UNITED STATES SECURITIES AND EXCHANGE COMMISSION
Washington, D.C. 20549
Form 10-Q
x☒ | QUARTERLY REPORT PURSUANT TO SECTION 13 OR 15(d) OF THE SECURITIES EXCHANGE ACT OF 1934 |
For the quarterly period ended March 31, 20162017
or
¨☐ | TRANSITION REPORT PURSUANT TO SECTION 13 OR 15(d) OF THE SECURITIES EXCHANGE ACT OF 1934 |
| | |
For the transition period from to | | |
Commission File Number:001-14965
The Goldman Sachs Group, Inc.
(Exact name of registrant as specified in its charter)
| | |
| Delaware | | 13-4019460 |
(State or other jurisdiction of incorporation or organization) | | (I.R.S. Employer Identification No.) |
| |
| 200 West Street, New York, N.Y. | | 10282 |
| (Address of principal executive offices) | | (Zip Code) |
(212) 902-1000
(Registrant’s telephone number, including area code)
Indicate by check mark whether the registrant (1) has filed all reports required to be filed by Section 13 or 15(d) of the Securities Exchange Act of 1934 during the preceding 12 months (or for such shorter period that the registrant was required to file such reports), and (2) has been subject to such filing requirements for the past 90 days.x ☒ Yes ¨☐ No
Indicate by check mark whether the registrant has submitted electronically and posted on its corporate Web site, if any, every Interactive Data File required to be submitted and posted pursuant to Rule 405 of Regulation S-T (§232.405 of this chapter) during the preceding 12 months (or for such shorter period that the registrant was required to submit and post such files).x
☒ Yes ¨☐ No
Indicate by check mark whether the registrant is a large accelerated filer, an accelerated filer, a non-accelerated filer, or a smaller reporting company, or an emerging growth company. See the definitions of “large accelerated filer,” “accelerated filer”filer,” “smaller reporting company” and “smaller reporting“emerging growth company” in Rule 12b-2 of the Exchange Act.
| | |
Large accelerated filer x☒ Accelerated filer ¨☐ |
|
Non-accelerated filer ¨☐ (Do not check if a smaller reporting company) Smaller reporting company ¨☐ |
|
| Emerging growth company ☐ |
If an emerging growth company, indicate by check mark if the registrant has elected not to use the extended transition period for complying with any new or revised financial accounting standards provided pursuant to Section 13(a) of the Exchange Act. ☐
Indicate by check mark whether the registrant is a shell company (as defined in Rule 12b-2 of the Exchange Act).¨
☐ Yes x☒ No
APPLICABLE ONLY TO CORPORATE ISSUERS
As of April 22, 2016,21, 2017, there were 415,394,033393,630,833 shares of the registrant’s common stock outstanding.
THE GOLDMAN SACHS GROUP, INC.
QUARTERLY REPORT ON FORM 10-Q FOR THE QUARTER ENDED MARCH 31, 20162017
INDEX
| | | | |
| Form 10-Q Item Number | | Page No. |
| |
PART I | | FINANCIAL INFORMATION | | 2 | | 1 |
| |
Item 1 | | Financial Statements (Unaudited) | | 21 |
| |
| | Condensed Consolidated Statements of Earnings for the three months ended March 31, 2016 and March 31, 2015 | | 21 |
| |
| | | |
Condensed Consolidated Statements of Comprehensive Income for the three months ended March 31, 2016 and March 31, 2015 | | 32 |
| |
| | | |
Condensed Consolidated Statements of Financial Condition as of March 31, 2016 and December 31, 2015 | | 43 |
| |
| | | |
Condensed Consolidated Statements of Changes in Shareholders’ Equity for the three months ended March 31, 2016 and year ended December 31, 2015 | | 54 |
| |
| | | |
Condensed Consolidated Statements of Cash Flows for the three months ended March 31, 2016 and March 31, 2015 | | 65 |
| |
| |
Notes to Condensed Consolidated Financial Statements | | 76 |
| |
| |
Note 1. Description of Business | | 76 |
| |
| |
Note 2. Basis of Presentation | | 76 |
| |
| |
Note 3. Significant Accounting Policies | | 87 |
| |
| |
Note 4. Financial Instruments Owned, at Fair Value and Financial Instruments Sold, | | |
| | But Not Yet Purchased, at Fair Value | | 14 |
| |
| | | |
Note 5. Fair Value Measurements | | 15 |
| |
| |
Note 6. Cash Instruments | | 16 |
| |
| |
Note 7. Derivatives and Hedging Activities | | 22 |
| |
| |
Note 8. Fair Value Option | | 3433 |
| |
| |
Note 9. Loans Receivable | | 4039 |
| |
| |
Note 10. Collateralized Agreements and Financings | | 4443 |
| |
| |
Note 11. Securitization Activities | | 4847 |
| |
| |
Note 12. Variable Interest Entities | | 5049 |
| |
| |
Note 13. Other Assets | | 53 |
| |
| |
Note 14. Deposits | | 5655 |
| |
| |
Note 15. Short-Term Borrowings | | 56 |
| |
| |
Note 16. Long-Term Borrowings | | 5756 |
| |
| |
Note 17. Other Liabilities and Accrued Expenses | | 59 |
| |
| |
Note 18. Commitments, Contingencies and Guarantees | | 6059 |
| |
| |
Note 19. Shareholders’ Equity | | 6563 |
| |
| |
Note 20. Regulation and Capital Adequacy | | 6765 |
| |
| |
Note 21. Earnings Per Common Share | | 7675 |
| |
| |
Note 22. Transactions with Affiliated Funds | | 7675 |
| |
| |
Note 23. Interest Income and Interest Expense | | 7776 |
| |
| |
Note 24. Income Taxes | | 7876 |
| |
| |
Note 25. Business Segments | | 7977 |
| |
| |
Note 26. Credit Concentrations | | 8179 |
| |
| |
Note 27. Legal Proceedings | | 8280 |
| | | | |
| | | Goldman Sachs March 20162017 Form 10-Q | | 1 |
PART I. FINANCIAL INFORMATION
ITEMItem 1. Financial Statements (Unaudited)
THE GOLDMAN SACHS GROUP, INC. AND SUBSIDIARIES
Condensed Consolidated Statements of Earnings
(Unaudited)
| | | | Three Months Ended March | | | Three Months Ended March | |
| in millions, except per share amounts | | 2016 | | | | 2015 | | | | 2017 | | | | 2016 | |
Revenues | | | | | | | | |
Investment banking | | | $1,463 | | | | $ 1,905 | | | | $1,703 | | | | $1,463 | |
| | | | | |
Investment management | | | 1,262 | | | | 1,503 | | | | 1,397 | | | | 1,262 | |
| | | | | |
Commissions and fees | | | 917 | | | | 853 | | | | 771 | | | | 917 | |
| | | | | |
Market making | | | 1,862 | | | | 3,925 | | | | 2,418 | | | | 1,862 | |
| | | | | |
Other principal transactions | | | (49 | ) | | | 1,572 | | | | 1,221 | | | | (49 | ) |
Total non-interest revenues | | | 5,455 | | | | 9,758 | | | | 7,510 | | | | 5,455 | |
| | | | | |
Interest income | | | 2,348 | | | | 2,035 | | | | 2,746 | | | | 2,348 | |
| | | | | |
Interest expense | | | 1,465 | | | | 1,176 | | | | 2,230 | | | | 1,465 | |
Net interest income | | | 883 | | | | 859 | | | | 516 | | | | 883 | |
Net revenues, including net interest income | | | 6,338 | | | | 10,617 | | | | 8,026 | | | | 6,338 | |
Operating expenses | | | | | | | | |
Compensation and benefits | | | 2,662 | | | | 4,459 | | | | 3,291 | | | | 2,662 | |
| | | | | |
Brokerage, clearing, exchange and distribution fees | | | 691 | | | | 638 | | | | 615 | | | | 691 | |
| | | | | |
Market development | | | 122 | | | | 139 | | | | 134 | | | | 122 | |
| | | | | |
Communications and technology | | | 197 | | | | 198 | | | | 223 | | | | 197 | |
| | | | | |
Depreciation and amortization | | | 239 | | | | 219 | | | | 257 | | | | 239 | |
| | | | | |
Occupancy | | | 183 | | | | 204 | | | | 176 | | | | 183 | |
| | | | | |
Professional fees | | | 220 | | | | 211 | | | | 205 | | | | 220 | |
| | | | | |
Other expenses | | | 448 | | | | 615 | | | | 586 | | | | 448 | |
Total non-compensation expenses | | | 2,100 | | | | 2,224 | | | | 2,196 | | | | 2,100 | |
Total operating expenses | | | 4,762 | | | | 6,683 | | | | 5,487 | | | | 4,762 | |
Pre-tax earnings | | | 1,576 | | | | 3,934 | | | | 2,539 | | | | 1,576 | |
| | | | | |
Provision for taxes | | | 441 | | | | 1,090 | | | | 284 | | | | 441 | |
Net earnings | | | 1,135 | | | | 2,844 | | | | 2,255 | | | | 1,135 | |
| | | | | |
Preferred stock dividends | | | (65 | ) | | | 96 | | | | 93 | | | | (65 | ) |
Net earnings applicable to common shareholders | | | $1,200 | | | | $ 2,748 | | | | $2,162 | | | | $1,200 | |
Earnings per common share | | | | | | | | |
Basic | | | $ 2.71 | | | | $ 6.05 | | | | $ 5.23 | | | | $ 2.71 | |
| | | | | |
Diluted | | | 2.68 | | | | 5.94 | | | | $ 5.15 | | | | $ 2.68 | |
| | | | | |
Dividends declared per common share | | | $ 0.65 | | | | $ 0.60 | | | | $ 0.65 | | | | $ 0.65 | |
| | | | | |
Average common shares outstanding | | |
Average common shares | | | | | |
Basic | | | 440.8 | | | | 453.3 | | | | 412.5 | | | | 440.8 | |
| | | | | |
Diluted | | | 447.4 | | | | 462.9 | | | | 420.1 | | | | 447.4 | |
The accompanying notes are an integral part of these condensed consolidated financial statements.
| | | | |
| | Goldman Sachs March 2017 Form 10-Q | | 1 |
THE GOLDMAN SACHS GROUP, INC. AND SUBSIDIARIES
Condensed Consolidated Statements of Comprehensive Income
(Unaudited)
| | | | | | | | |
| | | Three Months Ended March | |
| $ in millions | | | 2017 | | | | 2016 | |
Net earnings | | | $2,255 | | | | $1,135 | |
| | |
Other comprehensive income/(loss) adjustments, net of tax: | | | | | | | | |
Currency translation | | | (16 | ) | | | (17 | ) |
| | |
Debt valuation adjustment | | | (139 | ) | | | (12 | ) |
| | |
Pension and postretirement liabilities | | | 1 | | | | (36 | ) |
Other comprehensive loss | | | (154 | ) | | | (65 | ) |
Comprehensive income | | | $2,101 | | | | $1,070 | |
The accompanying notes are an integral part of these condensed consolidated financial statements.
| | | | |
| 2 | | Goldman Sachs March 20162017 Form 10-Q | | |
THE GOLDMAN SACHS GROUP, INC. AND SUBSIDIARIES
Condensed Consolidated Statements of Comprehensive IncomeFinancial Condition
(Unaudited)
| | | | | | | | |
| | | Three Months Ended March | |
| $ in millions | | | 2016 | | | | 2015 | |
Net earnings | | | $1,135 | | | | $2,844 | |
| | |
Other comprehensive loss adjustments, net of tax: | | | | | | | | |
Currency translation | | | (17 | ) | | | (25 | ) |
| | |
Debt valuation adjustment | | | (12 | ) | | | — | |
| | |
Pension and postretirement liabilities | | | (36 | ) | | | (3 | ) |
| | |
Other comprehensive loss | | | (65 | ) | | | (28 | ) |
Comprehensive income | | | $1,070 | | | | $2,816 | |
| | | | | | | | |
| | | As of | |
| $ in millions, except per share amounts | |
| March
2017 |
| |
| December
2016 |
|
Assets | | | | | | | | |
Cash and cash equivalents | | | $123,035 | | | | $121,711 | |
| | |
Collateralized agreements: | | | | | | | | |
Securities purchased under agreements to resell and federal funds sold (includes$116,546 and $116,077 at fair value) | | | 117,278 | | | | 116,925 | |
| | |
Securities borrowed (includes$79,893and $82,398 at fair value) | | | 187,446 | | | | 184,600 | |
| | |
Receivables: | | | | | | | | |
Brokers, dealers and clearing organizations | | | 25,750 | | | | 18,044 | |
| | |
Customers and counterparties (includes$3,644 and $3,266 at fair value) | | | 54,460 | | | | 47,780 | |
| | |
Loans receivable | | | 50,385 | | | | 49,672 | |
| | |
Financial instruments owned, at fair value (includes$53,389and $51,278 pledged as collateral) | | | 308,871 | | | | 295,952 | |
| | |
Other assets | | | 26,844 | | | | 25,481 | |
Total assets | | | $894,069 | | | | $860,165 | |
Liabilities and shareholders’ equity | | | | | | | | |
Deposits (includes$19,480 and $13,782 at fair value) | | | $127,929 | | | | $124,098 | |
| | |
Collateralized financings: | | | | | | | | |
Securities sold under agreements to repurchase, at fair value | | | 88,533 | | | | 71,816 | |
| | |
Securities loaned (includes$4,403 and $2,647 at fair value) | | | 9,698 | | | | 7,524 | |
| | |
Other secured financings (includes$21,960 and $21,073 at fair value) | | | 22,376 | | | | 21,523 | |
| | |
Payables: | | | | | | | | |
Brokers, dealers and clearing organizations | | | 8,589 | | | | 4,386 | |
| | |
Customers and counterparties | | | 187,669 | | | | 184,069 | |
| | |
Financial instruments sold, but not yet purchased, at fair value | | | 115,927 | | | | 117,143 | |
| | |
Unsecured short-term borrowings (includes$13,900 and $14,792 at fair value) | | | 35,872 | | | | 39,265 | |
| | |
Unsecured long-term borrowings (includes$32,075 and $29,410 at fair value) | | | 199,370 | | | | 189,086 | |
| | |
Other liabilities and accrued expenses (includes$806and $621 at fair value) | | | 11,189 | | | | 14,362 | |
Total liabilities | | | 807,152 | | | | 773,272 | |
| | |
Commitments, contingencies and guarantees | | | | | | | | |
Shareholders’ equity | | | | | | | | |
Preferred stock, par value $0.01 per share; aggregate liquidation preference of$11,203and $11,203 | | | 11,203 | | | | 11,203 | |
| | |
Common stock, par value $0.01 per share;4,000,000,000and 4,000,000,000 shares authorized,881,753,381 and 873,608,100 shares issued, and394,791,563 and 392,632,230 shares outstanding | | | 9 | | | | 9 | |
| | |
Share-based awards | | | 3,155 | | | | 3,914 | |
| | |
Nonvoting common stock, par value $0.01 per share;200,000,000 and 200,000,000 shares authorized, no shares issued and outstanding | | | — | | | | — | |
| | |
Additional paid-in capital | | | 53,185 | | | | 52,638 | |
| | |
Retained earnings | | | 90,904 | | | | 89,039 | |
| | |
Accumulated other comprehensive loss | | | (1,370 | ) | | | (1,216 | ) |
| | |
Stock held in treasury, at cost, par value $0.01 per share;486,961,820 and 480,975,872 shares | | | (70,169 | ) | | | (68,694 | ) |
Total shareholders’ equity | | | 86,917 | | | | 86,893 | |
Total liabilities and shareholders’ equity | | | $894,069 | | | | $860,165 | |
The accompanying notes are an integral part of these condensed consolidated financial statements.
| | | | |
| | | Goldman Sachs March 20162017 Form 10-Q | | 3 |
THE GOLDMAN SACHS GROUP, INC. AND SUBSIDIARIES
Condensed Consolidated Statements of Financial ConditionChanges in Shareholders’ Equity
(Unaudited)
| | | | | | | | |
| | | As of | |
| $ in millions, except per share amounts | |
| March
2016 |
| |
| December
2015 |
|
Assets | | | | | | | | |
Cash and cash equivalents | | | $ 79,169 | | | | $ 75,105 | |
| | |
Cash and securities segregated for regulatory and other purposes (includes $39,505 and $38,504 at fair value as of March 2016 and December 2015, respectively) | | | 58,287 | | | | 56,838 | |
| | |
Collateralized agreements: | | | | | | | | |
Securities purchased under agreements to resell and federal funds sold (includes $127,189 and $119,450 at fair value as of March 2016 and December 2015, respectively) | | | 128,513 | | | | 120,905 | |
| | |
Securities borrowed (includes $66,212 and $69,801 at fair value as of March 2016 and December 2015, respectively) | | | 180,603 | | | | 172,099 | |
| | |
Receivables: | | | | | | | | |
Brokers, dealers and clearing organizations | | | 22,971 | | | | 25,453 | |
| | |
Customers and counterparties (includes $3,893 and $4,992 at fair value as of March 2016 and December 2015, respectively) | | | 49,399 | | | | 46,430 | |
| | |
Loans receivable | | | 47,924 | | | | 45,407 | |
| | |
Financial instruments owned, at fair value (includes $53,548 and $54,426 pledged as collateral as of March 2016 and December 2015, respectively) | | | 286,902 | | | | 293,940 | |
| | |
Other assets | | | 24,268 | | | | 25,218 | |
Total assets | | | $878,036 | | | | $861,395 | |
Liabilities and shareholders’ equity | | | | | | | | |
Deposits (includes $15,034 and $14,680 at fair value as of March 2016 and December 2015, respectively) | | | $104,866 | | | | $ 97,519 | |
| | |
Collateralized financings: | | | | | | | | |
Securities sold under agreements to repurchase, at fair value | | | 77,617 | | | | 86,069 | |
| | |
Securities loaned (includes $972 and $466 at fair value as of March 2016 and December 2015, respectively) | | | 4,427 | | | | 3,614 | |
| | |
Other secured financings (includes $24,394 and $23,207 at fair value as of March 2016 and December 2015, respectively) | | | 26,175 | | | | 24,753 | |
| | |
Payables: | | | | | | | | |
Brokers, dealers and clearing organizations | | | 6,027 | | | | 5,406 | |
| | |
Customers and counterparties | | | 204,911 | | | | 204,956 | |
| | |
Financial instruments sold, but not yet purchased, at fair value | | | 127,013 | | | | 115,248 | |
| | |
Unsecured short-term borrowings, including the current portion of unsecured long-term borrowings (includes $19,246 and $17,743 at fair value as of March 2016 and December 2015, respectively) | | | 46,691 | | | | 42,787 | |
| | |
Unsecured long-term borrowings (includes $25,671 and $22,273 at fair value as of March 2016 and December 2015, respectively) | | | 180,159 | | | | 175,422 | |
| | |
Other liabilities and accrued expenses (includes $576 and $1,253 at fair value as of March 2016 and December 2015, respectively) | | | 13,313 | | | | 18,893 | |
Total liabilities | | | 791,199 | | | | 774,667 | |
| | |
Commitments, contingencies and guarantees | | | | | | | | |
Shareholders’ equity | | | | | | | | |
Preferred stock, par value $0.01 per share; aggregate liquidation preference of $11,203 and $11,200 as of March 2016 and December 2015, respectively | | | 11,203 | | | | 11,200 | |
| | |
Common stock, par value $0.01 per share; 4,000,000,000 shares authorized, 872,016,591 and 863,976,731 shares issued as of March 2016 and December 2015, respectively, and 417,572,204 and 419,480,736 shares outstanding as of March 2016 and December 2015, respectively | | | 9 | | | | 9 | |
| | |
Share-based awards | | | 3,820 | | | | 4,151 | |
| | |
Nonvoting common stock, par value $0.01 per share; 200,000,000 shares authorized, no shares issued and outstanding | | | — | | | | — | |
| | |
Additional paid-in capital | | | 52,471 | | | | 51,340 | |
| | |
Retained earnings | | | 83,990 | | | | 83,386 | |
| | |
Accumulated other comprehensive loss | | | (478 | ) | | | (718 | ) |
| | |
Stock held in treasury, at cost, par value $0.01 per share; 454,444,389 and 444,495,997 shares as of March 2016 and December 2015, respectively | | | (64,178 | ) | | | (62,640 | ) |
Total shareholders’ equity | | | 86,837 | | | | 86,728 | |
Total liabilities and shareholders’ equity | | | $878,036 | | | | $861,395 | |
| | | | | | | | | | | | |
| $ in millions | |
| Three Months Ended
March 2017 |
| | | | | |
| Year Ended
December 2016 |
|
Preferred stock | | | | | | | | | | | | |
Beginning balance | | | $ 11,203 | | | | | | | | $ 11,200 | |
| | |
Issued | | | — | | | | | | | | 1,325 | |
| | |
Redeemed | | | — | | | | | | | | (1,322 | ) |
Ending balance | | | 11,203 | | | | | | | | 11,203 | |
| | |
Common stock | | | | | | | | | | | | |
Beginning balance | | | 9 | | | | | | | | 9 | |
| | |
Issued | | | — | | | | | | | | — | |
Ending balance | | | 9 | | | | | | | | 9 | |
| | |
Share-based awards | | | | | | | | | | | | |
Beginning balance, as previously reported | | | 3,914 | | | | | | | | 4,151 | |
| | |
Cumulative effect of the change in accounting principle related to forfeiture of share-based awards | | | 35 | | | | | | | | — | |
Beginning balance, adjusted | | | 3,949 | | | | | | | | 4,151 | |
| | |
Issuance and amortization of share-based awards | | | 1,271 | | | | | | | | 2,143 | |
| | |
Delivery of common stock underlying share-based awards | | | (1,954 | ) | | | | | | | (2,068 | ) |
| | |
Forfeiture of share-based awards | | | (5 | ) | | | | | | | (102 | ) |
| | |
Exercise of share-based awards | | | (106 | ) | | | | | | | (210 | ) |
Ending balance | | | 3,155 | | | | | | | | 3,914 | |
| | |
Additional paid-in capital | | | | | | | | | | | | |
Beginning balance | | | 52,638 | | | | | | | | 51,340 | |
| | |
Delivery of common stock underlying share-based awards | | | 2,045 | | | | | | | | 2,282 | |
| | |
Cancellation of share-based awards in satisfaction of withholding tax requirements | | | (1,495 | ) | | | | | | | (1,121 | ) |
| | |
Preferred stock issuance costs, net | | | — | | | | | | | | (10 | ) |
| | |
Excess net tax benefit related to share-based awards | | | — | | | | | | | | 147 | |
| | |
Cash settlement of share-based awards | | | (3 | ) | | | | | | | — | |
Ending balance | | | 53,185 | | | | | | | | 52,638 | |
| | |
Retained earnings | | | | | | | | | | | | |
Beginning balance, as previously reported | | | 89,039 | | | | | | | | 83,386 | |
| | |
Cumulative effect of the change in accounting principle related to debt valuation adjustment, net of tax | | | — | | | | | | | | (305 | ) |
| | |
Cumulative effect of the change in accounting principle related to forfeiture of share-based awards, net of tax | | | (24 | ) | | | | | | | — | |
Beginning balance, adjusted | | | 89,015 | | | | | | | | 83,081 | |
| | |
Net earnings | | | 2,255 | | | | | | | | 7,398 | |
| | |
Dividends and dividend equivalents declared on common stock and share-based awards | | | (273 | ) | | | | | | | (1,129 | ) |
| | |
Dividends declared on preferred stock | | | (93 | ) | | | | | | | (577 | ) |
| | |
Preferred stock redemption discount | | | — | | | | | | | | 266 | |
Ending balance | | | 90,904 | | | | | | | | 89,039 | |
| | |
Accumulated other comprehensive loss | | | | | | | | | | | | |
Beginning balance, as previously reported | | | (1,216 | ) | | | | | | | (718 | ) |
| | |
Cumulative effect of the change in accounting principle related to debt valuation adjustment, net of tax | | | — | | | | | | | | 305 | |
Beginning balance, adjusted | | | (1,216 | ) | | | | | | | (413 | ) |
| | |
Other comprehensive loss | | | (154 | ) | | | | | | | (803 | ) |
Ending balance | | | (1,370 | ) | | | | | | | (1,216 | ) |
| | |
Stock held in treasury, at cost | | | | | | | | | | | | |
Beginning balance | | | (68,694 | ) | | | | | | | (62,640 | ) |
| | |
Repurchased | | | (1,500 | ) | | | | | | | (6,069 | ) |
| | |
Reissued | | | 27 | | | | | | | | 22 | |
| | |
Other | | | (2 | ) | | | | | | | (7 | ) |
Ending balance | | | (70,169 | ) | | | | | | | (68,694 | ) |
Total shareholders’ equity | | | $ 86,917 | | | | | | | | $ 86,893 | |
The accompanying notes are an integral part of these condensed consolidated financial statements.
| | | | |
| 4 | | Goldman Sachs March 20162017 Form 10-Q | | |
THE GOLDMAN SACHS GROUP, INC. AND SUBSIDIARIES
Condensed Consolidated Statements of Changes in Shareholders’ EquityCash Flows
(Unaudited)
| | | | | | | | |
| $ in millions | |
| Three Months Ended
March 2016 |
| |
| Year Ended
December 2015 |
|
Preferred stock | | | | | | | | |
Balance, beginning of year | | | $ 11,200 | | | | $ 9,200 | |
| | |
Issued | | | 675 | | | | 2,000 | |
| | |
Redeemed | | | (672 | ) | | | — | |
Balance, end of period | | | 11,203 | | | | 11,200 | |
| | |
Common stock | | | | | | | | |
Balance, beginning of year | | | 9 | | | | 9 | |
| | |
Issued | | | — | | | | — | |
Balance, end of period | | | 9 | | | | 9 | |
| | |
Share-based awards | | | | | | | | |
Balance, beginning of year | | | 4,151 | | | | 3,766 | |
| | |
Issuance and amortization of share-based awards | | | 1,672 | | | | 2,308 | |
| | |
Delivery of common stock underlying share-based awards | | | (1,971 | ) | | | (1,742 | ) |
| | |
Forfeiture of share-based awards | | | (30 | ) | | | (72 | ) |
| | |
Exercise of share-based awards | | | (2 | ) | | | (109 | ) |
Balance, end of period | | | 3,820 | | | | 4,151 | |
| | |
Additional paid-in capital | | | | | | | | |
Balance, beginning of year | | | 51,340 | | | | 50,049 | |
| | |
Delivery of common stock underlying share-based awards | | | 1,972 | | | | 2,092 | |
| | |
Cancellation of share-based awards in satisfaction of withholding tax requirements | | | (881 | ) | | | (1,198 | ) |
| | |
Preferred stock issuance costs, net | | | (14 | ) | | | (7 | ) |
| | |
Excess net tax benefit related to share-based awards | | | 54 | | | | 406 | |
| | |
Cash settlement of share-based awards | | | — | | | | (2 | ) |
Balance, end of period | | | 52,471 | | | | 51,340 | |
| | |
Retained earnings | | | | | | | | |
Balance, beginning of year, as previously reported | | | 83,386 | | | | 78,984 | |
| | |
Reclassification of cumulative debt valuation adjustment, net of tax, to accumulated other comprehensive loss | | | (305 | ) | | | — | |
Balance, beginning of year, adjusted | | | 83,081 | | | | 78,984 | |
| | |
Net earnings | | | 1,135 | | | | 6,083 | |
| | |
Dividends and dividend equivalents declared on common stock and share-based awards | | | (291 | ) | | | (1,166 | ) |
| | |
Dividends declared on preferred stock | | | (96 | ) | | | (515 | ) |
| | |
Preferred stock redemption discount | | | 161 | | | | — | |
Balance, end of period | | | 83,990 | | | | 83,386 | |
| | |
Accumulated other comprehensive loss | | | | | | | | |
Balance, beginning of year, as previously reported | | | (718 | ) | | | (743 | ) |
| | |
Reclassification of cumulative debt valuation adjustment, net of tax, from retained earnings | | | 305 | | | | — | |
Balance, beginning of year, adjusted | | | (413 | ) | | | (743 | ) |
| | |
Other comprehensive income/(loss) | | | (65 | ) | | | 25 | |
Balance, end of period | | | (478 | ) | | | (718 | ) |
| | |
Stock held in treasury, at cost | | | | | | | | |
Balance, beginning of year | | | (62,640 | ) | | | (58,468 | ) |
| | |
Repurchased | | | (1,550 | ) | | | (4,195 | ) |
| | |
Reissued | | | 19 | | | | 32 | |
| | |
Other | | | (7 | ) | | | (9 | ) |
Balance, end of period | | | (64,178 | ) | | | (62,640 | ) |
Total shareholders’ equity | | | $ 86,837 | | | | $ 86,728 | |
| | | | | | | | |
| | | Three Months Ended March | |
| $ in millions | | | 2017 | | | | 2016 | |
Cash flows from operating activities | | | | | | | | |
Net earnings | | | $ 2,255 | | | | $ 1,135 | |
| | |
Adjustments to reconcile net earnings to net cash provided by/(used for) operating activities: | | | | | | | | |
Depreciation and amortization | | | 257 | | | | 239 | |
| | |
Share-based compensation | | | 1,272 | | | | 1,665 | |
| | |
Changes in operating assets and liabilities: | | | | | | | | |
Receivables and payables (excluding loans receivable), net | | | (6,658 | ) | | | 19 | |
| | |
Collateralized transactions (excluding other secured financings), net | | | 15,692 | | | | (26,632 | ) |
| | |
Financial instruments owned, at fair value | | | (13,634 | ) | | | 11,480 | |
| | |
Financial instruments sold, but not yet purchased, at fair value | | | (1,216 | ) | | | 11,697 | |
| | |
Other, net | | | (1,332 | ) | | | (2,145 | ) |
Net cash used for operating activities | | | (3,364 | ) | | | (2,542 | ) |
| | |
Cash flows from investing activities | | | | | | | | |
Purchase of property, leasehold improvements and equipment | | | (838 | ) | | | (573 | ) |
| | |
Proceeds from sales of property, leasehold improvements and equipment | | | 77 | | | | 210 | |
| | |
Net cash used for business acquisitions | | | (512 | ) | | | (562 | ) |
| | |
Proceeds from sales of investments | | | 539 | | | | 322 | |
| | |
Loans receivable, net | | | (839 | ) | | | (2,537 | ) |
Net cash used for investing activities | | | (1,573 | ) | | | (3,140 | ) |
| | |
Cash flows from financing activities | | | | | | | | |
Unsecured short-term borrowings, net | | | (1,007 | ) | | | 1,970 | |
| | |
Other secured financings (short-term), net | | | (1,771 | ) | | | 775 | |
| | |
Proceeds from issuance of other secured financings (long-term) | | | 2,622 | | | | 933 | |
| | |
Repayment of other secured financings (long-term), including the current portion | | | (1,377 | ) | | | (1,118 | ) |
| | |
Purchase of APEX | | | — | | | | (505 | ) |
| | |
Proceeds from issuance of unsecured long-term borrowings | | | 19,502 | | | | 14,752 | |
| | |
Repayment of unsecured long-term borrowings, including the current portion | | | (13,087 | ) | | | (11,801 | ) |
| | |
Derivative contracts with a financing element, net | | | 912 | | | | 16 | |
| | |
Deposits, net | | | 3,831 | | | | 7,347 | |
| | |
Common stock repurchased | | | (1,503 | ) | | | (1,556 | ) |
| | |
Settlement of share-based awards in satisfaction of withholding tax requirements | | | (1,498 | ) | | | (888 | ) |
| | |
Dividends and dividend equivalents paid on common stock, preferred stock and share-based awards | | | (366 | ) | | | (387 | ) |
| | |
Proceeds from issuance of preferred stock, net of issuance costs | | | — | | | | 655 | |
| | |
Proceeds from issuance of common stock, including exercise of share-based awards | | | 6 | | | | 1 | |
| | |
Cash settlement of share-based awards | | | (3 | ) | | | — | |
Net cash provided by financing activities | | | 6,261 | | | | 10,194 | |
Net increase in cash and cash equivalents | | | 1,324 | | | | 4,512 | |
| | |
Cash and cash equivalents, beginning balance | | | 121,711 | | | | 93,439 | |
Cash and cash equivalents, ending balance | | | $123,035 | | | | $ 97,951 | |
SUPPLEMENTAL DISCLOSURES:
Cash payments for interest, net of capitalized interest, were $2.31 billion and $2.25 billion, and cash payments for income taxes, net of refunds, were $257 million and $266 million during the three months ended March 2017 and March 2016, respectively.
Cash flows related to common stock repurchased includes common stock repurchased in the prior period for which settlement occurred during the current period and excludes common stock repurchased during the current period for which settlement occurred in the following period.
Non-cash activities during the three months ended March 2016:
The impact of adoption of ASU No. 2015-02 was a net reduction to both total assets and liabilities of approximately $200 million. See Note 3 for further information.
The firm sold assets and liabilities of $1.81 billion and $697 million, respectively, that were previously classified as held for sale, in exchange for $1.11 billion of financial instruments.
The firm exchanged $505 million of APEX for $666 million of Series E and Series F Preferred Stock. See Note 19 for further information.
The accompanying notes are an integral part of these condensed consolidated financial statements.
| | | | |
| | | Goldman Sachs March 20162017 Form 10-Q | | 5 |
THE GOLDMAN SACHS GROUP, INC. AND SUBSIDIARIES
Condensed Consolidated Statements of Cash Flows
(Unaudited)
| | | | | | | | |
| | | Three Months Ended March | |
| $ in millions | | | 2016 | | | | 2015 | |
Cash flows from operating activities | | | | | | | | |
Net earnings | | | $ 1,135 | | | | $ 2,844 | |
| | |
Adjustments to reconcile net earnings to net cash provided by/(used for) operating activities | | | | | | | | |
Depreciation and amortization | | | 239 | | | | 219 | |
| | |
Share-based compensation | | | 1,665 | | | | 1,809 | |
| | |
Gain related to extinguishment of junior subordinated debt | | | — | | | | (34 | ) |
| | |
Changes in operating assets and liabilities | | | | | | | | |
Cash and securities segregated for regulatory and other purposes | | | (1,449 | ) | | | 9,393 | |
| | |
Receivables and payables (excluding loans receivable), net | | | 19 | | | | 5,733 | |
| | |
Collateralized transactions (excluding other secured financings), net | | | (23,750 | ) | | | 7,546 | |
| | |
Financial instruments owned, at fair value | | | 9,599 | | | | (13,266 | ) |
| | |
Financial instruments sold, but not yet purchased, at fair value | | | 11,697 | | | | 726 | |
| | |
Other, net | | | (3,087 | ) | | | (8,234 | ) |
Net cash provided by/(used for) operating activities | | | (3,932 | ) | | | 6,736 | |
| | |
Cash flows from investing activities | | | | | | | | |
Purchase of property, leasehold improvements and equipment | | | (573 | ) | | | (302 | ) |
| | |
Proceeds from sales of property, leasehold improvements and equipment | | | 210 | | | | 13 | |
| | |
Business acquisitions, net of cash acquired | | | (562 | ) | | | (477 | ) |
| | |
Proceeds from sales of investments | | | 322 | | | | 184 | |
| | |
Loans receivable, net | | | (2,537 | ) | | | (3,681 | ) |
Net cash used for investing activities | | | (3,140 | ) | | | (4,263 | ) |
| | |
Cash flows from financing activities | | | | | | | | |
Unsecured short-term borrowings, net | | | 1,970 | | | | (921 | ) |
| | |
Other secured financings (short-term), net | | | 775 | | | | (26 | ) |
| | |
Proceeds from issuance of other secured financings (long-term) | | | 933 | | | | 4,293 | |
| | |
Repayment of other secured financings (long-term), including the current portion | | | (1,118 | ) | | | (2,566 | ) |
| | |
Purchase of trust preferred securities | | | — | | | | (1 | ) |
| | |
Purchase of Automatic Preferred Enhanced Capital Securities (APEX) | | | (505 | ) | | | — | |
| | |
Proceeds from issuance of unsecured long-term borrowings | | | 14,752 | | | | 11,873 | |
| | |
Repayment of unsecured long-term borrowings, including the current portion | | | (11,801 | ) | | | (11,319 | ) |
| | |
Derivative contracts with a financing element, net | | | 16 | | | | (46 | ) |
| | |
Deposits, net | | | 7,347 | | | | 3,046 | |
| | |
Common stock repurchased | | | (1,556 | ) | | | (1,250 | ) |
| | |
Dividends and dividend equivalents paid on common stock, preferred stock and share-based awards | | | (387 | ) | | | (373 | ) |
| | |
Proceeds from issuance of preferred stock, net of issuance costs | | | 655 | | | | — | |
| | |
Proceeds from issuance of common stock, including exercise of share-based awards | | | 1 | | | | 71 | |
| | |
Excess tax benefit related to share-based awards | | | 54 | | | | 275 | |
Net cash provided by financing activities | | | 11,136 | | | | 3,056 | |
Net increase in cash and cash equivalents | | | 4,064 | | | | 5,529 | |
| | |
Cash and cash equivalents, beginning of year | | | 75,105 | | | | 57,600 | |
Cash and cash equivalents, end of period | | | $ 79,169 | | | | $ 63,129 | |
SUPPLEMENTAL DISCLOSURES:
Cash payments for interest, net of capitalized interest, were $2.25 billion and $1.77 billion and cash payments for income taxes, net of refunds, were $266 million and $451 million during the three months ended March 2016 and March 2015, respectively.
Non-cash activities during the three months ended March 2016:
The impact of adoption of ASU No. 2015-02 was a net reduction to both total assets and liabilities of approximately $200 million. See Note 3 for further information.
The firm sold assets and liabilities of $1.81 billion and $697 million, respectively, that were previously classified as held for sale, in exchange for $1.11 billion of financial instruments. See Notes 13 and 17 for further information.
The firm exchanged $505 million of APEX for $666 million of Series E and Series F Preferred Stock. See Note 19 for further information.
Cash flows related to common stock repurchased includes common stock repurchased in the prior quarter for which settlement occurred during the current quarter and excludes common stock repurchased during the current quarter for which settlement occurred in the following quarter.
Non-cash activities during the three months ended March 2015:
The firm exchanged $262 million of Trust Preferred Securities and common beneficial interests for $296 million of certain of the firm’s junior subordinated debt.
The accompanying notes are an integral part of these condensed consolidated financial statements.
| | | | |
6 | | Goldman Sachs March 2016 Form 10-Q | | |
THE GOLDMAN SACHS GROUP, INC. AND SUBSIDIARIES
Notes to Condensed Consolidated Financial Statements
(Unaudited)
Note 1.
Description of Business
The Goldman Sachs Group, Inc. (Group Inc. or parent company), a Delaware corporation, together with its consolidated subsidiaries (collectively, the firm), is a leading global investment banking, securities and investment management firm that provides a wide range of financial services to a substantial and diversified client base that includes corporations, financial institutions, governments and individuals. Founded in 1869, the firm is headquartered in New York and maintains offices in all major financial centers around the world.
The firm reports its activities in the following four business segments:
Investment Banking
The firm provides a broad range of investment banking services to a diverse group of corporations, financial institutions, investment funds and governments. Services include strategic advisory assignments with respect to mergers and acquisitions, divestitures, corporate defense activities, restructurings, spin-offs and risk management, and debt and equity underwriting of public offerings and private placements, including local and cross-border transactions and acquisition financing, as well as derivative transactions directly related to these activities.
Institutional Client Services
The firm facilitates client transactions and makes markets in fixed income, equity, currency and commodity products, primarily with institutional clients such as corporations, financial institutions, investment funds and governments. The firm also makes markets in and clears client transactions on major stock, options and futures exchanges worldwide and provides financing, securities lending and other prime brokerage services to institutional clients.
Investing & Lending
The firm invests in and originates loans to provide financing to clients. These investments and loans are typically longer-term in nature. The firm makes investments, some of which are consolidated, directly and indirectly through funds and separate accounts that the firm manages, in debt securities and loans, public and private equity securities, infrastructure and real estate entities. The firm also makes unsecured loans to individuals through its online platform.
Investment Management
The firm provides investment management services and offers investment products (primarily through separately managed accounts and commingled vehicles, such as mutual funds and private investment funds) across all major asset classes to a diverse set of institutional and individual clients. The firm also offers wealth advisory services, including portfolio management and financial counseling, and brokerage and other transaction services to high-net-worth individuals and families.
Note 2.
Basis of Presentation
These condensed consolidated financial statements are prepared in accordance with accounting principles generally accepted in the United States (U.S. GAAP) and include the accounts of Group Inc. and all other entities in which the firm has a controlling financial interest. Intercompany transactions and balances have been eliminated.
These condensed consolidated financial statements are unaudited and should be read in conjunction with the audited consolidated financial statements included in the firm’s Annual Report on Form 10-K for the year ended December 31, 2015.2016. References to “the 20152016 Form 10-K” are to the firm’s Annual Report on Form 10-K for the year ended December 31, 2015.2016. The condensed consolidated financial information as of December 31, 20152016 has been derived from audited consolidated financial statements not included herein.
These unaudited condensed consolidated financial statements reflect all adjustments that are, in the opinion of management, necessary for a fair statement of the results for the interim periods presented. These adjustments are of a normal, recurring nature. Interim period operating results may not be indicative of the operating results for a full year.
All references to March 20162017 and March 20152016 refer to the firm’s periods ended, or the dates, as the context requires, March 31, 20162017 and March 31, 2015,2016, respectively. All references to December 20152016 refer to the date December 31, 2015.2016. Any reference to a future year refers to a year ending on December 31 of that year. Certain reclassifications have been made to previously reported amounts to conform to the current presentation.
| | | | |
| 6 | | Goldman Sachs March 20162017 Form 10-Q | | 7 |
THE GOLDMAN SACHS GROUP, INC. AND SUBSIDIARIES
Notes to Condensed Consolidated Financial Statements
(Unaudited)
Note 3.
Significant Accounting Policies
The firm’s significant accounting policies include when and how to measure the fair value of assets and liabilities, accounting for goodwill and identifiable intangible assets, and when to consolidate an entity. See Notes 5 through 8 for policies on fair value measurements, Note 13 for policies on goodwill and identifiable intangible assets, and below and Note 12 for policies on consolidation accounting. All other significant accounting policies are either described below or included in the following footnotes:
| | | | |
| |
Financial Instruments Owned, at Fair Value and Financial Instruments Sold, But Not Yet Purchased, at Fair Value | | | Note 4 | |
| |
Fair Value Measurements | | | Note 5 | |
| |
Cash Instruments | | | Note 6 | |
| |
Derivatives and Hedging Activities | | | Note 7 | |
| |
Fair Value Option | | | Note 8 | |
| |
Loans Receivable | | | Note 9 | |
| |
Collateralized Agreements and Financings | | | Note 10 | |
| |
Securitization Activities | | | Note 11 | |
| |
Variable Interest Entities | | | Note 12 | |
| |
Other Assets, including Goodwill and Identifiable Intangible Assets
| | | Note 13 | |
| |
Deposits | | | Note 14 | |
| |
Short-Term Borrowings | | | Note 15 | |
| |
Long-Term Borrowings | | | Note 16 | |
| |
Other Liabilities and Accrued Expenses | | | Note 17 | |
| |
Commitments, Contingencies and Guarantees | | | Note 18 | |
| |
Shareholders’ Equity | | | Note 19 | |
| |
Regulation and Capital Adequacy | | | Note 20 | |
| |
Earnings Per Common Share | | | Note 21 | |
| |
Transactions with Affiliated Funds | | | Note 22 | |
| |
Interest Income and Interest Expense | | | Note 23 | |
| |
Income Taxes | | | Note 24 | |
| |
Business Segments | | | Note 25 | |
| |
Credit Concentrations | | | Note 26 | |
| |
Legal Proceedings | | | Note 27 | |
Consolidation
The firm consolidates entities in which the firm has a controlling financial interest. The firm determines whether it has a controlling financial interest in an entity by first evaluating whether the entity is a voting interest entity or a variable interest entity (VIE).
Voting Interest Entities. Voting interest entities are entities in which (i) the total equity investment at risk is sufficient to enable the entity to finance its activities independently and (ii) the equity holders have the power to direct the activities of the entity that most significantly impact its economic performance, the obligation to absorb the losses of the entity and the right to receive the residual returns of the entity. The usual condition for a controlling financial interest in a voting interest entity is ownership of a majority voting interest. If the firm has a controlling majority voting interest in a voting interest entity, the entity is consolidated.
Variable Interest Entities. A VIE is an entity that lacks one or more of the characteristics of a voting interest entity. The firm has a controlling financial interest in a VIE when the firm has a variable interest or interests that provide it with (i) the power to direct the activities of the VIE that most significantly impact the VIE’s economic performance and (ii) the obligation to absorb losses of the VIE or the right to receive benefits from the VIE that could potentially be significant to the VIE. See Note 12 for further information about VIEs.
Equity-Method Investments. When the firm does not have a controlling financial interest in an entity but can exert significant influence over the entity’s operating and financial policies, the investment is accounted for either (i) under the equity method of accounting or (ii) at fair value by electing the fair value option available under U.S. GAAP. Significant influence generally exists when the firm owns 20% to 50% of the entity’s common stock or in-substance common stock.
In general, the firm accounts for investments acquired after the fair value option became available, at fair value. In certain cases, the firm applies the equity method of accounting to new investments that are strategic in nature or closely related to the firm’s principal business activities, when the firm has a significant degree of involvement in the cash flows or operations of the investee or when cost-benefit considerations are less significant. See Note 13 for further information about equity-method investments.
| | | | |
8 | | Goldman Sachs March 20162017 Form 10-Q | | 7 |
THE GOLDMAN SACHS GROUP, INC. AND SUBSIDIARIES
Notes to Condensed Consolidated Financial Statements
(Unaudited)
Investment Funds. The firm has formed numerous investment funds with third-party investors. These funds are typically organized as limited partnerships or limited liability companies for which the firm acts as general partner or manager. Generally, the firm does not hold a majority of the economic interests in these funds. These funds are usually voting interest entities and generally are not consolidated because third-party investors typically have rights to terminate the funds or to remove the firm as general partner or manager. Investments in these funds are generally measured at net asset value (NAV) and are included in “Financial instruments owned, at fair value.” See Notes 6, 18 and 22 for further information about investments in funds.
Use of Estimates
Preparation of these condensed consolidated financial statements requires management to make certain estimates and assumptions, the most important of which relate to fair value measurements, accounting for goodwill and identifiable intangible assets, discretionary compensation accruals, the provisions for losses that may arise from litigation, regulatory proceedings (including governmental investigations) and tax audits, and the allowance for losses on loans receivable and lending commitments held for investment. These estimates and assumptions are based on the best available information but actual results could be materially different.
Revenue Recognition
Financial Assets and Financial Liabilities at Fair Value. Financial instruments owned, at fair value and Financial instruments sold, but not yet purchased, at fair value are recorded at fair value either under the fair value option or in accordance with other U.S. GAAP. In addition, the firm has elected to account for certain of its other financial assets and financial liabilities at fair value by electing the fair value option. The fair value of a financial instrument is the amount that would be received to sell an asset or paid to transfer a liability in an orderly transaction between market participants at the measurement date. Financial assets are marked to bid prices and financial liabilities are marked to offer prices. Fair value measurements do not include transaction costs. Fair value gains or losses are generally included in “Market making” for positions in Institutional Client Services and “Other principal transactions” for positions in Investing & Lending. See Notes 5 through 8 for further information about fair value measurements.
Investment Banking. Fees from financial advisory assignments and underwriting revenues are recognized in earnings when the services related to the underlying transaction are completed under the terms of the assignment. Expenses associated with such transactions are deferred until the related revenue is recognized or the assignment is otherwise concluded. Expenses associated with financial advisory assignments are recorded as non-compensation expenses, net of client reimbursements. Underwriting revenues are presented net of related expenses.
Investment Management. The firm earns management fees and incentive fees for investment management services. Management fees for mutual funds are calculated as a percentage of daily net asset value and are received monthly. Management fees for hedge funds and separately managed accounts are calculated as a percentage of month-end net asset value and are generally received quarterly. Management fees for private equity funds are calculated as a percentage of monthly invested capital or commitments and are received quarterly, semi-annually or annually, depending on the fund. All management fees are recognized over the period that the related service is provided. Incentive fees are calculated as a percentage of a fund’s or separately managed account’s return, or excess return above a specified benchmark or other performance target. Incentive fees are generally based on investment performance over a 12-month period or over the life of a fund. Fees that are based on performance over a 12-month period are subject to adjustment prior to the end of the measurement period. For fees that are based on investment performance over the life of the fund, future investment underperformance may require fees previously distributed to the firm to be returned to the fund. Incentive fees are recognized only when all material contingencies have been resolved. Management and incentive fee revenues are included in “Investment management” revenues.
The firm makes payments to brokers and advisors related to the placement of the firm’s investment funds. These payments are calculated based on either a percentage of the management fee or the investment fund’s net asset value. Where the firm is principal to the arrangement, such costs are recorded on a gross basis and included in “Brokerage, clearing, exchange and distribution fees,” and where the firm is agent to the arrangement, such costs are recorded on a net basis in “Investment management” revenues.
| | | | |
| 8 | | Goldman Sachs March 20162017 Form 10-Q | | 9 |
THE GOLDMAN SACHS GROUP, INC. AND SUBSIDIARIES
Notes to Condensed Consolidated Financial Statements
(Unaudited)
Commissions and Fees. The firm earns “Commissions and fees” from executing and clearing client transactions on stock, options and futures markets, as well as over-the-counter (OTC) transactions. Commissions and fees are recognized on the day the trade is executed.
Transfers of Financial Assets
Transfers of financial assets are accounted for as sales when the firm has relinquished control over the assets transferred. For transfers of financial assets accounted for as sales, any gains or losses are recognized in net revenues. Assets or liabilities that arise from the firm’s continuing involvement with transferred financial assets are initially recognized at fair value. For transfers of financial assets that are not accounted for as sales, the assets generally remain in “Financial instruments owned, at fair value” and the transfer is accounted for as a collateralized financing, with the related interest expense recognized over the life of the transaction. See Note 10 for further information about transfers of financial assets accounted for as collateralized financings and Note 11 for further information about transfers of financial assets accounted for as sales.
Cash and Cash Equivalents
The firm defines cash equivalents as highly liquid overnight deposits held in the ordinary course of business. As of March 20162017 and December 2015,2016, “Cash and cash equivalents” included $5.53$14.27 billion and $6.47$11.15 billion, respectively, of cash and due from banks, and $73.64$108.77 billion and $68.64$110.56 billion, respectively, of interest-bearing deposits with banks. The firm segregates cash for regulatory and other purposes related to client activity. As of March 2017 and December 2016, $15.18 billion and $14.65 billion, respectively, of “Cash and cash equivalents” were segregated for regulatory and other purposes. See “Recent Accounting Developments” for further information.
In addition, the firm segregates securities for regulatory and other purposes related to client activity. See Note 10 for further information about segregated securities.
Receivables from and Payables to Brokers, Dealers and Clearing Organizations
Receivables from and payables to brokers, dealers and clearing organizations are accounted for at cost plus accrued interest, which generally approximates fair value. While these receivables and payables are carried at amounts that approximate fair value, they are not accounted for at fair value under the fair value option or at fair value in accordance with other U.S. GAAP and therefore are not included in the firm’s fair value hierarchy in Notes 6 through 8. Had these receivables and payables been included in the firm’s fair value hierarchy, substantially all would have been classified in level 2 as of March 20162017 and December 2015.2016.
Receivables from Customers and Counterparties
Receivables from customers and counterparties generally relate to collateralized transactions. Such receivables are primarily comprised of customer margin loans, certain transfers of assets accounted for as secured loans rather than purchases at fair value and collateral posted in connection with certain derivative transactions. Substantially all of these receivables are accounted for at amortized cost net of estimated uncollectible amounts. Certain of the firm’s receivables from customers and counterparties are accounted for at fair value under the fair value option, with changes in fair value generally included in “Market making” revenues. See Note 8 for further information about receivables from customers and counterparties accounted for at fair value under the fair value option. In addition, as of March 20162017 and December 2015,2016, the firm’s receivables from customers and counterparties included $4.38$2.91 billion and $2.35$2.60 billion, respectively, of loans held for sale, accounted for at the lower of cost or fair value. See Note 5 for an overview of the firm’s fair value measurement policies.
As of March 20162017 and December 2015,2016, the carrying value of receivables not accounted for at fair value generally approximated fair value. While these itemsreceivables are carried at amounts that approximate fair value, they are not accounted for at fair value under the fair value option or at fair value in accordance with other U.S. GAAP and therefore are not included in the firm’s fair value hierarchy in Notes 6 through 8. Had these itemsreceivables been included in the firm’s fair value hierarchy, substantially all would have been classified in level 2 as of March 20162017 and December 2015.2016. Interest on receivables from customers and counterparties is recognized over the life of the transaction and included in “Interest income.”
Payables to Customers and Counterparties
Payables to customers and counterparties primarily consist of customer credit balances related to the firm’s prime brokerage activities. Payables to customers and counterparties are accounted for at cost plus accrued interest, which generally approximates fair value. While these payables are carried at amounts that approximate fair value, they are not accounted for at fair value under the fair value option or at fair value in accordance with other U.S. GAAP and therefore are not included in the firm’s fair value hierarchy in Notes 6 through 8. Had these payables been included in the firm’s fair value hierarchy, substantially all would have been classified in level 2 as of March 20162017 and December 2015.2016. Interest on payables to customers and counterparties is recognized over the life of the transaction and included in “Interest expense.”
| | | | |
10 | | Goldman Sachs March 20162017 Form 10-Q | | 9 |
THE GOLDMAN SACHS GROUP, INC. AND SUBSIDIARIES
Notes to Condensed Consolidated Financial Statements
(Unaudited)
Offsetting Assets and Liabilities
To reduce credit exposures on derivatives and securities financing transactions, the firm may enter into master netting agreements or similar arrangements (collectively, netting agreements) with counterparties that permit it to offset receivables and payables with such counterparties. A netting agreement is a contract with a counterparty that permits net settlement of multiple transactions with that counterparty, including upon the exercise of termination rights by a non-defaulting party. Upon exercise of such termination rights, all transactions governed by the netting agreement are terminated and a net settlement amount is calculated. In addition, the firm receives and posts cash and securities collateral with respect to its derivatives and securities financing transactions, subject to the terms of the related credit support agreements or similar arrangements (collectively, credit support agreements). An enforceable credit support agreement grants the non-defaulting party exercising termination rights the right to liquidate the collateral and apply the proceeds to any amounts owed. In order to assess enforceability of the firm’s right of setoff under netting and credit support agreements, the firm evaluates various factors including applicable bankruptcy laws, local statutes and regulatory provisions in the jurisdiction of the parties to the agreement.
Derivatives are reported on a net-by-counterparty basis (i.e., the net payable or receivable for derivative assets and liabilities for a given counterparty) in the condensed consolidated statements of financial condition when a legal right of setoff exists under an enforceable netting agreement. Resale and repurchase agreements and securities borrowed and loaned transactions with the same term and currency are presented on a net-by-counterparty basis in the condensed consolidated statements of financial condition when such transactions meet certain settlement criteria and are subject to netting agreements.
In the condensed consolidated statements of financial condition, derivatives are reported net of cash collateral received and posted under enforceable credit support agreements, when transacted under an enforceable netting agreement. In the condensed consolidated statements of financial condition, resale and repurchase agreements, and securities borrowed and loaned, are not reported net of the related cash and securities received or posted as collateral. See Note 10 for further information about collateral received and pledged, including rights to deliver or repledge collateral. See Notes 7 and 10 for further information about offsetting.
Share-based Compensation
The cost of employee services received in exchange for a share-based award is generally measured based on the grant-date fair value of the award. Share-based awards that do not require future service (i.e., vested awards, including awards granted to retirement-eligible employees) are expensed immediately. Share-based awards that require future service are amortized over the relevant service period. ExpectedEffective January 2017, forfeitures are included in determining share-based employee compensation expense.recorded when they occur. Prior to January 2017, expected forfeitures were estimated and recorded over the vesting period. See “Recent Accounting Developments — Improvements to Employee Share-Based Payment Accounting (ASC 718)” for additional information.
The firm pays cash dividend equivalents on outstanding restricted stock units (RSUs). Dividend equivalents paid on RSUs, which are generally charged to retained earnings. Dividend equivalents paid onIf RSUs expected to bethat require future service are forfeited, are included in compensation expense. The firm accounts for the tax benefit related to dividend equivalents paid on RSUs as an increaseoriginally charged to additional paid-in capital.retained earnings are reclassified to compensation expense in the period in which forfeiture occurs.
The firm generally issues new shares of common stock upon delivery of share-based awards. In certain cases, primarily related to conflicted employment (as outlined in the applicable award agreements), the firm may cash settle share-based compensation awards accounted for as equity instruments. For these awards, whose terms allow for cash settlement, additional paid-in capital is adjusted to the extent of the difference between the value of the award at the time of cash settlement and the grant-date value of the award.
Foreign Currency Translation
Assets and liabilities denominated in non-U.S. currencies are translated at rates of exchange prevailing on the date of the condensed consolidated statements of financial condition and revenues and expenses are translated at average rates of exchange for the period. Foreign currency remeasurement gains or losses on transactions in nonfunctional currencies are recognized in earnings. Gains or losses on translation of the financial statements of a non-U.S. operation, when the functional currency is other than the U.S. dollar, are included, net of hedges and taxes, in the condensed consolidated statements of comprehensive income.
| | | | |
| 10 | | Goldman Sachs March 20162017 Form 10-Q | | 11 |
THE GOLDMAN SACHS GROUP, INC. AND SUBSIDIARIES
Notes to Condensed Consolidated Financial Statements
(Unaudited)
Recent Accounting Developments
Revenue from Contracts with Customers (ASC 606). In May 2014, the FASB issued ASU No. 2014-09, “Revenue from Contracts with Customers (Topic 606).” This ASU, No. 2014-09as amended, provides comprehensive guidance on the recognition of revenue from customers arising from the transfer of goods and services. The ASU also providesservices, guidance on accounting for certain contract costs, and requires new disclosures.
The ASU No. 2014-09, as amended by ASU No. 2015-14, ASU No. 2016-08 and ASU No. 2016-10, is effective for annual reportingthe firm in January 2018 under a modified retrospective approach or retrospectively to all periods beginning after December 15, 2017, including interim periodspresented. The firm’s implementation efforts include identifying revenues and costs within that reporting period. Early adoption is permitted for annual reporting periods beginning after December 15, 2016.the scope of the ASU, reviewing contracts, and analyzing any changes to its existing revenue recognition policies. As a result of adopting this ASU, the firm may, among other things, be required to recognize incentive fees earlier than under the firm’s current revenue recognition policy, which defers recognition until all contingencies are resolved. The firm is still evaluatingmay also be required to change the effectcurrent presentation of certain costs from a net presentation within net revenues to a gross basis, or vice versa. Based on implementation work to date, the firm does not currently expect that the ASU will have a material impact on its financial condition, results of operations andor cash flows.flows on the date of adoption.
Measuring the Financial Assets and the Financial Liabilities of a Consolidated Collateralized Financing Entity (ASC 810).In August 2014, the FASB issued ASU No. 2014-13, “Consolidation (Topic 810) — Measuring the Financial Assets and the Financial Liabilities of a Consolidated Collateralized Financing Entity (CFE).” This ASU No. 2014-13 provides an alternative to reflect changes in the fair value of the financial assets and the financial liabilities of the CFE by measuring either the fair value of the assets or liabilities, whichever is more observable. ASU No. 2014-13observable, and provides new disclosure requirements for those electing this approach, and was effective for interim and annual periods beginning after December 15, 2015.approach.
The firm adopted the ASU in January 2016. Adoption of the ASU No. 2014-13 did not materially affect the firm’s financial condition, results of operations or cash flows.
Amendments to the Consolidation Analysis (ASC 810). In February 2015, the FASB issued ASU No. 2015-02, “Consolidation (Topic 810) — Amendments to the Consolidation Analysis.” This ASU No. 2015-02 eliminates the deferral of the requirements of ASU No. 2009-17, “Consolidations (Topic 810) — Improvements to Financial Reporting by Enterprises Involved with Variable Interest Entities” for certain interests in investment funds and provides a scope exception from Topic 810 for certain investments in money market funds. The ASUIt also makes several modifications to the consolidation guidance for VIEs and general partners’ investments in limited partnerships, as well as modifications to the evaluation of whether limited partnerships are VIEs or voting interest entities. ASU No. 2015-02 is effective for interim and annual reporting periods beginning after December 15, 2015 and is required to be adopted under a modified retrospective approach or retrospectively to all periods presented.
The firm adopted the ASU No. 2015-02 as ofin January 1, 2016, using a modified retrospective approach. The impact of adoption was a net reduction to both total assets and total liabilities of approximately $200 million, substantially all included in “Financial instruments owned, at fair value” and in “Other liabilities and accrued expenses,” respectively. Adoption of this ASU No. 2015-02 did not have an impact on the firm’s results of operations. See Note 12 for further information about the adoption of ASU No. 2015-02.
Simplifying the Presentation of Debt Issuance Costs (ASC 835). In April 2015, the FASB issued ASU No. 2015-03, “Interest — Imputation of Interest (Subtopic 835-30) — Simplifying the Presentation of Debt Issuance Costs.” ASU No. 2015-03 simplifies the presentation of debt issuance costs by requiring that these costs related to a recognized debt liability be presented in the statements of financial condition as a direct reduction from the carrying amount of that liability. ASU No. 2015-03 is effective for annual reporting periods beginning after December 15, 2015, including interim periods within that reporting period. ASU No. 2015-03 is required to be applied retrospectively to all periods presented beginning in the year of adoption. Early adoption was permitted. The firm early adopted ASU No. 2015-03 in September 2015. In accordance with ASU No. 2015-03, previously reported amounts have been conformed to the current presentation.
Simplifying the Accounting for Measurement-Period Adjustments (ASC 805). In September 2015, the FASB issued ASU No. 2015-16, “Business Combinations (Topic 805) — Simplifying the Accounting for Measurement-Period Adjustments.” This ASU No. 2015-16 eliminates the requirement for an acquirer in a business combination to account for measurement-period adjustments retrospectively.
The firm adopted the ASU No. 2015-16 was effective for annual reporting periods beginning after December 15, 2015, including interim periods within that reporting period.in January 2016. Adoption of the ASU No. 2015-16 did not materially affect the firm’s financial condition, results of operations or cash flows.
| | | | |
12 | | Goldman Sachs March 2016 Form 10-Q | | |
THE GOLDMAN SACHS GROUP, INC. AND SUBSIDIARIES
Notes to Condensed Consolidated Financial Statements
(Unaudited)
Disclosures for Investments in Certain Entities That Calculate Net Asset Value (NAV) per Share (or Its Equivalent) (ASC 820). In May 2015, the FASB issued ASU No. 2015–07, “Fair Value Measurement (Topic 820) — Disclosures for Investments in Certain Entities That Calculate Net Asset Value per Share (or Its Equivalent).” ASU No. 2015–07 requires that investments for which the fair value is measured at NAV using the practical expedient (investments in funds measured at NAV) under “Fair Value Measurements and Disclosures” (Topic 820) be excluded from the fair value hierarchy. ASU No. 2015–07 is effective for annual reporting periods beginning after December 15, 2015, including interim periods within that reporting period. ASU No. 2015–07 is required to be applied retrospectively to all periods presented beginning in the period of adoption. Early adoption was permitted. The firm early adopted ASU No. 2015–07 in June 2015 and adoption did not affect the firm’s financial condition, results of operations, or cash flows. In accordance with ASU No. 2015-07, previously reported amounts have been conformed to the current presentation. See Notes 4 through 6 for the disclosures required by ASU No. 2015-07.
Recognition and Measurement of Financial Assets and Financial Liabilities (ASC 825). In January 2016, the FASB issued ASU No. 2016-01, “Financial Instruments (Topic 825) — Recognition and Measurement of Financial Assets and Financial Liabilities.” This ASU No. 2016-01 amends certain aspects of recognition, measurement, presentation and disclosure of financial instruments. This guidanceIt includes a requirement to present separately in other comprehensive income changes in fair value attributable to a firm’s own credit spreads (debt valuation adjustment or DVA), net of tax, on financial liabilities for which the fair value option was elected.
| | | | |
| | Goldman Sachs March 2017 Form 10-Q | | 11 |
THE GOLDMAN SACHS GROUP, INC. AND SUBSIDIARIES
Notes to Condensed Consolidated Financial Statements
(Unaudited)
The ASU No. 2016-01 is effective for annual reporting periods beginning after December 15, 2017, including interim periods within that reporting period.the firm in January 2018. Early adoption is permitted under a modified retrospective approach for the requirements related to DVA. In the first quarter ofJanuary 2016, the firm early adopted this ASU No. 2016-01 for the requirements related to DVA and reclassified the cumulative DVA, a gain of $305 million (net of tax), from retained earnings to accumulated other comprehensive loss. The firm does not expect the adoption of the remaining provisions of the ASU to have a material impact on its financial condition, results of operations or cash flows.
Leases (ASC 842).In February 2016, the FASB issued ASU No. 2016-02, “Leases (Topic 842).” This ASU No. 2016-02 requires that, at lease inception,for leases longer than one year, a lessee recognize in the statements of financial condition a right-of-use asset, representing the right to use the underlying asset for the lease term, and a lease liability, representing the liability to make lease payments. The ASUIt also requires that for finance leases, a lessee recognize interest expense on the lease liability, separately from the amortization of the right-of-use asset in the statements of earnings, while for operating leases, such amounts should be recognized as a combined expense in the statements of earnings.expense. In addition, this ASU No. 2016-02 requires expanded disclosures about the nature and terms of lease agreements andagreements.
The ASU is effective for annual reporting periods beginning after December 15, 2018, including interim periods within that reporting period.the firm in January 2019 under a modified retrospective approach. Early adoption is permitted. The firm’s implementation efforts include reviewing existing leases and service contracts, which may include embedded leases. The firm is still evaluating the effectexpects a gross up on its consolidated statements of financial condition upon recognition of the ASUright-of-use assets and lease liabilities and does not expect the amount of the gross up to have a material impact on its financial condition, results of operations, and cash flows.condition.
Improvements to Employee Share-Based Payment Accounting (ASC 718).In March 2016, the FASB issued ASU No. 2016-09, “Compensation — Stock Compensation (Topic 718) — Improvements to Employee Share-Based Payment Accounting.” ASU No. 2016-09 includes provisions to simplify certain aspects related to the accounting for share-based awards and the related financial statement presentation. This ASU includes a requirement that the tax effect related to the settlement of share-based awards be recorded in income tax benefit or expense in the statements of earnings.earnings rather than directly to additional paid-in capital. This change has no impact on total shareholders’ equity and is required to be adopted prospectively. The ASU also allows for forfeitures to be recorded when they occur rather than estimated over the vesting period. This change is required to be applied on a modified retrospective basis.
The firm adopted prospectivelythe ASU in January 2017 and the impact of the RSU deliveries and option exercises in the first quarter of 2017 was a reduction to the provision for taxes of $475 million, which was recognized in the condensed consolidated statements of earnings. The impact will vary in future periods depending upon, among other things, the number of RSUs delivered and their change in value since grant. Prior to the adoption of this ASU, this amount would have been recorded directly to additional paid-in capital. The firm also elected to account for forfeitures as they occur, rather than to estimate forfeitures over the vesting period, and the cumulative effect of adoption. this election upon adoption was an increase of $35 million to “Share-based awards” and a decrease of $24 million (net of tax of $11 million) to “Retained earnings” within the condensed consolidated statements of changes in shareholders’ equity.
In addition, the ASU modifies the classification of certain share-based payment activities within the statements of cash flows. As a result, the firm reclassified, on a retrospective basis, a cash outflow of $888 million related to the settlement of share-based awards in satisfaction of withholding tax requirements from operating activities to financing activities and a cash inflow of $54 million of excess tax benefits related to share-based awards from financing activities to operating activities within the condensed consolidated statements of cash flows for the three months ended March 2016.
Measurement of Credit Losses on Financial Instruments (ASC 326). In June 2016, the FASB issued ASU No. 2016-13, “Financial Instruments — Credit Losses (Topic 326) — Measurement of Credit Losses on Financial Instruments.” This ASU amends several aspects of the measurement of credit losses on financial instruments, including replacing the existing incurred credit loss model and other models with the Current Expected Credit Losses (CECL) model and amending certain aspects of accounting for purchased financial assets with deterioration in credit quality since origination.
| | | | |
| 12 | | Goldman Sachs March 2017 Form 10-Q | | |
THE GOLDMAN SACHS GROUP, INC. AND SUBSIDIARIES
Notes to Condensed Consolidated Financial Statements
(Unaudited)
Under CECL, the allowance for losses for financial assets that are measured at amortized cost should reflect management’s estimate of credit losses over the remaining expected life of the financial assets. Expected credit losses for newly recognized financial assets, as well as changes to expected credit losses during the period, would be recognized in earnings. For certain purchased financial assets with deterioration in credit quality since origination, an initial allowance would be recorded for expected credit losses and recognized as an increase to the purchase price rather than as an expense. Expected credit losses, including losses on off-balance-sheet exposures such as lending commitments, will be measured based on historical experience, current conditions and forecasts that affect the collectability of the reported amount.
The ASU is effective for the firm in January 2020 under a modified retrospective approach. Early adoption is permitted in January 2019. Adoption of the ASU will result in earlier recognition of credit losses and an increase in the recorded allowance for certain purchased loans with deterioration in credit quality since origination with a corresponding increase to their gross carrying value. The impact of adoption of this ASU on the firm’s financial condition, results of operations and cash flows will depend on, among other things, the economic environment and the type of financial assets held by the firm on the date of adoption.
Classification of Certain Cash Receipts and Cash Payments (ASC 230). In August 2016, the FASB issued ASU No. 2016-15, “Statement of Cash Flows (Topic 230) — Classification of Certain Cash Receipts and Cash Payments.” This ASU provides guidance on the disclosure and classification of certain items within the statements of cash flows.
The ASU is effective for the firm in January 2018 under a retrospective approach. Early adoption is permitted. Since the ASU only impacts classification in the statements of cash flows, adoption will not affect the firm’s cash and cash equivalents.
Restricted Cash (ASC 230). In November 2016, the FASB issued ASU No. 2016-18, “Statement of Cash Flows (Topic 230) — Restricted Cash.” This ASU requires that cash segregated for regulatory and other purposes be included in cash and cash equivalents disclosed in the statements of cash flows and these changes areis required to be applied retrospectively to all periods presented, orretrospectively.
The firm early adopted the ASU in certain cases prospectively, beginningDecember 2016 and reclassified cash segregated for regulatory and other purposes into “Cash and cash equivalents” disclosed in the periodconsolidated statements of adoption.cash flows. The impact of adoption was an increase of $448 million for the three months ended March 2016 to “Net cash used for operating activities.” In addition, in December 2016, to be consistent with the presentation of segregated cash in the consolidated statements of cash flows under the ASU, the firm reclassified amounts previously included in “Cash and securities segregated for regulatory and other purposes” into “Cash and cash equivalents,” “Securities purchased under agreements to resell and federal funds sold,” “Securities borrowed” and “Financial instruments owned, at fair value,” in the consolidated statements of financial condition. Previously reported amounts in the condensed consolidated statements of cash flows and notes to the condensed consolidated financial statements have been conformed to the current presentation.
Clarifying the Definition of a Business (ASC 805). In January 2017, the FASB issued ASU No. 2016-092017-01, “Business Combinations (Topic 805) — Clarifying the Definition of a Business.” The ASU amends the definition of a business and provides a threshold which must be considered to determine whether a transaction is an acquisition (or disposal) of an asset or a business. The ASU is effective for annual reporting periods beginning after December 15, 2016, including interim periods within that reporting period.the firm in January 2018 under a prospective approach. Early adoption is permitted. The impact of this ASU will depend on the nature of the firm’s activities after adoption, although the firm expects that fewer transactions will be treated as acquisitions (or disposals) of businesses.
Clarifying the Scope of Asset Derecognition Guidance and Accounting for Partial Sales of Nonfinancial Assets (ASC 610-20). In February 2017, the FASB issued ASU No. 2016-09 could be material2017-05, “Other Income — Gains and Losses from the Derecognition of Nonfinancial Assets (Subtopic 610-20) — Clarifying the Scope of Asset Derecognition Guidance and Accounting for Partial Sales of Nonfinancial Assets.” The ASU clarifies the scope of guidance applicable to sales of nonfinancial assets and also provides guidance on accounting for partial sales of such assets.
The ASU is effective for the firm in January 2018 under a retrospective or modified retrospective approach. The firm is still evaluating the effect of the ASU on its financial condition, results of operations and cash flows in future periods depending upon, among other things, the level of earnings and stock price of the firm.flows.
| | | | |
| | | Goldman Sachs March 20162017 Form 10-Q | | 13 |
THE GOLDMAN SACHS GROUP, INC. AND SUBSIDIARIES
Notes to Condensed Consolidated Financial Statements
(Unaudited)
Note 4.
| | | | |
Note 4.
Financial Instruments Owned, at Fair Value and Financial Instruments Sold, But Not Yet Purchased, at Fair Value | | | | |
Financial instruments owned, at fair value and financial instruments sold, but not yet purchased, at fair value are accounted for at fair value either under the fair value option or in accordance with other U.S. GAAP. See Note 8 for further information about other financial assets and financial liabilities accounted for at fair value primarily under the fair value option.
The table below presents the firm’s financial instruments owned, at fair value, and financial instruments sold, but not yet purchased, at fair value.
| | $ in millions | |
| Financial
Instruments
Owned |
| |
| Financial
Instruments
Sold, But
Not Yet
Purchased |
| |
| Financial
Instruments Owned |
| |
| Financial
Instruments Sold, But Not Yet Purchased |
|
As of March 2016 | | | | | |
Commercial paper, certificates of deposit, time deposits and other money market instruments | | | $ 1,878 | | | | $ — | | |
As of March 2017 | | | | | |
Money market instruments | | | | $ 1,735 | | | | $ — | |
| | | | | |
U.S. government and federal agency obligations | | | 46,716 | | | | 12,453 | | | | 71,035 | | | | 20,181 | |
| | | | | |
Non-U.S. government and agency obligations | | | 34,627 | | | | 17,539 | | | | 35,614 | | | | 23,285 | |
| | | | | |
Loans and securities backed by commercial real estate | | | 5,555 | | | | 2 | | |
Loans and securities backed by: | | | | | |
Commercial real estate | | | | 3,602 | | | | — | |
| | | | | |
Loans and securities backed by residential real estate | | | 12,196 | | | | 1 | | |
Residential real estate | | | | 12,133 | | | | — | |
| | | | | |
Bank loans and bridge loans | | | 11,292 | | | | 557 | | |
| | | |
Corporate debt securities | | | 17,108 | | | | 7,678 | | |
Corporate loans and debt securities | | | | 31,721 | | | | 7,258 | |
| | | | | |
State and municipal obligations | | | 1,169 | | | | — | | | | 1,108 | | | | — | |
| | | | | |
Other debt obligations | | | 1,361 | | | | 2 | | | | 1,364 | | | | 1 | |
| | | | | |
Equities and convertible debentures | | | 81,912 | | | | 34,598 | | |
Equity securities | | | | 95,539 | | | | 26,195 | |
| | | | | |
Commodities | | | 5,240 | | | | — | | | | 3,643 | | | | — | |
| | | | | |
Investments in funds measured at NAV | | | 7,177 | | | | — | | |
Investments in funds at NAV | | | | 6,183 | | | | — | |
Subtotal | | | 226,231 | | | | 72,830 | | | | 263,677 | | | | 76,920 | |
| | | | | |
Derivatives | | | 60,671 | | | | 54,183 | | | | 45,194 | | | | 39,007 | |
Total | | | $286,902 | | | | $127,013 | | | | $308,871 | | | | $115,927 | |
As of December 2015 | | | | | |
Commercial paper, certificates of deposit, time deposits and other money market instruments | | $ 2,583 | | | | $ — | | |
As of December 2016 | | | | | |
Money market instruments | | | $ 1,319 | | | | $ — | |
| | | | | |
U.S. government and federal agency obligations | | 46,382 | | | | 15,516 | | | 57,657 | | | 16,627 | |
| | | | | |
Non-U.S. government and agency obligations | | 31,772 | | | | 14,973 | | | 29,381 | | | 20,502 | |
| | | | | |
Loans and securities backed by commercial real estate | | 4,975 | | | | 4 | | |
Loans and securities backed by: | | | | | |
Commercial real estate | | | 3,842 | | | | — | |
| | | | | |
Loans and securities backed by residential real estate | | 13,183 | | | | 2 | | |
Residential real estate | | | 12,195 | | | 3 | |
| | | | | |
Bank loans and bridge loans | | 12,164 | | | | 461 | | |
| | | |
Corporate debt securities | | 16,640 | | | | 6,123 | | |
Corporate loans and debt securities | | | 28,659 | | | 6,570 | |
| | | | | |
State and municipal obligations | | 992 | | | | 2 | | | 1,059 | | | | — | |
| | | | | |
Other debt obligations | | 1,595 | | | | 2 | | | 1,358 | | | 1 | |
| | | | | |
Equities and convertible debentures | | 98,072 | | | | 31,394 | | |
Equity securities | | | 94,692 | | | 25,941 | |
| | | | | |
Commodities | | 3,935 | | | | — | | | 5,653 | | | | — | |
| | | | | |
Investments in funds measured at NAV | | 7,757 | | | | — | | |
Investments in funds at NAV | | | 6,465 | | | | — | |
Subtotal | | 240,050 | | | | 68,477 | | | 242,280 | | | 69,644 | |
| | | | | |
Derivatives | | 53,890 | | | | 46,771 | | | 53,672 | | | 47,499 | |
Total | | $293,940 | | | | $115,248 | | | $295,952 | | | $117,143 | |
In the table above:
Money market instruments include commercial paper, certificates of deposit and time deposits, substantially all of which have a maturity of less than one year.
Equity securities include public and private equities, exchange-traded funds and convertible debentures.
Gains and Losses from Market Making and Other Principal Transactions
The table below presents “Market making” revenues by major product type, as well as “Other principal transactions” revenues.
| $ in millions Product Type | | Three Months Ended March | | |
| | | 2016 | | | | 2015 | | |
| | | | Three Months Ended March | |
| $ in millions | | | | 2017 | | | | 2016 | |
Interest rates | | | $1,177 | | | | $(2,586 | ) | | | $1,364 | | | | $1,177 | |
| | | | | |
Credit | | | 618 | | | | 932 | | | | 544 | | | | 618 | |
| | | | | |
Currencies | | | (908 | ) | | | 3,652 | | | | (318 | ) | | | (908 | ) |
| | | | | |
Equities | | | 691 | | | | 1,662 | | | | 578 | | | | 691 | |
| | | | | |
Commodities | | | 284 | | | | 265 | | | | 250 | | | | 284 | |
Market making | | | 1,862 | | | | 3,925 | | | | 2,418 | | | | 1,862 | |
Other principal transactions | | | (49 | ) | | | 1,572 | | | | 1,221 | | | | (49 | ) |
Total | | | $1,813 | | | | $ 5,497 | | | | $3,639 | | | | $1,813 | |
In the table above:
Gains/(losses) include both realized and unrealized gains and losses, and are primarily related to the firm’s financial instruments owned, at fair value and financial instruments sold, but not yet purchased, at fair value, including both derivative and non-derivative financial instruments.
Gains/(losses) exclude related interest income and interest expense. See Note 23 for further information about interest income and interest expense.
Gains/(losses) on other principal transactions are included in the firm’s Investing & Lending segment. See Note 25 for net revenues, including net interest income, by product type for Investing & Lending, as well as the amount of net interest income included in Investing & Lending.
Gains/(losses) are not representative of the manner in which the firm manages its business activities because many of the firm’s market-making and client facilitation strategies utilize financial instruments across various product types. Accordingly, gains or losses in one product type frequently offset gains or losses in other product types. For example, most of the firm’s longer-term derivatives across product types are sensitive to changes in interest rates and may be economically hedged with interest rate swaps. Similarly, a significant portion of the firm’s cash instruments and derivatives across product types has exposure to foreign currencies and may be economically hedged with foreign currency contracts.
| | | | |
| 14 | | Goldman Sachs March 20162017 Form 10-Q | | |
THE GOLDMAN SACHS GROUP, INC. AND SUBSIDIARIES
Notes to Condensed Consolidated Financial Statements
(Unaudited)
Note 5.
Fair Value Measurements
The fair value of a financial instrument is the amount that would be received to sell an asset or paid to transfer a liability in an orderly transaction between market participants at the measurement date. Financial assets are marked to bid prices and financial liabilities are marked to offer prices. Fair value measurements do not include transaction costs. The firm measures certain financial assets and financial liabilities as a portfolio (i.e., based on its net exposure to market and/or credit risks).
The best evidence of fair value is a quoted price in an active market. If quoted prices in active markets are not available, fair value is determined by reference to prices for similar instruments, quoted prices or recent transactions in less active markets, or internally developed models that primarily use market-based or independently sourced parameters as inputs including, but not limited to, interest rates, volatilities, equity or debt prices, foreign exchange rates, commodity prices, credit spreads and funding spreads (i.e., the spread or difference between the interest rate at which a borrower could finance a given financial instrument relative to a benchmark interest rate).
U.S. GAAP has a three-level fair value hierarchy for disclosure of fair value measurements. The fair valueThis hierarchy prioritizes inputs to the valuation techniques used to measure fair value, giving the highest priority to level 1 inputs and the lowest priority to level 3 inputs. A financial instrument’s level in the fair valuethis hierarchy is based on the lowest level of input that is significant to its fair value measurement. In evaluating the significance of a valuation input, the firm considers, among other factors, a portfolio’s net risk exposure to that input. The fair value hierarchy is as follows:
Level 1. Inputs are unadjusted quoted prices in active markets to which the firm had access at the measurement date for identical, unrestricted assets or liabilities.
Level 2. Inputs to valuation techniques are observable, either directly or indirectly.
Level 3. One or more inputs to valuation techniques are significant and unobservable.
The fair values for substantially all of the firm’s financial assets and financial liabilities are based on observable prices and inputs and are classified in levels 1 and 2 of the fair value hierarchy. Certain level 2 and level 3 financial assets and financial liabilities may require appropriate valuation adjustments that a market participant would require to arrive at fair value for factors such as counterparty and the firm’s credit quality, funding risk, transfer restrictions, liquidity and bid/offer spreads. Valuation adjustments are generally based on market evidence.
See Notes 6 through 8 for further information about fair value measurements of cash instruments, derivatives and other financial assets and financial liabilities accounted for at fair value primarily under the fair value option (including information about unrealized gains and losses related to level 3 financial assets and financial liabilities, and transfers in and out of level 3), respectively.
The table below presents financial assets and financial liabilities accounted for at fair value under the fair value option or in accordance with other U.S. GAAP.
| | | | | | | | |
| | | As of | |
| $ in millions | |
| March
2017 |
| |
| December
2016 |
|
Total level 1 financial assets | | | $151,691 | | | | $135,401 | |
| | |
Total level 2 financial assets | | | 406,332 | | | | 419,585 | |
| | |
Total level 3 financial assets | | | 23,288 | | | | 23,280 | |
| | |
Investments in funds at NAV | | | 6,183 | | | | 6,465 | |
| | |
Counterparty and cash collateral netting | | | (78,540 | ) | | | (87,038 | ) |
Total financial assets at fair value | | | $508,954 | | | | $497,693 | |
Total assets | | | $894,069 | | | | $860,165 | |
| | |
Total level 3 financial assets divided by: | | | | | | | | |
Total assets | | | 2.6% | | | | 2.7% | |
| | |
Total financial assets at fair value | | | 4.6% | | | | 4.7% | |
Total level 1 financial liabilities | | | $ 67,732 | | | | $ 62,504 | |
| | |
Total level 2 financial liabilities | | | 246,087 | | | | 232,027 | |
| | |
Total level 3 financial liabilities | | | 21,067 | | | | 21,448 | |
| | |
Counterparty and cash collateral netting | | | (37,802 | ) | | | (44,695 | ) |
Total financial liabilities at fair value | | | $297,084 | | | | $271,284 | |
Total level 3 financial liabilities divided by total financial liabilities at fair value | | | 7.1% | | | | 7.9% | |
In the table above:
Counterparty netting among positions classified in the same level is included in that level.
Counterparty and cash collateral netting represents the impact on derivatives of netting across levels of the fair value hierarchy. Netting among positions classified in the same level is included in that level.
| | | | | | | | |
| | | As of | |
| $ in millions | |
| March
2016 |
| |
| December
2015 |
|
Total level 1 financial assets | | | $136,833 | | | | $153,051 | |
| | |
Total level 2 financial assets | | | 450,629 | | | | 432,445 | |
| | |
Total level 3 financial assets | | | 24,462 | | | | 24,046 | |
| | |
Investments in funds measured at NAV | | | 7,177 | | | | 7,757 | |
| | |
Counterparty and cash collateral netting | | | (95,400 | ) | | | (90,612 | ) |
Total financial assets at fair value | | | $523,701 | | | | $526,687 | |
Total assets 1 | | | $878,036 | | | | $861,395 | |
| | |
Total level 3 financial assets as a percentage of total assets | | | 2.8% | | | | 2.8% | |
| | |
Total level 3 financial assets as a percentage of total financial assets at fair value | | | 4.7% | | | | 4.6% | |
Total level 1 financial liabilities | | | $ 62,777 | | | | $ 59,798 | |
| | |
Total level 2 financial liabilities | | | 257,286 | | | | 245,759 | |
| | |
Total level 3 financial liabilities | | | 19,683 | | | | 16,812 | |
| | |
Counterparty and cash collateral netting | | | (49,223 | ) | | | (41,430 | ) |
Total financial liabilities at fair value | | | $290,523 | | | | $280,939 | |
| | |
Total level 3 financial liabilities as a percentage of total financial liabilities at fair value | | | 6.8% | | | | 6.0% | |
1. | Includes $854Total assets includes $867 billion and $835 billion and $836 billion as of March 2016 and December 2015, respectively, that is carried at fair value or at amounts that generally approximate fair value.
|
The table below presents a summary of level 3 financial assets. See Notes 6 through 8 for further information about level 3 financial assets.
| | | | | | | | |
| | | As of | |
| $ in millions | |
| March
2016 |
| |
| December
2015 |
|
Cash instruments | | | $ 18,469 | | | | $ 18,131 | |
| | |
Derivatives | | | 5,950 | | | | 5,870 | |
| | |
Other financial assets | | | 43 | | | | 45 | |
Total | | | $ 24,462 | | | | $ 24,046 | |
Level 3 financial assets as of March 2017 and December 2016, were essentially unchanged compared with December 2015.respectively, that is carried at fair value or at amounts that generally approximate fair value.
| | | | |
| | | Goldman Sachs March 20162017 Form 10-Q | | 15 |
THE GOLDMAN SACHS GROUP, INC. AND SUBSIDIARIES
Notes to Condensed Consolidated Financial Statements
(Unaudited)
The table below presents a summary of level 3 financial assets.
| | | | | | | | |
| | | As of | |
| $ in millions | |
| March
2017 |
| |
| December
2016 |
|
Cash instruments | | | $18,324 | | | | $18,035 | |
| | |
Derivatives | | | 4,950 | | | | 5,190 | |
| | |
Other financial assets | | | 14 | | | | 55 | |
Total | | | $23,288 | | | | $23,280 | |
Level 3 financial assets as of March 2017 were essentially unchanged compared with December 2016. See Notes 6 through 8 for further information about level 3 financial assets.
Note 6.
Cash Instruments
Cash instruments include U.S. government and federal agency obligations, non-U.S. government and agency obligations, mortgage-backed loans and securities, bankcorporate loans and bridge loans, corporate debt securities, equities and convertible debentures,equity securities, investments in funds measured at NAV, and other non-derivative financial instruments owned and financial instruments sold, but not yet purchased. See below for the types of cash instruments included in each level of the fair value hierarchy and the valuation techniques and significant inputs used to determine their fair values. See Note 5 for an overview of the firm’s fair value measurement policies.
Level 1 Cash Instruments
Level 1 cash instruments include certain money market instruments, U.S. government obligations, and most non-U.S. government obligations, actively traded listed equities, certain government agency obligations, certain corporate debt securities and money market instruments.actively traded listed equities. These instruments are valued using quoted prices for identical unrestricted instruments in active markets.
The firm defines active markets for equity instruments based on the average daily trading volume both in absolute terms and relative to the market capitalization for the instrument. The firm defines active markets for debt instruments based on both the average daily trading volume and the number of days with trading activity.
Level 2 Cash Instruments
Level 2 cash instruments include commercial paper, certificates of deposit, time deposits,most money market instruments, most government agency obligations, certain non-U.S. government obligations, most corporate debt securities, commodities, certain mortgage-backed loans and securities, certain bankmost corporate loans and bridge loans,debt securities, most state and municipal obligations, most other debt obligations, restricted or less liquid listed equities, most state and municipal obligationscommodities and certain lending commitments.
Valuations of level 2 cash instruments can be verified to quoted prices, recent trading activity for identical or similar instruments, broker or dealer quotations or alternative pricing sources with reasonable levels of price transparency. Consideration is given to the nature of the quotations (e.g., indicative or firm) and the relationship of recent market activity to the prices provided from alternative pricing sources.
Valuation adjustments are typically made to level 2 cash instruments (i) if the cash instrument is subject to transfer restrictions and/or (ii) for other premiums and liquidity discounts that a market participant would require to arrive at fair value. Valuation adjustments are generally based on market evidence.
Level 3 Cash Instruments
Level 3 cash instruments have one or more significant valuation inputs that are not observable. Absent evidence to the contrary, level 3 cash instruments are initially valued at transaction price, which is considered to be the best initial estimate of fair value. Subsequently, the firm uses other methodologies to determine fair value, which vary based on the type of instrument. Valuation inputs and assumptions are changed when corroborated by substantive observable evidence, including values realized on sales of financial assets.
Valuation Techniques and Significant Inputs of Level 3 Cash Instruments
Valuation techniques of level 3 cash instruments vary by instrument, but are generally based on discounted cash flow techniques. The valuation techniques and the nature of significant inputs used to determine the fair values of each type of level 3 cash instrument are described below:
Loans and Securities Backed by Commercial Real Estate.Loans and securities backed by commercial real estate are directly or indirectly collateralized by a single commercial real estate property or a portfolio of properties, and may include tranches of varying levels of subordination. Significant inputs are generally determined based on relative value analyses and include:
Transaction prices in both the underlying collateral and instruments with the same or similar underlying collateral and the basis, or price difference, to such prices;collateral;
Market yields implied by transactions of similar or related assets and/or current levels and changes in market indices such as the CMBX (an index that tracks the performance of commercial mortgage bonds);
| | | | |
| 16 | | Goldman Sachs March 20162017 Form 10-Q | | |
THE GOLDMAN SACHS GROUP, INC. AND SUBSIDIARIES
Notes to Condensed Consolidated Financial Statements
(Unaudited)
A measure of expected future cash flows in a default scenario (recovery rates) implied by the value of the underlying collateral, which is mainly driven by current performance of the underlying collateral, capitalization rates and multiples. Recovery rates are expressed as a percentage of notional or face value of the instrument and reflect the benefit of credit enhancements on certain instruments; and
Timing of expected future cash flows (duration) which, in certain cases, may incorporate the impact of other unobservable inputs (e.g., prepayment speeds).
Loans and Securities Backed by Residential Real Estate. Loans and securities backed by residential real estate are directly or indirectly collateralized by portfolios of residential real estate and may include tranches of varying levels of subordination. Significant inputs are generally determined based on relative value analyses, which incorporate comparisons to instruments with similar collateral and risk profiles. Significant inputs include:
Transaction prices in both the underlying collateral and instruments with the same or similar underlying collateral;
Market yields implied by transactions of similar or related assets;
Cumulative loss expectations, driven by default rates, home price projections, residential property liquidation timelines, related costs and subsequent recoveries; and
Duration, driven by underlying loan prepayment speeds and residential property liquidation timelines.
BankCorporate Loans and Bridge Loans.Debt Securities. Corporate loans and debt securities includes bank loans and bridge loans and corporate debt securities. Significant inputs are generally determined based on relative value analyses, which incorporate comparisons both to prices of credit default swaps that reference the same or similar underlying instrument or entity and to other debt instruments for the same issuer for which observable prices or broker quotations are available. Significant inputs include:
Market yields implied by transactions of similar or related assets and/or current levels and trends of market indices such as CDX and LCDX (indices that track the performance of corporate credit and loans, respectively);
Current performance and recovery assumptions and, where the firm uses credit default swaps to value the related cash instrument, the cost of borrowing the underlying reference obligation; and
EquitiesEquity Securities. Equity securities include private equity securities and Convertible Debentures (Including Private Equity Investments and Investments in Real Estate Entities).convertible debentures. Recent third-party completed or pending transactions (e.g., merger proposals, tender offers, debt restructurings) are considered to be the best evidence for any change in fair value. When these are not available, the following valuation methodologies are used, as appropriate:
Industry multiples (primarily EBITDA multiples) and public comparables;
Transactions in similar instruments;
Discounted cash flow techniques; and
The firm also considers changes in the outlook for the relevant industry and financial performance of the issuer as compared to projected performance. Significant inputs include:
Market and transaction multiples;
Discount rates long-term growth rates, earnings compound annual growth rates and capitalization rates; and
For equity instrumentssecurities with debt-like features, market yields implied by transactions of similar or related assets, current performance and recovery assumptions, and duration.
Other Cash Instruments. Other cash instruments consists of commercial paper, certificates of deposit, time deposits and other money market instruments; non-U.S. government and agency obligations; corporate debt securities;obligations, state and municipal obligations;obligations, and other debt obligations. Significant inputs are generally determined based on relative value analyses, which incorporate comparisons both to prices of credit default swaps that reference the same or similar underlying instrument or entity and to other debt instruments for the same issuer for which observable prices or broker quotations are available. Significant inputs include:
Market yields implied by transactions of similar or related assets and/or current levels and trends of market indices such as CDX and LCDX;indices;
Current performance and recovery assumptions and, where the firm uses credit default swaps to value the related cash instrument, the cost of borrowing the underlying reference obligation; and
| | | | |
| | | Goldman Sachs March 20162017 Form 10-Q | | 17 |
THE GOLDMAN SACHS GROUP, INC. AND SUBSIDIARIES
Notes to Condensed Consolidated Financial Statements
(Unaudited)
Fair Value of Cash Instruments by Level
The tables below present cash instrument assets and liabilities at fair value by level within the fair value hierarchy.
| | | | | | | | | | | | | | | | |
| | | As of March 2017 | |
| $ in millions | | | Level 1 | | | | Level 2 | | | | Level 3 | | | | Total | |
Assets | | | | | | | | | | | | | | | | |
Money market instruments | | | $ 307 | | | | $ 1,428 | | | | $ — | | | | $ 1,735 | |
| | |
U.S. government and federal agency obligations | | | 44,423 | | | | 26,612 | | | | — | | | | 71,035 | |
| | |
Non-U.S. government and agency obligations | | | 29,523 | | | | 6,061 | | | | 30 | | | | 35,614 | |
| | |
Loans and securities backed by: | | | | | | | | | | | | | | | | |
Commercial real estate | | | — | | | | 1,998 | | | | 1,604 | | | | 3,602 | |
| | |
Residential real estate | | | — | | | | 11,303 | | | | 830 | | | | 12,133 | |
| | |
Corporate loans and debt securities | | | 410 | | | | 26,758 | | | | 4,553 | | | | 31,721 | |
| | |
State and municipal obligations | | | — | | | | 1,012 | | | | 96 | | | | 1,108 | |
| | |
Other debt obligations | | | — | | | | 868 | | | | 496 | | | | 1,364 | |
| | |
Equity securities | | | 76,969 | | | | 7,855 | | | | 10,715 | | | | 95,539 | |
| | |
Commodities | | | — | | | | 3,643 | | | | — | | | | 3,643 | |
Subtotal | | | $151,632 | | | | $87,538 | | | | $18,324 | | | | $257,494 | |
| | |
Investments in funds at NAV | | | | | | | | | | | | | | | 6,183 | |
Total cash instrument assets | | | | | | | | | | | | | | | $263,677 | |
Liabilities | | | | | | | | | | | | | | | | |
U.S. government and federal agency obligations | | | $ (19,827 | ) | | | $ (354 | ) | | | $ — | | | | $ (20,181 | ) |
| | |
Non-U.S. government and agency obligations | | | (21,532 | ) | | | (1,753 | ) | | | — | | | | (23,285 | ) |
| | |
Corporate loans and debt securities | | | (8 | ) | | | (7,208 | ) | | | (42 | ) | | | (7,258 | ) |
| | |
Other debt obligations | | | — | | | | (1 | ) | | | — | | | | (1 | ) |
| | |
Equity securities | | | (25,900 | ) | | | (288 | ) | | | (7 | ) | | | (26,195 | ) |
Total cash instrument liabilities | | | $ (67,267 | ) | | | $ (9,604 | ) | | | $ (49 | ) | | | $ (76,920 | ) |
| | | | | | | | | | | | | | | | |
| | | As of December 2016 | |
| $ in millions | | | Level 1 | | | | Level 2 | | | | Level 3 | | | | Total | |
Assets | | | | | | | | | | | | | | | | |
Money market instruments | | | $ 188 | | | | $ 1,131 | | | | $ — | | | | $ 1,319 | |
| | |
U.S. government and federal agency obligations | | | 35,254 | | | | 22,403 | | | | — | | | | 57,657 | |
| | |
Non-U.S. government and agency obligations | | | 22,433 | | | | 6,933 | | | | 15 | | | | 29,381 | |
| | |
Loans and securities backed by: | | | | | | | | | | | | | | | | |
Commercial real estate | | | — | | | | 2,197 | | | | 1,645 | | | | 3,842 | |
| | |
Residential real estate | | | — | | | | 11,350 | | | | 845 | | | | 12,195 | |
| | |
Corporate loans and debt securities | | | 215 | | | | 23,804 | | | | 4,640 | | | | 28,659 | |
| | |
State and municipal obligations | | | — | | | | 960 | | | | 99 | | | | 1,059 | |
| | |
Other debt obligations | | | — | | | | 830 | | | | 528 | | | | 1,358 | |
| | |
Equity securities | | | 77,276 | | | | 7,153 | | | | 10,263 | | | | 94,692 | |
| | |
Commodities | | | — | | | | 5,653 | | | | — | | | | 5,653 | |
Subtotal | | | $135,366 | | | | $82,414 | | | | $18,035 | | | | $235,815 | |
| | |
Investments in funds at NAV | | | | | | | | | | | | | | | 6,465 | |
Total cash instrument assets | | | | | | | | | | | | | | | $242,280 | |
Liabilities | | | | | | | | | | | | | | | | |
U.S. government and federal agency obligations | | | $ (16,615 | ) | | | $ (12 | ) | | | $ — | | | | $ (16,627 | ) |
| | |
Non-U.S. government and agency obligations | | | (19,137 | ) | | | (1,364 | ) | | | (1 | ) | | | (20,502 | ) |
| | |
Loans and securities backed by residential real estate | | | — | | | | (3 | ) | | | — | | | | (3 | ) |
| | |
Corporate loans and debt securities | | | (2 | ) | | | (6,524 | ) | | | (44 | ) | | | (6,570 | ) |
| | |
Other debt obligations | | | — | | | | (1 | ) | | | — | | | | (1 | ) |
| | |
Equity securities | | | (25,768 | ) | | | (156 | ) | | | (17 | ) | | | (25,941 | ) |
Total cash instrument liabilities | | | $ (61,522 | ) | | | $ (8,060 | ) | | | $ (62 | ) | | | $ (69,644 | ) |
In the tables below:above:
Cash instrument assets and liabilities are included in “Financial instruments owned, at fair value” and “Financial instruments sold, but not yet purchased, at fair value,” respectively.
Cash instrument assets are shown as positive amounts and cash instrument liabilities are shown as negative amounts.
| | | | | | | | | | | | | | | | |
| | | As of March 2016 | |
| $ in millions | | | Level 1 | | | | Level 2 | | | | Level 3 | | | | Total | |
Assets | | | | | | | | | | | | | | | | |
Commercial paper, certificates of deposit, time deposits and other money market instruments | | | $ 262 | | | | $ 1,616 | | | | $ — | | | | $ 1,878 | |
| | |
U.S. government and federal agency obligations | | | 24,242 | | | | 22,474 | | | | — | | | | 46,716 | |
| | |
Non-U.S. government and agency obligations | | | 28,797 | | | | 5,772 | | | | 58 | | | | 34,627 | |
| | |
Loans and securities backed by commercial real estate | | | — | | | | 3,387 | | | | 2,168 | | | | 5,555 | |
| | |
Loans and securities backed by residential real estate | | | — | | | | 10,762 | | | | 1,434 | | | | 12,196 | |
| | |
Bank loans and bridge loans | | | — | | | | 8,103 | | | | 3,189 | | | | 11,292 | |
| | |
Corporate debt securities | | | 185 | | | | 14,321 | | | | 2,602 | | | | 17,108 | |
| | |
State and municipal obligations | | | — | | | | 1,083 | �� | | | 86 | | | | 1,169 | |
| | |
Other debt obligations | | | — | | | | 903 | | | | 458 | | | | 1,361 | |
| | |
Equities and convertible debentures | | | 65,439 | | | | 7,999 | | | | 8,474 | | | | 81,912 | |
| | |
Commodities | | | — | | | | 5,240 | | | | — | | | | 5,240 | |
Subtotal | | | $118,925 | | | | $81,660 | | | | $18,469 | | | | $219,054 | |
| | |
Investments in funds measured at NAV | | | | | | | | | | | | | | | 7,177 | |
Total cash instrument assets | | | | | | | | | | | | | | | $226,231 | |
Liabilities | | | | | | | | | | | | | | | | |
U.S. government and federal agency obligations | | | $(12,444 | ) | | | $ (9 | ) | | | $ — | | | | $ (12,453 | ) |
| | |
Non-U.S. government and agency obligations | | | (16,078 | ) | | | (1,461 | ) | | | — | | | | (17,539 | ) |
| | |
Loans and securities backed by commercial real estate | | | — | | | | (1 | ) | | | (1 | ) | | | (2 | ) |
| | |
Loans and securities backed by residential real estate | | | — | | | | (1 | ) | | | — | | | | (1 | ) |
| | |
Bank loans and bridge loans | | | — | | | | (464 | ) | | | (93 | ) | | | (557 | ) |
| | |
Corporate debt securities | | | (9 | ) | | | (7,665 | ) | | | (4 | ) | | | (7,678 | ) |
| | |
Other debt obligations | | | — | | | | (1 | ) | | | (1 | ) | | | (2 | ) |
| | |
Equities and convertible debentures | | | (34,221 | ) | | | (338 | ) | | | (39 | ) | | | (34,598 | ) |
Total cash instrument liabilities | | | $(62,752 | ) | | | $ (9,940 | ) | | | $ (138 | ) | | | $(72,830 | ) |
Money market instruments include commercial paper, certificates of deposit and time deposits.
| | | | | | | | | | | | | | | | |
| | | As of December 2015 | |
| $ in millions | | | Level 1 | | | | Level 2 | | | | Level 3 | | | | Total | |
Assets | | | | | | | | | | | | | | | | |
Commercial paper, certificates of deposit, time deposits and other money market instruments | | | $ 625 | | | | $ 1,958 | | | | $ — | | | | $ 2,583 | |
| | |
U.S. government and federal agency obligations | | | 24,844 | | | | 21,538 | | | | — | | | | 46,382 | |
| | |
Non-U.S. government and agency obligations | | | 26,500 | | | | 5,260 | | | | 12 | | | | 31,772 | |
| | |
Loans and securities backed by commercial real estate | | | — | | | | 3,051 | | | | 1,924 | | | | 4,975 | |
| | |
Loans and securities backed by residential real estate | | | — | | | | 11,418 | | | | 1,765 | | | | 13,183 | |
| | |
Bank loans and bridge loans | | | — | | | | 9,014 | | | | 3,150 | | | | 12,164 | |
| | |
Corporate debt securities | | | 218 | | | | 14,330 | | | | 2,092 | | | | 16,640 | |
| | |
State and municipal obligations | | | — | | | | 891 | | | | 101 | | | | 992 | |
| | |
Other debt obligations | | | — | | | | 1,057 | | | | 538 | | | | 1,595 | |
| | |
Equities and convertible debentures | | | 81,252 | | | | 8,271 | | | | 8,549 | | | | 98,072 | |
| | |
Commodities | | | — | | | | 3,935 | | | | — | | | | 3,935 | |
Subtotal | | | $133,439 | | | | $80,723 | | | | $18,131 | | | | $232,293 | |
| | |
Investments in funds measured at NAV | | | | | | | | | | | | | | | 7,757 | |
Total cash instrument assets | | | | | | | | | | | | | | | $240,050 | |
Liabilities | | | | | | | | | | | | | | | | |
U.S. government and federal agency obligations | | | $ (15,455 | ) | | | $ (61 | ) | | | $ — | | | | $ (15,516 | ) |
| | |
Non-U.S. government and agency obligations | | | (13,522 | ) | | | (1,451 | ) | | | — | | | | (14,973 | ) |
| | |
Loans and securities backed by commercial real estate | | | — | | | | (4 | ) | | | — | | | | (4 | ) |
| | |
Loans and securities backed by residential real estate | | | — | | | | (2 | ) | | | — | | | | (2 | ) |
| | |
Bank loans and bridge loans | | | — | | | | (337 | ) | | | (124 | ) | | | (461 | ) |
| | |
Corporate debt securities | | | (2 | ) | | | (6,119 | ) | | | (2 | ) | | | (6,123 | ) |
| | |
State and municipal obligations | | | — | | | | (2 | ) | | | — | | | | (2 | ) |
| | |
Other debt obligations | | | — | | | | (1 | ) | | | (1 | ) | | | (2 | ) |
| | |
Equities and convertible debentures | | | (30,790 | ) | | | (538 | ) | | | (66 | ) | | | (31,394 | ) |
Total cash instrument liabilities | | | $ (59,769 | ) | | | $ (8,515 | ) | | | $ (193 | ) | | | $ (68,477 | ) |
InEquity securities include public and private equities, exchange-traded funds and convertible debentures.
As of March 2017 and December 2016, substantially all of the tables above:firm’s level 3 equity securities were comprised of private equity securities.
Total cash instrument assets includesinclude collateralized debt obligations (CDOs) and collateralized loan obligations (CLOs) backed by real estate and corporate obligations of $419$414 million and $461 million in level 2, and $793$527 million and $624 million in level 3 as of March 2017 and December 2016, and $405 million in level 2 and $774 million in level 3 as of December 2015, respectively.
Level 3 equities and convertible debentures includes $7.76 billion of private equity investments, $303 million of investments in real estate entities and $414 million of convertible debentures as of March 2016, and $7.69 billion of private equity investments, $308 million of investments in real estate entities and $552 million of convertible debentures as of December 2015.
| | | | |
| 18 | | Goldman Sachs March 20162017 Form 10-Q | | |
THE GOLDMAN SACHS GROUP, INC. AND SUBSIDIARIES
Notes to Condensed Consolidated Financial Statements
(Unaudited)
Significant Unobservable Inputs
The table below presents the amount of level 3 assets, and ranges and weighted averages of significant unobservable inputs used to value the firm’s level 3 cash instruments.
| | | | Level 3 Assets and Range of Significant Unobservable Inputs (Weighted Average) as of | | Level 3 Assets and Range of Significant Unobservable Inputs (Weighted Average) as of | |
| $ in millions | | March 2016 | | December 2015 | |
| March
2017 |
| |
| December
2016 |
|
Loans and securities backed by commercial real estate | | $2,168 | | $1,924 | Loans and securities backed by commercial real estate | |
Level 3 assets | | | | $1,604 | | | $1,645 | |
| | | | |
Yield | | 2.2% to 24.0% (12.7%) | | 3.5% to 22.0% (11.8%) | | | 4.5% to 22.0% (12.3% | ) | | 3.7% to 23.0% (13.0% | ) |
| | | | |
Recovery rate | | 18.9% to 98.9% (59.7%) | | 19.6% to 96.5% (59.4%) | | | 17.4% to 97.9% (61.3% | ) | | 8.9% to 99.0% (60.6% | ) |
| | | | |
Duration (years) | | 0.3 to 5.0 (2.0) | | 0.3 to 5.3 (2.3) | | | 0.7 to 6.1 (1.9 | ) | | 0.8 to 6.2 (2.1 | ) |
| | |
Basis (points) | | (12) to 6 ((2)) | | (11) to 4 ((2)) | |
Loans and securities backed by residential real estate | | $1,434 | | $1,765 | Loans and securities backed by residential real estate | |
Level 3 assets | | | | $830 | | | $845 | |
| | | | |
Yield | | 3.0% to 13.3% (8.3%) | | 3.2% to 17.0% (7.9%) | | | 1.9% to 15.0% (8.3% | ) | | 0.8% to 15.6% (8.7% | ) |
| | | | |
Cumulative loss rate | | 3.2% to 35.2% (26.3%) | | 4.6% to 44.2% (27.3%) | | | 9.4% to 46.8% (25.7% | ) | | 8.9% to 47.1% (24.2% | ) |
| | | | |
Duration (years) | | 1.4 to 14.1 (6.8) | | 1.5 to 13.8 (7.0) | | | 1.1 to 14.6 (6.8 | ) | | 1.1 to 16.1 (7.3 | ) |
Bank loans and bridge loans | | $3,189 | | $3,150 | |
Corporate loans and debt securities | | Corporate loans and debt securities | |
Level 3 assets | | | | $4,553 | | | $4,640 | |
| | | | |
Yield | | 1.7% to 25.0% (9.6%) | | 1.9% to 36.6% (10.2%) | | | 2.6% to 24.5% (10.4% | ) | | 2.5% to 25.0% (10.3% | ) |
| | | | |
Recovery rate | | 5.9% to 85.2% (49.2%) | | 14.5% to 85.6% (51.2%) | | | 0.0% to 94.0% (56.5% | ) | | 0.0% to 85.0% (56.5% | ) |
| | | | |
Duration (years) | | 0.6 to 5.7 (2.7) | | 0.7 to 6.1 (2.2) | | | 0.3 to 5.4 (2.9 | ) | | 0.6 to 15.7 (2.9 | ) |
Equities and convertible debentures | | $8,474 | | $8,549 | |
Equity securities | | Equity securities | |
Level 3 assets | | | | $10,715 | | | $10,263 | |
| | | | |
Multiples | | 0.7x to 17.8x (6.3x) | | 0.7x to 21.4x (6.4x) | | | 0.8x to 24.6x (7.0x | ) | | 0.8x to 19.7x (6.8x | ) |
| | | | |
Discount rate/yield | | 6.5% to 30.0% (15.1%) | | 7.1% to 20.0% (14.8%) | | | 6.5% to 30.0% (16.2% | ) | | 6.5% to 25.0% (16.0% | ) |
| | | | |
Long-term growth rate/compound annual growth rate | | 3.0% to 5.2% (4.5%) | | 3.0% to 5.2% (4.5%) | |
| | |
Capitalization rate | | 5.0% to 12.0% (7.1%) | | 5.5% to 12.5% (7.6%) | | | 4.1% to 12.9% (6.6% | ) | | 4.2% to 12.5% (6.8% | ) |
Other cash instruments | | $3,204 | | $2,743 | Other cash instruments | |
Level 3 assets | | | | $622 | | | $642 | |
| | | | |
Yield | | 1.5% to 18.4% (11.5%) | | 0.9% to 25.6% (10.9%) | | | 2.4% to 16.1% (9.0% | ) | | 1.9% to 14.0% (8.8% | ) |
| | | | |
Recovery rate | | 0.0% to 90.9% (62.3%) | | 0.0% to 70.0% (59.7%) | | | 2.7% to 93.0% (82.6% | ) | | 0.0% to 93.0% (61.4% | ) |
| | | | |
Duration (years) | | 1.2 to 16.5 (4.0) | | 1.1 to 11.4 (4.5) | | | 0.8 to 12.0 (3.9 | ) | | 0.9 to 12.0 (4.3 | ) |
In the table above:
Ranges represent the significant unobservable inputs that were used in the valuation of each type of cash instrument.
Weighted averages are calculated by weighting each input by the relative fair value of the cash instruments.
The ranges and weighted averages of these inputs are not representative of the appropriate inputs to use when calculating the fair value of any one cash instrument. For example, the highest multiple for private equity investmentssecurities is appropriate for valuing a specific private equity investmentsecurity but may not be appropriate for valuing any other private equity investment.security. Accordingly, the ranges of inputs do not represent uncertainty in, or possible ranges of, fair value measurements of the firm’s level 3 cash instruments.
Increases in yield, discount rate, capitalization rate, duration or cumulative loss rate used in the valuation of the firm’s level 3 cash instruments would result in a lower fair value measurement, while increases in recovery rate basis,or multiples long-term growth rate or compound annual growth rate would result in a higher fair value measurement. Due to the distinctive nature of each of the firm’s level 3 cash instruments, the interrelationship of inputs is not necessarily uniform within each product type.
Equities and convertible debenturesEquity securities include private equity investmentssecurities and investments in real estate entities.convertible debentures.
Loans and securities backed by commercial and residential real estate, bankcorporate loans and bridge loansdebt securities and other cash instruments are valued using discounted cash flows, and equities and convertible debenturesequity securities are valued using market comparables and discounted cash flows.
The fair value of any one instrument may be determined using multiple valuation techniques. For example, market comparables and discounted cash flows may be used together to determine fair value. Therefore, the level 3 balance encompasses both of these techniques.
Transfers Between Levels of the Fair Value Hierarchy
Transfers between levels of the fair value hierarchy are reported at the beginning of the reporting period in which they occur. See “Level 3 Rollforward” below for information about transfers between level 2 and level 3.
During the three months ended March 2016:2017, transfers into level 2 from level 1 of cash instruments were $182 million, reflecting transfers of public equity securities due to decreased market activity in these instruments. Transfers into level 1 from level 2 of cash instruments were $33 million, reflecting transfers of public equity securities due to increased market activity in these instruments.
TransfersDuring the three months ended March 2016, transfers into level 2 from level 1 of cash instruments were $137 million, reflecting transfers of public equity securities primarily due to decreased market activity in these instruments.
Transfers into level 1 from level 2 of cash instruments were $195 million, primarily reflecting transfers of public equity securities principally due to increased market activity in these instruments.
During the three months ended March 2015:
Transfers into level 2 from level 1 of cash instruments were $141 million, reflecting transfers of public equity securities primarily due to decreased market activity in these instruments.
Transfers into level 1 from level 2 of cash instruments were $237 million, reflecting transfers of public equity securities due to increased market activity in these instruments.
See level 3 rollforward below for information about transfers between level 2 and level 3.
| | | | |
| | | Goldman Sachs March 20162017 Form 10-Q | | 19 |
THE GOLDMAN SACHS GROUP, INC. AND SUBSIDIARIES
Notes to Condensed Consolidated Financial Statements
(Unaudited)
Level 3 Rollforward
The table below presents a summary of the changes in fair value for level 3 cash instrument assets and liabilities.
| | | | | | | | |
| | | Three Months Ended March | |
| $ in millions | | | 2017 | | | | 2016 | |
Total cash instrument assets | | | | | | | | |
Beginning balance | | | $18,035 | | | | $18,131 | |
| | |
Net realized gains/(losses) | | | 131 | | | | 150 | |
| | |
Net unrealized gains/(losses) | | | 402 | | | | (40 | ) |
| | |
Purchases | | | 683 | | | | 1,418 | |
| | |
Sales | | | (687 | ) | | | (794 | ) |
| | |
Settlements | | | (716 | ) | | | (986 | ) |
| | |
Transfers into level 3 | | | 1,605 | | | | 1,568 | |
| | |
Transfers out of level 3 | | | (1,129 | ) | | | (978 | ) |
Ending balance | | | $18,324 | | | | $18,469 | |
Total cash instrument liabilities | | | | | | | | |
Beginning balance | | | $ (62 | ) | | | $ (193 | ) |
| | |
Net realized gains/(losses) | | | — | | | | 3 | |
| | |
Net unrealized gains/(losses) | | | 4 | | | | 8 | |
| | |
Purchases | | | 36 | | | | 58 | |
| | |
Sales | | | (28 | ) | | | (26 | ) |
| | |
Settlements | | | (2 | ) | | | (1 | ) |
| | |
Transfers into level 3 | | | (2 | ) | | | (18 | ) |
| | |
Transfers out of level 3 | | | 5 | | | | 31 | |
Ending balance | | | $ (49 | ) | | | $ (138 | ) |
In the table above:
Changes in fair value are presented for all cash instrument assets and liabilities categorized asthat are classified in level 3 as of the end of the period. In the table below:
Net unrealized gains/(losses) relate to instruments that were still held at period-end.
Purchases include originations and secondary purchases.
If a cash instrument asset or liability was transferred to level 3 during a reporting period, its entire gain or loss for the period is includedclassified in level 3. For level 3 cash instrument assets, increases are shown as positive amounts, while decreases are shown as negative amounts. For level 3 cash instrument liabilities, increases are shown as negative amounts, while decreases are shown as positive amounts.
Level 3 cash instruments are frequently economically hedged with level 1 and level 2 cash instruments and/or level 1, level 2 or level 3 derivatives. Accordingly, gains or losses that are reportedclassified in level 3 can be partially offset by gains or losses attributable to level 1 or level 2 cash instruments and/or level 1, level 2 or level 3 derivatives. As a result, gains or losses included in the level 3 rollforward below do not necessarily represent the overall impact on the firm’s results of operations, liquidity or capital resources.
Purchases include both originations and secondary market purchases.
Net unrealized gains/(losses) relate to instruments that were still held at period-end.
ForThe table below disaggregates, by product type, the three months ended March 2016, the net realized and unrealized gains on level 3information for cash instrument assets of $110 million (reflecting $150 million of realized gains and $40 million of unrealized losses) include gains/(losses) of approximately $(115) million, $9 million and $216 million reportedincluded in “Market making,” “Other principal transactions” and “Interest income,” respectively.the summary table above.
For the three months ended March 2015, the net realized and unrealized gains on level 3 cash instrument assets of $676 million (reflecting $273 million of realized gains and $403 million of unrealized gains) include gains of approximately $94 million, $376 million and $206 million reported in “Market making,” “Other principal transactions” and “Interest income,” respectively.
See “Level 3 Rollforward Commentary” below for an explanation of the net unrealized gains/(losses) on level 3 cash instruments and the activity related to transfers into and out of level 3.
| | | | | | | | |
| | | Three Months Ended March | |
| $ in millions | | | 2017 | | | | 2016 | |
Loans and securities backed by commercial real estate | | | | | |
Beginning balance | | | $ 1,645 | | | | $1,924 | |
| | |
Net realized gains/(losses) | | | 16 | | | | 21 | |
| | |
Net unrealized gains/(losses) | | | 51 | | | | (8 | ) |
| | |
Purchases | | | 47 | | | | 340 | |
| | |
Sales | | | (55 | ) | | | (135 | ) |
| | |
Settlements | | | (130 | ) | | | (123 | ) |
| | |
Transfers into level 3 | | | 147 | | | | 253 | |
| | |
Transfers out of level 3 | | | (117 | ) | | | (104 | ) |
Ending balance | | | $ 1,604 | | | | $2,168 | |
Loans and securities backed by residential real estate | | | | | |
Beginning balance | | | $ 845 | | | | $1,765 | |
| | |
Net realized gains/(losses) | | | 9 | | | | 12 | |
| | |
Net unrealized gains/(losses) | | | 35 | | | | 45 | |
| | |
Purchases | | | 149 | | | | 61 | |
| | |
Sales | | | (156 | ) | | | (298 | ) |
| | |
Settlements | | | (49 | ) | | | (82 | ) |
| | |
Transfers into level 3 | | | 39 | | | | 132 | |
| | |
Transfers out of level 3 | | | (42 | ) | | | (201 | ) |
Ending balance | | | $ 830 | | | | $1,434 | |
Corporate loans and debt securities | | | | | | | | |
Beginning balance | | | $ 4,640 | | | | $5,242 | |
| | |
Net realized gains/(losses) | | | 66 | | | | 74 | |
| | |
Net unrealized gains/(losses) | | | 69 | | | | 8 | |
| | |
Purchases | | | 306 | | | | 587 | |
| | |
Sales | | | (375 | ) | | | (137 | ) |
| | |
Settlements | | | (330 | ) | | | (492 | ) |
| | |
Transfers into level 3 | | | 762 | | | | 802 | |
| | |
Transfers out of level 3 | | | (585 | ) | | | (293 | ) |
Ending balance | | | $ 4,553 | | | | $5,791 | |
Equity securities | | | | | | | | |
Beginning balance | | | $10,263 | | | | $8,549 | |
| | |
Net realized gains/(losses) | | | 29 | | | | 32 | |
| | |
Net unrealized gains/(losses) | | | 252 | | | | (82 | ) |
| | |
Purchases | | | 103 | | | | 380 | |
| | |
Sales | | | (56 | ) | | | (96 | ) |
| | |
Settlements | | | (142 | ) | | | (250 | ) |
| | |
Transfers into level 3 | | | 616 | | | | 295 | |
| | |
Transfers out of level 3 | | | (350 | ) | | | (354 | ) |
Ending balance | | | $10,715 | | | | $8,474 | |
Other cash instruments | | | | | | | | |
Beginning balance | | | $ 642 | | | | $ 651 | |
| | |
Net realized gains/(losses) | | | 11 | | | | 11 | |
| | |
Net unrealized gains/(losses) | | | (5 | ) | | | (3 | ) |
| | |
Purchases | | | 78 | | | | 50 | |
| | |
Sales | | | (45 | ) | | | (128 | ) |
| | |
Settlements | | | (65 | ) | | | (39 | ) |
| | |
Transfers into level 3 | | | 41 | | | | 86 | |
| | |
Transfers out of level 3 | | | (35 | ) | | | (26 | ) |
Ending balance | | | $ 622 | | | | $ 602 | |
| | | | | | | | | | | | | | | | | | | | | | | | | | | | | | | | | | | | |
| | | Level 3 Cash Instrument Assets and Liabilities at Fair Value | |
| $ in millions | |
| Balance,
beginning
of period |
| |
| Net
realized
gains/
(losses) |
| |
| Net
unrealized
gains/
(losses) |
| | | Purchases | | | | Sales | | | | Settlements | | |
| Transfers
into
level 3 |
| |
| Transfers
out of
level 3 |
| |
| Balance,
end of
period |
|
| Three Months Ended March 2016 | | | | | | | | | | | | | | | | | | | | | | | | | | | | | | | | | | | | |
Non-U.S. government and agency obligations | | | $ 12 | | | | $ 1 | | | | $ — | | | | $ 20 | | | | $ (11 | ) | | | $ — | | | | $ 36 | | | | $ — | | | | $ 58 | |
| | |
Loans and securities backed by commercial real estate | | | 1,924 | | | | 21 | | | | (8 | ) | | | 340 | | | | (135 | ) | | | (123 | ) | | | 253 | | | | (104 | ) | | | 2,168 | |
| | |
Loans and securities backed by residential real estate | | | 1,765 | | | | 12 | | | | 45 | | | | 61 | | | | (298 | ) | | | (82 | ) | | | 132 | | | | (201 | ) | | | 1,434 | |
| | |
Bank loans and bridge loans | | | 3,150 | | | | 33 | | | | 6 | | | | 183 | | | | (67 | ) | | | (425 | ) | | | 511 | | | | (202 | ) | | | 3,189 | |
| | |
Corporate debt securities | | | 2,092 | | | | 41 | | | | 2 | | | | 404 | | | | (70 | ) | | | (67 | ) | | | 291 | | | | (91 | ) | | | 2,602 | |
| | |
State and municipal obligations | | | 101 | | | | 1 | | | | — | | | | 6 | | | | (31 | ) | | | (1 | ) | | | 22 | | | | (12 | ) | | | 86 | |
| | |
Other debt obligations | | | 538 | | | | 9 | | | | (3 | ) | | | 24 | | | | (86 | ) | | | (38 | ) | | | 28 | | | | (14 | ) | | | 458 | |
| | |
Equities and convertible debentures | | | 8,549 | | | | 32 | | | | (82 | ) | | | 380 | | | | (96 | ) | | | (250 | ) | | | 295 | | | | (354 | ) | | | 8,474 | |
Total cash instrument assets | | | $18,131 | | | | $150 | | | | $ (40 | ) | | | $1,418 | | | | $ (794 | ) | | | $ (986 | ) | | | $1,568 | | | | $ (978 | ) | | | $18,469 | |
Total cash instrument liabilities | | | $ (193 | ) | | | $ 3 | | | | $ 8 | | | | $ 58 | | | | $ (26 | ) | | | $ (1 | ) | | | $ (18 | ) | | | $ 31 | | | | $ (138 | ) |
Three Months Ended March 2015 | | | | | | | | | | | | | | | | | | | | | | | | | | | | | | | | | | | | |
Commercial paper, certificates of deposit, time deposits and other money market instruments | | | $ — | | | | $ — | | | | $ (1 | ) | | | $ — | | | | $ — | | | | $ — | | | | $ 11 | | | | $ — | | | | $ 10 | |
| | |
Non-U.S. government and agency obligations | | | 136 | | | | 1 | | | | — | | | | 1 | | | | (24 | ) | | | (19 | ) | | | — | | | | — | | | | 95 | |
| | |
Loans and securities backed by commercial real estate | | | 3,275 | | | | 35 | | | | (23 | ) | | | 101 | | | | (149 | ) | | | (855 | ) | | | 414 | | | | (35 | ) | | | 2,763 | |
| | |
Loans and securities backed by residential real estate | | | 2,545 | | | | 48 | | | | 62 | | | | 386 | | | | (268 | ) | | | (183 | ) | | | 280 | | | | (97 | ) | | | 2,773 | |
| | |
Bank loans and bridge loans | | | 6,973 | | | | 96 | | | | (108 | ) | | | 405 | | | | (400 | ) | | | (928 | ) | | | 719 | | | | (446 | ) | | | 6,311 | |
| | |
Corporate debt securities | | | 3,633 | | | | 38 | | | | (12 | ) | | | 169 | | | | (367 | ) | | | (216 | ) | | | 369 | | | | (848 | ) | | | 2,766 | |
| | |
State and municipal obligations | | | 110 | | | | — | | | | 1 | | | | 27 | | | | (3 | ) | | | 1 | | | | 33 | | | | (27 | ) | | | 142 | |
| | |
Other debt obligations | | | 870 | | | | 16 | | | | 7 | | | | 150 | | | | (41 | ) | | | (55 | ) | | | 16 | | | | (77 | ) | | | 886 | |
| | |
Equities and convertible debentures | | | 11,108 | | | | 39 | | | | 477 | | | | 168 | | | | (114 | ) | | | (446 | ) | | | 442 | | | | (185 | ) | | | 11,489 | |
Total cash instrument assets | | | $28,650 | | | | $273 | | | | $ 403 | | | | $1,407 | | | | $(1,366 | ) | | | $(2,701 | ) | | | $2,284 | | | | $(1,715 | ) | | | $27,235 | |
Total cash instrument liabilities | | | $ (244 | ) | | | $ (3 | ) | | | $ 28 | | | | $ 56 | | | | $ (24 | ) | | | $ — | | | | $ (41 | ) | | | $ 66 | | | | $ (162 | ) |
| | | | |
| 20 | | Goldman Sachs March 20162017 Form 10-Q | | |
THE GOLDMAN SACHS GROUP, INC. AND SUBSIDIARIES
Notes to Condensed Consolidated Financial Statements
(Unaudited)
Level 3 Rollforward Commentary
Three Months Ended March 2017. The net realized and unrealized gains on level 3 cash instrument assets of $533 million (reflecting $131 million of net realized gains and $402 million of net unrealized gains) for the three months ended March 2017 include gains/(losses) of approximately $(10) million, $396 million and $147 million reported in “Market making,” “Other principal transactions” and “Interest income,” respectively.
The net unrealized gain on level 3 cash instrument assets for the three months ended March 2017 primarily reflected gains on private equity securities, principally driven by strong corporate performance and company-specific events.
Transfers into level 3 during the three months ended March 2017 primarily reflected transfers of certain corporate loans and debt securities and private equity securities from level 2, principally due to reduced price transparency as a result of a lack of market evidence, including fewer transactions in these instruments.
Transfers out of level 3 during the three months ended March 2017 primarily reflected transfers of certain corporate loans and debt securities to level 2, principally due to certain unobservable duration and yield inputs no longer being significant to the valuation of these instruments and certain private equity securities to level 2, principally due to increased price transparency as a result of market evidence, including new transactions in these instruments.
Three Months Ended March 2016. The net realized and unrealized gains on level 3 cash instrument assets of $110 million (reflecting $150 million of realized gains and $40 million of unrealized losses) for the three months ended March 2016 include gains/(losses) of approximately $(115) million, $9 million and $216 million reported in “Market making,” “Other principal transactions” and “Interest income,” respectively.
The net unrealized loss on level 3 cash instruments of $32 million (reflecting a $40 million loss on cash instrument assets and a $8 million gain on cash instrument liabilities) for the three months ended March 2016 reflected losses on private equity investmentssecurities principally driven by lower global equity prices and corporate performance.
Transfers into level 3 during the three months ended March 2016 primarily reflected transfers of certain bankcorporate loans and bridge loans,debt securities, private equity investments, corporate debt securities and loans and securities backed by commercial real estate from level 2, principally due to reduced price transparency as a result of a lack of market evidence, including fewer market transactions in these instruments, and transfers of certain other corporate loans and debt securities from level 2 principally due to certain unobservable yield inputs becoming significant to the valuation of these instruments.
Transfers out of level 3 during the three months ended March 2016 primarily reflected transfers of certain private equity investments, banksecurities, corporate loans and bridge loansdebt securities and loans and securities backed by residential real estate to level 2, principally due to increased price transparency as a result of market evidence, including market transactions in these instruments.
Three Months Ended March 2015.The net unrealized gain on level 3 cash instruments of $431 million (reflecting a $403 million gain on cash instrument assets and a $28 million gain on cash instrument liabilities) for the three months ended March 2015 primarily reflected gains on private equity investments principally driven by strong corporate performance and company-specific events.
Transfers into level 3 during the three months ended March 2015 primarily reflected transfers of certain bank loans and bridge loans, private equity investments and loans and securities backed by commercial real estate from level 2 principally due to reduced price transparency as a result of a lack of market evidence, including fewer market transactions in these instruments.
Transfers out of level 3 during the three months ended March 2015 primarily reflected transfers of certain corporate debt securities, bank loans and bridge loans and private equity investments to level 2 principally due to increased price transparency as a result of market evidence, including additional market transactions in these instruments.
Investments in Funds That Are Measured at Net Asset Value Per Share
Cash instruments at fair value include investments in funds that are measured at NAV of the investment fund. The firm uses NAV to measure the fair value of its fund investments when (i) the fund investment does not have a readily determinable fair value and (ii) the NAV of the investment fund is calculated in a manner consistent with the measurement principles of investment company accounting, including measurement of the investments at fair value.
TheSubstantially all of the firm’s investments in funds measured at NAV primarily consist of investments in firm-sponsored private equity, credit, real estate and hedge funds where the firm co-invests with third-party investors.
Private equity funds primarily invest in a broad range of industries worldwide, including leveraged buyouts, recapitalizations, growth investments and distressed investments. Credit funds generally invest in loans and other fixed income instruments and are focused on providing private high-yield capital for leveraged and management buyout transactions, recapitalizations, financings, refinancings, acquisitions and restructurings for private equity firms, private family companies and corporate issuers. Real estate funds invest globally, primarily in real estate companies, loan portfolios, debt recapitalizations and property. The privatePrivate equity, credit and real estate funds are primarily closed-end funds in which the firm’s investments are generally not eligible for redemption. Distributions will be received from these funds as the underlying assets are liquidated or distributed.
The firm also invests in hedge funds, primarily multi-disciplinary hedge funds that employ a fundamental bottom-up investment approach across various asset classes and strategies. The firm’s investments in hedge funds primarily include interests where the underlying assets are illiquid in nature, and proceeds from redemptions will not be received until the underlying assets are liquidated or distributed.
| | | | |
| | Goldman Sachs March 2017 Form 10-Q | | 21 |
THE GOLDMAN SACHS GROUP, INC. AND SUBSIDIARIES
Notes to Condensed Consolidated Financial Statements
(Unaudited)
Many of the funds described above are “covered funds” as defined by the Volcker Rule of the U.S. Dodd-Frank Wall Street Reform and Consumer Protection Act (Dodd-Frank Act). The Board of Governors of the Federal Reserve System (Federal Reserve Board) extended the conformance period through July 2016 for investments in, and relationships with, covered funds that were in place prior to December 2013 and indicated that it intends to further extend the conformance period through July 2017.
| | | | |
| | Goldman Sachs March 2016 Form 10-Q | | 21 |
THE GOLDMAN SACHS GROUP, INC. AND SUBSIDIARIES
Notes2017, and in December 2016 issued guidance that permitted banking entities to Condensed Consolidated Financial Statements
(Unaudited)
apply for an extension of up to an additional five years (through July 2022) for certain legacy “illiquid funds” (as defined by the Volcker Rule). The firm currently expects to be able to exit the majority of such interests in these funds in orderly transactions prior to July 2017, subject to market conditions. However, to the extent that the underlying investments of particular funds are not sold, the firm may be required to sell its interests in such funds. If that occurs, the firm may receive a valuereceived this extension for its interests that is less than the then carrying value as there could be a limited secondary market for these investments and the firm may be unable to sell them in orderly transactions. In order to be compliant with the Volcker Rule, the firm will be required to reduce mostsubstantially all of its interestsremaining investments in, theand relationships with, covered funds in the table below bybelow. The firm will continue to manage and conform its investments in, and relationships with, such covered funds, taking into account the end ofextended conformance period under the conformance period.Volcker Rule.
The table below presents the fair value of the firm’s investments in funds at NAV and related unfunded commitments to, funds that are measured at NAV.commitments.
| | $ in millions | |
| Fair Value of
Investments |
| |
| Unfunded
Commitments |
| |
| Fair Value of
Investments |
| |
| Unfunded
Commitments |
|
As of March 2016 | | | | | |
As of March 2017 | | | | | |
Private equity funds | | | $4,961 | | | | $2,020 | | | | $4,514 | | | | $1,397 | |
| | | | | |
Credit funds | | | 498 | | | | 319 | | | | 418 | | | | 190 | |
| | | | | |
Hedge funds | | | 548 | | | | — | | | | 337 | | | | — | |
| | | | | |
Real estate funds | | | 1,170 | | | | 215 | | | | 914 | | | | 270 | |
Total | | | $7,177 | | | | $2,554 | | | | $6,183 | | | | $1,857 | |
As of December 2015 | | | | | |
As of December 2016 | | | | | |
Private equity funds | | $5,414 | | | | $2,057 | | | $4,628 | | | | $1,393 | |
| | | | | |
Credit funds | | 611 | | | | 344 | | | 421 | | | | 166 | |
| | | | | |
Hedge funds | | 560 | | | | — | | | 410 | | | | — | |
| | | | | |
Real estate funds | | 1,172 | | | | 296 | | | 1,006 | | | | 272 | |
Total | | $7,757 | | | | $2,697 | | | $6,465 | | | | $1,831 | |
Note 7.
Derivatives and Hedging Activities
Derivative Activities
Derivatives are instruments that derive their value from underlying asset prices, indices, reference rates and other inputs, or a combination of these factors. Derivatives may be traded on an exchange (exchange-traded) or they may be privately negotiated contracts, which are usually referred to as OTC derivatives. Certain of the firm’s OTC derivatives are cleared and settled through central clearing counterparties (OTC-cleared), while others are bilateral contracts between two counterparties (bilateral OTC).
Market-Making. As a market maker, the firm enters into derivative transactions to provide liquidity to clients and to facilitate the transfer and hedging of their risks. In this capacity,role, the firm typically acts as principal and is required to commit capital to provide execution. As a market maker, it is essentialexecution, and maintains inventory in response to, maintain an inventoryor in anticipation of, financial instruments sufficient to meet expected client and market demands.demand.
Risk Management.The firm also enters into derivatives to actively manage risk exposures that arise from its market-making and investing and lending activities in derivative and cash instruments. The firm’s holdings and exposures are hedged, in many cases, on either a portfolio or risk-specific basis, as opposed to an instrument-by-instrument basis. The offsetting impact of this economic hedging is reflected in the same business segment as the related revenues. In addition, the firm may enter into derivatives designated as hedges under U.S. GAAP. These derivatives are used to manage interest rate exposure in certain fixed-rate unsecured long-term and short-term borrowings, and deposits, and to manage foreign currency exposure on the net investment in certain non-U.S. operations.
The firm enters into various types of derivatives, including:
Futures and Forwards. Contracts that commit counterparties to purchase or sell financial instruments, commodities or currencies in the future.
SwapsSwaps.. Contracts that require counterparties to exchange cash flows such as currency or interest payment streams. The amounts exchanged are based on the specific terms of the contract with reference to specified rates, financial instruments, commodities, currencies or indices.
Options. Contracts in which the option purchaser has the right, but not the obligation, to purchase from or sell to the option writer financial instruments, commodities or currencies within a defined time period for a specified price.
Derivatives are reported on a net-by-counterparty basis (i.e., the net payable or receivable for derivative assets and liabilities for a given counterparty) when a legal right of setoff exists under an enforceable netting agreement (counterparty netting). Derivatives are accounted for at fair value, net of cash collateral received or posted under enforceable credit support agreements (cash collateral netting). Derivative assets and liabilities are included in “Financial instruments owned, at fair value” and “Financial instruments sold, but not yet purchased, at fair value,” respectively. Realized and unrealized gains and losses on derivatives not designated as hedges under ASC 815 are included in “Market making” and “Other principal transactions” in Note 4.
| | | | |
| 22 | | Goldman Sachs March 20162017 Form 10-Q | | |
THE GOLDMAN SACHS GROUP, INC. AND SUBSIDIARIES
Notes to Condensed Consolidated Financial Statements
(Unaudited)
The tabletables below presentspresent the gross fair value and the notional amountamounts of derivative contracts by major product type, the amounts of counterparty and cash collateral netting in the condensed consolidated statements of financial condition, as well as cash and securities collateral posted and received under enforceable credit support agreements that do not meet the criteria for netting under U.S. GAAP.
| | | | | | | | | | | | | | | | | | |
| | | As of March 2017 | | | | | As of December 2016 | |
| $ in millions | |
| Derivative
Assets |
| |
| Derivative
Liabilities |
| | | |
| Derivative
Assets |
| |
| Derivative
Liabilities |
|
Not accounted for as hedges | |
Exchange-traded | | | $ 461 | | | | $ 495 | | | | | | $ 443 | | | | $ 382 | |
| | | | | | | | | | | | | | | | | | | |
OTC-cleared | | | 145,594 | | | | 122,472 | | | | | | 189,471 | | | | 168,946 | |
| | |
Bilateral OTC | | | 292,542 | | | | 271,992 | | | | | | 309,037 | | | | 289,491 | |
Total interest rates | | | 438,597 | | | | 394,959 | | | | | | 498,951 | | | | 458,819 | |
OTC-cleared | | | 4,901 | | | | 4,984 | | | | | | 4,837 | | | | 4,811 | |
| | |
Bilateral OTC | | | 19,850 | | | | 16,746 | | | | | | 21,530 | | | | 18,770 | |
Total credit | | | 24,751 | | | | 21,730 | | | | | | 26,367 | | | | 23,581 | |
Exchange-traded | | | 10 | | | | 16 | | | | | | 36 | | | | 176 | |
| | |
OTC-cleared | | | 736 | | | | 729 | | | | | | 796 | | | | 798 | |
| | |
Bilateral OTC | | | 80,074 | | | | 81,025 | | | | | | 111,032 | | | | 106,318 | |
Total currencies | | | 80,820 | | | | 81,770 | | | | | | 111,864 | | | | 107,292 | |
Exchange-traded | | | 3,018 | | | | 3,100 | | | | | | 3,219 | | | | 3,187 | |
| | |
OTC-cleared | | | 189 | | | | 236 | | | | | | 189 | | | | 197 | |
| | |
Bilateral OTC | | | 7,670 | | | | 8,984 | | | | | | 8,945 | | | | 10,487 | |
Total commodities | | | 10,877 | | | | 12,320 | | | | | | 12,353 | | | | 13,871 | |
Exchange-traded | | | 8,953 | | | | 8,634 | | | | | | 8,576 | | | | 8,064 | |
| | |
Bilateral OTC | | | 37,790 | | | | 43,259 | | | | | | 39,516 | | | | 45,826 | |
Total equities | | | 46,743 | | | | 51,893 | | | | | | 48,092 | | | | 53,890 | |
Subtotal | | | 601,788 | | | | 562,672 | | �� | | | | 697,627 | | | | 657,453 | |
Accounted for as hedges | |
OTC-cleared | | | 4,216 | | | | 185 | | | | | | 4,347 | | | | 156 | |
| | |
Bilateral OTC | | | 3,858 | | | | 10 | | | | | | 4,180 | | | | 10 | |
Total interest rates | | | 8,074 | | | | 195 | | | | | | 8,527 | | | | 166 | |
OTC-cleared | | | 22 | | | | 31 | | | | | | 30 | | | | 40 | |
| | |
Bilateral OTC | | | 22 | | | | 83 | | | | | | 55 | | | | 64 | |
Total currencies | | | 44 | | | | 114 | | | | | | 85 | | | | 104 | |
Subtotal | | | 8,118 | | | | 309 | | | | | | 8,612 | | | | 270 | |
Total gross fair value | | | $ 609,906 | | | | $ 562,981 | | | | | | $ 706,239 | | | | $ 657,723 | |
Offset in condensed consolidated statements of financial condition | |
Exchange-traded | | | $ (10,406 | ) | | | $ (10,406 | ) | | | | | $ (9,727 | ) | | | $ (9,727 | ) |
| | |
OTC-cleared | | | (128,189 | ) | | | (128,189 | ) | | | | | (171,864 | ) | | | (171,864 | ) |
| | |
Bilateral OTC | | | (349,176 | ) | | | (349,176 | ) | | | | | (385,647 | ) | | | (385,647 | ) |
Total counterparty netting | | | (487,771 | ) | | | (487,771 | ) | | | | | (567,238 | ) | | | (567,238 | ) |
OTC-cleared | | | (26,963 | ) | | | (233 | ) | | | | | (27,560 | ) | | | (2,940 | ) |
| | |
Bilateral OTC | | | (49,978 | ) | | | (35,970 | ) | | | | | (57,769 | ) | | | (40,046 | ) |
Total cash collateral netting | | | (76,941 | ) | | | (36,203 | ) | | | | | (85,329 | ) | | | (42,986 | ) |
Total amounts offset | | | $(564,712 | ) | | | $(523,974 | ) | | | | | $(652,567 | ) | | | $(610,224 | ) |
Included in condensed consolidated statements of financial condition | |
Exchange-traded | | | $ 2,036 | | | | $ 1,839 | | | | | | $ 2,547 | | | | $ 2,082 | |
| | |
OTC-cleared | | | 506 | | | | 215 | | | | | | 246 | | | | 144 | |
| | |
Bilateral OTC | | | 42,652 | | | | 36,953 | | | | | | 50,879 | | | | 45,273 | |
Total | | | $ 45,194 | | | | $ 39,007 | | | | | | $ 53,672 | | | | $ 47,499 | |
Not offset in condensed consolidated statements of financial condition | |
Cash collateral | | | $ (338 | ) | | | $ (1,306 | ) | | | | | $ (535 | ) | | | $ (2,085 | ) |
| | |
Securities collateral | | | (13,403 | ) | | | (9,032 | ) | | | | | (15,518 | ) | | | (10,224 | ) |
Total | | | $ 31,453 | | | | $ 28,669 | | | | | | $ 37,619 | | | | $ 35,190 | |
| | | | | | | | |
| | | Notional Amounts as of | |
| $ in millions | |
| March
2017 |
| |
| December
2016 |
|
Not accounted for as hedges | | | | | | | | |
Exchange-traded | | | $ 7,103,874 | | | | $ 4,425,532 | |
| | |
OTC-cleared | | | 16,790,485 | | | | 16,646,145 | |
| | |
Bilateral OTC | | | 11,633,305 | | | | 11,131,442 | |
Total interest rates | | | 35,527,664 | | | | 32,203,119 | |
OTC-cleared | | | 382,658 | | | | 378,432 | |
| | |
Bilateral OTC | | | 1,009,141 | | | | 1,045,913 | |
Total credit | | | 1,391,799 | | | | 1,424,345 | |
Exchange-traded | | | 16,912 | | | | 13,800 | |
| | |
OTC-cleared | | | 77,380 | | | | 62,799 | |
| | |
Bilateral OTC | | | 6,552,532 | | | | 5,576,748 | |
Total currencies | | | 6,646,824 | | | | 5,653,347 | |
Exchange-traded | | | 291,840 | | | | 227,707 | |
| | |
OTC-cleared | | | 3,961 | | | | 3,506 | |
| | |
Bilateral OTC | | | 206,679 | | | | 196,899 | |
Total commodities | | | 502,480 | | | | 428,112 | |
Exchange-traded | | | 701,664 | | | | 605,335 | |
| | |
Bilateral OTC | | | 1,024,526 | | | | 959,112 | |
Total equities | | | 1,726,190 | | | | 1,564,447 | |
Subtotal | | | 45,794,957 | | | | 41,273,370 | |
Accounted for as hedges | | | | | | | | |
OTC-cleared | | | 55,009 | | | | 55,328 | |
| | |
Bilateral OTC | | | 32,754 | | | | 36,607 | |
Total interest rates | | | 87,763 | | | | 91,935 | |
OTC-cleared | | | 2,266 | | | | 1,703 | |
| | |
Bilateral OTC | | | 9,674 | | | | 8,544 | |
Total currencies | | | 11,940 | | | | 10,247 | |
Subtotal | | | 99,703 | | | | 102,182 | |
Total notional amounts | | | $45,894,660 | | | | $41,375,552 | |
In the table below:tables above:
Gross fair values exclude the effects of both counterparty netting and collateral, and therefore are not representative of the firm’s exposure.
Where the firm has received or posted collateral under credit support agreements, but has not yet determined such agreements are enforceable, the related collateral has not been netted.
Notional amounts, which represent the sum of gross long and short derivative contracts, provide an indication of the volume of the firm’s derivative activity and do not represent anticipated losses.
Total gross fair value of derivatives includes derivative assets and derivative liabilities of $11.91 billion and $15.46 billion, respectively, as of March 2017, and derivative assets and derivative liabilities of $19.92 billion and $20.79 billion, respectively, as of December 2016, which are not subject to an enforceable netting agreement or are subject to a netting agreement that the firm has not yet determined to be enforceable.
| | | | | | | | | | | | | | | | | | | | | | | | | | |
| | | As of March 2016 | | | | | As of December 2015 | |
| $ in millions | |
| Derivative
Assets |
| |
| Derivative
Liabilities |
| |
| Notional
Amount |
| | | |
| Derivative
Assets |
| |
| Derivative
Liabilities |
| |
| Notional
Amount |
|
Derivatives not accounted for as hedges | | | | | | | | | | | | | | | | | | | | | | | | | | |
Exchange-traded | | | $ 393 | | | | $ 464 | | | | $ 5,746,768 | | | | | | $ 310 | | | | $ 280 | | | | $ 4,402,843 | |
| | |
OTC-cleared | | | 322,805 | | | | 306,746 | | | | 23,524,475 | | | | | | 211,272 | | | | 192,401 | | | | 20,738,687 | |
| | |
Bilateral OTC | | | 435,907 | | | | 409,229 | | | | 13,039,635 | | | | | | 345,516 | | | | 321,458 | | | | 12,953,830 | |
Total interest rates | | | 759,105 | | | | 716,439 | | | | 42,310,878 | | | | | | 557,098 | | | | 514,139 | | | | 38,095,360 | |
OTC-cleared | | | 5,695 | | | | 6,006 | | | | 443,266 | | | | | | 5,203 | | | | 5,596 | | | | 339,244 | |
| | |
Bilateral OTC | | | 33,142 | | | | 28,635 | | | | 1,536,544 | | | | | | 35,679 | | | | 31,179 | | | | 1,552,806 | |
Total credit | | | 38,837 | | | | 34,641 | | | | 1,979,810 | | | | | | 40,882 | | | | 36,775 | | | | 1,892,050 | |
Exchange-traded | | | 51 | | | | 108 | | | | 21,293 | | | | | | 183 | | | | 204 | | | | 13,073 | |
| | |
OTC-cleared | | | 267 | | | | 242 | | | | 19,281 | | | | | | 165 | | | | 128 | | | | 14,617 | |
| | |
Bilateral OTC | | | 108,252 | | | | 113,147 | | | | 6,050,000 | | | | | | 96,660 | | | | 99,235 | | | | 5,461,940 | |
Total currencies | | | 108,570 | | | | 113,497 | | | | 6,090,574 | | | | | | 97,008 | | | | 99,567 | | | | 5,489,630 | |
Exchange-traded | | | 5,128 | | | | 5,379 | | | | 268,221 | | | | | | 2,997 | | | | 3,623 | | | | 203,465 | |
| | |
OTC-cleared | | | 167 | | | | 236 | | | | 2,742 | | | | | | 232 | | | | 233 | | | | 2,839 | |
| | |
Bilateral OTC | | | 14,575 | | | | 15,344 | | | | 235,205 | | | | | | 17,445 | | | | 17,215 | | | | 230,750 | |
Total commodities | | | 19,870 | | | | 20,959 | | | | 506,168 | | | | | | 20,674 | | | | 21,071 | | | | 437,054 | |
Exchange-traded | | | 9,545 | | | | 8,343 | | | | 538,880 | | | | | | 9,372 | | | | 7,908 | | | | 528,419 | |
| | |
Bilateral OTC | | | 39,939 | | | | 41,986 | | | | 952,522 | | | | | | 37,788 | | | | 38,290 | | | | 927,078 | |
Total equities | | | 49,484 | | | | 50,329 | | | | 1,491,402 | | | | | | 47,160 | | | | 46,198 | | | | 1,455,497 | |
Subtotal | | | 975,866 | | | | 935,865 | | | | 52,378,832 | | | | | | 762,822 | | | | 717,750 | | | | 47,369,591 | |
Derivatives accounted for as hedges | | | | | | | | | | | | | | | | | | | | | | | | | | |
OTC-cleared | | | 6,606 | | | | 84 | | | | 58,840 | | | | | | 4,567 | | | | 85 | | | | 51,446 | |
| | |
Bilateral OTC | | | 6,373 | | | | 22 | | | | 54,940 | | | | | | 6,660 | | | | 20 | | | | 62,022 | |
Total interest rates | | | 12,979 | | | | 106 | | | | 113,780 | | | | | | 11,227 | | | | 105 | | | | 113,468 | |
OTC-cleared | | | 6 | | | | 29 | | | | 1,364 | | | | | | 24 | | | | 6 | | | | 1,333 | |
| | |
Bilateral OTC | | | 25 | | | | 211 | | | | 9,189 | | | | | | 116 | | | | 27 | | | | 8,615 | |
Total currencies | | | 31 | | | | 240 | | | | 10,553 | | | | | | 140 | | | | 33 | | | | 9,948 | |
Subtotal | | | 13,010 | | | | 346 | | | | 124,333 | | | | | | 11,367 | | | | 138 | | | | 123,416 | |
Total gross fair value/notional amount of derivatives | | | $ 988,876 | 1 | | | $ 936,211 | 1 | | | $52,503,165 | | | | | | $ 774,189 | 1 | | | $ 717,888 | 1 | | | $47,493,007 | |
Amounts that have been offset in the condensed consolidated statements of financial condition | | | | | | | | | | | | | | | | | | | | | | | | | | |
Exchange-traded | | | $ (11,374 | ) | | | $ (11,374 | ) | | | | | | | | | $ (9,398 | ) | | | $ (9,398 | ) | | | | |
| | |
OTC-cleared | | | (310,428 | ) | | | (310,428 | ) | | | | | | | | | (194,928 | ) | | | (194,928 | ) | | | | |
| | |
Bilateral OTC | | | (512,487 | ) | | | (512,487 | ) | | | | | | | | | (426,841 | ) | | | (426,841 | ) | | | | |
Total counterparty netting | | | (834,289 | ) | | | (834,289 | ) | | | | | | | | | (631,167 | ) | | | (631,167 | ) | | | | |
OTC-cleared | | | (24,829 | ) | | | (2,599 | ) | | | | | | | | | (26,151 | ) | | | (3,305 | ) | | | | |
| | |
Bilateral OTC | | | (69,087 | ) | | | (45,140 | ) | | | | | | | | | (62,981 | ) | | | (36,645 | ) | | | | |
Total cash collateral netting | | | (93,916 | ) | | | (47,739 | ) | | | | | | | | | (89,132 | ) | | | (39,950 | ) | | | | |
Total counterparty and cash collateral netting | | | $(928,205 | ) | | | $(882,028 | ) | | | | | | | | | $(720,299 | ) | | | $(671,117 | ) | | | | |
Amounts included in financial instruments owned/financial instruments sold, but not yet purchased | | | | | | | | | | | | | | | | | | | | | | | | | | |
Exchange-traded | | | $ 3,743 | | | | $ 2,920 | | | | | | | | | | $ 3,464 | | | | $ 2,617 | | | | | |
| | |
OTC-cleared | | | 289 | | | | 316 | | | | | | | | | | 384 | | | | 216 | | | | | |
| | |
Bilateral OTC | | | 56,639 | | | | 50,947 | | | | | | | | | | 50,042 | | | | 43,938 | | | | | |
Total amounts included in the condensed consolidated statements of financial condition | | | $ 60,671 | | | | $ 54,183 | | | | | | | | | | $ 53,890 | | | | $ 46,771 | | | | | |
Amounts that have not been offset in the condensed consolidated statements of financial condition | | | | | | | | | | | | | | | | | | | | | | | | | | |
Cash collateral received/posted | | | $ (546 | ) | | | $ (2,725 | ) | | | | | | | | | $ (498 | ) | | | $ (1,935 | ) | | | | |
| | |
Securities collateral received/posted | | | (16,108 | ) | | | (14,430 | ) | | | | | | | | | (14,008 | ) | | | (10,044 | ) | | | | |
Total | | | $ 44,017 | | | | $ 37,028 | | | | | | | | | | $ 39,384 | | | | $ 34,792 | | | | | |
1. | Includes derivative assets and derivative liabilities of $22.33 billion and $23.50 billion, respectively, as of March 2016, and derivative assets and derivative liabilities of $17.09 billion and $18.16 billion, respectively, as of December 2015, which are not subject to an enforceable netting agreement or are subject to a netting agreement that the firm has not yet determined to be enforceable.
|
| | | | |
| | | Goldman Sachs March 20162017 Form 10-Q | | 23 |
THE GOLDMAN SACHS GROUP, INC. AND SUBSIDIARIES
Notes to Condensed Consolidated Financial Statements
(Unaudited)
Pursuant to a rule change at a clearing organization in the first quarter of 2017, transactions with this clearing organization are considered settled each day. The impact of reflecting transactions with this clearing organization as settled would have been a reduction in gross interest rate and credit derivative assets and liabilities as of December 2016 of $24.58 billion and $27.36 billion, respectively, and a corresponding decrease in counterparty and cash collateral netting, with no impact to the condensed consolidated statements of financial condition.
Valuation Techniques for Derivatives
The firm’s level 2 and level 3 derivatives are valued using derivative pricing models (e.g., discounted cash flow models, correlation models, and models that incorporate option pricing methodologies, such as Monte Carlo simulations). Price transparency of derivatives can generally be characterized by product type, as described below.
Interest Rate. In general, the key inputs used to value interest rate derivatives are transparent, even for most long-dated contracts. Interest rate swaps and options denominated in the currencies of leading industrialized nations are characterized by high trading volumes and tight bid/offer spreads. Interest rate derivatives that reference indices, such as an inflation index, or the shape of the yield curve (e.g., 10-year swap rate vs. 2-year swap rate) are more complex, but the key inputs are generally observable.
Credit. Price transparency for credit default swaps, including both single names and baskets of credits, varies by market and underlying reference entity or obligation. Credit default swaps that reference indices, large corporates and major sovereigns generally exhibit the most price transparency. For credit default swaps with other underliers, price transparency varies based on credit rating, the cost of borrowing the underlying reference obligations, and the availability of the underlying reference obligations for delivery upon the default of the issuer. Credit default swaps that reference loans, asset-backed securities and emerging market debt instruments tend to have less price transparency than those that reference corporate bonds. In addition, more complex credit derivatives, such as those sensitive to the correlation between two or more underlying reference obligations, generally have less price transparency.
Currency. Prices for currency derivatives based on the exchange rates of leading industrialized nations, including those with longer tenors, are generally transparent. The primary difference between the price transparency of developed and emerging market currency derivatives is that emerging markets tend to be observable for contracts with shorter tenors.
Commodity.Commodity derivatives include transactions referenced to energy (e.g., oil and natural gas), metals (e.g., precious and base) and soft commodities (e.g., agricultural). Price transparency varies based on the underlying commodity, delivery location, tenor and product quality (e.g., diesel fuel compared to unleaded gasoline). In general, price transparency for commodity derivatives is greater for contracts with shorter tenors and contracts that are more closely aligned with major and/or benchmark commodity indices.
Equity.Price transparency for equity derivatives varies by market and underlier. Options on indices and the common stock of corporates included in major equity indices exhibit the most price transparency. Equity derivatives generally have observable market prices, except for contracts with long tenors or reference prices that differ significantly from current market prices. More complex equity derivatives, such as those sensitive to the correlation between two or more individual stocks, generally have less price transparency.
Liquidity is essential to observability of all product types. If transaction volumes decline, previously transparent prices and other inputs may become unobservable. Conversely, even highly structured products may at times have trading volumes large enough to provide observability of prices and other inputs. See Note 5 for an overview of the firm’s fair value measurement policies.
Level 1 Derivatives
Level 1 derivatives include short-term contracts for future delivery of securities when the underlying security is a level 1 instrument, and exchange-traded derivatives if they are actively traded and are valued at their quoted market price.
Level 2 Derivatives
Level 2 derivatives include OTC derivatives for which all significant valuation inputs are corroborated by market evidence and exchange-traded derivatives that are not actively traded and/or that are valued using models that calibrate to market-clearing levels of OTC derivatives. In evaluating the significance of a valuation input, the firm considers, among other factors, a portfolio’s net risk exposure to that input.
| | | | |
| 24 | | Goldman Sachs March 20162017 Form 10-Q | | |
THE GOLDMAN SACHS GROUP, INC. AND SUBSIDIARIES
Notes to Condensed Consolidated Financial Statements
(Unaudited)
The selection of a particular model to value a derivative depends on the contractual terms of and specific risks inherent in the instrument, as well as the availability of pricing information in the market. For derivatives that trade in liquid markets, model selection does not involve significant management judgment because outputs of models can be calibrated to market-clearing levels.
Valuation models require a variety of inputs, such as contractual terms, market prices, yield curves, discount rates (including those derived from interest rates on collateral received and posted as specified in credit support agreements for collateralized derivatives), credit curves, measures of volatility, prepayment rates, loss severity rates and correlations of such inputs. Significant inputs to the valuations of level 2 derivatives can be verified to market transactions, broker or dealer quotations or other alternative pricing sources with reasonable levels of price transparency. Consideration is given to the nature of the quotations (e.g., indicative or firm) and the relationship of recent market activity to the prices provided from alternative pricing sources.
Level 3 Derivatives
Level 3 derivatives are valued using models which utilize observable level 1 and/or level 2 inputs, as well as unobservable level 3 inputs. The significant unobservable inputs used to value the firm’s level 3 derivatives are described below.
For the majority of the firm’s interest rate and currency derivatives classified withinin level 3, significant unobservable inputs include correlations of certain currencies and interest rates (e.g., the correlation between Euro inflation and Euro interest rates) and specific interest rate volatilities.
For level 3 credit derivatives, significant unobservable inputs include illiquid credit spreads and upfront credit points, which are unique to specific reference obligations and reference entities, recovery rates and certain correlations required to value credit and mortgage derivatives (e.g., the likelihood of default of the underlying reference obligation relative to one another).
For level 3 commodity derivatives, significant unobservable inputs include volatilities for options with strike prices that differ significantly from current market prices and prices or spreads for certain products for which the product quality or physical location of the commodity is not aligned with benchmark indices.
For level 3 equity derivatives, significant unobservable inputs generally include equity volatility inputs for options that are long-dated and/or have strike prices that differ significantly from current market prices. In addition, the valuation of certain structured trades requires the use of level 3 correlation inputs, such as the correlation of the price performance of two or more individual stocks or the correlation of the price performance for a basket of stocks to another asset class such as commodities.
Subsequent to the initial valuation of a level 3 derivative, the firm updates the level 1 and level 2 inputs to reflect observable market changes and any resulting gains and losses are recordedclassified in level 3. Level 3 inputs are changed when corroborated by evidence such as similar market transactions, third-party pricing services and/or broker or dealer quotations or other empirical market data. In circumstances where the firm cannot verify the model value by reference to market transactions, it is possible that a different valuation model could produce a materially different estimate of fair value. See below for further information about significant unobservable inputs used in the valuation of level 3 derivatives.
Valuation Adjustments
Valuation adjustments are integral to determining the fair value of derivative portfolios and are used to adjust the mid-market valuations produced by derivative pricing models to the appropriate exit price valuation. These adjustments incorporate bid/offer spreads, the cost of liquidity, credit valuation adjustments and funding valuation adjustments, which account for the credit and funding risk inherent in the uncollateralized portion of derivative portfolios. The firm also makes funding valuation adjustments to collateralized derivatives where the terms of the agreement do not permit the firm to deliver or repledge collateral received. Market-based inputs are generally used when calibrating valuation adjustments to market-clearing levels.
In addition, for derivatives that include significant unobservable inputs, the firm makes model or exit price adjustments to account for the valuation uncertainty present in the transaction.
| | | | |
| | | Goldman Sachs March 20162017 Form 10-Q | | 25 |
THE GOLDMAN SACHS GROUP, INC. AND SUBSIDIARIES
Notes to Condensed Consolidated Financial Statements
(Unaudited)
Fair Value of Derivatives by Level
The tables below present the fair value of derivatives on a gross basis by level and major product type as well as the impact of netting.netting, included in the condensed consolidated statements of financial condition.
| | | | As of March 2016 | | | As of March 2017 | |
| $ in millions | | | Level 1 | | | | Level 2 | | | | Level 3 | | | | Total | | | | Level 1 | | | | Level 2 | | | | Level 3 | | | | Total | |
Assets | | | | | | | | | | | | | | | | |
Interest rates | | | $ 17 | | | | $ 771,432 | | | | $ 635 | | | | $ 772,084 | | | | $ 65 | | | | $ 446,015 | | | | $ 591 | | | | $ 446,671 | |
| | | | | |
Credit | | | — | | | | 32,905 | | | | 5,932 | | | | 38,837 | | | | — | | | | 20,152 | | | | 4,599 | | | | 24,751 | |
| | | | | |
Currencies | | | — | | | | 108,415 | | | | 186 | | | | 108,601 | | | | — | | | | 80,673 | | | | 191 | | | | 80,864 | |
| | | | | |
Commodities | | | — | | | | 19,304 | | | | 566 | | | | 19,870 | | | | — | | | | 10,531 | | | | 346 | | | | 10,877 | |
| | | | | |
Equities | | | 210 | | | | 48,679 | | | | 595 | | | | 49,484 | | | | — | | | | 46,321 | | | | 422 | | | | 46,743 | |
Gross fair value of derivative assets | | | 227 | | | | 980,735 | | | | 7,914 | | | | 988,876 | | |
Gross fair value | | | | 65 | | | | 603,692 | | | | 6,149 | | | | 609,906 | |
| | | | | |
Counterparty netting within levels | | | — | | | | (830,841 | ) | | | (1,964 | ) | | | (832,805 | ) | |
Counterparty netting in levels | | | | (6 | ) | | | (484,967 | ) | | | (1,199 | ) | | | (486,172 | ) |
Subtotal | | | $227 | | | | $ 149,894 | | | | $ 5,950 | | | | $ 156,071 | | | | $ 59 | | | | $ 118,725 | | | | $ 4,950 | | | | $ 123,734 | |
| | | | | |
Cross-level counterparty netting | | | | | | | | | (1,484 | ) | Cross-level counterparty netting | | | | (1,599 | ) |
| | | | | |
Cash collateral netting | | | (93,916 | ) | | | (76,941 | ) |
Fair value included in financial instruments owned | | | $ 60,671 | | |
Net fair value | | Net fair value | | | | $ 45,194 | |
Liabilities | | | | | | | | | | | | | | | | |
Interest rates | | | $ (17 | ) | | | $(715,510 | ) | | | $(1,018 | ) | | | $(716,545 | ) | | | $ (52 | ) | | | $(394,229 | ) | | | $ (873 | ) | | | $(395,154 | ) |
| | | | | |
Credit | | | — | | | | (31,530 | ) | | | (3,111 | ) | | | (34,641 | ) | | | — | | | | (19,370 | ) | | | (2,360 | ) | | | (21,730 | ) |
| | | | | |
Currencies | | | — | | | | (113,560 | ) | | | (177 | ) | | | (113,737 | ) | | | — | | | | (81,717 | ) | | | (167 | ) | | | (81,884 | ) |
| | | | | |
Commodities | | | — | | | | (20,102 | ) | | | (857 | ) | | | (20,959 | ) | | | — | | | | (12,052 | ) | | | (268 | ) | | | (12,320 | ) |
| | | | | |
Equities | | | (8 | ) | | | (47,625 | ) | | | (2,696 | ) | | | (50,329 | ) | | | (419 | ) | | | (49,090 | ) | | | (2,384 | ) | | | (51,893 | ) |
Gross fair value of derivative liabilities | | | (25 | ) | | | (928,327 | ) | | | (7,859 | ) | | | (936,211 | ) | |
Gross fair value | | | | (471 | ) | | | (556,458 | ) | | | (6,052 | ) | | | (562,981 | ) |
| | | | | |
Counterparty netting within levels | | | — | | | | 830,841 | | | | 1,964 | | | | 832,805 | | |
Counterparty netting in levels | | | | 6 | | | | 484,967 | | | | 1,199 | | | | 486,172 | |
Subtotal | | | $ (25 | ) | | | $ (97,486 | ) | | | $(5,895 | ) | | | $(103,406 | ) | | | $(465 | ) | | | $ (71,491 | ) | | | $(4,853 | ) | | | $ (76,809 | ) |
| | | | | |
Cross-level counterparty netting | | | | | | | | | 1,484 | | Cross-level counterparty netting | | | | 1,599 | |
| | | | | |
Cash collateral netting | | | 47,739 | | | | 36,203 | |
Fair value included in financial instruments sold, but not yet purchased | | | $ (54,183 | ) | |
Net fair value | | Net fair value | | | | $ (39,007 | ) |
| | | | | | | | | | | | | | | | |
| | | As of December 2016 | |
| $ in millions | | | Level 1 | | | | Level 2 | | | | Level 3 | | | | Total | |
Assets | | | | | | | | | | | | | | | | |
Interest rates | | | $ 46 | | | | $ 506,818 | | | | $ 614 | | | | $ 507,478 | |
| | |
Credit | | | — | | | | 21,388 | | | | 4,979 | | | | 26,367 | |
| | |
Currencies | | | — | | | | 111,762 | | | | 187 | | | | 111,949 | |
| | |
Commodities | | | — | | | | 11,950 | | | | 403 | | | | 12,353 | |
| | |
Equities | | | 1 | | | | 47,667 | | | | 424 | | | | 48,092 | |
Gross fair value | | | 47 | | | | 699,585 | | | | 6,607 | | | | 706,239 | |
| | |
Counterparty netting in levels | | | (12 | ) | | | (564,100 | ) | | | (1,417 | ) | | | (565,529 | ) |
Subtotal | | | $ 35 | | | | $ 135,485 | | | | $ 5,190 | | | | $ 140,710 | |
| | |
Cross-level counterparty netting | | | | (1,709 | ) |
| | |
Cash collateral netting | | | | | | | | | | | | | | | (85,329 | ) |
Net fair value | | | | $ 53,672 | |
Liabilities | | | | | | | | | | | | | | | | |
Interest rates | | | $ (27 | ) | | | $(457,963 | ) | | | $ (995 | ) | | | $(458,985 | ) |
| | |
Credit | | | — | | | | (21,106 | ) | | | (2,475 | ) | | | (23,581 | ) |
| | |
Currencies | | | — | | | | (107,212 | ) | | | (184 | ) | | | (107,396 | ) |
| | |
Commodities | | | — | | | | (13,541 | ) | | | (330 | ) | | | (13,871 | ) |
| | |
Equities | | | (967 | ) | | | (49,083 | ) | | | (3,840 | ) | | | (53,890 | ) |
Gross fair value | | | (994 | ) | | | (648,905 | ) | | | (7,824 | ) | | | (657,723 | ) |
| | |
Counterparty netting in levels | | | 12 | | | | 564,100 | | | | 1,417 | | | | 565,529 | |
Subtotal | | | $(982 | ) | | | $ (84,805 | ) | | | $(6,407 | ) | | | $ (92,194 | ) |
| | |
Cross-level counterparty netting | | | | 1,709 | |
| | |
Cash collateral netting | | | | | | | | | | | | | | | 42,986 | |
Net fair value | | | | $ (47,499 | ) |
| | | | | | | | | | | | | | | | |
| | | As of December 2015 | |
| $ in millions | | | Level 1 | | | | Level 2 | | | | Level 3 | | | | Total | |
Assets | | | | | | | | | | | | | | | | |
Interest rates | | | $ 4 | | | | $ 567,761 | | | | $ 560 | | | | $ 568,325 | |
| | |
Credit | | | — | | | | 34,832 | | | | 6,050 | | | | 40,882 | |
| | |
Currencies | | | — | | | | 96,959 | | | | 189 | | | | 97,148 | |
| | |
Commodities | | | — | | | | 20,087 | | | | 587 | | | | 20,674 | |
| | |
Equities | | | 46 | | | | 46,491 | | | | 623 | | | | 47,160 | |
Gross fair value of derivative assets | | | 50 | | | | 766,130 | | | | 8,009 | | | | 774,189 | |
| | |
Counterparty netting within levels | | | — | | | | (627,548 | ) | | | (2,139 | ) | | | (629,687 | ) |
Subtotal | | | $ 50 | | | | $ 138,582 | | | | $ 5,870 | | | | $ 144,502 | |
| | |
Cross-level counterparty netting | | | | | | | | | | | | | | | (1,480 | ) |
| | |
Cash collateral netting | | | | | | | | | | | | | | | (89,132 | ) |
Fair value included in financial instruments owned | | | | | | | | | | | | | | | $ 53,890 | |
Liabilities | | | | | | | | | | | | | | | | |
Interest rates | | | $(11 | ) | | | $(513,275 | ) | | | $ (958 | ) | | | $(514,244 | ) |
| | |
Credit | | | — | | | | (33,518 | ) | | | (3,257 | ) | | | (36,775 | ) |
| | |
Currencies | | | — | | | | (99,377 | ) | | | (223 | ) | | | (99,600 | ) |
| | |
Commodities | | | — | | | | (20,222 | ) | | | (849 | ) | | | (21,071 | ) |
| | |
Equities | | | (18 | ) | | | (43,953 | ) | | | (2,227 | ) | | | (46,198 | ) |
Gross fair value of derivative liabilities | | | (29 | ) | | | (710,345 | ) | | | (7,514 | ) | | | (717,888 | ) |
| | |
Counterparty netting within levels | | | — | | | | 627,548 | | | | 2,139 | | | | 629,687 | |
Subtotal | | | $(29 | ) | | | $ (82,797 | ) | | | $(5,375 | ) | | | $ (88,201 | ) |
| | |
Cross-level counterparty netting | | | | | | | | | | | | | | | 1,480 | |
| | |
Cash collateral netting | | | | | | | | | | | | | | | 39,950 | |
Fair value included in
financial instruments sold, but not yet purchased | | | | | | | | | | | | | | | $ (46,771 | ) |
In the tables above:
The gross fair values exclude the effects of both counterparty netting and collateral netting, and therefore are not representative of the firm’s exposure.
Counterparty netting is reflected in each level to the extent that receivable and payable balances are netted within the same level and is included in “Counterpartycounterparty netting withinin levels.” Where the counterparty netting is across levels, the netting is reflected in “Cross-levelcross-level counterparty netting.”
Derivative assets are shown as positive amounts and derivative liabilities are shown as negative amounts.
| | | | |
26 | | Goldman Sachs March 2016 Form 10-Q | | |
THE GOLDMAN SACHS GROUP, INC. AND SUBSIDIARIES
Notes to Condensed Consolidated Financial Statements
(Unaudited)
Significant Unobservable Inputs
The table below presents the amount of level 3 assets (liabilities), and ranges, averages and medians of significant unobservable inputs used to value the firm’s level 3 derivatives.
| | | | | | | | |
| | | Level 3 Assets (Liabilities) and Range of Significant Unobservable Inputs (Average / Median) as of | |
| $ in millions | | | March 2016 | | | | December 2015 | |
Interest Rates | | | $(383) | | | | $(398) | |
| | |
Correlation | | | (10)% to 86% (56% / 60%) | | | | (25)% to 92% (53% / 55%) | |
| | |
Volatility (bps per annum) | | | 31 to 151 (84 / 57) | | | | 31 to 152 (84 / 57) | |
Credit | | | $2,821 | | | | $2,793 | |
| | |
Correlation | | | 35% to 90% (63% / 62%) | | | | 46% to 99% (68% / 66%) | |
| | |
Credit Spreads (bps) | | | 1 to 909 (147 / 87) | 1 | | | 1 to 1,019 (129 / 86) | 1 |
| | |
Upfront Credit Points | | | 0 to 99 (41 / 37) | | | | 0 to 100 (41 / 40) | |
| | |
Recovery Rates | | | 20% to 75% (58% / 70%) | | | | 2% to 97% (58% / 70%) | |
Currencies | | | $9 | | | | $(34) | |
| | |
Correlation | | | 25% to 70% (51% / 55%) | | | | 25% to 70% (50% / 51%) | |
Commodities | | | $(291) | | | | $(262) | |
| | |
Volatility | | | 15% to 65% (37% / 37%) | | | | 11% to 77% (35% / 34%) | |
| | |
Spread per million British thermal units of natural
gas | | | $(1.38) to $3.97 ($(0.07) / $(0.03)) | | | | $(1.32) to $4.15 ($(0.05) / $(0.01)) | |
| | |
Spread per barrel of oil and refined products | | | $(12.60) to $63.72 ($7.54 / $8.96) | | | | $(10.64) to $65.29 ($3.34 /$(3.31)) | 1 |
Equities | | | $(2,101) | | | | $(1,604) | |
| | |
Correlation | | | (30)% to 91% (40% / 46%) | | | | (65)% to 94% (42% / 48%) | |
| | |
Volatility | | | 5% to 105% (28% / 25%) | | | | 5% to 76% (24% / 23%) | |
1. | The difference between the average and the median for these spread inputs indicates that the majority of the inputs fall in the lower end of the range.
|
| | | | | | | | |
| | | Level 3 Assets (Liabilities) and Range of Significant Unobservable Inputs (Average/Median) as of | |
| $ in millions | |
| March
2017 |
| |
| December
2016 |
|
Interest rates, net | | | $(282) | | | | $(381) | |
| | |
Correlation | | | (10)% to 86% (56%/60%) | | | | (10)% to 86% (56%/60%) | |
| | |
Volatility (bps) | | | 31 to 151 (84/57) | | | | 31 to 151 (84/57) | |
Credit, net | | | $2,239 | | | | $2,504 | |
| | |
Correlation | | | 36% to 90% (67%/70%) | | | | 35% to 91% (65%/68%) | |
| | |
Credit spreads (bps) | | | 1 to 962 (88/49) | | | | 1 to 993 (122/73) | |
| | |
Upfront credit points | | | 0 to 99 (41/35) | | | | 0 to 100 (43/35) | |
| | |
Recovery rates | | | 20% to 97% (59%/65%) | | | | 1% to 97% (58%/70%) | |
Currencies, net | | | $24 | | | | $3 | |
| | |
Correlation | | | 25% to 70% (50%/55%) | | | | 25% to 70% (50%/55%) | |
Commodities, net | | | $78 | | | | $73 | |
| | |
Volatility | | | 10% to 59% (29%/28%) | | | | 13% to 68% (33%/33%) | |
| | |
Natural gas spread | |
| $(1.68) to $3.47
($(0.22)/$(0.13)) |
| |
| $(1.81) to $4.33
($(0.14)/$(0.05)) |
|
| | |
Oil spread | |
| $(9.31) to $63.63
($7.62/$(0.41)) |
| |
| $(19.72) to $64.92
($25.30/$16.43) |
|
Equities, net | | | $(1,962) | | | | $(3,416) | |
| | |
Correlation | | | (30)% to 89% (42%/41%) | | | | (39)% to 88% (41%/41%) | |
| | |
Volatility | | | 5% to 80% (23%/22%) | | | | 5% to 72% (24%/23%) | |
In the table above:
Derivative assets are shown as positive amounts and derivative liabilities are shown as negative amounts.
Ranges represent the significant unobservable inputs that were used in the valuation of each type of derivative.
Averages represent the arithmetic average of the inputs and are not weighted by the relative fair value or notional of the respective financial instruments. An average greater than the median indicates that the majority of inputs are below the average. For example, the difference between the average and the median for credit spreads and oil spread inputs indicates that the majority of the inputs fall in the lower end of the range.
| | | | |
| 26 | | Goldman Sachs March 2017 Form 10-Q | | |
THE GOLDMAN SACHS GROUP, INC. AND SUBSIDIARIES
Notes to Condensed Consolidated Financial Statements
(Unaudited)
The ranges, averages and medians of these inputs are not representative of the appropriate inputs to use when calculating the fair value of any one derivative. For example, the highest correlation for interest rate derivatives is appropriate for valuing a specific interest rate derivative but may not be appropriate for valuing any other interest rate derivative. Accordingly, the ranges of inputs do not represent uncertainty in, or possible ranges of, fair value measurements of the firm’s level 3 derivatives.
Interest rates, currencies and equities derivatives are valued using option pricing models, credit derivatives are valued using option pricing, correlation and discounted cash flow models, and commodities derivatives are valued using option pricing and discounted cash flow models.
The fair value of any one instrument may be determined using multiple valuation techniques. For example, option pricing models and discounted cash flows models are typically used together to determine fair value. Therefore, the level 3 balance encompasses both of these techniques.
Correlation within currencies and equities includes cross-product correlation.
Derivative assets are shown as positive amounts and derivative liabilities are shown as negative amounts.Natural gas spread represents the spread per million British thermal units of natural gas.
| | | | |
| | Goldman Sachs March 2016 Form 10-Q | | 27 |
THE GOLDMAN SACHS GROUP, INC. AND SUBSIDIARIESOil spread represents the spread per barrel of oil and refined products.
Notes to Condensed Consolidated Financial Statements
(Unaudited)
Range of Significant Unobservable Inputs
The following is information about the ranges of significant unobservable inputs used to value the firm’s level 3 derivative instruments:
Correlation. Ranges for correlation cover a variety of underliers both within one market (e.g., equity index and equity single stock names) and across markets (e.g., correlation of an interest rate and a foreign exchange rate), as well as across regions. Generally, cross-product correlation inputs are used to value more complex instruments and are lower than correlation inputs on assets within the same derivative product type.
Volatility. Ranges for volatility cover numerous underliers across a variety of markets, maturities and strike prices. For example, volatility of equity indices is generally lower than volatility of single stocks.
Credit spreads, upfront credit points and recovery rates. The ranges for credit spreads, upfront credit points and recovery rates cover a variety of underliers (index and single names), regions, sectors, maturities and credit qualities (high-yield and investment-grade). The broad range of this population gives rise to the width of the ranges of significant unobservable inputs.
Commodity prices and spreads. The ranges for commodity prices and spreads cover variability in products, maturities and delivery locations.
Sensitivity of Fair Value Measurement to Changes in Significant Unobservable Inputs
The following is a description of the directional sensitivity of the firm’s level 3 fair value measurements to changes in significant unobservable inputs, in isolation:
Correlation. In general, for contracts where the holder benefits from the convergence of the underlying asset or index prices (e.g., interest rates, credit spreads, foreign exchange rates, inflation rates and equity prices), an increase in correlation results in a higher fair value measurement.
Volatility.In general, for purchased options, an increase in volatility results in a higher fair value measurement.
Credit spreads, upfront credit points and recovery rates.In general, the fair value of purchased credit protection increases as credit spreads or upfront credit points increase or recovery rates decrease. Credit spreads, upfront credit points and recovery rates are strongly related to distinctive risk factors of the underlying reference obligations, which include reference entity-specific factors such as leverage, volatility and industry, market-based risk factors, such as borrowing costs or liquidity of the underlying reference obligation, and macroeconomic conditions.
Commodity prices and spreads. In general, for contracts where the holder is receiving a commodity, an increase in the spread (price difference from a benchmark index due to differences in quality or delivery location) or price results in a higher fair value measurement.
Due to the distinctive nature of each of the firm’s level 3 derivatives, the interrelationship of inputs is not necessarily uniform within each product type.
| | | | |
28 | | Goldman Sachs March 20162017 Form 10-Q | | 27 |
THE GOLDMAN SACHS GROUP, INC. AND SUBSIDIARIES
Notes to Condensed Consolidated Financial Statements
(Unaudited)
Level 3 Rollforward
The table below presents a summary of the changes in fair value for all derivatives categorized aslevel 3 derivatives.
| | | | | | | | |
| | | Three Months Ended March | |
| $ in millions | | | 2017 | | | | 2016 | |
Total level 3 derivatives | | | | | | | | |
Beginning balance | | | $(1,217 | ) | | | $ 495 | |
| | |
Net realized gains/(losses) | | | (15 | ) | | | (79 | ) |
| | |
Net unrealized gains/(losses) | | | 769 | | | | 461 | |
| | |
Purchases | | | 79 | | | | 115 | |
| | |
Sales | | | (458 | ) | | | (1,825 | ) |
| | |
Settlements | | | 871 | | | | 106 | |
| | |
Transfers into level 3 | | | (10 | ) | | | (16 | ) |
| | |
Transfers out of level 3 | | | 78 | | | | 798 | |
Ending balance | | | $ 97 | | | | $ 55 | |
In the table above:
Changes in fair value are presented for all derivative assets and liabilities that are classified in level 3 as of the end of the period. In the table below:
Net unrealized gains/(losses) relate to instruments that were still held at period-end.
If a derivative was transferred tointo level 3 during a reporting period, its entire gain or loss for the period is includedclassified in level 3. Transfers between levels are reported at the beginning of the reporting period in which they occur.
Positive amounts for transfers into level 3 and negative amounts for transfers out of level 3 represent net transfers of derivative assets. Negative amounts for transfers into level 3 and positive amounts for transfers out of level 3 represent net transfers of derivative liabilities.
A derivative with level 1 and/or level 2 inputs is classified in level 3 in its entirety if it has at least one significant level 3 input.
If there is one significant level 3 input, the entire gain or loss from adjusting only observable inputs (i.e., level 1 and level 2 inputs) is classified asin level 3.
Gains or losses that have been reportedclassified in level 3 resulting from changes in level 1 or level 2 inputs are frequently offset by gains or losses attributable to level 1 or level 2 derivatives and/or level 1, level 2 and level 3 cash instruments. As a result, gains/(losses) included in the level 3 rollforward below do not necessarily represent the overall impact on the firm’s results of operations, liquidity or capital resources.
The table below disaggregates, by major product type, the information for level 3 derivatives included in the summary table above.
| | | | | | | | |
| | | Three Months Ended March | |
| $ in millions | | | 2017 | | | | 2016 | |
Interest rates, net | | | | | | | | |
Beginning balance | | | $ (381 | ) | | | $ (398 | ) |
| | |
Net realized gains/(losses) | | | (22 | ) | | | (11 | ) |
| | |
Net unrealized gains/(losses) | | | 103 | | | | 28 | |
| | |
Purchases | | | 4 | | | | 3 | |
| | |
Sales | | | (9 | ) | | | (10 | ) |
| | |
Settlements | | | 46 | | | | 17 | |
| | |
Transfers into level 3 | | | (10 | ) | | | — | |
| | |
Transfers out of level 3 | | | (13 | ) | | | (12 | ) |
Ending balance | | | $ (282 | ) | | | $ (383 | ) |
Credit, net | | | | | | | | |
Beginning balance | | | $ 2,504 | | | | $ 2,793 | |
| | |
Net realized gains/(losses) | | | 43 | | | | (26 | ) |
| | |
Net unrealized gains/(losses) | | | (174 | ) | | | 210 | |
| | |
Purchases | | | 16 | | | | 33 | |
| | |
Sales | | | (20 | ) | | | (57 | ) |
| | |
Settlements | | | (135 | ) | | | (75 | ) |
| | |
Transfers into level 3 | | | 13 | | | | 8 | |
| | |
Transfers out of level 3 | | | (8 | ) | | | (65 | ) |
Ending balance | | | $ 2,239 | | | | $ 2,821 | |
Currencies, net | | | | | | | | |
Beginning balance | | | $ 3 | | | | $ (34 | ) |
| | |
Net realized gains/(losses) | | | (22 | ) | | | (21 | ) |
| | |
Net unrealized gains/(losses) | | | (13 | ) | | | (5 | ) |
| | |
Purchases | | | 2 | | | | 6 | |
| | |
Sales | | | — | | | | (1 | ) |
| | |
Settlements | | | 51 | | | | 61 | |
| | |
Transfers into level 3 | | | (2 | ) | | | — | |
| | |
Transfers out of level 3 | | | 5 | | | | 3 | |
Ending balance | | | $ 24 | | | | $ 9 | |
Commodities, net | | | | | | | | |
Beginning balance | | | $ 73 | | | | $ (262 | ) |
| | |
Net realized gains/(losses) | | | — | | | | (5 | ) |
| | |
Net unrealized gains/(losses) | | | 20 | | | | 41 | |
| | |
Purchases | | | 13 | | | | 47 | |
| | |
Sales | | | (13 | ) | | | (18 | ) |
| | |
Settlements | | | (21 | ) | | | (37 | ) |
| | |
Transfers into level 3 | | | (9 | ) | | | (26 | ) |
| | |
Transfers out of level 3 | | | 15 | | | | (31 | ) |
Ending balance | | | $ 78 | | | | $ (291 | ) |
Equities, net | | | | | | | | |
Beginning balance | | | $(3,416 | ) | | | $(1,604 | ) |
| | |
Net realized gains/(losses) | | | (14 | ) | | | (16 | ) |
| | |
Net unrealized gains/(losses) | | | 833 | | | | 187 | |
| | |
Purchases | | | 44 | | | | 26 | |
| | |
Sales | | | (416 | ) | | | (1,739 | ) |
| | |
Settlements | | | 930 | | | | 140 | |
| | |
Transfers into level 3 | | | (2 | ) | | | 2 | |
| | |
Transfers out of level 3 | | | 79 | | | | 903 | |
Ending balance | | | $(1,962 | ) | | | $(2,101 | ) |
Net unrealized gains/(losses) relate
| | | | |
| 28 | | Goldman Sachs March 2017 Form 10-Q | | |
THE GOLDMAN SACHS GROUP, INC. AND SUBSIDIARIES
Notes to instruments that were still held at period-end.Condensed Consolidated Financial Statements
(Unaudited)
For the three months endedLevel 3 Rollforward Commentary
Three Months Ended March 2016, the2017. The net realized and unrealized gains on level 3 derivatives of $754 million (reflecting $15 million of net realized losses and $769 million of net unrealized gains) include gains/(losses) of $848 million and $(94) million reported in “Market making” and “Other principal transactions” respectively.
The net unrealized gain on level 3 derivatives for the three months ended March 2017 was primarily attributable to gains on certain equity derivatives, reflecting the impact of an increase in equity prices.
Transfers into level 3 derivatives during the three months ended March 2017 were not material.
Transfers out of level 3 derivatives during the three months ended March 2017 primarily reflected transfers of certain equity derivative assetsliabilities to level 2, principally due to certain unobservable volatility inputs not being significant to the valuation of these derivatives.
Three Months Ended March 2016. The net realized and liabilitiesunrealized gains on level 3 derivatives of $382 million (reflecting $79 million of realized losses and $461 million of unrealized gains) include gains/(losses) of $393 million and $(11) million reported in “Market making” and “Other principal transactions” respectively.
For the three months ended March 2015, the net realized and unrealized gains on level 3 derivative assets and liabilities of $749 million (reflecting $113 million of realized gains and $636 million of unrealized gains) include gains/(losses) of $784 million and $(35) million reported in “Market making” and “Other principal transactions” respectively.
See “Level 3 Rollforward Commentary” below for an explanation of the net unrealized gains/(losses) on level 3 derivative assets and liabilities and the activity related to transfers into and out of level 3.
| | | | | | | | | | | | | | | | | | | | | | | | | | | | | | | | | | | | |
| | | Level 3 Derivative Assets and Liabilities at Fair Value | |
| $ in millions | |
| Asset/
(liability)
balance,
beginning
of period |
| |
| Net
realized
gains/
(losses) |
| |
| Net
unrealized
gains/
(losses) |
| | | Purchases | | | | Sales | | | | Settlements | | |
| Transfers
into
level 3 |
| |
| Transfers
out of
level 3 |
| |
| Asset/
(liability)
balance,
end of
period |
|
Three Months Ended March 2016 | | | | | | | | | | | | | | | | | | | | | | | | | | | | | | | | | | | | |
Interest rates — net | | | $ (398 | ) | | | $ (11 | ) | | | $ 28 | | | | $ 3 | | | | $ (10 | ) | | | $ 17 | | | | $ – | | | | $ (12 | ) | | | $ (383 | ) |
| | |
Credit — net | | | 2,793 | | | | (26 | ) | | | 210 | | | | 33 | | | | (57 | ) | | | (75 | ) | | | 8 | | | | (65 | ) | | | 2,821 | |
| | |
Currencies — net | | | (34 | ) | | | (21 | ) | | | (5 | ) | | | 6 | | | | (1 | ) | | | 61 | | | | – | | | | 3 | | | | 9 | |
| | |
Commodities — net | | | (262 | ) | | | (5 | ) | | | 41 | | | | 47 | | | | (18 | ) | | | (37 | ) | | | (26 | ) | | | (31 | ) | | | (291 | ) |
| | |
Equities — net | | | (1,604 | ) | | | (16 | ) | | | 187 | | | | 26 | | | | (1,739 | ) | | | 140 | | | | 2 | | | | 903 | | | | (2,101 | ) |
Total derivatives — net | | | $ 495 | | | | $ (79 | ) | | | $461 | | | | $115 | | | | $(1,825 | ) | | | $ 106 | | | | $ (16 | ) | | | $ 798 | | | | $ 55 | |
Three Months Ended March 2015 | | | | | | | | | | | | | | | | | | | | | | | | | | | | | | | | | | | | |
Interest rates — net | | | $ (40 | ) | | | $ (8 | ) | | | $ 85 | | | | $ 23 | | | | $ (22 | ) | | | $ 4 | | | | $ (27 | ) | | | $ (51 | ) | | | $ (36 | ) |
| | |
Credit — net | | | 3,530 | | | | 134 | | | | 479 | | | | 58 | | | | (132 | ) | | | (507 | ) | | | 286 | | | | (259 | ) | | | 3,589 | |
| | |
Currencies — net | | | (267 | ) | | | (31 | ) | | | 30 | | | | 8 | | | | (4 | ) | | | 85 | | | | 5 | | | | (8 | ) | | | (182 | ) |
| | |
Commodities — net | | | (1,142 | ) | | | 7 | | | | (49 | ) | | | – | | | | (10 | ) | | | 6 | | | | (9 | ) | | | (189 | ) | | | (1,386 | ) |
| | |
Equities — net | | | (1,375 | ) | | | 11 | | | | 91 | | | | 41 | | | | (553 | ) | | | 804 | | | | 27 | | | | 180 | | | | (774 | ) |
Total derivatives — net | | | $ 706 | | | | $113 | | | | $636 | | | | $130 | | | | $ (721 | ) | | | $ 392 | | | | $282 | | | | $(327 | ) | | | $ 1,211 | |
| | | | |
| | Goldman Sachs March 2016 Form 10-Q | | 29 |
THE GOLDMAN SACHS GROUP, INC. AND SUBSIDIARIES
Notes to Condensed Consolidated Financial Statements
(Unaudited)
Level 3 Rollforward Commentary
Three Months ended March 2016.The net unrealized gain on level 3 derivatives of $461 million for the three months ended March 2016 was primarily attributable to gains on certain credit derivatives, reflecting the impact of changes in interest rates and widening of certain credit spreads, and gains on certain equity derivatives, reflecting the impact of changes in equity prices.
Transfers into level 3 derivatives during the three months ended March 2016 were not material.
Transfers out of level 3 derivatives during the three months ended March 2016 primarily reflected transfers of certain equity derivative liabilities to level 2, principally due to certain unobservable inputs no longer being significant to the valuation of these derivatives.
Three Months Ended March 2015. The net unrealized gain on level 3 derivatives of $636 million for the three months ended March 2015 was primarily attributable to gains on credit derivatives, primarily reflecting the impact of a decrease in interest rates, changes in foreign exchange rates and wider credit spreads.
Transfers into level 3 derivatives during the three months ended March 2015 primarily reflected transfers of certain credit derivative assets from level 2, principally due to unobservable credit spread inputs becoming significant to the valuation of certain derivatives and to the net risk of certain portfolios.
Transfers out of level 3 derivatives during the three months ended March 2015 primarily reflected transfers of certain credit derivative assets to level 2, principally due to increased transparency of correlation and upfront credit point inputs used to value these derivatives, transfers of certain commodity derivative assets to level 2, principally due to increased transparency of natural gas spread inputs used to value these derivatives and unobservable volatility inputs no longer being significant to the valuation of certain other commodity derivatives and transfers of certain equity derivative liabilities to level 2, principally due to unobservable inputs no longer being significant to the valuation of these derivatives.
OTC Derivatives
The table below presents the fair values of OTC derivative assets and liabilities by tenor and major product type.
| | $ in millions | |
| Less than
1 Year |
| |
| 1 - 5
Years |
| |
| Greater than
5 Years |
| | | Total | | |
| Less than
1 Year |
| |
| 1 - 5
Years |
| |
| Greater than
5 Years |
| | Total | |
As of March 2016 | | | | | | | | | |
As of March 2017 | | | | | | | | | |
Assets | | | | | | | | | | | | | | | | |
Interest rates | | | $ 5,106 | | | | $26,561 | | | | $ 93,300 | | | | $124,967 | | | | $ 5,419 | | | | $17,823 | | | | $77,258 | | | | $100,500 | |
| | | | | |
Credit | | | 1,621 | | | | 4,022 | | | | 6,575 | | | | 12,218 | | | | 1,295 | | | | 3,476 | | | | 4,161 | | | | 8,932 | |
| | | | | |
Currencies | | | 15,721 | | | | 7,668 | | | | 7,442 | | | | 30,831 | | | | 9,715 | | | | 6,246 | | | | 8,154 | | | | 24,115 | |
| | | | | |
Commodities | | | 5,199 | | | | 2,925 | | | | 228 | | | | 8,352 | | | | 3,103 | | | | 1,252 | | | | 175 | | | | 4,530 | |
| | | | | |
Equities | | | 5,299 | | | | 7,537 | | | | 1,986 | | | | 14,822 | | | | 3,299 | | | | 6,955 | | | | 1,294 | | | | 11,548 | |
| | | | | |
Counterparty netting within tenors | | | (3,737 | ) | | | (5,868 | ) | | | (5,387 | ) | | | (14,992 | ) | |
Counterparty netting in tenors | | | | (2,965 | ) | | | (5,174 | ) | | | (3,966 | ) | | | (12,105 | ) |
Subtotal | | | $29,209 | | | | $42,845 | | | | $104,144 | | | | $176,198 | | | | $19,866 | | | | $30,578 | | | | $87,076 | | | | $137,520 | |
| | | | | |
Cross-tenor counterparty netting | | | | | | | | | (25,354 | ) | Cross-tenor counterparty netting | | | | | | | | (17,421 | ) |
| | | | | |
Cash collateral netting | | | | | | | | (93,916 | ) | | | (76,941 | ) |
Total | | | | | | | | $ 56,928 | | | | $ 43,158 | |
Liabilities | | | | | | | | | | | | | | | | |
Interest rates | | | $ 6,871 | | | | $15,388 | | | | $ 47,096 | | | | $ 69,355 | | | | $ 5,086 | | | | $ 9,749 | | | | $34,116 | | | | $ 48,951 | |
| | | | | |
Credit | | | 2,370 | | | | 3,827 | | | | 1,826 | | | | 8,023 | | | | 1,298 | | | | 3,082 | | | | 1,531 | | | | 5,911 | |
| | | | | |
Currencies | | | 17,616 | | | | 9,389 | | | | 8,904 | | | | 35,909 | | | | 11,591 | | | | 8,502 | | | | 5,035 | | | | 25,128 | |
| | | | | |
Commodities | | | 4,593 | | | | 1,985 | | | | 2,613 | | | | 9,191 | | | | 2,387 | | | | 1,067 | | | | 2,437 | | | | 5,891 | |
| | | | | |
Equities | | | 8,606 | | | | 5,767 | | | | 2,497 | | | | 16,870 | | | | 7,859 | | | | 6,298 | | | | 2,859 | | | | 17,016 | |
| | | | | |
Counterparty netting within tenors | | | (3,737 | ) | | | (5,868 | ) | | | (5,387 | ) | | | (14,992 | ) | |
Counterparty netting in tenors | | | | (2,965 | ) | | | (5,174 | ) | | | (3,966 | ) | | | (12,105 | ) |
Subtotal | | | $36,319 | | | | $30,488 | | | | $ 57,549 | | | | $124,356 | | | | $25,256 | | | | $23,524 | | | | $42,012 | | | | $ 90,792 | |
| | | | | |
Cross-tenor counterparty netting | | | | | | | | | (25,354 | ) | Cross-tenor counterparty netting | | | | | | | | (17,421 | ) |
| | | | | |
Cash collateral netting | | | | | | | | (47,739 | ) | | | (36,203 | ) |
Total | | | | | | | | $ 51,263 | | | | $ 37,168 | |
As of December 2015 | | | | | | | | | |
As of December 2016 | | | | | | | | | |
Assets | | | | | | | | | | | | | | | | |
Interest rates | | $ 4,231 | | | | $23,278 | | | | $ 81,401 | | | | $108,910 | | | $ 5,845 | | | $18,376 | | | $79,507 | | | $103,728 | |
| | | | | |
Credit | | 1,664 | | | | 4,547 | | | | 5,842 | | | | 12,053 | | | 1,763 | | | 2,695 | | | 4,889 | | | 9,347 | |
| | | | | |
Currencies | | 14,646 | | | | 8,936 | | | | 6,353 | | | | 29,935 | | | 18,344 | | | 8,292 | | | 8,428 | | | 35,064 | |
| | | | | |
Commodities | | 6,228 | | | | 3,897 | | | | 231 | | | | 10,356 | | | 3,273 | | | 1,415 | | | 179 | | | 4,867 | |
| | | | | |
Equities | | 4,806 | | | | 7,091 | | | | 1,550 | | | | 13,447 | | | 3,141 | | | 9,249 | | | 1,341 | | | 13,731 | |
| | | | | |
Counterparty netting within tenors | | (3,660 | ) | | | (5,751 | ) | | | (5,270 | ) | | | (14,681 | ) | |
Counterparty netting in tenors | | | (3,543 | ) | | (5,550 | ) | | (3,794 | ) | | (12,887 | ) |
Subtotal | | $27,915 | | | | $41,998 | | | | $ 90,107 | | | | $160,020 | | | $28,823 | | | $34,477 | | | $90,550 | | | $153,850 | |
| | | | | |
Cross-tenor counterparty netting | | | | | | | | | (20,462 | ) | Cross-tenor counterparty netting | | | | | | | (17,396 | ) |
| | | | | |
Cash collateral netting | | | | | | | | (89,132 | ) | | (85,329 | ) |
Total | | | | | | | | $50,426 | | | $ 51,125 | |
Liabilities | | | | | | | | | | | | | | | | |
Interest rates | | $ 5,323 | | | | $13,945 | | | | $ 35,592 | | | | $ 54,860 | | | $ 5,679 | | | $10,814 | | | $38,812 | | | $ 55,305 | |
| | | | | |
Credit | | 1,804 | | | | 4,704 | | | | 1,437 | | | | 7,945 | | | 2,060 | | | 3,328 | | | 1,167 | | | 6,555 | |
| | | | | |
Currencies | | 12,378 | | | | 9,940 | | | | 10,048 | | | | 32,366 | | | 14,720 | | | 9,771 | | | 5,879 | | | 30,370 | |
| | | | | |
Commodities | | 4,464 | | | | 3,136 | | | | 2,526 | | | | 10,126 | | | 2,546 | | | 1,555 | | | 2,315 | | | 6,416 | |
| | | | | |
Equities | | 5,154 | | | | 5,802 | | | | 2,994 | | | | 13,950 | | | 7,000 | | | 10,426 | | | 2,614 | | | 20,040 | |
| | | | | |
Counterparty netting within tenors | | (3,660 | ) | | | (5,751 | ) | | | (5,270 | ) | | | (14,681 | ) | |
Counterparty netting in tenors | | | (3,543 | ) | | (5,550 | ) | | (3,794 | ) | | (12,887 | ) |
Subtotal | | $25,463 | | | | $31,776 | | | | $ 47,327 | | | | $104,566 | | | $28,462 | | | $30,344 | | | $46,993 | | | $105,799 | |
| | | | | |
Cross-tenor counterparty netting | | | | | | | | | (20,462 | ) | Cross-tenor counterparty netting | | | | | | | (17,396 | ) |
| | | | | |
Cash collateral netting | | | | | | | | (39,950 | ) | | (42,986 | ) |
Total | | | | | | | | $ 44,154 | | | $ 45,417 | |
| | | | |
30 | | Goldman Sachs March 20162017 Form 10-Q | | 29 |
THE GOLDMAN SACHS GROUP, INC. AND SUBSIDIARIES
Notes to Condensed Consolidated Financial Statements
(Unaudited)
In the table above:
Tenor is based on expected duration for mortgage-related credit derivatives and generally on remaining contractual maturity for other derivatives.
Counterparty netting within the same product type and tenor category is included within such product type and tenor category.
Counterparty netting across product types within the same tenor category is included in “Counterpartycounterparty netting withinin tenors.” Where the counterparty netting is across tenor categories, the netting is reflected in “Cross-tenorcross-tenor counterparty netting.”
Credit Derivatives
The firm enters into a broad array of credit derivatives in locations around the world to facilitate client transactions and to manage the credit risk associated with market-making and investing and lending activities. Credit derivatives are actively managed based on the firm’s net risk position.
Credit derivatives are generally individually negotiated contracts and can have various settlement and payment conventions. Credit events include failure to pay, bankruptcy, acceleration of indebtedness, restructuring, repudiation and dissolution of the reference entity.
The firm enters into the following types of credit derivatives:
Credit Default Swaps. Single-name credit default swaps protect the buyer against the loss of principal on one or more bonds, loans or mortgages (reference obligations) in the event the issuer (reference entity) of the reference obligations suffers a credit event. The buyer of protection pays an initial or periodic premium to the seller and receives protection for the period of the contract. If there is no credit event, as defined in the contract, the seller of protection makes no payments to the buyer of protection. However, if a credit event occurs, the seller of protection is required to make a payment to the buyer of protection, which is calculated in accordance with the terms of the contract.
Credit Options. In a credit option, the option writer assumes the obligation to purchase or sell a reference obligation at a specified price or credit spread. The option purchaser buys the right, but does not assume the obligation, to sell the reference obligation to, or purchase it from, the option writer. The payments on credit options depend either on a particular credit spread or the price of the reference obligation.
Credit Indices, Baskets and Tranches. Credit derivatives may reference a basket of single-name credit default swaps or a broad-based index. If a credit event occurs in one of the underlying reference obligations, the protection seller pays the protection buyer. The payment is typically a pro-rata portion of the transaction’s total notional amount based on the underlying defaulted reference obligation. In certain transactions, the credit risk of a basket or index is separated into various portions (tranches), each having different levels of subordination. The most junior tranches cover initial defaults and once losses exceed the notional amount of these junior tranches, any excess loss is covered by the next most senior tranche in the capital structure.
Total Return Swaps. A total return swap transfers the risks relating to economic performance of a reference obligation from the protection buyer to the protection seller. Typically, the protection buyer receives from the protection seller a floating rate of interest and protection against any reduction in fair value of the reference obligation, and in return the protection seller receives the cash flows associated with the reference obligation, plus any increase in the fair value of the reference obligation.
The firm economically hedges its exposure to written credit derivatives primarily by entering into offsetting purchased credit derivatives with identical underliers. Substantially all of the firm’s purchased credit derivative transactions are with financial institutions and are subject to stringent collateral thresholds. In addition, upon the occurrence of a specified trigger event, the firm may take possession of the reference obligations underlying a particular written credit derivative, and consequently may, upon liquidation of the reference obligations, recover amounts on the underlying reference obligations in the event of default.
As of March 2017, written and purchased credit derivatives had total gross notional amounts of $669.66 billion and $722.22 billion, respectively, for total net notional purchased protection of $52.56 billion. As of December 2016, written and purchased credit derivatives had total gross notional amounts of $970.66$690.47 billion and $1.01 trillion, respectively, for total net notional purchased protection of $38.60 billion. As of December 2015, written and purchased credit derivatives had total gross notional amounts of $923.48 billion and $968.68$733.98 billion, respectively, for total net notional purchased protection of $45.20$43.51 billion. Substantially all of the firm’s written and purchased credit derivatives are credit default swaps.
| | | | |
| 30 | | Goldman Sachs March 20162017 Form 10-Q | | 31 |
THE GOLDMAN SACHS GROUP, INC. AND SUBSIDIARIES
Notes to Condensed Consolidated Financial Statements
(Unaudited)
The table below presents certain information about credit derivatives.
| | | | Credit Spread on Underlier (basis points) | | | Credit Spread on Underlier (basis points) | |
| $ in millions | | 0 - 250 | | 251 - 500 | | 501 -
1,000 | | Greater than
1,000 | | Total | | | 0 - 250 | | |
| 251 -
500 |
| |
| 501 -
1,000 |
| |
| Greater
than
1,000 |
| | Total | |
As of March 2016 | | |
As of March 2017 | | As of March 2017 | | | | | | | | | |
Maximum Payout/Notional Amount of Written Credit Derivatives by Tenor | Maximum Payout/Notional Amount of Written Credit Derivatives by Tenor | | Maximum Payout/Notional Amount of Written Credit Derivatives by Tenor | |
Less than 1 year | | | $241,215 | | | | $ 6,035 | | | | $ 2,678 | | | | $ 8,852 | | | | $258,780 | | | | $207,898 | | | | $ 8,016 | | | | $ 1,629 | | | | $ 5,065 | | | | $222,608 | |
| | | | | |
1 - 5 years | | | 525,268 | | | | 36,418 | | | | 17,789 | | | | 21,490 | | | | 600,965 | | | | 337,949 | | | | 10,995 | | | | 8,711 | | | | 7,428 | | | | 365,083 | |
| | | | | |
Greater than 5 years | | | 92,695 | | | | 12,286 | | | | 4,343 | | | | 1,595 | | | | 110,919 | | | | 73,908 | | | | 5,972 | | | | 1,564 | | | | 528 | | | | 81,972 | |
Total | | | $859,178 | | | | $54,739 | | | | $24,810 | | | | $ 31,937 | | | | $970,664 | | | | $619,755 | | | | $24,983 | | | | $11,904 | | | | $13,021 | | | | $669,663 | |
Maximum Payout/Notional Amount of Purchased Credit Derivatives | Maximum Payout/Notional Amount of Purchased Credit Derivatives | | Maximum Payout/Notional Amount of Purchased Credit Derivatives | |
Offsetting | | | $766,408 | | | | $46,382 | | | | $17,797 | | | | $ 22,474 | | | | $853,061 | | | | $531,632 | | | | $16,116 | | | | $10,521 | | | | $10,873 | | | | $569,142 | |
| | | | | |
Other | | | 127,323 | | | | 10,073 | | | | 8,313 | | | | 10,493 | | | | 156,202 | | | | 138,756 | | | | 9,863 | | | | 2,082 | | | | 2,380 | | | | 153,081 | |
Fair Value of Written Credit Derivatives | Fair Value of Written Credit Derivatives | | Fair Value of Written Credit Derivatives | |
Asset | | | $ 16,961 | | | | $ 961 | | | | $ 180 | | | | $ 111 | | | | $ 18,213 | | | | $ 14,252 | | | | $ 650 | | | | $ 192 | | | | $ 59 | | | | $ 15,153 | |
| | | | | |
Liability | | | 3,427 | | | | 2,163 | | | | 1,787 | | | | 10,339 | | | | 17,716 | | | | 1,844 | | | | 538 | | | | 904 | | | | 4,271 | | | | 7,557 | |
Net asset/(liability) | | | $ 13,534 | | | | $ (1,202 | ) | | | $ (1,607 | ) | | | $(10,228 | ) | | | $ 497 | | | | $ 12,408 | | | | $ 112 | | | | $ (712 | ) | | | $ (4,212 | ) | | | $ 7,596 | |
As of December 2015 | | |
As of December 2016 | | As of December 2016 | | | | | | | |
Maximum Payout/Notional Amount of Written Credit Derivatives by Tenor | Maximum Payout/Notional Amount of Written Credit Derivatives by Tenor | | Maximum Payout/Notional Amount of Written Credit Derivatives by Tenor | |
Less than 1 year | | $240,468 | | | $ 2,859 | | | $ 2,881 | | | $ 10,533 | | | $256,741 | | | $207,727 | | | $ 5,819 | | | $ 1,016 | | | $ 8,629 | | | $223,191 | |
| | | | | |
1 - 5 years | | 514,986 | | | 42,399 | | | 16,327 | | | 26,271 | | | 599,983 | | | 375,208 | | | 17,255 | | | 8,643 | | | 7,986 | | | 409,092 | |
| | | | | |
Greater than 5 years | | 57,054 | | | 6,481 | | | 1,567 | | | 1,651 | | | 66,753 | | | 52,977 | | | 3,928 | | | 1,045 | | | 233 | | | 58,183 | |
Total | | $812,508 | | | $51,739 | | | $20,775 | | | $ 38,455 | | | $923,477 | | | $635,912 | | | $27,002 | | | $10,704 | | | $16,848 | | | $690,466 | |
Maximum Payout/Notional Amount of Purchased Credit Derivatives | Maximum Payout/Notional Amount of Purchased Credit Derivatives | | Maximum Payout/Notional Amount of Purchased Credit Derivatives | |
Offsetting | | $722,436 | | | $46,313 | | | $19,556 | | | $ 33,266 | | | $821,571 | | | $558,305 | | | $20,588 | | | $10,133 | | | $15,186 | | | $604,212 | |
| | | | | |
Other | | 132,757 | | | 6,383 | | | 3,372 | | | 4,598 | | | 147,110 | | | 119,509 | | | 7,712 | | | 1,098 | | | 1,446 | | | 129,765 | |
Fair Value of Written Credit Derivatives | Fair Value of Written Credit Derivatives | | Fair Value of Written Credit Derivatives | |
Asset | | $ 17,110 | | | $ 924 | | | $ 108 | | | $ 190 | | | $ 18,332 | | | $ 13,919 | | | $ 606 | | | $ 187 | | | $ 45 | | | $ 14,757 | |
| | | | | |
Liability | | 2,756 | | | 2,596 | | | 1,942 | | | 12,485 | | | 19,779 | | | 2,436 | | | 902 | | | 809 | | | 5,686 | | | 9,833 | |
Net asset/(liability) | | $ 14,354 | | | $ (1,672 | ) | | $ (1,834 | ) | | $(12,295 | ) | | $ (1,447 | ) | | $ 11,483 | | | $ (296 | ) | | $ (622 | ) | | $ (5,641 | ) | | $ 4,924 | |
In the table above:
Fair values exclude the effects of both netting of receivable balances with payable balances under enforceable netting agreements, and netting of cash received or posted under enforceable credit support agreements, and therefore are not representative of the firm’s credit exposure.
Tenor is based on expected duration for mortgage-related credit derivatives and on remaining contractual maturity for other credit derivatives.
The credit spread on the underlier, together with the tenor of the contract, are indicators of payment/performance risk. The firm is less likely to pay or otherwise be required to perform where the credit spread and the tenor are lower.
Offsetting purchased credit derivatives represent the notional amount of purchased credit derivatives that economically hedge written credit derivatives with identical underliers and are included in “Offsetting.”offsetting.
Other purchased credit derivatives represent the notional amount of all other purchased credit derivatives not included in “Offsetting.”offsetting.
Impact of Credit Spreads on Derivatives
On an ongoing basis, the firm realizes gains or losses relating to changes in credit risk through the unwind of derivative contracts and changes in credit mitigants.
The net gain/(loss),gain, including hedges, attributable to the impact of changes in credit exposure and credit spreads (counterparty and the firm’s) on derivatives was $132$11 million and $(99)$132 million for the three months ended March 20162017 and March 2015,2016, respectively.
Bifurcated Embedded Derivatives
The table below presents the fair value and the notional amount of derivatives that have been bifurcated from their related borrowings. These
| | | | | | | | |
| | | As of | |
| $ in millions | |
| March
2017 |
| |
| December
2016 |
|
Fair value of assets | | | $ 734 | | | | $ 676 | |
| | |
Fair value of liabilities | | | 981 | | | | 864 | |
Net liability | | | $ 247 | | | | $ 188 | |
Notional amount | | | $8,495 | | | | $8,726 | |
In the table above, these derivatives, which are recorded at fair value, primarily consist of interest rate, equity and commodity products and are included in “Unsecured short-term borrowings” and “Unsecured long-term borrowings” with the related borrowings. See Note 8 for further information.
| | | | | | | | |
| | | As of | |
| $ in millions | |
| March
2016 |
| |
| December
2015 |
|
Fair value of assets | | | $ 600 | | | | $ 466 | |
| | |
Fair value of liabilities | | | 668 | | | | 794 | |
Net liability | | | $ 68 | | | | $ 328 | |
Notional amount | | | $9,235 | | | | $7,869 | |
Derivatives with Credit-Related Contingent Features
Certain of the firm’s derivatives have been transacted under bilateral agreements with counterparties who may require the firm to post collateral or terminate the transactions based on changes in the firm’s credit ratings. The firm assesses the impact of these bilateral agreements by determining the collateral or termination payments that would occur assuming a downgrade by all rating agencies. A downgrade by any one rating agency, depending on the agency’s relative ratings of the firm at the time of the downgrade, may have an impact which is comparable to the impact of a downgrade by all rating agencies.
| | | | |
32 | | Goldman Sachs March 20162017 Form 10-Q | | 31 |
THE GOLDMAN SACHS GROUP, INC. AND SUBSIDIARIES
Notes to Condensed Consolidated Financial Statements
(Unaudited)
The table below presents the aggregate fair value of net derivative liabilities under such agreements (excluding application of collateral posted to reduce these liabilities), the related aggregate fair value of the assets posted as collateral and the additional collateral or termination payments that could have been called at the reporting date by counterparties in the event of a one-notch and two-notch downgrade in the firm’s credit ratings.
| | | | As of | | | As of | |
| $ in millions | |
| March
2016 |
| |
| December
2015 |
| |
| March
2017 |
| |
| December
2016 |
|
Net derivative liabilities under bilateral agreements | | | $36,752 | | | | $29,836 | | | | $28,517 | | | $32,927 | |
| | | | | |
Collateral posted | | | 31,979 | | | | 26,075 | | | | $24,530 | | | $27,840 | |
| | | | | |
Additional collateral or termination payments for a one-notch downgrade | | | 676 | | | | 1,061 | | |
Additional collateral or termination payments: | | | | | |
One-notch downgrade | | | | $ 367 | | | $ 677 | |
| | | | | |
Additional collateral or termination payments for a two-notch downgrade | | | 2,031 | | | | 2,689 | | |
Two-notch downgrade | | | | $ 1,880 | | | $ 2,216 | |
Hedge Accounting
The firm applies hedge accounting for (i) certain interest rate swaps used to manage the interest rate exposure of certain fixed-rate unsecured long-term and short-term borrowings and certain fixed-rate certificates of deposit and (ii) certain foreign currency forward contracts and foreign currency-denominated debt used to manage foreign currency exposures on the firm’s net investment in certain non-U.S. operations.
To qualify for hedge accounting, the hedging instrument must be highly effective at reducing the risk from the exposure being hedged. Additionally, the firm must formally document the hedging relationship at inception and test the hedging relationship at least on a quarterly basis to ensure the hedging instrument continues to be highly effective over the life of the hedging relationship.
Fair Value Hedges
The firm designates certain interest rate swaps as fair value hedges. These interest rate swaps hedge changes in fair value attributable to the designated benchmark interest rate (e.g., London Interbank Offered Rate (LIBOR) or Overnight Index Swap Rate (OIS))Rate), effectively converting a substantial portion of fixed-rate obligations into floating-rate obligations.
The firm applies a statistical method that utilizes regression analysis when assessing the effectiveness of its fair value hedging relationships in achieving offsetting changes in the fair values of the hedging instrument and the risk being hedged (i.e., interest rate risk). An interest rate swap is considered highly effective in offsetting changes in fair value attributable to changes in the hedged risk when the regression analysis results in a coefficient of determination of 80% or greater and a slope between 80% and 125%.
For qualifying fair value hedges, gains or losses on derivatives are included in “Interest expense.” The change in fair value of the hedged item attributable to the risk being hedged is reported as an adjustment to its carrying value and is subsequently amortized into interest expense over its remaining life. Gains or losses resulting from hedge ineffectiveness are included in “Interest expense.” When a derivative is no longer designated as a hedge, any remaining difference between the carrying value and par value of the hedged item is amortized to interest expense over the remaining life of the hedged item using the effective interest method. See Note 23 for further information about interest income and interest expense.
The table below presents the gains/(losses) from interest rate derivatives accounted for as hedges, the related hedged borrowings and bank deposits, and the hedge ineffectiveness on these derivatives, which primarily consists of amortization of prepaid credit spreads resulting from the passage of time.
| | | | Three Months Ended March | | | Three Months Ended March | |
| $ in millions | | | 2016 | | | | 2015 | | | | 2017 | | | | 2016 | |
Interest rate hedges | | | $ 1,990 | | | | $ 942 | | | | $(754 | ) | | | $ 1,990 | |
| | | | | |
Hedged borrowings and bank deposits | | | (2,028 | ) | | | (1,050 | ) | |
Hedged borrowings and deposits | | | | 554 | | | | (2,028 | ) |
Hedge ineffectiveness | | | $ (38 | ) | | | $ (108 | ) | | | $(200 | ) | | | $ (38 | ) |
Net Investment Hedges
The firm seeks to reduce the impact of fluctuations in foreign exchange rates on its net investments in certain non-U.S. operations through the use of foreign currency forward contracts and foreign currency-denominated debt. For foreign currency forward contracts designated as hedges, the effectiveness of the hedge is assessed based on the overall changes in the fair value of the forward contracts (i.e., based on changes in forward rates). For foreign currency-denominated debt designated as a hedge, the effectiveness of the hedge is assessed based on changes in spot rates.
For qualifying net investment hedges, the gains or losses on the hedging instruments, to the extent effective, are included in “Currency translation” in the condensed consolidated statements of comprehensive income.
The table below presents the gains/(losses) from net investment hedging.
| | | | | | | | |
| | | Three Months Ended March | |
| $ in millions | | | 2016 | | | | 2015 | |
Foreign currency forward contract hedges | | | $ (356 | ) | | | $ 444 | |
| | |
Foreign currency-denominated debt hedges | | | (150 | ) | | | 2 | |
| | | | |
| 32 | | Goldman Sachs March 20162017 Form 10-Q | | 33 |
THE GOLDMAN SACHS GROUP, INC. AND SUBSIDIARIES
Notes to Condensed Consolidated Financial Statements
(Unaudited)
The table below presents the gains/(losses) from net investment hedging.
| | | | | | | | |
| | | Three Months
Ended March | |
| $ in millions | | | 2017 | | | | 2016 | |
Hedges: | | | | | | | | |
Foreign currency forward contract | | | $(349 | ) | | | $(356 | ) |
| | |
Foreign currency-denominated debt | | | $ (82 | ) | | | $(150 | ) |
The gain/(loss) related to ineffectiveness and the gain/(loss) reclassified to earnings from accumulated other comprehensive loss were not material for the three months ended March 20162017 or March 2015.2016.
As of March 20162017 and December 2015,2016, the firm had designated $2.36$1.77 billion and $2.20$1.69 billion, respectively, of foreign currency-denominated debt, included in “Unsecured long-term borrowings” and “Unsecured short-term borrowings,” as hedges of net investments in non-U.S. subsidiaries.
Note 8.
Fair Value Option
Other Financial Assets and Financial Liabilities at Fair Value
In addition to all cash and derivative instruments included in “Financial instruments owned, at fair value” and “Financial instruments sold, but not yet purchased, at fair value,” the firm accounts for certain of its other financial assets and financial liabilities at fair value primarily under the fair value option. The primary reasons for electing the fair value option are to:
Reflect economic events in earnings on a timely basis;
Mitigate volatility in earnings from using different measurement attributes (e.g., transfers of financial instruments owned accounted for as financings are recorded at fair value whereas the related secured financing would be recorded on an accrual basis absent electing the fair value option); and
Address simplification and cost-benefit considerations (e.g., accounting for hybrid financial instruments at fair value in their entirety versus bifurcation of embedded derivatives and hedge accounting for debt hosts).
Hybrid financial instruments are instruments that contain bifurcatable embedded derivatives and do not require settlement by physical delivery of non-financialnonfinancial assets (e.g., physical commodities). If the firm elects to bifurcate the embedded derivative from the associated debt, the derivative is accounted for at fair value and the host contract is accounted for at amortized cost, adjusted for the effective portion of any fair value hedges. If the firm does not elect to bifurcate, the entire hybrid financial instrument is accounted for at fair value under the fair value option.
Other financial assets and financial liabilities accounted for at fair value under the fair value option include:
Repurchase agreements and substantially all resale agreements;
Securities borrowed and loaned within Fixed Income, Currency and Commodities Client Execution;Execution (FICC Client Execution);
Substantially all other secured financings, including transfers of assets accounted for as financings rather than sales;
Certain unsecured short-term borrowings, consistingsubstantially all of all commercial paper and certainwhich are hybrid financial instruments;
Certain unsecured long-term borrowings, including certain prepaid commodity transactions and certain hybrid financial instruments;
Certain receivables from customers and counterparties, including transfers of assets accounted for as secured loans rather than purchases and certain margin loans;
Certain time deposits issued by the firm’s bank subsidiaries (deposits with no stated maturity are not eligible for a fair value option election), including structured certificates of deposit, which are hybrid financial instruments; and
Certain subordinated liabilities issued byof consolidated VIEs.
| | | | |
34 | | Goldman Sachs March 20162017 Form 10-Q | | 33 |
THE GOLDMAN SACHS GROUP, INC. AND SUBSIDIARIES
Notes to Condensed Consolidated Financial Statements
(Unaudited)
Fair Value of Other Financial Assets and Financial Liabilities by Level
The table below presents, by level within the fair value hierarchy, other financial assets and financial liabilities accounted for at fair value primarily under the fair value option.
| | | | | | | | | | | | | | | | |
| $ in millions | | | Level 1 | | | | Level 2 | | | | Level 3 | | | | Total | |
As of March 2016 | | | | | | | | | | | | | | | | |
Assets | | | | | | | | | | | | | | | | |
Securities segregated for regulatory and other purposes | | | $17,681 | | | | $ 21,824 | | | | $ — | | | | $ 39,505 | |
| | |
Securities purchased under agreements to resell | | | — | | | | 127,189 | | | | — | | | | 127,189 | |
| | |
Securities borrowed | | | — | | | | 66,212 | | | | — | | | | 66,212 | |
| | |
Receivables from customers and counterparties | | | — | | | | 3,850 | | | | 43 | | | | 3,893 | |
Total | | | $17,681 | | | | $ 219,075 | | | | $ 43 | | | | $ 236,799 | |
Liabilities | | | | | | | | | | | | | | | | |
Deposits | | | $ — | | | | $ (12,449 | ) | | | $ (2,585 | ) | | | $ (15,034 | ) |
| | |
Securities sold under agreements to repurchase | | | — | | | | (77,544 | ) | | | (73 | ) | | | (77,617 | ) |
| | |
Securities loaned | | | — | | | | (972 | ) | | | — | | | | (972 | ) |
| | |
Other secured financings | | | — | | | | (23,565 | ) | | | (829 | ) | | | (24,394 | ) |
| | |
Unsecured short-term borrowings | | | — | | | | (15,079 | ) | | | (4,167 | ) | | | (19,246 | ) |
| | |
Unsecured long-term borrowings | | | — | | | | (19,748 | ) | | | (5,923 | ) | | | (25,671 | ) |
| | |
Other liabilities and accrued expenses | | | — | | | | (503 | ) | | | (73 | ) | | | (576 | ) |
Total | | | $ — | | | | $(149,860 | ) | | | $(13,650 | ) | | | $(163,510 | ) |
As of December 2015 | | | | | | | | | | | | | | | | |
Assets | | | | | | | | | | | | | | | | |
Securities segregated for regulatory and other purposes | | | $19,562 | | | | $ 18,942 | | | | $ — | | | | $ 38,504 | |
| | |
Securities purchased under agreements to resell | | | — | | | | 119,450 | | | | — | | | | 119,450 | |
| | |
Securities borrowed | | | — | | | | 69,801 | | | | — | | | | 69,801 | |
| | |
Receivables from customers and counterparties | | | — | | | | 4,947 | | | | 45 | | | | 4,992 | |
Total | | | $19,562 | | | | $ 213,140 | | | | $ 45 | | | | $ 232,747 | |
Liabilities | | | | | | | | | | | | | | | | |
Deposits | | | $ — | | | | $ (12,465 | ) | | | $ (2,215 | ) | | | $ (14,680 | ) |
| | |
Securities sold under agreements to repurchase | | | — | | | | (85,998 | ) | | | (71 | ) | | | (86,069 | ) |
| | |
Securities loaned | | | — | | | | (466 | ) | | | — | | | | (466 | ) |
| | |
Other secured financings | | | — | | | | (22,658 | ) | | | (549 | ) | | | (23,207 | ) |
| | |
Unsecured short-term borrowings | | | — | | | | (13,610 | ) | | | (4,133 | ) | | | (17,743 | ) |
| | |
Unsecured long-term borrowings | | | — | | | | (18,049 | ) | | | (4,224 | ) | | | (22,273 | ) |
| | |
Other liabilities and accrued expenses | | | — | | | | (1,201 | ) | | | (52 | ) | | | (1,253 | ) |
Total | | | $ — | | | | $(154,447 | ) | | | $(11,244 | ) | | | $(165,691 | ) |
| | | | | | | | | | | | | | | | |
| $ in millions | | | Level 1 | | | | Level 2 | | | | Level 3 | | | | Total | |
As of March 2017 | | | | | | | | | | | | | | | | |
Assets | | | | | | | | | | | | | | | | |
Securities purchased under agreements to resell | | | $ — | | | | $ 116,546 | | | | $ — | | | | $ 116,546 | |
| | |
Securities borrowed | | | — | | | | 79,893 | | | | — | | | | 79,893 | |
| | |
Receivables from customers and counterparties | | | — | | | | 3,630 | | | | 14 | | | | 3,644 | |
Total | | | $ — | | | | $ 200,069 | | | | $ 14 | | | | $ 200,083 | |
Liabilities | | | | | | | | | | | | | | | | |
Deposits | | | $ — | | | | $ (16,132 | ) | | | $ (3,348 | ) | | | $ (19,480 | ) |
| | |
Securities sold under agreements to repurchase | | | — | | | | (88,469 | ) | | | (64 | ) | | | (88,533 | ) |
| | |
Securities loaned | | | — | | | | (4,403 | ) | | | — | | | | (4,403 | ) |
| | |
Other secured financings | | | — | | | | (21,392 | ) | | | (568 | ) | | | (21,960 | ) |
| | |
Unsecured borrowings: | | | | | | | | | | | | | | | | |
Short-term | | | — | | | | (9,656 | ) | | | (4,244 | ) | | | (13,900 | ) |
| | |
Long-term | | | — | | | | (24,197 | ) | | | (7,878 | ) | | | (32,075 | ) |
| | |
Other liabilities and accrued expenses | | | — | | | | (743 | ) | | | (63 | ) | | | (806 | ) |
Total | | | $ — | | | | $(164,992 | ) | | | $(16,165 | ) | | | $(181,157 | ) |
As of December 2016 | | | | | | | | | | | | | | | | |
Assets | | | | | | | | | | | | | | | | |
Securities purchased under agreements to resell | | | $ — | | | | $ 116,077 | | | | $ — | | | | $ 116,077 | |
| | |
Securities borrowed | | | — | | | | 82,398 | | | | — | | | | 82,398 | |
| | |
Receivables from customers and counterparties | | | — | | | | 3,211 | | | | 55 | | | | 3,266 | |
Total | | | $ — | | | | $ 201,686 | | | | $ 55 | | | | $ 201,741 | |
Liabilities | | | | | | | | | | | | | | | | |
Deposits | | | $ — | | | | $ (10,609 | ) | | | $ (3,173 | ) | | | $ (13,782 | ) |
| | |
Securities sold under agreements to repurchase | | | — | | | | (71,750 | ) | | | (66 | ) | | | (71,816 | ) |
| | |
Securities loaned | | | — | | | | (2,647 | ) | | | — | | | | (2,647 | ) |
| | |
Other secured financings | | | — | | | | (20,516 | ) | | | (557 | ) | | | (21,073 | ) |
| | |
Unsecured borrowings: | | | | | | | | | | | | | | | | |
Short-term | | | — | | | | (10,896 | ) | | | (3,896 | ) | | | (14,792 | ) |
| | |
Long-term | | | — | | | | (22,185 | ) | | | (7,225 | ) | | | (29,410 | ) |
| | |
Other liabilities and accrued expenses | | | — | | | | (559 | ) | | | (62 | ) | | | (621 | ) |
Total | | | $ — | | | | $(139,162 | ) | | | $(14,979 | ) | | | $(154,141 | ) |
In the table above:
Securities segregated for regulatory andabove, other purposes include segregated securities accounted for at fair value under the fair value option and consists of securities borrowed and resale agreements.
Level 1 other financial assets at fair value include U.S. Treasury securities segregated for regulatory and other purposes accounted for at fair value under other U.S. GAAP.
Other financial assets are shown as positive amounts and other financial liabilities are shown as negative amounts.
Valuation Techniques and Significant Inputs
Other financial assets and financial liabilities at fair value are generally valued based on discounted cash flow techniques, which incorporate inputs with reasonable levels of price transparency, and are generally classified asin level 2 because the inputs are observable. Valuation adjustments may be made for liquidity and for counterparty and the firm’s credit quality.
See below for information about the significant inputs used to value other financial assets and financial liabilities at fair value, including the ranges of significant unobservable inputs used to value the level 3 instruments within these categories. These ranges represent the significant unobservable inputs that were used in the valuation of each type of other financial assets and financial liabilities at fair value. The ranges and weighted averages of these inputs are not representative of the appropriate inputs to use when calculating the fair value of any one instrument. For example, the highest yield presented below for other secured financings is appropriate for valuing a specific agreement in that category but may not be appropriate for valuing any other agreements in that category. Accordingly, the ranges of inputs presented below do not represent uncertainty in, or possible ranges of, fair value measurements of the firm’s level 3 other financial assets and financial liabilities.
Resale and Repurchase Agreements and Securities Borrowed and Loaned. The significant inputs to the valuation of resale and repurchase agreements and securities borrowed and loaned are funding spreads, the amount and timing of expected future cash flows and interest rates. As of both March 20162017 and December 2015,2016, the firm had no level 3 resale agreements, securities borrowed or securities loaned. As of both March 20162017 and December 2015,2016, the firm’s level 3 repurchase agreements were not material. See Note 10 for further information about collateralized agreements and financings.
| | | | |
| 34 | | Goldman Sachs March 20162017 Form 10-Q | | 35 |
THE GOLDMAN SACHS GROUP, INC. AND SUBSIDIARIES
Notes to Condensed Consolidated Financial Statements
(Unaudited)
Other Secured Financings. The significant inputs to the valuation of other secured financings at fair value are the amount and timing of expected future cash flows, interest rates, funding spreads, the fair value of the collateral delivered by the firm (which is determined using the amount and timing of expected future cash flows, market prices, market yields and recovery assumptions) and the frequency of additional collateral calls. The ranges of significant unobservable inputs used to value level 3 other secured financings are as follows:
As of March 2016:2017:
Yield: 0.5% to 10.0%18.9% (weighted average: 3.1%5.1%)
Duration: 1.30.8 to 8.616.8 years (weighted average: 2.52.9 years)
As of December 2015:2016:
Yield: 0.6%0.4% to 10.0%16.6% (weighted average: 2.7%3.5%)
Duration: 1.60.1 to 8.85.7 years (weighted average: 2.82.3 years)
Generally, increases in funding spreads, yield or duration, in isolation, would result in a lower fair value measurement. Due to the distinctive nature of each of the firm’s level 3 other secured financings, the interrelationship of inputs is not necessarily uniform across such financings. See Note 10 for further information about collateralized agreements and financings.
Unsecured Short-term and Long-term Borrowings. The significant inputs to the valuation of unsecured short-term and long-term borrowings at fair value are the amount and timing of expected future cash flows, interest rates, the credit spreads of the firm, as well as commodity prices in the case of prepaid commodity transactions. The inputs used to value the embedded derivative component of hybrid financial instruments are consistent with the inputs used to value the firm’s other derivative instruments. See Note 7 for further information about derivatives. See Notes 15 and 16 for further information about unsecured short-term and long-term borrowings, respectively.
Certain of the firm’s unsecured short-term and long-term borrowings are includedclassified in level 3, substantially all of which are hybrid financial instruments. As the significant unobservable inputs used to value hybrid financial instruments primarily relate to the embedded derivative component of these borrowings, these inputs are incorporated in the firm’s derivative disclosures related to unobservable inputs in Note 7.
Receivables from Customers and Counterparties. Receivables from customers and counterparties at fair value are primarily comprised of transfers of assets accounted for as secured loans rather than purchases. The significant inputs to the valuation of such receivables are commodity prices, interest rates, the amount and timing of expected future cash flows and funding spreads. As of both March 20162017 and December 2015,2016, the firm’s level 3 receivables from customers and counterparties were not material.
Deposits. The significant inputs to the valuation of time deposits are interest rates and the amount and timing of future cash flows. The inputs used to value the embedded derivative component of hybrid financial instruments are consistent with the inputs used to value the firm’s other derivative instruments. See Note 7 for further information about derivatives. See Note 14 for further information about deposits.
The firm’s deposits that are includedclassified in level 3 are hybrid financial instruments. As the significant unobservable inputs used to value hybrid financial instruments primarily relate to the embedded derivative component of these deposits, these inputs are incorporated in the firm’s derivative disclosures related to unobservable inputs in Note 7.
Transfers Between Levels of the Fair Value Hierarchy
Transfers between levels of the fair value hierarchy are reported at the beginning of the reporting period in which they occur. There were no transfers of other financial assets and financial liabilities between level 1 and level 2 during the three months ended March 20162017 and March 2015. The table2016. See “Level 3 Rollforward” below presentsfor information about transfers between level 2 and level 3.
| | | | |
36 | | Goldman Sachs March 20162017 Form 10-Q | | 35 |
THE GOLDMAN SACHS GROUP, INC. AND SUBSIDIARIES
Notes to Condensed Consolidated Financial Statements
(Unaudited)
Level 3 Rollforward
The table below presents a summary of the changes in fair value for other level 3 financial assets and financial liabilities accounted for at fair value.
| | | | | | | | |
| | | Three Months Ended March | |
| $ in millions | | | 2017 | | | | 2016 | |
Total other financial assets | | | | | | | | |
Beginning balance | | | $ 55 | | | | $ 45 | |
| | |
Net realized gains/(losses) | | | (3 | ) | | | — | |
| | |
Net unrealized gains/(losses) | | | — | | | | (1 | ) |
| | |
Settlements | | | (38 | ) | | | (1 | ) |
Ending balance | | | $ 14 | | | | $ 43 | |
Total other financial liabilities | | | | | | | | |
Beginning balance | | | $(14,979 | ) | | | $(11,244 | ) |
| | |
Net realized gains/(losses) | | | (104 | ) | | | (16 | ) |
| | |
Net unrealized gains/(losses) | | | (344 | ) | | | (86 | ) |
| | |
Purchases | | | (2 | ) | | | (2 | ) |
| | |
Issuances | | | (2,916 | ) | | | (3,573 | ) |
| | |
Settlements | | | 2,406 | | | | 1,504 | |
| | |
Transfers into level 3 | | | (327 | ) | | | (673 | ) |
| | |
Transfers out of level 3 | | | 101 | | | | 440 | |
Ending balance | | | $(16,165 | ) | | | $(13,650 | ) |
In the table above:
Changes in fair value categorized asare presented for all other financial assets and liabilities that are classified in level 3 as of the end of the period. In the table below:
Net unrealized gains/(losses) relate to instruments that were still held at period-end.
If a financial asset or financial liability was transferred to level 3 during a reporting period, its entire gain or loss for the period is includedclassified in level 3. For level 3 other financial assets, increases are shown as positive amounts, while decreases are shown as negative amounts. For level 3 other financial liabilities, increases are shown as negative amounts, while decreases are shown as positive amounts.
Level 3 other financial assets and liabilities are frequently economically hedged with cash instruments and derivatives. Accordingly, gains or losses that are reportedclassified in level 3 can be partially offset by gains or losses attributable to level 1, 2 or 3 cash instruments or derivatives. As a result, gains or losses included in the level 3 rollforward below do not necessarily represent the overall impact on the firm’s results of operations, liquidity or capital resources.
The table below disaggregates, by the condensed consolidated statements of financial condition line items, the information for other financial liabilities included in the summary table above.
| | | | | | | | |
| | | Three Months Ended March | |
| $ in millions | | | 2017 | | | | 2016 | |
Deposits | | | | | | | | |
Beginning balance | | | $(3,173 | ) | | | $(2,215 | ) |
| | |
Net realized gains/(losses) | | | (1 | ) | | | (2 | ) |
| | |
Net unrealized gains/(losses) | | | (28 | ) | | | (103 | ) |
| | |
Issuances | | | (172 | ) | | | (273 | ) |
| | |
Settlements | | | 26 | | | | 8 | |
Ending balance | | | $(3,348 | ) | | | $(2,585 | ) |
Securities sold under agreements to repurchase | |
Beginning balance | | | $ (66 | ) | | | $ (71 | ) |
| | |
Net unrealized gains/(losses) | | | — | | | | (2 | ) |
| | |
Settlements | | | 2 | | | | — | |
Ending balance | | | $ (64 | ) | | | $ (73 | ) |
Other secured financings | | | | | | | | |
Beginning balance | | | $ (557 | ) | | | $ (549 | ) |
| | |
Net realized gains/(losses) | | | 4 | | | | 6 | |
| | |
Net unrealized gains/(losses) | | | (17 | ) | | | (34 | ) |
| | |
Purchases | | | (2 | ) | | | — | |
| | |
Issuances | | | (2 | ) | | | (225 | ) |
| | |
Settlements | | | 92 | | | | 7 | |
| | |
Transfers into level 3 | | | (87 | ) | | | (45 | ) |
| | |
Transfers out of level 3 | | | 1 | | | | 11 | |
Ending balance | | | $ (568 | ) | | | $ (829 | ) |
Unsecured short-term borrowings | | | | | | | | |
Beginning balance | | | $(3,896 | ) | | | $(4,133 | ) |
| | |
Net realized gains/(losses) | | | (86 | ) | | | (16 | ) |
| | |
Net unrealized gains/(losses) | | | (139 | ) | | | 17 | |
| | |
Issuances | | | (1,803 | ) | | | (1,159 | ) |
| | |
Settlements | | | 1,683 | | | | 1,450 | |
| | |
Transfers into level 3 | | | (58 | ) | | | (492 | ) |
| | |
Transfers out of level 3 | | | 55 | | | | 166 | |
Ending balance | | | $(4,244 | ) | | | $(4,167 | ) |
Unsecured long-term borrowings | | | | | | | | |
Beginning balance | | | $(7,225 | ) | | | $(4,224 | ) |
| | |
Net realized gains/(losses) | | | (25 | ) | | | (6 | ) |
| | |
Net unrealized gains/(losses) | | | (158 | ) | | | 36 | |
| | |
Purchases | | | — | | | | (2 | ) |
| | |
Issuances | | | (936 | ) | | | (1,893 | ) |
| | |
Settlements | | | 603 | | | | 39 | |
| | |
Transfers into level 3 | | | (182 | ) | | | (136 | ) |
| | |
Transfers out of level 3 | | | 45 | | | | 263 | |
Ending balance | | | $(7,878 | ) | | | $(5,923 | ) |
Other liabilities and accrued expenses | | | | | | | | |
Beginning balance | | | $ (62 | ) | | | $ (52 | ) |
| | |
Net realized gains/(losses) | | | 4 | | | | 2 | |
| | |
Net unrealized gains/(losses) | | | (2 | ) | | | — | |
| | |
Issuances | | | (3 | ) | | | (23 | ) |
Ending balance | | | $ (63 | ) | | | $ (73 | ) |
| | | | |
| 36 | | Goldman Sachs March 2017 Form 10-Q | | |
THE GOLDMAN SACHS GROUP, INC. AND SUBSIDIARIES
Notes to Condensed Consolidated Financial Statements
(Unaudited)
NetLevel 3 Rollforward Commentary
Three Months Ended March 2017. The net realized and unrealized gains/(losses) relate to instruments that were still held at period-end.
Forlosses on level 3 other financial liabilities of $448 million (reflecting $104 million of net realized losses and $344 million of net unrealized losses) for the three months ended March 2016,2017 include losses of $400 million, $15 million and $2 million reported in “Market making,” “Other principal transactions” and “Interest expense,” respectively, in the condensed consolidated statements of earnings and losses of $31 million reported in “Debt valuation adjustment” in the condensed consolidated statements of comprehensive income.
The net unrealized loss on level 3 other financial liabilities for the three months ended March 2017 primarily reflected losses on certain hybrid financial instruments included in unsecured long-term and short-term borrowings, principally due to an increase in global equity prices and changes in foreign exchange rates.
Transfers into level 3 of other financial liabilities during the three months ended March 2017 primarily reflected transfers of certain hybrid financial instruments included in unsecured long-term borrowings from level 2, principally due to certain unobservable inputs being significant to the valuation of these instruments, and transfers of other secured financings from level 2, principally due to reduced transparency of certain yield inputs used to value these instruments.
Transfers out of level 3 of other financial liabilities during the three months ended March 2017 primarily reflected transfers of certain hybrid financial instruments included in unsecured short-term and long-term borrowings to level 2, principally due to increased transparency of correlation and volatility inputs used to value these instruments.
Three Months Ended March 2016. The net realized and unrealized losses on level 3 other financial liabilities of $102 million (reflecting $16 million of net realized losses and $86 million of net unrealized losses) for the three months ended March 2016 include losses of approximately $150 million, $3 million and $2 million reported in “Market making,” “Other principal transactions” and “Interest expense,” respectively, in the condensed consolidated statements of earnings and gains of $53 million reported in “Debt valuation adjustment” in the condensed consolidated statements of comprehensive income.
For the three months ended March 2015, the net realized and unrealized losses on level 3 other financial liabilities of $247 million (reflecting $20 million of realized losses and $227 million of unrealized losses) include losses of approximately $9 million, $231 million and $7 million reported in “Market making,” “Other principal transactions” and “Interest expense,” respectively.
See “Level 3 Rollforward Commentary” below for an explanation of the net unrealized gains/(losses) on level 3 other financial assets and liabilities and the activity related to transfers into and out of level 3.
| | | | | | | | | | | | | | | | | | | | | | | | | | | | | | | | | | | | | | | | |
| | | Level 3 Other Financial Assets and Liabilities at Fair Value | |
| $ in millions | |
| Balance,
beginning
of period |
| |
| Net
realized
gains/
(losses) |
| |
| Net
unrealized
gains/
(losses) |
| | | Purchases | | | | Sales | | | | Issuances | | | | Settlements | | |
| Transfers
into level 3 |
| |
| Transfers
out of level 3 |
| |
| Balance,
end of period |
|
Three Months Ended March 2016 | | | | | | | | | | | | | | | | | | | | | | | | | | | | | | | | | | | | | | | | |
Receivables from customers and counterparties | | | $ 45 | | | | $ — | | | | $ (1 | ) | | | $ — | | | | $ — | | | | $ — | | | | $ (1 | ) | | | $ — | | | | $ — | | | | $ 43 | |
Total other financial assets | | | $ 45 | | | | $ — | | | | $ (1 | ) | | | $ — | | | | $ — | | | | $ — | | | | $ (1 | ) | | | $ — | | | | $ — | | | | $ 43 | |
Deposits | | | $ (2,215 | ) | | | $ (2 | ) | | | $(103 | ) | | | $ — | | | | $ — | | | | $ (273 | ) | | | $ 8 | | | | $ — | | | | $ — | | | | $ (2,585 | ) |
| | |
Securities sold under agreements to repurchase | | | (71 | ) | | | — | | | | (2 | ) | | | — | | | | — | | | | — | | | | — | | | | — | | | | — | | | | (73 | ) |
| | |
Other secured financings | | | (549 | ) | | | 6 | | | | (34 | ) | | | — | | | | — | | | | (225 | ) | | | 7 | | | | (45 | ) | | | 11 | | | | (829 | ) |
| | |
Unsecured short-term borrowings | | | (4,133 | ) | | | (16 | ) | | | 17 | | | | — | | | | — | | | | (1,159 | ) | | | 1,450 | | | | (492 | ) | | | 166 | | | | (4,167 | ) |
| | |
Unsecured long-term borrowings | | | (4,224 | ) | | | (6 | ) | | | 36 | | | | (2 | ) | | | — | | | | (1,893 | ) | | | 39 | | | | (136 | ) | | | 263 | | | | (5,923 | ) |
| | |
Other liabilities and accrued expenses | | | (52 | ) | | | 2 | | | | — | | | | — | | | | — | | | | (23 | ) | | | — | | | | — | | | | — | | | | (73 | ) |
Total other financial liabilities | | | $(11,244 | ) | | | $(16 | ) | | | $ (86 | ) | | | $ (2 | ) | | | $ — | | | | $(3,573 | ) | | | $1,504 | | | | $ (673 | ) | | | $ 440 | | | | $(13,650 | ) |
Three Months Ended March 2015 | | | | | | | | | | | | | | | | | | | | | | | | | | | | | | | | | | | | | | | | |
Receivables from customers and counterparties | | | $ 56 | | | | $ — | | | | $ (5 | ) | | | $ — | | | | $ — | | | | $ — | | | | $ (20 | ) | | | $ 7 | | | | $ — | | | | $ 38 | |
Total other financial assets | | | $ 56 | | | | $ — | | | | $ (5 | ) | | | $ — | | | | $ — | | | | $ — | | | | $ (20 | ) | | | $ 7 | | | | $ — | | | | $ 38 | |
Deposits | | | $ (1,065 | ) | | | $ (1 | ) | | | $ (21 | ) | | | $ — | | | | $ — | | | | $ (298 | ) | | | $ 35 | | | | $ — | | | | $ — | | | | $ (1,350 | ) |
| | |
Securities sold under agreements to repurchase | | | (124 | ) | | | — | | | | (1 | ) | | | — | | | | — | | | | — | | | | 42 | | | | — | | | | — | | | | (83 | ) |
| | |
Other secured financings | | | (1,091 | ) | | | (7 | ) | | | 13 | | | | — | | | | — | | | | (3 | ) | | | 205 | | | | (185 | ) | | | 2 | | | | (1,066 | ) |
| | |
Unsecured short-term borrowings | | | (3,712 | ) | | | (10 | ) | | | (84 | ) | | | — | | | | — | | | | (875 | ) | | | 800 | | | | (465 | ) | | | 337 | | | | (4,009 | ) |
| | |
Unsecured long-term borrowings | | | (2,585 | ) | | | (1 | ) | | | 28 | | | | — | | | | — | | | | (574 | ) | | | 223 | | | | (209 | ) | | | 215 | | | | (2,903 | ) |
| | |
Other liabilities and accrued expenses | | | (715 | ) | | | (1 | ) | | | (162 | ) | | | — | | | | — | | | | — | | | | — | | | | — | | | | — | | | | (878 | ) |
Total other financial liabilities | | | $ (9,292 | ) | | | $(20 | ) | | | $(227 | ) | | | $ — | | | | $ — | | | | $(1,750 | ) | | | $1,305 | | | | $ (859 | ) | | | $ 554 | | | | $(10,289 | ) |
| | | | |
| | Goldman Sachs March 2016 Form 10-Q | | 37 |
THE GOLDMAN SACHS GROUP, INC. AND SUBSIDIARIES
Notes to Condensed Consolidated Financial Statements
(Unaudited)
Level 3 Rollforward Commentary
Three Months Ended March 2016.The net unrealized loss on level 3 other financial assets and liabilities of $87 million (reflecting $1 million of losses on other financial assets and $86 million of losses on other financial liabilities) for the three months ended March 2016 primarily consisted of losses on certain hybrid financial instruments included in deposits, principally due to the impact of a decrease in interest rates.
Transfers into level 3 of other financial liabilities during the three months ended March 2016 primarily reflected transfers of certain hybrid financial instruments included in unsecured short-term borrowings from level 2, principally due to unobservable inputs becoming significant to the valuation of these instruments, and transfers from level 3 unsecured long-term borrowings to level 3 unsecured short-term borrowings, as these borrowings neared maturity.
Transfers out of level 3 of other financial liabilities during the three months ended March 2016 primarily reflected transfers to level 3 unsecured short-term borrowings from level 3 unsecured long-term borrowings, as these borrowings neared maturity, and transfers of certain other hybrid financial instruments included in unsecured short-term and unsecured long-term borrowings to level 2, principally due to increased transparency of certain correlation and volatility inputs used to value these instruments.
Three Months Ended March 2015. The net unrealized loss on level 3 other financial assets and liabilities of $232 million (reflecting $5 million of losses on other financial assets and $227 million of losses on other financial liabilities) for the three months ended March 2015 primarily consisted of losses on certain subordinated liabilities included in other liabilities and accrued expenses, principally due to changes in the market value of the related underlying investments, and certain hybrid financial instruments included in unsecured short-term borrowings, principally due to an increase in global equity prices.
Transfers into level 3 of other financial liabilities during the three months ended March 2015 primarily reflected transfers of certain hybrid financial instruments included in unsecured short-term and long-term borrowings from level 2, principally due to decreased transparency of certain correlation and volatility inputs used to value these instruments, transfers of certain other hybrid financial instruments included in unsecured long-term borrowings, principally due to unobservable inputs being significant to the valuation of these instruments, and transfers from level 3 unsecured long-term borrowings to level 3 unsecured short-term borrowings, as these borrowings neared maturity.
Transfers out of level 3 of other financial liabilities during the three months ended March 2015 primarily reflected transfers of certain hybrid financial instruments included in unsecured short-term and long-term borrowings to level 2, principally due to increased transparency of certain correlation and volatility inputs used to value these instruments and transfers to level 3 unsecured short-term borrowings from level 3 unsecured long-term borrowings, as these borrowings neared maturity.
| | | | |
38 | | Goldman Sachs March 2016 Form 10-Q | | |
THE GOLDMAN SACHS GROUP, INC. AND SUBSIDIARIES
Notes to Condensed Consolidated Financial Statements
(Unaudited)
Gains and Losses on Financial Assets and Financial Liabilities Accounted for at Fair Value Under the Fair Value Option
The table below presents the gains and losses recognized in earnings as a result of the firm electing to apply the fair value option to certain financial assets and financial liabilities. These gains and losses
| | | | | | | | |
| | | Three Months Ended March | |
| $ in millions | | | 2017 | | | | 2016 | |
Unsecured short-term borrowings | | | $(861 | ) | | | $ 198 | |
| | |
Unsecured long-term borrowings | | | (189 | ) | | | (422 | ) |
| | |
Other liabilities and accrued expenses | | | 187 | | | | (28 | ) |
| | |
Other | | | (104 | ) | | | (462 | ) |
Total | | | $(967 | ) | | | $(714 | ) |
| | | | |
| | Goldman Sachs March 2017 Form 10-Q | | 37 |
THE GOLDMAN SACHS GROUP, INC. AND SUBSIDIARIES
Notes to Condensed Consolidated Financial Statements
(Unaudited)
In the table above:
Gains/(losses) are included in “Market making” and “Other principal transactions.” The table below also includes gains and losses on the embedded derivative component of hybrid financial instruments included in unsecured short-term borrowings, unsecured long-term borrowings and deposits. These gains and losses would have been recognized under other U.S. GAAP even if the firm had not elected to account for the entire hybrid financial instrument at fair value.
| | | | | | | | |
| | | Three Months Ended March | |
| $ in millions | | | 2016 | | | | 2015 | |
Unsecured short-term borrowings | | | $ 198 | | | | $ (705 | ) |
| | |
Unsecured long-term borrowings | | | (422 | ) | | | (66 | ) |
| | |
Other liabilities and accrued expenses | | | (28 | ) | | | (164 | ) |
| | |
Other | | | (462 | ) | | | (224 | ) |
Total | | | $(714 | ) | | | $(1,159 | ) |
In the table above:
Gains/(losses) exclude contractual interest, which is included in “Interest income” and “Interest expense,” for all instruments other than hybrid financial instruments. See Note 23 for further information about interest income and interest expense.
Unsecured short-term borrowings and unsecured long-term borrowings include gains/(losses) on the embedded derivative component of hybrid financial instruments. These gains and losses would have been recognized under other U.S. GAAP even if the firm had not elected to account for the entire hybrid financial instrument at fair value.
Unsecured short-term borrowings includes gains/(losses) on the embedded derivative component of hybrid financial instruments of $205$(860) million and $(695)$205 million for the three months ended March 20162017 and March 2015,2016, respectively.
Unsecured long-term borrowings includes lossesgains/(losses) on the embedded derivative component of hybrid financial instruments of $338$(144) million and $33$(338) million for the three months ended March 20162017 and March 2015,2016, respectively.
Other liabilities and accrued expenses includes gains/(losses) on certain subordinated liabilities issued byof consolidated VIEs.
Substantially all of Other primarily consists of gains/(losses) on receivables from customers and counterparties, deposits and other secured financings.
Excluding the gains and losses on the instruments accounted for under the fair value option described above, “Market making” and “Other principal transactions” primarily represent gains and losses on “Financial instruments owned, at fair value” and “Financial instruments sold, but not yet purchased, at fair value.”
Loans and Lending Commitments
The table below presents the difference between the aggregate fair value and the aggregate contractual principal amount for loans and long-term receivables for which the fair value option was elected.
| | | | | | | | |
| | | As of | |
| $ in millions | |
| March
2017 |
| |
| December
2016 |
|
Performing loans and long-term receivables | | | | | | | | |
Aggregate contractual principal in excess of fair value | | | $ 762 | | | | $ 478 | |
| | |
Loans on nonaccrual status and/or more than 90 days past due | |
Aggregate contractual principal in excess of fair value | | | $5,239 | | | | $8,101 | |
| | |
Aggregate fair value of loans on nonaccrual status and/or more than 90 days past due | | | $2,131 | | | | $2,138 | |
In the table below,above, the aggregate contractual principal amount of loans on nonaccrualnon-accrual status and/or more than 90 days past due (which excludes loans carried at zero fair value and considered uncollectible) exceeds the related fair value primarily because the firm regularly purchases loans, such as distressed loans, at values significantly below the contractual principal amounts.
| | | | | | | | |
| | | As of | |
| $ in millions | |
| March
2016 |
| |
| December
2015 |
|
Performing loans and long-term receivables | | | | | | | | |
Aggregate contractual principal in excess of the related fair value | | | $1,215 | | | | $1,330 | |
| | |
Loans on nonaccrual status and/or more than 90 days past due | | | | | | | | |
Aggregate contractual principal in excess of the related fair value (excluding loans carried at zero fair value and considered uncollectible) | | | 8,981 | | | | 9,600 | |
| | |
Aggregate fair value of loans on nonaccrual status and/or more than 90 days past due | | | 2,434 | | | | 2,391 | |
As of March 20162017 and December 2015,2016, the fair value of unfunded lending commitments for which the fair value option was elected was a liability of $178$51 million and $211$80 million, respectively, and the related total contractual amount of these lending commitments was $11.58$6.91 billion and $14.01$7.19 billion, respectively. See Note 18 for further information about lending commitments.
| | | | |
| | Goldman Sachs March 2016 Form 10-Q | | 39 |
THE GOLDMAN SACHS GROUP, INC. AND SUBSIDIARIES
Notes to Condensed Consolidated Financial Statements
(Unaudited)
Long-Term Debt Instruments
The aggregate contractual principal amount of long-term other secured financings for which the fair value option was elected exceeded the related fair value by $618$177 million and $362$361 million as of March 20162017 and December 2015,2016, respectively. The aggregate contractual principal amount of unsecured long-term borrowings for which the fair value option was elected exceeded the related fair value by $488 million$1.44 billion and $1.12$1.56 billion as of March 20162017 and December 2015,2016, respectively. The amounts above include both principalprincipal- and non-principal-protected long-term borrowings.
| | | | |
| 38 | | Goldman Sachs March 2017 Form 10-Q | | |
THE GOLDMAN SACHS GROUP, INC. AND SUBSIDIARIES
Notes to Condensed Consolidated Financial Statements
(Unaudited)
Impact of Credit Spreads on Loans and Lending Commitments
The estimated net gain attributable to changes in instrument-specific credit spreads on loans and lending commitments for which the fair value option was elected was $51$64 million and $375$51 million for the three months ended March 20162017 and March 2015,2016, respectively. The firm generally calculates the fair value of loans and lending commitments for which the fair value option is elected by discounting future cash flows at a rate which incorporates the instrument-specific credit spreads. For floating-rate loans and lending commitments, substantially all changes in fair value are attributable to changes in instrument-specific credit spreads, whereas for fixed-rate loans and lending commitments, changes in fair value are also attributable to changes in interest rates.
Debt Valuation Adjustment
The firm calculates the fair value of financial liabilities for which the fair value option is elected by discounting future cash flows at a rate which incorporates the firm’s credit spreads. The net DVA on such financial liabilities was a loss of $213 million ($139 million, net of tax) and $24 million ($12 million, net of tax) for the three months ended March 2017 and March 2016, respectively, and was included in “Debt valuation adjustment” in the condensed consolidated statements of comprehensive income. The gains/(losses) reclassified to earnings from accumulated other comprehensive loss upon extinguishment of such financial liabilities were not material for the three months ended March 2017 and March 2016.
Note 9.
Loans Receivable
Loans receivable is comprised of loans held for investment that are accounted for at amortized cost net of allowance for loan losses. Interest on loans receivable is recognized over the life of the loan and is recorded on an accrual basis.
The table below presents details about loans receivable.
| | | | As of | | | As of | |
| $ in millions | |
| March
2016 |
| |
| December
2015 |
| |
| March
2017 |
| |
| December
2016 |
|
Corporate loans | | | $23,096 | | | | $20,740 | | | | $25,151 | | | | $24,837 | |
| | | | | |
Loans to private wealth management clients | | | 14,183 | | | | 13,961 | | | | 13,156 | | | | 13,828 | |
| | | | | |
Loans backed by commercial real estate | | | 5,013 | | | | 5,271 | | | | 5,011 | | | | 4,761 | |
| | | | | |
Loans backed by residential real estate | | | 2,238 | | | | 2,316 | | | | 3,867 | | | | 3,865 | |
| | | | | |
Other loans | | | 3,883 | | | | 3,533 | | | | 3,742 | | | | 2,890 | |
Total loans receivable, gross | | | 48,413 | | | | 45,821 | | | | 50,927 | | | | 50,181 | |
| | | | | |
Allowance for loan losses | | | (489 | ) | | | (414 | ) | | | (542 | ) | | | (509 | ) |
Total loans receivable | | | $47,924 | | | | $45,407 | | | | $50,385 | | | | $49,672 | |
As of March 20162017 and December 2015,2016, the fair value of loans receivable was $47.61$50.65 billion and $45.19$49.80 billion, respectively. As of March 2017, had these loans been carried at fair value and included in the fair value hierarchy, $28.42 billion and $22.23 billion would have been classified in level 2 and level 3, respectively. As of December 2016, had these loans been carried at fair value and included in the fair value hierarchy, $23.11$28.40 billion and $24.50 billion would have been classified in level 2 and level 3, respectively. As of December 2015, had these loans been carried at fair value and included in the fair value hierarchy, $23.91 billion and $21.28$21.40 billion would have been classified in level 2 and level 3, respectively.
The firm also extends lending commitments that are held for investment and accounted for on an accrual basis. As of March 20162017 and December 2015,2016, such lending commitments were $90.83$100.79 billion and $93.92$98.05 billion, respectively, substantiallyrespectively. Substantially all of whichthese commitments were extended to corporate borrowers.borrowers and were primarily related to the firm’s relationship lending activities. The carrying value and the estimated fair value of such lending commitments were liabilities of $306$363 million and $3.22$2.34 billion, respectively, as of March 2016,2017, and $291$327 million and $3.32$2.55 billion, respectively, as of December 2015.2016. As of March 2017, had these lending commitments been carried at fair value and included in the fair value hierarchy, $871 million and $1.47 billion would have been classified in level 2 and level 3, respectively. As of December 2016, had these lending commitments been carried at fair value and included in the fair value hierarchy, $1.36$1.10 billion and $1.86 billion would have been classified in level 2 and level 3, respectively. As of December 2015, had these lending commitments been carried at fair value and included in the fair value hierarchy, $1.35 billion and $1.97$1.45 billion would have been classified in level 2 and level 3, respectively.
| | | | |
40 | | Goldman Sachs March 20162017 Form 10-Q | | 39 |
THE GOLDMAN SACHS GROUP, INC. AND SUBSIDIARIES
Notes to Condensed Consolidated Financial Statements
(Unaudited)
The following is a description of the captions in the table above:
Corporate Loans. Corporate loans include term loans, revolving lines of credit, letter of credit facilities and bridge loans, and are principally used for operating liquidity and general corporate purposes, or in connection with acquisitions. Corporate loans may be secured or unsecured, depending on the loan purpose, the risk profile of the borrower and other factors. Loans receivable related to the firm’s relationship lending activities are reported within corporate loans.
Loans to Private Wealth Management Clients. Loans to the firm’s private wealth management clients include loans used by clients to finance private asset purchases, employ leverage for strategic investments in real or financial assets, bridge cash flow timing gaps or provide liquidity for other needs. Such loans are primarily secured by securities or other assets.
Loans Backed by Commercial Real Estate. Loans backed by commercial real estate include loans extended by the firm that are directly or indirectly secured by hotels, retail stores, multifamily housing complexes and commercial and industrial properties. Loans backed by commercial real estate also include loans purchased by the firm.
Loans Backed by Residential Real Estate. Loans backed by residential real estate include loans extended by the firm to clients who warehouse assets that are directly or indirectly secured by residential real estate. Loans backed by residential real estate also include loans purchased by the firm.
Other Loans. Other loans primarily include loans extended to clients who warehouse assets that are directly or indirectly secured by consumer loans, including auto loans, and private student loans and other assets. Other loans also includes unsecured loans to individuals made through the firm’s online platform.
Loans receivable includes Purchased Credit Impaired (PCI) loans. PCI loans represent acquired loans or pools of loans with evidence of credit deterioration subsequent to their origination and where it is probable, at acquisition, that the firm will not be able to collect all contractually required payments. Loans acquired within the same reporting period, which have at least two common risk characteristics, one of which relates to their credit risk, are eligible to be pooled together and considered a single unit of account. PCI loans are initially recorded at acquisition price and the difference between the acquisition price and the expected cash flows (accretable yield) is recognized as interest income over the life of such loans or pools of loans on an effective yield method. Expected cash flows on PCI loans are determined using various inputs and assumptions, including default rates, loss severities, recoveries, amount and timing of prepayments and other macroeconomic indicators.
As of March 2016,2017, the gross carrying value of PCI loans was $2.31$4.03 billion (including $1.16$1.40 billion, $1.13$2.61 billion and $25$16 million related to loans backed by commercial real estate, loans backed by residential real estate and other consumer loans, respectively). The outstanding principal balance and accretable yield related to such loans was $5.91$8.57 billion and $274$552 million, respectively, as of March 2016.2017. At the time of acquisition, the fair value, related expected cash flows, and the contractually required cash flows of PCI loans acquired during the three months ended March 2016 was $2142017 were $262 million, $253$296 million and $526$632 million, respectively. As of December 2015,2016, the gross carrying value of PCI loans was $2.12$3.97 billion (including $1.16$1.44 billion, $941 million$2.51 billion and $23$18 million related to loans backed by commercial real estate, loans backed by residential real estate and other consumer loans, respectively). The outstanding principal balance and accretable yield related to such loans was $5.54$8.52 billion and $234$526 million, respectively, as of December 2015.2016. At the time of acquisition, the fair value, related expected cash flows, and the contractually required cash flows of PCI loans acquired during the three months ended March 2016 were $214 million, $253 million and $526 million, respectively.
| | | | |
| 40 | | Goldman Sachs March 20162017 Form 10-Q | | 41 |
THE GOLDMAN SACHS GROUP, INC. AND SUBSIDIARIES
Notes to Condensed Consolidated Financial Statements
(Unaudited)
Credit Quality
The firm’s risk assessment process includes evaluating the credit quality of its loans receivable. For loans receivable (excluding PCI loans), the firm performs credit reviews which include initial and ongoing analyses of its borrowers. A credit review is an independent analysis of the capacity and willingness of a borrower to meet its financial obligations, resulting in an internal credit rating. The determination of internal credit ratings also incorporates assumptions with respect to the nature of and outlook for the borrower’s industry, and the economic environment. The firm also assigns a regulatory risk rating to such loans based on the definitions provided by the U.S. federal bank regulatory agencies.
The table below presents gross loans receivable (excluding PCI loans of $4.03 billion and $3.97 billion as of March 2017 and December 2016, respectively, which are not assigned a credit rating equivalent) and related lending commitments by the firm’s internally determined public rating agency equivalent and by regulatory risk rating.
| | | | | | | | | | | | |
| $ in millions | | | Loans | | |
| Lending
Commitments |
| | | Total | |
Credit Rating Equivalent | | | | | | | | | | | | |
As of March 2017 | | | | | | | | | | | | |
Investment-grade | | | $18,667 | | | | $ 72,777 | | | | $ 91,444 | |
| | |
Non-investment-grade | | | 28,236 | | | | 28,017 | | | | 56,253 | |
Total | | | $46,903 | | | | $100,794 | | | | $147,697 | |
As of December 2016 | | | | | | | | | | | | |
Investment-grade | | | $18,434 | | | | $ 72,323 | | | | $ 90,757 | |
| | |
Non-investment-grade | | | 27,777 | | | | 25,722 | | | | 53,499 | |
Total | | | $46,211 | | | | $ 98,045 | | | | $144,256 | |
Regulatory Risk Rating | | | | | | | | | | | | |
As of March 2017 | | | | | | | | | | | | |
Non-criticized/pass | | | $43,600 | | | | $ 97,205 | | | | $140,805 | |
| | |
Criticized | | | 3,303 | | | | 3,589 | | | | 6,892 | |
Total | | | $46,903 | | | | $100,794 | | | | $147,697 | |
As of December 2016 | | | | | | | | | | | | |
Non-criticized/pass | | | $43,146 | | | | $ 94,966 | | | | $138,112 | |
| | |
Criticized | | | 3,065 | | | | 3,079 | | | | 6,144 | |
Total | | | $46,211 | | | | $ 98,045 | | | | $144,256 | |
In the table above, non-criticized/pass loans and lending commitments represent loans and lending commitments that are performing and/or do not demonstrate adverse characteristics that are likely to result in a credit loss.
The firm enters into economic hedges to mitigate credit risk on certain loans receivable and commercial lending commitments (both of which are held for investment) related to the firm’s relationship lending activities. Such loanshedges are accounted for at fair value. See Note 18 for further information about commercial lending commitments and associated hedges.
Loans receivable (excluding PCI loans) are determined to be impaired when it is probable that the firm will not be able to collect all principal and interest due under the contractual terms of the loan. At that time, loans are generally placed on non-accrual status and all accrued but uncollected interest is reversed against interest income, and interest subsequently collected is recognized on a cash basis to the extent the loan balance is deemed collectible. Otherwise, all cash received is used to reduce the outstanding loan balance. In certain circumstances, the firm may also modify the original terms of a loan agreement by granting a concession to a borrower experiencing financial difficulty. Such modifications are considered troubled debt restructurings and typically include interest rate reductions, payment extensions, and modification of loan covenants. Loans modified in a troubled debt restructuring are considered impaired and are subject to specific loan-level reserves.
As of March 20162017 and December 2015,2016, the gross carrying value of impaired loans receivable (excluding PCI loans) inon non-accrual status were $440was $630 million and $223$404 million, respectively. As of March 2017 and December 2016, such loans included $176 million and $142 million, respectively, of corporate loans that were modified in a troubled debt restructuring. The firm’s lending commitments related to these loans were $156 million and $144 million, as of March 2017 and December 2016, respectively.
For PCI loans, the firm’s risk assessment process includes reviewing certain key metrics, such as delinquency status, collateral values, credit scores and other risk factors. When it is determined that the firm cannot reasonably estimate expected cash flows on the PCI loans or pools of loans, such loans are placed on non-accrual status.
The table below presents gross loans receivable (excluding PCI loans of $2.31 billion and $2.12 billion as of March 2016 and December 2015, respectively, which are not assigned a credit rating equivalent) and related lending commitments by the firm’s internally determined public rating agency equivalent and by regulatory risk rating. Non-criticized/pass loans and lending commitments represent loans and lending commitments that are performing and/or do not demonstrate adverse characteristics that are likely to result in a credit loss.
| | | | | | | | | | | | |
| $ in millions | | | Loans | | |
| Lending
Commitments |
| | | Total | |
Credit Rating Equivalent As of March 2016 | | | | | | | | | | | | |
Investment-grade | | | $20,100 | | | | $63,119 | | | | $ 83,219 | |
| | |
Non-investment-grade | | | 26,002 | | | | 27,706 | | | | 53,708 | |
Total | | | $46,102 | | | | $90,825 | | | | $136,927 | |
As of December 2015 | | | | | | | | | | | | |
Investment-grade | | | $19,459 | | | | $64,898 | | | | $ 84,357 | |
| | |
Non-investment-grade | | | 24,241 | | | | 29,021 | | | | 53,262 | |
Total | | | $43,700 | | | | $93,919 | | | | $137,619 | |
Regulatory Risk Rating As of March 2016 | | | | | | | | | | | | |
Non-criticized/pass | | | $43,568 | | | | $88,065 | | | | $131,633 | |
| | |
Criticized | | | 2,534 | | | | 2,760 | | | | 5,294 | |
Total | | | $46,102 | | | | $90,825 | | | | $136,927 | |
As of December 2015 | | | | | | | | | | | | |
Non-criticized/pass | | | $40,967 | | | | $92,021 | | | | $132,988 | |
| | |
Criticized | | | 2,733 | | | | 1,898 | | | | 4,631 | |
Total | | | $43,700 | | | | $93,919 | | | | $137,619 | |
| | | | |
42 | | Goldman Sachs March 20162017 Form 10-Q | | 41 |
THE GOLDMAN SACHS GROUP, INC. AND SUBSIDIARIES
Notes to Condensed Consolidated Financial Statements
(Unaudited)
| | | | |
Allowance for Losses on Loans and Lending Commitments | | | | |
The firm’s allowance for loan losses is comprised of specific loan-level reserves, portfolio level reserves, and reserves on PCI loans as described below:
Specific loan-level reserves are determined on loans (excluding PCI loans) that exhibit credit quality weakness and are therefore individually evaluated for impairment.
Portfolio level reserves are determined on loans (excluding PCI loans) not deemed impaired by aggregating groups of loans with similar risk characteristics and estimating the probable loss inherent in the portfolio.
Reserves on PCI loans are recorded when it is determined that the expected cash flows, which are reassessed on a quarterly basis, will be lower than those used to establish the current effective yield for such loans or pools of loans. If the expected cash flows are determined to be significantly higher than those used to establish the current effective yield, such increases are initially recognized as a reduction to any previously recorded allowances for loan losses and any remaining increases are recognized as interest income prospectively over the life of the loan or pools of loans as an increase to the effective yield.
The allowance for loan losses is determined using various inputs, including industry default and loss data, current macroeconomic indicators, borrower’s capacity to meet its financial obligations, borrower’s country of risk, loan seniority and collateral type. Management’s estimate of loan losses entails judgment about loan collectability at the reporting dates, and there are uncertainties inherent in those judgments. While management uses the best information available to determine this estimate, future adjustments to the allowance may be necessary based on, among other things, changes in the economic environment or variances between actual results and the original assumptions used. Loans are charged off against the allowance for loan losses when deemed to be uncollectible. As of March 20162017 and December 2015,2016, substantially all of the firm’s loans receivable were evaluated for impairment at the portfolio level.
The firm also records an allowance for losses on lending commitments that are held for investment and accounted for on an accrual basis. Such allowance is determined using the same methodology as the allowance for loan losses, while also taking into consideration the probability of drawdowns or funding, and is included in “Other liabilities and accrued expenses” in the condensed consolidated statements of financial condition.expenses.” As of March 20162017 and December 2015,2016, substantially all of such lending commitments were evaluated for impairment at the portfolio level.
The table below presents changes in the allowance for loan losses and the allowance for losses on lending commitments.
| | | | | | | | |
| $ in millions | |
| Three Months Ended
March 2017 |
| |
| Year Ended
December 2016 |
|
Allowance for loan losses | | | | | | | | |
Beginning balance | | | $509 | | | | $414 | |
| | |
Charge-offs | | | (11 | ) | | | (8 | ) |
| | |
Provision | | | 52 | | | | 138 | |
| | |
Other | | | (8 | ) | | | (35 | ) |
Ending balance | | | $542 | | | | $509 | |
Allowance for losses on lending commitments | |
Beginning balance | | | $212 | | | | $188 | |
| | |
Provision | | | 36 | | | | 44 | |
| | |
Other | | | — | | | | (20 | ) |
Ending balance | | | $248 | | | | $212 | |
In the table below, “Other”above:
The provision for losses on loans and lending commitments is included in “Other principal transactions,” and was primarily related to corporate loans and corporate lending commitments.
Other represents the reduction to the allowance related to loans and lending commitments transferred to held for sale.
| | | | | | | | |
| $ in millions | |
| Three Months Ended
March 2016 |
| |
| Year Ended
December 2015 |
|
Allowance for loan losses | | | | | | | | |
Balance, beginning of period | | | $414 | | | | $228 | |
| | |
Charge-offs | | | — | | | | (1 | ) |
| | |
Provision for loan losses | | | 99 | | | | 187 | |
| | |
Other | | | (24 | ) | | | — | |
Balance, end of period | | | $489 | | | | $414 | |
Allowance for losses on lending commitments | |
Balance, beginning of period | | | $188 | | | | $ 86 | |
| | |
Provision for losses on lending commitments | | | 37 | | | | 102 | |
| | |
Other | | | (12 | ) | | | — | |
Balance, end of period | | | $213 | | | | $188 | |
The provision for losses on loans and lending commitments is included in “Other principal transactions” in the condensed consolidated statements of earnings. As of March 20162017 and December 2015,2016, substantially all of the allowance for loan losses and allowance for losses on lending commitments were related to corporate loans and corporate lending commitments and were primarily determined at the portfolio level.
The firm did not have anyfirm’s allowance for losses on PCI loans as of March 20162017 and December 2015.2016 was not material.
| | | | |
| 42 | | Goldman Sachs March 20162017 Form 10-Q | | 43 |
THE GOLDMAN SACHS GROUP, INC. AND SUBSIDIARIES
Notes to Condensed Consolidated Financial Statements
(Unaudited)
Note 10.
Collateralized Agreements and Financings
Collateralized agreements are securities purchased under agreements to resell (resale agreements) and securities borrowed. Collateralized financings are securities sold under agreements to repurchase (repurchase agreements), securities loaned and other secured financings. The firm enters into these transactions in order to, among other things, facilitate client activities, invest excess cash, acquire securities to cover short positions and finance certain firm activities.
Collateralized agreements and financings are presented on a net-by-counterparty basis when a legal right of setoff exists. Interest on collateralized agreements and collateralized financings is recognized over the life of the transaction and included in “Interest income” and “Interest expense,” respectively. See Note 23 for further information about interest income and interest expense.
The table below presents the carrying value of resale and repurchase agreements and securities borrowed and loaned transactions.
| | | | As of | | | As of | |
| $ in millions | |
| March
2016 |
| |
| December
2015 |
| |
| March
2017 |
| |
| December
2016 |
|
Securities purchased under agreements to resell | | | $128,513 | | | | $120,905 | | | | $117,278 | | | $116,925 | |
| | | | | |
Securities borrowed | | | 180,603 | | | | 172,099 | | | | $187,446 | | | $184,600 | |
| | | | | |
Securities sold under agreements to repurchase | | | 77,617 | | | | 86,069 | | | | $ 88,533 | | | $ 71,816 | |
| | | | | |
Securities loaned | | | 4,427 | | | | 3,614 | | | | $ 9,698 | | | $ 7,524 | |
In the table above:
Substantially all resale agreements and all repurchase agreements are carried at fair value under the fair value option. See Note 8 for further information about the valuation techniques and significant inputs used to determine fair value.
As of March 20162017 and December 2015, $66.212016, $79.89 billion and $69.80$82.40 billion of securities borrowed, and $972 million$4.40 billion and $466 million$2.65 billion of securities loaned were at fair value, respectively.
Resale and Repurchase Agreements
A resale agreement is a transaction in which the firm purchases financial instruments from a seller, typically in exchange for cash, and simultaneously enters into an agreement to resell the same or substantially the same financial instruments to the seller at a stated price plus accrued interest at a future date.
A repurchase agreement is a transaction in which the firm sells financial instruments to a buyer, typically in exchange for cash, and simultaneously enters into an agreement to repurchase the same or substantially the same financial instruments from the buyer at a stated price plus accrued interest at a future date.
Even though repurchase and resale agreements (including “repos- and reverses-to-maturity”) involve the legal transfer of ownership of financial instruments, they are accounted for as financing arrangements because they require the financial instruments to be repurchased or resold before or at the maturity of the agreement. The financial instruments purchased or sold in resale and repurchase agreements typically include U.S. government and federal agency, and investment-grade sovereign obligations.
The firm receives financial instruments purchased under resale agreements and makes delivery of financial instruments sold under repurchase agreements. To mitigate credit exposure, the firm monitors the market value of these financial instruments on a daily basis, and delivers or obtains additional collateral due to changes in the market value of the financial instruments, as appropriate. For resale agreements, the firm typically requires collateral with a fair value approximately equal to the carrying value of the relevant assets in the condensed consolidated statements of financial condition.
| | | | |
44 | | Goldman Sachs March 20162017 Form 10-Q | | 43 |
THE GOLDMAN SACHS GROUP, INC. AND SUBSIDIARIES
Notes to Condensed Consolidated Financial Statements
(Unaudited)
Securities Borrowed and Loaned Transactions
In a securities borrowed transaction, the firm borrows securities from a counterparty in exchange for cash or securities. When the firm returns the securities, the counterparty returns the cash or securities. Interest is generally paid periodically over the life of the transaction.
In a securities loaned transaction, the firm lends securities to a counterparty in exchange for cash or securities. When the counterparty returns the securities, the firm returns the cash or securities posted as collateral. Interest is generally paid periodically over the life of the transaction.
The firm receives securities borrowed and makes delivery of securities loaned. To mitigate credit exposure, the firm monitors the market value of these securities on a daily basis, and delivers or obtains additional collateral due to changes in the market value of the securities, as appropriate. For securities borrowed transactions, the firm typically requires collateral with a fair value approximately equal to the carrying value of the securities borrowed transaction.
Securities borrowed and loaned within Fixed Income, Currency and CommoditiesFICC Client Execution are recorded at fair value under the fair value option. See Note 8 for further information about securities borrowed and loaned accounted for at fair value.
Securities borrowed and loaned within Securities Services are recorded based on the amount of cash collateral advanced or received plus accrued interest. As these arrangementsagreements generally can be terminated on demand, they exhibit little, if any, sensitivity to changes in interest rates. Therefore, the carrying value of such arrangementsagreements approximates fair value. While these arrangementsagreements are carried at amounts that approximate fair value, they are not accounted for at fair value under the fair value option or at fair value in accordance with other U.S. GAAP and therefore are not included in the firm’s fair value hierarchy in Notes 6 through 8. Had these arrangementsagreements been included in the firm’s fair value hierarchy, they would have been classified in level 2 as of March 20162017 and December 2015.2016.
Offsetting Arrangements
The table below presents the gross and net resale and repurchase agreements and securities borrowed and loaned transactions, and the related amount of counterparty netting included in the condensed consolidated statements of financial condition. The tables below also presentcondition as well as the amounts of counterparty netting and cash and securities collateral, not offset in the condensed consolidated statements of financial condition, including counterparty netting that does not meet the criteria for netting under U.S. GAAP and the fair value of cash or securities collateral received or posted subject to enforceable credit support agreements.condition.
| | | | | | | | | | | | | | | | | | |
| | | Assets | | | | | Liabilities | |
| $ in millions | |
| Resale
agreements |
| |
| Securities
borrowed |
| | | |
| Repurchase
agreements |
| |
| Securities
loaned |
|
As of March 2016 | | | | | | | | | | | | | | | | | | |
Amounts included in the
condensed consolidated statements of financial
condition | | | | | | | | | | | | | | | |
Gross carrying value | | | $ 185,335 | | | | $ 191,397 | | | | | | $118,919 | | | | $ 8,917 | |
| | |
Counterparty netting | | | (41,302 | ) | | | (4,490 | ) | | | | | (41,302 | ) | | | (4,490 | ) |
Total | | | 144,033 | 1 | | | 186,907 | 1 | | | | | 77,617 | | | | 4,427 | |
Amounts not offset in the
condensed consolidated
statements of financial
condition | | | | | | | | | | | | | | | |
Counterparty netting | | | (6,124 | ) | | | (1,493 | ) | | | | | (6,124 | ) | | | (1,493 | ) |
| | |
Collateral | | | (136,339 | ) | | | (176,455 | ) | | | | | (70,161 | ) | | | (2,674 | ) |
Total | | | $ 1,570 | | | | $ 8,959 | | | | | | $ 1,332 | | | | $ 260 | |
| | | | | |
As of December 2015 | | | | | | | | | | | | | | | | | | |
Amounts included in the
condensed consolidated
statements of financial
condition | | | | | | | | | | | | | | | |
Gross carrying value | | | $ 163,199 | | | | $ 180,203 | | | | | | $114,960 | | | | $ 6,179 | |
| | |
Counterparty netting | | | (28,891 | ) | | | (2,565 | ) | | | | | (28,891 | ) | | | (2,565 | ) |
Total | | | 134,308 | 1 | | | 177,638 | 1 | | | | | 86,069 | | | | 3,614 | |
Amounts not offset in the
condensed consolidated
statements of financial
condition | | | | | | | | | | | | | | | |
Counterparty netting | | | (4,979 | ) | | | (1,732 | ) | | | | | (4,979 | ) | | | (1,732 | ) |
| | |
Collateral | | | (125,561 | ) | | | (167,061 | ) | | | | | (78,958 | ) | | | (1,721 | ) |
Total | | | $ 3,768 | | | | $ 8,845 | | | | | | $ 2,132 | | | | $ 161 | |
1. | As of March 2016 and December 2015, the firm had $15.52 billion and $13.40 billion, respectively, of securities received under resale agreements, and $6.30 billion and $5.54 billion, respectively, of securities borrowed transactions that were segregated to satisfy certain regulatory requirements. These securities are included in “Cash and securities segregated for regulatory and other purposes.”
|
| | | | | | | | | | | | | | | | | | |
| | | Assets | | | | | Liabilities | |
$ in millions | |
| Resale
agreements |
| |
| Securities
borrowed |
| | | |
| Repurchase
agreements |
| |
| Securities
loaned |
|
As of March 2017 | | | | | | | | | | | | | | | | | | |
Included in the condensed consolidated statements of financial condition | |
Gross carrying value | | | $ 172,342 | | | | $ 193,253 | | | | | | $143,597 | | | | $15,505 | |
| | |
Counterparty netting | | | (55,064 | ) | | | (5,807 | ) | | | | | (55,064 | ) | | | (5,807 | ) |
Total | | | 117,278 | | | | 187,446 | | | | | | 88,533 | | | | 9,698 | |
Amounts not offset | | | | | | | | | | | | | | | | | | |
Counterparty netting | | | (16,808 | ) | | | (3,894 | ) | | | | | (16,808 | ) | | | (3,894 | ) |
| | |
Collateral | | | (99,100 | ) | | | (170,184 | ) | | | | | (70,079 | ) | | | (5,348 | ) |
Total | | | $ 1,370 | | | | $ 13,368 | | | | | | $ 1,646 | | | | $ 456 | |
As of December 2016 | | | | | | | | | | | | | | | | | | |
Included in the condensed consolidated statements of financial condition | |
Gross carrying value | | | $ 173,561 | | | | $ 189,571 | | | | | | $128,452 | | | | $12,495 | |
| | |
Counterparty netting | | | (56,636 | ) | | | (4,971 | ) | | | | | (56,636 | ) | | | (4,971 | ) |
Total | | | 116,925 | | | | 184,600 | | | | | | 71,816 | | | | 7,524 | |
Amounts not offset | | | | | | | | | | | | | | | | | | |
Counterparty netting | | | (8,319 | ) | | | (4,045 | ) | | | | | (8,319 | ) | | | (4,045 | ) |
| | |
Collateral | | | (107,148 | ) | | | (170,625 | ) | | | | | (62,081 | ) | | | (3,087 | ) |
Total | | | $ 1,458 | | | | $ 9,930 | | | | | | $ 1,416 | | | | $ 392 | |
In the table above:
Substantially all of the gross carrying values of these arrangements are subject to enforceable netting agreements.
Where the firm has received or posted collateral under credit support agreements, but has not yet determined such agreements are enforceable, the related collateral has not been netted.
Amounts not offset includes counterparty netting that does not meet the criteria for netting under U.S. GAAP and the fair value of cash or securities collateral received or posted subject to enforceable credit support agreements.
| | | | |
| 44 | | Goldman Sachs March 20162017 Form 10-Q | | 45 |
THE GOLDMAN SACHS GROUP, INC. AND SUBSIDIARIES
Notes to Condensed Consolidated Financial Statements
(Unaudited)
Gross Carrying Value of Repurchase Agreements and Securities Loaned
The table below presents the gross carrying value of repurchase agreements and securities loaned by class of collateral pledged.
| | $ in millions | |
| Repurchase
agreements |
| |
| Securities
loaned |
| |
| Repurchase
agreements |
| |
| Securities
loaned |
|
As of March 2016 | | | | | |
Commercial paper, certificates of deposit, time deposits and other money market instruments | | | $ 472 | | | | $ — | | |
As of March 2017 | | | | | |
Money market instruments | | | | $ 529 | | | | $ — | |
| | | | | |
U.S. government and federal agency obligations | | | 52,083 | | | | 108 | | | | 56,621 | | | | — | |
| | | | | |
Non-U.S. government and agency obligations | | | 41,608 | | | | 2,209 | | | | 64,817 | | | | 2,259 | |
| | | | | |
Securities backed by commercial real estate | | | 56 | | | | — | | | | 130 | | | | — | |
| | | | | |
Securities backed by residential real estate | | | 856 | | | | — | | | | 875 | | | | — | |
| | | | | |
Corporate debt securities | | | 6,727 | | | | 38 | | |
Corporate loans and debt securities | | | | 10,280 | | | | 930 | |
| | | | | |
State and municipal obligations | | | 175 | | | | — | | | | 608 | | | | — | |
| | | | | |
Other debt obligations | | | 78 | | | | — | | | | 87 | | | | — | |
| | | | | |
Equities and convertible debentures | | | 16,864 | | | | 6,562 | | |
Equity securities | | | | 9,650 | | | | 12,316 | |
Total | | | $118,919 | | | | $8,917 | | | | $143,597 | | | | $15,505 | |
As of December 2015 | | | | | |
Commercial paper, certificates of deposit, time deposits and other money market instruments | | $ 806 | | | | $ — | | |
As of December 2016 | | | | | |
Money market instruments | | | $ 317 | | | | $ — | |
| | | | | |
U.S. government and federal agency obligations | | 54,856 | | | | 101 | | | 47,207 | | | | 115 | |
| | | | | |
Non-U.S. government and agency obligations | | 31,547 | | | | 2,465 | | | 56,156 | | | | 1,846 | |
| | | | | |
Securities backed by commercial real estate | | 269 | | | | — | | | 208 | | | | — | |
| | | | | |
Securities backed by residential real estate | | 2,059 | | | | — | | | 122 | | | | — | |
| | | | | |
Corporate debt securities | | 6,877 | | | | 30 | | |
Corporate loans and debt securities | | | 8,297 | | | | 39 | |
| | | | | |
State and municipal obligations | | 609 | | | | — | | | 831 | | | | — | |
| | | | | |
Other debt obligations | | 101 | | | | — | | | 286 | | | | — | |
| | | | | |
Equities and convertible debentures | | 17,836 | | | | 3,583 | | |
Equity securities | | | 15,028 | | | | 10,495 | |
Total | | $114,960 | | | | $6,179 | | | $128,452 | | | | $12,495 | |
The table below presents the gross carrying value of repurchase agreements and securities loaned by maturity date.
| | | | As of March 2016 | | | As of March 2017 | |
| $ in millions | |
| Repurchase
agreements |
| |
| Securities
loaned |
| |
| Repurchase
agreements |
| |
| Securities
loaned |
|
No stated maturity and overnight | | | $ 34,115 | | | | $5,504 | | | | $ 45,786 | | | | $ 7,010 | |
| | | | | |
2 - 30 days | | | 37,023 | | | | 2,435 | | | | 48,967 | | | | 3,770 | |
| | | | | |
31 - 90 days | | | 16,890 | | | | 500 | | | | 11,632 | | | | 595 | |
| | | | | |
91 days - 1 year | | | 24,679 | | | | 478 | | | | 24,929 | | | | 3,126 | |
| | | | | |
Greater than 1 year | | | 6,212 | | | | — | | | | 12,283 | | | | 1,004 | |
Total | | | $118,919 | | | | $8,917 | | | | $143,597 | | | | $15,505 | |
In the table above:
Repurchase agreements and securities loaned that are repayable prior to maturity at the option of the firm are reflected at their contractual maturity dates.
Repurchase agreements and securities loaned that are redeemable prior to maturity at the option of the holdersholder are reflected at the earliest dates such options become exercisable.
Other Secured Financings
In addition to repurchase agreements and securities loaned transactions, the firm funds certain assets through the use of other secured financings and pledges financial instruments and other assets as collateral in these transactions. These other secured financings consist of:
Liabilities of consolidated VIEs;
Transfers of assets accounted for as financings rather than sales (primarily collateralized central bank financings, pledged commodities, bank loans and mortgage whole loans); and
Other structured financing arrangements.
Other secured financings include arrangements that are nonrecourse. As of March 20162017 and December 2015,2016, nonrecourse other secured financings were $2.48$4.06 billion and $2.20$2.54 billion, respectively.
The firm has elected to apply the fair value option to substantially all other secured financings because the use of fair value eliminates non-economic volatility in earnings that would arise from using different measurement attributes. See Note 8 for further information about other secured financings that are accounted for at fair value.
Other secured financings that are not recorded at fair value are recorded based on the amount of cash received plus accrued interest, which generally approximates fair value. While these financings are carried at amounts that approximate fair value, they are not accounted for at fair value under the fair value option or at fair value in accordance with other U.S. GAAP and therefore are not included in the firm’s fair value hierarchy in Notes 6 through 8. Had these financings been included in the firm’s fair value hierarchy, they would have been primarily classified in level 2 as of March 20162017 and December 2015.2016.
| | | | |
46 | | Goldman Sachs March 20162017 Form 10-Q | | 45 |
THE GOLDMAN SACHS GROUP, INC. AND SUBSIDIARIES
Notes to Condensed Consolidated Financial Statements
(Unaudited)
The table below presents information about other secured financings.
| | | | | | | | | | | | |
| $ in millions | |
| U.S.
Dollar |
| |
| Non-U.S.
Dollar |
| | | Total | |
As of March 2016 | | | | | | | | | | | | |
Other secured financings(short-term): | | | | | | | | | | | | |
At fair value | | | $ 8,151 | | | | $ 6,193 | | | | $14,344 | |
| | |
At amortized cost | | | 581 | | | | 224 | | | | 805 | |
| | |
Weighted average interest rates | | | 2.96% | | | | 2.37% | | | | | |
| | |
Other secured financings(long-term): | | | | | | | | | | | | |
At fair value | | | 7,194 | | | | 2,856 | | | | 10,050 | |
| | |
At amortized cost | | | 619 | | | | 357 | | | | 976 | |
| | |
Weighted average interest rates | | | 3.07% | | | | 1.83% | | | | | |
Total 1 | | | $16,545 | | | | $ 9,630 | | | | $26,175 | |
Amount of other secured financings collateralized by: | | | | | | | | | | | | |
Financial instruments 2 | | | $15,616 | | | | $ 9,259 | | | | $24,875 | |
| | |
Other assets | | | 929 | | | | 371 | | | | 1,300 | |
As of December 2015 | | | | | | | | | | | | |
Other secured financings(short-term): | | | | | | | | | | | | |
At fair value | | | $ 7,952 | | | | $ 5,448 | | | | $13,400 | |
| | |
At amortized cost | | | 514 | | | | 319 | | | | 833 | |
| | |
Weighted average interest rates | | | 2.93% | | | | 3.83% | | | | | |
| | |
Other secured financings(long-term): | | | | | | | | | | | | |
At fair value | | | 6,702 | | | | 3,105 | | | | 9,807 | |
| | |
At amortized cost | | | 370 | | | | 343 | | | | 713 | |
| | |
Weighted average interest rates | | | 2.87% | | | | 1.54% | | | | | |
Total 1 | | | $15,538 | | | | $ 9,215 | | | | $24,753 | |
Amount of other secured financings collateralized by: | | | | | | | | | | | | |
Financial instruments 2 | | | $14,862 | | | | $ 8,872 | | | | $23,734 | |
| | |
Other assets | | | 676 | | | | 343 | | | | 1,019 | |
1. | Includes $464 million and $334 million related to transfers of financial assets accounted for as financings rather than sales as of March 2016 and December 2015, respectively. Such financings were collateralized by financial assets of $465 million and $336 million as of March 2016 and December 2015, respectively, primarily included in “Financial instruments owned, at fair value.”
|
2. | Includes $15.05 billion and $14.98 billion of other secured financings collateralized by financial instruments owned, at fair value as of March 2016 and December 2015, respectively, and includes $9.83 billion and $8.76 billion of other secured financings collateralized by financial instruments received as collateral and repledged as of March 2016 and December 2015, respectively.
|
| | | | | | | | | | | | |
| $ in millions | |
| U.S.
Dollar |
| |
| Non-U.S.
Dollar |
| | | Total | |
As of March 2017 | | | | | | | | | | | | |
Other secured financings (short-term): | | | | | | | | | | | | |
At fair value | | | $ 5,528 | | | | $5,412 | | | | $10,940 | |
| | |
At amortized cost | | | $ — | | | | $ 309 | | | | $ 309 | |
| | |
Weighted average interest rates | | | —% | | | | 2.27% | | | | | |
| | |
Other secured financings (long-term): | | | | | | | | | | | | |
At fair value | | | $ 7,015 | | | | $4,005 | | | | $11,020 | |
| | |
At amortized cost | | | $ 107 | | | | $ — | | | | $ 107 | |
| | |
Weighted average interest rates | | | 3.99% | | | | —% | | | | | |
Total | | | $12,650 | | | | $9,726 | | | | $22,376 | |
Other secured financings collateralized by: | | | | | | | | | | | | |
Financial instruments | | | $11,195 | | | | $8,585 | | | | $19,780 | |
| | |
Other assets | | | $ 1,455 | | | | $1,141 | | | | $ 2,596 | |
As of December 2016 | | | | | | | | | | | | |
Other secured financings (short-term): | | | | | | | | | | | | |
At fair value | | | $ 9,380 | | | | $3,738 | | | | $13,118 | |
| | |
At amortized cost | | | $ — | | | | $ — | | | | $ — | |
| | |
Weighted average interest rates | | | —% | | | | —% | | | | | |
| | |
Other secured financings (long-term): | | | | | | | | | | | | |
At fair value | | | $ 5,562 | | | | $2,393 | | | | $ 7,955 | |
| | |
At amortized cost | | | $ 145 | | | | $ 305 | | | | $ 450 | |
| | |
Weighted average interest rates | | | 4.06% | | | | 2.16% | | | | | |
Total | | | $15,087 | | | | $6,436 | | | | $21,523 | |
Other secured financings collateralized by: | | | | | | | | | | | | |
Financial instruments | | | $13,858 | | | | $5,974 | | | | $19,832 | |
| | |
Other assets | | | $ 1,229 | | | | $ 462 | | | | $ 1,691 | |
In the table above:
Short-term other secured financings include financings maturing within one year of the financial statement date and financings that are redeemable within one year of the financial statement date at the option of the holder.
Weighted average interest rates exclude other secured financings at fair value and include the effect of hedging activities. See Note 7 for further information about hedging activities.
Total other secured financings include $343 million and $285 million related to transfers of financial assets accounted for as financings rather than sales as of March 2017 and December 2016, respectively. Such financings were collateralized by financial assets of $342 million and $285 million as of March 2017 and December 2016, respectively, primarily included in “Financial instruments owned, at fair value.”
Other secured financings collateralized by financial instruments include $11.31 billion and $13.65 billion of other secured financings collateralized by financial instruments owned, at fair value as of March 2017 and December 2016, respectively, and $8.47 billion and $6.18 billion of other secured financings collateralized by financial instruments received as collateral and repledged as of March 2017 and December 2016, respectively.
The table below presents other secured financings by maturity date.
| | $ in millions | |
| As of
March 2016 |
| |
| As of
March 2017 |
|
Other secured financings (short-term) | | | $15,149 | | | | $11,249 | |
| | | | | |
Other secured financings (long-term): | | | | |
2017 | | | 5,741 | | |
| | | |
2018 | | | 2,826 | | | | 6,362 | |
| | | | | |
2019 | | | 605 | | | | 819 | |
| | | | | |
2020 | | | 1,120 | | | | 1,234 | |
| | | | | |
2021 | | | 184 | | | | 512 | |
| | | | | |
2022 - thereafter | | | 550 | | |
2022 | | | | 1,542 | |
| | | | |
2023 - thereafter | | | | 658 | |
Total other secured financings (long-term) | | | 11,026 | | | | 11,127 | |
Total other secured financings | | | $26,175 | | | | $22,376 | |
In the table above:
Long-term other secured financings that are repayable prior to maturity at the option of the firm are reflected at their contractual maturity dates.
Long-term other secured financings that are redeemable prior to maturity at the option of the holdersholder are reflected at the earliest dates such options become exercisable.
Collateral Received and Pledged
The firm receives cash and securities (e.g., U.S. government and federal agency, other sovereign and corporate obligations, as well as equities and convertible debentures)equity securities) as collateral, primarily in connection with resale agreements, securities borrowed, derivative transactions and customer margin loans. The firm obtains cash and securities as collateral on an upfront or contingent basis for derivative instruments and collateralized agreements to reduce its credit exposure to individual counterparties.
In many cases, the firm is permitted to deliver or repledge financial instruments received as collateral when entering into repurchase agreements and securities loaned transactions, primarily in connection with secured client financing activities. The firm is also permitted to deliver or repledge these financial instruments in connection with other secured financings, collateralized derivative transactions and firm or customer settlement requirements.
The firm also pledges certain financial instruments owned, at fair value in connection with repurchase agreements, securities loaned transactions and other secured financings, and other assets (substantially all real estate and cash) in connection with other secured financings to counterparties who may or may not have the right to deliver or repledge them.
| | | | |
| 46 | | Goldman Sachs March 20162017 Form 10-Q | | 47 |
THE GOLDMAN SACHS GROUP, INC. AND SUBSIDIARIES
Notes to Condensed Consolidated Financial Statements
(Unaudited)
The table below presents financial instruments at fair value received as collateral that were available to be delivered or repledged and were delivered or repledged by the firm.
| | | | As of | | | As of | |
| $ in millions | |
| March
2016 |
| |
| December
2015 |
| |
| March
2017 |
| |
| December
2016 |
|
Collateral available to be delivered or repledged 1 | | | $674,270 | | | | $636,684 | | |
Collateral available to be delivered or repledged | | | | $661,415 | | | $634,609 | |
| | | | | |
Collateral that was delivered or repledged | | | 532,874 | | | | 496,240 | | | | $536,728 | | | $495,717 | |
In the table above, as of March 2017 and December 2016, collateral available to be delivered or repledged excludes $11.54 billion and $15.47 billion, respectively, of securities received under resale agreements and securities borrowed transactions that contractually had the right to be delivered or repledged, but were segregated for regulatory and other purposes.
1. | As of March 2016 and December 2015, amounts exclude $15.52 billion and $13.40 billion, respectively, of securities received under resale agreements, and $6.30 billion and $5.54 billion, respectively, of securities borrowed transactions that contractually had the right to be delivered or repledged, but were segregated to satisfy certain regulatory requirements.
|
The table below presents information about assets pledged.
| | | | As of | | | As of | |
| $ in millions | |
| March
2016 |
| |
| December
2015 |
| |
| March
2017 |
| |
| December
2016 |
|
Financial instruments owned, at fair value pledged to counterparties that: | | | | | Financial instruments owned, at fair value pledged to counterparties that: | |
Had the right to deliver or repledge | | | $53,548 | | | | $54,426 | | | | $ 53,389 | | | $ 51,278 | |
| | | | | |
Did not have the right to deliver or repledge | | | 58,627 | | | | 63,880 | | | | $ 71,873 | | | $ 61,099 | |
| | | | | |
Other assets pledged to counterparties that: | | | | | |
Did not have the right to deliver or repledge | | | 2,402 | | | | 1,841 | | |
Other assets pledged to counterparties that did not have the right to deliver or repledge | | | | $ 4,418 | | | $ 3,287 | |
The firm also segregated $14.43 billion and $15.29 billion of securities included in “Financial instruments owned, at fair value” as of March 2017 and December 2016, respectively, for regulatory and other purposes. See Note 3 for information about segregated cash.
Note 11.
Securitization Activities
The firm securitizes residential and commercial mortgages, corporate bonds, loans and other types of financial assets by selling these assets to securitization vehicles (e.g., trusts, corporate entities and limited liability companies) or through a resecuritization. The firm acts as underwriter of the beneficial interests that are sold to investors. The firm’s residential mortgage securitizations are primarily in connection with government agency securitizations.
Beneficial interests issued by securitization entities are debt or equity securitiesinterests that give the investors rights to receive all or portions of specified cash inflows to a securitization vehicle and include senior and subordinated interests in principal, interest and/or other cash inflows. The proceeds from the sale of beneficial interests are used to pay the transferor for the financial assets sold to the securitization vehicle or to purchase securities which serve as collateral.
The firm accounts for a securitization as a sale when it has relinquished control over the transferred financial assets. Prior to securitization, the firm accounts for assets pending transfer at fair value and therefore does not typically recognize significant gains or losses upon the transfer of assets. Net revenues from underwriting activities are recognized in connection with the sales of the underlying beneficial interests to investors.
For transfers of financial assets that are not accounted for as sales, the assets remain in “Financial instruments owned, at fair value” and the transfer is accounted for as a collateralized financing, with the related interest expense recognized over the life of the transaction. See Notes 10 and 23 for further information about collateralized financings and interest expense, respectively.
The firm generally receives cash in exchange for the transferred assets but may also have continuing involvement with the transferred financial assets, including ownership of beneficial interests in securitized financial assets, primarily in the form of senior or subordinated securities. The firm may also purchase senior or subordinated securities issued by securitization vehicles (which are typically VIEs) in connection with secondary market-making activities.
The primary risks included in beneficial interests and other interests from the firm’s continuing involvement with securitization vehicles are the performance of the underlying collateral, the position of the firm’s investment in the capital structure of the securitization vehicle and the market yield for the security. Substantially all of theseThese interests are primarily accounted for at fair value are included in “Financial instruments owned, at fair value” and are classified in level 2 of the fair value hierarchy. Beneficial interests and other interests not accounted for at fair value are carried at amounts that approximate fair value. See Notes 5 through 8 for further information about fair value measurements.
The table below presents the amount of financial assets securitized and the cash flows received on retained interests in securitization entities in which the firm had continuing involvement as of the end of the period.
| | | | Three Months
Ended March | | | Three Months Ended March | |
| $ in millions | | | 2016 | | | | 2015 | | | | 2017 | | | | 2016 | |
Residential mortgages | | | $623 | | | | $4,610 | | | | $2,942 | | | | $623 | |
| | | | | |
Commercial mortgages | | | 177 | | | | 2,164 | | | | 1,062 | | | | 177 | |
Total | | | $800 | | | | $6,774 | | | | $4,004 | | | | $800 | |
Cash flows on retained interests | | | $ 21 | | | | $ 40 | | |
Retained interests cash flows | | | | $ 73 | | | | $ 21 | |
| | | | |
48 | | Goldman Sachs March 20162017 Form 10-Q | | 47 |
THE GOLDMAN SACHS GROUP, INC. AND SUBSIDIARIES
Notes to Condensed Consolidated Financial Statements
(Unaudited)
The table below presents the firm’s continuing involvement in nonconsolidated securitization entities to which the firm sold assets, as well as the total outstanding principal amount of transferred assets in which the firm has continuing involvement.
| | | | | | | | | | | | |
| $ in millions | |
| Outstanding
Principal
Amount |
| |
| Fair Value of
Retained
Interests |
| |
| Fair Value of
Purchased
Interests |
|
As of March 2016 | | | | | | | | | | | | |
U.S. governmentagency-issued collateralized mortgage obligations | | | $35,170 | | | | $ 543 | | | | $ 6 | |
| | |
Other residentialmortgage-backed | | | 1,648 | | | | 67 | | | | — | |
| | |
Other commercialmortgage-backed | | | 3,698 | | | | 88 | | | | 30 | |
| | |
CDOs, CLOs and other | | | 2,710 | | | | 41 | | | | 9 | |
Total | | | $43,226 | | | | $ 739 | | | | $45 | |
As of December 2015 | | | | | | | | | | | | |
U.S. governmentagency-issued collateralized mortgage obligations | | | $39,088 | | | | $ 846 | | | | $20 | |
| | |
Other residentialmortgage-backed | | | 2,195 | | | | 154 | | | | 17 | |
| | |
Other commercialmortgage-backed | | | 6,842 | | | | 115 | | | | 28 | |
| | |
CDOs, CLOs and other | | | 2,732 | | | | 44 | | | | 7 | |
Total | | | $50,857 | | | | $1,159 | | | | $72 | |
| | | | | | | | | | | | |
| $ in millions | |
| Outstanding
Principal
Amount |
| |
| Retained
Interests |
| |
| Purchased
Interests |
|
As of March 2017 | | | | | | | | | | | | |
U.S. government agency-issued collateralized mortgage obligations | | | $22,360 | | | | $ 964 | | | | $16 | |
| | |
Other residential mortgage-backed | | | 3,077 | | | | 416 | | | | 24 | |
| | |
Other commercial mortgage-backed | | | 1,421 | | | | 38 | | | | 5 | |
| | |
CDOs, CLOs and other | | | 2,273 | | | | 52 | | | | 5 | |
Total | | | $29,131 | | | | $1,470 | | | | $50 | |
As of December 2016 | | | | | | | | | | | | |
U.S. government agency-issued collateralized mortgage obligations | | | $25,140 | | | | $ 953 | | | | $24 | |
| | |
Other residential mortgage-backed | | | 3,261 | | | | 540 | | | | 6 | |
| | |
Other commercial mortgage-backed | | | 357 | | | | 15 | | | | — | |
| | |
CDOs, CLOs and other | | | 2,284 | | | | 56 | | | | 6 | |
Total | | | $31,042 | | | | $1,564 | | | | $36 | |
In the table above:
The outstanding principal amount is presented for the purpose of providing information about the size of the securitization entities in which the firm has continuing involvement and is not representative of the firm’s risk of loss.
ForThe firm’s risk of loss from retained or purchased interests the firm’s risk of loss is limited to the faircarrying value of these interests.
Purchased interests represent senior and subordinated interests, purchased in connection with secondary market-making activities, in securitization entities in which the firm also holds retained interests.
Substantially all of the total outstanding principal amount and total fair value of retained interests as of March 2016 and December 2015 relate to securitizations during 2012 and thereafter.
The fair value of retained interests was $1.50 billion and $1.58 billion as of March 2017 and December 2016, respectively.
In addition to the interests in the table above, the firm had other continuing involvement in the form of derivative transactions and commitments with certain nonconsolidated VIEs. The carrying value of these derivatives and commitments was a net asset of $80$56 million and $92$48 million as of March 20162017 and December 2015,2016, respectively. The notional amounts of these derivatives and commitments are included in maximum exposure to loss in the nonconsolidated VIE table in Note 12.
The table below presents the weighted average key economic assumptions used in measuring the fair value of mortgage-backed retained interests and the sensitivity of this fair value to immediate adverse changes of 10% and 20% in those assumptions.
| | | | As of | | | As of | |
| $ in millions | | | March 2016 | | | | December 2015 | | |
| March
2017 |
| |
| December
2016 |
|
Fair value of retained interests | | | $ 698 | | | | $ 1,115 | | | | $1,449 | | | | $1,519 | |
| | | | | |
Weighted average life (years) | | | 7.5 | | | | 7.5 | | | | 7.5 | | | | 7.5 | |
| | | | | |
Constant prepayment rate | | | 12.7% | | | | 10.4% | | | | 8.6% | | | | 8.1% | |
| | | | | |
Impact of 10% adverse change | | | $ (17 | ) | | | $ (22 | ) | | | $ (15 | ) | | | $ (14 | ) |
| | | | | |
Impact of 20% adverse change | | | (34 | ) | | | (43 | ) | | | $ (27 | ) | | | $ (28 | ) |
| | | | | |
Discount rate | | | 5.4% | | | | 5.5% | | | | 5.2% | | | | 5.3% | |
| | | | | |
Impact of 10% adverse change | | | $ (15 | ) | | | $ (28 | ) | | | $ (36 | ) | | | $ (37 | ) |
| | | | | |
Impact of 20% adverse change | | | (30 | ) | | | (55 | ) | | | $ (71 | ) | | | $ (71 | ) |
In the table above:
Amounts do not reflect the benefit of other financial instruments that are held to mitigate risks inherent in these retained interests.
Changes in fair value based on an adverse variation in assumptions generally cannot be extrapolated because the relationship of the change in assumptions to the change in fair value is not usually linear.
The impact of a change in a particular assumption is calculated independently of changes in any other assumption. In practice, simultaneous changes in assumptions might magnify or counteract the sensitivities disclosed above.
The constant prepayment rate is included only for positions for which it is a key assumption in the determination of fair value.
The discount rate for retained interests that relate to U.S. government agency-issued collateralized mortgage obligations does not include any credit loss.
Expected credit loss assumptions are reflected in the discount rate for the remainder of retained interests.
The firm has other retained interests not reflected in the table above with a fair value of $41$52 million and a weighted average life of 3.03.4 years as of March 2016,2017, and a fair value of $44$56 million and a weighted average life of 3.5 years as of December 2015.2016. Due to the nature and current fair value of certain of these retained interests, the weighted average assumptions for constant prepayment and discount rates and the related sensitivity to adverse changes are not meaningful as of March 20162017 and December 2015.2016. The firm’s maximum exposure to adverse changes in the value of these interests is the carrying value of $41$52 million and $44$56 million as of March 20162017 and December 2015,2016, respectively.
| | | | |
| 48 | | Goldman Sachs March 20162017 Form 10-Q | | 49 |
THE GOLDMAN SACHS GROUP, INC. AND SUBSIDIARIES
Notes to Condensed Consolidated Financial Statements
(Unaudited)
Note 12.
Variable Interest Entities
A variable interest in a VIE is an investment (e.g., debt or equity securities) or other interest (e.g., derivatives or loans and lending commitments) that will absorb portions of the VIE’s expected losses and/or receive portions of the VIE’s expected residual returns.
The firm’s variable interests in VIEs include senior and subordinated debt in residential and commercial mortgage-backed and other asset-backed securitization entities, CDOs and CLOs;debt; loans and lending commitments; limited and general partnership interests; preferred and common equity; derivatives that may include foreign currency, equity and/or credit risk; guarantees; and certain of the fees the firm receives from investment funds. Certain interest rate, foreign currency and credit derivatives the firm enters into with VIEs are not variable interests because they create, rather than absorb, risk.
VIEs generally finance the purchase of assets by issuing debt and equity securities that are either collateralized by or indexed to the assets held by the VIE. The debt and equity securities issued by a VIE may include tranches of varying levels of subordination. The firm’s involvement with VIEs includes securitization of financial assets, as described in Note 11, and investments in and loans to other types of VIEs, as described below. See Note 11 for additional information about securitization activities, including the definition of beneficial interests. See Note 3 for the firm’s consolidation policies, including the definition of a VIE.
VIE Consolidation Analysis
The enterprise with a controlling financial interest in a VIE is known as the primary beneficiary and consolidates the VIE. The firm determines whether it is the primary beneficiary of a VIE by performing an analysis that principally considers:
Which variable interest holder has the power to direct the activities of the VIE that most significantly impact the VIE’s economic performance;
Which variable interest holder has the obligation to absorb losses or the right to receive benefits from the VIE that could potentially be significant to the VIE;
The VIE’s purpose and design, including the risks the VIE was designed to create and pass through to its variable interest holders;
The VIE’s capital structure;
The terms between the VIE and its variable interest holders and other parties involved with the VIE; and
Related-party relationships.
The firm reassesses its initial evaluation of whether an entity is a VIE when certain reconsideration events occur. The firm reassesses its determination of whether it is the primary beneficiary of a VIE on an ongoing basis based on current facts and circumstances.
VIE Activities
The firm is principally involved with VIEs through the following business activities:
Mortgage-Backed VIEs and Corporate CDO and CLO VIEs. The firm sells residential and commercial mortgage loans and securities to mortgage-backed VIEs and corporate bonds and loans to corporate CDO and CLO VIEs and may retain beneficial interests in the assets sold to these VIEs. The firm purchases and sells beneficial interests issued by mortgage-backed and corporate CDO and CLO VIEs in connection with market-making activities. In addition, the firm may enter into derivatives with certain of these VIEs, primarily interest rate swaps, which are typically not variable interests. The firm generally enters into derivatives with other counterparties to mitigate its risk from derivatives with these VIEs.
Certain mortgage-backed and corporate CDO and CLO VIEs, usually referred to as synthetic CDOs or credit-linked note VIEs, synthetically create the exposure for the beneficial interests they issue by entering into credit derivatives, rather than purchasing the underlying assets. These credit derivatives may reference a single asset, an index, or a portfolio/basket of assets or indices. See Note 7 for further information about credit derivatives. These VIEs use the funds from the sale of beneficial interests and the premiums received from credit derivative counterparties to purchase securities which serve to collateralizeas collateral for the beneficial interest holders and/or the credit derivative counterparty. These VIEs may enter into other derivatives, primarily interest rate swaps, which are typically not variable interests. The firm may be a counterparty to derivatives with these VIEs and generally enters into derivatives with other counterparties to mitigate its risk.
| | | | |
50 | | Goldman Sachs March 20162017 Form 10-Q | | 49 |
THE GOLDMAN SACHS GROUP, INC. AND SUBSIDIARIES
Notes to Condensed Consolidated Financial Statements
(Unaudited)
Real Estate, Credit-Related and Other Investing VIEs. The firm purchases equity and debt securities issued by and makes loans to VIEs that hold real estate, performing and nonperforming debt, distressed loans and equity securities. The firm typically does not sell assets to, or enter into derivatives with, these VIEs.
Other Asset-Backed VIEs. The firm structures VIEs that issue notes to clients, and purchases and sells beneficial interests issued by other asset-backed VIEs in connection with market-making activities. In addition, the firm may enter into derivatives with certain other asset-backed VIEs, primarily total return swaps on the collateral assets held by these VIEs under which the firm pays the VIE the return due to the note holders and receives the return on the collateral assets owned by the VIE. The firm generally can be removed as the total return swap counterparty. The firm generally enters into derivatives with other counterparties to mitigate its risk from derivatives with these VIEs. The firm typically does not sell assets to the other asset-backed VIEs it structures.
Principal-Protected Note VIEs. The firm structures VIEs that issue principal-protected notes to clients. These VIEs own portfolios of assets, principally with exposure to hedge funds. Substantially all of the principal protection on the notes issued by these VIEs is provided by the asset portfolio rebalancing that is required under the terms of the notes. The firm enters into total return swaps with these VIEs under which the firm pays the VIE the return due to the principal-protected note holders and receives the return on the assets owned by the VIE. The firm may enter into derivatives with other counterparties to mitigate the risk it has from the derivatives it enters into with these VIEs. The firm also obtains funding through these VIEs.
Investments in Funds and Other VIEs. The firm makes equity investments in certain of the investment fund VIEs it manages and is entitled to receive fees from these VIEs. The firm typically does not sell assets to, or enter into derivatives with, these VIEs. Other VIEs primarily includes nonconsolidated power-related VIEs. The firm purchases debt and equity securities issued by VIEs that hold power-related assets and may provide commitments to these VIEs.
Adoption of ASU No. 2015-02
The firm adopted ASU No. 2015-02 as of January 1, 2016. Upon adoption, certain of the firm’s investments in entities that were previously classified as voting interest entities are now classified as VIEs. These include investments in certain limited partnership entities that have been deconsolidated upon adoption as certain fee interests are not considered significant interests under the guidance, and the firm is no longer deemed to have a controlling financial interest in such entities. See Note 3 for further information about the adoption of ASU No. 2015-02.
Nonconsolidated VIEs. As a result of adoption as of January 1, 2016, “Investments in funds and other” nonconsolidated VIEs included $10.70 billion in “Assets in VIEs,” $543 million in “Carrying value of variable interests — assets” and $559 million in “Maximum Exposureexposure to Loss”loss” related to investments in limited partnership entities that were previously classified as nonconsolidated voting interest entities.
Consolidated VIEs. As a result of adoption as of January 1, 2016, “Real estate, credit-related and other investing” consolidated VIEs included $302 million of assets, substantially all included in “Financial instruments owned, at fair value,” and $122 million of liabilities, included in “Other liabilities and accrued expenses” primarily related to investments in limited partnership entities that were previously classified as consolidated voting interest entities.
| | | | |
| 50 | | Goldman Sachs March 20162017 Form 10-Q | | 51 |
THE GOLDMAN SACHS GROUP, INC. AND SUBSIDIARIES
Notes to Condensed Consolidated Financial Statements
(Unaudited)
Nonconsolidated VIEs
The table below presents information abouta summary of the nonconsolidated VIEs in which the firm holds variable interests. The nature of the firm’s variable interests can take different forms, as described in the rows under maximum exposure to loss.
| | | | As of | | | As of | |
| $ in millions | |
| March
2016 |
| |
| December
2015 |
| |
| March
2017 |
| |
| December
2016 |
|
Mortgage-backed 1 | | | | | |
Assets in VIEs | | | $51,020 | | | | $62,672 | | |
| | | |
Carrying value of variable interests — assets | | | 1,702 | | | | 2,439 | | |
| | | |
Maximum Exposure to Loss | | | | | |
Retained interests | | | 698 | | | | 1,115 | | |
| | | |
Purchased interests | | | 1,004 | | | | 1,324 | | |
| | | |
Commitments and guarantees | | | 41 | | | | 40 | | |
| | | |
Derivatives | | | 216 | | | | 222 | | |
Total maximum exposure to loss | | | 1,959 | | | | 2,701 | | |
Corporate CDOs and CLOs | | | | | |
Total nonconsolidated VIEs | | | | | |
Assets in VIEs | | | 6,207 | | | | 6,493 | | | | $68,972 | | | | $70,083 | |
| | | | | |
Carrying value of variable interests — assets | | | 754 | | | | 624 | | | | 6,385 | | | | 6,199 | |
| | | | | |
Carrying value of variable interests — liabilities | | | 34 | | | | 29 | | | | 183 | | | | 254 | |
| | | |
Maximum Exposure to Loss | | | | | |
Maximum exposure to loss: | | | | | |
Retained interests | | | 2 | | | | 3 | | | | 1,470 | | | | 1,564 | |
| | | | | |
Purchased interests | | | 123 | | | | 106 | | | | 486 | | | | 544 | |
| | | | | |
Commitments and guarantees | | | 910 | | | | 647 | | | | 2,497 | | | | 2,196 | |
| | | | | |
Derivatives | | | 1,763 | | | | 2,633 | | | | 6,872 | | | | 7,144 | |
| | | | | |
Loans and investments | | | 427 | | | | 265 | | | | 4,148 | | | | 3,760 | |
Total maximum exposure to loss | | | 3,225 | | | | 3,654 | | | | $15,473 | | | | $15,208 | |
Real estate, credit-related and other investing | | | | | |
Assets in VIEs | | | 9,923 | | | | 9,793 | | |
| | | |
Carrying value of variable interests — assets | | | 3,632 | | | | 3,557 | | |
| | | |
Carrying value of variable interests — liabilities | | | 4 | | | | 3 | | |
| | | |
Maximum Exposure to Loss | | | | | |
Commitments and guarantees | | | 597 | | | | 570 | | |
| | | |
Loans and investments | | | 3,632 | | | | 3,557 | | |
Total maximum exposure to loss | | | 4,229 | | | | 4,127 | | |
Other asset-backed | | | | | |
Assets in VIEs | | | 6,326 | | | | 7,026 | | |
| | | |
Carrying value of variable interests — assets | | | 226 | | | | 265 | | |
| | | |
Carrying value of variable interests — liabilities | | | 113 | | | | 145 | | |
| | | |
Maximum Exposure to Loss | | | | | |
Retained interests | | | 39 | | | | 41 | | |
| | | |
Purchased interests | | | 29 | | | | 98 | | |
| | | |
Commitments and guarantees | | | 500 | | | | 500 | | |
| | | |
Derivatives | | | 4,136 | | | | 4,075 | | |
Total maximum exposure to loss | | | 4,704 | | | | 4,714 | | |
Investments in funds and other | | | | | |
Assets in VIEs | | | 14,548 | | | | 4,161 | | |
| | | |
Carrying value of variable interests — assets | | | 931 | | | | 286 | | |
| | | |
Maximum Exposure to Loss | | | | | |
Commitments and guarantees | | | 250 | | | | 263 | | |
| | | |
Derivatives | | | 6 | | | | 6 | | |
| | | |
Loans and investments | | | 931 | | | | 286 | | |
Total maximum exposure to loss | | | 1,187 | | | | 555 | | |
Total nonconsolidated VIEs | | | | | |
Assets in VIEs | | | 88,024 | | | | 90,145 | | |
| | | |
Carrying value of variable interests — assets | | | 7,245 | | | | 7,171 | | |
| | | |
Carrying value of variable interests — liabilities | | | 151 | | | | 177 | | |
| | | |
Maximum Exposure to Loss | | | | | |
Retained interests | | | 739 | | | | 1,159 | | |
| | | |
Purchased interests | | | 1,156 | | | | 1,528 | | |
| | | |
Commitments and guarantees 2 | | | 2,298 | | | | 2,020 | | |
| | | |
Derivatives 2 | | | 6,121 | | | | 6,936 | | |
| | | |
Loans and investments | | | 4,990 | | | | 4,108 | | |
Total maximum exposure to loss | | | $15,304 | | | | $15,751 | | |
In the table above:
1. | Assets in VIEs and maximum exposure to loss include $4.16 billion and $469 million, respectively, as of March 2016, and $4.08 billion and $502 million, respectively, as of December 2015, related to CDOs backed by mortgage obligations.
|
2. | Includes $1.57 billion and $1.52 billion as of March 2016 and December 2015, respectively, related to commitments and derivative transactions with VIEs to which the firm transferred assets.
|
The firm’s exposure to the obligations of VIEs is generally limited to its interests in these entities. In certain instances, the firm provides guarantees, including derivative guarantees, to VIEs or holders of variable interests in VIEs.
In the table above, nonconsolidated VIEs are aggregated based on principal business activity. The nature of the firm’s variable interests can take different forms, as described in the rows under maximum exposure to loss. In the table above:
The maximum exposure to loss excludes the benefit of offsetting financial instruments that are held to mitigate the risks associated with these variable interests.
ForThe maximum exposure to loss from retained andinterests, purchased interests, and loans and investments the maximum exposure to loss is the carrying value of these interests.
ForThe maximum exposure to loss from commitments and guarantees, and derivatives the maximum exposure to loss is the notional amount, which does not represent anticipated losses and also has not been reduced by unrealized losses already recorded. As a result, the maximum exposure to loss exceeds liabilities recorded for commitments and guarantees, and derivatives provided to VIEs.
Total maximum exposure to loss from commitments and guarantees, and derivatives includes $1.40 billion and $1.28 billion as of March 2017 and December 2016, respectively, related to transactions with VIEs to which the firm transferred assets.
The table below disaggregates, by principal business activity, the information for nonconsolidated VIEs included in the summary table above.
| | | | | | | | |
| | | As of | |
$ in millions | |
| March
2017 |
| |
| December
2016 |
|
Mortgage-backed | | | | | | | | |
Assets in VIEs | | | $30,947 | | | | $32,714 | |
| | |
Carrying value of variable interests — assets | | | 1,826 | | | | 1,936 | |
Maximum exposure to loss: | | | | | | | | |
Retained interests | | | 1,418 | | | | 1,508 | |
| | |
Purchased interests | | | 408 | | | | 429 | |
| | |
Commitments and guarantees | | | 10 | | | | 9 | |
| | |
Derivatives | | | 164 | | | | 163 | |
Total maximum exposure to loss | | | $ 2,000 | | | | $ 2,109 | |
Corporate CDOs and CLOs | | | | | | | | |
Assets in VIEs | | | $ 5,457 | | | | $ 5,391 | |
| | |
Carrying value of variable interests — assets | | | 700 | | | | 393 | |
| | |
Carrying value of variable interests — liabilities | | | 26 | | | | 25 | |
Maximum exposure to loss: | | | | | | | | |
Retained interests | | | 1 | | | | 2 | |
| | |
Purchased interests | | | 43 | | | | 43 | |
| | |
Commitments and guarantees | | | 650 | | | | 186 | |
| | |
Derivatives | | | 2,465 | | | | 2,841 | |
| | |
Loans and investments | | | 467 | | | | 94 | |
Total maximum exposure to loss | | | $ 3,626 | | | | $ 3,166 | |
Real estate, credit-related and other investing | | | | | | | | |
Assets in VIEs | | | $ 9,495 | | | | $ 8,617 | |
| | |
Carrying value of variable interests — assets | | | 2,568 | | | | 2,550 | |
| | |
Carrying value of variable interests — liabilities | | | 3 | | | | 3 | |
Maximum exposure to loss: | | | | | | | | |
Commitments and guarantees | | | 659 | | | | 693 | |
| | |
Loans and investments | | | 2,568 | | | | 2,550 | |
Total maximum exposure to loss | | | $ 3,227 | | | | $ 3,243 | |
Other asset-backed | | | | | | | | |
Assets in VIEs | | | $ 6,240 | | | | $ 6,405 | |
| | |
Carrying value of variable interests — assets | | | 273 | | | | 293 | |
| | |
Carrying value of variable interests — liabilities | | | 150 | | | | 220 | |
Maximum exposure to loss: | | | | | | | | |
Retained interests | | | 51 | | | | 54 | |
| | |
Purchased interests | | | 35 | | | | 72 | |
| | |
Commitments and guarantees | | | 275 | | | | 275 | |
| | |
Derivatives | | | 4,237 | | | | 4,134 | |
| | |
Loans and investments | | | 95 | | | | 89 | |
Total maximum exposure to loss | | | $ 4,693 | | | | $ 4,624 | |
Investments in funds and other | | | | | | | | |
Assets in VIEs | | | $16,833 | | | | $16,956 | |
| | |
Carrying value of variable interests — assets | | | 1,018 | | | | 1,027 | |
| | |
Carrying value of variable interests — liabilities | | | 4 | | | | 6 | |
Maximum exposure to loss: | | | | | | | | |
Commitments and guarantees | | | 903 | | | | 1,033 | |
| | |
Derivatives | | | 6 | | | | 6 | |
| | |
Loans and investments | | | 1,018 | | | | 1,027 | |
Total maximum exposure to loss | | | $ 1,927 | | | | $ 2,066 | |
In the table above, mortgage-backed includes assets in VIEs of $1.33 billion and $1.54 billion, and maximum exposure to loss of $253 million and $279 million, as of March 2017 and December 2016, respectively, related to CDOs backed by mortgage obligations.
| | | | |
| | Goldman Sachs March 2017 Form 10-Q | | 51 |
THE GOLDMAN SACHS GROUP, INC. AND SUBSIDIARIES
Notes to Condensed Consolidated Financial Statements
(Unaudited)
As of both March 2017 and December 2016, the carrying values of the firm’s variable interests in nonconsolidated VIEs are included in the condensed consolidated statements of financial condition as follows:
Mortgage-backed: Substantially all assets held by the firm related to mortgage-backed, corporate CDO and CLO and investments in funds and other VIEs arewere included in “Financial instruments owned, at fair value.value” and “Loans receivable.” Substantially
Corporate CDOs and CLOs: All assets were included in “Financial instruments owned, at fair value” and all liabilities held by the firm related to corporate CDO and CLO VIEs arewere included in “Financial instruments sold, but not yet purchased, at fair value;value.”
Substantially all assets held by the firm related to realReal estate, credit-related and other investing VIEs areinvesting: All assets were included in “Financial instruments owned, at fair value,” “Loans receivable,”receivable” and “Other assets.” Substantiallyassets” and all liabilities held by the firm related to real estate, credit-related and other investing VIEs arewere included in “Other liabilities and accrued expenses” and “Financial Instrumentsinstruments sold, but not yet purchased, at fair value;value” and “Other liabilities and accrued expenses.” and
Substantially allOther asset-backed: All assets held by the firm related to other asset-backed VIEs arewere included in “Financial instruments owned, at fair value” and “Loans Receivable.receivable” and all liabilities were included in “Financial instruments sold, but not yet purchased, at fair value.”
Investments in funds and other: Substantially all assets were included in “Financial instruments owned, at fair value” and all liabilities held by the firm related to other asset-backed VIEs arewere included in “Financial instruments sold, but not yet purchased, at fair value.”
| | | | |
52 | | Goldman Sachs March 2016 Form 10-Q | | |
THE GOLDMAN SACHS GROUP, INC. AND SUBSIDIARIES
Notes to Condensed Consolidated Financial Statements
(Unaudited)
Consolidated VIEs
The table below presents a summary of the carrying amountvalue and classification of assets and liabilities in consolidated VIEs.
| | | | | | | | |
| | | As of | |
| $ in millions | |
| March
2016 |
| |
| December
2015 |
|
Real estate, credit-related and other investing | | | | | | | | |
Assets | | | | | | | | |
Cash and cash equivalents | | | $ 178 | | | | $ 374 | |
| | |
Cash and securities segregated for regulatory and other purposes | | | 57 | | | | 49 | |
| | |
Receivables from brokers, dealers and clearing organizations | | | — | | | | 1 | |
| | |
Receivables from customers and counterparties | | | 13 | | | | — | |
| | |
Loans receivable | | | 1,547 | | | | 1,534 | |
| | |
Financial instruments owned, at fair value | | | 1,873 | | | | 1,585 | |
| | |
Other assets | | | 576 | | | | 456 | |
Total | | | 4,244 | | | | 3,999 | |
Liabilities | | | | | | | | |
Other secured financings | | | 370 | | | | 332 | |
| | |
Payables to brokers, dealers and clearing organizations | | | 1 | | | | — | |
| | |
Payables to customers and counterparties | | | 2 | | | | 2 | |
| | |
Financial instruments sold, but not yet purchased, at fair value | | | 12 | | | | 16 | |
| | |
Other liabilities and accrued expenses | | | 695 | | | | 556 | |
Total | | | 1,080 | | | | 906 | |
CDOs, mortgage-backed and other asset-backed | | | | | | | | |
Assets | | | | | | | | |
Financial instruments owned, at fair value | | | 372 | | | | 572 | |
| | |
Other assets | | | 9 | | | | 15 | |
Total | | | 381 | | | | 587 | |
Liabilities | | | | | | | | |
Other secured financings | | | 204 | | | | 113 | |
| | |
Payables to customers and counterparties | | | — | | | | 432 | |
Total | | | 204 | | | | 545 | |
Principal-protected notes | | | | | | | | |
Assets | | | | | | | | |
Cash and cash equivalents | | | 9 | | | | — | |
| | |
Financial instruments owned, at fair value | | | 100 | | | | 126 | |
Total | | | 109 | | | | 126 | |
Liabilities | | | | | | | | |
Other secured financings | | | 466 | | | | 413 | |
| | |
Unsecured short-term borrowings, including the current portion of unsecured long-term borrowings | | | 426 | | | | 416 | |
| | |
Unsecured long-term borrowings | | | 320 | | | | 312 | |
Total | | | 1,212 | | | | 1,141 | |
Total consolidated VIEs | | | | | | | | |
Assets | | | | | | | | |
Cash and cash equivalents | | | 187 | | | | 374 | |
| | |
Cash and securities segregated for regulatory and other purposes | | | 57 | | | | 49 | |
| | |
Receivables from brokers, dealers and clearing organizations | | | — | | | | 1 | |
| | |
Receivables from customers and counterparties | | | 13 | | | | — | |
| | |
Loans receivable | | | 1,547 | | | | 1,534 | |
| | |
Financial instruments owned, at fair value | | | 2,345 | | | | 2,283 | |
| | |
Other assets | | | 585 | | | | 471 | |
Total | | | 4,734 | | | | 4,712 | |
Liabilities | | | | | | | | |
Other secured financings | | | 1,040 | | | | 858 | |
| | |
Payables to brokers, dealers and clearing organizations | | | 1 | | | | — | |
| | |
Payables to customers and counterparties | | | 2 | | | | 434 | |
| | |
Financial instruments sold, but not yet purchased, at fair value | | | 12 | | | | 16 | |
| | |
Unsecured short-term borrowings, including the current portion of unsecured long-term borrowings | | | 426 | | | | 416 | |
| | |
Unsecured long-term borrowings | | | 320 | | | | 312 | |
| | |
Other liabilities and accrued expenses | | | 695 | | | | 556 | |
Total | | | $2,496 | | | | $2,592 | |
| | | | | | | | |
| | | As of | |
$ in millions | |
| March
2017 |
| |
| December
2016 |
|
Total consolidated VIEs | | | | | | | | |
Assets | | | | | | | | |
Cash and cash equivalents | | | $ 997 | | | | $ 300 | |
| | |
Loans receivable | | | 528 | | | | 603 | |
| | |
Financial instruments owned, at fair value | | | 2,256 | | | | 2,047 | |
| | |
Other assets | | | 589 | | | | 682 | |
Total | | | $4,370 | | | | $3,632 | |
Liabilities | | | | | | | | |
Other secured financings | | | $1,561 | | | | $ 854 | |
| | |
Payables to brokers, dealers and clearing organizations | | | 9 | | | | 1 | |
| | |
Financial instruments sold, but not yet purchased, at fair value | | | 15 | | | | 7 | |
| | |
Unsecured short-term borrowings | | | 212 | | | | 197 | |
| | |
Unsecured long-term borrowings | | | 323 | | | | 334 | |
| | |
Other liabilities and accrued expenses | | | 959 | | | | 803 | |
Total | | | $3,079 | | | | $2,196 | |
In the table above:
Consolidated VIEs are aggregated based on principal business activity and their assetsAssets and liabilities are presented net of intercompany eliminations. The majorityeliminations and exclude the benefit of offsetting financial instruments that are held to mitigate the assets in principal-protected notes VIEs are intercompany and are eliminated in consolidation.risks associated with the firm’s variable interests.
VIEs in which the firm holds a majority voting interest are excluded if (i) the VIE meets the definition of a business and (ii) the VIE’s assets can be used for purposes other than the settlement of its obligations.
Substantially all the assets can only be used to settle obligations of the VIE.
| | | | |
| 52 | | Goldman Sachs March 2017 Form 10-Q | | |
THE GOLDMAN SACHS GROUP, INC. AND SUBSIDIARIES
Notes to Condensed Consolidated Financial Statements
(Unaudited)
The liabilitiestable below disaggregates, by principal business activity, the information for consolidated VIEs included in the summary table above.
| | | | | | | | |
| | | As of | |
$ in millions | |
| March
2017 |
| |
| December
2016 |
|
Real estate, credit-related and other investing | | | | | | | | |
Assets | | | | | | | | |
Cash and cash equivalents | | | $ 323 | | | | $ 300 | |
| | |
Loans receivable | | | 528 | | | | 603 | |
| | |
Financial instruments owned, at fair value | | | 1,917 | | | | 1,708 | |
| | |
Other assets | | | 580 | | | | 680 | |
Total | | | $ 3,348 | | | | $ 3,291 | |
Liabilities | | | | | | | | |
Other secured financings | | | $ 304 | | | | $ 284 | |
| | |
Payables to brokers, dealers and clearing organizations | | | 9 | | | | 1 | |
| | |
Financial instruments sold, but not yet purchased, at fair value | | | 15 | | | | 7 | |
| | |
Other liabilities and accrued expenses | | | 959 | | | | 803 | |
Total | | | $ 1,287 | | | | $ 1,095 | |
CDOs, mortgage-backed and other asset-backed | | | | | |
Assets | | | | | | | | |
Cash and cash equivalents | | | $ 674 | | | | $ — | |
| | |
Financial instruments owned, at fair value | | | 251 | | | | 253 | |
| | |
Other assets | | | 9 | | | | 2 | |
Total | | | $ 934 | | | | $ 255 | |
Liabilities | | | | | | | | |
Other secured financings | | | $ 825 | | | | $ 139 | |
Total | | | $ 825 | | | | $ 139 | |
Principal-protected notes | | | | | | | | |
Assets | | | | | | | | |
Financial instruments owned, at fair value | | | $ 88 | | | | $ 86 | |
Total | | | $ 88 | | | | $ 86 | |
Liabilities | | | | | | | | |
Other secured financings | | | $ 432 | | | | $ 431 | |
| | |
Unsecured short-term borrowings | | | 212 | | | | 197 | |
| | |
Unsecured long-term borrowings | | | 323 | | | | 334 | |
Total | | | $ 967 | | | | $ 962 | |
In the table above:
The majority of the assets in principal-protected notes VIEs are intercompany and are eliminated in consolidation.
Creditors and beneficial interest holders of real estate, credit-related and other investing VIEs, and CDOs, mortgage-backed and other asset-backed VIEs do not have recourse to the general credit of the firm.
Assets and liabilities exclude the benefit of offsetting financial instruments that are held to mitigate the risks associated with the firm’s variable interests.
Note 13.
Other Assets
Other assets are generally less liquid, non-financialnonfinancial assets. The table below presents other assets by type.
| | | | | | | | |
| | | As of | |
| $ in millions | |
| March
2016 |
| |
| December
2015 |
|
Property, leasehold improvements and equipment | | | $10,612 | | | | $ 9,956 | |
| | |
Goodwill and identifiable intangible assets | | | 4,136 | | | | 4,148 | |
| | |
Income tax-related assets | | | 5,783 | | | | 5,548 | |
| | |
Equity-method investments 1 | | | 237 | | | | 258 | |
| | |
Miscellaneous receivables and other 2, 3 | | | 3,500 | | | | 5,308 | |
Total | | | $24,268 | | | | $25,218 | |
1. | Excludes investments accounted for at fair value under the fair value option where the firm would otherwise apply the equity method of accounting of $7.11 billion and $6.59 billion as of March 2016 and December 2015, respectively, all of which are included in “Financial instruments owned, at fair value.” The firm has generally elected the fair value option for such investments acquired after the fair value option became available.
|
2. | Includes $599 million and $581 million of investments in qualified affordable housing projects as of March 2016 and December 2015, respectively.
|
3. | The decrease from December 2015 to March 2016 reflects the sale of assets previously classified as held for sale related to certain of the firm’s consolidated investments.
|
| | | | | | | | |
| | | As of | |
| $ in millions | |
| March
2017 |
| |
| December
2016 |
|
Property, leasehold improvements and equipment | | | $13,372 | | | | $12,070 | |
| | |
Goodwill and identifiable intangible assets | | | 4,067 | | | | 4,095 | |
| | |
Income tax-related assets | | | 5,592 | | | | 5,550 | |
| | |
Equity-method investments | | | 221 | | | | 219 | |
| | |
Miscellaneous receivables and other | | | 3,592 | | | | 3,547 | |
Total | | | $26,844 | | | | $25,481 | |
| | | | |
| | Goldman Sachs March 2016 Form 10-Q | | 53 |
THE GOLDMAN SACHS GROUP, INC. AND SUBSIDIARIES
Notes to Condensed Consolidated Financial Statements
(Unaudited)
In the table above:
Equity-method investments exclude investments accounted for at fair value under the fair value option where the firm would otherwise apply the equity method of accounting of $8.56 billion and $7.92 billion as of March 2017 and December 2016, respectively, all of which are included in “Financial instruments owned, at fair value.” The firm has generally elected the fair value option for such investments acquired after the fair value option became available.
Miscellaneous receivables and other includes $689 million and $682 million of investments in qualified affordable housing projects as of March 2017 and December 2016, respectively.
Property, Leasehold Improvements and Equipment
Property, leasehold improvements and equipment in the table above is net of accumulated depreciation and amortization of $7.95$7.92 billion and $7.77$7.68 billion as of March 20162017 and December 2015,2016, respectively. Property, leasehold improvements and equipment included $5.96$5.70 billion and $5.93$5.96 billion as of March 20162017 and December 2015,2016, respectively, related to property, leasehold improvements and equipment that the firm uses in connection with its operations. The remainder is held by investment entities, including VIEs, consolidated by the firm. Substantially all property and equipment is depreciated on a straight-line basis over the useful life of the asset. Leasehold improvements are amortized on a straight-line basis over the useful life of the improvement or the term of the lease, whichever is shorter. CertainCapitalized costs of software developed or obtained for internal use are capitalized and amortized on a straight-line basis over the useful life of the software.three years.
Goodwill and Identifiable Intangible Assets
The tablestable below presentpresents the carrying valuesvalue of goodwill andgoodwill.
| | | | | | | | |
| | | As of | |
| $ in millions | |
| March
2017 |
| |
| December
2016 |
|
Investment Banking: | | | | | | | | |
Financial Advisory | | | $ 98 | | | | $ 98 | |
| | |
Underwriting | | | 183 | | | | 183 | |
| | |
Institutional Client Services: | | | | | | | | |
FICC Client Execution | | | 269 | | | | 269 | |
| | |
Equities client execution | | | 2,403 | | | | 2,403 | |
| | |
Securities Services | | | 105 | | | | 105 | |
| | |
Investing & Lending | | | 2 | | | | 2 | |
| | |
Investment Management | | | 604 | | | | 606 | |
Total | | | $3,664 | | | | $3,666 | |
| | | | |
| | Goldman Sachs March 2017 Form 10-Q | | 53 |
THE GOLDMAN SACHS GROUP, INC. AND SUBSIDIARIES
Notes to Condensed Consolidated Financial Statements
(Unaudited)
The table below presents the carrying value of identifiable intangible assets.
| | | | | | | | |
| | | Goodwill as of | |
| $ in millions | |
| March
2016 |
| |
| December
2015 |
|
Investment Banking: | | | | | | | | |
Financial Advisory | | | $ 98 | | | | $ 98 | |
| | |
Underwriting | | | 183 | | | | 183 | |
| | |
Institutional Client Services: | | | | | | | | |
Fixed Income, Currency and Commodities Client Execution | | | 269 | | | | 269 | |
| | |
Equities Client Execution | | | 2,404 | | | | 2,402 | |
| | |
Securities Services | | | 105 | | | | 105 | |
| | |
Investing & Lending | | | 2 | | | | 2 | |
| | |
Investment Management | | | 598 | | | | 598 | |
Total | | | $3,659 | | | | $3,657 | |
| |
| | | Identifiable Intangible Assets as of | |
| $ in millions | |
| March
2016 |
| |
| December
2015 |
|
Institutional Client Services: | | | | | | | | |
Fixed Income, Currency and Commodities Client Execution | | | $ 73 | | | | $ 92 | |
| | |
Equities Client Execution | | | 189 | | | | 193 | |
| | |
Investing & Lending | | | 91 | | | | 75 | |
| | |
Investment Management | | | 124 | | | | 131 | |
Total | | | $ 477 | | | | $ 491 | |
| | | | | | | | |
| | | As of | |
| $ in millions | |
| March
2017 |
| |
| December
2016 |
|
Institutional Client Services: | | | | | | | | |
FICC Client Execution | | | $ 49 | | | | $ 65 | |
| | |
Equities client execution | | | 128 | | | | 141 | |
| | |
Investing & Lending | | | 114 | | | | 105 | |
| | |
Investment Management | | | 112 | | | | 118 | |
Total | | | $403 | | | | $429 | |
Goodwill. Goodwill is the cost of acquired companies in excess of the fair value of net assets, including identifiable intangible assets, at the acquisition date.
Goodwill is assessed for impairment annually in the fourth quarter or more frequently if events occur or circumstances change that indicate an impairment may exist. When assessing goodwill for impairment, first, qualitative factors are assessed to determine whether it is more likely than not that the fair value of a reporting unit is less than its carrying amount.value. If the results of the qualitative assessment are not conclusive, a quantitative goodwill test is performed. The quantitative goodwill test consists of two steps:
The first step compares the estimated fair value of each reporting unit with its estimated net book value (including goodwill and identifiable intangible assets). If the reporting unit’s estimated fair value exceeds its estimated net book value, goodwill is not impaired.
If the estimated fair value of a reporting unit is less than its estimated net book value, the second step of the goodwill test is performed to measure the amount of impairment, if any. An impairment is equal to the excess of the carrying amount of goodwill over its fair value.
Goodwill was tested for impairment, using a quantitative test, during the fourth quarter of 2015. The estimated fair value of each of the reporting units exceeded its respective net book value. Accordingly, goodwill was not impaired and step two of the quantitative goodwill test was not performed.
To estimate the fair value of each reporting unit, a relative value technique wasis used because the firm believes market participants would use this technique to value the firm’s reporting units. The relative value technique applies observable price-to-earnings multiples or price-to-book multiples and projected return on equity of comparable competitors to reporting units’ net earnings or net book value. The net book value of each reporting unit reflects an allocation of total shareholders’ equity and represents the estimated amount of total shareholders’ equity required to support the activities of the reporting unit under currently applicable regulatory capital requirements.
If the estimated fair value of a reporting unit is less than its estimated net book value, the second step of the goodwill test is performed to measure the amount of impairment, if any. An impairment is equal to the excess of the carrying value of goodwill over its fair value.
During the fourth quarter of 2016, the firm assessed goodwill for impairment using a qualitative assessment. Multiple factors were assessed with respect to each of the firm’s reporting units to determine whether it was more likely than not that the fair value of any of these reporting units was less than its carrying value.
As a result of the qualitative assessment, the firm determined that it was more likely than not that the fair value of each of the reporting units exceeded its respective carrying value.
Notwithstanding the results of the qualitative assessment, since the 2015 quantitative goodwill test determined that the estimated fair value of the FICC Client Execution reporting unit was not substantially in excess of its carrying value, the firm also performed a quantitative test on this reporting unit during the fourth quarter of 2016. In the quantitative test, the estimated fair value of the FICC Client Execution reporting unit substantially exceeded its carrying value.
Therefore, the firm determined that goodwill for all reporting units was not impaired.
There were no events or changes in circumstances during the three months ended March 20162017 that would indicate that it was more likely than not that the fair value of each of the reporting units did not exceed its respective carrying amountvalue as of March 2016.2017.
Identifiable Intangible Assets. The table below presents the gross carrying value, accumulated amortization and net carrying value of identifiable intangible assets.
| | | | | | | | |
| | | As of | |
| $ in millions | |
| March
2017 |
| |
| December
2016 |
|
Customer lists | | | | | | | | |
Gross carrying value | | | $ 1,065 | | | | $ 1,065 | |
| | |
Accumulated amortization | | | (853 | ) | | | (837 | ) |
Net carrying value | | | 212 | | | | 228 | |
| | |
Other | | | | | | | | |
Gross carrying value | | | 554 | | | | 543 | |
| | |
Accumulated amortization | | | (363 | ) | | | (342 | ) |
Net carrying value | | | 191 | | | | 201 | |
| | |
Total | | | | | | | | |
Gross carrying value | | | 1,619 | | | | 1,608 | |
| | |
Accumulated amortization | | | (1,216 | ) | | | (1,179 | ) |
Net carrying value | | | $ 403 | | | | $ 429 | |
In the table above:
The net carrying value of other intangibles primarily includes intangible assets related to acquired leases and commodities transportation rights.
During the three months ended March 2017 and March 2016, the firm acquired $20 million and $34 million, respectively, of intangible assets, primarily related to acquired leases, with a weighted average amortization period of three years.
Substantially all of the firm’s identifiable intangible assets are considered to have finite useful lives and are amortized over their estimated useful lives generally using the straight-line method.
| | | | |
| 54 | | Goldman Sachs March 20162017 Form 10-Q | | |
THE GOLDMAN SACHS GROUP, INC. AND SUBSIDIARIES
Notes to Condensed Consolidated Financial Statements
(Unaudited)
Identifiable Intangible Assets. The table below presents the gross carrying amount, accumulated amortization and net carrying amount of identifiable intangible assets and their weighted average remaining useful lives.
| | | | | | | | | | |
| | | As of | |
| $ in millions | |
| March
2016 |
| | Weighted Average
Remaining Useful
Lives (years) | |
| December
2015 |
|
Customer lists | | | | | | | | | | |
Gross carrying amount | | | $ 1,065 | | | | | | $ 1,072 | |
| | |
Accumulated amortization | | | (787 | ) | | | | | (777 | ) |
Net carrying amount | | | 278 | | | 6 | | | 295 | |
| | |
Commodities-related | | | | | | | | | | |
Gross carrying amount | | | 184 | | | | | | 185 | |
| | |
Accumulated amortization | | | (111 | ) | | | | | (94 | ) |
Net carrying amount | | | 73 | | | 7 | | | 91 | |
| | |
Other | | | | | | | | | | |
Gross carrying amount | | | 298 | | | | | | 264 | |
| | |
Accumulated amortization | | | (172 | ) | | | | | (159 | ) |
Net carrying amount | | | 126 | | | 6 | | | 105 | |
| | |
Total | | | | | | | | | | |
Gross carrying amount | | | 1,547 | | | | | | 1,521 | |
| | |
Accumulated amortization | | | (1,070 | ) | | | | | (1,030 | ) |
Net carrying amount | | | $ 477 | | | 6 | | | $ 491 | |
In the table above:
The net carrying amount of commodities-related intangibles primarily includes transportation rights.
The net carrying amount of other intangibles primarily includes intangible assets related to acquired leases.
Substantially all of the firm’s identifiable intangible assets are considered to have finite useful lives and are amortized over their estimated useful lives using the straight-line method or based on economic usage for certain customer lists and commodities-related intangibles.
The tables below present details about amortization of identifiable intangible assets.
| | | | Three Months
Ended March | | | Three Months Ended March | |
| $ in millions | | | 2016 | | | | 2015 | | | | 2017 | | | | 2016 | |
Amortization | | | $ 47 | | | | $ 43 | | | | $41 | | | | $47 | |
| $ in millions Estimated future amortization | | As of
March 2016 | | |
Remainder of 2016 | | | $ 93 | | |
| | | |
2017 | | | 121 | | |
| $ in millions | | |
| As of
March 2017 |
|
Estimated future amortization | | | |
Remainder of 2017 | | | | $ 94 | |
| | | | | |
2018 | | | 103 | | | | $116 | |
| | | | | |
2019 | | | 71 | | | | $ 82 | |
| | | | | |
2020 | | | 25 | | | | $ 30 | |
| | | | | |
2021 | | | 17 | | | | $ 21 | |
| | | | |
2022 | | | | $ 16 | |
Impairments
The firm tests property, leasehold improvements and equipment, identifiable intangible assets and other assets for impairment whenever events or changes in circumstances suggest that an asset’s or asset group’s carrying value may not be fully recoverable. To the extent the carrying value of an asset exceeds the projected undiscounted cash flows expected to result from the use and eventual disposal of the asset or asset group, the firm determines the asset is impaired and records an impairment equal to the difference between the estimated fair value and the carrying value of the asset or asset group. In addition, the firm will recognize an impairment prior to the sale of an asset if the carrying value of the asset exceeds its estimated fair value.
During the quarters ended March 20162017 and March 2015,2016, impairments were not material to the firm’s results of operations or financial condition.
Note 14.
Deposits
The table below presents the types and sources of the firm’s deposits.
| | | | | | | | | | | | |
| $ in millions | |
| Savings and
Demand |
| | | Time | | | | Total | |
As of March 2017 | | | | | | | | | | | | |
Private bank and online retail | | | $61,589 | | | | $ 4,740 | | | | $ 66,329 | |
| | |
Brokered certificates of deposit | | | — | | | | 32,630 | | | | 32,630 | |
| | |
Deposit sweep programs | | | 16,012 | | | | — | | | | 16,012 | |
| | |
Institutional | | | 1 | | | | 12,957 | | | | 12,958 | |
Total | | | $77,602 | | | | $50,327 | | | | $127,929 | |
As of December 2016 | | | | | | | | | | | | |
Private bank and online retail | | | $61,166 | | | | $ 4,437 | | | | $ 65,603 | |
| | |
Brokered certificates of deposit | | | — | | | | 34,905 | | | | 34,905 | |
| | |
Deposit sweep programs | | | 16,019 | | | | — | | | | 16,019 | |
| | |
Institutional | | | 12 | | | | 7,559 | | | | 7,571 | |
Total | | | $77,197 | | | | $46,901 | | | | $124,098 | |
In the table above:
Substantially all deposits are interest-bearing.
Savings and demand deposits have no stated maturity.
Time deposits include $19.48 billion and $13.78 billion as of March 2017 and December 2016, respectively, of deposits accounted for at fair value under the fair value option. See Note 8 for further information about deposits accounted for at fair value.
Time deposits have a weighted average maturity of approximately 2 years and 2.5 years as of March 2017 and December 2016, respectively.
Deposit sweep programs represent long-term contractual agreements with several U.S. broker-dealers who sweep client cash to FDIC-insured deposits.
Deposits insured by the FDIC as of March 2017 and December 2016 were approximately $68.27 billion and $69.91 billion, respectively.
The table below presents deposits held in U.S. and non-U.S. offices. Substantially all U.S. deposits were held at GS Bank USA and substantially all non-U.S. deposits were held at Goldman Sachs International Bank (GSIB).
| | | | | | | | |
| | | As of | |
| $ in millions | |
| March
2017 |
| |
| December
2016 |
|
U.S. offices | | | $105,207 | | | | $106,037 | |
| | |
Non-U.S. offices | | | 22,722 | | | | 18,061 | |
Total | | | $127,929 | | | | $124,098 | |
The table below presents maturities of time deposits held in U.S. and non-U.S. offices.
| | | | | | | | | | | | |
| | | As of March 2017 | |
| $ in millions | | | U.S. | | | | Non-U.S. | | | | Total | |
Remainder of 2017 | | | $ 8,541 | | | | $11,141 | | | | $19,682 | |
| | |
2018 | | | 6,257 | | | | 3,072 | | | | 9,329 | |
| | |
2019 | | | 5,403 | | | | — | | | | 5,403 | |
| | |
2020 | | | 4,087 | | | | — | | | | 4,087 | |
| | |
2021 | | | 3,545 | | | | 39 | | | | 3,584 | |
| | |
2022 | | | 3,232 | | | | 78 | | | | 3,310 | |
| | |
2023 - thereafter | | | 4,704 | | | | 228 | | | | 4,932 | |
Total | | | $35,769 | | | | $14,558 | | | | $50,327 | |
As of March 2017, deposits in U.S. and non-U.S. offices include $2.20 billion and $12.19 billion, respectively, of time deposits that were greater than $250,000.
| | | | |
| | | Goldman Sachs March 20162017 Form 10-Q | | 55 |
THE GOLDMAN SACHS GROUP, INC. AND SUBSIDIARIES
Notes to Condensed Consolidated Financial Statements
(Unaudited)
Note 14.
Deposits
The table below presents deposits held in U.S. and non-U.S. offices, substantially all of which were interest-bearing. Substantially all U.S. deposits were held at Goldman Sachs Bank USA (GS Bank USA) and substantially all non-U.S. deposits were held at Goldman Sachs International Bank (GSIB).
| | | | | | | | |
| | | As of | |
| $ in millions | |
| March
2016 |
| |
| December
2015 |
|
U.S. offices | | | $ 87,422 | | | | $81,920 | |
| | |
Non-U.S. offices | | | 17,444 | | | | 15,599 | |
Total | | | $104,866 | | | | $97,519 | |
The table below presents maturities of time deposits held in U.S. and non-U.S. offices.
| | | | | | | | | | | | |
| | | As of March 2016 | |
| $ in millions | | | U.S. | | | | Non-U.S. | | | | Total | |
Remainder of 2016 | | | $ 7,934 | | | | $8,442 | | | | $16,376 | |
| | |
2017 | | | 7,267 | | | | 875 | | | | 8,142 | |
| | |
2018 | | | 4,698 | | | | 69 | | | | 4,767 | |
| | |
2019 | | | 4,654 | | | | — | | | | 4,654 | |
| | |
2020 | | | 3,689 | | | | — | | | | 3,689 | |
| | |
2021 | | | 2,933 | | | | 42 | | | | 2,975 | |
| | |
2022 - thereafter | | | 7,019 | | | | 136 | | | | 7,155 | |
Total | | | $38,194 | | | | $9,564 | | | | $47,758 | 1, 2 |
1. | Includes $1.95 billion and $7.78 billion of deposits greater than $250,000 in U.S. and non-U.S. offices, respectively.
|
2. | Includes $15.03 billion of time deposits accounted for at fair value under the fair value option. See Note 8 for further information about deposits accounted for at fair value.
|
As of March 2016 and December 2015, deposits include $57.11 billion and $54.51 billion, respectively, offirm’s savings and demand deposits which have no stated maturity, and wereare recorded based on the amount of cash received plus accrued interest, which approximates fair value. In addition, the firm designates certain derivatives as fair value hedges to convert substantially alla majority of its time deposits not accounted for at fair value from fixed-rate obligations into floating-rate obligations. Accordingly, the carrying value of time deposits approximated fair value as of March 20162017 and December 2015.2016. While these savings and demand deposits and time deposits are carried at amounts that approximate fair value, they are not accounted for at fair value under the fair value option or at fair value in accordance with other U.S. GAAP and therefore are not included in the firm’s fair value hierarchy in Notes 6 through 8. Had these deposits been included in the firm’s fair value hierarchy, they would have been classified in level 2 as of March 20162017 and December 2015.2016.
Note 15.
Short-Term Borrowings
The table below presents details about the firm’s short-term borrowings.
| | | | As of | | | As of | |
| $ in millions | |
| March
2016 |
| |
| December
2015 |
| |
| March
2017 |
| |
| December
2016 |
|
Other secured financings (short-term) | | | $15,149 | | | | $14,233 | | | | $11,249 | | | | $13,118 | |
| | | | | |
Unsecured short-term borrowings | | | 46,691 | | | | 42,787 | | | | 35,872 | | | | 39,265 | |
Total | | | $61,840 | | | | $57,020 | | | | $47,121 | | | | $52,383 | |
See Note 10 for information about other secured financings.
Unsecured short-term borrowings include the portion of unsecured long-term borrowings maturing within one year of the financial statement date and unsecured long-term borrowings that are redeemable within one year of the financial statement date at the option of the holder.
The firm accounts for commercial paper and certain hybrid financial instruments at fair value under the fair value option. See Note 8 for further information about unsecured short-term borrowings that are accounted for at fair value. The carrying value of unsecured short-term borrowings that are not recorded at fair value generally approximates fair value due to the short-term nature of the obligations. While these unsecured short-term borrowings are carried at amounts that approximate fair value, they are not accounted for at fair value under the fair value option or at fair value in accordance with other U.S. GAAP and therefore are not included in the firm’s fair value hierarchy in Notes 6 through 8. Had these borrowings been included in the firm’s fair value hierarchy, substantially all would have been classified in level 2 as of March 20162017 and December 2015.2016.
The table below presents details about the firm’s unsecured short-term borrowings. The
| | | | | | | | |
| | | As of | |
| $ in millions | |
| March
2017 |
| |
| December
2016 |
|
Current portion of unsecured long-term borrowings | | | $ 20,404 | | | | $ 23,528 | |
| | |
Hybrid financial instruments | | | 11,619 | | | | 11,700 | |
| | |
Other unsecured short-term borrowings | | | 3,849 | | | | 4,037 | |
Total | | | $ 35,872 | | | | $ 39,265 | |
Weighted average interest rate | | | 1.96% | | | | 1.68% | |
In the table above, the weighted average interest rates for these borrowings include the effect of hedging activities and exclude financial instruments accounted for at fair value under the fair value option. See Note 7 for further information about hedging activities.
Note 16.
| | | | | | | | |
| | | As of | |
| $ in millions | |
| March
2016 |
| |
| December
2015 |
|
Current portion of unsecured long-term borrowings | | | $28,678 | | | | $25,373 | |
| | |
Hybrid financial instruments | | | 13,765 | | | | 12,956 | |
| | |
Commercial paper | | | 133 | | | | 208 | |
| | |
Other short-term borrowings | | | 4,115 | | | | 4,250 | |
Total | | | $46,691 | | | | $42,787 | |
Weighted average interest rate | | | 1.85% | | | | 1.52% | |
Long-Term Borrowings
The table below presents details about the firm’s long-term borrowings.
| | | | | | | | |
| | | As of | |
| $ in millions | |
| March
2017 |
| |
| December
2016 |
|
Other secured financings (long-term) | | | $ 11,127 | | | | $ 8,405 | |
| | |
Unsecured long-term borrowings | | | 199,370 | | | | 189,086 | |
Total | | | $210,497 | | | | $197,491 | |
See Note 10 for information about other secured financings.
The table below presents unsecured long-term borrowings extending through 2056, which consists principally of senior borrowings.
| | | | | | | | | | | | |
| $ in millions | |
| U.S.
Dollar |
| |
| Non-U.S.
Dollar |
| | | Total | |
As of March 2017 | | | | | | | | | | | | |
Fixed-rate obligations | | | $ 97,757 | | | | $ 31,811 | | | | $129,568 | |
| | |
Floating-rate obligations | | | 40,672 | | | | 29,130 | | | | 69,802 | |
Total | | | $138,429 | | | | $ 60,941 | | | | $199,370 | |
As of December 2016 | | | | | | | | | | | | |
Fixed-rate obligations | | | $ 96,113 | | | | $ 32,159 | | | | $128,272 | |
| | |
Floating-rate obligations | | | 36,748 | | | | 24,066 | | | | 60,814 | |
Total | | | $132,861 | | | | $ 56,225 | | | | $189,086 | |
| | | | |
| 56 | | Goldman Sachs March 20162017 Form 10-Q | | |
THE GOLDMAN SACHS GROUP, INC. AND SUBSIDIARIES
Notes to Condensed Consolidated Financial Statements
(Unaudited)
Note 16.
Long-Term BorrowingsIn the table above:
The table below presents details about the firm’s long-term borrowings.
| | | | | | | | |
| | | As of | |
| $ in millions | |
| March
2016 |
| |
| December
2015 |
|
Other secured financings (long-term) | | | $ 11,026 | | | | $ 10,520 | |
| | |
Unsecured long-term borrowings | | | 180,159 | | | | 175,422 | |
Total | | | $191,185 | | | | $185,942 | |
See Note 10 for information about other secured financings.
The table below presents unsecured long-term borrowings extending through 2061 and consisting principally of senior borrowings. Floating interest rates are generally are based on LIBOR or OIS.Overnight Index Swap Rate. Equity-linked and indexed instruments are included in floating-rate obligations.
| | | | | | | | | | | | |
| $ in millions | |
| U.S.
Dollar |
| |
| Non-U.S.
Dollar |
| | | Total | |
As of March 2016 | | | | | | | | | | | | |
Fixed-rate obligations 1 | | | $ 92,405 | | | | $31,948 | | | | $124,353 | |
| | |
Floating-rate obligations | | | 34,825 | | | | 20,981 | | | | 55,806 | |
Total | | | $127,230 | | | | $52,929 | | | | $180,159 | |
As of December 2015 | | | | | | | | | | | | |
Fixed-rate obligations 1 | | | $ 92,190 | | | | $30,703 | | | | $122,893 | |
| | |
Floating-rate obligations | | | 33,543 | | | | 18,986 | | | | 52,529 | |
Total | | | $125,733 | | | | $49,689 | | | | $175,422 | |
Interest rates on U.S. dollar-denominated debt ranged from 1.60% to 10.04% (with a weighted average rate of 4.47%) and 1.60% to 10.04% (with a weighted average rate of 4.57%) as of March 2017 and December 2016, respectively.
1. | Interest rates on U.S. dollar-denominated debt ranged from 1.60% to 10.04% (with a weighted average rate of 4.82%) and 1.60% to 10.04% (with a weighted average rate of 4.89%) as of March 2016 and December 2015, respectively. Interest rates on non-U.S. dollar-denominated debt ranged from 0.02% to 13.00% (with a weighted average rate of 3.43%) and 0.40% to 13.00% (with a weighted average rate of 3.81%) as of March 2016 and December 2015, respectively.
|
Interest rates on non-U.S. dollar-denominated debt ranged from 0.07% to 13.00% (with a weighted average rate of 3.01%) and 0.02% to 13.00% (with a weighted average rate of 3.05%) as of March 2017 and December 2016, respectively.
The table below presents unsecured long-term borrowings by maturity date.
| | | | |
| $ in millions | |
| As of
March 2016 |
|
2017 | | | $ 14,529 | |
| | |
2018 | | | 25,382 | |
| | |
2019 | | | 18,722 | |
| | |
2020 | | | 19,125 | |
| | |
2021 | | | 12,695 | |
| | |
2022 - thereafter | | | 89,706 | |
Total 1 | | | $180,159 | |
1. | Includes $9.91 billion of adjustments to the carrying value of certain unsecured long-term borrowings resulting from the application of hedge accounting by year of maturity as follows: $250 million in 2017, $620 million in 2018, $518 million in 2019, $542 million in 2020, $814 million in 2021, and $7.17 billion in 2022 and thereafter.
|
| | | | |
| $ in millions | |
| As of
March 2017 |
|
2018 | | | $ 20,246 | |
| | |
2019 | | | 26,790 | |
| | |
2020 | | | 21,749 | |
| | |
2021 | | | 20,969 | |
| | |
2022 | | | 16,723 | |
| | |
2023 - thereafter | | | 92,893 | |
Total | | | $199,370 | |
In the table above:
Unsecured long-term borrowings maturing within one year of the financial statement date and unsecured long-term borrowings that are redeemable within one year of the financial statement date at the option of the holdersholder are excluded from the table as they are included as unsecuredin “Unsecured short-term borrowings.”
Unsecured long-term borrowings that are repayable prior to maturity at the option of the firm are reflected at their contractual maturity dates.
Unsecured long-term borrowings that are redeemable prior to maturity at the option of the holdersholder are reflected at the earliest dates such options become exercisable.
Unsecured long-term borrowings include $6.93 billion of adjustments to the carrying value of certain unsecured long-term borrowings resulting from the application of hedge accounting by year of maturity as follows: $190 million in 2018, $292 million in 2019, $314 million in 2020, $551 million in 2021, $(20) million in 2022, and $5.60 billion in 2023 and thereafter.
The firm designates certain derivatives as fair value hedges to convert a majority of the amountportion of its fixed-rate unsecured long-term borrowings not accounted for at fair value into floating-rate obligations. Accordingly, excluding the cumulative impact of changes in the firm’s credit spreads, the carrying value of unsecured long-term borrowings approximated fair value as of March 2016 and December 2015. See Note 7 for further information about hedging activities. ForThe table below presents unsecured long-term borrowings, after giving effect to such hedging activities.
| | | | | | | | |
| | | As of | |
| $ in millions | |
| March
2017 |
| |
| December
2016 |
|
Fixed-rate obligations: | | | | | | | | |
At fair value | | | $ 145 | | | | $ 150 | |
| | |
At amortized cost | | | 75,019 | | | | 74,718 | |
| | |
Floating-rate obligations: | | | | | | | | |
At fair value | | | 31,930 | | | | 29,260 | |
| | |
At amortized cost | | | 92,276 | | | | 84,958 | |
Total | | | $199,370 | | | | $189,086 | |
In the table above, the weighted average interest rates on the aggregate amounts were 2.88% (3.90% related to fixed-rate obligations and 2.05% related to floating-rate obligations) and 2.87% (3.90% related to fixed-rate obligations and 1.97% related to floating-rate obligations) as of March 2017 and December 2016, respectively. These rates exclude financial instruments accounted for at fair value under the fair value option.
As of March 2017 and December 2016, the carrying value of unsecured long-term borrowings for which the firm did not elect the fair value option the cumulative impact due to changes in the firm’s own credit spreads would be a decrease of less than 1% and an increase of less than 1% in the carrying value of such borrowings as of March 2016 and December 2015, respectively.approximated fair value. As these borrowings are not accounted for at fair value under the fair value option or at fair value in accordance with other U.S. GAAP, their fair value is not included in the firm’s fair value hierarchy in Notes 6 through 8. Had these borrowings been included in the firm’s fair value hierarchy, substantially all would have been classified in level 2 as of March 20162017 and December 2015.2016.
| | | | |
| | Goldman Sachs March 2016 Form 10-Q | | 57 |
THE GOLDMAN SACHS GROUP, INC. AND SUBSIDIARIES
Notes to Condensed Consolidated Financial Statements
(Unaudited)
The table below presents unsecured long-term borrowings, after giving effect to hedging activities that converted a majority of the amount of fixed-rate obligations to floating-rate obligations.
| | | | | | | | |
| | | As of | |
| $ in millions | |
| March
2016 |
| |
| December
2015 |
|
Fixed-rate obligations | | | | | | | | |
At fair value | | | $ 40 | | | | $ 21 | |
| | |
At amortized cost 1 | | | 62,158 | | | | 55,017 | |
| | |
Floating-rate obligations | | | | | | | | |
At fair value | | | 25,631 | | | | 22,252 | |
| | |
At amortized cost 1 | | | 92,330 | | | | 98,132 | |
Total | | | $180,159 | | | | $175,422 | |
1. | The weighted average interest rates on the aggregate amounts were 2.81% (4.14% related to fixed-rate obligations and 1.90% related to floating-rate obligations) and 2.73% (4.33% related to fixed-rate obligations and 1.84% related to floating-rate obligations) as of March 2016 and December 2015, respectively. These rates exclude financial instruments accounted for at fair value under the fair value option.
|
Subordinated Borrowings
Unsecured long-term borrowings include subordinated debt and junior subordinated debt. Junior subordinated debt is junior in right of payment to other subordinated borrowings, which are junior to senior borrowings. As of both March 20162017 and December 2015,2016, subordinated debt had maturities ranging from 20172018 to 2045. Subordinated debt that matures within one year of the financial statement date is included in “Unsecured short-term borrowings.”
| | | | |
| | Goldman Sachs March 2017 Form 10-Q | | 57 |
THE GOLDMAN SACHS GROUP, INC. AND SUBSIDIARIES
Notes to Condensed Consolidated Financial Statements
(Unaudited)
The table below presents details about the firm’s subordinated borrowings. The
| | | | | | | | | | | | |
| $ in millions | |
| Par
Amount |
| |
| Carrying
Amount |
| | | Rate | |
As of March 2017 | | | | | | | | | | | | |
Subordinated debt | | | $14,827 | | | | $17,280 | | | | 4.29% | |
| | |
Junior subordinated debt | | | 1,360 | | | | 1,807 | | | | 5.72% | |
Total | | �� | $16,187 | | | | $19,087 | | | | 4.41% | |
As of December 2016 | | | | | | | | | | | | |
Subordinated debt | | | $15,058 | | | | $17,604 | | | | 4.29% | |
| | |
Junior subordinated debt | | | 1,360 | | | | 1,809 | | | | 5.70% | |
Total | | | $16,418 | | | | $19,413 | | | | 4.41% | |
In the table above, the rate is the weighted average interest ratesrate for these borrowings, includeincluding the effect of fair value hedges used to convert these fixed-rate obligations into floating-rate obligations. See Note 7 for further information about hedging activities. The rates exclude financial instruments accounted for at fair value under the fair value option.
| | | | | | | | | | | | |
| $ in millions | |
| Par
Amount |
| |
| Carrying
Amount |
| | | Rate | |
As of March 2016 | | | | | | | | | | | | |
Subordinated debt | | | $15,983 | | | | $19,033 | | | | 4.12% | |
| | |
Junior subordinated debt | | | 1,360 | | | | 1,815 | | | | 5.80% | |
Total subordinated borrowings | | | $17,343 | | | | $20,848 | | | | 4.26% | |
As of December 2015 | | | | | | | | | | | | |
Subordinated debt | | | $18,004 | | | | $20,784 | | | | 3.79% | |
| | |
Junior subordinated debt | | | 1,359 | | | | 1,817 | | | | 5.77% | |
Total subordinated borrowings | | | $19,363 | | | | $22,601 | | | | 3.93% | |
Junior Subordinated Debt
Junior Subordinated Debt Held by 2012 Trusts. In 2012, the Vesey Street Investment Trust I (Vesey Street Trust) and the Murray Street Investment Trust I (together, the 2012 Trusts)(Murray Street Trust) issued an aggregate of $2.25 billion of senior guaranteed trust securities to third parties. Theparties, the proceeds of that offeringwhich were used to purchase $1.75 billion of junior subordinated debt issued by Group Inc. that pays interest semi-annually at a fixed annual rate of 4.647% and matures on March 9, 2017, and $500 million of junior subordinated debt issued by Group Inc. that pays interest semi-annually at a fixed annual rate of 4.404% and matures on September 1, 2016. During 2014, the firm exchanged $175 million of the senior guaranteed trust securities held by the firm for $175 million of junior subordinated debt held by the Murray Street Investment Trust I. Following the exchange, these senior guaranteed trust securities and junior subordinated debt were extinguished.
The 2012 Trusts purchased the junior subordinated debt from Goldman Sachs Capital II and Goldman Sachs Capital III (APEX Trusts). The APEX Trusts used the proceeds from such sales to purchase shares of Group Inc.’s Perpetual Non-Cumulative Preferred Stock, Series E (Series E Preferred Stock) and Perpetual Non-Cumulative Preferred Stock, Series F (Series F Preferred Stock).
The 2012 Trusts are required to pay distributions on their senior guaranteed trust securities in the same amounts and on the same dates that they are scheduled to receive interest on the junior subordinated debt they hold, and are required to redeem their respective senior guaranteed trust securities upon the maturity or earlier redemption of the junior subordinated debt they hold.
The firm has the right to defer payments on the junior subordinated debt, subject to limitations. During any such deferral period, the firm will not be permitted to, among other things, pay dividends on or make certain repurchases of its common or preferred stock. However, as Group Inc. fully and unconditionally guarantees the payment of the distribution and redemption amounts when due on a senior basis on the senior guaranteed trust securities issued by the 2012 Trusts, ifVesey Street Trust and Murray Street Trust and the 2012 Trusts are unable to make scheduled distributions torelated junior subordinated debt matured during the holdersthird quarter of 2016 and the first quarter of 2017, respectively. As of December 2016, $1.45 billion of senior guaranteed trust securities underissued by the guarantee, Group Inc. would be obligated to make those payments. As such,Murray Street Trust and the related junior subordinated debt held by the 2012 Trusts for the benefit of investors, included in “Unsecured short-term borrowings” in the condensed consolidated statements of financial condition, is not classified as subordinated borrowings.were outstanding.
| | | | |
58 | | Goldman Sachs March 2016 Form 10-Q | | |
THE GOLDMAN SACHS GROUP, INC. AND SUBSIDIARIES
Notes to Condensed Consolidated Financial Statements
(Unaudited)
The APEX Trusts and the 2012 Trusts are Delaware statutory trusts sponsored by the firm and wholly-owned finance subsidiaries of the firm for regulatory and legal purposes but are not consolidated for accounting purposes.
The firm has covenanted in favor of the holders of Group Inc.’s 6.345% junior subordinated debt due February 15, 2034, that, subject to certain exceptions, the firm will not redeem or purchase the capital securities issued by the APEX Trusts, or shares of Group Inc.’s Series E or Series F Preferred Stock or shares of Group Inc.’s Series O Perpetual Non-Cumulative Preferred Stock if the redemption or purchase results in less than $253 million aggregate liquidation preference outstanding, prior to specified dates in 2022 for a price that exceeds a maximum amount determined by reference to the net cash proceeds that the firm has received from the sale of qualifying securities. During the first quarter of 2016, the firm exchanged a par amount of $1.32 billion (of which $672 million was exchanged in the first quarter of 2016) of APEX issued by the APEX Trusts for a corresponding redemption value of the Series E and Series F Preferred Stock, which was permitted under the covenants referenced above. See Note 19 for additional information about this exchange.
Junior Subordinated Debt Issued in Connection with Trust Preferred Securities. Group Inc. issued $2.84 billion of junior subordinated debt in 2004 to Goldman Sachs Capital I (Trust), a Delaware statutory trust. The Trust issued $2.75 billion of guaranteed preferred beneficial interests (Trust Preferred Securities) to third parties and $85 million of common beneficial interests to Group Inc. and used the proceeds from the issuances to purchase the junior subordinated debt from Group Inc. During 2014As of both March 2017 and the first quarter of 2015, the firm purchased $1.43 billion (par amount) of Trust Preferred Securities and delivered these securities, along with $44.2 million of common beneficial interests, to the Trust in exchange for a corresponding par amount of the junior subordinated debt. Following the exchanges, these Trust Preferred Securities, common beneficial interests and junior subordinated debt were extinguished. Subsequent to these extinguishments,December 2016, the outstanding par amount of junior subordinated debt held by the Trust was $1.36 billion and the outstanding par amount of Trust Preferred Securities and common beneficial interests issued by the Trust was $1.32 billion and $40.8 million, respectively. The Trust is a wholly-owned finance subsidiary of the firm for regulatory and legal purposes but is not consolidated for accounting purposes.
The firm pays interest semi-annually on the junior subordinated debt at an annual rate of 6.345% and the debt matures on February 15, 2034. The coupon rate and the payment dates applicable to the beneficial interests are the same as the interest rate and payment dates for the junior subordinated debt. The firm has the right, from time to time, to defer payment of interest on the junior subordinated debt, and therefore cause payment on the Trust’s preferred beneficial interests to be deferred, in each case up to ten consecutive semi-annual periods. During any such deferral period, the firm will not be permitted to, among other things, pay dividends on or make certain repurchases of its common stock. The Trust is not permitted to pay any distributions on the common beneficial interests held by Group Inc. unless all dividends payable on the preferred beneficial interests have been paid in full.
| | | | |
| 58 | | Goldman Sachs March 2017 Form 10-Q | | |
THE GOLDMAN SACHS GROUP, INC. AND SUBSIDIARIES
Notes to Condensed Consolidated Financial Statements
(Unaudited)
Note 17.
Other Liabilities and Accrued Expenses
The table below presents other liabilities and accrued expenses by type.
| | | | | | | | |
| | | As of | |
| $ in millions | |
| March
2016 |
| |
| December
2015 |
|
Compensation and benefits | | | $ 3,622 | | | | $ 8,149 | |
| | |
Noncontrolling interests | | | 387 | | | | 459 | |
| | |
Income tax-related liabilities | | | 1,213 | | | | 1,280 | |
| | |
Employee interests in consolidated funds | | | 136 | | | | 149 | |
| | |
Subordinated liabilities issued by consolidated VIEs | | | 529 | | | | 501 | |
| | |
Accrued expenses and other 1 | | | 7,426 | | | | 8,355 | |
Total | | | $13,313 | | | | $18,893 | |
1. | The decrease from December 2015 to March 2016 reflects the sale of liabilities previously classified as held for sale related to certain of the firm’s consolidated investments.
|
| | | | |
| | Goldman Sachs March 2016 Form 10-Q | | 59 |
THE GOLDMAN SACHS GROUP, INC. AND SUBSIDIARIES
Notes to Condensed Consolidated Financial Statements
(Unaudited)
| | | | | | | | |
| | | As of | |
| $ in millions | |
| March
2017 |
| |
| December
2016 |
|
Compensation and benefits | | | $ 3,471 | | | | $ 7,181 | |
| | |
Noncontrolling interests | | | 543 | | | | 506 | |
| | |
Income tax-related liabilities | | | 1,624 | | | | 1,794 | |
| | |
Employee interests in consolidated funds | | | 243 | | | | 77 | |
| | |
Subordinated liabilities of consolidated VIEs | | | 751 | | | | 584 | |
| | |
Accrued expenses and other | | | 4,557 | | | | 4,220 | |
Total | | | $ 11,189 | | | | $ 14,362 | |
Note 18.
Commitments, Contingencies and
Guarantees
Commitments
The table below presents the firm’s commitments by type.
| | | | As of | | | As of | |
| $ in millions | |
| March
2016 |
| |
| December
2015 |
| |
| March
2017 |
| |
| December
2016 |
|
Commitments to extend credit | | | | | | | | |
Commercial lending: | | | | | | | | |
Investment-grade | | | $ 67,876 | | | | $ 72,428 | | | | $ 74,351 | | | | $ 73,664 | |
| | | | | |
Non-investment-grade | | | 36,529 | | | | 41,277 | | | | 36,930 | | | | 34,878 | |
| | | | | |
Warehouse financing | | | 3,553 | | | | 3,453 | | | | 3,781 | | | | 3,514 | |
Total commitments to extend credit | | | 107,958 | | | | 117,158 | | | | 115,062 | | | | 112,056 | |
| | | | | |
Contingent and forward starting resale and securities borrowing agreements | | | 56,227 | | | | 28,874 | | | | 42,366 | | | | 25,348 | |
| | | | | |
Forward starting repurchase and secured lending agreements | | | 12,622 | | | | 5,878 | | | | 17,827 | | | | 8,939 | |
| | | | | |
Letters of credit | | | 352 | | | | 249 | | | | 406 | | | | 373 | |
| | | | | |
Investment commitments | | | 4,407 | | | | 6,054 | | | | 8,602 | | | | 8,444 | |
| | | | | |
Other | | | 5,201 | | | | 6,944 | | | | 4,848 | | | | 6,014 | |
Total commitments | | | $186,767 | | | | $165,157 | | | | $189,111 | | | | $161,174 | |
The table below presents the firm’s commitments by period of expiration.
| | | | | | | | | | | | | | | | |
| | | As of March 2016 | |
| $ in millions | |
| Remainder
of 2016 |
| |
| 2017 -
2018 |
| |
| 2019 -
2020 |
| |
| 2021 -
Thereafter |
|
Commitments to extend credit | | | | | | | | | | | | | | | | |
Commercial lending: | | | | | | | | | | | | | | | | |
Investment-grade | | | $10,162 | | | | $17,519 | | | | $33,701 | | | | $ 6,494 | |
| | |
Non-investment-grade | | | 7,223 | | | | 8,696 | | | | 15,429 | | | | 5,181 | |
| | |
Warehouse financing | | | 465 | | | | 1,624 | | | | 156 | | | | 1,308 | |
Total commitments to extend credit | | | 17,850 | | | | 27,839 | | | | 49,286 | | | | 12,983 | |
| | |
Contingent and forward starting resale and securities borrowing agreements | | | 56,191 | | | | 36 | | | | — | | | | — | |
| | |
Forward starting repurchase and secured lending agreements | | | 12,622 | | | | — | | | | — | | | | — | |
| | |
Letters of credit | | | 174 | | | | 171 | | | | 3 | | | | 4 | |
| | |
Investment commitments | | | 2,772 | | | | 420 | | | | 28 | | | | 1,187 | |
| | |
Other | | | 4,724 | | | | 351 | | | | 76 | | | | 50 | |
Total commitments | | | $94,333 | | | | $28,817 | | | | $49,393 | | | | $14,224 | |
| | | | | | | | | | | | | | | | |
| | | As of March 2017 | |
| $ in millions | |
| Remainder
of 2017 |
| |
| 2018 -
2019 |
| |
| 2020 -
2021 |
| |
| 2022 -
Thereafter |
|
Commitments to extend credit | | | | | | | | | | | | | | | | |
Commercial lending: | | | | | | | | | | | | | | | | |
Investment-grade | | | $14,774 | | | | $16,661 | | | | $37,047 | | | | $ 5,869 | |
| | |
Non-investment-grade | | | 1,438 | | | | 8,600 | | | | 17,319 | | | | 9,573 | |
| | |
Warehouse financing | | | 70 | | | | 1,651 | | | | 972 | | | | 1,088 | |
Total commitments to extend credit | | | 16,282 | | | | 26,912 | | | | 55,338 | | | | 16,530 | |
| | |
Contingent and forward starting resale and securities borrowing agreements | | | 42,363 | | | | 3 | | | | — | | | | — | |
| | |
Forward starting repurchase and secured lending agreements | | | 17,827 | | | | — | | | | — | | | | — | |
| | |
Letters of credit | | | 184 | | | | 182 | | | | — | | | | 40 | |
| | |
Investment commitments | | | 5,360 | | | | 612 | | | | 107 | | | | 2,523 | |
| | |
Other | | | 4,478 | | | | 311 | | | | 16 | | | | 43 | |
Total commitments | | | $86,494 | | | | $28,020 | | | | $55,461 | | | | $19,136 | |
Commitments to Extend Credit
The firm’s commitments to extend credit are agreements to lend with fixed termination dates and depend on the satisfaction of all contractual conditions to borrowing. These commitments are presented net of amounts syndicated to third parties. The total commitment amount does not necessarily reflect actual future cash flows because the firm may syndicate all or substantial additional portions of these commitments. In addition, commitments can expire unused or be reduced or cancelled at the counterparty’s request.
As of March 20162017 and December 2015, $90.832016, $100.79 billion and $93.92$98.05 billion, respectively, of the firm’s lending commitments were held for investment and were accounted for on an accrual basis. See Note 9 for further information about such commitments. In addition, as of March 20162017 and December 2015, $6.182016, $7.65 billion and $9.92$6.87 billion, respectively, of the firm’s lending commitments were held for sale and were accounted for at the lower of cost or fair value.
The firm accounts for the remaining commitments to extend credit at fair value. Losses, if any, are generally recorded, net of any fees in “Other principal transactions.”
| | | | |
| | Goldman Sachs March 2017 Form 10-Q | | 59 |
THE GOLDMAN SACHS GROUP, INC. AND SUBSIDIARIES
Notes to Condensed Consolidated Financial Statements
(Unaudited)
Commercial Lending. The firm’s commercial lending commitments are extended to investment-grade and non-investment-grade corporate borrowers. Commitments to investment-grade corporate borrowers are principally used for operating liquidity and general corporate purposes. The firm also extends lending commitments in connection with contingent acquisition financing and other types of corporate lending as well as commercial real estate financing. Commitments that are extended for contingent acquisition financing are often intended to be short-term in nature, as borrowers often seek to replace them with other funding sources.
| | | | |
60 | | Goldman Sachs March 2016 Form 10-Q | | |
THE GOLDMAN SACHS GROUP, INC. AND SUBSIDIARIES
Notes to Condensed Consolidated Financial Statements
(Unaudited)
Sumitomo Mitsui Financial Group, Inc. (SMFG) provides the firm with credit loss protection on certain approved loan commitments (primarily investment-grade commercial lending commitments). The notional amount of such loan commitments was $27.33$26.76 billion and $27.03$26.88 billion as of March 20162017 and December 2015,2016, respectively. The credit loss protection on loan commitments provided by SMFG is generally limited to 95% of the first loss the firm realizes on such commitments, up to a maximum of approximately $950 million. In addition, subject to the satisfaction of certain conditions, upon the firm’s request, SMFG will provide protection for 70% of additional losses on such commitments, up to a maximum of $1.13 billion, of which $768 million of protection had been provided as of both March 20162017 and December 2015.2016. The firm also uses other financial instruments to mitigate credit risks related to certain commitments not covered by SMFG. These instruments primarily include credit default swaps that reference the same or similar underlying instrument or entity, or credit default swaps that reference a market index.
Warehouse Financing. The firm provides financing to clients who warehouse financial assets. These arrangements are secured by the warehoused assets, primarily consisting of consumer and corporate loans.
Contingent and Forward Starting Resale and Securities Borrowing Agreements/Forward Starting Repurchase and Secured Lending Agreements
The firm enters into resale and securities borrowing agreements and repurchase and secured lending agreements that settle at a future date, generally within three business days. The firm also enters into commitments to provide contingent financing to its clients and counterparties through resale agreements. The firm’s funding of these commitments depends on the satisfaction of all contractual conditions to the resale agreement and these commitments can expire unused.
Letters of Credit
The firm has commitments under letters of credit issued by various banks which the firm provides to counterparties in lieu of securities or cash to satisfy various collateral and margin deposit requirements.
Investment Commitments
The firm’s investment commitments include commitments to invest in private equity, real estate and other assets directly and through funds that the firm raises and manages. Investment commitments include $2.74$2.13 billion and $2.86$2.10 billion as of March 20162017 and December 2015,2016, respectively, related to commitments to invest in funds managed by the firm. If these commitments are called, they would be funded at market value on the date of investment.
Leases
The firm has contractual obligations under long-term noncancelable lease agreements for office space expiring on various dates through 2069. Certain agreements are subject to periodic escalation provisions for increases in real estate taxes and other charges.
The table below presents future minimum rental payments, net of minimum sublease rentals.
| | $ in millions | |
| As of
March 2016 |
| |
| As of
March 2017 |
|
Remainder of 2016 | | | $ 242 | | |
| | | |
2017 | | | 317 | | |
Remainder of 2017 | | | | $ 233 | |
| | | | | |
2018 | | | 305 | | | | 295 | |
| | | | | |
2019 | | | 261 | | | | 255 | |
| | | | | |
2020 | | | 229 | | | | 224 | |
| | | | | |
2021 | | | 180 | | | | 171 | |
| | | | | |
2022 - thereafter | | | 984 | | |
2022 | | | | 118 | |
| | | | |
2023 - thereafter | | | | 679 | |
Total | | | $2,518 | | | | $1,975 | |
Rent charged to operating expense was $62$70 million and $64$62 million for the three months ended March 20162017 and March 2015,2016, respectively.
Operating leases include office space held in excess of current requirements. Rent expense relating to space held for growth is included in “Occupancy.” The firm records a liability, based on the fair value of the remaining lease rentals reduced by any potential or existing sublease rentals, for leases where the firm has ceased using the space and management has concluded that the firm will not derive any future economic benefits. Costs to terminate a lease before the end of its term are recognized and measured at fair value on termination.
| | | | |
| 60 | | Goldman Sachs March 20162017 Form 10-Q | | 61 |
THE GOLDMAN SACHS GROUP, INC. AND SUBSIDIARIES
Notes to Condensed Consolidated Financial Statements
(Unaudited)
Contingencies
Legal Proceedings. See Note 27 for information about legal proceedings, including certain mortgage-related matters, and agreements the firm has entered into to toll the statute of limitations.
Certain Mortgage-Related Contingencies. There are multiple areas of focus by regulators, governmental agencies and others within the mortgage market that may impact originators, issuers, servicers and investors. There remains significant uncertainty surrounding the nature and extent of any potential exposure for participants in this market.
The firm has not been a significant originator of residential mortgage loans. The firm did purchase loans originated by others and generally received loan-level representations. During the period 2005 through 2008, the firm sold approximately $10 billion of loans to government-sponsored enterprises and approximately $11 billion of loans to other third parties. In addition, the firm transferred $125 billion of loans to trusts and other mortgage securitization vehicles. In connection with both sales of loans and securitizations, the firm provided loan-level representations and/or assigned the loan-level representations from the party from whom the firm purchased the loans.
The firm’s exposure to claims for repurchase of residential mortgage loans based on alleged breaches of representations will depend on a number of factors such as the extent to which these claims are made within the statute of limitations, taking into consideration the agreements to toll the statute of limitations the firm has entered into with trustees representing certain trusts. Based upon the large number of defaults in residential mortgages, including those sold or securitized by the firm, there is a potential for repurchase claims. However, the firm is not in a position to make a meaningful estimate of that exposure at this time.
Other Contingencies. In connection with the sale of Metro International Trade Services (Metro), the firm provided customary representations and warranties, and indemnities for breaches of these representations and warranties, to the buyer. The firm further agreed to provide indemnities to the buyer, which primarily relate to fundamental representations and warranties, and potential liabilities for legal or regulatory proceedings arising out of the conduct of Metro’s business while the firm owned it.
In connection with the settlement agreement with the Residential Mortgage-Backed Securities Working Group of the U.S. Financial Fraud Enforcement Task Force, the firm agreed to provide $1.80 billion in consumer relief in the form of principal forgiveness for underwater homeowners and distressed borrowers; financing for construction, rehabilitation and preservation of affordable housing; and support for debt restructuring, foreclosure prevention and housing quality improvement programs, as well as land banks.
Guarantees
The table below presents information about certain derivatives that meet the definition of a guarantee, securities lending indemnifications and certain other guarantees.
| | | | | | | | | | | | |
| $ in millions | | | Derivatives | | |
| Securities
lending
indemnifications |
| |
| Other
financial
guarantees |
|
As of March 2016 | | | | | | | | | | | | |
Carrying Value of Net Liability | | | $ 10,026 | | | | $ — | | | | $ 60 | |
Maximum Payout/Notional Amount by Period of Expiration | |
Remainder of 2016 | | | $ 622,772 | | | | $36,841 | | | | $ 554 | |
| | |
2017 - 2018 | | | 266,094 | | | | — | | | | 1,359 | |
| | |
2019 - 2020 | | | 87,837 | | | | — | | | | 1,235 | |
| | |
2021 - thereafter | | | 61,261 | | | | — | | | | 729 | |
Total | | | $1,037,964 | | | | $36,841 | | | | $3,877 | |
As of December 2015 | | | | | | | | | | | | |
Carrying Value of Net Liability | | | $ 8,351 | | | | $ — | | | | $ 76 | |
Maximum Payout/Notional Amount by Period of Expiration | |
2016 | | | $ 640,288 | | | | $31,902 | | | | $ 611 | |
| | |
2017 - 2018 | | | 168,784 | | | | — | | | | 1,402 | |
| | |
2019 - 2020 | | | 67,643 | | | | — | | | | 1,772 | |
| | |
2021 - thereafter | | | 49,728 | | | | — | | | | 676 | |
Total | | | $ 926,443 | | | | $31,902 | | | | $4,461 | |
| | | | | | | | | | | | |
| $ in millions | | | Derivatives | | |
| Securities
lending
indemnifications |
| |
| Other
financial
guarantees |
|
As of March 2017 | | | | | | | | | | | | |
Carrying Value of Net Liability | | | $ 7,552 | | | | $ — | | | | $ 52 | |
Maximum Payout/Notional Amount by Period of Expiration | |
Remainder of 2017 | | | $ 520,372 | | | | $38,900 | | | | $ 955 | |
| | |
2018 - 2019 | | | 386,607 | | | | — | | | | 676 | |
| | |
2020 - 2021 | | | 87,083 | | | | — | | | | 1,934 | |
| | |
2022 - thereafter | | | 69,414 | | | | — | | | | 199 | |
Total | | | $1,063,476 | | | | $38,900 | | | | $3,764 | |
As of December 2016 | | | | | | | | | | | | |
Carrying Value of Net Liability | | | $ 8,873 | | | | $ — | | | | $ 50 | |
Maximum Payout/Notional Amount by Period of Expiration | |
2017 | | | $ 432,328 | | | | $33,403 | | | | $1,064 | |
| | |
2018 - 2019 | | | 261,676 | | | | — | | | | 763 | |
| | |
2020 - 2021 | | | 71,264 | | | | — | | | | 1,662 | |
| | |
2022 - thereafter | | | 51,506 | | | | — | | | | 173 | |
Total | | | $ 816,774 | | | | $33,403 | | | | $3,662 | |
In the table above:
The maximum payout is based on the notional amount of the contract and does not represent anticipated losses.
Amounts exclude certain commitments to issue standby letters of credit that are included in “Commitments to extend credit.” See the tables in “Commitments” above for a summary of the firm’s commitments.
| | | | |
62 | | Goldman Sachs March 20162017 Form 10-Q | | 61 |
THE GOLDMAN SACHS GROUP, INC. AND SUBSIDIARIES
Notes to Condensed Consolidated Financial Statements
(Unaudited)
Derivative Guarantees. The firm enters into various derivatives that meet the definition of a guarantee under U.S. GAAP, including written equity and commodity put options, written currency contracts and interest rate caps, floors and swaptions. These derivatives are risk managed together with derivatives that do not meet the definition of a guarantee, and therefore the amounts in the table above do not reflect the firm’s overall risk related to its derivative activities. Disclosures about derivatives are not required if they may be cash settled and the firm has no basis to conclude it is probable that the counterparties held the underlying instruments at inception of the contract. The firm has concluded that these conditions have been met for certain large, internationally active commercial and investment bank counterparties, central clearing counterparties and certain other counterparties. Accordingly, the firm has not included such contracts in the table above. In addition, see Note 7 for information about credit derivatives that meet the definition of a guarantee, which are not included in the table above.
Derivatives are accounted for at fair value and therefore the carrying value is considered the best indication of payment/performance risk for individual contracts. However, the carrying values in the table above exclude the effect of counterparty and cash collateral netting.
Securities Lending Indemnifications. The firm, in its capacity as an agency lender, indemnifies most of its securities lending customers against losses incurred in the event that borrowers do not return securities and the collateral held is insufficient to cover the market value of the securities borrowed. Collateral held by the lenders in connection with securities lending indemnifications was $37.99$40.11 billion and $32.85$34.33 billion as of March 20162017 and December 2015,2016, respectively. Because the contractual nature of these arrangements requires the firm to obtain collateral with a market value that exceeds the value of the securities lent to the borrower, there is minimal performance risk associated with these guarantees.
Other Financial Guarantees. In the ordinary course of business, the firm provides other financial guarantees of the obligations of third parties (e.g., standby letters of credit and other guarantees to enable clients to complete transactions and fund-related guarantees). These guarantees represent obligations to make payments to beneficiaries if the guaranteed party fails to fulfill its obligation under a contractual arrangement with that beneficiary.
Guarantees of Securities Issued by Trusts. The firm has established trusts, including Goldman Sachs Capital I, the APEX Trusts, the 2012 Trusts and other entities for the limited purpose of issuing securities to third parties, lending the proceeds to the firm and entering into contractual arrangements with the firm and third parties related to this purpose. The firm does not consolidate these entities. See Note 16 for further information about the transactions involving Goldman Sachs Capital I the APEX Trusts, and the 2012APEX Trusts.
The firm effectively provides for the full and unconditional guarantee of the securities issued by these entities. Timely payment by the firm of amounts due to these entities under the guarantee, borrowing, preferred stock and related contractual arrangements will be sufficient to cover payments due on the securities issued by these entities.
Management believes that it is unlikely that any circumstances will occur, such as nonperformance on the part of paying agents or other service providers, that would make it necessary for the firm to make payments related to these entities other than those required under the terms of the guarantee, borrowing, preferred stock and related contractual arrangements and in connection with certain expenses incurred by these entities.
Indemnities and Guarantees of Service Providers. In the ordinary course of business, the firm indemnifies and guarantees certain service providers, such as clearing and custody agents, trustees and administrators, against specified potential losses in connection with their acting as an agent of, or providing services to, the firm or its affiliates.
| | | | |
| | Goldman Sachs March 2016 Form 10-Q | | 63 |
THE GOLDMAN SACHS GROUP, INC. AND SUBSIDIARIES
Notes to Condensed Consolidated Financial Statements
(Unaudited)
The firm may also be liable to some clients or other parties for losses arising from its custodial role or caused by acts or omissions of third-party service providers, including sub-custodians and third-party brokers. In certain cases, the firm has the right to seek indemnification from these third-party service providers for certain relevant losses incurred by the firm. In addition, the firm is a member of payment, clearing and settlement networks as well as securities exchanges around the world that may require the firm to meet the obligations of such networks and exchanges in the event of member defaults and other loss scenarios.
| | | | |
| 62 | | Goldman Sachs March 2017 Form 10-Q | | |
THE GOLDMAN SACHS GROUP, INC. AND SUBSIDIARIES
Notes to Condensed Consolidated Financial Statements
(Unaudited)
In connection with itsthe firm’s prime brokerage and clearing businesses, the firm agrees to clear and settle on behalf of its clients the transactions entered into by them with other brokerage firms. The firm’s obligations in respect of such transactions are secured by the assets in the client’s account as well as any proceeds received from the transactions cleared and settled by the firm on behalf of the client. In connection with joint venture investments, the firm may issue loan guarantees under which it may be liable in the event of fraud, misappropriation, environmental liabilities and certain other matters involving the borrower.
The firm is unable to develop an estimate of the maximum payout under these guarantees and indemnifications. However, management believes that it is unlikely the firm will have to make any material payments under these arrangements, and no material liabilities related to these guarantees and indemnifications have been recognized in the condensed consolidated statements of financial condition as of March 20162017 and December 2015.2016.
Other Representations, Warranties and Indemnifications. The firm provides representations and warranties to counterparties in connection with a variety of commercial transactions and occasionally indemnifies them against potential losses caused by the breach of those representations and warranties. The firm may also provide indemnifications protecting against changes in or adverse application of certain U.S. tax laws in connection with ordinary-course transactions such as securities issuances, borrowings or derivatives.
In addition, the firm may provide indemnifications to some counterparties to protect them in the event additional taxes are owed or payments are withheld, due either to a change in or an adverse application of certain non-U.S. tax laws.
These indemnifications generally are standard contractual terms and are entered into in the ordinary course of business. Generally, there are no stated or notional amounts included in these indemnifications, and the contingencies triggering the obligation to indemnify are not expected to occur. The firm is unable to develop an estimate of the maximum payout under these guarantees and indemnifications. However, management believes that it is unlikely the firm will have to make any material payments under these arrangements, and no material liabilities related to these arrangements have been recognized in the condensed consolidated statements of financial condition as of March 20162017 and December 2015.December��2016.
Guarantees of Subsidiaries. Group Inc. fully and unconditionally guarantees the securities issued by GS Finance Corp., a wholly-owned finance subsidiary of the firm.
Group Inc. has guaranteed the payment obligations of Goldman Sachs & Co. LLC, formerly Goldman, Sachs & Co. (GS&Co.), and GS Bank USA, and Goldman Sachs Execution & Clearing, L.P. (GSEC), subject to certain exceptions.
In November 2008, the firm contributed subsidiaries into GS Bank USA, and Group Inc. agreed to guarantee the reimbursement of certain losses, including credit-related losses, relating to assets held by the contributed entities.
In addition, Group Inc. guarantees many of the obligations of its other consolidated subsidiaries on a transaction-by-transaction basis, as negotiated with counterparties. Group Inc. is unable to develop an estimate of the maximum payout under its subsidiary guarantees; however, because these guaranteed obligations are also obligations of consolidated subsidiaries, Group Inc.’s liabilities as guarantor are not separately disclosed.
| | | | |
64 | | Goldman Sachs March 2016 Form 10-Q | | |
THE GOLDMAN SACHS GROUP, INC. AND SUBSIDIARIES
Notes to Condensed Consolidated Financial Statements
(Unaudited)
Note 19.
Shareholders’ Equity
Common Equity
On April 18, 2016,17, 2017, the Board of Directors of Group Inc. (Board) declared aincreased the firm’s quarterly dividend ofto $0.75 per common share from $0.65 per common share toshare. The dividend will be paid on June 29, 20162017 to common shareholders of record on June 1, 2016.2017.
The firm’s share repurchase program is intended to help maintain the appropriate level of common equity. The share repurchase program is effected primarily through regular open-market purchases (which may include repurchase plans designed to comply with Rule 10b5-1), the amounts and timing of which are determined primarily by the firm’s current and projected capital position, but which may also be influenced by general market conditions and the prevailing price and trading volumes of the firm’s common stock. Prior to repurchasing common stock, the firm must receive confirmation that the Federal Reserve Board does not object to such capital actions.action.
The table below presents the amount of common stock repurchased by the firm under the share repurchase program.
| | | | |
| in millions, except per share amounts | |
| Three Months Ended
March 20162017 |
|
Common share repurchases | | | 10.06.2 | |
| | |
Average cost per share | | | $154.44243.22 | |
| | |
Total cost of common share repurchases | | | $ 1,5501,500 | |
| | | | |
| | Goldman Sachs March 2017 Form 10-Q | | 63 |
THE GOLDMAN SACHS GROUP, INC. AND SUBSIDIARIES
Notes to Condensed Consolidated Financial Statements
(Unaudited)
Pursuant to the terms of certain share-based compensation plans, employees may remit shares to the firm or the firm may cancel restricted stock units (RSUs)RSUs or stock options to satisfy minimum statutory employee tax withholding requirements and the exercise price of stock options. Under these plans, during the three months ended March 2016, 49,3532017, 12,136 shares were remitted with a total value of $7$3 million, and the firm cancelled 5.85.7 million of RSUs with a total value of $876$1.32 billion and 2.6 million and 99,930of stock options with a total value of $15$632 million.
Preferred Equity
The tables below present details about the perpetual preferred stock issued and outstanding as of March 2016.2017.
| | Series | |
| Shares
Authorized |
| |
| Shares
Issued |
| |
| Shares
Outstanding |
| |
| Depositary Shares
Per Share |
| |
| Shares
Authorized |
| |
| Shares
Issued |
| |
| Shares
Outstanding |
| |
| Depositary Shares
Per Share |
|
A | | 50,000 | | | | 30,000 | | | | 29,999 | | | | 1,000 | | | 50,000 | | | | 30,000 | | | | 29,999 | | | | 1,000 | |
| | | | | |
B | | 50,000 | | | | 32,000 | | | | 32,000 | | | | 1,000 | | | 50,000 | | | | 32,000 | | | | 32,000 | | | | 1,000 | |
| | | | | |
C | | 25,000 | | | | 8,000 | | | | 8,000 | | | | 1,000 | | | 25,000 | | | | 8,000 | | | | 8,000 | | | | 1,000 | |
| | | | | |
D | | 60,000 | | | | 54,000 | | | | 53,999 | | | | 1,000 | | | 60,000 | | | | 54,000 | | | | 53,999 | | | | 1,000 | |
| | | | | |
E | | 17,500 | | | | 17,500 | | | | 12,528 | | | | N/A | | | 17,500 | | | | 7,667 | | | | 7,667 | | | | N/A | |
| | | | | |
F | | 5,000 | | | | 5,000 | | | | 3,254 | | | | N/A | | | 5,000 | | | | 1,615 | | | | 1,615 | | | | N/A | |
| | | | | |
I | | 34,500 | | | | 34,000 | | | | 34,000 | | | | 1,000 | | | 34,500 | | | | 34,000 | | | | 34,000 | | | | 1,000 | |
| | | | | |
J | | 46,000 | | | | 40,000 | | | | 40,000 | | | | 1,000 | | | 46,000 | | | | 40,000 | | | | 40,000 | | | | 1,000 | |
| | | | | |
K | | 32,200 | | | | 28,000 | | | | 28,000 | | | | 1,000 | | | 32,200 | | | | 28,000 | | | | 28,000 | | | | 1,000 | |
| | | | | |
L | | 52,000 | | | | 52,000 | | | | 52,000 | | | | 25 | | | 52,000 | | | | 52,000 | | | | 52,000 | | | | 25 | |
| | | | | |
M | | 80,000 | | | | 80,000 | | | | 80,000 | | | | 25 | | | 80,000 | | | | 80,000 | | | | 80,000 | | | | 25 | |
| | | | | |
N 1 | | 31,050 | | | | 27,000 | | | | 27,000 | | | | 1,000 | | |
N | | | 31,050 | | | | 27,000 | | | | 27,000 | | | | 1,000 | |
| | | | |
O | | | 26,000 | | | | 26,000 | | | | 26,000 | | | | 25 | |
Total | | | 483,250 | | | | 407,500 | | | | 400,780 | | | | | | 509,250 | | | | 420,282 | | | | 420,280 | | | |
1. | In February 2016, Group Inc. issued 27,000 shares of Series N perpetual 6.30% Non-Cumulative Preferred Stock (Series N Preferred Stock).
|
| | Series | |
| Liquidation
Preference |
| | Redemption Price Per Share | |
| Redemption
Value
($ in millions) |
| | | Earliest Redemption Date | | |
| Liquidation
Preference |
| |
| Redemption
Value
($ in millions) |
|
A | | $ 25,000 | | | $25,000 plus declared and unpaid dividends | | | $ 750 | | | Currently redeemable | | | | $ 25,000 | | | | $ 750 | |
| | | | | |
B | | 25,000 | | | $25,000 plus declared and unpaid dividends | | | 800 | | | Currently redeemable | | | | $ 25,000 | | | | 800 | |
| | | | | |
C | | 25,000 | | | $25,000 plus declared and unpaid dividends | | | 200 | | | Currently redeemable | | | | $ 25,000 | | | | 200 | |
| | | | | |
D | | 25,000 | | | $25,000 plus declared and unpaid dividends | | | 1,350 | | | Currently redeemable | | | | $ 25,000 | | | | 1,350 | |
| | | | | |
E | | 100,000 | | | $100,000 plus declared and unpaid dividends | | | 1,253 | | | Currently redeemable | | | | $100,000 | | | | 767 | |
| | | | | |
F | | 100,000 | | | $100,000 plus declared and unpaid dividends | | | 325 | | | Currently redeemable | | | | $100,000 | | | | 161 | |
| | | | | |
I | | 25,000 | | | $25,000 plus accrued and unpaid dividends | | | 850 | | | November 10, 2017 | | | | $ 25,000 | | | | 850 | |
| | | | | |
J | | 25,000 | | | $25,000 plus accrued and unpaid dividends | | | 1,000 | | | May 10, 2023 | | | | $ 25,000 | | | | 1,000 | |
| | | | | |
K | | 25,000 | | | $25,000 plus accrued and unpaid dividends | | | 700 | | | May 10, 2024 | | | | $ 25,000 | | | | 700 | |
| | | | | |
L | | 25,000 | | | $25,000 plus accrued and unpaid dividends | | | 1,300 | | | May 10, 2019 | | | | $ 25,000 | | | | 1,300 | |
| | | | | |
M | | 25,000 | | | $25,000 plus accrued and unpaid dividends | | | 2,000 | | | May 10, 2020 | | | | $ 25,000 | | | | 2,000 | |
| | | | | |
N | | 25,000 | | | $25,000 plus accrued and unpaid dividends | | | 675 | | | May 10, 2021 | | | | $ 25,000 | | | | 675 | |
| | | | |
O | | | November 10, 2026 | | | | $ 25,000 | | | | 650 | |
Total | | | | | | | $11,203 | | | | | | | | $11,203 | |
| | | | |
| | Goldman Sachs March 2016 Form 10-Q | | 65 |
THE GOLDMAN SACHS GROUP, INC. AND SUBSIDIARIES
Notes to Condensed Consolidated Financial Statements
(Unaudited)
In the tables above:
EachAll shares have a par value of $0.01 per share and, where applicable, each share is represented by the specified number of depositary shares.
The earliest redemption date represents the date on which each share of non-cumulative Series A, Series B, Series C and Series D Preferred Stock issued and outstanding is redeemable at the firm’s option.
Prior to redeeming preferred stock, the firm must receive confirmation that the Federal Reserve Board does not object to such capital action.
The redemption price per share for Series A through F Preferred Stock is the liquidation preference plus declared and unpaid dividends. The redemption price per share for Series I through O Preferred Stock is the liquidation preference plus accrued and unpaid dividends. Each share of non-cumulative Series E and Series F Preferred Stock issued and outstanding is redeemable at the firm’s option, subject to certain covenant restrictions governing the firm’s ability to redeem or purchase the preferred stock without issuing common stock or other instruments with equity-like characteristics. See Note 16 for information about the replacement capital covenants applicable to the Series E and Series F Preferred Stock.
Each share of non-cumulative Series I Preferred Stock issued and outstanding is redeemable at the firm’s option beginning November 10, 2017.
Each share of non-cumulative Series J Preferred Stock issued and outstanding is redeemable at the firm’s option beginning May 10, 2023.
Each share of non-cumulative Series K Preferred Stock issued and outstanding is redeemable at the firm’s option beginning May 10, 2024.
Each share of non-cumulative Series L Preferred Stock issued and outstanding is redeemable at the firm’s option beginning May 10, 2019.
Each share of non-cumulative Series M Preferred Stock issued and outstanding is redeemable at the firm’s option beginning May 10, 2020.
Each share of non-cumulative Series N Preferred Stock issued and outstanding is redeemable at the firm’s option beginning May 10, 2021.
All shares of preferred stock have a par value of $0.01 per share and, where applicable, each share of preferred stock is represented by the specified number of depositary shares.
Prior to redeeming preferred stock, the firm must receive confirmation that the Federal Reserve Board does not object to such capital actions. All series of preferred stock are pari passu and have a preference over the firm’s common stock on liquidation.
Dividends on each series of preferred stock, excluding Series L, Series M and Series MO Preferred Stock, if declared, are payable quarterly in arrears. Dividends on Series L, Series M and Series MO Preferred Stock, if declared, are payable semi-annually in arrears from the issuance date to, but excluding, May 10, 2019, and May 10, 2020 and November 10, 2026, respectively, and quarterly thereafter.
The firm’s ability to declare or pay dividends on, or purchase, redeem or otherwise acquire, its common stock is subject to certain restrictions in the event that the firm fails to pay or set aside full dividends on the preferred stock for the latest completed dividend period.
| | | | |
| 64 | | Goldman Sachs March 2017 Form 10-Q | | |
THE GOLDMAN SACHS GROUP, INC. AND SUBSIDIARIES
Notes to Condensed Consolidated Financial Statements
(Unaudited)
During the first quarter of 2016, the firm delivered a par amount of $672 million$1.32 billion (fair value of $1.04 billion, including $505 million)million of fair value delivered during the first quarter of 2016) of APEX to the APEX Trusts in exchange for 4,9729,833 shares of Series E Preferred Stock and 1,7463,385 shares of Series F Preferred Stock for a total redemption value of $672 million$1.32 billion (net carrying value of $1.31 billion, including $666 million)million of net carrying value redeemed during the first quarter of 2016). Following the exchange, shares of Series E and Series F Preferred Stock were cancelled. The difference of $161 million between the fair value of the APEX and the net carrying value of the preferred stock at the time of cancellation was $266 million for 2016 (including $161 million for the first quarter of 2016), and was recorded in “Preferred stock dividends” individends,” along with preferred dividends declared on the condensed consolidated statements of earnings.firm’s preferred stock. See Note 16 for further information about APEX.
The table below presents the dividend rates of the firm’s perpetual preferred stock as of March 2016.2017.
| | | | |
| Series | | | Dividend Rate | |
A | | | 3 month LIBOR + 0.75%, with floor of 3.75% per annum | |
| | |
B | | | 6.20% per annum | |
| | |
C | | | 3 month LIBOR + 0.75%, with floor of 4.00% per annum | |
| | |
D | | | 3 month LIBOR + 0.67%, with floor of 4.00% per annum | |
| | |
E | | | 3 month LIBOR + 0.77%, with floor of 4.00% per annum | |
| | |
F | | | 3 month LIBOR + 0.77%, with floor of 4.00% per annum | |
| | |
I | | | 5.95% per annum | |
| | |
J | |
| 5.50% per annum to, but excluding, May 10, 2023;
3 month LIBOR + 3.64% per annum thereafter |
|
| | |
K | |
| 6.375% per annum to, but excluding, May 10, 2024;
3 month LIBOR + 3.55% per annum thereafter |
|
| | |
L | |
| 5.70% per annum to, but excluding, May 10, 2019;
3 month LIBOR + 3.884% per annum thereafter |
|
| | |
M | |
| 5.375% per annum to, but excluding, May 10, 2020;
3 month LIBOR + 3.922% per annum thereafter |
|
| | |
N | | | 6.30% per annum | |
| |
O | |
| 5.30% per annum to, but excluding, November 10, 2026;
3 month LIBOR + 3.834% per annum thereafter |
|
The table below presents preferred dividends declared on the firm’s preferred stock.
| | | | Three Months Ended March | | | Three Months Ended March | |
| | | 2016 | | | | 2015 | | | 2017 | | | | | | 2016 | |
| Series | | | per share | | | | $ in millions | | | | | | per share | | | | $ in millions | | | | per share | | | | $ in millions | | | | | | per share | | | | $ in millions | |
A | | | $ 239.58 | | | | $ 7 | | | | | $ 239.58 | | | | $ 7 | | | | $ 239.58 | | | | $ 7 | | | | | $ 239.58 | | | | $ 7 | |
| | | | | |
B | | | 387.50 | | | | 12 | | | | | 387.50 | | | | 12 | | | | $ 387.50 | | | | 12 | | | | | $ 387.50 | | | | 12 | |
| | | | | |
C | | | 255.56 | | | | 2 | | | | | 255.56 | | | | 2 | | | | $ 255.56 | | | | 2 | | | | | $ 255.56 | | | | 2 | |
| | | | | |
D | | | 255.56 | | | | 14 | | | | | 255.56 | | | | 14 | | | | $ 255.56 | | | | 14 | | | | | $ 255.56 | | | | 14 | |
| | | | | |
E | | | 1,011.11 | | | | 18 | | | | | 1,011.11 | | | | 18 | | | | $1,000.00 | | | | 7 | | | | | $1,011.11 | | | | 18 | |
| | | | | |
F | | | 1,011.11 | | | | 5 | | | | | 1,011.11 | | | | 5 | | | | $1,000.00 | | | | 2 | | | | | $1,011.11 | | | | 5 | |
| | | | | |
I | | | 371.88 | | | | 13 | | | | | 371.88 | | | | 13 | | | | $ 371.88 | | | | 13 | | | | | $ 371.88 | | | | 13 | |
| | | | | |
J | | | 343.75 | | | | 14 | | | | | 343.75 | | | | 14 | | | | $ 343.75 | | | | 14 | | | | | $ 343.75 | | | | 14 | |
| | | | | |
K | | | 398.44 | | | | 11 | | | | | 398.44 | | | | 11 | | | | $ 398.44 | | | | 11 | | | | | $ 398.44 | | | | 11 | |
| | | | |
N | | | | $ 393.75 | | | | 11 | | | | | $ — | | | | — | |
Total | | | | | $96 | | | | | | | | $96 | | | | | | $93 | | | | | | | | $96 | |
| | | | |
66 | | Goldman Sachs March 2016 Form 10-Q | | |
THE GOLDMAN SACHS GROUP, INC. AND SUBSIDIARIES
Notes to Condensed Consolidated Financial Statements
(Unaudited)
Accumulated Other Comprehensive Loss
The table below presents accumulated other comprehensive loss, net of tax, by type.
| | | | | | | | | | | | |
| $ in millions | |
| Beginning
balance |
| |
| Other
comprehensive
income/(loss)
adjustments,
net of tax |
| |
| Ending
balance |
|
As of March 2017 | | | | | | | | | | | | |
Currency translation | | | $ (647 | ) | | | $ (16 | ) | | | $ (663 | ) |
| | |
Debt valuation adjustment | | | (239 | ) | | | (139 | ) | | | (378 | ) |
| | |
Pension and postretirement liabilities | | | (330 | ) | | | 1 | | | | (329 | ) |
Total | | | $(1,216 | ) | | | $(154 | ) | | | $(1,370 | ) |
| | | |
As of December 2016 | | | | | | | | | | | | |
Currency translation | | | $ (587 | ) | | | $ (60 | ) | | | $ (647 | ) |
| | |
Debt valuation adjustment | | | 305 | | | | (544 | ) | | | (239 | ) |
| | |
Pension and postretirement liabilities | | | (131 | ) | | | (199 | ) | | | (330 | ) |
Total | | | $ (413 | ) | | | $(803 | ) | | | $(1,216 | ) |
In the table below,above, the beginning balance of accumulated other comprehensive loss for the current periodDecember 2016 has been adjusted to reflect the impactcumulative effect of reclassifying the cumulativechange in accounting principle related to debt valuation adjustment, net of tax, from retained earnings to accumulated other comprehensive loss.tax. See Note 3 for further information about the adoption of ASUNo. 2016-01. See Note 8 for further information about the debt valuation adjustment.
| | | | | | | | | | | | |
| $ in millions | |
| Balance,
beginning
of year,
adjusted |
| |
| Other
comprehensive
income/(loss)
adjustments,
net of tax |
| |
| Balance,
end of
period |
|
As of March 2016 | | | | | | | | | | | | |
Currency translation | | | $(587 | ) | | | $ (17 | ) | | | $(604 | ) |
| | |
Debt valuation adjustment | | | 305 | | | | (12 | ) | | | 293 | |
| | |
Pension and postretirement liabilities | | | (131 | ) | | | (36 | ) | | | (167 | ) |
Accumulated other comprehensive loss, net of tax | | | $(413 | ) | | | $ (65 | ) | | | $(478 | ) |
As of December 2015 | | | | | | | | | | | | |
Currency translation | | | $(473 | ) | | | $(114 | ) | | | $(587 | ) |
| | |
Pension and postretirement liabilities | | | (270 | ) | | | 139 | | | | (131 | ) |
Accumulated other comprehensive income/(loss), net of tax | | | $(743 | ) | | | $ 25 | | | | $(718 | ) |
Note 20.
Regulation and Capital Adequacy
The Federal Reserve Board is the primary regulator of Group Inc., a bank holding company under the Bank Holding Company Act of 1956 (BHC Act) and a financial holding company under amendments to the BHCthis Act. As a bank holding company, the firm is subject to consolidated regulatory capital requirements which are calculated in accordance with the revised risk-based capital and leverage regulations of the Federal Reserve Board, subject to certain transitional provisions (Revised Capital Framework).
The risk-based capital requirements are expressed as capital ratios that compare measures of regulatory capital to risk-weighted assets (RWAs). Failure to comply with these capital requirements could result in restrictions being imposed by the firm’s regulators. The firm’s capital levels are also subject to qualitative judgments by the regulators about components of capital, risk weightings and other factors. Furthermore, certain of the firm’s subsidiaries are subject to separate regulations and capital requirements as described below.
| | | | |
| | Goldman Sachs March 2017 Form 10-Q | | 65 |
THE GOLDMAN SACHS GROUP, INC. AND SUBSIDIARIES
Notes to Condensed Consolidated Financial Statements
(Unaudited)
Capital Framework
The regulations under the Revised Capital Framework are largely based on the Basel Committee’s finalCommittee on Banking Supervision’s (Basel Committee) capital framework for strengthening international capital standards (Basel III) and also implement certain provisions of the Dodd-Frank Act. Under the Revised Capital Framework, the firm is an “Advanced approach” banking organization.
The firm calculates its Common Equity Tier 1 (CET1), Tier 1 capital and Total capital ratios in accordance with (i) the Standardized approach and market risk rules set out in the Revised Capital Framework (together, the Standardized Capital Rules) and (ii) the Advanced approach and market risk rules set out in the Revised Capital Framework (together, the Basel III Advanced Rules). The lower of each ratio calculated in (i) and (ii) is the ratio against which the firm’s compliance with its minimum ratio requirements is assessed. Each of the ratios calculated in accordance with the Basel III Advanced Rules was lower than that calculated in accordance with the Standardized Capital Rules and therefore the Basel III Advanced ratios were the ratios that applied to the firm as of March 20162017 and December 2015.2016. The capital ratios that apply to the firm can change in future reporting periods as a result of these regulatory requirements.
| | | | |
| | Goldman Sachs March 2016 Form 10-Q | | 67 |
THE GOLDMAN SACHS GROUP, INC. AND SUBSIDIARIES
Notes to Condensed Consolidated Financial Statements
(Unaudited)
Regulatory Capital and Capital Ratios. The table below presents the minimum ratios required for the firm.
| | | | | | | | |
| | | As of | |
| | | | March 2016 | | | | December 2015 | |
CET1 ratio | | | 5.875% | | | | 4.5% | |
| | |
Tier 1 capital ratio | | | 7.375% | | | | 6.0% | |
| | |
Total capital ratio 1 | | | 9.375% | | | | 8.0% | |
| | |
Tier 1 leverage ratio | | | 4.000% | | | | 4.0% | |
1. | In order to meet the quantitative requirements for being “well-capitalized” under the Federal Reserve Board’s regulations, the firm must meet a higher required minimum Total capital ratio of 10.0%.
|
| | | | | | | | |
| | | As of | |
| | |
| March
2017 |
| |
| December
2016 |
|
CET1 ratio | | | 7.000% | | | | 5.875% | |
| | |
Tier 1 capital ratio | | | 8.500% | | | | 7.375% | |
| | |
Total capital ratio | | | 10.500% | | | | 9.375% | |
| | |
Tier 1 leverage ratio | | | 4.000% | | | | 4.000% | |
In the table above:
The minimum capital ratios as of March 2017 reflect (i) the 50% phase-in of the capital conservation buffer (1.25%), (ii) the 50% phase-in of the Global Systemically Important Bank (G-SIB) buffer (1.25%), and (iii) the countercyclical capital buffer of zero percent, each described below.
The minimum capital ratios as of December 2016 reflect (i) the 25% phase-in of the capital conservation buffer (0.625%), (ii) the 25% phase-in of the Global Systemically Important Bank (G-SIB)G-SIB buffer (0.75%), and (iii) the counter-cyclicalcountercyclical capital buffer of zero percent, each described below.
Tier 1 leverage ratio is defined as Tier 1 capital divided by quarterly average adjusted total assets (which includes adjustments for goodwill and identifiable intangible assets, and certain investments in nonconsolidated financial institutions).
Certain aspects of the Revised Capital Framework’s requirements phase in over time (transitional provisions). These include capital buffers and certain deductions from regulatory capital (such as investments in nonconsolidated financial institutions). These deductions from regulatory capital are required to be phased in ratably per year from 2014 to 2018, with residual amounts not deducted during the transitional period subject to risk weighting. In addition, junior subordinated debt issued to trusts is being phased out of regulatory capital. The minimum CET1, Tier 1 and Total capital ratios that apply to the firm will increase as the capital buffers are phased in.
The capital conservation buffer, which consists entirely of capital that qualifies as CET1, began to phase in on January 1, 2016 and will continue to do so in increments of 0.625% per year until it reaches 2.5% of RWAs on January 1, 2019.
| | | | |
| 66 | | Goldman Sachs March 2017 Form 10-Q | | |
THE GOLDMAN SACHS GROUP, INC. AND SUBSIDIARIES
Notes to Condensed Consolidated Financial Statements
(Unaudited)
The G-SIB buffer, which is an extension of the capital conservation buffer, phases in ratably, beginning on January 1, 2016, becoming fully effective on January 1, 2019, and must consist entirely of capital that qualifies as CET1. The buffer must be calculated using two methodologies, the higher of which is reflected in the firm’s minimum risk-based capital ratios. The first calculation is based upon the Basel Committee’s methodology which, among other factors, relies upon measures of the size, activity and complexity of each G-SIB (Method One).G-SIB. The second calculation uses similar inputs, but it includes a measure of reliance on short-term wholesale funding (Method Two).funding. The firm’s G-SIB buffer applicable for the year ending December 2017 is 3.0%, using2.5% (using financial data primarily as offor the year ended December 2014.2015), reflecting a reduction from 3%, which was the firm’s G-SIB buffer applicable for the year ended December 2016. The buffer will be updated annually based on financial data as of the end offrom the prior year end, and will be generally applicable for the following year.
The Revised Capital Framework also provides for a counter-cyclicalcountercyclical capital buffer, which is an extension of the capital conservation buffer, of up to 2.5% (consisting entirely of CET1) intended to counteract excessive credit growth.systemic vulnerabilities. As of March 20162017, the Federal Reserve Board has set the firm’s counter-cyclicalcountercyclical capital buffer at 0%.zero percent.
Failure to meet the requirementscapital levels inclusive of thesethe buffers could result in limitations on the firm’s ability to distribute capital, including share repurchases and dividend payments, and to make certain discretionary compensation payments.
Definition of Risk-Weighted Assets. RWAs are calculated in accordance with both the Standardized Capital Rules and the Basel III Advanced Rules. The following is a comparison of RWA calculations under these rules:
RWAs for credit risk in accordance with the Standardized Capital Rules are calculated in a different manner than the Basel III Advanced Rules. The primary difference is that the Standardized Capital Rules do not contemplate the use of internal models to compute exposure for credit risk on derivatives and securities financing transactions, whereas the Basel III Advanced Rules permit the use of such models, subject to supervisory approval. In addition, credit RWAs calculated in accordance with the Standardized Capital Rules utilize prescribed risk-weights which depend largely on the type of counterparty, rather than on internal assessments of the creditworthiness of such counterparties;
RWAs for market risk in accordance with the Standardized Capital Rules and the Basel III Advanced Rules are generally consistent; and
RWAs for operational risk are not required by the Standardized Capital Rules, whereas the Basel III Advanced Rules do include such a requirement.
| | | | |
68 | | Goldman Sachs March 2016 Form 10-Q | | |
THE GOLDMAN SACHS GROUP, INC. AND SUBSIDIARIES
Notes to Condensed Consolidated Financial Statements
(Unaudited)
Credit Risk
Credit RWAs are calculated based upon measures of exposure, which are then risk weighted. The following is a description of the calculation of credit RWAs in accordance with the Standardized Capital Rules and the Basel III Advanced Rules:
For credit RWAs calculated in accordance with the Standardized Capital Rules, the firm utilizes prescribed risk-weights which depend largely on the type of counterparty (e.g., whether the counterparty is a sovereign, bank, broker-dealer or other entity). The exposure measure for derivatives is based on a combination of positive net current exposure and a percentage of the notional amount of each derivative. The exposure measure for securities financing transactions is calculated to reflect adjustments for potential price volatility, the size of which depends on factors such as the type and maturity of the security, and whether it is denominated in the same currency as the other side of the financing transaction. The firm utilizes specific required formulaic approaches to measure exposure for securitizations and equities; and
For credit RWAs calculated in accordance with the Basel III Advanced Rules, the firm has been given permission by its regulators to compute risk-weights for wholesale and retail credit exposures in accordance with the Advanced Internal Ratings-Based approach. This approach is based on internal assessments of the creditworthiness of counterparties, with key inputs being the probability of default, loss given default and the effective maturity. The firm utilizes internal models to measure exposure for derivatives, securities financing transactions and eligible margin loans. The Revised Capital Framework requires that a bank holding company obtain prior written agreement from its regulators before using internal models for such purposes. The firm utilizes specific required formulaic approaches to measure exposure for securitizations and equities.
| | | | |
| | Goldman Sachs March 2017 Form 10-Q | | 67 |
THE GOLDMAN SACHS GROUP, INC. AND SUBSIDIARIES
Notes to Condensed Consolidated Financial Statements
(Unaudited)
Market Risk
Market RWAs are calculated based on measures of exposure which include Value-at-Risk (VaR), stressed VaR, incremental risk and comprehensive risk based on internal models, and a standardized measurement method for specific risk. The market risk regulatory capital rules require that a bank holding company obtain prior written agreement from its regulators before using any internal model to calculate its risk-based capital requirement. The following is further information regarding the measures of exposure for market RWAs calculated in accordance with the Standardized Capital Rules and Basel III Advanced Rules:
VaR is the potential loss in value of inventory positions, as well as certain other financial assets and financial liabilities, due to adverse market movements over a defined time horizon with a specified confidence level. For both risk management purposes and regulatory capital calculations the firm uses a single VaR model which captures risks including those related to interest rates, equity prices, currency rates and commodity prices. However, VaR used for regulatory capital requirements (regulatory VaR) differs from risk management VaR due to different time horizons and confidence levels (10-day and 99% for regulatory VaR vs. one-day and 95% for risk management VaR), as well as differences in the scope of positions on which VaR is calculated. In addition, the daily trading net revenues used to determine risk management VaR exceptions (i.e., comparing the daily trading net revenues to the VaR measure calculated as of the end of the prior business day) include intraday activity, whereas the Federal Reserve Board’s regulatory capital rules require that intraday activity be excluded from daily trading net revenues when calculating regulatory VaR exceptions. Intraday activity includes bid/offer net revenues, which are more likely than not to be positive by their nature. As a result, there may be differences in the number of VaR exceptions and the amount of daily trading net revenues calculated for regulatory VaR compared to the amounts calculated for risk management VaR. The firm’s positional losses observed on a single day exceeded its 99% one-day regulatory VaR on one occasion during the three months ended March 2016, but did not exceed its 99% one-day regulatory VaR during the three months ended March 2017 and exceeded its 99% one-day regulatory VaR on two occasions during the year ended December 2015.2016. There was no change in the VaR multiplier used to calculate Market RWAs;
| | | | |
| | Goldman Sachs March 2016 Form 10-Q | | 69 |
THE GOLDMAN SACHS GROUP, INC. AND SUBSIDIARIES
Notes to Condensed Consolidated Financial Statements
(Unaudited)
Stressed VaR is the potential loss in value of inventory positions, as well as certain other financial assets and financial liabilities, during a period of significant market stress;
Incremental risk is the potential loss in value of non-securitized inventory positions due to the default or credit migration of issuers of financial instruments over a one-year time horizon;
Comprehensive risk is the potential loss in value, due to price risk and defaults, within the firm’s credit correlation positions; and
Specific risk is the risk of loss on a position that could result from factors other than broad market movements, including event risk, default risk and idiosyncratic risk. The standardized measurement method is used to determine specific risk RWAs, by applying supervisory defined risk-weighting factors after applicable netting is performed.
Operational Risk
Operational RWAs are only required to be included under the Basel III Advanced Rules. The firm has been given permission by its regulators to calculate operational RWAs in accordance with the “Advanced Measurement Approach,” and therefore utilizes an internal risk-based model to quantify operationalOperational RWAs.
Consolidated Regulatory Capital Ratios
Capital Ratios and RWAs. Each of the ratios calculated in accordance with the Basel III Advanced Rules was lower than that calculated in accordance with the Standardized Rules as of March 20162017 and December 2015,2016, and therefore such lower ratios applied to the firm as of these dates.
The table below presents the ratios calculated in accordance with both the Standardized and Basel III Advanced Rules.
| | | | | | | | |
| | | As of | |
| $ in millions | |
| March
2016 |
| |
| December
2015 |
|
Standardized | | | | | | | | |
Common shareholders’ equity | | | $ 75,634 | | | | $ 75,528 | |
| | |
Deductions for goodwill and identifiable intangible assets, net of deferred tax liabilities | | | (2,885 | ) | | | (2,814 | ) |
| | |
Deductions for investments in nonconsolidated financial institutions | | | (996 | ) | | | (864 | ) |
| | |
Other adjustments | | | (813 | ) | | | (487 | ) |
Common Equity Tier 1 | | | 70,940 | | | | 71,363 | |
Perpetual non-cumulative preferred stock | | | 11,203 | | | | 11,200 | |
| | |
Junior subordinated debt issued to trusts | | | — | | | | 330 | |
| | |
Deduction for investments in covered funds | | | (414 | ) | | | (413 | ) |
| | |
Other adjustments | | | (648 | ) | | | (969 | ) |
Tier 1 capital | | | $ 81,081 | | | | $ 81,511 | |
Standardized Tier 2 and total capital | | | | | | | | |
Tier 1 capital | | | $ 81,081 | | | | $ 81,511 | |
| | |
Qualifying subordinated debt | | | 14,939 | | | | 15,132 | |
| | |
Junior subordinated debt issued to trusts | | | 792 | | | | 990 | |
| | |
Allowance for losses on loans and lending commitments | | | 703 | | | | 602 | |
| | |
Other adjustments | | | (17 | ) | | | (19 | ) |
Standardized Tier 2 capital | | | 16,417 | | | | 16,705 | |
Standardized total capital | | | $ 97,498 | | | | $ 98,216 | |
Basel III Advanced Tier 2 and total capital | | | | | | | | |
Tier 1 capital | | | $ 81,081 | | | | $ 81,511 | |
| | |
Standardized Tier 2 capital | | | 16,417 | | | | 16,705 | |
| | |
Allowance for losses on loans and lending commitments | | | (703 | ) | | | (602 | ) |
Basel III Advanced Tier 2 capital | | | 15,714 | | | | 16,103 | |
Basel III Advanced total capital | | | $ 96,795 | | | | $ 97,614 | |
RWAs | | | | | | | | |
Standardized | | | $527,669 | | | | $524,107 | |
| | |
Basel III Advanced | | | 581,699 | | | | 577,651 | |
CET1 ratio | | | | | | | | |
Standardized | | | 13.4% | | | | 13.6% | |
| | |
Basel III Advanced | | | 12.2% | | | | 12.4% | |
Tier 1 capital ratio | | | | | | | | |
Standardized | | | 15.4% | | | | 15.6% | |
| | |
Basel III Advanced | | | 13.9% | | | | 14.1% | |
Total capital ratio | | | | | | | | |
Standardized | | | 18.5% | | | | 18.7% | |
| | |
Basel III Advanced | | | 16.6% | | | | 16.9% | |
Tier 1 leverage ratio | | | 9.2% | | | | 9.3% | |
| | | | |
7068 | | Goldman Sachs March 20162017 Form 10-Q | | |
THE GOLDMAN SACHS GROUP, INC. AND SUBSIDIARIES
Notes to Condensed Consolidated Financial Statements
(Unaudited)
The table below presents the ratios calculated in accordance with both the Standardized and Basel III Advanced Rules.
| | | | | | | | |
| | | As of | |
| $ in millions | |
| March
2017 |
| |
| December
2016 |
|
Common shareholders’ equity | | | $ 75,714 | | | | $ 75,690 | |
| | |
Deductions for goodwill and identifiable intangible assets, net of deferred tax liabilities | | | (2,923 | ) | | | (2,874 | ) |
| | |
Deductions for investments in nonconsolidated financial institutions | | | (461 | ) | | | (424 | ) |
| | |
Other adjustments | | | (493 | ) | | | (346 | ) |
Common Equity Tier 1 | | | 71,837 | | | | 72,046 | |
Preferred stock | | | 11,203 | | | | 11,203 | |
| | |
Deduction for investments in covered funds | | | (328 | ) | | | (445 | ) |
| | |
Other adjustments | | | (199 | ) | | | (364 | ) |
Tier 1 capital | | | $ 82,513 | | | | $ 82,440 | |
Standardized Tier 2 and Total capital | | | | | | | | |
Tier 1 capital | | | $ 82,513 | | | | $ 82,440 | |
| | |
Qualifying subordinated debt | | | 14,336 | | | | 14,566 | |
| | |
Junior subordinated debt issued to trusts | | | 660 | | | | 792 | |
| | |
Allowance for losses on loans and lending commitments | | | 791 | | | | 722 | |
| | |
Other adjustments | | | (6 | ) | | | (6 | ) |
Standardized Tier 2 capital | | | 15,781 | | | | 16,074 | |
Standardized Total capital | | | $ 98,294 | | | | $ 98,514 | |
Basel III Advanced Tier 2 and Total capital | | | | | | | | |
Tier 1 capital | | | $ 82,513 | | | | $ 82,440 | |
| | |
Standardized Tier 2 capital | | | 15,781 | | | | 16,074 | |
| | |
Allowance for losses on loans and lending commitments | | | (791 | ) | | | (722 | ) |
Basel III Advanced Tier 2 capital | | | 14,990 | | | | 15,352 | |
Basel III Advanced Total capital | | | $ 97,503 | | | | $ 97,792 | |
RWAs | | | | | | | | |
Standardized | | | $507,401 | | | | $496,676 | |
| | |
Basel III Advanced | | | $558,276 | | | | $549,650 | |
CET1 ratio | | | | | | | | |
Standardized | | | 14.2% | | | | 14.5% | |
| | |
Basel III Advanced | | | 12.9% | | | | 13.1% | |
Tier 1 capital ratio | | | | | | | | |
Standardized | | | 16.3% | | | | 16.6% | |
| | |
Basel III Advanced | | | 14.8% | | | | 15.0% | |
Total capital ratio | | | | | | | | |
Standardized | | | 19.4% | | | | 19.8% | |
| | |
Basel III Advanced | | | 17.5% | | | | 17.8% | |
Tier 1 leverage ratio | | | 9.5% | | | | 9.4% | |
In the table above:
The deductions for goodwill and identifiable intangible assets, net of deferred tax liabilities, include goodwill of $3.66 billion and $3.67 billion as of March 20162017 and December 20152016, respectively, and identifiable intangible assets of $286$322 million (80% of $403 million) and $257 million (60% of $477 million) and $196 million (40% of $491$429 million) as of March 20162017 and December 2015,2016, respectively, net of associated deferred tax liabilities of $1.06 billion and $1.04$1.05 billion as of March 20162017 and December 2015,2016, respectively. Goodwill is fully deducted from CET1, while the deduction for identifiable intangible assets is required to be phased into CET1 ratably over five years from 2014 to 2018. The balance that is not deducted during the transitional period is risk weighted.
The deductions for investments in nonconsolidated financial institutions represent the amount by which the firm’s investments in the capital of nonconsolidated financial institutions exceed certain prescribed thresholds. The deduction for such investments is required to be phased into CET1 ratably over five years from 2014 to 2018. As of March 20162017 and December 2015,2016, CET1 reflects 60%80% and 40%60% of the deduction, respectively. The balance that is not deducted during the transitional period is risk weighted.
The deduction for investments in covered funds represents the firm’s aggregate investments in applicable covered funds, as permitted by the Volcker Rule, that were purchased after December 2013. Substantially all of these investments in covered funds were purchased in connection with the firm’s market-making activities. This deduction was not subject to a transition period. See Note 6 for further information about the Volcker Rule.
Other adjustments within CET1 and Tier 1 capital primarily include accumulated other comprehensive loss, credit valuation adjustments on derivative liabilities, the overfunded portion of the firm’s defined benefit pension plan obligation net of associated deferred tax liabilities, disallowed deferred tax assets and other required credit risk-based deductions. The deductions for such items are generally required to be phased into CET1 ratably over five years from 2014 to 2018. As of March 20162017 and December 2015,2016, CET1 reflects 60%80% and 40%60% of such deductions, respectively. The balance that is not deducted from CET1 during the transitional period is generally deducted from Tier 1 capital within other adjustments.
As of March 2017, junior subordinated debt issued to trusts was fully phased out of Tier 1 capital, with 50% included in Tier 2 capital and 50% fully phased out of regulatory capital. As of December 2016, junior subordinated debt issued to trusts iswas fully phased out of Tier 1 capital, with 60% included in Tier 2 capital and 40% fully phased out of regulatory capital. As of December 2015, junior subordinated debt issued to trusts is reflected in both Tier 1 capital (25%) and Tier 2 capital (75%). Junior subordinated debt issued to trusts is reduced by the amount of trust preferred securities purchased by the firm and will be fully phased out of Tier 2 capital by 2022 at a rate of 10% per year. See Note 16 for additional information about the firm’s junior subordinated debt issued to trusts and trust preferred securities purchased by the firm.
Qualifying subordinated debt representsis subordinated debt issued by Group Inc. with an original term to maturity of five years or greater. The outstanding amount of subordinated debt qualifying for Tier 2 capital is reduced upon reaching a remaining maturity of five years. See Note 16 for additional information about the firm’s subordinated debt.
The tables below present changes in CET1, Tier 1 capital and Tier 2 capital for the three months ended March 2016 and year ended December 2015.
| | | | | | | | |
| | | Three Months Ended
March 2016 | |
| $ in millions | | | Standardized | | |
| Basel III
Advanced |
|
Common Equity Tier 1 | | | | | | | | |
Beginning balance | | | $71,363 | | | | $71,363 | |
| | |
Increased deductions due to transitional provisions | | | (839 | ) | | | (839 | ) |
| | |
Increase in common shareholders’ equity | | | 106 | | | | 106 | |
| | |
Change in deduction for goodwill and identifiable intangible assets, net of deferred tax liabilities | | | 5 | | | | 5 | |
| | |
Change in deduction for investments in nonconsolidated financial institutions | | | 323 | | | | 323 | |
| | |
Change in other adjustments | | | (18 | ) | | | (18 | ) |
Ending balance | | | $70,940 | | | | $70,940 | |
Tier 1 capital | | | | | | | | |
Beginning balance | | | $81,511 | | | | $81,511 | |
| | |
Increased deductions due to transitional provisions | | | (559 | ) | | | (559 | ) |
| | |
Other net increase in CET1 | | | 416 | | | | 416 | |
| | |
Redesignation of junior subordinated debt issued to trusts | | | (330 | ) | | | (330 | ) |
| | |
Increase in perpetual non-cumulative preferred stock | | | 3 | | | | 3 | |
| | |
Change in deduction for investments in covered funds | | | (1 | ) | | | (1 | ) |
| | |
Change in other adjustments | | | 41 | | | | 41 | |
Ending balance | | | 81,081 | | | | 81,081 | |
Tier 2 capital | | | | | | | | |
Beginning balance | | | 16,705 | | | | 16,103 | |
| | |
Decrease in qualifying subordinated debt | | | (193 | ) | | | (193 | ) |
| | |
Redesignation of junior subordinated debt issued to trusts | | | (198 | ) | | | (198 | ) |
| | |
Change in the allowance for losses on loans and lending commitments | | | 101 | | | | — | |
| | |
Change in other adjustments | | | 2 | | | | 2 | |
Ending balance | | | 16,417 | | | | 15,714 | |
Total capital | | | $97,498 | | | | $96,795 | |
| | | | |
| | | Goldman Sachs March 20162017 Form 10-Q | | 7169 |
THE GOLDMAN SACHS GROUP, INC. AND SUBSIDIARIES
Notes to Condensed Consolidated Financial Statements
(Unaudited)
| | | | | | | | |
| | | Year Ended
December 2015 | |
| $ in millions | | | Standardized | | |
| Basel III
Advanced |
|
Common Equity Tier 1 | | | | | | | | |
Beginning balance | | | $69,830 | | | | $69,830 | |
| | |
Increased deductions due to transitional provisions | | | (1,368 | ) | | | (1,368 | ) |
| | |
Increase in common shareholders’ equity | | | 1,931 | | | | 1,931 | |
| | |
Change in deduction for goodwill and identifiable intangible assets, net of deferred tax liabilities | | | 75 | | | | 75 | |
| | |
Change in deduction for investments in nonconsolidated financial institutions | | | 1,059 | | | | 1,059 | |
| | |
Change in other adjustments | | | (164 | ) | | | (164 | ) |
Ending balance | | | $71,363 | | | | $71,363 | |
Tier 1 capital | | | | | | | | |
Beginning balance | | | $78,433 | | | | $78,433 | |
| | |
Increased deductions due to transitional provisions | | | (1,073 | ) | | | (1,073 | ) |
| | |
Other net increase in CET1 | | | 2,901 | | | | 2,901 | |
| | |
Redesignation of junior subordinated debt issued to trusts | | | (330 | ) | | | (330 | ) |
| | |
Increase in perpetual non-cumulative preferred stock | | | 2,000 | | | | 2,000 | |
| | |
Deduction for investments in covered funds | | | (413 | ) | | | (413 | ) |
| | |
Change in other adjustments | | | (7 | ) | | | (7 | ) |
Ending balance | | | 81,511 | | | | 81,511 | |
Tier 2 capital | | | | | | | | |
Beginning balance | | | 12,861 | | | | 12,545 | |
| | |
Increased deductions due to transitional provisions | | | (53 | ) | | | (53 | ) |
| | |
Increase in qualifying subordinated debt | | | 3,238 | | | | 3,238 | |
| | |
Redesignation of junior subordinated debt issued to trusts | | | 330 | | | | 330 | |
| | |
Change in the allowance for losses on loans and lending commitments | | | 286 | | | | — | |
| | |
Change in other adjustments | | | 43 | | | | 43 | |
Ending balance | | | 16,705 | | | | 16,103 | |
Total capital | | | $98,216 | | | | $97,614 | |
The increased deductions due to transitional provisionstables below present changes in CET1, Tier 1 capital and Tier 2 capital.
| | | | | | | | |
| | | Three Months Ended
March 2017 | |
| $ in millions | | | Standardized | | |
| Basel III
Advanced |
|
Common Equity Tier 1 | | | | | | | | |
Beginning balance | | | $72,046 | | | | $72,046 | |
| | |
Change in common shareholders’ equity | | | 24 | | | | 24 | |
| | |
Change in deductions for: | | | | | | | | |
Transitional provisions | | | (426 | ) | | | (426 | ) |
| | |
Goodwill and identifiable intangible assets, net of deferred tax liabilities | | | 22 | | | | 22 | |
| | |
Investments in nonconsolidated financial institutions | | | 125 | | | | 125 | |
| | |
Change in other adjustments | | | 46 | | | | 46 | |
Ending balance | | | $71,837 | | | | $71,837 | |
Tier 1 capital | | | | | | | | |
Beginning balance | | | $82,440 | | | | $82,440 | |
| | |
Change in deductions for: | | | | | | | | |
Transitional provisions | | | (274 | ) | | | (274 | ) |
| | |
Investments in covered funds | | | 117 | | | | 117 | |
| | |
Other net increase in CET1 | | | 217 | | | | 217 | |
| | |
Change in other adjustments | | | 13 | | | | 13 | |
Ending balance | | | 82,513 | | | | 82,513 | |
Tier 2 capital | | | | | | | | |
Beginning balance | | | 16,074 | | | | 15,352 | |
| | |
Change in qualifying subordinated debt | | | (230 | ) | | | (230 | ) |
| | |
Redesignation of junior subordinated debt issued to trusts | | | (132 | ) | | | (132 | ) |
| | |
Change in the allowance for losses on loans and lending commitments | | | 69 | | | | — | |
| | |
Change in other adjustments | | | — | | | | — | |
Ending balance | | | 15,781 | | | | 14,990 | |
Total capital | | | $98,294 | | | | $97,503 | |
| | | | | | | | |
| | | Year Ended
December 2016 | |
| $ in millions | | | Standardized | | |
| Basel III
Advanced |
|
Common Equity Tier 1 | | | | | | | | |
Beginning balance | | | $71,363 | | | | $71,363 | |
| | |
Change in common shareholders’ equity | | | 162 | | | | 162 | |
| | |
Change in deductions for: | | | | | | | | |
Transitional provisions | | | (839 | ) | | | (839 | ) |
| | |
Goodwill and identifiable intangible assets, net of deferred tax liabilities | | | 16 | | | | 16 | |
| | |
Investments in nonconsolidated financial institutions | | | 895 | | | | 895 | |
| | |
Change in other adjustments | | | 449 | | | | 449 | |
Ending balance | | | $72,046 | | | | $72,046 | |
Tier 1 capital | | | | | | | | |
Beginning balance | | | $81,511 | | | | $81,511 | |
| | |
Change in deductions for: | | | | | | | | |
Transitional provisions | | | (558 | ) | | | (558 | ) |
| | |
Investments in covered funds | | | (32 | ) | | | (32 | ) |
| | |
Other net increase in CET1 | | | 1,522 | | | | 1,522 | |
| | |
Redesignation of junior subordinated debt issued to trusts | | | (330 | ) | | | (330 | ) |
| | |
Change in preferred stock | | | 3 | | | | 3 | |
| | |
Change in other adjustments | | | 324 | | | | 324 | |
Ending balance | | | 82,440 | | | | 82,440 | |
Tier 2 capital | | | | | | | | |
Beginning balance | | | 16,705 | | | | 16,103 | |
| | |
Change in qualifying subordinated debt | | | (566 | ) | | | (566 | ) |
| | |
Redesignation of junior subordinated debt issued to trusts | | | (198 | ) | | | (198 | ) |
| | |
Change in the allowance for losses on loans and lending commitments | | | 120 | | | | — | |
| | |
Change in other adjustments | | | 13 | | | | 13 | |
Ending balance | | | 16,074 | | | | 15,352 | |
Total capital | | | $98,514 | | | | $97,792 | |
In the tables above, the change in deductions for transitional provisions represent the increased phase-in of deductions from 60% to 80% (effective January 1, 2017) for the three months ended March 2017 and from 40% to 60% (effective January 1, 2016) for the three months ended March 2016 and from 20% to 40% (effective January 1, 2015) for the year ended December 2015.2016.
| | | | |
| 70 | | Goldman Sachs March 2017 Form 10-Q | | |
THE GOLDMAN SACHS GROUP, INC. AND SUBSIDIARIES
Notes to Condensed Consolidated Financial Statements
(Unaudited)
The tables below present the components of RWAs calculated in accordance with the Standardized and Basel III Advanced Rules.
| | | | Standardized Capital Rules as of | | | Standardized Capital Rules as of | |
| $ in millions | | | March 2016 | | | | December 2015 | | |
| March
2017 |
| |
| December
2016 |
|
Credit RWAs | | | | | | | | |
Derivatives | | | $138,947 | | | | $136,841 | | | | $120,757 | | | | $124,286 | |
| | | | | |
Commitments, guarantees and loans | | | 114,253 | | | | 111,391 | | | | 118,783 | | | | 115,744 | |
| | | | | |
Securities financing transactions | | | 76,317 | | | | 71,392 | | | | 78,811 | | | | 71,319 | |
| | | | | |
Equity investments | | | 36,671 | | | | 37,687 | | | | 43,066 | | | | 41,428 | |
| | | | | |
Other | | | 60,109 | | | | 62,807 | | | | 62,369 | | | | 58,636 | |
Total Credit RWAs | | | 426,297 | | | | 420,118 | | | | 423,786 | | | | 411,413 | |
Market RWAs | | | | | | | | |
Regulatory VaR | | | 11,025 | | | | 12,000 | | | | 9,638 | | | | 9,750 | |
| | | | | |
Stressed VaR | | | 24,738 | | | | 21,738 | | | | 26,163 | | | | 22,475 | |
| | | | | |
Incremental risk | | | 10,338 | | | | 9,513 | | | | 9,200 | | | | 7,875 | |
| | | | | |
Comprehensive risk | | | 5,835 | | | | 5,725 | | | | 4,663 | | | | 5,338 | |
| | | | | |
Specific risk | | | 49,436 | | | | 55,013 | | | | 33,951 | | | | 39,825 | |
Total Market RWAs | | | 101,372 | | | | 103,989 | | | | 83,615 | | | | 85,263 | |
Total RWAs | | | $527,669 | | | | $524,107 | | | | $507,401 | | | | $496,676 | |
| | | | Basel III Advanced Rules as of | | |
| $ in millions | | | March 2016 | | | | December 2015 | | |
Credit RWAs | | | | | |
Derivatives | | | $120,876 | | | | $113,671 | | |
| | | |
Commitments, guarantees and loans | | | 115,376 | | | | 114,523 | | |
| | | |
Securities financing transactions | | | 13,467 | | | | 14,901 | | |
| | | |
Equity investments | | | 39,091 | | | | 40,110 | | |
| | | |
Other | | | 61,606 | | | | 60,877 | | |
Total Credit RWAs | | | 350,416 | | | | 344,082 | | |
Market RWAs | | | | | |
Regulatory VaR | | | 11,025 | | | | 12,000 | | |
| | | |
Stressed VaR | | | 24,738 | | | | 21,738 | | |
| | | |
Incremental risk | | | 10,338 | | | | 9,513 | | |
| | | |
Comprehensive risk | | | 5,008 | | | | 4,717 | | |
| | | |
Specific risk | | | 49,436 | | | | 55,013 | | |
Total Market RWAs | | | 100,545 | | | | 102,981 | | |
Total Operational RWAs | | | 130,738 | | | | 130,588 | | |
Total RWAs | | | $581,699 | | | | $577,651 | | |
| | | | | | | | |
| | | Basel III Advanced Rules as of | |
| $ in millions | |
| March
2017 |
| |
| December
2016 |
|
Credit RWAs | | | | | | | | |
Derivatives | | | $ 99,709 | | | | $105,096 | |
| | |
Commitments, guarantees and loans | | | 130,963 | | | | 122,792 | |
| | |
Securities financing transactions | | | 17,486 | | | | 14,673 | |
| | |
Equity investments | | | 45,894 | | | | 44,095 | |
| | |
Other | | | 66,728 | | | | 63,431 | |
Total Credit RWAs | | | 360,780 | | | | 350,087 | |
Market RWAs | | | | | | | | |
Regulatory VaR | | | 9,638 | | | | 9,750 | |
| | |
Stressed VaR | | | 26,163 | | | | 22,475 | |
| | |
Incremental risk | | | 9,200 | | | | 7,875 | |
| | |
Comprehensive risk | | | 4,013 | | | | 4,550 | |
| | |
Specific risk | | | 33,951 | | | | 39,825 | |
Total Market RWAs | | | 82,965 | | | | 84,475 | |
Total Operational RWAs | | | 114,531 | | | | 115,088 | |
Total RWAs | | | $558,276 | | | | $549,650 | |
In the tables above:
Securities financing transactions representsrepresent resale and repurchase agreements and securities borrowed and loaned transactions.
Other primarily includes receivables, other assets, and cash and cash equivalents.
The table below presents changes in RWAs calculated in accordance with the Standardized and Basel III Advanced Rules.
| | | | | | | | |
| | | Three Months Ended March 2017 | |
| $ in millions | | | Standardized | | |
| Basel III
Advanced |
|
Risk-Weighted Assets | | | | | | | | |
Beginning balance | | | $496,676 | | | | $549,650 | |
| | |
Credit RWAs | | | | | | | | |
Change in deductions for transitional provisions | | | (233 | ) | | | (233 | ) |
| | |
Change in: | | | | | | | | |
Derivatives | | | (3,529 | ) | | | (5,387 | ) |
| | |
Commitments, guarantees and loans | | | 3,039 | | | | 8,171 | |
| | |
Securities financing transactions | | | 7,492 | | | | 2,813 | |
| | |
Equity investments | | | 1,800 | | | | 1,961 | |
| | |
Other | | | 3,804 | | | | 3,368 | |
Change in Credit RWAs | | | 12,373 | | | | 10,693 | |
Market RWAs | | | | | | | | |
Change in: | | | | | | | | |
Regulatory VaR | | | (112 | ) | | | (112 | ) |
| | |
Stressed VaR | | | 3,688 | | | | 3,688 | |
| | |
Incremental risk | | | 1,325 | | | | 1,325 | |
| | |
Comprehensive risk | | | (675 | ) | | | (537 | ) |
| | |
Specific risk | | | (5,874 | ) | | | (5,874 | ) |
Change in Market RWAs | | | (1,648 | ) | | | (1,510 | ) |
Operational RWAs | | | | | | | | |
Change in operational risk | | | — | | | | (557 | ) |
Change in Operational RWAs | | | — | | | | (557 | ) |
Ending balance | | | $507,401 | | | | $558,276 | |
In the table above, the increased deductions for transitional provisions represent the increased phase-in of deductions from 60% to 80%, effective January 1, 2017.
Standardized Credit RWAs as of March 2017 increased by $12.37 billion compared with December 2016, primarily reflecting an increase in securities financing transactions, principally due to increased exposures. Standardized Market RWAs as of March 2017 decreased by $1.65 billion compared with December 2016, primarily reflecting a decrease in specific risk as a result of changes in risk exposures, partially offset by increased stressed VaR.
Basel III Advanced Credit RWAs as of March 2017 increased by $10.69 billion compared with December 2016, primarily reflecting an increase in commitments, guarantees and loans principally due to increased lending activity. Basel III Advanced Market RWAs as of March 2017 decreased by $1.51 billion compared with December 2016, primarily reflecting a decrease in specific risk as a result of changes in risk exposures, partially offset by increased stressed VaR. Basel III Advanced Operational RWAs as of March 2017 were essentially unchanged compared with December 2016.
| | | | |
72 | | Goldman Sachs March 20162017 Form 10-Q | | 71 |
THE GOLDMAN SACHS GROUP, INC. AND SUBSIDIARIES
Notes to Condensed Consolidated Financial Statements
(Unaudited)
The table below presents changes in RWAs calculated in accordance with the Standardized and Basel III Advanced Rules forRules.
| | | | | | | | |
| | | Year Ended December 2016 | |
| $ in millions | | | Standardized | | |
| Basel III
Advanced |
|
Risk-Weighted Assets | | | | | | | | |
Beginning balance | | | $524,107 | | | | $577,651 | |
| | |
Credit RWAs | | | | | | | | |
Change in deductions for transitional provisions | | | (531 | ) | | | (531 | ) |
| | |
Change in: | | | | | | | | |
Derivatives | | | (12,555 | ) | | | (8,575 | ) |
| | |
Commitments, guarantees and loans | | | 4,353 | | | | 8,269 | |
| | |
Securities financing transactions | | | (73 | ) | | | (228 | ) |
| | |
Equity investments | | | 4,196 | | | | 4,440 | |
| | |
Other | | | (4,095 | ) | | | 2,630 | |
Change in Credit RWAs | | | (8,705 | ) | | | 6,005 | |
Market RWAs | | | | | | | | |
Change in: | | | | | | | | |
Regulatory VaR | | | (2,250 | ) | | | (2,250 | ) |
| | |
Stressed VaR | | | 737 | | | | 737 | |
| | |
Incremental risk | | | (1,638 | ) | | | (1,638 | ) |
| | |
Comprehensive risk | | | (387 | ) | | | (167 | ) |
| | |
Specific risk | | | (15,188 | ) | | | (15,188 | ) |
Change in Market RWAs | | | (18,726 | ) | | | (18,506 | ) |
Operational RWAs | | | | | | | | |
Change in operational risk | | | — | | | | (15,500 | ) |
Change in Operational RWAs | | | — | | | | (15,500 | ) |
Ending balance | | | $496,676 | | | | $549,650 | |
In the three months ended March 2016. Thetable above, the increased deductions due tofor transitional provisions represent the increased phase-in of deductions from 40% to 60%, effective January 1, 2016.
| | | | | | | | |
| | | Three Months Ended
March 2016 | |
| $ in millions | | | Standardized | | |
| Basel III
Advanced |
|
Risk-Weighted Assets | | | | | | | | |
Beginning balance | | | $524,107 | | | | $577,651 | |
| | |
Credit RWAs | | | | | | | | |
Increased deductions due to transitional provisions | | | (531 | ) | | | (531 | ) |
| | |
Increase/(decrease) in derivatives | | | 2,106 | | | | 7,205 | |
| | |
Increase/(decrease) in commitments, guarantees and loans | | | 2,862 | | | | 853 | |
| | |
Increase/(decrease) in securities financing transactions | | | 4,925 | | | | (1,434 | ) |
| | |
Increase/(decrease) in equity investments | | | (561 | ) | | | (564 | ) |
| | |
Change in other | | | (2,622 | ) | | | 805 | |
Change in Credit RWAs | | | 6,179 | | | | 6,334 | |
Market RWAs | | | | | | | | |
Increase/(decrease) in regulatory VaR | | | (975 | ) | | | (975 | ) |
| | |
Increase/(decrease) in stressed VaR | | | 3,000 | | | | 3,000 | |
| | |
Increase/(decrease) in incremental risk | | | 825 | | | | 825 | |
| | |
Increase/(decrease) in comprehensive risk | | | 110 | | | | 291 | |
| | |
Increase/(decrease) in specific risk | | | (5,577 | ) | | | (5,577 | ) |
Change in Market RWAs | | | (2,617 | ) | | | (2,436 | ) |
Operational RWAs | | | | | | | | |
Increase/(decrease) in operational risk | | | — | | | | 150 | |
Change in Operational RWAs | | | — | | | | 150 | |
Ending balance | | | $527,669 | | | | $581,699 | |
Standardized Credit RWAs as of MarchDecember 2016 increaseddecreased by $6.18$8.71 billion compared with December 2015, primarily reflecting an increasea decrease in securities financing transactions,derivatives, principally due to reduced exposures, and a decrease in receivables included in other credit RWAs reflecting the impact of firm and client activity. This decrease was partially offset by increases in commitments, guarantees and loans principally due to increased lending activity and equity investments, principally due to increased exposures and an increase in lending activity.the impact of market movements. Standardized Market RWAs as of December 2016 decreased $2.62by $18.73 billion compared with December 2015, primarily reflecting a decrease in specific risk as a result of reduced risk exposures, partially offset by increased stressed VaR.exposures.
Basel III Advanced Credit RWAs as of MarchDecember 2016 increased by $6.33$6.01 billion compared with December 2015, primarily reflecting an increase in commitments, guarantees and loans principally due to increased lending activity, and an increase in equity investments, principally due to increased exposures and the impact of market movements. These increases were partially offset by a decrease in derivatives, principally due to higherlower counterparty credit risk.risk and reduced exposure. Basel III Advanced Market RWAs as of MarchDecember 2016 decreased by $2.44$18.51 billion compared with December 2015, primarily reflecting a decrease in specific risk as a result of reduced risk exposures, partially offset by increased stressed VaR. Basel III Advanced Operational RWAs as of March 2016 were essentially unchanged compared with December 2015.
The table below presents changes in RWAs calculated in accordance with the Standardized and Basel III Advanced Rules for the year ended December 2015. The increased deductions due to transitional provisions represent the increased phase-in of deductions from 20% to 40%, effective January 1, 2015.
| | | | | | | | |
| | | Year Ended December 2015 | |
| $ in millions | | | Standardized | | |
| Basel III
Advanced |
|
Risk-Weighted Assets | | | | | | | | |
Beginning balance | | | $619,216 | | | | $570,313 | |
| | |
Credit RWAs | | | | | | | | |
Increased deductions due to transitional provisions | | | (1,073 | ) | | | (1,073 | ) |
| | |
Increase/(decrease) in derivatives | | | (43,930 | ) | | | (8,830 | ) |
| | |
Increase/(decrease) in commitments, guarantees and loans | | | 21,608 | | | | 19,314 | |
| | |
Increase/(decrease) in securities financing transactions | | | (20,724 | ) | | | (717 | ) |
| | |
Increase/(decrease) in equity investments | | | 131 | | | | 934 | |
| | |
Change in other | | | (8,589 | ) | | | 6,510 | |
Change in Credit RWAs | | | (52,577 | ) | | | 16,138 | |
Market RWAs | | | | | | | | |
Increase/(decrease) in regulatory VaR | | | 1,762 | | | | 1,762 | |
| | |
Increase/(decrease) in stressed VaR | | | (7,887 | ) | | | (7,887 | ) |
| | |
Increase/(decrease) in incremental risk | | | (7,437 | ) | | | (7,437 | ) |
| | |
Increase/(decrease) in comprehensive risk | | | (4,130 | ) | | | (3,433 | ) |
| | |
Increase/(decrease) in specific risk | | | (24,840 | ) | | | (24,905 | ) |
Change in Market RWAs | | | (42,532 | ) | | | (41,900 | ) |
Operational RWAs | | | | | | | | |
Increase/(decrease) in operational risk | | | — | | | | 33,100 | |
Change in Operational RWAs | | | — | | | | 33,100 | |
Ending balance | | | $524,107 | | | | $577,651 | |
Standardized Credit RWAs as of December 2015 decreased by $52.58 billion compared with December 2014, reflecting decreases in derivatives and securities financing transactions, primarily due to lower exposures. These decreases were partially offset by an increase in lending activity. Standardized Market RWAs as of December 2015 decreased by $42.53 billion compared with December 2014, primarily due to decreased specific risk, as a result of reduced risk exposures.
Basel III Advanced Credit RWAs as of December 2015 increased by $16.14 billion compared with December 2014, primarily reflecting an increase in lending activity. This increase was partially offset by a decrease in RWAs related to derivatives, due to lower counterparty credit risk. Basel III Advanced Market RWAs as of December 2015 decreased by $41.90 billion compared with December 2014, primarily due to decreased specific risk, as a result of reduced risk exposures. Basel III Advanced Operational RWAs as of December 2015 increased2016 decreased by $33.10$15.50 billion compared with December 2014, substantially all2015, reflecting a decrease in the frequency of which is associated with mortgage-related legal matters and regulatory proceedings.certain events incorporated within the firm’s risk-based model.
| | | | |
| | Goldman Sachs March 2016 Form 10-Q | | 73 |
THE GOLDMAN SACHS GROUP, INC. AND SUBSIDIARIES
Notes to Condensed Consolidated Financial Statements
(Unaudited)
See “Definition of Risk-Weighted Assets” above for a description of the calculations of Credit RWAs, Market RWAs and Operational RWAs, including the differences in the calculation of Credit RWAs under each of the Standardized Capital Rules and the Basel III Advanced Rules.
Bank Subsidiaries
Regulatory Capital Ratios. GS Bank USA, an FDIC-insured, New York State-chartered bank and a member of the Federal Reserve System, is supervised and regulated by the Federal Reserve Board, the FDIC, the New York State Department of Financial Services and the Consumer Financial Protection Bureau, and is subject to regulatory capital requirements that are calculated in substantially the same manner as those applicable to bank holding companies. For purposes of assessing the adequacy of its capital, GS Bank USA calculates its capital ratios in accordance with the risk-based capital and leverage requirements applicable to state member banks. Those requirements are based on the Revised Capital Framework described above. GS Bank USA is an Advanced approach banking organization under the Revised Capital Framework.
| | | | |
| 72 | | Goldman Sachs March 2017 Form 10-Q | | |
THE GOLDMAN SACHS GROUP, INC. AND SUBSIDIARIES
Notes to Condensed Consolidated Financial Statements
(Unaudited)
Under the regulatory framework for prompt corrective action applicable to GS Bank USA, in order to meet the quantitative requirements for being a “well-capitalized” depository institution, GS Bank USA must meet higher minimum requirements than the minimum ratios in the table below. The table below presents the minimum ratios and the “well-capitalized” minimum ratios required for GS Bank USA.
| | | | Minimum Ratio as of | | | “Well-capitalized” Minimum Ratio | | | Minimum Ratio as of | | | | |
| | | | March 2016 | | | | December 2015 | | | |
| March
2017 |
| |
| December
2016 |
| |
| “Well-capitalized”
Minimum Ratio |
|
CET1 ratio | | | 5.125% | | | | 4.5% | | | | 6.5% | | | | 5.750% | | | | 5.125% | | | | 6.5% | |
| | | | | |
Tier 1 capital ratio | | | 6.625% | | | | 6.0% | | | | 8.0% | | | | 7.250% | | | | 6.625% | | | | 8.0% | |
| | | | | |
Total capital ratio | | | 8.625% | | | | 8.0% | | | | 10.0% | | | | 9.250% | | | | 8.625% | | | | 10.0% | |
| | | | | |
Tier 1 leverage ratio | | | 4.000% | | | | 4.0% | | | | 5.0% | | | | 4.000% | | | | 4.000% | | | | 5.0% | |
GS Bank USA was in compliance with its minimum capital requirements and the “well-capitalized” minimum ratios as of March 20162017 and December 2015.2016. In the table above, the minimum capital ratios as of March 2017 reflect the 50% phase-in of the capital conservation buffer (1.25%) and the countercyclical capital buffer described above (0%). The minimum capital ratios as of December 2016 reflect the 25% phase-in of the capital conservation buffer (0.625%) and the counter-cyclicalcountercyclical capital buffer described above (0%). GS Bank USA’s capital levels and prompt corrective action classification are also subject to qualitative judgments by the regulators about components of capital, risk weightings and other factors. Failure to comply with these capital requirements, including a breach of the buffers discussed above, could result in restrictions being imposed by GS Bank USA’s regulators.
Similar to the firm, GS Bank USA is required to calculate each of the CET1, Tier 1 capital and Total capital ratios in accordance with both the Standardized Capital Rules and Basel III Advanced Rules. The lower of each ratio calculated in accordance with the Standardized Capital Rules and Basel III Advanced Rules is the ratio against which GS Bank USA’s compliance with its minimum ratio requirements is assessed. Each of the ratios calculated in accordance with the Standardized Capital Rules was lower than that calculated in accordance with the Basel III Advanced Rules and therefore the Standardized Capital ratios were the ratios that applied to GS Bank USA as of March 20162017 and December 2015.2016. The capital ratios that apply to GS Bank USA can change in future reporting periods as a result of these regulatory requirements.
The table below presents the ratios for GS Bank USA calculated in accordance with both the Standardized and Basel III Advanced Rules.
| | | | As of | | | As of | |
| $ in millions | | | March 2016 | | | | December 2015 | | |
| March
2017 |
| |
| December
2016 |
|
Standardized | | | | | | | | |
Common Equity Tier 1 | | | $ 23,333 | | | | $ 23,017 | | | | $ 24,791 | | | | $ 24,485 | |
Tier 1 capital | | | 23,333 | | | | 23,017 | | | | 24,791 | | | | 24,485 | |
| | | | | |
Tier 2 capital | | | 2,424 | | | | 2,311 | | | | 2,401 | | | | 2,382 | |
Total capital | | | $ 25,757 | | | | $ 25,328 | | | | $ 27,192 | | | | $ 26,867 | |
Basel III Advanced | | | | | | | | |
Common Equity Tier 1 | | | $ 23,333 | | | | $ 23,017 | | | | $ 24,791 | | | | $ 24,485 | |
Tier 1 capital | | | 23,333 | | | | 23,017 | | | | 24,791 | | | | 24,485 | |
| | | | | |
Standardized Tier 2 capital | | | 2,424 | | | | 2,311 | | | | 2,401 | | | | 2,382 | |
| | | | | |
Allowance for losses on loans and lending commitments | | | (410 | ) | | | (311 | ) | | | (401 | ) | | | (382 | ) |
| | | | |
Tier 2 capital | | | 2,014 | | | | 2,000 | | | | 2,000 | | | | 2,000 | |
Total capital | | | $ 25,347 | | | | $ 25,017 | | | | $ 26,791 | | | | $ 26,485 | |
RWAs | | | | | | | | |
Standardized | | | $206,858 | | | | $202,197 | | | | $207,753 | | | | $204,232 | |
| | | | | |
Basel III Advanced | | | 141,435 | | | | 131,059 | | | | $136,820 | | | | $131,051 | |
CET1 ratio | | | | | | | | |
Standardized | | | 11.3% | | | | 11.4% | | | | 11.9% | | | | 12.0% | |
| | | | | |
Basel III Advanced | | | 16.5% | | | | 17.6% | | | | 18.1% | | | | 18.7% | |
Tier 1 capital ratio | | | | | | | | |
Standardized | | | 11.3% | | | | 11.4% | | | | 11.9% | | | | 12.0% | |
| | | | | |
Basel III Advanced | | | 16.5% | | | | 17.6% | | | | 18.1% | | | | 18.7% | |
Total capital ratio | | | | | | | | |
Standardized | | | 12.5% | | | | 12.5% | | | | 13.1% | | | | 13.2% | |
| | | | | |
Basel III Advanced | | | 17.9% | | | | 19.1% | | | | 19.6% | | | | 20.2% | |
Tier 1 leverage ratio | | | 15.9% | | | | 16.4% | | | | 15.5% | | | | 14.4% | |
GS Bank USA’s Standardized capital ratios as of March 2017 were essentially unchanged compared with December 2016. The decrease in GS Bank USA’s Advanced capital ratios from December 2016 to March 2017 is primarily due to an increase in credit RWAs, principally due to an increase in lending activity.
The firm’s principal non-U.S. bank subsidiary, GSIB, is a wholly-owned credit institution, regulated by the Prudential Regulation Authority (PRA) and the Financial Conduct Authority (FCA) and is subject to minimum capital requirements. As of March 20162017 and December 2015,2016, GSIB was in compliance with all regulatory capital requirements.
| | | | |
74 | | Goldman Sachs March 20162017 Form 10-Q | | 73 |
THE GOLDMAN SACHS GROUP, INC. AND SUBSIDIARIES
Notes to Condensed Consolidated Financial Statements
(Unaudited)
Broker-Dealer Subsidiaries
U.S. Regulated Broker-Dealer Subsidiaries. TheGS&Co. is the firm’s primary U.S. regulated broker-dealer subsidiaries include GS&Co.subsidiary and GSEC. GS&Co. and GSEC are registered U.S. broker-dealers and futures commission merchants, and areis subject to regulatory capital requirements including those imposed by the SEC the U.S. Commodity Futures Trading Commission (CFTC), the Chicago Mercantile Exchange,and the Financial Industry Regulatory Authority, Inc. (FINRA)In addition, GS&Co. is a registered futures commission merchant and is subject to regulatory capital requirements imposed by the CFTC, the Chicago Mercantile Exchange and the National Futures Association. Rule 15c3-1 of the SEC and Rule 1.17 of the CFTC specify uniform minimum net capital requirements, as defined, for their registrants, and also effectively require that a significant part of the registrants’ assets be kept in relatively liquid form. GS&Co. and GSEC havehas elected to calculate theirits minimum capital requirements in accordance with the “Alternative Net Capital Requirement” as permitted by Rule 15c3-1.
As of March 20162017 and December 2015,2016, GS&Co. had regulatory net capital, as defined by Rule 15c3-1, of $16.47$16.09 billion and $14.75$17.17 billion, respectively, which exceeded the amount required by $13.95$13.50 billion and $12.37$14.66 billion, respectively. As of March 2016 and December 2015, GSEC had regulatory net capital, as defined by Rule 15c3-1, of $2.06 billion and $1.71 billion, respectively, which exceeded the amount required by $1.98 billion and $1.59 billion, respectively.
In addition to its alternative minimum net capital requirements, GS&Co. is also required to hold tentative net capital in excess of $1 billion and net capital in excess of $500 million in accordance with the market and credit risk standards of Appendix E of Rule 15c3-1. GS&Co. is also required to notify the SEC in the event that its tentative net capital is less than $5 billion. As of March 20162017 and December 2015,2016, GS&Co. had tentative net capital and net capital in excess of both the minimum and the notification requirements.
Non-U.S. Regulated Broker-Dealer Subsidiaries. The firm’s principal non-U.S. regulated broker-dealer subsidiaries include Goldman Sachs International (GSI) and Goldman Sachs Japan Co., Ltd. (GSJCL). GSI, the firm’s U.K. broker-dealer, is regulated by the PRA and the FCA. GSJCL, the firm’s Japanese broker-dealer, is regulated by Japan’s Financial Services Agency. These and certain other non-U.S. subsidiaries of the firm are also subject to capital adequacy requirements promulgated by authorities of the countries in which they operate. As of March 20162017 and December 2015,2016, these subsidiaries were in compliance with their local capital adequacy requirements.
Restrictions on Payments
Group Inc.’s ability to withdraw capital from its regulated subsidiaries is limited by minimum equity capital requirements applicable to those subsidiaries, provisions of applicable law and regulations and other regulatory restrictions that limit the ability of those subsidiaries to declare and pay dividends without prior regulatory approval (e.g., the amount of dividends that may be paid by GS Bank USA is limited to the lesser of the amounts calculated under a recent earnings test and an undivided profits test) even if the relevant subsidiary would satisfy the equity capital requirements applicable to it after giving effect to the dividend. For example, the Federal Reserve Board, the FDIC and the New York State Department of Financial Services have authority to prohibit or to limit the payment of dividends by the banking organizations they supervise (including GS Bank USA) if, in the relevant regulator’s opinion, payment of a dividend would constitute an unsafe or unsound practice in the light of the financial condition of the banking organization.
As of March 20162017 and December 2015,2016, Group Inc. was required to maintain $49.66$48.15 billion and $48.09$46.49 billion, respectively, of minimum equity capital in its regulated subsidiaries in order to satisfy the regulatory requirements of such subsidiaries.
Other
The deposits of GS Bank USA are insured by the FDIC to the extent provided by law. The Federal Reserve Board requires that GS Bank USA maintain cash reserves with the Federal Reserve Bank of New York. The amount deposited by GS Bank USA held at the Federal Reserve Bank of New York was $50.13$67.86 billion and $49.36$74.24 billion as of March 20162017 and December 2015,2016, respectively, which exceeded required reserve amounts by $50.06$67.80 billion and $49.25$74.09 billion as of March 20162017 and December 2015,2016, respectively.
| | | | |
| 74 | | Goldman Sachs March 20162017 Form 10-Q | | 75 |
THE GOLDMAN SACHS GROUP, INC. AND SUBSIDIARIES
Notes to Condensed Consolidated Financial Statements
(Unaudited)
Note 21.
Earnings Per Common Share
Basic earnings per common share (EPS) is calculated by dividing net earnings applicable to common shareholders by the weighted average number of common shares outstanding. Common shares outstanding includes common stock and RSUs for which no future service is required as a condition to the delivery of the underlying common stock.stock (collectively, basic shares). Diluted EPS includes the determinants of basic EPS and, in addition, reflects the dilutive effect of the common stock deliverable for stock options and for RSUs for which future service is required as a condition to the delivery of the underlying common stock.
The table below presents the computations of basic and diluted EPS.
| | | | Three Months
Ended March | | | Three Months Ended March | |
| in millions, except per share amounts | | | 2016 | | | | 2015 | | | | 2017 | | | | 2016 | |
Numerator for basic and diluted EPS - net earnings applicable to common shareholders | | | $1,200 | | | | $2,748 | | |
Denominator for basic EPS - weighted average number of common shares | | | 440.8 | | | | 453.3 | | |
Net earnings applicable to common shareholders | | | | $2,162 | | | | $1,200 | |
Weighted average number of basic shares | | | | 412.5 | | | | 440.8 | |
| | | | | |
Effect of dilutive securities: | | | | | | | | |
RSUs | | | 3.5 | | | | 4.3 | | | | 4.7 | | | | 3.5 | |
| | | | | |
Stock options | | | 3.1 | | | | 5.3 | | | | 2.9 | | | | 3.1 | |
Dilutive potential common shares | | | 6.6 | | | | 9.6 | | |
Denominator for diluted EPS - weighted average number of common shares and dilutive potential common shares | | | 447.4 | | | | 462.9 | | |
Dilutive securities | | | | 7.6 | | | | 6.6 | |
Weighted average number of basic shares and dilutive securities | | | | 420.1 | | | | 447.4 | |
Basic EPS | | | $ 2.71 | | | | $ 6.05 | | | | $ 5.23 | | | | $ 2.71 | |
| | | | | |
Diluted EPS | | | 2.68 | | | | 5.94 | | | | $ 5.15 | | | | $ 2.68 | |
In the table above, unvested share-based awards that have non-forfeitable rights to dividends or dividend equivalents are treated as a separate class of securities in calculating EPS. The impact of applying this methodology was a reduction in basic EPS of $0.01 for both the three months ended March 20162017 and March 2015.2016.
The diluted EPS computations in the table above do not include antidilutive RSUs and common shares underlying antidilutive stock options of 6.1 million and 6.0less than 0.1 million for the three months ended March 20162017 and 6.1 million for the three months ended March 2015, respectively.2016.
Note 22.
Transactions with Affiliated Funds
The firm has formed numerous nonconsolidated investment funds with third-party investors. As the firm generally acts as the investment manager for these funds, it is entitled to receive management fees and, in certain cases, advisory fees or incentive fees from these funds. Additionally, the firm invests alongside the third-party investors in certain funds.
The firm may periodically determine to waive certain management fees on selected money market funds. Management fees of $27 million were waived for the three months ended March 2016.
The tables below present fees earned from affiliated funds, fees receivable from affiliated funds and the aggregate carrying value of the firm’s interests in affiliated funds.
| | | | | | | | |
| | | Three Months Ended March | |
| $ in millions | | | 2016 | | | | 2015 | |
Fees earned from funds | | | $ 632 | | | | $ 884 | |
| |
| | | As of | |
| $ in millions | |
| March
2016 |
| |
| December
2015 |
|
Fees receivable from funds | | | $ 576 | | | | $ 599 | |
| | |
Aggregate carrying value of interests in funds | | | 7,363 | | | | 7,768 | |
| | | | | | | | |
| | | Three Months Ended March | |
| $ in millions | | | 2017 | | | | 2016 | |
Fees earned from funds | | | $ 710 | | | | $ 632 | |
| |
| | | As of | |
| $ in millions | |
| March
2017 |
| |
| December
2016 |
|
Fees receivable from funds | | | $ 595 | | | | $ 554 | |
| | |
Aggregate carrying value of interests in funds | | | $6,505 | | | | $6,841 | |
| | | | |
76 | | Goldman Sachs March 2016 Form 10-Q | | |
THE GOLDMAN SACHS GROUP, INC. AND SUBSIDIARIES
NotesThe firm may periodically determine to Condensed Consolidated Financial Statements
(Unaudited)
Aswaive certain management fees on selected money market funds. Management fees of both$25 million and $27 million were waived for the three months ended March 2017 and March 2016, and December 2015, the firm had an outstanding guarantee on behalf of its funds of $300 million, which the firm has voluntarily provided in connection with a financing agreement with a third-party lender executed by one of the firm’s real estate funds that is not covered by the Volcker Rule. As of March 2016 and December 2015, the firm had no outstanding loans or commitments to extend credit to affiliated funds.
respectively. The Volcker Rule restricts the firm from providing financial support to covered funds (as defined in the rule) after the expiration of any applicablethe conformance period. As a general matter, in the ordinary course of business, the firm does not expect to provide additional voluntary financial support to any covered funds but may choose to do so with respect to funds that are not subject to the Volcker Rule; however, in the event that such support is provided, the amount is not expected to be material.
As of both March 2017 and December 2016, the firm had an outstanding guarantee, as permitted under the Volcker Rule, on behalf of its funds of $300 million. The firm has voluntarily provided this guarantee in connection with a financing agreement with a third-party lender executed by one of the firm’s real estate funds that is not covered by the Volcker Rule. As of March 2017 and December 2016, except as noted above, the firm has not provided any additional financial support to its affiliated funds.
In addition, in the ordinary course of business, the firm may also engage in other activities with its affiliated funds including, among others, securities lending, trade execution, market making, custody, and acquisition and bridge financing. See Note 18 for the firm’s investment commitments related to these funds.
| | | | |
| | Goldman Sachs March 2017 Form 10-Q | | 75 |
THE GOLDMAN SACHS GROUP, INC. AND SUBSIDIARIES
Notes to Condensed Consolidated Financial Statements
(Unaudited)
Note 23.
Interest Income and Interest Expense
Interest is recorded over the life of the instrument on an accrual basis based on contractual interest rates. The table below presents the firm’s sources of interest income and interest expense.
| | | | Three Months
Ended March | | | Three Months
Ended March | |
| $ in millions | | | 2016 | | | | 2015 | | | | 2017 | | | | 2016 | |
Interest income | | | | | | | | |
Deposits with banks | | | $ 76 | | | | $ 38 | | | | $ 162 | | | | $ 91 | |
| | | | | |
Securities borrowed, securities purchased under agreements to resell and federal funds sold | | | 94 | | | | (30 | ) | | | 281 | | | | 109 | |
| | | | | |
Financial instruments owned, at fair value | | | 1,396 | | | | 1,474 | | | | 1,351 | | | | 1,418 | |
| | | | | |
Loans receivable | | | 412 | | | | 253 | | | | 565 | | | | 412 | |
| | | | | |
Other interest | | | 370 | | | | 300 | | | | 387 | | | | 318 | |
Total interest income | | | 2,348 | | | | 2,035 | | | | 2,746 | | | | 2,348 | |
Interest expense | | | | | | | | |
Deposits | | | 169 | | | | 85 | | | | 274 | | | | 169 | |
| | | | | |
Securities loaned and securities sold under agreements to repurchase | | | 118 | | | | 73 | | | | 136 | | | | 118 | |
| | | | | |
Financial instruments sold, but not yet purchased, at fair value | | | 314 | | | | 329 | | | | 336 | | | | 314 | |
| | | | | |
Short-term secured and unsecured borrowings | | | 127 | | | | 125 | | | | 121 | | | | 127 | |
| | | | | |
Long-term secured and unsecured borrowings | | | 865 | | | | 811 | | | | 1,176 | | | | 865 | |
| | | | | |
Other interest | | | (128 | ) | | | (247 | ) | | | 187 | | | | (128 | ) |
Total interest expense | | | 1,465 | | | | 1,176 | | | | 2,230 | | | | 1,465 | |
Net interest income | | | $ 883 | | | | $ 859 | | | | $ 516 | | | | $ 883 | |
In the table above:
Securities borrowed, securities purchased under agreements to resell and federal funds sold includes rebates paid and interest income on securities borrowed.
Other interest income includes interest income on customer debit balances and other interest-earning assets.
Other interest expense includes rebates received on other interest-bearing liabilities and interest expense on customer credit balances.
| | | | |
| | Goldman Sachs March 2016 Form 10-Q | | 77 |
THE GOLDMAN SACHS GROUP, INC. AND SUBSIDIARIES
Notes to Condensed Consolidated Financial Statements
(Unaudited)
Note 24.
Income Taxes
Provision for Income Taxes
Income taxes are provided for using the asset and liability method under which deferred tax assets and liabilities are recognized for temporary differences between the financial reporting and tax bases of assets and liabilities. The firm reports interest expense related to income tax matters in “Provision for taxes” and income tax penalties in “Other expenses.”
Deferred Income Taxes
Deferred income taxes reflect the net tax effects of temporary differences between the financial reporting and tax bases of assets and liabilities. These temporary differences result in taxable or deductible amounts in future years and are measured using the tax rates and laws that will be in effect when such differences are expected to reverse. Valuation allowances are established to reduce deferred tax assets to the amount that more likely than not will be realized and primarily relate to the ability to utilize losses in various tax jurisdictions. Tax assets and liabilities are presented as a component of “Other assets” and “Other liabilities and accrued expenses,” respectively.
Unrecognized Tax Benefits
The firm recognizes tax positions in the condensed consolidated financial statements only when it is more likely than not that the position will be sustained on examination by the relevant taxing authority based on the technical merits of the position. A position that meets this standard is measured at the largest amount of benefit that will more likely than not be realized on settlement. A liability is established for differences between positions taken in a tax return and amounts recognized in the condensed consolidated financial statements.
Regulatory Tax Examinations
The firm is subject to examination by the U.S. Internal Revenue Service (IRS) and other taxing authorities in jurisdictions where the firm has significant business operations, such as the United Kingdom, Japan, Hong Kong and various states, such as New York. The tax years under examination vary by jurisdiction. The firm does not expect completion of these audits to have a material impact on the firm’s financial condition but it may be material to operating results for a particular period, depending, in part, on the operating results for that period.
| | | | |
| 76 | | Goldman Sachs March 2017 Form 10-Q | | |
THE GOLDMAN SACHS GROUP, INC. AND SUBSIDIARIES
Notes to Condensed Consolidated Financial Statements
(Unaudited)
The table below presents the earliest tax years that remain subject to examination by major jurisdiction.
| | | | |
| Jurisdiction | |
| As of
March 20162017 |
|
U.S. Federal | | | 20082011 | |
| | |
New York State and City | | | 2007 | |
| | |
United Kingdom | | | 2014 | |
| | |
Japan | | | 2014 | |
| | |
Hong Kong | | | 20062010 | |
The U.S. Federal examinations of fiscal 2008 through calendar 2010 have been finalized, but the settlement is subject to review by the Joint Committee of Taxation. The examinations of 2011 and 2012 began in 2013.
The firm has been accepted into the Compliance Assurance Process program by the IRSU.S. Internal Revenue Service for each of the tax years from 2013 through 2016.2017. This program allows the firm to work with the IRSU.S. Internal Revenue Service to identify and resolve potential U.S. federal tax issues before the filing of tax returns. The 2013 through 2015 tax year is the first year that was examined under the program, and 2013 and 2014years remain subject to post-filing review.
New York State and City examinations for the firm (excluding GS Bank USA) of fiscal 2007 through calendar 2010 began in 2013.are ongoing. New York State and City examinations of 2011for GS Bank USA have been completed through 2014 began in 2015.2014.
During the first quarter of 2016,2017, the firm concluded examinations with the JapanHong Kong tax authorities related to 2007 through 2015, with 2010 through 2013.2015 subject to final review. The completion of thethese examinations did not have a material impact on the firm’s financial condition, results of operations, or cash flows.effective income tax rate.
All years including and subsequent to the years in the table above remain open to examination by the taxing authorities. The firm believes that the liability for unrecognized tax benefits it has established is adequate in relation to the potential for additional assessments.
| | | | |
78 | | Goldman Sachs March 2016 Form 10-Q | | |
THE GOLDMAN SACHS GROUP, INC. AND SUBSIDIARIES
Notes to Condensed Consolidated Financial Statements
(Unaudited)
Note 25.
Business Segments
The firm reports its activities in the following four business segments: Investment Banking, Institutional Client Services, Investing & Lending and Investment Management.
Basis of Presentation
In reporting segments, certain of the firm’s business lines have been aggregated where they have similar economic characteristics and are similar in each of the following areas: (i) the nature of the services they provide, (ii) their methods of distribution, (iii) the types of clients they serve and (iv) the regulatory environments in which they operate.
The cost drivers of the firm taken as a whole, — compensation, headcount and levels of business activity, — are broadly similar in each of the firm’s business segments. Compensation and benefits expenses in the firm��sfirm’s segments reflect, among other factors, the overall performance of the firm, as well as the performance of individual businesses. Consequently, pre-tax margins in one segment of the firm’s business may be significantly affected by the performance of the firm’s other business segments.
The firm allocates assets (including allocations of global core liquid assets and cash, secured client financing and other assets), revenues and expenses among the four business segments. Due to the integrated nature of these segments, estimates and judgments are made in allocating certain assets, revenues and expenses. The allocation process is based on the manner in which management currently views the performance of the segments. Transactions between segments are based on specific criteria or approximate third-party rates.
| | | | |
| | Goldman Sachs March 2017 Form 10-Q | | 77 |
THE GOLDMAN SACHS GROUP, INC. AND SUBSIDIARIES
Notes to Condensed Consolidated Financial Statements
(Unaudited)
The table below presents the firm’s net revenues, pre-tax earnings and total assets by segment. Management believes that this information provides a reasonable representation of each segment’s contribution to consolidatedpre-tax earnings and total assets.
| | | | Three Months Ended or as of March | | | Three Months Ended or as of March | |
| $ in millions | | | 2016 | | | | 2015 | | | | 2017 | | | | 2016 | |
Investment Banking | | | | | | | | |
Financial Advisory | | | $ 771 | | | | $ 961 | | | | $ 756 | | | | $ 771 | |
Equity underwriting | | | 183 | | | | 533 | | | | 311 | | | | 183 | |
| | | | | |
Debt underwriting | | | 509 | | | | 411 | | | | 636 | | | | 509 | |
Total Underwriting | | | 692 | | | | 944 | | | | 947 | | | | 692 | |
Total net revenues | | | 1,463 | | | | 1,905 | | | | 1,703 | | | | 1,463 | |
| | | | | |
Operating expenses | | | 762 | | | | 1,104 | | | | 975 | | | | 762 | |
Pre-tax earnings | | | $ 701 | | | | $ 801 | | | | $ 728 | | | | $ 701 | |
Segment assets | | | $ 2,579 | | | | $ 3,215 | | | | $ 2,614 | | | | $ 2,579 | |
Institutional Client Services | | | | | | | | |
Fixed Income, Currency and Commodities Client Execution | | | $ 1,663 | | | | $ 3,134 | | |
FICC Client Execution | | | | $ 1,685 | | | | $ 1,663 | |
Equities client execution | | | 470 | | | | 1,124 | | | | 552 | | | | 470 | |
| | | | | |
Commissions and fees | | | 878 | | | | 808 | | | | 738 | | | | 878 | |
| | | | | |
Securities services | | | 432 | | | | 393 | | | | 384 | | | | 432 | |
Total Equities | | | 1,780 | | | | 2,325 | | | | 1,674 | | | | 1,780 | |
Total net revenues | | | 3,443 | | | | 5,459 | | | | 3,359 | | | | 3,443 | |
| | | | | |
Operating expenses | | | 2,421 | | | | 3,571 | | | | 2,544 | | | | 2,421 | |
Pre-tax earnings | | | $ 1,022 | | | | $ 1,888 | | | | $ 815 | | | | $ 1,022 | |
Segment assets | | | $671,462 | | | | $703,690 | | | | $667,778 | | | | $671,462 | |
Investing & Lending | | | | | | | | |
Equity securities | | | $ — | | | | $ 1,160 | | | | $ 798 | | | | $ — | |
| | | | | |
Debt securities and loans | | | 87 | | | | 509 | | | | 666 | | | | 87 | |
Total net revenues | | | 87 | | | | 1,669 | | | | 1,464 | | | | 87 | |
| | | | | |
Operating expenses | | | 443 | | | | 737 | | | | 750 | | | | 443 | |
Pre-tax earnings/(loss) | | | $ (356 | ) | | | $ 932 | | | | $ 714 | | | | $ (356 | ) |
Segment assets | | | $188,985 | | | | $143,086 | | | | $209,958 | | | | $188,985 | |
Investment Management | | | | | | | | |
Management and other fees | | | $ 1,165 | | | | $ 1,194 | | | | $ 1,219 | | | | $ 1,165 | |
| | | | | |
Incentive fees | | | 46 | | | | 254 | | | | 121 | | | | 46 | |
| | | | | |
Transaction revenues | | | 134 | | | | 136 | | | | 160 | | | | 134 | |
Total net revenues | | | 1,345 | | | | 1,584 | | | | 1,500 | | | | 1,345 | |
| | | | | |
Operating expenses | | | 1,136 | | | | 1,271 | | | | 1,218 | | | | 1,136 | |
Pre-tax earnings | | | $ 209 | | | | $ 313 | | | | $ 282 | | | | $ 209 | |
Segment assets | | | $ 15,010 | | | | $ 15,054 | | | | $ 13,719 | | | | $ 15,010 | |
Total net revenues | | | $ 6,338 | | | | $ 10,617 | | | | $ 8,026 | | | | $ 6,338 | |
| | | | | |
Total operating expenses | | | 4,762 | | | | 6,683 | | | | 5,487 | | | | 4,762 | |
Total pre-tax earnings | | | $ 1,576 | | | | $ 3,934 | | | | $ 2,539 | | | | $ 1,576 | |
Total assets | | | $878,036 | | | | $865,045 | | | | $894,069 | | | | $878,036 | |
| | | | |
| | Goldman Sachs March 2016 Form 10-Q | | 79 |
THE GOLDMAN SACHS GROUP, INC. AND SUBSIDIARIES
Notes to Condensed Consolidated Financial Statements
(Unaudited)
The segment information presented inIn the table above is prepared according to the following methodologies:above:
Revenues and expenses directly associated with each segment are included in determining pre-tax earnings.
Net revenues in the firm’s segments include allocations of interest income and interest expense to specific securities, commodities and other positions in relation to the cash generated by, or funding requirements of, such underlying positions. Net interest is included in segment net revenues as it is consistent with the way in which management assesses segment performance.
Overhead expenses not directly allocable to specific segments are allocated ratably based on direct segment expenses.
The table below presents the amounts of net interest income by segment included in net revenues.
| | | | Three Months
Ended March | | | Three Months
Ended March | |
| $ in millions | | | 2016 | | | | 2015 | | | | 2017 | | | | 2016 | |
Investment Banking | | | $ — | | | | $ — | | | | $ — | | | | $ — | |
| | | | | |
Institutional Client Services | | | 703 | | | | 726 | | | | 203 | | | | 703 | |
| | | | | |
Investing & Lending | | | 136 | | | | 97 | | | | 243 | | | | 136 | |
| | | | | |
Investment Management | | | 44 | | | | 36 | | | | 70 | | | | 44 | |
Total net interest income | | | $883 | | | | $859 | | | | $516 | | | | $883 | |
The table below presents the amounts of depreciation and amortization expense by segment included in pre-tax earnings.
| | | | Three Months
Ended March | | | Three Months
Ended March | |
| $ in millions | | | 2016 | | | | 2015 | | | | 2017 | | | | 2016 | |
Investment Banking | | | $ 31 | | | | $ 29 | | | | $ 33 | | | | $ 31 | |
| | | | | |
Institutional Client Services | | | 114 | | | | 101 | | | | 122 | | | | 114 | |
| | | | | |
Investing & Lending | | | 54 | | | | 53 | | | | 57 | | | | 54 | |
| | | | | |
Investment Management | | | 40 | | | | 36 | | | | 45 | | | | 40 | |
Total depreciation and amortization | | | $239 | | | | $219 | | | | $257 | | | | $239 | |
| | | | |
| 78 | | Goldman Sachs March 2017 Form 10-Q | | |
THE GOLDMAN SACHS GROUP, INC. AND SUBSIDIARIES
Notes to Condensed Consolidated Financial Statements
(Unaudited)
Geographic Information
Due to the highly integrated nature of international financial markets, the firm manages its businesses based on the profitability of the enterprise as a whole. The methodology for allocating profitability to geographic regions is dependent on estimates and management judgment because a significant portion of the firm’s activities require cross-border coordination in order to facilitate the needs of the firm’s clients.
Geographic results are generally allocated as follows:
Investment Banking: location of the client and investment banking team.
Institutional Client Services: Fixed Income, Currency and CommoditiesFICC Client Execution, and Equities (excluding Securities Services): location of the market-making desk; Securities Services: location of the primary market for the underlying security.
Investing & Lending: Investing: location of the investment; Lending: location of the client.
Investment Management: location of the sales team.
The table below presents the total net revenues and pre-tax earnings of the firm by geographic region allocated based on the methodology referred to above, as well as the percentage of total net revenues and pre-tax earnings for each geographic region.
| | | | | | | | | | | | | | | | |
| | | Three Months Ended March | |
| $ in millions | | | 2017 | | | | 2016 | |
Net revenues | | | | | | | | | | | | | | | | |
Americas | | | $4,892 | | | | 61% | | | | $3,863 | | | | 61% | |
| | |
EMEA | | | 1,919 | | | | 24% | | | | 1,660 | | | | 26% | |
| | |
Asia | | | 1,215 | | | | 15% | | | | 815 | | | | 13% | |
Total net revenues | | | $8,026 | | | | 100% | | | | $6,338 | | | | 100% | |
Pre-tax earnings | | | | | | | | | | | | | | | | |
Americas | | | $1,524 | | | | 61% | | | | $ 987 | | | | 63% | |
| | |
EMEA | | | 622 | | | | 24% | | | | 399 | | | | 25% | |
| | |
Asia | | | 393 | | | | 15% | | | | 190 | | | | 12% | |
Total pre-tax earnings | | | $2,539 | | | | 100% | | | | $1,576 | | | | 100% | |
In the table below, above:
Substantially all of the amounts in Americas were attributable to the U.S.
EMEA represents Europe, Middle East and Africa.
Asia includes Australia and New Zealand.
| | | | | | | | | | | | | | | | |
| | | Three Months Ended March | |
| $ in millions | | | 2016 | | | | 2015 | |
Net revenues | | | | | | | | | | | | | | | | |
Americas | | | $3,863 | | | | 61% | | | | $ 5,872 | | | | 55% | |
| | |
Europe, Middle East and Africa | | | 1,660 | | | | 26% | | | | 2,885 | | | | 27% | |
| | |
Asia | | | 815 | | | | 13% | | | | 1,860 | | | | 18% | |
Total net revenues | | | $6,338 | | | | 100% | | | | $10,617 | | | | 100% | |
Pre-tax earnings | | | | | | | | | | | | | | | | |
Americas | | | $ 987 | | | | 63% | | | | $ 2,073 | | | | 53% | |
| | |
Europe, Middle East and Africa | | | 399 | | | | 25% | | | | 1,097 | | | | 28% | |
| | |
Asia | | | 190 | | | | 12% | | | | 764 | | | | 19% | |
Total pre-tax earnings | | | $1,576 | | | | 100% | | | | $ 3,934 | | | | 100% | |
| | | | |
80 | | Goldman Sachs March 2016 Form 10-Q | | |
THE GOLDMAN SACHS GROUP, INC. AND SUBSIDIARIES
Notes to Condensed Consolidated Financial Statements
(Unaudited)
Note 26.
Credit Concentrations
Credit concentrations may arise from market making, client facilitation, investing, underwriting, lending and collateralized transactions and may be impacted by changes in economic, industry or political factors. The firm seeks to mitigate credit risk by actively monitoring exposures and obtaining collateral from counterparties as deemed appropriate.
While the firm’s activities expose it to many different industries and counterparties, the firm routinely executes a high volume of transactions with asset managers, investment funds, commercial banks, brokers and dealers, clearing houses and exchanges, which results in significant credit concentrations.
In the ordinary course of business, the firm may also be subject to a concentration of credit risk to a particular counterparty, borrower or issuer, including sovereign issuers, or to a particular clearing house or exchange.
The table below presents the credit concentrations in cash instruments held by the firm.
| | | | | | | | |
| | | As of | |
| $ in millions | |
| March
2017 |
| |
| December
2016 |
|
U.S. government and federal agency obligations | | | $71,035 | | | | $57,657 | |
| | |
% of total assets | | | 7.9% | | | | 6.7% | |
| | |
Non-U.S. government and agency obligations | | | $35,614 | | | | $29,381 | |
| | |
% of total assets | | | 4.0% | | | | 3.4% | |
Amounts in the table belowabove are included in “Financial instruments owned, at fair value” and “Cash and securities segregated for regulatory and other purposes.value.”
| | | | | | | | |
| | | As of | |
| $ in millions | |
| March
2016 |
| |
| December
2015 |
|
U.S. government and federal agency obligations | | | $63,282 | | | | $63,844 | |
| | |
% of total assets | | | 7.2% | | | | 7.4% | |
| | |
Non-U.S. government and agency obligations | | | $34,627 | | | | $31,772 | |
| | |
% of total assets | | | 3.9% | | | | 3.7% | |
As of March 20162017 and December 2015,2016, the firm did not have credit exposure to any other counterparty that exceeded 2% of total assets.
| | | | |
| | Goldman Sachs March 2017 Form 10-Q | | 79 |
THE GOLDMAN SACHS GROUP, INC. AND SUBSIDIARIES
Notes to Condensed Consolidated Financial Statements
(Unaudited)
To reduce credit exposures, the firm may enter into agreements with counterparties that permit the firm to offset receivables and payables with such counterparties and/or enable the firm to obtain collateral on an upfront or contingent basis. Collateral obtained by the firm related to derivative assets is principally cash and is held by the firm or a third-party custodian. Collateral obtained by the firm related to resale agreements and securities borrowed transactions is primarily U.S. government and federal agency obligations and non-U.S. government and agency obligations. See Note 10 for further information about collateralized agreements and financings.
The table below presents U.S. government and federal agency obligations and non-U.S. government and agency obligations that collateralize resale agreements and securities borrowed transactions (including those in “Cashtransactions.
| | | | | | | | |
| | | As of | |
| $ in millions | |
| March
2017 |
| |
| December
2016 |
|
U.S. government and federal agency obligations | | | $86,207 | | | | $89,721 | |
| | |
Non-U.S. government and agency obligations | | | $84,588 | | | | $80,234 | |
In the table above:
Non-U.S. government and agency obligations primarily consist of securities segregated for regulatoryissued by the governments of Japan, France, the U.K. and other purposes”). BecauseGermany.
Given that the firm’s primary credit exposure on such transactions is to the counterparty to the transaction, the firm would be exposed to the collateral issuer only in the event of counterparty default. In the table below, non-U.S. government and agency obligations primarily consists of securities issued by the governments of France, the United Kingdom, Japan and Germany.
| | | | | | | | |
| | | As of | |
| $ in millions | |
| March
2016 |
| |
| December
2015 |
|
U.S. government and federal agency obligations | | | $101,293 | | | | $107,198 | |
| | |
Non-U.S. government and agency obligations | | | 88,271 | | | | 74,326 | |
| | | | |
| | Goldman Sachs March 2016 Form 10-Q | | 81 |
THE GOLDMAN SACHS GROUP, INC. AND SUBSIDIARIES
Notes to Condensed Consolidated Financial Statements
(Unaudited)
Note 27.
Legal Proceedings
The firm is involved in a number of judicial, regulatory and arbitration proceedings (including those described below) concerning matters arising in connection with the conduct of the firm’s businesses. Many of these proceedings are in early stages, and many of these cases seek an indeterminate amount of damages.
Under ASC 450, an event is “reasonably possible” if “the chance of the future event or events occurring is more than remote but less than likely” and an event is “remote” if “the chance of the future event or events occurring is slight.” Thus, references to the upper end of the range of reasonably possible loss for cases in which the firm is able to estimate a range of reasonably possible loss mean the upper end of the range of loss for cases for which the firm believes the risk of loss is more than slight.
With respect to matters described below for which management has been able to estimate a range of reasonably possible loss where (i) actual or potential plaintiffs have claimed an amount of money damages, (ii) the firm is being, or threatened to be, sued by purchasers in an underwritinga securities offering and is not being indemnified by a party that the firm believes will pay the full amount of any judgment, or (iii) the purchasers are demanding that the firm repurchase securities, management has estimated the upper end of the range of reasonably possible loss as being equal to (a) in the case of (i), the amount of money damages claimed, (b) in the case of (ii), the difference between the initial sales price of the securities that the firm sold in such underwritingoffering and the estimated lowest subsequent price of such securities prior to the action being commenced and (c) in the case of (iii), the price that purchasers paid for the securities less the estimated value, if any, as of March 20162017 of the relevant securities, in each of cases (i), (ii) and (iii), taking into account any other factors believed to be relevant to the particular matter or matters of that type. As of the date hereof, the firm has estimated the upper end of the range of reasonably possible aggregate loss for such matters and for any other matters described below where management has been able to estimate a range of reasonably possible aggregate loss to be approximately $1.9$1.8 billion in excess of the aggregate reserves for such matters.
| | | | |
| 80 | | Goldman Sachs March 2017 Form 10-Q | | |
THE GOLDMAN SACHS GROUP, INC. AND SUBSIDIARIES
Notes to Condensed Consolidated Financial Statements
(Unaudited)
Management is generally unable to estimate a range of reasonably possible loss for matters other than those included in the estimate above, including where (i) actual or potential plaintiffs have not claimed an amount of money damages, except in those instances where management can otherwise determine an appropriate amount, (ii) matters are in early stages, (iii) matters relate to regulatory investigations or reviews, except in those instances where management can otherwise determine an appropriate amount, (iv) there is uncertainty as to the likelihood of a class being certified or the ultimate size of the class, (v) there is uncertainty as to the outcome of pending appeals or motions, (vi) there are significant factual issues to be resolved, and/or (vii) there are novel legal issues presented. For example, the firm’s potential liabilities with respect to future mortgage-related “put-back” claims described below may ultimately result in an increase in the firm’s liabilities, but are not included in management’s estimate of reasonably possible loss. As another example, the firm’s potential liabilities with respect to the investigations and reviews described below underin “Regulatory Investigations and Reviews and Related Litigation” also generally are not included in management’s estimate of reasonably possible loss. However, management does not believe, based on currently available information, that the outcomes of such other matters will have a material adverse effect on the firm’s financial condition, though the outcomes could be material to the firm’s operating results for any particular period, depending, in part, upon the operating results for such period. See Note 18 for further information about mortgage-related contingencies.
| | | | |
82 | | Goldman Sachs March 2016 Form 10-Q | | |
THE GOLDMAN SACHS GROUP, INC. AND SUBSIDIARIES
Notes to Condensed Consolidated Financial Statements
(Unaudited)
Mortgage-Related Matters. Beginning in April 2010, a number of purported securities law class actions were filed in the U.S. District Court for the Southern District of New York challenging the adequacy of Group Inc.’s public disclosure of, among other things, the firm’s activities in the CDO market, the firm’s conflict of interest management, and the SEC investigation that led to GS&Co. entering into a consent agreement with the SEC, settling all claims made against GS&Co. by the SEC in connection with the ABACUS 2007-AC1 CDO offering (ABACUS 2007-AC1 transaction), pursuant to which GS&Co. paid $550 million of disgorgement and civil penalties. The consolidated amended complaint filed on July 25, 2011, which names as defendants Group Inc. and certain current and former officers and employees of Group Inc. and its affiliates, generally alleges violations of Sections 10(b) and 20(a) of the Exchange Act and seeks unspecified damages. On June 21, 2012, the district court dismissed the claims based on Group Inc.’s not disclosing that it had received a “Wells” notice from the staff of the SEC related to the ABACUS 2007-AC1 transaction, but permitted the plaintiffs’ other claims to proceed. The district court granted class certification on September 24, 2015, but the appellate court granted defendants’ petition for review on January 26, 2016. On February 1, 2016, the district court stayed proceedings in the district court pending the appellate court’s decision.
In June 2012, the Board received a demand from a shareholder that the Board investigate and take action relating to the firm’s mortgage-related activities and to stock sales by certain directors and executives of the firm. On February 15, 2013, this shareholder filed a putative shareholder derivative action in New York Supreme Court, New York County, against Group Inc. and certain current or former directors and employees, based on these activities and stock sales. The derivative complaint includes allegations of breach of fiduciary duty, unjust enrichment, abuse of control, gross mismanagement and corporate waste, and seeks, among other things, unspecified monetary damages, disgorgement of profits and certain corporate governance and disclosure reforms. On May 28, 2013, Group Inc. informed the shareholder that the Board completed its investigation and determined to refuse the demand. On June 20, 2013, the shareholder made a books and records demand requesting materials relating to the Board’s determination. The parties have agreed to stay proceedings in the putative derivative action pending resolution of the books and records demand.
| | | | |
| | Goldman Sachs March 2017 Form 10-Q | | 81 |
THE GOLDMAN SACHS GROUP, INC. AND SUBSIDIARIES
Notes to Condensed Consolidated Financial Statements
(Unaudited)
In addition, the Board has received books and records demands from several shareholders for materials relating to, among other subjects, the firm’s mortgage servicing and foreclosure activities, participation in federal programs providing assistance to financial institutions and homeowners, loan sales to Fannie Mae and Freddie Mac, mortgage-related activities and conflicts management.
GS&Co., Goldman Sachs Mortgage Company and GS Mortgage Securities Corp. and three current or former Goldman Sachs employees are defendants in a putative class action commenced on December 11, 2008 in the U.S. District Court for the Southern District of New York brought on behalf of purchasers of various mortgage pass-through certificates and asset-backed certificates issued by various securitization trusts established by the firm and underwritten by GS&Co. in 2007. On June 3, 2010, another investor filed a separate putative class action asserting substantively similar allegations relating to one other offering and thereafter moved to further amend its amended complaint to add claims with respect to two additional offerings. On December 30, 2015, the district court preliminarily approved a settlement covering both actions. The firm has paid the full amount of the proposed settlement into an escrow account.
On September 30, 2010, a class action was filed in the U.S. District Court for the Southern District of New York against GS&Co., Group Inc. and two former GS&Co. employees on behalf of investors in $823 million of notes issued in 2006 and 2007 by two synthetic CDOs (Hudson Mezzanine 2006-1 and 2006-2). On February 11, 2016, the district court preliminarily approved a settlement resolving the action. The firm has reserved the full amount of the proposed settlement.
Various alleged purchasers of and counterparties and providers of credit enhancement involved in transactions relating to, mortgage pass-through certificates CDOs and other mortgage-related products (including ACA Financial Guaranty Corp., Aozora Bank, Ltd., Basis Yield Alpha Fund (Master), CIFG Assurance of North America, Inc.,Massachusetts Mutual Life Insurance Company and the FDIC (as receiver for Guaranty Bank), IKB Deutsche Industriebank AG, Massachusetts Mutual Life Insurance Company, Texas County & District Retirement System and the Tennessee Consolidated Retirement System)) have filed complaints in state and federal court against firm affiliates, generally alleging that the offering documents for the securities that they purchased contained untrue statements of material fact and material omissions and generally seeking rescission and/or damages. Certain of these complaints allege fraud and seek punitive damages. Certain of these complaints also name other firms as defendants.
| | | | |
| | Goldman Sachs March 2016 Form 10-Q | | 83 |
THE GOLDMAN SACHS GROUP, INC. AND SUBSIDIARIES
Notes to Condensed Consolidated Financial Statements
(Unaudited)
Norges Bank Investment Management and Selective Insurance Company have threatened to assert claims of various types against the firm in connection with the sale of mortgage-related securities. The firm has entered into agreements with one of these entities to toll the relevant statute of limitations.
As of the date hereof, the aggregate amount of mortgage-related securities sold to plaintiffs in active and threatened cases described in the preceding two paragraphsparagraph where those plaintiffs are seeking rescission of such securities was approximately $3.2 billion$261 million (which does not reflect adjustment for any subsequent paydowns or distributions or any residual value of such securities, statutory interest or any other adjustments that may be claimed). This amount does not include the potential claims by these or other purchasers in the same or other mortgage-related offerings that have not been described above, or claims that have been dismissed.
The firm has entered into agreements with Deutsche Bank National Trust Company and U.S. Bank National Association to toll the relevant statute of limitations with respect to claims for repurchase of residential mortgage loans based on alleged breaches of representations related to $11.1 billion original notional face amount of securitizations issued by trusts for which they act as trustees.
The firm has received subpoenas or requests for information from, and is engaged in discussions with, certain regulators and law enforcement agencies with which it has not entered into settlement agreements as part of inquiries or investigations relating to mortgage-related matters.
SunEdison Bankruptcy Litigation. GS Bank USA is among the defendants named in an adversary proceeding filed on October 20, 2016 in the U.S. Bankruptcy Court for the Southern District of New York arising from the bankruptcy of SunEdison, Inc. (SunEdison). The complaint alleges that amounts transferred and liens granted by SunEdison to its secured creditors, including GS Bank USA, prior to filing for bankruptcy were fraudulent and preferential transfers. Plaintiffs seek to recoup those transfers, avoid those liens and disallow certain claims of the secured creditors. GS Bank USA received pre-filing payments from SunEdison aggregating $169 million that are subject to the recoupment claims and holds $75 million of secured debt subject to the avoidance and disallowance claims. Defendants moved to dismiss on November 22, 2016.
Currencies-Related Litigation. GS&Co. and Group Inc., Litton Loan Servicing LP (Litton), Ocwen Financial Corporation and Arrow Corporate Member Holdings LLC (Arrow), a former subsidiary of Group Inc., are among the defendants named in a putative class action pending since January 23, 2013filed in the U.S. District Court for the Southern District of New York on September 26, 2016, on behalf of putative indirect purchasers of foreign exchange instruments. The amended complaint, filed on March 24, 2017, generally challengingalleges a conspiracy to manipulate the procurement mannerforeign currency exchange markets and scope of “force-placed” hazard insurance arranged by Litton when homeowners failed to arrange for insurance as required by their mortgages. The complaint asserts claims for breach of contract, breach of fiduciary duty, misappropriation, conversion, unjust enrichmentunder federal and violation of Florida unfair practices lawstate antitrust laws and RICO claims,state consumer protection laws and seeks unspecified compensatory and punitive damagesinjunctive relief, as well as declaratory and injunctive relief. On January 15, 2016,treble damages in an unspecified amount.
Financial Advisory Services. Group Inc. and Arrow were added as defendants to a putative class action in the U.S. District Court for the Northern District of California based on substantially similar allegations, asserting RICO claims and violations of California’s Unfair Competition Law, and seeking similar relief. On April 20, 2016, the court preliminarily approved a settlement among Group Inc., Litton and Arrow and the plaintiffs in the action pending in the Southern District of New York, which would resolve the remaining claims in both actions. The firm has reserved the full amountcertain of its obligations under the proposed settlement.
On April 11, 2016, the firm reached a definitive agreementaffiliates are from time to time parties to various civil litigation and arbitration proceedings and other disputes with the Residential Mortgage-Backed Securities Working Group of the U.S. Financial Fraud Enforcement Task Force to resolve its ongoing investigations. The agreement resolved actualclients and potential civil claims by the U.S. Department of Justice, the Attorney General’s Offices for the States of California, Illinois and New York, the National Credit Union Administration (as conservator for several failed credit unions) and the Federal Home Loan Banks of Chicago and Des Moines (as a successor to the Federal Home Loan Bank of Seattle),third parties relating to the firm’s securitization, underwriting and sale of residential mortgage-backed securities from 2005 to 2007. The terms of the settlement agreement are substantially the same as those of the agreement in principle described in Note 27 to the consolidated financial statements included in the 2015 Form 10-K. See also “Regulatory Investigations and Reviews and Related Litigation” below. The firm has received subpoenas or requests for information, and is engaged in discussions with,advisory activities. These claims generally seek, among other federal, state and local regulators or law enforcement authorities as part of inquiries or investigations relating to mortgage-related matters, and may become the subject of additional litigation, investor and shareholder demands, and regulatory and other investigations and actions with respect to mortgage-related matters. See Note 18 for information regarding mortgage-related contingencies not described in this Note 27.
Solazyme, Inc. Securities Litigation. GS&Co. is among the underwriters named as defendants in a putative securities class action filed on June 24, 2015 in the U.S. District Court for the Northern District of California. In addition to the underwriters, the defendants include Solazyme, Inc. (Solazyme) and certain of its directors and officers. As to the underwriters, the complaints generally allege misstatements and omissions in connection with March 2014 offerings by Solazyme of approximately $63 million of common stock and $150 million principal amount of convertible senior subordinated notes, assert claims under the federal securities laws, and seekthings, compensatory damages and, in an unspecified amountsome cases, punitive damages, and rescission. Plaintiffs filed an amended complaint on December 15, 2015, and defendants moved to dismiss on February 12, 2016. GS&Co. underwrote 3,450,000 sharesin certain cases allege that the firm did not appropriately disclose or deal with conflicts of common stock and $150 million principal amount of notes for an aggregate offering price of approximately $187 million.interest.
| | | | |
8482 | | Goldman Sachs March 20162017 Form 10-Q | | |
THE GOLDMAN SACHS GROUP, INC. AND SUBSIDIARIES
Notes to Condensed Consolidated Financial Statements
(Unaudited)
GT Advanced Technologies Securities Litigation. GS&Co. is among the underwriters named as defendants in several putative securities class actions filed in October 2014 in the U.S. District Court for the District of New Hampshire. In addition to the underwriters, the defendants include certain directors and officers of GT Advanced Technologies Inc. (GT Advanced Technologies). As to the underwriters, the complaints generally allege misstatements and omissions in connection with the December 2013 offerings by GT Advanced Technologies of approximately $86 million of common stock and $214 million principal amount of convertible senior notes, assert claims under the federal securities laws, and seek compensatory damages in an unspecified amount and rescission. On July 20, 2015, the plaintiffs filed a consolidated amended complaint. On October 7, 2015, the defendants moved to dismiss. GS&Co. underwrote 3,479,769 shares of common stock and $75 million principal amount of notes for an aggregate offering price of approximately $105 million. On October 6, 2014, GT Advanced Technologies filed for Chapter 11 bankruptcy.
FireEye Securities Litigation. GS&Co. is among the underwriters named as defendants in several putative securities class actions, filed beginning in June 2014 in the California Superior Court, County of Santa Clara. In addition to the underwriters, the defendants include FireEye, Inc. (FireEye) and certain of its directors and officers. The complaints generally allege misstatements and omissions in connection with the offering materials for the March 2014 offering of approximately $1.15 billion of FireEye common stock, assert claims under the federal securities laws, and seek compensatory damages in an unspecified amount and rescission. On August 11, 2015, the court overruled the defendants’ demurrers, which sought to have the consolidated amended complaint dismissed. On November 16, 2015, plaintiffs moved for class certification. FireEye and its director and officer defendants filed a motion for judgment on the pleadings for lack of subject matter jurisdiction, which was denied on April 1, 2016. GS&Co. underwrote 2,100,000 shares for a total offering price of approximately $172 million.
Cobalt International Energy Securities Litigation. Cobalt International Energy, Inc. (Cobalt), certain of its officers and directors (including employees of affiliates of Group Inc. who served as directors of Cobalt), affiliates of shareholders of Cobalt (including Group Inc.) and the underwriters (including GS&Co.) for certain offerings of Cobalt’s securities are defendants in a putative securities class action filed on November 30, 2014 in the U.S. District Court for the Southern District of Texas. The second consolidated amended complaint, filed on May 1, 2015,March 15, 2017, asserts claims under the federal securities laws, seeks compensatory and rescissory damages in unspecified amounts and alleges material misstatements and omissions concerning Cobalt in connection with a $1.67 billion February 2012 offering of Cobalt common stock, a $1.38 billion December 2012 offering of Cobalt’s convertible notes, a $1.00 billion January 2013 offering of Cobalt’s common stock, a $1.33 billion May 2013 offering of Cobalt’s common stock, and a $1.30 billion May 2014 offering of Cobalt’s convertible notes. The consolidated amended complaint alleges that, among others, Group Inc. and GS&Co. are liable as controlling persons with respect to all five offerings.offerings, and that the shareholder affiliates (including Group Inc.) are liable for the sale of Cobalt common stock on the basis of inside information. The consolidated amended complaint also seeks damages from GS&Co. in connection with its acting as an underwriter of 14,430,000 shares of common stock representing an aggregate offering price of approximately $465 million, $690 million principal amount of convertible notes, and approximately $508 million principal amount of convertible notes in the February 2012, December 2012 and May 2014 offerings, respectively, for an aggregate offering price of approximately $1.66 billion. On January 19, 2016, the court granted, with leave to replead, the underwriter defendants’ motions to dismiss as to claims by plaintiffs who purchased Cobalt securities after April 30, 2013, but denied the motions to dismiss in all other respects. Defendants’ ensuing motionsOn November 3, 2016, plaintiffs moved for class certification. On April 14, 2017, the shareholder affiliates moved to certify this orderdismiss the claim alleging sales based on inside information.
Cobalt, certain of its officers and directors (including employees of affiliates of Group Inc. who served as directors of Cobalt), certain shareholders of Cobalt (including funds affiliated with Group Inc.), and affiliates of these shareholders (including Group Inc.) are defendants in putative shareholder derivative actions filed on May 6, 2016 and November 29, 2016 in Texas District Court, Harris County. As to the director and officer defendants (including employees of affiliates of Group Inc. who served as directors of Cobalt), the petitions generally allege that they breached their fiduciary duties under state law by making materially false and misleading statements concerning Cobalt. As to the shareholder defendants and their affiliates (including Group Inc. and several affiliated funds), the original petition also alleges that they breached their fiduciary duties by selling Cobalt securities in the common stock offerings described above on the basis of inside information. The petitions seek, among other things, unspecified monetary damages and disgorgement of proceeds from the sale of Cobalt common stock. On March 6, 2017, the court denied defendants’ motion to dismiss the May petition as to the shareholder defendants and their affiliates (including Group Inc. and its affiliated funds). Defendants moved to dismiss the November petition on January 30, 2017.
Adeptus Health Securities Litigation. GS&Co. is among the underwriters named as defendants in several putative securities class actions, filed beginning in October 2016 in the U.S. District Court for the Eastern District of Texas. In addition to the underwriters, the defendants include Adeptus Health Inc. (Adeptus), its sponsor, and certain directors and officers of Adeptus. As to the underwriters, the complaints generally allege misstatements and omissions in connection with the $124 million June 2014 initial public offering, the $154 million May 2015 secondary equity offering, the $411 million July 2015 secondary equity offering, and the $175 million June 2016 secondary equity offering. The complaints assert claims under the federal securities laws and seek, among other things, unspecified monetary damages. GS&Co. underwrote 1.69 million shares of common stock in the June 2014 initial public offering representing an interlocutory appeal were denied on March 14, 2016.aggregate offering price of approximately $37 million, 962,378 shares of common stock in the May 2015 offering representing an aggregate offering price of approximately $61 million, 1.76 million shares of common stock in the July 2015 offering representing an aggregate offering price of approximately $184 million, and all the shares of common stock in the June 2016 offering representing an aggregate offering price of approximately $175 million. On April 19, 2017, Adeptus filed for Chapter 11 bankruptcy.
| | | | |
| | | Goldman Sachs March 20162017 Form 10-Q | | 8583 |
THE GOLDMAN SACHS GROUP, INC. AND SUBSIDIARIES
Notes to Condensed Consolidated Financial Statements
(Unaudited)
Investment Management Services. Group Inc. and certain of its affiliates are parties to various civil litigation and arbitration proceedings and other disputes with clients relating to losses allegedly sustained as a result of the firm’s investment management services. These claims generally seek, among other things, restitution or other compensatory damages and, in some cases, punitive damages.
TerraForm Global and SunEdison Securities Litigation. GS&Co. is among the underwriters, placement agents and initial purchasers named as defendants in several putative class actions and individual actions filed beginning in October 2015 relating to the $675 million July 2015 initial public offering of the common stock of TerraForm Global, Inc. (TerraForm Global), the August 2015 public offering of $650 million of SunEdison convertible preferred stock, the June 2015 private placement of $335 million of TerraForm Global Class D units, and the August 2015 Rule 144A offering of $810 million principal amount of TerraForm Global senior notes. SunEdison is TerraForm Global’s controlling shareholder and sponsor. Beginning in October 2016, the pending cases were transferred to the U.S. District Court for the Southern District of New York. On January 16, 2017, certain plaintiffs filed a consolidated amended complaint relating to TerraForm Global’s initial public offering, and, on March 17, 2017, certain plaintiffs filed a second amended complaint relating to SunEdison’s convertible preferred stock offering. The defendants also include TerraForm Global, SunEdison and certain of their directors and officers. The complaints generally allege misstatements and omissions in connection with the offerings, assert claims under federal securities laws and, in certain actions, state laws, and seek compensatory damages in an unspecified amount, as well as rescission or rescissory damages. TerraForm Global sold 154,800 Class D units, representing an aggregate offering price of approximately $155 million, to the individual plaintiffs. GS&Co., as underwriter, sold 138,890 shares of SunEdison convertible preferred stock in the offering, representing an aggregate offering price of approximately $139 million and sold 2,340,000 shares of TerraForm Global common stock in the initial public offering representing an aggregate offering price of approximately $35 million. GS&Co., as initial purchaser, sold approximately $49 million principal amount of TerraForm Global senior notes in the Rule 144A offering. On April 21, 2016, SunEdison filed for Chapter 11 bankruptcy.
Valeant Pharmaceuticals International Securities Litigation. GS&Co. and Goldman Sachs Canada Inc. (GS Canada) are among the underwriters and initial purchasers named as defendants in a putative class action filed on March 2, 2016 in the Superior Court of Quebec, Canada. In addition to the underwriters and initial purchasers, the defendants include Valeant Pharmaceuticals International, Inc. (Valeant), certain directors and officers of Valeant and Valeant’s auditor. As to GS&Co. and GS Canada, the complaint generally alleges misstatements and omissions in connection with the offering materials for the June 2013 public offering of $2.3 billion of common stock, the June 2013 Rule 144A offering of $3.2 billion principal amount of senior notes, and the November 2013 Rule 144A offering of $900 million principal amount of senior notes. The complaint asserts claims under the Quebec Securities Act and the Civil Code of Quebec and seeks compensatory damages in an unspecified amount. The parties have agreed to limit the proposed class by excluding U.S. purchasers in the offerings.
GS&Co. is among the initial purchasers named as defendants in a putative class action filed on June 24, 2016 in the U.S. District Court for the District of New Jersey. In addition to the initial purchasers for Valeant’s Rule 144A debt offerings, the defendants include Valeant, certain directors and officers of Valeant, Valeant’s auditor and the underwriters for a common stock offering in which GS&Co. did not participate. As to GS&Co., the complaint generally alleges misstatements and omissions in connection with the June 2013 and November 2013 Rule 144A offerings described above, asserts claims under the federal securities laws, and seeks rescission and compensatory damages in an unspecified amount. Defendants moved to dismiss on September 13, 2016.
GS&Co. and GS Canada, as sole underwriters, sold 27,058,824 shares of common stock in the June 2013 offering representing an aggregate offering price of approximately $2.3 billion and, as initial purchasers, sold approximately $1.3 billion and $293 million in principal amount of senior notes in the June 2013 and November 2013 Rule 144A offerings, respectively.
| | | | |
| 84 | | Goldman Sachs March 2017 Form 10-Q | | |
THE GOLDMAN SACHS GROUP, INC. AND SUBSIDIARIES
Notes to Condensed Consolidated Financial Statements
(Unaudited)
Interest Rate Swap Antitrust Litigation. Group Inc., GS&Co., GSI, GS Bank USA and Goldman Sachs Financial Markets, L.P. (GSFM) are among the defendants named in putative antitrust class actions relating to the trading of interest rate swaps, filed beginning in November 2015 and consolidated in the U.S. District Court for the Southern District of New York. The second consolidated amended complaint filed on December 9, 2016 generally alleges a conspiracy among the defendants since at least January 1, 2007 to preclude exchange trading of interest rate swaps. The complaint seeks declaratory and injunctive relief, as well as treble damages in an unspecified amount. Defendants moved to dismiss on January 20, 2017.
Group Inc., GS&Co., GSI, GS Bank USA and GSFM are among the defendants named in antitrust actions relating to the trading of interest rate swaps filed in the U.S. District Court for the Southern District of New York beginning in April 2016 by two operators of swap execution facilities and certain of their affiliates. These actions have been consolidated with the class action described above for pretrial proceedings. The second consolidated amended complaint filed on December 9, 2016 generally asserts claims under federal and state antitrust laws and state common law in connection with an alleged conspiracy among the defendants to preclude trading of interest rate swaps on the plaintiffs’ respective swap execution facilities and seeks declaratory and injunctive relief, as well as treble damages in an unspecified amount. Defendants moved to dismiss on January 20, 2017.
Commodities-Related Litigation. GSI is among the defendants named in putative class actions relating to trading in platinum and palladium, filed beginning on November 25, 2014 and most recently amended on July 27, 2015, in the U.S. District Court for the Southern District of New York. The complaints generally allege that the defendants violated federal antitrust laws and the Commodity Exchange Act in connection with an alleged conspiracy to manipulate a benchmark for physical platinum and palladium prices and seek declaratory and injunctive relief, as well as treble damages in an unspecified amount. On March 28, 2017, the district court dismissed the antitrust claims but permitted certain of the Commodity Exchange Act claims to proceed against certain defendants, including GSI.
Employment-Related Matters. On September 15, 2010, a putative class action was filed in the U.S. District Court for the Southern District of New York by three female former employees alleging that Group Inc. and GS&Co. have systematically discriminated against female employees in respect of compensation, promotion, assignments, mentoring and performance evaluations. The complaint alleges a class consisting of all female employees employed at specified levels in specified areas by Group Inc. and GS&Co. since July 2002, and asserts claims under federal and New York City discrimination laws. The complaint seeks class action status, injunctive relief and unspecified amounts of compensatory, punitive and other damages. On July 17, 2012, the district court issued a decision granting in part Group Inc.’s and GS&Co.’s motion to strike certain of plaintiffs’ class allegations on the ground that plaintiffs lacked standing to pursue certain equitable remedies and denying Group Inc.’s and GS&Co.’s motion to strike plaintiffs’ class allegations in their entirety as premature. On March 21, 2013, the U.S. Court of Appeals for the Second Circuit held that arbitration should be compelled with one of the named plaintiffs, who as a managing director was a party to an arbitration agreement with the firm. On March 10, 2015, the magistrate judge to whom the district judge assigned the remaining plaintiffs’ May 2014 motion for class certification recommended that the motion be denied in all respects. On August 3, 2015, the magistrate judge denied plaintiffs’ motion for reconsideration of that recommendation and granted the plaintiffs’ motion to intervene two female individuals, one of whom was employed by the firm as of September 2010 and the other of whom is a currentceased to be an employee of the firm.firm subsequent to the magistrate judge’s decision. On August 17, 2015,June 6, 2016, the defendants appealeddistrict court affirmed the magistrate judge’s decision on intervention. On September 28, 2015,April 12, 2017, the defendants moveddistrict court denied defendants’ motion to dismiss the claims of an intervenor who is not a current employee of the firmintervenors for lack of standing.
Investment Management Services. Group Inc.standing and certain of its affiliates are parties to various civil litigation and arbitration proceedings and other disputes with clients relating to losses allegedly sustained as a result of the firm’s investment management services. These claims generally seek, among other things, restitution or other compensatory damages and, in some cases, punitive damages.
Financial Advisory Services. Group Inc. and certain of its affiliates are from time to time parties to various civil litigation and arbitration proceedings and other disputes with clients and third parties relating to the firm’s financial advisory activities. These claims generally seek, among other things, compensatory damages and, in some cases, punitive damages, and in certain cases allege that the firm did not appropriately disclose or deal with conflicts of interest.
Credit Derivatives Antitrust Matters. GS&Co. is among the numerous defendants in putative antitrust class actions relating to credit derivatives, filed beginning in May 2013 and consolidated in the U.S. District Court for the Southern District of New York. On April 18, 2016, the court approved the settlement among GS&Co. and the plaintiffs. The firm has reserved the full amount of the settlement.
Libya-Related Litigation. GSI is the defendant in an action filed on January 21, 2014 with the High Court of Justice in London by the Libyan Investment Authority, relating to nine derivative transactions between the plaintiff and GSI and seeking, among other things, rescission of the transactions and unspecified equitable compensation and damages exceeding $1 billion. On December 4, 2014, the Libyan Investment Authority filed an amended statement of claim.mootness.
| | | | |
86 | | Goldman Sachs March 20162017 Form 10-Q | | 85 |
THE GOLDMAN SACHS GROUP, INC. AND SUBSIDIARIES
Notes to Condensed Consolidated Financial Statements
(Unaudited)
Municipal Securities Matters. GS&Co. (along with, in some cases, other financial services firms) is named by municipalities, municipal-owned entities, state-owned agencies or instrumentalities and non-profit entities in a number of FINRA arbitrations and federal court cases based on GS&Co.’s role as underwriter of the claimants’ issuances of an aggregate of approximately $1.9 billion of auction rate securities from 2003 through 2007 and as a broker-dealer with respect to auctions for these securities. The claimants generally allege that GS&Co. failed to disclose that it had a practice of placing cover bids in auctions, and/or failed to inform the claimant of the deterioration of the auction rate market beginning in the fall of 2007, and that, as a result, the claimant was forced to engage in a series of expensive refinancing and conversion transactions after the failure of the auction market in February 2008. Certain claimants also allege that GS&Co. advised them to enter into or continue with interest rate swaps in connection with their auction rate securities issuances, causing them to incur additional losses. The claims include breach of fiduciary duty, fraudulent concealment, negligent misrepresentation, breach of contract, violations of the Exchange Act and state securities laws, and breach of duties under the rules of the Municipal Securities Rulemaking Board and the NASD. Certain of the arbitrations have been enjoined in accordance with the exclusive forum selection clauses in the transaction documents. In addition, GS&Co. has filed motions with the FINRA Panels to dismiss the arbitrations, one of which has been granted, and has filed motions to dismiss two of the proceedings pending in federal court, one of which was granted but has been appealed and one of which was denied. GS&Co. has also reached settlements or settlements in principle in five actions and one action was voluntarily dismissed.
U.S. Treasury Securities-Related Litigation. GS&Co. is among the primary dealers named as defendants in several putative class actions relating to the market for U.S. Treasury securities, filed beginning in July 2015 and consolidated in the U.S. District Court for the Southern District of New York. The complaints generally allege that the defendants violated the federal antitrust laws and the Commodity Exchange Act in connection with an alleged conspiracy to manipulate the when-issued market and auctions for U.S. Treasury securities, as well as related futures and options, and seek declaratory and injunctive relief, treble damages in an unspecified amount and restitution.
Commodities-Related Litigation. GS&Co., GSI, J. Aron & Company and Metro, a previously consolidated subsidiary of Group Inc. that was sold in the fourth quarter of 2014, are among the defendants in a number of putative class actions filed beginning on August 1, 2013 and consolidated in the U.S. District Court for the Southern District of New York. The complaints generally allege violations of federal antitrust laws and state laws in connection with the storage of aluminum and aluminum trading. The complaints seek declaratory, injunctive and other equitable relief as well as unspecified monetary damages, including treble damages. On August 29, 2014, the court granted the Goldman Sachs defendants’ motion to dismiss. Certain plaintiffs appealed on September 24, 2014, and the remaining plaintiffs sought to amend their complaints in October 2014. On March 26, 2015, the court granted in part and denied in part plaintiffs’ motions for leave to amend their complaints, rejecting their monopolization claims and most state law claims but permitting their antitrust conspiracy claims and certain parallel state law and unjust enrichment claims to proceed. The court directed the remaining plaintiffs to file their amended complaints, which they did on April 9, 2015. Plaintiffs later voluntarily dismissed their state law claims. On March 25, 2016, the plaintiffs moved for class certification. On April 25, 2016, the court denied plaintiffs’ motions for leave to further amend their complaints.
GSI is among the defendants named in putative class actions relating to trading in platinum and palladium, filed beginning on November 25, 2014, in the U.S. District Court for the Southern District of New York. The complaints generally allege that the defendants violated federal antitrust laws and the Commodity Exchange Act in connection with an alleged conspiracy to manipulate a benchmark for physical platinum and palladium prices and seek declaratory and injunctive relief as well as treble damages in an unspecified amount. On July 27, 2015, plaintiffs filed a second amended consolidated complaint, and on September 21, 2015, the defendants moved to dismiss.
| | | | |
| | Goldman Sachs March 2016 Form 10-Q | | 87 |
THE GOLDMAN SACHS GROUP, INC. AND SUBSIDIARIES
Notes to Condensed Consolidated Financial Statements
(Unaudited)
ISDAFIX-Related Litigation. Group Inc. is among the defendants named in several putative class actions relating to trading in interest rate derivatives, filed beginning in September 2014 in the U.S. District Court for the Southern District of New York. The second consolidated amended complaint, filed on February 12, 2015, asserts claims under the federal antitrust laws and state common law in connection with an alleged conspiracy to manipulate the ISDAFIX benchmark and seeks declaratory and injunctive relief as well as treble damages in an unspecified amount. On March 28, 2016, the district court denied defendants’ motion to dismiss as to the antitrust, breach of contract, and unjust enrichment claims, but dismissed the tortious interference and implied covenant of good faith claims with prejudice.
Currencies-Related Litigation. GS&Co. and Group Inc. are among the defendants named in several putative antitrust class actions relating to trading in the foreign exchange markets, filed beginning in December 2013 in the U.S. District Court for the Southern District of New York. The complaints generally allege that defendants violated federal antitrust laws in connection with an alleged conspiracy to manipulate the foreign currency exchange markets and seek declaratory and injunctive relief as well as treble damages in an unspecified amount. On February 13, 2014, the cases were consolidated into one action.
Beginning in February 2015, GS&Co. and Group Inc. were named as defendants in separate putative class actions filed in the U.S. District Court for the Southern District of New York, which were consolidated with the antitrust class actions described above on August 13, 2015. On December 15, 2015, the court preliminarily approved a settlement among GS&Co., Group Inc. and the plaintiffs in the consolidated action. The firm has paid the full amount of the proposed settlement into an escrow account.
On June 3, 2015, GS&Co. and Group Inc. were among the defendants named in a putative class action filed in the U.S. District Court for the Southern District of New York on behalf of certain ERISA employee benefit plans. As to the claims brought against GS&Co. and Group Inc., the second amended complaint, filed on April 6, 2016, generally alleges that the defendants violated ERISA in connection with an alleged conspiracy to manipulate the foreign currency exchange markets, which caused losses to ERISA plans for which the defendants provided foreign exchange services or otherwise authorized the execution of foreign exchange services. Plaintiffs seek declaratory and injunctive relief as well as restitution and disgorgement in an unspecified amount.
Group Inc., GS&Co. and Goldman Sachs Canada Inc. are among the defendants named in putative class actions related to trading in foreign exchange markets, filed beginning in September 2015 in the Superior Court of Justice in Ontario, Canada and the Superior Court of Quebec, Canada, on behalf of direct and indirect purchasers of foreign exchange instruments traded in Canada. The complaints generally allege a conspiracy to manipulate the foreign currency exchange markets and assert claims under Canada’s Competition Act and common law. The Ontario and Quebec complaints seek, among other things, compensatory damages in the amounts of 1 billion Canadian dollars and 100 million Canadian dollars, respectively, as well as restitution and 50 million Canadian dollars in punitive, exemplary and aggravated damages.
Interest Rate Swap Antitrust Litigation. Group Inc., GS&Co., GSI, GS Bank USA and Goldman Sachs Financial Markets, L.P. (GSFM) are among the defendants named in putative antitrust class actions relating to the trading of interest rate swaps, filed beginning in November 2015 in the U.S. District Courts for the Southern District of New York and Northern District of Illinois. The complaints generally allege a conspiracy among the dealers and brokers since at least January 1, 2007 to preclude exchange trading of interest rate swaps. The complaints seek declaratory and injunctive relief as well as treble damages in an unspecified amount. On February 25, 2016, certain plaintiffs in the New York court filed an amended complaint, and moved to consolidate all pending actions in that court.
Group Inc., GS&Co., GSI, GS Bank USA and GSFM are among the defendants named in an antitrust action relating to the trading of interest rate swaps filed in the U.S. District Court for the Southern District of New York on April 18, 2016 by the operator of a swap execution facility and certain of its affiliates. The complaint asserts claims under federal and state antitrust laws and state common law in connection with an alleged conspiracy among the defendants to preclude trading of interest rate swaps on the plaintiffs’ swap execution facility and seeks declaratory and injunctive relief as well as treble damages in an unspecified amount.
| | | | |
88 | | Goldman Sachs March 2016 Form 10-Q | | |
THE GOLDMAN SACHS GROUP, INC. AND SUBSIDIARIES
Notes to Condensed Consolidated Financial Statements
(Unaudited)
Compensation-Related Litigation. On June 9, 2015, Group Inc. and certain of its current and former directors were named as defendants in a purported shareholder derivative action in the Court of Chancery of the State of Delaware. The derivative complaint alleges that excessive compensation has been paid to such directors since 2012. The derivative complaint includes allegations of breach of fiduciary duty and unjust enrichment and seeks, among other things, unspecified monetary damages, disgorgement of director compensation and reform of the firm’s stock incentive plan. On September 30, 2015, the defendants moved to dismiss.
Regulatory Investigations and Reviews and Related Litigation. Group Inc. and certain of its affiliates are subject to a number of other investigations and reviews by, and in some cases have received subpoenas and requests for documents and information from, various governmental and regulatory bodies and self-regulatory organizations and litigation and shareholder requests relating to various matters relating to the firm’s businesses and operations, including:
The 2008 financial crisis;
The public offering process;
The firm’s investment management and financial advisory services;
Research practices, including research independence and interactions between research analysts and other firm personnel, including investment banking personnel, as well as third parties;
Transactions involving government-related financings and other matters, including those related to 1Malaysia Development Berhad (1MDB), a sovereign wealth fund in Malaysia, municipal securities, including wall-cross procedures and conflict of interest disclosure with respect to state and municipal clients, the trading and structuring of municipal derivative instruments in connection with municipal offerings, political contribution rules, municipal advisory services and the possible impact of credit default swap transactions on municipal issuers;
The offering, auction, sales, trading and clearance of corporate and government securities, currencies, commodities and other financial products and related sales and other communications and activities, as well as the firm’s supervision and controls relating to such activities, including compliance with the SEC’s short sale rule, algorithmic, high-frequency and quantitative trading, the firm’s U.S. alternative trading system (dark pool), futures trading, options trading, when-issued trading, transaction reporting, technology systems and controls, securities lending practices, trading and clearance of credit derivative instruments and interest rate swaps, commodities activities and metals storage, private placement practices, allocations of and trading in securities, and trading activities and communications in connection with the establishment of benchmark rates, such as currency rates and the ISDAFIX benchmark rates;
Compliance with the U.S. Foreign Corrupt Practices Act;
The firm’s hiring and compensation practices;
The firm’s system of risk management and controls; and
Insider trading, the potential misuse and dissemination of material nonpublic information regarding corporate and governmental developments and the effectiveness of the firm’s insider trading controls and information barriers.
Goldman SachsThe firm is cooperating with all such governmental and regulatory investigations and reviews.
| | | | |
| 86 | | Goldman Sachs March 20162017 Form 10-Q | | 89 |
Report of Independent Registered Public Accounting Firm
| | | | |
Report of Independent Registered Public Accounting Firm | | | | |
To the Board of Directors and the Shareholders of
The Goldman Sachs Group, Inc.:
We have reviewed the accompanying condensed consolidated statement of financial condition of The Goldman Sachs Group, Inc. and its subsidiaries (the Company) as of March 31, 2016,2017, the related condensed consolidated statements of earnings for the three months ended March 31, 20162017 and 2015,2016, the condensed consolidated statements of comprehensive income for the three months ended March 31, 20162017 and 2015,2016, the condensed consolidated statement of changes in shareholders’ equity for the three months ended March 31, 2016,2017, and the condensed consolidated statements of cash flows for the three months ended March 31, 20162017 and 2015.2016. These condensed consolidated interim financial statements are the responsibility of the Company’s management.
We conducted our review in accordance with the standards of the Public Company Accounting Oversight Board (United States). A review of interim financial information consists principally of applying analytical procedures and making inquiries of persons responsible for financial and accounting matters. It is substantially less in scope than an audit conducted in accordance with the standards of the Public Company Accounting Oversight Board (United States), the objective of which is the expression of an opinion regarding the financial statements taken as a whole. Accordingly, we do not express such an opinion.
Based on our review, we are not aware of any material modifications that should be made to the accompanying condensed consolidated interim financial statements for them to be in conformity with accounting principles generally accepted in the United States of America.
We previously audited, in accordance with the standards of the Public Company Accounting Oversight Board (United States), the consolidated statement of financial condition as of December 31, 2015,2016, and the related consolidated statements of earnings, comprehensive income, changes in shareholders’ equity and cash flows for the year then ended (not presented herein), and in our report dated February 19, 2016,24, 2017, we expressed an unqualified opinion on those consolidated financial statements. In our opinion, the information set forth in the accompanying condensed consolidated statement of financial condition as of December 31, 2015,2016, and the condensed consolidated statement of changes in shareholders’ equity for the year ended December 31, 2015,2016, is fairly stated in all material respects in relation to the consolidated financial statements from which it has been derived.
/s/ PRICEWATERHOUSECOOPERSPRICEWATERHOUSECOOPERS LLP
New York, New York
May 5, 20163, 2017
| | | | |
90 | | Goldman Sachs March 20162017 Form 10-Q | | 87 |
THE GOLDMAN SACHS GROUP, INC. AND SUBSIDIARIES
Statistical Disclosures
|
Distribution of Assets, Liabilities and Shareholders’ Equity |
The tabletables below presentspresent a summary of consolidated average balances, interest and interest rates.
| | | | | | | | |
| | | Average Balance for
the Three Months
Ended March | |
| $ in millions | | | 2017 | | | | 2016 | |
Assets | | | | | | | | |
U.S. | | | $ 95,195 | | | | $ 72,170 | |
| | |
Non-U.S. | | | 11,216 | | | | 16,446 | |
Total deposits with banks | | | 106,411 | | | | 88,616 | |
U.S. | | | 164,589 | | | | 189,586 | |
| | |
Non-U.S. | | | 130,310 | | | | 128,304 | |
Total securities borrowed, securities purchased under agreements to resell and federal funds sold | | | 294,899 | | | | 317,890 | |
U.S. | | | 152,460 | | | | 157,311 | |
| | |
Non-U.S. | | | 104,832 | | | | 97,700 | |
Total financial instruments owned, at fair value | | | 257,292 | | | | 255,011 | |
U.S. | | | 45,656 | | | | 42,444 | |
| | |
Non-U.S. | | | 4,441 | | | | 4,625 | |
Total loans receivable | | | 50,097 | | | | 47,069 | |
U.S. | | | 34,459 | | | | 34,594 | |
| | |
Non-U.S. | | | 38,796 | | | | 33,685 | |
Total other interest-earning assets | | | 73,255 | | | | 68,279 | |
Total interest-earning assets | | | 781,954 | | | | 776,865 | |
| | |
Cash and due from banks | | | 11,464 | | | | 14,161 | |
| | |
Other non-interest-earning assets | | | 81,167 | | | | 93,032 | |
Total assets | | | $874,585 | | | | $884,058 | |
Liabilities | | | | | | | | |
U.S. | | | $101,807 | | | | $ 83,011 | |
| | |
Non-U.S. | | | 18,783 | | | | 16,198 | |
Total interest-bearing deposits | | | 120,590 | | | | 99,209 | |
U.S. | | | 50,890 | | | | 57,569 | |
| | |
Non-U.S. | | | 35,837 | | | | 29,640 | |
Total securities loaned and securities sold under agreements to repurchase | | | 86,727 | | | | 87,209 | |
U.S. | | | 34,493 | | | | 38,207 | |
| | |
Non-U.S. | | | 38,029 | | | | 35,426 | |
Total financial instruments sold, but not yet purchased, at fair value | | | 72,522 | | | | 73,633 | |
U.S. | | | 36,571 | | | | 43,949 | |
| | |
Non-U.S. | | | 13,316 | | | | 13,831 | |
Total short-term borrowings | | | 49,887 | | | | 57,780 | |
U.S. | | | 188,916 | | | | 178,821 | |
| | |
Non-U.S. | | | 12,097 | | | | 9,000 | |
Total long-term borrowings | | | 201,013 | | | | 187,821 | |
U.S. | | | 134,748 | | | | 152,592 | |
| | |
Non-U.S. | | | 58,594 | | | | 62,242 | |
Total other interest-bearing liabilities | | | 193,342 | | | | 214,834 | |
Total interest-bearing liabilities | | | 724,081 | | | | 720,486 | |
Non-interest-bearing deposits | | | 3,413 | | | | 2,497 | |
| | |
Other non-interest-bearing liabilities | | | 60,278 | | | | 74,152 | |
Total liabilities | | | 787,772 | | | | 797,135 | |
| | |
Shareholders’ equity | | | | | | | | |
Preferred stock | | | 11,203 | | | | 11,370 | |
| | |
Common stock | | | 75,610 | | | | 75,553 | |
Total shareholders’ equity | | | 86,813 | | | | 86,923 | |
Total liabilities and shareholders’ equity | | | $874,585 | | | | $884,058 | |
Percentage of interest-earning assets and interest-bearing liabilities attributable to non-U.S. operations | |
Assets | | | 37.03% | | | | 36.14% | |
| | |
Liabilities | | | 24.40% | | | | 23.09% | |
| | | | | | | | |
| | | Interest for the
Three Months
Ended March | |
| $ in millions | | | 2017 | | | | 2016 | |
Assets | | | | | | | | |
U.S. | | | $ 149 | | | | $ 71 | |
| | |
Non-U.S. | | | 13 | | | | 20 | |
Total deposits with banks | | | 162 | | | | 91 | |
U.S. | | | 233 | | | | 27 | |
| | |
Non-U.S. | | | 48 | | | | 82 | |
Total securities borrowed, securities purchased under agreements to resell and federal funds sold | | | 281 | | | | 109 | |
U.S. | | | 930 | | | | 990 | |
| | |
Non-U.S. | | | 421 | | | | 428 | |
Total financial instruments owned, at fair value | | | 1,351 | | | | 1,418 | |
U.S. | | | 500 | | | | 362 | |
| | |
Non-U.S. | | | 65 | | | | 50 | |
Total loans receivable | | | 565 | | | | 412 | |
U.S. | | | 290 | | | | 228 | |
| | |
Non-U.S. | | | 97 | | | | 90 | |
Total other interest-earning assets | | | 387 | | | | 318 | |
Total interest-earning assets | | | $2,746 | | | | $2,348 | |
Liabilities | | | | | | | | |
U.S. | | | $ 241 | | | | $ 146 | |
| | |
Non-U.S. | | | 33 | | | | 23 | |
Total interest-bearing deposits | | | 274 | | | | 169 | |
U.S. | | | 114 | | | | 87 | |
| | |
Non-U.S. | | | 22 | | | | 31 | |
Total securities loaned and securities sold under agreements to repurchase | | | 136 | | | | 118 | |
U.S. | | | 168 | | | | 168 | |
| | |
Non-U.S. | | | 168 | | | | 146 | |
Total financial instruments sold, but not yet purchased, at fair value | | | 336 | | | | 314 | |
U.S. | | | 113 | | | | 116 | |
| | |
Non-U.S. | | | 8 | | | | 11 | |
Total short-term borrowings | | | 121 | | | | 127 | |
U.S. | | | 1,161 | | | | 856 | |
| | |
Non-U.S. | | | 15 | | | | 9 | |
Total long-term borrowings | | | 1,176 | | | | 865 | |
U.S. | | | 37 | | | | (263 | ) |
| | |
Non-U.S. | | | 150 | | | | 135 | |
Total other interest-bearing liabilities | | | 187 | | | | (128 | ) |
Total interest-bearing liabilities | | | $2,230 | | | | $1,465 | |
Net interest income | | | | | | | | |
U.S. | | | $ 268 | | | | $ 568 | |
| | |
Non-U.S. | | | 248 | | | | 315 | |
Net interest income | | | $ 516 | | | | $ 883 | |
| | | | |
| 88 | | Goldman Sachs March 2017 Form 10-Q | | |
THE GOLDMAN SACHS GROUP, INC. AND SUBSIDIARIES
Statistical Disclosures
| | | | | | | | |
| | | Average Rate
(annualized) for the
Three Months
Ended March | |
| | | | 2017 | | | | 2016 | |
Assets | | | | | | | | |
U.S. | | | 0.63% | | | | 0.40% | |
| | |
Non-U.S. | | | 0.47% | | | | 0.49% | |
Total deposits with banks | | | 0.62% | | | | 0.41% | |
U.S. | | | 0.57% | | | | 0.06% | |
| | |
Non-U.S. | | | 0.15% | | | | 0.26% | |
Total securities borrowed, securities purchased under agreements to resell and federal funds sold | | | 0.39% | | | | 0.14% | |
U.S. | | | 2.47% | | | | 2.53% | |
| | |
Non-U.S. | | | 1.63% | | | | 1.76% | |
Total financial instruments owned, at fair value | | | 2.13% | | | | 2.24% | |
U.S. | | | 4.44% | | | | 3.43% | |
| | |
Non-U.S. | | | 5.94% | | | | 4.35% | |
Total loans receivable | | | 4.57% | | | | 3.52% | |
U.S. | | | 3.41% | | | | 2.65% | |
| | |
Non-U.S. | | | 1.01% | | | | 1.07% | |
Total other interest-earning assets | | | 2.14% | | | | 1.87% | |
Total interest-earning assets | | | 1.42% | | | | 1.22% | |
Liabilities | | | | | | | | |
U.S. | | | 0.96% | | | | 0.71% | |
| | |
Non-U.S. | | | 0.71% | | | | 0.57% | |
Total interest-bearing deposits | | | 0.92% | | | | 0.69% | |
U.S. | | | 0.91% | | | | 0.61% | |
| | |
Non-U.S. | | | 0.25% | | | | 0.42% | |
Total securities loaned and securities sold under agreements to repurchase | | | 0.64% | | | | 0.54% | |
U.S. | | | 1.98% | | | | 1.77% | |
| | |
Non-U.S. | | | 1.79% | | | | 1.66% | |
Total financial instruments sold, but not yet purchased, at fair value | | | 1.88% | | | | 1.72% | |
U.S. | | | 1.25% | | | | 1.06% | |
| | |
Non-U.S. | | | 0.24% | | | | 0.32% | |
Total short-term borrowings | | | 0.98% | | | | 0.88% | |
U.S. | | | 2.49% | | | | 1.93% | |
| | |
Non-U.S. | | | 0.50% | | | | 0.40% | |
Total long-term borrowings | | | 2.37% | | | | 1.85% | |
U.S. | | | 0.11% | | | | (0.69)% | |
| | |
Non-U.S. | | | 1.04% | | | | 0.87% | |
Total other interest-bearing liabilities | | | 0.39% | | | | (0.24)% | |
Total interest-bearing liabilities | | | 1.25% | | | | 0.82% | |
Interest rate spread | | | 0.17% | | | | 0.40% | |
| | |
U.S. | | | 0.22% | | | | 0.46% | |
| | |
Non-U.S. | | | 0.35% | | | | 0.45% | |
| | |
Net yield on interest-earning assets | | | 0.27% | | | | 0.46% | |
In the tables above:
Assets, liabilities and interest are
classified as U.S. and non-U.S. based on the location of the legal entity in which the assets and liabilities are held.
Derivative instruments and commodities are included in other non-interest-earning assets and other non-interest-bearing liabilities.
| | | | | | | | | | | | | | | | | | | | | | | | | | |
| | | Three Months Ended March | |
| | | 2016 | | | | | 2015 | |
$ in millions | | | Average balance | | | | Interest | | |
| Average
rate (annualized) |
| | | | | Average balance | | | | Interest | | |
| Average
rate (annualized) |
|
Assets | | | | | | | | | | | | | | | | | | | | | | | | | | |
U.S. | | | $ 68,857 | | | | $ 71 | | | | 0.41% | | | | | | $ 56,283 | | | | $ 34 | | | | 0.24% | |
| | |
Non-U.S. | | | 8,611 | | | | 5 | | | | 0.23% | | | | | | 3,638 | | | | 4 | | | | 0.45% | |
Total deposits with banks | | | 77,468 | | | | 76 | | | | 0.39% | | | | | | 59,921 | | | | 38 | | | | 0.26% | |
U.S. | | | 169,282 | | | | 12 | | | | 0.03% | | | | | | 175,582 | | | | (120 | ) | | | (0.28)% | |
| | |
Non-U.S. | | | 128,304 | | | | 82 | | | | 0.26% | | | | | | 108,402 | | | | 90 | | | | 0.34% | |
Total securities borrowed, securities purchased under agreements to resell and federal funds sold | | | 297,586 | | | | 94 | | | | 0.13% | | | | | | 283,984 | | | | (30 | ) | | | (0.04)% | |
U.S. | | | 134,882 | | | | 968 | | | | 2.89% | | | | | | 157,439 | | �� | | 1,031 | | | | 2.66% | |
| | |
Non-U.S. | | | 97,700 | | | | 428 | | | | 1.76% | | | | | | 98,744 | | | | 443 | | | | 1.82% | |
Total financial instruments owned, at fair value 1 | | | 232,582 | | | | 1,396 | | | | 2.41% | | | | | | 256,183 | | | | 1,474 | | | | 2.33% | |
U.S. | | | 42,444 | | | | 362 | | | | 3.43% | | | | | | 28,617 | | | | 238 | | | | 3.37% | |
| | |
Non-U.S. | | | 4,625 | | | | 50 | | | | 4.35% | | | | | | 1,251 | | | | 15 | | | | 4.86% | |
Total loans receivable | | | 47,069 | | | | 412 | | | | 3.52% | | | | | | 29,868 | | | | 253 | | | | 3.44% | |
U.S. | | | 80,640 | | | | 265 | | | | 1.32% | | | | | | 65,709 | | | | 176 | | | | 1.09% | |
| | |
Non-U.S. | | | 41,520 | | | | 105 | | | | 1.02% | | | | | | 71,375 | | | | 124 | | | | 0.70% | |
Total Other interest-earning assets 2 | | | 122,160 | | | | 370 | | | | 1.22% | | | | | | 137,084 | | | | 300 | | | | 0.89% | |
Total interest-earning assets | | | 776,865 | | | | 2,348 | | | | 1.22% | | | | | | 767,040 | | | | 2,035 | | | | 1.08% | |
| | |
Cash and due from banks | | | 5,289 | | | | | | | | | | | | | | 5,771 | | | | | | | | | |
| | |
Other non-interest-earning assets 1 | | | 101,904 | | | | | | | | | | | | | | 103,523 | | | | | | | | | |
Total assets 3 | | | $884,058 | | | | | | | | | | | | | | $876,334 | | | | | | | | | |
Liabilities | | | | | | | | | | | | | | | | | | | | | | | | | | |
U.S. | | | $ 83,011 | | | | $ 146 | | | | 0.71% | | | | | | $ 70,623 | | | | $ 75 | | | | 0.43% | |
| | |
Non-U.S. | | | 16,198 | | | | 23 | | | | 0.57% | | | | | | 12,728 | | | | 10 | | | | 0.32% | |
Total interest-bearing deposits | | | 99,209 | | | | 169 | | | | 0.69% | | | | | | 83,351 | | | | 85 | | | | 0.41% | |
U.S. | | | 57,569 | | | | 87 | | | | 0.61% | | | | | | 60,976 | | | | 50 | | | | 0.33% | |
| | |
Non-U.S. | | | 29,640 | | | | 31 | | | | 0.42% | | | | | | 29,542 | | | | 23 | | | | 0.32% | |
Total securities loaned and securities sold under agreements to repurchase | | | 87,209 | | | | 118 | | | | 0.54% | | | | | | 90,518 | | | | 73 | | | | 0.33% | |
U.S. | | | 38,207 | | | | 168 | | | | 1.77% | | | | | | 34,611 | | | | 168 | | | | 1.97% | |
| | |
Non-U.S. | | | 35,426 | | | | 146 | | | | 1.66% | | | | | | 38,826 | | | | 161 | | | | 1.68% | |
Total financial instruments sold, but not yet purchased, at fair value 1 | | | 73,633 | | | | 314 | | | | 1.72% | | | | | | 73,437 | | | | 329 | | | | 1.82% | |
U.S. | | | 43,949 | | | | 116 | | | | 1.06% | | | | | | 41,805 | | | | 119 | | | | 1.15% | |
| | |
Non-U.S. | | | 13,831 | | | | 11 | | | | 0.32% | | | | | | 15,432 | | | | 6 | | | | 0.16% | |
Total short-term borrowings 4 | | | 57,780 | | | | 127 | | | | 0.88% | | | | | | 57,237 | | | | 125 | | | | 0.89% | |
U.S. | | | 178,821 | | | | 856 | | | | 1.93% | | | | | | 165,871 | | | | 773 | | | | 1.89% | |
| | |
Non-U.S. | | | 9,000 | | | | 9 | | | | 0.40% | | | | | | 8,026 | | | | 38 | | | | 1.92% | |
Total long-term borrowings 4 | | | 187,821 | | | | 865 | | | | 1.85% | | | | | | 173,897 | | | | 811 | | | | 1.89% | |
U.S. | | | 152,592 | | | | (263 | ) | | | (0.69)% | | | | | | 158,792 | | | | (339 | ) | | | (0.87)% | |
| | |
Non-U.S. | | | 62,242 | | | | 135 | | | | 0.87% | | | | | | 64,086 | | | | 92 | | | | 0.58% | |
Total other interest-bearing liabilities 5 | | | 214,834 | | | | (128 | ) | | | (0.24)% | | | | | | 222,878 | | | | (247 | ) | | | (0.45)% | |
Total interest-bearing liabilities | | | 720,486 | | | | 1,465 | | | | 0.82% | | | | | | 701,318 | | | | 1,176 | | | | 0.68% | |
Non-interest-bearing deposits | | | 2,497 | | | | | | | | | | | | | | 1,505 | | | | | | | | | |
| | |
Other non-interest-bearing liabilities 1 | | | 74,152 | | | | | | | | | | | | | | 89,465 | | | | | | | | | |
Total liabilities 3 | | | 797,135 | | | | | | | | | | | | | | 792,288 | | | | | | | | | |
| | |
Shareholders’ equity | | | | | | | | | | | | | | | | | | | | | | | | | | |
Preferred stock | | | 11,370 | | | | | | | | | | | | | | 9,200 | | | | | | | | | |
| | |
Common stock | | | 75,553 | | | | | | | | | | | | | | 74,846 | | | | | | | | | |
Total shareholders’ equity | | | 86,923 | | | | | | | | | | | | | | 84,046 | | | | | | | | | |
Total liabilities and shareholders’ equity | | | $884,058 | | | | | | | | | | | | | | $876,334 | | | | | | | | | |
Interest rate spread | | | | | | | | | | | 0.40% | | | | | | | | | | | | | | 0.40% | |
| | |
U.S. | | | | | | | $ 568 | | | | 0.46% | | | | | | | | | | $ 513 | | | | 0.43% | |
| | |
Non-U.S. | | | | | | | 315 | | | | 0.45% | | | | | | | | | | 346 | | | | 0.50% | |
Net interest income and net yield on interest-earning assets | | | | | | | 883 | | | | 0.46% | | | | | | | | | | 859 | | | | 0.45% | |
Percentage of interest-earning assets and interest-bearing liabilities attributable to non-U.S. operations | | | | | | | | | | | | | | | | | | | | | | | | | | |
Assets | | | | | | | | | | | 36.14% | | | | | | | | | | | | | | 36.95% | |
| | |
Liabilities | | | | | | | | | | | 23.09% | | | | | | | | | | | | | | 24.05% | |
Total other interest-earning assets primarily consists of certain receivables from customers and counterparties.
1. | Derivative instruments and commodities are included in other non-interest-earning assets and other non-interest-bearing liabilities.
|
Substantially all of the total other interest-bearing liabilities consists of certain payables to customers and counterparties.
2. | Primarily consists of certain receivables from customers and counterparties and cash and securities segregated for regulatory and other purposes.
|
Interest rates for borrowings include the effects of interest rate swaps accounted for as hedges.
3. | The impact of adopting ASU No. 2015-03 was a reduction to both average total assets and average total liabilities of $414 million for the three months ended March 2015. See Note 3 to the condensed consolidated financial statements for further information about ASU No. 2015-03.
|
In December 2016, the firm reclassified amounts related to cash and securities segregated for regulatory and other purposes that were previously included in total other interest-earning assets to total deposits with banks, total securities borrowed, securities purchased under agreements to resell and federal funds sold, and total financial instruments owned, at fair value. The firm also reclassified amounts related to cash segregated for regulatory and other purposes that were previously included in other non-interest-earning assets to cash and due from banks. Previously reported amounts have been conformed to the current presentation. See Note 3 to the condensed consolidated financial statements for further information about this reclassification.
4. | Interest rates include the effects of interest rate swaps accounted for as hedges.
|
5. | Substantially all consists of certain payables to customers and counterparties.
|
| | | | |
| | | Goldman Sachs March 20162017 Form 10-Q | | 91 |
Item 2. Management’s Discussion and Analysis of Financial Condition and Results of Operations
INDEX
| | | | |
92 | | Goldman Sachs March 2016 Form 10-Q | | 89 |
THE GOLDMAN SACHS GROUP, INC. AND SUBSIDIARIES
Management’s Discussion and Analysis
| | | | |
Item 2. Management’s Discussion and Analysis of Financial Condition and Results of Operations | | | | |
Introduction
The Goldman Sachs Group, Inc. (Group Inc. or parent company), a Delaware corporation, together with its consolidated subsidiaries, (collectively, the firm), is a leading global investment banking, securities and investment management firm that provides a wide range of financial services to a substantial and diversified client base that includes corporations, financial institutions, governments and individuals. Founded in 1869, the firm iswe are headquartered in New York and maintainsmaintain offices in all major financial centers around the world.
When we use the terms “the firm,” “we,” “us” and “our,” we mean Group Inc. and its consolidated subsidiaries. We report our activities in four business segments: Investment Banking, Institutional Client Services, Investing & Lending and Investment Management. See “Results of Operations” below for further information about our business segments.
This Management’s Discussion and Analysis of Financial Condition and Results of Operations should be read in conjunction with our Annual Report on Form 10-K for the year ended December 31, 2015.2016. References to “the 20152016 Form 10-K” are to our Annual Report on Form 10-K for the year ended December 31, 2015.
When we use the terms “Goldman Sachs,” “the firm,” “we,” “us” and “our,” we mean Group Inc. and its consolidated subsidiaries.
2016. References to “the March 2016“this Form 10-Q” are to our Quarterly Report on Form 10-Q for the quarterly period ended March 31, 2016.2017. All references to “the condensed consolidated financial statements” or “Statistical Disclosures” are to Part I, Item 1 of the March 2016this Form 10-Q. All references to March 20162017 and March 20152016 refer to our periods ended, or the dates, as the context requires, March 31, 20162017 and March 31, 2015,2016, respectively. All references to December 20152016 refer to the date December 31, 2015.2016. Any reference to a future year refers to a year ending on December 31 of that year. Certain reclassifications have been made to previously reported amounts to conform to the current presentation.
Executive Overview
The firmWe generated net earnings of $1.14$2.26 billion and diluted earnings per common share of $5.15 for the first quarter of 2017, nearly double the amounts for the first quarter of 2016. Net earnings and diluted earnings per common share were $1.14 billion and $2.68, respectively, for the first quarter of 2016, which reflected the impact of a decrease of 60% and 55%, respectively, compared with $2.84 billion and $5.94 per share for the first quarter of 2015.challenging operating environment. Annualized return on average common shareholders’ equity (ROE) was 11.4% for the first quarter of 2017, compared with 6.4% for the first quarter of 2016, compared with 14.7% for the first quarter of 2015.2016. Book value per common share was $173.00$184.98 as of March 2016, 1%2017, 1.4% higher compared with the end of 2015.2016.
In the first quarter of 2017, as required, we adopted ASU No. 2016-09, “Compensation — Stock Compensation (Topic 718) — Improvements to Employee Share-Based Payment Accounting.” The impact of the restricted stock unit (RSU) deliveries and option exercises from the settlement of employee share-based awards in the first quarter of 2017 was a reduction to our provision for taxes of $475 million, which increased diluted earnings per common share by $1.13 and annualized return on average common shareholders’ equity by 2.5 percentage points. See Note 3 to the condensed consolidated financial statements for further information about this ASU.
Net revenues were $6.34$8.03 billion for the first quarter of 2016, 40% lower2017, 27% higher than a strongthe first quarter of 2015,2016, due to significantly higher net revenues in Investing & Lending and higher net revenues in both Investment Banking and Investment Management. These results were partially offset by slightly lower net revenues in Institutional Client Services, Investing & Lending and Investment Banking, as well as lower net revenues in Investment Management. These results reflected the impact of a challenging operating environment during the quarter.Services.
Operating expenses were $4.76$5.49 billion for the first quarter of 2016, 29% lower2017, 15% higher than the first quarter of 2015,2016, primarily due to significantly lowerhigher compensation and benefits expenses, reflecting a decreasean increase in net revenues, and lower non-compensationrevenues. Non-compensation expenses were slightly higher, primarily due to lowerhigher other expenses, reflecting higher net provisions for litigation and regulatory proceedings. Brokerage, clearing, exchange and distribution fees were lower compared with the first quarter of 2016, reflecting decreased transaction volumes in Equities.
We maintained strong capital ratios and liquidity. As of March 2016, ourOur Common Equity Tier 1 ratio as calculated in accordance with the Standardized approach and the Basel III Advanced approach, in each case reflecting the applicable transitional provisions, was 13.4%14.2% and 12.2%12.9%, respectively. In addition,respectively, and our global core liquid assets were $196$222 billion, all as of March 2016.2017. See Note 20 to the condensed consolidated financial statements for further information about our capital ratios. See “Risk Management — Liquidity Risk Management” below for further information about our global core liquid assets.
| | | | |
| 90 | | Goldman Sachs March 20162017 Form 10-Q | | 93 |
THE GOLDMAN SACHS GROUP, INC. AND SUBSIDIARIES
Management’s Discussion and Analysis
Global
During the first quarter of 2016,2017, global economic conditions wereappeared mixed compared with the previous quarter, as real gross domestic product (GDP) growth in the United States,U.S., China and United Kingdomthe U.K. slowed, while growth in the Euro area, Japan and JapanIndia appeared to improve. Weak manufacturingBroadly, global macroeconomic data particularlyremained strong throughout the quarter, and volatility in equity, foreign exchange and commodity markets was low. Major central banks continued to gradually tighten their stance on monetary policy. The U.S. Federal Reserve followed an increase in the United Statestarget federal funds rate in December 2016 with another increase in March 2017. In addition, the People’s Bank of China tightened its stance on monetary policy slightly by raising certain interest rates, and China, contributedthe European Central Bank confirmed it intended to concerns about global growth. These concerns impacted investors’ risk appetite, with many equity markets declining atdecrease the pace of its monthly asset purchases beginning of the quarter. A moderate rally followed in the second half of the quarter, but markets generally ended the quarter lower compared with the end of 2015. Volatility peaked in February but has since returned to more moderate levels, while theApril 2017. The price of crude oil (WTI) ended the quarter higher after declining during the first halfat approximately $51 per barrel, a decrease of the quarter. Long-term government bond yields were generally lower compared with6% from the end of 2015. During the quarter, the European Central Bank (ECB) announced multiple easing measures and the Bank of Japan (BOJ) introduced negative interest rates, while the U.S. Federal Reserve maintained its policy rate.2016. In investment banking, industry-wide equity underwriting activity was low and announced mergers and acquisitions activity significantlyvolumes declined compared with the robust level of volumes during 2016. Industry-wide equity underwriting activity continued to improve from the low levels of activity during 2016 and industry-wide debt underwriting activity increased after a slowdown in the fourth quarter of 2015.2016.
United States
In the United States,U.S., real GDP growth decreased compared with the previous quarter, reflecting a contraction in fixed investment and a decrease in consumer expenditurespending growth. Measures of consumer confidence remained stable, whilestrengthened, and the pace of housing starts and home sales were essentially unchangedincreased modestly, compared with the fourth quarter of 2015.2016. The unemployment rate was 5.0%4.5% as of March 2016, essentially unchanged compared with2017, slightly lower than the end of 2015,2016, and measures of inflation increased. TheFollowing a rate increase of 25 basis points in December 2016, the U.S. Federal Reserve maintainedincreased its target rate for the federal funds rate atagain in March by 25 basis points to a target range of 0.25%0.75% to 0.50%, and indicated that it remains concerned about the global economic and market backdrop.1.00%. The yield on the 10-year U.S. Treasury note ended the quarter at 1.78%2.39%, 496 basis points lower compared with the end of 2015.2016. In equity markets, the NASDAQ Composite Index, decreased by 3% compared with the end of 2015, while the S&P 500 Index and the Dow Jones Industrial Average both increased by 1%.10%, 6% and 5%, respectively, compared with the end of 2016.
Europe
In the Euro area, real GDP growth increasedappeared to increase during the quarter, whileas did measures of headline inflation appeared negative.inflation. The ECB expanded its easing measures — launching a new series of targeted longer-term refinancing operations (TLTROs) starting in June; increasing the volume of monthly purchases; and adding investment-grade, non-financial corporate bonds to the list of bonds purchased under its asset purchase program. The ECB also loweredEuropean Central Bank maintained its main refinancing operations rate by 5 basis points toat 0.00% and its deposit rate by 10 basis pointsat (0.40)%. In addition, the European Central Bank maintained the pace of its monthly asset purchases at €80 billion in the first quarter, but confirmed it intended to (0.40)%.reduce the pace of purchases to €60 billion beginning in April 2017. Measures of unemployment remained high and the Euro appreciated by 5%1% against the U.S. dollar compared with the end of 2015.2016. In the United Kingdom,U.K., real GDP growth decreased compared with the previous quarter. The Bank of England maintained its official bank rate at 0.50%0.25%, and the British pound depreciatedappreciated by 3%2% against the U.S. dollar. Yields on 10-year government bonds generally declinedincreased in the region. In equity markets, the DAX Index, Euro Stoxx 50 Index, DAX Index, CAC 40 Index and FTSE 100 Index declinedincreased by 8%7%, 7%6%, 5% and 1%3%, respectively, compared with the end of 2015.2016. During the last week of the quarter, the U.K. activated Article 50 of the E.U. treaty initiating a two-year negotiation period for its exit from the E.U.
Asia
In Japan, real GDP growth appeared to increase compared with the fourth quarter of 2015.2016. The BOJ introduced a negative interest rateBank of (0.10)% while maintainingJapan maintained its monetary base target and asset purchase program.program and continued to target a yield on 10-year Japanese government bonds of approximately 0%. The yield on 10-year Japanese government bonds decreased into negative territory, androse slightly, the U.S. dollar depreciated by 6%5% against the Japanese yen. Theyen, and the Nikkei 225 Index decreased by 12%1% compared with the end of 2015.2016. In China, real GDP growth slowed during the quarter. Measuresquarter and measures of inflation increased compared with the fourth quarter of 2015.decreased. The People’s Bank of China announced cuts totightened its stance on monetary policy in February by raising the reserve requirement ratiointerest rates it charges in open-market operations and theon funds lent via its Standing Lending Facility. The U.S. dollar depreciated by 1% against the Chinese yuan compared with the end of 2015. In2016, and in equity markets, the Hang Seng Index and the Shanghai Composite Index increased by 10% and Hang Seng Index decreased by 15% and 5%4%, respectively. In India, economic growth appeared to increase compared with the previous quarter. The U.S. dollar was essentially unchangeddepreciated by 5% against the Indian rupee, and the BSE Sensex Index decreasedincreased by 3%11% compared with the end of 2015.2016.
| | | | |
94 | | Goldman Sachs March 20162017 Form 10-Q | | 91 |
THE GOLDMAN SACHS GROUP, INC. AND SUBSIDIARIES
Management’s Discussion and Analysis
Critical Accounting Policies
Fair Value
Fair Value Hierarchy. Financial instruments owned, at fair value and Financial instruments sold, but not yet purchased, at fair value (i.e., inventory), as well as certain other financial assets and financial liabilities, are reflected in our condensed consolidated statements of financial condition at fair value (i.e., marked-to-market), with related gains or losses generally recognized in our condensed consolidated statements of earnings. The use of fair value to measure financial instruments is fundamental to our risk management practices and is our most critical accounting policy.
The fair value of a financial instrument is the amount that would be received to sell an asset or paid to transfer a liability in an orderly transaction between market participants at the measurement date. We measure certain financial assets and financial liabilities as a portfolio (i.e., based on its net exposure to market and/or credit risks). In determining fair value, the hierarchy under U.S. generally accepted accounting principles (U.S. GAAP) gives (i) the highest priority to unadjusted quoted prices in active markets for identical, unrestricted assets or liabilities (level 1 inputs), (ii) the next priority to inputs other than level 1 inputs that are observable, either directly or indirectly (level 2 inputs), and (iii) the lowest priority to inputs that cannot be observed in market activity (level 3 inputs). In evaluating the significance of a valuation input, we consider, among other factors, a portfolio’s net risk exposure to that input. Assets and liabilities are classified in their entirety based on the lowest level of input that is significant to their fair value measurement.
The fair values for substantially all of our financial assets and financial liabilities are based on observable prices and inputs and are classified in levels 1 and 2 of the fair value hierarchy. Certain level 2 and level 3 financial assets and financial liabilities may require appropriate valuation adjustments that a market participant would require to arrive at fair value for factors such as counterparty and the firm’sour credit quality, funding risk, transfer restrictions, liquidity and bid/offer spreads.
Instruments categorized withinclassified in level 3 of the fair value hierarchy are those which require one or more significant inputs that are not observable. As of both March 20162017 and December 2015,2016, level 3 financial assets represented 2.8%2.6% and 2.7%, respectively, of our total assets. See Notes 5 through 8 to the condensed consolidated financial statements for further information about level 3 financial assets, including changes in level 3 financial assets and related fair value measurements. Absent evidence to the contrary, instruments classified withinin level 3 of the fair value hierarchy are initially valued at transaction price, which is considered to be the best initial estimate of fair value. Subsequent to the transaction date, we use other methodologies to determine fair value, which vary based on the type of instrument. Estimating the fair value of level 3 financial instruments requires judgments to be made. These judgments include:
Determining the appropriate valuation methodology and/or model for each type of level 3 financial instrument;
Determining model inputs based on an evaluation of all relevant empirical market data, including prices evidenced by market transactions, interest rates, credit spreads, volatilities and correlations; and
Determining appropriate valuation adjustments, including those related to illiquidity or counterparty credit quality.
Regardless of the methodology, valuation inputs and assumptions are only changed when corroborated by substantive evidence.
| | | | |
| | Goldman Sachs March 2016 Form 10-Q | | 95 |
THE GOLDMAN SACHS GROUP, INC. AND SUBSIDIARIES
Management’s Discussion and Analysis
Controls Over Valuation of Financial Instruments. Market makers and investment professionals in our revenue-producing units are responsible for pricing our financial instruments. Our control infrastructure is independent of the revenue-producing units and is fundamental to ensuring that all of our financial instruments are appropriately valued at market-clearing levels. In the event that there is a difference of opinion in situations where estimating the fair value of financial instruments requires judgment (e.g., calibration to market comparables or trade comparison, as described below), the final valuation decision is made by senior managers in control and support functions. This independent price verification is critical to ensuring that our financial instruments are properly valued.
| | | | |
| 92 | | Goldman Sachs March 2017 Form 10-Q | | |
THE GOLDMAN SACHS GROUP, INC. AND SUBSIDIARIES
Management’s Discussion and Analysis
Price Verification. All financial instruments at fair value classified in levels 1, 2 and 3 of the fair value hierarchy are subject to our independent price verification process. The objective of price verification is to have an informed and independent opinion with regard to the valuation of financial instruments under review. Instruments that have one or more significant inputs which cannot be corroborated by external market data are classified withinin level 3 of the fair value hierarchy. Price verification strategies utilized by our independent control and support functions include:
Trade Comparison. Analysis of trade data (both internal and external where available) is used to determine the most relevant pricing inputs and valuations.
External Price Comparison. Valuations and prices are compared to pricing data obtained from third parties (e.g., brokers or dealers, Markit, Bloomberg, IDC, TRACE). Data obtained from various sources is compared to ensure consistency and validity. When broker or dealer quotations or third-party pricing vendors are used for valuation or price verification, greater priority is generally given to executable quotations.
Calibration to Market Comparables. Market-based transactions are used to corroborate the valuation of positions with similar characteristics, risks and components.
Relative Value Analyses. Market-based transactions are analyzed to determine the similarity, measured in terms of risk, liquidity and return, of one instrument relative to another or, for a given instrument, of one maturity relative to another.
Collateral Analyses. Margin calls on derivatives are analyzed to determine implied values which are used to corroborate our valuations.
Execution of Trades. Where appropriate, trading desks are instructed to execute trades in order to provide evidence of market-clearing levels.
Backtesting. Valuations are corroborated by comparison to values realized upon sales.
See Notes 5 through 8 to the condensed consolidated financial statements for further information about fair value measurements.
Review of Net Revenues. Independent control and support functions ensure adherence to our pricing policy through a combination of daily procedures, including the explanation and attribution of net revenues based on the underlying factors. Through this process we independently validate net revenues, identify and resolve potential fair value or trade booking issues on a timely basis and seek to ensure that risks are being properly categorized and quantified.
Review of Valuation Models. Our independent model risk management group (Model Risk Management), consisting of quantitative professionals who are separate from model developers, performs an independent model review and validation process of our valuation models. New or changed models are reviewed and approved prior to being put into use. Models are evaluated and re-approved annually to assess the impact of any changes in the product or market and any market developments in pricing theories. See “Risk Management — Model Risk Management” for further information about the review and validation of our valuation models.
| | | | |
96 | | Goldman Sachs March 2016 Form 10-Q | | |
THE GOLDMAN SACHS GROUP, INC. AND SUBSIDIARIES
Management’s Discussion and Analysis
Goodwill and Identifiable Intangible Assets
Goodwill. Goodwill is the cost of acquired companies in excess of the fair value of net assets, including identifiable intangible assets, at the acquisition date.
Goodwill is assessed for impairment annually in the fourth quarter or more frequently if events occur or circumstances change that indicate an impairment may exist, byexist. When assessing goodwill for impairment, first, assessing qualitative factors are assessed to determine whether it is more likely than not that the fair value of a reporting unit is less than its carrying amount.value. If the results of the qualitative assessment are not conclusive, a quantitative goodwill test is performed by comparing the estimated fair value of each reporting unit with its estimated net bookcarrying value.
During the fourth quarter of 2016, we determined that goodwill for all reporting units was not impaired. There were no events or changes in circumstances during the three months ended March 2017 that would indicate that it was more likely than not that the fair value of each of the reporting units did not exceed its respective carrying value as of March 2017. See Note 13 to the condensed consolidated financial statements for further information about our goodwill.
Estimating the fair value of our reporting units requires management to make judgments. Critical inputs to the fair value estimates include projected earnings and attributed equity. There is inherent uncertainty in the projected earnings. The net book value of each reporting unit reflects an allocation of total shareholders’ equity and represents the estimated amount of total shareholders’ equity required to support the activities of the reporting unit under currently applicable regulatory capital requirements. See “Equity Capital Management and Regulatory Capital” for further information about our capital requirements.
We last performed a quantitative goodwill test during the fourth quarter of 2015. We determined that goodwill was not impaired. In that quantitative goodwill test, the estimated fair value of our reporting units in which we hold substantially all of our goodwill significantly exceeded their estimated carrying values. However, the estimated fair value of the Fixed Income, Currency
| | | | |
| | Goldman Sachs March 2017 Form 10-Q | | 93 |
THE GOLDMAN SACHS GROUP, INC. AND SUBSIDIARIES
Management’s Discussion and Commodities Client Execution reporting unit, which represents approximately 7% of our goodwill, was not substantially in excess of its carrying value. This reporting unit and the industry more broadly have been, and continue to be, adversely impacted by the currently challenging operating environment and increased capital requirements. We will continue to closely monitor the reporting unit to determine whether an impairment is required in the future. As of both March 2016 and December 2015, the goodwill related to the Fixed Income, Currency and Commodities Client Execution reporting unit was $269 million, substantially all of which originated from the acquisition of Goldman Sachs Australia Pty Ltd in 2011.Analysis
If we experience a prolonged or severe period of weakness in the business environment or financial markets, or additional increases in capital requirements, our goodwill could be impaired in the future. In addition, significant changes to other inputs of the quantitative goodwill test could cause the estimated fair value of our reporting units to decline, which could result in an impairment of goodwill in the future.
See Note 13 to the condensed consolidated financial statements for further information about our goodwill and our quantitative goodwill test.
Identifiable Intangible Assets. We amortize our identifiable intangible assets over their estimated useful lives generally using the straight-line method or based on economic usage for certain customer lists and commodities-related intangibles.method. Identifiable intangible assets are tested for impairment whenever events or changes in circumstances suggest that an asset’s or asset group’s carrying value may not be fully recoverable. See Note 13 to the condensed consolidated financial statements for the carrying value and estimated remaining useful lives of our identifiable intangible assets by major asset class.
A prolonged or severe period of market weakness, or significant changes in regulation, could adversely impact our businesses and impair the value of our identifiable intangible assets. In addition, certain events could indicate a potential impairment of our identifiable intangible assets, including weaker business performance resulting in a decrease in our customer base and decreases in revenues from commodities-related transportation rights, customer contracts and relationships. Management judgment is required to evaluate whether indications of potential impairment have occurred, and to test intangible assets for impairment if required.
An impairment, generally calculated as the difference between the estimated fair value and the carrying value of an asset or asset group, is recognized if the total of the estimated undiscounted cash flows relating to the asset or asset group is less than the corresponding carrying value.
See Note 13 to the condensed consolidated financial statements for further information about our identifiable intangible assets.
| | | | |
| | Goldman Sachs March 2016 Form 10-Q | | 97 |
THE GOLDMAN SACHS GROUP, INC. AND SUBSIDIARIES
Management’s Discussion and Analysis
Recent Accounting Developments
See Note 3 to the condensed consolidated financial statements for information about Recent Accounting Developments.
Use of Estimates
The use of generally accepted accounting principles requires management to make certain estimates and assumptions. In addition to the estimates we make in connection with fair value measurements, the accounting for goodwill and identifiable intangible assets, and discretionary compensation accruals, the use of estimates and assumptions is also important in determining provisions for losses that may arise from litigation, regulatory proceedings (including governmental investigations) and tax audits, and the allowance for losses on loans receivable and lending commitments held for investment.
A substantial portion of our compensation and benefits represents discretionary compensation, which is finalized at year-end. We believe the most appropriate way to allocate estimated annual discretionary compensation among interim periods is in proportion to the net revenues earned in such periods. In addition to the level of net revenues, our overall compensation expense in any given year is also influenced by, among other factors, overall financial performance, prevailing labor markets, business mix, the structure of our share-based compensation programs and the external environment. See “Results of Operations — Financial Overview — Operating Expenses” below for information about our ratio of compensation and benefits to net revenues.
We estimate and provide for potential losses that may arise out of litigation and regulatory proceedings to the extent that such losses are probable and can be reasonably estimated. In addition, we estimate the upper end of the range of reasonably possible aggregate loss in excess of the related reserves for litigation and regulatory proceedings where the firm believeswe believe the risk of loss is more than slight. See Notes 18 and 27 to the condensed consolidated financial statements for information about certain judicial, regulatorylitigation and legalregulatory proceedings.
Significant judgment is required in making these estimates and our final liabilities may ultimately be materially different. Our total estimated liability in respect of litigation and regulatory proceedings is determined on a case-by-case basis and represents an estimate of probable losses after considering, among other factors, the progress of each case, proceeding or proceeding,investigation, our experience and the experience of others in similar cases, proceedings or proceedings,investigations, and the opinions and views of legal counsel.
| | | | |
| 94 | | Goldman Sachs March 2017 Form 10-Q | | |
THE GOLDMAN SACHS GROUP, INC. AND SUBSIDIARIES
Management’s Discussion and Analysis
In accounting for income taxes, we recognize tax positions in the financial statements only when it is more likely than not that the position will be sustained on examination by the relevant taxing authority based on the technical merits of the position. See Note 24 to the condensed consolidated financial statements for further information about accounting for income taxes.
We also estimate and record an allowance for credit losses related to our loans receivable and lending commitments held for investment. Management’s estimate of loan losses entails judgment about loan collectability at the reporting dates, and there are uncertainties inherent in those judgments. See Note 9 to the condensed consolidated financial statements for further information about the allowance for losses on loans receivable and lending commitments held for investment.
| | | | |
98 | | Goldman Sachs March 2016 Form 10-Q | | |
THE GOLDMAN SACHS GROUP, INC. AND SUBSIDIARIES
Management’s Discussion and Analysis
Results of Operations
The composition of our net revenues has varied over time as financial markets and the scope of our operations have changed. The composition of net revenues can also vary over the shorter term due to fluctuations in U.S. and global economic and market conditions. See “Risk Factors” in Part I, Item 1A of the 20152016 Form 10-K for further information about the impact of economic and market conditions on our results of operations.
Financial Overview
The table below presents an overview of our financial results and selected financial ratios.
| | | | | | | | |
| | | Three Months Ended March | |
| $ in millions, except per share amounts | | | 2016 | | | | 2015 | |
Net revenues | | | $ 6,338 | | | | $10,617 | |
| | |
Pre-tax earnings | | | 1,576 | | | | 3,934 | |
| | |
Net earnings | | | 1,135 | | | | 2,844 | |
| | |
Net earnings applicable to common shareholders | | | 1,200 | 1 | | | 2,748 | |
| | |
Diluted earnings per common share | | | 2.68 | | | | 5.94 | |
| | |
Annualized return on average common shareholders’ equity | | | 6.4% | | | | 14.7% | |
| | |
Annualized net earnings to average assets | | | 0.5% | | | | 1.3% | |
| | |
Annualized return on average total
shareholders’ equity | | | 5.2% | | | | 13.5% | |
| | |
Total average equity to average assets | | | 9.8% | | | | 9.6% | |
| | |
Dividend payout ratio | | | 24.3% | | | | 10.1% | |
1. | Includes a benefit of $161 million, reflected in preferred stock dividends, related to the exchange of APEX for shares of Series E and Series F Preferred Stock. See Note 19 to the condensed consolidated financial statements for further information.
|
| | | | | | | | |
| | | Three Months Ended March | |
| $ in millions, except per share amounts | | | 2017 | | | | 2016 | |
Net revenues | | | $ 8,026 | | | | $ 6,338 | |
| | |
Pre-tax earnings | | | $ 2,539 | | | | $ 1,576 | |
| | |
Net earnings | | | $ 2,255 | | | | $ 1,135 | |
| | |
Net earnings applicable to common shareholders | | | $ 2,162 | | | | $ 1,200 | |
| | |
Diluted earnings per common share | | | $ 5.15 | | | | $ 2.68 | |
| | |
Annualized return on average common shareholders’ equity | | | 11.4% | | | | 6.4% | |
| | |
Annualized net earnings to average assets | | | 1.0% | | | | 0.5% | |
| | |
Annualized return on average total shareholders’ equity | | | 10.4% | | | | 5.2% | |
| | |
Total average equity to average assets | | | 9.9% | | | | 9.8% | |
| | |
Dividend payout ratio | | | 12.6% | | | | 24.3% | |
In the table above:
Net earnings applicable to common shareholders for the three months ended March 2016 includes a benefit of $161 million, reflected in preferred stock dividends, related to the exchange of APEX for shares of Series E and Series F Preferred Stock. See Note 19 to the condensed consolidated financial statements for further information.
Annualized ROEreturn on average common shareholders’ equity is calculated by dividing annualized net earnings applicable to common shareholders by average monthly common shareholders’ equity. The table below presents our average common shareholders’ equity.
| | | | | | | | |
| | | Average for the Three Months Ended March | |
| $ in millions | | | 2016 | | | | 2015 | |
Total shareholders’ equity | | | $ 86,923 | | | | $84,046 | |
| | |
Preferred stock | | | (11,370 | ) | | | (9,200 | ) |
Common shareholders’ equity | | | $ 75,553 | | | | $74,846 | |
Annualized return on average total shareholders’ equity is calculated by dividing annualized net earnings by average monthly total shareholders’ equity. The table below presents our average common and total shareholders’ equity.
| | | | | | | | |
| | | Average for the Three Months Ended March | |
| $ in millions | | | 2017 | | | | 2016 | |
Total shareholders’ equity | | | $ 86,813 | | | | $ 86,923 | |
| | |
Preferred stock | | | (11,203 | ) | | | (11,370 | ) |
Common shareholders’ equity | | | $ 75,610 | | | | $ 75,553 | |
Dividend payout ratio is calculated by dividing dividends declared per common share by diluted earnings per common share.
Net Revenues
The table below presents our net revenues by line item onin the condensed consolidated statements of earnings.
| | | | Three Months Ended March | | | Three Months Ended March | |
| $ in millions | | | 2016 | | | | 2015 | | | | 2017 | | | | 2016 | |
Investment banking | | | $1,463 | | | | $ 1,905 | | | | $ 1,703 | | | | $ 1,463 | |
| | | | | |
Investment management | | | 1,262 | | | | 1,503 | | | | 1,397 | | | | 1,262 | |
| | | | | |
Commissions and fees | | | 917 | | | | 853 | | | | 771 | | | | 917 | |
| | | | | |
Market making | | | 1,862 | | | | 3,925 | | | | 2,418 | | | | 1,862 | |
| | | | | |
Other principal transactions | | | (49 | ) | | | 1,572 | | | | 1,221 | | | | (49 | ) |
Total non-interest revenues | | | 5,455 | | | | 9,758 | | | | 7,510 | | | | 5,455 | |
Interest income | | | 2,348 | | | | 2,035 | | | | 2,746 | | | | 2,348 | |
| | | | | |
Interest expense | | | 1,465 | | | | 1,176 | | | | 2,230 | | | | 1,465 | |
Net interest income | | | 883 | | | | 859 | | | | 516 | | | | 883 | |
Total net revenues | | | $6,338 | | | | $10,617 | | | | $ 8,026 | | | | $ 6,338 | |
In the table above:
“Investment banking”banking is comprised of revenues (excluding net interest) from financial advisory and underwriting assignments, as well as derivative transactions directly related to these assignments. These activities are included in our Investment Banking segment.
“Investment management”management is comprised of revenues (excluding net interest) from providing investment management services to a diverse set of clients, as well as wealth advisory services and certain transaction services to high-net-worth individuals and families. These activities are included in our Investment Management segment.
| | | | |
| | Goldman Sachs March 2017 Form 10-Q | | 95 |
THE GOLDMAN SACHS GROUP, INC. AND SUBSIDIARIES
Management’s Discussion and Analysis
“Commissions and fees”fees is comprised of revenues from executing and clearing client transactions on major stock, options and futures exchanges worldwide, as well as over-the-counter (OTC) transactions. These activities are included in our Institutional Client Services and Investment Management segments.
“Market making”making is comprised of revenues (excluding net interest) from client execution activities related to making markets in interest rate products, credit products, mortgages, currencies, commodities and equity products. These activities are included in our Institutional Client Services segment.
“Other principal transactions”transactions is comprised of revenues (excluding net interest) from our investing activities and the origination of loans to provide financing to clients. In addition, “OtherOther principal transactions”transactions includes revenues related to our consolidated investments. These activities are included in our Investing & Lending segment.
| | | | |
| | Goldman Sachs March 2016 Form 10-Q | | 99 |
THE GOLDMAN SACHS GROUP, INC. AND SUBSIDIARIES
Management’s DiscussionOperating Environment. After investor sentiment improved in the fourth quarter of 2016 following strong economic data, the prospect of higher interest rates and Analysis
| | | | |
Three Months Ended March 2016 versus March 2015
| | | | |
Net revenues on the condensed consolidated statementspotential for more pro-growth policies in the U.S., expectations were tempered in light of earnings were $6.34 billionuncertainty regarding European elections and legislative challenges in the U.S., which along with low volatility impacted the operating environment for our market-making activities. However, generally higher equity prices and tighter credit spreads contributed to a relatively favorable environment for industry-wide underwriting activities and other principal transactions. For investment management activities, although generally higher asset prices resulted in appreciation in our client assets, our assets under supervision declined during the first quarter of 2016, 40% lower than a strong first quarter2017 reflecting seasonal net outflows in liquidity products.
If the trend of 2015, reflecting significantly lower market-making revenues, other principal transactions revenues and investment banking revenues, as well as lower investment management revenues. These results were partially offset by higher commissions and fees and slightly higher net interest income.
During the first quarter of 2016, our business activities were negatively impacted by a challenging operating environment characterized by economicmacroeconomic uncertainty higher levels of volatility and significant price pressure across both equity and fixed income markets, particularly during the first half of the quarter. These factors, as well as uncertainty around global central bank activity, impacted investor conviction and risk appetite for market-making activities, and industry-wide equity underwriting and mergers and acquisitions activity for investment banking activities. Results in other principal transactions also reflected the impact of difficult market conditions, as well as the impact of a challenging macroeconomic environment on corporate performance. For investment management activities, net market appreciation for our client assets was mixed, as fixed income assets appreciated during the quarter, while equity and alternative investment assets depreciated. If macroeconomic concerns continuecontinues over the long term, and market-making activity levels decline or investment banking activity levels continue to decline, or if asset prices remaindecline, or if assets under pressure,supervision continue to decline, net revenues would likely continue to be negatively impacted. See “Segment Operating Results” below for further information about the operating environment and material trends and uncertainties that may impact our results of operations.
Three Months Ended March 2017 versus March 2016 Net revenues in the condensed consolidated statements of earnings were $8.03 billion for the first quarter of 2017, 27% higher than the first quarter of 2016, due to significantly higher other principal transactions revenues and market-making revenues and higher investment banking revenues and investment management revenues. These results were partially offset by significantly lower net interest income and lower commissions and fees.
Non-Interest Revenues. Investment banking revenues onin the condensed consolidated statements of earnings were $1.46$1.70 billion for the first quarter of 2016, 23% lower2017, 16% higher than the first quarter of 2015.2016. Revenues in financial advisory were significantlyslightly lower compared with a strongthe first quarter of 2015, reflecting a decrease in2016. Industry-wide completed mergers and acquisitions transactions.activity levels declined compared with the same prior year period. Revenues in underwriting were also significantly lower, due to significantly lower revenues in equity underwriting, reflecting low levels of industry-wide activity during the quarter. Revenues in debt underwriting were significantly higher compared with the first quarter of 2015, primarily2016, due to significantly higher revenues in equity underwriting, reflecting an increase in investment-gradeindustry-wide activity, and significantly higher revenues in debt underwriting, reflecting an increase in industry-wide leveraged finance activity.
Investment management revenues onin the condensed consolidated statements of earnings were $1.26$1.40 billion for the first quarter of 2016, 16% lower2017, 11% higher than the first quarter of 2015,2016, primarily reflecting significantly lowerdue to higher incentive fees and higher management and other fees. In addition,The increase in management and other fees were slightly lower, reflectingreflected higher average assets under supervision, partially offset by shifts in the mix of client assets and strategies, partially offset by the impact of higher average assets under supervision.strategies.
Commissions and fees onin the condensed consolidated statements of earnings were $917$771 million for the first quarter of 2016, 8% higher2017, 16% lower than the first quarter of 2015, primarily2016, reflecting higherlower listed cash equity and futures volumes in the United States,U.S., consistent with higher market volumes in this region.volumes.
Market-making revenues onin the condensed consolidated statements of earnings were $1.86$2.42 billion for the first quarter of 2016, 53% lower2017, 30% higher than the first quarter of 2015,2016, due to significantly higher revenues in mortgages, interest rate products and equity derivative products and higher revenues in credit products. These results were partially offset by lower revenues across all major fixed incomein commodities and currencies and slightly lower revenues in equity products, reflecting the impact of difficult market-making conditions during the quarter.cash products.
| | | | |
| 96 | | Goldman Sachs March 2017 Form 10-Q | | |
THE GOLDMAN SACHS GROUP, INC. AND SUBSIDIARIES
Management’s Discussion and Analysis
Other principal transactions revenues onin the condensed consolidated statements of earnings were negative $49 million$1.22 billion for the first quarter of 2016,2017, significantly lowerhigher compared with thea weak first quarter of 2015,2016, primarily due to a significant decreaseincrease in revenuesnet gains from investments in both private and public equities, which were negativelypositively impacted by generally lowercorporate performance and an increase in global equity prices and corporate performance during the first quarter of 2016.prices. Revenues in debt securities and loans were also significantly lowerhigher compared with the first quarter of 2015, primarily2016, reflecting lower revenues related to loans and lending commitments to institutional clients (includingsignificantly higher provision for losses) and lower net gains from investments.investments in debt instruments.
Net Interest Income. Net interest income onin the condensed consolidated statements of earnings was $883$516 million for the first quarter of 2016, 3% higher2017, 42% lower than the first quarter of 2015. The increase was primarily due to higher interest income resulting from an increase in total average loans receivable and higher interest income related to collateralized agreements,2016, reflecting the impact of higher interest rates. The increase in interest income was partially offset by ana significant increase in interest expense primarily reflectingdue to the impact of higher interest rates on other interest-bearing liabilities, long-term borrowings and interest-bearing deposits, as well as increases in total average long-term borrowings and total average interest-bearing deposits. The increase in interest expense was partially offset by higher interest income due to the impact of higher interest rates on collateralized agreements and loans receivable, as well as an increase in total average long-term borrowings.loans receivable. See “Statistical Disclosures — Distribution of Assets, Liabilities and Shareholders’ Equity” for further information about our sources of net interest income.
| | | | |
100 | | Goldman Sachs March 2016 Form 10-Q | | |
THE GOLDMAN SACHS GROUP, INC. AND SUBSIDIARIES
Management’s Discussion and Analysis
Operating Expenses
Our operating expenses are primarily influenced by compensation, headcount and levels of business activity. Compensation and benefits includes salaries, estimated year-end discretionary compensation, amortization of equity awards and other items such as benefits. Discretionary compensation is significantly impacted by, among other factors, the level of net revenues, overall financial performance, prevailing labor markets, business mix, the structure of our share-based compensation programs and the external environment. In addition, see “Use of Estimates” for additional information about expenses that may arise from compensation and benefits, and litigation and regulatory proceedings.
The table below presents our operating expenses and total staff (which includes employees, consultants and temporary staff).
| | | | Three Months Ended March | | | Three Months Ended March | |
| $ in millions | | | 2016 | | | | 2015 | | | | 2017 | | | | 2016 | |
Compensation and benefits | | | $ 2,662 | | | | $ 4,459 | | | | $ 3,291 | | | | $ 2,662 | |
| | | | | |
Brokerage, clearing, exchange and
distribution fees | | | 691 | | | | 638 | | | | 615 | | | | 691 | |
| | | | | |
Market development | | | 122 | | | | 139 | | | | 134 | | | | 122 | |
| | | | | |
Communications and technology | | | 197 | | | | 198 | | | | 223 | | | | 197 | |
| | | | | |
Depreciation and amortization | | | 239 | | | | 219 | | | | 257 | | | | 239 | |
| | | | | |
Occupancy | | | 183 | | | | 204 | | | | 176 | | | | 183 | |
| | | | | |
Professional fees | | | 220 | | | | 211 | | | | 205 | | | | 220 | |
| | | | | |
Other expenses | | | 448 | | | | 615 | | | | 586 | | | | 448 | |
Total non-compensation expenses | | | 2,100 | | | | 2,224 | | | | 2,196 | | | | 2,100 | |
Total operating expenses | | | $ 4,762 | | | | $ 6,683 | | | | $ 5,487 | | | | $ 4,762 | |
Total staff at period-end | | | 36,500 | | | | 34,400 | | | | 34,100 | | | | 36,500 | |
Three Months Ended March 20162017 versus March 2015.2016. Operating expenses onin the condensed consolidated statements of earnings were $4.76$5.49 billion for the first quarter of 2016, 29% lower2017, 15% higher than the first quarter of 2015.2016. The accrual for compensation and benefits expenses onin the condensed consolidated statements of earnings was $2.66$3.29 billion for the first quarter of 2016, 40% lower2017, 24% higher than the first quarter of 2015,2016, reflecting a decreasean increase in net revenues. The ratio of compensation and benefits to net revenues for the first quarter of 20162017 was 42.0%, unchanged41.0% compared with the first quarter of 2015. Total staff decreased slightly during42.0% for the first quarter of 2016.
Non-compensation expenses onin the condensed consolidated statements of earnings were $2.10$2.20 billion for the first quarter of 2016, 6% lower2017, 5% higher than the first quarter of 2015. This decrease reflected lower other expenses,2016, primarily due to lowerhigher other expenses, reflecting higher net provisions for litigation and regulatory proceedings and lower expenses related to consolidated investments, partially offset by higher brokerage,proceedings. Brokerage, clearing, exchange and distribution fees were lower compared with the first quarter of 2016, reflecting higherdecreased transaction volumes in Equities. Net provisions for litigation and regulatory proceedings for the first quarter of 20162017 were $77$139 million compared with $190$77 million for the first quarter of 2015.2016.
As of March 2017, total staff was essentially unchanged compared with December 2016.
Provision for Taxes
The effective income tax rate for the first quarter of 20162017 was 28.0%11.2%, down from the full year tax rate of 30.7%28.2% for 2015,2016, primarily due to tax benefits on the settlement of employee share-based awards in accordance with ASU No. 2016-09. The impact of the RSU deliveries and option exercises in the first quarter of 2017 was a decrease relatedreduction to our provision for taxes of $475 million and a reduction in our effective income tax rate of 18.7 percentage points. See Note 3 to the impactcondensed consolidated financial statements for further information about this ASU. This reduction was partially offset by the resolution of certain tax matters in 2016 and non-deductible provisions for mortgage-related litigation and regulatory matters in 2015, partially offset by the impact of settlements of tax audits in 2015, changes in tax law on deferred tax assets in 2015 and an increase related to higher enacted tax rates impacting certain of the firm’s U.K. subsidiaries beginning in 2016.
In March 2016, the United Kingdom government announced a budget proposal that will reduce the corporate income tax base rate by 1 percentage point effective April 1, 2020. Deferred income tax assets will be remeasured upon enactment of the legislation. We do not expect this change to have a material impact on our financial condition, results of operations or cash flows for the remainder of 2016.2017.
| | | | |
| | | Goldman Sachs March 20162017 Form 10-Q | | 10197 |
THE GOLDMAN SACHS GROUP, INC. AND SUBSIDIARIES
Management’s Discussion and Analysis
Segment Operating Results
The table below presents the net revenues, operating expenses and pre-tax earnings/(loss) of our segments.
| | | | Three Months Ended March | | | Three Months
Ended March | |
| $ in millions | | | 2016 | | | | 2015 | | | | 2017 | | | | 2016 | |
Investment Banking | | | | | | | | |
Net revenues | | | $1,463 | | | | $ 1,905 | | | | $1,703 | | | | $1,463 | |
| | | | | |
Operating expenses | | | 762 | | | | 1,104 | | | | 975 | | | | 762 | |
Pre-tax earnings | | | $ 701 | | | | $ 801 | | | | $ 728 | | | | $ 701 | |
Institutional Client Services | | | | | | | | |
Net revenues | | | $3,443 | | | | $ 5,459 | | | | $3,359 | | | | $3,443 | |
| | | | | |
Operating expenses | | | 2,421 | | | | 3,571 | | | | 2,544 | | | | 2,421 | |
Pre-tax earnings | | | $1,022 | | | | $ 1,888 | | | | $ 815 | | | | $1,022 | |
Investing & Lending | | | | | | | | |
Net revenues | | | $ 87 | | | | $ 1,669 | | | | $1,464 | | | | $ 87 | |
| | | | | |
Operating expenses | | | 443 | | | | 737 | | | | 750 | | | | 443 | |
Pre-tax earnings/(loss) | | | $ (356 | ) | | | $ 932 | | | | $ 714 | | | | $ (356 | ) |
Investment Management | | | | | | | | |
Net revenues | | | $1,345 | | | | $ 1,584 | | | | $1,500 | | | | $1,345 | |
| | | | | |
Operating expenses | | | 1,136 | | | | 1,271 | | | | 1,218 | | | | 1,136 | |
Pre-tax earnings | | | $ 209 | | | | $ 313 | | | | $ 282 | | | | $ 209 | |
Total net revenues | | | $6,338 | | | | $10,617 | | | | $8,026 | | | | $6,338 | |
| | | | | |
Total operating expenses | | | 4,762 | | | | 6,683 | | | | 5,487 | | | | 4,762 | |
Total pre-tax earnings | | | $1,576 | | | | $ 3,934 | | | | $2,539 | | | | $1,576 | |
Net revenues in our segments include allocations of interest income and interest expense to specific securities, commodities and other positions in relation to the cash generated by, or funding requirements of, such underlying positions. See Note 25 to the condensed consolidated financial statements for further information about our business segments.
TheOur cost drivers of Goldman Sachs taken as a whole, — compensation, headcount and levels of business activity, — are broadly similar in each of our business segments. Compensation and benefits expenses within our segments reflect, among other factors, theour overall performance, of Goldman Sachs as well as the performance of individual businesses. Consequently, pre-tax margins in one segment of our business may be significantly affected by the performance of our other business segments. A description of segment operating results follows.
Investment Banking
Our Investment Banking segment is comprised of:
Financial Advisory. Includes strategic advisory assignments with respect to mergers and acquisitions, divestitures, corporate defense activities, restructurings, spin-offs, risk management and derivative transactions directly related to these client advisory assignments.
Underwriting. Includes public offerings and private placements, including local and cross-border transactions and acquisition financing, of a wide range of securities loans and other financial instruments, including loans, and derivative transactions directly related to these client underwriting activities.
The table below presents the operating results of our Investment Banking segment.
| | | | Three Months Ended March | | | Three Months Ended March | |
| $ in millions | | | 2016 | | | | 2015 | | | | 2017 | | | | 2016 | |
Financial Advisory | | | $ 771 | | | | $ 961 | | | | $ 756 | | | | $ 771 | |
Equity underwriting | | | 183 | | | | 533 | | | | 311 | | | | 183 | |
| | | | | |
Debt underwriting | | | 509 | | | | 411 | | | | 636 | | | | 509 | |
Total Underwriting | | | 692 | | | | 944 | | | | 947 | | | | 692 | |
Total net revenues | | | 1,463 | | | | 1,905 | | | | 1,703 | | | | 1,463 | |
| | | | | |
Operating expenses | | | 762 | | | | 1,104 | | | | 975 | | | | 762 | |
Pre-tax earnings | | | $ 701 | | | | $ 801 | | | | $ 728 | | | | $ 701 | |
The table below presents our financial advisory and underwriting transaction volumes (Source: Thomson Reuters).volumes.
| | | | Three Months Ended March | | | Three Months Ended March | |
| $ in billions | | | 2016 | | | | 2015 | | | | 2017 | | | | 2016 | |
Announced mergers and acquisitions | | | $ 224 | | | | $ 179 | | | | $ 176 | | | | $ 198 | |
| | | | | |
Completed mergers and acquisitions | | | 262 | | | | 313 | | | | $ 206 | | | | $ 263 | |
| | | | | |
Equity and equity-related offerings | | | 10 | | | | 25 | | | | $ 17 | | | | $ 10 | |
| | | | | |
Debt offerings | | | 76 | | | | 71 | | | | $ 80 | | | | $ 73 | |
In the table above:
Volumes are per Dealogic. Prior periods have been conformed to reflect volumes per Dealogic.
Announced and completed mergers and acquisitions volumes are based on full credit to each of the advisors in a transaction. Equity and equity-related offerings and debt offerings are based on full credit for single book managers and equal credit for joint book managers. Transaction volumes may not be indicative of net revenues in a given period. In addition, transaction volumes for prior periods may vary from amounts previously reported due to the subsequent withdrawal or a change in the value of a transaction.
Equity and equity-related offerings includes Rule 144A and public common stock offerings, convertible offerings and rights offerings.
Debt offerings includes non-convertible preferred stock, mortgage-backed securities, asset-backed securities and taxable municipal debt. Includes publicly registered and Rule 144A issues. Excludes leveraged loans.
| | | | |
10298 | | Goldman Sachs March 20162017 Form 10-Q | | |
THE GOLDMAN SACHS GROUP, INC. AND SUBSIDIARIES
Management’s Discussion and Analysis
Three Months Ended March 2016 versus March 2015.Operating Environment. Net revenues in Investment Banking were $1.46 billion for the first quarter of 2016, 23% lower than the first quarter of 2015.
Net revenues in Financial Advisory were $771 million, 20% lower compared with a strong first quarter of 2015, reflecting a decrease in completedIn mergers and acquisitions, transactions. Net revenues in Underwriting were $692 million, 27% lower than the first quarter of 2015, due to significantly lower net revenues in equity underwriting, reflecting low levels ofboth industry-wide activity during the quarter. Net revenues in debt underwriting were significantly highercompleted and announced volumes declined compared with the first quarterrobust level of 2015, primarily reflecting an increase in investment-grade activity.
Duringvolumes during 2016, as the first quarter of 2016, Investment Banking operated in anoperating environment was generally characterized by low levels ofuncertainty about potential policy changes in the U.S. In underwriting, generally higher equity prices and tighter credit spreads contributed to a relatively favorable financing environment. As a result, industry-wide equity underwriting activity particularlycontinued to improve from the low levels of activity during 2016, which began with a challenging first quarter. In addition, industry-wide debt underwriting activity increased during the quarter after a slowdown in initial public offerings, and a significant decline in announced mergers and acquisitions activity compared with the fourth quarter of 2015. In addition, industry-wide completed mergers2016, as leveraged finance and acquisitionsinvestment-grade activity slowed, although activity during the quarter remained strong. Industry-wide debt underwriting activity improved compared with the fourth quarter of 2015.rebounded. In the future, if clientindustry-wide activity levels in mergers and acquisitions or equity underwriting continue the downward trend from the first quarter, or if clientindustry-wide activity levels in equity underwriting or debt underwriting begin to decline, net revenues in Investment Banking would likely be negatively impacted.
Three Months Ended March 2017 versus March 2016. Net revenues in Investment Banking were $1.70 billion for the first quarter of 2017, 16% higher than the first quarter of 2016.
Net revenues in Financial Advisory were $756 million, 2% lower than the first quarter of 2016. Industry-wide completed mergers and acquisitions activity levels declined compared with the same prior year period. Net revenues in Underwriting were $947 million, 37% higher than the first quarter of 2016, due to significantly higher net revenues in equity underwriting, reflecting an increase in industry-wide activity, and significantly higher net revenues in debt underwriting, reflecting an increase in industry-wide leveraged finance activity.
Operating expenses were $762$975 million for the first quarter of 2016, 31% lower2017, 28% higher than the first quarter of 2015, primarily2016, due to decreasedincreased compensation and benefits expenses, reflecting lowerhigher net revenues. Pre-tax earnings were $701$728 million in the first quarter of 2016, 12% lower2017, 4% higher than the first quarter of 2015.2016.
As of March 2016,2017, our investment banking transaction backlog decreased compared with both the end of 2015, but was higher compared with2016 and the end of the first quarter of 2015.2016. The decrease duringcompared with the quarterend of 2016 was due to lower estimated net revenues from both potential advisory transactions, reflecting a decrease in net revenues related to mergers and potential debt underwriting transactions compared with strong levels at the end of 2015. These declines wereacquisitions. This decline was partially offset by slightly higher estimated net revenues from potential equitydebt underwriting transactions, principally related to leveraged finance transactions.
Our investment banking transaction backlog represents an estimate of our future net revenues from investment banking transactions where we believe that future revenue realization is more likely than not. We believe changes in our investment banking transaction backlog may be a useful indicator of client activity levels which, over the long term, impact our net revenues. However, the time frame for completion and corresponding revenue recognition of transactions in our backlog varies based on the nature of the assignment, as certain transactions may remain in our backlog for longer periods of time and others may enter and leave within the same reporting period. In addition, our transaction backlog is subject to certain limitations, such as assumptions about the likelihood that individual client transactions will occur in the future. Transactions may be cancelled or modified, and transactions not included in the estimate may also occur.
Institutional Client Services
Our Institutional Client Services segment is comprised of:
Fixed Income, Currency and Commodities Client Execution. Includes client execution activities related to making markets in both cash and derivative instruments for interest rate products, credit products, mortgages, currencies and commodities.
Interest Rate Products. Government bonds money market instruments, treasury bills,(including inflation-linked securities) across maturities, other government-backed securities, repurchase agreements, and other highly liquid securities and instruments, as well as interest rate swaps, options and other derivatives.
Credit Products. Investment-grade corporate securities, high-yield securities, credit derivatives, exchange-traded funds, bank and bridge loans, municipal securities, emerging market and distressed debt, and trade claims.
Mortgages. Commercial mortgage-related securities, loans and derivatives, residential mortgage-related securities, loans and derivatives (including U.S. government agency-issued collateralized mortgage obligations other prime, subprime and Alt-Aother securities and loans), and other asset-backed securities, loans and derivatives.
Currencies. MostCurrency options, spot/forwards and other derivatives on G-10 currencies including growth-market currencies.and emerging-market products.
Commodities. CrudeCommodity derivatives and, to a lesser extent, physical commodities, involving crude oil and petroleum products, natural gas, base, precious and other metals, electricity, coal, agricultural and other commodity products.
| | | | |
| | | Goldman Sachs March 20162017 Form 10-Q | | 10399 |
THE GOLDMAN SACHS GROUP, INC. AND SUBSIDIARIES
Management’s Discussion and Analysis
Equities. Includes client execution activities related to making markets in equity products and commissions and fees from executing and clearing institutional client transactions on major stock, options and futures exchanges worldwide, as well as OTC transactions. Equities also includes our securities services business, which provides financing, securities lending and other prime brokerage services to institutional clients, including hedge funds, mutual funds, pension funds and foundations, and generates revenues primarily in the form of interest rate spreads or fees.
Market-Making Activities
As a market maker, we facilitate transactions in both liquid and less liquid markets, primarily for institutional clients, such as corporations, financial institutions, investment funds and governments, to assist clients in meeting their investment objectives and in managing their risks. In this role, we seek to earn the difference between the price at which a market participant is willing to sell an instrument to us and the price at which another market participant is willing to buy it from us, and vice versa (i.e., bid/offer spread). In addition, we maintain inventory, typically for a short period of time, in response to, or in anticipation of, client demand. We also hold inventory to actively manage our risk exposures that arise from these market-making activities. Our market-making inventory is recorded in financial instruments owned, at fair value (long positions) or financial instruments sold, but not yet purchased, at fair value (short positions) in our condensed consolidated statements of financial condition.
Our results are influenced by a combination of interconnected drivers, including (i) client activity levels and transactional bid/offer spreads (collectively, client activity), and (ii) changes in the fair value of our inventory and interest income and interest expense related to the holding, hedging and funding of our inventory (collectively, market-making inventory changes). Due to the integrated nature of our market-making activities, disaggregation of net revenues into client activity and market-making inventory changes is judgmental and has inherent complexities and limitations.
The amount and composition of our net revenues vary over time as these drivers are impacted by multiple interrelated factors affecting economic and market conditions, including volatility and liquidity in the market, changes in interest rates, currency exchange rates, credit spreads, equity prices and commodity prices, investor confidence, and other macroeconomic concerns and uncertainties.
In general, assuming all other market-making conditions remain constant, increases in client activity levels or bid/offer spreads tend to result in increases in net revenues, and decreases tend to have the opposite effect. However, changes in market-making conditions can materially impact client activity levels and bid/offer spreads, as well as the fair value of our inventory. For example, a decrease in liquidity in the market could have the impact of (i) increasing our bid/offer spread, (ii) decreasing investor confidence and thereby decreasing client activity levels, and (iii) wider credit spreads on our inventory positions.
The table below presents the operating results of our Institutional Client Services segment.
| | | | Three Months
Ended March | | | Three Months Ended March | |
| $ in millions | | | 2016 | | | | 2015 | | | | 2017 | | | | 2016 | |
Fixed Income, Currency and
Commodities Client Execution | | | $1,663 | | | | $3,134 | | |
FICC Client Execution | | | | $1,685 | | | | $1,663 | |
Equities client execution | | | 470 | | | | 1,124 | | | | 552 | | | | 470 | |
| | | | | |
Commissions and fees | | | 878 | | | | 808 | | | | 738 | | | | 878 | |
| | | | | |
Securities services | | | 432 | | | | 393 | | | | 384 | | | | 432 | |
Total Equities | | | 1,780 | | | | 2,325 | | | | 1,674 | | | | 1,780 | |
Total net revenues | | | 3,443 | | | | 5,459 | | | | 3,359 | | | | 3,443 | |
| | | | | |
Operating expenses | | | 2,421 | | | | 3,571 | | | | 2,544 | | | | 2,421 | |
Pre-tax earnings | | | $1,022 | | | | $1,888 | | | | $ 815 | | | | $1,022 | |
Three Months Ended March 2016 versus March 2015. NetThe table below presents the net revenues inof our Institutional Client Services were $3.44 billionsegment by line item in the condensed consolidated statements of earnings. See “Net Revenues” above for the first quarter of 2016, 37% lower than the first quarter of 2015.
Netfurther information about market-making revenues, in Fixed Income, Currency and Commodities Client Execution were $1.66 billion for the first quarter of 2016, 47% lower compared with a strong first quarter of 2015, due to significantly lower net revenues across all major businesses, primarily reflecting the impact of difficult market-making conditions during the quarter and, to a lesser extent, generally lower client activity. Net revenues in interest rate products and currencies were significantly lower, reflecting favorable market-making conditions during the first quarter of 2015. Net revenues also declined significantly in commodities and mortgages, reflecting the challenging market-making conditions, including continued low energy prices and wider spreads for certain products. The significant decrease in credit products reflected the difficult market-making conditions, particularly in Europe.
Net revenues in Equities were $1.78 billion for the first quarter of 2016, 23% lower than the first quarter of 2015, due to significantly lower net revenues in equities client execution compared with a strong first quarter of 2015.
The decrease in equities client execution reflected significantly lower net revenues in both cash products and derivatives. These results were partially offset by higher commissions and fees primarily reflecting higher listed cash equity and futures volumesnet interest income.
| | | | | | | | | | | | |
| $ in millions | |
| FICC Client
Execution |
| |
| Total
Equities |
| |
| Institutional
Client
Services |
|
Three Months Ended March 2017 | | | | | | | | | | | | |
Market making | | | $1,657 | | | | $ 761 | | | | $2,418 | |
| | |
Commissions and fees | | | — | | | | 738 | | | | 738 | |
| | |
Net interest income | | | 28 | | | | 175 | | | | 203 | |
Total net revenues | | | $1,685 | | | | $1,674 | | | | $3,359 | |
Three Months Ended March 2016 | | | | | | | | | | | | |
Market making | | | $1,208 | | | | $ 654 | | | | $1,862 | |
| | |
Commissions and fees | | | — | | | | 878 | | | | 878 | |
| | |
Net interest income | | | 455 | | | | 248 | | | | 703 | |
Total net revenues | | | $1,663 | | | | $1,780 | | | | $3,443 | |
In the table above:
The difference between commissions and fees and those in the United States, consistent with higher market volumes in this region. In addition, net revenues in securities services were higher, reflecting improved spreads.
The firm elects the fair value option for certain unsecured borrowings. The fair value net loss attributable to the impactcondensed consolidated statements of changesearnings represents commissions and fees included in our credit spreads on these borrowings was $44 million ($32 million and $12 million related to Fixed Income, Currency and Commodities Client Execution and equities client execution, respectively) for the first quarter of 2015. In the first quarter of 2016, the firm early adopted the requirement in ASU No. 2016-01 to present separately such gains and losses in other comprehensive income. The amount included in accumulated other comprehensive loss for the first quarter of 2016 was a loss of $24 million ($12 million, net of tax). Investment Management segment.
See Note 325 to the condensed consolidated financial statements for further information about ASU No. 2016-01.net interest income by business segment.
Challenging trends
The primary driver of net revenues for FICC Client Execution, for the periods in the operating environment for Institutional Client Services that existed throughouttable above, was attributable to client activity.
| | | | |
| 100 | | Goldman Sachs March 2017 Form 10-Q | | |
THE GOLDMAN SACHS GROUP, INC. AND SUBSIDIARIES
Management’s Discussion and Analysis
Operating Environment. After investor sentiment improved in the second half of 2015 continued during the firstfourth quarter of 2016 as concernsfollowing strong economic data, the prospect of higher interest rates and uncertainties about global growththe potential for more pro-growth policies in the U.S., expectations were tempered in light of uncertainty regarding European elections and central banklegislative challenges in the U.S. Reduced volatility negatively affected client activity persisted. These concerns contributed to significant price pressure at the beginning of the quarter across both equity and fixed income markets. Volatility peaked in Februarybusinesses with the VIX reaching over 28,falling below 11, Euro-dollar foreign exchange volatility approaching its lowest level in two years and global equity markets materially declined during the first half of the quarter with the Dow Jones Industrial Average, Shanghai Composite Index, and Nikkei 225 Index down 10%, 25% and 21%, respectively, at theircrude oil volatility averaging its lowest points. Credit spreads for high-yield issuers widened over 100 basis points earlylevel in the quarter, driven by the energy sector, andmore than two years. In addition, oil and natural gas prices continued their downward trend that begandeclined during the middle of 2015, reaching as low as $26quarter to approximately $51 per barrel (WTI) and $1.64$3.19 per million British thermal units, respectively. Although these trends somewhat reversedglobal equity markets continued to increase during the first quarter of 2017 (with the MSCI World Index up 6%), there was a modest retreat in March from intra-quarter highs. In credit markets, spreads generally tightened during the second half of the quarter, these factors impacted investor conviction and risk appetite, and market-making conditions remained difficult. The Dow Jones Industrial Average ended the quarter up 1%, while the Shanghai Composite Index and Nikkei 225 Index were down 15% and 12%, respectively.quarter. If the trend of macroeconomic concerns continueuncertainty continues over the long term and activity levels decline, from the level of activity during the first quarter of 2016, net revenues in Institutional Client Services would likely continue to be negatively impacted. See “Business Environment” above for further information about economic and market conditions in the global operating environment during the quarter.
| | | | |
104 | | Goldman Sachs March 2016 Form 10-Q | | |
THE GOLDMAN SACHS GROUP, INC. AND SUBSIDIARIES
Management’s Discussion and Analysis
Operating expensesThree Months Ended March 2017 versus March 2016. Net revenues in Institutional Client Services were $2.42$3.36 billion for the first quarter of 2016, 32%2017, 2% lower than the first quarter of 2015,2016.
Net revenues in FICC Client Execution were $1.69 billion for the first quarter of 2017, essentially unchanged compared with the first quarter of 2016, as significantly improved results from the impact of changes in market-making conditions on our inventory was offset by significantly lower client activity.
The following provides details of our FICC Client Execution net revenues by business, compared with results in the first quarter of 2016:
Net revenues in mortgages were significantly higher, reflecting favorable market-making conditions including generally tighter spreads, compared with a challenging first quarter of 2016.
Net revenues in interest rate products were higher, reflecting improved market-making conditions, partially offset by lower client activity.
Net revenues in commodities were significantly lower, reflecting the impact of changes in market-making conditions and, to a lesser extent, lower client activity.
Net revenues in currencies were significantly lower due to decreased compensation and benefits expenses, reflectinglower client activity.
Net revenues in credit products were lower, due to lower client activity, largely offset by improved market-making conditions, including generally tighter credit spreads.
Net revenues in Equities were $1.67 billion for the first quarter of 2017, 6% lower than the first quarter of 2016, primarily due to lower net revenues in commissions and fees, reflecting lower listed cash equity volumes in the U.S., consistent with market volumes. Net revenues in securities services were also lower, primarily reflecting the impact of changes in the composition of customer balances. These results were partially offset by higher net revenues in equities client execution, reflecting significantly higher results in derivatives, partially offset by lower results in cash products.
Operating expenses were $2.54 billion for the first quarter of 2017, 5% higher than the first quarter of 2016, primarily due to higher net provisions for litigation and regulatory proceedings. These decreases were partially offset by higher brokerage,Brokerage, clearing, exchange and distribution fees were lower, reflecting higherdecreased transaction volumes in Equities. Pre-tax earnings were $1.02 billion$815 million in the first quarter of 2016, 46%2017, 20% lower than the first quarter of 2015.2016.
Investing & Lending
Investing & Lending includes our investing activities and the origination of loans, including our relationship lending activities, to provide financing to clients. These investments and loans are typically longer-term in nature. We make investments, some of which are consolidated, directly and indirectly through funds and separate accounts that we manage, in debt securities and loans, public and private equity securities, infrastructure and real estate entities. We also make unsecured loans to individuals through our online platform.
The table below presents the operating results of our Investing & Lending segment.
| | | | Three Months
Ended March | | | Three Months Ended March | |
| $ in millions | | | 2016 | | | | 2015 | | | | 2017 | | | | 2016 | |
Equity securities | | | $ — | | | | $1,160 | | | | $ 798 | | | | $ — | |
| | | | | |
Debt securities and loans | | | 87 | | | | 509 | | | | 666 | | | | 87 | |
Total net revenues | | | 87 | | | | 1,669 | | | | 1,464 | | | | 87 | |
| | | | | |
Operating expenses | | | 443 | | | | 737 | | | | 750 | | | | 443 | |
Pre-tax earnings/(loss) | | | $(356 | ) | | | $ 932 | | | | $ 714 | | | | $(356 | ) |
| | | | |
| | Goldman Sachs March 2017 Form 10-Q | | 101 |
THE GOLDMAN SACHS GROUP, INC. AND SUBSIDIARIES
Management’s Discussion and Analysis
Three Months Ended March 2016 versus March 2015.Operating Environment. Net revenues in Investing & Lending were $87 millionDuring the first quarter of 2017, generally higher global equity prices and tighter credit spreads contributed to a favorable environment for our equity and debt investments. Results also reflected net gains from corporate performance and company-specific events, including sales. This environment sharply contrasts with the first quarter of 2016, significantly lower than the first quarter of 2015, primarily due to a significant decrease in net revenues from investments in both private and public equities, which were negatively impacted by generally lower global equity prices and corporate performance during the first quarter of 2016. Net revenues in debt securities and loans were also significantly lower compared with the first quarter of 2015, primarily reflecting lower net revenues related to loans and lending commitments to institutional clients (including higher provision for losses) and lower net gains from investments.
During the first quarter of 2016,where market conditions were difficult and corporate performance, particularly in the energy sector, was impacted by a challenging macroeconomic environment. Global equity markets generally ended the quarter lower compared with the end of 2015. In addition, concern about the outlook for the global economy continues to be a meaningful consideration for the global marketplace. If the trend of macroeconomic concerns negatively affect corporate performance or challenges in the energy sector continue over the long term,company-specific events, or if global equity markets decline further,or credit spreads widen, net revenues in Investing & Lending would likely continue to be negatively impacted.
Three Months Ended March 2017 versus March 2016.Net revenues in Investing & Lending were $1.46 billion for the first quarter of 2017, significantly higher compared with a weak first quarter of 2016, primarily due to a significant increase in net gains from investments in both private and public equities, which were positively impacted by corporate performance and an increase in global equity prices. Net revenues in debt securities and loans were also significantly higher compared with the first quarter of 2016, reflecting significantly higher net gains from investments in debt instruments and higher net interest income.
Operating expenses were $443$750 million for the first quarter of 2016, 40% lower2017, 69% higher than the first quarter of 2015,2016, primarily due to decreasedincreased compensation and benefits expenses, reflecting lowerhigher net revenues, and lower expenses related to consolidated investments.revenues. Pre-tax earnings were $714 million in the first quarter of 2017, compared with a pre-tax loss wasof $356 million in the first quarter of 2016, compared with pre-tax earnings of $932 million in the first quarter of 2015.2016.
Investment Management
Investment Management provides investment management services and offers investment products (primarily through separately managed accounts and commingled vehicles, such as mutual funds and private investment funds) across all major asset classes to a diverse set of institutional and individual clients. Investment Management also offers wealth advisory services, including portfolio management and financial counseling, and brokerage and other transaction services to high-net-worth individuals and families.
Assets under supervision include assets under management and other client assets. Assets under management(AUS) include client assets where we earn a fee for managing assets on a discretionary basis. This includes net assets in our mutual funds, hedge funds, credit funds and private equity funds (including real estate funds), and separately managed accounts for institutional and individual investors. Other client assetsAssets under supervision also include client assets invested with third-party managers, bank deposits and advisory relationships where we earn a fee for advisory and other services, but do not have investment discretion. Assets under supervision do not include the self-directed brokerage assets of our clients. Long-term assets under supervision represent assets under supervision excluding liquidity products. Liquidity products represent money market and bank deposit assets.
Assets under supervision typically generate fees as a percentage of net asset value, which vary by asset class and distribution channel and are affected by investment performance as well as asset inflows and redemptions. Asset classes such as alternative investment and equity assets typically generate higher fees relative to fixed income and liquidity product assets. The average effective management fee (which excludes non-asset-based fees) we earned on our assets under supervision was 3635 basis points and 3936 basis points for the three months ended March 20162017 and March 2015,2016, respectively.
In certain circumstances, we are also entitled to receive incentive fees based on a percentage of a fund’s or a separately managed account’s return, or when the return exceeds a specified benchmark or other performance target.targets. Incentive fees are recognized only when all material contingencies are resolved.
The table below presents the operating results of our Investment Management segment.
| | | | | | | | |
| | | Three Months Ended March | |
| $ in millions | | | 2017 | | | | 2016 | |
Management and other fees | | | $1,219 | | | | $1,165 | |
| | |
Incentive fees | | | 121 | | | | 46 | |
| | |
Transaction revenues | | | 160 | | | | 134 | |
Total net revenues | | | 1,500 | | | | 1,345 | |
| | |
Operating expenses | | | 1,218 | | | | 1,136 | |
Pre-tax earnings | | | $ 282 | | | | $ 209 | |
| | | | |
| 102 | | Goldman Sachs March 20162017 Form 10-Q | | 105 |
THE GOLDMAN SACHS GROUP, INC. AND SUBSIDIARIES
Management’s Discussion and Analysis
The table below presents the operating results of our Investment Management segment.
| | | | | | | | |
| | | Three Months
Ended March | |
| $ in millions | | | 2016 | | | | 2015 | |
Management and other fees | | | $1,165 | | | | $1,194 | |
| | |
Incentive fees | | | 46 | | | | 254 | |
| | |
Transaction revenues | | | 134 | | | | 136 | |
Total net revenues | | | 1,345 | | | | 1,584 | |
| | |
Operating expenses | | | 1,136 | | | | 1,271 | |
Pre-tax earnings | | | $ 209 | | | | $ 313 | |
The tables below present our period-end assets under supervision (AUS) by asset class and by distribution channel.class.
| | | | | | | | | | | | |
| | | As of | |
| | | March | | | December 2015 | |
| $ in billions | | | 2016 | | | | 2015 | | |
Assets under management | | | $1,110 | | | | $1,029 | | | | $1,078 | |
| | |
Other client assets | | | 177 | | | | 148 | | | | 174 | |
Total AUS | | | $1,287 | | | | $1,177 | | | | $1,252 | |
Asset Class | | | | | | | | | | | | |
Alternative investments | | | $ 147 | | | | $ 142 | | | | $ 148 | |
| | |
Equity | | | 252 | | | | 247 | | | | 252 | |
| | |
Fixed income | | | 566 | | | | 519 | | | | 546 | |
Long-term AUS | | | 965 | | | | 908 | | | | 946 | |
| | |
Liquidity products | | | 322 | | | | 269 | | | | 306 | |
Total AUS | | | $1,287 | | | | $1,177 | | | | $1,252 | |
Distribution Channel | | | | | | | | | | | | |
Institutional | | | $ 479 | | | | $ 419 | | | | $ 471 | |
| | |
High-net-worth individuals | | | 384 | | | | 370 | | | | 369 | |
| | |
Third-party distributed | | | 424 | | | | 388 | | | | 412 | |
Total AUS | | | $1,287 | | | | $1,177 | | | | $1,252 | |
| | | | | | | | |
| | | Three Months
Ended March | |
| $ in billions | | | 2017 | | | | 2016 | |
Alternative investments | | | $ 156 | | | | $ 147 | |
| | |
Equity | | | 279 | | | | 252 | |
| | |
Fixed income | | | 615 | | | | 566 | |
Total long-term assets under supervision | | | 1,050 | | | | 965 | |
| | |
Liquidity products | | | 323 | | | | 322 | |
Total assets under supervision | | | $1,373 | | | | $1,287 | |
In the table above, alternative investments primarily includes hedge funds, credit funds, private equity, real estate, currencies, commodities and asset allocation strategies.
The table below presents our period-end assets under supervision by distribution channel.
| | | | | | | | |
| | | Three Months
Ended March | |
| $ in billions | | | 2017 | | | | 2016 | |
Institutional | | | $ 515 | | | | $ 479 | |
| | |
High-net-worth individuals | | | 435 | | | | 384 | |
| | |
Third-party distributed | | | 423 | | | | 424 | |
Total | | | $1,373 | | | | $1,287 | |
The table below presents a summary of the changes in our assets under supervision.
| | | | Three Months
Ended March | | | Three Months Ended March | |
| $ in billions | | | 2016 | | | | 2015 | | | | 2017 | | | | 2016 | |
Balance, beginning of period | | | $1,252 | | | | $1,178 | | |
Beginning balance | | | | $1,379 | | | | $1,252 | |
| | | | | |
Net inflows/(outflows) | | | | | | | | |
Alternative investments | | | 1 | | | | (2 | ) | | | 2 | | | | 1 | |
| | | | | |
Equity | | | 4 | | | | 5 | | | | (3 | ) | | | 4 | |
| | | | | |
Fixed income | | | 5 | | | | 4 | | | | 6 | | | | 5 | |
Long-term AUS net inflows/(outflows) | | | 10 | | | | 7 | | |
Total long-term AUS net inflows/(outflows) | | | | 5 | | | | 10 | |
| | | | | |
Liquidity products | | | 16 | | | | (14 | ) | | | (35 | ) | | | 16 | |
Total AUS net inflows/(outflows) | | | 26 | | | | (7 | ) | | | (30 | ) | | | 26 | |
| | | | | |
Net market appreciation/(depreciation) | | | 9 | | | | 6 | | | | 24 | | | | 9 | |
Balance, end of period | | | $1,287 | | | | $1,177 | | |
Ending balance | | | | $1,373 | | | | $1,287 | |
In the table above, total long-term AUS net inflows/(outflows) for the first quarter of 2017 includes $5 billion of equity asset outflows in connection with the divestiture of our local Australian-focused investment capabilities and fund platform.
The table below presents our average monthly assets under supervision by asset class.
| | | | Average for the
Three Months
Ended March | | | Average for the Three Months Ended March | |
| $ in billions | | | 2016 | | | | 2015 | | | | 2017 | | | | 2016 | |
Alternative investments | | | $ 147 | | | | $ 143 | | | | $ 155 | | | | $ 147 | |
| | | | | |
Equity | | | 245 | | | | 241 | | | | 272 | | | | 245 | |
| | | | | |
Fixed income | | | 553 | | | | 517 | | | | 609 | | | | 553 | |
Long-term AUS | | | 945 | | | | 901 | | |
Total long-term assets under supervision | | | | 1,036 | | | | 945 | |
| | | | | |
Liquidity products | | | 312 | | | | 273 | | | | 339 | | | | 312 | |
Total AUS | | | $1,257 | | | | $1,174 | | |
Total assets under supervision | | | | $1,375 | | | | $1,257 | |
Three Months Ended March 2016 versus March 2015.Operating Environment.Net revenues in Investment Management were $1.35 billion for the first quarter of 2016, 15% lower than the first quarter of 2015, primarily reflecting significantly lower incentive fees. In addition, management and other fees were slightly lower, reflecting shifts in the mix of client assets and strategies, partially offset by the impact of higher average assets under supervision. During the quarter, total assets under supervision increased $35 billion to $1.29 trillion. Long-term assets under supervision increased $19 billion, due to net inflows of $10 billion, primarily in fixed income and equity assets, and net market appreciation of $9 billion, reflecting appreciation in fixed income assets. In addition, liquidity products increased $16 billion.
During the first quarter of 2016, Investment Management operated in a challengingan environment which reflected difficultcharacterized by generally higher asset prices, resulting in appreciation in our client assets in both equity and fixed income markets during the first half of the quarter,assets. This partially offset seasonal net outflows in liquidity products, which followed by a moderate rallynet inflows in the markets during the second half.fourth quarter of 2016. As a result, net market appreciation for our client assets was mixed, as fixed income assets appreciated, while equity and alternative investment assets depreciated. Thethe mix of our average assets under supervision shifted slightly frombetween long-term assets under supervision toand liquidity products was essentially unchanged compared with the fourth quarter of 2015. In addition, limited harvesting opportunities for our fund investments as a result of the difficult operating environment impacted incentive fees.2016. In the future, if asset prices decline, or investors continue the trend of favoringfavor assets that typically generate lower fees or if investors continue to withdraw their assets, net revenues in Investment Management would likely continue to be negatively impacted.
Operating expensesThree Months Ended March 2017 versus March 2016.Net revenues in Investment Management were $1.14$1.50 billion for the first quarter of 2016, 11% lower2017, 12% higher than the first quarter of 2015,2016, primarily due to higher incentive fees and higher management and other fees. The increase in management and other fees reflected higher average assets under supervision, partially offset by shifts in the mix of client assets and strategies. During the quarter, total assets under supervision decreased $6 billion to $1.37 trillion. Long-term assets under supervision increased $29 billion, including net market appreciation of $24 billion, primarily in equity and fixed income assets, and net inflows of $5 billion (which includes $5 billion of equity asset outflows in connection with the divestiture of our local Australian-focused investment capabilities and fund platform), reflecting inflows in fixed income assets. Liquidity products decreased $35 billion.
Operating expenses were $1.22 billion for the first quarter of 2017, 7% higher than the first quarter of 2016, due to increased compensation and benefits expenses, reflecting lowerhigher net revenues. Pre-tax earnings were $209$282 million in the first quarter of 2016, 33% lower2017, 35% higher than the first quarter of 2015.2016.
Geographic Data
See Note 25 to the condensed consolidated financial statements for a summary of our total net revenues and pre-tax earnings by geographic region.
| | | | |
106 | | Goldman Sachs March 20162017 Form 10-Q | | 103 |
THE GOLDMAN SACHS GROUP, INC. AND SUBSIDIARIES
Management’s Discussion and Analysis
Balance Sheet and Funding Sources
Balance Sheet Management
One of our most important risk management disciplines is our ability to manage the size and composition of our balance sheet. While our asset base changes due to client activity, market fluctuations and business opportunities, the size and composition of our balance sheet reflectalso reflects factors including (i) our overall risk tolerance, (ii) our ability to access stable funding sources and (iii) the amount of equity capital we hold.hold and (iii) our funding profile, among other factors. See “Equity Capital Management and Regulatory Capital — Equity Capital Management” for information about our equity capital management process.
Although our balance sheet fluctuates on a day-to-day basis, our total assets at quarter-end and year-end dates are generally not materially different from those occurring within our reporting periods.
In order to ensure appropriate risk management, we seek to maintain a sufficiently liquid balance sheet and have processes in place to dynamically manage our assets and liabilities which include (i) quarterlybalance sheet planning, (ii) business-specific limits, (iii) monitoring of key metrics and (iv) scenario analyses.
QuarterlyBalance Sheet Planning. We prepare a quarterly balance sheet plan that combines our projected total assets and composition of assets with our expected funding sources for the upcoming quarter.over a one-year time horizon. This plan is reviewed semi-annually and may be adjusted in response to changing business needs or market conditions. The objectives of this quarterly planning process are:
To develop our near-term balance sheet projections, taking into account the general state of the financial markets and expected business activity levels, as well as current regulatory requirements;
To determine the target amount, tenor and type of funding to raise, based on our projected assets and forecasted maturities; and
To allow business risk managers and managers from our independent control and support functions to objectively evaluate balance sheet limit requests from business managers in the context of the firm’sour overall balance sheet constraints, including the firm’sour liability profile and equity capital levels, and key metrics. Limits are typically set at levels that will be periodically exceeded, rather than at levels which reflectmetrics; and
To inform the target amount, tenor and type of funding to raise, based on our maximum risk appetite.projected assets and contractual maturities.
To prepare our quarterly balance sheet plan, businessBusiness risk managers and managers from our independent control and support functions meetalong with business managers to review current and prior period information and discuss expectations for the upcoming quarter.year to prepare our balance sheet plan. The specific information reviewed includes asset and liability size and composition, aged inventory, limit utilization, risk and performance measures, and capital usage.
Our consolidated quarterlybalance sheet plan, including our balance sheet planssheets by business, funding projections, and projected key metrics, is reviewed and approved by the Firmwide Finance Committee. See “Overview and Structure of Risk Management” for an overview of our risk management structure.
Business-Specific Limits. The Firmwide Finance Committee sets asset and liability limits for each business and aged inventory limits for certain financial instruments as a disincentive to hold inventory over longer periods of time.business. These limits are set at levels which are close to actual operating levels, rather than at levels which reflect our maximum risk appetite, in order to ensure prompt escalation and discussion among business managers and managers in our independent control and support functions on a routine basis. The Firmwide Finance Committee reviews and approves balance sheet limits on a quarterlysemi-annual basis and may also approve changes in limits on an ad hoca more frequent basis in response to changing business needs or market conditions. In addition, the Risk Governance Committee sets aged inventory limits for certain financial instruments as a disincentive to hold inventory over longer periods of time. Requests for changes in limits are evaluated after giving consideration to their impact on our key firm metrics. Compliance with limits is monitored on a daily basis by business risk managers, as well as managers in our independent control and support functions.
Monitoring of Key Metrics. We monitor key balance sheet metrics daily both by business and on a consolidated basis, including asset and liability size and composition, aged inventory, limit utilization and risk measures. We allocate assets to businesses and review and analyze movements resulting from new business activity as well as market fluctuations.
| | | | |
| 104 | | Goldman Sachs March 20162017 Form 10-Q | | 107 |
THE GOLDMAN SACHS GROUP, INC. AND SUBSIDIARIES
Management’s Discussion and Analysis
Scenario Analyses. We conduct various scenario analyses including as part of the Comprehensive Capital Analysis and Review (CCAR) and U.S. Dodd-Frank Wall Street Reform and Consumer Protection Act (Dodd-Frank Act) Stress Tests (DFAST), as well as our resolution and recovery planning. See “Equity Capital Management and Regulatory Capital — Equity Capital Management” below for further information.information about these scenario analyses. These scenarios cover short-term and long-term time horizons using various macroeconomic and firm-specific assumptions, based on a range of economic scenarios. We use these analyses to assist us in developing our longer-term balance sheet management strategy, including the level and composition of assets, funding and equity capital. Additionally, these analyses help us develop approaches for maintaining appropriate funding, liquidity and capital across a variety of situations, including a severely stressed environment.
Balance Sheet Allocation
In addition to preparing our condensed consolidated statements of financial condition in accordance with U.S. GAAP, we prepare a balance sheet that generally allocates assets to our businesses, which is a non-GAAP presentation and may not be comparable to similar non-GAAP presentations used by other companies. We believe that presenting our assets on this basis is meaningful because it is consistent with the way management views and manages risks associated with the firm’sour assets and better enables investors to assess the liquidity of the firm’sour assets.
The table below presents our balance sheet allocation.
| | | | | | | | |
| | | As of | |
| $ in millions | |
| March
2016 |
| |
| December
2015 |
|
Global Core Liquid Assets (GCLA) | | | $195,763 | | | | $199,120 | |
| | |
Other cash | | | 9,172 | | | | 9,180 | |
GCLA and cash | | | 204,935 | | | | 208,300 | |
| | |
Secured client financing | | | 232,775 | | | | 221,325 | |
| | |
Inventory | | | 209,062 | | | | 208,836 | |
| | |
Secured financing agreements | | | 67,861 | | | | 63,495 | |
| | |
Receivables | | | 40,000 | | | | 39,976 | |
Institutional Client Services | | | 316,923 | | | | 312,307 | |
| | |
Public equity | | | 3,685 | | | | 3,991 | |
| | |
Private equity | | | 17,444 | | | | 16,985 | |
| | |
Debt 1 | | | 23,564 | | | | 23,216 | |
| | |
Loans receivable | | | 47,924 | | | | 45,407 | |
| | |
Other | | | 6,518 | | | | 4,646 | |
Investing & Lending | | | 99,135 | | | | 94,245 | |
Total inventory and related assets | | | 416,058 | | | | 406,552 | |
| | |
Other assets | | | 24,268 | | | | 25,218 | |
Total assets | | | $878,036 | | | | $861,395 | |
1. | Includes $16.72 billion and $17.29 billion as of March 2016 and December 2015, respectively, of direct loans primarily extended to corporate and private wealth management clients that are accounted for at fair value.
|
| | | | | | | | |
| | | As of | |
| $ in millions | |
| March
2017 |
| |
| December
2016 |
|
Global Core Liquid Assets (GCLA) | | | $222,497 | | | | $226,066 | |
| | |
Other cash | | | 10,848 | | | | 9,088 | |
GCLA and cash | | | 233,345 | | | | 235,154 | |
| | |
Secured client financing | | | 208,716 | | | | 199,387 | |
| | |
Inventory | | | 212,476 | | | | 206,988 | |
| | |
Secured financing agreements | | | 71,388 | | | | 65,606 | |
| | |
Receivables | | | 39,042 | | | | 29,592 | |
Institutional Client Services | | | 322,906 | | | | 302,186 | |
| | |
Public equity | | | 2,727 | | | | 3,224 | |
| | |
Private equity | | | 19,281 | | | | 18,224 | |
| | |
Debt | | | 22,646 | | | | 21,675 | |
| | |
Loans receivable | | | 50,385 | | | | 49,672 | |
| | |
Other | | | 7,219 | | | | 5,162 | |
Investing & Lending | | | 102,258 | | | | 97,957 | |
Total inventory and related assets | | | 425,164 | | | | 400,143 | |
| | |
Other assets | | | 26,844 | | | | 25,481 | |
Total assets | | | $894,069 | | | | $860,165 | |
The following is a description of the captions in the table above:
Global Core Liquid Assets and Cash. We maintain liquidity to meet a broad range of potential cash outflows and collateral needs in a stressed environment. See “Liquidity Risk Management” below for details on the composition and sizing of our “Global Core Liquid Assets” (GCLA).GCLA. In addition to our GCLA, we maintain other unrestricted operating cash balances, primarily for use in specific currencies, entities, or jurisdictions where we do not have immediate access to parent company liquidity.
Secured Client Financing. We provide collateralized financing for client positions, including margin loans secured by client collateral, securities borrowed, and resale agreements primarily collateralized by government obligations. As a result of client activities, we are required toWe segregate cash and securities for regulatory and other purposes related to satisfy regulatory requirements.client activity. Securities are segregated from our own inventory as well as from collateral obtained through securities borrowed or resale agreements. Our secured client financing arrangements, which are generally short-term, are accounted for at fair value or at amounts that approximate fair value, and include daily margin requirements to mitigate counterparty credit risk.
Institutional Client Services. In Institutional Client Services, we maintain inventory positions to facilitate market making in fixed income, equity, currency and commodity products. Additionally, as part of market-making activities, we enter into resale or securities borrowing arrangements to obtain securities which we canor use our own inventory to cover transactions in which we or our clients have sold securities that have not yet been purchased. The receivables in Institutional Client Services primarily relate to securities transactions.
Investing & Lending. In Investing & Lending, we make investments and originate loans to provide financing to clients. These investments and loans are typically longer-term in nature. We make investments, directly and indirectly through funds and separate accounts that we manage, in debt securities, loans, public and private equity securities, infrastructure, real estate entities and other investments. We also make unsecured loans to individuals through our online platform. Debt includes $14.29 billion and $14.23 billion as of March 2017 and December 2016, respectively, of direct loans primarily extended to corporate and private wealth management clients that are accounted for at fair value. Loans receivable is comprised of loans held for investment that are accounted for at amortized cost net of allowance for loan losses. See Note 9 to the condensed consolidated financial statements for further information about loans receivable.
| | | | |
| | Goldman Sachs March 2017 Form 10-Q | | 105 |
THE GOLDMAN SACHS GROUP, INC. AND SUBSIDIARIES
Management’s Discussion and Analysis
Other Assets. Other assets are generally less liquid, non-financialnonfinancial assets, including property, leasehold improvements and equipment, goodwill and identifiable intangible assets, income tax-related receivables, equity-method investments, assets classified as held for sale and miscellaneous receivables.
| | | | |
108 | | Goldman Sachs March 2016 Form 10-Q | | |
THE GOLDMAN SACHS GROUP, INC. AND SUBSIDIARIES
Management’s Discussion and Analysis
The table below presents the reconciliation of this balance sheet allocation to our U.S. GAAP balance sheet.
| | $ in millions | |
| GCLA
and Cash |
| |
| Secured
Client
Financing |
| |
| Institutional
Client
Services |
| |
| Investing
& Lending |
| | Total | | GCLA and Cash | | Secured Client Financing | | Institutional Client Services | | Investing & Lending | | | Total | |
As of March 2016 | | | | | | | | | | | |
As of March 2017 | | | | | | | | | | | |
Cash and cash equivalents | | | $ 79,169 | | | | $ — | | | | $ — | | | | $ — | | | $ 79,169 | | $107,851 | | $ 15,184 | | $ — | | $ — | | | $123,035 | |
| | |
Cash and securities segregated for regulatory and other purposes | | | — | | | | 58,287 | | | | — | | | | — | | | 58,287 | |
| | | | |
Securities purchased under agreements to resell and federal funds sold | | | 63,234 | | | | 47,434 | | | | 16,326 | | | | 1,519 | | | 128,513 | | 50,725 | | 42,793 | | 22,807 | | 953 | | | 117,278 | |
| | | | |
Securities borrowed | | | 30,473 | | | | 98,595 | | | | 51,535 | | | | — | | | 180,603 | | 38,018 | | 100,847 | | 48,581 | | — | | | 187,446 | |
| | | | |
Receivables from brokers, dealers and clearing organizations | | | — | | | | 4,880 | | | | 18,091 | | | | — | | | 22,971 | | — | | 6,437 | | 19,313 | | — | | | 25,750 | |
| | | | |
Receivables from customers and counterparties | | | — | | | | 23,579 | | | | 21,909 | | | | 3,911 | | | 49,399 | | — | | 29,027 | | 19,729 | | 5,704 | | | 54,460 | |
| | | | |
Loans receivable | | | — | | | | — | | | | — | | | | 47,924 | | | 47,924 | | — | | — | | — | | 50,385 | | | 50,385 | |
| | | | |
Financial instruments owned, at fair value | | | 32,059 | | | | — | | | | 209,062 | | | | 45,781 | | | 286,902 | | 36,751 | | 14,428 | | 212,476 | | 45,216 | | | 308,871 | |
Subtotal | | | $204,935 | | | | $232,775 | | | | $316,923 | | | | $99,135 | | | $853,768 | | $233,345 | | $208,716 | | $322,906 | | $102,258 | | | $867,225 | |
| | | | |
Other assets | | 24,268 | | | 26,844 | |
Total assets | | $878,036 | | | $894,069 | |
As of December 2015 | | | | | | | | | | | |
As of December 2016 | | As of December 2016 | | |
Cash and cash equivalents | | $ 75,105 | | | | $ — | | | | $ — | | | | $ — | | | $ 75,105 | | $107,066 | | $ 14,645 | | $ — | | $ — | | $121,711 | |
| | |
Cash and securities segregated for regulatory and other purposes | | | — | | | 56,838 | | | | — | | | | — | | | 56,838 | |
| | | | |
Securities purchased under agreements to resell and federal funds sold | | 60,092 | | | 42,786 | | | 16,368 | | | 1,659 | | | 120,905 | | 56,583 | | 40,436 | | 18,844 | | 1,062 | | 116,925 | |
| | | | |
Securities borrowed | | 33,260 | | | 91,712 | | | 47,127 | | | | — | | | 172,099 | | 41,652 | | 96,186 | | 46,762 | | — | | 184,600 | |
| | | | |
Receivables from brokers, dealers and clearing organizations | | | — | | | 5,912 | | | 19,541 | | | | — | | | 25,453 | | — | | 6,540 | | 11,504 | | — | | 18,044 | |
| | | | |
Receivables from customers and counterparties | | | — | | | 24,077 | | | 20,435 | | | 1,918 | | | 46,430 | | — | | 26,286 | | 18,088 | | 3,406 | | 47,780 | |
| | | | |
Loans receivable | | | — | | | | — | | | | — | | | 45,407 | | | 45,407 | | — | | — | | — | | 49,672 | | 49,672 | |
| | | | |
Financial instruments owned, at fair value | | 39,843 | | | | — | | | 208,836 | | | 45,261 | | | 293,940 | | 29,853 | | 15,294 | | 206,988 | | 43,817 | | 295,952 | |
Subtotal | | $208,300 | | | $221,325 | | | $312,307 | | | $94,245 | | | $836,177 | | $235,154 | | $199,387 | | $302,186 | | $ 97,957 | | $834,684 | |
| | | | |
Other assets | | 25,218 | | 25,481 | |
Total assets | | $861,395 | | $860,165 | |
In the table above:
Total assets for Institutional Client Services and Investing & Lending represent inventory and related assets. These amounts differ from total assets by business segment disclosed in Note 25 to the condensed consolidated financial statements because total assets disclosed in Note 25 include allocations of our GCLA and cash, secured client financing and other assets.
See “Balance Sheet Analysis and Metrics” for explanations on the changes in our balance sheet from December 20152016 to March 2016.2017.
Balance Sheet Analysis and Metrics
As of March 2016,2017, total assets onin our condensed consolidated statements of financial condition were $878.04$894.07 billion, an increase of $16.64$33.90 billion from December 2015, primarily2016, reflecting increases in collateralized agreements of $16.11 billion and cash and cash equivalents of $4.06 billion, partially offset by a decrease in financial instruments owned, at fair value of $7.04$12.92 billion, receivables from brokers, dealers and clearing organizations of $7.71 billion and receivables from customers and counterparties of $6.68 billion. During the first quarter of 2016, collateralized agreements increased due to changesThe increase in firm and client activity and cash and cash equivalents increased due to changes in the composition of our GCLA. Financialfinancial instruments owned, at fair value decreased reflecting lowerprimarily reflected increases in U.S. government and federal agency obligations and non-U.S. government and agency obligations related to market-making activity, related to equities and convertible debentures, partially offset by the impact of movements in currencies and interest rates on derivative valuations. The increases in receivables from brokers, dealers and clearing organizations and receivables from customers and counterparties reflected client activity.
As of March 2016,2017, total liabilities onin our condensed consolidated statements of financial condition were $791.20$807.15 billion, an increase of $16.53$33.88 billion from December 2015, primarily2016, reflecting increases in financial instruments sold, but not yet purchased, at fair value of $11.77 billion and deposits of $7.35 billion, partially offset by a decrease in securities sold under agreements to repurchase, at fair value of $8.45$16.72 billion, unsecured long-term borrowings of $10.28 billion and payables to brokers, dealers and clearing organizations of $4.20 billion. During the first quarter of 2016, financial instruments sold, but not yet purchased, at fair value increased primarily due to the impact of movements in interest rates on derivative valuations and anThe increase in equities and convertible debentures related to market-making activity. Securitiessecurities sold under agreements to repurchase, at fair value decreased reflectingreflected the impact of firm and client activity.
| | | | |
| | Goldman Sachs March 2016 Form 10-Q | | 109 |
THE GOLDMAN SACHS GROUP, INC. AND SUBSIDIARIES
Management’s Discussion The increase in unsecured long-term borrowings was due to net new issuances. The increase in payables to brokers, dealers and Analysisclearing organizations reflected client activity.
As of March 20162017 and December 2015,2016, our total securities sold under agreements to repurchase, accounted for as collateralized financings, were $77.62$88.53 billion and $86.07$71.82 billion, respectively, which were 11% higher and 5% lower, and 3% higher, respectively, compared with the daily average amountsamount of repurchase agreements over the respective quarters. As of March 2016,2017, the decreaseincrease in our repurchase agreements relative to the daily average during the quarter resulted from the impact of firm and client activity at the end of the period.
The level of our repurchase agreements fluctuates between and within periods, primarily due to providing clients with access to highly liquid collateral, such as U.S. government and federal agency, and investment-grade sovereign obligations through collateralized financing activities.
| | | | |
| 106 | | Goldman Sachs March 2017 Form 10-Q | | |
THE GOLDMAN SACHS GROUP, INC. AND SUBSIDIARIES
Management’s Discussion and Analysis
The table below presents information about our assets, unsecured long-term borrowings, shareholders’ equity and leverage ratios.
| | | | As of | | | As of | |
| $ in millions | |
| March
2016 |
| |
| December
2015 |
| |
| March
2017 |
| |
| December
2016 |
|
Total assets | | | $878,036 | | | | $861,395 | | | | $894,069 | | | | $860,165 | |
| | | | | |
Unsecured long-term borrowings | | | $180,159 | | | | $175,422 | | | | $199,370 | | | | $189,086 | |
| | | | | |
Total shareholders’ equity | | | $ 86,837 | | | | $ 86,728 | | | | $ 86,917 | | | | $ 86,893 | |
| | | | | |
Leverage ratio | | | 10.1x | | | | 9.9x | | | | 10.3x | | | | 9.9x | |
| | | | | |
Debt to equity ratio | | | 2.1x | | | | 2.0x | | | | 2.3x | | | | 2.2x | |
In the table above:
The leverage ratio equals total assets divided by total shareholders’ equity and measures the proportion of equity and debt the firm is usingwe use to finance assets. This ratio is different from the Tier 1 leverage ratio included in Note 20 to the condensed consolidated financial statements.
The debt to equity ratio equals unsecured long-term borrowings divided by total shareholders’ equity.
The table below presents information about our shareholders’ equity and book value per common share, including the reconciliation of total shareholders’ equity to tangible common shareholders’ equity.
| | | | As of | | | As of | |
| $ in millions, except per share amounts | |
| March
2016 |
| |
| December
2015 |
| |
| March
2017 |
| |
| December
2016 |
|
Total shareholders’ equity | | | $ 86,837 | | | | $ 86,728 | | | | $ 86,917 | | | | $ 86,893 | |
| | | | | |
Less: Preferred stock | | | (11,203 | ) | | | (11,200 | ) | | | (11,203 | ) | | | (11,203 | ) |
Common shareholders’ equity | | | 75,634 | | | | 75,528 | | | | 75,714 | | | | 75,690 | |
| | | | | |
Less: Goodwill and identifiable intangible assets | | | (4,136 | ) | | | (4,148 | ) | | | (4,067 | ) | | | (4,095 | ) |
Tangible common shareholders’ equity | | | $ 71,498 | | | | $ 71,380 | | | | $ 71,647 | | | | $ 71,595 | |
Book value per common share | | | $ 173.00 | | | | $ 171.03 | | | | $ 184.98 | | | | $ 182.47 | |
| | | | | |
Tangible book value per common share | | | 163.54 | | | | 161.64 | | | | $ 175.05 | | | | $ 172.60 | |
In the table above:
Tangible common shareholders’ equity equals total shareholders’ equity less preferred stock, goodwill and identifiable intangible assets. We believe that tangible common shareholders’ equity is meaningful because it is a measure that we and investors use to assess capital adequacy. Tangible common shareholders’ equity is a non-GAAP measure and may not be comparable to similar non-GAAP measures used by other companies.
Book value per common share and tangible book value per common share are based on common shares outstanding including restricted stock units (RSUs)and RSUs granted to employees with no future service requirements (collectively, basic shares) of 437.2409.3 million and 441.6414.8 million as of March 20162017 and December 2015,2016, respectively. We believe that tangible book value per common share (tangible common shareholders’ equity divided by common shares outstanding, including RSUs granted to employees with no future service requirements)basic shares) is meaningful because it is a measure that we and investors use to assess capital adequacy. Tangible book value per common share is a non-GAAP measure and may not be comparable to similar non-GAAP measures used by other companies.
Funding Sources
Our primary sources of funding are secured financings, unsecured long-term and short-term borrowings, and deposits. We seek to maintain broad and diversified funding sources globally across products, programs, markets, currencies and creditors to avoid funding concentrations.
We raise funding through a number of different products, including:
Collateralized financings, such as repurchase agreements, securities loaned and other secured financings;
Long-term unsecured debt (including structured notes) through syndicated U.S. registered offerings, U.S. registered and Rule 144A medium-term note programs, offshore medium-term note offerings and other debt offerings;
Savings, and demand deposits through deposit sweep programs and time deposits through internal and third-party broker-dealers;broker-dealers, as well as from retail and institutional customers; and
Short-term unsecured debt at the subsidiary level through U.S. and non-U.S. hybrid financial instruments commercial paper issuances and other methods.
| | | | |
110 | | Goldman Sachs March 20162017 Form 10-Q | | 107 |
THE GOLDMAN SACHS GROUP, INC. AND SUBSIDIARIES
Management’s Discussion and Analysis
Our funding is primarily raised in U.S. dollar, Euro, British pound and Japanese yen. We generally distribute our funding products through our own sales force and third-party distributors to a large, diverse creditor base in a variety of markets in the Americas, Europe and Asia. We believe that our relationships with our creditors are critical to our liquidity. Our creditors include banks, governments, securities lenders, pension funds, insurance companies, mutual funds and individuals. We have imposed various internal guidelines to monitor creditor concentration across our funding programs.
Secured Funding. We fund a significant amount of inventory on a secured basis.basis, including repurchase agreements, securities loaned and other secured financings. As of March 2017 and December 2016, secured funding included in “Collateralized financings” in the condensed consolidated statements of financial condition was $120.61 billion and $100.86 billion, respectively. We may also pledge our inventory as collateral for securities borrowed under a securities lending agreement or as collateral for derivative transactions. We also use our own inventory to cover transactions in which we or our clients have sold securities that have not yet been purchased. Secured funding is less sensitive to changes in our credit quality than unsecured funding, due to our posting of collateral to our lenders. Nonetheless, we continually analyze the refinancing risk of our secured funding activities, taking into account trade tenors, maturity profiles, counterparty concentrations, collateral eligibility and counterparty rollover probabilities. We seek to mitigate our refinancing risk by executing term trades with staggered maturities, diversifying counterparties, raising excess secured funding, and pre-funding residual risk through our GCLA.
We seek to raise secured funding with a term appropriate for the liquidity of the assets that are being financed, and we seek longer maturities for secured funding collateralized by asset classes that may be harder to fund on a secured basis, especially during times of market stress. Substantially all of ourOur secured funding, excluding funding collateralized by liquid government obligations, is primarily executed for tenors of one month or greater. Assets that may be harder to fund on a secured basis during times of market stress include certain financial instruments in the following categories: mortgage and other asset-backed loans and securities, non-investment-grade corporate debt securities, equities and convertible debenturesequity securities and emerging market securities. Assets that are classified asin level 3 inof the fair value hierarchy are generally funded on an unsecured basis. See Notes 5 and 6 to the condensed consolidated financial statements for further information about the classification of financial instruments in the fair value hierarchy and “Unsecured Long-Term Borrowings” below for further information about the use of unsecured long-term borrowings as a source of funding.
The weighted average maturity of our secured funding included in “Collateralized financings” in the condensed consolidated statements of financial condition, excluding funding that can only be collateralized by highly liquid securities eligible for inclusion in our GCLA, exceeded 120 days as of March 2016.2017.
A majority of our secured funding for securities not eligible for inclusion in the GCLA is executed through term repurchase agreements and securities loaned contracts. We also raise financing through other types of collateralized financings, such as secured loans and notes. Goldman Sachs Bank USA (GS Bank USA) has access to funding from the Federal Home Loan Bank (FHLB).Bank. As of March 2016,2017, our outstanding borrowings against the FHLBFederal Home Loan Bank were $2.92$1.93 billion.
GS Bank USA also has access to funding through the Federal Reserve Bank discount window. While we do not rely on this funding in our liquidity planning and stress testing, we maintain policies and procedures necessary to access this funding and test discount window borrowing procedures.
Unsecured Long-Term Borrowings. We issue unsecured long-term borrowings as a source of funding for inventory and other assets and to finance a portion of our GCLA. We issue in different tenors, currencies and products to maximize the diversification of our investor base.
The table below presents our quarterly unsecured long-term borrowings maturity profile as of March 2016.2017.
| | $ in millions | |
| First
Quarter |
| |
| Second
Quarter |
| |
| Third
Quarter |
| |
| Fourth
Quarter |
| | | Total | | |
| First
Quarter |
| |
| Second
Quarter |
| |
| Third
Quarter |
| |
| Fourth
Quarter |
| | | Total | |
2017 | | | $ — | | | | $4,140 | | | | $6,061 | | | | $4,328 | | | | $ 14,529 | | |
| | | |
2018 | | | 8,534 | | | | 8,324 | | | | 4,855 | | | | 3,669 | | | | 25,382 | | | | $ — | | | | $9,056 | | | | $4,869 | | | | $ 6,321 | | | | $ 20,246 | |
| | | | | |
2019 | | | 6,797 | | | | 2,457 | | | | 2,342 | | | | 7,126 | | | | 18,722 | | | | $7,590 | | | | $6,059 | | | | $2,919 | | | | $10,222 | | | | 26,790 | |
| | | | | |
2020 | | | 4,616 | | | | 7,825 | | | | 5,696 | | | | 988 | | | | 19,125 | | | | $5,188 | | | | $7,538 | | | | $5,569 | | | | $ 3,454 | | | | 21,749 | |
| | | | | |
2021 | | | 2,699 | | | | 1,004 | | | | 5,334 | | | | 3,658 | | | | 12,695 | | | | $2,745 | | | | $3,558 | | | | $7,402 | | | | $ 7,264 | | | | 20,969 | |
| | | | | |
2022 - thereafter | | | | | | | | | | | 89,706 | | |
2022 | | | | $5,948 | | | | $5,685 | | | | $4,100 | | | | $ 990 | | | | 16,723 | |
| | | | |
2023 - thereafter | | | | | | | | | | | | 92,893 | |
Total | | | | | | | | | | | $180,159 | | | | | | | | | | | | $199,370 | |
The weighted average maturity of our unsecured long-term borrowings as of March 20162017 was approximately nineeight years. To mitigate refinancing risk, we seek to limit the principal amount of debt maturing on any one day or during any week or year. We enter into interest rate swaps to convert a majority of the amountportion of our unsecured long-term borrowings into floating-rate obligations in order to manage our exposure to interest rates. See Note 16 to the condensed consolidated financial statements for further information about our unsecured long-term borrowings.
| | | | |
| 108 | | Goldman Sachs March 20162017 Form 10-Q | | 111 |
THE GOLDMAN SACHS GROUP, INC. AND SUBSIDIARIES
Management’s Discussion and Analysis
Deposits. Our deposits provide us with a diversified source of liquidity and reduce our reliance on wholesale funding. A growing source of our deposit base is comprised of retail deposits. Deposits are primarily used to finance lending activity, other inventory and a portion of our GCLA. We raise deposits mainlyprimarily through GS Bank USA and Goldman Sachs International Bank (GSIB). The table below presentsAs of March 2017 and December 2016, our deposits were $127.93 billion and $124.10 billion, respectively. See Note 14 to the types and sources ofcondensed consolidated financial statements for further information about our deposits.
| | | | | | | | | | | | |
| $ in millions | |
| Savings and
Demand |
| | | Time | | | | Total | |
As of March 2016 | | | | | | | | | | | | |
Private bank deposits | | | $41,494 | | | | $ 2,405 | | | | $ 43,899 | |
| | |
Certificates of deposit | | | — | | | | 38,279 | | | | 38,279 | |
| | |
Deposit sweep programs | | | 15,613 | | | | — | | | | 15,613 | |
| | |
Institutional | | | 1 | | | | 7,074 | | | | 7,075 | |
Total | | | $57,108 | | | | $47,758 | | | | $104,866 | |
As of December 2015 | | | | | | | | | | | | |
Private bank deposits | | | $38,715 | | | | $ 2,354 | | | | $ 41,069 | |
| | |
Certificates of deposit | | | — | | | | 34,375 | | | | 34,375 | |
| | |
Deposit sweep programs | | | 15,791 | | | | — | | | | 15,791 | |
| | |
Institutional | | | 1 | | | | 6,283 | | | | 6,284 | |
Total | | | $54,507 | | | | $43,012 | | | | $ 97,519 | |
In the table above:
Savings and demand deposits have no stated maturity.
Time deposits have a weighted average maturity of approximately three years as of both March 2016 and December 2015.
Substantially all of the private bank deposits were from overnight deposit sweep programs related to private wealth management clients.
Deposit sweep programs represent long-term contractual agreements with several U.S. broker-dealers who sweep client cash to FDIC-insured deposits.
Deposits insured by the FDIC as of March 2016 and December 2015 were approximately $59.05 billion and $55.48 billion, respectively.
In April 2016, following regulatory approvals, GS Bank USA acquired GE Capital Bank’s online deposit platform and assumed approximately $16 billion of deposits, consisting of approximately $8 billion in online deposit accounts and certificates of deposit, and approximately $8 billion in brokered certificates of deposit.
Unsecured Short-Term Borrowings. A significant portion of our unsecured short-term borrowings was originally long-term debt that is scheduled to mature within one year of the reporting date. We use unsecured short-term borrowings, including hybrid financial instruments, to finance liquid assets and for other cash management purposes. We issue hybrid financial instruments and commercial paper. In light of regulatory developments, since the third quarter of 2015, Group Inc. has not issuedno longer issues debt with an original maturity of less than one year, and currently does not expectother than to issue short-term debt in the future.its subsidiaries.
As of March 20162017 and December 2015,2016, our unsecured short-term borrowings, including the current portion of unsecured long-term borrowings, were $46.69$35.87 billion and $42.79$39.27 billion, respectively. See Note 15 to the condensed consolidated financial statements for further information about our unsecured short-term borrowings.
Equity Capital Management and Regulatory Capital
Capital adequacy is of critical importance to us. We have in place a comprehensive capital management policy that provides a framework, defines objectives and establishes guidelines to assist us in maintaining the appropriate level and composition of capital in both business-as-usual and stressed conditions.
Equity Capital Management
We determine the appropriate level and composition of our equity capital by considering multiple factors including our current and future consolidated regulatory capital requirements, the results of our capital planning and stress testing process and other factors such as rating agency guidelines, subsidiary capital requirements, the business environment and conditions in the financial markets. We manage our capital requirements and the levels of our capital usage principally by setting limits on balance sheet assets and/or limits on risk, in each case at both the consolidated and business levels.
We principally manage the level and composition of our equity capital through issuances and repurchases of our common stock. We may also, from time to time, issue or repurchase our preferred stock, junior subordinated debt issued to trusts, and other subordinated debt or other forms of capital as business conditions warrant. Prior to any repurchases, we must receive confirmation that the Board of Governors of the Federal Reserve System (Federal Reserve Board) does not object to such capital actions.action. See Notes 16 and 19 to the condensed consolidated financial statements for further information about our preferred stock, junior subordinated debt issued to trusts and other subordinated debt.
Capital Planning and Stress Testing Process.As part of capital planning, we project sources and uses of capital given a range of business environments, including stressed conditions. Our stress testing process is designed to identify and measure material risks associated with our business activities including market risk, credit risk and operational risk, as well as our ability to generate revenues.
| | | | |
112 | | Goldman Sachs March 20162017 Form 10-Q | | 109 |
THE GOLDMAN SACHS GROUP, INC. AND SUBSIDIARIES
Management’s Discussion and Analysis
The following is a description of our capital planning and stress testing process:
Capital Planning. Our capital planning process incorporates an internal capital adequacy assessment with the objective of ensuring that we are appropriately capitalized relative to the risks in our business. We incorporate stress scenarios into our capital planning process with a goal of holding sufficient capital to ensure we remain adequately capitalized after experiencing a severe stress event. Our assessment of capital adequacy is viewed in tandem with our assessment of liquidity adequacy and is integrated into our overall risk management structure, governance and policy framework.
| | Our capital planning process also includes an internal risk-based capital assessment. This assessment incorporates market risk, credit risk and operational risk. Market risk is calculated by using Value-at-Risk (VaR) calculations supplemented by risk-based add-ons which include risks related to rare events (tail risks). Credit risk utilizes assumptions about our counterparties’ probability of default and the size of our losses in the event of a default. Operational risk is calculated based on scenarios incorporating multiple types of operational failures as well as considering internal and external actual loss experience. Backtesting for market risk and credit risk is used to gauge the effectiveness of models at capturing and measuring relevant risks. |
Stress Testing. Our stress tests incorporate our internally designed stress scenarios, including our internally developed severely adverse scenario, and those required under CCAR and DFAST, and are designed to capture our specific vulnerabilities and risks. We provide additional information about our stress test processes and a summary of the results on our web sitewebsite as described underin “Available Information” below.
As required by the Federal Reserve Board’s annual CCAR rules, we submit a capital plan for review by the Federal Reserve Board. The purpose of the Federal Reserve Board’s review is to ensure that we have a robust, forward-looking capital planning process that accounts for our unique risks and that permits continued operation during times of economic and financial stress.
The Federal Reserve Board evaluates us based, in part, on whether we have the capital necessary to continue operating under the baseline and stress scenarios provided by the Federal Reserve Board and those developed internally. This evaluation also takes into account our process for identifying risk, our controls and governance for capital planning, and our guidelines for making capital planning decisions. In addition, the Federal Reserve Board evaluates our plan to make capital distributions (i.e., dividend payments and repurchases or redemptions of stock, subordinated debt or other capital securities) and issue capital, across a range of macroeconomic scenarios and firm-specific assumptions.
In addition, the DFAST rules require us to conduct stress tests on a semi-annual basis and publish a summary of certain results. The Federal Reserve Board also conducts its own annual stress tests and publishes a summary of certain results.
We submittedWith respect to our initial 20152016 CCAR tosubmission, the Federal Reserve Board in January 2015 and, based on the Federal Reserve Board feedback, we submitted revised capital actions in March 2015. The Federal Reserve Board informed us that it did not object to our revised capital actions, including the potential repurchase of outstanding common stock, ana potential increase in our quarterly common stock dividend and the possible issuance, redemption and modification of other capital securities from the secondthird quarter of 20152016 through the second quarter of 2016.2017. We published a summary of our annual DFAST results in March 2015.June 2016. See “Available Information” below. We submitted our 20162017 CCAR in April 20162017 and expect to publish a summary of our annual DFAST results in June 2016.2017.
In addition, the rules adopted by the Federal Reserve Board under the Dodd-Frank Act require GS Bank USA to conduct stress tests on an annual basis and publish a summary of certain results. GS Bank USA submitted its 2015 annual DFAST stress results to the Federal Reserve Board in January 2015 and published a summary of its results in March 2015. See “Available Information” below. GS Bank USA submitted its 2016 annual DFAST results to the Federal Reserve Board in April 2016 and published a summary of its results in June 2016. See “Available Information” below. GS Bank USA submitted its 2017 annual DFAST results to the Federal Reserve Board in April 2017 and expects to publish a summary of its annual DFAST results in June 2016.2017.
| | | | |
| 110 | | Goldman Sachs March 2017 Form 10-Q | | |
THE GOLDMAN SACHS GROUP, INC. AND SUBSIDIARIES
Management’s Discussion and Analysis
Goldman Sachs International (GSI) also has its own capital planning and stress testing process, which incorporates internally designed stress tests and those required under the Prudential Regulation Authority’s (PRA) Internal Capital Adequacy Assessment Process.
| | | | |
| | Goldman Sachs March 2016 Form 10-Q | | 113 |
THE GOLDMAN SACHS GROUP, INC. AND SUBSIDIARIES
Management’s Discussion and Analysis
Contingency Capital Plan.As part of our comprehensive capital management policy, we maintain a contingency capital plan. Our contingency capital plan provides a framework for analyzing and responding to a perceived or actual capital deficiency, including, but not limited to, identification of drivers of a capital deficiency, as well as mitigants and potential actions. It outlines the appropriate communication procedures to follow during a crisis period, including internal dissemination of information as well as timely communication with external stakeholders.
Capital Attribution.We assess each of our businesses’ capital usage based upon our internal assessment of risks, which incorporates an attribution of all of our relevant regulatory capital requirements. These regulatory capital requirements are allocated using our attributed equity framework, which takes into consideration our binding capital constraints. We also attribute risk-weighted assets (RWAs) to our business segments. As of March 2016,2017, approximately two-thirds60% of RWAs calculated in accordance with the Standardized Capital Rules and the Basel III Advanced Rules, subject to transitional provisions, were attributed to our Institutional Client Services segment and substantially all of the remaining RWAs were attributed to our Investing & Lending segment. We manage the levels of our capital usage based upon balance sheet and risk limits, as well as capital return analyses of our businesses based on our capital attribution.
Share Repurchase Program. We use our share repurchase program to help maintain the appropriate level of common equity. The repurchase program is effected primarily through regular open-market purchases (which may include repurchase plans designed to comply with Rule 10b5-1), the amounts and timing of which are determined primarily by our current and projected capital position and our capital plan submitted to the Federal Reserve Board as part of CCAR. The amounts and timing of the repurchases may also be influenced by general market conditions and the prevailing price and trading volumes of our common stock.
As of March 2016,2017, the remaining share authorization under our existing repurchase program was 53.220.4 million shares;shares. On April 17, 2017, the Board of Directors of Group Inc. (Board) authorized the repurchase of an additional 50 million shares of common stock pursuant to the firm’s existing share repurchase program; however, we are only permitted to make repurchases to the extent that such repurchases have not been objected to by the Federal Reserve Board. See “Unregistered Sales of Equity Securities and Use of Proceeds” in Part II, Item 2 of the March 2016this Form 10-Q and Note 19 to the condensed consolidated financial statements for additional information about our share repurchase program and see above for information about our capital planning and stress testing process.
Resolution and Recovery Plans
We are required by the Federal Reserve Board and the FDIC to submit a periodic plan that describes our strategy for a rapid and orderly resolution in the event of material financial distress or failure (resolution plan). We are also required by the Federal Reserve Board to submit and have submitted, on a periodic basis, a global recovery plan that outlines the steps that management could take to reduce risk, maintain sufficient liquidity, and conserve capital in times of prolonged stress.
In April 2016, the Federal Reserve Board and the FDIC provided feedback on the 2015 resolution plans of eight systemically important domestic banking institutions and provided guidance related to the 2017 resolution plan submissions. OurWhile our plan was not jointly found to be deficient (i.e., non-credible or to not facilitate an orderly resolution under the U.S. bankruptcy code. WhileBankruptcy Code), the FDIC identified deficiencies and noted that it found that our plan was not credible or would not facilitate an orderly resolution underboth the U.S. bankruptcy code, theFDIC and Federal Reserve Board did not identify any such deficiencies.also identified certain shortcomings. In response to the feedback received, in September 2016, we must (i) submit by October 1, 2016submitted a status report on our actions to address jointthese shortcomings identified by the agencies and a separate public section that explains these actions, at a high level, the actions welevel. Our 2017 resolution plan, to takewhich is due by July 1, 2017, is also required to address the joint shortcomings and (ii) submit our resolution plan, due on July 1, 2017, addressing the joint shortcomings and takingtake into account the additional guidance.
In addition, GS Bank USA is required to submit a resolution plan to the FDIC and, accordingly, submitted its 2015 resolution plan on September 1, 2015. GS Bank USA has not yet received supervisory feedback on its 2015 resolution plan. The submission dates forIn July 2016, GS Bank USA’sUSA received notification from the FDIC that its resolution plan submission date was extended to October 1, 2017 and the 2016 andresolution plan requirement will be satisfied by the submission of the 2017 resolution plans are yet to be confirmed by the FDIC.plan.
| | | | |
| | Goldman Sachs March 2017 Form 10-Q | | 111 |
THE GOLDMAN SACHS GROUP, INC. AND SUBSIDIARIES
Management’s Discussion and Analysis
Rating Agency Guidelines
The credit rating agencies assign credit ratings to the obligations of Group Inc., which directly issues or guarantees substantially all of the firm’sour senior unsecured obligations. Goldman Sachs & Co. LLC, formerly Goldman, Sachs & Co. (GS&Co.), and GSI have been assigned long- and short-term issuer ratings by certain credit rating agencies. GS Bank USA and GSIB have also been assigned long- and short-term issuer ratings, as well as ratings on their long-term and short-term bank deposits. In addition, credit rating agencies have assigned ratings to debt obligations of certain other subsidiaries of Group Inc.
| | | | |
114 | | Goldman Sachs March 2016 Form 10-Q | | |
THE GOLDMAN SACHS GROUP, INC. AND SUBSIDIARIES
Management’s Discussion and Analysis
The level and composition of our equity capital are among the many factors considered in determining our credit ratings. Each agency has its own definition of eligible capital and methodology for evaluating capital adequacy, and assessments are generally based on a combination of factors rather than a single calculation. See “Liquidity Risk Management — Credit Ratings” for further information about credit ratings of Group Inc., GS Bank USA, GSIB, GS&Co. and GSI.
Consolidated Regulatory Capital
We are subject to the Federal Reserve Board’s revised risk-based capital and leverage regulations, subject to certain transitional provisions (Revised Capital Framework). These regulations are largely based on the Basel Committee on Banking Supervision’s (Basel Committee) final capital framework for strengthening international capital standards (Basel III) and also implement certain provisions of the Dodd-Frank Act. Under the Revised Capital Framework, we are an “Advanced approach” banking organization.
We calculate our Common Equity Tier 1 (CET1), Tier 1 capital and Total capital ratios in accordance with (i) the Standardized approach and market risk rules set out in the Revised Capital Framework (together, the Standardized Capital Rules) and (ii) the Advanced approach and market risk rules set out in the Revised Capital Framework (together, the Basel III Advanced Rules) as described in Note 20 to the condensed consolidated financial statements. The lower of each ratio calculated in (i) and (ii) is the ratio against which our compliance with minimum ratio requirements is assessed. Each of the ratios calculated in accordance with the Basel III Advanced Rules was lower than that calculated in accordance with the Standardized Capital Rules and therefore the Basel III Advanced ratios were the ratios that applied to us as of March 20162017 and December 2015.2016.
See Note 20 to the condensed consolidated financial statements for further information about our capital ratios as of March 20162017 and December 2015,2016, and for additional information about the Revised Capital Framework.
Minimum Capital Ratios and Capital Buffers
The table below presents our minimum required ratios as of March 2016,2017, as well as the estimated minimum ratios that we expect will apply at the end of the transitional provisions beginning January 2019.
| | | | | | | | |
| | |
| March 2016
Minimum Ratio |
| |
| January 2019
Estimated Minimum Ratio |
|
CET1 ratio | | | 5.875% | | | | 9.5% | |
| | |
Tier 1 capital ratio | | | 7.375% | | | | 11.0% | |
| | |
Total capital ratio | | | 9.375% | 1 | | | 13.0% | |
| | |
Tier 1 leverage ratio | | | 4.000% | | | | 4.0% | |
1. | In order to meet the quantitative requirements for being “well-capitalized” under the Federal Reserve Board’s regulations, we must meet a higher required minimum Total capital ratio of 10.0%.
|
| | | | | | | | |
| | |
| March 2017
Minimum Ratio |
| |
| January 2019
Estimated Minimum Ratio |
|
CET1 ratio | | | 7.000% | | | | 9.5% | |
| | |
Tier 1 capital ratio | | | 8.500% | | | | 11.0% | |
| | |
Total capital ratio | | | 10.500% | | | | 13.0% | |
| | |
Tier 1 leverage ratio | | | 4.000% | | | | 4.0% | |
In the table above:
The minimum capital ratios as of March 20162017 reflect (i) the 25%50% phase-in of the capital conservation buffer (0.625%(1.25%), (ii) the 25%50% phase-in of the Global Systemically Important Bank(G-SIB) buffer (0.75%(1.25%), and (iii) the counter-cyclicalcountercyclical capital buffer of zero percent.
The estimated minimum capital ratios as of January 2019 reflect (i) the fully phased-in capital conservation buffer (2.5%), (ii) the fully phased-in G-SIB buffer (2.5%), and (iii) the counter-cyclicalcountercyclical capital buffer of zero percent. TheG-SIB buffer of 2.5% is estimated based on 20152016 financial data, a reduction from the 3.0% buffer effective January 1, 2016.data. The ultimateG-SIB buffer and countercyclical buffers in the future may differ from this estimatethese estimates due to additional guidance from our regulators and/or positional changes. As a result, the minimum ratios, which we are subject to as of January 1, 2019, could be higher than the amounts presented in the table above.
Tier 1 leverage ratio is defined as Tier 1 capital divided by quarterly average adjusted total assets (which includes adjustments for goodwill and identifiable intangible assets, and certain investments in nonconsolidated financial institutions).
See Note 20 to the condensed consolidated financial statements for information about the capital conservation buffer, the current G-SIB buffer and the counter-cyclicalcountercyclical capital buffer.
Our regulators could change these buffers in the future, specifically as it relates to the counter-cyclical capital buffer as certain aspects are still being finalized by the Federal Reserve Board. As a result, the minimum ratios we are subject to as of January 1, 2019 could be higher than the amounts presented in the table above.
Our minimum required supplementary leverage ratio will be 5.0% on January 1, 2018. See “Supplementary Leverage Ratio” below for further information.
| | | | |
| 112 | | Goldman Sachs March 20162017 Form 10-Q | | 115 |
THE GOLDMAN SACHS GROUP, INC. AND SUBSIDIARIES
Management’s Discussion and Analysis
Fully Phased-in Capital Ratios
The table below presents our capital ratios calculated in accordance with the Standardized Capital Rules and the Basel III Advanced Rules on a fully phased-in basis.
| | | | As of | | | As of | |
| $ in millions | |
| March
2016 |
| |
| December
2015 |
| |
| March
2017 |
| |
| December
2016 |
|
Common shareholders’ equity | | | $ 75,634 | | | | $ 75,528 | | | | $ 75,714 | | | $ 75,690 | |
| | | | | |
Deductions for goodwill and identifiable intangible assets, net of deferred
tax liabilities | | | (3,035 | ) | | | (3,044 | ) | | | (2,988 | ) | | (3,015 | ) |
| | | | | |
Deductions for investments in nonconsolidated financial institutions | | | (1,741 | ) | | | (2,274 | ) | | | (603 | ) | | (765 | ) |
| | | | | |
Other adjustments | | | (1,466 | ) | | | (1,409 | ) | | | (700 | ) | | (799 | ) |
Total Common Equity Tier 1 | | | 69,392 | | | | 68,801 | | | | 71,423 | | | 71,111 | |
Perpetual non-cumulative preferred stock | | | 11,203 | | | | 11,200 | | |
Preferred stock | | | | 11,203 | | | 11,203 | |
| | | | | |
Deduction for investments in covered funds | | | (414 | ) | | | (413 | ) | | | (328 | ) | | (445 | ) |
| | | | | |
Other adjustments | | | (77 | ) | | | (128 | ) | | | (59 | ) | | (61 | ) |
Tier 1 capital | | | $ 80,104 | | | | $ 79,460 | | | | $ 82,239 | | | $ 81,808 | |
Standardized Tier 2 and total capital | | | | | |
Standardized Tier 2 and Total capital | | | | | |
Tier 1 capital | | | $ 80,104 | | | | $ 79,460 | | | | $ 82,239 | | | $ 81,808 | |
| | | | | |
Qualifying subordinated debt | | | 14,939 | | | | 15,132 | | | | 14,336 | | | 14,566 | |
| | | | | |
Allowance for losses on loans and
lending commitments | | | 703 | | | | 602 | | | | 791 | | | 722 | |
| | | | | |
Other adjustments | | | (17 | ) | | | (19 | ) | | | (6 | ) | | (6 | ) |
Standardized Tier 2 capital | | | 15,625 | | | | 15,715 | | | | 15,121 | | | 15,282 | |
Standardized total capital | | | $ 95,729 | | | | $ 95,175 | | |
Basel III Advanced Tier 2 and total capital | | | | | |
Standardized Total capital | | | | $ 97,360 | | | $ 97,090 | |
Basel III Advanced Tier 2 and Total capital | | | | | |
Tier 1 capital | | | $ 80,104 | | | | $ 79,460 | | | | $ 82,239 | | | $ 81,808 | |
| | | | | |
Standardized Tier 2 capital | | | 15,625 | | | | 15,715 | | | | 15,121 | | | 15,282 | |
| | | | | |
Allowance for losses on loans and
lending commitments | | | (703 | ) | | | (602 | ) | | | (791 | ) | | (722 | ) |
Basel III Advanced Tier 2 capital | | | 14,922 | | | | 15,113 | | | | 14,330 | | | 14,560 | |
Basel III Advanced total capital | | | $ 95,026 | | | | $ 94,573 | | |
Basel III Advanced Total capital | | | | $ 96,569 | | | $ 96,368 | |
RWAs | | | | | | | | |
Standardized | | | $539,798 | | | | $534,135 | | | | $521,263 | | | $507,807 | |
| | | | | |
Basel III Advanced | | | 593,608 | | | | 587,319 | | | | $572,312 | | | $560,786 | |
CET1 ratio | | | | | | | | |
Standardized | | | 12.9% | | | | 12.9% | | | | 13.7% | | | 14.0% | |
| | | | | |
Basel III Advanced | | | 11.7% | | | | 11.7% | | | | 12.5% | | | 12.7% | |
Tier 1 capital ratio | | | | | | | | |
Standardized | | | 14.8% | | | | 14.9% | | | | 15.8% | | | 16.1% | |
| | | | | |
Basel III Advanced | | | 13.5% | | | | 13.5% | | | | 14.4% | | | 14.6% | |
Total capital ratio | | | | | | | | |
Standardized | | | 17.7% | | | | 17.8% | | | | 18.7% | | | 19.1% | |
| | | | | |
Basel III Advanced | | | 16.0% | | | | 16.1% | | | | 16.9% | | | 17.2% | |
Although the fully phased-in capital ratios are not applicable until 2019, we believe that the ratios in the table above are meaningful because they are measures that we, our regulators and investors use to assess our ability to meet future regulatory capital requirements. The fully phased-in Basel III Advanced and Standardized capital ratios are non-GAAP measures and may not be comparable to similar non-GAAP measures used by other companies. These ratios are based on our current interpretation, expectations and understanding of the Revised Capital Framework and may evolve as we discuss itsthe interpretation and application of this framework with our regulators.
In the table above:
The deductions for goodwill and identifiable intangible assets, net of deferred tax liabilities, include goodwill of $3.66 billion and $3.67 billion as of March 20162017 and December 20152016, respectively, and identifiable intangible assets of $477$403 million and $491$429 million as of March 20162017 and December 2015,2016, respectively, net of associated deferred tax liabilities of $1.10$1.08 billion as of both March 20162017 and December 2015.2016.
The deductions for investments in nonconsolidated financial institutions represent the amount by which our investments in the capital of nonconsolidated financial institutions exceed certain prescribed thresholds. The decrease from December 20152016 to March 20162017 primarily reflects reductions in our fund investments.
The deduction for investments in covered funds represents our aggregate investments in applicable covered funds, as permitted by the Volcker Rule, that were purchased after December 2013. Substantially all of these investments in covered funds were purchased in connection with our market-making activities. This deduction was not subject to a transition period. See “Regulatory Developments” below for further information about the Volcker Rule.
Other adjustments within CET1 primarily include the overfunded portion of our defined benefit pension plan obligation net of associated deferred tax liabilities, disallowed deferred tax assets, credit valuation adjustments on derivative liabilities, debt valuation adjustments and other required credit risk-based deductions.
Qualifying subordinated debt representsis subordinated debt issued by Group Inc. with an original term to maturity of five years or greater. The outstanding amount of subordinated debt qualifying for Tier 2 capital is reduced upon reaching a remaining maturity of five years. See Note 16 to the condensed consolidated financial statements for additional information about our subordinated debt.
See Note 20 to the condensed consolidated financial statements for information about our transitional capital ratios, which represent the ratios that are applicable to us as of March 20162017 and December 2015.2016.
| | | | |
116 | | Goldman Sachs March 20162017 Form 10-Q | | 113 |
THE GOLDMAN SACHS GROUP, INC. AND SUBSIDIARIES
Management’s Discussion and Analysis
Supplementary Leverage Ratio
The Revised Capital Framework includes a supplementary leverage ratio requirement for Advanced approach banking organizations. Under amendments to the Revised Capital Framework, the U.S. federal bank regulatory agencies approved a final rule that implements the supplementary leverage ratio aligned with the definition of leverage established by the Basel Committee. The supplementary leverage ratio compares Tier 1 capital to a measure of leverage exposure, defined aswhich consists of total daily average assets for the quarter less certain deductions plusand certain off-balance-sheet exposures including(which include a measure of derivatives exposures and commitments.commitments), less certain balance sheet deductions. The Revised Capital Framework requires a minimum supplementary leverage ratio of 5.0% (comprised of the minimum requirement of 3.0% and a 2.0% buffer) for U.S. bank holding companies deemed to be G-SIBs, effective on January 1, 2018.
As of March 20162017 and December 2015,2016, our supplementary leverage ratio was 6.0%6.4% and 5.9%6.4%, respectively, based on Tier 1 capital on a fully phased-in basis of $80.10$82.24 billion and $79.46$81.81 billion, respectively, divided by total leverage exposure of $1.33$1.28 trillion (total(consists of total daily average assets for the quarter of $875 billion and certain off-balance-sheet exposures of $410 billion, less certain balance sheet deductions of $5 billion) and $1.27 trillion (consists of total daily average assets for the quarter of $884 billion plus adjustmentsand certain off-balance-sheet exposures of $448 billion) and $1.34 trillion (total daily average assets for the quarter$392 billion, less certain balance sheet deductions of $878 billion plus adjustments of $465$5 billion), respectively. Within total leverage exposure, the adjustments to quarterly average assets in both periods were primarily comprised of off-balance-sheet exposures related to derivatives, secured financing transactions, commitments and guarantees.
This supplementary leverage ratio is based on our current interpretation and understanding of the U.S. federal bank regulatory agencies’ final rule and may evolve as we discuss itsthe interpretation and application of this rule with our regulators. See “Regulatory Developments” below for information about the Basel Committee’s proposal on the supplementary leverage ratio.
Subsidiary Capital Requirements
Many of our subsidiaries, including GS Bank USA and our broker-dealer subsidiaries, are subject to separate regulation and capital requirements of the jurisdictions in which they operate.
GS Bank USA. GS Bank USA is subject to regulatory capital requirements that are calculated in substantially the same manner as those applicable to bank holding companies and calculates its capital ratios in accordance with the risk-based capital and leverage requirements applicable to state member banks, which are based on the Revised Capital Framework. See Note 20 to the condensed consolidated financial statements for further information about the Revised Capital Framework as it relates to GS Bank USA, including GS Bank USA’s capital ratios and required minimum ratios.
In addition, under Federal Reserve Board rules, commencing on January 1, 2018, in order to be considered a “well-capitalized” depository institution, GS Bank USA must have a supplementary leverage ratio of 6.0% or greater. The supplementary leverage ratio compares Tier 1 capital to a measure of leverage exposure, defined as total daily average assets for the quarter less certain deductions plusand certain off-balance-sheet exposures including(which include a measure of derivatives exposures and commitments.commitments), less certain balance sheet deductions. As of March 2017 and December 2016, GS Bank USA’s supplementary leverage ratio was 7.1%7.3% and 7.3%, respectively, based on Tier 1 capital on a fully phased-in basis of $23.33$24.79 billion and $24.48 billion, respectively, divided by total leverage exposure of $327$341 billion (total(consists of total daily average assets for the quarter of $147$160 billion plus adjustmentsand certain off-balance-sheet exposures of $180 billion). As$181 billion, less certain balance sheet deductions of December 2015, GS Bank USA’s supplementary leverage ratio was 7.1%, based on Tier 1 capital on a fully phased-in basis$15 million) and $333 billion (consists of $23.02 billion, divided by total leverage exposure of $324 billion (total daily average assets for the quarter of $134$170 billion plus adjustmentsand certain off-balance-sheet exposures of $190 billion).$163 billion, less certain balance sheet deductions of $20 million), respectively. This supplementary leverage ratio is based on our current interpretation and understanding of this rule and may evolve as we discuss their interpretation and application with our regulators.
| | | | |
| 114 | | Goldman Sachs March 2017 Form 10-Q | | |
THE GOLDMAN SACHS GROUP, INC. AND SUBSIDIARIES
Management’s Discussion and Analysis
GSI. Our regulated U.K. broker-dealer, GSI, is one of our principal non-U.S. regulated subsidiaries and is regulated by the PRA and the Financial Conduct Authority. GSI is subject to the revised capital framework for European Union (EU)-regulatedE.U.-regulated financial institutions (the fourth EUprescribed in the E.U. Fourth Capital Requirements Directive (CRD IV) and EUthe E.U. Capital Requirements Regulation collectively known as “CRD IV”)(CRR). These capital regulations are largely based on Basel III.
| | | | |
| | Goldman Sachs March 2016 Form 10-Q | | 117 |
THE GOLDMAN SACHS GROUP, INC. AND SUBSIDIARIES
Management’s Discussion and Analysis
The table below presents GSI’s minimum required ratios.
| | | |
| March 2016
Minimum Ratio |
| |
| December 2015
Minimum Ratio |
| |
| March 2017
Minimum Ratio |
| |
| December 2016
Minimum Ratio |
|
CET1 ratio | | | 6.539% | | | | 6.1% | | | | 7.170% | | | | 6.549% | |
| | | | | | | |
Tier 1 capital ratio | | | 8.517% | | | | 8.2% | | | | 9.149% | | | | 8.530% | |
| | | | | | | |
Total capital ratio | | | 11.147% | | | | 10.9% | | | | 11.780% | | | | 11.163% | |
The minimum ratios in the table above incorporate capital guidance received from the PRA and could change in the future. GSI’s future capital requirements may also be impacted by developments such as the introduction of capital buffers as described above in “Minimum Capital Ratios and Capital Buffers.”
As of March 2016,2017, GSI had a CET1 ratio of 11.6%12.7%, a Tier 1 capital ratio of 11.6%12.7% and a Total capital ratio of 15.7%16.7%. Each of these ratios includes approximately 1820 basis points attributable to resultsprofit for the three months ended March 2016.2017. These ratios will be finalized upon the completion of GSI’s March 20162017 financial statements. As of December 2015,2016, GSI had a CET1 ratio of 12.9%, a Tier 1 capital ratio of 12.9% and a Total capital ratio of 17.6%17.2%.
CRD IV, as amended byIn November 2016, the European Commission Delegated Act (the Delegated Act), introducedproposed amendments to the CRR to implement a new3% minimum leverage ratio whichrequirement for certain E.U. financial institutions. This leverage ratio compares CRD IV’sthe CRR’s definition of Tier 1 capital to a measure of leverage exposure, defined as the sum of assets less Tier 1 capital deductions plus certain off-balance-sheet exposures including(which include a measure of derivatives exposures, securities financing transactions and commitments. The Delegated Act does not currently include a minimum leverage ratio requirement; however, the Basel Committee has proposed a minimum requirement of 3%.commitments), less Tier 1 capital deductions. Any required minimum ratio is expected to become effective for GSI onno earlier than January 1, 2018. As of March 20162017 and December 2015,2016, GSI had a leverage ratio of 3.4%3.7% and 3.6%3.8%, respectively. The ratio as of March 2017 includes approximately 6 basis points attributable to profit for the three months ended March 2017. This leverage ratio is based on our current interpretation and understanding of this rule and may evolve as we discuss itsthe interpretation and application of this rule with GSI’s regulators.
Other Subsidiaries. We expect that theThe capital requirements of several of our subsidiaries are likely tomay increase in the future due to the various developments arising from the Basel Committee, the Dodd-Frank Act, and other governmental entities and regulators. See Note 20 to the condensed consolidated financial statements for information about the capital requirements of our other regulated subsidiaries.
Subsidiaries not subject to separate regulatory capital requirements may hold capital to satisfy local tax and legal guidelines, rating agency requirements (for entities with assigned credit ratings) or internal policies, including policies concerning the minimum amount of capital a subsidiary should hold based on its underlying level of risk. In certain instances, Group Inc. may be limited in its ability to access capital held at certain subsidiaries as a result of regulatory, tax or other constraints. As of March 20162017 and December 2015,2016, Group Inc.’s equity investment in subsidiaries was $86.80$94.03 billion and $85.52$92.77 billion, respectively, compared with its total shareholders’ equity of $86.84$86.92 billion and $86.73$86.89 billion, respectively.
Our capital invested in non-U.S. subsidiaries is generally exposed to foreign exchange risk, substantially all of which is managed through a combination of derivatives and non-U.S. denominated debt. See Note 7 to the condensed consolidated financial statements for information about our net investment hedges, which are used to hedge this risk.
Guarantees of Subsidiaries. Group Inc. has guaranteed the payment obligations of GS&Co., and GS Bank USA, and Goldman Sachs Execution & Clearing, L.P. (GSEC), in each case subject to certain exceptions. In November 2008, Group Inc. contributed subsidiaries into GS Bank USA, and Group Inc. agreed to guarantee certain losses, including credit-related losses, relating to assets held by the contributed entities.
| | | | |
118 | | Goldman Sachs March 2016 Form 10-Q | | |
THE GOLDMAN SACHS GROUP, INC. AND SUBSIDIARIES
Management’s Discussion and Analysis
Regulatory Developments
Our businesses are subject to significant and evolving regulation. The Dodd-Frank Act, enacted in July 2010, significantly altered the financial regulatory regime within which we operate. In addition, other reforms have been adopted or are being considered by regulators and policy makers worldwide. We expect that the principal areas of impact from regulatory reform for us will be increased regulatory capital requirements and increased regulation and restriction on certain activities. However, givenGiven that many of the new and proposed rules are highly complex, the full impact of regulatory reform will not be known until the rules are implemented and market practices develop under the final regulations.
There has been increased regulation of, and limitations on, our activities, including the Dodd-Frank Act prohibition on “proprietary trading” and the limitation on the sponsorship of, and investment in, “covered funds” (as defined in the Volcker Rule). In addition, there is increased regulation of, and restrictions on, OTC derivatives markets and transactions, particularly related to swaps and security-based swaps.
| | | | |
| | Goldman Sachs March 2017 Form 10-Q | | 115 |
THE GOLDMAN SACHS GROUP, INC. AND SUBSIDIARIES
Management’s Discussion and Analysis
See “Business — Regulation” in Part I, Item 1 of the 20152016 Form 10-K for more information about the laws, rules and regulations and proposed laws, rules and regulations that apply to us and our operations. In addition, see Note 20 to the condensed consolidated financial statements for information about regulatory developments as they relate to our regulatory capital and leverage ratios.
Volcker Rule
The provisions of the Dodd-Frank Act referred to as the “Volcker Rule,”Rule” became effective in July 2015 (subject to a conformance period, as applicable). The Volcker Rule prohibits “proprietary trading,” but permits activities such as underwriting, market making and risk-mitigation hedging, requires an extensive compliance program and includes additional reporting and record keepingrecord-keeping requirements. The initial implementation of these rules did not have a material impact on our financial condition, results of operations or cash flows. However, the rule is highly complex, and its impact may change as market practices further develop.
In addition to the prohibition on proprietary trading, the Volcker Rule limits the sponsorship of, and investment in, covered funds by banking entities, including Group Inc. and its subsidiaries. It also limits certain types of transactions between us and our sponsored funds, similar to the limitations on transactions between depository institutions and their affiliates as described in “Business — Regulation” in Part I, Item 1 of the 20152016 Form 10-K. Covered funds include our private equity funds, certain of our credit and real estate funds, our hedge funds and certain other investment structures. The limitation on investments in covered funds requires us to reduce our investment in each such fund to 3% or less of the fund’s net asset value, and to reduce our aggregate investment in all such funds to 3% or less of our Tier 1 capital.
Our investments in applicable covered funds purchased after December 2013 are required to be deducted from Tier 1 capital. See “Fully“Equity Capital Management and Regulatory Capital — Fully Phased-in Capital Ratios” above for further information about our Tier 1 capital and the deduction for investments in covered funds.
Our current investment in funds at NAV is $6.18 billion. See Note 6 to the condensed consolidated financial statements for further information about our investment in funds at NAV and the extended conformance period under the Volcker Rule for legacy illiquid covered funds.
We will continue to manage and conform our existing interests in such funds, taking into account the extended conformance period under the Volcker Rule. We plan to continue to conduct our investing and lending activities in ways that are permissible under the Volcker Rule.
Our current investment in funds that are measured at NAV is $7.18 billion. In order to be compliant with the Volcker Rule, we will be required to reduce most of our interests in these funds by the end of the conformance period. See Note 6 to the condensed consolidated financial statements for further information about our investment in funds measured at NAV and the conformance period for covered funds.
Although our net revenues from our interests in private equity, credit, real estate and hedge funds may vary from period to period, our aggregate net revenues from these investments were approximately 3% and 5% of our aggregate total net revenues over the last 10 years and 5 years, respectively.
| | | | |
| | Goldman Sachs March 2016 Form 10-Q | | 119 |
THE GOLDMAN SACHS GROUP, INC. AND SUBSIDIARIES
Management’s Discussion and Analysis
Total Loss-Absorbing Capacity
In October 2015,December 2016, the Federal Reserve Board issuedadopted a proposedfinal rule, which would establish aestablishes new total loss-absorbing capacity (TLAC) requirementand related requirements for U.S. bank holding companies designated as G-SIBs. The TLAC proposalrule will be effective in January 2019, with no phase-in period, and has been designed so that, in the event of a G-SIB’s failure, there will be sufficient external loss-absorbing capacity available in order for authorities to implement an orderly resolution of the G-SIB. The proposal would require G-SIBs to maintain an amount of regulatory capital andrule (i) establishes minimum TLAC requirements, (ii) establishes minimum eligible long-term debt (i.e., debt that is unsecured, has a maturity greater than one year from issuancerequirements, (iii) prohibits certain holding company transactions and satisfies certain additional criteria) to cover a percentage of RWAs and/or leverage exposure (the denominator in the supplementary leverage ratio).
Under the proposed rule, eligible long-term debt would exclude, among other instruments, debt securities that permit acceleration for reasons other than insolvency or payment default, as well as structured notes, as defined in the TLAC proposal, and debt securities not governed by U.S. law. The senior long-term debt of U.S. G-SIBs, including Group Inc., typically permits acceleration for reasons other than insolvency or payment default, and therefore would not qualify as eligible long-term debt under the proposed rule.
The proposed rule would prohibit Group Inc., as a U.S. G-SIB, from (i) guaranteeing liabilities of subsidiaries that are subject to early termination provisions under certain conditions, (ii) incurring liabilities guaranteed by subsidiaries, (iii) issuing short-term debt, or (iv) entering into derivatives and certain other financial contracts with external counterparties. Additionally, the proposed rule would capcaps the amount of certainG-SIB liabilities of a U.S. G-SIB that are not eligible long-term debt. Finally, the proposed rule would require U.S. G-SIBs and other large banking entities to deduct from their own Tier 2 capital certain holdings in unsecured debt of other U.S. G-SIBs, as well as holdings of their own unsecured debt securities.
Under the proposal,We expect that we will be compliant with the TLAC requirements would phase in between 2019 and 2022. We are currently evaluatingby the impact of the proposed TLAC requirements.effective date. See “Business — Regulation” in Part I, Item 1 of the 20152016 Form 10-K for further information onabout the Federal Reserve Board’s proposed TLAC rule.
Other Regulatory Developments
In JanuarySeptember 2016, the Basel Committee finalized a revised framework for calculating minimum capital requirements for market risk. The revisions constitute a fundamental change tofinal margin rules issued by the calculation of both model-based and non-model-based components of market risk capital. The Basel Committee has set an effective date for first reporting under the revised framework of December 31, 2019. The U.S. federal bank regulatory agencies have not yet proposedand the CFTC for uncleared swaps became effective. These rules implementing these revisionswere effective for U.S. banking organizations. We are currently evaluatingvariation margin requirements in March 2017 and will phase in through September 2020 for initial margin requirements depending on the potential impactlevel of swaps, security-based swaps and/or exempt foreign exchange derivative transaction activity of the Basel Committee’s revised framework.
swap dealer and the relevant counterparty. The Basel Committee continues to consult on several potential changes to regulatory capital requirements that could impact our capital ratios in the future. In particular, the Basel Committee has issued consultation papers on, among other matters, revisions to the operational risk capital framework and several changes to the calculation of credit RWAs under both model-based and standardized approaches.
In April 2016, the Basel Committee issued a consultation paper proposing certain changes to the calculationfinal rules of the leverage ratio and raising the possibility of additional leverage ratioU.S. federal bank regulatory agencies generally apply to inter-affiliate transactions, with limited relief available from initial margin requirements for G-SIBs. U.S. G-SIBsaffiliates.
Under the CFTC final rules, inter-affiliate transactions are currently subjectexempt from initial margin requirements with certain exceptions but variation margin requirements still apply. We expect that our margin requirements will continue to a buffer onincrease as the minimum leverage ratio.rules phase in. Japanese regulators have implemented broadly similar rules and regulators in other major jurisdictions are expected to do so over the next several quarters.
See “Business — Regulation” in Part I, Item 1 of the 20152016 Form 10-K for further information onabout regulations that may impact us in the future.
| | | | |
120116 | | Goldman Sachs March 20162017 Form 10-Q | | |
THE GOLDMAN SACHS GROUP, INC. AND SUBSIDIARIES
Management’s Discussion and Analysis
Off-Balance-Sheet Arrangements
| | | | |
Off-Balance-Sheet Arrangements and Contractual Obligations | | | | |
Off-Balance-Sheet Arrangements
We have various types of off-balance-sheet arrangements that we enter into in the ordinary course of business. Our involvement in these arrangements can take many different forms, including:
Purchasing or retaining residual and other interests in special purpose entities such as mortgage-backed and other asset-backed securitization vehicles;
Holding senior and subordinated debt, interests in limited and general partnerships, and preferred and common stock in other nonconsolidated vehicles;
Entering into interest rate, foreign currency, equity, commodity and credit derivatives, including total return swaps;
Entering into operating leases; and
Providing guarantees, indemnifications, loan commitments, letters of credit and representations and warranties.
We enter into these arrangements for a variety of business purposes, including securitizations. The securitization vehicles that purchase mortgages, corporate bonds, and other types of financial assets are critical to the functioning of several significant investor markets, including the mortgage-backed and other asset-backed securities markets, since they offer investors access to specific cash flows and risks created through the securitization process.
We also enter into these arrangements to underwrite client securitization transactions; provide secondary market liquidity; make investments in performing and nonperforming debt, equity, real estate and other assets; provide investors with credit-linked and asset-repackaged notes; and receive or provide letters of credit to satisfy margin requirements and to facilitate the clearance and settlement process.
Our financial interests in, and derivative transactions with, such nonconsolidated entities are generally accounted for at fair value, in the same manner as our other financial instruments, except in cases where we apply the equity method of accounting.
The table below presents where information about our various off-balance-sheet arrangements may be found in the March 2016this Form 10-Q. In addition, see Note 3 to the condensed consolidated financial statements for information about our consolidation policies.
| | | | |
Type of Off-Balance-Sheet Arrangement | | | | Disclosure in Form 10-Q |
Variable interests and other obligations, including contingent obligations, arising from variable interests in nonconsolidated VIEs | | | | See Note 12 to the condensed consolidated financial statements. |
| |
Leases, letters of credit, and lending and other commitments | | | | See “Contractual Obligations” below and Note 18 to the condensed consolidated financial statements. |
| |
Guarantees | | | | See “Contractual Obligations” below and Note 18 to the condensed consolidated financial statements. |
| |
Derivatives | | | | See “Credit Risk Management — Credit Exposures — OTC Derivatives” below and Notes 4, 5, 7 and 18 to the condensed consolidated financial statements. |
Contractual Obligations
We have certain contractual obligations which require us to make future cash payments. These contractual obligations include our unsecured long-term borrowings, secured long-term financings, time deposits and contractual interest payments, all of which are included in our condensed consolidated statements of financial condition.
Our obligations to make future cash payments also include certain off-balance-sheet contractual obligations such as purchase obligations, minimum rental payments under noncancelable leases and commitments and guarantees.
| | | | |
| | | Goldman Sachs March 20162017 Form 10-Q | | 121117 |
THE GOLDMAN SACHS GROUP, INC. AND SUBSIDIARIES
Management’s Discussion and Analysis
The table below presents our contractual obligations, commitments and guarantees by type.
| | | | As of | | | As of | |
| $ in millions | |
| March
2016 |
| |
| December
2015 |
| |
| March
2017 |
| |
| December
2016 |
|
Amounts related to on-balance-sheet obligations | Amounts related to on-balance-sheet obligations | | Amounts related to on-balance-sheet obligations | |
Time deposits | | | $ 27,860 | | | | $ 25,748 | | | | $ 27,212 | | | | $ 27,394 | |
| | | | | |
Secured long-term financings | | | 11,026 | | | | 10,520 | | | | $ 11,127 | | | | $ 8,405 | |
| | | | | |
Unsecured long-term borrowings | | | 180,159 | | | | 175,422 | | | | $ 199,370 | | | | $189,086 | |
| | | | | |
Contractual interest payments | | | 58,763 | | | | 59,327 | | | | $ 54,827 | | | | $ 54,552 | |
| | | | | |
Subordinated liabilities issued by consolidated VIEs | | | 529 | | | | 501 | | |
Subordinated liabilities of consolidated VIEs | | | | $ 751 | | | | $ 584 | |
| | | | | |
Amounts related to off-balance-sheet arrangements | Amounts related to off-balance-sheet arrangements | | Amounts related to off-balance-sheet arrangements | |
Commitments to extend credit | | | 107,958 | | | | 117,158 | | | | $ 115,062 | | | | $112,056 | |
| | | | | |
Contingent and forward starting resale and securities borrowing agreements | | | 56,227 | | | | 28,874 | | | | $ 42,366 | | | | $ 25,348 | |
| | | | | |
Forward starting repurchase and secured
lending agreements | | | 12,622 | | | | 5,878 | | | | $ 17,827 | | | | $ 8,939 | |
| | | | | |
Letters of credit | | | 352 | | | | 249 | | | | $ 406 | | | | $ 373 | |
| | | | | |
Investment commitments | | | 4,407 | | | | 6,054 | | | | $ 8,602 | | | | $ 8,444 | |
| | | | | |
Other commitments | | | 5,201 | | | | 6,944 | | | | $ 4,848 | | | | $ 6,014 | |
| | | | | |
Minimum rental payments | | | 2,518 | | | | 2,575 | | | | $ 1,975 | | | | $ 1,941 | |
| | | | | |
Derivative guarantees | | | 1,037,964 | | | | 926,443 | | | | $1,063,476 | | | | $816,774 | |
| | | | | |
Securities lending indemnifications | | | 36,841 | | | | 31,902 | | | | $ 38,900 | | | | $ 33,403 | |
| | | | | |
Other financial guarantees | | | 3,877 | | | | 4,461 | | | | $ 3,764 | | | | $ 3,662 | |
The table below presents our contractual obligations, commitments and guarantees by period of expiration.
| | | | As of March 2016 | | | As of March 2017 | |
| $ in millions | |
| Remainder
of 2016 |
| |
| 2017 -
2018 |
| |
| 2019 -
2020 |
| |
| 2021 -
Thereafter |
| |
| Remainder
of 2017 |
| |
| 2018 -
2019 |
| |
| 2020 -
2021 |
| |
| 2022 -
Thereafter |
|
Amounts related to on-balance-sheet obligations | Amounts related to on-balance-sheet obligations | | Amounts related to on-balance-sheet obligations | |
Time deposits | | | $ — | | | | $ 9,387 | | | | $ 8,343 | | | | $ 10,130 | | | | $ — | | | | $ 11,299 | | | | $ 7,671 | | | | $ 8,242 | |
| | | | | |
Secured long-term financings | | | — | | | | 8,567 | | | | 1,725 | | | | 734 | | | | $ — | | | | $ 7,181 | | | | $ 1,746 | | | | $ 2,200 | |
| | | | | |
Unsecured long-term borrowings | | | — | | | | 39,911 | | | | 37,847 | | | | 102,401 | | | | $ — | | | | $ 47,036 | | | | $42,718 | | | | $109,616 | |
| | | | | |
Contractual interest payments | | | 4,567 | | | | 11,931 | | | | 8,786 | | | | 33,479 | | | | $ 4,707 | | | | $ 11,679 | | | | $ 8,719 | | | | $ 29,722 | |
| | | | | |
Subordinated liabilities issued by consolidated VIEs | | | — | | | | — | | | | — | | | | 529 | | |
Subordinated liabilities of consolidated VIEs | | | | $ — | | | | $ — | | | | $ — | | | | $ 751 | |
| | | | | |
Amounts related to off-balance-sheet arrangements | Amounts related to off-balance-sheet arrangements | | Amounts related to off-balance-sheet arrangements | |
Commitments to extend credit | | | 17,850 | | | | 27,839 | | | | 49,286 | | | | 12,983 | | | | $ 16,282 | | | | $ 26,912 | | | | $55,338 | | | | $ 16,530 | |
| | | | | |
Contingent and forward starting resale and securities borrowing agreements | | | 56,191 | | | | 36 | | | | — | | | | — | | | | $ 42,363 | | | | $ 3 | | | | $ — | | | | $ — | |
| | | | | |
Forward starting repurchase and secured lending agreements | | | 12,622 | | | | — | | | | — | | | | — | | | | $ 17,827 | | | | $ — | | | | $ — | | | | $ — | |
| | | | | |
Letters of credit | | | 174 | | | | 171 | | | | 3 | | | | 4 | | | | $ 184 | | | | $ 182 | | | | $ — | | | | $ 40 | |
| | | | | |
Investment commitments | | | 2,772 | | | | 420 | | | | 28 | | | | 1,187 | | | | $ 5,360 | | | | $ 612 | | | | $ 107 | | | | $ 2,523 | |
| | | | | |
Other commitments | | | 4,724 | | | | 351 | | | | 76 | | | | 50 | | | | $ 4,478 | | | | $ 311 | | | | $ 16 | | | | $ 43 | |
| | | | | |
Minimum rental payments | | | 242 | | | | 622 | | | | 490 | | | | 1,164 | | | | $ 233 | | | | $ 550 | | | | $ 395 | | | | $ 797 | |
| | | | | |
Derivative guarantees | | | 622,772 | | | | 266,094 | | | | 87,837 | | | | 61,261 | | | | $520,372 | | | | $386,607 | | | | $87,083 | | | | $ 69,414 | |
| | | | | |
Securities lending indemnifications | | | 36,841 | | | | — | | | | — | | | | — | | | | $ 38,900 | | | | $ — | | | | $ — | | | | $ — | |
| | | | | |
Other financial guarantees | | | 554 | | | | 1,359 | | | | 1,235 | | | | 729 | | | | $ 955 | | | | $ 676 | | | | $ 1,934 | | | | $ 199 | |
In the table above:
The “Remainder of 2016” column includes $2.54 billion of investment commitments to covered funds (as defined by the Volcker Rule) in excess of 3% of the fund’s net asset value. We expect that substantially all of these commitments will not be called. See Note 6 to the condensed consolidated financial statements for information about the Volcker Rule conformance period.
Obligations maturing within one year of our financial statement date or redeemable within one year of our financial statement date at the option of the holders are excluded as they are treated as short-term obligations.
Obligations that are repayable prior to maturity at our option are reflected at their contractual maturity dates and obligations that are redeemable prior to maturity at the option of the holders are reflected at the earliest dates such options become exercisable.
Amounts included in the table do not necessarily reflect the actual future cash flow requirements for these arrangements because commitments and guarantees represent notional amounts and may expire unused or be reduced or cancelled at the counterparty’s request.
Due to the uncertainty of the timing and amounts that will ultimately be paid, our liability for unrecognized tax benefits has been excluded. See Note 24 to the condensed consolidated financial statements for further information about our unrecognized tax benefits.
UnsecuredAs of March 2017, unsecured long-term borrowings includes $9.91$6.93 billion of adjustments to the carrying value of certain unsecured long-term borrowings resulting from the application of hedge accounting.
TheAs of March 2017, the aggregate contractual principal amount of secured long-term financings and unsecured long-term borrowings for which the fair value option was elected exceeded the related fair value by $618$177 million and $488 million,$1.44 billion, respectively.
Contractual interest payments represents estimated future interest payments related to unsecured long-term borrowings, secured long-term financings and time deposits based on applicable interest rates as of March 2016,2017, and includes stated coupons, if any, on structured notes.
See Notes 15 and 18 to the condensed consolidated financial statements for further information about our short-term borrowings, and commitments and guarantees, respectively.
| | | | |
122118 | | Goldman Sachs March 20162017 Form 10-Q | | |
THE GOLDMAN SACHS GROUP, INC. AND SUBSIDIARIES
Management’s Discussion and Analysis
As of March 2016,2017, our unsecured long-term borrowings were $180.16$199.37 billion, with maturities extending to 2061,2056, and consisted principally of senior borrowings. See Note 16 to the condensed consolidated financial statements for further information about our unsecured long-term borrowings.
As of March 2016,2017, our future minimum rental payments, net of minimum sublease rentals under noncancelable leases, were $2.52$1.98 billion. These lease commitments for office space expire on various dates through 2069. Certain agreements are subject to periodic escalation provisions for increases in real estate taxes and other charges. See Note 18 to the condensed consolidated financial statements for further information about our leases.
Our occupancy expenses include costs associated with office space held in excess of our current requirements. This excess space, the cost of which is charged to earnings as incurred, is being held for potential growth or to replace currently occupied space that we may exit in the future. We regularly evaluate our current and future space capacity in relation to current and projected staffing levels. During the three months ended March 2016,2017, total occupancy expenses for space held in excess of our current requirements and exit costs related to our office space were not material. We may incur exit costs in the future to the extent we (i) reduce our space capacity or (ii) commit to, or occupy, new properties in the locations in which we operate and, consequently, dispose of existing space that had been held for potential growth. These exit costs may be material to our results of operations in a given period.
Risk Management
Risks are inherent in our business and include liquidity, market, credit, operational, model, legal, regulatory and reputational risks. For further information about our risk management processes, see “— Overview and Structure of Risk Management” below. Our risks include the risks across our risk categories, regions or global businesses, as well as those which have uncertain outcomes and have the potential to materially impact our financial results, our liquidity and our reputation. For further information about our areas of risk, see “— Liquidity Risk Management,” “— Market Risk Management,” “— Credit Risk Management,” “— Operational Risk Management” and “— Model Risk Management” below and “Risk Factors” in Part I, Item 1A of the 20152016 Form 10-K.
| | | | |
| | Goldman Sachs March 2016 Form 10-Q | | 123 |
THE GOLDMAN SACHS GROUP, INC. AND SUBSIDIARIES
Management’s Discussion and Analysis
Overview and Structure of Risk Management
Management
Overview
We believe that effective risk management is of primary importance to the success of the firm.our success. Accordingly, we have comprehensive risk management processes through which we monitor, evaluate and manage the risks we assume in conducting our activities. These include liquidity, market, credit, operational, model, legal, compliance, regulatory and reputational risk exposures. Our risk management framework is built around three core components: governance, processes and people.
Governance. Risk management governance starts with ourthe Board, which plays an important role in reviewing and approving risk management policies and practices, both directly and through its committees, including its Risk Committee. The Board also receives regular briefings on firmwide risks, including market risk, liquidity risk, credit risk, operational risk and model risk from our independent control and support functions, including the chief risk officer, and on compliance risk from the head of Compliance, on legal and regulatory matters from the general counsel, and on other matters impacting our reputation from the chair of our Firmwide Client and Business Standards Committee. The chief risk officer, as part of the review of the firmwide risk portfolio, regularly advises the Risk Committee of the Board of relevant risk metrics and material exposures. Next, at theour most senior levels, of the firm, our leaders are experienced risk managers, with a sophisticated and detailed understanding of the risks we take. Our senior management, and senior managers in our revenue-producing units and independent control and support functions, lead and participate in risk-oriented committees. Independent control and support functions include Business Selection andCompliance, the Conflicts Resolution Group (Conflicts), Compliance, Controllers, Credit Risk Management and Advisory (Credit Risk Management), Human Capital Management, Legal, Liquidity Risk Management and Analysis (Liquidity Risk Management), Market Risk Management and Analysis (Market Risk Management), Model Risk Management, Operations, Operational Risk Management and Analysis (Operational Risk Management), Tax, Technology and Treasury.
Our governance structure provides the protocol and responsibility for decision-making on risk management issues and ensures implementation of those decisions. We make extensive use of risk-related committees that meet regularly and serve as an important means to facilitate and foster ongoing discussions to identify, manage and mitigate risks.
| | | | |
| | Goldman Sachs March 2017 Form 10-Q | | 119 |
THE GOLDMAN SACHS GROUP, INC. AND SUBSIDIARIES
Management’s Discussion and Analysis
We maintain strong communication about risk and we have a culture of collaboration in decision-making among the revenue-producing units, independent control and support functions, committees and senior management. While we believe that the first line of defense in managing risk rests with the managers in our revenue-producing units, we dedicate extensive resources to independent control and support functions in order to ensure a strong oversight structure and an appropriate segregation of duties. We regularly reinforce our strong culture of escalation and accountability across all divisions and functions.
Processes. We maintain various processes and procedures that are critical components of our risk management. First and foremost is our daily discipline of marking substantially all of our inventory to current market levels. Goldman Sachs carries itsWe carry our inventory at fair value, with changes in valuation reflected immediately in our risk management systems and in net revenues. We do so because we believe this discipline is one of the most effective tools for assessing and managing risk and that it provides transparent and realistic insight into our financial exposures.
We also apply a rigorous framework of limits to control risk across multiple transactions, products, businesses and markets. This includes approval of limits at both firmwide, business and businessproduct levels by the Risk Committee of the Board. In addition, the Firmwide Risk Committee is responsible for approving our risk limits framework, subject to the overall limits approved by the Risk Committee of the Board, at a variety of levels and monitoring these limits on a daily basis. Divisional risk committees are responsible for setting sub-limits below the overall business-level limits approved byThe Risk Governance Committee (through delegated authority from the Firmwide Risk Committee. Limits are typicallyCommittee) is responsible for approving limits at firmwide, business and product levels. Certain limits may be set at levels that will be periodically exceeded,require periodic adjustment, rather than at levels which reflect our maximum risk appetite. This fosters an ongoing dialogue on risk among revenue-producing units, independent control and support functions, committees and senior management, as well as rapid escalation of risk-related matters. See “Liquidity Risk Management,” “Market Risk Management” and “Credit Risk Management” for further information about our risk limits.
| | | | |
124 | | Goldman Sachs March 2016 Form 10-Q | | |
THE GOLDMAN SACHS GROUP, INC. AND SUBSIDIARIES
Management’s Discussion and Analysis
Active management of our positions is another important process. Proactive mitigation of our market and credit exposures minimizes the risk that we will be required to take outsized actions during periods of stress.
We also focus on the rigor and effectiveness of our risk systems. The goal of our risk management technology is to get the right information to the right people at the right time, which requires systems that are comprehensive, reliable and timely. We devote significant time and resources to our risk management technology to ensure that it consistently provides us with complete, accurate and timely information.
People. Even the best technology serves only as a tool for helping to make informed decisions in real time about the risks we are taking. Ultimately, effective risk management requires our people to interpret our risk data on an ongoing and timely basis and adjust risk positions accordingly. In both our revenue-producing units and our independent control and support functions, the experience of our professionals, and their understanding of the nuances and limitations of each risk measure, guide us in assessing exposures and maintaining them within prudent levels.
We reinforce a culture of effective risk management in our training and development programs as well as the way we evaluate performance, and recognize and reward our people. Our training and development programs, including certain sessions led by our most senior leaders, are focused on the importance of risk management, client relationships and reputational excellence. As part of our annual performance review process, we assess reputational excellence including how an employee exercises good risk management and reputational judgment, and adheres to our code of conduct and compliance policies. Our review and reward processes are designed to communicate and reinforce to our professionals the link between behavior and how people are recognized, the need to focus on our clients and our reputation, and the need to always act in accordance with theour highest standards of the firm.standards.
| | | | |
| 120 | | Goldman Sachs March 2017 Form 10-Q | | |
THE GOLDMAN SACHS GROUP, INC. AND SUBSIDIARIES
Management’s Discussion and Analysis
Structure
Ultimate oversight of risk is the responsibility of our Board. The Board oversees risk both directly and through its committees, including its Risk Committee. Within the firm,We have a series of committees with specific risk management mandates that have oversight or decision-making responsibilities for risk management activities. Committee membership generally consists of senior managers from both our revenue-producing units and our independent control and support functions. We have established procedures for these committees to ensure that appropriate information barriers are in place. Our primary risk committees, most of which also have additional sub-committees or working groups, are described below. In addition to these committees, we have other risk-oriented committees which provide oversight for different businesses, activities, products, regions and legal entities. All of our firmwide, regional and divisional committees have responsibility for considering the impact of transactions and activities which they oversee on our reputation.
Membership of our risk committees is reviewed regularly and updated to reflect changes in the responsibilities of the committee members. Accordingly, the length of time that members serve on the respective committees varies as determined by the committee chairs and based on the responsibilities of the members within the firm.members.
In addition, independent control and support functions, which report to the chief executive officer, the presidentpresidents and chiefco-chief operating officer,officers, the chief financial officer or the chief risk officer and the chief administrative officer, are responsible for day-to-day oversight or monitoring of risk, as illustrated in the chart below and as described in greater detail in the following sections. Internal Audit, which reports to the Audit Committee of the Board and includes professionals with a broad range of audit and industry experience, including risk management expertise, is responsible for independently assessing and validating key controls within the risk management framework.
| | | | |
| | Goldman Sachs March 2016 Form 10-Q | | 125 |
THE GOLDMAN SACHS GROUP, INC. AND SUBSIDIARIES
Management’s Discussion and Analysis
The chart below presents an overview of our risk management governance structure, highlightingincluding the
oversight reporting relationships of our Board, our key risk-related committees and the independence of our keyindependent control and support functions.
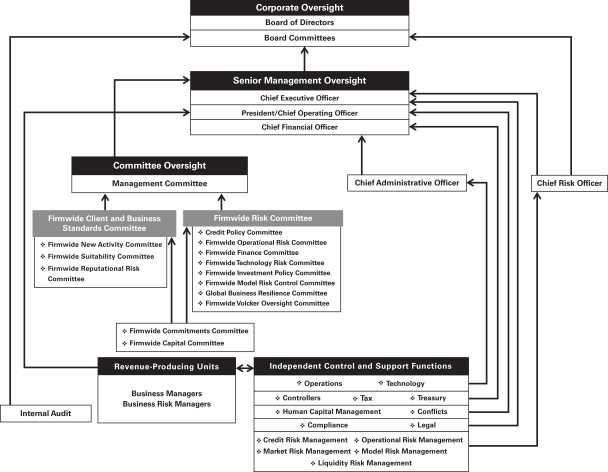
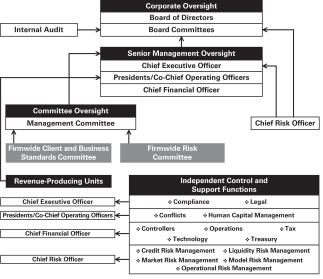
Management Committee. The Management Committee oversees our global activities, including all of our independent control and support functions. It provides this oversight directly and through authority delegated to committees it has established. This committee is comprised of our most senior leaders, and is chaired by our chief executive officer. The Management Committee has established various committees with delegated authority and the chair of the Management Committee appoints the chairs of these committees. Most members of the Management Committee are also members of other firmwide, divisional and regional committees. The following are the committees that are principally involved in firmwide risk management.
Firmwide Client and Business Standards Committee. The Firmwide Client and Business Standards Committee assesses and makes determinations regarding business standards and practices, reputational risk management, client relationships and client service, is chaired by one of our presidentpresidents and co-chief operating officers (who is appointed as chair by the chief operating officer,executive officer), and reports to the Management Committee. This committee also has responsibility for overseeing recommendations of the Business Standards Committee. This committee periodically updates and receives guidance from the Public Responsibilities Committee of the Board. This committee has also established certain committees that report to it, including divisional Client and Business Standards Committees and risk-related committees. The following are the risk-related committees that report to the Firmwide Client and Business Standards Committee:
| | | | |
126 | | Goldman Sachs March 20162017 Form 10-Q | | 121 |
THE GOLDMAN SACHS GROUP, INC. AND SUBSIDIARIES
Management’s Discussion and Analysis
The following are the risk-related committees that report to the Firmwide Client and Business Standards Committee:
Firmwide New Activity Committee. The Firmwide New Activity Committee is responsible for reviewing new activities and for establishing a process to identify and review previously approved activities that are significant and that have changed in complexity and/or structure or present different reputational and suitability concerns over time to consider whether these activities remain appropriate. This committee is co-chaired by our global treasurerthe head of product control and the chief administrative officerco-head of our Investment Management Division,Europe, Middle East and Africa (EMEA) FICC sales, who are appointed as co-chairs by the chair of the Firmwide Client and Business Standards Committee.
Firmwide Reputational Risk Committee. The Firmwide Reputational Risk Committee is responsible for assessing reputational risks arising from transactions that have been identified as requiring mandatory escalation to the Firmwide Reputational Risk Committee or that otherwise have potential heightened reputational risk. This committee is chaired by one of our presidents and co-chief operating officers (who is appointed as chair by the chief executive officer), and the vice-chairs are the head of Compliance and the head of the Conflicts Resolution Group, who are appointed as vice-chairs by the chair of the Firmwide Client and Business Standards Committee.
Firmwide Suitability Committee. The Firmwide Suitability Committee is responsible for setting standards and policies for product, transaction and client suitability and providing a forum for consistency across divisions, regions and products on suitability assessments. This committee also reviews suitability matters escalated from other committees. This committee is co-chaired by the deputy head of Compliance, and the chief strategy officer of the Securities Division and co-head of Fixed Income, Currency and Commodities Sales, who are appointed as co-chairs by the chair of the Firmwide Client and Business Standards Committee.
Firmwide Reputational Risk Committee. The Firmwide Reputational Risk Committee is responsible for assessing reputational risks arising from transactions that have been identified as presenting or likely to present heightened reputational risk, and other situations where the facts and circumstances warrant escalation. This committee is co-chaired by the head of Compliance and the head of Conflicts, who are appointed as co-chairs by the chair of the Firmwide Client and Business Standards Committee.
Firmwide Risk Committee. The Firmwide Risk Committee is globally responsible for the ongoing monitoring and management of our financial risks. Through both direct and delegated authority, theThe Firmwide Risk Committee approves firmwideour risk limits framework, metrics and business-level limits for both market and credit risks, approves sovereign credit risk limits,methodologies, reviews results of stress tests and scenario analyses, and provides oversight over model risk. This committee is co-chaired by our chief financial officer and our chief risk officer (who are appointed as co-chairs by the chief executive officer), and reports to the Management Committee. The following are the primary committees that report to the Firmwide Risk Committee:
Credit Policy Committee. The Credit Policy Committee establishes and reviews broad firmwide credit policies and parameters that are implemented by Credit Risk Management. This committee is co-chaired by a deputy chief risk officer and the head of Credit Risk Management for our Securities Division, who are appointed as co-chairs by our chief risk officer.
Firmwide Operational Risk Committee. The Firmwide Operational Risk Committee provides oversight of the ongoing development and implementation of our operational risk policies, framework and methodologies, and monitors the effectiveness of operational risk management. This committee is co-chaired by a managing director in Credit Risk Management and the head of Operational Risk Management, who are appointed as co-chairs by our chief risk officer.
Firmwide Finance Committee. The Firmwide Finance Committee has oversight responsibility for liquidity risk, the size and composition of our balance sheet and capital base, and credit ratings. This committee regularly reviews our liquidity, balance sheet, funding position and capitalization, approves related policies, and makes recommendations as to any adjustments to be made in light of current events, risks, exposures and regulatory requirements. As a part of such oversight, among other things, this committee reviews and approves balance sheet limits and the size of our GCLA. This committee is co-chaired by our chief financialrisk officer and our global treasurer, who are appointed as co-chairs by the Firmwide Risk Committee.
Firmwide Investment Policy Committee. The Firmwide Investment Policy Committee reviews, approves, sets policies, and provides oversight for certain illiquid principal investments, including review of risk management and controls for these types of investments. This committee is co-chaired by the head of our Merchant Banking Division, a co-head of our Securities Division and a deputy general counsel, who are appointed as co-chairs by our presidents and co-chief operating officers and our chief financial officer.
Firmwide Model Risk Control Committee. The Firmwide Model Risk Control Committee is responsible for oversight of the development and implementation of model risk controls, which includes governance, policies and procedures related to our reliance on financial models. This committee is chaired by a deputy chief risk officer, who is appointed as chair by the Firmwide Risk Committee.
Firmwide Operational Risk Committee. The Firmwide Operational Risk Committee provides oversight of the ongoing development and implementation of our operational risk policies, framework and methodologies, and monitors the effectiveness of operational risk management. This committee is co-chaired by managing directors in Credit Risk Management and Operational Risk Management, who are appointed as co-chairs by our chief risk officer.
| | | | |
| 122 | | Goldman Sachs March 2017 Form 10-Q | | |
THE GOLDMAN SACHS GROUP, INC. AND SUBSIDIARIES
Management’s Discussion and Analysis
Firmwide Technology Risk Committee. The Firmwide Technology Risk Committee reviews matters related to the design, development, deployment and use of technology. This committee oversees cyber security matters, as well as technology risk management frameworks and methodologies, and monitors their effectiveness. This committee is co-chaired by our chief information officer and the head of Global Investment Research, who are appointed as co-chairs by the Firmwide Risk Committee.
Firmwide Investment PolicyVolcker Oversight Committee.The Firmwide Investment PolicyVolcker Oversight Committee reviews, approves, sets policies,is responsible for the oversight and provides oversight for certain illiquid principal investments, includingperiodic review of risk managementthe implementation of our Volcker Rule compliance program, as approved by the Board, and controls for these types of investments.other Volcker Rule-related matters. This committee is co-chaired by a deputy chief risk officer and the deputy head of our Merchant Banking Division, a co-head of our Securities Division and a deputy general counsel,Compliance, who are appointed as co-chairs by our president and chief operating officer and our chief financial officer.
| | | | |
| | Goldman Sachs March 2016 Form 10-Q | | 127 |
THE GOLDMAN SACHS GROUP, INC. AND SUBSIDIARIES
Management’s Discussion and Analysis
Firmwide Model Risk Control Committee. The Firmwide Model Risk Control Committee is responsible for oversightthe co-chairs of the development and implementation of model risk controls, which includes governance, policies and procedures related to our reliance on financial models. This committee is chaired by a deputy chief risk officer, who is appointed as chair by the Firmwide Risk Committee.
Global Business Resilience Committee.The Global Business Resilience Committee is responsible for oversight of business resilience initiatives, promoting increased levels of security and resilience, and reviewing certain operating risks related to business resilience. This committee is chaired by our chief administrative officer, who is appointed as chair by the Firmwide Risk Committee.
Firmwide Volcker OversightRisk Governance Committee. The Risk Governance Committee (through delegated authority from the Firmwide Volcker Oversight CommitteeRisk Committee) is globally responsible for the oversightongoing approval and periodic reviewmonitoring of the implementation of our Volcker Rule compliance program, as approved by the Board,risk frameworks, policies, parameters and other Volcker Rule-related matters.limits, at firmwide, business and product levels. This committee is co-chairedchaired by our chief risk officer, and a deputy general counsel, who areis appointed as co-chairschair by the co-chairs of the Firmwide Risk Committee.
The following committees report jointly to the Firmwide Risk Committee and the Firmwide Client and Business Standards Committee:
Firmwide Capital Committee. The Firmwide Capital Committee provides approval and oversight of debt-related transactions, including principal commitments of our capital. This committee aims to ensure that business and reputational standards for underwritings and capital commitments are maintained on a global basis. This committee is co-chaired by the head of Credit Risk Management for our Investment Banking Division, Investment Management Division and Merchant Banking Division, and the head of the EMEA Financing Group. The co-chairs of the Firmwide Capital Committee are appointed by the co-chairs of the Firmwide Risk Committee.
Firmwide Commitments Committee. The Firmwide Commitments Committee reviews our underwriting and distribution activities with respect to equity and equity-related product offerings, and sets and maintains policies and procedures designed to ensure that legal, reputational, regulatory and business standards are maintained on a global basis. In addition to reviewing specific transactions, this committee periodically conducts general strategic reviews of sectors and products and establishes policies in connection with transaction practices. This committee is co-chaired by the co-headchairman of the Financial Institutions Group in our Investment Banking Division, an advisory director to the firm,co-head of the Industrials group in our Investment Banking Division, our chief underwriting officer, and a managing director in Risk Management, who are appointed as co-chairs by the chair of the Firmwide Client and Business Standards Committee.
Firmwide Capital Committee. The Firmwide Capital Committee provides approval and oversight of debt-related transactions, including principal commitments of our capital. This committee aims to ensure that business and reputational standards for underwritings and capital commitments are maintained on a global basis. This committee is co-chaired by the head of Credit Risk Management for our Investment Banking Division and our Merchant Banking Division and the head of credit finance for Europe, Middle East and Africa (EMEA). The co-chairs of the Firmwide Capital Committee are appointed by the co-chairs of the Firmwide Risk Committee.
Conflicts Management
Conflicts of interest and our approach to dealing with them are fundamental to our client relationships, our reputation and our long-term success. The term “conflict of interest” does not have a universally accepted meaning, and conflicts can arise in many forms within a business or between businesses. The responsibility for identifying potential conflicts, as well as complying with our policies and procedures, is shared by the entire firm.
We have a multilayered approach to resolving conflicts and addressing reputational risk. Our senior management oversees policies related to conflicts resolution, and, in conjunction with Conflicts, Legal and Compliance, the Firmwide Client and Business Standards Committee, and other internal committees, formulates policies, standards and principles, and assists in making judgments regarding the appropriate resolution of particular conflicts. Resolving potential conflicts necessarily depends on the facts and circumstances of a particular situation and the application of experienced and informed judgment.
As a general matter, Conflicts reviews all financing and advisory assignments in Investment Banking and certain of our investing, lending and other activities of the firm.activities. In addition, we have various transaction oversight committees, such as the Firmwide Capital, Commitments and Suitability Committees and other committees across the firm that also review new underwritings, loans, investments and structured products. These groups and committees work with internal and external counsel and Compliance to evaluate and address any actual or potential conflicts. Conflicts reports to one of our presidents and co-chief operating officers.
We regularly assess our policies and procedures that address conflicts of interest in an effort to conduct our business in accordance with the highest ethical standards and in compliance with all applicable laws, rules, and regulations.
| | | | |
128 | | Goldman Sachs March 20162017 Form 10-Q | | 123 |
THE GOLDMAN SACHS GROUP, INC. AND SUBSIDIARIES
Management’s Discussion and Analysis
Liquidity Risk Management
Overview
Liquidity risk is the risk that we will be unable to fund the firm or meet our liquidity needs in the event of firm-specific, broader industry, or market liquidity stress events. Liquidity is of critical importance to us, as most of the failures of financial institutions have occurred in large part due to insufficient liquidity. Accordingly, we have in place a comprehensive and conservative set of liquidity and funding policies. Our principal objective is to be able to fund the firm and to enable our core businesses to continue to serve clients and generate revenues, even under adverse circumstances.
Treasury has the primary responsibility for assessing, monitoring and managing our liquidity and funding strategy. Treasury is independent of the revenue-producing units and reports to our chief financial officer.
Liquidity Risk Management is an independent risk management function responsible for control and oversight of the firm’sour liquidity risk management framework, including stress testing and limit governance. Liquidity Risk Management is independent of the revenue-producing units and Treasury, and reports to our chief risk officer.
Liquidity Risk Management Principles
We manage liquidity risk according to three principles (i) hold sufficient excess liquidity in the form of Global Core Liquid Assets (GCLA)GCLA to cover outflows during a stressed period, (ii) maintain appropriate Asset-Liability Management and (iii) maintain a viable Contingency Funding Plan.
Global Core Liquid Assets. GCLA is liquidity that we maintain to meet a broad range of potential cash outflows and collateral needs in a stressed environment. Our most important liquidity policy is to pre-fund our estimated potential cash and collateral needs during a liquidity crisis and hold this liquidity in the form of unencumbered, highly liquid securities and cash. We believe that the securities held in our GCLA would be readily convertible to cash in a matter of days, through liquidation, by entering into repurchase agreements or from maturities of resale agreements, and that this cash would allow us to meet immediate obligations without needing to sell other assets or depend on additional funding from credit-sensitive markets.
Our GCLA reflects the following principles:
The first days or weeks of a liquidity crisis are the most critical to a company’s survival;
Focus must be maintained on all potential cash and collateral outflows, not just disruptions to financing flows. Our businesses are diverse, and our liquidity needs are determined by many factors, including market movements, collateral requirements and client commitments, all of which can change dramatically in a difficult funding environment;
During a liquidity crisis, credit-sensitive funding, including unsecured debt and some types of secured financing agreements, may be unavailable, and the terms (e.g., interest rates, collateral provisions and tenor) or availability of other types of secured financing may change; and
As a result of our policy to pre-fund liquidity that we estimate may be needed in a crisis, we hold more unencumbered securities and have larger debt balances than our businesses would otherwise require. We believe that our liquidity is stronger with greater balances of highly liquid unencumbered securities, even though it increases our total assets and our funding costs.
We maintain our GCLA across Group Inc. and its major broker-dealer and bank subsidiaries, asset types, and clearing agents to provide us with sufficient operating liquidity to ensure timely settlement in all major markets, even in a difficult funding environment. In addition to the GCLA, we maintain cash balances and securities in several of our other entities, primarily for use in specific currencies, entities, or jurisdictions where we do not have immediate access to parent company liquidity.
We believe that our GCLA provides us with a resilient source of funds that would be available in advance of potential cash and collateral outflows and gives us significant flexibility in managing through a difficult funding environment.
| | | | |
| | Goldman Sachs March 2016 Form 10-Q | | 129 |
THE GOLDMAN SACHS GROUP, INC. AND SUBSIDIARIES
Management’s Discussion and Analysis
Asset-Liability Management. Our liquidity risk management policies are designed to ensure we have a sufficient amount of financing, even when funding markets experience persistent stress. We manage the maturities and diversity of our funding across markets, products and counterparties, and seek to maintain a long-dated and diversified funding profile with an appropriate tenor, taking into consideration the characteristics and liquidity profile of our assets.
| | | | |
| 124 | | Goldman Sachs March 2017 Form 10-Q | | |
THE GOLDMAN SACHS GROUP, INC. AND SUBSIDIARIES
Management’s Discussion and Analysis
Our approach to asset-liability management includes:
Conservatively managing the overall characteristics of our funding book, with a focus on maintaining long-term, diversified sources of funding in excess of our current requirements. See “Balance Sheet and Funding Sources — Funding Sources” for additional details;
Actively managing and monitoring our asset base, with particular focus on the liquidity, holding period and our ability to fund assets on a secured basis. We assess our funding requirements and our ability to liquidate assets in a stressed environment while appropriately managing risk. This enables us to determine the most appropriate funding products and tenors. See “Balance Sheet and Funding Sources — Balance Sheet Management” for more detail on our balance sheet management process and “— Funding Sources — Secured Funding” for more detail on asset classes that may be harder to fund on a secured basis; and
Raising secured and unsecured financing that has a long tenor relative to the liquidity profile of our assets. This reduces the risk that our liabilities will come due in advance of our ability to generate liquidity from the sale of our assets. Because we maintain a highly liquid balance sheet, the holding period of certain of our assets may be materially shorter than their contractual maturity dates.
Our goal is to ensure that we maintain sufficient liquidity to fund our assets and meet our contractual and contingent obligations in normal times as well as during periods of market stress. Through our dynamic balance sheet management process, we use actual and projected asset balances to determine secured and unsecured funding requirements. Funding plans are reviewed and approved by the Firmwide Finance Committee on a quarterly basis. In addition, senior managers in our independent control and support functions regularly analyze, and the Firmwide Finance Committee reviews, our consolidated total capital position (unsecured long-term borrowings plus total shareholders’ equity) so that we maintain a level of long-term funding that is sufficient to meet our long-term financing requirements. In a liquidity crisis, we would first use our GCLA in order to avoid reliance on asset sales (other than our GCLA). However, we recognize that orderly asset sales may be prudent or necessary in a severe or persistent liquidity crisis.
Subsidiary Funding Policies
The majority of our unsecured funding is raised by Group Inc. which lends the necessary funds to its subsidiaries, some of which are regulated, to meet their asset financing, liquidity and capital requirements. In addition, Group Inc. provides its regulated subsidiaries with the necessary capital to meet their regulatory requirements. The benefits of this approach to subsidiary funding are enhanced control and greater flexibility to meet the funding requirements of our subsidiaries. Funding is also raised at the subsidiary level through a variety of products, including secured funding, unsecured borrowings and deposits.
Our intercompany funding policies assume that, unless legally provided for, a subsidiary’s funds or securities are not freely available to its parent or other subsidiaries. In particular, many of our subsidiaries are subject to laws that authorize regulatory bodies to block or reduce the flow of funds from those subsidiaries to Group Inc. Regulatory action of that kind could impede access to funds that Group Inc. needs to make payments on its obligations. Accordingly, we assume that the capital provided to our regulated subsidiaries is not available to Group Inc. or other subsidiaries and any other financing provided to our regulated subsidiaries is not available until the maturity of such financing.
| | | | |
130 | | Goldman Sachs March 2016 Form 10-Q | | |
THE GOLDMAN SACHS GROUP, INC. AND SUBSIDIARIES
Management’s Discussion and Analysis
Group Inc. has provided substantial amounts of equity and subordinated indebtedness, directly or indirectly, to its regulated subsidiaries. For example, as of March 2016,2017, Group Inc. had $28.87$30.48 billion of equity and subordinated indebtedness invested in GS&Co., its principal U.S. registered broker-dealer; $33.08$37.19 billion invested in GSI, a regulated U.K. broker-dealer; $2.31 billion invested in GSEC, a U.S. registered broker-dealer; $2.81$2.57 billion invested in Goldman Sachs Japan Co., Ltd. (GSJCL), a regulated Japanese broker-dealer; $25.50$26.96 billion invested in GS Bank USA, a regulated New York State-chartered bank; and $3.67$3.80 billion invested in GSIB, a regulated U.K. bank. Group Inc. also provided, directly or indirectly, $93.75$100.84 billion of unsubordinated loans (including secured loans of $38.21 billion), and $10.29$14.29 billion of collateral and cash deposits to these entities, substantially all of which was to GS&Co., GSI, GSJCL and GS Bank USA, as of March 2016.2017. In addition, as of March 2016,2017, Group Inc. had significant amounts of capital invested in and loans to its other regulated subsidiaries.
| | | | |
| | Goldman Sachs March 2017 Form 10-Q | | 125 |
THE GOLDMAN SACHS GROUP, INC. AND SUBSIDIARIES
Management’s Discussion and Analysis
Contingency Funding Plan. We maintain a contingency funding plan to provide a framework for analyzing and responding to a liquidity crisis situation or periods of market stress. Our contingency funding plan outlines a list of potential risk factors, key reports and metrics that are reviewed on an ongoing basis to assist in assessing the severity of, and managing through, a liquidity crisis and/or market dislocation. The contingency funding plan also describes in detail our potential responses if our assessments indicate that we have entered a liquidity crisis, which include pre-funding for what we estimate will be our potential cash and collateral needs as well as utilizing secondary sources of liquidity. Mitigants and action items to address specific risks which may arise are also described and assigned to individuals responsible for execution.
The contingency funding plan identifies key groups of individuals to foster effective coordination, control and distribution of information, all of which are critical in the management of a crisis or period of market stress. The contingency funding plan also details the responsibilities of these groups and individuals, which include making and disseminating key decisions, coordinating all contingency activities throughout the duration of the crisis or period of market stress, implementing liquidity maintenance activities and managing internal and external communication.
Liquidity Stress Tests
In order to determine the appropriate size of our GCLA, we use an internal liquidity model, referred to as the Modeled Liquidity Outflow, which captures and quantifies our liquidity risks. We also consider other factors including, but not limited to, an assessment of our potential intraday liquidity needs through an additional internal liquidity model, referred to as the Intraday Liquidity Model, the results of our long-term stress testing models, applicable regulatory requirements and a qualitative assessment of theour condition ofas well as the financial markets and the firm.markets. The results of the Modeled Liquidity Outflow, the Intraday Liquidity Model and the long-term stress testing models are reported to senior management on a regular basis.
Modeled Liquidity Outflow. Our Modeled Liquidity Outflow is based on conducting multiple scenarios that include combinations of market-wide and firm-specific stress. These scenarios are characterized by the following qualitative elements:
Severely challenged market environments, including low consumer and corporate confidence, financial and political instability, adverse changes in market values, including potential declines in equity markets and widening of credit spreads; and
A firm-specific crisis potentially triggered by material losses, reputational damage, litigation, executive departure, and/or a ratings downgrade.
| | | | |
| | Goldman Sachs March 2016 Form 10-Q | | 131 |
THE GOLDMAN SACHS GROUP, INC. AND SUBSIDIARIES
Management’s Discussion and Analysis
The following are the critical modeling parameters of the Modeled Liquidity Outflow:
Liquidity needs over a 30-day scenario;
A two-notch downgrade of our long-term senior unsecured credit ratings;
A combination of contractual outflows, such as upcoming maturities of unsecured debt, and contingent outflows (e.g., actions though not contractually required, we may deem necessary in a crisis). We assume that most contingent outflows will occur within the initial days and weeks of a crisis;
No issuance of equity or unsecured debt;
No support from additional government funding facilities. Although we have access to various central bank funding programs, we do not assume reliance on additional sources of funding in a liquidity crisis; and
No asset liquidation, other than the GCLA.
The potential contractual and contingent cash and collateral outflows covered in our Modeled Liquidity Outflow include:
Unsecured Funding
Contractual: All upcoming maturities of unsecured long-term debt, commercial paper, and other unsecured funding products. We assume that we will be unable to issue new unsecured debt or rollover any maturing debt.
Contingent: Repurchases of our outstanding long-term debt, commercial paper and hybrid financial instruments in the ordinary course of business as a market maker.
Deposits
Contractual: All upcoming maturities of term deposits. We assume that we will be unable to raise new term deposits or rollover any maturing term deposits.
Contingent: Partial withdrawals of bank deposits that have no contractual maturity. The withdrawal assumptions reflect, among other factors, the type of deposit, whether the deposit is insured or uninsured, and our relationship with the depositor.
| | | | |
| 126 | | Goldman Sachs March 2017 Form 10-Q | | |
THE GOLDMAN SACHS GROUP, INC. AND SUBSIDIARIES
Management’s Discussion and Analysis
Secured Funding
Contractual: A portion of upcoming contractual maturities of secured funding due to either the inability to refinance or the ability to refinance only at wider haircuts (i.e., on terms which require us to post additional collateral). Our assumptions reflect, among other factors, the quality of the underlying collateral, counterparty roll probabilities (our assessment of the counterparty’s likelihood of continuing to provide funding on a secured basis at the maturity of the trade) and counterparty concentration.
Contingent: Adverse changes in the value of financial assets pledged as collateral for financing transactions, which would necessitate additional collateral postings under those transactions.
OTC Derivatives
Contingent: Collateral postings to counterparties due to adverse changes in the value of our OTC derivatives, excluding those that are cleared and settled through central counterparties (OTC-cleared).
Contingent: Other outflows of cash or collateral related to OTC derivatives, excluding OTC-cleared, including the impact of trade terminations, collateral substitutions, collateral disputes, loss of rehypothecation rights, collateral calls or termination payments required by a two-notch downgrade in our credit ratings, and collateral that has not been called by counterparties, but is available to them.
Exchange-Traded and OTC-cleared Derivatives
Contingent: Variation margin postings required due to adverse changes in the value of our outstanding exchange-traded and OTC-cleared derivatives.
Contingent: An increase in initial margin and guaranty fund requirements by derivative clearing houses.
Customer Cash and Securities
Contingent: Liquidity outflows associated with our prime brokerage business, including withdrawals of customer credit balances, and a reduction in customer short positions, which may serve as a funding source for long positions.
Firm Securities
Contingent: Liquidity outflows associated with a reduction or composition change in firmour short positions, which may serve as a funding source for long positions.
| | | | |
132 | | Goldman Sachs March 2016 Form 10-Q | | |
THE GOLDMAN SACHS GROUP, INC. AND SUBSIDIARIES
Management’s Discussion and Analysis
Unfunded Commitments
Contingent: Draws on our unfunded commitments. Draw assumptions reflect, among other things, the type of commitment and counterparty.
Other
Other upcoming large cash outflows, such as tax payments.
Intraday Liquidity Model. Our Intraday Liquidity Model measures our intraday liquidity needs using a scenario analysis characterized by the same qualitative elements as our Modeled Liquidity Outflow. The model assesses the risk of increased intraday liquidity requirements during a scenario where access to sources of intraday liquidity may become constrained.
The following are key modeling elements of the Intraday Liquidity Model:
Liquidity needs over a one-day settlement period;
Delays in receipt of counterparty cash payments;
A reduction in the availability of intraday credit lines at our third-party clearing agents; and
Higher settlement volumes due to an increase in activity.
Long-Term Stress Testing. We utilize a longer-term stress testtests to take a forward view on our liquidity position through a prolonged stress periodperiods in which the firm experienceswe experience a severe liquidity stress and recoversrecover in an environment that continues to be challenging. We are focused on ensuring conservative asset-liability management to prepare for a prolonged period of potential stress, seeking to maintain a long-dated and diversified funding profile with an appropriate tenor, taking into consideration the characteristics and liquidity profile of our assets.
We also runperform stress tests on a regular basis as part of our routine risk management processes and conduct tailored stress tests on an ad hoc or product-specific basis in response to market developments.
Model Review and Validation
Treasury regularly refines our Modeled Liquidity Outflow, Intraday Liquidity Model and our other stress testing models to reflect changes in market or economic conditions and our business mix. Any changes, including model assumptions, are assessed and approved by Liquidity Risk Management.
Model Risk Management is responsible for the independent review and validation of our liquidity models. See “Model Risk Management” for further information about the review and validation of these models.
Limits
We use liquidity limits at various levels and across liquidity risk types to controlmanage the size of our liquidity exposures. Limits are measured relative to acceptable levels of risk given theour liquidity risk tolerance of the firm.tolerance. The purpose of the firmwide limits is to assist senior management in monitoring and controlling our overall liquidity profile.
| | | | |
| | Goldman Sachs March 2017 Form 10-Q | | 127 |
THE GOLDMAN SACHS GROUP, INC. AND SUBSIDIARIES
Management’s Discussion and Analysis
The Risk Committee of the Board and the Firmwide Finance Committee approve liquidity risk limits at the firmwide level. Limits are reviewed frequently and amended, with required approvals, on a permanent and temporary basis, as appropriate, to reflect changing market or business conditions.
Our liquidity risk limits are monitored by Treasury and Liquidity Risk Management. Treasury is responsible for identifying and escalating, on a timely basis, instances where limits have been exceeded.
GCLA and Unencumbered Metrics
GCLA. Based on the results of our internal liquidity risk models, described above, as well as our consideration of other factors including, but not limited to, an assessment of our potential intraday liquidity needs and a qualitative assessment of theour condition ofas well as the financial markets, and the firm, we believe our liquidity position as of both March 20162017 and December 20152016 was appropriate. As of March 20162017 and December 2015,2016, the fair value of the securities and certain overnight cash deposits included in our GCLA totaled $195.76$222.50 billion and $199.12$226.07 billion, respectively,respectively. We strictly limit our GCLA to a narrowly defined list of securities and thecash because they are highly liquid, even in a difficult funding environment. We do not include other potential sources of excess liquidity in our GCLA, such as less liquid unencumbered securities or committed credit facilities. The fair value of these assetsour GCLA averaged $197.99$217.84 billion and $219.15 billion for the three months ended March 2017 and December 2016, and $187.75 billion for the year ended December 2015.respectively.
| | | | |
| | Goldman Sachs March 2016 Form 10-Q | | 133 |
THE GOLDMAN SACHS GROUP, INC. AND SUBSIDIARIES
Management’s Discussion and Analysis
The table below presents the average fair value of the securities and certain overnight cash deposits that are included in our GCLA.
| | | | Average for the | | | Average for the Three Months Ended | |
| $ in millions | |
| Three Months Ended
March 2016 |
| |
| Year Ended
December 2015 |
| |
| March
2017 |
| |
| December
2016 |
|
U.S. dollar-denominated | | | $140,904 | | | | $132,415 | | | | $162,559 | | | | $163,454 | |
| | | | | |
Non-U.S. dollar-denominated | | | 57,084 | | | | 55,333 | | | | 55,283 | | | | 55,694 | |
Total | | | $197,988 | | | | $187,748 | | | | $217,842 | | | | $219,148 | |
The table below presents the average fair value of our GCLA by asset class.
| | | | | | | | |
| | | Average for the Three Months Ended | |
| $ in millions | |
| March
2017 |
| |
| December
2016 |
|
Overnight cash deposits | | | $ 93,449 | | | | $102,718 | |
| | |
U.S. government obligations | | | 74,327 | | | | 66,285 | |
| | |
U.S. federal agency obligations | | | 13,047 | | | | 13,503 | |
| | |
Non-U.S. government obligations | | | 37,019 | | | | 36,642 | |
Total | | | $217,842 | | | | $219,148 | |
In the tables above:
The U.S. dollar-denominated GCLA is composed of (i) unencumbered U.S. government and federal agency obligations (including highly liquid U.S. federal agency mortgage-backed obligations), all of which are eligible as collateral in Federal Reserve open market operations and (ii) certain overnight U.S. dollar cash deposits.
The non-U.S. dollar-denominated GCLA is composed of onlynon-U.S. government obligations (only unencumbered German, French, Japanese and United KingdomU.K. government obligationsobligations) and certain overnight cash deposits in highly liquid currencies. We strictly limit our GCLA to this narrowly defined list of securities and cash because they are highly liquid, even in a difficult funding environment. We do not include other potential sources of excess liquidity in our GCLA, such as less liquid unencumbered securities or committed credit facilities.
The table below presents the fair valueaverage GCLA of Group Inc. and our GCLA by asset class.major broker-dealer and bank subsidiaries.
| | | | | | | | |
| | | Average for the | |
| $ in millions | |
| Three Months Ended
March 2016 |
| |
| Year Ended
December 2015 |
|
Overnight cash deposits | | | $ 75,027 | | | | $ 61,407 | |
| | |
U.S. government obligations | | | 72,783 | | | | 69,562 | |
| | |
U.S. federal agency obligations, including highly liquid U.S. federal agency mortgage-backed obligations | | | 10,725 | | | | 11,413 | |
| | |
German, French, Japanese and United Kingdom government obligations | | | 39,453 | | | | 45,366 | |
Total | | | $197,988 | | | | $187,748 | |
| | | | | | | | |
| | | Average for the Three Months Ended | |
| $ in millions | |
| March
2017 |
| |
| December
2016 |
|
Group Inc. | | | $ 40,053 | | | | $ 39,996 | |
| | |
Major broker-dealer subsidiaries | | | 88,829 | | | | 89,288 | |
| | |
Major bank subsidiaries | | | 88,960 | | | | 89,864 | |
Total | | | $217,842 | | | | $219,148 | |
We maintain our GCLA to enable us to meet current and potential liquidity requirements of our parent company, Group Inc., and its subsidiaries. Our Modeled Liquidity Outflow and Intraday Liquidity Model incorporate a consolidated requirement for Group Inc. as well as a standalone requirement for each of our major broker-dealer and bank subsidiaries. Liquidity held directly in each of these major subsidiaries is intended for use only by that subsidiary to meet its liquidity requirements and is assumed not to be available to Group Inc. unless (i) legally provided for and (ii) there are no additional regulatory, tax or other restrictions. In addition, the Modeled Liquidity Outflow and Intraday Liquidity Model also incorporate a broader assessment of standalone liquidity requirements for other subsidiaries and we hold a portion of our GCLA directly at Group Inc. to support such requirements.
The table below presents the GCLA of Group Inc. and our major broker-dealer and bank subsidiaries.
| | | | | | | | |
| | | Average for the | |
| $ in millions | |
| Three Months Ended
March 2016 |
| |
| Year Ended
December 2015 |
|
Group Inc. | | | $ 46,524 | | | | $ 41,284 | |
| | |
Major broker-dealer subsidiaries | | | 87,169 | | | | 89,510 | |
| | |
Major bank subsidiaries | | | 64,295 | | | | 56,954 | |
Total | | | $197,988 | | | | $187,748 | |
Other Unencumbered Assets. In addition to our GCLA, we have a significant amount of other unencumbered cash and financial instruments, including other government obligations, high-grade money market securities, corporate obligations, marginable equities, loans and cash deposits not included in our GCLA. Beginning in January 2016, to be consistent with changes in the manner in which management views unencumbered assets, we included certain loans within our unencumbered assets. The fair value of our unencumbered assets averaged $137.21$146.93 billion and $144.37 billion for the three months ended March 2017 and December 2016, and $90.36 billion for the year ended December 2015. Had these loans been included as of December 2015, the fair value of our unencumbered assets would have increased by $44.45 billion.respectively. We do not consider these assets liquid enough to be eligible for our GCLA.
| | | | |
134128 | | Goldman Sachs March 20162017 Form 10-Q | | |
THE GOLDMAN SACHS GROUP, INC. AND SUBSIDIARIES
Management’s Discussion and Analysis
Liquidity Regulatory Framework
The Basel Committee’s international framework forfinal rules on minimum liquidity risk measurement, standards and monitoring callsapproved by the U.S. federal bank regulatory agencies call for a liquidity coverage ratio (LCR) designed to ensure that banking organizations maintain an adequate level of unencumbered high-quality liquid assets (HQLA) based on expected net cash outflows under an acute short-term liquidity stress scenario.
The final rules on minimum liquidity standards approved by the U.S. federal bank regulatory agencies are generally consistent with the Basel Committee’s framework as described above, but include accelerated transition provisions and more stringent requirements related to both the range of assets that qualify as HQLA and cash outflow assumptions for certain types of funding and other liquidity risks. Our GCLA is substantially the same in composition as the assets that qualify as HQLA under these rules. Under the accelerated transition timeline, the
The LCR became effective in the United StatesU.S. on January 1, 2015, with a phase-in period whereby firms had an 80% minimum in 2015, which increasesincreased by 10% per year until 2017. In November 2015,December 2016, the Federal Reserve Board proposedissued a final rule that would requirerequires bank holding companies to disclose, their LCR on a quarterly basis beginning inwith the second quarter ended September 2016. These requirements includeof 2017, LCR averages over the quarter, detailedquantitative and qualitative information on certain components of the LCR calculation and projected net cash outflows. For the three months ended March 2016,2017, our average LCR exceeded the fully phased-in minimum requirement, based on our interpretation and understanding of the finalized framework, which may evolve as we review our interpretation and application with our regulators.requirement.
The Basel Committee’s international framework for liquidity risk measurement, standards and monitoring also calls for a net stable funding ratio (NSFR) designed to promote more medium- and long-term stable funding of the assets and off-balance-sheet activities of banking organizations over a one-year time horizon. The Basel Committee’s NSFR framework requires banking organizations to maintain a minimum NSFR of 100%, and will be effective on January 1, 2018. In addition, in the second quarter of 2016, the U.S. federal bank regulatory agencies issued a proposed rule that would implement an NSFRcalls for a net stable funding ratio (NSFR) for large U.S. banking organizations. The proposal would require banking organizations to ensure they have access to stable funding over a one-year time horizon. The proposed NSFR requirement has an effective date of January 1, 2018, including quarterly disclosure of the ratio, as well as a description of the banking organization’s stable funding sources. We are currently evaluating the impact ofexpect that we will be compliant with the NSFR frameworks.requirement by the effective date.
The following is information on our subsidiary liquidity regulatory requirements:
GS Bank USA. GS Bank USA is subject to minimum liquidity standards under the LCR rule approved by the U.S. federal bank regulatory agencies that became effective on January 1, 2015, with the same phase-in through 2017 described above. The U.S. federal bank regulatory agencies’ proposed rule on the NSFR described above would also apply to GS Bank USA.
GSI. The LCR rule issued by the U.K. regulatory authorities became effective in the United KingdomU.K. on October 1, 2015, with a phase-in period whereby certain financial institutions, including GSI, were required to have an 80% minimum ratio initially, increasing to 90% on January 1, 2017 and 100% on January 1, 2018.
Other Subsidiaries. We monitor the local regulatory liquidity requirements of our subsidiaries to ensure compliance. For many of our subsidiaries, these requirements either have changed or are likely to change in the future due to the implementation of the Basel Committee’s framework for liquidity risk measurement, standards and monitoring, as well as other regulatory developments.
The implementation of these rules, and any amendments adopted by the applicable regulatory authorities, could impact our liquidity and funding requirements and practices in the future.
Credit Ratings
We rely on the short-term and long-term debt capital markets to fund a significant portion of our day-to-day operations and the cost and availability of debt financing is influenced by our credit ratings. Credit ratings are also important when we are competing in certain markets, such as OTC derivatives, and when we seek to engage in longer-term transactions. See “Risk Factors” in Part I, Item 1A of the 20152016 Form 10-K for information about the risks associated with a reduction in our credit ratings.
| | | | |
| | Goldman Sachs March 2016 Form 10-Q | | 135 |
THE GOLDMAN SACHS GROUP, INC. AND SUBSIDIARIES
Management’s Discussion and Analysis
The table below presents the unsecured credit ratings and outlook of Group Inc. by DBRS, Inc. (DBRS), Fitch, Inc. (Fitch), Moody’s Investors Service (Moody’s), Standard & Poor’s Ratings Services (S&P), and Rating and Investment Information, Inc. (R&I).
| | | | | | | | | | | | | | | | | | | | |
| | | As of March 20162017 | |
| | | | DBRS | | | | Fitch | | | | Moody’s | | | | S&P | | | | R&I | |
Short-term Debt | | | R-1 (middle | ) | | | F1 | | | | P-2 | | | | A-2 | | | | a-1 | |
| | |
Long-term Debt | | | A (high | ) | | | A | | | | A3 | | | | BBB+ | | | | A | |
| | |
Subordinated Debt | | | A | | | | A- | | | | Baa2 | | | | BBB- | | | | A- | |
| | |
Trust Preferred | | | A | | | | BBB- | | | | Baa3 | | | | BB | | | | N/A | |
| | |
Preferred Stock | | | BBB (high | ) | | | BB+ | | | | Ba1 | | | | BB | | | | N/A | |
| | |
Ratings Outlook | | | Stable | | | | Stable | | | | Stable | | | | Stable | | | | Stable | |
In the table above:
The ratings for Trust Preferred relate to the guaranteed preferred beneficial interests issued by Goldman Sachs Capital I.
The DBRS, Fitch, Moody’s and S&P ratings for Preferred Stock include the APEX issued by Goldman Sachs Capital II and Goldman Sachs Capital III.
| | | | |
| | Goldman Sachs March 2017 Form 10-Q | | 129 |
THE GOLDMAN SACHS GROUP, INC. AND SUBSIDIARIES
Management’s Discussion and Analysis
The table below presents the unsecured credit ratings and outlook of GS Bank USA, GSIB, GS&Co. and GSI, by Fitch, Moody’s and S&P.
| | | | | | | | | | | | |
| | | As of March 20162017 | |
| | | | Fitch | | | | Moody’s | | | | S&P | |
GS Bank USA | | | | | | | | | | | | |
Short-term Debt | | | F1 | | | | P-1 | | | | A-1 | |
| | |
Long-term Debt | | | A+ | | | | A1 | | | | AA+ | |
| | |
Short-term Bank Deposits | | | F1+ | | | | P-1 | | | | N/A | |
| | |
Long-term Bank Deposits | | | AA- | | | | A1 | | | | N/A | |
| | |
Ratings Outlook | | | Stable | | | | Stable | | | | Watch PositiveStable | |
GSIB | | | | | | | | | | | | |
Short-term Debt | | | F1 | | | | P-1 | | | | A-1 | |
| | |
Long-term Debt | | | A | | | | A1 | | | | AA+ | |
| | |
Short-term Bank Deposits | | | F1 | | | | P-1 | | | | N/A | |
| | |
Long-term Bank Deposits | | | A | | | | A1 | | | | N/A | |
| | |
Ratings Outlook | | | PositiveStable | | | | Stable | | | | Watch PositiveStable | |
GS&Co. | | | | | | | | | | | | |
Short-term Debt | | | F1 | | | | N/A | | | | A-1 | |
| | |
Long-term Debt | | | A+ | | | | N/A | | | | AA+ | |
| | |
Ratings Outlook | | | Stable | | | | N/A | | | | Watch PositiveStable | |
GSI | | | | | | | | | | | | |
Short-term Debt | | | F1 | | | | P-1 | | | | A-1 | |
| | |
Long-term Debt | | | A | | | | A1 | | | | AA+ | |
| | |
Ratings Outlook | | | PositiveStable | | | | Stable | | | | Watch PositiveStable | |
We believe our credit ratings are primarily based on the credit rating agencies’ assessment of:
Our liquidity, market, credit and operational risk management practices;
The level and variability of our earnings;
Our franchise, reputation and management;
Our corporate governance; and
The external operating and economic environment, including, in some cases, the assumed level of government support or other systemic considerations, such as potential resolution.
Certain of our derivatives have been transacted under bilateral agreements with counterparties who may require us to post collateral or terminate the transactions based on changes in our credit ratings. We assess the impact of these bilateral agreements by determining the collateral or termination payments that would occur assuming a downgrade by all rating agencies. A downgrade by any one rating agency, depending on the agency’s relative ratings of us at the time of the downgrade, may have an impact which is comparable to the impact of a downgrade by all rating agencies. We allocate a portion ofmanage our GCLA to ensure we would, among other potential requirements, be able to make the additional collateral or termination payments that may be required in the event of a two-notch reduction in our long-term credit ratings, as well as collateral that has not been called by counterparties, but is available to them.
The table below presents the additional collateral or termination payments related to our net derivative liabilities under bilateral agreements that could have been called at the reporting date by counterparties in the event of a one-notch and two-notch downgrade in our credit ratings.
| | | | | | | | |
| | | As of | |
| $ in millions | |
| March
2016 |
| |
| December
2015 |
|
Additional collateral or termination payments
for a one-notch downgrade | | | $ 676 | | | | $1,061 | |
| | |
Additional collateral or termination payments
for a two-notch downgrade | | | 2,031 | | | | 2,689 | |
| | | | |
136 | | Goldman Sachs March 2016 Form 10-Q | | |
THE GOLDMAN SACHS GROUP, INC. AND SUBSIDIARIES
Management’s Discussion and Analysis
| | | | | | | | |
| | | As of | |
| $ in millions | |
| March
2017 |
| |
| December
2016 |
|
Additional collateral or termination payments: | | | | | | | | |
One-notch downgrade | | | $ 367 | | | | $ 677 | |
| | |
Two-notch downgrade | | | $1,880 | | | | $2,216 | |
Cash Flows
As a global financial institution, our cash flows are complex and bear little relation to our net earnings and net assets. Consequently, we believe that traditional cash flow analysis is less meaningful in evaluating our liquidity position than the liquidity and asset-liability management policies described above. Cash flow analysis may, however, be helpful in highlighting certain macro trends and strategic initiatives in our businesses.
Three Months Ended March 2017. Our cash and cash equivalents increased by $1.32 billion to $123.04 billion at the end of the first quarter of 2017. We generated $6.26 billion in net cash from financing activities, primarily from net issuances of unsecured long-term borrowings. We used $3.36 billion in net cash from operating activities, primarily related to an increase in financial instruments owned, at fair value, and receivables from customers and counterparties, partially offset by a decrease in collateralized transactions. We used $1.57 billion in net cash from investing activities, primarily related to purchases of property, leasehold improvements and equipment and to fund loans receivable.
Three Months Ended March 2016. Our cash and cash equivalents increased by $4.06$4.51 billion to $79.17$97.95 billion at the end of the first quarter of 2016. We generated $11.13$10.19 billion in net cash from financing activities, primarily from increases in bank deposits and from net issuances of unsecured long-term borrowings. We used $7.07$5.68 billion in net cash for operating and investing activities, primarily related to collateralized transactions and to fund loans receivable.
Three Months Ended March 2015. Our cash
| | | | |
| 130 | | Goldman Sachs March 2017 Form 10-Q | | |
THE GOLDMAN SACHS GROUP, INC. AND SUBSIDIARIES
Management’s Discussion and cash equivalents increased by $5.53 billion to $63.13 billion at the end of the first quarter of 2015. We generated $9.79 billion in net cash from operating and financing activities, primarily from increases from net issuances of secured and unsecured long-term borrowings and bank deposits. We used $4.26 billion in net cash for investing activities, primarily to fund loans receivable.Analysis
Market Risk Management
Overview
Market risk is the risk of loss in the value of our inventory, as well as certain other financial assets and financial liabilities, due to changes in market conditions. We employ a variety of risk measures, each described in the respective sections below, to monitor market risk. We hold inventory primarily for market making for our clients and for our investing and lending activities. Our inventory therefore changes based on client demands and our investment opportunities. Our inventory is accounted for at fair value and therefore fluctuates on a daily basis, with the related gains and losses included in “Market making” and “Other principal transactions.” Categories of market risk include the following:
Interest rate risk: results from exposures to changes in the level, slope and curvature of yield curves, the volatilities of interest rates, mortgage prepayment speeds and credit spreads;
Equity price risk: results from exposures to changes in prices and volatilities of individual equities, baskets of equities and equity indices;
Currency rate risk: results from exposures to changes in spot prices, forward prices and volatilities of currency rates; and
Commodity price risk: results from exposures to changes in spot prices, forward prices and volatilities of commodities, such as crude oil, petroleum products, natural gas, electricity, and precious and base metals.
Managers in revenue-producing units are accountable for managing risk within prescribed limits. These managers have in-depth knowledge of their positions, markets and the instruments available to hedge their exposures.
Market Risk Management, which is independent of the revenue-producing units and reports to our chief risk officer, has primary responsibility for assessing, monitoring and managing our market risk at the firm.risk. We monitor and control risks through strong firmwide oversight and independent control and support functions across our global businesses.
Managers in revenue-producing units and Market Risk Management discuss market information, positions and estimated risk and loss scenarios on an ongoing basis. Managers in revenue-producing units are accountable for managing risk within prescribed limits. These managers have in-depth knowledge of their positions, markets and the instruments available to hedge their exposures.
| | | | |
| | Goldman Sachs March 2016 Form 10-Q | | 137 |
THE GOLDMAN SACHS GROUP, INC. AND SUBSIDIARIES
Management’s Discussion and Analysis
Market Risk Management Process
We manage our market risk by diversifying exposures, controlling position sizes and establishing economic hedges in related securities or derivatives. This process includes:
Accurate and timely exposure information incorporating multiple risk metrics;
A dynamic limit setting framework; and
Constant communication among revenue-producing units, risk managers and senior management.
Risk Measures.Measures
Market Risk Management produces risk measures and monitors them against established market risk limits set by our risk committees.limits. These measures reflect an extensive range of scenarios and the results are aggregated at product, business and firmwide levels.
We use a variety of risk measures to estimate the size of potential losses for both moderate and more extreme market moves over both short-term and long-term time horizons. Our primary risk measures are VaR, which is used for shorter-term periods, and stress tests. Our risk reports detail key risks, drivers and changes for each desk and business, and are distributed daily to senior management of both our revenue-producing units and our independent control and support functions.
Value-at-Risk. VaR is the potential loss in value due to adverse market movements over a defined time horizon with a specified confidence level. For assets and liabilities included in VaR, see “Financial Statement Linkages to Market Risk Measures.” We typically employ a one-day time horizon with a 95% confidence level. We use a single VaR model which captures risks including interest rates, equity prices, currency rates and commodity prices. As such, VaR facilitates comparison across portfolios of different risk characteristics. VaR also captures the diversification of aggregated risk at the firmwide level.
We are aware of the inherent limitations to VaR and therefore use a variety of risk measures in our market risk management process. Inherent limitations to VaR include:
VaR does not estimate potential losses over longer time horizons where moves may be extreme;
VaR does not take account of the relative liquidity of different risk positions; and
Previous moves in market risk factors may not produce accurate predictions of all future market moves.
| | | | |
| | Goldman Sachs March 2017 Form 10-Q | | 131 |
THE GOLDMAN SACHS GROUP, INC. AND SUBSIDIARIES
Management’s Discussion and Analysis
When calculating VaR, we use historical simulations with full valuation of approximately 70,000 market factors. VaR is calculated at a position level based on simultaneously shocking the relevant market risk factors for that position. We sample from five years of historical data to generate the scenarios for our VaR calculation. The historical data is weighted so that the relative importance of the data reduces over time. This gives greater importance to more recent observations and reflects current asset volatilities, which improves the accuracy of our estimates of potential loss. As a result, even if our positions included in VaR were unchanged, our VaR would increase with increasing market volatility and vice versa.
Given its reliance on historical data, VaR is most effective in estimating risk exposures in markets in which there are no sudden fundamental changes or shifts in market conditions.
Our VaR measure does not include:
Positions that are best measured and monitored using sensitivity measures; and
The impact of changes in counterparty and our own credit spreads on derivatives, as well as changes in our own credit spreads on unsecured borrowings for which the fair value option was elected.
We perform daily backtesting of our VaR model (i.e., comparing daily trading net revenues to the VaR measure calculated as of the prior business day) at the firmwide level and for each of our businesses and major regulated subsidiaries.
Stress Testing. Stress testing is a method of determining the effect of various hypothetical stress scenarios on the firm.scenarios. We use stress testing to examine risks of specific portfolios as well as the potential impact of our significant risk exposures across the firm.exposures. We use a variety of stress testing techniques to calculate the potential loss from a wide range of market moves on our portfolios, including sensitivity analysis, scenario analysis and firmwide stress tests. The results of our various stress tests are analyzed together for risk management purposes.
Sensitivity analysis is used to quantify the impact of a market move in a single risk factor across all positions (e.g., equity prices or credit spreads) using a variety of defined market shocks, ranging from those that could be expected over a one-day time horizon up to those that could take many months to occur. We also use sensitivity analysis to quantify the impact of the default of any single entity, which captures the risk of large or concentrated exposures.
| | | | |
138 | | Goldman Sachs March 2016 Form 10-Q | | |
THE GOLDMAN SACHS GROUP, INC. AND SUBSIDIARIES
Management’s Discussion and Analysis
Scenario analysis is used to quantify the impact of a specified event, including how the event impacts multiple risk factors simultaneously. For example, for sovereign stress testing we calculate potential direct exposure associated with our sovereign inventory as well as the corresponding debt, equity and currency exposures associated with our non-sovereign inventory that may be impacted by the sovereign distress. When conducting scenario analysis, we typically consider a number of possible outcomes for each scenario, ranging from moderate to severely adverse market impacts. In addition, these stress tests are constructed using both historical events and forward-looking hypothetical scenarios.
Firmwide stress testing combines market, credit, operational and liquidity risks into a single combined scenario. Firmwide stress tests are primarily used to assess capital adequacy as part of our capital planning and stress testing process; however, we also ensure that firmwide stress testing is integrated into our risk governance framework. This includes selecting appropriate scenarios to use for our capital planning and stress testing process. See “Equity Capital Management and Regulatory Capital — Equity Capital Management” above for further information.
Unlike VaR measures, which have an implied probability because they are calculated at a specified confidence level, there is generally no implied probability that our stress test scenarios will occur. Instead, stress tests are used to model both moderate and more extreme moves in underlying market factors. When estimating potential loss, we generally assume that our positions cannot be reduced or hedged (although experience demonstrates that we are generally able to do so).
Stress test scenarios are conducted on a regular basis as part of our routine risk management process and on an ad hoc basis in response to market events or concerns. Stress testing is an important part of our risk management process because it allows us to quantify our exposure to tail risks, highlight potential loss concentrations, undertake risk/reward analysis, and assess and mitigate our risk positions.
Limits. We use risk limits at various levels in the firm (including firmwide, business and product) to govern risk appetite by controlling the size of our exposures to market risk. Limits are set based on VaR and on a range of stress tests relevant to our exposures. Limits are reviewed frequently and amended on a permanent or temporary basis to reflect changing market conditions, business conditions or tolerance for risk.
| | | | |
| 132 | | Goldman Sachs March 2017 Form 10-Q | | |
THE GOLDMAN SACHS GROUP, INC. AND SUBSIDIARIES
Management’s Discussion and Analysis
The Risk Committee of the Board and the Risk Governance Committee (through delegated authority from the Firmwide Risk CommitteeCommittee) approve market risk limits and sub-limits at firmwide, business and businessproduct levels, consistent with our risk appetite. In addition, Market Risk Management (through delegated authority from the Risk Governance Committee) sets market risk limits and our divisional risk committees set sub-limits below the approved business-level risk limits. at certain product and desk levels.
The purpose of the firmwide limits is to assist senior management in controlling our overall risk profile. Sub-limits are set below the approved level of risk limits. Sub-limits set the desired maximum amount of exposure that may be managed by any particular business on a day-to-day basis without additional levels of senior management approval, effectively leaving day-to-day decisions to individual desk managers and traders. Accordingly, sub-limits are a management tool designed to ensure appropriate escalation rather than to establish maximum risk tolerance. Sub-limits also distribute risk among various businesses in a manner that is consistent with their level of activity and client demand, taking into account the relative performance of each area.
Our market risk limits are monitored daily by Market Risk Management, which is responsible for identifying and escalating, on a timely basis, instances where limits have been exceeded. The business-level limits that are set by the divisional risk committees are subject to the same scrutiny and limit escalation policy as the firmwide limits.
When a risk limit has been exceeded (e.g., due to positional changes or changes in market conditions, such as increased volatilities or changes in correlations), it is escalated to senior managers in Market Risk Management and/or the appropriate risk committee andcommittee. Such instances are remediated by an inventory reduction and/or a temporary or permanent increase to the risk limit.
| | | | |
| | Goldman Sachs March 2016 Form 10-Q | | 139 |
THE GOLDMAN SACHS GROUP, INC. AND SUBSIDIARIES
Management’s Discussion and Analysis
Model Review and Validation
Our VaR and stress testing models are regularly reviewed by Market Risk Management and enhanced in order to incorporate changes in the composition of positions included in our market risk measures, as well as variations in market conditions. Prior to implementing significant changes to our assumptions and/or models, Model Risk Management performs model validations. Significant changes to our VaR and stress testing models are reviewed with our chief risk officer and chief financial officer, and approved by the Firmwide Risk Committee.
See “Model Risk Management” for further information about the review and validation of these models.
Systems
We have made a significant investment in technology to monitor market risk including:
An independent calculation of VaR and stress measures;
Risk measures calculated at individual position levels;
Attribution of risk measures to individual risk factors of each position;
The ability to report many different views of the risk measures (e.g., by desk, business, product type or legal entity); and
The ability to produce ad hoc analyses in a timely manner.
Metrics
We analyze VaR at the firmwide level and a variety of more detailed levels, including by risk category, business, and region. The tables below present by risk category, average daily VaR and period-end VaR, as well as the high and low VaR for the period. Diversification effect in the tables below represents the difference between total VaR and the sum of the VaRs for the four risk categories. This effect arises because the four market risk categories are not perfectly correlated.
The table below presents average daily VaR.VaR by risk category.
| $ in millions Risk Categories | | Three Months
Ended March | | |
| | | 2016 | | | | 2015 | | |
| | | | Three Months Ended | |
| $ in millions | | |
| March
2017 |
| |
| December
2016 |
| |
| March
2016 |
|
Interest rates | | | $ 54 | | | | $ 53 | | | | $ 44 | | | | $ 40 | | | | $ 54 | |
| | | | | |
Equity prices | | | 25 | | | | 24 | | | | 26 | | | | 25 | | | | 25 | |
| | | | | |
Currency rates | | | 29 | | | | 30 | | | | 19 | | | | 19 | | | | 29 | |
| | | | | |
Commodity prices | | | 16 | | | | 28 | | | | 18 | | | | 17 | | | | 16 | |
| | | | | |
Diversification effect | | | (52 | ) | | | (54 | ) | | | (43 | ) | | | (40 | ) | | | (52 | ) |
Total | | | $ 72 | | | | $ 81 | | | | $ 64 | | | | $ 61 | | | | $ 72 | |
Our average daily VaR increased to $64 million for the first quarter of 2017 from $61 million for the fourth quarter of 2016, reflecting an increase in the interest rates category, principally due to increased exposures, partially offset by an increase in the diversification benefit across risk categories.
Our average daily VaR decreased to $64 million for the first quarter of 2017 from $72 million for the first quarter of 2016, from $81 million for the first quarter of 2015, primarily reflecting a decrease in the commodity pricesinterest rates category due to decreased exposures and lower levels of volatility.
The table below presents period-end VaR,volatility and highreduced exposures, and low VaR.
| | | | | | | | | | | | | | | | | | |
$ in millions Risk Categories | | As of | | | | | Three Months Ended March 2016 | |
| | March | | | December | | | | |
| | | 2016 | | | | 2015 | | | | | | High | | | | Low | |
Interest rates | | | $ 45 | | | | $ 43 | | | | | | $64 | | | | $45 | |
| | |
Equity prices | | | 27 | | | | 24 | | | | | | 32 | | | | 21 | |
| | |
Currency rates | | | 16 | | | | 31 | | | | | | 40 | | | | 14 | |
| | |
Commodity prices | | | 13 | | | | 17 | | | | | | 19 | | | | 13 | |
| | |
Diversification effect | | | (42 | ) | | | (48 | ) | | | | | | | | | | |
Total | | | $ 59 | | | | $ 67 | | | | | | $83 | | | | $57 | |
Our daily VaR decreased to $59 million as of March 2016 from $67 million as of December 2015, primarily reflecting a decrease in the currency rates category principally due to reduced exposures, partially offset by a decrease in the diversification benefit across risk categories.
During the first quarter of 2016, the firmwide VaR risk limit was not exceeded, raised or reduced.
| | | | |
140 | | Goldman Sachs March 20162017 Form 10-Q | | 133 |
THE GOLDMAN SACHS GROUP, INC. AND SUBSIDIARIES
Management’s Discussion and Analysis
The table below presents period-end VaR by risk category.
| | | | | | | | | | | | |
| | | As of | |
| $ in millions | |
| March
2017 |
| |
| December
2016 |
| |
| March
2016 |
|
Interest rates | | | $ 43 | | | | $ 45 | | | | $ 45 | |
| | |
Equity prices | | | 27 | | | | 34 | | | | 27 | |
| | |
Currency rates | | | 11 | | | | 23 | | | | 16 | |
| | |
Commodity prices | | | 22 | | | | 19 | | | | 13 | |
| | |
Diversification effect | | | (49 | ) | | | (39 | ) | | | (42 | ) |
Total | | | $ 54 | | | | $ 82 | | | | $ 59 | |
Our daily VaR decreased to $54 million as of March 2017 from $82 million as of December 2016, primarily reflecting decreases in the currency rates and equity prices categories, principally due to reduced exposures, and an increase in the diversification benefit across risk categories.
Our daily VaR decreased to $54 million as of March 2017 from $59 million as of March 2016, primarily reflecting an increase in the diversification benefit across risk categories, and a decrease in the currency rates category due to reduced exposures, partially offset by an increase in the commodity prices category, principally due to increased exposures.
During the first quarter of 2017, the firmwide VaR risk limit was not exceeded, raised or reduced.
The table below presents high and low VaR by risk category.
| | | | | | | | | | | | |
| | | | | | Three Months Ended
March 2017 | |
| $ in millions | | | | | | | High | | | | Low | |
Interest rates | | | | | | | $ 57 | | | | $ 37 | |
| | |
Equity prices | | | | | | | $ 35 | | | | $ 22 | |
| | |
Currency rates | | | | | | | $ 28 | | | | $ 10 | |
| | |
Commodity prices | | | | | | | $ 25 | | | | $ 12 | |
The high and low total VaR was $86 million and $50 million, respectively, for the three months ended March 2017.
The chart below reflects our daily VaR over the last four quarters.
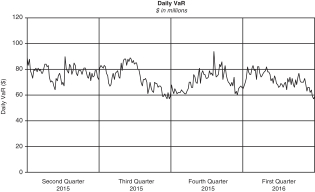
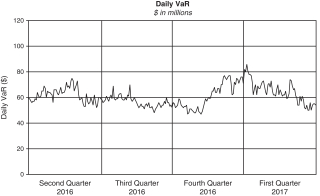
The chart below presents the frequency distribution of our daily trading net revenues for substantially all positions included in VaR for the quarter ended March 2016.2017.
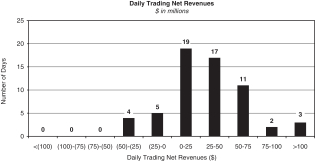
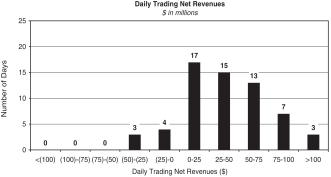
Daily trading net revenues are compared with VaR calculated as of the end of the prior business day. Trading losses incurred on a single day did not exceed our 95% one-day VaR during the first quarter of 20162017 (i.e., a VaR exception).
During periods in which we have significantly more positive net revenue days than net revenue loss days, we expect to have fewer VaR exceptions because, under normal conditions, our business model generally produces positive net revenues. In periods in which our franchise revenues are adversely affected, we generally have more loss days, resulting in more VaR exceptions. The daily market-making revenues used to determine VaR exceptions reflect the impact of any intraday activity, including bid/offer net revenues, which are more likely than not to be positive by their nature.
| | | | |
| 134 | | Goldman Sachs March 2017 Form 10-Q | | |
THE GOLDMAN SACHS GROUP, INC. AND SUBSIDIARIES
Management’s Discussion and Analysis
Sensitivity Measures
Certain portfolios and individual positions are not included in VaR because VaR is not the most appropriate risk measure. Other sensitivity measures we use to analyze market risk are described below.
10% Sensitivity Measures. The table below presents market risk for inventory positions, accounted for at fair value, that are not included in VaR.VaR by asset category. The market risk of these positions is determined by estimating the potential reduction in net revenues of a 10% decline in the underlying asset value. value of these positions.
| | | | | | | | | | | | |
| | | As of | |
| $ in millions | |
| March
2017 |
| |
| December
2016 |
| |
| March
2016 |
|
Equity | | | $2,116 | | | | $2,085 | | | | $1,996 | |
| | |
Debt | | | 1,653 | | | | 1,702 | | | | 1,670 | |
Total | | | $3,769 | | | | $3,787 | | | | $3,666 | |
In the table above:
Equity positions below relate to private and restricted public equity securities, including interests in funds that invest in corporate equities and real estate and interests in hedge funds, which are included in “Financial instruments owned, at fair value.” funds.
Debt positions include interests in funds that invest in corporate mezzanine and senior debt instruments, loans backed by commercial and residential real estate, corporate bank loans and other corporate debt, including acquired portfolios of distressed loans. These
Equity and debt positions reflected in our condensed consolidated statements of financial condition are included in “Financial instruments owned, at fair value.” See Note 6 to the condensed consolidated financial statements for further information about cash instruments.
These measures do not reflect diversification benefits across asset categories or across other market risk measures.
| | | | | | | | |
| | | As of | |
$ in millions Asset Categories | |
| March
2016 |
| |
| December
2015 |
|
Equity | | | $1,996 | | | | $2,157 | |
| | |
Debt | | | 1,670 | | | | 1,479 | |
Total | | | $3,666 | | | | $3,636 | |
| | | | |
| | Goldman Sachs March 2016 Form 10-Q | | 141 |
THE GOLDMAN SACHS GROUP, INC. AND SUBSIDIARIES
Management’s Discussion and Analysis
Credit Spread Sensitivity on Derivatives and Financial Liabilities. VaR excludes the impact of changes in counterparty and our own credit spreads on derivatives as well as changes in our own credit spreads (debt valuation adjustment) on financial liabilities for which the fair value option was elected. The estimated sensitivity to a one basis point increase in credit spreads (counterparty and our own) on derivatives was a gain of $2 million and $3 million (including hedges) as of both March 20162017 and December 2015, respectively.2016. In addition, the estimated sensitivity to a one basis point increase in our own credit spreads on financial liabilities for which the fair value option was elected was a gain of $23$28 million and $17$25 million (including hedges) as of March 20162017 and December 2015,2016, respectively. However, the actual net impact of a change in our own credit spreads is also affected by the liquidity, duration and convexity (as the sensitivity is not linear to changes in yields) of those financial liabilities for which the fair value option was elected, as well as the relative performance of any hedges undertaken.
Interest Rate Sensitivity. “Loans receivable” as of March 20162017 and December 20152016 were $47.92$50.39 billion and $45.41$49.67 billion, respectively, substantially all of which had floating interest rates. As of March 20162017 and December 2015,2016, the estimated sensitivity to a 100 basis point increase in interest rates on such loans was $419$397 million and $396$405 million, respectively, of additional interest income over a twelve-month period, which does not take into account the potential impact of an increase in costs to fund such loans. See Note 9 to the condensed consolidated financial statements for further information about loans receivable.
Other Market Risk Considerations
In addition, asAs of March 20162017 and December 2015,2016, we had commitments and held loans for which we have obtained credit loss protection from Sumitomo Mitsui Financial Group, Inc. See Note 18 to the condensed consolidated financial statements for further information about such lending commitments.
Additionally,In addition, we make investments accounted for under the equity method and we also make direct investments in real estate, both of which are included in “Other assets.” Direct investments in real estate are accounted for at cost less accumulated depreciation. See Note 13 to the condensed consolidated financial statements for further information about “Other assets.”
| | | | |
| | Goldman Sachs March 2017 Form 10-Q | | 135 |
THE GOLDMAN SACHS GROUP, INC. AND SUBSIDIARIES
Management’s Discussion and Analysis
Financial Statement Linkages to Market Risk Measures
We employ a variety of risk measures, each described in the respective sections above, to monitor market risk across the condensed consolidated statements of financial condition and condensed consolidated statements of earnings. The related gains and losses on these positions are included in “Market making,” “Other principal transactions,” “Interest income” and “Interest expense” in the condensed consolidated statements of earnings, and “Debt valuation adjustment” in the condensed consolidated statements of comprehensive income.
The table below presents certain categories in our condensed consolidated statements of financial condition and the market risk measures used to assess those assets and liabilities. Certain categories on the condensed consolidated statements of financial condition are incorporated in more than one risk measure.
| | |
Categories on the Condensed
Consolidated Statements of
Financial Condition Included in
Market Risk Measures | | Market Risk Measures |
Securities segregated for regulatory and other purposes, at fair value
| | • VaR
|
Collateralized agreementsagreements: • Securities purchased under agreements to resell, at fair value • Securities borrowed, at fair value | | • VaR |
ReceivablesReceivables:
| | |
• Certain secured loans, at fair value | | • VaR
|
• Loans receivable | | • VaR • Interest Rate Sensitivity |
Financial instruments owned, at fair value | | • VaR • 10% Sensitivity Measures • Credit Spread Sensitivity — Derivatives |
Deposits, at fair value | | • Credit Spread Sensitivity — Financial Liabilities |
Collateralized financingsfinancings: • Securities sold under agreements to repurchase, at fair value • Securities loaned, at fair value • Other secured financings, at fair value | | • VaR |
Financial instruments sold, but not yet purchased, at fair value | | • VaR • Credit Spread Sensitivity — Derivatives |
Unsecured short-term borrowings and unsecuredlong-term borrowings, at fair value | | • VaR • Credit Spread Sensitivity — Financial Liabilities |
| | | | |
142 | | Goldman Sachs March 2016 Form 10-Q | | |
THE GOLDMAN SACHS GROUP, INC. AND SUBSIDIARIES
Management’s Discussion and Analysis
Credit Risk Management
Overview
Credit risk represents the potential for loss due to the default or deterioration in credit quality of a counterparty (e.g., an OTC derivatives counterparty or a borrower) or an issuer of securities or other instruments we hold. Our exposure to credit risk comes mostly from client transactions in OTC derivatives and loans and lending commitments. Credit risk also comes from cash placed with banks, securities financing transactions (i.e., resale and repurchase agreements and securities borrowing and lending activities) and receivables from brokers, dealers, clearing organizations, customers and counterparties.
Credit Risk Management, which is independent of the revenue-producing units and reports to our chief risk officer, has primary responsibility for assessing, monitoring and managing credit risk at the firm.risk. The Credit Policy Committee and the Firmwide Risk Committee establish and review credit policies and parameters. In addition, we hold other positions that give rise to credit risk (e.g., bonds held in our inventory and secondary bank loans). These credit risks are captured as a component of market risk measures, which are monitored and managed by Market Risk Management, consistent with other inventory positions. We also enter into derivatives to manage market risk exposures. Such derivatives also give rise to credit risk, which is monitored and managed by Credit Risk Management.
Credit Risk Management Process
Effective management of credit risk requires accurate and timely information, a high level of communication and knowledge of customers, countries, industries and products. Our process for managing credit risk includes:
Approving transactions and setting and communicating credit exposure limits;
Establishing or approving underwriting standards;
Monitoring compliance with established credit exposure limits;
Assessing the likelihood that a counterparty will default on its payment obligations;
Measuring our current and potential credit exposure and losses resulting from counterparty default;
Reporting of credit exposures to senior management, the Board and regulators;
Use ofUsing credit risk mitigants, including collateral and hedging; and
CommunicationCommunicating and collaborationcollaborating with other independent control and support functions such as operations, legal and compliance.
| | | | |
| 136 | | Goldman Sachs March 2017 Form 10-Q | | |
THE GOLDMAN SACHS GROUP, INC. AND SUBSIDIARIES
Management’s Discussion and Analysis
As part of the risk assessment process, Credit Risk Management performs credit reviews, which include initial and ongoing analyses of our counterparties. For substantially all of our credit exposures, the core of our process is an annual counterparty credit review. A credit review is an independent analysis of the capacity and willingness of a counterparty to meet its financial obligations, resulting in an internal credit rating. The determination of internal credit ratings also incorporates assumptions with respect to the nature of and outlook for the counterparty’s industry, and the economic environment. Senior personnel within Credit Risk Management, with expertise in specific industries, inspect and approve credit reviews and internal credit ratings.
Our risk assessment process may also include, where applicable, reviewing certain key metrics, such as delinquency status, collateral values, credit scores and other risk factors.
Our global credit risk management systems capture credit exposure to individual counterparties and on an aggregate basis to counterparties and their subsidiaries (economic groups). These systems also provide management with comprehensive information on our aggregate credit risk by product, internal credit rating, industry, country and region.
Risk Measures and Limits
We measure our credit risk based on the potential loss in the event of non-payment by a counterparty using current and potential exposure. For derivatives and securities financing transactions, current exposure represents the amount presently owed to us after taking into account applicable netting and collateral arrangements while potential exposure represents our estimate of the future exposure that could arise over the life of a transaction based on market movements within a specified confidence level. Potential exposure also takes into account netting and collateral arrangements. For loans and lending commitments, the primary measure is a function of the notional amount of the position.
We use credit limits at various levels (counterparty,(e.g., counterparty, economic group, industry and country) as well as underwriting standards to control the size and nature of our credit exposures. Limits for counterparties and economic groups are reviewed regularly and revised to reflect changing risk appetites for a given counterparty or group of counterparties. Limits for industries and countries are based on our risk tolerance and are designed to allow for regular monitoring, review, escalation and management of credit risk concentrations. The Risk Committee of the Board and the Risk Governance Committee (through delegated authority from the Firmwide Risk CommitteeCommittee) approve credit risk limits at the firmwide, business and businessproduct levels. Credit Risk Management (through delegated authority from the Risk Governance Committee) sets credit limits for individual counterparties, economic groups, industries and countries. Policies authorized by the Firmwide Risk Committee, the Risk Governance Committee and the Credit Policy Committee prescribe the level of formal approval required for us to assume credit exposure to a counterparty across all product areas, taking into account any applicable netting provisions, collateral or other credit risk mitigants.
| | | | |
| | Goldman Sachs March 2016 Form 10-Q | | 143 |
THE GOLDMAN SACHS GROUP, INC. AND SUBSIDIARIES
Management’s Discussion and Analysis
Stress Tests
We use regular stress tests to calculate the credit exposures, including potential concentrations that would result from applying shocks to counterparty credit ratings or credit risk factors (e.g., currency rates, interest rates, equity prices). These shocks include a wide range of moderate and more extreme market movements. Some of our stress tests include shocks to multiple risk factors, consistent with the occurrence of a severe market or economic event. In the case of sovereign default, we estimate the direct impact of the default on our sovereign credit exposures, changes to our credit exposures arising from potential market moves in response to the default, and the impact of credit market deterioration on corporate borrowers and counterparties that may result from the sovereign default. Unlike potential exposure, which is calculated within a specified confidence level, with a stress test there is generally no assumed probability of these events occurring.
We runperform stress tests on a regular basis as part of our routine risk management processes and conduct tailored stress tests on an ad hoc basis in response to market developments. Stress tests are regularly conducted jointly with our market and liquidity risk functions.
Model Review and Validation
Our potential credit exposure and stress testing models, and any changes to such models or assumptions, are reviewed by Model Risk Management. See “Model Risk Management” for further information about the review and validation of these models.
| | | | |
| | Goldman Sachs March 2017 Form 10-Q | | 137 |
THE GOLDMAN SACHS GROUP, INC. AND SUBSIDIARIES
Management’s Discussion and Analysis
Risk Mitigants
To reduce our credit exposures on derivatives and securities financing transactions, we may enter into netting agreements with counterparties that permit us to offset receivables and payables with such counterparties. We may also reduce credit risk with counterparties by entering into agreements that enable us to obtain collateral from them on an upfront or contingent basis and/or to terminate transactions if the counterparty’s credit rating falls below a specified level. We monitor the fair value of the collateral on a daily basis to ensure that our credit exposures are appropriately collateralized. We seek to minimize exposures where there is a significant positive correlation between the creditworthiness of our counterparties and the market value of collateral we receive.
For loans and lending commitments, depending on the credit quality of the borrower and other characteristics of the transaction, we employ a variety of potential risk mitigants. Risk mitigants include collateral provisions, guarantees, covenants, structural seniority of the bank loan claims and, for certain lending commitments, provisions in the legal documentation that allow us to adjust loan amounts, pricing, structure and other terms as market conditions change. The type and structure of risk mitigants employed can significantly influence the degree of credit risk involved in a loan or lending commitment.
When we do not have sufficient visibility into a counterparty’s financial strength or when we believe a counterparty requires support from its parent, we may obtain third-party guarantees of the counterparty’s obligations. We may also mitigate our credit risk using credit derivatives or participation agreements.
Credit Exposures
As of March 2016,2017, our aggregate credit exposures increasedexposure was essentially unchanged as compared with December 2015, primarily reflecting increases in OTC derivatives and cash deposits with central banks, partially offset by decreases in loans and lending commitments.2016. The percentage of our credit exposureexposures arising from non-investment-grade counterparties (based on our internally determined public rating agency equivalents) decreased slightlyincreased as compared with December 2015, primarily2016, reflecting a decreasean increase in non-investment-grade loans and lending commitments. During the three months ended March 2016,2017, the number of counterparty defaults increaseddecreased as compared with the same prior year period, and such defaults primarily occurred within derivatives and loans and lending commitments. The total number of counterparty defaults remained low, representing less than 0.5% of all counterparties. Estimated losses associated with counterparty defaults were higherlower compared with the same prior year period and were not material to the firm.material. Our credit exposures are described further below.
Cash and Cash Equivalents. CashOur credit exposure on cash and cash equivalents includearises from our unrestricted cash, and includes both interest-bearing and non-interest-bearing deposits. To mitigate the risk of credit loss, we place substantially all of our deposits with highly-rated banks and central banks. Unrestricted cash was $107.86 billion and $107.06 billion as of March 2017 and December 2016, respectively, and excludes cash segregated for regulatory and other purposes of $15.18 billion and $14.65 billion as of March 2017 and December 2016, respectively.
OTC Derivatives. Our credit exposure on OTC derivatives arises primarily from our market-making activities. As a market maker, we enter into derivative transactions to provide liquidity to clients and to facilitate the transfer and hedging of their risks. We also enter into derivatives to manage market risk exposures. We manage our credit exposure on OTC derivatives using the credit risk process, measures, limits and risk mitigants described above.
| | | | |
144 | | Goldman Sachs March 2016 Form 10-Q | | |
THE GOLDMAN SACHS GROUP, INC. AND SUBSIDIARIES
Management’s Discussion and Analysis
Derivatives are reported on a net-by-counterparty basis (i.e., the net payable or receivable for derivative assets and liabilities for a given counterparty) when a legal right of setoff exists under an enforceable netting agreement. Derivatives are accounted for at fair value, net of cash collateral received or posted under enforceable credit support agreements. We generally enter into OTC derivatives transactions under bilateral collateral arrangements withthat require the daily exchange of collateral. As credit risk is an essential component of fair value, we include a credit valuation adjustment (CVA) in the fair value of derivatives to reflect counterparty credit risk, as described in Note 7 to the condensed consolidated financial statements. CVA is a function of the present value of expected exposure, the probability of counterparty default and the assumed recovery upon default.
The table below presents the distribution of our exposure to OTC derivatives by tenor, both before and after the effect of collateral and netting agreements.
| | $ in millions | |
| Investment-
Grade |
| |
| Non-Investment-
Grade / Unrated |
| | | Total | | |
| Investment-
Grade |
| |
| Non-Investment-
Grade / Unrated |
| | | Total | |
As of March 2016 | | | | | | | |
As of March 2017 | | | | | | | |
Less than 1 year | | | $ 22,780 | | | | $ 6,429 | | | | $ 29,209 | | | | $ 15,741 | | | | $ 4,125 | | | | $ 19,866 | |
| | | | | |
1 - 5 years | | | 36,440 | | | | 6,405 | | | | 42,845 | | | | 27,116 | | | | 3,462 | | | | 30,578 | |
| | | | | |
Greater than 5 years | | | 98,095 | | | | 6,049 | | | | 104,144 | | | | 82,762 | | | | 4,314 | | | | 87,076 | |
Total | | | 157,315 | | | | 18,883 | | | | 176,198 | | | | 125,619 | | | | 11,901 | | | | 137,520 | |
| | | | | |
Netting | | | (111,337 | ) | | | (7,933 | ) | | | (119,270 | ) | | | (88,567 | ) | | | (5,795 | ) | | | (94,362 | ) |
OTC derivative assets | | | $ 45,978 | | | | $10,950 | | | | $ 56,928 | | | | $ 37,052 | | | | $ 6,106 | | | | $ 43,158 | |
Net credit exposure | | | $ 29,328 | | | | $ 8,248 | | | | $ 37,576 | | | | $ 23,133 | | | | $ 5,171 | | | | $ 28,304 | |
As of December 2015 | | | | | | | |
As of December 2016 | | | | | | | |
Less than 1 year | | $ 23,950 | | | $ 3,965 | | | | $ 27,915 | | | $ 24,840 | | | | $ 3,983 | | | | $ 28,823 | |
| | | | | |
1 - 5 years | | 35,249 | | | 6,749 | | | | 41,998 | | | 30,801 | | | | 3,676 | | | | 34,477 | |
| | | | | |
Greater than 5 years | | 85,394 | | | 4,713 | | | | 90,107 | | | 85,951 | | | | 4,599 | | | | 90,550 | |
Total | | 144,593 | | | 15,427 | | | | 160,020 | | | 141,592 | | | | 12,258 | | | | 153,850 | |
| | | | | |
Netting | | (103,087 | ) | | (6,507 | ) | | | (109,594 | ) | | (96,493 | ) | | | (6,232 | ) | | | (102,725 | ) |
OTC derivative assets | | $ 41,506 | | | $ 8,920 | | | | $ 50,426 | | | $ 45,099 | | | | $ 6,026 | | | | $ 51,125 | |
Net credit exposure | | $ 27,001 | | | $ 7,368 | | | | $ 34,369 | | | $ 28,879 | | | | $ 4,922 | | | | $ 33,801 | |
| | | | |
| 138 | | Goldman Sachs March 2017 Form 10-Q | | |
THE GOLDMAN SACHS GROUP, INC. AND SUBSIDIARIES
Management’s Discussion and Analysis
In the table above:
Tenor is based on expected duration for mortgage-related credit derivatives and generally on remaining contractual maturity for other derivatives.
Receivable and payable balances with the same counterparty in the same tenor category are netted within such tenor category.
Receivable and payable balances for the same counterparty across tenor categories are netted under enforceable netting agreements, and cash collateral received is netted under enforceable credit support agreements.
Receivable and payable balances with the same counterparty in the same tenor category are netted within such tenor category.
Net credit exposure represents OTC derivative assets, included in “Financial instruments owned, at fair value,” less cash collateral and the fair value of securities collateral, primarily U.S. government and federal agency obligations and non-U.S. government and agency obligations, received under credit support agreements, which management considers when determining credit risk, but such collateral is not eligible for netting under U.S. GAAP.
The tables below present the distribution of our exposure to OTC derivatives by tenor and our internally determined public rating agency equivalents.
| | | | Investment-Grade | | | Investment-Grade | |
| $ in millions | | AAA | | | AA | | | A | | | BBB | | | Total | | | AAA | | | AA | | | A | | | BBB | | | Total | |
As of March 2016 | | | | | | | | | | | |
As of March 2017 | | | | | | | | | | | |
Less than 1 year | | | $ 302 | | | | $ 5,989 | | | | $ 9,406 | | | | $ 7,083 | | | | $ 22,780 | | | | $ 135 | | | | $ 3,469 | | | | $ 6,930 | | | | $ 5,207 | | | | $ 15,741 | |
| | | | | |
1 - 5 years | | | 994 | | | | 10,426 | | | | 16,416 | | | | 8,604 | | | | 36,440 | | | | 855 | | | | 7,858 | | | | 10,809 | | | | 7,594 | | | | 27,116 | |
| | | | | |
Greater than 5 years | | | 4,070 | | | | 43,546 | | | | 23,956 | | | | 26,523 | | | | 98,095 | | | | 3,425 | | | | 40,850 | | | | 17,456 | | | | 21,031 | | | | 82,762 | |
Total | | | 5,366 | | | | 59,961 | | | | 49,778 | | | | 42,210 | | | | 157,315 | | | | 4,415 | | | | 52,177 | | | | 35,195 | | | | 33,832 | | | | 125,619 | |
| | | | | |
Netting | | | (2,578 | ) | | | (42,184 | ) | | | (37,882 | ) | | | (28,693 | ) | | | (111,337 | ) | | | (1,734 | ) | | | (37,826 | ) | | | (26,884 | ) | | | (22,123 | ) | | | (88,567 | ) |
OTC derivative assets | | | $ 2,788 | | | | $ 17,777 | | | | $ 11,896 | | | | $ 13,517 | | | | $ 45,978 | | | | $ 2,681 | | | | $ 14,351 | | | | $ 8,311 | | | | $ 11,709 | | | | $ 37,052 | |
Net credit exposure | | | $ 2,647 | | | | $ 10,672 | | | | $ 7,629 | | | | $ 8,380 | | | | $ 29,328 | | | | $ 2,484 | | | | $ 8,746 | | | | $ 4,495 | | | | $ 7,408 | | | | $ 23,133 | |
As of December 2015 | | | | | | | | | | | |
As of December 2016 | | | | | | | | | | | |
Less than 1 year | | $ 411 | | | $ 6,059 | | | $ 10,051 | | | $ 7,429 | | | $ 23,950 | | | $ 332 | | | $ 4,907 | | | $ 12,595 | | | $ 7,006 | | | $ 24,840 | |
| | | | | |
1 - 5 years | | 1,214 | | | 10,374 | | | 16,995 | | | 6,666 | | | 35,249 | | | 862 | | | 6,898 | | | 12,814 | | | 10,227 | | | 30,801 | |
| | | | | |
Greater than 5 years | | 3,205 | | | 40,879 | | | 20,507 | | | 20,803 | | | 85,394 | | | 3,182 | | | 42,400 | | | 19,682 | | | 20,687 | | | 85,951 | |
Total | | 4,830 | | | 57,312 | | | 47,553 | | | 34,898 | | | 144,593 | | | 4,376 | | | 54,205 | | | 45,091 | | | 37,920 | | | 141,592 | |
| | | | | |
Netting | | (2,202 | ) | | (40,872 | ) | | (36,847 | ) | | (23,166 | ) | | (103,087 | ) | | (1,860 | ) | | (40,095 | ) | | (31,644 | ) | | (22,894 | ) | | (96,493 | ) |
OTC derivative assets | | $ 2,628 | | | $ 16,440 | | | $ 10,706 | | | $ 11,732 | | | $ 41,506 | | | $ 2,516 | | | $ 14,110 | | | $ 13,447 | | | $ 15,026 | | | $ 45,099 | |
Net credit exposure | | $ 2,427 | | | $ 10,269 | �� | | $ 6,652 | | | $ 7,653 | | | $ 27,001 | | | $ 2,283 | | | $ 8,366 | | | $ 8,401 | | | $ 9,829 | | | $ 28,879 | |
| | | | Non-Investment-Grade / Unrated | | | Non-Investment-Grade / Unrated | |
| $ in millions | | BB or lower | | | | Unrated | | | | Total | | | BB or lower | | | Unrated | | | Total | |
As of March 2016 | | | | | | | |
As of March 2017 | | | | | | | |
Less than 1 year | | | $ 5,711 | | | | $ 718 | | | | $ 6,429 | | | | $ 3,882 | | | | $ 243 | | | | $ 4,125 | |
| | | | | |
1 - 5 years | | | 6,299 | | | | 106 | | | | 6,405 | | | | 3,437 | | | | 25 | | | | 3,462 | |
| | | | | |
Greater than 5 years | | | 5,726 | | | | 323 | | | | 6,049 | | | | 4,268 | | | | 46 | | | | 4,314 | |
Total | | | 17,736 | | | | 1,147 | | | | 18,883 | | | | 11,587 | | | | 314 | | | | 11,901 | |
| | | | | |
Netting | | | (7,886 | ) | | | (47 | ) | | | (7,933 | ) | | | (5,755 | ) | | | (40 | ) | | | (5,795 | ) |
OTC derivative assets | | | $ 9,850 | | | | $1,100 | | | | $10,950 | | | | $ 5,832 | | | | $ 274 | | | | $ 6,106 | |
Net credit exposure | | | $ 7,425 | | | | $ 823 | | | | $ 8,248 | | | | $ 4,969 | | | | $ 202 | | | | $ 5,171 | |
As of December 2015 | | | | | | | |
As of December 2016 | | | | | | | |
Less than 1 year | | $ 3,657 | | | | $ 308 | | | | $ 3,965 | | | $ 3,661 | | | $ 322 | | | $ 3,983 | |
| | | | | |
1 - 5 years | | 6,505 | | | | 244 | | | | 6,749 | | | 3,653 | | | 23 | | | 3,676 | |
| | | | | |
Greater than 5 years | | 4,434 | | | | 279 | | | | 4,713 | | | 4,437 | | | 162 | | | 4,599 | |
Total | | 14,596 | | | | 831 | | | | 15,427 | | | 11,751 | | | 507 | | | 12,258 | |
| | | | | |
Netting | | (6,472 | ) | | | (35 | ) | | | (6,507 | ) | | (6,207 | ) | | (25 | ) | | (6,232 | ) |
OTC derivative assets | | $ 8,124 | | | | $ 796 | | | | $ 8,920 | | | $ 5,544 | | | $ 482 | | | $ 6,026 | |
Net credit exposure | | $ 6,769 | | | | $ 599 | | | | $ 7,368 | | | $ 4,569 | | | $ 353 | | | $ 4,922 | |
| | | | |
| | Goldman Sachs March 2016 Form 10-Q | | 145 |
THE GOLDMAN SACHS GROUP, INC. AND SUBSIDIARIES
Management’s Discussion and Analysis
Lending and Financing Activities. We manage our lending and financing activities using the credit risk process, measures, limits and risk mitigants described above. Other lending positions, including secondary trading positions, are risk-managed as a component of market risk.
Lending Activities. Our lending activities include lending to investment-grade and non-investment-grade corporate borrowers. Loans and lending commitments associated with these activities are principally used for operating liquidity and general corporate purposes or in connection with contingent acquisitions. Corporate loans may be secured or unsecured, depending on the loan purpose, the risk profile of the borrower and other factors. Our lending activities also include extending loans to borrowers that are secured by commercial and other real estate. See the tables below for further information about our credit exposures associated with these lending activities.
Securities Financing Transactions. We enter into securities financing transactions in order to, among other things, facilitate client activities, invest excess cash, acquire securities to cover short positions and finance certain firm activities. We bear credit risk related to resale agreements and securities borrowed only to the extent that cash advanced or the value of securities pledged or delivered to the counterparty exceeds the value of the collateral received. We also have credit exposure on repurchase agreements and securities loaned to the extent that the value of securities pledged or delivered to the counterparty for these transactions exceeds the amount of cash or collateral received. Securities collateral obtained for securities financing transactions primarily includes U.S. government and federal agency obligations and non-U.S. government and agency obligations. We had approximately $24$30 billion and $27$29 billion as of March 20162017 and December 2015,2016, respectively, of credit exposure related to securities financing transactions reflecting both netting agreements and collateral that management considers when determining credit risk. As of both March 20162017 and December 2015,2016, substantially all of our credit exposure related to securities financing transactions was with investment-grade financial institutions, funds and governments, primarily located in the Americas and EMEA.
| | | | |
| | Goldman Sachs March 2017 Form 10-Q | | 139 |
THE GOLDMAN SACHS GROUP, INC. AND SUBSIDIARIES
Management’s Discussion and Analysis
Other Credit Exposures. We are exposed to credit risk from our receivables from brokers, dealers and clearing organizations and customers and counterparties. Receivables from brokers, dealers and clearing organizations are primarily comprised of initial margin placed with clearing organizations and receivables related to sales of securities which have traded, but not yet settled. These receivables generally have minimal credit risk due to the low probability of clearing organization default and the short-term nature of receivables related to securities settlements. Receivables from customers and counterparties are generally comprised of collateralized receivables related to customer securities transactions and generally have minimal credit risk due to both the value of the collateral received and the short-term nature of these receivables. Our net credit exposure related to these activities was approximately $36$30 billion and $33$31 billion as of March 20162017 and December 2015,2016, respectively, and was primarily comprised of initial margin (both cash and securities) placed with investment-grade clearing organizations. The regional breakdown of our net credit exposure related to these activities was approximately 48%39% and 44% in the Americas, approximately 40%47% and 45%42% in EMEA, and approximately 12%14% and 11%14% in Asia as of March 20162017 and December 2015,2016, respectively.
In addition, we extend other loans and lending commitments to our private wealth management clients that are primarily secured by residential real estate, securities or other assets. We also purchase performing and distressed loans backed by residential real estate and consumer loans. The gross exposure related to such loans and lending commitments was approximately $28 billion as of both March 2016 and December 2015. The regional breakdown of our net credit exposure related to these activities was approximately 83% and 84% in the Americas, approximately 14% and 14% in EMEA, and approximately 3% and 2% in Asia as of March 2016 and December 2015, respectively. The fair value of the collateral received against such loans and lending commitments generally exceeded the gross exposure as of both March 2016 and December 2015.
| | | | |
146 | | Goldman SachsIn addition, we extend other loans and lending commitments to our private wealth management clients that are primarily secured by residential real estate, securities or other assets. We also purchase performing and distressed loans backed by residential real estate and consumer loans. The gross exposure related to such loans and lending commitments was approximately $29 billion and $28 billion as of March 2017 and December 2016, Form 10-Q | | respectively. The regional breakdown of our net credit exposure related to these activities was approximately 88% and 90% in the Americas, approximately 10% and 8% in EMEA, and approximately 2% and 2% in Asia as of March 2017 and December 2016, respectively. The fair value of the collateral received against such loans and lending commitments generally exceeded the gross carrying value as of both March 2017 and December 2016. |
THE GOLDMAN SACHS GROUP, INC. AND SUBSIDIARIES
Management’s DiscussionCredit Exposure by Industry, Region and AnalysisCredit Quality
| | | | |
Credit Exposure by Industry, Region and Credit Quality | | | | |
The tables below present our credit exposure related to cash, OTC derivatives, and loans and lending commitments (excluding credit exposures described above in “Securities Financing Transactions” and “Other Credit Exposures”) broken down by industry, region and credit quality.
| | | | Cash as of | | | Cash as of | |
| $ in millions | |
| March
2016 |
| |
| December
2015 |
| |
| March
2017 |
| |
| December
2016 |
|
Credit Exposure by Industry | | | | | | | | |
Funds | | | $ 322 | | | | $ 176 | | | | $ — | | | | $ 138 | |
| | | | | |
Financial Institutions | | | 12,993 | | | | 12,799 | | | | 14,485 | | | | 11,836 | |
| | | | | |
Sovereign | | | 65,854 | | | | 62,130 | | | | 93,366 | | | | 95,092 | |
Total | | | $79,169 | | | | $75,105 | | | | $107,851 | | | | $107,066 | |
Credit Exposure by Region | | | | | | | | |
Americas | | | $55,697 | | | | $54,846 | | | | $ 74,645 | | | | $ 80,381 | |
| | | | | |
EMEA | | | 11,807 | | | | 8,496 | | | | 20,158 | | | | 16,099 | |
| | | | | |
Asia | | | 11,665 | | | | 11,763 | | | | 13,048 | | | | 10,586 | |
Total | | | $79,169 | | | | $75,105 | | | | $107,851 | | | | $107,066 | |
Credit Exposure by Credit Quality (Credit Rating Equivalent) | Credit Exposure by Credit Quality (Credit Rating Equivalent) | | Credit Exposure by Credit Quality (Credit Rating Equivalent) | |
AAA | | | $59,220 | | | | $55,626 | | | | $ 81,542 | | | | $ 83,899 | |
| | | | | |
AA | | | 3,862 | | | | 4,286 | | | | 9,229 | | | | 8,784 | |
| | | | | |
A | | | 13,677 | | | | 14,243 | | | | 15,838 | | | | 13,344 | |
| | | | | |
BBB | | | 2,267 | | | | 855 | | | | 1,183 | | | | 971 | |
| | | | | |
BB or lower | | | 143 | | | | 95 | | | | 59 | | | | 68 | |
Total | | | $79,169 | | | | $75,105 | | | | $107,851 | | | | $107,066 | |
| | | | OTC Derivatives as of | | |
| $ in millions | |
| March
2016 |
| |
| December
2015 |
| |
Credit Exposure by Industry | | | | | |
Funds | | | $14,824 | | | | $10,899 | | |
| | | |
Financial Institutions | | | 15,647 | | | | 14,526 | | |
| | | |
Consumer, Retail & Healthcare | | | 1,721 | | | | 1,553 | | |
| | | |
Sovereign | | | 8,590 | | | | 7,566 | | |
| | | |
Municipalities & Nonprofit | | | 4,642 | | | | 3,984 | | |
| | | |
Natural Resources & Utilities | | | 4,690 | | | | 4,846 | | |
| | | |
Real Estate | | | 326 | | | | 205 | | |
| | | |
Technology, Media & Telecommunications | | | 2,411 | | | | 1,839 | | |
| | | |
Diversified Industrials | | | 4,077 | | | | 5,008 | | |
Total | | | $56,928 | | | | $50,426 | | |
Credit Exposure by Region | | | | | |
Americas | | | $21,860 | | | | $17,724 | | |
| | | |
EMEA | | | 29,799 | | | | 27,113 | | |
| | | |
Asia | | | 5,269 | | | | 5,589 | | |
Total | | | $56,928 | | | | $50,426 | | |
Credit Exposure by Credit Quality (Credit Rating Equivalent) | | |
AAA | | | $ 2,788 | | | | $ 2,628 | | |
| | | |
AA | | | 17,777 | | | | 16,440 | | |
| | | |
A | | | 11,896 | | | | 10,706 | | |
| | | |
BBB | | | 13,517 | | | | 11,732 | | |
| | | |
BB or lower | | | 9,850 | | | | 8,124 | | |
| | | |
Unrated | | | 1,100 | | | | 796 | | |
Total | | | $56,928 | | | | $50,426 | | |
| | | | | | | | |
| | | OTC Derivatives as of | |
| $ in millions | |
| March
2017 |
| |
| December
2016 |
|
Credit Exposure by Industry | | | | | | | | |
Funds | | | $ 11,467 | | | | $ 13,294 | |
| | |
Financial Institutions | | | 10,760 | | | | 14,116 | |
| | |
Consumer, Retail & Healthcare | | | 933 | | | | 773 | |
| | |
Sovereign | | | 7,550 | | | | 7,019 | |
| | |
Municipalities & Nonprofit | | | 2,832 | | | | 2,959 | |
| | |
Natural Resources & Utilities | | | 2,969 | | | | 3,707 | |
| | |
Real Estate | | | 118 | | | | 85 | |
| | |
Technology, Media & Telecommunications | | | 1,981 | | | | 4,188 | |
| | |
Diversified Industrials | | | 2,829 | | | | 2,529 | |
| | |
Other (including Special Purpose Vehicles) | | | 1,719 | | | | 2,455 | |
Total | | | $ 43,158 | | | | $ 51,125 | |
Credit Exposure by Region | | | | | | | | |
Americas | | | $ 13,827 | | | | $ 19,629 | |
| | |
EMEA | | | 26,210 | | | | 26,536 | |
| | |
Asia | | | 3,121 | | | | 4,960 | |
Total | | | $ 43,158 | | | | $ 51,125 | |
Credit Exposure by Credit Quality (Credit Rating Equivalent) | |
AAA | | | $ 2,681 | | | | $ 2,516 | |
| | |
AA | | | 14,351 | | | | 14,110 | |
| | |
A | | | 8,311 | | | | 13,447 | |
| | |
BBB | | | 11,709 | | | | 15,026 | |
| | |
BB or lower | | | 5,832 | | | | 5,544 | |
| | |
Unrated | | | 274 | | | | 482 | |
Total | | | $ 43,158 | | | | $ 51,125 | |
| | | | | | | | |
| | | Loans and Lending
Commitments as of | |
| $ in millions | |
| March
2016 |
| |
| December
2015 |
|
Credit Exposure by Industry | | | | | | | | |
Funds | | | $ 2,272 | | | | $ 2,595 | |
| | |
Financial Institutions | | | 13,472 | | | | 14,063 | |
| | |
Consumer, Retail & Healthcare | | | 27,888 | | | | 31,944 | |
| | |
Sovereign | | | 393 | | | | 419 | |
| | |
Municipalities & Nonprofit | | | 959 | | | | 628 | |
| | |
Natural Resources & Utilities | | | 25,300 | | | | 24,476 | |
| | |
Real Estate | | | 14,211 | | | | 15,045 | |
| | |
Technology, Media & Telecommunications | | | 30,700 | | | | 36,444 | |
| | |
Diversified Industrials | | | 22,012 | | | | 20,047 | |
| | |
Other | | | 15,224 | | | | 13,941 | |
Total | | | $152,431 | | | | $159,602 | |
Credit Exposure by Region | | | | | | | | |
Americas | | | $113,479 | | | | $121,271 | |
| | |
EMEA | | | 32,167 | | | | 33,061 | |
| | |
Asia | | | 6,785 | | | | 5,270 | |
Total | | | $152,431 | | | | $159,602 | |
Credit Exposure by Credit Quality (Credit Rating Equivalent) | |
AAA | | | $ 3,852 | | | | $ 4,148 | |
| | |
AA | | | 8,257 | | | | 7,716 | |
| | |
A | | | 27,566 | | | | 27,212 | |
| | |
BBB | | | 40,365 | | | | 43,937 | |
| | |
BB or lower | | | 72,106 | | | | 76,049 | |
| | |
Unrated | | | 285 | | | | 540 | |
Total | | | $152,431 | | | | $159,602 | |
| | | | |
| 140 | | Goldman Sachs March 2017 Form 10-Q | | |
THE GOLDMAN SACHS GROUP, INC. AND SUBSIDIARIES
Management’s Discussion and Analysis
| | | | | | | | |
| | | Loans and Lending
Commitments as of | |
| $ in millions | |
| March
2017 |
| |
| December
2016 |
|
Credit Exposure by Industry | |
Funds | | | $ 4,245 | | | | $ 3,854 | |
| | |
Financial Institutions | | | 14,462 | | | | 13,630 | |
| | |
Consumer, Retail & Healthcare | | | 28,665 | | | | 30,007 | |
| | |
Sovereign | | | 505 | | | | 902 | |
| | |
Municipalities & Nonprofit | | | 683 | | | | 709 | |
| | |
Natural Resources & Utilities | | | 25,063 | | | | 25,694 | |
| | |
Real Estate | | | 15,736 | | | | 13,034 | |
| | |
Technology, Media & Telecommunications | | | 32,604 | | | | 33,232 | |
| | |
Diversified Industrials | | | 24,409 | | | | 20,847 | |
| | |
Other (including Special Purpose Vehicles) | | | 13,064 | | | | 12,301 | |
Total | | | $159,436 | | | | $154,210 | |
Credit Exposure by Region | |
Americas | | | $119,143 | | | | $115,145 | |
| | |
EMEA | | | 36,232 | | | | 35,044 | |
| | |
Asia | | | 4,061 | | | | 4,021 | |
Total | | | $159,436 | | | | $154,210 | |
Credit Exposure by Credit Quality (Credit Rating Equivalent) | |
AAA | | | $ 3,085 | | | | $ 3,135 | |
| | |
AA | | | 8,616 | | | | 8,375 | |
| | |
A | | | 30,393 | | | | 29,227 | |
| | |
BBB | | | 43,875 | | | | 43,151 | |
| | |
BB or lower | | | 73,407 | | | | 69,745 | |
| | |
Unrated | | | 60 | | | | 577 | |
Total | | | $159,436 | | | | $154,210 | |
Selected Exposures
The section below provides information about our credit and market exposure to certain jurisdictions and industriescountries that have had heightened focus due to recent events and broad market concerns. Credit exposure represents the potential for loss due to the default or deterioration in credit quality of a counterparty or borrower. Market exposure represents the potential for loss in value of our long and short inventory due to changes in market prices. There is no overlap between the credit and market exposures in the amounts below.
Country Exposures. The decline inCurrent levels of oil prices continuescontinue to raise concerns about Venezuela and Nigeria, and theirits sovereign debt. The political situationssituation in Iraq has led to ongoing concerns about its economic stability. The debt crisis in Mozambique has resulted in the suspension of its funding by the International Monetary Fund and Russia,the World Bank, as well as the decline in oil prices, have led to continued concerns about their economic and financial stability. In addition, Argentina continues to face long-term economic and financial challenges; however, the government accessed international capital markets in the second quarter of 2016. Separately, signs of slowing growth in China and deteriorating macroeconomic conditions in Brazil have led to heightened focus and broad market concerns relating to these countries.
| | | | |
| | Goldman Sachs March 2016 Form 10-Q | | 147 |
THE GOLDMAN SACHS GROUP, INC. AND SUBSIDIARIES
Management’s Discussion and Analysis
As of March 2016, our total credit exposure to Russia was $276 million, which was with non-sovereign counterparties or borrowers, and was primarily related to loans and lending commitments. In addition, our total market exposure to Russia as of March 2016 was $918 million, which was primarily with non-sovereign issuers or underliers and was primarily related to equities and credit derivatives.
As of March 2016, our total credit exposure to China was $4.1 billion, substantially all of which was with non-sovereign counterparties or borrowers, and primarily related to deposits with banks and loans and lending commitments. In addition, our total market exposure to China as of March 2016 was $1.8 billion and was substantially all related to equities.
As of March 2016, our total credit exposure to Brazil was $4.2 billion. Substantially all of such exposure was with non-sovereign counterparties or borrowers, and substantially all related to secured receivables and initial margin placed with clearing organizations. In addition, our total market exposure to Brazil as of March 2016 was $1.8 billion and was primarily related to sovereign debt.rating downgrades.
Our total credit and market exposure to each of Argentina, Iraq, Venezuela, and NigeriaMozambique as of March 20162017 was not material.
We have a comprehensive framework to monitor, measure and assess our country exposures and to determine our risk appetite. We determine the country of risk by the location of the counterparty, issuer or underlier’s assets, where they generate revenue, the country in which they are headquartered, the jurisdiction where a claim against them could be enforced, and/or the government whose policies affect their ability to repay their obligations. We monitor our credit exposure to a specific country both at the individual counterparty level as well as at the aggregate country level.
We use regular stress tests, described above, to calculate the credit exposures, including potential concentrations that would result from applying shocks to counterparty credit ratings or credit risk factors. To supplement these regular stress tests, we also conduct tailored stress tests on an ad hoc basis in response to specific market events that we deem significant. These stress tests are designed to estimate the direct impact of the event on our credit and market exposures resulting from shocks to risk factors including, but not limited to, currency rates, interest rates, and equity prices. We also utilize these stress tests to estimate the indirect impact of certain hypothetical events on our country exposures, such as the impact of credit market deterioration on corporate borrowers and counterparties along with the shocks to the risk factors described above. The parameters of these shocks vary based on the scenario reflected in each stress test. We review estimated losses produced by the stress tests in order to understand their magnitude, highlight potential loss concentrations, and assess and mitigate our exposures where necessary.
See “Stress Tests” above, “Liquidity Risk Management — Liquidity Stress Tests” and “Market Risk Management — Market Risk Management Process — Stress Testing” for further information about stress tests.
Industry Exposures. Significant declines in the price of oil have led to market concerns regarding the creditworthiness of certain companies in the oil and gas industry. As of March 2016, our credit exposure to oil and gas companies related to loans and lending commitments was $10.7 billion ($2.2 billion of loans and $8.5 billion of lending commitments). Such exposure included $5.0 billion of exposure to non-investment-grade counterparties ($1.6 billion related to loans and $3.4 billion related to lending commitments). In addition, we have exposure to our clients in the oil and gas industry arising from derivatives. As of March 2016, our credit exposure related to derivatives and receivables with oil and gas companies was $1.7 billion, primarily with investment-grade counterparties. As of March 2016, our market exposure related to oil and gas companies was $(532) million, which was primarily to investment-grade issuers or underliers.
| | | | |
148 | | Goldman Sachs March 2016 Form 10-Q | | |
THE GOLDMAN SACHS GROUP, INC. AND SUBSIDIARIES
Management’s Discussion and Analysis
Operational Risk Management
Overview
Operational risk is the risk of loss resulting from inadequate or failed internal processes, people and systems or from external events. Our exposure to operational risk arises from routine processing errors as well as extraordinary incidents, such as major systems failures or legal and regulatory matters.
Potential types of loss events related to internal and external operational risk include:
Clients, products and business practices;
Execution, delivery and process management;
| | | | |
| | Goldman Sachs March 2017 Form 10-Q | | 141 |
THE GOLDMAN SACHS GROUP, INC. AND SUBSIDIARIES
Management’s Discussion and Analysis
Business disruption and system failures;
Employment practices and workplace safety;
Damage to physical assets;
We maintain a comprehensive control framework designed to provide a well-controlled environment to minimize operational risks. The Firmwide Operational Risk Committee provides oversight of the ongoing development and implementation of our operational risk policies and framework. Operational Risk Management is a risk management function independent of our revenue-producing units, reports to our chief risk officer, and is responsible for developing and implementing policies, methodologies and a formalized framework for operational risk management with the goal of minimizingmaintaining our exposure to operational risk.risk at levels that are within our risk appetite.
Operational Risk Management Process
Managing operational risk requires timely and accurate information as well as a strong control culture. We seek to manage our operational risk through:
Training, supervision and development of our people;
Active participation of senior management in identifying and mitigating our key operational risks across the firm;risks;
Independent control and support functions that monitor operational risk on a daily basis, and implementation of extensive policies and procedures, and controls designed to prevent the occurrence of operational risk events;
Proactive communication between our revenue-producingrevenue producing units and our independent control and support functions; and
A network of systems throughout the firm to facilitate the collection of data used to analyze and assess our operational risk exposure.
We combine top-down and bottom-up approaches to manage and measure operational risk. From a top-down perspective, our senior management assesses firmwide and business-level operational risk profiles. From a bottom-up perspective, revenue-producing units and independent control and support functions are responsible for risk identification and risk management on a day-to-day basis, including identifying, mitigating, and escalating operational risks to senior management.
Our operational risk management framework is in part designed to comply with the operational risk measurement rules under the Revised Capital Framework and has evolved based on the changing needs of our businesses and regulatory guidance.
Our operational risk management framework comprises the following practices:
Risk identification and reporting;assessment;
Risk monitoring.monitoring and reporting.
Internal Audit performs an independent review of our operational risk management framework, including our key controls, processes and applications, on an annual basis to assess the effectiveness of our framework.
| | | | |
| | Goldman Sachs March 2016 Form 10-Q | | 149 |
THE GOLDMAN SACHS GROUP, INC. AND SUBSIDIARIES
Management’s Discussion and Analysis
Risk Identification and ReportingAssessment
The core of our operational risk management framework is risk identification and reporting.assessment. We have a comprehensive data collection process, including firmwide policies and procedures, for operational risk events.
We have established policies that require managers in our revenue-producing units and our independent control and support functions to report and escalate operational risk events. When operational risk events are identified, our policies require that the events be documented and analyzed to determine whether changes are required in our systems and/or processes to further mitigate the risk of future events.
We have established thresholds to monitor the impact of an operational risk event, including single loss events and cumulative losses over a twelve-month period, as well as escalation protocols. We also provide periodic operational risk reports, which include incidents that breach escalation thresholds, to senior management, firmwide and divisional risk committees and the Risk Committee of the Board.
In addition, our firmwide systems capture internal operational risk event data, key metrics such as transaction volumes, and statistical information such as performance trends. We use an internally-developedinternally developed operational risk management application to aggregate and organize this information. ManagersOne of our key risk identification and assessment tools is an operational risk and control self-assessment process, which is performed by managers from both revenue-producing units and independent control and support functions analyzefunctions. This process consists of the informationidentification and rating of operational risks, on a forward-looking basis, and the related controls. The results from this process are analyzed to evaluate operational risk exposures and identify businesses, activities or products with heightened levels of operational risk. We also provide periodic operational risk reports to senior management, risk committees and the Board.
Risk Measurement
We measure our operational risk exposure over a twelve-month time horizon using both statistical modeling and scenario analyses, which involve qualitative assessments of the potential frequency and extent of potential operational risk losses, for each of our businesses. Operational risk measurement incorporates qualitative and quantitative assessments of factors including:
Internal and external operational risk event data;
Assessments of our internal controls;
| | | | |
| 142 | | Goldman Sachs March 2017 Form 10-Q | | |
THE GOLDMAN SACHS GROUP, INC. AND SUBSIDIARIES
Management’s Discussion and Analysis
Evaluations of the complexity of our business activities;
The degree of and potential for automation in our processes;
New productactivity information;
The legal and regulatory environment;
Changes in the markets for our products and services, including the diversity and sophistication of our customers and counterparties; and
Liquidity of the capital markets and the reliability of the infrastructure that supports the capital markets.
The results from these scenario analyses are used to monitor changes in operational risk and to determine business lines that may have heightened exposure to operational risk. These analyses ultimately are used in the determination of the appropriate level of operational risk capital to hold.
Risk Monitoring and Reporting
We evaluate changes in theour operational risk profile of the firm and itsour businesses, including changes in business mix or jurisdictions in which we operate, by monitoring the factors noted above at a firmwide level. We have both detectivepreventive and preventivedetective internal controls, which are designed to reduce the frequency and severity of operational risk losses and the probability of operational risk events. We monitor the results of assessments and independent internal audits of these internal controls.
We also provide periodic operational risk reports to senior management, risk committees and the Board. In addition, we have established thresholds to monitor the impact of an operational risk event, including single loss events and cumulative losses over a twelve-month period, as well as escalation protocols. We also provide periodic operational risk reports, which include incidents that breach escalation thresholds, to senior management, firmwide and divisional risk committees and the Risk Committee of the Board.
Model Review and Validation
The statistical models utilized by Operational Risk Management are subject to independent review and validation by Model Risk Management. See “Model Risk Management” for further information about the review and validation of these models.
| | | | |
150 | | Goldman Sachs March 2016 Form 10-Q | | |
THE GOLDMAN SACHS GROUP, INC. AND SUBSIDIARIES
Management’s Discussion and Analysis
Model Risk Management
Overview
Model risk is the potential for adverse consequences from decisions made based on model outputs that may be incorrect or used inappropriately. We rely on quantitative models across our business activities primarily to value certain financial assets and liabilities, to monitor and manage our risk, and to measure and monitor our regulatory capital.
Our model risk management framework is managed through a governance structure and risk management controls, which encompass standards designed to ensure we maintain a comprehensive model inventory, including risk assessment and classification, sound model development practices, independent review and model-specific usage controls. The Firmwide Risk Committee and the Firmwide Model Risk Control Committee oversee our model risk management framework. Model Risk Management, which is independent of model developers, model owners and model users, reports to our chief risk officer, is responsible for identifying and reporting significant risks associated with models, and provides periodic updates to senior management, risk committees and the Risk Committee of the Board.
Model Review and Validation
Model Risk Management consists of quantitative professionals who perform an independent review, validation and approval of our models. This review includes an analysis of the model documentation, independent testing, an assessment of the appropriateness of the methodology used, and verification of compliance with model development and implementation standards. Model Risk Management reviews all existing models on an annual basis, as well as new models or significant changes to models.
The model validation process incorporates a review of models and trade and risk parameters across a broad range of scenarios (including extreme conditions) in order to critically evaluate and verify:
The model’s conceptual soundness, including the reasonableness of model assumptions, and suitability for intended use;
The testing strategy utilized by the model developers to ensure that the models function as intended;
The suitability of the calculation techniques incorporated in the model;
The model’s accuracy in reflecting the characteristics of the related product and its significant risks;
The model’s consistency with models for similar products; and
The model’s sensitivity to input parameters and assumptions.
See “Critical Accounting Policies — Fair Value — Review of Valuation Models,” “Liquidity Risk Management,” “Market Risk Management,” “Credit Risk Management” and “Operational Risk Management” for further information about our use of models within these areas.
| | | | |
| | | Goldman Sachs March 20162017 Form 10-Q | | 151143 |
THE GOLDMAN SACHS GROUP, INC. AND SUBSIDIARIES
Management’s Discussion and Analysis
Available Information
Our internet address is www.gs.com and the investor relations section of our web sitewebsite is located at www.gs.com/shareholders. We make available free of charge through the investor relations section of our web site,website, annual reports on Form 10-K, quarterly reports on Form 10-Q and current reports on Form 8-K and amendments to those reports filed or furnished pursuant to Section 13(a) or 15(d) of the U.S. Securities Exchange Act of 1934 (Exchange Act), as well as proxy statements, as soon as reasonably practicable after we electronically file such material with, or furnish it to, the SEC. Also posted on our web site,website, and available in print upon request of any shareholder to our Investor Relations Department, are our certificate of incorporation and by-laws, charters for our Audit Committee, Risk Committee, Compensation Committee, Corporate Governance and Nominating Committee, and Public Responsibilities Committee, our Policy Regarding Director Independence Determinations, our Policy on Reporting of Concerns Regarding Accounting and Other Matters, our Corporate Governance Guidelines and our Code of Business Conduct and Ethics governing our directors, officers and employees. Within the time period required by the SEC, we will post on our web sitewebsite any amendment to the Code of Business Conduct and Ethics and any waiver applicable to any executive officer, director or senior financial officer.
In addition, our web sitewebsite includes information concerning:
Purchases and sales of our equity securities by our executive officers and directors;
Disclosure relating to certain non-GAAP financial measures (as defined in the SEC’s Regulation G) that we may make public orally, telephonically, by webcast, by broadcast or by similarother means from time to time;
The public portion of our resolution plan submission; and
The firm’sOur risk management practices and regulatory capital ratios, as required under the disclosure-related provisions of the Federal Reserve Board’s capital rules.Revised Capital Framework, which are based on the third pillar of Basel III.
Our Investor Relations Department can be contacted at The Goldman Sachs Group, Inc., 200 West Street, 29th Floor, New York, New York 10282, Attn: Investor Relations, telephone: 212-902-0300, e-mail:gs-investor-relations@gs.com.
| | | | |
152144 | | Goldman Sachs March 20162017 Form 10-Q | | |
THE GOLDMAN SACHS GROUP, INC. AND SUBSIDIARIES
Management’s Discussion and Analysis
| | | | |
Cautionary Statement Pursuant to the U.S. Private Securities Litigation Reform Act
of 1995 | | | | |
We have included or incorporated by reference in the March 2016this Form 10-Q, and from time to time our management may make, statements that may constitute“forward-looking “forward-looking statements” within the meaning of the safe harbor provisions of the U.S. Private Securities Litigation Reform Act of 1995. Forward-looking statements are not historical facts, but instead represent only our beliefs regarding future events, many of which, by their nature, are inherently uncertain and outside our control. These statements include statements other than historical information or statements of current conditionconditions and may relate to our future plans and objectives and results, among other things, and may also include statements about the effect of changes to the capital, leverage, liquidity, long-term debt and total loss-absorbing capacity rules applicable to banks and bank holding companies, the impact of the Dodd-Frank Act on our businesses and operations, and various legal proceedings, governmental investigations or mortgage-related contingencies as set forth in Notes 27 and 18, respectively, to the condensed consolidated financial statements, as well as statements about the results of our Dodd-Frank Act and firm stress tests, statements about the objectives and effectiveness of our business continuity plan, information security program, risk management and liquidity policies, statements about our resolution plan and resolution strategy and their implications for our debtholders and other stakeholders, statements about trends in or growth opportunities for our businesses, statements about our future status, activities or reporting under U.S. or non-U.S. banking and financial regulation and statements about our investment banking transaction backlog. By identifying these statements for you in this manner, we are alerting you to the possibility that our actual results and financial condition may differ, possibly materially, from the anticipated results and financial condition indicated in theseforward-looking statements. Important factors that could cause our actual results and financial condition to differ from those indicated in the forward-looking statements include, among others, those described below and underin “Risk Factors” in Part I, Item 1A of the 20152016 Form 10-K.
Statements about our investment banking transaction backlog are subject to the risk that the terms of these transactions may be modified or that they may not be completed at all; therefore, the net revenues, if any, that we actually earn from these transactions may differ, possibly materially, from those currently expected. Important factors that could result in a modification of the terms of a transaction or a transaction not being completed include, in the case of underwriting transactions, a decline or continued weakness in general economic conditions, outbreak of hostilities, volatility in the securities markets generally or an adverse development with respect to the issuer of the securities and, in the case of financial advisory transactions, a decline in the securities markets, an inability to obtain adequate financing, an adverse development with respect to a party to the transaction or a failure to obtain a required regulatory approval. For information about other important factors that could adversely affect our investment banking transactions, see “Risk Factors” in Part I, Item 1A of the 20152016 Form 10-K.
We have provided in this filing information regarding the firm’sour capital, liquidity and leverage ratios, including the CET1 ratios under the Advanced and Standardized approaches on a fully phased-in basis, as well as the LCRour NSFR, and the supplementary leverage ratios for the firmus and GS Bank USA. The statements with respect to these ratios are forward-looking statements, based on our current interpretation, expectations and understandings of the relevant regulatory rules, guidance and guidance,proposals, and reflect significant assumptions concerning the treatment of various assets and liabilities and the manner in which the ratios are calculated. As a result, the methods used to calculate these ratios may differ, possibly materially, from those used in calculating the firm’sour and, where applicable, GS Bank USA’s capital, liquidity and leverage ratios for any future disclosures. The ultimate methods of calculating the ratios will depend on, among other things, implementation guidance or further rulemaking from the U.S. federal bank regulatory agencies and the development of market practices and standards.
| | | | |
| | | Goldman Sachs March 20162017 Form 10-Q | | 153145 |
Item 3. Quantitative and Qualitative Disclosures About Market Risk
Quantitative and qualitative disclosures about market risk are set forth underin “Management’s Discussion and Analysis of Financial Condition and Results of Operations ––— Risk Management — Market Risk Management” in Part I, Item 2 above.of this Form 10-Q.
Item 4. Controls and Procedures
As of the end of the period covered by this report, an evaluation was carried out by Goldman Sachs’our management, with the participation of our Chief Executive Officer and Chief Financial Officer, of the effectiveness of our disclosure controls and procedures (as defined in Rule 13a-15(e) under the Securities Exchange Act of 1934 (Exchange Act)). Based upon that evaluation, our Chief Executive Officer and Chief Financial Officer concluded that these disclosure controls and procedures were effective as of the end of the period covered by this report. In addition, no change in our internal control over financial reporting (as defined in Rule 13a-15(f) under the Exchange Act) occurred during our most recentthe quarter ended March 31, 2017 that has materially affected, or is reasonably likely to materially affect, our internal control over financial reporting.
PART II. OTHER INFORMATION
Item 1. Legal Proceedings
We are involved in a number of judicial, regulatory and arbitration proceedings concerning matters arising in connection with the conduct of our businesses. Many of these proceedings are in early stages, and many of these cases seek an indeterminate amount of damages. However, we believe, based on currently available information, that the results of such proceedings, in the aggregate, will not have a material adverse effect on our financial condition, but may be material to our operating results for any particular period, depending, in part, upon the operating results for such period. Given the range of litigation and investigations presently under way, our litigation expenses can be expected to remain high. See “Management’s Discussion and Analysis of Financial Condition and Results of Operations — Use of Estimates” in Part I, Item 2 of the March 2016this Form 10-Q. See NoteNotes 18 and 27 to the condensed consolidated financial statements in Part I, Item 1 of the March 2016this Form 10-Q for information about certain judicial, regulatory and legal proceedings.
| | | | |
154 | | Goldman Sachs March 2016 Form 10-Q | | |
Item 2. Unregistered Sales of Equity Securities and Use of Proceeds
The table below sets forth the information with respect topresents purchases made by or on behalf of The Goldman Sachs Group, Inc. (Group Inc.) or any “affiliated purchaser” (as defined in Rule 10b-18(a)(3) under the Securities Exchange Act of 1934) of our common stock during the three months ended March 31, 2016.2017.
| | | | | | | | | | | | | | |
| | |
| Total
number
of shares
purchased |
| |
| Average
price
paid per
share |
| |
| Total
number
of shares
purchased
as part of
publicly
announced
plans or
programs |
| | Maximum number of shares that may yet be purchased under the plans or programs |
Month #1 (January 1, 2016 to January 31, 2016) | | | 4,044,958 | 1 | | | $158.29 | | | | 4,011,435 | | | 59,190,448 |
| |
Month #2 (February 1, 2016 to February 29, 2016) | | | 3,283,392 | 1 | | | 150.23 | | | | 3,267,562 | | | 55,922,886 |
| |
Month #3 (March 1, 2016 to March 31, 2016) | | | 2,757,008 | | | | 153.79 | | | | 2,757,008 | | | 53,165,878 |
Total | | | 10,085,358 | | | | | | | | 10,036,005 | | | |
| | | | | | | | | | | | | | | | |
| | |
| Total
Shares Purchased |
| |
| Average
Price Paid Per Share |
| |
| Total
Shares Purchased as Part of a Publicly Announced Program |
| |
| Maximum
Shares That May Yet Be Purchased Under the Program |
|
January 2017 | | | 1,560,481 | 1 | | | $237.52 | | | | 1,557,610 | | | | 25,054,852 | |
| | |
February 2017 | | | 2,167,001 | 1 | | | $245.36 | | | | 2,157,736 | | | | 22,897,116 | |
| | |
March 2017 | | | 2,451,821 | | | | $244.92 | | | | 2,451,821 | | | | 20,445,295 | |
Total | | | 6,179,303 | | | | | | | | 6,167,167 | | | | | |
| 1. | Includes 33,5232,871 shares and 15,8309,265 shares remitted to satisfy minimum statutory withholding taxes on the delivery of equity-based awards during January 20162017 and February 2016,2017, respectively. |
On April 17, 2017, the Board of Directors of Group Inc. (Board) authorized the repurchase of an additional 50 million shares of common stock pursuant to the firm’s existing share repurchase program. Since March 21, 2000, we announced that ourthe Board hadhas approved a repurchase program authorizing repurchases of up to 15555 million shares of our common stock, which was increased by an aggregate of 490 million shares by resolutions of our Board adopted from June 2001 through October 2015.stock. The repurchase program is effected primarily through regular open-market purchases (which may include repurchase plans designed to comply with Rule 10b5-1), the amounts and timing of which are determined primarily by the firm’sour current and projected capital position, but which may also be influenced by general market conditions and the prevailing price and trading volumes of our common stock. The repurchase program has no set expiration or termination date. Prior to repurchasing common stock, we must receive confirmation that the Board of Governors of the Federal Reserve System does not object to such capital actions.action.
| | | | |
| 146 | | Goldman Sachs March 2017 Form 10-Q | | |
Item 6. Exhibits
Exhibits
| | |
| |
3.1
| | Restated Certificate of Incorporation of Group Inc. amended as of March 4, 2016.
|
| |
12.1 | | Statement re: Computation of Ratios of Earnings to Fixed Charges and Ratios of Earnings to Combined Fixed Charges and Preferred Stock Dividends. |
| |
15.1 | | Letter re: Unaudited Interim Financial Information. |
| |
31.1 | | Rule 13a-14(a) Certifications. |
| |
32.1 | | Section 1350 Certifications. *Certifications (This information is furnished and not filed for purposes of Sections 11 and 12 of the Securities Act of 1933 and Section 18 of the Securities Exchange Act of 1934). |
| |
101 | | Interactive data files pursuant to Rule 405 of RegulationS-T: (i) the Condensed Consolidated Statements of Earnings for the three months ended March 31, 20162017 and March 31, 2015,2016, (ii) the Condensed Consolidated Statements of Comprehensive Income for the three months ended March 31, 20162017 and March 31, 2015,2016, (iii) the Condensed Consolidated Statements of Financial Condition as of March 31, 20162017 and December 31, 2015,2016, (iv) the Condensed Consolidated Statements of Changes in Shareholders’ Equity for the three months ended March 31, 20162017 and year ended December 31, 2015,2016, (v) the Condensed Consolidated Statements of Cash Flows for the three months ended March 31, 20162017 and March 31, 2015,2016, and (vi) the notes to the Condensed Consolidated Financial Statements. |
| |
| | * This information is furnished and not filed for purposes of Sections 11 and 12 of the Securities Act of 1933 and Section 18 of the Securities Exchange Act of 1934.
|
| | | | |
| | Goldman Sachs March 2016 Form 10-Q | | 155 |
SIGNATURES
Pursuant to the requirements of the Securities Exchange Act of 1934, the registrant has duly caused this report to be signed on its behalf by the undersigned thereunto duly authorized.
| | | | | | |
THE GOLDMAN SACHS GROUP, INC.
THE GOLDMAN SACHS GROUP, INC. |
| | |
By: | | /s/ | | Harvey M. Schwartz |
| | Name:
| | | | Harvey M. Schwartz R. Martin Chavez
|
| | Title:Name:
| | R. Martin Chavez |
Title: | | Chief Financial Officer |
Date: | | May 3, 2017 |
| | |
| |
By: | | /s/ | | Sarah E. Smith |
| | Name:
| | | | Sarah E. Smith Brian J. Lee
|
| | Title:Name:
| | Brian J. Lee |
Title: | | Principal Accounting Officer |
Date: | | May 3, 2017 |
Date: May 5, 2016
| | | | |
156 | | Goldman Sachs March 20162017 Form 10-Q | | 147 |