| | | Maryland | | 81-0696966 | (State or other jurisdiction of incorporation or organization) | | (I.R.S. Employer Identification No.) |
345 Park Avenue New York, New York 10154 (Address of principal executive offices) (Zip Code) (212) 583-5000 (Registrant’s telephone number, including area code) Indicate by check mark whether the Registrant (1) has filed all reports required to be filed by Section 13 or 15(d) of the Securities Exchange Act of 1934 during the preceding 12 months (or for such shorter period that the Registrant was required to file such reports), and (2) has been subject to such filing requirements for the past 90 days. Yes ☐☒ No ☒ ☐ Indicate by check mark whether the registrant has submitted electronically and posted on its corporate Web site, if any, every Interactive Data File required to be submitted and posted pursuant to Rule 405 of Regulation S-T (§232.405 of this chapter) during the preceding 12 months (or for such shorter period that the registrant was required to submit and post such files). Yes ☒ No ☐ Indicate by check mark whether the Registrant is a large accelerated filer, an accelerated filer, a non-accelerated filer, or a smaller reporting company, or an emerging growth company. See the definitions of “large accelerated filer,” “accelerated filer”filer,” “smaller reporting company,” and “smaller reporting“emerging growth company” in Rule 12b-2 of the Exchange Act. | | | | | | | Large accelerated filer | ☐ | ☐ | | Accelerated filer | | ☐ | | | | | Non-accelerated filer | ☒ | ☒ (Do(Do not check if a smaller reporting company) | | Smaller reporting company | ☐ | | ☐ | | Emerging growth company | ☒ |
If an emerging growth company, indicate by check mark if the registrant has elected not to use the extended transition period for complying with any new or revised financial accounting standards provided pursuant to Section 13(a) of the Exchange Act. Yes ☒ No ☐ Indicate by check mark whether the Registrant is a shell company (as defined in Rule 12b-2 of the Exchange Act).Act. Yes ☐ No ☒ The number
As of the Registrant’sNovember 13, 2017, there were 117,771,673 outstanding shares of Class S common stock, par value $0.01 per share, as27,873,679 outstanding shares of November 14, 2016 was 20,000, all of which were Class I shares.common stock, 2,981,473 outstanding shares of Class D common stock, and 4,315,936 outstanding shares of Class T common stock.
TABLE OF CONTENTS | | | | | | | PART I. | | FINANCIAL INFORMATION | | | | 1 | | | | ITEM 1. | | FINANCIAL STATEMENTS | | | | 1 | | | | | | Consolidated Financial Statements (Unaudited): | | | | | | | | | | Consolidated Balance Sheets as of September 30, 20162017 and MarchDecember 31, 2016 | | | 1 | | | | | | Consolidated Statements of Operations for the Three and Nine Months Ended September 30, 2017 and for the Three Months ended September 30, 2016 and the Period March 2, 2016 (date of initial capitalization) through September 30, 2016 | 2 | | | | | Consolidated Statement of Changes in Equity for the Nine Months Ended September 30, 2017 | 3 | | | | | Consolidated Statements of Cash Flows for the Nine Months Ended September 30, 2017 and for the Period March 2, 2016 (date of initial capitalization) through September 30, 2016 | 4 | | | | | Notes to Consolidated Financial Statements | | | 2 | 6 | | | | ITEM 2. | | MANAGEMENT’S DISCUSSION AND ANALYSIS OF FINANCIAL CONDITION AND RESULTS OF OPERATIONS | | | 6 | 23 | | | | ITEM 3. | | QUANTITATIVE AND QUALITATIVE DISCLOSURES ABOUT MARKET RISK | | | 10 | 37 | | | | ITEM 4. | | CONTROLS AND PROCEDURES | | | 11 | 38 | | | | PART II. | | OTHER INFORMATION | | | | 39 | | | | ITEM 1. | | LEGAL PROCEEDINGS | | | 12 | 39 | | | | ITEM 1A. | | RISK FACTORS | | | 12 | 39 | | | | ITEM 2. | | UNREGISTERED SALES OF EQUITY SECURITIES AND USE OF PROCEEDS | | | 12 | 40 | | | | ITEM 3. | | DEFAULTS UPON SENIOR SECURITIES | | | 12 | 41 | | | | ITEM 4. | | MINE SAFETY DISCLOSURES | | | 12 | 41 | | | | ITEM 5. | | OTHER INFORMATION | | | 12 | 41 | | | | ITEM 6. | | EXHIBITS | | | 13 | 42 | | | | SIGNATURES | | | 15 | 43 |
PART I. FINANCIALFINANCIAL INFORMATION ITEM 1. | FINANCIAL STATEMENTS |
Blackstone Real Estate Income Trust, Inc. Consolidated Balance Sheets (Unaudited) (in thousands, except share and per share data) | | | | | | | | | | | | September 30, 2016 | | | March 31, 2016 | | Assets | | | | | | | | | Cash and cash equivalents | | $ | 200,000 | | | $ | 200,000 | | | | | | | | | | | Total assets | | $ | 200,000 | | | $ | 200,000 | | | | | | | | | | | Liabilities and Equity | | | | | | | | | | | | | | | | | | Total liabilities | | $ | — | | | $ | — | | | | | | | | | | | Equity | | | | | | | | | Preferred stock, $0.01 par value per share, 100,000,000 and 0 shares authorized at September 30, 2016 and March 31, 2016, respectively, and none issued and outstanding | | | — | | | | — | | Common stock, $0.01 par value per share, 0 and 1,000,000 shares authorized, 0 and 20,000 shares issued and outstanding at September 30, 2016 and March 31, 2016, respectively | | | — | | | | 200 | | Common stock – Class T shares, $0.01 par value per share, 500,000,000 and 0 shares authorized at September 30, 2016 and March 31, 2016, respectively, and none issued and outstanding | | | — | | | | — | | Common stock – Class S shares, $0.01 par value per share, 500,000,000 and 0 shares authorized at September 30, 2016 and March 31, 2016, respectively, and none issued and outstanding | | | — | | | | — | | Common stock – Class D shares, $0.01 par value per share, 500,000,000 and 0 shares authorized at September 30, 2016 and March 31, 2016, respectively, and none issued and outstanding | | | — | | | | — | | Common stock – Class I shares, $0.01 par value per share, 500,000,000 and 0 shares authorized, 20,000 and 0 shares issued and outstanding at September 30, 2016 and March 31, 2016, respectively | | | 200 | | | | — | | Additional paid-in capital | | | 199,800 | | | | 199,800 | | | | | | | | | | | Total equity | | | 200,000 | | | | 200,000 | | | | | | | | | | | Total liabilities and equity | | $ | 200,000 | | | $ | 200,000 | | | | | | | | | | |
| | September 30, | | | December 31, | | | | 2017 | | | 2016 | | Assets | | | | | | | | | Investments in real estate, net | | $ | 2,234,133 | | | $ | — | | Investments in real estate-related securities | | | 644,371 | | | | — | | Cash and cash equivalents | | | 30,820 | | | | 200 | | Restricted cash | | | 105,881 | | | | — | | Intangible assets, net | | | 88,510 | | | | — | | Other assets | | | 23,754 | | | | — | | Total assets | | $ | 3,127,469 | | | $ | 200 | | Liabilities and Equity | | | | | | | | | Mortgage notes, term loan, and revolving credit facility, net | | $ | 1,155,391 | | | $ | — | | Repurchase agreements | | | 478,455 | | | | — | | Affiliate line of credit | | | 122,676 | | | | — | | Due to affiliates | | | 101,983 | | | | 86 | | Subscriptions received in advance | | | 98,435 | | | | — | | Accounts payable, accrued expenses, and other liabilities | | | 58,103 | | | | 29 | | Total liabilities | | $ | 2,015,043 | | | $ | 115 | | | | | | | | | | | Commitments and contingencies | | | — | | | | — | | | | | | | | | | | Equity | | | | | | | | | Preferred stock, $0.01 par value per share, 100,000,000 shares authorized; none issued and outstanding as of September 30, 2017 and December 31, 2016 | | | — | | | | — | | Common stock — Class S shares, $0.01 par value per share, 500,000,000 shares authorized; 98,779,308 and no shares issued and outstanding as of September 30, 2017 and December 31, 2016, respectively | | | 988 | | | | — | | Common stock — Class T shares, $0.01 par value per share, 500,000,000 shares authorized; 2,208,763 and no shares issued and outstanding as of September 30, 2017 and December 31, 2016, respectively | | | 22 | | | | — | | Common stock — Class D shares, $0.01 par value per share, 500,000,000 shares authorized; 1,225,700 and no shares issued and outstanding as of September 30, 2017 and December 31, 2016, respectively | | | 12 | | | | — | | Common stock — Class I shares, $0.01 par value per share, 500,000,000 shares authorized; 23,277,430 and 20,000 shares issued and outstanding as of September 30, 2017 and December 31, 2016, respectively | | | 233 | | | | — | | Additional paid-in capital | | | 1,177,444 | | | | 200 | | Accumulated deficit and cumulative distributions | | | (75,129 | ) | | | (115 | ) | Total stockholders' equity | | | 1,103,570 | | | | 85 | | Non-controlling interests | | | 8,856 | | | | — | | Total equity | | | 1,112,426 | | | | 85 | | Total liabilities and equity | | $ | 3,127,469 | | | $ | 200 | |
See accompanying notes to consolidated financial statements.
Blackstone Real Estate Income Trust, Inc. Consolidated Statements of Operations (Unaudited) (in thousands, except share and per share data) | Three Months Ended September 30, | | | Nine Months Ended September 30, | | | For the Period March 2, 2016 (date of initial capitalization) through September 30, | | | 2017 | | | 2016 | | | 2017 | | | 2016 | | Revenues | | | | | | | | | | | | | | | | Rental revenue | $ | 33,599 | | | $ | — | | | $ | 55,727 | | | $ | — | | Tenant reimbursement income | | 3,230 | | | | — | | | | 5,503 | | | | — | | Hotel revenue | | 9,874 | | | | — | | | | 15,048 | | | | — | | Other revenue | | 2,201 | | | | — | | | | 3,409 | | | | — | | Total revenues | | 48,904 | | | | — | | | | 79,687 | | | | — | | Expenses | | | | | | | | | | | | | | | | Rental property operating | | 15,938 | | | | — | | | | 25,632 | | | | — | | Hotel operating | | 6,668 | | | | — | | | | 9,617 | | | | — | | General and administrative | | 1,716 | | | | — | | | | 5,969 | | | | — | | Management fee | | 3,712 | | | | — | | | | 3,712 | | | | — | | Performance participation allocation | | 5,711 | | | | — | | | | 10,952 | | | | — | | Depreciation and amortization | | 40,359 | | | | — | | | | 65,145 | | | | — | | Total expenses | | 74,104 | | | | — | | | | 121,027 | | | | — | | Other income (expense) | | | | | | | | | | | | | | | | Income from real estate-related securities | | 4,026 | | | | — | | | | 7,435 | | | | — | | Interest income | | 36 | | | | — | | | | 418 | | | | — | | Interest expense | | (10,866 | ) | | | — | | | | (16,413 | ) | | | — | | Other expenses | | (27 | ) | | | | | | | (55 | ) | | | | | Total other (expense) income | | (6,831 | ) | | | — | | | | (8,615 | ) | | | — | | Net loss before income tax | | (32,031 | ) | | | — | | | | (49,955 | ) | | | — | | Income tax benefit | | 184 | | | | — | | | | 140 | | | | — | | Net loss | $ | (31,847 | ) | | $ | — | | | $ | (49,815 | ) | | $ | — | | Net loss attributable to non-controlling interests | $ | 122 | | | $ | — | | | $ | 122 | | | $ | — | | Net loss attributable to BREIT stockholders | $ | (31,725 | ) | | $ | — | | | $ | (49,693 | ) | | $ | — | | Net loss per share of common stock — basic and diluted | $ | (0.28 | ) | | $ | — | | | $ | (0.66 | ) | | $ | — | | Weighted-average shares of common stock outstanding, basic and diluted | | 112,585,463 | | | | 20,000 | | | | 75,771,929 | | | | 20,000 | |
See accompanying notes to consolidated financial statements.
Blackstone Real Estate Income Trust, Inc. Consolidated Statement of Changes in Equity (Unaudited) (in thousands) | | Par Value | | | | | | | Accumulated | | | | | | | | | | | | | | | | Common | | | Common | | | Common | | | Common | | | Additional | | | Deficit and | | | Total | | | | | | | | | | | | Stock | | | Stock | | | Stock | | | Stock | | | Paid-in | | | Cumulative | | | Stockholders' | | | Non-controlling | | | Total | | | | Class S | | | Class T | | | Class D | | | Class I | | | Capital | | | Distributions | | | Equity | | | Interests | | | Equity | | Balance at December 31, 2016 | | $ | — | | | $ | — | | | $ | — | | | $ | — | | | $ | 200 | | | $ | (115 | ) | | $ | 85 | | | $ | — | | | $ | 85 | | | | | | | | | | | | | | | | | | | | | | | | | | | | | | | | | | | | | | | Common stock issued | | | 978 | | | | 22 | | | | 12 | | | | 230 | | | | 1,262,811 | | | | — | | | | 1,264,053 | | | | — | | | | 1,264,053 | | | | | | | | | | | | | | | | | | | | | | | | | | | | | | | | | | | | | | | Offering costs | | | — | | | | — | | | | — | | | | — | | | | (98,938 | ) | | | — | | | | (98,938 | ) | | | — | | | | (98,938 | ) | | | | | | | | | | | | | | | | | | | | | | | | | | | | | | | | | | | | | | Distribution reinvestment | | | 10 | | | | — | | | | — | | | | 3 | | | | 13,481 | | | | — | | | | 13,494 | | | | — | | | | 13,494 | | | | | | | | | | | | | | | | | | | | | | | | | | | | | | | | | | | | | | | Common stock repurchased | | | — | | | | — | | | | — | | | | — | | | | (187 | ) | | | — | | | | (187 | ) | | | — | | | | (187 | ) | | | | | | | | | | | | | | | | | | | | | | | | | | | | | | | | | | | | | | Amortization of restricted stock grants | | | — | | | | — | | | | — | | | | — | | | | 77 | | | | — | | | | 77 | | | | — | | | | 77 | | | | | | | | | | | | | | | | | | | | | | | | | | | | | | | | | | | | | | | Net loss | | | — | | | | — | | | | — | | | | — | | | | — | | | | (49,693 | ) | | | (49,693 | ) | | | (122 | ) | | | (49,815 | ) | | | | | | | | | | | | | | | | | | | | | | | | | | | | | | | | | | | | | | Distributions declared on common stock | | | — | | | | — | | | | — | | | | — | | | | — | | | | (25,321 | ) | | | (25,321 | ) | | | — | | | | (25,321 | ) | | | | | | | | | | | | | | | | | | | | | | | | | | | | | | | | | | | | | | Contributions from non-controlling interests | | | — | | | | — | | | | — | | | | — | | | | — | | | | — | | | | — | | | | 8,978 | | | | 8,978 | | | | | | | | | | | | | | | | | | | | | | | | | | | | | | | | | | | | | | | Balance at September 30, 2017 | | $ | 988 | | | $ | 22 | | | $ | 12 | | | $ | 233 | | | $ | 1,177,444 | | | $ | (75,129 | ) | | $ | 1,103,570 | | | $ | 8,856 | | | $ | 1,112,426 | |
See accompanying notes to consolidated financial statements.
Blackstone Real Estate Income Trust, Inc. Consolidated Statements of Cash Flows (Unaudited) (in thousands) | | Nine Months Ended September 30, 2017 | | | For the Period March 2, 2016 (date of initial capitalization) through September 30, 2016 | | Cash flows from operating activities: | | | | | | | | | Net loss | | $ | (49,815 | ) | | | — | | Adjustments to reconcile net loss to net cash provided by operating activities: | | | | | | | | | Depreciation and amortization | | | 65,145 | | | | — | | Unrealized gain on changes in fair value of financial instruments | | | (993 | ) | | | — | | Realized loss on settlement of real estate-related securities | | | 177 | | | | — | | Straight-line rent adjustment | | | (1,118 | ) | | | — | | Amortization of above- and below-market lease intangibles | | | (792 | ) | | | — | | Amortization of below-market and prepaid ground lease intangibles | | | 156 | | | | — | | Amortization of deferred financing costs | | | 771 | | | | — | | Amortization of restricted stock grants | | | 77 | | | | — | | Bad debt expense | | | 709 | | | | — | | Change in assets and liabilities: | | | | | | | | | (Increase) / decrease in other assets | | | (10,824 | ) | | | — | | Increase / (decrease) in due to affiliates | | | 18,523 | | | | — | | Increase / (decrease) in accounts payable, accrued expenses, and other liabilities | | | 22,244 | | | | — | | Net cash provided by operating activities | | | 44,260 | | | | — | | Cash flows from investing activities: | | | | | | | | | Acquisitions of real estate | | | (2,245,885 | ) | | | — | | Capital improvements to real estate | | | (3,290 | ) | | | — | | Pre-acquisition costs | | | (9,201 | ) | | | — | | Purchase of real estate-related securities | | | (660,151 | ) | | | — | | Proceeds from settlement of real estate-related securities | | | 16,596 | | | | — | | Net cash used in investing activities | | | (2,901,931 | ) | | | — | | Cash flows from financing activities: | | | | | | | | | Proceeds from issuance of common stock | | | 1,264,053 | | | | — | | Offering costs paid | | | (15,388 | ) | | | — | | Subscriptions received in advance | | | 98,435 | | | | — | | Repurchase of common stock | | | (187 | ) | | | — | | Borrowings from mortgage notes, term loan, and revolving credit facility | | | 1,055,913 | | | | — | | Borrowings under repurchase agreements | | | 491,026 | | | | — | | Settlement of repurchase agreements | | | (12,571 | ) | | | — | | Borrowings from affiliate line of credit | | | 617,650 | | | | — | | Repayments on affiliate line of credit | | | (495,150 | ) | | | — | | Payment of deferred financing costs | | | (12,384 | ) | | | — | | Contributions from non-controlling interests | | | 8,978 | | | | — | | Distributions | | | (6,203 | ) | | | — | | Net cash provided by financing activities | | | 2,994,172 | | | | — | | Net change in cash and cash equivalents and restricted cash | | | 136,501 | | | | — | | | | | | | | | | | Cash and cash equivalents and restricted cash, beginning of period | | $ | 200 | | | $ | 200 | | Cash and cash equivalents and restricted cash, end of period | | $ | 136,701 | | | $ | 200 | | | | | | | | | | | Reconciliation of cash and cash equivalents and restricted cash to the consolidated balance sheets: | | | | | | | | | Cash and cash equivalents | | $ | 30,820 | | | $ | 200 | | Restricted cash | | | 105,881 | | | | — | | Total cash and cash equivalents and restricted cash | | $ | 136,701 | | | $ | 200 | |
See accompanying notes to consolidated financial statements.
| | | | | | | | | Non-cash investing and financing activities: | | | | | | | | | Assumption of mortgage notes in conjunction with acquisitions of real estate | | $ | 107,369 | | | | — | | Assumption of other liabilities in conjunction with acquisitions of real estate | | $ | 17,093 | | | | — | | Accrued capital expenditures and acquisition related costs | | $ | 314 | | | | — | | Accrued pre-acquisition costs | | $ | 905 | | | | — | | Accrued distributions | | $ | 5,624 | | | | — | | Accrued stockholder servicing fee due to affiliate | | $ | 75,998 | | | | — | | Accrued offering costs due to affiliate | | $ | 7,552 | | | | — | | Distribution reinvestment | | $ | 13,494 | | | | — | | Accrued deferred financing costs | | $ | 307 | | | | — | |
See accompanying notes to consolidated financial statements.
Blackstone Real Estate Income Trust, Inc. Notes to Consolidated Financial Statements (Unaudited) 1. Organization and Business Purpose Blackstone Real Estate Income Trust, Inc. (the(“BREIT” or the “Company”) was formed on November 16, 2015 as a Maryland corporation and intends to qualify as a real estate investment trust (“REIT”) for U.S. federal income tax purposes.purposes commencing with the taxable year ending December 31, 2017. The Company was organized to invest primarily in stabilized income-oriented commercial real estate in the United States and to a lesser extent, invest in real estate-related securities. The Company is the sole general partner of BREIT Operating Partnership, L.P., a Delaware limited partnership (“BREIT OP”). BREIT Special Limited Partner L.L.C. (the “Special Limited Partner”), a wholly ownedwholly-owned subsidiary of The Blackstone Group L.P. (together with its affiliates, “Blackstone”), owns a special limited partner interest in BREIT OP. The Company was organized to invest primarily in stabilized income-oriented commercial real estate in the United States and to a lesser extent, invest in real estate-related securities. Substantially all of the Company’s business will beis conducted through BREIT OP, which as of September 30, 2016 had not commenced its principal operations.OP. The Company and BREIT OP are externally managed by BX REIT Advisors L.L.C. (the “Adviser”), an affiliate of Blackstone. The Company had neither purchased nor contracted to purchase any investments. The Adviser had not identified any real estate or real estate-related investments in which it is probable that the Company will invest. 2. Capitalization
As of September 30, 2016, the Company had authority to issue 2,100,000,000 shares, consisting of the following:
| | | | | | | | | Classification | | Number of Shares | | | Par Value | | Preferred Stock | | | 100,000,000 | | | $ | 0.01 | | Class T Shares | | | 500,000,000 | | | $ | 0.01 | | Class S Shares | | | 500,000,000 | | | $ | 0.01 | | Class D Shares | | | 500,000,000 | | | $ | 0.01 | | Class I Shares | | | 500,000,000 | | | $ | 0.01 | | | | | | | | | | | Total | | | 2,100,000,000 | | | | | |
The Company has registered with the Securities and Exchange Commission (the “SEC”) an offering of up to $5,000,000,000$5.0 billion in shares of common stock, consisting of up to $4,000,000,000$4.0 billion in shares in its primary offering and up to $1,000,000,000$1.0 billion in shares pursuant to its distribution reinvestment plan (the “Offering”). The Company intends to sell any combination of four classes of shares of its common stock, Class T shares, Class S shares, Class D shares and Class I shares, with a dollar value up to the maximum offering amount.aggregate amount of the Offering. The share classes have different upfront selling commissions, dealer manager fees and ongoing stockholder servicing fees. UntilAs of January 1, 2017, the Company had satisfied the minimum offering requirement and the Company’s board of directors authorized the release of proceeds from escrow,escrow. As of September 30, 2017, the per share purchase price forCompany issued and sold 125,491,201 shares of the Company’s common stock in its primary offering will be $10.00 per share plus applicable upfront(consisting of 98,779,308 Class S shares, 23,277,430 Class I shares, 1,225,700 Class D shares, and 2,208,763 Class T shares). The Company intends to continue selling commissions and dealer manager fees. Thereafter, the purchase price per share for each classshares on a monthly basis.
As of common stock will vary and will generally equal the Company’s prior month’s net asset value (“NAV”) per share, as calculated monthly, plus applicable upfront selling commissions and dealer manager fees. On March 2, 2016,September 30, 2017, the Company was capitalized with a $200,000 investmentowned 18 investments in real estate and had 24 positions in commercial mortgage-backed securities (“CMBS”). The Company currently operates in five reportable segments: Multifamily, Industrial, Hotel, and Retail Properties, and Real Estate-Related Securities. Financial results by the Advisersegment are reported in exchange for 20,000 shares of the Company’s common stock. On August 15, 2016, the Company amended its charter and the 20,000 shares of common stock held by the Adviser were converted into 20,000 shares of Class I common stock.Note 14 — Segment Reporting.
3.2. Summary of Significant Accounting Policies
Basis of Presentation The accompanying consolidated financial statements include the accounts of the Company. Separate consolidated statements of income, changes in equity, and cash flows have not been presented in the financial statements because the principal operations have not commenced.
Blackstone Real Estate Income Trust, Inc.
Notes to Consolidated Financial Statements
(Unaudited)
The accompanying unaudited consolidated financial statements have been prepared in accordance with accounting principles generally accepted in the United States of America (“GAAP”) for interim financial information and the instructions to Form 10-Q and Rule 10-01 of Regulation S-X. All intercompany transactions have been eliminated in consolidation. The consolidated financial statements, including the notes thereto, are unaudited and exclude some of the disclosures required in audited financial statements. Management believes it has made all necessary adjustments, consisting of only normal recurring items, so that the consolidated financial statements are presented fairly and that estimates made in preparing its consolidated financial statementstatements are reasonable and prudent. The accompanying unaudited consolidated interim financial statements should be read in conjunction with the audited consolidated financial statement as of March 31, 2016statements included in the Company’s ProspectusAnnual Report on Form 10-K for the fiscal year ended December 31, 2016 filed with the SEC on October 17, 2016.SEC. The accompanying consolidated financial statements include the accounts of the Company, our subsidiaries and joint ventures in which we have a controlling interest. For consolidated joint ventures, the non-controlling partner’s share of the assets, liabilities and operations of the joint ventures is included in non-controlling interests as equity of the Company. The non-controlling partner’s interest is generally computed as the joint venture partner’s ownership percentage. The preparation of the financial statements in conformity with GAAP requires management to make estimates and assumptions that affect the reported amounts of assets and liabilities and disclosures of contingent assets and liabilities at the date of the balance sheet. Actual results could differ from those estimates. Cash and Cash Equivalents Cash and cash equivalents represent cash held in banks, cash on hand, and liquid investments with original maturities of three months or less. The Company may have bank balances in excess of federally insured amounts; however, the Company deposits its cash and cash equivalents with high credit-quality institutions to minimize credit risk exposure. The Company did not hold cash equivalents asrisk.
Restricted Cash As of September 30, 20162017, restricted cash primarily consists of $98.4 million of cash received for subscriptions prior to the date in which the subscriptions are effective. The Company’s restricted cash is held primarily in a bank account controlled by the Company’s transfer agent but in the name of the Company. Investments in Real Estate In accordance with the guidance for business combinations, the Company determines whether the acquisition of a property qualifies as a business combination, which requires that the assets acquired and March 31, 2016.liabilities assumed constitute a business. If the property acquired is not a business, the Company accounts for the transaction as an asset acquisition. The Company has early adopted Accounting Standards Update 2017-01 — Clarifying the Definition of a Business (“ASU 2017-01”). ASU 2017-01 states that when substantially all of the fair value of the gross assets to be acquired is concentrated in a single identifiable asset or group of similar identifiable assets, the asset or set of assets is not a business. All property acquisitions to date have been accounted for as asset acquisitions. Whether the acquisition of a property acquired is considered a business combination or asset acquisition, the Company recognizes the identifiable assets acquired, the liabilities assumed, and any non-controlling interest in the acquired entity. In addition, for transactions that are business combinations, the Company evaluates the existence of goodwill or a gain from a bargain purchase. The Company expenses acquisition-related costs associated with business combinations as they are incurred. The Company capitalizes acquisition-related costs associated with asset acquisitions. Upon acquisition of a property, the Company assesses the fair value of acquired tangible and intangible assets (including land, buildings, tenant improvements, “above-market” and “below-market” leases, acquired in-place leases, other identified intangible assets and assumed liabilities) and allocates the purchase price to the acquired assets and assumed liabilities. The Company assesses and considers fair value based on estimated cash flow projections that utilize discount and/or capitalization rates that it deems appropriate, as well as other available market information. Estimates of future cash flows are based on a number of factors including the historical operating results, known and anticipated trends, and market and economic conditions. The fair value of the tangible assets of an acquired property considers the value of the property as if it were vacant. The Company also considers an allocation of purchase price of other acquired intangibles, including acquired in-place leases that may have a customer relationship intangible value, including (but not limited to) the nature and extent of the existing relationship with the tenants, the tenants’ credit quality and expectations of lease renewals. Based on its acquisitions to date, the Company’s allocation to customer relationship intangible assets has not been material. The Company records acquired above-market and below-market leases at their fair values (using a discount rate which reflects the risks associated with the leases acquired) equal to the difference between (1) the contractual amounts to be paid pursuant to each in-place lease and (2) management’s estimate of fair market lease rates for each corresponding in-place lease, measured over a period equal to the remaining term of the lease for above-market leases and the initial term plus the term of any below-market fixed rate renewal options for below-market leases. Other intangible assets acquired include amounts for in-place lease values that are based on the Company’s evaluation of the specific characteristics of each tenant’s lease. Factors to be considered include estimates of carrying costs during hypothetical expected lease-up periods considering current market conditions, and costs to execute similar leases. In estimating carrying costs, the Company includes real estate taxes, insurance and other operating expenses and estimates of lost rentals at market rates during the expected lease-up periods, depending on local market conditions. In estimating costs to execute similar leases, the Company considers leasing commissions, legal and other related expenses. The amortization of acquired above-market and below-market leases is recorded as an adjustment to Rental Revenue on the Company’s Consolidated Statements of Operations. The amortization of in-place leases is recorded as an adjustment to Depreciation and Amortization Expense on the Company’s Consolidated Statements of Operations. The amortization of below-market and pre-paid ground leases are recorded as an adjustment to Rental Property Operating or Hotel Operating Expenses, as applicable, on the Company’s Consolidated Statements of Operations. The cost of buildings and improvements includes the purchase price of the Company’s properties and any acquisition-related costs, along with any subsequent improvements to such properties. The Company’s investments in real estate are stated at cost and are generally depreciated on a straight-line basis over the estimated useful lives of the assets as follows: Description | | Depreciable Life | Building | | 30 - 40 years | Building- and land improvements | | 10 years | Furniture, fixtures and equipment | | 1 - 7 years | Lease intangibles | | Over lease term |
Significant improvements to properties are capitalized. When assets are sold or retired, their costs and related accumulated depreciation are removed from the accounts with the resulting gains or losses reflected in net income or loss for the period. Repairs and maintenance are expensed to operations as incurred and are included in Rental Property Operating and Hotel Operating Expenses on the Company’s Consolidated Statements of Operations. The Company’s management reviews its real estate properties for impairment each quarter or when there is an event or change in circumstances that indicates an impaired value. If the carrying amount of the real estate investment is no longer recoverable and exceeds the fair value such investment, an impairment loss is recognized. The impairment loss is recognized based on the excess of the carrying amount of the asset over its fair value. The evaluation of anticipated future cash flows is highly subjective and is based in part on assumptions regarding future occupancy, rental rates and capital requirements that could differ materially from actual results. Since cash flows on real estate properties considered to be “long-lived assets to be held and used” are considered on an undiscounted basis to determine whether an asset has been impaired, the Company’s strategy of holding properties over the long term directly decreases the likelihood of recording an impairment loss. If the Company’s strategy changes or market conditions otherwise dictate an earlier sale date, an impairment loss may be recognized and such loss could be material to the Company’s results. If the Company determines that an impairment has occurred, the affected assets must be reduced to their fair value, less cost to sell. During the periods presented, no such impairment occurred. Deferred Charges The Company’s deferred charges include financing and leasing costs. Deferred financing costs include legal, structuring, and other loan costs incurred by the Company for its financing agreements. Deferred financing costs related to the Company’s mortgage notes and term loan are recorded as an offset to the related liability and amortized over the term of the applicable financing instruments. Deferred financing costs related to the Company’s revolving credit facility and affiliate line of credit are recorded as a component of Other Assets on the Company’s Consolidated Balance Sheets and amortized over the term of the applicable financing agreements. Deferred leasing costs incurred in connection with new leases, which consist primarily of brokerage and legal fees, are recorded as a component of Other Assets on the Company’s Consolidated Balance Sheets and amortized over the life of the related lease. Investments in Real Estate-Related Securities The Company has elected to classify its investment in real estate-related securities as trading securities and carry such investments at estimated fair value. As such, the resulting gains and losses are recorded as a component of Income from Real Estate-Related Securities on the Company’s Consolidated Statements of Operations. Fair Value Measurement Under normal market conditions, the fair value of an investment is the amount that would be received to sell an asset or transfer a liability in an orderly transaction between market participants at the measurement date (i.e., the exit price). Additionally, there is a hierarchal framework that prioritizes and ranks the level of market price observability used in measuring investments at fair value. Market price observability is impacted by a number of factors, including the type of investment and the characteristics specific to the investment and the state of the marketplace, including the existence and transparency of transactions between market participants. Investments with readily available active quoted prices or for which fair value can be measured from actively quoted prices generally will have a higher degree of market price observability and a lesser degree of judgment used in measuring fair value. Investments measured and reported at fair value are classified and disclosed in one of the following levels within the fair value hierarchy: Level 1 — quoted prices are available in active markets for identical investments as of the measurement date. The Company does not adjust the quoted price for these investments. Level 2 — quoted prices are available in markets that are not active or model inputs are based on inputs that are either directly or indirectly observable as of the measurement date. Level 3 — pricing inputs are unobservable and include instances where there is minimal, if any, market activity for the investment. These inputs require significant judgment or estimation by management or third parties when determining fair value and generally represent anything that does not meet the criteria of Levels 1 and 2. Due to the inherent uncertainty of these estimates, these values may differ materially from the values that would have been used had a ready market for these investments existed.
As of September 30, 2017, the Company’s $644.4 million of investments in real estate-related securities were classified as Level 2. Valuation The Company’s investments in real estate-related securities are reported at fair value. As of September 30, 2017, the Company’s investments in real estate-related securities consisted of CMBS, which are mortgage-related fixed income securities. Mortgage-related securities are usually issued as separate tranches, or classes, of securities within each deal. The Company generally determines the fair value of its CMBS by utilizing third-party pricing service providers and broker-dealer quotations on the basis of last available bid price. In determining the fair value of a particular investment, pricing service providers may use broker-dealer quotations, reported trades or valuation estimates from their internal pricing models to determine the reported price. The pricing service providers’ internal models for mortgage-related securities such as CMBS usually consider the attributes applicable to a particular class of the security (e.g., credit rating, seniority), current market data, and estimated cash flows for each class and incorporate deal collateral performance such as prepayment speeds and default rates, as available. The fair value of the Company’s mortgage notes, term loan, and revolving credit facility, repurchase agreements, and affiliate line of credit all approximate their carrying value. Revenue Recognition The Company’s sources of revenue and the related revenue recognition policies are as follows: Rental revenue — primarily consists of base rent arising from tenant leases at the Company’s industrial, multifamily, and retail properties. Rental revenue is recognized on a straight-line basis over the life of the lease, including any rent steps or abatement provisions. The Company begins to recognize revenue upon the acquisition of the related property or when a tenant takes possession of the leased space. Tenant reimbursement income — consists primarily of amounts due from tenants for costs related to common area maintenance, real estate taxes, and other recoverable costs included in lease agreements. The Company recognizes the reimbursement of such costs incurred as tenant reimbursement income. Hotel revenue — consists of income from the Company’s hotel properties. Hotel revenue consists primarily of room revenue and food and beverage revenue. Room revenue is recognized when the related room is occupied and other hotel revenue is recognized when the service is rendered. Income Taxes The Company intends to make an election to be taxed as a REIT under Sections 856 through 860 of the Internal Revenue Code of 1986, as amended, or the Internal Revenue Code, commencing with its taxable year ending December 31, for the year in which the proceeds from escrow are released.2017. If the Company qualifies for taxation as a REIT, the Company generally will not be subject to federal corporate income tax to the extent it distributes 90% of its taxable income to its stockholders. REITs are subject to a number of other organizationalorganization and operational requirements. Even if the Company qualifies for taxation as a REIT, it may be subject to certain state and local taxes on its income and property, and federal income and excise taxes on its undistributed income. OrganizationalThe Company leases its hotel investments to wholly-owned taxable REIT subsidiaries (“TRSs”). The TRSs are subject to taxation at the federal, state and local levels, as applicable. Revenues related to the hotels’ operations such as room revenue, food and beverage revenue and other revenue are recorded in the TRS along with corresponding expenses. The Company accounts for applicable income taxes by utilizing the asset and liability method. As such, the Company records deferred tax assets and liabilities for the future tax consequences resulting from the difference between the carrying value of existing assets and liabilities and their respective tax basis. A valuation allowance for deferred tax assets is provided if the Company believes all or some portion of the deferred tax asset may not be realized. As of September 30, 2017, the Company recorded a deferred tax asset of $246 thousand due to its hotel investments and recorded such amount as a tax benefit within Income Tax Benefit on the Company’s Consolidated Statements of Operations.
Organization and Offering ExpensesCosts Organization costs are expensed as incurred and recorded as a component of General and Administrative Expense on the Company’s Consolidated Statements of Operations and offering costs are charged to equity as such amounts are incurred.
The Adviser has agreed to advance organizationalcertain organization and offering expensescosts on behalf of the Company interest free (including legal, accounting, and other expenses attributable to the Company’s organization, but excluding upfront selling commissions, dealer manager fees and stockholder servicing fees) through December 31, 2017, the day before the first anniversary of the date onas of which escrow for the Offering iswas released. The Company will reimburse the Adviser for all such advanced expenses ratably over a 60 month period following the first anniversary of the date the escrow for the Offering is released.December 31, 2017. As of September 30, 2016 and March 31, 2016,2017, the Adviser and its affiliates havehad incurred organizationalorganization and offering expensescosts on the Company’s behalf of approximately $6.0$9.4 million, consisting of offering costs of $7.6 million and $2.2 million, respectively. These organizational and offering expenses are not recorded in the accompanying consolidated balance sheet because suchorganization costs are notof $1.8 million. Such costs became the Company’s liability untilon January 1, 2017, the date as of which the escrow forproceeds from the Offering is released. When recorded by the Company, organizational expenses will be expensed as incurred,were released from escrow. These organization and offering expenses will be charged to stockholders’ equity as such amounts will be reimbursed to the Adviser or its affiliates from the gross proceeds of the Offering. Any amount due to the Adviser but not paid will be recognizedcosts were recorded as a liabilitycomponent of Due to Affiliates on the consolidated balance sheet.Company’s Consolidated Balance Sheet as of September 30, 2017. Distribution Reinvestment Plan
The Company has adopted a distribution reinvestment plan whereby stockholders (other than Maine, Maryland, New Jersey and Ohio investors) will have their cash distributions automatically reinvested in additional shares of common stock unless they elect to receive their distributions in cash. Maine, Maryland, New Jersey and Ohio investors will automatically receive their distributions in cash unless they elect to have their cash distributions reinvested in additional shares of the Company’s common stock. The per share purchase price for shares purchased pursuant to the distribution reinvestment plan will be equal to the offering price before upfront selling commissions
Blackstone Real Estate Income Trust, Inc.
Notes to Consolidated Financial Statements
(Unaudited)
and dealer manager fees (the “transaction price”) at the time the distribution is payable, which will generally be equal to the Company’s prior month’s NAV per share for that share class. Stockholders will not pay upfront selling commissions or dealer manager fees when purchasing shares pursuant to the distribution reinvestment plan. The stockholder servicing fees with respect to shares of the Company’s Class T shares, Class S shares and Class D shares are calculated based on the NAV for those shares and may reduce the NAV or, alternatively, the distributions payable with respect to shares of each such class, including shares issued in respect of distributions on such shares under the distribution reinvestment plan.
Share Repurchases
The Company has adopted a share repurchase plan, whereby on a monthly basis, stockholders may request that the Company repurchase all or any portion of their shares. The Company may choose to repurchase all, some or none of the shares that have been requested to be repurchased at the end of any particular month, in its discretion, subject to any limitations in the share repurchase plan. The total amount of aggregate repurchases of Class T, Class S, Class D, and Class I shares will be limited to 2% of the aggregate NAV per month and 5% of the aggregate NAV per calendar quarter. Shares would be repurchased at a price equal to the transaction price on the applicable repurchase date, subject to any early repurchase deduction. Shares that have not been outstanding for at least one year will be repurchased at 95% of the transaction price. Due to the illiquid nature of investments in real estate, the Company may not have sufficient liquid resources to fund repurchase requests and has established limitations on the amount of funds the Company may use for repurchases during any calendar month and quarter. Further, the Company’s board of directors may modify, suspend or terminate the share repurchase plan.
4. Related Party Transactions
Pursuant to the advisory agreement between the Company and the Adviser, the Adviser is responsible for sourcing, evaluating and monitoring the Company’s investment opportunities and making decisions related to the acquisition, management, financing and disposition of the Company’s assets, in accordance with the Company’s investment objectives, guidelines, policies and limitations, subject to oversight by the Company’s board of directors.
Certain affiliates of the Company, including the Adviser, will receive fees and compensation in connection with the ongoing management of the assets of the Company. The Adviser will be paid a management fee equal to 1.25% of NAV per annum, payable monthly. The management fee will be paid, at the Adviser’s election, in cash, shares of common stock, or BREIT OP units. The Adviser has agreed to waive its management fee for the first six months following the date the escrow for the Offering is released.
The Special Limited Partner will hold a performance participation interest in the BREIT OP that entitles it to receive an allocation from BREIT OP equal to 12.5% of the annual Total Return, subject to a 5% annual Hurdle Amount and a High Water Mark, with a Catch-Up (each term as defined in the BREIT OP limited partnership agreement). Such allocation will be made annually and accrue monthly.
In addition, Blackstone Advisory Partners L.P. (the “Dealer Manager”) will serve, a registered broker-dealer affiliated with the Adviser, serves as the dealer manager for the Offering. The Dealer Manager is a registered broker-dealer affiliated with the Adviser. The Company entered into an agreement (the “Dealer Manager Agreement”) with the Dealer Manager in connection with the Offering. Subject to the terms of the Dealer Manager Agreement, the Company’s obligations to pay stockholder servicing fees with respect to the Class T, Class S and Class D shares distributed in the Offering shall survive until such shares are no longer outstanding (including because such shares converted into Class I shares).
Blackstone Real Estate Income Trust, Inc.
Notes to Consolidated Financial Statements
(Unaudited)
The Dealer Manager is entitled to receive selling commissions of up to 3.0%, and dealer manager fees of 0.5%, ofbased on the transaction price of each Class T shareapplicable class of shares sold in the primary offering.Offering. The Dealer Manager is also entitled to receive selling commissions of up to 3.5% of the transaction price of each Class S share sold in the primary offering. The Dealer Manager also receives a stockholder servicing fee of 0.85%, 0.85% and 0.25% per annum of the aggregate NAVnet asset value (“NAV”) of the Company’s outstanding Class TS shares, Class ST shares, and Class D shares, respectively.
The following table details the selling commissions, dealer manager fees, and stockholder servicing fees for each applicable share class: | | Class S | | | Class T | | | Class D | | | Class I | Selling commissions and dealer manager fees (% of transaction price) | | up to 3.5% | | | up to 3.5% | | | — | | | — | Stockholder servicing fee (% of NAV) | | | 0.85% | | | | 0.85% | | | | 0.25% | | | — |
There is no stockholder servicing fee with respect to Class I shares. The Dealer Manager has entered into agreements with the selected dealers distributing the Company’s shares in the Offering, which provide, among other things, for the reallowancere-allowance of the full amount of the selling commissions and dealer manager fees and all or a portion of the stockholder servicing fees received by the Dealer Manager to such selected dealers. The Company will cease paying the stockholder servicing fee with respect to any Class TS share, Class ST share or Class D share soldheld in the primary offeringa stockholder’s account at the end of the month in which the total selling commissions, dealer manager fees and stockholder servicing fees paid with respect to the shares held by such sharestockholder within such account would exceed, in the aggregate, 8.75% (or, in the case of Class T shares sold through certain participating broker-dealers, a lower limit as set forth in any applicable agreement between the Dealer Manager and a participating broker-dealer) of the gross proceeds from the sale of such share.shares (including the gross proceeds of any shares issued under the Company’s distribution reinvestment plan with respect thereto). The Company will accrue the full cost of the stockholder servicing fee as an offering cost at the time each Class T,S, Class ST, and Class D share is sold during the primary offering. There will not be a stockholder servicing fee with respect to Class I shares. The Company may retain certain of the Adviser’s affiliates for services relating to the Company’s investments or its operations, including any administrative services, construction, special servicing, leasing, development, property oversight and other property management services, as well as services related to mortgage servicing, group purchasing, healthcare, consulting/brokerage, capital markets/credit origination, loan servicing, property, title and/or other types of insurance, management consulting and other similar operational matters. Any such arrangements will be at market terms and rates.Offering. As of September 30, 2017, the Company had accrued $76.0 million of stockholder servicing fees related to Class S shares, Class D shares and Class T shares sold and recorded such amount as a component of Due to Affiliates on the Company’s Consolidated Balance Sheets.
Earnings Per Share Basic net loss per share of common stock is determined by dividing net loss attributable to common stockholders by the weighted average number of common shares outstanding during the period. All classes of common stock are allocated net income/(loss) at the same rate per share and receive the same gross distribution per share. The restricted stock grants of Class I shares held by our directors are considered to be participating securities because they contain non-forfeitable rights to distributions. The impact of these restricted stock grants on basic and diluted earnings per common share (“EPS”) has been calculated using the two-class method whereby earnings are allocated to the restricted stock grants based on dividends declared and the restricted stocks’ participation rights in undistributed earnings. As of September 30, 2017, the effects of the two-class method on basic and diluted EPS were not material to the Company’s consolidated financial statements. Recent Accounting Pronouncements In May 2014, the Financial Accounting Standards Board (“FASB”) issued ASU 2014-09 “Revenue from Contracts with Customers (Topic 606).” Beginning January 1, 2018, companies will be required to recognize revenue to depict the transfer of promised goods or services to customers in an amount that reflects the consideration to which the entity expects to be entitled in exchange for those goods or services and also includes additional disclosure requirements. The new standard can be adopted either retrospectively to prior reporting periods presented or as a cumulative effect adjustment as of the date of adoption. The Company is taking inventory of its revenue streams and performing a detailed review of the related contracts to determine the impact of this standard on the Company’s consolidated financial statements. The majority of the Company’s revenue is derived from tenant leases at multifamily, industrial and
retail properties. As such the adoption of ASU 2014-09 will not have an impact on both the Rental Revenue and Tenant Reimbursement Income revenue streams. However, upon adoption of the new leasing standard, ASU 2014-09 may impact the presentation of certain lease and non-lease components of revenue. See below for a further description of the expected impact the new leasing standard may have on the Company. The Company is finalizing its assessment of the expected impact ASU 2014-09 will have on its performance obligations related to the revenue components at the Company’s hotel properties. Due to the fact that the Company’s hotel properties are select service hotels whereby the customer is generally allowed to cancel their reservation within a certain period of time, the Company does not expect the adoption of ASU 2014-09 to have a material impact on the revenue recognition policy for the Company’s hotel properties. In February 2016, the FASB issued ASU 2016-02, “Leases,” which will require organizations that lease assets to recognize the assets and Marchliabilities for the rights and obligations created by those leases on their balance sheet. Additional disclosure regarding a company’s leasing activities will also be expanded under the new guidance. For public entities, ASU 2016-02 is effective for fiscal years beginning after December 15, 2018, including interim periods within those fiscal years, and requires a modified retrospective transition. The Company is currently evaluating the potential impact of this pronouncement on the Company’s consolidated financial statements from both a lessor and lessee standpoint. Under the new leasing standard lessor accounting remains substantially the same as current GAAP. However, the classification of certain lease and non-lease components, such as tenant reimbursement income for real estate taxes and insurance, may change but will not impact total revenue. The new lease standard will have a significant impact on lessee accounting. As such, the Company will be required to recognize a right of use asset on the Company’s consolidated balance sheet along with a lease liability equal to the present value of the remaining minimum lease payments for the Company’s ground leases. 3. Investments in Real Estate Investments in real estate, net consisted of the following ($ in thousands): | | September 30, 2017 | | Building and building improvements | | $ | 1,850,698 | | Land and land improvements | | | 367,012 | | Furniture, fixtures and equipment | | | 40,364 | | Total | | | 2,258,074 | | Accumulated depreciation | | | (23,941 | ) | Investments in real estate, net | | $ | 2,234,133 | |
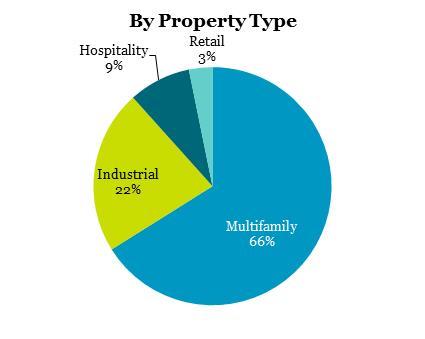
During the nine months ended September 30, 2017, the Company acquired interests in 18 real estate investments, which were comprised of 50 industrial, 27 multifamily, 7 hotel, and 1 retail property. As of December 31, 2016, the Company had not commenced its principal operations and had not acquired any real estate investment properties.
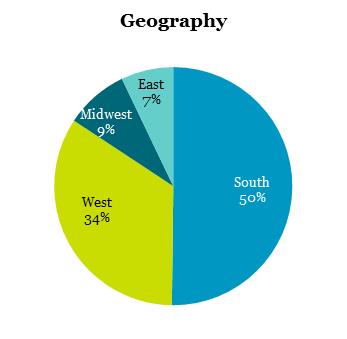
The following table provides further details of the properties acquired during the nine months ended September 30, 2017 ($ in thousands): Property Name | | Ownership Interest | | | Number of Properties | | Location | | Sector | | Acquisition Date | | Purchase Price(1) | | Hyatt Place UC Davis(2) | | | 100% | | | 1 | | Davis, CA | | Hotel | | Jan. 2017 | | $ | 32,687 | | Sonora Canyon | | | 100% | | | 1 | | Mesa, AZ | | Multifamily | | Feb. 2017 | | | 40,983 | | Stockton | | | 100% | | | 1 | | Stockton, CA | | Industrial | | Feb. 2017 | | | 32,751 | | Bakers Centre | | | 100% | | | 1 | | Philadelphia, PA | | Retail | | Mar. 2017 | | | 54,223 | | TA Multifamily Portfolio | | | 100% | | | 6 | | Various(3) | | Multifamily | | Apr. 2017 | | | 432,593 | | HS Industrial Portfolio | | | 100% | | | 38 | | Various(4) | | Industrial | | Apr. 2017 | | | 405,930 | | Emory Point(2) | | | 100% | | | 1 | | Atlanta, GA | | Multifamily(5) | | May 2017 | | | 201,578 | | Nevada West | | | 100% | | | 3 | | Las Vegas, NV | | Multifamily | | May 2017 | | | 170,965 | | Hyatt Place San Jose Downtown | | | 100% | | | 1 | | San Jose, CA | | Hotel | | June 2017 | | | 65,321 | | Mountain Gate & Trails | | | 100% | | | 2 | | Las Vegas, NV | | Multifamily | | June 2017 | | | 83,572 | | Elysian West | | | 100% | | | 1 | | Las Vegas, NV | | Multifamily | | July 2017 | | | 107,027 | | Florida Select-Service 4-Pack | | | 100% | | | 4 | | Tampa & Orlando, FL | | Hotel | | July 2017 | | | 58,973 | | Hyatt House Downtown Atlanta | | | 100% | | | 1 | | Atlanta, GA | | Hotel | | Aug. 2017 | | | 35,332 | | Harbor 5 | | | 100% | | | 5 | | Dallas, TX | | Multifamily | | Aug. 2017 | | | 146,161 | | Gilbert Multifamily | | | 90% | | | 2 | | Gilbert, AZ | | Multifamily | | Sept. 2017 | | | 147,039 | | Domain & GreenVue Multifamily | | | 100% | | | 2 | | Dallas, TX | | Multifamily | | Sept. 2017 | | | 134,452 | | Fairfield Industrial | | | 100% | | | 11 | | Fairfield, NJ | | Industrial | | Sept. 2017 | | | 74,283 | | ACG II Multifamily Portfolio | | | 94% | | | 4 | | Various (6) | | Multifamily | | Sept. 2017 | | | 148,038 | | | | | | | | 85 | | | | | | | | $ | 2,371,908 | |
(1) | Purchase price is inclusive of acquisition related costs. |
(2) | The Hyatt Place UC Davis and Emory Point are subject to a ground lease. The Emory Point ground lease was prepaid by the seller and is recorded as a component of Intangible Assets on the Company’s Consolidated Balance Sheets. |
(3) | The TA Multifamily Portfolio consists of a 32-floor property in downtown Orlando (“55 West”) and five garden style properties located in the suburbs of Palm Beach Gardens, Orlando, Chicago, Dallas and Kansas City. |
(4) | The HS Industrial Portfolio consists of 38 industrial properties located in six submarkets, with the following concentration based on square footage: Atlanta (38%), Chicago (23%), Houston (17%), Harrisburg (10%), Dallas (10%) and Orlando (2%). |
(5) | Emory Point also includes 124,000 square feet of walkable retail space. |
(6) | The ACG II Multifamily Portfolio consists of four garden style properties in Modesto, CA, Olympia, WA, Flagstaff, AZ and Gilbert, AZ. |
The following table summarizes the purchase price allocation for the properties acquired during the nine months ended September 30, 2017 ($ in thousands): | TA Multifamily Portfolio | | | HS Industrial Portfolio | | | Emory Point | | | Nevada West | | | All Other | | | Total | | Building and building improvements | $ | 337,889 | | | $ | 345,391 | | | $ | 171,709 | | | $ | 145,305 | | | $ | 847,905 | | | $ | 1,848,199 | | Land and land improvements | | 68,456 | | | | 45,081 | | | | — | | | | 17,409 | | | | 235,876 | | | | 366,822 | | Furniture, fixtures and equipment | | 4,651 | | | | — | | | | 3,040 | | | | 2,833 | | | | 28,892 | | | | 39,416 | | In-place lease intangibles | | 21,880 | | | | 20,793 | | | | 11,207 | | | | 5,418 | | | | 46,094 | | | | 105,392 | | Below-market ground lease intangibles | | — | | | | — | | | | — | | | | — | | | | 4,683 | | | | 4,683 | | Above-market lease intangibles | | 24 | | | | 2,726 | | | | 84 | | | | — | | | | 465 | | | | 3,299 | | Below-market lease intangibles | | (307 | ) | | | (8,061 | ) | | | (576 | ) | | | — | | | | (3,749 | ) | | | (12,693 | ) | Prepaid ground lease rent | | — | | | | — | | | | 16,114 | | | | — | | | | — | | | | 16,114 | | Other intangibles | | — | | | | — | | | | — | | | | — | | | | 676 | | | | 676 | | Total purchase price | $ | 432,593 | | | $ | 405,930 | | | $ | 201,578 | | | $ | 170,965 | | | $ | 1,160,842 | | | $ | 2,371,908 | | Assumed mortgage notes(1) | | — | | | | — | | | | — | | | | — | | | | 108,971 | | | | 108,971 | | Net purchase price | $ | 432,593 | | | $ | 405,930 | | | $ | 201,578 | | | $ | 170,965 | | | $ | 1,051,871 | | | $ | 2,262,937 | |
| (1) | Includes assumed mortgage notes with an outstanding principal balance of $107.4 million and premium on mortgage notes of $1.6 million as of September 30, 2017. Refer to Note 6 for additional details on the Company’s mortgage notes. |
The weighted-average amortization periods for the acquired in-place lease intangibles, below-market ground lease intangibles, above-market lease intangibles, below-market lease intangibles, prepaid ground lease rent and other intangibles of the properties acquired during the nine months ended September 30, 2017 were 3, 52, 6, 6, 71 and 4 years, respectively. 4. Intangibles The gross carrying amount and accumulated amortization of the Company’s intangible assets and liabilities consisted of the following ($ in thousands): | | September 30, 2017 | | Intangible assets: | | | | | In-place lease intangibles | | $ | 104,735 | | Below-market ground lease intangibles | | | 4,683 | | Above-market lease intangibles | | | 3,299 | | Prepaid ground lease rent | | | 16,114 | | Other | | | 676 | | Total intangible assets | | | 129,507 | | Accumulated amortization: | | | | | In-place lease amortization | | | (40,496 | ) | Below-market ground lease amortization | | | (62 | ) | Above-market lease amortization | | | (314 | ) | Prepaid ground lease rent amortization | | | (94 | ) | Other | | | (31 | ) | Total accumulated amortization | | | (40,997 | ) | Intangible assets, net | | $ | 88,510 | | Intangible liabilities: | | | | | Below-market lease intangibles | | $ | 12,693 | | Accumulated amortization | | | (1,106 | ) | Intangible liabilities, net | | $ | 11,587 | |
The estimated future amortization on the Company’s intangibles for each of the next five years and thereafter as of September 30, 2017 is as follows ($ in thousands): | | In-place Lease Intangibles | | | Below-market Ground Lease Intangibles | | | Above-market Lease Intangibles | | | Pre-paid Ground Lease Intangibles | | | Below-market Lease Intangibles | | 2017 (remaining) | | $ | 23,448 | | | $ | 22 | | | $ | 194 | | | $ | 57 | | | $ | (743 | ) | 2018 | | | 20,145 | | | | 89 | | | | 722 | | | | 227 | | | | (2,745 | ) | 2019 | | | 6,370 | | | | 89 | | | | 496 | | | | 227 | | | | (2,060 | ) | 2020 | | | 5,264 | | | | 89 | | | | 473 | | | | 227 | | | | (1,866 | ) | 2021 | | | 4,101 | | | | 89 | | | | 442 | | | | 227 | | | | (1,617 | ) | Thereafter | | | 4,911 | | | | 4,243 | | | | 658 | | | | 15,055 | | | | (2,556 | ) | | | $ | 64,239 | | | $ | 4,621 | | | $ | 2,985 | | | $ | 16,020 | | | $ | (11,587 | ) |
5. Investments in Real Estate-Related Securities The following table details the Company’s investments in CMBS as of September 30, 2017 ($ in thousands): | Number of Investments | | | Credit Rating(1) | | Collateral | | Weighted Average Coupon(2) | | Weighted Average Maturity Date | | Face Amount | | | Cost Basis | | | Fair Value | | | | 5 | | | BBB | | Office, Hospitality, Industrial, Retail | | L+2.16% | | 4/28/2030 | | $ | 132,034 | | | $ | 132,034 | | | $ | 132,363 | | | | 11 | | | BB | | Hospitality, Office, Retail, Multifamily | | L+3.22% | | 4/5/2034 | | | 333,578 | | | | 333,466 | | | | 333,777 | | | | 8 | | | B | | Hospitality, Office, Multifamily | | L+4.12% | | 11/30/2032 | | | 177,950 | | | | 177,878 | | | | 178,231 | | | | 24 | | | | | | | | | | | $ | 643,562 | | | $ | 643,378 | | | $ | 644,371 | |
| (1) | BBB represents credit ratings of BBB+, BBB, and BBB-, BB represents credit ratings of BB+, BB, and BB-, and B represents credit ratings of B+, B, and B-. |
| (2) | The term “L” refers to the three-month U.S. dollar-denominated London Interbank Offer Rate (“LIBOR”). As of September 30, 2017, three-month LIBOR was equal to 1.3%. |
As of September 30, 2017, the Company’s investments in real estate-related securities included 11 CMBS with a total cost basis of $369.3 million collateralized by properties owned by Blackstone-advised investment vehicles and three CMBS with a total cost basis of $63.5 million collateralized by a loan originated by a Blackstone-advised investment vehicle. Such CMBS were purchased in fully or over-subscribed offerings. Each investment in such CMBS by Blackstone and its affiliates (including the Company) represented no more than a 49% participation in any individual tranche. The Company acquired its minority participation interests from third-party investment banks on market terms negotiated by the majority third-party investors. Blackstone and its affiliates (including the Company) will forgo all non-economic rights (including voting rights) in such CMBS as long as the Blackstone-advised investment vehicles either own the properties collateralizing, or have an interest in a different part of the capital structure related to such CMBS. For the three and nine months ended September 30, 2017, the Company recorded interest income of $3.1 million and $4.3 million, respectively, related to its investments in such CMBS. Such amounts were reported as a component of Income From Real Estate-Related Securities on the Company’s Consolidated Statements of Operations. As described in Note 2, the Company classifies its investments in real estate-related securities as trading and records these investments at fair value in Real Estate-Related Securities on the Company’s Consolidated Balance Sheets. During the three and nine months ended September 30, 2017, the Company recorded an unrealized loss of $0.6 million and an unrealized gain of $1.0 million, respectively, as a component of Income From Real Estate-Related Securities on the Company’s Consolidated Statements of Operations. During the nine months ended September 30, 2017, one of the Company’s CMBS investments was repaid and the Company recorded a realized loss of $0.2 million as a component of Income From Real Estate-Related Securities on the Company’s Consolidated Statements of Operations. The Company did not sell any securities during the three and nine months ended September 30, 2017.
6. Mortgage Notes, Term Loan, and Revolving Credit Facility The following is a summary of the mortgage notes, term loan, and revolving credit facility secured by the Company’s properties as of September 30, 2017 ($ in thousands): Property | | Interest Rate(1) | | | Maturity Dates | | Principal Balance | | | Amortization Period | | Prepayment Provisions(2) | TA Multifamily (excluding 55 West) | | | 3.76% | | | 6/1/2024 | | $ | 211,249 | | | Interest Only | | Yield Maintenance | Industrial Properties - Term Loan | | L+2.10% | | | 6/1/2022 | | | 146,000 | | | Interest Only | | Spread Maintenance | Industrial Properties - Revolving Credit Facility | | L+2.10% | | | 6/1/2022 | | | 146,000 | | | Interest Only | | None | Emory Point | | | 3.66% | | | 5/5/2024 | | | 130,000 | | | Interest Only(4) | | Yield Maintenance | Nevada West | | | 3.75% | | | 9/1/2024 | | | 121,380 | | | Interest Only | | Yield Maintenance | Elysian West | | | 3.77% | | | 9/1/2024 | | | 75,400 | | | Interest Only | | Yield Maintenance | 55 West (part of TA Multifamily Portfolio) | | L+2.18% | | | 5/9/2022(3) | | | 63,600 | | | Interest Only | | Spread Maintenance | Mountain Gate & Trails | | | 3.75% | | | 9/1/2024 | | | 59,985 | | | Interest Only | | Yield Maintenance | Gilbert Vistara | | | 4.09% | | | 10/1/2028 | | | 48,129 | | | Interest Only | | Yield Maintenance | Gilbert Redstone | | | 4.92% | | | 4/10/2029 | | | 40,484 | | | Interest Only(5) | | Yield Maintenance | ACG II - Highlands | | | 3.62% | | | 10/1/2024 | | | 27,715 | | | Interest Only | | Yield Maintenance | Sonora Canyon | | | 3.76% | | | 6/1/2024 | | | 26,455 | | | Interest Only | | Yield Maintenance | ACG II - Brooks Landing | | | 4.60% | | | 10/6/2025 | | | 24,500 | | | Interest Only | | Yield Maintenance | ACG II - Woodlands | | | 4.83% | | | 3/6/2024 | | | 23,485 | | | Interest Only(5) | | Yield Maintenance | ACG II - Sterling Pointe | | | 5.36% | | | 1/6/2024 | | | 18,900 | | | Interest Only(5) | | Yield Maintenance | Total principal balance | | | | | | | | | 1,163,282 | | | | | | Deferred financing costs, net | | | | | | | | | (9,493 | ) | | | | | Premium on assumed debt, net | | | | | | | | | 1,602 | | | | | | Mortgage notes, term loan, and revolving credit facility, net | | | | | | | | $ | 1,155,391 | | | | | |
| (1) | The term “L” refers to the one-month LIBOR. As of September 30, 2017, one-month LIBOR was equal to 1.2%. |
| (2) | Yield and spread maintenance provisions require the borrower to pay a premium to the lender in an amount that would allow the lender to attain the yield or spread assuming the borrower had made all payments until maturity. |
| (3) | The 55 West mortgage has an initial maturity date of May 9, 2019 and the Company, at its sole discretion, has three one-year extension options. |
| (4) | Interest only payments required for the first 60 months of the mortgage and principal and interest payments required for the final 24 months. |
| (5) | Principal and interest payments are required for Gilbert Redstone, ACG II-Woodlands, and ACG II-Sterling Point beginning September 2021, February 2019, and January 2018, respectively. |
The following table presents the future principal payments due under the Company’s mortgage notes, term loan, and revolving credit facility as of September 30, 2017 ($ in thousands): | | | | | Year | | Amount | | 2017 (remaining) | | $ | — | | 2018 | | | 227 | | 2019 | | | 510 | | 2020 | | | 622 | | 2021 | | | 834 | | Thereafter | | | 1,161,089 | | Total | | $ | 1,163,282 | |
7. Repurchase Agreements The Company has entered into master repurchase agreements with Citigroup Global Markets Inc. (the “Citi MRA”), Royal Bank of Canada (the “RBC MRA”), and Bank of America Merrill Lynch (the “BAML MRA”) to provide the Company with additional financing capacity secured by the Company’s $644.4 million of investments in real estate-related securities. The terms of the Citi MRA, RBC MRA, and BAML MRA provide the lenders the ability to determine the size and terms of the financing provided based upon the particular collateral pledged by the Company from time-to-time. As of September 30, 2017, the Company did not retainedhave any outstanding borrowings under the BAML MRA.
The following table is a summary of our repurchase agreements as of September 30, 2017 ($ in thousands): Facility | | Interest Rate(1) | | Maturity Dates(2) | | Security Interests | | Collateral Assets(3) | | | Outstanding Balance | | | Prepayment Provisions | Citi MRA | | L+1.25% - L+1.70% | | 10/16/2017 - 12/28/2017 | | CMBS | | $ | 580,899 | | | $ | 429,294 | | | None | RBC MRA | | L+1.25% - L+1.45% | | 10/20/2017 | | CMBS | | | 63,472 | | | | 49,161 | | | None | | | | | | | | | $ | 644,371 | | | $ | 478,455 | | | |
| (1) | The term “L” refers to the three-month LIBOR. As of September 30, 2017, three-month LIBOR was equal to 1.3% |
| (2) | Subsequent to quarter end, the Company rolled its repurchase agreement contracts expiring in October 2017 into new three, nine, or twelve month contracts. |
| (3) | Represents the fair value of the Company’s investments in real estate-related securities. |
8. Affiliate Line of Credit On January 23, 2017, the Company entered into an unsecured, uncommitted line of credit (the “Line of Credit”) up to a maximum amount of $250 million with Blackstone Holdings Finance Co. L.L.C. (“Lender”), an affiliate of Blackstone. The Line of Credit expires on January 23, 2018, and may be extended for up to 12 months, subject to Lender approval. The interest rate is the then-current rate offered by a third-party lender, or, if no such rate is available, LIBOR plus 2.25%. Interest under the Line of Credit is determined based on a one-month U.S. dollar-denominated LIBOR, which was 1.2% as of September 30, 2017. Each advance under the Line of Credit is repayable on the earliest of (i) the expiration of the Line of Credit, (ii) Lender’s demand and (iii) the date on which the Adviser no longer acts as the Company’s investment adviser, provided that the Company will have 180 days to make such repayment in the cases of clauses (i) and (ii) and 45 days to make such repayment in the case of clause (iii). To the extent the Company has not repaid all loans and other obligations under the Line of Credit when repayment is required, the Company is obligated to apply the net cash proceeds from the Offering and any sale or other disposition of assets to the repayment of such loans and other obligations; provided that the Company will be permitted to (x) make payments to fulfill any repurchase requests pursuant to the Company’s share repurchase plan, (y) use funds to close any acquisition of property that the Company committed to prior to receiving a demand notice and (z) make quarterly distributions to the Company’s stockholders at per share levels consistent with the immediately preceding fiscal quarter and as otherwise required for any such services.the Company to maintain its REIT status. As of September 30, 2017, the Company had $122.7 million in borrowings outstanding under the Line of Credit. 5. Economic Dependency
9. Other Assets and Other Liabilities The following table summarizes the components of other assets ($ in thousands): | | September 30, 2017 | | | December 31, 2016 | | Pre-acquisition costs | | $ | 10,106 | | | | — | | Prepaid expenses | | | 3,267 | | | | — | | Receivables | | | 3,143 | | | | — | | Deferred financing costs, net | | | 2,426 | | | | — | | Straight-line rent receivable | | | 1,118 | | | | — | | Other | | | 3,694 | | | | — | | Total | | $ | 23,754 | | | $ | — | |
The following table summarizes the components of accounts payable, accrued expenses, and other liabilities ($ in thousands): | | September 30, 2017 | | | December 31, 2016 | | Real estate taxes payable | | $ | 15,867 | | | $ | — | | Intangible liabilities, net | | | 11,587 | | | | — | | Accounts payable and accrued expenses | | | 9,501 | | | | — | | Tenant security deposits | | | 5,685 | | | | — | | Distribution payable | | | 5,624 | | | | — | | Accrued interest expense | | | 4,397 | | | | — | | Prepaid rental income | | | 4,098 | | | | — | | Other | | | 1,344 | | | | 29 | | Total | | $ | 58,103 | | | $ | 29 | |
10. Equity Authorized Capital The Company will be dependent onis authorized to issue preferred stock and four classes of common stock consisting of Class S shares, Class T shares, Class D shares, and Class I shares. The Company’s board of directors has the Adviserability to establish the preferences and its affiliatesrights of each class or series of preferred stock, without stockholder approval, and as such, it may afford the holders of any series or class of preferred stock preferences, powers and rights senior to the rights of holders of common stock. The differences among the common share classes relate to upfront selling commissions, dealer manager fees and ongoing stockholder servicing fees. See Note 2 for certain services that are essentiala further description of such items. Other than the differences in upfront selling commissions, dealer manager fees and ongoing stockholder servicing fees, each class of common stock is subject to it, including the salesame economic and voting rights. As of September 30, 2017, the Company had authority to issue 2,100,000,000 shares, consisting of the following: Classification | | Number of Shares (in thousands) | | | Par Value | | Preferred Stock | | | 100,000 | | | $ | 0.01 | | Class S Shares | | | 500,000 | | | $ | 0.01 | | Class T Shares | | | 500,000 | | | $ | 0.01 | | Class D Shares | | | 500,000 | | | $ | 0.01 | | Class I Shares | | | 500,000 | | | $ | 0.01 | | Total | | | 2,100,000 | | | | | |
Common Stock As of September 30, 2017, the Company had sold 125.5 million shares of its common stock in the Offering for aggregate net proceeds of $1.3 billion. The following table details the movement in the Company’s outstanding shares of common stock acquisition(in thousands): | | Nine Months Ended September 30, 2017 | | | | Class S | | | Class T | | | Class D | | | Class I | | | Total | | Beginning balance | | | — | | | | — | | | | — | | | | 20 | | | | 20 | | Common stock issued | | | 97,801 | | | | 2,206 | | | | 1,221 | | | | 22,932 | | | | 124,160 | | Distribution reinvestment | | | 993 | | | | 3 | | | | 5 | | | | 313 | | | | 1,314 | | Common stock repurchased | | | (15 | ) | | | — | | | | — | | | | (4 | ) | | | (19 | ) | Directors’ restricted stock grant(1) | | | — | | | | — | | | | — | | | | 16 | | | | 16 | | Ending balance | | | 98,779 | | | | 2,209 | | | | 1,226 | | | | 23,277 | | | | 125,491 | |
(1) | The directors’ restricted stock grant represents 25% of the annual compensation paid to the independent directors. The grant is amortized over the service period of such grant. |
Share Repurchase Plan We have adopted a share repurchase plan whereby, subject to certain limitations, stockholders may request on a monthly basis that we repurchase all or any portion of their shares. For the nine months ended September 30, 2017, we repurchased 18,921 shares of common stock. We had no unfulfilled repurchase requests during the nine months ended September 30, 2017. Distributions The Company generally intends to distribute substantially all of its taxable income, which does not necessarily equal net income as calculated in accordance with GAAP, to its stockholders each year to comply with the REIT provisions of the Internal Revenue Code. Beginning March 2017, the Company declared a monthly distribution to stockholders of record as of the last day of each applicable month. The following table details the aggregate distributions declared for each applicable class of common stock for the nine months ended September 30, 2017 ($ in thousands, except share and disposition decisions,per share data): | | Class S | | | Class I | | | Class D | | | Class T | | Aggregate distributions declared per share of common stock | | $ | 0.3245 | | | $ | 0.3245 | | | $ | 0.2471 | | | $ | 0.2030 | | Stockholder servicing fee per share of common stock | | | (0.0598 | ) | | | — | | | | (0.0108 | ) | | | (0.0289 | ) | Net distributions declared per share of common stock | | $ | 0.2647 | | | $ | 0.3245 | | | $ | 0.2363 | | | $ | 0.1741 | |
11. Related Party Transactions Management Fee and certain other responsibilities. InPerformance Participation Allocation On August 7, 2017, the event thatCompany renewed the advisory agreement between the Company, BREIT OP and the Adviser for an additional one-year period ending August 31, 2018. The Adviser is entitled to an annual management fee equal to 1.25% of the Company’s NAV, payable monthly as compensation for the services it provides to the Company. The management fee can be paid, at the Adviser’s election, in cash, shares of common stock, or BREIT OP units. The Adviser’s management fee waiver period expired on June 30, 2017. During the three months ended September 30, 2017, the Company accrued $3.7 million of management fees, which is included in Due to Affiliates on the Company’s Consolidated Balance Sheets. The Adviser has currently elected to receive the management fee in shares of the Company’s common stock and during October 2017 the Adviser was issued 355 thousand Class I shares as payment for the $3.7 million management fee accrued as of September 30, 2017. Additionally, the Special Limited Partner holds a performance participation interest in BREIT OP that entitles it to receive an allocation of BREIT OP’s total return to its capital account. Total return is defined as distributions paid or accrued plus the change in NAV. Under the BREIT OP agreement, the annual total return will be allocated solely to the Special Limited Partner after the other unit holders have received a total return of 5% (after recouping any loss carryforward amount) and such allocation will continue until the allocation between the Special Limited Partner and all other unit holders is equal to 12.5% and 87.5%, respectively. Thereafter, the Special Limited Partner will receive an allocation of 12.5% of the annual total return. The allocation of the performance participation interest is ultimately determined at the end of each calendar year and will be paid in cash or Class I units of BREIT OP, at the election of the Special Limited Partner. During the nine months ended September 30, 2017, the Company had recognized $11.0 million of Performance Participation Allocation Expense in the Company’s Consolidated Statement of Operations. Due to Affiliates The following table details the components of due to affiliates ($ in thousands): | | September 30, 2017 | | | December 31, 2016 | | Accrued stockholder servicing fee | | $ | 75,998 | | | $ | — | | Performance participation allocation | | | 10,952 | | | | — | | Advanced organization and offering costs | | | 9,389 | | | | — | | Accrued management fee | | | 3,712 | | | | — | | Accrued affiliate service provider expenses | | | 1,797 | | | | — | | Advanced expenses | | | 135 | | | | 86 | | Total | | $ | 101,983 | | | $ | 86 | |
Accrued stockholder servicing fee As described in Note 2, the Company accrues the full amount of the future stockholder servicing fees payable to the Dealer Manager for Class S, Class T, and Class D shares up to the 8.75% of gross proceeds limit at the time such shares are unablesold. As of September 30, 2017, the Company accrued $76.0 million of stockholder servicing fees payable to the Dealer Manager related to the Class S, Class T, and Class D shares sold. The Dealer Manager has entered into agreements with the selected dealers distributing the Company’s shares in the Offering, which provide, among other things, for the re-allowance of the full amount of the selling commissions and dealer manager fee and all or unwillinga portion of the stockholder servicing fees received by the Dealer Manager to such selected dealers. Advanced organization and offering costs The Adviser advanced $9.4 million of organization and offering costs (excluding upfront selling commissions, dealer manager fees and stockholder servicing fees) on behalf of the Company through September 30, 2017. Such amounts will be reimbursed to the Adviser on a pro-rata basis over 60 months beginning January 1, 2018. Accrued affiliate service provider expenses The Company has engaged and expects to continue to engage BRE Hotels and Resorts, a portfolio company controlled (but not owned) by a Blackstone-advised fund, to provide day-to-day operational and management services (including revenue management, accounting, legal and contract management, expense management, and capital expenditure projects and transaction support services) for the Company’s hotel properties. The Company currently estimates the cost for such services to be approximately $200 per key per
annum (which will be reviewed periodically and adjusted if appropriate), plus actual costs allocated for transaction support services. During the three and nine months ended September 30, 2017, the Company incurred $38 thousand and $53 thousand, respectively, of expenses due to BRE Hotels and Resorts for services incurred in connection with its investments and such amount is included in Hotel Operating expenses on the Company’s Consolidated Statements of Operations. The Company has engaged and expects to continue to engage LivCor, LLC (“LivCor”), a portfolio company owned by a Blackstone-advised fund, to provide day-to-day operational and management services (including leasing, construction management, revenue management, accounting, legal and contract management, expense management, and capital expenditure projects and transaction support services) for the Company’s multifamily properties. The Company currently estimates the cost for such services to be approximately $300 per unit per annum (which will be reviewed periodically and adjusted if appropriate), plus actual costs allocated for transaction support services. During the three and nine months ended September 30, 2017, the Company incurred $394 thousand and $464 thousand, respectively, of expenses due to LivCor for services incurred in connection with its investments and such amount is included in Rental Property Operating expenses on the Company’s Consolidated Statements of Operations. Additionally, as of September 30, 2017, the Company capitalized $600 thousand to Investments in Real Estate on the Company’s Consolidated Balance Sheets for transaction support services provided by LivCor. The Company has engaged and expects to continue to engage Equity Office Management, L.L.C. (“EOM”), a portfolio company owned by Blackstone-advised funds, to provide day-to-day operational and management services (including property management services, leasing, construction management, accounting, legal and contract management, expense management, and capital expenditure projects and transaction support services) for the Company’s office and industrial properties. The Company currently estimates the cost for such services to be approximately 3% of gross revenue for property management services, 1% of gross rents from new and renewal leases for leasing services and 4% of total project costs for construction management services, plus a per square foot amount for corporate services and actual costs allocated for transaction support services. During the three and nine months ended September 30, 2017, the Company incurred $286 thousand and $757 thousand, respectively, of expenses due to EOM for services incurred in connection with its investments, and such amount is included in Rental Property Operating expenses in the Company’s Consolidated Statements of Operations. Additionally, as of September 30, 2017, the Company capitalized $20 thousand to Investments in Real Estate on the Company’s Consolidated Balance Sheets for transaction support services provided by EOM. The Company has engaged and expects to continue to engage ShopCore Properties TRS Management LLC (“ShopCore”), a portfolio company owned by a Blackstone-advised fund, to provide day-to-day operational and management services (including property management services, leasing, construction management, revenue management, accounting, legal and contract management, expense management, and capital expenditure projects and transaction support services) for the Company’s retail properties. The Company currently estimates the cost of such services to be approximately 3% of gross revenue for property management services, 1% of gross rents from new and renewal leases for leasing services and 4% of total project costs for construction management services, plus a per square foot amount for corporate services and actual costs allocated for transaction support services. During the three and nine months ended September 30, 2017, the Company incurred $72 thousand and $142 thousand, respectively, of expenses due to ShopCore for services incurred in connection with its investments and such amount is included in Rental Property Operating expenses on the Company’s Consolidated Statements of Operations. The Company expects to set up a management incentive plan for each transaction for which the Company engages BRE Hotels and Resorts, LivCor, EOM, or ShopCore for certain senior executives of the applicable portfolio company. Neither Blackstone nor the Adviser receives any fees or incentive payments from agreements between the Company and such portfolio companies or their management teams. During the nine months ended September 30, 2017, the Company has not paid or accrued any incentive fees to its affiliated service providers under such agreements. Advanced expenses The Adviser had advanced $135 thousand and $86 thousand of expenses on the Company’s behalf for general corporate services provided by unaffiliated third parties as of September 30, 2017 and December 31, 2016, respectively. Other Blackstone partnered with a leading national title agency to create Lexington National Land Services (“LNLS”), a title agent company. LNLS acts as an agent for one or more underwriters in issuing title policies in connection with investments by the Company, Blackstone, and third parties. LNLS will not perform services in non-regulated states for the Company, unless in the context of a portfolio transaction that includes properties in rate-regulated states, as part of a syndicate of title insurance companies where the rate is negotiated by other insurers or their agents, when a third party is paying all or a material portion of the premium or in other scenarios where LNLS is not negotiating the premium. LNLS earns fees, which would be requiredhave otherwise been paid to find alternative service providers.third parties, by providing title agency services and facilitating placement of title insurance with underwriters. Blackstone receives distributions from LNLS in connection with investments by the Company based on its equity interest in LNLS. During the nine months ended
September 30, 2017, the Company paid LNLS $160 thousand for title services related to two investments and such costs were capitalized to Investments in Real Estate on the Company’s Consolidated Balance Sheet. 6.12. Commitments and Contingencies
As of September 30, 20162017 and MarchDecember 31, 2016, the Company iswas not subject to any material litigation nor is the Company aware of any material litigation threatened against it. The Hyatt Place UC Davis is subject to a ground lease that expires in 2070. Pursuant to the ground lease, the Company will pay the landlord annual rent equal to the greater of (a) minimum base rent of $130 thousand (subject to certain periodic adjustments) or (b) 5% of room revenue reduced by a utility rebate equal to actual utility charges paid, capped at 2% of room revenue. The 55 West parking garage is subject to a ground lease that expires in 2085. Pursuant to the ground lease, the Company will pay the landlord annual rent equal to a fixed payment of $50 thousand and a variable payment which is the product of the prior year variable rate adjusted by the Consumer Price Index during the previous year. At the time the Company acquired the ground lease, the variable rent payment component was equal to $59 thousand. The following table details the Company’s contractual obligations and commitments with payments due subsequent to September 30, 2017 ($ in thousands): Year | | Future Commitments | | 2017 (remaining) | | $ | 60 | | 2018 | | | 239 | | 2019 | | | 239 | | 2020 | | | 239 | | 2021 | | | 239 | | Thereafter | | | 13,233 | | Total | | $ | 14,249 | |
13. Five Year Minimum Rental Payments The following table presents the future minimum rents the Company expects to receive for its industrial and retail properties ($ in thousands). Leases at the Company’s multifamily investments are short term, generally 12 months or less, and are therefore not included. Year | | Future Minimum Rents | | 2017 (remaining) | | $ | 9,562 | | 2018 | | | 37,139 | | 2019 | | | 31,378 | | 2020 | | | 28,275 | | 2021 | | | 24,021 | | Thereafter | | | 59,734 | | Total | | $ | 190,109 | |
14. Segment Reporting The Company operates in five reportable segments: Multifamily properties, Industrial properties, Hotel properties, Retail properties, and Real Estate-Related Securities. The Company allocates resources and evaluates results based on the performance of each segment individually. The Company believes that Segment Net Operating Income is the key performance metric that captures the unique operating characteristics of each segment. The following table sets forth the total assets by segment as of September 30, 2017 ($ in thousands): | | September 30, 2017 | | Multifamily | | $ | 1,588,958 | | Industrial | | | 524,988 | | Hotel | | | 200,301 | | Retail | | | 55,644 | | Real Estate-Related Securities | | | 646,373 | | Other (Corporate) | | | 111,205 | | Total assets | | $ | 3,127,469 | |
The following table sets forth the financial results by segment for the three months ended September 30, 2017 ($ in thousands): | | Multifamily | | | Industrial | | | Hotel | | | Retail | | | Real Estate- Related Securities | | | Total | | Revenues: | | | | | | | | | | | | | | | | | | | | | | | | | Rental revenue | | $ | 24,911 | | | $ | 7,737 | | | $ | — | | | $ | 951 | | | $ | — | | | $ | 33,599 | | Tenant reimbursement income | | | 964 | | | | 2,036 | | | | — | | | | 230 | | | | — | | | | 3,230 | | Hotel revenue | | | — | | | | — | | | | 9,874 | | | | — | | | | — | | | | 9,874 | | Other revenue | | | 2,182 | | | | 7 | | | | — | | | | 12 | | | | — | | | | 2,201 | | Total revenues | | | 28,057 | | | | 9,780 | | | | 9,874 | | | | 1,193 | | | | — | | | | 48,904 | | | | | | | | | | | | | | | | | | | | | | | | | | | Expenses: | | | | | | | | | | | | | | | | | | | | | | | | | Rental property operating | | | 12,588 | | | | 3,029 | | | | — | | | | 321 | | | | — | | | | 15,938 | | Hotel operating | | | — | | | | — | | | | 6,668 | | | | — | | | | — | | | | 6,668 | | Total expenses | | | 12,588 | | | | 3,029 | | | | 6,668 | | | | 321 | | | | — | | | | 22,606 | | Income from real estate-related securities | | | — | | | | — | | | | — | | | | — | | | | 4,026 | | | | 4,026 | | Segment net operating income | | $ | 15,469 | | | $ | 6,751 | | | $ | 3,206 | | | $ | 872 | | | $ | 4,026 | | | $ | 30,324 | | | | | | | | | | | | | | | | | | | | | | | | | | | Depreciation and amortization | | $ | 32,606 | | | $ | 5,408 | | | $ | 1,862 | | | $ | 483 | | | $ | — | | | $ | 40,359 | | | | | | | | | | | | | | | | | | | | | | | | | | | Other income (expense): | | | | | | | | | | | | | | | | | | | | | | | | | General and administrative | | | | | | | | | | | | | | | | | | | | | | | (1,716 | ) | Management fee | | | | | | | | | | | | | | | | | | | | | | | (3,712 | ) | Performance participation allocation | | | | | | | | | | | | | | | | | | | | | | | (5,711 | ) | Interest income | | | | | | | | | | | | | | | | | | | | | | | 36 | | Interest expense | | | | | | | | | | | | | | | | | | | | | | | (10,866 | ) | Other expenses | | | | | | | | | | | | | | | | | | | | | | | (27 | ) | Income tax benefit | | | | | | | | | | | | | | | | | | | | | | | 184 | | Net loss | | | | | | | | | | | | | | | | | | | | | | $ | (31,847 | ) | Net loss attributable to non-controlling interests | | | | | | | | | | | | | | | | | | | | | | | 122 | | Net loss attributable to BREIT stockholders | | | | | | | | | | | | | | | | | | | | | | $ | (31,725 | ) |
The following table sets forth the financial results by segment for the nine months ended September 30, 2017 ($ in thousands): | | Multifamily | | | Industrial | | | Hotel | | | Retail | | | Real Estate- Related Securities | | | Total | | Revenues: | | | | | | | | | | | | | | | | | | | | | | | | | Rental revenue | | $ | 39,466 | | | $ | 14,357 | | | $ | — | | | $ | 1,904 | | | $ | — | | | $ | 55,727 | | Tenant reimbursement income | | | 1,472 | | | | 3,703 | | | | — | | | | 328 | | | | — | | | | 5,503 | | Hotel revenue | | | — | | | | — | | | | 15,048 | | | | — | | | | — | | | | 15,048 | | Other revenue | | | 3,385 | | | | 6 | | | | — | | | | 18 | | | | — | | | | 3,409 | | Total revenues | | | 44,323 | | | | 18,066 | | | | 15,048 | | | | 2,250 | | | | — | | | | 79,687 | | | | | | | | | | | | | | | | | | | | | | | | | | | Expenses: | | | | | | | | | | | | | | | | | | | | | | | | | Rental property operating | | | 19,473 | | | | 5,664 | | | | — | | | | 495 | | | | — | | | | 25,632 | | Hotel operating | | | — | | | | — | | | | 9,617 | | | | — | | | | — | | | | 9,617 | | Total expenses | | | 19,473 | | | | 5,664 | | | | 9,617 | | | | 495 | | | | — | | | | 35,249 | | Income from real estate-related securities | | | — | | | | — | | | | — | | | | — | | | | 7,435 | | | | 7,435 | | Segment net operating income | | $ | 24,850 | | | $ | 12,402 | | | $ | 5,431 | | | $ | 1,755 | | | $ | 7,435 | | | $ | 51,873 | | | | | | | | | | | | | | | | | | | | | | | | | | | Depreciation and amortization | | $ | 51,205 | | | $ | 9,852 | | | $ | 3,119 | | | $ | 969 | | | $ | — | | | $ | 65,145 | | | | | | | | | | | | | | | | | | | | | | | | | | | Other income (expense): | | | | | | | | | | | | | | | | | | | | | | | | | General and administrative | | | | | | | | | | | | | | | | | | | | | | | (5,969 | ) | Management fee | | | | | | | | | | | | | | | | | | | | | | | (3,712 | ) | Performance participation allocation | | | | | | | | | | | | | | | | | | | | | | | (10,952 | ) | Interest income | | | | | | | | | | | | | | | | | | | | | | | 418 | | Interest expense | | | | | | | | | | | | | | | | | | | | | | | (16,413 | ) | Other expenses | | | | | | | | | | | | | | | | | | | | | | | (55 | ) | Income tax benefit | | | | | | | | | | | | | | | | | | | | | | | 140 | | Net loss | | | | | | | | | | | | | | | | | | | | | | $ | (49,815 | ) | Net loss attributable to non-controlling interests | | | | | | | | | | | | | | | | | | | | | | | 122 | | Net loss attributable to BREIT stockholders | | | | | | | | | | | | | | | | | | | | | | $ | (49,693 | ) |
15. Subsequent Events Acquisitions Subsequent to September 30, 2017, the Company acquired an aggregate of $383.8 million of real estate across four separate transactions, exclusive of closing costs. The acquisitions were related to multifamily, industrial, hotel, and retail properties. Subsequent to September 30, 2017, the Company purchased an aggregate of $150.8 million of floating-rate CMBS. Financing On October 27, 2017, the Company entered into a $300.0 million revolving credit facility with Citi Bank, N.A. (the “Citi Line of Credit”). The Citi Line of Credit is currently secured by certain of the Company’s hotel investments. Borrowings under the Citi Line of Credit will accrue interest at a rate of LIBOR plus 2.25%. The initial maturity date of the Citi Line of Credit is October 26, 2018, and the Company has two one year extension options. As of November 13, 2017, the Company has not drawn any funds under the Citi Line of Credit. Status of the Offering As of November 13, 2017, the Company had sold an aggregate of 152,942,761 shares of its common stock (consisting of 117,771,673 Class S shares, 4,315,936 Class T shares, 2,981,473 Class D shares, and 27,873,679 Class I shares) in the Offering resulting in net proceeds of $1.5 billion to the Company as payment for such shares.
ITEM 2. | MANAGEMENT’SMANAGEMENT’S DISCUSSION AND ANALYSIS OF FINANCIAL CONDITION AND RESULTS OF OPERATIONS |
References herein to “Blackstone Real Estate Income Trust,” “BREIT,” the “Company,” “we,” “us,” or “our” refer to Blackstone Real Estate Income Trust, Inc. and its subsidiaries unless the context specifically requires otherwise. The following discussion should be read in conjunction with the unaudited consolidated financial statements and notes thereto appearing elsewhere in this quarterly report on Form 10-Q. In addition to historical data, this discussion contains forward-looking statements about our business, operations and financial performance based on current expectations that involve risks, uncertainties and assumptions. Our actual results may differ materially from those in this discussion as a result of various factors, including but not limited to those discussed under “Risk Factors” in our Registration Statement on Form S-11 (File No. 333-213043) and elsewhere in this quarterly report on Form 10-Q. We do not undertake to revise or update any forward-looking statements. Forward-Looking Statements This Form 10-Q contains forward-looking statements about our business, operations and financial performance, including, in particular, statements about our plans, strategies and objectives. You can generally identify forward-looking statements by our use of forward-looking terminology such as “may,” “will,” “expect,” “intend,” “anticipate,” “estimate,” “believe,” “continue” or other similar words. These statements include our plans and objectives for future operations, including plans and objectives relating to future growth and availability of funds, and are based on current expectations that involve numerous risks, uncertainties and uncertainties.assumptions. Assumptions relating to these statements involve judgments with respect to, among other things, future economic, competitive and market conditions and future business decisions, all of which are difficult or impossible to accurately predict and many of which are beyond our control. Although we believe the assumptions underlying the forward-looking statements, and the forward-looking statements themselves, are reasonable, any of the assumptions could be inaccurate and, therefore, there can be no assurance that these forward-looking statements will prove to be accurate and our actual results, performance and achievements may be materially different from that expressed or implied by these forward-looking statements.statements as a result of various factors, including but not limited to those discussed in the Company’s Registration Statement on Form S-11 (File No. 333-213043), as amended, under Item 1A. Risk Factors in our annual report on Form 10-K for the year ended December 31, 2016, and elsewhere in this quarterly report on Form 10-Q. In light of the significant uncertainties inherent in these forward looking statements, the inclusion of this information should not be regarded as a representation by us or any other person that our objectives and plans, which we consider to be reasonable, will be achieved. Overview We are a Maryland corporationBlackstone Real Estate Income Trust, Inc. was formed on November 16, 2015.2015 as a Maryland corporation. We are an externally advised, perpetual-life entity that intends to qualify as a real estate investment trust (“REIT”) for U.S. federal income tax purposes commencing with the taxable year ending December 31, 2017. We were formed to invest primarily in stabilized income-oriented commercial real estate in the United States. We are an externally advised, perpetual-life real estate investment trust (“REIT”) formedStates and, to directly and indirectly acquire real estate and real estate-related assets. Our investment objectives are to invest in assets that will enable us to:
provide current income in the form of regular, stable cash distributions to achieve an attractive dividend yield;
preserve and protect invested capital;
realize appreciation in net asset value from proactive investment management and asset management; and
provide an investment alternative for stockholders seeking to allocate a portion of their long-term investment portfolios to commercial real estate with lower volatility than public real estate companies.
We cannot assure you that we will achieve our investment objectives.
Our investments in primarily stabilized income-oriented commercial real estate in the United States will focus on a range of asset types. These may include multifamily, retail assets, office, hotel, and industrial, as well as others, including, without limitation, healthcare, student housing, senior living, data centers, manufactured housing and storage properties. To a lesser extent, we also plan to invest in real estate-related securities to providesecurities. We are the sole general partner of BREIT Operating Partnership L.P., a sourceDelaware limited partnership (“BREIT OP”). BREIT Special Limited Partner L.L.C. (the “Special Limited Partner”), a wholly owned subsidiary of liquidity for our share repurchase plan, cash management and other purposes.
We intend to qualify asThe Blackstone Group L.P. (together with its affiliates, “Blackstone”), owns a REIT for federal income tax purposes.special limited partner interest in BREIT OP. We plan to own all or substantially all of our assets through the BREIT Operating Partnership L.P. (“OP. The Company and BREIT OP”OP are externally managed by BX REIT Advisors L.L.C. (the “Adviser”), a Delaware limited partnershipan affiliate of which we are the general partner.Blackstone.
Our board of directors will at all times have ultimate oversight and policy-making authority over us, including responsibility for governance, financial controls, compliance and disclosure. However, pursuant to the advisory agreement between us and BX REIT Advisors L.L.C. (the “Adviser”),Advisory Agreement, we have delegated to the Adviser the authority to source, evaluate and monitor our investment opportunities and to make decisions related to the acquisition, management, financing and disposition of our assets, in accordance with our investment objectives, guidelines, policies and limitations, subject to oversight by our board of directors.
As of September 30, 2016, weWe have neither engaged in any operations nor generated any revenues. Our entire activity since inception to September 30, 2016 was to prepare for our proposed fundraising through our initial public offering of our common stock. The Company has registered with the Securities and Exchange Commission (the “SEC”) an offering of up to $5,000,000,000$5.0 billion in shares of common stock (in any combination of purchases of Class S, Class T, Class D and Class I shares of our common stock), consisting of up to $4,000,000,000$4.0 billion in shares in our primary offering and up to $1,000,000,000$1.0 billion in shares pursuant to its distribution reinvestment plan (the “Offering”).
After The share classes have different upfront selling commissions and ongoing stockholder servicing fees. As of January 1, 2017, we have received purchase orders for at least $150,000,000 (excluding shares purchased by The Blackstone Group L.P. (together with its affiliates “Blackstone”)satisfied the minimum offering requirement and our board of directors and officers),authorized the release of proceeds from escrow. We intend to continue selling shares in any combinationthe Offering on a monthly basis. As of purchasesNovember 13, 2017, we had received net proceeds of Class T, Class S, Class D and Class I$1.5 billion from selling an aggregate of 152,942,761 shares of our common stock (consisting of 117,771,673 Class S shares, 4,315,936 Class T shares, 2,981,473 Class D shares, and our board of directors has authorized the release of such funds to us from escrow, we intend to contribute27,873,679 Class I shares). We have contributed the net proceeds from the Offering which are not used or retained to pay the fees and expenses attributable to our operations to the Operating PartnershipBREIT OP in respect ofexchange for a corresponding number of Class T,S, Class S,I, Class D, and Class IT units. The Operating Partnership will useBREIT OP has primarily used the net proceeds received from us to make investments in accordance with our investment strategyreal estate and policies.
As of September 30, 2016, we have not entered into any arrangements to acquire any properties or real estate-related securities as further described below under “— Portfolio”.
We own one property in Houston, nine properties in Florida, and one property in Atlanta. Our assets remain operational with the net proceedsno material damage from the Offering. The numberhurricanes that hit the U.S. at the end of August and type of properties or real estate-related securities that we acquire will depend upon real estate market conditions, the amount of proceeds we raise in the Offeringbeginning of September 2017. We expect to incur some non-budgeted expenses related to minor repairs and other circumstances existing at the time we are acquiring such assets. cleanup. We expect these costs to have an immaterial impact on our NAV and results from operations. We are not aware of any material trends or uncertainties, favorable or unfavorable, other than national economic conditions affecting real estate generally, that may be reasonably anticipated to have a material impact on either capital resources or the revenues or income to be derived from acquiring properties or real estate-related securities, other than those referreddisclosed in Item 1A. Risk Factors in our annual report on Form 10-K for the year ended December 31, 2016, our prospectus dated April 17, 2017 and filed with the SEC, as supplemented, and elsewhere in this quarterly report on Form 10-Q. Investment Objectives Our investment objectives are to invest in assets that will enable us to: provide current income in the latest prospectusform of regular, stable cash distributions to achieve an attractive distribution yield; preserve and protect invested capital; realize appreciation in the net asset value (“NAV”) from proactive investment and asset management; and provide an investment alternative for stockholders seeking to allocate a portion of their long-term investment portfolios to commercial real estate with lower volatility than public real estate companies.
Portfolio Acquisitions of Real Estate During the Offering (File No. 333-213043). Resultsnine months ended September 30, 2017, we invested $2.4 billion in real estate investments consisting of Operations
As79 wholly-owned properties and 6 properties through two joint ventures. The following table provides information regarding our portfolio of real properties as of September 30, 2016, we2017:
Sector and Property/Portfolio Name | | Number of Properties | | | Location | | Acquisition Date | | Ownership Interest(1) | | | Acquisition Price (in thousands)(2) | | | Sq. Feet (in thousands)/ Number of Rooms/Units | | Occupancy Rate(3) | | Multifamily: | | | | | | | | | | | | | | | | | | | | | | | TA Multifamily Portfolio | | | 6 | | | Various(4) | | Apr. 2017 | | | 100% | | | $ | 432,593 | | | 2,514 units | | | 94% | | Emory Point | | | 1 | | | Atlanta, GA | | May 2017 | | | 100% | | | | 201,578 | | | 750 units | | | 100% | | Nevada West Multifamily | | | 3 | | | Las Vegas, NV | | May 2017 | | | 100% | | | | 170,965 | | | 972 units | | | 92% | | Gilbert Multifamily | | | 2 | | | Gilbert, AZ | | Sept. 2017 | | | 90% | | | | 147,039 | | | 748 units | | | 93% | | ACG II Multifamily | | | 4 | | | Various(5) | | Sept. 2017 | | | 94% | | | | 148,038 | | | 932 units | | | 98% | | Harbor 5 | | | 5 | | | Dallas, TX | | Aug. 2017 | | | 100% | | | | 146,161 | | | 1,192 units | | | 94% | | Domain & GreenVue Multifamily | | | 2 | | | Dallas, TX | | Sept. 2017 | | | 100% | | | | 134,452 | | | 803 units | | | 84% | | Elysian West | | | 1 | | | Las Vegas, NV | | July 2017 | | | 100% | | | | 107,027 | | | 466 units | | | 91% | | Mountain Gate & Trails | | | 2 | | | Las Vegas, NV | | June 2017 | | | 100% | | | | 83,572 | | | 539 units | | | 96% | | Sonora Canyon | | | 1 | | | Mesa, AZ | | Feb. 2017 | | | 100% | | | | 40,983 | | | 388 units | | | 93% | | Total Multifamily | | | 27 | | | | | | | | | | | | 1,612,408 | | | 9,304 units | | | | | | | | | | | | | | | | | | | | | | | | | | | | Industrial: | | | | | | | | | | | | | | | | | | | | | | | HS Industrial Portfolio | | | 38 | | | Various(4) | | Apr. 2017 | | | 100% | | | | 405,930 | | | 5,972 sq. ft. | | | 96% | | Fairfield Industrial | | | 11 | | | Fairfield, NJ | | Sept. 2017 | | | 100% | | | | 74,283 | | | 578 sq. ft. | | | 100% | | Stockton | | | 1 | | | Stockton, CA | | Feb. 2017 | | | 100% | | | | 32,751 | | | 878 sq. ft. | | | 87% | | Total Industrial | | | 50 | | | | | | | | | | | | 512,964 | | | 7,428 sq. ft. | | | | | | | | | | | | | | | | | | | | | | | | | | | | Hotel: | | | | | | | | | | | | | | | | | | | | | | | Hyatt Place San Jose Downtown | | | 1 | | | San Jose, CA | | June 2017 | | | 100% | | | | 65,321 | | | 236 rooms | | | 83% | | Florida Select-Service 4-Pack | | | 4 | | | Tampa & Orlando, FL | | July 2017 | | | 100% | | | | 58,973 | | | 469 rooms | | | 71% | | Hyatt House Downtown Atlanta | | | 1 | | | Atlanta, GA | | Aug. 2017 | | | 100% | | | | 35,332 | | | 150 rooms | | | 78% | | Hyatt Place UC Davis | | | 1 | | | Davis, CA | | Jan. 2017 | | | 100% | | | | 32,687 | | | 127 rooms | | | 87% | | Total Hotel | | | 7 | | | | | | | | | | | | 192,313 | | | 982 rooms | | | | | | | | | | | | | | | | | | | | | | | | | | | | Retail: | | | | | | | | | | | | | | | | | | | | | | | Bakers Centre | | | 1 | | | Philadelphia, PA | | Mar. 2017 | | | 100% | | | | 54,223 | | | 237 sq. ft. | | | 95% | | Total Retail | | | 1 | | | | | | | | | | | | 54,223 | | | 237 sq. ft. | | | | | | | | | | | | | | | | | | | | | | | | | | | | Total Investments in Real Estate | | | 85 | | | | | | | | | | | $ | 2,371,908 | | | | | | | |
(1) | Certain of the joint venture agreements entered into by BREIT provide the other partner a profits interest based on certain internal rate of return hurdles being achieved. |
(2) | Purchase price is inclusive of acquisition-related costs. |
(3) | The occupancy rate is as of September 30, 2017 for non-hotels. The occupancy rate for our hotel investments is the average occupancy rate from the date of acquisition to September 30, 2017. |
(4) | See property description below for geographical breakdown. |
(5) | The ACG II Multifamily Portfolio consists of four garden style properties in Modesto, CA, Olympia, WA, Flagstaff, AZ and Gilbert, AZ. |
Subsequent to September 30, 2017, the Company acquired an aggregate of $383.8 million of real estate across four separate transactions, exclusive of closing costs. The acquisitions were related to multifamily, industrial, hotel, and retail properties.
The following provides descriptions of select properties in our organizationalportfolio: TA Multifamily Portfolio On April 13, 2017, we acquired fee simple interests in six high quality multifamily properties totaling 2,514 units (the “TA Multifamily Portfolio”). The portfolio was acquired from an affiliate of TA Realty, a third party, for $432.6 million. The TA Multifamily Portfolio consists of a 32-floor high quality property in downtown Orlando and five garden style properties located in the suburbs of Palm Beach Gardens, Orlando, Chicago, Dallas and Kansas City. The acquisition of the TA Multifamily Portfolio was funded with cash on hand, which primarily consisted of proceeds from the Offering, and a $95.0 million draw on the Line of Credit. See “— Liquidity and Capital Resources” for further information regarding the Line of Credit. HS Industrial Portfolio On April 18, 2017, we acquired a fee simple interest in the HS Industrial Portfolio (the “HS Industrial Portfolio”), a six million square foot collection of predominantly infill industrial assets. The portfolio was acquired from an affiliate of High Street Realty Company (“Seller”), a third party, for $405.9 million. The HS Industrial Portfolio consists of 38 industrial properties located in six submarkets, with the following concentration based on square footage: Atlanta (38%), Chicago (23%), Houston (17%), Harrisburg (10%), Dallas (10%) and Orlando (2%). The acquisition of the HS Industrial Portfolio was funded through a combination of cash on hand, which primarily consisted of proceeds from the Offering, a $5.0 million draw on the Line of Credit, and a $292.0 million loan. See “— Liquidity and Capital Resources” for further information regarding the HS Industrial Portfolio financing. Emory Point On May 2, 2017, we acquired a leasehold interest in Emory Point, a Class A+ multifamily property totaling 750 units and 124,000 square feet of walkable retail space in Atlanta, Georgia (“Emory Point”). The property was acquired from a third party for $201.6 million. Emory Point was recently constructed in 2015 and is located adjacent to Emory University and across the street from the Center for Disease Control and Prevention’s headquarters. The property’s immediate submarket has no new multifamily supply and the property is the only new multifamily project delivered in the property’s immediate submarket since 2010. The acquisition of Emory Point was funded through a combination of cash on hand, which primarily consisted of proceeds from the Offering and a $130.0 million loan. See “— Liquidity and Capital Resources” for further information regarding the Emory Point financing. Nevada West On May 19, 2017, we acquired a fee simple interest in three newly constructed Class A multifamily properties totaling 972 units located in Las Vegas, Nevada (“Nevada West”). The properties were acquired from a third party for $171.0 million. Nevada West is highly amenitized with large units and rents 10% - 15% below comparable properties. We believe the Las Vegas residential market also benefits from attractive fundamentals with new housing supply 65% below the long term average while annual unemployment growth has averaged 3.7% since 2012 compared to 1.8% nationally. The acquisition of Nevada West was funded through cash on hand, which primarily consisted of proceeds from the Offering.
Summary of Portfolio The following charts further describe the diversification of our investments in real properties based on fair value as of September 30, 2017: The following chart outlines the allocation of our investments in real properties and real estate-related securities based on fair value as of September 30, 2017: 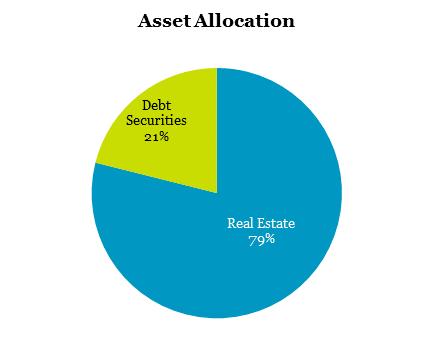
Investments in Real Estate-Related Securities During the nine months ended September 30, 2017, we made 24 investments in commercial mortgage backed securities (“CMBS”). The following table details our investments in CMBS as of September 30, 2017 ($ in thousands): | Number of Investments | | | Credit Rating(1) | | Collateral | | Weighted Average Coupon(2) | | Weighted Average Maturity Date | | Face Amount | | | Cost Basis | | | Fair Value | | | | 5 | | | BBB | | Office, Hospitality, Industrial, Retail | | L+2.16% | | 4/28/2030 | | $ | 132,034 | | | $ | 132,034 | | | $ | 132,363 | | | | 11 | | | BB | | Hospitality, Office, Retail, Multifamily | | L+3.22% | | 4/5/2034 | | | 333,578 | | | | 333,466 | | | | 333,777 | | | | 8 | | | B | | Hospitality, Office, Multifamily | | L+4.12% | | 11/30/2032 | | | 177,950 | | | | 177,878 | | | | 178,231 | | | | 24 | | | | | | | | | | | $ | 643,562 | | | $ | 643,378 | | | $ | 644,371 | |
| (1) | BBB represents credit ratings of BBB+, BBB, and BBB-, BB represents credit ratings of BB+, BB, and BB-, and B represents credit ratings of B+, B, and B-. |
| (2) | The term “L” refers to the three-month U.S. dollar-denominated London Interbank Offer Rate (“LIBOR”). |
| (3) | For details regarding affiliate relationships with respect to certain of our CMBS investments, see Note 5 to our consolidated financial statements. |
The following charts further describe the diversification of our CMBS investments by credit rating and collateral type based on fair value as of September 30, 2017: Credit Rating(1) | Collateral Type | | | 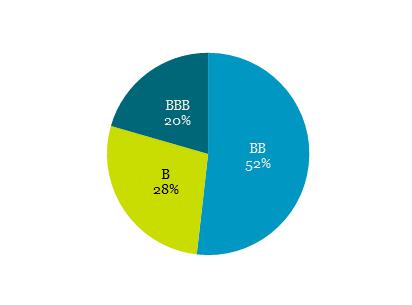
| 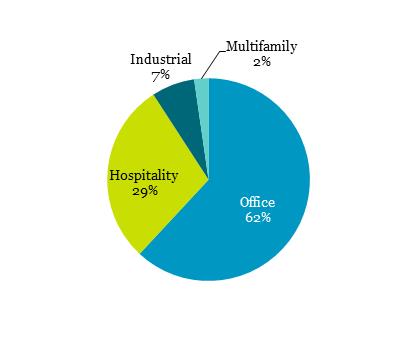
|
(1) | BBB represents credit ratings of BBB+, BBB, and BBB-, BB represents credit ratings of BB+, BB, and BB-, and B represents credit ratings of B+, B, and B-. |
Subsequent to September 30, 2017, we purchased an aggregate of $150.8 million of floating-rate CMBS.
Rental and Hotel Revenue The following table details our rental revenue and hotel revenue by segment ($ in thousands): | | Three Months Ended | | | Nine Months Ended | | | | September 30, 2017 | | | September 30, 2017 | | Rental revenue | | | | | | | | | Multifamily | | $ | 24,911 | | | $ | 39,466 | | Industrial | | | 7,737 | | | | 14,357 | | Retail | | | 951 | | | | 1,904 | | Total rental revenue | | | 33,599 | | | | 55,727 | | Hotel revenue | | | 9,874 | | | | 15,048 | | Total rental and hotel revenue | | $ | 43,473 | | | $ | 70,775 | |
Lease Expirations The following schedule details the expiring leases at our industrial and retail properties by annualized base rent and square footage as of September 30, 2017 ($ and square feet data in thousands). The table below excludes our multifamily properties as substantially all leases at such properties expire within twelve months. Year | | Number of Expiring Leases | | | Annualized Base Rent(1) | | | % of Total Annualized Base Rent Expiring | | | Square Feet | | | % of Total Square Feet Expiring | | 2017 (remainder) | | | 1 | | | $ | 418 | | | | 1% | | | | 131 | | | | 2% | | 2018 | | | 24 | | | | 6,906 | | | | 16% | | | | 1,129 | | | | 15% | | 2019 | | | 19 | | | | 5,575 | | | | 13% | | | | 982 | | | | 13% | | 2020 | | | 16 | | | | 3,960 | | | | 9% | | | | 641 | | | | 9% | | 2021 | | | 21 | | | | 8,082 | | | | 18% | | | | 1,465 | | | | 20% | | 2022 | | | 16 | | | | 5,781 | | | | 13% | | | | 907 | | | | 12% | | 2023 | | | 19 | | | | 6,341 | | | | 14% | | | | 1,099 | | | | 15% | | 2024 | | | 9 | | | | 1,579 | | | | 4% | | | | 190 | | | | 3% | | 2025 | | | 8 | | | | 2,937 | | | | 7% | | | | 484 | | | | 7% | | 2026 | | | 4 | | | | 571 | | | | 1% | | | | 73 | | | | 1% | | Thereafter | | | 4 | | | | 1,720 | | | | 4% | | | | 189 | | | | 3% | | Total | | | 141 | | | $ | 43,870 | | | | 100% | | | | 7,290 | | | | 100% | |
(1) | Annualized base rent is determined from the annualized September 2017 base rent per leased square foot of the applicable year and excludes tenant recoveries, straight-line rent and above-market and below-market lease amortization. |
Hotel Metrics The following table details the average daily rate and the revenue per available room (“RevPAR”) for our hotel properties for the period of ownership during the three and nine months ended September 30, 2017: | | Three Months Ended September 30, 2017 | | | Nine Months Ended September 30, 2017 | | Property | | Average Daily Rate | | | RevPAR | | | Average Daily Rate | | | RevPAR | | Hyatt Place UC Davis | | $ | 160 | | | $ | 143 | | | $ | 165 | | | $ | 144 | | Hyatt Place San Jose Downtown | | $ | 197 | | | $ | 163 | | | $ | 213 | | | $ | 177 | | Florida Select-Service 4-Pack | | $ | 107 | | | $ | 76 | | | $ | 108 | | | $ | 76 | | Hyatt House Downtown Atlanta | | $ | 175 | | | $ | 136 | | | $ | 175 | | | $ | 136 | |
Affiliate Service Providers For details regarding our affiliate service providers, see Note 11 to our consolidated financial statements.
Results of Operations The following table sets forth information regarding our consolidated results of operations ($ in thousands): | | Three Months Ended September 30, 2017 | | | Nine Months Ended September 30, 2017 | | Revenues | | | | | | | | | Rental revenue | | $ | 33,599 | | | $ | 55,727 | | Tenant reimbursement income | | | 3,230 | | | | 5,503 | | Hotel revenue | | | 9,874 | | | | 15,048 | | Other revenue | | | 2,201 | | | | 3,409 | | Total revenues | | | 48,904 | | | | 79,687 | | Expenses | | | | | | | | | Rental property operating | | | 15,938 | | | | 25,632 | | Hotel operating | | | 6,668 | | | | 9,617 | | General and administrative | | | 1,716 | | | | 5,969 | | Management fee | | | 3,712 | | | | 3,712 | | Performance participation allocation | | | 5,711 | | | | 10,952 | | Depreciation and amortization | | | 40,359 | | | | 65,145 | | Total expenses | | | 74,104 | | | | 121,027 | | Other income (expense) | | | | | | | | | Income from real estate-related securities | | | 4,026 | | | | 7,435 | | Interest income | | | 36 | | | | 418 | | Interest expense | | | (10,866 | ) | | | (16,413 | ) | Other expense | | | (27 | ) | | | (55 | ) | Total other (expense) income | | | (6,831 | ) | | | (8,615 | ) | Income before income tax | | | (32,031 | ) | | | (49,955 | ) | Income tax benefit | | | 184 | | | | 140 | | Net loss | | | (31,847 | ) | | | (49,815 | ) | Net loss attributable to non-controlling interests | | | 122 | | | | 122 | | Net loss attributable to BREIT stockholders | | $ | (31,725 | ) | | $ | (49,693 | ) |
From March 2, 2016 (date of our initial capitalization) through September 30, 2016, we had not commenced our principal operations and were focused on our formation and the registration of the Offering. The registration statement for the Offering was declared effective by the SEC on August 31, 2016. We commenced selling shares in October 2016 and broke escrow on January 1, 2017. As such, comparative results have not been presented. Total Revenues During the three and nine months ended September 30, 2017, total revenues were $48.9 million and $79.7 million, respectively, driven primarily by rental income and hotel revenue from our 18 investments in real property. Rental Property and Hotel Operating Expenses During the three and nine months ended September 30, 2017, Rental Property and Hotel Operating Expenses were $22.6 million and $35.2 million, respectively, driven primarily by our 18 investments in real property. General and Administrative Expenses During the three and nine months ended September 30, 2017, General and Administrative Expenses were $1.7 million and $6.0 million, respectively, and consisted primarily of legal fees, accounting fees, transfer agent fees, other professional services fees, and expenses related to unconsummated acquisitions we are no longer pursuing. Additionally, during the nine months ended September 30, 2017, we incurred $1.8 million of organization costs incurred in conjunction with our formation. Such costs included legal fees, accounting fees, and transfer agent fees, among other costs. We do not expect to incur such costs in the future as our formation is complete and we have commenced principal operations.
Management Fee The Adviser’s management fee waiver expired on June 30, 2017, and during the third quarter we began accruing the management fee on a monthly basis based on our NAV. During both the three and nine months ended September 30, 2017, the management fee was $3.7 million. Performance Participation Allocation During the three and nine months ended September 30, 2017, the unrealized performance participation allocation accrued was $5.7 million and $11.0 million, respectively, as a result of the total return being greater than the 5% hurdle amount. Such amount was allocated to the Special Limited Partner. Depreciation and Amortization During the three and nine months ended September 30, 2017, depreciation and amortization expenses were $40.4 million and $65.1 million, respectively, driven by depreciation and amortization on our investments in real property. Income from Real Estate-Related Securities During the three and nine months ended September 30, 2017, income from real estate-related securities was $4.0 million and $7.4 million, respectively, which consisted of the interest income and mark-to-market gains, partially offset by a realized loss on our investments in real estate-related securities. Interest Income During the three and nine months ended September 30, 2017, interest income was $36 thousand and $0.4 million, respectively, which consisted of the interest earned on the cash deposited in a money market account. Interest Expense During the three and nine months ended September 30, 2017, interest expense was $10.9 million and $16.4 million, respectively, which consisted of the interest expense incurred on our mortgage notes, term loan, revolving credit facility, Line of Credit and borrowings under our repurchase agreements. Income Tax Benefit During the three and nine months ended September 30, 2017, the income tax benefit of $0.2 million and $0.1 million, respectively, related to our hotel taxable REIT subsidiaries. Funds from Operations and Adjusted Funds from Operations We believe funds from operations (“FFO”) is a meaningful supplemental non-GAAP operating metric. Our consolidated financial statements are presented under historical cost accounting which, among other things, requires depreciation of real estate investments to be calculated on a straight-line basis. As a result, our operating results imply that the value of our real estate investments will decrease evenly over a set time period. However, we believe that the value of real estate investments will fluctuate over time based on market conditions and as such, depreciation under historical cost accounting may be less informative. FFO is a standard REIT industry metric defined by the National Associational of Real Estate Investment Trusts (“NAREIT”). FFO, as defined by NAREIT and presented below, is calculated as net income or loss (computed in accordance with GAAP), excluding gains or losses from sales of depreciable real property and impairment write-downs on depreciable real property, plus real estate-related depreciation and amortization, and similar adjustments for unconsolidated joint ventures. The following table presents a reconciliation of FFO to net loss ($ in thousands): | | Three Months Ended September 30, 2017 | | | Nine Months Ended September 30, 2017 | | Net loss attributable to BREIT stockholders | | $ | (31,725 | ) | | $ | (49,693 | ) | Adjustments: | | | | | | | | | Real estate depreciation and amortization | | | 40,359 | | | | 65,145 | | Amount attributable to non-controlling interests for above adjustment | | | (169 | ) | | | (169 | ) | Funds from Operations attributable to BREIT stockholders | | $ | 8,465 | | | $ | 15,283 | |
We also believe that adjusted FFO (“AFFO”) is a meaningful supplemental non-GAAP disclosure of our operating results. AFFO further adjusts FFO in order for our operating results to reflect the specific characteristics of our business by adjusting for items we believe are not related to our core operations. Our adjustments to FFO to arrive at AFFO include straight-line rental income, amortization of above- and below-market lease intangibles, organization costs, unrealized gains or losses from changes in the fair value of financial instruments, amortization of stock awards, and performance participation allocation not paid in cash. AFFO is not defined by NAREIT and our calculation of AFFO may not be comparable to disclosures made by other REITs. The following table presents a reconciliation of FFO to AFFO ($ in thousands): | | Three Months Ended September 30, 2017 | | | Nine Months Ended September 30, 2017 | | Funds from Operations attributable to BREIT stockholders | | $ | 8,465 | | | $ | 15,283 | | Adjustments: | | | | | | | | | Straight-line rental income | | | (551 | ) | | | (1,118 | ) | Amortization of above- and below-market lease intangibles | | | (427 | ) | | | (792 | ) | Amortization of below-market and prepaid ground lease intangible | | | 79 | | | | 156 | | Organization costs | | | — | | | | 1,838 | | Unrealized gains (losses) from changes in the fair value of real estate-related securities | | | 641 | | | | (966 | ) | Amortization of restricted stock awards | | | 25 | | | | 77 | | Performance participation allocation | | | 5,711 | | | | 10,952 | | Adjusted Funds from Operations attributable to BREIT stockholders | | $ | 13,943 | | | $ | 25,430 | |
FFO and AFFO should not be considered to be more relevant or accurate than the current GAAP methodology in calculating net income or in evaluating our operating performance. In addition, FFO and AFFO should not be considered as alternatives to net income (loss) as indications of our performance or as alternatives to cash flows from operating activities as indications of our liquidity, but rather should be reviewed in conjunction with these and other GAAP measurements. Further, FFO and AFFO are not intended to be used as liquidity measures indicative of cash flow available to fund our cash needs, including our ability to make distributions to our stockholders. Net Asset Value The purchase price per share for each class of our common stock will generally equal our prior month’s NAV per share, as determined monthly, plus applicable selling commissions and dealer manager fees. Our NAV for each class of shares is based on the net asset values of our investments (including real estate-related securities), the addition of any other assets (such as cash on hand) and the deduction of any liabilities, including the allocation/accrual of any performance participation, and any stockholder servicing fees applicable to such class of shares. The following table provides a breakdown of the major components of our NAV ($ and shares in thousands, except per share data): Components of NAV | | September 30, 2017 | | Investments in real property | | $ | 2,437,266 | | Investments in real estate-related securities | | | 644,371 | | Cash and cash equivalents | | | 30,820 | | Restricted cash | | | 105,881 | | Other assets | | | 22,553 | | Debt obligations | | | (1,756,385 | ) | Subscriptions received in advance | | | (98,435 | ) | Other liabilities | | | (48,836 | ) | Accrued performance participation allocation | | | (10,952 | ) | Management fee payable | | | (3,712 | ) | Accrued stockholder servicing fees(1) | | | (744 | ) | Non-controlling interests in joint venture | | | (9,025 | ) | Net Asset Value | | $ | 1,312,802 | | Number of outstanding shares | | | 125,491 | |
(1) | Stockholder servicing fees only apply to Class S, Class T, and Class D shares. See Reconciliation of Stockholders’ Equity to NAV for an explanation of the difference between the $744 thousand accrued for purposes of our NAV and the $76.0 million accrued under U.S. GAAP. |
NAV Per Share | | Class S Shares | | | Class I Shares | | | Class D Shares | | | Class T Shares | | | Total | | Monthly NAV | | $ | 1,033,848 | | | $ | 243,433 | | | $ | 12,718 | | | $ | 22,803 | | | $ | 1,312,802 | | Number of outstanding shares | | | 98,779 | | | | 23,277 | | | | 1,226 | | | | 2,209 | | | | 125,491 | | NAV Per Share | | $ | 10.4662 | | | $ | 10.4579 | | | $ | 10.3763 | | | $ | 10.3239 | | | | | |
Set forth below are the weighted averages of the key assumptions in the discounted cash flow methodology used in the September 30, 2017 valuations, based on property types. Once we own more than one retail property, we will include the key assumptions for this property type. Property Type | | Discount Rate | | | Exit Capitalization Rate | | Multifamily | | | 7.8% | | | | 5.7% | | Industrial | | | 7.1% | | | | 6.7% | | Hospitality | | | 9.8% | | | | 9.5% | |
These assumptions are determined by the Adviser and reviewed by our independent valuation advisor. A change in these assumptions would impact the calculation of the value of our property investments. For example, assuming all other factors remain unchanged, the changes listed below would result in the following effects on our investment values: Input | | Hypothetical Change | | Multifamily Investment Values | | Industrial Investment Values | | Hospitality Investment Values | | | | | | | | | | Discount Rate | | 0.25% decrease | | +1.9% | | +1.5% | | +0.9% | (weighted average) | | 0.25% increase | | (1.9%) | | (1.5%) | | (0.9%) | | | | | | | | | | Exit Capitalization Rate | | 0.25% decrease | | +2.8% | | +2.4% | | +1.9% | (weighted average) | | 0.25% increase | | (2.7%) | | (2.2%) | | (1.8%) |
The following table reconciles stockholders’ equity per our consolidated balance sheet to our NAV ($ in thousands): Reconciliation of Stockholders’ Equity to NAV | | September 30, 2017 | | Stockholders’ equity under U.S. GAAP | | $ | 1,103,570 | | Adjustments: | | | | | Accrued stockholder servicing fee | | | 75,254 | | Organization and offering costs | | | 9,389 | | Unrealized real estate appreciation | | | 60,080 | | Accumulated depreciation and amortization | | | 64,509 | | NAV | | $ | 1,312,802 | |
The following details the adjustments to reconcile GAAP stockholders’ equity to our NAV: | - | Accrued stockholder servicing fee represents the accrual for the full cost of the stockholder servicing fee for Class S, Class D and Class T shares. Under GAAP, we accrued the full cost of the stockholder servicing fee as an offering cost at the time we sold the Class S, Class T, and Class D shares. For purposes of NAV we recognize the stockholder servicing fee as a reduction of NAV on a monthly basis as such fee is paid. |
| - | The Adviser has agreed to advance organization and offering costs on our behalf through December 31, 2017. Such costs will be reimbursed to the Adviser pro rata over 60 months beginning January 1, 2018. Under GAAP, organization costs are expensed as incurred and offering costs are charged to equity as such amounts are incurred. For NAV, such costs will be recognized as a reduction to NAV as they are reimbursed ratably over 60 months. |
| - | Our investments in real estate are presented under historical cost in our GAAP consolidated financial statements. Additionally, our mortgage notes, term loan, and revolving credit facility, and repurchase agreements and Line of Credit (“Debt”) are presented at their carrying value in our consolidated GAAP financial statements. As such, any increases in the fair market value of our investments in real estate or Debt are not included in our GAAP results. For purposes of determining our NAV, our investments in real estate and Debt are recorded at fair value. |
| - | In addition, we depreciate our investments in real estate and amortize certain other assets and liabilities in accordance with GAAP. Such depreciation and amortization is not recorded for purposes of determining our NAV. |
Distributions The following table summarizes our distributions declared during the three and nine months ended September 30, 2017 ($ in thousands). From March 2, 2016 (date of our initial capitalization) through September 30, 2016, we had not commenced our principal operations and as such, no distributions were made during this period. | | Three Months Ended September 30, 2017 | | | Nine Months Ended September 30, 2017 | | | | Amount | | | Percentage | | | Amount | | | Percentage | | Distributions | | | | | | | | | | | | | | | | | Paid in cash | | $ | 5,033 | | | | 33 | % | | $ | 8,221 | | | | 32 | % | Reinvested in shares | | | 10,018 | | | | 67 | % | | | 17,100 | | | | 68 | % | Total distributions | | $ | 15,051 | | | | 100 | % | | $ | 25,321 | | | | 100 | % | | | | | | | | | | | | | | | | | | Sources of Distributions | | | | | | | | | | | | | | | | | Cash flows from operating activities | | $ | 15,051 | | | | 100 | % | | $ | 25,321 | | | | 100 | % | Offering proceeds | | | — | | | | — | % | | | — | | | | — | % | Total sources of distributions | | $ | 15,051 | | | | 100 | % | | $ | 25,321 | | | | 100 | % | | | | | | | | | | | | | | | | | | Cash flows from operating activities | | $ | 24,776 | | | | | | | $ | 44,260 | | | | | | Funds from Operations | | $ | 8,465 | | | | | | | $ | 15,283 | | | | | |
Liquidity and Capital Resources Our primary needs for liquidity and capital resources are to fund our investments, to make distributions to our stockholders, to repurchase shares of our common stock pursuant to our share repurchase plan, to pay our organization and offering costs, operating feesexpenses and expensescapital expenditures and to pay interestdebt service on any outstanding indebtedness we may incur. To date, the Adviser has advanced our organization and offering costs, but beginning January 1, 2018 we will be required to reimburse the Adviser for such advanced amounts ratably over a 60 month period. We anticipate our offering and operating fees and expenses will include, among other things, the management fee we will pay to the Adviser (to the extent the Adviser elects to receive the management fee in cash or requests that we repurchase shares previously issued to the Adviser for payment of the management fee), the performance participation allocation that the Operating PartnershipBREIT OP will pay to BREITthe Special Limited Partner, L.L.C., an affiliate of the Adviser, stockholder servicing fees, legal, audit and valuation expenses, federal and state filing fees, printing expenses, administrative fees, transfer agent fees, marketing and distributiongeneral corporate expenses, and fees related to acquiring, financing, appraising and managing our properties.properties and other investments. We do not have any office or personnel expenses as we do not have any employees. We will reimburse the Adviser for certain out-of-pocket expenses in connection with our operations. The Adviser has agreed to advance all of our organizational and offering expenses on our behalf (other than upfront selling commissions and stockholder servicing fees) through the first anniversary of the date on which we break escrow for the Offering. We will reimburse the Adviser for such advanced expenses ratably over the 60 months following the first anniversary of the date on which we break escrow for the Offering. As of September 30, 2016 and March 31, 2016, the Adviser had incurred approximately $6.0 million and $2.2 million, respectively, of organizational and offering expenses on our behalf.
We intend to elect to be taxed as a REIT under Sections 856 through 860 of the Internal Revenue Code of 1986, as amended, beginning with our taxable year ending December 31 of the year in which the escrow period concludes. In order to maintain our qualification as a REIT, we are required to, among other things, distribute as dividends at least 90% of our REIT taxable income, determined without regard to the dividends-paid deduction and excluding net capital gains, to our stockholders and meet certain tests regarding the nature of our income and assets.
Over time, we generally intend to fund our cash needs for items other than asset acquisitions from operations. Our cash needs for acquisitions and other investments will be funded primarily from the sale of shares of our common stock and through the assumption or incurrence of debt.
Although we have not received any commitments from lenders to fund
The following is a linesummary of credit, we may decide to obtain a lineour indebtedness as of credit to fund acquisitions, to repurchase shares pursuant to our share repurchase plan and for any other corporate purpose. If we decide to obtain a line of credit, we would expect that it would afford us borrowing availability to fund repurchases. As our assets increase, however, it may not be commercially feasible or we may not be able to secure an adequate line of credit to fund share repurchases. Moreover, actual availability may be reduced at any given time if we use borrowings under the line of credit to fund share repurchases or for other corporate purposes.September 30, 2017 ($ in thousands): Indebtedness | | Interest Rate(1) | | | Maturity Dates(2)(3) | | | Maximum Facility Size | | Principal Balance | | | Loans secured by our properties: | | | | | | | | | | | | | | | | TA Multifamily (excluding 55 West) | | 3.76% | | | 6/1/2024 | | | N/A | | $ | 211,249 | | | Industrial Properties - Term Loan | | L+2.10% | | | 6/1/2022 | | | N/A | | | 146,000 | | | Industrial Properties - Revolving Credit Facility | | L+2.10% | | | 6/1/2022 | | | 146,000 | | | 146,000 | | | Emory Point | | 3.66% | | | 5/5/2024 | | | N/A | | | 130,000 | | | Nevada West | | 3.75% | | | 9/1/2024 | | | N/A | | | 121,380 | | | Elysian West | | 3.77% | | | 9/1/2024 | | | N/A | | | 75,400 | | | 55 West (part of TA Multifamily Portfolio) | | L+2.18% | | | 5/9/2022(2) | | | N/A | | | 63,600 | | | Mountain Gate & Trails | | 3.75% | | | 9/1/2024 | | | N/A | | | 59,985 | | | Gilbert Vistara | | 4.09% | | | 10/1/2028 | | | N/A | | | 48,129 | | | Gilbert Redstone | | 4.92% | | | 4/10/2029 | | | N/A | | | 40,484 | | | ACG II - Highlands | | 3.62% | | | 10/1/2024 | | | N/A | | | 27,715 | | | Sonora Canyon | | 3.76% | | | 6/1/2024 | | | N/A | | | 26,455 | | | ACG II - Brooks Landing | | 4.60% | | | 10/6/2025 | | | N/A | | | 24,500 | | | ACG II - Woodlands | | 4.83% | | | 3/6/2024 | | | N/A | | | 23,485 | | | ACG II - Sterling Pointe | | 5.36% | | | 1/6/2024 | | | N/A | | | 18,900 | | | Total loans secured by our properties | | | | | | | | | | | | | 1,163,282 | | | | | | | | | | | | | | | | | | | Repurchase agreement borrowings: | | | | | | | | | | | | | | | | Citi MRA | | L+1.25% - L+1.70% | | | 10/16/2017 - 12/28/2017 | | | N/A | | | 429,294 | | | RBC MRA | | L+1.25% - L+1.45% | | | 10/20/2017 | | | N/A | | | 49,161 | | | BAML MRA | | | — | | | | — | | | N/A | | | — | | | Total repurchase agreement borrowings | | | | | | | | | | | | | 478,455 | | | | | | | | | | | | | | | | | | | Line of Credit | | L+2.25% | | | 1/23/2018 | | | 250,000 | | | 122,676 | | | Citi Line of Credit(4) | | L+2.25% | | | | 10/26/2018 | | | 300,000 | | | — | | | Total indebtedness | | | | | | | | | | | | $ | 1,764,413 | | |
| (1) | The term “L” refers to (i) the one-month LIBOR with respect to the Line of Credit, Revolving Credit Facility, and Term Loan, and (ii) the three-month LIBOR with respect to the Repurchase agreement borrowings. |
| (2) | The 55 West mortgage has an initial maturity date of May 9, 2019 and we, at our sole discretion, have three one-year extension options in which we anticipate exercising. |
| (3) | Subsequent to quarter end, we rolled our repurchase agreement contracts expiring in October 2017 into new three, nine, or twelve month contracts. |
| (4) | Subsequent to quarter end, we entered into a $300.0 million revolving credit facility with Citi Bank, N.A. (the “Citi Line of Credit”). See Note 15 to our consolidated financial statements for further details on the Citi Line of Credit. |
Other potential future sources of capital include secured or unsecured financings from banks or other lenders and proceeds from the sale of assets. If necessary, we may use financings or other sources of capital in the event of unforeseen significant capital expenditures. We have not yet identified any sources for these types of financings. As of November 13, 2017, we had received net proceeds of $1.5 billion from selling an aggregate of 152,942,761 shares of our common stock (consisting of 117,771,673 Class S shares, 4,315,936 Class T shares, 2,981,473 Class D shares, and 27,873,679 Class I shares). The Company intends to continue selling shares in the Offering on a monthly basis.
Cash Flows OnThe following table provides a breakdown of the net change in our cash and cash equivalents and restricted cash ($ in thousands):
| | Nine Months Ended September 30, 2017 | | Cash flows provided by operating activities | | $ | 44,260 | | Cash flows used in investing activities | | | (2,901,931 | ) | Cash flows provided by financing activities | | | 2,994,172 | | Net increase in cash and cash equivalents and restricted cash | | $ | 136,501 | |
Cash flows provided by operating activities were $44.3 million during the nine months ended September 30, 2017 primarily as a result of cash flows from the operations of the investments in our properties and interest income on our investments in real estate-related securities. Cash flows used in investing activities were $2.9 billion during the nine months ended September 30, 2017 driven primarily by our acquisitions of real estate investments of $2.3 billion and purchase of real estate-related securities of $660.2 million. Cash flows provided by financing activities were $3.0 billion during the nine months ended September 30, 2017 primarily due to the $1.3 billion of net proceeds we received from the issuance of our common stock and $1.7 billion of net borrowings under our mortgage notes, term loan, affiliate line of credit, and repurchase agreements. From March 2, 2016 the Company was capitalized with a $200,000 investment by the Adviser. There have been no other cash flows from inception(date of our initial capitalization) through September 30, 2016. As of September 30, 2016, we had not declared or paid any distributions.commenced our principal operations and as such, comparative results have not been analyzed. Critical Accounting Policies Below is a discussionThe preparation of the financial statements in accordance with accounting policies that management believes will be critical once we commence operations. We consider these policies critical because theyprinciples generally accepted in the United States (“GAAP”) involve significant judgments and assumptions and require estimates about matters that are inherently uncertain and because they are important for understanding and evaluating our reported financial results. Our accounting policies have been established to conform with generally accepted accounting principles in the United States (“GAAP”). The preparation of the consolidated financial statements in accordance with GAAP requires management to use judgments in the application of such policies.uncertain. These judgments will affect our reported amounts of assets and liabilities and our disclosure of contingent assets and liabilities at the dates of the consolidated financial statements and the reported amounts of revenue and expenses during the reporting periods. With different estimates or assumptions, materially different amounts could be reported in our consolidated financial statements. Additionally, other companies may utilize different estimates that may impact the comparability ofWe consider our results of operations to those of companiesaccounting policies over investments in similar businesses.
Principles of Consolidationreal estate and Variable Interest Entities
The Financial Accounting Standards Board has recently issued guidance that clarifies the methodology for determining whether an entity is a variable interest entity (“VIE”),lease intangibles, investments in securities, and the methodology for assessing who is the primary beneficiary of a VIE. VIEs are defined as entities in which equity investors do not have the characteristics of a controlling financial interest or do not have sufficient equity at risk for the entity to finance its activities without additional subordinated financial support from other parties. A VIE is requiredrevenue recognition to be consolidated by its primary beneficiary, and only by its primary beneficiary, which is defined as the party with both the power to direct the activities of the VIE that most significantly impact the entity’s economic performance and the obligation to absorb losses or the right to receive benefits from the entity that could potentially be significant to the VIE.
There are judgments and estimates involved in determining if an entity in which we will make an investment will be a VIE and if so, if we will be the primary beneficiary. The entity will be evaluated to determine if it is a VIE by, among other things, calculating the percentage of equity being risked compared to the total equity of the entity. The minimum equity at risk percentage can vary depending upon the industry or the type of operations of the entity and it will be up to us to determine that minimum percentage as it relates to our business and the facts surrounding each of our acquisitions. In addition, even if the entity’s equity at risk is a very low percentage, we will be required to evaluate the equity at risk compared to the entity’s expected future losses to determine if there could still in fact be sufficient equity at the entity. Determining expected future losses involves assumptions of various possibilities of the results of future operations of the entity, assigning a probability to each possibility and using a discount rate to determine the net present value of those future losses. A change in the judgments, assumptions and estimates outlined above could result in consolidating an entity that had not been previously consolidated orcritical accounting for an investment on the equity method that had been previously consolidated, the effects of which could be material to our results of operations and financial condition.
Real Estate Joint Ventures and Partnerships
To determine the method of accounting for partially owned real estate joint ventures and partnerships, management evaluates the characteristics of associated entities and determines whether an entity is a VIE and, if so, determines if we are the primary beneficiary by analyzing whether we have both the power to direct the entity’s significant economic activities and the obligation to absorb potentially significant losses or receive potentially significant benefits. Significant judgments and assumptions inherent in this analysis include the design of the entity structure, the nature of the entity’s operations, future cash flow projections, the entity’s financing and capital structure, and contractual relationships and terms. We consolidate a VIE when we have determined that we are the primary beneficiary.
Primary risks associated with our VIEs include the potential funding of the entities’ debt obligations or making additional contributions to fund the entities’ operations.
Partially owned, non-variable interest real estate joint ventures and partnerships over which we have a controlling financial interest are consolidated in our consolidated financial statements. In determining if we have a controlling financial interest, we consider factors such as ownership interest, authority to make decisions, kickout rights and substantive participating rights. Partially owned real estate joint ventures and partnerships where we do not have a controlling financial interest, but have the ability to exercise significant influence, are accounted for using the equity method.
Management will analyze and assess reconsideration events, including changes in the factors mentioned above, to determine if a consolidation treatment remains appropriate. Decisions regarding consolidation of partially owned entities frequently require significant judgment by our management. Errors in the assessment of consolidation could result in material changespolicies. See Note 2 to our consolidated financial statements.statements for further descriptions of such accounting policies.
Investment Property and Lease IntangiblesRecent Accounting Pronouncements
AcquisitionsSee Note 2 — “Summary of properties will be accountedSignificant Accounting Policies” to our consolidated financial statements in this quarterly report on Form 10-Q for utilizing the acquisition method and, accordingly, the results of operations of acquired properties will be included in our results of operations from their respective dates of acquisition. Estimates of future cash flows and other valuation techniques that we believe are similar to those used by independent appraisers will be used to record the purchase of identifiable assets acquired and liabilities assumed such as land, buildings and improvements, equipment and identifiable intangible assets and liabilities such as amounts related to in-place leases, acquired above- and below-market leases, tenant relationships, asset retirement obligations and mortgage notes payable. Values of buildings and improvements will be determined on an as-if-vacant basis. Initial valuations may be subject to change until such information is finalized, no later than 12 months from the acquisition date.a discussion concerning recent accounting pronouncements.
The estimated fair value of acquired in-place leases will be the costs we would have incurred to lease the properties to the occupancy level of the properties at the date of acquisition. Such estimates include the fair value of leasing commissions, legal costs and other direct costs that would be incurred to lease the properties to such occupancy levels. Additionally, we will evaluate the time period over which such occupancy levels would be achieved. Such evaluation will include an estimate of the net market-based rental revenues and net operating costs (primarily consisting of real estate taxes, insurance and utilities) that would be incurred during the lease-up period. Acquired in-place leases as of the date of acquisition will be amortized over the remaining lease terms.
Acquired above- and below-market lease values will be recorded based on the present value (using an interest rate that reflects the risks associated with the lease acquired) of the difference between the contractual amounts to be paid pursuant to the in-place leases and management’s estimate of fair market value lease rates for the corresponding in-place leases. The capitalized above- and below-market lease values will be amortized as adjustments to rental revenue over the remaining terms of the respective leases, which include periods covered by bargain renewal options. Should a tenant terminate its lease, the unamortized portion of the in-place lease value will be charged to amortization expense and the unamortized portion of out-of-market lease value will be charged to rental revenue.
Value of Real Estate Portfolio
We will review our real estate portfolio to ascertain if there are any indicators of impairment in the value of any of our real estate assets, including deferred costs and intangibles, in order to determine if there is any need for an impairment charge. In reviewing the portfolio, we will examine the type of asset, the economic situation in the area in which the asset is located, the economic situation in the industry in which the tenant is involved and the timeliness of the payments made by the tenant under its lease, as well as any current correspondence that may have been had
with the tenant, including property inspection reports. For each real estate asset owned for which indicators of impairment exist, if the undiscounted cash flow analysis yields an amount which is less than the assets’ carrying amount, an impairment loss will be recorded to the extent that the estimated fair value is lower than the asset’s carrying amount. The estimated fair value is determined using a discounted cash flow model of the expected future cash flows through the useful life of the property. Real estate assets that are expected to be disposed of are valued at the lower of carrying amount or fair value less costs to sell on an individual asset basis. Any impairment charge taken with respect to any part of our real estate portfolio will reduce our earnings and assets to the extent of the amount of any impairment charge, but it will not affect our cash flow or our distributions until such time as we dispose of the property.
Revenue Recognition
Our revenues, which we expect will be substantially derived from rental income, will include rental income that our tenants pay in accordance with the terms of their respective leases reported on a straight line basis over the initial lease term of each lease. Since we expect many of our leases will provide for rental increases at specified intervals, straight line basis accounting requires us to record as an asset and include in revenues unbilled rent receivables, which we will only receive if the tenant makes all rent payments required through expiration of the initial term of the lease. Accordingly, management must determine, in its judgment, that the unbilled rent receivable applicable to each specific tenant is collectible. We will review unbilled rent receivables and take into consideration the tenant’s payment history and the financial condition of the tenant. In the event that the collectability of an unbilled rent receivable is in doubt, we will be required to take a reserve against the receivable or a direct write-off of the receivable, which will have an adverse effect on earnings for the year in which the reserve or direct write-off is taken.
Rental revenue will also include amortization of above- and below-market leases. Revenues relating to lease termination fees will be recognized at the time that a tenant’s right to occupy the leased space is terminated.
Income Taxes
As a REIT, we will not be subject to federal income tax with respect to the portion of our income that meets certain criteria and is distributed annually to stockholders. We intend to operate in a manner that allows us to meet the requirements for taxation as a REIT. Many of these requirements, however, are highly technical and complex. We will monitor the business and transactions that may potentially impact our REIT status. If we were to fail to meet these requirements, we could be subject to federal income tax on our taxable income at regular corporate rates. We would not be able to deduct distributions paid to stockholders in any year in which it fails to qualify as a REIT. We would also be disqualified for the four taxable years following the year during which qualification was lost unless we were entitled to relief under specific statutory provisions.
Off-Balance Sheet Arrangements We currently have no off-balance sheet arrangements that are reasonably likely to have a material current or future effect on our financial condition, changes in financial condition, revenues or expenses, results of operations, liquidity, capital expenditures or capital resources.
Contractual Obligations The following table aggregates our contractual obligations and commitments with payments due subsequent to September 30, 2017 ($ in thousands). Obligations | | Total | | | Less than 1 year | | | 1-3 years | | | 3-5 years | | | More than 5 years | | Organizational and offering costs | | $ | 9,389 | | | $ | 1,408 | | | $ | 3,756 | | | $ | 3,756 | | | $ | 469 | | | | | | | | | | | | | | | | | | | | | | | Ground leases | | | 14,249 | | | | 239 | | | | 478 | | | | 478 | | | | 13,054 | | | | | | | | | | | | | | | | | | | | | | | Indebtedness (1) | | | 1,947,404 | | | | 524,129 | | | | 89,108 | | | | 381,789 | | | | 952,378 | | | | | | | | | | | | | | | | | | | | | | | Total | | $ | 1,971,042 | | | $ | 525,776 | | | $ | 93,342 | | | $ | 386,023 | | | $ | 965,901 | |
| (1) | The allocation of our indebtedness includes both principal and interest payments based on the current maturity date and interest rates in effect at September 30, 2017. |
ITEM 3. | QUANTITATIVE AND QUALITATIVE DISCLOSURES ABOUT MARKET RISK |
Indebtedness We had no significant operations as of September 30, 2016. When we commence operations, we expect that our primary market risk exposure will beare exposed to interest rate risk with respect to our variable-rate indebtedness, and credit risk and market risk with respect to use of derivative financial instruments.whereas an increase in interest rates would directly result in higher interest expense costs. As of September 30, 2016, we had no2017, the outstanding principal balance of our variable rate indebtedness was $956.6 million and did not use any derivative financial instruments.consisted of mortgage notes, a term loan, a revolving credit facility, an affiliate line of credit, and repurchase agreements. Our mortgage loans, term loan, revolving credit facility, and affiliate line of credit are variable rate and indexed to one-month U.S. Dollar denominated LIBOR. For the three and nine months ended September 30, 2017, a 10% increase in one-month U.S. Dollar denominated LIBOR would have resulted in increased interest expense of $819 thousand and $1.3 million, respectively. Our repurchase agreements are variable rate and indexed to three-month U.S. Dollar denominated LIBOR. For the three and nine months ended September 30, 2017, a 10% increase in the three-month U.S. Dollar denominated LIBOR rate would have resulted in increased interest expense of $217 thousand and $293 thousand, respectively. We may be exposed to interest rate changes primarily as a result of long-term debt used to maintain liquidity, fund capital expenditures and expand our investment portfolio and operations. Market fluctuations in real estate financing may affect the availability and cost of funds needed to expand our investment portfolio. In addition, restrictions upon the availability of real estate financing or high interest rates for real estate loans could adversely affect our ability to dispose of real estate in the future. We will seek to limit the impact of rising interest rate changesrates on earnings and cash flows and to lower our overall borrowing costs. We maythrough the use of fixed rate financings or the use of derivative financial instruments to hedge exposures to changes in interest rates on loans secured by our assets. Also, Investments in real estate-related securities As of September 30, 2017, our investments in real estate-related securities consisted of $644.4 million of CMBS. Our CMBS investments are floating-rate and indexed to one-month U.S. denominated LIBOR and as such, exposed to interest rate risk. Our net income will increase or decrease depending on interest rate movements. While we willcannot predict factors which may or may not affect interest rates, during the three and nine months ended September 30, 2017, a 10% increase or decrease in the one-month U.S. denominated LIBOR rate would have resulted in an increase or decrease to income from real estate-related securities of $467 thousand and $663 thousand, respectively. We may also be exposed to both creditmarket risk and market risk. Credit risk is the failure of the counterpartywith respect to perform under the terms of the derivative contract. Ifour investments in real-estate related securities due to changes in the fair value of our investments. The fair value of our investments may fluctuate, thus the amount we will realize upon any sale of our investments in CMBS is unknown. As of September 30, 2017, the fair value at which we may sell our investments in real estate-related securities is not known, but a derivative contract is positive, the counterparty will owe us, which creates credit risk for us. If10% change in the fair value of a derivative contract is negative, we will owe the counterparty and, therefore, do not have credit risk. We will seek to minimize the credit riskour investments in derivative instruments by entering into transactions with high-quality counterparties.
Market risk is the adverse effect on the valuereal estate-related securities may result in an unrealized gain or loss of a financial instrument that results from a change in interest rates. The market risk associated with interest-rate contracts is managed by establishing and monitoring parameters that limit the types and degree of market risk that may be undertaken. With regard to variable rate financing, we will assess our interest rate cash flow risk by continually identifying and monitoring changes in interest rate exposures that may adversely impact expected future cash flows and by evaluating hedging opportunities. We will maintain risk management control systems to monitor interest rate cash flow risk attributable to both our outstanding and forecasted debt obligations as well as our potential offsetting hedge positions. While this hedging strategy will be designed to minimize the impact on our net income and funds from operations from changes in interest rates, the overall returns on your investment may be reduced.$64.4 million.
ITEM 4. | CONTROLS AND PROCEDURES |
Evaluation of Disclosure Controls and Procedures An evaluation of the effectiveness of the design and operation of our “disclosure controls and procedures” (as defined in Rule13a-15(e) under the Securities Exchange Act of 1934, as amended (the “Exchange Act”)), as of the end of the period covered by this quarterly report on Form 10-Q was made under the supervision and with the participation of our management, including our Chief Executive Officer (“CEO”) and Chief Financial Officer (“CFO”). Based upon this evaluation, our CEO and CFO have concluded that our disclosure controls and procedures (a) are effective to ensure that information required to be disclosed by us in reports filed or submitted under the Exchange Act is recorded, processed, summarized and reported within the time periods specified by SEC rules and forms and (b) include, without limitation, controls and procedures designed to ensure that information required to be disclosed by us in reports filed or submitted under the Exchange Act is accumulated and communicated to our management, including our CEO and CFO, as appropriate to allow timely decisions regarding required disclosure. Changes in Internal Controls over Financial Reporting There have been no changes in our “internal control over financial reporting” (as defined in Rule 13a-15(f) of the Exchange Act) that occurred during the period covered by this quarterly report on Form 10-Q that have materially affected, or are reasonably likely to materially affect, our internal control over financial reporting.
PART II. OTHER INFORMATION From time to time, we may be involved in various claims and legal actions arising in the ordinary course of business. As of September 30, 2016,2017, we were not involved in any material legal proceedings. We have disclosed under the heading “Risk Factors” in our Registration Statement on Form S-11 (File No. 333-213043), filed with the SEC, risk factors which materially affect our business, financial condition or results of operations. There have been no material changes fromto the risk factors previously disclosed. You should carefully consider the risk factors set forth in the Registration Statement and the other information set forth elsewhere in this quarterly reportdisclosed under Item 1A of our Annual Report on Form 10-Q. You should be aware that these risk factors and other information may not describe every risk facing us. Additional risks and uncertainties not currently known to us or that we currently deem to be immaterial also may materially adversely affect our business, financial condition and/or operating results.10-K for the year ended December 31, 2016.
ITEM 2. | UNREGISTERED SALES OF EQUITYEQUITY SECURITIES AND USE OF PROCEEDS |
Unregistered Sales of Equity Securities On March 2, 2016, we issued 20,000 shares of common stock, par value $0.01 per share, to the Adviser for an aggregate purchase price of $200,000 in connection with our formation. No sales commission or other consideration was paid in connection with the sale. The sale was consummated without registration under the Securities Act of 1933, as amended (the “Securities Act”), in reliance upon the exemption from registration set forth in Section 4(a)(2) of the Securities Act as transactions not involving any public offering.
During the three months ended September 30, 2016,2017, we did not sell or issue any equity securities that were not registered under the Securities Act. As described in Note 11 to our consolidated financial statements, the Adviser is entitled to an annual management fee payable monthly in cash, shares of common stock, or BREIT OP Units, in each case at the Adviser's election. For the three month period ended September 30, 2017, the Adviser elected to receive its management fee in Class I Shares. During October 2017, the Company issued 355 thousand unregistered Class I Shares to the Adviser in satisfaction of the management fee. Use of Offering Proceeds On August 31, 2016, our Registration Statement on Form S-11 (File No. 333-213043), covering our public offeringthe Offering of up to $5$5.0 billion in shares of common stock (in any combination of purchases of Class S, Class T, Class D and Class I shares of our common stock), consisting of up to $4.0 billion in shares in our primary offering and up to $1.0 billion in shares pursuant to our distribution reinvestment plan, was declared effective under the Securities Act. Amendment No. 5 to our Registration Statement was declared effective under the Securities Act on August 17, 2017. The initial offering price of each class of our common stock was $10.00 per share, plus applicable selling commissions and dealer manager fees. The offering price for each class of our common stock is determined monthly and is made available on our website and in prospectus supplement filings. As of September 30, 2016,2017, the following is certain information about the Offering and use of proceeds therefrom ($ in thousands): | | Class S Shares | | | Class I Shares | | | Class D Shares | | | Class T Shares | | | Total | | Offering proceeds: | | | | | | | | | | | | | | | | | | | | | Shares sold | | | 98,779,308 | | | | 23,241,230 | | | | 1,225,700 | | | | 2,208,763 | | | | 125,455,001 | | Gross offering proceeds | | $ | 997,265 | | | $ | 231,177 | | | $ | 12,454 | | | $ | 23,157 | | | $ | 1,264,053 | | Selling commissions and dealer manager fees | | | (11,431 | ) | | | — | | | | — | | | | (659 | ) | | | (12,090 | ) | Accrued stockholder servicing fees | | | (4,008 | ) | | | — | | | | (6 | ) | | | (28 | ) | | | (4,042 | ) | Other offering costs | | | — | | | | — | | | | — | | | | — | | | | — | | Net offering proceeds | | $ | 981,826 | | | $ | 231,177 | | | $ | 12,448 | | | $ | 22,470 | | | $ | 1,247,921 | | Use of offering proceeds: | | | | | | | | | | | | | | | | | | | | | Purchase of real estate | | | | | | | | | | | | | | | | | | | (2,245,885 | ) | Capital improvements to real estate | | | | | | | | | | | | | | | | | | | (3,290 | ) | Pre-acquisition costs | | | | | | | | | | | | | | | | | | | (9,201 | ) | Purchase of real estate-related securities | | | | | | | | | | | | | | | | | | | (660,151 | ) | Proceeds from settlement of real estate-related securities | | | | | | | | | | | | | | | | | | | 16,596 | | Repurchase of common stock | | | | | | | | | | | | | | | | | | | (187 | ) | Borrowings from mortgage notes, term loan, and revolving credit facility | | | | | | | | | | | | | | | | | | | 1,055,913 | | Borrowings under repurchase agreements | | | | | | | | | | | | | | | | | | | 491,026 | | Settlement of repurchase agreements | | | | | | | | | | | | | | | | | | | (12,571 | ) | Borrowings from Line of Credit | | | | | | | | | | | | | | | | | | | 617,650 | | Repayments on Line of Credit | | | | | | | | | | | | | | | | | | | (495,150 | ) | Payment of deferred financing costs | | | | | | | | | | | | | | | | | | | (12,384 | ) | Contributions from non-controlling interests | | | | | | | | | | | | | | | | | | | 8,978 | | Distributions to stockholders | | | | | | | | | | | | | | | | | | | (6,203 | ) | Working capital | | | | | | | | | | | | | | | | | | | 37,758 | | Cash and cash equivalents | | | | | | | | | | | | | | | | | | $ | 30,820 | |
Share Repurchases Under our share repurchase plan, to the extent we hadchoose to repurchase shares in any particular month, we will only repurchase shares as of the opening of the last calendar day of that month (each such date, a “Repurchase Date”). Repurchases will be made at the transaction price in effect on the Repurchase Date (which will generally be equal to our prior month’s NAV per share), except that shares that have not received subscriptionsbeen outstanding for at least one year will be repurchased at 95% of the transaction price (an “Early Repurchase Deduction”) subject to certain limited exceptions. Settlements of share repurchases will be made within three business days of the Repurchase Date. The Early Repurchase Deduction will not apply to shares acquired through our distribution reinvestment plan. The total amount of aggregate repurchases of Class S, Class T, Class D and Class I shares is limited to no more than 2% of our aggregate NAV per month and no more than 5% of our aggregate NAV per calendar quarter. Should repurchase requests, in our judgment, place an undue burden on our liquidity, adversely affect our operations or risk having an adverse impact on the company as a whole, or should we otherwise determine that investing our liquid assets in real properties or other illiquid investments rather than repurchasing our shares is in the best interests of the Company as a whole, then we may choose to repurchase fewer shares than have been requested to be repurchased, or none at all. Further, our board of directors may modify, suspend or terminate our share repurchase plan if it deems such action to be in our best interest and the best interest of our stockholders. In the event that we determine to repurchase some but not all of the shares submitted for repurchase during any month, shares repurchased at the end of the month will be repurchased on a pro rata basis. If the transaction price for the applicable month is not made available by the tenth business day prior to the last business day of the month (or is changed after such date), then no repurchase requests will be accepted for such month and stockholders who wish to have their shares repurchased the following month must resubmit their repurchase requests. During the three months ended September 30, 2017, we repurchased shares of our common stock sufficient to allow us to break escrow and, therefore, we had notin the following amounts, which represented all of the share repurchase requests received any proceeds fromfor the Offering.same period. Period | | Total Number of Shares Redeemed or Repurchased | | | Average Price Paid per Share | | | Total Number of Shares Purchased as Part of Publicly Announced Plans or Programs | | | Maximum Number of Shares that May Yet Be Purchased Pursuant to the Program | July 1 – July 31, 2017 | | | — | | | $ | — | | | | — | | | (1) | August 1 - August 31, 2017 | | | 3,594 | | | | 9.80 | | | | 3,594 | | | (1) | September 1 - September 30, 2017 | | | 15,327 | | | | 9.90 | | | | 15,327 | | | (1) | Total | | | 18,921 | | | $ | 9.85 | | | | 18,921 | | | (1) |
| (1) | Repurchases are limited under the share repurchase plan as described above. Under the share repurchase plan, we would have been able to repurchase up to an aggregate of $57.6 million of Class T, Class S, Class D and Class I shares based on our August 31, 2017 NAV in the third quarter of 2017 (if such repurchase requests were made). Pursuant to the share repurchase plan, this amount resets at the beginning of each quarter. |
ITEM 3. | DEFAULTS UPON SENIOR SECURITIES |
None. ITEM 4. | MINE SAFETY DISCLOSURES |
Not applicable. Not applicable.
ITEM 6. | ITEM 5.
| OTHER INFORMATIONEXHIBITS |
Not applicable.
| | | 1.1 | | Dealer Manager Agreement, by and between Blackstone Real Estate Income Trust, Inc. and Blackstone Advisory Partners L.P. | | | 3.1 | | Articles of Amendment and Restatement (incorporated by reference to Exhibit 3.1 to the Registrant’s Registration Statement on Form S-11, as filed by the Registrant with the Securities and Exchange Commission on August 30, 2016 (file number 333-213043)) | | | 3.2 | | Amended and Restated Bylaws (incorporated by reference to Exhibit 3.2 to the Registrant’s Registration Statement on Form S-11, as filed by the Registrant with the Securities and Exchange Commission on August 30, 2016 (file number 333-213043)) | | | 3.3 | | Articles of Amendment of Blackstone Real Estate Income Trust, Inc., dated October 17, 2016 (incorporated by reference to Exhibit 3.3 to the Registrant’s Current Report on Form 8-K, as filed by the Registrant with the Securities and Exchange Commission on October 19, 2016) | | | 4.1 | | Share Repurchase Plan | | | 4.2 | | Distribution Reinvestment Plan (incorporated by reference to Exhibit 4.2 to the Registrant’s Registration Statement on Form S-11, as filed by the Registrant with the Securities and Exchange Commission on August 30, 2016 (file number 333-213043)) | | | | 10.1 | | Advisory Agreement, by and among Blackstone Real Estate Income Trust, Inc., BREIT Operating Partnership, L.P. and BX REIT Advisors L.L.C. | 31.1 | | 10.2 | | BREIT Operating Partnership L.P. Partnership Agreement, by and between Blackstone Real Estate Income Trust, Inc., BREIT Special Limited Partner L.L.C. and the limited partners party thereto from time to time. | | | 10.3 | | Registration Rights Agreement, by and among Blackstone Real Estate Income Trust, Inc., BREIT Special Limited Partner L.L.C. and BX REIT Advisors L.L.C. | | | 10.4 | | Escrow Agreement, by and among Blackstone Real Estate Income Trust, Inc., Blackstone Advisory Partners L.P. and UMB Bank, N.A. | | | 10.5 | | Trademark License Agreement, by and among Blackstone TM L.L.C., Blackstone Real Estate Income Trust, Inc. and BREIT Operating Partnership L.P. | | | 10.6 | | Valuation Services Agreement, by and among Altus Group U.S. Inc., Blackstone Real Estate Income Trust, Inc. and BREIT Operating Partnership L.P. | | | 10.7 | | Form of Indemnification Agreement (incorporated by reference to Exhibit 10.7 to the Registrant’s Registration Statement on Form S-11, as filed by the Registrant with the Securities and Exchange Commission on August 30, 2016 (file number 333-213043)) | | | 10.8 | | Form of Independent Directors Restricted Stock Award Agreement (incorporated by reference to Exhibit 10.8 to the Registrant’s Registration Statement on Form S-11, as filed by the Registrant with the Securities and Exchange Commission on August 30, 2016 (file number 333-213043)) | | | 31.1 | | Certification of Chief Executive Officer, as adopted pursuant to Section 302 of the Sarbanes-Oxley Act of 2002 | | | | 31.2 | | Certification of Chief Financial Officer, as adopted pursuant to Section 302 of the Sarbanes-Oxley Act of 2002 | | | | 32.1 + | | Certification of Chief Executive Officer, pursuant to 18 U.S.C. Section 1350, as adopted pursuant to Section 906 of the Sarbanes-Oxley Act of 2002 |
+ | This exhibit shall not be deemed “filed” for purposes of Section 18 of the Securities Exchange Act of 1934, as amended (the “Exchange Act”) or otherwise subject to the liability of that Section. Such exhibit shall not be deemed incorporated into any filing under the Securities Act or the Exchange Act. |
The agreements and other documents filed as exhibits to this report are not intended to provide factual information or other disclosure other than with respect to the terms of the agreements or other documents themselves, and you should not rely on them for that purpose. In particular, any representations and warranties made by us in these agreements or other documents were made solely within the specific context of the relevant agreement or document and may not describe the actual state of affairs as of the date they were made or at any other time.
SIGNATURESSIGNATURES
Pursuant to the requirements of the Securities Exchange Act of 1934, the registrant has duly caused this report to be signed on its behalf by the undersigned thereunto duly authorized. | | | | | | | | | BLACKSTONE REAL ESTATE INCOME TRUST, INC. | | | | November 14, 201613, 2017 | | | | /s/ Frank Cohen | Date | | | | Frank Cohen | | | | | Chief Executive Officer | | | | | (Principal Executive Officer) | | | | November 14, 201613, 2017 | | | | /s/ Paul D. Quinlan | Date | | | | Paul D. Quinlan | | | | | Chief Financial Officer and Treasurer | | | | | (Principal Financial Officer and | | | | | Principal Accounting Officer) |
1543
|