SECURITIES AND EXCHANGE COMMISSION
| QUARTERLY REPORT PURSUANT TO SECTION 13 OR 15(d) OF THE SECURITIES EXCHANGE ACT OF 1934 |
FOR THE QUARTERLY PERIOD ENDED
SEPTEMBERJUNE 30,
20172020
| TRANSITION REPORT PURSUANT TO SECTION 13 OR 15(d) OF THE SECURITIES EXCHANGE ACT OF 1934 |
FOR THE TRANSITION PERIOD FROM
TO
Commission File Number:
001-14788

Blackstone Mortgage Trust, Inc.
(Exact name of Registrant as specified in its charter)
| | |
| | |
(State or other jurisdiction of incorporation or organization) | | |
345 Park Avenue, 42nd Floor
(Address of principal executive offices)(Zip Code)
(Registrant’s telephone number, including area code)
(Former name, former address and
formalformer fiscal year, if changed since last report)
Securities registered pursuant to Section 12(b) of the Act:
| | | | |
| | | | |
Class A common stock, par value $0.01 per share | | | | |
Indicate by check mark whether the
Registrantregistrant (1) has filed all reports required to be filed by Section 13 or 15(d) of the Securities Exchange Act of 1934 during the preceding 12 months (or for such shorter period that the
Registrantregistrant was required to file such reports), and (2) has been subject to such filing requirements for the past 90 days. Yes
Indicate by check mark whether the registrant has submitted electronically
and posted on its corporate Web site, if any, every Interactive Data File required to be submitted
and posted pursuant to Rule 405 of Regulation S-T (§232.405 of this chapter) during the preceding 12 months (or for such shorter period that the registrant was required to submit
and post such files). Yes
Indicate by check mark whether the
Registrantregistrant is a large accelerated filer, an accelerated filer, a non-accelerated filer, a smaller reporting company, or an emerging growth company. See the definitions of “large accelerated filer,” “accelerated filer,” “smaller reporting company” and “emerging growth company” in Rule 12b-2 of the Exchange Act.
| | | | | | |
| | | | | | |
| | | |
Non-accelerated filer
| | ☐ (Do not check if a smaller reporting company)
| | | | |
| | | | Smaller reporting company | | |
| | | | | | |
| | | | | | |
If an emerging growth company, indicate by check mark if the registrant has elected not to use the extended transition period for complying with any new or revised financial accounting standards provided pursuant to Section 13(a) of the Exchange Act. ☐
Indicate by check mark whether the Registrantregistrant is a shell company (as defined in Rule 12b-2 of the Exchange Act). Yes ☐ No
The number of the
Registrant’sregistrant’s outstanding shares of class A common stock, par value $0.01 per share, outstanding as of
October 17, 2017July 22, 2020 was
94,828,437.146,197,290
.
PART I. FINANCIAL INFORMATION
ITEM 1. FINANCIAL STATEMENTS
Blackstone Mortgage Trust, Inc.
Consolidated Balance Sheets (Unaudited)
(in thousands, except share data)
| | | | | | | | |
| | | September 30, | | | December 31, | |
| | | 2017 | | | 2016 | |
Assets | | | | | | | | |
Cash and cash equivalents | | $ | 61,221 | | | $ | 75,567 | |
Restricted cash | | | 32,864 | | | | — | |
Loans receivable, net | | | 9,637,152 | | | | 8,692,978 | |
Other assets | | | 45,680 | | | | 44,070 | |
| | | | | | | | |
Total Assets | | $ | 9,776,917 | | | $ | 8,812,615 | |
| | | | | | | | |
| | |
Liabilities and Equity | | | | | | | | |
Secured debt agreements, net | | $ | 6,079,135 | | | $ | 5,716,354 | |
Loan participations sold, net | | | 33,193 | | | | 348,077 | |
Securitized debt obligations, net | | | 474,298 | | | | — | |
Convertible notes, net | | | 562,741 | | | | 166,762 | |
Other liabilities | | | 101,758 | | | | 87,819 | |
| | | | | | | | |
Total Liabilities | | | 7,251,125 | | | | 6,319,012 | |
| | | | | | | | |
| | |
Commitments and contingencies | | | — | | | | — | |
| | |
Equity | | | | | | | | |
Class A common stock, $0.01 par value, 200,000,000 shares authorized, 94,828,007 and 94,540,263 shares issued and outstanding as of September 30, 2017 and December 31, 2016, respectively | | | 948 | | | | 945 | |
Additional paid-in capital | | | 3,109,094 | | | | 3,089,997 | |
Accumulated other comprehensive loss | | | (32,362 | ) | | | (56,202 | ) |
Accumulated deficit | | | (558,066 | ) | | | (541,137 | ) |
| | | | | | | | |
Total Blackstone Mortgage Trust, Inc. stockholders’ equity | | | 2,519,614 | | | | 2,493,603 | |
Non-controlling interests | | | 6,178 | | | | — | |
| | | | | | | | |
Total Equity | | | 2,525,792 | | | | 2,493,603 | |
| | | | | | | | |
Total Liabilities and Equity | | $ | 9,776,917 | | | $ | 8,812,615 | |
| | | | | | | | |
| | | | | | | | |
| | | | | | |
| | | | | | |
| | | | | | | | |
Cash and cash equivalents | | $ | | | | $ | | |
| | | | | | | | |
Current expected credit loss reserve | | | | ) | | | | |
| | | | | | | | | |
| | | | | | | | |
| | | | | | | | |
| | | | | | | | | |
| | $ | | | | $ | | |
| | | | | | | | | |
| | | | | | | | | |
| | | | | | | | |
Secured debt agreements, net | | $ | | | | $ | | |
Securitized debt obligations, net | | | | | | | | |
| | | | | | | | |
| | | | | | | | |
| | | | | | | | |
| | | | | | | | | |
| | | | | | | | |
| | | | | | | | | |
| | | | | | | | | |
Commitments and contingencies | | | | | | | | |
| | | | | | | | | |
| | | | | | | | |
Class A common stock, $0.01 par value, 400,000,000 shares authorized and 146,196,662 shares issued and outstanding as of June 30, 2020, and 200,000,000 shares authorized and 135,003,662 shares issued and outstanding as of December 31, 2019 | | | | | | | | |
| | | | | | | | |
Accumulated other comprehensive income (loss) | | | | | | | | ) |
| | | | ) | | | | ) |
| | | | | | | | | |
Total Blackstone Mortgage Trust, Inc. stockholders’ equity | | | | | | | | |
| | | | | | | | |
| | | | | | | | | |
| | | | | | | | |
| | | | | | | | | |
Total Liabilities and Equity | | $ | | | | $ | | |
| | | | | | | | | |
Note: The consolidated balance
sheetsheets as of
SeptemberJune 30,
2017 includes2020 and December 31, 2019 include assets of
a consolidated variable interest
entity,entities, or
VIE,VIEs, that can only be used to settle obligations of
theeach respective VIE, and liabilities of
a consolidated
VIEVIEs for which creditors do not have recourse to Blackstone Mortgage Trust, Inc. As of
SeptemberJune 30,
2017,2020 and December 31, 2019, assets of the
VIEconsolidated VIEs totaled
$500.8 million$2.7 billion and $1.4 billion, respectively, and liabilities of the
VIEconsolidated VIEs totaled
$474.9 million. We did not consolidate any VIEs as of December 31, 2016.$2.2 billion and $1.2 billion, respectively. Refer to Note
1615 for additional discussion of the
VIE.VIEs.
See accompanying notes to consolidated financial statements.
Blackstone Mortgage Trust, Inc.
Consolidated Statements of Operations (Unaudited)
(in thousands, except share and per share data)
| | | | | | | | | | | | | | | | |
| | | Three Months Ended
September 30, | | | Nine Months Ended
September 30, | |
| | | 2017 | | | 2016 | | | 2017 | | | 2016 | |
Income from loans and other investments | | | | | | | | | | | | | | | | |
Interest and related income | | $ | 146,446 | | | $ | 128,190 | | | $ | 391,787 | | | $ | 381,686 | |
Less: Interest and related expenses | | | 67,891 | | | | 45,373 | | | | 168,917 | | | | 139,819 | |
| | | | | | | | | | | | | | | | |
Income from loans and other investments, net | | | 78,555 | | | | 82,817 | | | | 222,870 | | | | 241,867 | |
Other expenses | | | | | | | | | | | | | | | | |
Management and incentive fees | | | 13,243 | | | | 13,701 | | | | 40,557 | | | | 43,161 | |
General and administrative expenses | | | 7,419 | | | | 7,414 | | | | 22,219 | | | | 20,990 | |
| | | | | | | | | | | | | | | | |
Total other expenses | | | 20,662 | | | | 21,115 | | | | 62,776 | | | | 64,151 | |
Gain on investments at fair value | | | — | | | | 2,824 | | | | — | | | | 13,413 | |
Income from equity investment in unconsolidated subsidiary | | | — | | | | 2,060 | | | | — | | | | 2,192 | |
| | | | | | | | | | | | | | | | |
Income before income taxes | | | 57,893 | | | | 66,586 | | | | 160,094 | | | | 193,321 | |
Income tax provision | | | 83 | | | | 194 | | | | 265 | | | | 281 | |
| | | | | | | | | | | | | | | | |
Net income | | | 57,810 | | | | 66,392 | | | | 159,829 | | | | 193,040 | |
| | | | | | | | | | | | | | | | |
Net income attributable to non-controlling interests | | | (88 | ) | | | (1,598 | ) | | | (88 | ) | | | (8,119 | ) |
| | | | | | | | | | | | | | | | |
Net income attributable to Blackstone Mortgage Trust, Inc. | | $ | 57,722 | | | $ | 64,794 | | | $ | 159,741 | | | $ | 184,921 | |
| | | | | | | | | | | | | | | | |
Net income per share of common stock basic and diluted | | $ | 0.61 | | | $ | 0.69 | | | $ | 1.68 | | | $ | 1.97 | |
| | | | | | | | | | | | | | | | |
Weighted-average shares of common stock outstanding, basic and diluted | | | 95,013,087 | | | | 94,071,537 | | | | 95,004,188 | | | | 94,067,923 | |
| | | | | | | | | | | | | | | | |
Dividends declared per share of common stock | | $ | 0.62 | | | $ | 0.62 | | | $ | 1.86 | | | $ | 1.86 | |
| | | | | | | | | | | | | | | | |
| | | | | | | | | | | | | | | | |
| | | | | | |
| | | | | | |
| | | | | | | | | | | | |
Income from loans and other investments | | | | | | | | | | | | | | | | |
Interest and related income | | $ | | | | $ | | | | $ | | | | $ | | |
Less: Interest and related expenses | | | | | | | | | | | | | | | | |
| | | | | | | | | | | | | | | | | |
Income from loans and other investments, net | | | | | | | | | | | | | | | | |
| | | | | | | | | | | | | | | | |
Management and incentive fees | | | | | | | | | | | | | | | | |
General and administrative expenses | | | | | | | | | | | | | | | | |
| | | | | | | | | | | | | | | | | |
| | | | | | | | | | | | | | | | |
Increase in current expected credit loss reserve | | | | ) | | | | | | | | ) | | | | |
| | | | | | | | | | | | | | | | | |
Income (loss) before income taxes | | | | | | | | | | | | ) | | | | |
| | | | | | | | | | | | | | | | |
| | | | | | | | | | | | | | | | | |
| | | | | | | | | | | | ) | | | | |
| | | | | | | | | | | | | | | | | |
Net income attributable to non-controlling interests | | | | ) | | | | ) | | | | ) | | | | ) |
| | | | | | | | | | | | | | | | | |
Net income (loss) attributable to Blackstone Mortgage Trust, Inc. | | $ | | | | $ | | | | $ | | ) | | $ | | |
| | | | | | | | | | | | | | | | | |
Net income (loss) per share of common stock basic and diluted | | $ | | | | $ | | | | $ | | ) | | $ | | |
| | | | | | | | | | | | | | | | | |
Weighted-average shares of common stock outstanding, basic and diluted | | | | | | | | | | | | | | | | |
| | | | | | | | | | | | | | | | | |
See accompanying notes to consolidated financial statements.
Blackstone Mortgage Trust, Inc.
Consolidated Statements of Comprehensive Income (Unaudited)
(in thousands)
| | | | | | | | | | | | | | | | |
| | | Three Months Ended
September 30, | | | Nine Months Ended
September 30, | |
| | | 2017 | | | 2016 | | | 2017 | | | 2016 | |
Net income | | $ | 57,810 | | | $ | 66,392 | | | $ | 159,829 | | | $ | 193,040 | |
Other comprehensive income | | | | | | | | | | | | | | | | |
Unrealized gain (loss) on foreign currency remeasurement | | | 16,175 | | | | (10,128 | ) | | | 43,990 | | | | (25,472 | ) |
Realized and unrealized (loss) gain on derivative financial instruments | | | (8,029 | ) | | | 5,882 | | | | (20,150 | ) | | | 11,841 | |
| | | | | | | | | | | | | | | | |
Other comprehensive income (loss) | | | 8,146 | | | | (4,246 | ) | | | 23,840 | | | | (13,631 | ) |
| | | | | | | | | | | | | | | | |
Comprehensive income | | | 65,956 | | | | 62,146 | | | | 183,669 | | | | 179,409 | |
Comprehensive income attributable to non-controlling interests | | | (88 | ) | | | (1,598 | ) | | | (88 | ) | | | (8,119 | ) |
| | | | | | | | | | | | | | | | |
Comprehensive income attributable to Blackstone Mortgage Trust, Inc. | | $ | 65,868 | | | $ | 60,548 | | | $ | 183,581 | | | $ | 171,290 | |
| | | | | | | | | | | | | | | | |
| | | | | | | | | | | | | | | | |
| | | | | | |
| | | | | | |
| | | | | | | | | | | | |
| | $ | | | | $ | | | | $ | | ) | | $ | | |
Other comprehensive income | | | | | | | | | | | | | | | | |
Unrealized gain (loss) on foreign currency translation | | | | | | | | ) | | | | ) | | | | ) |
Realized and unrealized (loss) gain on derivative financial instruments | | | | ) | | | | | | | | | | | | |
| | | | | | | | | | | | | | | | | |
Other comprehensive (loss) income | | | | ) | | | | | | | | | | | | |
| | | | | | | | | | | | | | | | | |
Comprehensive income (loss) | | | | | | | | | | | | ) | | | | |
Comprehensive income attributable to non-controlling interests | | | | ) | | | | ) | | | | ) | | | | ) |
| | | | | | | | | | | | | | | | | |
Comprehensive income (loss) attributable to Blackstone Mortgage Trust, Inc. | | $ | | | | $ | | | | $ | | ) | | $ | | |
| | | | | | | | | | | | | | | | | |
See accompanying notes to consolidated financial statements.
Blackstone Mortgage Trust, Inc.
Consolidated Statements of Changes in Equity (Unaudited)
(in thousands)
| | | | | | | | | | | | | | | | | | | | | | | | | | | | |
| | | Blackstone Mortgage Trust, Inc. | | | | | | | |
| | | Class A
Common
Stock | | | Additional
Paid-In
Capital | | | Accumulated Other
Comprehensive
(Loss) Income | | | Accumulated
Deficit | | | Stockholders’
Equity | | | Non-controlling
Interests | | | Total
Equity | |
Balance at December 31, 2015 | | $ | 937 | | | $ | 3,070,200 | | | $ | (32,758 | ) | | $ | (545,791 | ) | | $ | 2,492,588 | | | $ | 13,143 | | | $ | 2,505,731 | |
Shares of class A common stock issued, net | | | 2 | | | | — | | | | — | | | | — | | | | 2 | | | | — | | | | 2 | |
Restricted class A common stock earned | | | — | | | | 14,190 | | | | — | | | | — | | | | 14,190 | | | | — | | | | 14,190 | |
Dividends reinvested | | | — | | | | 276 | | | | — | | | | (256 | ) | | | 20 | | | | — | | | | 20 | |
Deferred directors’ compensation | | | — | | | | 282 | | | | — | | | | — | | | | 282 | | | | — | | | | 282 | |
Other comprehensive loss | | | — | | | | — | | | | (13,631 | ) | | | — | | | | (13,631 | ) | | | — | | | | (13,631 | ) |
Net income | | | — | | | | — | | | | — | | | | 184,921 | | | | 184,921 | | | | 8,119 | | | | 193,040 | |
Dividends declared on common stock | | | — | | | | — | | | | — | | | �� | (174,678 | ) | | | (174,678 | ) | | | — | | | | (174,678 | ) |
Distributions to non-controlling interests | | | — | | | | — | | | | — | | | | — | | | | — | | | | (20,158 | ) | | | (20,158 | ) |
| | | | | | | | | | | | | | | | | | | | | | | | | | | | |
Balance at September 30, 2016 | | $ | 939 | | | $ | 3,084,948 | | | $ | (46,389 | ) | | $ | (535,804 | ) | | $ | 2,503,694 | | | $ | 1,104 | | | $ | 2,504,798 | |
| | | | | | | | | | | | | | | | | | | | | | | | | | | | |
| | | | | | | |
Balance at December 31, 2016 | | $ | 945 | | | $ | 3,089,997 | | | $ | (56,202 | ) | | $ | (541,137 | ) | | $ | 2,493,603 | | | $ | — | | | $ | 2,493,603 | |
Shares of class A common stock issued, net | | | 3 | | | | — | | | | — | | | | — | | | | 3 | | | | — | | | | 3 | |
Restricted class A common stock earned | | | — | | | | 17,493 | | | | — | | | | — | | | | 17,493 | | | | — | | | | 17,493 | |
Issuance of convertible notes | | | — | | | | 964 | | | | — | | | | — | | | | 964 | | | | — | | | | 964 | |
Dividends reinvested | | | — | | | | 327 | | | | — | | | | (296 | ) | | | 31 | | | | — | | | | 31 | |
Deferred directors’ compensation | | | — | | | | 313 | | | | — | | | | — | | | | 313 | | | | — | | | | 313 | |
Other comprehensive income | | | — | | | | — | | | | 23,840 | | | | — | | | | 23,840 | | | | — | | | | 23,840 | |
Net income | | | — | | | | — | | | | — | | | | 159,741 | | | | 159,741 | | | | 88 | | | | 159,829 | |
Contributions from non-controlling interests | | | — | | | | — | | | | — | | | | — | | | | — | | | | 6,090 | | | | 6,090 | |
Dividends declared on common stock | | | — | | | | — | | | | — | | | | (176,374 | ) | | | (176,374 | ) | | | — | | | | (176,374 | ) |
| | | | | | | | | | | | | | | | | | | | | | | | | | | | |
Balance at September 30, 2017 | | $ | 948 | | | $ | 3,109,094 | | | $ | (32,362 | ) | | $ | (558,066 | ) | | $ | 2,519,614 | | | $ | 6,178 | | | $ | 2,525,792 | |
| | | | | | | | | | | | | | | | | | | | | | | | | | | | |
| | | | | | | | | | | | | | | | | | | | | | | | | | | | |
| | Blackstone Mortgage Trust, Inc. | | | | | | | |
| | | | | | | | | | | | | | | | | | | | | |
| | | | | | | | | | | | | | | | | | | | | |
| | | | | | | | | | | | | | | | | | | | | |
Balance at December 31, 2019 | | $ | | | | $ | | | | $ | | ) | | $ | | ) | | $ | | | | $ | | | | $ | | |
Adoption of ASU 2016-13, see Note 2 | | | | | | | | | | | | | | | | ) | | | | ) | | | | ) | | | | ) |
Shares of class A common stock issued, net | | | | | | | | | | | | | | | | | | | | | | | | | | | | |
Restricted class A common stock earned | | | | | | | | | | | | | | | | | | | | | | | | | | | | |
| | | | | | | | | | | | | | | | ) | | | | | | | | | | | | |
Deferred directors’ compensation | | | | | | | | | | | | | | | | | | | | | | | | | | | | |
Other comprehensive income | | | | | | | | | | | | | | | | | | | | | | | | | | | | |
| | | | | | | | | | | | | | | | ) | | | | ) | | | | | | | | ) |
Dividends declared on common stock, $0.62 per share | | | | | | | | | | | | | | | | ) | | | | ) | | | | | | | | ) |
Contributions from non-controlling interests | | | | | | | | | | | | | | | | | | | | | | | | | | | | |
Distributions to non-controlling interests | | | | | | | | | | | | | | | | | | | | | | | | ) | | | | ) |
| | | | | | | | | | | | | | | | | | | | | | | | | | | | | |
Balance at March 31, 2020 | | $ | | | | $ | | | | $ | | | | $ | | ) | | $ | | | | $ | | | | $ | | |
| | | | | | | | | | | | | | | | | | | | | | | | | | | | | |
Shares of class A common stock issued, net | | | | | | | | | | | | | | | | | | | | | | | | | | | | |
Restricted class A common stock earned | | | | | | | | | | | | | | | | | | | | | | | | | | | | |
| | | | | | | | | | | | | | | | ) | | | | | | | | | | | | |
Deferred directors’ compensation | | | | | | | | | | | | | | | | | | | | | | | | | | | | |
| | | | | | | | | | | | ) | | | | | | | | ) | | | | | | | | ) |
| | | | | | | | | | | | | | | | | | | | | | | | | | | | |
Dividends declared on common stock, $0.62 per share | | | | | | | | | | | | | | | | ) | | | | ) | | | | | | | | ) |
Distributions to non-controlling interests | | | | | | | | | | | | | | | | | | | | | | | | ) | | | | ) |
| | | | | | | | | | | | | | | | | | | | | | | | | | | | | |
| | $ | | | | $ | | | | $ | | | | $ | | ) | | $ | | | | $ | | | | $ | | |
| | | | | | | | | | | | | | | | | | | | | | | | | | | | | |
See accompanying notes to consolidated financial statements.
Blackstone Mortgage Trust, Inc.
Consolidated Statements of
Cash FlowsChanges in Equity (Unaudited)
(in thousands)
| | | | | | | | |
| | | Nine Months Ended
September 30, | |
| | | 2017 | | | 2016 | |
Cash flows from operating activities | | | | | | | | |
Net income | | $ | 159,829 | | | $ | 193,040 | |
Adjustments to reconcile net income to net cash provided by operating activities | | | | | | | | |
Non-cash compensation expense | | | 17,809 | | | | 16,517 | |
Amortization of deferred fees on loans | | | (28,887 | ) | | | (31,594 | ) |
Amortization of deferred financing costs and premiums/discount on debt obligations | | | 16,356 | | | | 15,129 | |
Income from equity investment in unconsolidated subsidiary | | | — | | | | (2,192 | ) |
Distributions of income from unconsolidated subsidiary | | | — | | | | 8,167 | |
Gain on investments at fair value | | | — | | | | (13,413 | ) |
Changes in assets and liabilities, net | | | | | | | | |
Other assets | | | (219 | ) | | | 8,315 | |
Other liabilities | | | 11,651 | | | | (6,405 | ) |
| | | | | | | | |
Net cash provided by operating activities | | | 176,539 | | | | 187,564 | |
| | | | | | | | |
Cash flows from investing activities | | | | | | | | |
Origination and fundings of loans receivable | | | (2,314,721 | ) | | | (2,300,636 | ) |
Principal collections and sales proceeds from loans receivable and other assets | | | 1,976,271 | | | | 3,054,821 | |
Origination and exit fees received on loans receivable | | | 38,434 | | | | 35,388 | |
Receipts under derivative financial instruments | | | 6,115 | | | | — | |
Payments under derivative financial instruments | | | (18,115 | ) | | | — | |
Return of collateral deposited under derivative agreements | | | 8,980 | | | | — | |
Collateral deposited under derivative agreements | | | (16,651 | ) | | | — | |
| | | | | | | | |
Net cash (used in) provided by investing activities | | | (319,687 | ) | | | 789,573 | |
| | | | | | | | |
continued…
| | | | | | | | | | | | | | | | | | | | | | | | | | | | |
| | Blackstone Mortgage Trust, Inc. | | | | | | | |
| | | | | | | | | | | | | | | | | | | | | |
| | | | | | | | | | | | | | | | | | | | | |
| | | | | | | | | | | | | | | | | | | | | |
Balance at December 31, 2018 | | $ | | | | $ | | | | $ | | ) | | $ | | ) | | $ | | | | $ | | | | $ | | |
Shares of class A common stock issued, net | | | | | | | | | | | | | | | | | | | | | | | | | | | | |
Restricted class A common stock earned | | | | | | | | | | | | | | | | | | | | | | | | | | | | |
| | | | | | | | | | | | | | | | ) | | | | | | | | | | | | |
Deferred directors’ compensation | | | | | | | | | | | | | | | | | | | | | | | | | | | | |
Other comprehensive income | | | | | | | | | | | | | | | | | | | | | | | | | | | | |
| | | | | | | | | | | | | | | | | | | | | | | | | | | | |
Dividends declared on common stock, $0.62 per share | | | | | | | | | | | | | | | | ) | | | | ) | | | | | | | | ) |
Contributions from non-controlling interests | | | | | | | | | | | | | | | | | | | | | | | | | | | | |
Distributions to non-controlling interests | | | | | | | | | | | | | | | | | | | | | | | | ) | | | | ) |
| | | | | | | | | | | | | | | | | | | | | | | | | | | | | |
Balance at March 31, 2019 | | $ | | | | $ | | | | $ | | ) | | $ | | ) | | $ | | | | $ | | | | $ | | |
| | | | | | | | | | | | | | | | | | | | | | | | | | | | | |
Shares of class A common stock issued, net | | | | | | | | | | | | | | | | | | | | | | | | | | | | |
Restricted class A common stock earned | | | | | | | | | | | | | | | | | | | | | | | | | | | | |
| | | | | | | | | | | | | | | | ) | | | | | | | | | | | | |
Deferred directors’ compensation | | | | | | | | | | | | | | | | | | | | | | | | | | | | |
Other comprehensive income | | | | | | | | | | | | | | | | | | | | | | | | | | | | |
| | | | | | | | | | | | | | | | | | | | | | | | | | | | |
Dividends declared on common stock, $0.62 per share | | | | | | | | | | | | | | | | ) | | | | ) | | | | | | | | ) |
Contributions from non-controlling interests | | | | | | | | | | | | | | | | | | | | | | | | | | | | |
Distributions to non-controlling interests | | | | | | | | | | | | | | | | | | | | | | | | ) | | | | ) |
| | | | | | | | | | | | | | | | | | | | | | | | | | | | | |
| | $ | | | | $ | | | | $ | | ) | | $ | | ) | | $ | | | | $ | | | | $ | | |
| | | | | | | | | | | | | | | | | | | | | | | | | | | | | |
See accompanying notes to consolidated financial statements.
Blackstone Mortgage Trust, Inc.
Consolidated Statements of Cash Flows (Unaudited)
(in thousands)
| | | | | | | | |
| | | Nine Months Ended
September 30, | |
| | | 2017 | | | 2016 | |
Cash flows from financing activities | | | | | | | | |
Borrowings under secured debt agreements | | $ | 2,776,058 | | | $ | 2,225,895 | |
Repayments under secured debt agreements | | | (2,481,250 | ) | | | (2,988,217 | ) |
Proceeds from sale of loan participations | | | 33,193 | | | | 54,441 | |
Repayment of loan participations | | | (381,310 | ) | | | (92,000 | ) |
Payment of deferred financing costs | | | (13,591 | ) | | | (12,564 | ) |
Receipts under derivative financial instruments | | | — | | | | 31,668 | |
Payments under derivative financial instruments | | | — | | | | (14,266 | ) |
Contributions from non-controlling interests | | | 6,090 | | | | — | |
Distributions to non-controlling interests | | | — | | | | (20,158 | ) |
Net proceeds from issuance of convertible notes | | | 394,074 | | | | — | |
Net proceeds from issuance of class A common stock | | | 31 | | | | 20 | |
Dividends paid on class A common stock | | | (176,195 | ) | | | (174,549 | ) |
| | | | | | | | |
Net cash provided by (used in) financing activities | | | 157,100 | | | | (989,730 | ) |
| | | | | | | | |
Net increase (decrease) in cash, cash equivalents, and restricted cash | | | 13,952 | | | | (12,593 | ) |
Cash, cash equivalents, and restricted cash at beginning of period | | | 75,567 | | | | 106,005 | |
Effects of currency translation on cash, cash equivalents, and restricted cash | | | 4,566 | | | | 1,526 | |
| | | | | | | | |
Cash, cash equivalents, and restricted cash at end of period | | $ | 94,085 | | | $ | 94,938 | |
| | | | | | | | |
Supplemental disclosure of cash flows information | | | | | | | | |
Payments of interest | | $ | (141,124 | ) | | $ | (123,564 | ) |
| | | | | | | | |
Payments of income taxes | | $ | (220 | ) | | $ | (131 | ) |
| | | | | | | | |
Supplemental disclosure of non-cash investing and financing activities | | | | | | | | |
Dividends declared, not paid | | $ | (58,793 | ) | | $ | (58,388 | ) |
| | | | | | | | |
Loan principal payments held by servicer, net | | $ | 513 | | | $ | 9,515 | |
| | | | | | | | |
Consolidation of loans receivable of a VIE | | $ | 500,000 | | | $ | — | |
| | | | | | | | |
Consolidation of securitized debt obligations of a VIE | | $ | (474,620 | ) | | $ | — | |
| | | | | | | | |
| | | | | | | | | | | | |
| | | | | | |
| | | | | | | | | |
Cash flows from operating activities | | | | | | | | | | | | |
| | | | | | $ | | ) | | $ | | |
Adjustments to reconcile net (loss) income to net cash provided by operating activities | | | | | | | | | | | | |
Satisfaction of management and incentive fees in stock | | | | | | | | | | | | |
Non-cash compensation expense | | | | | | | | | | | | |
Amortization of deferred fees on loans and debt securities | | | | | | | | ) | | | | ) |
Amortization of deferred financing costs and premiums/ discount on debt obligations | | | | | | | | | | | | |
Increase in current expected credit loss reserve | | | | | | | | | | | | |
Changes in assets and liabilities, net | | | | | | | | | | | | |
| | | | | | | | | | | | ) |
| | | | | | | | ) | | | | |
| | | | | | | | | | | | | |
Net cash provided by operating activities | | | | | | | | | | | | |
| | | | | | | | | | | | | |
Cash flows from investing activities | | | | | | | | | | | | |
Origination and fundings of loans receivable | | | | | | | | ) | | | | ) |
Principal collections and sales proceeds from loans receivable and debt securities | | | | | | | | | | | | |
Origination and exit fees received on loans receivable | | | | | | | | | | | | |
Receipts under derivative financial instruments | | | | | | | | | | | | |
Payments under derivative financial instruments | | | | | | | | ) | | | | ) |
Collateral deposited under derivative agreements | | | | | | | | ) | | | | ) |
Return of collateral deposited under derivative agreements | | | | | | | | | | | | |
| | | | | | | | | | | | | |
Net cash used in investing activities | | | | | | | | ) | | | | ) |
| | | | | | | | | | | | | |
See accompanying notes to consolidated financial statements.
Blackstone Mortgage Trust, Inc.
Consolidated Statements of Cash Flows (Unaudited)
| | | | | | | | | | | | |
| | | | | | |
| | | | | | | | | |
Cash flows from financing activities | | | | | | | | | | | | |
Borrowings under secured debt agreements | | | | | | $ | | | | $ | | |
Repayments under secured debt agreements | | | | | | | | ) | | | | ) |
Proceeds from issuance of collateralized loan obligations | | | | | | | | | | | | |
Repayment of collateralized loan obligations | | | | | | | | ) | | | | |
Proceeds from sale of loan participations | | | | | | | | | | | | |
Repayment of loan participations | | | | | | | | | | | | ) |
Net proceeds from issuance of secured term loans | | | | | | | | | | | | |
Repayments of secured term loans | | | | | | | | ) | | | | |
Payment of deferred financing costs | | | | | | | | ) | | | | ) |
Contributions from non-controlling interests | | | | | | | | | | | | |
Distributions to non-controlling interests | | | | | | | | ) | | | | ) |
Net proceeds from issuance of class A common stock | | | | | | | | | | | | |
Dividends paid on class A common stock | | | | | | | | ) | | | | ) |
| | | | | | | | | | | | | |
Net cash provided by (used in) financing activities | | | | | | | | | | | | ) |
| | | | | | | | | | | | | |
Net increase (decrease) in cash, cash equivalents, and restricted cash | | | | | | | | | | | | ) |
Cash and cash equivalents at beginning of period | | | | | | | | | | | | |
Effects of currency translation on cash and cash equivalents | | | | | | | | ) | | | | ) |
| | | | | | | | | | | | | |
Cash and cash equivalents at end of period | | | | | | $ | | | | $ | | |
| | | | | | | | | | | | | |
Supplemental disclosure of cash flows information | | | | | | | | | | | | |
| | | | | | $ | | ) | | $ | | ) |
| | | | | | | | | | | | | |
| | | | | | $ | | ) | | $ | | ) |
| | | | | | | | | | | | | |
Supplemental disclosure of non-cash investing and financing activities | | | | |
Dividends declared, not paid | | | | | | $ | | ) | | $ | | ) |
| | | | | | | | | | | | | |
| Satisfaction of management and incentive fees in stock | | | | | | | | | | | | |
Loan principal payments held by servicer, net | | | | | | $ | | | | $ | | |
| | | | | | | | | | | | | |
See accompanying notes to consolidated financial statements.
Blackstone Mortgage Trust, Inc.
Notes to Consolidated Financial Statements
References herein to “Blackstone Mortgage Trust,” “Company,” “we,” “us” or “our” refer to Blackstone Mortgage Trust, Inc. and its subsidiaries unless the context specifically requires otherwise.
Blackstone Mortgage Trust is a real estate finance company that originates
and purchases senior loans collateralized by
propertiescommercial real estate in North America,
Europe, and
Europe.Australia. Our portfolio is composed of loans secured by high-quality, institutional assets in major markets, sponsored by experienced, well-capitalized real estate investment owners and operators. These senior loans are capitalized by accessing a variety of financing options, including our credit facilities, issuing CLOs or single-asset securitizations, and syndications of senior loan participations, depending on our view of the most prudent financing option available for each of our investments. We are not in the business of buying or trading securities, and the only securities we own are the retained interests from our securitization financing transactions, which we have not financed. We are externally managed by BXMT Advisors L.L.C., or our Manager, a subsidiary of The Blackstone Group
L.P.Inc., or Blackstone, and are a real estate investment trust, or REIT, traded on the New York Stock Exchange, or NYSE, under the symbol “BXMT.”
WeOur principal executive offices are
headquartered inlocated at 345 Park Avenue, 42nd Floor, New York,
City.New York 10154. We were incorporated in Maryland in 1998, when we reorganized from a California common law business trust into a Maryland corporation.
We conduct our operations as a REIT for U.S. federal income tax purposes. We generally will not be subject to U.S. federal income taxes on our taxable income to the extent that we annually distribute all of our net taxable income to stockholders and maintain our qualification as a REIT. We also operate our business in a manner that permits us to maintain an exclusion from registration under the Investment Company Act of 1940, as amended. We are organized as a holding company and conduct our business primarily through our various subsidiaries.
2. SUMMARY OF SIGNIFICANT ACCOUNTING POLICIES
The accompanying unaudited consolidated financial statements have been prepared in accordance with accounting principles generally accepted in the United States of America, or GAAP, for interim financial information and the instructions to Form
10-Q
and Rule
10-01
of Regulation
S-X.
The consolidated financial statements, including the notes thereto, are unaudited and exclude some of the disclosures required in
annualaudited financial statements.
Management believes it hasWe believe we have made all necessary adjustments, consisting of only normal recurring items, so that the consolidated financial statements are presented fairly and that estimates made in preparing
itsour consolidated financial statements are reasonable and prudent. The operating results presented for interim periods are not necessarily indicative of the results that may be expected for any other interim period or for the entire year. The accompanying unaudited consolidated interim financial statements should be read in conjunction with the audited consolidated financial statements included in our Annual Report on Form
10-K
for the fiscal year ended December 31,
20162019 filed with the Securities and Exchange Commission, or the SEC.
The accompanying consolidated financial statements include, on a consolidated basis, our accounts, the accounts of our wholly-owned subsidiaries, majority-owned subsidiaries, and variable interest entities, or VIEs, of which we are the primary beneficiary. All intercompany balances and transactions have been eliminated in consolidation.
Principles of Consolidation
We consolidate all entities that we control through either majority ownership or voting rights. In addition, we consolidate all VIEs of which we are considered the primary beneficiary. VIEs are defined as entities in which equity investors (i) do not have the characteristics of a controlling financial interest and/or (ii) do not have sufficient equity at risk for the entity to finance its activities without additional subordinated financial support from other parties. The entity that consolidates a VIE is known as its primary beneficiary and is generally the entity with (i) the power to direct the activities that most significantly affect the VIE’s economic performance and (ii) the right to receive benefits from the VIE or the obligation to absorb losses of the VIE that could be significant to the VIE.
In the third quarter of 2018, we contributed a loan to a single asset securitization vehicle, or the 2018 Single Asset Securitization, which is a VIE, and invested in the related subordinate position. We are not the primary beneficiary of the VIE because we do not have the power to direct the activities that most significantly affect the VIE’s economic performance and, therefore, do not consolidate the 2018 Single Asset Securitization on our balance sheet. We have classified the subordinate position as aheld-to-maturity
debt security that is included in other assets on our consolidated balance sheets. Refer to Note
1615 for additional discussion of our
consolidated VIE.VIEs.
Blackstone Mortgage Trust, Inc.
Notes to Consolidated Financial Statements (continued)
In April 2017, we entered into a joint venture, or our Multifamily Joint Venture, with Walker & Dunlop Inc. to originate, hold, and finance multifamily bridge loans. Pursuant to the terms of the agreements governing the joint venture, Walker & Dunlop contributed 15% of the venture’s equity capital and we contributed 85%. We consolidate the Multifamily Joint Venture as we have a controlling financial interest. The non-controlling interests included on our consolidated balance sheets represent the equity interests in our Multifamily Joint Venture that are owned by Walker & Dunlop. A portion of our Multifamily Joint Venture’s consolidated equity and results of operations are allocated to these non-controlling interests based on Walker & Dunlop’s
pro-ratapro rata ownership of our Multifamily Joint Venture.
Blackstone Mortgage Trust, Inc.
Notes to Consolidated Financial Statements (continued)
(Unaudited)
The preparation of consolidated financial statements in conformity with GAAP requires us to make estimates and assumptions that affect the reported amounts of assets and liabilities and disclosure of contingent assets and liabilities as of the date of the consolidated financial statements and the reported amounts of revenues and expenses during the reporting period.
During the first quarter of 2020, there was a global outbreak of a novel coronavirus, or COVID-19, which has spread to over 200 countries and territories, including the United States, and has spread to every state in the United States. The World Health Organization has designated COVID-19 as a pandemic, and numerous countries, including the United States, have declared national emergencies with respect to COVID-19. The global impact of the outbreak has been rapidly evolving, and as cases of COVID-19 have continued to be identified in additional countries, many countries have reacted by instituting quarantines and restrictions on travel, closing financial markets and/or restricting trading, and limiting operations of non-essential offices and retail centers. Such actions are creating disruption in global supply chains, increasing rates of unemployment and adversely impacting many industries. The outbreak could have a continued adverse impact on economic and market conditions and trigger a period of global economic slowdown. The rapid development and fluidity of this situation precludes any prediction as to the ultimate adverse impact of COVID-19 on economic and market conditions. We believe the estimates and assumptions underlying our consolidated financial statements are reasonable and supportable based on the information available as of June 30, 2020, however uncertainty over the ultimate impactCOVID-19
will have on the global economy generally, and our business in particular, makes any estimates and assumptions as of June 30, 2020 inherently less certain than they would be absent the current and potential impacts ofCOVID-19.
Actual results may ultimately differ from those estimates.
Interest income from our loans receivable portfolio
and debt securities is recognized over the life of each investment using the effective interest method and is recorded on the accrual basis. Recognition of fees, premiums, and discounts associated with these investments is deferred
until the loan is advanced and
is then recorded over the term of the loan
or debt security as an adjustment to yield. Income accrual is generally suspended for loans at the earlier of the date at which payments become 90 days past due or when, in the opinion of our Manager, recovery of income and principal becomes doubtful. Income is then recorded on the basis of cash received until accrual is resumed when the loan becomes contractually current and performance is demonstrated to be resumed. In addition, for loans we originate, the related origination expenses are deferred and recognized as a component of interest
income;income, however expenses related to loans we acquire are included in general and administrative expenses as incurred.
Cash
and Cash Equivalents
and Restricted CashCash and cash equivalents represent cash held in banks
cash on hand, and liquid investments with original maturities of three months or less. We may have bank balances in excess of federally insured amounts; however, we deposit our cash and cash equivalents with high credit-quality institutions to minimize credit risk exposure. We have not experienced, and do not expect, any losses on our cash or cash equivalents.
Restricted As of both June 30, 2020 and December 31, 2019, we had 0 restricted cash representson our consolidated balance sheets.
Blackstone Mortgage Trust, Inc.
Notes to Consolidated Financial Statements (continued)
Through our subsidiaries, we have oversight of certain servicing accounts held with third-party servicers, or Servicing Accounts, which relate to borrower escrows and other cash
heldbalances aggregating $350.4 million and $450.8 million as of June 30, 2020 and December 31, 2019, respectively. This cash is maintained in
a segregated bank
account related to a letter of credit.The following table provides a reconciliation of cash, cash equivalents,accounts, and restricted cashthese amounts are not included in the assets and liabilities presented in our consolidated balance sheetssheets. Cash in these Servicing Accounts will be transferred by the respective third-party servicer to the total amount shown in our consolidated statementsborrower or us under the terms of cash flows ($ in thousands):
| | | | | | | | |
| | | September 30, 2017 | | | September 30, 2016 | |
Cash and cash equivalents | | $ | 61,221 | | | $ | 94,061 | |
Restricted cash | | | 32,864 | | | | 877 | |
| | | | | | | | |
Total cash, cash equivalents, and restricted cash shown in our consolidated statements of cash flows | | $ | 94,085 | | | $ | 94,938 | |
| | | | | | | | |
the applicable loan agreement upon occurrence of certain future events. We do not generate any revenue or incur any expenses as a result of these Servicing Accounts.
Loans Receivable
and Provision for Loan LossesWe originate and purchase commercial real estate debt and related instruments generally to be held as long-term investments at amortized cost.
Debt SecuritiesHeld-to-Maturity
We
classify our debt securities asheld-to-maturity,
as we have the intent and ability to hold these securities until maturity. We include our debt securities in other assets on our consolidated balance sheets at amortized cost.Current Expected Credit Losses Reserve
The current expected credit loss, or CECL, reserve required under Accounting Standard Update, or ASU, 2016-13 “Financial Instruments – Credit Losses – Measurement of Credit Losses
on Financial Instruments (Topic 326),” or ASU 2016-13, reflects our current estimate of potential credit losses related to our loans and debt securities included in our consolidated balance sheets. The initial CECL reserve recorded on January 1, 2020 is reflected as a direct charge to retained earnings on our consolidated statements of changes in equity; however subsequent changes to the CECL reserve are requiredrecognized through net income (loss) o
n our consolidated statements of operations. While ASU 2016-13 does not require any particular method for determining the CECL reserve, it does specify the reserve should be based on relevant information about past events, including historical loss experience, current portfolio and market conditions, and reasonable and supportable forecasts for the duration of each respective loan. In addition, other than a few narrow exceptions, ASU 2016-13 requires that all financial instruments subject to periodically evaluatethe CECL model have some amount of loss reserve to reflect the GAAP principal underlying the CECL model that all loans, debt securities, and similar assets have some inherent risk of loss, regardless of credit quality, subordinate capital, or other mitigating factors.
We estimate our CECL reserve primarily using the Weighted Average Remaining Maturity, or WARM method, which has been identified as an acceptable loss-rate method for estimating CECL reserves in the Financial Accounting Standards Board Staff Q&A Topic 326, No. 1. The WARM method requires us to reference historic loan loss data across a comparable data set and apply such loss rate to each of theseour loans over their expected remaining term, taking into consideration expected economic conditions over the relevant timeframe. We apply the WARM method for possible impairment. Impairmentthe majority of our loan portfolio, which loans share similar risk characteristics. In certain instances, for loans with unique risk characteristics, we may instead use a probability-weighted model that considers the likelihood of default and expected loss given default for each such individual loan.
Application of the WARM method to estimate a CECL reserve requires judgment, including (i) the appropriate historical loan loss reference data, (ii) the expected timing and amount of future loan fundings and repayments, and (iii) the current credit quality of our portfolio and our expectations of performance and market conditions over the relevant time period. To estimate the historic loan losses relevant to our portfolio, we have augmented our historical loan performance, which includes zero realized loan losses since the launch of our senior loan origination business in 2013, with market loan loss data licensed from Trepp LLC. This database includes commercial mortgage-backed securities, or CMBS, issued since January 1, 1999 through May 31, 2020. Within this database, we focused our historical loss reference calculations on the most relevant subset of available CMBS data, which we determined based on loan metrics that are most comparable to our loan portfolio including asset type, geography, andloan-to-value,
or LTV. We believe this CMBS data, which includes month-over-month loan and property performance, is
indicated when it is deemed probable that we will not be ablethe most relevant, available, and comparable dataset to
collect all amounts dueour portfolio. Our loans typically include commitments to us pursuantfund incremental proceeds to our borrowers over t
he life of the loan, which future funding commitments are also subject to the contractual termsCECL model. The CECL reserve related to future loan fundings is recorded as a component of Other Liabilities on our consolidated balance sheets. This CECL reserve is estimated using the same process outlined above for our outstanding loan balances, and changes in this component of the loan. If aCECL reserve will similarly impact our consolidated net income (loss).
For both the funded and unfunded portions of our loans, we consider our internal risk rating of each loan is determined to be impaired, we write downas the loan through a charge to the provision for loan losses. Impairmentprimary credit quality indicator underlying our assessment.
Table of these loans, which are collateral dependent, is measured by comparing the estimated fair value of the underlying collateral, less costs to sell, to the book value of the respective loan. These valuations require significant judgments, which include assumptions regarding capitalization rates, leasing, creditworthiness of major tenants, occupancy rates, availability of financing, exit plan, loan sponsorship, actions of other lenders, and other factors deemed necessary by our Manager. Actual losses, if any, could ultimately differ from these estimates.Contents
Blackstone Mortgage Trust, Inc.
Notes to Consolidated Financial Statements (continued)
The CECL reserve is measured on a collective basis wherever similar risk characteristics exist within a pool of similar assets. We have identified the following pools and measure the reserve for credit losses using the following methods:
| | | : WARM method that incorporates a subset of historical loss data, expected weighted-average remaining maturity of our loan pool, and an economic view. |
| | | : WARM method that incorporates a subset of historical loss data, expected weighted average remaining maturity of our loan pool, and an economic view. |
| | | : a probability of default and loss given default model, assessed on an individual basis. |
| | | : practical expedient applied forcollateral-dependent loans. The CECL reserve is assessed on an individual basis for these loans by comparing the estimated fair value of the underlying collateral, less costs to sell, to the book value of the respective loan. These valuations require significant judgments, which include assumptions regarding capitalization rates, discount rates, leasing, creditworthiness of major tenants, occupancy rates, availability and cost of financing, exit plan, loan sponsorship, actions of other lenders, and other factors deemed relevant by our Manager. Actual losses, if any, could ultimately differ from these estimates. |
We adopted ASU
2016-13
using the modified-retrospective method for all financial assets measured at amortized cost. Prior to our adoption, we had no loan loss provisions on our consolidated balance sheets. We recorded a cumulative-effective adjustment to the opening retained earnings in our consolidated statement of equity as of January 1, 2020.
The following table details the impact of this adoption ($ in thousands): | | | | |
| | | |
| | | | |
| | | | |
| | $ | | |
| | | | |
| | | | |
| | | | | |
| | $ | | |
| | | | | |
CECL reserve on held-to-maturity debt securities | | | | |
| | | | |
CECL reserve on unfunded loan commitments | | | | |
| | | | | |
Total impact of ASU 2016-13 adoption on retained earnings | | $ | | |
| | | | | |
Contractual Term and Unfunded Loan Commitments
Expected credit losses are estimated over the contractual term of each loan, adjusted for expected prepayments. As part of our quarterly review of our loan portfolio, we assess the expected repayment date of each loan, which is used to determine the contractual term for purposes of computing our CECL reserve.
Additionally, the expected credit losses over the contractual period of our loans are subject to the obligation to extend credit through our unfunded loan commitments. The CECL reserve for unfunded loan commitments is adjusted quarterly, as we consider the expected timing of future funding obligations over the estimated life of the loan. The considerations in estimating our CECL reserve for unfunded loan commitments are similar to those used for the related outstanding loan receivables.
Blackstone Mortgage Trust, Inc.
Notes to Consolidated Financial Statements (continued)
Our risk rating is our primary credit quality indicator in assessing our current expected credit loss reserve. Our Manager performs a quarterly
risk review of our portfolio of
loans. In conjunction with this review, our Manager assesses the risk factors ofloans, and assigns each loan
and assigns a risk rating based on a variety of factors, including, without limitation,
loan-to-value ratio, or LTV, debt yield, property type, geographic and local market dynamics, physical condition, cash flow volatility, leasing and tenant profile, loan structure and exit plan, and project sponsorship. Based on a
5-point
scale, our loans are rated
“1”“l” through “5,” from less risk to greater risk,
relative to our loan portfolio in the aggregate, which ratings are defined as follows:
| | | | |
| | | | |
| | | | |
| | | | |
| | | | |
| | 2 | | Low |
| | | | |
| | |
| | 3 - | | Medium Risk |
| | |
| | | | High Risk/Potential for Loss: A loan that has a risk of realizing a principal loss. |
| | | | |
| | |
| | | | A loan that has a very high risk of realizing a principal loss or has otherwise incurred a principal loss. |
During
Estimation of Economic Conditions
In addition to the
second quarterWARM method computations and probability-weighted models described above, our CECL reserve is also adjusted to reflect our estimation of
2015,the current and future economic conditions that impact the performance of the commercial real estate assets securing our loans. These estimations include unemployment rates, interest rates, and other macroeconomic factors impacting the likelihood and magnitude of potential credit losses for our loans during their anticipated term. In addition to the CMBS data we
acquired a portfoliohave licensed from Trepp LLC, we have also licensed certain macroeconomic financial forecasts to inform our view of
loans from General Electric Capital Corporation and certain of its affiliates, or the
GE portfolio, for a total purchase price of $4.7 billion. We allocated the aggregate purchase price between eachpotential future impact that broader economic conditions may have on our loan
portfolio’s performance. These estimations require significant judgments about future events that, while based on
its fair value relativethe information available to
the overall portfolio, which allocation resulted in purchase discounts or premiums determined on an asset-by-asset basis. Each loan accretes from its allocated purchase price to its expected collection value over the lifeus as of the
loan, consistent withbalance sheet date, are ultimately indeterminate and the
other loans inactual economic condition impacting our
portfolio.Equity Investment in Unconsolidated Subsidiary
Our carried interest in CT Opportunity Partners I, LP, or CTOPI, was accounted for usingportfolio could vary significantly from the equity method. CTOPI’s assets and liabilities were not consolidated into our financial statements due to our determination that (i) it was not a VIE and (ii) the other investors in CTOPI had sufficient rights to preclude consolidation by us. As such,estimates we reported our allocable percentage of the net assets of CTOPI on our consolidated balance sheets. The investment was fully realizedmade as of December 31, 2016 and we no longer have any equity investments in unconsolidated subsidiaries in our consolidated financial statements.
June 30, 2020
.
Derivative Financial Instruments
We classify all derivative financial instruments as either other assets or other liabilities on our consolidated balance sheets at fair value.
On the date we enter into a derivative contract, we designate each contract as (i) a hedge of a net investment in a foreign operation, or net investment hedge, (ii) a hedge of a forecasted transaction or of the variability of cash flows to be received or paid related to a recognized asset or liability, or cash flow hedge, (iii) a hedge of a recognized asset or liability, or fair value hedge, or (iv) a derivative instrument not to be designated as a hedging derivative, or non-designated hedge. For all derivatives other than those designated as non-designated hedges, we formally document our hedge relationships and designation at the contract’s inception. This documentation includes the identification of the hedging instruments and the hedged items, its risk management objectives, strategy for undertaking the hedge transaction and our evaluation of the effectiveness of its hedged transaction.
On a quarterly basis, we also formally assess whether the derivative we designated in each hedging relationship is expected to be, and has been, highly effective in offsetting changes in the value or cash flows of the hedged items. If it is determined that a derivative is not highly effective at hedging the designated exposure, hedge accounting is discontinued and the changes in fair value of the instrument are included in net income
(loss) prospectively.
ChangesEffective April 1, 2020, our net investment hedges are assessed using a method based on changes in spot exchange rates. Gains and losses, representing hedge components excluded from the assessment of effectiveness, are recognized in interest income on our consolidated statements of operations over the contractual term of our net investment hedges on a systematic and rational basis, as documented at hedge inception in accordance with our accounting policy election. All other changes in the fair value of our derivative instruments that qualify as hedges are reported as a component of accumulated other comprehensive income (loss) on our consolidated financial statements. Deferred gains and losses are reclassified out of accumulated other comprehensive income (loss) and into net income
(loss) in the same period or periods during which the hedged transaction affects earnings, and are presented in the same line item as the earnings effect of the hedged item. For cash flow hedges, this is typically when the periodic swap settlements are made, while for net investment hedges, this occurs when the hedged item is sold or substantially liquidated. To the extent a derivative does not qualify for hedge accounting and is deemed a non-designated hedge, the changes in its fair value are included in net income
(loss) concurrently.
Blackstone Mortgage Trust, Inc.
Notes to Consolidated Financial Statements (continued)
Where applicable, we record investments financed with
repurchasesecured debt agreements as separate assets and the related borrowings under any
repurchasesecured debt agreements are recorded as separate liabilities on our consolidated balance sheets. Interest income earned on the investments and interest expense incurred on the
repurchasesecured debt agreements are reported separately on our consolidated statements of operations.
Senior Loan Participations
In certain instances, we finance our loans through the non-recourse syndication of a senior loan interest to a third-party. Depending on the particular structure of the syndication, the senior loan interest may remain on our GAAP balance sheet or, in other cases, the sale will be recognized and the senior loan interest will no longer be included in our consolidated financial statements. When these sales are not recognized under GAAP we reflect the transaction by recording a loan participations sold liability on our consolidated balance sheet, however this gross presentation does not impact stockholders’ equity or net
income.income (loss). When the sales are recognized, our balance sheet only includes our remaining subordinate loan and not the non-consolidated senior interest we sold.
We record our secured term loans as liabilities on our consolidated balance sheets. Where applicable, any issue discount or transaction expenses are deferred and amortized through the maturity date of the secured term loans as additionalnon-cash
interest expense. The “Debt with Conversion and Other Options” Topic of the Financial Accounting Standards Board, or FASB, Accounting Standards Codification, or ASC, requires the liability and equity components of convertible debt instruments that may be settled in cash upon conversion, including partial cash settlement, to be separately accounted for in a manner that reflects the issuer’s nonconvertible debt borrowing rate. The initial proceeds from the sale of convertible notes are allocated between a liability component and an equity component in a manner that reflects interest expense at the rate of similar nonconvertible debt that could have been issued at such time. The equity component represents the excess initial proceeds received over the fair value of the liability component of the notes as of the date of issuance. We measured the estimated fair value of the debt component of our convertible notes as of the respective issuance dates based on our nonconvertible debt borrowing rate. The equity component of each series of our convertible notes is reflected within additional
paid-in
capital on our consolidated balance sheet, and the resulting
debtissue discount is amortized over the period during which such convertible notes are expected to be outstanding (through the maturity date) as additional
non-cash
interest expense. The additional
non-cash
interest expense attributable to such convertible notes will increase in subsequent periods through the maturity date as the notes accrete to their par value over the same period.
The deferred financing costs that are included as a reduction in the net book value of the related liability on our consolidated balance sheets include issuance and other costs related to our debt obligations. These costs are amortized as interest expense using the effective interest method over the life of the related obligations.
Fair Value of Financial Instruments
The “Fair Value Measurements and Disclosures” Topic
of the FASB, or ASC 820, defines fair value, establishes a framework for measuring fair value, and requires certain disclosures about fair value measurements under GAAP. Specifically, this guidance defines fair value based on exit price, or the price that would be received upon the sale of an asset or the transfer of a liability in an orderly transaction between market participants at the measurement date.
ASC 820 also establishes a fair value hierarchy that prioritizes and ranks the level of market price observability used in measuring financial instruments. Market price observability is affected by a number of factors, including the type of financial instrument, the characteristics specific to the financial instrument, and the state of the marketplace, including the existence and transparency of transactions between market participants. Financial instruments with readily available quoted prices in active markets generally will have a higher degree of market price observability and a lesser degree of judgment used in measuring fair value.
Blackstone Mortgage Trust, Inc.
Notes to Consolidated Financial Statements (continued)
Financial instruments measured and reported at fair value are classified and disclosed based on the observability of inputs used in the determination, as follows:
Level 1: Generally includes only unadjusted quoted prices that are available in active markets for identical financial instruments as of the reporting date.
| | | Level 1: Generally includes only unadjusted quoted prices that are available in active markets for identical financial instruments as of the reporting date. |
Blackstone Mortgage Trust, Inc.
Notes to Consolidated Financial Statements (continued)
(Unaudited)
Level 2: Pricing inputs include quoted prices in active markets for similar instruments, quoted prices in less active or inactive markets for identical or similar instruments where multiple price quotes can be obtained, and other observable inputs, such as interest rates, yield curves, credit risks, and default rates.
Level 3: Pricing inputs are unobservable for the financial instruments and include situations where there is little, if any, market activity for the financial instrument. These inputs require significant judgment or estimation by management of third-parties when determining fair value and generally represent anything that does not meet the criteria of Levels 1 and 2.
| | | Level 2: Pricing inputs include quoted prices in active markets for similar instruments, quoted prices in less active or inactive markets for identical or similar instruments where multiple price quotes can be obtained, and other observable inputs, such as interest rates, yield curves, credit risks, and default rates. |
| | | Level 3: Pricing inputs are unobservable for the financial instruments and include situations where there is little, if any, market activity for the financial instrument. These inputs require significant judgment or estimation by management of third-parties when determining fair value and generally represent anything that does not meet the criteria of Levels 1 and 2. |
The estimated value of each asset reported at fair value using Level 3 inputs is determined by an internal committee composed of members of senior management of our Manager, including our Chief Executive Officer, Chief Financial Officer, and other senior officers.
Certain of our other assets are reported at fair value
, as of quarter-end, either (i) on a recurring basis as of each quarter-end, or (ii) on a nonrecurring basis, as a result of impairment or other events. Our assets that are recorded at fair value are discussed further in Note 15.14
. We generally value our assets recorded at fair value by either (i) discounting expected cash flows based on assumptions regarding the collection of principal and interest and estimated market rates, or (ii) obtaining assessments from third-party dealers. For collateral-dependent loans that are identified as impaired, we measure impairment by comparing our Manager’s estimation of the fair value of the underlying collateral, less costs to sell, to the book value of the respective loan. These valuations
may require significant judgments, which include assumptions regarding capitalization rates,
discount rates, leasing, creditworthiness of major tenants, occupancy rates, availability
and cost of financing, exit plan, loan sponsorship, actions of other lenders, and other factors deemed
necessaryrelevant by our
Manager.Mana
During the three months ended June 30, 2020, we recorded an aggregate $69.7 million CECL reserve specifically related to two of our loans receivable with an aggregate outstanding principal balance of $334.2 million.
The CECL reserve was recorded based on our
Manager’s e
sti
mation of the fair value of the loan’s underlying collateral as of June 30, 2020. These loans receivable are therefore measured at fair value on a nonrecurring basis using significant unobservable inputs, and are classified as Level 3 assets in the fair value hierarchy.
The significant unobservable
inputs used to estimate the fair value of these loans receivable include the exit c
apitalization rate assumption used to
forecast the future sa
le price of the underlying real estate collateral, which ranged from 4.25% to 4.80%.
We are also required by GAAP to disclose fair value information about financial instruments,
thatwhich are not otherwise reported at fair value in our consolidated balance sheet, to the extent it is practicable to estimate a fair value for those instruments. These disclosure requirements exclude certain financial instruments and all
non-financial
instruments.
The following methods and assumptions are used to estimate the fair value of each class of financial instruments, for which it is practicable to estimate that value:
| | | Cash and cash equivalents: The carrying amount of cash and cash equivalents approximates fair value. |
| | | Loans receivable, net: The fair values of these loans were estimated by our Manager based on a discounted cash flow methodology, taking into consideration various factors including capitalization rates, discount rates, leasing, creditworthiness of major tenants, occupancy rates, availability and cost of financing, exit plan, loan sponsorship, actions of other lenders, and other factors deemed relevant by our Manager. |
| | | Debt securities held-to-maturity: The fair value of these instruments was estimated by utilizing third-party pricing service providers assuming the securities are not sold prior to maturity. In determining the value of a particular investment, pricing service providers may use broker-dealer quotations, reported trades, or valuation estimates from their internal pricing models to determine the reported price. |
Restricted cash: The carrying amount of restricted cash approximates fair value.
Loans receivable, net: The fair values of these loans were estimated by our Manager based on a discounted cash flow methodology, taking into consideration various factors including capitalization rates, discount rates, leasing, occupancy rates, availability and cost of financing, exit plan, sponsorship, actions of other lenders, and indications of market value from other market participants.
Derivative financial instruments: The fair value of our foreign currency and interest rate contracts was estimated using advice from a third-party derivative specialist, based on contractual cash flows and observable inputs comprising foreign currency rates and credit spreads.
Secured debt agreements, net: The fair value of these instruments was estimated based on the rate at which a similar credit facility would currently be priced.
Loan participations sold, net: The fair value of these instruments was estimated based on the value of the related loan receivable asset.
Securitized debt obligations, net: The fair value of these instruments was estimated by utilizing third-party pricing service providers. In determining the value of a particular investment, pricing service providers may use broker-dealer quotations, reported trades, or valuation estimates from their internal pricing models to determine the reported price.
Convertible notes, net: Each series of the convertible notes is actively traded and their fair values were obtained using quoted market prices.
Blackstone Mortgage Trust, Inc.
Notes to Consolidated Financial Statements (continued)
| | | Derivative financial instruments: The fair value of our foreign currency and interest rate contracts was estimated using advice from a third-party derivative specialist, based on contractual cash flows and observable inputs comprising foreign currency rates and credit spreads. |
| | | Secured debt agreements, net: The fair value of these instruments was estimated based on the rate at which a similar credit facility would currently be priced. |
| | | Securitized debt obligations, net: The fair value of these instruments was estimated by utilizing third-party pricing service providers. In determining the value of a particular investment, pricing service providers may use broker-dealer quotations, reported trades, or valuation estimates from their internal pricing models to determine the reported price. |
| | | Secured term loans, net: The fair value of these instruments was estimated by utilizing third-party pricing service providers. In determining the value of a particular investment, pricing service providers may use broker-dealer quotations, reported trades, or valuation estimates from their internal pricing models to determine the reported price. |
| | | Convertible notes, net: Each series of the convertible notes is actively traded and their fair values were obtained using quoted market prices. |
Our financial results generally do not reflect provisions for current or deferred income taxes on our REIT taxable income. We believe that we operate in a manner that will continue to allow us to be taxed as a REIT and, as a result, we generally do not expect to pay substantial corporate level taxes other than those payable by our taxable REIT subsidiaries. If we were to fail to meet these requirements, we may be subject to federal, state, and local income tax on current and past income, and penalties. Refer to Note
1312 for additional information.
Our stock-based compensation consists of awards issued to our Manager and certain individuals employed by an affiliate of our Manager that vest over the life of the awards, as well as deferred stock units issued to certain members of our
Boardboard of
Directors.directors. Stock-based compensation expense is recognized for these awards in net income
(loss) on a variable basis over the applicable vesting period of the awards, based on the value of our class A common stock. Refer to Note
1413 for additional information.
Basic earnings per share, or Basic EPS, is computed in accordance with the
two-class
method and is based on the net earnings allocable to our class A common stock, including restricted class A common stock and deferred stock units, divided by the weighted-average number of shares of our class A common stock, including restricted class A common stock and deferred stock units outstanding during the period. Our restricted class A common stock is considered a participating security, as defined by GAAP, and has been included in our Basic EPS under the
two-class
method as these restricted shares have the same rights as our other shares of class A common stock, including participating in any gains or losses.
Diluted earnings per share, or Diluted EPS, is determined using the treasury stock method, and is based on the net earnings allocable to our class A common stock, including restricted class A common stock and deferred stock units, divided by the weighted-average number of shares of our class A common stock, including restricted class A common stock and deferred stock units. Refer to Note
1110 for additional discussion of earnings per share.
In the normal course of business, we enter into transactions not denominated in United States, or U.S., dollars. Foreign exchange gains and losses arising on such transactions are recorded as a gain or loss in our consolidated statements of operations. In addition, we consolidate entities that have a
non-U.S.
dollar functional currency.
Non-U.S.
dollar denominated assets and liabilities are translated to U.S. dollars at the exchange rate prevailing at the reporting date and income, expenses, gains, and losses are translated at the average exchange rate over the applicable period. Cumulative translation adjustments arising from the translation of
non-U.S.
dollar denominated subsidiaries are recorded in other comprehensive income (loss).
Blackstone Mortgage Trust, Inc.
Notes to Consolidated Financial Statements (continued)
Underwriting Commissions and Offering Costs
Underwriting commissions and offering costs incurred in connection with common stock offerings are reflected as a reduction of additional
paid-in
capital. Costs incurred that are not directly associated with the completion of a common stock offering are expensed when incurred.
Recent Accounting Pronouncements
In August 2017, the FASB issued ASU 2017-12 “Derivatives and Hedging Topic 815: Targeted Improvements to Accounting for Hedging Activities,” or ASU 2017-12. ASU 2017-12 is intended to better align an entity’s financial reporting for hedging activities with the economic objectives of those activities. Upon adoption of ASU 2017-12, the cumulative ineffectiveness that has previously been recognized on existing cash flow and net investment hedges will be adjusted and removed from beginning retained earnings and placed in accumulated other comprehensive income (loss). We adopted ASU 2017-12 in the third quarter of 2017, which did not have an impact on our financial statements as we had not previously recognized any hedge ineffectiveness related to our existing cash flow and net investment hedges. In future periods, for hedges that are deemed effective, we will no longer need to bifurcate hedges into an effective and ineffective portion, and all gains or losses on effective hedges will be recognized in other comprehensive income (loss).
Blackstone Mortgage Trust, Inc.
Notes to Consolidated Financial Statements (continued)
(Unaudited)
In November 2016, the FASB issued ASU 2016-18 “Statement of Cash Flows (Topic 230): Restricted Cash,” or ASU 2016-18. ASU 2016-18 is intended to clarify how entities present restricted cash in the statement of cash flows. The guidance requires entities to show the changes in the total of cash and cash equivalents and restricted cash in the statement of cash flows. As a result, entities will no longer present transfers between cash and cash equivalents and restricted cash in the statement of cash flows. We adopted ASU 2016-18 in the second quarter of 2017 and applied the guidance retrospectively to our prior period consolidated statement of cash flows.
In June 2016, the FASB issued ASU
2016-13 “Financial
“Financial Instruments – Credit Losses – Measurement of Credit Losses on Financial Instruments (Topic 326),” or ASU
2016-13.
ASU
2016-13
significantly changes how entities
will measure credit losses for most financial assets and certain other instruments that are not measured at fair value through net
income.income. ASU
2016-13 will replace
replaced the
“incurred loss”incurred loss model under
existingprevious guidance with
an “expected loss”a CECL model for instruments measured at amortized cost, and
requirerequires entities to record
allowancesreserves for
available-for-sale
debt securities rather than reduce the carrying amount, as they
do todaydid previously under the other-than-temporary impairment model. It also
simplifiessimplified the accounting model for purchased credit-impaired debt securities and loans.
We adopted ASU
2016-13 is effective for fiscal years beginning after December 15, 2019
on January 1, 2020, and
is to be adopted throughrecorded a
$17.7 million cumulative-effect adjustment to retained
earnings as of the beginning of the first reporting period in which the guidance is effective. While we are currently evaluating the impact ASU 2016-13 will have on our consolidated financial statements, we expect that the adoption will result in an increased amount of provisions for potential loan losses as well as the recognition of such provisions earlier in the lending cycle. We currently do not have any provision for loan losses on our consolidated financial statements.earnings.
In
May 2014,March 2020, the FASB issued ASU
2014-09, “Revenue from Contracts with Customers2020-04
“Reference Rate Reform (Topic
606),848): Facilitation of the Effects of Reference Rate Reform on Financial Reporting,” or ASU
2014-09. 2020-04.
ASU
2014-09 broadly amends2020-04
provides optional expedients and exceptions to GAAP requirements for modifications on debt instruments, leases, derivatives, and other contracts, related to the
expected market transition from LIBOR, and certain other floating rate benchmark indices, or collectively, IBORs, to alternative reference rates. ASU2020-04
generally considers contract modifications related to reference rate reform to be an event that does not require contract remeasurement at the modification date nor a reassessment of a previous accounting
determination. The guidance
in ASU2020-04
is optional and may be elected over time, through December 31, 2022, as reference rate reform activities occur. Once ASU2020-04
is elected, the guidance must be applied prospectively for
revenue recognition. ASU 2014-09 is effective forall eligible contract modifications. In the first
interim or annual period beginning after December 15, 2017,quarter of 2020, we have elected to apply the hedge accounting expedients, related to probability and
isthe assessments of effectiveness, for future IBOR-indexed cash flows, to
be applied retrospectively. We do not anticipateassume that the
adoptionindex upon which future hedged transactions will be based matches the index on the corresponding derivatives. Application of
ASU 2014-09 will have a materialthese expedients preserves the presentation of derivatives consistent with our past presentation. We continue to evaluate the impact
on our consolidated financial statements.of ASU
2020-04
and may apply other elections, as applicable, as the expected market transition from IBORs to alternative reference rates continues to develop.
Blackstone Mortgage Trust, Inc.
Notes to Consolidated Financial Statements (continued)
The following table details overall statistics for our loans receivable portfolio ($ in thousands):
| | | | | | | | |
| | | September 30, 2017 | | | December 31, 2016 | |
Number of loans | | | 111 | | | | 107 | |
Principal balance | | $ | 9,681,055 | | | $ | 8,727,218 | |
Net book value | | $ | 9,637,152 | | | $ | 8,692,978 | |
Unfunded loan commitments(1) | | $ | 1,622,216 | | | $ | 882,472 | |
Weighted-average cash coupon(2) | | | 5.30 | % | | | 5.01 | % |
Weighted-average all-in yield(2) | | | 5.68 | % | | | 5.36 | % |
Weighted-average maximum maturity (years)(3) | | | 3.4 | | | | 3.2 | |
| |
| | | | | | | | |
| | | | | | |
| | | | | | | | |
| | $ | | | | $ | | |
| | $ | | | | $ | | |
Unfunded loan commitments (1) | | $ | | | | $ | | |
Weighted-average cash coupon (2) | | | | % | | | | % |
Weighted-average all-in yield (2) | | | | % | | | | % |
Weighted-average maximum maturity (years) (3) | | | | | | | | |
| | | | | | | | |
| | | | | | |
| | Unfunded commitments will primarily be funded to finance propertyour borrowers’ construction or development of real estate-related assets, capital improvements of existing assets, or lease-related expenditures by the borrowers.expenditures. These future commitments will generally be funded over the term of each loan, subject in certain cases to an expiration date. |
| | The weighted-average cash coupon andall-in yield are expressed as a spread over the relevant floating benchmark rates, which include USD LIBOR, GBP LIBOR, EURIBOR, BBSY, and CDOR, as applicable to each loan. As of SeptemberJune 30, 2017,2020, 99% of our floating rate loans were indexed to various benchmark rates, with 91% of floating rate loans by principal balance earned a floating rate of interest, primarily indexed to USD LIBOR. In addition, $273.9 millionLIBOR, and $12.6 billion of our floating ratesuch loans earned interest based on floors that are above the applicable index, with an average floorindex. The other 1% of 1.24%,our loans earned a fixed rate of interest. We reflect our fixed rate loans as a spread over the relevant floating benchmark rates, as of SeptemberJune 30, 2017.2020 and December 31, 2019, respectively, for purposes of the weighted-averages. As of December 31, 2016,2019, 99% of our loans by total loan exposure earned a floating rate loans were indexed to various benchmark rates, with 84% of floating rate loansinterest, primarily indexed to USD LIBOR. In addition, $216.3 millionLIBOR, and $6.1 billion of our floating ratesuch loans earned interest based on floors that are above the applicable index, with an average floor of 1.27%, as of December 31, 2016.index. In addition to cash coupon, all-in yield includes the amortization of deferred origination and extension fees, loan origination costs, and purchase discounts, andas well as the accrual of exit fees. Cash coupon and all-in yield assume applicable floating benchmark rates for weighted-average calculation. |
| | Maximum maturity assumes all extension options are exercised by the borrower, however our loans may be repaid prior to such date. As of SeptemberJune 30, 2017, 72%2020, 51% of our loans by principal balance were subject to yield maintenance or other prepayment restrictions and 28%49% were open to repayment by the borrower without penalty. As of December 31, 2016, 64%2019, 61% of our loans by principal balance were subject to yield maintenance or other prepayment restrictions and 36%39% were open to repayment by the borrower without penalty. |
Activity relating to our loans receivable portfolio was as follows ($ in thousands):
| | | | | | | | | | | | |
| | | Principal
Balance | | | Deferred Fees /
Other Items(1) | | | Net Book
Value | |
December 31, 2016 | | $ | 8,727,218 | | | $ | (34,240) | | | $ | 8,692,978 | |
Loan fundings | | | 2,789,341 | | | | — | | | | 2,789,341 | |
Loan repayments | | | (1,970,743 | ) | | | — | | | | (1,970,743 | ) |
Unrealized gain (loss) on foreign currency translation | | | 135,239 | | | | (116 | ) | | | 135,123 | |
Deferred fees and other items | | | — | | | | (38,434 | ) | | | (38,434 | ) |
Amortization of fees and other items | | | — | | | | 28,887 | | | | 28,887 | |
| | | | | | | | | | | | |
September 30, 2017 | | $ | 9,681,055 | | | $ | (43,903 | ) | | $ | 9,637,152 | |
| | | | | | | | | | | | |
| |
| | | | | | | | | | | | |
| | | | | Deferred Fees / Other Items (1) | | | | |
Loans Receivable, as of December 31, 2019 | | $ | | | | $ | | ) | | $ | | |
| | | | | | | | | | | | |
| | | | ) | | | | | | | | ) |
Unrealized (loss) gain on foreign currency translation | | | | ) | | | | | | | | ) |
Deferred fees and other items | | | | | | | | ) | | | | ) |
Amortization of fees and other items | | | | | | | | | | | | |
| | | | | | | | | | | | | |
Loans Receivable, as of June 30, 2020 | | $ | | | | $ | | ) | | $ | | |
| | | | | | | | | | | | | |
| | | | | | | | | | | | ) |
| | | | | | | | | | | | | |
Loans Receivable, net, as of June 30, 2020 | | | | | | | | | | $ | | |
| | | | | | | | | | | | | |
| | | | | | | | | | | | |
| | | | | | | | | | |
| | Other items primarily consist of purchase discounts or premiums, exit fees, and deferred origination expenses. | |
Blackstone Mortgage Trust, Inc.
Notes to Consolidated Financial Statements (continued)
The tables below detail the property type and geographic distribution of the properties securing the loans in our portfolio ($ in thousands):
| | | | | | | | | | | | |
September 30, 2017 |
Property Type | | Number of
Loans | | Net Book
Value | | | Total Loan
Exposure(1) | | | Percentage of
Portfolio |
Office | | 55 | | $ | 5,781,675 | | | $ | 5,814,214 | | | 54% |
Hotel | | 14 | | | 1,713,162 | | | | 1,784,893 | | | 17 |
Retail | | 7 | | | 539,752 | | | | 982,270 | | | 9 |
Multifamily | | 17 | | | 762,969 | | | | 767,875 | | | 7 |
Condominium | | 2 | | | 129,421 | | | | 273,112 | | | 3 |
Manufactured housing | | 7 | | | 232,148 | | | | 231,856 | | | 2 |
Other | | 9 | | | 478,025 | | | | 814,457 | | | 8 |
| | | | | | | | | | | | |
| | 111 | | $ | 9,637,152 | | | $ | 10,668,677 | | | 100% |
| | | | | | | | | | | | |
| | | | |
Geographic Location | | Number of
Loans | | Net Book
Value | | | Total Loan
Exposure(1) | | | Percentage of
Portfolio |
United States | | | | | | | | | | | | |
Northeast | | 26 | | $ | 2,680,546 | | | $ | 2,694,018 | | | 25% |
West | | 28 | | | 2,470,097 | | | | 2,629,456 | | | 24 |
Southeast | | 21 | | | 1,964,534 | | | | 2,414,994 | | | 23 |
Midwest | | 8 | | | 890,546 | | | | 894,564 | | | 8 |
Southwest | | 8 | | | 291,792 | | | | 290,393 | | | 3 |
Northwest | | 2 | | | 249,118 | | | | 251,422 | | | 2 |
| | | | | | | | | | | | |
Subtotal | | 93 | | | 8,546,633 | | | | 9,174,847 | | | 85 |
International | | | | | | | | | | | | |
United Kingdom | | 7 | | | 486,794 | | | | 838,763 | | | 8 |
Canada | | 7 | | | 462,832 | | | | 458,619 | | | 4 |
Belgium | | 1 | | | 72,544 | | | | 73,247 | | | 1 |
Germany | | 1 | | | 12,114 | | | | 66,810 | | | 1 |
Netherlands | | 2 | | | 56,235 | | | | 56,391 | | | 1 |
| | | | | | | | | | | | |
Subtotal | | 18 | | | 1,090,519 | | | | 1,493,830 | | | 15 |
| | | | | | | | | | | | |
Total | | 111 | | $ | 9,637,152 | | | $ | 10,668,677 | | | 100% |
| | | | | | | | | | | | |
|
| | | | | | |
| | In certain instances, we finance our loans through the non-recourse sale of a senior loan interest that is not included in our consolidated financial statements. See Note 2 for further discussion. Total loan exposure encompasses the entire loan we originated and financed, including $987.6$739.6 million of such non-consolidated senior interests as of SeptemberJune 30, 2017.2020. |
| | Excludes investment exposure to the $857.3 million 2018 Single Asset Securitization. See Note 4 for details of the subordinate we own in the 2018 Single Asset Securitization. |
Blackstone Mortgage Trust, Inc.
Notes to Consolidated Financial Statements (continued)
(Unaudited)
| | | | | | | | | | | | | | |
December 31, 2016 | |
Property Type | | Number of
Loans | | Net Book
Value | | | Total Loan
Exposure(1) | | | Percentage of
Portfolio | |
Office | | 55 | | $ | 4,800,609 | | | $ | 4,889,456 | | | | 50% | |
Hotel | | 18 | | | 1,889,732 | | | | 1,957,334 | | | | 20 | |
Retail | | 9 | | | 769,813 | | | | 1,173,592 | | | | 12 | |
Multifamily | | 8 | | | 521,097 | | | | 523,529 | | | | 5 | |
Manufactured housing | | 9 | | | 296,290 | | | | 296,252 | | | | 3 | |
Condominium | | 2 | | | 66,070 | | | | 258,360 | | | | 3 | |
Other | | 6 | | | 349,367 | | | | 658,211 | | | | 7 | |
| | | | | | | | | | | | | | |
| | 107 | | $ | 8,692,978 | | | $ | 9,756,734 | | | | 100% | |
| | | | | | | | | | | | | | |
| | | | |
Geographic Location | | Number of
Loans | | Net Book
Value | | | Total Loan
Exposure(1) | | | Percentage of
Portfolio | |
United States | | | | | | | | | | | | | | |
Northeast | | 26 | | $ | 2,548,257 | | | $ | 2,562,149 | | | | 26% | |
Southeast | | 21 | | | 1,492,530 | | | | 1,899,748 | | | | 19 | |
West | | 22 | | | 1,628,811 | | | | 1,828,667 | | | | 19 | |
Midwest | | 7 | | | 695,713 | | | | 698,093 | | | | 7 | |
Southwest | | 8 | | | 380,639 | | | | 379,766 | | | | 4 | |
Northwest | | 3 | | | 227,747 | | | | 293,564 | | | | 3 | |
| | | | | | | | | | | | | | |
Subtotal | | 87 | | | 6,973,697 | | | | 7,661,987 | | | | 78 | |
International | | | | | | | | | | | | | | |
United Kingdom | | 9 | | | 977,136 | | | | 1,305,816 | | | | 13 | |
Canada | | 8 | | | 487,835 | | | | 483,923 | | | | 5 | |
Germany | | 1 | | | 204,241 | | | | 254,644 | | | | 3 | |
Netherlands | | 2 | | | 50,069 | | | | 50,364 | | | | 1 | |
| | | | | | | | | | | | | | |
Subtotal | | 20 | | | 1,719,281 | | | | 2,094,747 | | | | 22 | |
| | | | | | | | | | | | | | |
Total | | 107 | | $ | 8,692,978 | | | $ | 9,756,734 | | | | 100% | |
| | | | | | | | | | | | | | |
| |
| | | | | | | | | | |
| | In certain instances, we finance our loans through the non-recourse sale of a senior loan interest that is not included in our consolidated financial statements. See Note 2 for further discussion. Total loan exposure encompasses the entire loan we originated and financed, including $1.0 billion$688.5 million of such non-consolidated senior interests as of December 31, 2016.2019. | |
| | Excludes investment exposure to the $930.0 million 2018 Single Asset Securitization. See Note 4 for details of the subordinate position we own in the 2018 Single Asset Securitization. | |
As further described in Note 2, our Manager evaluates our loan portfolio on a quarterly basis. In conjunction with our quarterly loan portfolio review, our Manager assesses the risk factors of each loan, and assigns a risk rating based on several factors. Factors considered in the assessment include, but are not limited to, risk of loss, current LTV, debt yield, collateral performance, structure, exit plan, and sponsorship. Loans are rated “1” (less risk) through “5” (greater risk), which ratings are defined in Note 2.
Blackstone Mortgage Trust, Inc.
Notes to Consolidated Financial Statements (continued)
The following table allocates the principal balance and net book value of our loans receivable based on our internal risk ratings ($ in thousands):
| | | | | | | | | | | | | | | | | | | | | | | | | | | | |
| September 30, 2017 | | | | | December 31, 2016 | |
Risk Rating | | | Number of Loans | | Net Book Value | | | Total Loan Exposure(1) | | | | | Risk Rating | | | Number of Loans | | Net Book Value | | | Total Loan Exposure(1) | |
| | 1 | | | 4 | | $ | 421,313 | | | $ | 421,628 | | | | | | 1 | | | 8 | | $ | 361,100 | | | $ | 361,574 | |
| | 2 | | | 49 | | | 3,701,801 | | | | 3,708,603 | | | | | | 2 | | | 52 | | | 4,011,992 | | | | 4,083,678 | |
| | 3 | | | 57 | | | 5,493,409 | | | | 6,517,829 | | | | | | 3 | | | 46 | | | 4,299,026 | | | | 5,290,668 | |
| | 4 | | | 1 | | | 20,629 | | | | 20,617 | | | | | | 4 | | | 1 | | | 20,860 | | | | 20,814 | |
| | 5 | | | — | | | — | | | | — | | | | | | 5 | | | — | | | — | | | | — | |
| | | | | | | | | | | | | | | | | | | | | | | | | | | | |
| | | | 111 | | $ | 9,637,152 | | | $ | 10,668,677 | | | | | | | | | 107 | | $ | 8,692,978 | | | $ | 9,756,734 | |
| | | | | | | | | | | | | | | | | | | | | | | | | | | | |
| | | | | | | | | | | | | | | | | | | | | | | | | | | | |
| | | | | | | | | |
| | | | | | | | Total Loan Exposure (1)(2) | | | | | | | | | | | | Total Loan Exposure (1)(2) | |
| | | | | | $ | | | | $ | | | | | | | | | | | | $ | | | | $ | | |
| | | | | | | | | | | | | | | | | | | | | | | | | | | | |
| | | | | | | | | | | | | | | | | | | | | | | | | | | | |
| | | | | | | | | | | | | | | | | | | | | | | | | | | | |
| | | | | | | | | | | | | | | | | | | | | | | | | | | | |
| | | | | | | | | | | | | | | | | | | | | | | | | | | | | |
| | | | | | $ | | | | $ | | | | | | | | | | | | $ | | | | $ | | |
| | | | | | | | | | | | | | | | | | | | | | | | | | | | | |
| | | | | | | | ) | | | | | | | | | | | | | | | | | | | | |
| | | | | | | | | | | | | | | | | | | | | | | | | | | | | |
| | | | | | $ | | | | | | | | | | | | | | | | $ | | | | | | |
| | | | | | | | | | | | | | | | | | | | | | | | | | | | | |
| (1) | | In certain instances, we finance our loans through the non-recourse sale of a senior loan interest that is not included in our consolidated financial statements. See Note 2 for further discussion. Total loan exposure encompasses the entire loan we originated and financed, including $987.6$739.6 million and $1.0 billion$688.5 million of suchnon-consolidated senior interests as of SeptemberJune 30, 20172020 and December 31, 2016,2019, respectively. |
| (2) | | Excludes investment exposure to the 2018 Single Asset Securitization of $857.3 million and $930.0 million as of June 30, 2020 and December 31, 2019, respectively. See Note 4 for details of the subordinatewe own in the 2018 Single Asset Securitization. |
The weighted-average risk rating of our total loan exposure was 2.6
3.0 and
2.5 2.8as of SeptemberJune 30, 20172020 and December 31, 2016,2019, respectively. The increase in weighted-averagethe risk rating was primarily driven by repaymentsthe result of loans with loweran aggregate principal balance of $3.1 billion that were downgraded to a
“4”or
“5”as of June 30, 2020 to reflect the higher risk in loans collateralized by hospitality assets and select other assets that are particularly negatively impacted by the COVID-19 pandemic.
Blackstone Mortgage Trust, Inc.
Notes to Consolidated Financial Statements (continued)
Current Expected Credit Loss Reserve
The CECL reserve required under GAAP reflects our current estimate of potential credit losses related to the loans and debt securities included in our consolidated balance sheets. Refer to Note 2 for further discussion of our CECL reserve. The following table presents the activity in our loans receivable CECL reserve by investment pool for thethree and
six months ended June 30, 2020 ($ in thousands): | | | | | | | | | | | | | | | | | | | | |
| | | | | | | | | | | | | | | |
| | | | | | | | | | | | | | | | | | | | |
CECL reserve as of December 31, 2019 | | $ | | | | $ | | | | $ | | | | $ | | | | $ | | |
Initial CECL reserve on January 1, 2020 | | | | | | | | | | | | | | | | | | | | |
| | | | | | | | | | | | | | | | | | | | |
| | | | | | | | | | | | | | | | | | | | | |
CECL reserve as of June 30, 2020 | | $ | | | | $ | | | | $ | | | | $ | | | | $ | | |
| | | | | | | | | | | | | | | | | | | | | |
CECL reserve as of March 31, 2020 | | $ | | | | $ | | | | $ | | | | $ | | | | $ | | |
(Decrease) increase in CECL reserve | | | | ) | | | | ) | | | | | | | | | | | | |
| | | | | | | | | | | | | | | | | | | | | |
CECL reserve as of June 30, 2020 | | $ | | | | $ | | | | $ | | | | $ | | | | $ | | |
| | | | | | | | | | | | | | | | | | | | | |
Our initial CECL reserve against our loans receivable portfolio of $13.9 million recorded on January 1, 2020 is reflected as a direct charge to retained earnings on our consolidated statements of changes in equity; however subsequent changes to the CECL reserve are recognized through net income (loss)
on our consolidated statements of operations. During the three and six months ended June 30, 2020, we recorded an increase of $65.4 million and $164.1 million, respectively, in the current expected credit loss reserve against our loans receivable portfolio, bringing our total CECL reserve to $178.1 million as of June 30, 2020. This CECL reserve reflects the macroeconomic impact of theCOVID-19
pandemic on commercial real estate markets generally, as well as certain loans assessed for impairment in our portfolio. See Note 2 for further discussion ofCOVID-19.
During the first quarter of 2020, we entered into a loan modification related to a multifamily asset in New York City,
which is classified as a troubled debt restructuring under GAAP. This modification included, among other changes, an additional borrower contribution of capital, a reduction in loan spread, and an extension of the loan’s maturity date to November 9, 2020. As of June 30, 2020, we recorded a $14.8 million CECL reserve on this loan, which had an outstanding principal balance of
$52.8 million as of June 30, 2020. The CECL reserve was recorded based on our Manager’s estimation of the fair value of the loan’s underlying collateral as of June 30, 2020, and to reflect ongoing loan modification discussions. As of June 30, 2020, the borrower was current with all terms of the loan, including payments of interest.
As of June 30, 2020, we recorded a
$54.9
million CECL reserve on a loanwith an outstanding principal balance of $281.4
million as of June 30, 2020. The CECL reserve was recorded based on our Manager’s estimation of the fair value of the loan’s underlying collateral as of June 30, 2020, and to reflect ongoing loan modification discussions. As of June 30, 2020, the borrower was current with all terms of the loan, including payments of interest.
Blackstone Mortgage Trust, Inc.
Notes to Consolidated Financial Statements (continued)
Our primary credit quality indicator is our risk ratings,
and not rating downgrades inwhich are further discussed above. The following table presents the
existing portfolio.We did not have any impaired loans, nonaccrual loans, or loans in maturity defaultnet book value of our loan portfolio as of SeptemberJune 30, 2017 or December 31, 2016.
2020 by year of origination, investment pool, and risk rating ($ in thousands):
| | | | | | | | | | | | | | | | | | | | | | | | | | | | |
| | Net Book Value of Loans Receivable by Year of Origination (1)(2) | |
| | | |
| | | | | | | | | | | | | | | | | | | | | |
| | | | | | | | | | | | | | | | | | | | | | | | | | | | |
| | $ | | | | $ | | | | $ | | | | $ | | | | $ | | | | $ | | | | $ | | |
| | | | | | | | | | | | | | | | | | | | | | | | | | | | |
| | | | | | | | | | | | | | | | | | | | | | | | | | | | |
| | | | | | | | | | | | | | | | | | | | | | | | | | | | |
| | | | | | | | | | | | | | | | | | | | | | | | | | | | |
| | | | | | | | | | | | | | | | | | | | | | | | | | | | | |
| | $ | | | | $ | | | | $ | | | | $ | | | | $ | | | | $ | | | | $ | | |
| | | | | | | | | | | | | | | | | | | | | | | | | | | | | |
| | | | | | | | | | | | | | | | | | | | | | | | | | | | |
| | $ | | | | $ | | | | $ | | | | $ | | | | $ | | | | $ | | | | $ | | |
| | | | | | | | | | | | | | | | | | | | | | | | | | | | |
| | | | | | | | | | | | | | | | | | | | | | | | | | | | |
| | | | | | | | | | | | | | | | | | | | | | | | | | | | |
| | | | | | | | | | | | | | | | | | | | | | | | | | | | |
| | | | | | | | | | | | | | | | | | | | | | | | | | | | | |
| | $ | | | | $ | | | | $ | | | | $ | | | | $ | | | | $ | | | | $ | | |
| | | | | | | | | | | | | | | | | | | | | | | | | | | | | |
| | | | | | | | | | | | | | | | | | | | | | | | | | | | |
| | $ | | | | $ | | | | $ | | | | $ | | | | $ | | | | $ | | | | $ | | |
| | | | | | | | | | | | | | | | | | | | | | | | | | | | |
| | | | | | | | | | | | | | | | | | | | | | | | | | | | |
| | | | | | | | | | | | | | | | | | | | | | | | | | | | |
| | | | | | | | | | | | | | | | | | | | | | | | | | | | |
| | | | | | | | | | | | | | | | | | | | | | | | | | | | | |
| | $ | | | | $ | | | | $ | | | | $ | | | | $ | | | | $ | | | | $ | | |
| | | | | | | | | | | | | | | | | | | | | | | | | | | | | |
| | | | | | | | | | | | | | | | | | | | | | | | | | | | |
| | $ | | | | $ | | | | $ | | | | $ | | | | $ | | | | $ | | | | $ | | |
| | | | | | | | | | | | | | | | | | | | | | | | | | | | |
| | | | | | | | | | | | | | | | | | | | | | | | | | | | |
| | | | | | | | | | | | | | | | | | | | | | | | | | | | |
| | | | | | | | | | | | | | | | | | | | | | | | | | | | |
| | | | | | | | | | | | | | | | | | | | | | | | | | | | | |
| | $ | | | | $ | | | | $ | | | | $ | | | | $ | | | | $ | | | | $ | | |
| | | | | | | | | | | | | | | | | | | | | | | | | | | | | |
| | | | | | | | | | | | | | | | | | | | | | | | | | | | |
| | $ | | | | $ | | | | $ | | | | $ | | | | $ | | | | $ | | | | $ | | |
| | | | | | | | | | | | | | | | | | | | | | | | | | | | |
| | | | | | | | | | | | | | | | | | | | | | | | | | | | |
| | | | | | | | | | | | | | | | | | | | | | | | | | | | |
| | | | | | | | | | | | | | | | | | | | | | | | | | | | |
| | | | | | | | | | | | | | | | | | | | | | | | | | | | | |
| | $ | | | | $ | | | | $ | | | | $ | | | | $ | | | | $ | | | | $ | | |
| | | | | | | | | | | | | | | | | | | | | | | | | | | | | |
| | | | | | | | | | | | | | | | | | | | | | | | | | | | ) |
| | | | | | | | | | | | | | | | | | | | | | | | | | | | | |
| | | | | | | | | | | | | | | | | | | | | | | | | | $ | | |
| | | | | | | | | | | | | | | | | | | | | | | | | | | | | |
| (1) | Date loan was originated or acquired by us. Origination dates are subsequently updated to reflect material loan modifications. |
| (2) | Excludes the $75.8 million net book value of our held-to-maturity debt securities which represents our subordinate position we own in the 2018 Single Asset Securitization, and is included in other assets on our consolidated balance sheets. See Note 4 for details of the subordinate position we own in the 2018 Single Asset Securitization. |
Blackstone Mortgage Trust, Inc.
Notes to Consolidated Financial Statements (continued)
Multifamily Joint Venture
As discussed in Note 2, we entered into a Multifamily Joint Venture in April 2017. As of
SeptemberJune 30,
2017,2020 and December 31, 2019, our Multifamily Joint Venture held
$146.1$624.1 million and $670.5 million of loans,
respectively, which are included in the loan disclosures above. Refer to Note 2 for additional discussion of our Multifamily Joint Venture.
4.
EQUITY INVESTMENT IN UNCONSOLIDATED SUBSIDIARYOur equity investment in unconsolidated subsidiary consisted solely of our carried interest in CTOPI, a fund formerly sponsored and managed by an affiliate of our Manager. The investment was fully realized as of December 31, 2016 and we no longer have any investments in unconsolidated subsidiaries on our consolidated financial statements.
Our carried interest in CTOPI entitled us to earn promote revenue in an amount equal to 17.7% of the fund’s profits, after a 9% preferred return and 100% return of capital to the CTOPI partners. We recognized $2.1 million and $2.2 million of promote income from CTOPI in respect of our carried interest and recorded such amounts in our consolidated statements of operations during the three and nine months ended September 30, 2016, respectively.
CTOPI Incentive Management Fee Grants
In January 2011, we created a management compensation pool for employees equal to 45% of the CTOPI promote distributions received by us. During the nine months ended September 30, 2016, we recognized $1.1 million of expenses under the CTOPI incentive plan. Such amounts were recognized as a component of general and administrative expenses in our consolidated statement of operations.
Blackstone Mortgage Trust, Inc.
Notes to Consolidated Financial Statements (continued)
(Unaudited)
5. OTHER ASSETS AND LIABILITIES
The following table details the components of our other assets ($ in thousands):
| | | | | | | | |
| | | September 30, 2017 | | | December 31, 2016 | |
Accrued interest receivable | | $ | 34,715 | | | $ | 32,871 | |
Collateral deposited under derivative agreements | | | 7,750 | | | | 79 | |
Derivative assets | | | 1,628 | | | | 4,086 | |
Loan portfolio payments held by servicer(1) | | | 845 | | | | 5,765 | |
Prepaid expenses | | | 469 | | | | 803 | |
Prepaid taxes | | | 34 | | | | 16 | |
Other | | | 239 | | | | 450 | |
| | | | | | | | |
Total | | $ | 45,680 | | | $ | 44,070 | |
| | | | | | | | |
| |
| | | | | | | | |
| | | | | | |
Loan portfolio payments held by servicer (1) | | $ | | | | $ | | |
Debt securities held-to-maturity (2) | | | | | | | | |
| | | | ) | | | | |
| | | | | | | | | |
Debt securities held-to-maturity, net | | | | | | | | |
Accrued interest receivable | | | | | | | | |
Collateral deposited under derivative agreements | | | | | | | | |
| | | | | | | | |
| | | | | | | | |
| | | | | | | | |
| | | | | | | | |
| | | | | | | | | |
| | $ | | | | $ | | |
| | | | | | | | | |
| | | | | | |
| | Represents loan principal and interest payments held by our third-party loan servicer as of the balance sheet date which were remitted to us during the subsequent remittance cycle. |
| | Represents the subordinate position we own in the 2018 Single Asset Securitization, which held aggregate loan assets of $857.3 million and $930.0 million as of June 30, 2020 and December 31, 2019, respectively, with a yield to full maturity of L+10.0% and a maximum maturity date of June 9, 2025, assuming all extension options are exercised by the borrower. Refer to Note 15 for additional discussion. |
Current Expected Credit Loss Reserve
The CECL reserve required under GAAP reflects our current estimate of potential credit losses related to the loans and debt securities included in our consolidated balance sheets. Refer to Note 2 for further discussion of our CECL reserve. The following table presents the activity in our debt securities CECL reserve by investment pool for thethree and
six months ended June 30, 2020 ($ in thousands): | | | | | | | | | | | | | | | | | | | | |
| | | | | | | | | | | | | | | |
Debt Securities Held-To-Maturity | | | | | | | | | | | | | | | | | | | | |
CECL reserve as of December 31, 2019 | | $ | | | | $ | | | | $ | | | | $ | | | | $ | | |
Initial CECL reserve on January 1, 2020 | | | | | | | | | | | | | | | | | | | | |
| | | | | | | | | | | | | | | | | | | | |
| | | | | | | | | | | | | | | | | | | | | |
CECL reserve as of June 30, 2020 | | $ | | | | $ | | | | $ | | | | $ | | | | $ | | |
| | | | | | | | | | | | | | | | | | | | | |
CECL reserve as of March 31, 2020 | | $ | | | | $ | | | | $ | | | | $ | | | | $ | | |
| | | | ) | | | | | | | | | | | | | | | | ) |
| | | | | | | | | | | | | | | | | | | | | |
CECL reserve as of June 30, 2020 | | $ | | | | $ | | | | $ | | | | $ | | | | $ | | |
| | | | | | | | | | | | | | | | | | | | | |
Blackstone Mortgage Trust, Inc.
Notes to Consolidated Financial Statements (continued)
Our initial CECL reserve against our debt securitiesheld-to-maturity
of $445,000 recorded on January 1, 2020 is reflected as a direct charge to retained earnings on our consolidated statements of changes in equity; however subsequent changes to the CECL reserve are recognized through net income (loss)
on our consolidated statements of operations. During the three and six months ended June 30, 2020, we recorded a decrease of $1.0 million and an increase of $3.7 million, respectively, in the expected credit loss reserve against our debt securitiesheld-to-maturity,
bringing our total CECL reserve to $4.1 million as of June 30, 2020. This CECL reserve reflects the macroeconomic impact of theCOVID-19
pandemic on commercial real estate markets generally and is not specific to any loan losses or impairments in our portfolio. See Note 2 for further discussion ofCOVID-19.
The following table details the components of our other liabilities ($ in thousands):
| | | | | | | | |
| | | September��30, 2017 | | | December 31, 2016 | |
Accrued dividends payable | | $ | 58,793 | | | $ | 58,615 | |
Accrued interest payable | | | 19,922 | | | | 9,049 | |
Accrued management and incentive fees payable | | | 13,243 | | | | 12,798 | |
Derivative liabilities | | | 7,167 | | | | 210 | |
Accounts payable and other liabilities | | | 2,633 | | | | 1,775 | |
Secured debt repayments pending servicer remittance(1) | | | — | | | | 5,372 | |
| | | | | | | | |
Total | | $ | 101,758 | | | $ | 87,819 | |
| | | | | | | | |
| |
| | | | | | | | |
| | | | | | |
Accrued dividends payable | | $ | | | | $ | | |
| | | | | | | | |
| | | | | | | | |
Accrued management and incentive fees payable | | | | | | | | |
Current expected credit loss reserve for unfunded loan commitments (1) | | | | | | | | |
Accounts payable and other liabilities | | | | | | | | |
| | | | | | | | | |
| | $ | | | | $ | | |
| | | | | | | | | |
| | | | | | |
| | Represents pending transfers from our third-party loan servicer that were remittedthe CECL reserve related to our banking counterparties duringunfunded loan commitments. See Note 2 for further discussion of the subsequent remittance cycle.CECL reserve. |
6.
Current Expected Credit Loss Reserve for Unfunded Loan Commitments
As of June 30, 2020, we had unfunded commitments of $3.6 billion related to 91 loans receivable. The expected credit losses over the contractual period of our loans are subject to the obligation to extend credit through our unfunded loan commitments. See Note 2 for further discussion of the CECL reserve related to our unfunded loan commitments, and Note 17 for further discussion of our unfunded loan commitments. The following table presents the activity in the CECL reserve related to our unfunded loan commitments by investment pool for the three and six months ended June 30, 2020 ($ in thousands):
| | | | | | | | | | | | | | | | | | | | |
| | | | | | | | | | | | | | | |
Unfunded Loan Commitments | | | | | | | | | | | | | | | | | | | | |
CECL reserve as of December 31, 2019 | | $ | | | | $ | | | | $ | | | | $ | | | | $ | | |
Initial CECL reserve on January 1, 2020 | | | | | | | | | | | | | | | | | | | | |
| | | | | | | | | | | | | | | | | | | | |
| | | | | | | | | | | | | | | | | | | | | |
CECL reserve as of June 30, 2020 | | $ | | | | $ | | | | $ | | | | $ | | | | $ | | |
| | | | | | | | | | | | | | | | | | | | | |
CECL reserve as of March 31, 2020 | | $ | | | | $ | | | | $ | | | | $ | | | | $ | | |
(Decrease) increase in CECL reserve | | | | ) | | | | ) | | | | | | | | | | | | ) |
| | | | | | | | | | | | | | | | | | | | | |
CECL reserve as of June 30, 2020 | | $ | | | | $ | | | | $ | | | | $ | | | | $ | | |
| | | | | | | | | | | | | | | | | | | | | |
Our initial CECL reserve against our unfunded loan commitments of $3.3 million recorded on January 1, 2020 is reflected as a direct charge to retained earnings on our consolidated statements of changes in equity; however subsequent changes to the CECL reserve are recognized through net income (loss)
on our consolidated statements of operations. During the three and six months ended June 30, 2020, we recorded a decrease of $7.5 million and an increase of $11.7 million, respectively, in the expected credit loss reserve against our unfunded loan commitments, bringing our total CECL reserve to $15.0 million as of June 30, 2020. This CECL reserve reflects the macroeconomic impact of theCOVID-19
pandemic on commercial real estate markets generally and is not specific to any loan losses or impairments in our portfolio. See Note 2 for further discussion ofCOVID-19.
Blackstone Mortgage Trust, Inc.
Notes to Consolidated Financial Statements (continued)
5. SECURED DEBT AGREEMENTS, NET
During the three months ended June 30, 2020, weentered into agreements with 7 of our secured credit facility lenders, representing an aggregate $7.9 billion of our secured credit facilities, to temporarily suspend credit mark provisions on certain of their portfolio assets in exchange for: (i) cash repayments; (ii) pledges of additional collateral; and (iii) reductions in our available borrowings.
Our secured debt agreements include
secured credit facilities,
the GE portfolio acquisition facility, asset-specific financings, and a revolving credit agreement. The following table details our secured debt agreements ($ in thousands):
| | | | | | | | |
| | | Secured Debt Agreements | |
| | | Borrowings Outstanding | |
| | | September 30, 2017 | | | December 31, 2016 | |
Credit facilities | | $ | 4,386,645 | | | $ | 3,572,837 | |
GE portfolio acquisition facility | | | 1,090,946 | | | | 1,479,582 | |
Asset-specific financings | | | 517,256 | | | | 679,207 | |
Revolving credit agreement | | | 101,750 | | | | — | |
| | | | | | | | |
Total secured debt agreements | | $ | 6,096,597 | | | $ | 5,731,626 | |
| | | | | | | | |
Deferred financing costs(1) | | | (17,462 | ) | | | (15,272 | ) |
| | | | | | | | |
Net book value of secured debt | | $ | 6,079,135 | | | $ | 5,716,354 | |
| | | | | | | | |
| |
| | | | | | | | |
| | | |
| | | |
| | | | | | |
Secured credit facilities | | $ | | | | $ | | |
Asset-specific financings | | | | | | | | |
Revolving credit agreement | | | | | | | | |
| | | | | | | | | |
Total secured debt agreements | | $ | | | | $ | | |
| | | | | | | | | |
Deferred financing costs (1) | | | | ) | | | | ) |
| | | | | | | | | |
Net book value of secured debt | | $ | | | | $ | | |
| | | | | | | | | |
| | | | |
| | Costs incurred in connection with our secured debt agreements are recorded on our consolidated balance sheet when incurred and recognized as a component of interest expense over the life of each related agreement. |
26
Blackstone Mortgage Trust, Inc.
Notes to Consolidated Financial Statements (continued)
Secured Credit Facilities
During the nine months ended September 30, 2017, we added two new
The following table details our secured credit facilities
related to our Multifamily Joint Venture, providing an aggregate additional $450.0 millionas of
credit capacity, increased the maximum facility size of two of our existing credit facilities, providing an additional £250.0 million and €250.0 million of credit capacity, respectively, and converted one of our asset-specific financings to a $500.0 million credit facility. The following tables detail our credit facilitiesJune 30, 2020 ($ in thousands):
| | | | | | | | | | | | | | | | | | | | |
| | | September 30, 2017 | |
| | | Maximum | | | Collateral | | | Credit Borrowings | |
Lender | | Facility Size(1) | | | Assets(2) | | | Potential(3) | | | Outstanding | | | Available(3) | |
Wells Fargo | | $ | 2,000,000 | | | $ | 2,232,117 | | | $ | 1,724,227 | | | $ | 1,398,224 | | | $ | 326,003 | |
MetLife | | | 1,000,000 | | | | 1,030,148 | | | | 807,164 | | | | 807,164 | | | | — | |
Bank of America | | | 750,000 | | | | 818,359 | | | | 641,066 | | | | 641,066 | | | | — | |
Citibank(4) | | | 795,350 | | | | 596,119 | | | | 464,849 | | | | 356,751 | | | | 108,098 | |
JP Morgan(5) | | | 500,000 | | | | 453,121 | | | | 344,656 | | | | 295,984 | | | | 48,672 | |
Deutsche Bank | | | 500,000 | | | | 393,564 | | | | 295,743 | | | | 295,743 | | | | — | |
Société Générale(6) | | | 472,560 | | | | 332,761 | | | | 266,000 | | | | 266,000 | | | | — | |
Morgan Stanley(7) | | | 669,900 | | | | 422,332 | | | | 331,037 | | | | 211,105 | | | | 119,932 | |
Bank of America - Multi. JV(8) | | | 200,000 | | | | 87,000 | | | | 69,600 | | | | 69,600 | | | | — | |
Goldman Sachs - Multi. JV(8) | | | 250,000 | | | | 59,125 | | | | 45,008 | | | | 45,008 | | | | — | |
| | | | | | | | | | | | | | | | | | | | |
| | $ | 7,137,810 | | | $ | 6,424,646 | | | $ | 4,989,350 | | | $ | 4,386,645 | | | $ | 602,705 | |
| | | | | | | | | | | | | | | | | | | | |
| | | | | | | | | | | | | | | | | | | | |
| | | December 31, 2016 | |
| | | Maximum | | | Collateral | | | Credit Borrowings | |
Lender | | Facility Size(1) | | | Assets(2) | | | Potential(3) | | | Outstanding | | | Available(3) | |
Wells Fargo | | $ | 2,000,000 | | | $ | 1,718,874 | | | $ | 1,339,942 | | | $ | 1,107,733 | | | $ | 232,209 | |
MetLife | | | 1,000,000 | | | | 1,106,017 | | | | 862,454 | | | | 862,454 | | | | — | |
Bank of America | | | 750,000 | | | | 794,881 | | | | 617,694 | | | | 617,694 | | | | — | |
JP Morgan(5) | | | 500,000 | | | | 550,560 | | | | 420,414 | | | | 316,219 | | | | 104,195 | |
Morgan Stanley(7) | | | 308,500 | | | | 344,056 | | | | 272,221 | | | | 231,930 | | | | 40,291 | |
Citibank(4) | | | 500,000 | | | | 508,989 | | | | 394,677 | | | | 229,629 | | | | 165,048 | |
Société Générale(6) | | | 420,680 | | | | 274,351 | | | | 207,178 | | | | 207,178 | | | | — | |
| | | | | | | | | | | | | | | | | | | | |
| | $ | 5,479,180 | | | $ | 5,297,728 | | | $ | 4,114,580 | | | $ | 3,572,837 | | | $ | 541,743 | |
| | | | | | | | | | | | | | | | | | | | |
| |
| | | | | | | | | | | | | | | | |
| | | |
| | Credit Facility Borrowings | | | | |
| | | | | | | | | | | | |
| | $ | | | | $ | | | | $ | | | | $ | | |
| | | | | | | | | | | | | | | | |
| | | | | | | | | | | | | | | | |
| | | | | | | | | | | | | | | | |
| | | | | | | | | | | | | | | | |
| | | | | | | | | | | | | | | | |
| | | | | | | | | | | | | | | | |
| | | | | | | | | | | | | | | | |
| | | | | | | | | | | | | | | | |
| | | | | | | | | | | | | | | | |
| | | | | | | | | | | | | | | | |
Goldman Sachs - Multi. JV (3) | | | | | | | | | | | | | | | | |
| | | | | | | | | | | | | | | | |
Bank of America - Multi. JV (3) | | | | | | | | | | | | | | | | |
| | | | | | | | | | | | | | | | | |
| | $ | | | | $ | | | | $ | | | | $ | | |
| | | | | | | | | | | | | | | | | |
| |
| | | | | | | | | | | | | | | | | | |
| | Maximum facility size represents the largest amount of borrowings available under a given facility once sufficient collateral assets have been approved by the lender and pledged by us.
|
(2)
| | Represents the principal balance of the collateral assets.
|
(3)
| | Potential borrowings represents the total amount we could draw under each facility based on collateral already approved and pledged. When undrawn, these amounts are immediately available to us at our sole discretion under the terms of each credit facility. |
(4)
| | As
Represents the principal balance of September 30, 2017, the Citibank maximum facility size was composed of a general $500.0 million facility size denominated in U.S. Dollars plus a general €250.0 million ($295.4 million) facility size that contemplated British Pound Sterling and Euro borrowings. As of December 31, 2016, the maximum facility size was composed of a general $500.0 million facility.collateral assets. |
(5)
| | As of September 30, 2017 and December 31, 2016, the JP Morgan maximum facility size was composed of a general $500.0 million facility size, under which U.S. Dollars and British Pound Sterling borrowings are contemplated.
|
(6)
| | As of September 30, 2017 and December 31, 2016, the Société Générale maximum facility size was composed of a €400.0 million facility size that was translated to $472.6 million and $420.7 million, respectively. Borrowings denominated in U.S. Dollars, British Pound Sterling, and Euro are contemplated under this facility.
|
(7)
| | As of September 30, 2017, the Morgan Stanley maximum facility size was composed of a £500.0 million facility size that was translated to $669.9 million. As of December 31, 2016, the maximum facility size was composed of a £250.0 million facility size that was translated to $308.5 million. Borrowings denominated in U.S. Dollars, British Pound Sterling, and Euro are contemplated under this facility.
|
(8)
| | These facilities finance the loan investments of our consolidated Multifamily Joint Venture. Refer to Note 2 for additional discussion of our Multifamily Joint Venture. |
Blackstone Mortgage Trust, Inc.
Notes to Consolidated Financial Statements (continued)
(Unaudited)
The weighted-average outstanding balance of our
secured credit facilities was
$4.0$9.2 billion for the
ninesix months ended
SeptemberJune 30,
2017.2020. As of
SeptemberJune 30,
2017,2020, we had aggregate borrowings of
$4.4$9.4 billion outstanding under our
secured credit facilities, with a weighted-average cash coupon of LIBOR plus
1.88%1.62% per annum, a weighted-average
all-in
cost of credit, including associated fees and expenses, of LIBOR plus
2.09%1.82% per annum, and a weighted-average advance rate of
78.8%75.6%. As of
SeptemberJune 30,
2017,2020, outstanding borrowings under these facilities had a weighted-average maturity,
excludingincluding extension options,
and term-out provisions, of
1.5 3.4years.
Blackstone Mortgage Trust, Inc.
Notes to Consolidated Financial Statements (continued)
The following table details our secured credit facilities as of December 31, 2019 ($ in thousands):
| | | | | | | | | | | | | | | | |
| | | |
| | Credit Facility Borrowings | | | | |
| | | | | | | | | | | | |
| | $ | | | | $ | | | | $ | | | | $ | | |
| | | | | | | | | | | | | | | | |
| | | | | | | | | | | | | | | | |
| | | | | | | | | | | | | | | | |
| | | | | | | | | | | | | | | | |
| | | | | | | | | | | | | | | | |
| | | | | | | | | | | | | | | | |
| | | | | | | | | | | | | | | | |
| | | | | | | | | | | | | | | | |
| | | | | | | | | | | | | | | | |
| | | | | | | | | | | | | | | | |
| | | | | | | | | | | | | | | | |
Goldman Sachs - Multi. JV (3) | | | | | | | | | | | | | | | | |
Bank of America - Multi. JV (3) | | | | | | | | | | | | | | | | |
| | | | | | | | | | | | | | | | | |
| | $ | | | | $ | | | | $ | | | | $ | | |
| | | | | | | | | | | | | | | | | |
| |
| | | | | | | | | | | | | | | | | | |
| | Potential borrowings represents the total amount we could draw under each facility based on collateral already approved and pledged. When undrawn, these amounts are immediately available to us at our sole discretion under the terms of each credit facility. |
| | Represents the principal balance of the collateral assets. |
| | These facilities finance the loan investments of our consolidated Multifamily Joint Venture. Refer to Note 2 for additional discussion of our Multifamily Joint Venture. |
The weighted-average outstanding balance of our
secured credit facilities was
$2.9$8.9 billion for the
ninesix months ended
September 30, 2016.December 31, 2019. As of December 31,
2016,2019, we had
aggregatedaggregate borrowings of
$3.6$9.8 billion outstanding under our
secured credit facilities, with a weighted-average cash coupon of LIBOR plus
1.82%1.60% per annum, a weighted-average
all-in
cost of credit, including associated fees and expenses, of LIBOR plus
2.02%1.79% per annum, and a weighted-average advance rate of
79.1%79.4%. As of December 31,
2016,2019, outstanding borrowings under these facilities had a weighted-average maturity,
excludingincluding extension options,
and term-out provisions, of
1.53.6 years.
Borrowings under each facility are subject to the initial approval of eligible collateral loans by the lender and the maximum advance rate and pricing rate of individual advances are determined with reference to the attributes of the respective collateral loan.
Blackstone Mortgage Trust, Inc.
Notes to Consolidated Financial Statements (continued)
The following tables outline the key terms of our credit facilities as of
SeptemberJune 30,
2017:2020: | | | | | | | | |
| | | | | | | | |
Wells Fargo
| | $ | | 25% | | Collateral marks only | | Term matched(3) |
MetLife
| | $ | | 50% | | Collateral marks only | | April 21, 2023(4) |
Bank of America
| | $ | | 50% | | Collateral marks only | | May 21, 2021(5) |
Société Générale
| | | | | | | | Term matched(3) |
Deutsche Bank
Goldman Sachs - Multi. JV(3) | | | | 35% | | | | Term matched(3) |
Citibank
| | $ / £ / € | | 25% | | Collateral marks only | | Term matched(3) |
Morgan Stanley
| | $ / £ / € | | 25% | | Collateral marks only | | March 3, 2020 |
JP Morgan
| | $ / £ | | 50% | | Collateral marks only | | January 7, 2020 |
Bank of America - Multi. JV (6)(3) | | | | | | | | |
Goldman Sachs
| | | | | | | | |
| | | | | | | | |
| | | | | | | | |
| | | | | | | | |
| | | | | | | | |
| | | | | | | | |
| | | | | | | | |
| | | | | | | | |
US Bank - Multi. JV (6)(3) | | | | | | | | July 12, 2020 |
| | | | | | | | |
| | | | | | | | |
|
| | |
| | Other than amounts guaranteed based on specific collateral asset types, borrowings under our credit facilities are non-recourse to us. |
| | Margin call provisions under our credit facilities do not permit valuation adjustments based on capital markets events, and are limited to collateral-specific credit marks. These provisions have been temporarily suspended on certain of our facilities as described above. |
| | These facilities finance the loan investments of our consolidated Multifamily Joint Venture. Refer to Note 2 for additional discussion of our Multifamily Joint Venture. |
| | Specific borrowings outstanding of $934.7 million are 100 % guaranteed. The remainder of the credit facility borrowings are 25 |
| | In addition to the 25 % guarantee across all borrowings, there is an incremental guarantee of $146.6 million related to $195.4 million of specific borrowings outstanding. |
| | Includes aone-year extension option which may be exercised at our sole discretion. |
| | Includes twoone-year extension options which may be exercised at our sole discretion. |
| | Includes twoone-year extension options which may be exercised at our sole discretion. |
| | Includes twoone-year extension options which may be exercised at our sole discretion. |
| | Includes fiveone-year extension options which may be exercised at our sole discretion. |
| | These secured credit facilities have various availability periods during which new advances can be made and which are generally subject to each lender’s discretion. Maturity dates for advances outstanding are tied to the term of each respective collateral asset. |
(4)
| | Includes five one-year extension options which may be exercised at our sole discretion.
|
(5)
| | Includes two one-year extension options which may be exercised at our sole discretion.
|
(6)
| | These facilities finance the loan investments of our consolidated Multifamily Joint Venture. Refer to Note 2 for additional discussion of our Multifamily Joint Venture.
|
| | | | | | | | | | | | | | | | | | | | |
Currency | | Outstanding
Borrowings | | | Potential
Borrowings(1) | | | Index | | | Rate(2) | | | Advance
Rate(3) | |
| $ | | | $ 4,123,064 | | | | $ 4,610,777 | | | | 1-month USD LIBOR | | | | L+1.86% | | | | 78.8% | |
| € | | | € 66,186 | | | | € 87,786 | | | | 3-month EURIBOR | | | | L+2.24% | | | | 80.0% | |
| £ | | | £ 138,371 | | | | £ 205,152 | | | | 3-month GBP LIBOR | | | | L+2.24% | | | | 78.6% | |
| | | | | | | | | | | | | | | | | | | | |
| | | $ 4,386,645 | | | | $ 4,989,350 | | | | | | | | L+1.88% | | | | 78.8% | |
| |
| | | | | | | | | | | | | | | | | | |
| | Potential borrowings represents the total amount we could draw under each facility based on collateral already approved and pledged. When undrawn, these amounts are immediately available to us at our sole discretion under the terms of each credit facility. | |
| | Represents weighted-average cash coupon based on borrowings outstanding.
Floating rate indices are generally matched to the payment timing under the terms of each secured credit facility and its respective collateral assets. | |
| | Represents weighted-average advance rate based on the approved outstanding principal balance of the collateral assets pledged. | |
Blackstone Mortgage Trust, Inc.
Notes to Consolidated Financial Statements (continued)
(Unaudited)
GE Portfolio Acquisition Facility
During the second quarter of 2015, concurrently with our acquisition of the GE portfolio, we entered into an agreement with Wells Fargo to provide us with secured financing for the acquired portfolio. As of September 30, 2017, this facility provided for $1.2 billion of financing, of which $1.1 billion was outstanding and an additional $129.4 million was available to finance future loan fundings in the GE portfolio. The GE portfolio acquisition facility is non-revolving and consists of a single master repurchase agreement providing for asset-specific borrowings for each collateral asset.
The asset-specific borrowings under the GE portfolio acquisition facility were advanced at a weighted-average rate of 80% of our purchase price of the collateral assets and are repaid pro rata from collateral asset repayment proceeds. The asset-specific borrowings are currency matched to the collateral assets and accrue interest at a rate equal to the sum of (i) the applicable base rate plus (ii) a margin of 1.75%, which will increase to 1.80% and 1.85% in year four and year five, respectively. As of September 30, 2017, those borrowings were denominated in U.S. Dollars, Canadian Dollars, and British Pounds Sterling. The asset-specific borrowings are term matched to the underlying collateral assets with an outside maturity date of May 20, 2020, which may be extended pursuant to two one-year extension options. We guarantee obligations under the GE portfolio acquisition facility in an amount equal to the greater of (i) 25% of outstanding asset-specific borrowings, and (ii) $250.0 million. We had outstanding asset-specific borrowings under the GE portfolio acquisition facility of $1.1 billion and a weighted-average all-in cost of credit, including associated fees and expenses, of LIBOR plus 1.75% per annum as of September 30, 2017, compared to $1.5 billion of outstanding asset-specific borrowings and a weighted-average all-in cost of credit, including associated fees and expenses, of LIBOR plus 1.83% per annum as of December 31, 2016.
Asset-Specific Financings
The following tables detail our asset-specific financings ($ in thousands):
| | | | | | | | | | | | | | | | | | | | | | |
| | | September 30, 2017 | |
Asset-Specific Financings | | Count | | Principal
Balance | | | Book Value | | | Wtd. Avg.
Yield/Cost(1) | | | Guarantee(2) | | | Wtd. Avg.
Term(3) | |
Collateral assets | | 5 | | $ | 662,223 | | | $ | 659,152 | | | | L+4.70 | % | | | n/a | | | | Dec. 2020 | |
Financing provided(4) | | 5 | | $ | 517,256 | | | $ | 516,537 | | | | L+2.48 | % | | $ | 162,517 | | | | Dec. 2020 | |
| | | | | | | | | | | | | | | | | | | | | | |
| | | |
Asset-Specific Financings | | | | | | | | | | | | | | | | | |
| | | | $ | | | | $ | | | | | | % | | | | | | | | |
| | | | $ | | | | $ | | | | | | % | | $ | | | | | | |
| | | |
Asset-Specific Financings | | | | | | | | | | | | | | | | | |
| | | | $ | | | | $ | | | | | | % | | | | | | | | |
| | | | $ | | | | $ | | | | | | % | | $ | | | | | | |
| | |
| | These floating rate loans and related liabilities are indexed to the various benchmark rates relevant in each arrangement in terms of currency and payment frequency. Therefore the net exposure to each benchmark rate is in direct proportion to our net assets indexed to that rate. In addition to cash coupon, yield/cost includes the amortization of deferred origination fees / financing costs. |
| | Other than amounts guaranteed on an asset-by-assetasset by asset basis, borrowings under our asset-specific financings are non-recourse to us. |
| | The weighted-average term is determined based on the maximum maturity of the corresponding loans, assuming all extension options are exercised by the borrower. Each of our asset-specific financings areis term-matched to the corresponding collateral loans. |
(4)
| | Borrowings of $394.8 million under these asset specific financings are cross collateralized with related credit facilities with the same lenders.
|
| | | | | | | | | | | | | | | | | | | | | | |
| | | December 31, 2016 | |
Asset-Specific Financings | | Count | | Principal
Balance | | | Book Value | | | Wtd. Avg.
Yield/Cost(1) | | | Guarantee(2) | | | Wtd. Avg.
Term(3) | |
Collateral assets | | 7 | | $ | 876,083 | | | $ | 869,417 | | | | L+4.84 | % | | | n/a | | | | Aug. 2020 | |
Financing provided(4) | | 7 | | $ | 679,207 | | | $ | 676,333 | | | | L+2.60 | % | | $ | 231,585 | | | | Aug. 2020 | |
| | |
(1)
| | These floating rate loans and related liabilities are indexed to the various benchmark rates relevant in each arrangement in terms of currency and payment frequency. Therefore the net exposure to each benchmark rate is in direct proportion to our net assets indexed to that rate. In addition to cash coupon, yield/cost includes the amortization of deferred origination fees / financing costs.
|
(2)
| | Other than amounts guaranteed on an asset-by-asset basis, borrowings under our asset-specific financings are non-recourse to us.
|
(3)
| | The weighted-average term is determined based on the maximum maturity of the corresponding loans, assuming all extension options are exercised by the borrower. Each of our asset-specific financings are term-matched to the corresponding collateral loans.
|
(4)
| | Borrowings of $392.3 million under these asset specific financings are cross collateralized with related credit facilities with the same lenders.
|
Blackstone Mortgage Trust, Inc.
Notes to Consolidated Financial Statements (continued)
(Unaudited)
The weighted-average outstanding balance of our asset-specific financings was
$596.2$312.5 million for the
ninesix months ended
SeptemberJune 30,
20172020 and
$557.9$262.5 million for the
ninesix months ended
September 30, 2016.December 31, 2019.
Revolving Credit Agreement
During the second quarter of 2017, we increased the borrowing capacity under our
We have a $250.0 million full recourse secured revolving credit agreement with Barclays
by $125.0 million to $250.0 million. This full recourse facilitythat is designed to finance first mortgage originations for up to
sixnine months as a bridge to term financing or syndication. Advances under the agreement are subject to availability under a specified borrowing base and accrue interest at a per annum pricing rate equal to the sum of (i) an applicable base rate or Eurodollar rate and (ii) an applicable margin, in each case, dependent on the applicable type of loan collateral. The maturity date of the facility is April 4,
2020.2023.
During the ninesix months ended SeptemberJune 30, 2017, the weighted-average outstanding2020, we had no borrowings under the revolving credit agreement were $23.5 million and we recorded interest expense of $1.7 million,$901,000, including $575,000$459,000 of amortization of deferred fees and expenses. As of September 30, 2017,
During the six months ended December 31, 2019, we had
$101.8 million of borrowings outstanding under the agreement.During the nine months ended September 30, 2016, the weighted-average outstandingno borrowings under the revolving credit agreement were $19.5 million and we recorded interest expense of $915,000,$972,000, including $248,000$525,000 of amortization of deferred fees and expenses. As of December 31, 2016 we had no outstanding borrowings under the agreement.
Debt Covenants
Each of the
The guarantees related to our secured debt agreements contain the following
uniform financial covenants: (i) our ratio of earnings before interest, taxes, depreciation, and amortization, or EBITDA, to fixed charges, as defined in the agreements, shall be not less than 1.4 to 1.0; (ii) our tangible net worth, as defined in the agreements, shall not be less than
$1.9$3.0 billion as of each measurement date plus 75% of the net cash proceeds of future equity issuances subsequent to
SeptemberJune 30,
2017;2020; (iii) cash liquidity shall not be less than the greater of (x) $10.0 million or (y)
no more than 5% of our recourse indebtedness; and (iv) our indebtedness shall not exceed 83.33% of our total assets. As of
SeptemberJune 30,
20172020 and December 31,
2016,2019, we were in compliance with these covenants.
7. LOAN PARTICIPATIONS SOLD, NET
The financing of a loan by the non-recourse sale of a senior interest Refer to Note 7 for information regarding financial covenants contained in the agreements governing our senior secured term loan through a participation agreement generally does not qualify as a sale under GAAP. Therefore, in the instancefacility.
Blackstone Mortgage Trust, Inc.
Notes to Consolidated Financial Statements (continued)
(Unaudited)
The following tables detail our loan participations sold ($ in thousands):
| | | | | | | | | | | | | | | | | | | | |
| | | September 30, 2017 |
Loan Participations Sold | | Count | | Principal
Balance | | | Book Value | | | Yield/Cost(1) | | | Guarantee(2) | | | Term |
Total loan | | 1 | | $ | 93,710 | | | $ | 91,498 | | | | L+5.96 | % | | | n/a | | | Feb. 2022 |
Senior participation(3) | | 1 | | | 33,193 | | | | 33,193 | | | | L+4.00 | % | | | n/a | | | Feb. 2022 |
| |
| | | December 31, 2016 |
Loan Participations Sold | | Count | | Principal
Balance | | | Book Value | | | Yield/Cost(1) | | | Guarantee(2) | | | Term |
Total loan | | 1 | | $ | 419,560 | | | $ | 416,233 | | | | L+4.48 | % | | | n/a | | | Dec. 2019 |
Senior participation(3)(4) | | 1 | | | 349,633 | | | | 348,077 | | | | L+2.72 | % | | $ | 29,616 | | | Dec. 2019 |
| | |
(1)
| | Our floating rate loans and related liabilities are indexed to the various benchmark rates relevant in each arrangement in terms of currency and payment frequency. Therefore the net exposure to each benchmark rate is in direct proportion to our net assets indexed to that rate. In addition to cash coupon, yield/cost includes the amortization of deferred fees / financing costs.
|
(2)
| | As of September 30, 2017, our loan participation sold was non-recourse to us. As of December 31, 2016, our loan participation was subject to a related guarantee agreement for £24.0 million ($29.6 million as of December 31, 2016).
|
(3)
| | During the three and nine months ended September 30, 2017, we recorded $4.0 million and $9.3 million, respectively, of interest expense related to our loan participations sold, of which $2.6 million and $7.7 million was paid in cash. During the three and nine months ended September 30, 2016, we recorded $3.4 million and $10.7 million, respectively, of interest expense related to our loan participations sold, of which $3.2 million and $10.3 million was paid in cash.
|
(4)
| | The difference between principal balance and book value of loan participations sold is due to deferred financing costs of $1.6 million as of December 31, 2016.
|
8.
6. SECURITIZED DEBT OBLIGATIONS, NET
In the
secondfirst quarter of 2020 and the fourth quarter of 2017, we
financed certain pools of our loans through collateralized loan obligations, which we refer to as the 2020 CLO and 2017 CLO, respectively, or collectively, the CLOs. We have also financed one of our loans through a single asset securitization vehicle, or the
2017 Single Asset Securitization. The 2020 CLO, 2017 CLO, and the 2017 Single Asset Securitization
which ishave issued securitized debt obligations that arenon-recourse
to us. The CLOs and the 2017 Single Asset Securitization are consolidated in our financial statements.
The Securitization has issued securitized debt obligations that are non-recourse to us. Refer to Note
1615 for further discussion of our
CLOs and 2017 Single Asset Securitization.
Blackstone Mortgage Trust, Inc.
Notes to Consolidated Financial Statements (continued)
The following
table detailstables detail our securitized debt obligations ($ in thousands):
| | | | | | | | | | | | | | | | | | |
| | | September 30, 2017 | |
Securitized Debt Obligations | | Count | | Principal
Balance | | | Book Value | | | Yield/Cost(1) | | | Term(2) | |
Total loan | | 1 | | $ | 644,788 | | | $ | 641,262 | | | | L+3.60 | % | | | June 2023 | |
Securitized debt obligations(3) | | 1 | | | 474,620 | | | | 474,298 | | | | L+1.94 | % | | | June 2033 | |
| | | | | | | | | | | | | | | | | | | |
| | |
Securitized Debt Obligations | | | | | | | | | | | | | | |
2020 Collateralized Loan Obligation | | | | | | | | | | | | | | | | | | | |
| | | | | | $ | | | | $ | | | | | | % | | | |
| | | | | | | | | | | | | | | | % | | | |
2017 Collateralized Loan Obligation | | | | | | | | | | | | | | | | | | | |
| | | | | | | | | | | | | | | | % | | | |
| | | | | | | | | | | | | | | | % | | | |
2017 Single Asset Securitization | | | | | | | | | | | | | | | | | | | |
| | | | | | | | | | | | | | | | % | | | |
| | | | | | | | | | | | | | | | % | | | |
| | | | | | | | | | | | | | | | | | | |
| | | | | | $ | | | | $ | | | | | | % | | | |
| | | | | | | | | | | | | | | | | | | | |
| | | | | | $ | | | | $ | | | | | | % | | | |
| | | | | | | | | | | | | | | | | | | | |
| | | | | | | | | | | | | | | | | | | |
| | |
Securitized Debt Obligations | | | | | | | | | | | | | | |
2017 Collateralized Loan Obligation | | | | | | | | | | | | | | | | | | | |
| | | | | | $ | | | | $ | | | | | | % | | | |
| | | | | | | | | | | | | | | | % | | | |
2017 Single Asset Securitization | | | | | | | | | | | | | | | | | | | |
| | | | | | | | | | | | | | | | % | | | |
| | | | | | | | | | | | | | | | % | | | |
| | | | | | | | | | | | | | | | | | | |
| | | | | | $ | | | | $ | | | | | | % | | | |
| | | | | | | | | | | | | | | | | | | | |
| | | | | | $ | | | | $ | | | | | | % | | | |
| | | | | | | | | | | | | | | | | | | | |
| | |
| | In addition to cash coupon, yield/costall-in yield includes the amortization of deferred origination and extension fees, / financing costs.loan origination costs, purchase discounts, and accrual of exit fees.All-in yield for the total portfolio assume applicable floating benchmark rates for weighted-average calculation. |
| | Loan term represents weighted-average final maturity, assuming all extension options are exercised by the borrower. Repayments of securitized debt obligations are tied to timing of the related collateral loan asset repayments. The term of these obligations represents the rated final distribution date of the securitization.securitizations. |
| | The collateral assets for the 2017 Single Asset Securitization include the total loan amount, of which we securitized $500.0 million. |
| | During the three and ninesix months ended SeptemberJune 30, 2017,2020, we recorded $3.8$10.7 million and $22.7 million, respectively, of interest expense related to our securitized debt obligations. During the three and six months ended June 30, 2019, we recorded $12.5 million and $25.0 million, respectively, of interest expense related to our securitized debt obligations. |
We did not have any securitized debt obligations as
Blackstone Mortgage Trust, Inc.
Notes to Consolidated Financial Statements (continued)
7. SECURED TERM LOANS, NET
During the three months ended June 30, 2020,
we entered into a $325.0 million senior secured term loan facility, or the 2020 Term Loan. As of June 30, 2020, the following senior secured term loan facilities, or Secured Term Loans, were outstanding ($ in thousands): | | |
| | The 2020 Term Loan includes a LIBOR floor of 1.00%. |
| | Includes issue discount and transaction expenses that are amortized through interest expense over the life of the Secured Term Loans. |
The 2019 and 2020 Term Loans are partially amortizing, with an amount equal to 1.0% per annum of the aggregate principal balance due in quarterly installments. The issue discount and transaction expenses on the 2019 Term Loan were $1.6 million and $10.1 million, respectively, which will be amortized into interest expense over the life of the 2019 Term Loan. The issue discount and transaction expenses of the 2020 Term Loan were $9.6 million and$3.8 million, respectively, which will be amortized into interest expense over the life of the 2020 Term Loan. The following table details the net book value of our Secured Term Loans on our consolidated balance sheets ($ in thousands):
The guarantee under our Secured Term Loans contains the financial covenant that our indebtedness shall not exceed 83.33% of our total assets. As of June 30, 2020 and December 31, 2019, we were in compliance with this covenant. Refer to Note 2 for additional discussion of our accounting policies for the Secured Term Loans.
Blackstone Mortgage Trust, Inc.
Notes to Consolidated Financial Statements (continued)
8. CONVERTIBLE NOTES, NET
As of
SeptemberJune 30,
2017,2020, the following convertible senior notes, or Convertible Notes, were outstanding ($ in thousands):
| | | | | | | | | | | | | | | | | | |
Convertible Notes Issuance | | Face Value | | | Coupon Rate | | | All-in Cost(1) | | | Conversion Rate(2) | | | Maturity |
November 2013 | | $ | 172,500 | | | | 5.25 | % | | | 5.87 | % | | | 36.1380 | | | December 1, 2018 |
May 2017 | | | 402,500 | | | | 4.38 | % | | | 4.85 | % | | | 28.0324 | | | May 5, 2022 |
| | | | | | | | | | | | | | | | | | | | |
Convertible Notes Issuance | | | | | | | | | | | | | | | |
| | $ | | | | | | % | | | | % | | | | | | | | |
| | $ | | | | | | % | | | | % | | | | | | | | |
| | |
| | Includes issuance costs that are amortized through interest expense over the life of the Convertible Notes using the effective interest method. |
| | Represents the shares of class A common stock per $1,000 principal amount of Convertible Notes, which is equivalent to a conversion price of $27.67$35.67 and $35.67$36.23 per share of class A common stock, respectively, for the November 2013 and May 2017 and March 2018 convertible notes. As a result of exceeding the cumulative dividend threshold, as defined in the November 2013 convertible notes supplemental indenture, the conversion rate on the November 2013 convertible notes was most recently adjusted on June 28, 2017 from the prior conversion rate of 35.7236 shares of class A common stock per $1,000 principal amount of convertible notes, which was equivalent to a conversion price of $27.99 per share of class A common stock. The cumulative dividend threshold as defined in the respective May 2017 and March 2018 convertible notes supplemental indenture has notindentures have 0t been exceeded as of SeptemberJune 30, 2017.2020. |
In May 2017 we issued $287.5 million of convertible notes. In the third quarter of 2017, we issued an additional $115.0 million of convertible notes under the same indenture and with the same terms as the May 2017 convertible notes. Accordingly, as of September 30, 2017, the May 2017 convertible notes had an aggregate outstanding face value of $402.5 million.
The Convertible Notes are convertible at the holders’ option into shares of our class A common stock, only under specific circumstances, prior to the close of business on
August 31, 2018 and January 31, 2022
and December 14, 2022 for the
November 2013May 2017 and
May 2017March 2018 convertible notes, respectively, at the applicable conversion rate in effect on the conversion date. Thereafter, the Convertible Notes are convertible at the option of the holder at any time until the second scheduled trading day immediately preceding the maturity date.
Neither series of the Convertible Notes were convertible as of September 30, 2017. We may not redeem the Convertible Notes prior to maturity. The last reported sale price of our class A common stock of
$31.02$24.09 on
September 29, 2017, the last trading day in the quarter ended SeptemberJune 30,
2017,2020 was
greater than the per share conversion price of the November 2013 convertible notes but less than the per share conversion price of the May 2017
and March 2018 convertible notes. We have the intent and ability to settle each series of the Convertible Notes in cash and, as a result, the
potential conversion of the Convertible Notes did not have any impact on our diluted earnings per share.
Upon our issuance of the November 2013 convertible notes, we recorded a $9.1 million discount based on the implied value of the conversion option and an assumed effective interest rate of 6.50%, as well as $4.1 million of initial issuance costs. Including the amortization of this discount and the issuance costs, our total cost of the November 2013 convertible notes issuance is 7.16% per annum.
Upon our issuance of the May 2017 convertible notes,
including our additional issuance in the third quarter of 2017, we recorded a $979,000 discount based on the implied value of the conversion option and an assumed effective interest rate of 4.57%, as well as $8.4 million of
initial debtissue discount and issuance costs. Including the amortization of the discount and issuance costs, our total cost of the May 2017 convertible notes issuance is 4.91% per annum.
The following table details
Upon our
issuance of the March 2018 convertible notes, we recorded a $1.5 million discount based on the implied value of the conversion option and an assumed effective interest
expense related torate of 5.25%, as well as $5.2 million of issue discount and issuance costs. Including the
Convertible Notes ($ in thousands): | | | | | | | | | | | | | | | | |
| | | Three Months Ended September 30, | | | Nine Months Ended September 30, | |
| | | 2017 | | | 2016 | | | 2017 | | | 2016 | |
Cash coupon | | $ | 6,247 | | | $ | 2,264 | | | $ | 12,732 | | | $ | 6,792 | |
Discount and issuance cost amortization | | | 1,202 | | | | 691 | | | | 2,869 | | | | 2,038 | |
| | | | | | | | | | | | | | | | |
Total interest expense | | $ | 7,449 | | | $ | 2,955 | | | $ | 15,601 | | | $ | 8,830 | |
| | | | | | | | | | | | | | | | |
amortization of the discount and issuance costs, our total cost of the March 2018 convertible notes issuance is 5.49% per annum.
Blackstone Mortgage Trust, Inc.
Notes to Consolidated Financial Statements (continued)
(Unaudited)
The following table details the net book value of our Convertible Notes on our consolidated balance sheets ($ in thousands):
| | | | | | | | |
| | | September 30, 2017 | | | December 31, 2016 | |
Face value | | $ | 575,000 | | | $ | 172,500 | |
Unamortized discount | | | (11,386 | ) | | | (5,532 | ) |
Deferred financing costs | | | (873 | ) | | | (206 | ) |
| | | | | | | | |
Net book value | | $ | 562,741 | | | $ | 166,762 | |
| | | | | | | | |
Accrued
The following table details our interest expense related to the Convertible Notes ($ in thousands):
| | | | | | | | | | | | | | | | |
| | | | | | | |
| | | | | | | |
| | | | | | | | | | | | | |
| | $ | | | | $ | | | | $ | | | | $ | | |
Discount and issuance cost amortization | | | | | | | | | | | | | | | | |
| | | | | | | | | | | | | | | | | |
| | $ | | | | $ | | | | $ | | | | $ | | |
| | | | | | | | | | | | | | | | | |
As of both June 30, 2020 and December 31, 2019, accrued interest payable for the Convertible Notes was
$9.0 million and $755,000 as of September 30, 2017 and December 31, 2016, respectively.$6.0 million. Refer to Note 2 for additional discussion of our accounting policies for the Convertible Notes.
10.
Blackstone Mortgage Trust, Inc.
Notes to Consolidated Financial Statements (continued)
9. DERIVATIVE FINANCIAL INSTRUMENTS
The sole objective of our use of derivative financial instruments is to minimize the risks and/or costs associated with our investments and/or financing transactions. These derivatives may or may not qualify as net investment, cash flow, or fair value hedges under the hedge accounting requirements of ASC 815 – “Derivatives and Hedging.” Derivatives not designated as hedges are not speculative and are used to manage our exposure to interest rate movements and other identified risks.
For more information onRefer to Note 2 for additional discussion of the accounting for designated and
non-designated
hedges, refer to Note 2.The use of derivative financial instruments involves certain risks, including the risk that the counterparties to these contractual arrangements do not perform as agreed. To mitigate this risk, we only enter into derivative financial instruments with counterparties that have appropriate credit ratings and are major financial institutions with which we and our affiliates may also have other financial relationships.
We do not anticipate that any of the counterparties will fail to meet their obligations.Net Investment Hedges of Foreign Currency Risk
Certain of our international investments expose us to fluctuations in foreign interest rates and currency exchange rates. These fluctuations may impact the value of our cash receipts and payments in terms of our functional currency, the U.S. Dollar. We use foreign currency forward contracts to protect the value or fix the amount of certain investments or cash flows in terms of the U.S. Dollar.
The following table details our outstanding foreign exchange derivatives that were designated as net investment hedges of foreign currency risk (notional amount in thousands):
| | | | | | | | | | | | | | | | | | |
September 30, 2017 | | | December 31, 2016 | |
Foreign Currency Derivatives | | Number of
Instruments | | | | Notional
Amount | | | Foreign Currency Derivatives | | Number of
Instruments | | | | Notional
Amount | |
Sell GBP Forward | | 1 | | | | £ | 112,700 | | | Sell GBP Forward | | 2 | | | | £ | 141,900 | |
Sell CAD Forward | | 1 | | | | C$ | 102,000 | | | Sell CAD Forward | | 2 | | | | C$ | 122,900 | |
| | | | | | | | | | Sell EUR Forward | | 1 | | | | € | 44,900 | |
Cash Flow Hedges of Interest Rate Risk
Certain of our
financing transactions expose us to
interest rate risks, which include a fixed versus floating rate mismatch between our assets and liabilities. We use derivative financial instruments, which include interest rate caps and swaps, and may also include interest rate options, floors, and other interest rate derivative contracts, to hedge interest rate
risk associated with our borrowings where there is potential for an index mismatch.risk.
Blackstone Mortgage Trust, Inc.
Notes to Consolidated Financial Statements (continued)
(Unaudited)
The following tables detail our outstanding interest rate derivatives that were designated as cash flow hedges of interest rate risk (notional amount in thousands):
| | | | | | | | | | | | |
September 30, 2017 |
Interest Rate Derivatives | | Number of
Instruments | | Notional
Amount | | | Strike | | Index | | Wtd.-Avg.
Maturity (Years) |
Interest Rate Swaps | | 4 | | C$ | 108,183 | | | 1.0% | | CDOR | | 1.7 |
Interest Rate Caps | | 9 | | $ | 204,248 | | | 2.4% | | USD LIBOR | | 1.7 |
Interest Rate Caps | | 3 | | C$ | 23,370 | | | 2.0% | | CDOR | | 0.6 |
|
December 31, 2016 |
Interest Rate Derivatives | | Number of
Instruments | | Notional
Amount | | | Strike | | Index | | Wtd.-Avg.
Maturity (Years) |
Interest Rate Swaps | | 4 | | C$ | 108,271 | | | 1.0% | | CDOR | | 2.4 |
Interest Rate Caps | | 21 | | $ | 802,256 | | | 2.0% | | USD LIBOR | | 0.4 |
Interest Rate Caps | | 5 | | C$ | 400,035 | | | 2.0% | | CDOR | | 0.4 |
Interest Rate Cap | | 1 | | £ | 15,142 | | | 2.0% | | GBP LIBOR | | 0.3 |
| | | | | | | | | | | | | | | | | | | | | | | | |
| |
Interest Rate Derivatives | | | | | | | | | | | | | | | | | Wtd.-Avg. Maturity (Years) | |
| | | | | | | | | | C$ | | | | | | | | | | | | | | |
| | | | | | | | | | C$ | | | | | | | | | | | | | | |
| | | | | | | | | | | | | | | | | | | | | | | | |
| |
Interest Rate Derivatives | | | | | | | | | | | | | | | | | Wtd.-Avg. Maturity (Years) | |
| | | | | | | | | | C$ | | | | | | | | | | | | | | |
| | | | | | | | | | C$ | | | | | | | | | | | | | | |
Amounts reported in accumulated other comprehensive income (loss) related to derivatives will be reclassified to interest expense as interest payments are made on our floating rate debt. During the twelve months following
SeptemberJune 30,
2017,2020, we estimate that an additional
$561,000$13,000 will be reclassified from accumulated other comprehensive income (loss) as an increase to interest
income.Non-designatedexpense.
Net Investment Hedges
of Foreign Currency Risk
Certain of our international investments expose us to fluctuations in foreign interest rates and currency exchange rates. These fluctuations may impact the value of our cash receipts and payments in terms of our functional currency, the U.S. dollar. We use foreign currency forward contracts to protect the value or fix the amount of certain investments or cash flows in terms of the U.S. dollar. During the three
and nine months ended
September 30, 2017,March 31, 2020, we
recorded lossesterminated all of
$42,000our outstanding foreign currency forward contracts, with aggregate notional amounts of€
552.1 million, £365.5 million, A$134.8 million, and
$355,000, respectively, related to non-designated hedges that were reported as a component of interest expense in our consolidated financial statements.C$23.7 million. During the three
and nine months ended
SeptemberJune 30,
2016,2020, we
recorded lossesentered into foreign currency forward contracts with aggregate notional amounts of
$528,000€
620.4 million, £530.2 million, A$92.8 million, and
$2.2 million, respectively.The following tables summarize our non-designated hedges (notional amount in thousands):
| | | | | | |
September 30, 2017 | |
Non-designated Hedges | | Number of
Instruments | | Notional
Amount | |
Buy USD / Sell GBP Forward | | 1 | | £ | 35,000 | |
Buy GBP / Sell USD Forward | | 1 | | £ | 35,000 | |
Buy USD / Sell CAD Forward | | 1 | | C$ | 15,000 | |
Buy CAD / Sell USD Forward | | 1 | | C$ | 15,000 | |
Buy GBP / Sell EUR Forward | | 1 | | € | 12,857 | |
|
December 31, 2016 | |
Non-designated Hedges | | Number of
Instruments | | Notional
Amount | |
Interest Rate Caps | | 3 | | $ | 256,875 | |
Interest Rate Caps | | 2 | | C$ | 37,221 | |
Buy GBP / Sell EUR Forward | | 1 | | € | 12,857 | |
C$24.4 million.
Blackstone Mortgage Trust, Inc.
Notes to Consolidated Financial Statements (continued)
Designated Hedges of
Derivative InstrumentsForeign Currency Risk
The following table
summarizes the fair valuedetails our outstanding foreign exchange derivatives that were designated as net investment hedges of
our derivative financial instruments ($foreign currency risk (notional amount in thousands):
| | | | | | | | | | | | | | | | |
| | | Fair Value of Derivatives in an
Asset Position(1) as of | | | Fair Value of Derivatives in a
Liability Position(2) as of | |
| | | September 30, 2017 | | | December 31, 2016 | | | September 30, 2017 | | | December 31, 2016 | |
Derivatives designated as hedging instruments: | | | | | | | | | | | | | | | | |
Foreign exchange contracts | | $ | — | | | $ | 3,268 | | | $ | 5,617 | | | $ | 210 | |
Interest rate derivatives | | | 1,238 | | | | 331 | | | | — | | | | — | |
| | | | | | | | | | | | | | | | |
Total derivatives designated as hedging instruments | | $ | 1,238 | | | $ | 3,599 | | | $ | 5,617 | | | $ | 210 | |
| | | | | | | | | | | | | | | | |
Derivatives not designated as hedging instruments: | | | | | | | | | | | | | | | | |
Foreign exchange contracts | | $ | 390 | | | $ | 487 | | | $ | 1,550 | | | $ | — | |
Interest rate derivatives | | | — | | | | — | | | | — | | | | — | |
| | | | | | | | | | | | | | | | |
Total derivatives not designated as hedging instruments | | $ | 390 | | | $ | 487 | | | $ | 1,550 | | | $ | — | |
| | | | | | | | | | | | | | | | |
Total Derivatives | | $ | 1,628 | | | $ | 4,086 | | | $ | 7,167 | | | $ | 210 | |
| | | | | | | | | | | | | | | | |
| |
| (1) | Included in other assets in our consolidated balance sheets.
|
| (2) | Included in other liabilities in our consolidated balance sheets.
|
| | | | | | | | | | | | | | | | | | |
| | | |
| | | | | | | | | | | | | | |
Foreign Currency Derivatives | | | | | | | | Foreign Currency Derivatives | | | | | | |
Buy USD / Sell EUR Forward | | | | | | | 607,690 | | | Buy USD / Sell GBP Forward | | | | | | £ | | |
Buy USD / Sell GBP Forward | | | | | | | | | | Buy USD / Sell EUR Forward | | | | | | € | 525,600 | |
Buy USD / Sell AUD Forward | | | | | | | | | | Buy USD / Sell AUD Forward | | | | | | A$ | | |
Buy USD / Sell CAD Forward | | | | | | | | | | Buy USD / Sell CAD Forward | | | | | | | | |
Non-designated
Hedges of Foreign Currency RiskThe following table details our outstanding foreign exchange derivatives that werenon-designated
hedges of foreign currency risk (notional amount in thousands): | | | | | | | | | | | | | | | | | | |
| | | |
| | | | | | | | | | | | | | |
| | | | | | | | | | | | | | |
Buy USD / Sell GBP Forward | | | | | | £ | | | | Buy CAD / Sell USD Forward | | | | | | | | |
Buy USD / Sell EUR Forward | | | | | | € | | | | Buy USD / Sell CAD Forward | | | | | | | | |
Buy EUR / Sell USD Forward | | | | | | € | | | | Buy GBP / Sell EUR Forward | | | | | | | 12,857 | |
| | | | | | | | | | Buy AUD / Sell USD Forward | | | | | | | | |
| | | | | | | | | | Buy USD / Sell AUD Forward | | | | | | | | |
Financial Statement Impact of Hedges of Foreign Currency Risk
The following table presents the effect of our derivative financial instruments on our consolidated statements of operations ($ in thousands):
| | | | | | | | | | | | | | | | | | | | |
| | | Amount of Gain (Loss)
Recognized in
OCI on Derivatives | | | Location of
Gain (Loss)
Reclassified from
Accumulated
OCI into Income | | | Amount of Gain
(Loss) Reclassified from
Accumulated OCI into Income | |
Derivatives in Hedging Relationships | | Three Months
Ended
September 30,
2017 | | | Nine Months
Ended
September 30,
2017 | | | | Three Months
Ended
September 30,
2017 | | | Nine Months
Ended
September 30,
2017 | |
Net Investment Hedges | | | | | | | | | | | | | | | | | | | | |
Foreign exchange contracts(1) | | $ | (8,524 | ) | | $ | (21,757 | ) | | | Interest Expense | | | $ | — | | | $ | — | |
Cash Flow Hedges | | | | | | | | | | | | | | | | | | | | |
Interest rate derivatives | | | 536 | | | | 707 | | |
| Interest Income
(Expense)(2) |
| | | 41 | | | | (900 | ) |
| | | | | | | | | | | | | | | | | | | | |
Total | | $ | (7,988 | ) | | $ | (21,050 | ) | | | | | | $ | 41 | | | $ | (900 | ) |
| | | | | | | | | | | | | | | | | | | | |
| | | | | Amount of Income (Expense) Recognized | |
| | | | | from Foreign Exchange Contracts | |
| | | | | | | | | |
Foreign Exchange Contracts | | | | | | | | | |
| | | | | | | | | |
| | | | | | $ | | | | $ | | |
| | | | | | | | | | | | |
| | | | | | | | ) | | | | ) |
| | | | | | | | | | | | | |
| | | | | | $ | | | | $ | | ) |
| | |
| | Represents the forward points earned on our foreign currency forward contracts, which reflect the interest rate differentials between the applicable base rate for our foreign currency investments and USD LIBOR. These forward contracts effectively convert the rate exposure to USD LIBOR, resulting in additional interest income earned in U.S. dollar terms. |
| | Represents the spot rate movement in our non-designated hedges, which are marked-to-market and recognized in interest expense. |
Blackstone Mortgage Trust, Inc.
Notes to Consolidated Financial Statements (continued)
Valuation and Other Comprehensive Income
The following table summarizes the fair value of our derivative financial instruments ($ in thousands):
| | | | | | | | | | | | | | | | |
| | Fair Value of Derivatives in an | | | Fair Value of Derivatives in a | |
| | | | | Liability Position (2) as of | |
| | | | | | | | | | | | |
Derivatives designated as hedging instruments: | | | | | | | | | | | | | | | | |
Foreign exchange contracts | | $ | | | | $ | | | | $ | | | | $ | | |
Interest rate derivatives | | | | | | | | | | | | | | | | |
| | | | | | | | | | | | | | | | | |
| | $ | | | | $ | | | | $ | | | | $ | | |
| | | | | | | | | | | | | | | | | |
Derivatives not designated as hedging instruments: | | | | | | | | | | | | | | | | |
Foreign exchange contracts | | $ | | | | $ | | | | $ | | | | $ | | |
Interest rate derivatives | | | | | | | | | | | | | | | | |
| | | | | | | | | | | | | | | | | |
| | $ | | | | $ | | | | $ | | | | $ | | |
| | | | | | | | | | | | | | | | | |
| | $ | | | | $ | | | | $ | | | | $ | | |
| | | | | | | | | | | | | | | | | |
| |
| (1) | Included in other assets in our consolidated balance sheets. |
| (2) | Included in other liabilities in our consolidated balance sheets. |
The following table presents the effect of our derivative financial instruments on our consolidated statements of operations ($ in thousands):
| | | | | | | | | | | | | | | | | | | | |
| | | | | | | | Reclassified from Accumulated | |
| | | | | | | | | | | | | | | |
Derivatives in Hedging Relationships | | | | | | | | Accumulated
OCI into Income | | | | | | | |
| | | | | | | | | | | | | | | | | | | | |
Foreign exchange contracts (1) | | $ | | ) | | $ | | | | | | | | $ | | | | $ | | |
| | | | | | | | | | | | | | | | | | | | |
Interest rate derivatives | | | | ) | | | | ) | | | | (2) | | | | ) | | | | |
| | | | | | | | | | | | | | | | | | | | | |
| | $ | | ) | | $ | | | | | | | | $ | | ) | | $ | | |
| | | | | | | | | | | | | | | | | | | | | |
| | |
| | During the three and ninesix months ended SeptemberJune 30, 2017,2020, we paid net cash settlements of $8.7$4.7 million and $11.8received net cash settlements of $57.0 million, respectively, on our foreign currency forward contracts, compared to receiving $19.2 million and $17.4 million during the same periods in 2016.contracts. Those amounts are included as a component of accumulated other comprehensive income ( loss ) on our consolidated balance sheets. |
| | During the three months ended SeptemberJune 30, 2017,2020, we recorded total interest and related incomeexpenses of $146.4$84.9 million, which included interest incomeexpenses of $41,000$9,000 related to our cash flow hedges. During the ninesix months ended SeptemberJune 30, 2017,2020, we incurredrecorded total interest and related expenses of $168.9$189.1 million, which included $900,000$20,000 related to income generated by our cash flow hedges.hedges |
Credit-Risk Related Contingent Features
We have entered into agreements with certain of our derivative counterparties that contain provisions where if we were to default on any of our indebtedness, including default where repayment of the indebtedness has not been accelerated by the lender, we may also be declared in default on our derivative obligations. In addition, certain of our agreements with our derivative counterparties require that we post collateral to secure net liability positions. As of
SeptemberJune 30,
2017,2020, we were in a net liability position with each such derivative counterparty and posted collateral of
$7.8 million.$22.2 million under these derivative contracts. As of December 31,
20162019, we were in a net
assetliability position with each such derivative counterparty and posted collateral of
$79,000.$30.8 million under these derivative contracts.
Blackstone Mortgage Trust, Inc.
Notes to Consolidated Financial Statements (continued)
Stock and Stock Equivalents
During the three months ended June 30, 2020, we filed articles of amendment to ourus to issue an additional 200,000,000 shares of common stock. As of
SeptemberJune 30,
2017,2020, we had the authority to issue up to
300,000,000500,000,000 shares of stock, consisting of
200,000,000400,000,000 shares of class A common stock and 100,000,000 shares of preferred stock. Subject to applicable NYSE listing requirements, our board of directors is authorized to cause us to issue additional shares of authorized stock without stockholder approval. In addition, to the extent not issued, currently authorized stock may be reclassified between class A common stock and preferred stock. We did not have any shares of preferred stock issued and outstanding as of
SeptemberJune 30,
2017.2020.
Class A Common Stock and Deferred Stock Units
Holders of shares of our class A common stock are entitled to vote on all matters submitted to a vote of stockholders and are entitled to receive such dividends as may be authorized by our board of directors and declared by us, in all cases subject to the rights of the holders of shares of outstanding preferred stock, if any.
The following table details ourissuances
of class A common stock during the six months ended June 30, 2020($ in thousands, except share and per share data):
| | | | | | | | | | | | |
| | Class A Common Stock Offerings | | | | |
| | | | | | | | | |
| | | | | | | | | | | | |
Gross share issue price (2) | | $ | | | | $ | | | | $ | | |
| | $ | | | | $ | | | | $ | | |
| | $ | | | | $ | | | | $ | | |
| |
| | |
| | Represents shares issued to our Manager in satisfaction of the management and incentive feesaccrued in the first quarter of 2020.The per share price was calculated based on the volume-weighted average price on the NYSE of our class A common stock over the five trading days following our April 29, 2020 first quarter 2020 earnings conference call. |
| | Represents the weighted-average gross price per share paid by the underwriters or sales agents, as applicable, in June 2020. |
| | Represents the weighted-average net proceeds per share after underwriting or sales discounts and commissions, as applicable, in June 2020. |
| | Net proceeds represents proceeds received from the underwriters less applicable transaction costs in June 2020. |
We also issue restricted class A common stock under our stock-based incentive plans. Refer to Note
1413 for additional discussion of these long-term incentive plans. In addition to our class A common stock, we also issue deferred stock units to certain members of our board of directors in lieu of cash compensation for services rendered. These deferred stock units are non-voting, but carry the right to receive dividends in the form of additional deferred stock units in an amount equivalent to the cash dividends paid to holders of shares of class A common stock.
Blackstone Mortgage Trust, Inc.
Notes to Consolidated Financial Statements (continued)
The following table details the movement in our outstanding shares of class A common stock, including restricted class A common stock and deferred stock units:
| | | | | | | | |
| | | Nine Months Ended September 30, | |
Common Stock Outstanding(1) | | 2017 | | | 2016 | |
Beginning balance | | | 94,709,290 | | | | 93,843,847 | |
Issuance of class A common stock(2) | | | 971 | | | | 812 | |
Issuance of restricted class A common stock, net | | | 286,773 | | | | 209,798 | |
Issuance of deferred stock units | | | 20,560 | | | | 20,850 | |
| | | | | | | | |
Ending balance | | | 95,017,594 | | | | 94,075,307 | |
| | | | | | | | |
| |
| | | | | | | | |
| | Six Months Ended June 30, | |
Common Stock Outstanding (1) | | | | | | |
| | | | | | | | |
Issuance of class A common stock (2) | | | | | | | | |
Issuance of restricted class A common stock, net | | | | | | | | |
Issuance of deferred stock units | | | | | | | | |
| | | | | | | | | |
| | | | | | | | |
| | | | | | | | | |
| |
| | | | | | |
| | Includes deferred stock units held by members of our board of directors of 189,587281,143 and 162,371244,536 as of SeptemberJune 30, 20172020 and 2016,2019, respectively. |
| | Consists of
Includes 971 and 812553 shares issued under our dividend reinvestment program during the ninesix months ended SeptemberJune 30, 20172020 and 2016,2019, respectively. |
Dividend Reinvestment and Direct Stock Purchase Plan
On March 25, 2014, we adopted a dividend reinvestment and direct stock purchase plan, under which we registered and reserved for issuance, in the aggregate, 10,000,000 shares of class A common stock. Under the dividend reinvestment component of this plan, our class A common stockholders can designate all or a portion of their cash dividends to be reinvested in additional shares of class A common stock. The direct stock purchase component allows stockholders and new investors, subject to our approval, to purchase shares of class A common stock directly from us. During the three and
ninesix months ended
SeptemberJune 30,
2017,2020, we issued
428646 shares and 971 shares, respectively, of class A common stock under the dividend reinvestment component of the plan compared to
262272 shares and
812553 shares,
respectively, for the same periods in
2016.2019. As of
SeptemberJune 30,
2017,2020, a total of
9,997,3569,993,053 shares of class A common stock remained available for issuance under the dividend reinvestment and direct stock purchase plan.
Blackstone Mortgage Trust, Inc.
Notes to Consolidated Financial Statements (continued)
(Unaudited)
At the Market Stock Offering Program
On
May 9, 2014,November 14, 2018, we entered into
six equity distribution agreements, or ATM Agreements, pursuant to which we may sell, from time to time, up to an aggregate sales price of
$200.0$500.0 million of our class A common stock. On July
29, 2016, in connection with filing a new universal shelf registration statement on Form S-3,26, 2019, we
amended our existing ATM Agreements and entered into
amendments to each of theone additional ATM
Agreements.Agreement. Sales of class A common stock made pursuant to
theour ATM Agreements may be made in negotiated transactions or transactions that are deemed to be “at the market” offerings as defined in Rule 415 under the Securities Act of 1933, as amended. Actual sales
will depend on a variety of factors including market conditions, the trading price of our class A common stock, our capital needs, and our determination of the appropriate sources of funding to meet such needs. We did not sell any shares of our class A common stock under
the ATM Agreements during the
ninesix months ended
SeptemberJune 30,
20172020. During the six months ended June 30, 2019, we issued and
2016.sold 1,909,628 shares of class A common stock under ATM Agreements, generating net proceeds totaling $65.4 million. As of
SeptemberJune 30,
2017,2020, sales of our class A common stock with an aggregate sales price of
$188.6$363.8 million remained available for issuance under
theour ATM Agreements.
We generally intend to distribute substantially all of our taxable income, which does not necessarily equal net income
(loss) as calculated in accordance with GAAP, to our stockholders each year to comply with the REIT provisions of the Internal Revenue Code of 1986, as amended, or the Internal Revenue Code. Our dividend policy remains subject to revision at the discretion of our board of directors. All distributions will be made at the discretion of our board of directors and will depend upon our taxable income, our financial condition, our maintenance of REIT status, applicable law, and other factors as our board of directors deems relevant.
Blackstone Mortgage Trust, Inc.
Notes to Consolidated Financial Statements (continued)
On
SeptemberJune 15,
2017,2020, we declared a dividend of $0.62 per share, or
$58.8$90.6 million
in aggregate, that was paid on
October 13, 2017July 15, 2020, to stockholders of record as of
SeptemberJune 30,
2017.2020. The following table details our dividend activity ($ in thousands, except per share data):
| | | | | | | | | | | | | | | | |
| | | Three Months Ended September 30, | | | Nine Months Ended September 30, | |
| | | 2017 | | | 2016 | | | 2017 | | | 2016 | |
Dividends declared per share of common stock | | $ | 0.62 | | | $ | 0.62 | | | $ | 1.86 | | | $ | 1.86 | |
Total dividends declared | | $ | 58,793 | | | $ | 58,226 | | | $ | 176,374 | | | $ | 174,678 | |
| | | | | | | | | | | | | | | | |
| | Three Months Ended June 30, | | | Six Months Ended June 30, | |
| | | | | | | | | | | | |
Dividends declared per share of common stock | | $ | | | | $ | | | | $ | | | | $ | | |
| | $ | | | | $ | | | | $ | | | | $ | | |
We calculate our basic and diluted earnings per share using the two-class method for all periods presented as the unvested shares of our restricted class A common stock qualify as participating securities, as defined by GAAP. These restricted shares have the same rights as our other shares of class A common stock, including participating in any dividends, and therefore have been included in our basic and diluted net income
(loss)
per share calculation. Our Convertible Notes are excluded from dilutive earnings per share as we have the intent and ability to settle these instruments in cash.
The following table sets forth the calculation of basic and diluted net income
(loss)
per share of class A common stock based on the weighted-average of both restricted and unrestricted class A common stock outstanding ($ in thousands, except per share data):
| | | | | | | | | | | | | | | | |
| | | Three Months Ended September 30, | | | Nine Months Ended September 30, | |
| | | 2017 | | | 2016 | | | 2017 | | | 2016 | |
Net income(1) | | $ | 57,722 | | | $ | 64,794 | | | $ | 159,741 | | | $ | 184,921 | |
Weighted-average shares outstanding, basic and diluted | | | 95,013,087 | | | | 94,071,537 | | | | 95,004,188 | | | | 94,067,923 | |
| | | | | | | | | | | | | | | | |
Per share amount, basic and diluted | | $ | 0.61 | | | $ | 0.69 | | | $ | 1.68 | | | $ | 1.97 | |
| | | | | | | | | | | | | | | | |
| |
| | | | | | | | | | | | | | | | |
| | Three Months Ended June 30, | | | Six Months Ended June 30, | |
| | | | | | | | | | | | |
| | $ | | | | $ | | | | $ | | ) | | $ | | |
Weighted-average shares outstanding, basic and diluted | | | | | | | | | | | | | | | | |
| | | | | | | | | | | | | | | | | |
Per share amount, basic and diluted | | $ | | | | $ | | | | $ | | ) | | $ | | |
| | | | | | | | | | | | | | | | | |
| | | | | | | | | | | | | | | | |
| | | | | | | | | | | | | | |
| | (1) | Represents net income (loss) attributable to Blackstone Mortgage Trust, Inc.Trust. | |
Blackstone Mortgage Trust, Inc.
Notes to Consolidated Financial Statements (continued)
(Unaudited)
Other Balance Sheet Items
Accumulated Other Comprehensive
LossIncome
As of
SeptemberJune 30,
2017,2020, total accumulated other comprehensive
lossincome was
$32.4$8.9 million, primarily representing
(i) $63.5 million of cumulative unrealized currency translation adjustments on assets and liabilities denominated in foreign currencies and (ii) an offsetting $31.1$137.8 million of net realized and unrealized gains related to changes in the fair value of derivative
instruments.instruments, offset by $128.9 million of cumulative unrealized currency translation adjustments on assets and liabilities denominated in foreign currencies. As of December 31,
2016,2019, total accumulated other comprehensive loss was
$56.2$16.2 million, primarily representing
(i) $107.5$80.7 million of cumulative unrealized currency translation adjustments on assets and liabilities denominated in foreign currencies,
and (ii) an offsetting $51.3offset by $64.5 million of net realized and unrealized gains related to changes in the fair value of derivative instruments.
The non-controlling interests included on our consolidated balance sheets represent the equity interests in our Multifamily Joint Venture that are not owned by us. A portion of our Multifamily Joint Venture’s consolidated equity and results of operations are allocated to these
non-controlling
interests based on their
pro-ratapro rata ownership of our Multifamily Joint Venture. As of
SeptemberJune 30,
2017,2020, our Multifamily Joint Venture’s total equity was
$41.2$140.1 million, of which
$35.0$119.1 million was owned by
Blackstone Mortgage Trust,us, and
$6.2$21.0 million was allocated to
non-controlling
interests. As of December 31,
2016, we did not have any non-controlling interests on2019, our
consolidated financial statements.12.Multifamily Joint Venture’s total equity was $147.3 million, of which $125.2 million was owned by us, and $22.1 million was allocated to
non-controlling
interests.Our other expenses consist of the management and incentive fees we pay to our Manager and our general and administrative expenses.
Blackstone Mortgage Trust, Inc.
Notes to Consolidated Financial Statements (continued)
Management and Incentive Fees
Pursuant to a management agreement between our Manager and us, or our Management Agreement, our Manager earns a base management fee in an amount equal to 1.50% per annum multiplied by our outstanding equity balance, as defined in the Management Agreement. In addition, our Manager is entitled to an incentive fee in an amount equal to the product of (i) 20% and (ii) the excess of (a) our Core Earnings (as defined in our Management Agreement) for the previous 12-month period over (b) an amount equal to 7.00% per annum multiplied by our outstanding Equity, provided that our Core Earnings over the prior three-year period is greater than zero. Core Earnings, as defined in our Management Agreement, is generally equal to our net income (loss) prepared in accordance with GAAP, excluding (i) certain non-cash items, (ii) the net income (loss) related to our legacy portfolio, and (iii) incentive management fees.
During the three and
ninesix months ended
SeptemberJune 30,
2017,2020, we incurred
$9.5$14.8 million and
$28.6$29.2 million, respectively, of management fees payable to our Manager, compared to
$9.5$13.3 million and
$28.4$26.4 million during the same
periodsperiod in
2016.2019. In addition, during the three and
ninesix months ended
SeptemberJune 30,
2017,2020, we incurred
$3.7$5.7 million and
$11.9$10.5 million, respectively, of incentive fees payable to our Manager, compared to
$4.2$7.7 million and
$14.8$14.4 million during the same
periodsperiod in
2016.2019. During the three months ended June 30, 2020, we issued 840,696 shares of class A common stock to our Manager in satisfaction of our aggregate $19.3 million of management and incentive fees
the first quarter of 2020.As of
SeptemberJune 30,
20172020 and December 31,
2016,2019 we had accrued management and incentive fees payable to our Manager of
$13.2$20.5 million and
$12.8$20.2 million, respectively.
Blackstone Mortgage Trust, Inc.
Notes to Consolidated Financial Statements (continued)
(Unaudited)
General and Administrative Expenses
General and administrative expenses consisted of the following ($ in thousands):
| | | | | | | | | | | | | | | | |
| | | Three Months Ended September 30, | | | Nine Months Ended September 30, | |
| | | 2017 | | | 2016 | | | 2017 | | | 2016 | |
Professional services(1) | | $ | 933 | | | $ | 828 | | | $ | 2,811 | | | $ | 2,474 | |
Operating and other costs(1) | | | 489 | | | | 305 | | | | 1,424 | | | | 1,695 | |
| | | | | | | | | | | | | | | | |
Subtotal | | | 1,422 | | | | 1,133 | | | | 4,235 | | | | 4,169 | |
Non-cash and CT Legacy Portfolio compensation expenses | | | | | | | | | | | | | | | | |
Management incentive awards plan - CTOPI(2) | | | — | | | | 938 | | | | — | | | | 1,106 | |
Management incentive awards plan - CT Legacy Partners(3) | | | — | | | | 354 | | | | — | | | | 1,112 | |
Restricted class A common stock earned | | | 5,819 | | | | 4,855 | | | | 17,496 | | | | 14,190 | |
Director stock-based compensation | | | 125 | | | | 94 | | | | 313 | | | | 282 | |
| | | | | | | | | | | | | | | | |
Subtotal | | | 5,944 | | | | 6,241 | | | | 17,809 | | | | 16,690 | |
| | | | | | | | | | | | | | | | |
Total BXMT expenses | | | 7,366 | | | | 7,374 | | | | 22,044 | | | | 20,859 | |
Other expenses | | | 53 | | | | 40 | | | | 175 | | | | 131 | |
| | | | | | | | | | | | | | | | |
Total general and administrative expenses | | $ | 7,419 | | | $ | 7,414 | | | $ | 22,219 | | | $ | 20,990 | |
| | | | | | | | | | | | | | | | |
| |
(1) During the three and nine months ended September 30, 2017 we recognized an aggregate $112,000 of expenses related to our Multifamily Joint Venture. (2) Represents the portion of CTOPI promote revenue recorded under compensation awards. See Note 4 for further discussion. (3) Represents the amounts recorded under the CT Legacy Partners management incentive awards during the period. See below for discussion of the CT Legacy Partners management incentive awards plan. | |
CT Legacy Partners Management Incentive Awards Plan
In conjunction with our March 2011 restructuring, we created an employee pool for up to 6.75% of the distributions paid to the common equity holders of our subsidiary, CT Legacy Partners (subject to certain caps and priority distributions). During the three and nine months ended September 30, 2016 we recognized $354,000 and $1.1 million, respectively, of expenses under the CT Legacy Partners incentive plan. Our investment in CT Legacy Partners was substantially realized as of December 31, 2016.
13.
| | | | | | | | | | | | | | | | |
| | Three Months Ended June 30, | | | Six Months Ended June 30, | |
| | | | | | | | | | | | |
| | $ | | | | $ | | | | $ | | | | $ | | |
Operating and other costs (1) | | | | | | | | | | | | | | | | |
| | | | | | | | | | | | | | | | | |
| | | | | | | | | | | | | | | | |
Non-cash compensation expenses | | | | | | | | | | | | | | | | |
Restricted class A common stock earned | | | | | | | | | | | | | | | | |
Director stock-based compensation | | | | | | | | | | | | | | | | |
| | | | | | | | | | | | | | | | | |
| | | | | | | | | | | | | | | | |
| | | | | | | | | | | | | | | | | |
Total general and administrative expenses | | $ | | | | $ | | | | $ | | | | $ | | |
| | | | | | | | | | | | | | | | | |
| | |
| | During the three and six months ended June 30, 2020, we recognized an aggregate $200,000 and $576,000, respectively, of expenses related to our Multifamily Joint Venture. During the three and six months ended June 30, 2019, we recognized an aggregate $164,000 and $333,000, respectively, of expenses related to our Multifamily Joint Venture. |
We
have elected to be taxed as a REIT
effective January 1, 2003, under the Internal Revenue Code for U.S. federal income tax purposes. We generally must distribute annually at least 90% of our net taxable income, subject to certain adjustments and excluding any net capital gain, in order for U.S. federal income tax not to apply to our earnings that we distribute. To the extent that we satisfy this distribution requirement, but distribute less than 100% of our net taxable income, we will be subject to U.S. federal income tax on our undistributed taxable income. In addition, we will be subject to a 4% nondeductible excise tax if the actual amount that we pay out to our stockholders in a calendar year is less than a minimum amount specified under U.S. federal tax laws.
Our qualification as a REIT also depends on our ability to meet various other requirements imposed by the Internal Revenue Code, which relate to organizational structure, diversity of stock ownership, and certain restrictions with regard to the nature of our assets and the sources of our income. Even if we qualify as a REIT, we may be subject to certain U.S. federal income and excise taxes and state and local taxes on our income and assets. If we fail to
Blackstone Mortgage Trust, Inc.
Notes to Consolidated Financial Statements (continued)
maintain our qualification as a REIT for any taxable year, we may be subject to material penalties as well as federal, state, and local income tax on our taxable income at regular corporate rates and we would not be able to qualify as a REIT for the subsequent four full taxable years. As of June 30, 2020 and December 31, 2019, we were in compliance with all REIT requirements.
Securitization transactions could result in the creation of taxable mortgage pools for federal income tax purposes. As a REIT, so long as we own 100% of the equity interests in a taxable mortgage pool, we generally would not be adversely affected by the characterization of the securitization as a taxable mortgage pool. Certain categories of stockholders, however, such as foreign stockholders eligible for treaty or other benefits, stockholders with net operating losses, and certaintax-exempt
stockholders that are subject to unrelated business income tax, or UBTI, could be subject to increased taxes on a portion of their dividend income from us that is attributable to the taxable mortgage pool. We have not made UBTI distributions to our common stockholders and do not intend to make such UBTI distributions in the future. During the three and six months ended June 30, 2020, we recorded a current income tax provision of $23,000 and $173,000, respectively, primarily related to activities of our taxable REIT subsidiaries and various state and local taxes. During the three and six months ended June 30, 2019, we recorded a current income tax provision of $46,000 and $147,000, respectively. We did 0t have any deferred tax assets or liabilities as of June 30, 2020 or December 31, 2019.
We have net operating losses, or NOLs, generated by our predecessor business that may be carried forward and utilized in current or future periods. As a result of our issuance of 25,875,000 shares of class A common stock in May 2013, the availability of our NOLs is generally limited to $2.0 million per annum by change of control provisions promulgated by the Internal Revenue Service with respect to the ownership of Blackstone Mortgage Trust. As of December 31, 2019, we had estimated NOLs of $159.0 million that will expire in 2029, unless they are utilized by us prior to expiration.
As of June 30, 2020, tax years 2016 through 2019 remain subject to examination by taxing authorities.
13. STOCK-BASED INCENTIVE PLANS
We are externally managed by our Manager and do not currently have any employees. However, as of June 30, 2020, our Manager, certain individuals employed by an affiliate of our Manager, and certain members of our board of directors were compensated, in part, through our issuance of stock-based instruments.
We had stock-based incentive awards outstanding under 9 benefit plans as of June 30, 2020. Seven of such benefit plans have expired and 0 new awards may be issued under them. Under our two current benefit plans, a maximum of 5,000,000 shares of our class A common stock may be issued to our Manager, our directors and officers, and certain employees of affiliates of our Manager. As of June 30, 2020, there were 2,870,936 shares available under our current benefit plans.
The following table details the movement in our outstanding shares of restricted class A common stock and the weighted-average grant date fair value per share:
| | | | | | | | |
| | Restricted Class A
Common Stock | | | Weighted-Average Grant Date Fair Value Per Share | |
Balance as of December 31, 2019 | | | | | | $ | | |
| | | | | | | | |
| | | | ) | | | | |
| | | | ) | | | | |
| | | | | | | | | |
Balance as of June 30, 2020 | | | | | | $ | | |
| | | | | | | | | |
These shares generally vest in installments over a three-year period, pursuant to the terms of the respective award agreements and the terms of our current benefit plans. The 1,547,277 shares of restricted class A common stock outstanding as of June 30, 2020 will vest as follows: 501,794 shares will vest in 2020; 690,100 shares will vest in
Blackstone Mortgage Trust, Inc.
Notes to Consolidated Financial Statements (continued)
2021; and 355,383 shares will vest in 2022. As of June 30, 2020, total unrecognized compensation cost relating to unvested share-based compensation arrangements was $53.0 million based on the grant date fair value of shares granted subsequent to July 1, 2018. The compensation cost of our share based compensation arrangements for awards granted before July 1, 2018 is based on the closing price of our class A common stock of $31.43 on June 29, 2018, the last trading day prior to July 1, 2018. This cost is expected to be recognized over a weighted-average period of 1.1 years from June 30, 2020.
Assets and Liabilities Measured at Fair Value
The following table summarizes our assets and liabilities measured at fair value on a recurring basis ($ in thousands):
| | | | | | | | | | | | | | | | | | | | | | | | | | | | | | | | |
| | | | | | |
| | | | | | | | | | | | | | | | | | | | | | | | |
| | | | | | | | | | | | | | | | | | | | | | | | | | | | | | | | |
| | $ | | | | $ | | | | $ | | | | $ | | | | $ | | | | $ | | | | $ | | | | $ | | |
| | | | | | | | | | | | | | | | | | | | | | | | | | | | | | | | |
| | $ | | | | $ | | | | $ | | | | $ | | | | $ | | | | $ | | | | $ | | | | $ | | |
Refer to Note 2 for further discussion regarding fair value measurement.
Fair Value of Financial Instruments
As discussed in Note 2, GAAP requires disclosure of fair value information about financial instruments, whether or not recognized in the statement of financial position, for which it is practicable to estimate that value.
The following table details the book value, face amount, and fair value of the financial instruments described in Note 2 ($ in thousands):
| | | | | | | | | | | | | | | | | | | | | | | | |
| | | | | | |
| | | | | | | | | | | | | | | | | | |
| | | | | | | | | | | | | | | | | | |
| | | | | | | | | | | | | | | | | | | | | | | | |
Cash and cash equivalents | | $ | | | | $ | | | | $ | | | | $ | | | | $ | | | | $ | | |
| | | | | | | | | | | | | | | | | | | | | | | | |
Debt securities held-to-maturity (1) | | | | | | | | | | | | | | | | | | | | | | | | |
| | | | | | | | | | | | | | | | | | | | | | | | |
Secured debt agreements, net | | | | | | | | | | | | | | | | | | | | | | | | |
Securitized debt obligations, net | | | | | | | | | | | | | | | | | | | | | | | | |
| | | | | | | | | | | | | | | | | | | | | | | | |
| | | | | | | | | | | | | | | | | | | | | | | | |
(1) Included in other assets on our consolidated balance sheets.
Estimates of fair value for cash and cash equivalents and convertible notes are measured using observable, quoted market prices, or Level 1 inputs. Estimates of fair value for debt securities held to maturity, securitized debt obligations, and the secured term loans are measured using observable, quoted market prices, in inactive markets, or Level 2 inputs. All other fair value significant estimates are measured using unobservable inputs, or Level 3 inputs. See Note 2 for further discussion regarding fair value measurement of certain of our assets and liabilities.
15. VARIABLE INTEREST ENTITIES
Consolidated Variable Interest Entities
We have financed a portion of our loans through the CLOs and the 2017 Single Asset Securitization, all of which are VIEs. We are the primary beneficiary of, and therefore consolidate, the CLOs and the 2017 Single Asset Securitization on our balance sheet as we (i) control the relevant interests of the CLOs and the 2017 Single Asset Securitization that give us power to direct the activities that most significantly affect the CLOs and the 2017 Single Asset Securitization, and (ii) have the right to receive benefits and obligation to absorb losses of the CLOs and the 2017 Single Asset Securitization through the subordinate interests we own.
Blackstone Mortgage Trust, Inc.
Notes to Consolidated Financial Statements (continued)
The following table details the assets and liabilities of our consolidated CLOs and 2017 Single Asset Securitization VIEs ($ in thousands):
| | | | | | | | |
| | | | | | |
| | | | | | | | |
| | $ | | | | $ | | |
Current expected credit loss reserve | | | | ) | | | | |
| | | | | | | | | |
| | | | | | | | |
| | | | | | | | |
| | | | | | | | | |
| | $ | | | | $ | | |
| | | | | | | | | |
| | | | | | | | |
Securitized debt obligations, net | | $ | | | | $ | | |
| | | | | | | | |
| | | | | | | | | |
| | $ | | | | $ | | |
| | | | | | | | | |
Assets held by these VIEs are restricted and can be used only to settle obligations of the VIEs, including the subordinate interests owned by us. The liabilities of these VIEs arenon-recourse
to us and can only be satisfied from the assets of the VIEs. The consolidation of these VIEs results in an increase in our gross assets, liabilities, interest income and interest expense, however it does not affect our stockholders’ equity or net income Non-Consolidated
Variable Interest EntitiesIn the third quarter of 2018, we contributed a $517.5 million loan to the $1.0 billion 2018 Single Asset Securitization, which is a VIE, and invested in the related $99.0 million subordinate position. We are not the primary beneficiary of the VIE because we do not have the power to direct the activities that most significantly affect the VIE’s economic performance and, therefore, do not consolidate the 2018 Single Asset Securitization on our balance sheet. We have classified the subordinate positionas aheld-to-maturity
debt security that is included in other assets on our consolidated balance sheets. Our maximum exposure to loss from the 2018 Single Asset Securitization is limited to our book value of $75.8 million as of June 30, 2020. We are not obligated to provide, have not provided, and do not intend to provide financial support to these consolidated andnon-consolidated
VIEs. 16. TRANSACTIONS WITH RELATED PARTIES
We are managed by our Manager pursuant to the Management Agreement, the current term of which expires on December 19, 2020, and will be automatically renewed for a one-year term upon such date and each anniversary thereafter unless earlier terminated.
As of June 30, 2020 and December 31, 2019, our consolidated balance sheets included $20.5 million and $20.2 million of accrued management and incentive fees payable to our Manager, respectively. During the three and six months ended June 30, 2020, we paid aggregate management and incentive fees of $19.3 million and $39.4 million, respectively, to our Manager, compared to $19.8 million and $38.4 million during the same periods of 2019. During the three months ended June 30, 2020, we issued 840,696 shares of class A common stock to our Manager in satisfaction of our aggregate $19.3 million of management and incentive fees
the first quarter of 2020. The per share price with respect to such issuance was calculated based on the volume-weightedaverage
price on the NYSE of our class A common stock over the five trading days following our April 29, 2020 first quarter 2020 earnings conference call.
In addition, during the three and six months ended June 30, 2020, we reimbursed our Manager for expenses incurred on our behalf of $205,000 and $423,000, respectively, compared to $242,000 and $430,000 during the same periods of 2019.
Blackstone Mortgage Trust, Inc.
Notes to Consolidated Financial Statements (continued)
As of June 30, 2020, our Manager held 768,179 shares of unvested restricted class A common stock, which had an aggregate grant date fair value of $26.3 million, and vest in installments over three years from the date of issuance. During the three and six months ended June 30, 2020, we recordednon-cash
expenses related to shares held by our Manager of $4.2 million and $8.5 million, respectively, compared to $3.9 million and $7.7 million during the same period of 2019. Refer to Note 13 for further details on our restricted class A common stock. An affiliate of our Manager is the special servicer of the CLOs. This affiliate did not earn any special servicing fees related to the CLOs during the six months ended June 30, 2020 or 2019.
During the six months ended June 30, 2020, we originated two loans whereby the respective borrowers engaged an affiliate of our Manager to act as title insurance agent in connection with these transactions. We did not incur any expenses or receive any revenues as a result of these transactions. There were no similar transactions during the six months ended June 30, 2019.
During the three and six months ended June 30, 2020, we incurred $138,000 and $271,000, respectively, of expenses for various administrative, compliance, and capital market data services to third-party service providers that are affiliates of our Manager, compared to $90,000 and $176,000 during the same periods of 2019.
In the second quarter of 2020, a Blackstone-advised investment vehicle acquired an aggregate $5.0 million participation, or 2%, of the total 2020 Term Loan as a part of a broad syndication lead-arranged by JP Morgan. Blackstone
Partners L.P., an affiliate of our Manager, was engaged as a book-runner for the transaction and received aggregate fees of $250,000 in such capacity. Both of these transactions were on terms equivalent to those of unaffiliated parties.
In the first quarter of 2020, we acquired a $140.0 million interest in a total $421.5 million senior loan to a borrower that is partially owned by a Blackstone-advised investment vehicle. We will forgo allnon-economic
rights under the loan, including voting rights, so long as we are an affiliate of the borrower. The senior loan terms were negotiated by third parties without our involvement and our 33% interest in the senior loan was made on such market terms. In the second and fourth quarter of 2019, certain Blackstone-advised investment vehicles acquired an aggregate $60.0 million participation, or 8%, of the total 2019 Term Loan as a part of a broad syndication lead-arranged by JP Morgan. Blackstone
Partners L.P., an affiliate of our Manager, was engaged as a book-runner for the transactions and received aggregate fees of $750,000 in such capacity. Both of these transactions were on terms equivalent to those of unaffiliated parties.
In the second quarter of 2019, we originated €
191.8 million of a total€
391.3 million senior loan to a borrower that is wholly owned by a Blackstone-advised investment vehicle. We will forgo all non-economic
rights under the loan, including voting rights, so long as the Blackstone-advised investment vehicle controls the borrower. The senior loan terms were negotiated by a third-party without our involvement and our 49% interest in the senior loan was made on such market terms. In the first quarter of 2019, we originated £240.1 million of a total £490.0 million senior loan to a borrower that is wholly owned by a Blackstone-advised investment vehicle. We will forgo allnon-economic
rights under the loan, including voting rights, so long as the Blackstone-advised investment vehicle controls the borrower. The senior loan terms were negotiated by a third party without our involvement and our 49% interest in the senior loan was made on such market terms. In the second quarter of 2020, we entered into a loan modification with the borrower. The modification terms were negotiated by the third party,
lender, without our involvement. 17. COMMITMENTS AND CONTINGENCIES
As further discussed in Note 2, the full extent of the impact ofCOVID-19
on the global economy generally, and our business in particular, is uncertain. As of June 30, 2020, no contingencies have been recorded on our consolidated balance sheet as a result ofCOVID-19,
however as the global pandemic continues and the economic implications worsen, it may have long-term impacts on our financial condition, results of operations, and cash flows. Refer to Note 2 for further discussion ofCOVID-19.
Blackstone Mortgage Trust, Inc.
Notes to Consolidated Financial Statements (continued)
Unfunded Commitments Under Loans Receivable
As of June 30, 2020, we had unfunded commitments of $3.6 billion related to 91 loans receivable. We generally finance the funding of our loan commitments on terms consistent with our overall credit facilities, with an average advance rate of 75.6% for such financed loans, resulting in identified financing for $2.2 billion of our aggregate unfunded loan commitments as of June 30, 2020. Some of our lenders, including substantially all of our financing of construction loans, are contractually obligated to fund their ratable portion of these loan commitments over time, while other lenders have some degree of discretion over future loan funding obligations. We expect to fund our loan commitments over the tenor of these loans, which have a weighted-average future funding period of 3.9 years. Our future loan fundings comprise funding for capital expenditures and construction, leasing costs, and interest and carry costs, and will vary depending on the progress of capital projects, leasing, and cash flows at the assets underlying our loans. Therefore, the exact timing and amounts of such future loan fundings are uncertain and will depend on the current and future performance of the underlying collateral assets. As a result of theCOVID-19
pandemic, the progress of capital expenditures, construction, and leasing is anticipated to be slower than otherwise expected, and the pace of future funding relating to these capital needs may be commensurately slower. Principal Debt Repayments
Our contractual principal debt repayments as of June 30, 2020 were as follows ($ in thousands):
| | | | | | | | | | | | | | | | | | | | |
| | | | | | |
| | | | | | | | | | | | | | | |
| | | | | | | | | | | | | | | |
Principal repayments under secured debt agreements (1) | | $ | | | | $ | | | | $ | | | | $ | | | | $ | | |
Principal repayments of secured term loans (2) | | | | | | | | | | | | | | | | | | | | |
Principal repayments of convertible notes (3) | | | | | | | | | | | | | | | | | | | | |
| | | | | | | | | | | | | | | | | | | | | |
| | $ | | | | $ | | | | $ | | | | $ | | | | $ | | |
| | | | | | | | | | | | | | | | | | | | | |
| | |
| | The allocation of repayments under our secured debt agreements is based on the earlier of (i) the maturity date of each facility, or (ii) the maximum maturity date of the collateral loans, assuming all extension options are exercised by the borrower. |
| | The Secured Term Loans are partially amortizing, with an amount equal to 1.0% per annum of the principal balance due in quarterly installments. Refer to Note 7 for further details on our secured term loans. |
| | Reflects the outstanding principal balance of Convertible Notes, excluding any potential conversion premium. Refer to Note 8 for further details on our Convertible Notes. |
| | Does not include $739.6 million ofnon-consolidated senior interests and $2.3 billion of securitized debt obligations, as the satisfaction of these liabilities will not require cash outlays from us. |
Board of Directors’ Compensation
As of June 30, 2020, of the eight members of our board of directors, our 5 independent directors are entitled to annual compensation of $175,000 each, $75,000 of which will be paid in the form of cash and $100,000 in the form of deferred stock units. The other three board members, including our chairman and our chief executive officer, are not compensated by us for their service as directors. In addition, (i) the chair of our audit committee receives additional annual cash compensation of $20,000, (ii) the other members of our audit committee receive additional annual cash compensation of $10,000, and (iii) the chairs of each of our compensation and corporate governance committees receive additional annual cash compensation of $10,000.
From time to time, we may be involved in various claims and legal actions arising in the ordinary course of business. As of June 30, 2020, we were not involved in any material legal proceedings.
| | |
| | MANAGEMENT’S DISCUSSION AND ANALYSIS OF FINANCIAL CONDITION AND RESULTS OF OPERATIONS |
References herein to “Blackstone Mortgage Trust,” “Company,” “we,” “us,” or “our” refer to Blackstone Mortgage Trust, Inc. and its subsidiaries unless the context specifically requires otherwise.
The following discussion should be read in conjunction with the unaudited consolidated financial statements and notes thereto appearing elsewhere in this quarterly report on Form10-Q.
In addition to historical data, this discussion contains forward-looking statements within the meaning of Section 27A of the Securities Act of 1933, as amended, and Section 21E of the Securities Exchange Act of 1934, as amended, which reflect our current views with respect to, among other things, our business, operations and financial performance. You can identify these forward-looking statements by the use of words such as “intend,” “goal,” “estimate,” “expect,” “project,” “projections,” “plans,” “seeks,” “anticipates,” “should,” “could,” “may,” “designed to,” “foreseeable future,” “believe,” “scheduled,” and similar expressions. Such forward-looking statements are subject to various risks, uncertainties and assumptions. Our actual results or outcomes may differ materially from those in this discussion as a result of various factors, including but not limited to those discussed in Item 1A. Risk Factors in our annual report on Form 10-K for the year ended December 31, 2019, as well as in Part II. Item 1A. Risk Factors in our quarterly report on Form 10-Q for the fiscal period ended March 31, 2020 and elsewhere in this quarterly report on Form 10-Q. Blackstone Mortgage Trust is a real estate finance company that originates senior loans collateralized by commercial real estate in North America, Europe, and Australia. Our portfolio is composed of loans secured by high-quality, institutional assets in major markets, sponsored by experienced, well-capitalized real estate investment owners and operators. These senior loans are capitalized by accessing a variety of financing options, including our credit facilities, issuing CLOs or single-asset securitizations, and syndications of senior loan participations, depending on our view of the most prudent financing option available for each of our investments. We are not in the business of buying or trading securities, and the only securities we own are the retained interests from our securitization financing transactions, which we have not financed. We are externally managed by BXMT Advisors L.L.C., or our Manager, a subsidiary of The Blackstone Group Inc., or Blackstone, and are traded on the New York Stock Exchange, or NYSE, under the symbol “BXMT.”
We benefit from the deep knowledge, experience and information advantages of our Manager, which is a part of Blackstone’s real estate platform. Blackstone Real Estate is one of the largest owners and operators of real estate in the world, with a proven track record of successfully navigating market cycles and emerging stronger through periods of volatility. The market-leading real estate expertise derived from the strength of the Blackstone platform deeply informs our credit and underwriting process, and gives us the tools to expertly asset manage our portfolio and work with our borrowers throughout periods of economic stress and uncertainty.
We are headquartered in New York City and conduct our operations as a real estate investment trust, or REIT, for U.S. federal income tax purposes. We generally will not be subject to U.S. federal income taxes on our taxable income to the extent that we annually distribute all of our net taxable income to stockholders and maintain our qualification as a REIT. We also operate our business in a manner that permits us to maintain an exclusion from registration under the Investment Company Act of 1940, as amended. We are organized as a holding company and conduct our business primarily through our various subsidiaries.
During the first quarter of 2020, there was a global outbreak of a novel coronavirus, or COVID-19, which has spread to over 200 countries and territories, including the United States, has spread to every state in the United States, and is continuing to spread. The World Health Organization has designated COVID-19 as a pandemic, and numerous countries, including the United States, have declared national emergencies with respect to COVID-19. The United States and other countries have reacted to the COVID-19 outbreak with unprecedented government intervention, including interest rate cuts and economic stimulus. The global impact of the outbreak has been rapidly evolving, and as cases of COVID-19 have continued to be identified in additional countries, many countries have reacted by instituting quarantines and restrictions on travel, closing financial markets and/or restricting trading, and limiting operations of non-essential offices, retail centers, hotels, and other businesses. Such actions are creating disruption in global supply chains, increasing rates of unemployment and adversely impacting many industries, including industries in which the collateral underlying certain of our loans are involved. The outbreak could have a continued adverse impact on economic and market conditions and trigger a period of global economic slowdown.
The outbreak of COVID-19 and its impact on the current financial, economic and capital markets environment, and future developments in these and other areas present uncertainty and risk with respect to our financial condition, results of operations, liquidity, and ability to pay distributions. We expect that these impacts are likely to continue to some extent as the outbreak persists and potentially even longer. The rapid development and fluidity of this situation precludes any prediction as to the ultimate adverse impact of COVID-19 on economic and market conditions, and, as a result, present material uncertainty and risk with respect to us and the performance of our investments. The full extent of the impact and effects of COVID-19 will depend on future developments, including, among other factors, the duration and spread of the outbreak, along with related travel advisories, quarantines and restrictions, the recovery time of the disrupted supply chains and industries, the impact of labor market interruptions, the impact of government interventions, and uncertainty with respect to the duration of the global economic slowdown. For additional discussion with respect to the potential impact of the COVID-19 pandemic on our liquidity and capital resources, see “Liquidity and Capital Resources” below.
I. Key Financial Measures and Indicators
As a real estate finance company, we believe the key financial measures and indicators for our business are earnings per share, dividends declared, Core Earnings, and book value per share. For the three months ended June 30, 2020 we recorded earnings per share of $0.13, declared a dividend of $0.62 per share, and reported $0.62 per share of Core Earnings. In addition, our book value per share as of June 30, 2020 was $26.45. As further described below, Core Earnings is a measure that is not prepared in accordance with accounting principles generally accepted in the United States of America, or GAAP. We use Core Earnings to evaluate our performance excluding the effects of certain transactions and GAAP adjustments that we believe are not necessarily indicative of our current loan activity and operations.
Earnings Per Share and Dividends Declared
The following table sets forth the calculation of basic and diluted net income (loss) per share and dividends declared per share ($ in thousands, except per share data):
| | | | | | | | |
| | | | |
| | | | | | | |
| | $ | 17,544 | | | $ | (53,350 | ) |
Weighted-average shares outstanding, basic and diluted | | | 138,299,418 | | | | 135,619,264 | |
| | | | | | | | |
Net income (loss) per share, basic and diluted | | $ | 0.13 | | | $ | (0.39 | ) |
| | | | | | | | |
Dividends declared per share | | $ | 0.62 | | | $ | 0.62 | |
| | | | | | | | |
| | | | | | | | |
| (1) | Represents net income (loss) attributable to Blackstone Mortgage Trust. |
Core Earnings is a non-GAAP measure, which we define as GAAP net income (loss), including realized gains and losses not otherwise included in GAAP net income (loss), and excluding (i) non-cash equity compensation expense, (ii) depreciation and amortization, (iii) unrealized gains (losses), (iv) net income (loss) attributable to our legacy portfolio, and (v) certain non-cash items. Core Earnings may also be adjusted from time to time to exclude one-time events pursuant to changes in GAAP and certain other non-cash charges as determined by our Manager, subject to approval by a majority of our independent directors. During the six months ended June 30, 2020, we recorded a $179.5 million increase in the current expected credit loss, or CECL, reserve, which has been excluded from Core Earnings consistent with other unrealized gains (losses) pursuant to our existing policy for reporting Core Earnings and the terms of the management agreement between our Manager and us.
We believe that Core Earnings provides meaningful information to consider in addition to our net income (loss) and cash flow from operating activities determined in accordance with GAAP. This adjusted measure helps us to evaluate our performance excluding the effects of certain transactions and GAAP adjustments that we believe are not necessarily indicative of our current loan portfolio and operations. Although, according to the management agreement between our Manager and us, or our Management Agreement, we calculate the incentive and base management fees due to our Manager using Core Earnings before our incentive fee expense, we report Core Earnings after incentive fee expense, as we believe this is a more meaningful presentation of the economic performance of our class A common stock.
Core Earnings does not represent net income (loss) or cash generated from operating activities and should not be considered as an alternative to GAAP net income (loss), or an indication of our GAAP cash flows from operations, a measure of our liquidity, or an indication of funds available for our cash needs. In addition, our methodology for calculating Core Earnings may differ from the methodologies employed by other companies to calculate the same or similar supplemental performance measures, and accordingly, our reported Core Earnings may not be comparable to the Core Earnings reported by other companies.
The following table provides a reconciliation of Core Earnings to GAAP net income (loss) ($ in thousands, except per share data):
| | | | | | | | |
| | | | |
| | | | | | | |
| | $ | 17,544 | | | $ | (53,350 | ) |
Increase in current expected credit loss reserve | | | 56,819 | | | | 122,702 | |
Non-cash compensation expense | | | 8,652 | | | | 8,678 | |
Realized hedging and foreign currency income, net (2) | | | 1,810 | | | | 8,467 | |
| | | 210 | | | | 596 | |
Adjustments attributable to non-controlling interests, net | | | 139 | | | | (561 | ) |
| | | | | | | | |
| | $ | 85,174 | | | $ | 86,532 | |
| | | | | | | | |
Weighted-average shares outstanding, basic and diluted | | | 138,299,418 | | | | 135,619,264 | |
| | | | | | | | |
Core Earnings per share, basic and diluted | | $ | 0.62 | | | $ | 0.64 | |
| | | | | | | | |
| | | | | | | | |
| | |
| | Represents net income (loss) attributable to Blackstone Mortgage Trust. |
| | For the three months ended June 30, 2020, represents realized gains on the repatriation of unhedged foreign currency. For the three months ended March 31, 2020, primarily represents the forward points earned on our foreign currency forward contracts, which reflect the interest rate differentials between the applicable base rate for our foreign currency investments and USD LIBOR. These forward contracts effectively convert the rate exposure to USD LIBOR, resulting in additional interest income earned in U.S. dollar terms. These amounts were not included in GAAP net income (loss), but rather as a component of Other Comprehensive Income in our consolidated financial statements. |
The following table calculates our book value per share ($ in thousands, except per share data):
| | | | | | | | |
| | | | | | | |
| | $ | 3,874,763 | | | $ | 3,650,920 | |
| | | | | | | | |
| | | 146,196,662 | | | | 135,355,320 | |
| | | 281,143 | | | | 268,049 | |
| | | | | | | | |
| | | 146,477,805 | | | | 135,623,369 | |
| | | | | | | | |
| | $ | 26.45 | | | $ | 26.92 | |
| | | | | | | | |
Loan fundings during the quarter totaled $317.2 million, including $47.9 million of non-consolidated senior interests. Loan repayments during the quarter totaled $385.7 million. We generated interest income of $192.0 million and incurred interest expense of $84.9 million during the quarter, which resulted in $107.1 million of net interest income during the three months ended June 30, 2020.
The following table details our loan origination activity ($ in thousands):
| | | | | | | | |
| | | | | | | |
| | | | | | | |
| | $ | 12,000 | | | $ | 1,311,939 | |
| | $ | 317,239 | | | $ | 1,317,583 | |
| | | (385,718 | ) | | | (953,069 | ) |
| | | | | | | | |
| | $ | (68,479 | ) | | $ | 364,514 | |
| | | | | | | | |
| | | | | | | | |
| | |
| | Includes new loan originations and additional commitments made under existing loans. |
| | Loan fundings during the three and six months ended June 30, 2020 include $47.9 million and $76.9 million, respectively, of additional fundings under related non-consolidated senior interests. |
The following table details overall statistics for our investment portfolio as of June 30, 2020 ($ in thousands):
| | | | | | | | | | | | | | | | | | | | | | | | |
| | | | | | Total Investment Exposure | |
| | |
| | | | | | | | | | | | | | | Total Investment
Portfolio | |
| | | 128 | | | | 128 | | | | 1 | | | | | | | | | | | | 129 | |
| | $ | 16,434,631 | | | $ | 17,174,244 | | | $ | 857,293 | | | | | | | | | | | $ | 18,031,537 | |
| | $ | 16,161,353 | | | $ | 16,161,353 | | | $ | 75,836 | | | | | | | | | | | $ | 16,237,189 | |
Unfunded loan commitments (4) | | $ | 3,590,868 | | | $ | 4,543,086 | | | $ | — | | | | | | | | | | | $ | 4,543,086 | |
Weighted-average cash coupon (5) | | | L + 3.17 | % | | | L + 3.23 | % | | | L + 2.75 | % | | | | | | | | | | | L + 3.21 | % |
Weighted-average all-in yield (5) | | | L + 3.52 | % | | | L + 3.58 | % | | | L + 3.03 | % | | | | | | | | | | | L + 3.55 | % |
Weighted-average maximum maturity (years) (6) | | | 3.5 | | | | 3.5 | | | | 4.9 | | | | | | | | | | | | 3.5 | |
| | | 64.6 | % | | | 64.6 | % | | | 42.6 | % | | | | | | | | | | | 63.6 | % |
| | | | | |
| | |
| | Excludes investment exposure to the $82.0 million subordinate position we own in the $857.3 million 2018 Single Asset Securitization. Refer to Notes 4 and 15 to our consolidated financial statements for further discussion of the 2018 Single Asset Securitization. |
| | In certain instances, we finance our loans through the non-recourse sale of a senior loan interest that is not included in our consolidated financial statements. Total loan exposure encompasses the entire loan we originated and financed, including $739.6 million of such non-consolidated senior interests that are not included in our balance sheet portfolio. |
| | Includes investment exposure to the $857.3 million 2018 Single Asset Securitization. We do not consolidate the 2018 Single Asset Securitization on our consolidated financial statements, and instead reflect our $82.0 million subordinate position as a component of other assets on our consolidated balance sheet. Refer to Notes 4 and 15 to our consolidated financial statements for further discussion of the 2018 Single Asset Securitization. |
| | Unfunded commitments will primarily be funded to finance our borrowers’ construction or development of real estate-related assets, capital improvements of existing assets, or lease-related expenditures. These commitments will generally be funded over the term of each loan, subject in certain cases to an expiration date. |
| | The weighted-average cash coupon and all-in yield are expressed as a spread over the relevant floating benchmark rates, which include USD LIBOR, GBP LIBOR, EURIBOR, BBSY, and CDOR, as applicable to each investment. As of June 30, 2020, 97% of our investments by total investment exposure earned a floating rate of interest, primarily indexed to USD LIBOR, and $13.0 billion of such investments earned interest based on floors that are above the applicable index. The other 3% of our investments earned a fixed rate of interest, which we reflect as a spread over the relevant floating benchmark rates, as of June 30, 2020, for purposes of the weighted-averages. In addition to cash coupon, all-in yield includes the amortization of deferred origination and extension fees, loan origination costs, and purchase discounts, as well as the accrual of exit fees. |
| | Maximum maturity assumes all extension options are exercised by the borrower, however our loans and other investments may be repaid prior to such date. As of June 30, 2020, 51% of our loans and other investments were subject to yield maintenance or other prepayment restrictions and 49% were open to repayment by the borrower without penalty. |
| | Based on LTV as of the dates loans and other investments were originated or acquired by us. |
The following table details the floating benchmark rates for our investment portfolio as of June 30, 2020 ($/€/£/A$/C$ in thousands):
| | | | | | | | | | | | | | | | | | | | | | |
| | | | | | | | Total Investment
Portfolio | | | | | | | | | | | | | |
| 103 | | | | $ | | | | $ | 12,520,462 | | | | | USD LIBOR | | | | L + 3.14% | | | | L + 3.49% |
| 8 | | | | € | | | | € | 2,810,320 | | | | | EURIBOR | | | | E + 2.90% | | | | E + 3.24% |
| 13 | | | | £ | | | | £ | 1,648,942 | | | | | GBP LIBOR | | | | L + 3.98% | | | | L + 4.28% |
| 2 | | | | A$ | | | | A$ | 338,150 | | | | | BBSY | | | | BBSY + 4.01% | | | | BBSY + 4.31% |
| 3 | | | | C$ | | | | C$ | 102,748 | | | | | CDOR | | | | CDOR + 3.95% | | | | CDOR + 4.29% |
| | | | | | | | | | | | | | | | | | | | | | |
| 129 | | | | | | | | $ | 18,031,537 | | | | | | | | | INDEX + 3.21% | | | | INDEX + 3.55% |
| | | | | | | | | | | | | | | | | | | | | | |
| | | | | | | | |
| (1) | We use foreign currency forward contracts to protect the value or fix the amount of certain investments or cash flows in terms of the U.S. dollar. We earn forward points on our forward contracts that reflect the interest rate differentials between the applicable base rate for our foreign currency investments and USD LIBOR. These forward contracts effectively convert the foreign currency rate exposure for such investments to USD LIBOR. |
| (2) | The cash coupon and all-in yield of our fixed rate loans are reflected as a spread over USD LIBOR for purposes of the weighted-averages. In addition to cash coupon, all-in yield includes the amortization of deferred origination and extension fees, loan origination costs, and purchase discounts, as well as the accrual of exit fees. |
The charts below detail the geographic distribution and types of properties securing our investment portfolio, as of June 30, 2020:
Refer to section VI of this Item 2 for details of our loan portfolio, on a loan-by-loan basis.
We collected all interest payments that were due under our loans through July 2020, including with respect to loans collateralized by hospitality assets, which we believe demonstrates the overall strength of our loan portfolio and the commitment and financial wherewithal of our borrowers generally, which are primarily affiliated with large real estate private equity funds and other strong, well-capitalized, experienced sponsors.
We maintain a robust asset management relationship with our borrowers and have utilized these relationships to address the potential impacts of the COVID-19 pandemic on our loans secured by properties experiencing cash flow pressure, most significantly hospitality assets. Some of our borrowers have indicated that due to the impact of the COVID-19 pandemic, they will be unable to timely execute their business plans, have had to temporarily close their businesses, or have experienced other negative business consequences and have requested temporary interest deferral or forbearance, or other modifications of their loans. During the three months ended June 30, 2020, we closed 13 loan modifications, representing an aggregate principal balance of $2.4 billion. The loan modifications included term extensions, interest rate changes, repurposing of reserves, temporary deferrals of interest, and performance test or covenant waivers, many of which were coupled with additional equity commitments from sponsors.
We are generally encouraged by our borrowers’ initial response to the COVID-19 pandemic’s impacts on their properties. With limited exceptions, we believe our loan sponsors are committed to supporting assets collateralizing our loans through additional equity investments, and that we will benefit from our long-standing core business model of originating senior loans collateralized by large assets in major markets with experienced, well-capitalized institutional sponsors. Our investment portfolio’s low origination weighted-average LTV of 63.6% as of June 30, 2020 reflects significant equity value that our sponsors are motivated to protect through periods of cyclical disruption. While we believe the principal amounts of our loans are generally adequately protected by underlying collateral value, there is a risk that we will not realize the entire principal value of certain investments.
Our Manager’s portfolio monitoring and asset management operations benefit from the deep knowledge, experience, and information advantages derived from its position as part of Blackstone’s real estate platform. Blackstone Real Estate is one of the largest owners and operators of real estate in the world, with a proven track record of successfully navigating market cycles and emerging stronger through periods of volatility. The market-leading real estate expertise derived from the strength of the Blackstone platform deeply informs our credit and underwriting process, and gives us the tools to expertly asset manage our portfolio and work with our borrowers throughout periods of economic stress and uncertainty.
As discussed in Note 2 to our consolidated financial statements, our Manager performs a quarterly review of our loan portfolio, assesses the performance of each loan, and assigns it a risk rating between “1” and “5,” from less risk to greater risk. The weighted-average risk rating of our total loan exposure was 3.0 and 2.8 as of June 30, 2020 and December 31, 2019, respectively. The increase in the risk rating was primarily the result of loans with an aggregate principal balance of $3.1 billion that were downgraded to a “4” or “5” as of June 30, 2020 to reflect the higher risk in loans collateralized by hospitality assets and select other assets that are particularly negatively impacted by the COVID-19 pandemic.
The following table allocates the principal balance and total loan exposure balances based on our internal risk ratings ($ in thousands):
| | | | | | | | | | | | |
| | | | |
| | | | | | | | | |
| 1 | | | 6 | | | $ | 403,025 | | | $ | 404,596 | |
| 2 | | | 28 | | | | 3,143,641 | | | | 3,163,083 | |
| 3 | | | 78 | | | | 9,509,007 | | | | 10,306,208 | |
| 4 | | | 14 | | | | 2,951,069 | | | | 2,966,195 | |
| 5 | | | 2 | | | | 332,661 | | | | 334,162 | |
| | | | | | | | | | | | |
| | | 128 | | | $ | 16,339,403 | | | $ | 17,174,244 | |
| | | | | | | | | | | | |
| | | | | | | (178,050 | ) | | | | |
| | | | | | | | | | | | |
| | | | | | $ | 16,161,353 | | | | | |
| | | | | | | | | | | | |
| | |
| | In certain instances, we finance our loans through the non-recourse sale of a senior loan interest that is not included in our consolidated financial statements. See Note 2 to our consolidated financial statements for further discussion. Total loan exposure encompasses the entire loan we originated and financed, including $739.6 million of such non-consolidated senior interests as of June 30, 2020. |
| | Excludes investment exposure to the $857.3 million 2018 Single Asset Securitization. Refer to Notes 4 and 15 to our consolidated financial statements for details of the subordinate position we own in the 2018 Single Asset Securitization. |
Current Expected Credit Loss Reserve
The CECL reserve required by GAAP reflects our current estimate of potential credit losses related to our loans and debt securities included in our consolidated balance sheets. Other than a few narrow exceptions, GAAP requires that all financial instruments subject to the CECL model have some amount of loss reserve to reflect the GAAP principal underlying the CECL model that all loans, debt securities, and similar assets have some inherent risk of loss, regardless of credit quality, subordinate capital, or other mitigating factors.
Our initial CECL reserve of $17.7 million recorded on January 1, 2020 is reflected as a direct charge to retained earnings on our consolidated statements of changes in equity; however subsequent changes to the CECL reserve are recognized through net income (loss) on our consolidated statements of operations. During the six months ended June 30, 2020, we recorded a $179.5 million increase in the current expected credit loss reserve, bringing our total CECL reserve to $197.2 million as of June 30, 2020. This CECL reserve reflects the macroeconomic impact of the COVID-19 pandemic on commercial real estate markets generally, as well as certain loans assessed for impairment in our portfolio. Further, this reserve is not reflective of what we expect our CECL reserve would be absent the current and potential future impacts of the COVID-19 pandemic. See Notes 2 and 3 to our consolidated financial statements for further discussion of our CECL reserve.
During the first quarter of 2020, we entered into a loan modification related to a multifamily asset in New York City, which is classified as a troubled debt restructuring under GAAP. This modification included, among other changes, an additional borrower contribution of capital, a reduction in loan spread, and an extension of the loan’s maturity date to November 9, 2020. As of June 30, 2020, we recorded a $14.8 million CECL reserve on this loan, which had an outstanding principal balance of $52.8 million as of June 30, 2020. The CECL reserve was recorded based on our estimation of the fair value of the loan’s underlying collateral as of June 30, 2020, and to reflect ongoing loan modification discussions. As of June 30, 2020, the borrower was current with all terms of the loan, including payments of interest.
As of June 30, 2020, we recorded a $54.9 million CECL reserve on a loan related to a hospitality asset in New York City with an outstanding principal balance of $281.4 million as of June 30, 2020. The CECL reserve was recorded based on our estimation of the fair value of the loan’s underlying collateral as of June 30, 2020, and to reflect ongoing loan modification discussions. As of June 30, 2020, the borrower was current with all terms of the loan, including payments of interest.
Multifamily Joint Venture
As of June 30, 2020, our Multifamily Joint Venture held $624.1 million of loans, which are included in the loan disclosures above. Refer to Note 2 to our consolidated financial statements for additional discussion of our Multifamily Joint Venture.
Of our $13.5 billion of portfolio financing, $3.8 billion includes consolidated and non-consolidated securitized debt obligations, and non-consolidated senior interests, which are inherently non-mark to market, non-recourse, and term-matched to the financed assets, and we have $9.7 billion of borrowings under our credit facilities and asset-specific financings.
The following table details our portfolio financing ($ in thousands):
| | | | | | | | |
| | | | |
| | | Outstanding Principal Balance | |
| | | | | | | |
Secured credit facilities | | $ | 9,431,109 | | | $ | 9,753,059 | |
Asset-specific financings | | | 285,343 | | | | 330,879 | |
Revolving credit agreement | | | — | | | | — | |
Non-consolidated senior interests (1) | | | 739,613 | | | | 688,521 | |
Securitized debt obligations | | | 2,253,008 | | | | 1,189,642 | |
Non-consolidated securitized debt obligation (2) | | | 775,291 | | | | 841,062 | |
| | | | | | | | |
Total portfolio financing | | $ | 13,484,364 | | | $ | 12,803,163 | |
| | | | | | | | |
| | |
| | These non-consolidated senior interests provide structural leverage for our net investments which are reflected in the form of mezzanine loans or other subordinate interests on our balance sheet and in our results of operations. |
| | Represents the senior non-consolidated investment exposure to the 2018 Single Asset Securitization. We own the related subordinate position, which is classified as a held-to-maturity debt security on our balance sheet. Refer to Notes 4 and 15 to our consolidated financial statements for details of the 2018 Single Asset Securitization. |
Secured Credit Facilities
The following table details our secured credit facilities ($ in thousands):
| | | | | | | | | | | | | | | | | | |
| | | | |
| | | Credit Facility Borrowings | | | | | | |
| | | | | | | | | | | | | | |
| | $ | 2,011,496 | | | $ | 2,011,496 | | | $ | — | | | | | $ | 2,673,795 | |
| | | 1,637,749 | | | | 1,607,267 | | | | 30,482 | | | | | | 2,110,436 | |
| | | 1,516,822 | | | | 1,497,542 | | | | 19,280 | | | | | | 1,960,089 | |
| | | 916,680 | | | | 899,627 | | | | 17,053 | | | | | | 1,189,282 | |
| | | 582,860 | | | | 582,854 | | | | 6 | | | | | | 781,016 | |
| | | 540,376 | | | | 540,376 | | | | — | | | | | | 750,722 | |
| | | 492,293 | | | | 492,293 | | | | — | | | | | | 786,931 | |
| | | 444,502 | | | | 444,502 | | | | — | | | | | | 556,015 | |
| | | 415,535 | | | | 388,182 | | | | 27,353 | | | | | | 558,291 | |
| | | 244,607 | | | | 244,607 | | | | — | | | | | | 306,082 | |
| | | 236,698 | | | | 236,698 | | | | — | | | | | | 301,932 | |
Goldman Sachs - Multi. JV (3) | | | 234,464 | | | | 234,464 | | | | — | | | | | | 306,555 | |
| | | 220,139 | | | | 217,281 | | | | 2,858 | | | | | | 275,174 | |
Bank of America - Multi. JV (3) | | | 33,920 | | | | 33,920 | | | | — | | | | | | 42,400 | |
| | | | | | | | | | | | | | | | | | |
| | $ | 9,528,141 | | | $ | 9,431,109 | | | $ | 97,032 | | | | | $ | 12,598,720 | |
| | | | | | | | | | | | | | | | | | |
| | |
| | Potential borrowings represents the total amount we could draw under each facility based on collateral already approved and pledged. When undrawn, these amounts are immediately available to us at our sole discretion under the terms of each credit facility. |
| | Represents the principal balance of the collateral assets. |
| | These facilities finance the loan investments of our consolidated Multifamily Joint Venture. Refer to Note 2 to our consolidated financial statements for additional discussion of our Multifamily Joint Venture. |
Asset-Specific Financings
The following table details our asset-specific financings ($ in thousands):
| | | | | | | | | | | | | | | | | | | | | | |
| | | | |
Asset-Specific Financings | | | | | | | | | |
| | | | | | | |
| | 3 | | $ | 356,679 | | | $ | 346,051 | | | | L+5.20 | % | | | n/a | | | | Feb. 2023 | |
| | 3 | | $ | 285,343 | | | $ | 279,132 | | | | L+3.60 | % | | $ | 16,546 | | | | Feb. 2023 | |
| | |
|
| | These floating rate loans and related liabilities are indexed to the various benchmark rates relevant in each arrangement in terms of currency and payment frequency. Therefore the net exposure to each benchmark rate is in direct proportion to our net assets indexed to that rate. In addition to cash coupon, yield/cost includes the amortization of deferred origination fees / financing costs. |
| | Other than amounts guaranteed on asset-by-asset basis, borrowings under our asset-specific financings are non-recourse to us. |
| | The weighted-average term is determined based on the maximum maturity of the corresponding loans, assuming all extension options are exercised by the borrower. Each of our asset-specific financings is term-matched to the corresponding collateral loans. |
Revolving Credit Agreement
We have a $250.0 million full recourse secured revolving credit agreement with Barclays that is designed to finance first mortgage originations for up to nine months as a bridge to term financing or syndication. Advances under the agreement are subject to availability under a specified borrowing base and accrue interest at a per annum pricing rate equal to the sum of (i) an applicable base rate or Eurodollar rate and (ii) an applicable margin, in each case, dependent on the applicable type of loan collateral. The maturity date of the facility is April 4, 2023. As of June 30, 2020, we had no outstanding borrowings under the agreement.
Non-Consolidated Senior Interests
In certain instances, we finance our loans through the non-recourse sale of a senior loan interest that is not included in our consolidated financial statements. These non-consolidated senior interests provide structural leverage for our net investments which are reflected in the form of mezzanine loans or other subordinate interests on our balance sheet and in our results of operations. The following table details the subordinate interests retained on our balance sheet and the related non-consolidated senior interests as of June 30, 2020 ($ in thousands):
| | | | | | | | | | | | | | | | | | | | | | |
| | | | |
Non-Consolidated Senior Interests | | | | | | | | | | | | | | | | | |
| | 5 | | $ | 921,301 | | | | n/a | | | | 5.83 | % | | | n/a | | | | Jan. 2024 | |
| | 5 | | | 739,613 | | | | n/a | | | | 4.42 | % | | | n/a | | | | Jan. 2024 | |
| | |
|
| | Our floating rate loans and related liabilities were indexed to the various benchmark rates relevant in each arrangement in terms of currency and payment frequency. Therefore the net exposure to each benchmark rate is in direct proportion to our net assets indexed to that rate. In addition to cash coupon, all-in yield/cost includes the amortization of deferred fees / financing costs. |
Securitized Debt Obligations
The following table details our securitized debt obligations ($ in thousands):
| | | | | | | | | | | | | | | | | | |
| | | | |
| | | | | | | | | | | | | | | |
Securitized Debt Obligations | | | | | | | | | | | | | | |
2020 Collateralized Loan Obligation | | | | | | | | | | | | | | | | | | |
| | 34 | | $ | 1,500,000 | | | $ | 1,500,000 | | | | L+3.20 | % | | | December 2023 | |
| | 1 | | | 1,243,125 | | | | 1,231,872 | | | | L+1.42 | % | | | February 2038 | |
2017 Collateralized Loan Obligation | | | | | | | | | | | | | | | | | | |
| | 16 | | | 717,763 | | | | 717,763 | | | | L+3.33 | % | | | January 2023 | |
| | 1 | | | 535,263 | | | | 534,120 | | | | L+1.77 | % | | | June 2035 | |
2017 Single Asset Securitization | | | | | | | | | | | | | | | | | | |
| | 1 | | | 688,611 | | | | 687,775 | | | | L+3.57 | % | | | June 2023 | |
| | 1 | | | 474,620 | | | | 474,620 | | | | L+1.63 | % | | | June 2033 | |
| | | | | | | | | | | | | | | | | | |
| | 51 | | $ | 2,906,374 | | | $ | 2,905,538 | | | | L+3.32 | % | | | | |
| | | | | | | | | | | | | | | | | | |
| | 3 | | $ | 2,253,008 | | | $ | 2,240,612 | | | | L+1.54 | % | | | | |
| | | | | | | | | | | | | | | | | | |
| | |
|
| | In addition to cash coupon, all-in yield includes the amortization of deferred origination and extension fees, loan origination costs, purchase discounts, and accrual of exit fees. All-in yield for the total portfolio assume applicable floating benchmark rates for weighted-average calculation. |
| | Loan term represents weighted-average final maturity, assuming all extension options are exercised by the borrower. Repayments of securitized debt obligations are tied to timing of the related collateral loan asset repayments. The term of these obligations represents the rated final distribution date of the securitizations. |
| | The collateral assets for the 2017 Single Asset Securitization include the total loan amount, of which we securitized $500.0 million. |
| | During the three and six months ended June 30, 2020, we recorded $10.7 million and $22.7 million, respectively, of interest expense related to our securitized debt obligations. |
Refer to Notes 6 and 15 to our consolidated financial statements for additional details of our securitized debt obligations.
Non-Consolidated Securitized Debt Obligation
In the third quarter of 2018, we contributed a senior loan to the 2018 Single Asset Securitization, and invested in the related subordinate position. We do not consolidate the 2018 Single Asset Securitization on our balance sheet. The non-consolidated securitized debt obligation provides structural leverage for our net investment which is reflected as a held-to-maturity debt security on our balance sheet. The following table details our non-consolidated securitized debt obligations ($ in thousands):
| | | | | | | | | | | | | | | | | | |
| | | | |
Non-Consolidated Securitized Debt Obligation | | | | | | | | | |
| | | | |
| | 1 | | $ | 857,293 | | | | n/a | | | | L+3.03 | % | | | Jun. 2025 | |
| | 1 | | $ | 775,291 | | | | n/a | | | | L+2.25 | % | | | Jun. 2025 | |
| | |
|
| | In addition to cash coupon, all-in yield includes the amortization of deferred origination and extension fees, loan origination costs, and purchase discounts. |
| | Loan term represents weighted-average final maturity, assuming all extension options are exercised by the borrower. Repayments of non-consolidated securitized debt obligations are tied to timing of the related collateral loan asset repayments. The term of these obligations represents the rated final distribution date of the securitizations. |
As of June 30, 2020, the following Secured Term Loans were outstanding ($ in thousands):
| | | | | | | | | | | | | | | | |
| | | | | | | | | | | | |
| | $ | 743,134 | | | | L+2.25 | % | | | L+2.52 | % | | | April 23, 2026 | |
| | $ | 325,000 | | | | L+4.75 | % | | | L+5.60 | % | | | April 23, 2026 | |
| | |
|
| | The 2020 Term Loan borrowing is subject to a LIBOR floor of 1.00%. |
| | Includes issue discount and transaction expenses that are amortized through interest expense over the life of the Secured Term Loans. |
Refer to Notes 2 and 7 to our consolidated financial statements for additional discussion of our Secured Term Loans.
As of June 30, 2020, the following convertible senior notes, or Convertible Notes, were outstanding ($ in thousands):
| | | | | | | | | | | | | | | | |
Convertible Notes Issuance | | | | | | | | | | | | |
| | $ | 402,500 | | | | 4.38 | % | | | 4.85 | % | | | May 5, 2022 | |
| | $ | 220,000 | | | | 4.75 | % | | | 5.33 | % | | | March 15, 2023 | |
| | |
|
| | Includes issuance costs that are amortized through interest expense over the life of the Convertible Notes using the effective interest method. |
Refer to Notes 2 and 8 to our consolidated financial statements for additional discussion of our Convertible Notes.
Generally, our business model is such that rising interest rates will increase our net income (loss), while declining interest rates will decrease net income (loss). As of June 30, 2020, 97% of our investments by total investment exposure earned a floating rate of interest and were financed with liabilities that pay interest at floating rates, which resulted in an amount of net equity that is positively correlated to rising interest rates, subject to the impact of interest rate floors on certain of our floating rate investments. As of June 30, 2020, the remaining 3% of our investments by total investment exposure earned a fixed rate of interest, but are financed with liabilities that pay interest at floating rates, which resulted in a negative correlation to rising interest rates to the extent of our financing. In certain instances where we have financed fixed rate assets with floating rate liabilities, we have purchased interest rate swaps or caps to limit our exposure to increases in interest rates on such liabilities.
Our liabilities are generally currency and index-matched to each collateral asset, resulting in a net exposure to movements in benchmark rates that varies by currency silo based on the relative proportion of floating rate assets and liabilities. The following table details our investment portfolio’s net exposure to interest rates by currency as of June 30, 2020 ($/€/£/A$/C$ in thousands):
| | | | | | | | | | | | | | | | | | | | |
| | | | | | | | | | | | | | | | |
Floating rate loans (1)(2) | | $ | 12,520,462 | | | € | 2,797,610 | | | £ | 1,290,854 | | | A$ | 338,150 | | | C$ | 55,917 | |
Floating rate debt (1)(3)(4) | | | (10,440,646 | ) | | | (2,220,917 | ) | | | (818,468 | ) | | | (245,254 | ) | | | (61,613 | ) |
| | | | | | | | | | | | | | | | | | | | |
Net floating rate exposure (5) | | $ | 2,079,816 | | | € | 576,693 | | | £ | 472,386 | | | A$ | 92,896 | | | C$ | (5,696 | ) |
| | | | | | | | | | | | | | | | | | | | |
| | |
|
| | Our floating rate investments and related liabilities are indexed to the various benchmark rates relevant in each case in terms of currency and payment frequency. Therefore the net exposure to each benchmark rate is in direct proportion to our net assets indexed to that rate. |
| | Includes investment exposure to the 2018 Single Asset Securitization. Refer to Notes 4 and 15 to our consolidated financial statements for details of the subordinate position we own in the 2018 Single Asset Securitization. |
| | Includes borrowings under secured debt agreements, non-consolidated senior interests, securitized debt obligations, non-consolidated securitized debt obligations, and secured term loans. |
| | Balance includes two interest rate swaps totaling C$17.3 million ($12.7 million as of June 30, 2020) that are used to hedge a portion of our fixed rate debt. |
| | In addition, we have one interest rate cap of C$21.4 million ($15.8 million as of June 30, 2020) to limit our exposure to increases in interest rates. |
III. Our Results of Operations
The following table sets forth information regarding our consolidated results of operations ($ in thousands, except per share data):
| | | | | | | | | | | | | | | | | | | | | | | | |
| | | | | | | | | | | | | |
| | | | | | | | | | | | | |
| | | | | | | | | | | | | | | | | | | |
Income from loans and other investments | | | | | | | | | | | | | | | | | | | | | | | | |
Interest and related income | | $ | 191,982 | | | $ | 223,369 | | | $ | (31,387 | ) | | $ | 396,857 | | | $ | 448,128 | | | $ | (51,271 | ) |
Less: Interest and related expenses | | | 84,853 | | | | 116,891 | | | | (32,038 | ) | | | 189,092 | | | | 235,579 | | | | (46,487 | ) |
| | | | | | | | | | | | | | | | | | | | | | | | |
Income from loans and other investments, net | | | 107,129 | | | | 106,478 | | | | 651 | | | | 207,765 | | | | 212,549 | | | | (4,784 | ) |
| | | | | | | | | | | | | | | | | | | | | | | | |
Management and incentive fees | | | 20,496 | | | | 20,984 | | | | (488 | ) | | | 39,773 | | | | 40,774 | | | | (1,001 | ) |
General and administrative expenses | | | 11,286 | | | | 9,897 | | | | 1,389 | | | | 23,078 | | | | 19,210 | | | | 3,868 | |
| | | | | | | | | | | | | | | | | | | | | | | | |
| | | 31,782 | | | | 30,881 | | | | 901 | | | | 62,851 | | | | 59,984 | | | | 2,867 | |
Increase in current expected credit loss reserve | | | (56,819 | ) | | | — | | | | (56,819 | ) | | | (179,521 | ) | | | — | | | | (179,521 | ) |
| | | | | | | | | | | | | | | | | | | | | | | | |
Income (loss) before income taxes | | | 18,528 | | | | 75,597 | | | | (57,069 | ) | | | (34,607 | ) | | | 152,565 | | | | (187,172 | ) |
| | | 23 | | | | 46 | | | | (23 | ) | | | 173 | | | | 147 | | | | 26 | |
| | | | | | | | | | | | | | | | | | | | | | | | |
| | | 18,505 | | | | 75,551 | | | | (57,046 | ) | | | (34,780 | ) | | | 152,418 | | | | (187,198 | ) |
| | | | | | | | | | | | | | | | | | | | | | | | |
Net income attributable to non-controlling interests | | | (961 | ) | | | (377 | ) | | | (584 | ) | | | (1,028 | ) | | | (680 | ) | | | (348 | ) |
| | | | | | | | | | | | | | | | | | | | | | | | |
Net income (loss) attributable to Blackstone Mortgage Trust, Inc. | | $ | 17,544 | | | $ | 75,174 | | | $ | (57,630 | ) | | $ | (35,808 | ) | | $ | 151,738 | | | $ | (187,546 | ) |
| | | | | | | | | | | | | | | | | | | | | | | | |
Net income (loss) per share - basic and diluted | | $ | 0.13 | | | $ | 0.59 | | | $ | (0.46 | ) | | $ | (0.26 | ) | | $ | 1.21 | | | $ | (1.47 | ) |
Dividends declared per share | | $ | 0.62 | | | $ | 0.62 | | | $ | — | | | $ | 1.24 | | | $ | 1.24 | | | $ | — | |
Income from loans and other investments, net
Income from loans and other investments, net increased $651,000 during the three months ended June 30, 2020, compared to the corresponding period in 2019, primarily due to (i) $13.0 billion of our loans earning interest based on floors that were above the applicable floating rate index, as of June 30, 2020, and (ii) an increase of $2.2 billion in the weighted-average principal balance of our loan portfolio during the three months ended June 30, 2020, as compared to the corresponding period in 2019. This was offset by (i) a decrease in LIBOR and (ii) an increase of $2.2 billion in the weighted-average principal balance of our outstanding financing arrangements during the three months ended June 30, 2020, as compared to the corresponding period in 2019.
Income from loans and other investments, net decreased $4.8 million during the six months ended June 30, 2020 compared to the corresponding period in 2019, primarily due to (i) a decrease in LIBOR and (ii) an increase of $1.8 billion in the weighted-average principal balance of our outstanding financing arrangements during the six months ended June 30, 2020, as compared to the corresponding period in 2019. This was offset by (i) an increase of $1.9 billion in the weighted-average principal balance of our loan portfolio during the six months ended June 30, 2020, as compared to the corresponding period in 2019, and (ii) $1.9 billion of our loans earning interest based on floors that were above the applicable floating rate index, as of June 30, 2019.
Other expenses are composed of management and incentive fees payable to our Manager and general and administrative expenses. Other expenses increased by $901,000 during the three months ended June 30, 2020 compared to the corresponding period in 2019 due to (i) an increase of $1.4 million of management fees payable to our Manager, primarily as a result of net proceeds received from the sale of shares of our class A common stock during 2019 and 2020, (ii) $896,000 of additional non-cash restricted stock amortization related to shares awarded under our long-term incentive plans, and (iii) an increase of $493,000 of general operating expenses. This was partially offset by a decrease of $1.9 million of incentive fees payable to our Manager.
Other expenses increased by $2.9 million during the six months ended June 30, 2020 compared to the corresponding period in 2019 due to (i) an increase of $2.9 million of management fees payable to our Manager, primarily as a result of net proceeds received from the sale of shares of our class A common stock during 2019 and 2020, (ii) an increase of $2.1 million of general operating expenses, and (iii) $1.8 million of additional non-cash restricted stock amortization related to shares awarded under our long-term incentive plans. This was partially offset by a decrease of $3.9 million of incentive fees payable to our Manager.
Increase in current expected credit loss reserve
During the three months ended June 30, 2020, we recorded a $56.8 million increase in the current expected credit loss reserve. During six months ended June 30, 2020, we recorded a $179.5 million increase in the current expected credit loss reserve. This CECL reserve reflects the macroeconomic impact of the COVID-19 pandemic on commercial real estate markets generally, as well as certain loans assessed for impairment in our portfolio. This reserve is not reflective of what we expect our CECL reserve would be absent the current and potential future impacts of the COVID-19 pandemic. See Notes 2 and 3 to our consolidated financial statements for further discussion of our CECL reserve.
Net income attributable to non-controlling interests
During the three and six months ended June 30, 2020, we recorded $961,000 and $1.0 million, respectively, of net income attributable to non-controlling interests related to our Multifamily Joint Venture.
During the three months ended June 30, 2020, we declared a dividend of $0.62 per share, or $90.6 million in aggregate, which was paid on July 15, 2020 to common stockholders of record as of June 30, 2020. During the three months ended June 30, 2019, we declared a dividend of $0.62 per share, or $83.3 million in aggregate.
During the six months ended June 30, 2020, we declared aggregate dividends of $1.24 per share, or $174.6 million. During the six months ended June 30, 2019, we declared aggregate dividends of $1.24 per share, or $161.2 million.
IV. Liquidity and Capital Resources
We have capitalized our business to date primarily through the issuance and sale of shares of our class A common stock, borrowings under secured debt agreements, and the issuance of secured term loans and issuance and sale of convertible notes. As of June 30, 2020, our balance sheet included $1.7 billion of corporate debt and $13.5 billion of asset-level financing. No portion of our corporate debt matures before 2022 and our asset-specific financing is generally term-matched or matures in 2022 or later. Of our $13.5 billion of asset-level financing, $3.8 billion includes consolidated and non-consolidated securitized debt obligations and senior syndications, which are both inherently non-recourse, non-mark to market, and term-matched to the financed assets, and we have $9.7 billion of borrowings under our credit facilities and asset-specific financings.
Margin call provisions under our credit facilities do not permit valuation adjustments based on capital markets events, and are limited to collateral-specific credit marks generally determined on a commercially reasonable basis.
During the three months ended June 30, 2020, we entered into agreements with seven of our secured credit facility lenders, representing an aggregate $7.9 billion of our secured credit facilities, to temporarily suspend credit mark provisions on certain of their portfolio assets in exchange for: (i) cash repayments; (ii) pledges of additional collateral; and (iii) reductions of available borrowings.
We are in frequent, consistent dialogue with the providers of our secured credit facilities regarding our management of their collateral assets in light of the impacts of the COVID-19 pandemic. Our Manager’s robust, in-house asset management team has extensive experience managing loans throughout cycles, and maintains a rated special servicer as part of its broader real estate debt investment and asset management platform. The feedback we have received from our lenders indicates that they believe our Manager, as part of the broader Blackstone Real Estate platform, has a superior capability to manage the loans in our portfolio to a successful resolution.
See Notes 5, 6, 7, and 8 to our consolidated financial statements for additional details regarding our secured debt agreements, securitized debt obligations, Secured Term Loans, and Convertible Notes, respectively.
Debt-to-Equity Ratio and Total Leverage Ratio
The following table presents our debt-to-equity ratio and total leverage ratio:
| | |
| | Represents (i) total outstanding secured debt agreements, secured term loans, and convertible notes, less cash, to (ii) total equity, in each case at period end. |
| | Represents (i) total outstanding secured debt agreements, secured term loans, convertible notes, non-consolidated senior interests, and consolidated and non-consolidated securitized debt obligations, less cash, to (ii) total equity, in each case at period end. |
Our current sources of liquidity include cash and cash equivalents, available borrowings under our secured debt agreements, and net receivables from servicers related to loan repayments, which are set forth in the following table ($ in thousands):
| | | | | | | | |
| | | | | | | |
Cash and cash equivalents | | $ | 1,259,836 | | | $ | 150,090 | |
Available borrowings under secured debt agreements | | | 97,032 | | | | 598,840 | |
Loan principal payments held by servicer, net (1) | | | 11,570 | | | | 1,965 | |
| | | | | | | | |
| | $ | 1,368,438 | | | $ | 750,895 | |
| | | | | | | | |
| |
| | |
| | Represents loan principal payments held by our third-party servicer as of the balance sheet date which were remitted to us during the subsequent remittance cycle, net of the related secured debt balance. |
Typically, loan repayments are our largest source of incremental liquidity. For the year ended December 31, 2019, loan repayments generated $998.2 million of liquidity, net of any related financings. Similarly, through June 30, 2020, loan repayments generated $196.3 million of liquidity. We currently expect the pace of loan prepayments will slow while the impacts of the COVID-19 pandemic are ongoing, however, as of June 30, 2020, our portfolio does include $3.4 billion of loans with a final maturity date earlier than December 31, 2022.
During the six months ended June 30, 2020, we generated cash flow from operating activities of $175.7 million. We expect, however, that the impact of the COVID-19 pandemic will put pressure on our cash flow from operations as we enter into loan modifications on certain of our loans permitting interest payments to be capitalized, and as we repay borrowings under our secured credit facilities. Additionally, during the three months ended June 30, 2020, we received $315.4 million of net borrowings under a secured term loan and $278.3 million of net proceeds from the issuance of shares of class A common stock. Furthermore, we are able to generate incremental liquidity through the replenishment provisions of our 2020 CLO, which allow us to replace a loan in the CLO that has been repaid by increasing the principal amount of existing CLO collateral assets to maintain the aggregate amount of collateral assets in the CLO, and the related financing outstanding.
We are focused on fortifying our balance sheet and enhancing our liquidity to best position us to weather near-term market uncertainty, satisfy our loan future funding and financing obligations and to potentially make opportunistic new investments, which will cause us to take some or all of the following actions: raise capital from offerings of securities, borrow additional capital, sell assets, pay our management and incentive fees in shares of our class A common stock, as we did with respect to such fees for the quarter ended March 31, 2020, and/or change our dividend practice, including by reducing the amount of, or temporarily suspending, our future dividends or paying our future dividends in kind for some period of time.
We have access to liquidity through public offerings of debt and equity securities. To facilitate such offerings, in July 2019, we filed a shelf registration statement with the Securities and Exchange Commission, or the SEC, that is effective for a term of three years and expires at the end of July 2022. The amount of securities to be issued pursuant to this shelf registration statement was not specified when it was filed and there is no specific dollar limit on the amount of securities we may issue. The securities covered by this registration statement include: (i) class A common stock; (ii) preferred stock; (iii) debt securities; (iv) depositary shares representing preferred stock; (v) warrants; (vi) subscription rights; (vii) purchase contracts; and (viii) units consisting of one or more of such securities or any combination of these securities. The specifics of any future offerings, along with the use of proceeds of any securities offered, will be described in detail in a prospectus supplement, or other offering materials, at the time of any offering.
We may also access liquidity through a dividend reinvestment plan and direct stock purchase plan, under which 9,993,053 shares of class A common stock were available for issuance as of June 30, 2020, and our at-the-market stock offering program, pursuant to which we may sell, from time to time, up to $363.8 million of additional shares of our class A common stock as of June 30, 2020. Refer to Note 10 to our consolidated financial statements for additional details.
In addition to our loan origination activity and general operating expenses, our primary liquidity needs include interest and principal payments under our $9.7 billion of outstanding borrowings under secured debt agreements, our Secured Term Loans, and our Convertible Notes.
In addition, we had aggregate unfunded loan commitments of $3.6 billion as of June 30, 2020. We generally finance the funding of our loan commitments on terms consistent with our overall credit facilities, with an average advance rate of 75.6% for such financed loans, resulting in identified financing for $2.2 billion of our aggregate unfunded loan commitments as of June 30, 2020. Some of our lenders, including substantially all of our financing of construction loans, are contractually obligated to fund their ratable portion of these loan commitments over time, while other lenders have some degree of discretion over future loan funding obligations. We expect to fund our loan commitments over the tenor of these loans, which have a weighted-average future funding period of 3.9 years. Our future loan fundings comprise funding for capital expenditures and construction, leasing costs, and interest and carry costs, and will vary depending on the progress of capital projects, leasing, and cash flows at the assets underlying our loans. Therefore, the exact timing and amounts of such future loan fundings are uncertain and will depend on the current and future performance of the underlying collateral assets. As a result of the COVID-19 pandemic, the progress of capital expenditures, construction, and leasing is anticipated to be slower than otherwise expected, and the pace of future funding relating to these capital needs may be commensurately slower.
Contractual Obligations and Commitments
Our contractual obligations and commitments as of June 30, 2020 were as follows ($ in thousands):
| | | | | | | | | | | | | | | | | | | | |
| | | | | | | |
| | | | | | | | | | | | | | | | |
| | | | | | | | | | | | | | | | |
Unfunded loan commitments (1) | | $ | 3,590,868 | | | $ | 93,950 | | | $ | 787,807 | | | $ | 2,178,328 | | | $ | 530,783 | |
Principal repayments under secured debt agreements (2) | | | 9,716,452 | | | | 183,218 | | | | 3,749,063 | | | | 5,544,371 | | | | 239,800 | |
Principal repayments of secured term loans (3) | | | 1,068,134 | | | | 10,738 | | | | 21,475 | | | | 21,475 | | | | 1,014,446 | |
Principal repayments of convertible notes (4) | | | 622,500 | | | | — | | | | 622,500 | | | | — | | | | — | |
| | | 871,765 | | | | 262,479 | | | | 403,742 | | | | 174,163 | | | | 31,381 | |
| | | | | | | | | | | | | | | | | | | | |
| | $ | 15,869,719 | | | $ | 550,385 | | | $ | 5,584,587 | | | $ | 7,918,337 | | | $ | 1,816,410 | |
| | | | | | | | | | | | | | | | | | | | |
| | |
| | The allocation of our unfunded loan commitments is based on the earlier of the commitment expiration date or the final loan maturity date, however we may be obligated to fund these commitments earlier than such date |
| | The allocation of repayments under our secured debt agreements for both principal and interest payments is based on the earlier of (i) the maturity date of each facility, or (ii) the maximum maturity date of the collateral loans, assuming all extension options are exercised by the borrower. |
| | The Secured Term Loans are partially amortizing, with an amount equal to 1.0% per annum of the principal balance due in quarterly installments. Refer to Note 7 to our consolidated financial statements for further details on our secured term loans. |
| | Reflects the outstanding principal balance of convertible notes, excluding any potential conversion premium. Refer to Note 8 to our consolidated financial statements for further details on our convertible notes. |
| | Represents interest payments on our secured debt agreements, convertible notes, and Secured Term Loans. Future interest payment obligations are estimated assuming the interest rates in effect as of June 30, 2020 will remain constant into the future. This is only an estimate as actual amounts borrowed and interest rates will vary over time. |
| | Total does not include $739.6 million of non-consolidated senior interests and $3.0 billion of consolidated and non-consolidated securitized debt obligations, as the satisfaction of these liabilities will not require cash outlays from us. |
We are also required to settle our interest rate swaps with our derivative counterparties upon maturity which, depending on interest rate movements, may result in cash received from or due to the respective counterparty. The table above does not include these amounts as they are not fixed and determinable. Refer to Note 9 to our consolidated financial statements for details regarding our derivative contracts.
We are required to pay our Manager a base management fee, an incentive fee, and reimbursements for certain expenses pursuant to our Management Agreement. The table above does not include the amounts payable to our Manager under our Management Agreement as they are not fixed and determinable. Refer to Note 11 to our consolidated financial statements for additional terms and details of the fees payable under our Management Agreement.
As a REIT, we generally must distribute substantially all of our net taxable income to stockholders in the form of dividends to comply with the REIT provisions of the Internal Revenue Code. Our taxable income does not necessarily equal our net income (loss) as calculated in accordance with GAAP, or our Core Earnings as described above.
The following table provides a breakdown of the net change in our cash and cash equivalents ($ in thousands):
| | | | | | | | |
| | | Six Months Ended June 30, | |
| | | | | | | |
Cash flows provided by operating activities | | $ | 175,708 | | | $ | 157,184 | |
Cash flows used in investing activities | | | (234,728 | ) | | | (90,425 | ) |
Cash flows provided by (used in) financing activities | | | 1,169,772 | | | | (91,834 | ) |
| | | | | | | | |
Net increase (decrease) in cash and cash equivalents | | $ | 1,110,752 | | | $ | (25,075 | ) |
| | | | | | | | |
We experienced a net increase in cash and cash equivalents of $1.1 billion for the six months ended June 30, 2020, compared to a net decrease of $25.1 million for the six months ended June 30, 2019. During the six months ended June 30, 2020, we received (i) $1.2 billion of proceeds from the issuance of collateralized loan obligations, (ii) $928.3 million from loan principal collections, (iii) $315.4 million of net borrowings under a secured term loan, and (iv) $278.3 million in net proceeds from the issuance of shares of class A common stock. We used the proceeds from these activities to (i) fund $1.2 billion of new loans and (ii) repay a net $286.1 million under our secured debt agreements.
Refer to Note 3 to our consolidated financial statements for further discussion of our loan activity. Refer to Notes 5 and 10 to our consolidated financial statements for further discussion of our secured debt agreements and equity.
We have elected to be taxed as a REIT under the Internal Revenue Code for U.S. federal income tax purposes. We generally must distribute annually at least 90% of our net taxable income, subject to certain adjustments and excluding any net capital gain, in order for U.S. federal income tax not to apply to our earnings that we distribute. To the extent that we satisfy this distribution requirement, but distribute less than 100% of our net taxable income, we will be subject to U.S. federal income tax on our undistributed taxable income. In addition, we will be subject to a 4% nondeductible excise tax if the actual amount that we pay out to our stockholders in a calendar year is less than a minimum amount specified under U.S. federal tax laws.
Our qualification as a REIT also depends on our ability to meet various other requirements imposed by the Internal Revenue Code, which relate to organizational structure, diversity of stock ownership, and certain restrictions with regard to the nature of our assets and the sources of our income. Even if we qualify as a REIT, we may be subject to certain U.S. federal income and excise taxes and state and local taxes on our income and assets. If we fail to maintain our qualification as a REIT for any taxable year, we may be subject to material penalties as well as federal, state and local income tax on our taxable income at regular corporate rates and we would not be able to qualify as a REIT for the subsequent four full taxable years. As of
SeptemberJune 30,
20172020 and December 31,
2016,2019, we were in compliance with all REIT requirements.
During the three and nine months ended September 30, 2017, we recorded a current income tax provision of $83,000 and $265,000, respectively, primarily related to activities of our taxable REIT subsidiaries and various state and local taxes. During the three and nine months ended September 30, 2016, we recorded an income tax provision of $194,000 and $281,000, respectively. We did not have any deferred tax assets or liabilities as of September 30, 2017 or December 31, 2016.
Blackstone Mortgage Trust, Inc.
Notes to Consolidated Financial Statements (continued)
(Unaudited)
We have net operating losses, or NOLs, generated by our predecessor business that may be carried forward and utilized in current or future periods. As a result of our issuance of 25,875,000 shares of class A common stock in May 2013, the availability of our NOLs is generally limited to $2.0 million per annum by change of control provisions promulgated by the Internal Revenue Service with respect to the ownership of Blackstone Mortgage Trust. As of December 31, 2016, we had NOLs of $159.0 million that will expire in 2029, unless they are utilized by us prior to expiration.
As of September 30, 2017, tax years 2014 through 2016 remain subject to examination by taxing authorities.
14. STOCK-BASED INCENTIVE PLANS
We are externally managed by our Manager and do not currently have any employees. However, as of September 30, 2017, our Manager, certain individuals employed by an affiliate of our Manager, and certain members of our board of directors were compensated, in part, through the issuance of stock-based instruments.
We had stock-based incentive awards outstanding under seven benefit plans as of September 30, 2017: (i) our amended and restated 1997 non-employee director stock plan, or 1997 Plan; (ii) our 2007 long-term incentive plan, or 2007 Plan; (iii) our 2011 long-term incentive plan, or 2011 Plan; (iv) our 2013 stock incentive plan, or 2013 Plan; (v) our 2013 manager incentive plan, or 2013 Manager Plan; (vi) our 2016 stock incentive plan, or 2016 Plan; and (vii) our 2016 manager incentive plan, or 2016 Manager Plan. We refer to our 1997 Plan, our 2007 Plan, our 2011 Plan, our 2013 Plan, and our 2013 Manager Plan, collectively, as our Expired Plans and we refer to our 2016 Plan and 2016 Manager Plan, collectively, as our Current Plans.
Our Expired Plans have expired and no new awards may be issued under them. Under our Current Plans, a maximum of 2,400,000 shares of our class A common stock may be issued to our Manager, our directors and officers, and certain employees of affiliates of our Manager. As of September 30, 2017, there were 1,448,852 shares available under the Current Plans.
The following table details the movement in our outstanding shares of restricted class A common stock and the weighted-average grant date fair value per share:
| | | | | | | | |
| | | Restricted Class A
Common Stock | | | Weighted-Average
Grant Date Fair
Value Per Share | |
Balance as of December 31, 2016 | | | 1,309,995 | | | $ | 28.68 | |
Granted | | | 289,896 | | | | 30.55 | |
Vested | | | (335,536 | ) | | | 27.78 | |
Forfeited | | | (3,123 | ) | | | 27.37 | |
| | | | | | | | |
Balance as of September 30, 2017 | | | 1,261,232 | | | $ | 29.35 | |
| | | | | | | | |
These shares generally vest in installments over a three-year period, pursuant to the terms of the respective award agreements and the terms of the Current Plans. The 1,261,232 shares of restricted class A common stock outstanding as of September 30, 2017 will vest as follows: 412,480 shares will vest in 2017; 542,789 shares will vest in 2018; 305,218 shares will vest in 2019; and 745 shares will vest in 2020. As of September 30, 2017, total unrecognized compensation cost relating to nonvested share-based compensation arrangements was $29.8 million based on the closing price of our class A common stock of $31.02 on September 29, 2017, the last trading day in the quarter ended September 30, 2017. This cost is expected to be recognized over a weighted average period of 1.0 years from September 30, 2017.
Blackstone Mortgage Trust, Inc.
Notes to Consolidated Financial Statements (continued)
(Unaudited)
15. FAIR VALUES
Assets and Liabilities Measured at Fair Value
The following table summarizes our assets and liabilities measured at fair value on a recurring basis ($ in thousands):
| | | | | | | | | | | | | | | | | | | | | | | | | | | | | | | | |
| | | September 30, 2017 | | | December 31, 2016 | |
| | | Level 1 | | | Level 2 | | | Level 3 | | | Fair Value | | | Level 1 | | | Level 2 | | | Level 3 | | | Fair Value | |
Assets | | | | | | | | | | | | | | | | | | | | | | | | | | | | | | | | |
Derivatives | | $ | — | | | $ | 1,628 | | | $ | — | | | $ | 1,628 | | | $ | — | | | $ | 4,086 | | | $ | — | | | $ | 4,086 | |
Liabilities | | | | | | | | | | | | | | | | | | | | | | | | | | | | | | | | |
Derivatives | | $ | — | | | $ | 7,167 | | | $ | — | | | $ | 7,167 | | | $ | — | | | $ | 210 | | | $ | — | | | $ | 210 | |
The following table reconciles the beginning and ending balances of assets measured at fair value on a recurring basis using Level 3 inputs ($ in thousands):
| | | | | | | | |
| | | Nine Months Ended September 30, | |
| | | 2017 | | | 2016(1) | |
January 1, | | $ | — | | | $ | 12,561 | |
Proceeds from investment realizations | | | — | | | | (2,406 | ) |
Transfers out of level 3(2) | | | — | | | | (20,745 | ) |
Adjustments to fair value included in earnings | | | | | | | | |
Gain on investments at fair value | | | — | | | | 11,790 | |
| | | | | | | | |
September 30, | | $ | — | | | $ | 1,200 | |
| | | | | | | | |
| |
| (1) | All assets measured at fair value on a recurring basis using Level 3 inputs were included as a component of other assets in the consolidated Balance Sheets.
| |
| (2) | During the second quarter of 2016, $20.7 million of collateralized debt obligations, or CDOs, were transferred out of Level 3 and into Level 1 as a result of a binding agreement to sell the underlying collateral assets of the CDO to an independent third-party. These investments were realized in the third quarter of 2016.
| |
Refer to Note 2 for further discussion regarding fair value measurement.
Fair Value of Financial Instruments
As discussed in Note 2, GAAP requires disclosure of fair value information about financial instruments, whether or not recognized in the statement of financial position, for which it is practicable to estimate that value. The following table details the carrying amount, face amount, and fair value of the financial instruments described in Note 2 ($ in thousands):
| | | | | | | | | | | | | | | | | | | | | | | | |
| | | September 30, 2017 | | | December 31, 2016 | |
| | | Carrying | | | Face | | | Fair | | | Carrying | | | Face | | | Fair | |
| | | Amount | | | Amount | | | Value | | | Amount | | | Amount | | | Value | |
Financial assets | | | | | | | | | | | | | | | | | | | | | | | | |
Cash and cash equivalents | | $ | 61,221 | | | $ | 61,221 | | | $ | 61,221 | | | $ | 75,567 | | | $ | 75,567 | | | $ | 75,567 | |
Restricted cash | | | 32,864 | | | | 32,864 | | | | 32,864 | | | | — | | | | — | | | | — | |
Loans receivable, net | | | 9,637,152 | | | | 9,681,055 | | | | 9,685,422 | | | | 8,692,978 | | | | 8,727,218 | | | | 8,733,784 | |
Financial liabilities | | | | | | | | | | | | | | | | | | | | | | | | |
Secured debt agreements, net | | | 6,079,135 | | | | 6,096,597 | | | | 6,096,597 | | | | 5,716,354 | | | | 5,731,626 | | | | 5,731,626 | |
Loan participations sold, net | | | 33,193 | | | | 33,193 | | | | 33,193 | | | | 348,077 | | | | 349,633 | | | | 349,633 | |
Securitized debt obligations, net | | | 474,298 | | | | 474,620 | | | | 474,655 | | | | — | | | | — | | | | — | |
Convertible notes, net | | | 562,741 | | | | 575,000 | | | | 602,503 | | | | 166,762 | | | | 172,500 | | | | 191,763 | |
Blackstone Mortgage Trust, Inc.
Notes to Consolidated Financial Statements (continued)
(Unaudited)
Estimates of fair value for cash and cash equivalents, restricted cash, and convertible notes are measured using observable, quoted market prices, or Level 1 inputs. Estimates of fair value for securitized debt obligations are measured using observable, quoted market prices, in inactive markets, or Level 2 inputs. All other fair value significant estimates are measured using unobservable inputs, or Level 3 inputs. See Note 2 for further discussion regarding fair value measurement of certain of our assets and liabilities.
16. VARIABLE INTEREST ENTITIES
In the second quarter of 2017, we financed one of our loans through the Securitization, which is a VIE. We are the primary beneficiary and consolidate the Securitization on our balance sheet as we (i) control the subordinate tranche of the Securitization, which we believe gives us the power to direct the activities that most significantly affect the Securitization, and (ii) have the right to receive benefits and obligation to absorb losses of the Securitization through the subordinate interests we own.
The following table details the assets and liabilities of our consolidated Securitization VIE ($ in thousands):
| | | | | | | | |
| | | September 30, 2017 | | | December 31, 2016 | |
Assets: | | | | | | | | |
Loans receivable, net | | $ | 500,000 | | | $ | — | |
Other assets | | | 763 | | | | — | |
| | | | | | | | |
Total assets | | $ | 500,763 | | | $ | — | |
| | | | | | | | |
Liabilities: | | | | | | | | |
Securitized debt obligations, net | | $ | 474,298 | | | $ | — | |
Other liabilities | | | 604 | | | | — | |
| | | | | | | | |
Total liabilities | | $ | 474,902 | | | $ | — | |
| | | | | | | | |
Assets held by the Securitization are restricted and can be used only to settle obligations of the Securitization, including the subordinate interests owned by us. The liabilities of the Securitization are non-recourse to us and can only be satisfied from the assets of the Securitization. The consolidation of the Securitization results in an increase in our gross assets, liabilities, interest income and interest expense, however it does not affect our stockholders’ equity or net income. We are not obligated to provide, have not provided, and do not intend to provide financial support to the Securitization.
17. TRANSACTIONS WITH RELATED PARTIES
We are managed by our Manager pursuant to the Management Agreement, the current term of which expires on December 19, 2017, and will be automatically renewed for a one-year term each anniversary thereafter unless earlier terminated.
As of September 30, 2017 and December 31, 2016, our consolidated balance sheet included $13.2 million and $12.8 million of accrued management and incentive fees payable to our Manager, respectively. During the three and nine months ended September 30, 2017, we paid management and incentive fees of $14.4 million and $40.1 million, respectively, to our Manager, compared to $15.8 million and $43.8 million during the same periods of 2016. In addition, during the three and nine months ended September 30, 2017, we reimbursed our Manager for expenses incurred on our behalf of $59,000 and $325,000, respectively, compared to $82,000 and $462,000 during the same periods of 2016. During the three and nine months ended September 30, 2016, CT Legacy Partners made aggregate preferred distributions of $146,000 and $491,000, respectively, to an affiliate of our Manager.
As of September 30, 2017, our Manager held 607,789 shares of unvested restricted class A common stock, which had an aggregate grant date fair value of $17.8 million. The shares vest in installments over three years from the date of issuance. During the three and nine months ended September 30, 2017, we recorded non-cash expense related to shares held by our Manager of $2.9 million and $8.7 million, respectively, compared to $2.5 million and $7.1 million during the same periods of 2016. We did not issue any shares of restricted class A common stock to our Manager during the nine months ended September 30, 2017 or 2016, respectively. Refer to Note 14 for further details on our restricted class A common stock.
During the nine months ended September 30, 2017 and 2016, we originated five loans and one loan, respectively, whereby each respective borrower engaged an affiliate of our Manager to act as title insurance agent in connection with each transaction. We did not incur any expenses or receive any revenues as a result of these transactions.
Blackstone Mortgage Trust, Inc.
Notes to Consolidated Financial Statements (continued)
(Unaudited)
During the three and nine months ended September 30, 2017, we incurred $87,000 and $254,000, respectively, of expenses for various administrative and capital market data services to third-party service providers that are affiliates of our Manager, compared to $112,000 and $282,000 during the same periods of 2016.
On June 30, 2017, in a fully subscribed offering totaling $474.6 million, certain Blackstone-advised investment vehicles purchased, in the aggregate, $72.9 million of securitized debt obligations issued by the Securitization. These investments by the Blackstone-advised investment vehicles represented no more than a 49% participation in any individual tranche and were purchased by the Blackstone-advised investment vehicles from third-party investment banks on market terms negotiated by the majority third-party investors. Refer to Note 8 for further details on the Securitization.
18. COMMITMENTS AND CONTINGENCIES
Unfunded Commitments Under Loans Receivable
As of September 30, 2017, we had unfunded commitments of $1.6 billion related to 67 of our loans receivable, which amounts will generally be funded to finance lease-related or capital expenditures by our borrowers. These future commitments will expire variously over the next four years.
Litigation
From time to time, we may be involved in various claims and legal actions arising in the ordinary course of business. As of September 30, 2017, we were not involved in any material legal proceedings.
Board of Directors’ Compensation
In April 2017, our board of directors approved changes to the compensation of our five independent directors which were effective as of the beginning of the third quarter of 2017. The other three board members, including our chairman and our chief executive officer, will continue to serve as directors without compensation for such service. These changes increased the annual compensation of our directors from $125,000 to $175,000 and are paid $75,000 in cash and $100,000 in the form of deferred stock units. In addition, (i) the chair of our audit committee received an increase in the additional annual cash compensation from $12,000 to $20,000, (ii) the other members of our audit committee received additional annual cash compensation of $10,000, and (iii) the chairs of each of our compensation and corporate governance committees received additional annual cash compensation of $10,000.
ITEM 2. | MANAGEMENT’S DISCUSSION AND ANALYSIS OF FINANCIAL CONDITION AND RESULTS OF OPERATIONS |
References herein to “Blackstone Mortgage Trust,” “Company,” “we,” “us,” or “our” refer to Blackstone Mortgage Trust, Inc. and its subsidiaries unless the context specifically requires otherwise.
The following discussion should be read in conjunction with the unaudited consolidated financial statements and notes thereto appearing elsewhere in this quarterly report on Form10-Q. In addition to historical data, this discussion contains forward-looking statements about our business, operations and financial performance based on current expectations that involve risks, uncertainties and assumptions. Our actual results may differ materially from those in this discussion as a result of various factors, including but not limited to those discussed in Item 1A. Risk Factors in our annual report on Form 10-K for the year ended December 31, 2016 and elsewhere in this quarterly report on Form 10-Q.
Introduction
Blackstone Mortgage Trust is a real estate finance company that originates and purchases senior loans collateralized by properties in North America and Europe. We are externally managed by BXMT Advisors L.L.C., or our Manager, a subsidiary of The Blackstone Group L.P., or Blackstone, and are a real estate investment trust, or REIT, traded on the New York Stock Exchange, or NYSE, under the symbol “BXMT.” We are headquartered in New York City.
We conduct our operations as a REIT for U.S. federal income tax purposes. We generally will not be subject to U.S. federal income taxes on our taxable income to the extent that we annually distribute all of our net taxable income to stockholders and maintain our qualification as a REIT. We also operate our business in a manner that permits us to maintain an exclusion from registration under the Investment Company Act of 1940, as amended. We are organized as a holding company and conduct our business primarily through our various subsidiaries.
I. Key Financial Measures and Indicators
As a real estate finance company, we believe the key financial measures and indicators for our business are earnings per share, dividends declared, Core Earnings, and book value per share. For the three months ended September 30, 2017 we recorded earnings per share of $0.61, declared a dividend of $0.62 per share, and reported $0.69 per share of Core Earnings. In addition, our book value per share as of September 30, 2017 was $26.52. As further described below, Core Earnings is a measure that is not prepared in accordance with accounting principles generally accepted in the United States of America, or GAAP. We use Core Earnings to evaluate our performance excluding the effects of certain transactions and GAAP adjustments that we believe are not necessarily indicative of our current loan activity and operations.
Earnings Per Share and Dividends Declared
The following table sets forth the calculation of basic and diluted net income per share and dividends declared per share ($ in thousands, except per share data):
| | | | | | | | |
| | | Three Months Ended | |
| | | September 30, 2017 | | | June 30, 2017 | |
Net income(1) | | $ | 57,722 | | | $ | 50,613 | |
Weighted-average shares outstanding, basic and diluted | | | 95,013,087 | | | | 95,005,873 | |
| | | | | | | | |
Net income per share, basic and diluted | | $ | 0.61 | | | $ | 0.53 | |
| | | | | | | | |
Dividends declared per share | | $ | 0.62 | | | $ | 0.62 | |
| | | | | | | | |
| |
| (1) | Represents net income attributable to Blackstone Mortgage Trust, Inc.
|
Core Earnings
Core Earnings is a non-GAAP measure, which we define as GAAP net income (loss), including realized gains and losses not otherwise included in GAAP net income (loss), and excluding (i) net income (loss) attributable to our CT Legacy Portfolio, (ii) non-cash equity compensation expense, (iii) depreciation and amortization, (iv) unrealized gains (losses), and (v) certain non-cash items. Core Earnings may also be adjusted from time to time to exclude one-time events pursuant to changes in GAAP and certain other non-cash charges as determined by our Manager, subject to approval by a majority of our independent directors.
We believe that Core Earnings provides meaningful information to consider in addition to our net income and cash flow from operating activities determined in accordance with GAAP. This adjusted measure helps us to evaluate our performance excluding the effects of certain transactions and GAAP adjustments that we believe are not necessarily indicative of our current loan portfolio and operations. Although, according to the management agreement between our Manager and us, or our Management Agreement, we calculate the incentive and base management fees due to our Manager using Core Earnings before incentive fees expense, we report Core Earnings after incentive fee expense, as we believe this is a more meaningful presentation of the economic performance of our class A common stock.
Core Earnings does not represent net income or cash generated from operating activities and should not be considered as an alternative to GAAP net income, or an indication of our GAAP cash flows from operations, a measure of our liquidity, or an indication of funds available for our cash needs. In addition, our methodology for calculating Core Earnings may differ from the methodologies employed by other companies to calculate the same or similar supplemental performance measures, and accordingly, our reported Core Earnings may not be comparable to the Core Earnings reported by other companies.
The following table provides a reconciliation of Core Earnings to GAAP net income ($ in thousands, except per share data):
| | | | | | | | |
| | | Three Months Ended | |
| | | September 30, 2017 | | | June 30, 2017 | |
Net income(1) | | $ | 57,722 | | | $ | 50,613 | |
Non-cash compensation expense | | | 5,944 | | | | 5,959 | |
GE purchase discount accretion adjustment(2) | | | (138 | ) | | | (198 | ) |
Other items | | | 1,610 | | | | 1,001 | |
| | | | | | | | |
Core Earnings | | $ | 65,138 | | | $ | 57,375 | |
| | | | | | | | |
Weighted-average shares outstanding, basic and diluted | | | 95,013,087 | | | | 95,005,873 | |
| | | | | | | | |
Core Earnings per share, basic and diluted | | $ | 0.69 | | | $ | 0.60 | |
| | | | | | | | |
| |
| (1) | Represents net income attributable to Blackstone Mortgage Trust.
| |
| (2) | Adjustment in respect of the deferral in Core Earnings of the accretion of a total $9.1 million of purchase discount attributable to a certain pool of GE portfolio loans pending the repayment of those loans.
| |
Book Value Per Share
The following table calculates our book value per share ($ in thousands, except per share data):
| | | | | | | | |
| | | September 30, 2017 | | | June 30, 2017 | |
Stockholders’ equity | | $ | 2,519,614 | | | $ | 2,506,473 | |
Shares | | | | | | | | |
Class A common stock | | | 94,828,007 | | | | 94,827,579 | |
Deferred stock units | | | 189,587 | | | | 181,931 | |
| | | | | | | | |
Total outstanding | | | 95,017,594 | | | | 95,009,510 | |
| | | | | | | | |
Book value per share | | $ | 26.52 | | | $ | 26.38 | |
| | | | | | | | |
II. Loan Portfolio
During the quarter ended September 30, 2017, we originated $1.1 billion of loans. Loan fundings during the quarter totaled $860.5 million and repayments totaled $870.8 million. We generated interest income of $146.4 million and incurred interest expense of $67.9 million during the quarter, which resulted in $78.6 million of net interest income during the three months ended September 30, 2017.
Portfolio Overview
The following table details our loan origination activity ($ in thousands):
| | | | | | | | |
| | | Three Months Ended | | | Nine Months Ended | |
| | | September 30, 2017 | | | September 30, 2017 | |
Loan originations(1) | | $ | 1,095,994 | | | $ | 3,568,900 | |
Loan fundings(2) | | $ | 860,482 | | | $ | 2,838,320 | |
Loan repayments(3) | | | (870,761 | ) | | | (2,093,567 | ) |
| | | | | | | | |
Total net fundings | | $ | (10,279 | ) | | $ | 744,753 | |
| | | | | | | | |
| |
(1) Includes new loan originations and additional commitments made under existing loans. Loan originations during the three and nine months ended September 30, 2017 include $4.0 million of additional commitments under related non-consolidated senior interests. (2) Loan fundings during the three and nine months ended September 30, 2017 include $10.8 million and $49.0 million, respectively, of additional fundings under related non-consolidated senior interests. (3) Loan repayments during the three and nine months ended September 30, 2017 include $17.8 million and $122.8 million, respectively, of additional repayments under related non-consolidated senior interests. | |
The following table details overall statistics for our loan portfolio as of September 30, 2017 ($ in thousands):
| | | | | | | | | | | | | | | | |
| | | | | | Total Loan Exposure(1) | |
| | | Balance Sheet
Portfolio | | | Total Loan
Portfolio | | | Floating Rate
Loans | | | Fixed Rate
Loans | |
Number of loans | | | 111 | | | | 111 | | | | 98 | | | | 13 | |
Principal balance | | $ | 9,681,055 | | | $ | 10,668,677 | | | $ | 9,793,239 | | | $ | 875,438 | |
Net book value | | $ | 9,637,152 | | | $ | 10,621,408 | | | $ | 9,746,450 | | | $ | 874,958 | |
Unfunded loan commitments(2) | | $ | 1,622,216 | | | $ | 1,673,300 | | | $ | 1,673,300 | | | $ | — | |
Weighted-average cash coupon(3) | | | 5.30 | % | | | 5.13 | % | | | L + 3.97 | % | | | 4.78 | % |
Weighted-average all-in yield(3) | | | 5.68 | % | | | 5.55 | % | | | L + 4.36 | % | | | 5.69 | % |
Weighted-average maximum maturity (years)(4) | | | 3.4 | | | | 3.4 | | | | 3.4 | | | | 3.9 | |
Loan to value (LTV)(5) | | | 61.8 | % | | | 61.1 | % | | | 60.3 | % | | | 69.6 | % |
| |
| | |
(1)
| | In certain instances, we finance our loans through the non-recourse sale of a senior loan interest that is not included in our consolidated financial statements. Total loan exposure encompasses the entire loan we originated and financed, including $987.6 million of such non-consolidated senior interests that are not included in our balance sheet portfolio.
|
(2)
| | Unfunded commitments will primarily be funded to finance property improvements or lease-related expenditures by the borrowers. These future commitments will be funded over the term of each loan, subject in certain cases to an expiration date.
|
(3)
| | As of September 30, 2017, our floating rate loans were indexed to various benchmark rates, with 91% of floating rate loans by loan exposure indexed to USD LIBOR based on total loan exposure. In addition, $273.9 million of our floating rate loans earned interest based on floors that are above the applicable index, with an average floor of 1.24%, as of September 30, 2017. In addition to cash coupon, all-in yield includes the amortization of deferred origination and extension fees, loan origination costs, purchase discounts, and accrual of exit fees. Cash coupon and all-in yield for the total portfolio assume applicable floating benchmark rates for weighted-average calculation.
|
(4)
| | Maximum maturity assumes all extension options are exercised by the borrower, however our loans may be repaid prior to such date. As of September 30, 2017, based on total loan exposure, 69% of our loans were subject to yield maintenance or other prepayment restrictions and 31% were open to repayment by the borrower without penalty.
|
(5)
| | Based on LTV as of the dates loans were originated or acquired by us.
|
The charts below detail the geographic distribution and types of properties securing these loans, as of September 30, 2017:
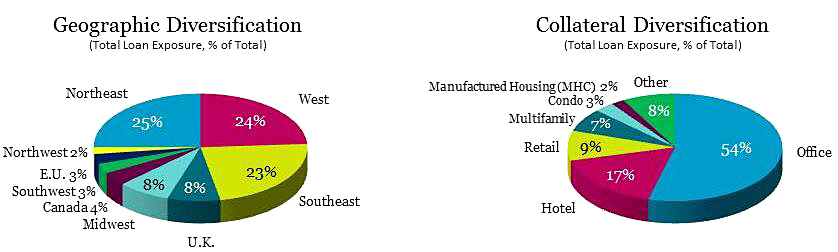
Refer to section VI of this Item 2 for details of our loan portfolio, on a loan-by-loan basis.
Asset Management
We actively manage the investments in our loan portfolio and exercise the rights afforded to us as a lender, including collateral level budget approvals, lease approvals, loan covenant enforcement, escrow/reserve management/collection, collateral release approvals and other rights that we may negotiate.
As discussed in Note 2 to our consolidated financial statements, our Manager performs a quarterly review of our loan portfolio, assesses the performance of each loan, and assigns it a risk rating between “1” and “5,” from less risk to greater risk. The following table allocates the principal balance and total loan exposure balances based on our internal risk ratings ($ in thousands):
| | | | | | | | | | |
| | | September 30, 2017 | |
Risk
Rating | | Number
of Loans | | Net Book
Value | | | Total Loan
Exposure(1) | |
| 1 | | 4 | | $ | 421,313 | | | $ | 421,628 | |
| 2 | | 49 | | | 3,701,801 | | | | 3,708,603 | |
| 3 | | 57 | | | 5,493,409 | | | | 6,517,829 | |
| 4 | | 1 | | | 20,629 | | | | 20,617 | |
| 5 | | — | | | — | | | | — | |
| | | | | | | | | | |
| | 111 | | $ | 9,637,152 | | | $ | 10,668,677 | |
| | | | | | | | | | |
| (1) | In certain instances, we finance our loans through the non-recourse sale of a senior loan interest that is not included in our consolidated financial statements. See Note 2 to our consolidated financial statements for further discussion. Total loan exposure encompasses the entire loan we originated and financed, including $987.6 million of such non-consolidated senior interests as of September 30, 2017.
| |
The weighted-average risk rating of our total loan exposure was 2.6 and 2.5 as of September 30, 2017 and December 31, 2016, respectively. The increase in weighted-average risk rating was primarily driven by repayments of loans with lower risk ratings, and not rating downgrades in the existing portfolio.
Multifamily Joint Venture
As of September 30, 2017, our Multifamily Joint Venture held $146.1 million of loans, which are included in the loan disclosures above. Refer to Note 2 for additional discussion of our Multifamily Joint Venture.
Portfolio Financing
Our portfolio financing arrangements include credit facilities, the GE portfolio acquisition facility, asset-specific financings, a revolving credit agreement, loan participations sold, non-consolidated senior interests, and securitized debt obligations.
The following table details our portfolio financing ($ in thousands):
| | | | | | | | |
| | | Portfolio Financing | |
| | | Outstanding Principal Balance | |
| | | September 30, 2017 | | | December 31, 2016 | |
Credit facilities | | $ | 4,386,645 | | | $ | 3,572,837 | |
GE portfolio acquisition facility | | | 1,090,946 | | | | 1,479,582 | |
Asset-specific financings | | | 517,256 | | | | 679,207 | |
Revolving credit agreement | | | 101,750 | | | | — | |
Loan participations sold | | | 33,193 | | | | 349,633 | |
Non-consolidated senior interests | | | 987,621 | | | | 1,029,516 | |
Securitized debt obligations | | | 474,620 | | | | — | |
| | | | | | | | |
Total portfolio financing | | $ | 7,592,031 | | | $ | 7,110,775 | |
| | | | | | | | |
Credit Facilities
The following table details our credit facilities ($ in thousands):
| | | | | | | | | | | | | | | | | | | | |
| | | September 30, 2017 | |
| | | Maximum | | | Collateral | | | Credit Borrowings | |
Lender | | Facility Size(1) | | | Assets(2) | | | Potential(3) | | | Outstanding | | | Available(3) | |
Wells Fargo | | $ | 2,000,000 | | | $ | 2,232,117 | | | $ | 1,724,227 | | | $ | 1,398,224 | | | $ | 326,003 | |
MetLife | | | 1,000,000 | | | | 1,030,148 | | | | 807,164 | | | | 807,164 | | | | — | |
Bank of America | | | 750,000 | | | | 818,359 | | | | 641,066 | | | | 641,066 | | | | — | |
Citibank(4) | | | 795,350 | | | | 596,119 | | | | 464,849 | | | | 356,751 | | | | 108,098 | |
JP Morgan(5) | | | 500,000 | | | | 453,121 | | | | 344,656 | | | | 295,984 | | | | 48,672 | |
Deutsche Bank | | | 500,000 | | | | 393,564 | | | | 295,743 | | | | 295,743 | | | | — | |
Société Générale(6) | | | 472,560 | | | | 332,761 | | | | 266,000 | | | | 266,000 | | | | — | |
Morgan Stanley(7) | | | 669,900 | | | | 422,332 | | | | 331,037 | | | | 211,105 | | | | 119,932 | |
Bank of America - Multi. JV(8) | | | 200,000 | | | | 87,000 | | | | 69,600 | | | | 69,600 | | | | — | |
Goldman Sachs - Multi. JV(8) | | | 250,000 | | | | 59,125 | | | | 45,008 | | | | 45,008 | | | | — | |
| | | | | | | | | | | | | | | | | | | | |
| | $ | 7,137,810 | | | $ | 6,424,646 | | | $ | 4,989,350 | | | $ | 4,386,645 | | | $ | 602,705 | |
| | | | | | | | | | | | | | | | | | | | |
| | |
(1)
| | Maximum facility size represents the largest amount of borrowings available under a given facility once sufficient collateral assets have been approved by the lender and pledged by us.
|
(2)
| | Represents the principal balance of the collateral assets.
|
(3)
| | Potential borrowings represents the total amount we could draw under each facility based on collateral already approved and pledged. When undrawn, these amounts are immediately available to us at our sole discretion under the terms of each credit facility.
|
(4)
| | As of September 30, 2017, the Citibank maximum facility size was composed of a general $500.0 million facility size denominated in U.S. Dollars plus a general €250.0 million ($295.4 million) facility size that contemplated British Pound Sterling and Euro borrowings.
|
(5)
| | As of September 30, 2017, the JP Morgan maximum facility size was composed of a general $500.0 million facility size, under which U.S. Dollars and British Pound Sterling borrowings are contemplated.
|
(6)
| | As of September 30, 2017, the Société Générale maximum facility size was composed of a €400.0 million facility size that was translated to $472.6 million. Borrowings denominated in U.S. Dollars, British Pound Sterling, and Euro are contemplated under this facility.
|
(7)
| | As of September 30, 2017, the Morgan Stanley maximum facility size was composed of a £500.0 million facility size that was translated to $669.9 million. Borrowings denominated in U.S. Dollars, British Pound Sterling, and Euro are contemplated under this facility.
|
(8)
| | These facilities finance the loan investments of our consolidated Multifamily Joint Venture. Refer to Note 2 for additional discussion of our Multifamily Joint Venture.
|
The weighted-average outstanding balance of our credit facilities was $4.0 billion for the nine months ended September 30, 2017. As of September 30, 2017, we had aggregate borrowings of $4.4 billion outstanding under our credit facilities, with a weighted-average cash coupon of LIBOR plus 1.88% per annum, a weighted-average all-in cost of credit, including associated fees and expenses, of LIBOR plus 2.09% per annum, and a weighted-average advance rate of 78.8%. As of September 30, 2017, outstanding borrowings under these facilities had a weighted-average maturity, excluding extension options and term-out provisions, of 1.5 years.
Borrowings under each facility are subject to the initial approval of eligible collateral loans by the lender and the maximum advance rate and pricing rate of individual advances are determined with reference to the attributes of the respective collateral loan.
GE Portfolio Acquisition Facility
During the second quarter of 2015, concurrently with our acquisition of the GE portfolio, we entered into an agreement with Wells Fargo to provide us with secured financing for the acquired portfolio. As of September 30, 2017, this facility provided for $1.2 billion of financing, of which $1.1 billion was outstanding and an additional $129.4 million was available to finance future loan fundings in the GE portfolio. The GE portfolio acquisition facility is non-revolving and consists of a single master repurchase agreement providing for asset-specific borrowings for each collateral asset.
The asset-specific borrowings under the GE portfolio acquisition facility were advanced at a weighted-average rate of 80% of our purchase price of the collateral assets and are repaid pro rata from collateral asset repayment proceeds. The asset-specific borrowings are currency matched to the collateral assets and accrue interest at a rate equal to the sum of (i) the applicable base rate plus (ii) a margin of 1.75%, which will increase to 1.80% and 1.85% in year four and year five, respectively. As of September 30, 2017, those borrowings were denominated in U.S. Dollars, Canadian Dollars, and British Pounds Sterling. The asset-specific borrowings are term matched to the underlying collateral assets with an outside maturity date of May 20, 2020, which may be extended pursuant to two one-year extension options. We guarantee obligations under the GE portfolio acquisition facility in an amount equal to the greater of (i) 25% of outstanding asset-specific borrowings, and (ii) $250.0 million. We had outstanding asset-specific borrowings under the GE portfolio acquisition facility of $1.1 billion and a weighted-average all-in cost of credit, including associated fees and expenses, of LIBOR plus 1.75% per annum as of September 30, 2017.
Asset-Specific Financings
The following table details our asset-specific financings ($ in thousands):
| | | | | | | | | | | | | | | | | | | | |
| | | September 30, 2017 |
| | | | | Principal | | | Book | | | Wtd. Avg. | | | | | | Wtd. Avg. |
Asset-Specific Financings | | Count | | Balance | | | Value | | | Yield/Cost(1) | | | Guarantee(2) | | | Term(3) |
Collateral assets | | 5 | | $ | 662,223 | | | $ | 659,152 | | | | L+4.70 | % | | | n/a | | | Dec. 2020 |
Financing provided(4) | | 5 | | $ | 517,256 | | | $ | 516,537 | | | | L+2.48 | % | | $ | 162,517 | | | Dec. 2020 |
| | |
(1)
| | These floating rate loans and related liabilities are indexed to the various benchmark rates relevant in each arrangement in terms of currency and payment frequency. Therefore the net exposure to each benchmark rate is in direct proportion to our net assets indexed to that rate. In addition to cash coupon, yield/cost includes the amortization of deferred origination fees / financing costs.
|
(2)
| | Other than amounts guaranteed on an asset-by-asset basis, borrowings under our asset-specific financings are non-recourse to us.
|
(3)
| | The weighted-average term is determined based on the maximum maturity of the corresponding loans, assuming all extension options are exercised by the borrower. Each of our asset-specific financings are term-matched to the corresponding collateral loans.
|
(4)
| | Borrowings of $394.8 million under these asset specific financings are cross collateralized with related credit facilities with the same lenders.
|
Refer to Note 6 to our consolidated financial statements for additional terms and details of our secured debt agreements, including certain financial covenants.
Revolving Credit Agreement
During the second quarter of 2017, we increased the borrowing capacity under our secured revolving credit agreement with Barclays by $125.0 million to $250.0 million. This full recourse facility is designed to finance first mortgage originations for up to six months as a bridge to term financing or syndication. Advances under the agreement are subject to availability under a specified borrowing base and accrue interest at a per annum pricing rate equal to the sum of (i) an applicable base rate or Eurodollar rate and (ii) an applicable margin, in each case, dependent on the applicable type of loan collateral. The maturity date of the facility is April 4, 2020.
During the nine months ended September 30, 2017, the weighted-average outstanding borrowings under the revolving credit agreement were $23.5 million and we recorded interest expense of $1.7 million, including $575,000 of amortization of deferred fees and expenses. As of September 30, 2017, we had $101.8 million of borrowings outstanding under the agreement.
Loan Participations Sold
The following table details our loan participations sold ($ in thousands):
| | | | | | | | | | | | | | | | | | | | | | |
| | | September 30, 2017 | |
| | | | | Principal | | | Book | | | | | | | | | | |
Loan Participations Sold | | Count | | Balance | | | Value | | | Yield/Cost(1) | | | Guarantee(2) | | | Term | |
Total loan | | 1 | | $ | 93,710 | | | $ | 91,498 | | | | L+5.96 | % | | | n/a | | | | Feb. 2022 | |
Senior participation(3) | | 1 | | | 33,193 | | | | 33,193 | | | | L+4.00 | % | | | n/a | | | | Feb. 2022 | |
| | |
(1)
| | Our floating rate loans and related liabilities are indexed to the various benchmark rates relevant in each arrangement in terms of currency and payment frequency. Therefore the net exposure to each benchmark rate is in direct proportion to our net assets indexed to that rate. In addition to cash coupon, yield/cost includes the amortization of deferred fees / financing costs.
|
(2)
| | As of September 30, 2017, our loan participation sold was non-recourse to us.
|
(3)
| | During the three and nine months ended September 30, 2017, we recorded $4.0 million and $9.3 million, respectively, of interest expense related to our loan participations sold, of which $2.6 million and $7.7 million was paid in cash.
|
Refer to Note 7 to our consolidated financial statements for additional details of our loan participations sold.
Non-Consolidated Senior Interests
In certain instances, we finance our loans through the non-recourse sale of a senior loan interest that is not included in our consolidated financial statements. These non-consolidated senior interests provide structural leverage for our net investments which are reflected in the form of mezzanine loans or other subordinate interests on our balance sheet and in our results of operations. The following table details the subordinate interests retained on our balance sheet and the related non-consolidated senior interests as of September 30, 2017 ($ in thousands):
| | | | | | | | | | | | | | | | | | | | | | |
| | | September 30, 2017 | |
| | | | | Principal | | | Book | | | Wtd. Avg. | | | | | | Wtd. Avg. | |
Non-Consolidated Senior Interests | | Count | | Balance | | | Value | | | Yield/Cost(1) | | | Guarantee | | | Term | |
Total loan | | 3 | | $ | 1,203,306 | | | | n/a | | | | 5.97 | % | | | n/a | | | | Sept. 2021 | |
Senior participation | | 3 | | | 987,621 | | | | n/a | | | | 4.37 | % | | | n/a | | | | Sept. 2021 | |
| | |
(1)
| | Our floating rate loans and related liabilities were indexed to the various benchmark rates relevant in each arrangement in terms of currency and payment frequency. Therefore the net exposure to each benchmark rate is in direct proportion to our net assets indexed to that rate. In addition to cash coupon, all-in yield/cost includes the amortization of deferred fees / financing costs.
|
Securitized Debt Obligations
The following table details our securitized debt obligations ($ in thousands):
| | | | | | | | | | | | | | | | | | |
| | | September 30, 2017 | |
| | | | | Principal | | | Book | | | | | | | |
Securitized Debt Obligations | | Count | | Balance | | | Value | | | Yield/Cost(1) | | | Term(2) | |
Total loan | | 1 | | $ | 644,788 | | | $ | 641,262 | | | | L+3.60 | % | | | June 2023 | |
Securitized debt obligations(3) | | 1 | | | 474,620 | | | | 474,298 | | | | L+1.94 | % | | | June 2033 | |
| | |
(1)
| | In addition to cash coupon, yield/cost includes the amortization of deferred origination fees / financing costs.
|
(2)
| | Loan term represents final maturity, assuming all extension options are exercised by the borrower. Repayments of securitized debt obligations are tied to timing of the related collateral loan asset repayments. The term of these obligations represents the rated final distribution date of the securitization.
|
(3)
| | During the three and nine months ended September 30, 2017, we recorded $3.8 million of interest expense related to our securitized debt obligations.
|
Refer to Notes 8 and 16 to our consolidated financial statements for additional details of our securitized debt obligations.
Floating Rate Portfolio
Generally, our business model is such that rising interest rates will increase our net income, while declining interest rates will decrease net income. As of September 30, 2017, 92% of our loans by total loan exposure earned a floating rate of interest and were financed with liabilities that pay interest at floating rates, which resulted in an amount of net equity that is positively correlated to rising interest rates, subject to the impact of interest rate floors on certain of our floating rate loans. As of September 30, 2017, the remaining 8% of our loans by total loan exposure earned a fixed rate of interest, but are financed with liabilities that pay interest at floating rates, which resulted in a negative correlation to rising interest rates to the extent of our financing. In certain instances where we have financed fixed rate assets with floating rate liabilities, we have purchased interest rate swaps or caps to limit our exposure to increases in interest rates on such liabilities.
Our liabilities are generally currency and index-matched to each collateral asset, resulting in a net exposure to movements in benchmark rates that varies by currency silo based on the relative proportion of floating rate assets and liabilities. The following table details our loan portfolio’s net exposure to interest rates by currency as of September 30, 2017 ($/£/€/C$ in thousands):
| | | | | | | | | | | | | | | | |
| | | USD | | | GBP | | | EUR | | | CAD | |
Floating rate loans(1) | | $ | 8,923,957 | | | £ | 306,606 | | | € | 109,732 | | | C$ | 410,145 | |
Floating rate debt(1)(2)(3) | | | (6,503,552 | ) | | | (172,553 | ) | | | (66,186 | ) | | | (358,905 | ) |
| | | | | | | | | | | | | | | | |
Net floating rate exposure(4) | | $ | 2,420,405 | | | £ | 134,053 | | | € | 43,546 | | | C$ | 51,240 | |
| | | | | | | | | | | | | | | | |
| |
| | |
(1)
| | Our floating rate loans and related liabilities are indexed to the various benchmark rates relevant in each case in terms of currency and payment frequency. Therefore the net exposure to each benchmark rate is in direct proportion to our net assets indexed to that rate.
|
(2)
| | Includes borrowings under secured debt agreements, loan participations sold, non-consolidated senior interests, and securitized debt obligations.
|
(3)
| | Liabilities balance includes four interest rate swaps totaling C$108.2 million ($86.7 million as of September 30, 2017) that are used to hedge a portion of our fixed rate debt.
|
(4)
| | In addition, we have interest rate caps of $204.2 million and C$23.4 million to limit our exposure to increases in interest rates.
|
Convertible Notes
As of September 30, 2017, the following convertible senior notes, or Convertible Notes, were outstanding ($ in thousands):
| | | | | | | | | | | | | | | | |
Convertible Notes Issuance | | Face Value | | | Coupon Rate | | | All-in Cost(1) | | | Maturity | |
November 2013 | | $ | 172,500 | | | | 5.25 | % | | | 5.87 | % | | | December 1, 2018 | |
May 2017 | | | 402,500 | | | | 4.38 | % | | | 4.85 | % | | | May 5, 2022 | |
| |
| | |
(1)
| | Includes issuance costs that are amortized through interest expense over the life of the Convertible Notes using the effective interest method.
|
Refer to Notes 2 and 9 to our consolidated financial statements for additional discussion of our Convertible Notes.
III. Our Results of Operations
Operating Results
The following table sets forth information regarding our consolidated results of operations ($ in thousands, except per share data):
| | | | | | | | | | | | | | | | | | | | | | | | |
| | | Three Months Ended
September 30, | | | 2017 vs
2016 | | | Nine Months Ended
September 30, | | | 2017 vs
2016 | |
| | | 2017 | | | 2016 | | | $ | | | 2017 | | | 2016 | | | $ | |
Income from loans and other investments | | | | | | | | | | | | | | | | | | | | | | | | |
Interest and related income | | $ | 146,446 | | | $ | 128,190 | | | $ | 18,256 | | | $ | 391,787 | | | $ | 381,686 | | | $ | 10,101 | |
Less: Interest and related expenses | | | 67,891 | | | | 45,373 | | | | 22,518 | | | | 168,917 | | | | 139,819 | | | | 29,098 | |
| | | | | | | | | | | | | | | | | | | | | | | | |
Income from loans and other investments, net | | | 78,555 | | | | 82,817 | | | | (4,262 | ) | | | 222,870 | | | | 241,867 | | | | (18,997 | ) |
Other expenses | | | | | | | | | | | | | | | | | | | | | | | | |
Management and incentive fees | | | 13,243 | | | | 13,701 | | | | (458 | ) | | | 40,557 | | | | 43,161 | | | | (2,604 | ) |
General and administrative expenses | | | 7,419 | | | | 7,414 | | | | 5 | | | | 22,219 | | | | 20,990 | | | | 1,229 | |
| | | | | | | | | | | | | | | | | | | | | | | | |
Total other expenses | | | 20,662 | | | | 21,115 | | | | (453 | ) | | | 62,776 | | | | 64,151 | | | | (1,375 | ) |
Gain on investments at fair value | | | — | | | | 2,824 | | | | (2,824 | ) | | | — | | | | 13,413 | | | | (13,413 | ) |
Income from equity investment in unconsolidated subsidiary | | | — | | | | 2,060 | | | | (2,060 | ) | | | — | | | | 2,192 | | | | (2,192 | ) |
| | | | | | | | | | | | | | | | | | | | | | | | |
Income before income taxes | | | 57,893 | | | | 66,586 | | | | (8,693 | ) | | | 160,094 | | | | 193,321 | | | | (33,227 | ) |
Income tax provision | | | 83 | | | | 194 | | | | (111 | ) | | | 265 | | | | 281 | | | | (16 | ) |
| | | | | | | | | | | | | | | | | | | | | | | | |
Net income | | | 57,810 | | | | 66,392 | | | | (8,582 | ) | | | 159,829 | | | | 193,040 | | | | (33,211 | ) |
| | | | | | | | | | | | | | | | | | | | | | | | |
Net income attributable to non-controlling interests | | | (88 | ) | | | (1,598 | ) | | | 1,510 | | | | (88 | ) | | | (8,119 | ) | | | 8,031 | |
| | | | | | | | | | | | | | | | | | | | | | | | |
Net income attributable to Blackstone Mortgage Trust, Inc. | | $ | 57,722 | | | $ | 64,794 | | | $ | (7,072 | ) | | $ | 159,741 | | | $ | 184,921 | | | $ | (25,180 | ) |
| | | | | | | | | | | | | | | | | | | | | | | | |
Net income per share - basic and diluted | | $ | 0.61 | | | $ | 0.69 | | | $ | (0.08 | ) | | $ | 1.68 | | | $ | 1.97 | | | $ | (0.29 | ) |
Dividends declared per share | | $ | 0.62 | | | $ | 0.62 | | | $ | — | | | $ | 1.86 | | | $ | 1.86 | | | $ | — | |
Income from loans and other investments, net
Income from loans and other investments, net decreased $4.3 million and $19.0 million during the three and nine months ended September 30, 2017, respectively, as compared to the corresponding periods in 2016. The decreases in both periods were primarily due to a decrease in non-recurring prepayment fee income and an increase in interest expense as a result of the convertible debt we issued in May 2017.
Other expenses
Other expenses are composed of management and incentive fees payable to our Manager and general and administrative expenses. Other expenses decreased by $453,000 during the three months ended September 30, 2017 compared to the corresponding period in 2016 due to (i) a decrease of $1.3 million of compensation expenses associated with our CT Legacy Portfolio incentive plans, and (ii) a decrease of $494,000 of incentive fees payable to our Manager. These were partially offset by (i) $964,000 of additional non-cash restricted stock amortization related to shares awarded under our long-term incentive plans, and (ii) an increase of $302,000 of general operating expenses.
Other expenses decreased by $1.4 million during the nine months ended September 30, 2017 compared to the nine months ended September 30, 2016 due to (i) a decrease of $2.8 million of incentive fees payable to our Manager, and (ii) a decrease of $2.2 million of compensation expenses associated with our CT Legacy Portfolio incentive plans. These were partially offset by (i) $3.3 million of additional non-cash restricted stock amortization related to shares awarded under our long-term incentive plans, (ii) an increase of $212,000 of management fees payable to our Manager, and (iii) an increase of $87,000 of general operating expenses.
Gain on investments at fair value
During the three and nine months ended September 30, 2016, we recognized $2.8 million and $13.4 million, respectively, of net gains on investments held by CT Legacy Partners. Our investment in CT Legacy Partners was substantially realized as of December 31, 2016.
Income from equity investment in unconsolidated subsidiary
During the three and nine months ended September 30, 2016, we recognized a $2.1 million gain and a $2.2 million gain, respectively, related to our promote interest from CTOPI. The investment in CTOPI was fully realized as of December 31, 2016.
Net income attributable to non-controlling interests
During the three and nine months ended September 30, 2017, our non-controlling interests related to our Multifamily Joint Venture. During the three and nine months ended September 30, 2016, our non-controlling interests related to CT Legacy Partners. In each case, the non-controlling interests represent the portion of the consolidated entity’s net income that is not owned by us.
During the three and nine months ended September 30, 2017, we recognized $88,000 of net income attributable to non-controlling interests related to our Multifamily Joint Venture. During the three and nine months ended September 30, 2016, we recognized $1.6 million and $8.1 million, respectively, of net income attributable to non-controlling interests which related to the gain on investments at fair value recognized by CT Legacy Partners during both periods.
Dividends per share
During the three months ended September 30, 2017, we declared a dividend of $0.62 per share, or $58.8 million, which was paid on October 13, 2017 to common stockholders of record as of September 30, 2017. During the three months ended September 30, 2016, we declared a dividend of $0.62 per share, or $58.2 million.
During the nine months ended September 30, 2017, we declared aggregate dividends of $1.86 per share, or $176.4 million. During the nine months ended September 30, 2016, we declared aggregate dividends of $1.86 per share, or $174.7 million.
IV. Liquidity and Capital Resources
Capitalization
We have capitalized our business to date through, among other things, the issuance and sale of shares of our class A common stock, borrowings under secured debt agreements, and the issuance and sale of Convertible Notes. As of September 30, 2017, we had 94,828,007 shares of our class A common stock outstanding representing $2.5 billion of stockholders’ equity, $6.1 billion of outstanding borrowings under secured debt agreements, and $575.0 million of Convertible Notes outstanding.
As of September 30, 2017, our secured debt agreements consisted of credit facilities with an outstanding balance of $4.4 billion, the GE portfolio acquisition facility with an outstanding balance of $1.1 billion, and $517.3 million of asset-specific financings. We also finance our business through the sale of loan participations and non-consolidated senior interests. As of September 30, 2017 we had $33.2 million of loan participations sold and $987.6 million of non-consolidated senior interests outstanding. In addition, as of September 30, 2017, our consolidated balance sheets included $474.6 million of securitized debt obligations related to the Securitization.
See Notes 6, 7, 8, and 9 to our consolidated financial statements for additional details regarding our secured debt agreements, loan participations sold, securitized debt obligations, and Convertible Notes, respectively.
Debt-to-Equity Ratio and Total Leverage Ratio
The following table presents our debt-to-equity ratio and total leverage ratio:
| | | | |
| | September 30, 2017 | | December 31, 2016 |
Debt-to-equity ratio(1)
| | 2.6x | | 2.3x |
Total leverage ratio(2)
| | 3.2x | | 2.9x |
|
| | |
(1)
| | Represents (i) total outstanding secured debt agreements and convertible notes, less cash, to (ii) total equity, in each case at period end.
|
(2)
| | Represents (i) total outstanding secured debt agreements, convertible notes, loan participations sold, non-consolidated senior interests, and securitized debt obligations, less cash, to (ii) total equity, in each case at period end.
|
Sources of Liquidity
Our primary sources of liquidity include cash and cash equivalents, available borrowings under our credit facilities and revolving credit agreement, and net receivables from servicers related to loan repayments which are set forth in the following table ($ in thousands):
| | | | | | | | |
| | | September 30, 2017 | | | December 31, 2016 | |
Cash and cash equivalents | | $ | 61,221 | | | $ | 75,567 | |
Available borrowings under secured debt agreements | | | 639,828 | | | | 541,743 | |
Loan principal payments held by servicer, net(1) | | | 845 | | | | 670 | |
| | | | | | | | |
| | $ | 701,894 | | | $ | 617,980 | |
| | | | | | | | |
| |
| | |
(1)
| | Represents loan principal payments held by our third-party servicer as of the balance sheet date which were remitted to us during the subsequent remittance cycle, net of the related secured debt balance.
|
In addition to our current sources of liquidity, we have access to liquidity through public offerings of debt and equity securities. To facilitate such offerings, in July 2016, we filed a shelf registration statement with the Securities and Exchange Commission, or the SEC, that is effective for a term of three years and expires in July 2019. The amount of securities to be issued pursuant to this shelf registration statement was not specified when it was filed and there is no specific dollar limit on the amount of securities we may issue. The securities covered by this registration statement include: (i) class A common stock; (ii) preferred stock; (iii) debt securities; (iv) depositary shares representing preferred stock; (v) warrants; (vi) subscription rights; (vii) purchase contracts; and (viii) units consisting of one or more of such securities or any combination of these securities. The specifics of any future offerings, along with the use of proceeds of any securities offered, will be described in detail in a prospectus supplement, or other offering materials, at the time of any offering.
We may also access liquidity through a dividend reinvestment plan and direct stock purchase plan, under which 9,997,356 shares of class A common stock were available for issuance as of September 30, 2017, and our at-the-market stock offering program, pursuant to which we may sell, from time to time, up to $188.6 million of additional shares of our class A common stock as of September 30, 2017. Refer to Note 11 to our consolidated financial statements for additional details.
Our existing loan portfolio also provides us with liquidity as loans are repaid or sold, in whole or in part, and the proceeds from such repayments become available for us to reinvest.
Liquidity Needs
In addition to our ongoing loan origination activity, our primary liquidity needs include interest and principal payments under our $6.1 billion of outstanding borrowings under secured debt agreements, our Convertible Notes, our unfunded loan commitments, dividend distributions to our stockholders, and operating expenses.
Contractual Obligations and Commitments
Our contractual obligations and commitments as of September 30, 2017 were as follows ($ in thousands):
| | | | | | | | | | | | | | | | | | | | |
| | | | | | Payment Timing | |
| | | Total | | | Less Than | | | 1 to 3 | | | 3 to 5 | | | More Than | |
| | | Obligation | | | 1 Year | | | Years | | | Years | | | 5 Years | |
Unfunded loan commitments(1) | | $ | 1,622,216 | | | $ | 224,032 | | | $ | 1,294,133 | | | $ | 104,051 | | | $ | — | |
Principal payments under secured debt agreements(2) | | | 6,096,597 | | | | 2,221,319 | | | | 3,629,304 | | | | 245,974 | | | | — | |
Principal payments on convertible notes | | | 575,000 | | | | — | | | | 172,500 | | | | 402,500 | | | | — | |
Interest payments(2)(3) | | | 400,423 | | | | 204,915 | | | | 164,633 | | | | 30,875 | | | | — | |
| | | | | | | | | | | | | | | | | | | | |
Total(4) | | $ | 8,694,236 | | | $ | 2,650,266 | | | $ | 5,260,570 | | | $ | 783,400 | | | $ | — | |
| | | | | | | | | | | | | | | | | | | | |
| | |
(1)
| | The allocation of our unfunded loan commitments is based on the earlier of the commitment expiration date or the loan maturity date.
|
(2)
| | The allocation of our secured debt agreements for both principal and interest payments is based on the current maturity date of each individual borrowing under the respective agreement.
|
(3)
| | Represents interest payments on our secured debt agreements and convertible notes. Future interest payment obligations are estimated assuming the amounts outstanding and the interest rates in effect as of September 30, 2017 will remain constant into the future. This is only an estimate as actual amounts borrowed and rates will vary over time.
|
(4)
| | Total does not include $33.2 million of loan participations sold, $987.6 million of non-consolidated senior interests, and $474.6 million of consolidated securitized debt obligations, as the satisfaction of these liabilities will not require cash outlays from us.
|
We are also required to settle our foreign currency forward contracts and interest rate swaps with our derivative counterparties upon maturity which, depending on foreign exchange and interest rate movements, may result in cash received from or due to the respective counterparty. The table above does not include these amounts as they are not fixed and determinable. Refer to Note 10 to our consolidated financial statement for details regarding our derivative contracts.
We are required to pay our Manager a base management fee, an incentive fee, and reimbursements for certain expenses pursuant to our Management Agreement. The table above does not include the amounts payable to our Manager under our Management Agreement as they are not fixed and determinable. Refer to Note 12 to our consolidated financial statements for additional terms and details of the fees payable under our Management Agreement.
As a REIT, we generally must distribute substantially all of our net taxable income to stockholders in the form of dividends to comply with the REIT provisions of the Internal Revenue Code of 1986, as amended, or the Internal Revenue Code. Our taxable income does not necessarily equal our net income as calculated in accordance with GAAP, or our Core Earnings as described above.
Cash Flows
The following table provides a breakdown of the net change in our cash, cash equivalents, and restricted cash ($ in thousands):
| | | | | | | | |
| | | Nine Months Ended September 30, | |
| | | 2017 | | | 2016 | |
Cash flows provided by operating activities | | $ | 176,539 | | | $ | 187,564 | |
Cash flows (used in) provided by investing activities | | | (319,687 | ) | | | 789,573 | |
Cash flows provided by (used in) financing activities | | | 157,100 | | | | (989,730 | ) |
| | | | | | | | |
Net increase (decrease) in cash, cash equivalents, and restricted cash | | $ | 13,952 | | | $ | (12,593 | ) |
| | | | | | | | |
We experienced a net increase in cash, cash equivalents, and restricted cash of $14.0 million for the nine months ended September 30, 2017, compared to a net decrease of $12.6 million for the nine months ended September 30, 2016. During the nine months ended September 30, 2017, we (i) collected $2.0 billion of proceeds from loan principal repayments, (ii) received $394.1 million of net proceeds from the issuance of a convertible note offering, and (iii) borrowed a net $294.8 million under our secured debt agreements. We used the proceeds from our debt and equity financing activities to fund $2.3 billion of new loans during the nine months ended September 30, 2017.
Refer to Note 3 to our consolidated financial statements for further discussion of our loan activity. Refer to Notes 6 and 7 to our consolidated financial statements for additional discussion of our secured debt agreements and participations sold.
V. Other Items
Income Taxes
We elected to be taxed as a REIT, effective January 1, 2003, under the Internal Revenue Code for U.S. federal income tax purposes. We generally must distribute annually at least 90% of our net taxable income, subject to certain adjustments and excluding any net capital gain, in order for U.S. federal income tax not to apply to our earnings that we distribute. To the extent that we satisfy this distribution requirement, but distribute less than 100% of our net taxable income, we will be subject to U.S. federal income tax on our undistributed taxable income. In addition, we will be subject to a 4% nondeductible excise tax if the actual amount that we pay out to our stockholders in a calendar year is less than a minimum amount specified under U.S. federal tax laws.
Our qualification as a REIT also depends on our ability to meet various other requirements imposed by the Internal Revenue Code, which relate to organizational structure, diversity of stock ownership, and certain restrictions with regard to the nature of our assets and the sources of our income. Even if we qualify as a REIT, we may be subject to certain U.S. federal income and excise taxes and state and local taxes on our income and assets. If we fail to maintain our qualification as a REIT for any taxable year, we may be subject to material penalties as well as federal, state and local income tax on our taxable income at regular corporate rates and we would not be able to qualify as a REIT for the subsequent four full taxable years. As of September 30, 2017 and December 31, 2016, we were in compliance with all REIT requirements.
Refer to Note 13 to our consolidated financial statements for additional discussion of our income taxes.
Off-Balance Sheet Arrangements
We have no off-balance sheet arrangements.
Critical Accounting Policies
Our discussion and analysis of our financial condition and results of operations is based upon our consolidated financial statements, which have been prepared in accordance with GAAP. The preparation of these financial statements requires our Manager to make estimates and assumptions that affect the reported amounts of assets, liabilities, revenue and expenses, and related disclosure of contingent assets and liabilities. Actual results could differ from these estimates. There have been no material changes to our Critical Accounting Policies described in our annual report on Form 10-K filed with the SEC on February
14, 2017.11, 2020, other than a supplement to the accounting policy for our current expected credit loss reserve. Refer to Note 2 to our consolidated financial statements for thefurther description of the accounting policy for our current expected credit loss reserve and our other significant accounting policies.
VI. Loan Portfolio Details
The following table provides details of our loan portfolio, on a
loan-by-loan basis, as of
SeptemberJune 30,
20172020 ($ in millions):
| | | | | | | | | | | | | | | | | | | | | | | | | | | | | | | | | | | | | | |
| | | Loan Type(1) | | Origination
Date(2) | | Total
Loan(3) | | | Principal
Balance(3) | | | Net Book
Value | | | Cash
Coupon(4) | | | All-in
Yield(4) | | | Maximum
Maturity(5) | | Location | | Property
Type | | Loan Per SQFT / Unit / Key | | LTV(2) | | | Risk
Rating |
1 | | Senior loan | | 5/11/2017 | | $ | 752.6 | | | | $644.8 | | | $ | 641.3 | | | | L + 3.40 % | | | | L + 3.60 % | | | 6/10/2023 | | Virginia | | Office | | 316 / sqft | | | 62% | | | 3 |
2 | | Senior loan(3) | | 5/15/2015 | | | 590.0 | | | | 531.4 | | | | 89.9 | | | | L + 4.25 % | | | | L + 4.74 % | | | 5/15/2020 | | Miami | | Retail | | 674 / sqft | | | 36% | | | 3 |
3 | | Senior loan(3) | | 8/6/2015 | | | 494.8 | | | | 494.8 | | | | 89.7 | | | | 4.49% | | | | 5.82% | | | 10/29/2022 | | Diversified - EUR | | Other | | n/a | | | 71% | | | 3 |
4 | | Senior loan | | 5/1/2015 | | | 320.3 | | | | 294.5 | | | | 293.9 | | | | L + 3.45 % | | | | L + 3.83 % | | | 5/1/2020 | | New York | | Office | | 375 / sqft | | | 68% | | | 3 |
5 | | Senior loan | | 1/7/2015 | | | 315.0 | | | | 293.8 | | | | 293.0 | | | | L + 3.50 % | | | | L + 3.71 % | | | 1/9/2021 | | New York | | Office | | 252 / sqft | | | 53% | | | 2 |
6 | | Senior loan | | 6/4/2015 | | | 274.4 | | | | 274.4 | | | | 277.6 | | | | L + 4.34 % | | | | L + 4.20 % | | | 9/2/2020 | | Diversified - CAN | | Hotel | | 42,371 / key | | | 54% | | | 2 |
7 | | Senior loan | | 3/31/2017 | | | 258.4 | | | | 241.5 | | | | 239.3 | | | | L + 4.15 % | | | | L + 4.54 % | | | 4/9/2022 | | Maui | | Hotel | | 318,182 / key | | | 75% | | | 3 |
8 | | Senior loan | | 6/23/2015 | | | 222.7 | | | | 215.1 | | | | 214.7 | | | | L + 3.65 % | | | | L + 3.97 % | | | 5/8/2022 | | Washington DC | | Office | | 241 / sqft | | | 72% | | | 2 |
9 | | Senior loan | | 7/31/2014 | | | 215.0 | | | | 213.3 | | | | 213.1 | | | | L + 3.40 % | | | | L + 3.52 % | | | 8/9/2019 | | Chicago | | Office | | 281 / sqft | | | 64% | | | 1 |
10 | | Senior loan | | 8/3/2016 | | | 275.9 | | | | 194.1 | | | | 192.3 | | | | L + 4.66 % | | | | L + 5.21 % | | | 8/9/2021 | | New York | | Office | | 267 / sqft | | | 57% | | | 3 |
11 | | Senior loan | | 8/19/2016 | | | 200.0 | | | | 189.8 | | | | 189.5 | | | | L + 3.64 % | | | | L + 4.10 % | | | 9/9/2021 | | New York | | Office | | 579 / sqft | | | 69% | | | 3 |
12 | | Senior loan | | 4/15/2016 | | | 200.0 | | | | 188.8 | | | | 188.1 | | | | L + 4.25 % | | | | L + 4.86 % | | | 5/9/2021 | | New York | | Office | | 176 / sqft | | | 40% | | | 3 |
13 | | Senior loan | | 2/25/2014 | | | 181.0 | | | | 181.0 | | | | 180.8 | | | | L + 4.75 % | | | | L + 5.07 % | | | 3/9/2019 | | Diversified - US | | Hotel | | 95,113 / key | | | 58% | | | 2 |
14 | | Senior loan(3) | | 6/30/2015 | | | 180.1 | | | | 177.1 | | | | 34.9 | | | | L + 4.75 % | | | | L + 5.16 % | | | 8/15/2022 | | San Francisco | | Condo | | 827 / sqft | | | 60% | | | 3 |
15 | | Senior loan | | 12/22/2016 | | | 204.5 | | | | 171.9 | | | | 170.5 | | | | L + 3.50 % | | | | L + 4.07 % | | | 1/9/2022 | | New York | | Office | | 242 / sqft | | | 66% | | | 3 |
16 | | Senior loan | | 8/17/2016 | | | 186.7 | | | | 169.1 | | | | 168.0 | | | | L + 3.75 % | | | | L + 4.13 % | | | 9/9/2021 | | San Francisco | | Office | | 492 / sqft | | | 65% | | | 3 |
17 | | Senior loan | | 8/31/2017 | | | 183.0 | | | | 165.4 | | | | 163.6 | | | | L + 3.00 % | | | | L + 3.40 % | | | 9/9/2022 | | Orange County | | Office | | 196 / sqft | | | 64% | | | 3 |
18 | | Senior loan | | 5/16/2017 | | | 189.2 | | | | 163.8 | | | | 162.0 | | | | L + 3.90 % | | | | L + 4.29 % | | | 5/16/2021 | | Chicago | | Office | | 123 / sqft | | | 59% | | | 3 |
19 | | Senior loan | | 3/8/2016 | | | 181.2 | | | | 161.7 | | | | 160.6 | | | | L + 3.55 % | | | | L + 3.85 % | | | 3/9/2021 | | Orange County | | Office | | 203 / sqft | | | 52% | | | 3 |
20 | | Senior loan | | 6/3/2016 | | | 160.0 | | | | 160.0 | | | | 160.0 | | | | L + 4.42 % | | | | L + 4.42 % | | | 6/9/2021 | | Los Angeles | | Office | | 86 / sqft | | | 41% | | | 2 |
21 | | Senior loan | | 2/17/2017 | | | 150.0 | | | | 150.0 | | | | 148.8 | | | | L + 4.65 % | | | | L + 5.04 % | | | 3/9/2022 | | Honolulu | | Hotel | | 240,770 / key | | | 65% | | | 3 |
22 | | Senior loan | | 10/30/2013 | | | 140.0 | | | | 140.0 | | | | 139.8 | | | | L + 4.38 % | | | | L + 4.54 % | | | 9/9/2020 | | San Francisco | | Hotel | | 215,716 / key | | | 66% | | | 2 |
23 | | Senior loan | | 10/5/2016 | | | 145.5 | | | | 139.4 | | | | 138.5 | | | | L + 4.35 % | | | | L + 4.84 % | | | 10/9/2021 | | Diversified - US | | Hotel | | 52,558 / key | | | 61% | | | 2 |
24 | | Senior loan | | 8/23/2017 | | | 165.0 | | | | 135.8 | | | | 134.1 | | | | L + 3.25 % | | | | L + 3.64 % | | | 10/9/2022 | | Los Angeles | | Office | | 276 / sqft | | | 74% | | | 3 |
25 | | Senior loan | | 10/26/2016 | | | 133.5 | | | | 133.5 | | | | 132.5 | | | | L + 4.20 % | | | | L + 4.57 % | | | 11/9/2021 | | Oakland | | Office | | 137 / sqft | | | 72% | | | 2 |
26 | | Senior loan | | 1/30/2014 | | | 133.4 | | | | 133.4 | | | | 133.1 | | | | L + 4.30 % | | | | L + 5.32 % | | | 12/1/2017 | | New York | | Hotel | | 212,341 / key | | | 38% | | | 2 |
27 | | Senior loan | | 2/12/2016 | | | 225.0 | | | | 124.6 | | | | 122.4 | | | | L + 5.75 % | | | | L + 7.08 % | | | 2/11/2021 | | Seattle | | Office | | 165 / sqft | | | 48% | | | 3 |
28 | | Senior loan | | 6/29/2017 | | | 141.1 | | | | 121.0 | | | | 119.7 | | | | L + 3.35 % | | | | L + 3.77 % | | | 7/9/2022 | | Torrance | | Multi | | 239,139 / unit | | | 68% | | | 3 |
29 | | Senior loan | | 12/9/2014 | | | 141.5 | | | | 120.4 | | | | 120.4 | | | | L + 3.80 % | | | | L + 3.80 % | | | 12/9/2019 | | Diversified - US | | Office | | 79 / sqft | | | 65% | | | 2 |
30 | | Senior loan | | 10/17/2016 | | | 111.2 | | | | 111.2 | | | | 110.4 | | | | L + 3.95 % | | | | L + 4.31 % | | | 10/21/2021 | | Diversified - UK | | Other | | 158 / sqft | | | 73% | | | 3 |
continued…
| | | | | | | | | | | | | | | | | | | | | | | | | | | | | | | | | | | | | | |
| | | | | | | | | | | | | | | | | | | | | | | | | | | | Loan Per
SQFT / Unit / Key | | | | | |
| | | | | | | | | | | | | | | | | | | | | | | | | | | | | | | | | | | | | | |
| | | | | | | | | | | | | | | | | | | | | | | | | | | | | | | | | | | | | | |
| | | | | | | | | | | | | | | | | | | | | | | | | | | | | | | | | | | | | | |
| | | | | | | | | | | | | | | | | | | | | | | | | | | | | | | | | | | | | | |
| | | | | | | | | | | | | | | | | | | | | | | | | | | | | | | | | | | | | | |
| | | | | | | | | | | | | | | | | | | | | | | | | | | | | | | | | | | | | | |
| | | | | | | | | | | | | | | | | | | | | | | | | | | | | | | | | | | | | | |
| | | | | | | | | | | | | | | | | | | | | | | | | | | | | | | | | | | | | | |
| | | | | | | | | | | | | | | | | | | | | | | | | | | | | | | | | | | | | | |
| | | | | | | | | | | | | | | | | | | | | | | | | | | | | | | | | | | | | | |
| | | | | | | | | | | | | | | | | | | | | | | | | | | | | | | | | | | | | | |
| | | | | | | | | | | | | | | | | | | | | | | | | | | | | | | | | | | | | | |
| | | | | | | | | | | | | | | | | | | | | | | | | | | | | | | | | | | | | | |
| | | | | | | | | | | | | | | | | | | | | | | | | | | | | | | | | | | | | | |
| | | | | | | | | | | | | | | | | | | | | | | | | | | | | | | | | | | | | | |
| | | | | | | | | | | | | | | | | | | | | | | | | | | | | | | | | | | | | | |
| | | | | | | | | | | | | | | | | | | | | | | | | | | | | | | | | | | | | | |
| | | | | | | | | | | | | | | | | | | | | | | | | | | | | | | | | | | | | | |
| | | | | | | | | | | | | | | | | | | | | | | | | | | | | | | | | | | | | | |
| | | | | | | | | | | | | | | | | | | | | | | | | | | | | | | | | | | | | | |
| | | | | | | | | | | | | | | | | | | | | | | | | | | | | | | | | | | | | | |
| | | | | | | | | | | | | | | | | | | | | | | | | | | | | | | | | | | | | | |
| | | | | | | | | | | | | | | | | | | | | | | | | | | | | | | | | | | | | | |
| | | | | | | | | | | | | | | | | | | | | | | | | | | | | | | | | | | | | | |
| | | | | | | | | | | | | | | | | | | | | | | | | | | | | | | | | | | | | | |
| | | | | | | | | | | | | | | | | | | | | | | | | | | | | | | | | | | | | | |
| | | | | | | | | | | | | | | | | | | | | | | | | | | | | | | | | | | | | | |
| | | | | | | | | | | | | | | | | | | | | | | | | | | | | | | | | | | | | | |
| | | | | | | | | | | | | | | | | | | | | | | | | | | | | | | | | | | | | | |
| | | | | | | | | | | | | | | | | | | | | | | | | | | | | | | | | | | | | | |
| | | | | | | | | | | | | | | | | | | | | | | | | | | | | | | | | | | | | | |
| | | Loan Type(1) | | Origination
Date(2) | | Total
Loan(3) | | | Principal
Balance(3) | | | Net Book
Value | | | Cash
Coupon(4) | | | All-in
Yield(4) | | | Maximum
Maturity(5) | | Location | | Property
Type | | Loan Per SQFT / Unit / Key | | LTV(2) | | | Risk
Rating |
31 | | Senior loan | | 2/20/2014 | | | 110.0 | | | | 110.0 | | | | 109.7 | | | | L + 3.95 % | | | | L + 4.16 % | | | 3/9/2021 | | Long Island | | Office | | 162 / sqft | | | 74% | | | 2 |
32 | | Senior loan | | 2/18/2016 | | | 107.2 | | | | 107.2 | | | | 106.9 | | | | L + 3.75 % | | | | L + 4.41 % | | | 4/20/2019 | | London - UK | | Office | | 913 / sqft | | | 44% | | | 3 |
33 | | Senior loan | | 6/24/2015 | | | 107.3 | | | | 103.7 | | | | 103.4 | | | | L + 4.25 % | | | | L + 4.62 % | | | 7/9/2020 | | Honolulu | | Hotel | | 173,921 / key | | | 67% | | | 2 |
34 | | Senior loan | | 7/28/2016 | | | 119.0 | | | | 103.4 | | | | 102.7 | | | | L + 3.60 % | | | | L + 4.00 % | | | 8/9/2021 | | Atlanta | | Office | | 164 / sqft | | | 70% | | | 3 |
35 | | Senior loan | | 3/12/2015 | | | 101.2 | | | | 101.1 | | | | 101.0 | | | | L + 3.25 % | | | | L + 3.61 % | | | 3/11/2020 | | Orange County | | Office | | 268 / sqft | | | 66% | | | 1 |
36 | | Senior loan | | 4/27/2016 | | | 100.8 | | | | 100.8 | | | | 100.7 | | | | L + 4.35 % | | | | L + 5.02 % | | | 5/9/2021 | | Chicago | | Office | | 134 / sqft | | | 74% | | | 2 |
37 | | Senior loan | | 1/22/2016 | | | 128.5 | | | | 97.8 | | | | 97.2 | | | | L + 4.25 % | | | | L + 4.76 % | | | 2/9/2021 | | Los Angeles | | Retail | | 254 / sqft | | | 64% | | | 3 |
38 | | Senior loan | | 6/23/2015 | | | 93.8 | | | | 93.8 | | | | 95.9 | | | | L + 4.30 % | | | | L + 4.83 % | | | 1/27/2018 | | Diversified - US | | Other | | 231,631 / unit | | | 57% | | | 3 |
39 | | Senior loan | | 1/26/2017 | | | 288.0 | | | | 93.7 | | | | 91.5 | | | | L + 5.50 % | | | | L + 5.96 % | | | 2/9/2022 | | Boston | | Office | | 252 / sqft | | | 42% | | | 2 |
40 | | Senior loan | | 3/10/2016 | | | 98.5 | | | | 90.7 | | | | 90.2 | | | | L + 4.10 % | | | | L + 4.52 % | | | 4/9/2021 | | Chicago | | Multi | | 625,799 / unit | | | 63% | | | 3 |
41 | | Senior loan | | 5/16/2014 | | | 100.0 | | | | 90.6 | | | | 90.1 | | | | L + 3.85 % | | | | L + 4.21 % | | | 4/9/2022 | | Miami | | Office | | 208 / sqft | | | 67% | | | 3 |
42 | | Senior loan | | 5/22/2014 | | | 98.7 | | | | 85.8 | | | | 85.6 | | | | L + 3.75 % | | | | L + 4.07 % | | | 6/15/2021 | | Orange County | | Office | | 150 / sqft | | | 67% | | | 2 |
43 | | Senior loan | | 2/18/2015 | | | 89.9 | | | | 85.6 | | | | 85.6 | | | | L + 3.75 % | | | | L + 3.75 % | | | 3/9/2020 | | Diversified - CA | | Office | | 177 / sqft | | | 71% | | | 2 |
44 | | Senior loan | | 7/23/2014 | | | 90.0 | | | | 85.0 | | | | 84.7 | | | | L + 3.85 % | | | | L + 4.07 % | | | 7/9/2020 | | Atlanta | | Office | | 170 / sqft | | | 43% | | | 2 |
45 | | Senior loan | | 1/31/2017 | | | 134.8 | | | | 84.8 | | | | 83.7 | | | | L + 5.00 % | | | | L + 5.49 % | | | 2/9/2022 | | Boston | | Other | | 460 / sqft | | | 60% | | | 3 |
46 | | Senior loan | | 7/11/2014 | | | 87.2 | | | | 82.2 | | | | 81.7 | | | | L + 3.55 % | | | | L + 3.83 % | | | 8/9/2020 | | Chicago | | Office | | 160 / sqft | | | 65% | | | 2 |
47 | | Senior loan | | 10/28/2014 | | | 85.0 | | | | 82.1 | | | | 82.0 | | | | L + 3.75 % | | | | L + 4.12 % | | | 11/9/2019 | | New York | | Retail | | 1,534 / sqft | | | 78% | | | 2 |
48 | | Senior loan | | 6/23/2015 | | | 80.9 | | | | 80.9 | | | | 81.3 | | | | L + 3.65 % | | | | L + 3.82 % | | | 11/30/2018 | | Diversified - US | | Hotel | | 68,474 / key | | | 83% | | | 2 |
49 | | Senior loan | | 5/1/2015 | | | 83.5 | | | | 79.7 | | | | 79.5 | | | | L + 3.95 % | | | | L + 4.31 % | | | 5/9/2020 | | Maryland | | Hotel | | 204,238 / key | | | 67% | | | 2 |
50 | | Senior loan | | 2/12/2016 | | | 100.0 | | | | 79.5 | | | | 79.4 | | | | L + 4.15 % | | | | L + 4.68 % | | | 3/9/2021 | | Long Island | | Office | | 119 / sqft | | | 65% | | | 3 |
51 | | Senior loan | | 6/23/2015 | | | 75.4 | | | | 75.2 | | | | 75.3 | | | | 5.19 % | (6) | | | 5.50 % | (6) | | 8/31/2020 | | Diversified - FL | | MHC | | 20,512 / unit | | | 69% | | | 1 |
52 | | Senior loan | | 6/4/2015 | | | 77.6 | | | | 74.2 | | | | 74.8 | | | | 5.13 % | (6) | | | 5.43 % | (6) | | 3/28/2019 | | Diversified - CAN | | Retail | | 43 / sqft | | | 74% | | | 3 |
53 | | Senior loan | | 8/18/2017 | | | 82.3 | | | | 73.2 | | | | 72.5 | | | | L + 4.10 % | | | | L + 4.46 % | | | 8/18/2022 | | Brussels | | Office | | 103 / sqft | | | 59% | | | 3 |
54 | | Senior loan | | 3/31/2017 | | | 91.2 | | | | 68.3 | | | | 67.5 | | | | L + 4.30 % | | | | L + 4.87 % | | | 4/9/2022 | | New York | | Office | | 335 / sqft | | | 64% | | | 3 |
55 | | Senior loan | | 2/27/2015 | | | 102.2 | | | | 67.7 | | | | 67.0 | | | | L + 3.55 % | | | | L + 3.92 % | | | 4/28/2022 | | Chicago | | Office | | 140 / sqft | | | 65% | | | 2 |
56 | | Senior loan | | 9/1/2017 | | | 76.0 | | | | 65.0 | | | | 64.3 | | | | L + 4.15 % | | | | L + 4.58 % | | | 9/9/2021 | | New York | | Condo | | 685 / sqft | | | 64% | | | 3 |
57 | | Senior loan | | 10/6/2014 | | | 67.0 | | | | 64.4 | | | | 64.2 | | | | L + 4.35 % | | | | L + 4.61 % | | | 10/9/2019 | | Long Island | | Hotel | | 104,698 / key | | | 56% | | | 3 |
58 | | Senior loan | | 11/30/2016 | | | 79.0 | | | | 63.9 | | | | 63.3 | | | | L + 3.95 % | | | | L + 4.39 % | | | 12/9/2021 | | Chicago | | Retail | | 1,263 / sqft | | | 54% | | | 3 |
59 | | Senior loan | | 6/29/2016 | | | 75.4 | | | | 63.7 | | | | 63.2 | | | | L + 3.65 % | | | | L + 4.08 % | | | 7/9/2021 | | Fort Lauderdale | | Office | | 246 / sqft | | | 64% | | | 3 |
60 | | Senior loan | | 5/11/2017 | | | 135.9 | | | | 62.7 | | | | 61.5 | | | | L + 3.40 % | | | | L + 3.91 % | | | 6/10/2023 | | Virginia | | Office | | 146 / sqft | | | 38% | | | 2 |
continued…
| | | | | | | | | | | | | | | | | | | | | | | | | | | | | | | | | | | | | | |
| | | Loan Type(1) | | Origination
Date(2) | | Total
Loan(3) | | | Principal
Balance(3) | | | Net Book
Value | | | Cash
Coupon(4) | | | All-in
Yield(4) | | | Maximum
Maturity(5) | | Location | | Property
Type | | Loan Per SQFT / Unit / Key | | LTV(2) | | | Risk
Rating |
61 | | Senior loan | | 3/11/2014 | | | 65.0 | | | | 62.1 | | | | 62.1 | | | | L + 4.50 % | | | | L + 4.77 % | | | 4/9/2019 | | New York | | Multi | | 698,177 / unit | | | 65% | | | 3 |
62 | | Senior loan | | 7/13/2017 | | | 86.3 | | | | 60.0 | | | | 59.2 | | | | L + 3.75 % | | | | L + 4.18 % | | | 8/9/2022 | | Honolulu | | Hotel | | 192,926 / key | | | 66% | | | 3 |
63 | | Senior loan | | 1/13/2014 | | | 60.0 | | | | 60.0 | | | | 59.5 | | | | L + 3.45 % | | | | L + 4.89 % | | | 6/9/2020 | | New York | | Office | | 284 / sqft | | | 53% | | | 2 |
64 | | Senior loan | | 5/9/2017 | | | 73.7 | | | | 59.3 | | | | 58.7 | | | | L + 3.85 % | | | | L + 4.30 % | | | 5/9/2022 | | New York | | Multi | | 357,510 / unit | | | 67% | | | 3 |
65 | | Senior loan | | 6/29/2017 | | | 64.2 | | | | 57.5 | | | | 56.9 | | | | L + 3.40 % | | | | L + 3.71 % | | | 7/9/2023 | | New York | | Multi | | 167,638 / unit | | | 69% | | | 3 |
66 | | Senior loan | | 6/4/2015 | | | 57.0 | | | | 57.0 | | | | 56.8 | | | | L + 3.25 % | | | | L + 4.09 % | | | 1/6/2018 | | Norwich - UK | | Retail | | 156 / sqft | | | 55% | | | 2 |
67 | | Senior loan | | 11/28/2013 | | | 63.0 | | | | 56.2 | | | | 56.2 | | | | L + 4.38 % | | | | L + 5.30 % | | | 1/20/2019 | | London - UK | | Office | | 689 / sqft | | | 58% | | | 3 |
68 | | Senior loan | | 7/21/2017 | | | 55.4 | | | | 55.4 | | | | 55.4 | | | | L + 3.95 % | | | | L + 4.15 % | | | 4/1/2019 | | Broomfield | | Multi | | 153,889 / unit | | | 49% | | | 2 |
69 | | Senior loan | | 9/9/2014 | | | 56.0 | | | | 52.5 | | | | 52.4 | | | | L + 4.00 % | | | | L + 4.25 % | | | 9/9/2019 | | Ft. Lauderdale | | Office | | 150 / sqft | | | 71% | | | 2 |
70 | | Senior loan | | 5/20/2015 | | | 52.4 | | | | 52.4 | | | | 52.7 | | | | L + 3.50 % | | | | L + 3.75 % | | | 12/31/2018 | | Chicago | | Office | | 133 / sqft | | | 67% | | | 3 |
71 | | Senior loan | | 11/23/2016 | | | 55.4 | | | | 50.0 | | | | 49.6 | | | | L + 3.50 % | | | | L + 3.80 % | | | 12/9/2022 | | New York | | Multi | | 208,333 / unit | | | 65% | | | 3 |
72 | | Senior loan | | 5/20/2015 | | | 58.0 | | | | 49.5 | | | | 49.5 | | | | 5.25 % | (6) | | | 5.52 % | (6) | | 6/30/2019 | | Charlotte | | Office | | 98 / sqft | | | 71% | | | 3 |
73 | | Senior loan | | 12/27/2016 | | | 57.2 | | | | 49.5 | | | | 49.0 | | | | L + 4.65 % | | | | L + 5.08 % | | | 1/9/2022 | | New York | | Multi | | 1,260,476 / unit | | | 64% | | | 3 |
74 | | Senior loan | | 9/1/2016 | | | 47.6 | | | | 47.6 | | | | 47.5 | | | | L + 4.35 % | | | | L + 4.97 % | | | 9/1/2021 | | Atlanta | | Multi | | 240,517 / unit | | | 72% | | | 3 |
75 | | Senior loan | | 9/22/2016 | | | 46.0 | | | | 45.5 | | | | 45.3 | | | | L + 4.25 % | | | | L + 4.90 % | | | 10/9/2019 | | New York | | Office | | 456 / sqft | | | 51% | | | 3 |
76 | | Senior loan | | 11/19/2015 | | | 50.0 | | | | 45.3 | | | | 45.3 | | | | L + 4.00 % | | | | L + 4.32 % | | | 10/9/2018 | | New York | | Office | | 1,163 / sqft | | | 57% | | | 3 |
77 | | Senior loan | | 2/9/2017 | | | 46.6 | | | | 44.4 | | | | 44.0 | | | | L + 4.50 % | | | | L + 4.98 % | | | 2/9/2022 | | London | | Office | | 726 / sqft | | | 69% | | | 3 |
78 | | Senior loan | | 8/29/2017 | | | 51.2 | | | | 43.5 | | | | 43.0 | | | | L + 3.10 % | | | | L + 3.52 % | | | 10/9/2022 | | Southern California | | Industrial | | 91 / sqft | | | 65% | | | 3 |
79 | | Senior loan | | 3/26/2014 | | | 42.9 | | | | 42.9 | | | | 42.8 | | | | L + 4.30 % | | | | L + 4.56 % | | | 4/9/2019 | | East Bay | | Office | | 123 / sqft | | | 71% | | | 2 |
80 | | Senior loan | | 6/11/2015 | | | 39.5 | | | | 39.5 | | | | 39.7 | | | | 5.18 % | (6) | | | 5.41 % | (6) | | 9/30/2020 | | Diversified - US | | MHC | | 22,584 / unit | | | 79% | | | 2 |
81 | | Senior loan | | 6/26/2015 | | | 42.1 | | | | 38.8 | | | | 38.8 | | | | L + 3.75 % | | | | L + 3.76 % | | | 7/9/2020 | | San Diego | | Office | | 177 / sqft | | | 73% | | | 2 |
82 | | Senior loan | | 11/17/2014 | | | 38.5 | | | | 38.5 | | | | 38.4 | | | | L + 5.50 % | | | | L + 6.17 % | | | 12/9/2019 | | Diversified - CAN | | Office | | 61 / sqft | | | 53% | | | 2 |
83 | | Senior loan | | 5/20/2015 | | | 37.9 | | | | 37.9 | | | | 38.0 | | | | 4.66 % | (6) | | | 5.19 % | (6) | | 1/31/2019 | | Los Angeles | | Office | | 176 / sqft | | | 59% | | | 2 |
84 | | Senior loan | | 8/25/2015 | | | 43.8 | | | | 37.4 | | | | 37.3 | | | | L + 4.50 % | | | | L + 4.76 % | | | 9/9/2018 | | Los Angeles | | Office | | 166 / sqft | | | 46% | | | 3 |
85 | | Senior loan | | 6/12/2014 | | | 34.8 | | | | 34.8 | | | | 34.7 | | | | L + 4.00 % | | | | L + 4.36 % | | | 6/30/2018 | | Los Angeles | | Office | | 39 / sqft | | | 44% | | | 2 |
86 | | Senior loan | | 10/22/2015 | | | 34.8 | | | | 34.8 | | | | 34.8 | | | | L + 4.50 % | | | | L + 5.03 % | | | 10/22/2018 | | London - UK | | Office | | 2,614 / sqft | | | 64% | | | 3 |
87 | | Senior loan | | 6/11/2015 | | | 34.0 | | | | 34.0 | | | | 34.1 | | | | 5.34% | | | | 5.58% | | | 5/31/2020 | | Diversified - US | | MHC | | 20,801 / unit | | | 65% | | | 2 |
88 | | Senior loan | | 7/14/2017 | | | 32.8 | | | | 32.8 | | | | 32.8 | | | | L + 4.35 % | | | | L + 4.58 % | | | 8/1/2018 | | Davis | | Multi | | 215,461 / unit | | | 59% | | | 2 |
89 | | Senior loan | | 5/20/2015 | | | 36.5 | | | | 32.0 | | | | 31.9 | | | | L + 3.60 % | | | | L + 4.07 % | | | 7/11/2019 | | Los Angeles | | Office | | 387 / sqft | | | 46% | | | 1 |
90 | | Senior loan | | 4/17/2015 | | | 31.9 | | | | 31.9 | | | | 31.8 | | | | L + 4.50 % | | | | L + 4.95 % | | | 4/20/2020 | | Hague - NL | | Hotel | | 104,241 / key | | | 71% | | | 2 |
continued…
| | | | | | | | | | | | | | | | | | | | | | | | | | | | | | | | | | | | | | |
| | | Loan Type(1) | | Origination
Date(2) | | Total
Loan(3) | | | Principal
Balance(3) | | | Net Book
Value | | | Cash
Coupon(4) | | | All-in
Yield(4) | | | Maximum
Maturity(5) | | Location | | Property
Type | | Loan Per SQFT / Unit / Key | | LTV(2) | | | Risk
Rating |
91 | | Senior loan | | 2/28/2014 | | | 26.0 | | | | 26.0 | | | | 26.0 | | | | L + 4.00 % | | | | L + 4.26 % | | | 3/9/2019 | | Phoenix | | Other | | 123,223 / unit | | | 69% | | | 2 |
92 | | Senior loan | | 6/11/2015 | | | 25.9 | | | | 25.9 | | | | 25.9 | | | | 5.25 % | (6) | | | 5.74 % | (6) | | 11/30/2020 | | West Palm Beach | | MHC | | 53,418 / unit | | | 75% | | | 2 |
93 | | Senior loan | | 6/18/2014 | | | 24.5 | | | | 24.5 | | | | 24.4 | | | | L + 4.00 % | | | | L + 4.43 % | | | 7/20/2019 | | Diversified - NL | | Office | | 64 / sqft | | | 69% | | | 3 |
94 | | Senior loan | | 6/11/2015 | | | 24.4 | | | | 24.4 | | | | 24.4 | | | | 5.37 % | (6) | | | 5.87 % | (6) | | 11/30/2020 | | Ft. Lauderdale | | MHC | | 49,523 / unit | | | 70% | | | 2 |
95 | | Senior loan | | 5/28/2015 | | | 48.7 | | | | 21.7 | | | | 21.7 | | | | L + 4.00 % | | | | L + 4.57 % | | | 6/30/2018 | | Los Angeles | | Office | | 25 / sqft | | | 53% | | | 2 |
96 | | Senior loan | | 6/4/2015 | | | 21.3 | | | | 21.3 | | | | 21.1 | | | | 4.50% | | | | 5.06% | | | 12/23/2021 | | Montreal - CAN | | Office | | 58 / sqft | | | 45% | | | 2 |
97 | | Senior loan | | 5/28/2015 | | | 20.6 | | | | 20.6 | | | | 20.6 | | | | L + 3.95 % | | | | L + 4.97 % | | | 3/31/2019 | | Pittsburgh | | Hotel | | 92,455 / key | | | 71% | | | 4 |
98 | | Senior loan | | 6/4/2015 | | | 18.2 | | | | 18.2 | | | | 18.3 | | | | 4.63% | | | | 5.00% | | | 3/1/2019 | | Ontario - CAN | | Other | | 53,616 / unit | | | 59% | | | 2 |
99 | | Senior loan | | 6/11/2015 | | | 17.9 | | | | 17.9 | | | | 17.8 | | | | 5.04 % | (6) | | | 5.61 % | (6) | | 11/30/2020 | | Ft. Lauderdale | | MHC | | 26,119 / unit | | | 51% | | | 2 |
100 | | Senior loan | | 6/4/2015 | | | 17.2 | | | | 17.2 | | | | 17.3 | | | | 5.20% | | | | 5.55% | | | 9/4/2020 | | Diversified - CAN | | Other | | 3,757 / unit | | | 61% | | | 2 |
101 | | Senior loan | | 5/8/2017 | | | 80.0 | | | | 15.2 | | | | 14.4 | | | | L + 3.75 % | | | | L + 4.86 % | | | 5/8/2022 | | Washington DC | | Office | | 71 / sqft | | | 73% | | | 3 |
102 | | Senior loan | | 6/11/2015 | | | 14.9 | | | | 14.9 | | | | 14.9 | | | | 5.34 % | (6) | | | 5.87 % | (6) | | 9/30/2020 | | Tampa | | MHC | | 39,244 / unit | | | 64% | | | 2 |
103 | | Senior loan | | 6/4/2015 | | | 15.6 | | | | 14.8 | | | | 15.4 | | | | L + 4.50 % | | | | L + 4.69 % | | | 12/1/2017 | | Toronto - CAN | | Office | | 89 / sqft | | | 58% | | | 2 |
104 | | Senior loan | | 7/21/2017 | | | 13.6 | | | | 13.6 | | | | 13.6 | | | | L + 4.50 % | | | | L + 4.74 % | | | 10/1/2018 | | Phoenix | | Multi | | 83,951 / unit | | | 68% | | | 2 |
105 | | Senior loan | | 9/6/2017 | | | 13.3 | | | | 13.3 | | | | 13.2 | | | | L + 4.25 % | | | | L + 5.17 % | | | 4/1/2019 | | Austin | | Multi | | 127,644 / unit | | | 57% | | | 3 |
106 | | Senior loan | | 7/13/2017 | | | 13.1 | | | | 13.1 | | | | 13.1 | | | | L + 4.50 % | | | | L + 4.86 % | | | 2/1/2020 | | Orlando | | Multi | | 60,648 / unit | | | 61% | | | 2 |
107 | | Senior loan | | 5/28/2015 | | | 12.8 | | | | 12.8 | | | | 12.8 | | | | L + 4.75 % | | | | L + 5.01 % | | | 10/15/2017 | | Diversified - US | | Office | | 48 / sqft | | | 86% | | | 2 |
108 | | Senior loan | | 7/21/2017 | | | 10.7 | | | | 10.7 | | | | 10.7 | | | | L + 4.50 % | | | | L + 4.74 % | | | 8/1/2018 | | Phoenix | | Multi | | 72,297 / unit | | | 61% | | | 3 |
109 | | Senior loan | | 7/21/2017 | | | 7.3 | | | | 7.3 | | | | 7.3 | | | | L + 5.00 % | | | | L + 5.30 % | | | 7/1/2019 | | Phoenix | | Multi | | 56,154 / unit | | | 66% | | | 3 |
110 | | Senior loan | | 7/20/2017 | | | 193.2 | | | | 0.0 | | | | (1.9 | ) | | | L + 5.10 % | | | | L + 6.17 % | | | 8/9/2022 | | Oakland | | Office | | 0 / sqft | | | 58% | | | 3 |
111 | | Senior loan | | 9/22/2017 | | | 91.0 | | | | 0.0 | | | | (0.9 | ) | | | L + 5.25 % | | | | L + 5.98 % | | | 10/9/2022 | | Oakland | | Multi | | 0 / unit | | | 47% | | | 3 |
| | | | | | | | | | | | | | | | | | | | | | | | | | | | | | | | | | | | | | |
| | | | | | $ | 12,342.0 | | | | $10,668.7 | | | $ | 9,637.2 | | | | 5.13% | | | | 5.55% | | | 3.4 yrs | | | | | | | | | 61% | | | 2.6 |
| | | | | | | | | | | | | | | | | | | | | | | | | | | | | | | | | | | | | | |
| | | | | | | | | | | | | | | | | | | | | | | | | | | | | | | | | | | | | | |
| | | | | | | | | | | | | | | | | | | | | | | | | | | | Loan Per
SQFT / Unit / Key | | | | | |
| | | | | | | | | | | | | | | | | | | | | | | | | | | | | | | | | | | | | | |
| | | | | | | | | | | | | | | | | | | | | | | | | | | | | | | | | | | | | | |
| | | | | | | | | | | | | | | | | | | | | | | | | | | | | | | | | | | | | | |
| | | | | | | | | | | | | | | | | | | | | | | | | | | | | | | | | | | | | | |
| | | | | | | | | | | | | | | | | | | | | | | | | | | | | | | | | | | | | | |
| | | | | | | | | | | | | | | | | | | | | | | | | | | | | | | | | | | | | | |
| | | | | | | | | | | | | | | | | | | | | | | | | | | | | | | | | | | | | | |
| | | | | | | | | | | | | | | | | | | | | | | | | | | | | | | | | | | | | | |
| | | | | | | | | | | | | | | | | | | | | | | | | | | | | | | | | | | | | | |
| | | | | | | | | | | | | | | | | | | | | | | | | | | | | | | | | | | | | | |
| | | | | | | | | | | | | | | | | | | | | | | | | | | | | | | | | | | | | | |
| | | | | | | | | | | | | | | | | | | | | | | | | | | | | | | | | | | | | | |
| | | | | | | | | | | | | | | | | | | | | | | | | | | | | | | | | | | | | | |
| | | | | | | | | | | | | | | | | | | | | | | | | | | | | | | | | | | | | | |
| | | | | | | | | | | | | | | | | | | | | | | | | | | | | | | | | | | | | | |
| | | | | | | | | | | | | | | | | | | | | | | | | | | | | | | | | | | | | | |
| | | | | | | | | | | | | | | | | | | | | | | | | | | | | | | | | | | | | | |
| | | | | | | | | | | | | | | | | | | | | | | | | | | | | | | | | | | | | | |
| | | | | | | | | | | | | | | | | | | | | | | | | | | | | | | | | | | | | | |
| | | | | | | | | | | | | | | | | | | | | | | | | | | | | | | | | | | | | | |
| | | | | | | | | | | | | | | | | | | | | | | | | | | | | | | | | | | | | | |
| | | | | | | | | | | | | | | | | | | | | | | | | | | | | | | | | | | | | | |
| | | | | | | | | | | | | | | | | | | | | | | | | | | | | | | | | | | | | | |
| | | | | | | | | | | | | | | | | | | | | | | | | | | | | | | | | | | | | | |
| | | | | | | | | | | | | | | | | | | | | | | | | | | | | | | | | | | | | | |
| | | | | | | | | | | | | | | | | | | | | | | | | | | | | | | | | | | | | | |
| | | | | | | | | | | | | | | | | | | | | | | | | | | | | | | | | | | | | | |
| | | | | | | | | | | | | | | | | | | | | | | | | | | | | | | | | | | | | | |
| | | | | | | | | | | | | | | | | | | | | | | | | | | | | | | | | | | | | | |
| | | | | | | | | | | | | | | | | | | | | | | | | | | | | | | | | | | | | | |
| | | | | | | | | | | | | | | | | | | | | | | | | | | | | | | | | | | | | | |
| | | | | | | | | | | | | | | | | | | | | | | | | | | | Loan Per
SQFT / Unit / Key | | | | | |
| | | | | | | | | | | | | | | | | | | | | | | | | | | | | | | | | | | | | | |
| | | | | | | | | | | | | | | | | | | | | | | | | | | | | | | | | | | | | | |
| | | | | | | | | | | | | | | | | | | | | | | | | | | | | | | | | | | | | | |
| | | | | | | | | | | | | | | | | | | | | | | | | | | | | | | | | | | | | | |
| | | | | | | | | | | | | | | | | | | | | | | | | | | | | | | | | | | | | | |
| | | | | | | | | | | | | | | | | | | | | | | | | | | | | | | | | | | | | | |
| | | | | | | | | | | | | | | | | | | | | | | | | | | | | | | | | | | | | | |
| | | | | | | | | | | | | | | | | | | | | | | | | | | | | | | | | | | | | | |
| | | | | | | | | | | | | | | | | | | | | | | | | | | | | | | | | | | | | | |
| | | | | | | | | | | | | | | | | | | | | | | | | | | | | | | | | | | | | | |
| | | | | | | | | | | | | | | | | | | | | | | | | | | | | | | | | | | | | | |
| | | | | | | | | | | | | | | | | | | | | | | | | | | | | | | | | | | | | | |
| (1) | Senior loans include senior mortgages and similar credit quality loans, including related contiguous subordinate loans and pari passu participations in senior mortgage loans. |
| (2) | Date loan was originated or acquired by us, and the LTV as of such date. DatesOrigination dates are notsubsequently updated for subsequentto reflect material loan modifications or upsizes.modifications. |
| (3) | Total loan amount reflects outstanding principal balance as well as any related unfunded loan commitment. |
| (4) | In certain instances, we finance our loans through thenon-recourse sale of a senior loan interest that is not included in our consolidated financial statements. As of SeptemberJune 30, 2017, three2020, five loans in our portfolio have been financed with an aggregate $987.6$739.6 million ofnon-consolidated senior interest, which are included in the table above. Portfolio excludes our $82.0 million subordinate position in the $857.3 million 2018 Single Asset Securitization. Refer to Notes 4 and 15 to our consolidated financial statements for details of the 2018 Single Asset Securitization. |
(4)(5) | The weighted-average cash coupon and all-in yield are expressed as a spread over the relevant floating benchmark rates, which include USD LIBOR, GBP LIBOR, EURIBOR, BBSY, and CDOR, as applicable to each loan. As of SeptemberJune 30, 2017,2020, 97% of our loans by total loan exposure earned a floating rate loans were indexed to various benchmark rates, with 91% of floating rate loans by loan exposureinterest, primarily indexed to USD LIBOR. In addition, $273.9 millionLIBOR, and $13.0 billion of our floating ratesuch loans earned interest based on floors that are above the applicable index, with an average floorindex. The other 3% of 1.24%,our loans earned a fixed rate of interest, which we reflect as a spread over the relevant floating benchmark rates, as of SeptemberJune 30, 2017.2020, for purposes of the weighted-averages. In addition to cash coupon,all-in yield includes the amortization of deferred origination and extension fees, loan origination costs, and purchase discounts, as well as the accrual of exit fees. |
(5)(6) | Maximum maturity assumes all extension options are exercised, however our loans may be repaid prior to such date. |
(6)(7) | Loan consists of one or more floating and fixed rate tranches. Coupon andall-in yield assume applicable floating benchmark rates for weighted-average calculation. |
| QUANTITATIVE AND QUALITATIVE DISCLOSURES ABOUT MARKET RISK |
Investment Portfolio Net Interest Income
Generally, our business model is such that rising interest rates will increase our net income
(loss), while declining interest rates will decrease net
income.income (loss). As of
SeptemberJune 30,
2017, 92%2020, 97% of our
loansinvestments by total
loaninvestment exposure earned a floating rate of interest and were financed with liabilities that pay interest at floating rates, which resulted in an amount of net equity that is positively correlated to rising interest rates, subject to the impact of interest rate floors on certain of our floating rate loans. As of
SeptemberJune 30,
2017,2020, the remaining
8%3% of our
loansinvestments by total
loaninvestment exposure earned a fixed rate of interest, but are financed with liabilities that pay interest at floating rates, which resulted in a negative correlation to rising interest rates to the extent of our financing. In certain instances where we have financed fixed rate assets with floating rate liabilities, we have purchased interest rate swaps or caps to limit our exposure to increases in interest rates on such liabilities.
Certain jurisdictions are currently reforming or phasing out their Interbank Offered Rates, or IBORS, including, without limitation, the London Interbank Offered Rate, Euro Interbank Offered Rate, the Canadian Dollar Offered Rate and the Australian Bank Bill Swap Reference Rate. The timing of the anticipated reforms or phase-outs vary by jurisdiction, with most of the reforms or phase-outs currently scheduled to take effect at the end of calendar year 2021. We are evaluating the operational impact of such changes on existing transactions and contractual arrangements and managing transition efforts. Refer to “Part I. Item 1A. Risk Factors — Risks Related to Our Lending and Investment Activities — The expected discontinuation of currently used financial reference rates and use of alternative replacement reference rates may adversely affect interest expense related to our loans and investments or otherwise adversely affect our results of operations, cash flows and the market value of our investments.” of our Annual Report on Form 10-K for the year ended December 31, 2019.
The following table projects the impact on our interest income and expense,
net of incentive fees, for the twelve-month period following
SeptemberJune 30,
2017,2020, assuming an immediate increase or decrease of both 25 and 50 basis points in the applicable interest rate benchmark by currency ($ in thousands):
| | | | | | | | | | | | | | | | | | | | | | | | |
Currency | | Assets (Liabilities)
Subject to Interest
Rate Sensitivity(1)(2) | | | | | | 25 Basis
Point
Increase | | | 25 Basis
Point
Decrease | | | 50 Basis
Point
Increase | | | 50 Basis
Point
Decrease | |
USD | | $ | 8,923,957 | | | | Interest income | | | $ | 22,299 | | | $ | (21,505 | ) | | $ | 44,608 | | | $ | (41,195 | ) |
| | | (6,503,552 | ) | | | Interest expense | | | | (16,259 | ) | | | 16,227 | | | | (32,518 | ) | | | 31,299 | |
| | | | | | | | | | | | | | | | | | | | | | | | |
| | $ | 2,420,405 | | | | Total | | | $ | 6,040 | | | $ | (5,278 | ) | | $ | 12,090 | | | $ | (9,896 | ) |
| | | | | | | | | | | | | | | | | | | | | | | | |
GBP | | $ | 410,791 | | | | Interest income | | | $ | 1,027 | | | $ | (1,027 | ) | | $ | 2,054 | | | $ | (1,636 | ) |
| | | (231,187 | ) | | | Interest expense | | | | (578 | ) | | | 578 | | | | (1,156 | ) | | | 1,156 | |
| | | | | | | | | | | | | | | | | | | | | | | | |
| | $ | 179,604 | | | | Total | | | $ | 449 | | | $ | (449 | ) | | $ | 898 | | | $ | (480 | ) |
| | | | | | | | | | | | | | | | | | | | | | | | |
EUR | | $ | 129,637 | | | | Interest income | | | $ | — | | | $ | — | | | $ | 222 | | | $ | — | |
| | | (78,192 | ) | | | Interest expense | | | | (195 | ) | | | 195 | | | | (391 | ) | | | 391 | |
| | | | | | | | | | | | | | | | | | | | | | | | |
| | $ | 51,445 | | | | Total | | | $ | (195 | ) | | $ | 195 | | | $ | (169 | ) | | $ | 391 | |
| | | | | | | | | | | | | | | | | | | | | | | | |
CAD(3) | | $ | 328,853 | | | | Interest income | | | $ | 822 | | | $ | (822 | ) | | $ | 1,644 | | | $ | (1,644 | ) |
| | | (287,769 | ) | | | Interest expense | | | | (719 | ) | | | 719 | | | | (1,439 | ) | | | 1,439 | |
| | | | | | | | | | | | | | | | | | | | | | | | |
| | $ | 41,084 | | | | Total | | | $ | 103 | | | $ | (103 | ) | | $ | 205 | | | $ | (205 | ) |
| | | | | | | | | | | | | | | | | | | | | | | | |
| | | | | | | | | | | | | | | | | | | | | | | | |
| | | | | | | | | | | | | | | | | | | | | | | | |
| | | | | | | Total | | | $ | 6,397 | | | $ | (5,635 | ) | | $ | 13,024 | | | $ | (10,190 | ) |
| | | | | | | | | | | | | | | | | | | | | | | | |
| | | | | | | | | | | | | | | | | | | | | | | | |
| | | Assets (Liabilities)
Sensitive to Changes in
| | | | | | Interest Rate Sensitivity as of June 30, 2020 | |
| | | | | | | | | | |
| | | | |
| | |
| | |
| | |
| |
| | $ | 12,520,462 | | | | Income | | | $ | 7,510 | | | $ | 15,440 | | | $ | (4,652 | ) | | $ | (4,652 | ) |
| | | (10,440,646 | ) | | | Expense | | | | (17,202 | ) | | | (34,851 | ) | | | 11,164 | | | | 11,164 | |
| | | | | | | | | | | | | | | | | | | | | | | | |
| | $ | 2,079,816 | | | | Net interest | | | $ | (9,692 | ) | | $ | (19,411 | ) | | $ | 6,512 | | | $ | 6,512 | |
| | | | | | | | | | | | | | | | | | | | | | | | |
| | $ | 3,142,835 | | | | Income | | | $ | — | | | $ | 1,350 | | | $ | — | | | $ | — | |
| | | (2,494,978 | ) | | | Expense | | | | — | | | | (1,068 | ) | | | — | | | | — | |
| | | | | | | | | | | | | | | | | | | | | | | | |
| | $ | 647,857 | | | | Net interest | | | $ | — | | | $ | 282 | | | $ | — | | | $ | — | |
| | | | | | | | | | | | | | | | | | | | | | | | |
| | $ | 1,600,788 | | | | Income | | | $ | 1,853 | | | $ | 4,028 | | | $ | (908 | ) | | $ | (908 | ) |
| | | (1,014,982 | ) | | | Expense | | | | (2,030 | ) | | | (4,060 | ) | | | 1,144 | | | | 1,144 | |
| | | | | | | | | | | | | | | | | | | | | | | | |
| | $ | 585,806 | | | | Net interest | | | $ | (177 | ) | | $ | (32 | ) | | $ | 236 | | | $ | 236 | |
| | | | | | | | | | | | | | | | | | | | | | | | |
| | $ | 233,425 | | | | Income | | | $ | — | | | $ | — | | | $ | — | | | $ | — | |
| | | (169,299 | ) | | | Expense | | | | (339 | ) | | | (677 | ) | | | 202 | | | | 202 | |
| | | | | | | | | | | | | | | | | | | | | | | | |
| | $ | 64,126 | | | | Net interest | | | $ | (339 | ) | | $ | (677 | ) | | $ | 202 | | | $ | 202 | |
| | | | | | | | | | | | | | | | | | | | | | | | |
| | $ | 41,188 | | | | Income | | | $ | 3 | | | $ | 6 | | | $ | (3 | ) | | $ | (6 | ) |
| | | (45,384 | ) | | | Expense | | | | (91 | ) | | | (182 | ) | | | 91 | | | | 182 | |
| | | | | | | | | | | | | | | | | | | | | | | | |
| | $ | (4,196 | ) | | | Net interest | | | $ | (88 | ) | | $ | (176 | ) | | $ | 88 | | | $ | 176 | |
| | | | | | | | | | | | | | | | | | | | | | | | |
| | | | | | | Total net interest | | | $ | (10,296 | ) | | $ | (20,014 | ) | | $ | 7,038 | | | $ | 7,126 | |
| | | | | | | | | | | | | | | | | | | | | | | | |
| (1) | Our floating rate loans and related liabilities are indexed to the various benchmark rates relevant in each case in terms of currency and payment frequency. Therefore the net exposure to each benchmark rate is in direct proportion to our net assets indexed to that rate. Increases (decreases) in interest income and expense are presented net of incentive fees. In addition, $13.0 billion of our loans earned interest based on floors that are above the applicable index as of June 30, 2020. Refer to Note 11 to our consolidated financial statements for additional details of our incentive fee calculation. |
| (2) | Includes borrowingsinvestment exposure to the 2018 Single Asset Securitization. Refer to Notes 4 and 15 to our consolidated financial statements for details of the subordinate position we own in the 2018 Single Asset Securitization. |
| (3) | Includes amounts outstanding under secured debt agreements, loan participations sold, non-consolidated senior interests, and securitized debt obligations.obligations, non-consolidated securitized debt obligations, and secured term loans. |
(3)(4) | Decrease in rates assumes the applicable benchmark rate for each currency does not decrease below 0%. |
| (5) | Liabilities balance includes fourtwo interest rate swaps totaling C$108.217.3 million ($86.712.7 million as of SeptemberJune 30, 2017)2020) that are used to hedge a portion of our fixed rate debt. |
Loan
Investment Portfolio Value
As of
SeptemberJune 30,
2017, 8%2020, 3% of our
loansinvestments by
total loaninvestment exposure earned a fixed rate of interest and as such, the values of such loans are sensitive to changes in interest rates. We generally hold all of our
loansinvestments to maturity and so do not expect to realize gains or losses on our fixed rate
loaninvestment portfolio as a result of movements in market interest rates.
In addition to the risks related to fluctuations in cash flows and asset values associated with movements in interest rates, there is also the risk of non-performance on floating rate assets. In the case of a significant increase in interest rates, the additional debt service payments due from our borrowers may strain the operating cash flows of the collateral real estate assets and, potentially, contribute to non-performance or, in severe cases, default. This risk is partially mitigated by various facts we consider during our underwriting process, which in certain cases include a requirement for our borrower to purchase an interest rate cap contract.
Our loans and investments are also subject to credit risk. The performance and value of our loans and investments depend upon the sponsors’ ability to operate the properties that serve as our collateral so that they produce cash flows adequate to pay interest and principal due to us. To monitor this risk, our Manager’s asset management team reviews our investment portfolios and in certain instances is in regular contact with our borrowers, monitoring performance of the collateral and enforcing our rights as necessary.
In addition, we are exposed to the risks generally associated with the commercial real estate market, including variances in occupancy rates, capitalization rates, absorption rates, and other macroeconomic factors beyond our control. We seek to manage these risks through our underwriting and asset management processes.
The COVID-19 pandemic has significantly impacted the commercial real estate markets, causing reduced occupancy, requests from tenants for rent deferral or abatement, and delays in construction and development projects currently planned or underway. These negative conditions have persisted, and in the future may continue to persist and impair our borrowers’ ability to pay principal and interest due to us under our loan agreements. We maintain a robust asset management relationship with our borrowers and have utilized these relationships to address the potential impacts of the COVID-19 pandemic on our loans secured by properties experiencing cash flow pressure, most significantly hospitality assets. Some of our borrowers have indicated that due to the impact of the COVID-19 pandemic, they will be unable to timely execute their business plans, have had to temporarily close their businesses, or have experienced other negative business consequences and have requested temporary interest deferral or forbearance, or other modifications of their loans. During the three months ended June 30, 2020, we closed 13 loan modifications, representing an aggregate principal balance of $2.4 billion. The loan modifications included term extensions, interest rate changes, repurposing of reserves, temporary deferrals of interest, and performance test or covenant waivers, many of which were coupled with additional equity commitments from sponsors.
We are generally encouraged by our borrowers’ initial response to the COVID-19 pandemic’s impacts on their properties. With limited exceptions, we believe our loan sponsors are committed to supporting assets collateralizing our loans through additional equity investments, and that we will benefit from our long-standing core business model of originating senior loans collateralized by large assets in major markets with experienced, well-capitalized institutional sponsors. Our investment portfolio’s low origination weighted-average LTV of 63.6% as of June 30, 2020, reflects significant equity value that our sponsors are motivated to protect through periods of cyclical disruption. While we believe the principal amounts of our loans are generally adequately protected by underlying collateral value, there is a risk that we will not realize the entire principal value of certain investments.
Our Manager’s portfolio monitoring and asset management operations benefit from the deep knowledge, experience, and information advantages derived from its position as part of Blackstone’s real estate platform. Blackstone Real Estate is one of the largest owners and operators of real estate in the world, with a proven track record of successfully navigating market cycles and emerging stronger through periods of volatility. The market-leading real estate expertise derived from the strength of the Blackstone platform deeply informs our credit and underwriting process, and gives us the tools to expertly asset manage our portfolio and work with our borrowers throughout periods of economic stress and uncertainty.
We are exposed to risks related to the equity capital markets, and our related ability to raise capital through the issuance of our class A common stock or other equity instruments. We are also exposed to risks related to the debt capital markets, and our related ability to finance our business through borrowings under credit facilities or other debt instruments. As a REIT, we are required to distribute a significant portion of our taxable income annually, which constrains our ability to accumulate operating cash flow and therefore requires us to utilize debt or equity capital to finance our business. We seek to mitigate these risks by monitoring the debt and equity capital markets to inform our decisions on the amount, timing, and terms of capital we raise.
The COVID-19 pandemic has resulted in extreme volatility in a variety of global markets, including the real estate-related debt markets. U.S. financial markets, in particular, are experiencing limited liquidity and forced selling by certain market participants with insufficient liquidity available to meet current obligations has put further downward pressure on asset prices. In reaction to these tumultuous and unpredictable market conditions, banks and other lenders have generally restricted lending activity and requested margin posting or repayments where applicable for secured loans collateralized by assets with depressed valuations.
Margin call provisions under our credit facilities do not permit valuation adjustments based on capital markets events, and are limited to collateral-specific credit marks generally determined on a commercially reasonable basis. During the three months ended June 30, 2020, we entered into agreements with seven of our secured credit facility lenders, representing an aggregate $7.9 billion of our secured credit facilities, to temporarily suspend credit mark provisions on certain of their portfolio assets in exchange for: (i) cash repayments; (ii) pledges of additional collateral; and (iii) reductions of available borrowings.
The nature of our business requires us to hold our cash and cash equivalents and obtain financing from various financial institutions. This exposes us to the risk that these financial institutions may not fulfill their obligations to us under these various contractual arrangements. We mitigate this exposure by depositing our cash and cash equivalents and entering into financing agreements with high credit-quality institutions.
The nature of our loans and investments also exposes us to the risk that our counterparties do not make required interest and principal payments on scheduled due dates. We seek to manage this risk through a comprehensive credit analysis prior to making an investment and active monitoring of the asset portfolios that serve as our collateral.
Our loans and investments that are denominated in a foreign currency are also subject to risks related to fluctuations in currency rates. We
generally mitigate this exposure by matching the currency of our foreign currency assets to the currency of the borrowings that finance those assets. As a result, we substantially reduce our exposure to changes in portfolio value related to changes in foreign currency rates.
In certain circumstances, we may also enter into foreign currency derivative contracts to further mitigate this exposure.The following table outlines our assets and liabilities that are denominated in a foreign currency
(£(€/
€£/A$/C$ in thousands):
| | | | | | | | | | | | |
| | | September 30, 2017 | |
Foreign currency assets(1) | | £ | 683,745 | | | € | 145,958 | | | C$ | 583,528 | |
Foreign currency liabilities(1) | | | (475,609 | ) | | | (66,290 | ) | | | (467,788 | ) |
Foreign currency contracts - notional | | | (112,700 | ) | | | — | | | | (102,000 | ) |
| | | | | | | | | | | | |
Net exposure to exchange rate fluctuations | | £ | 95,436 | | | € | 79,668 | | | C$ | 13,740 | |
| | | | | | | | | | | | |
| |
| | | | | | | | | | | | | | | | |
| | | | |
Foreign currency assets (1) | | € | 2,849,505 | | | £ | 1,654,698 | | | A$ | 344,002 | | | C$ | 108,478 | |
Foreign currency liabilities (1) | | | (2,220,577 | ) | | | (1,123,093 | ) | | | (245,982 | ) | | | (78,943 | ) |
Foreign currency contracts - notional | | | (620,400 | ) | | | (530,200 | ) | | | (92,800 | ) | | | (24,400 | ) |
| | | | | | | | | | | | | | | | |
Net exposure to exchange rate fluctuations | | € | 8,528 | | | £ | 1,405 | | | A$ | 5,220 | | | C$ | 5,135 | |
| | | | | | | | | | | | | | | | |
| | | | | | | | | | | | | | | | |
| | |
| | Balances include non-consolidated senior interests of £302.0 million.million |
We estimate that a 10% appreciation of the United States Dollar relative to the British Pound Sterling and the Euro would result in a decline in our net assets in U.S. Dollar terms of $27.9 million and $9.4 million, respectively, as of September 30, 2017.
Substantially all of our net asset exposure to
the Euro, the British Pound Sterling, the Australian Dollar, and the Canadian Dollar has been hedged with foreign currency forward contracts.
Evaluation of Disclosure Controls and Procedures
An evaluation of the effectiveness of the design and operation of our “disclosure controls and procedures” (as defined in Rule 13a-15(e) under the Securities Exchange Act of 1934, as amended (the “Exchange Act”)), as of the end of the period covered by this quarterly report on Form 10-Q was made under the supervision and with the participation of our management, including our Chief Executive Officer and Chief Financial Officer. Based upon this evaluation, our Chief Executive Officer and Chief Financial Officer have concluded that our disclosure controls and procedures (a) are effective to ensure that information required to be disclosed by us in reports filed or submitted under the Exchange Act is recorded, processed, summarized and reported within the time periods specified by SEC rules and forms and (b) include, without limitation, controls and procedures designed to ensure that information required to be disclosed by us in reports filed or submitted under the Exchange Act is accumulated and communicated to our management, including our Chief Executive Officer and Chief Financial Officer, as appropriate to allow timely decisions regarding required disclosure.
Changes in Internal
ControlsControl over Financial Reporting
There have been no changes in our “internal control over financial reporting” (as defined in Rule 13a-15(f) of the Exchange Act) that occurred during the period covered by this quarterly report on Form 10-Q that have materially affected, or are reasonably likely to materially affect, our internal control over financial reporting.
PART II. OTHER INFORMATION
From time to time, we may be involved in various claims and legal actions arising in the ordinary course of business. As of
SeptemberJune 30,
2017,2020, we were not involved in any material legal proceedings.
There have been no material changes to the risk factors previously disclosed under
Part I, Item 1A of our Annual Report on Form 10-K for the year ended December 31,
2016.2019, as updated by the information disclosed under Part II, Item 1A of our Quarterly Report on Form 10-Q for the quarterly period ended March 31, 2020. | UNREGISTERED SALES OF EQUITY SECURITIES AND USE OF PROCEEDS |
None.
On May 11, 2020, we issued 840,696 shares of our class A common stock to our Manager in satisfaction of $19.3 million of management and incentive fees accrued in the first quarter of 2020. The per share price of $22.92954, was calculated based on the volume-weighted average price on the NYSE of our class A common stock over the five trading days following our April 29, 2020 first quarter 2020 earnings conference call. The issuance of such shares was not registered under the Securities Act of 1933, as amended (the “Securities Act”), because the shares were issued in a transaction by the issuer not involving any public offering exempt from registration under Section 4(a)(2) of the Securities Act.
| DEFAULTS UPON SENIOR SECURITIES |
| | | | |
| | | | |
| | |
| |
| | Second Supplemental Indenture,Term Loan Credit Agreement, dated May 5, 2017, betweenas of April 23, 2019, among Blackstone Mortgage Trust, Inc., the Company and Thelenders party thereto, JPMorgan Chase Bank, of New York Mellon Trust Company, N.A., as trustee (filedAdministrative Agent, and JP Morgan Chase Bank, N.A., Merrill Lynch, Pierce, Fenner & Smith Incorporated, Barclays Bank Plc, Deutsche Bank Securities Inc. and Blackstone Advisory Partners LP, as Exhibit 4.2 to the Company’s Current Report on Form 8-K (File No. 001-14788) filed with the Commission on May 5, 2017Joint Lead Arrangers and incorporated herein by reference).Joint Bookrunners | | |
| | |
| | | | |
| | |
31.1 | | | | |
| | |
| | | | |
| | |
| | | | |
| | |
| | | | |
| | |
| | | | |
| | |
| | | | |
| | |
| | | | |
| | |
| | | | |
| | |
| | Inline XBRL Instance DocumentDocument– the instance document does not appear in the interactive data file because its XBRL tags are embedded within the inline XBRL document | | |
| | |
| | Inline XBRL Taxonomy Extension Schema Document | | |
| | | | |
| | Inline XBRL Taxonomy Extension Calculation Linkbase Document | | |
| | |
| | Inline XBRL Taxonomy Extension Label Linkbase Document | | |
| | |
| | Inline XBRL Taxonomy Extension Presentation Linkbase Document | | |
| | |
| | Inline XBRL Taxonomy Extension Definition Linkbase Document | | |
| | |
| | Cover Page Interactive Data File (formatted as Inline XBRL and contained in Exhibit 101) | | |
| | |
| | | | |
| + | This exhibit shall not be deemed “filed” for purposes of Section 18 of the Securities Exchange Act of 1934, as amended (the “Exchange Act”) or otherwise subject to the liability of that Section. Such exhibit shall not be deemed incorporated into any filing under the Securities Act, of 1933, as amended (the “Securities Act”), or the Exchange Act. |
The agreements and other documents filed as exhibits to this report are not intended to provide factual information or other disclosure other than with respect to the terms of the agreements or other documents themselves, and you should not rely on them for that purpose. In particular, any representations and warranties made by us in these agreements or other documents were made solely within the specific context of the relevant agreement or document and may not describe the actual state of affairs as of the date they were made or at any other time.
Pursuant to the requirements of the Securities Exchange Act of 1934, the registrant has duly caused this report to be signed on its behalf by the undersigned thereunto duly authorized.
| | | | |
| | | | BLACKSTONE MORTGAGE TRUST, INC. |
| | |
October 24, 2017
| | | | |
| | | | |
| | | | |
| | | | (Principal Executive Officer) |
| | |
October 24, 2017
| | | | /s/ Anthony F. Marone, Jr. |
| | | | |
| | | | |
| | | | (Principal Financial Officer and |
| | | | Principal Accounting Officer) |
59
 Blackstone Mortgage Trust, Inc.(Exact name of Registrant as specified in its charter)Maryland