FORM10-Q
[✓]
15(d)
March 31, 2024
[]
15(d)
___
| Canada | 98-0017682 | |||||||
| (State or other jurisdiction | (I.R.S. Employer | |||||||
| of incorporation or organization) | Identification No.) | |||||||
| 505 Quarry Park Boulevard S.E. | ||||||||
| Calgary, Alberta, Canada | T2C 5N1 | |||||||
| (Address of principal executive offices) | (Postal Code) | |||||||
Thecode)
| Title of each class | Trading symbol | Name of each exchange on which registered | ||||||||||||
| None | None | |||||||||||||
YES ✓ NO
The Yes ☑ No ☐
YES ✓ NO
The Yes ☑ No ☐
Large accelerated filer | ☑ | Accelerated filer | ☐ | ☐ | Smaller reporting company | ☐ | ||||||||||||||||||||||||||
| Emerging growth company | |||||||||||||||||||||||||||||||
| ☐ | |||||||||||||||||||||||||||||||
The☐
YES NO ✓
Yes ☐ No ☑
535,836,803.
| IMPERIAL OIL LIMITED | ||||||||
| Page | ||||||||||
| PART I. FINANCIAL INFORMATION | ||||||||||
| Item 1. | Financial statements | |||||||||
| Consolidated statement of shareholders’ equity | ||||||||||
| Item 2. | Management’s discussion and analysis of financial condition and results of operations | |||||||||
| Item 3. | Quantitative and qualitative disclosures about market risk | |||||||||
| Item 4. | Controls and procedures | |||||||||
| PART II. OTHER INFORMATION | ||||||||||
| Item 1. Legal proceedings | ||||||||||
| Item 2. | Unregistered sales of equity securities and use of proceeds | |||||||||
| Item | ||||||||||
| Item 6. Exhibits | ||||||||||
| SIGNATURES | ||||||||||
IMPERIAL OIL LIMITED
| IMPERIAL OIL LIMITED | ||||||||
Nine Months to September 30 Revenues and other income Operating revenues(a) Investment and other income(note 3) Total revenues and other income Expenses Exploration Purchases of crude oil and products(b) Production and manufacturing(c) Selling and general(c) Federal excise tax Depreciation and depletion Financing costs(note 5) Total expenses Income (loss) before income taxes Income taxes Net income (loss) Per-share information(Canadian dollars) Net income (loss) per common share - basic(note 8) Net income (loss) per common share - diluted(note 8) Dividends per common share (a) Amounts from related parties included in operating revenues. (b) Amounts to related parties included in purchases of crude oil and products. (c) Nine Months to September 30 Net income (loss) Other comprehensive income (loss), net of income taxes Post-retirement benefits liability adjustment (excluding amortization) Amortization of post-retirement benefits liability adjustment included in net periodic benefit costs Total other comprehensive income (loss) Comprehensive income (loss) As at Sept 30 As at Dec 31 Assets Current assets Cash Accounts receivable, less estimated doubtful accounts(a) Inventories of crude oil and products Materials, supplies and prepaid expenses Total current assets Investments and long-term receivables Property, plant and equipment, less accumulated depreciation and depletion Property, plant and equipment, net Goodwill Other assets, including intangibles, net Total assets Liabilities Current liabilities Notes and loans payable(b) Accounts payable and accrued liabilities(a) (note 7) Income taxes payable Total current liabilities Long-term debt(c) (note 6) Other long-term obligations(d) (note 7) Deferred income tax liabilities Total liabilities Shareholders’ equity Common shares at stated value(e) (note 8) Earnings reinvested(note 9) Accumulated other comprehensive income (loss)(note 10) Total shareholders’ equity Total liabilities and shareholders’ equity Consolidated statement Nine Months to September 30 Operating activities Net income (loss) Adjustments fornon-cash items: Depreciation and depletion (Gain) loss on asset sales(note 3) Deferred income taxes and other Changes in operating assets and liabilities: Accounts receivable Inventories, materials, supplies and prepaid expenses Income taxes payable Accounts payable and accrued liabilities All other items - net(a) Cash flows from (used in) operating activities Investing activities Additions to property, plant and equipment Proceeds from asset sales(note 3) Additional investments Cash flows from (used in) investing activities Financing activities Short-term debt - net Long-term debt - additions(note 6) Reduction in capitalized lease obligations(note 6) Dividends paid Common shares purchased(note 8) Cash flows from (used in) financing activities Increase (decrease) in cash Cash at beginning of period Cash at end of period(b) (a) Included contribution to registered pension plans. Revenues and other income Operating revenues(a) Intersegment sales Investment and other income(note 3) Expenses Exploration Purchases of crude oil and products Production and manufacturing Selling and general Federal excise tax Depreciation and depletion Financing costs(note 5) Total expenses Income (loss) before income taxes Income taxes Net income (loss) Cash flows from (used in) operating activities Capital and exploration expenditures(b) Revenues and other income Operating revenues(a) Intersegment sales Investment and other income(note 3) Expenses Exploration Purchases of crude oil and products Production and manufacturing Selling and general Federal excise tax Depreciation and depletion Financing costs(note 5) Total expenses Income (loss) before income taxes Income taxes Net income (loss) Cash flows from (used in) operating activities Capital and exploration expenditures(b) Revenues and other income Operating revenues(a) Intersegment sales Investment and other income(note 3) Expenses Exploration Purchases of crude oil and products Production and manufacturing Selling and general Federal excise tax Depreciation and depletion Financing costs(note 5) Total expenses Income (loss) before income taxes Income taxes Net income (loss) Cash flows from (used in) operating activities Capital and exploration expenditures(b) Total assets as at September 30 Revenues and other income Operating revenues(a) Intersegment sales Investment and other income(note 3) Expenses Exploration Purchases of crude oil and products Production and manufacturing Selling and general Federal excise tax Depreciation and depletion Financing costs(note 5) Total expenses Income (loss) before income taxes Income taxes Net income (loss) Cash flows from (used in) operating activities Capital and exploration expenditures(b) Total assets as at September 30 Nine Months to September 30 Proceeds from asset sales Book value of asset sales Gain (loss) on asset sales, before tax(a) (b) Gain (loss) on asset sales, after tax(a) (b) Pension benefits: Current service cost Interest cost Expected return on plan assets Amortization of prior service cost Amortization of actuarial loss (gain) Net periodic benefit cost Other post-retirement benefits: Current service cost Interest cost Amortization of actuarial loss (gain) Net periodic benefit cost Debt-related interest Capitalized interest Net interest expense Other interest Total financing costs Long-term debt Capital leases Total long-term debt Employee retirement benefits(a) Asset retirement obligations and other environmental liabilities(b) Share-based incentive compensation liabilities Other obligations Total other long-term obligations Authorized Common shares outstanding 1995 - 2015 2016 - Third quarter - Full year 2017 - Third quarter -Year-to-date Cumulative purchase to date Net income (loss) per common share - basic Net income (loss)(millions of Canadian dollars) Weighted average number of common shares outstanding(millions of shares) Net income (loss) per common share(dollars) Net income (loss) per common share - diluted Net income (loss)(millions of Canadian dollars) Weighted average number of common shares outstanding(millions of shares) Effect of employee share-based awards(millions of shares) Weighted average number of common shares outstanding, assuming dilution(millions of shares) Net income (loss) per common share(dollars) Earnings reinvested at beginning of period Net income (loss) for the period Share purchases in excess of stated value Dividends declared Earnings reinvested at end of period Balance at January 1 Post-retirement benefits liability adjustment: Current period change excluding amounts reclassified from accumulated other comprehensive Amounts reclassified from accumulated other comprehensive income Balance at September 30 Amortization of post-retirement benefits liability adjustment (a) This accumulated other comprehensive income component is included in the computation of net periodic benefit cost (note 4). Post-retirement benefits liability adjustments: Post-retirement benefits liability adjustment (excluding amortization) Amortization of post-retirement benefits liability adjustment included in TotalItem 1. Financial statementsConsolidated statement of income (U.S. GAAP, unaudited) Third Quarter millions of Canadian dollars 2017 2016 2017 2016 7,134 6,568 21,077 17,967 24 874 270 945 7,158 7,442 21,347 18,912 7 16 29 75 4,251 3,857 13,226 10,884 1,338 1,261 4,238 3,842 219 275 626 812 438 434 1,253 1,237 391 398 1,135 1,229 18 19 49 52 6,662 6,260 20,556 18,131 496 1,182 791 781 125 179 164 60 371 1,003 627 721 0.44 1.18 0.74 0.85 0.44 1.18 0.74 0.85 0.16 0.15 0.47 0.44 756 448 2,801 1,457 604 623 1,919 1,540 Amounts to related parties included in production and manufacturing, and selling and general expenses. 127 133 415 394 The information in the notes to consolidated financial statements is an integral part of these statements.IMPERIAL OIL LIMITEDConsolidated statement of income (U.S. GAAP, unaudited) Three Months to March 31millions of Canadian dollars 2024 2023 Revenues and other income Revenues (a)12,249 12,057 Investment and other income (note 3)34 64 Total revenues and other income 12,283 12,121 Expenses Exploration 1 1 Purchases of crude oil and products (b)7,706 7,478 Production and manufacturing (c)1,664 1,756 Selling and general (c)246 186 Federal excise tax and fuel charge 591 529 Depreciation and depletion 490 490 Non-service pension and postretirement benefit 1 20 Financing (d) (note 5)12 16 Total expenses 10,711 10,476 Income (loss) before income taxes 1,572 1,645 Income taxes 377 397 Net income (loss) 1,195 1,248 Per share information (Canadian dollars)Net income (loss) per common share - basic (note 9)2.23 2.14 Net income (loss) per common share - diluted (note 9)2.23 2.13 (a) Amounts from related parties included in revenues. 2,729 3,136 (b) Amounts to related parties included in purchases of crude oil and products. 985 1,078 (c) Amounts to related parties included in production and manufacturing, and selling and general expenses. 150 135 (d) Amounts to related parties included in financing. 44 39 The information in the notes to consolidated financial statements is an integral part of these statements. 3IMPERIAL OIL LIMITED Consolidated statement of comprehensive income (U.S. GAAP, unaudited) Third Quarter millions of Canadian dollars 2017 2016 2017 2016 371 1,003 627 721 - - 41 100 34 34 106 108 34 34 147 208 405 1,037 774 929 The information in the notes to consolidated financial statements is an integral part of these statements.IMPERIAL OIL LIMITEDConsolidated balance sheet (U.S. GAAP, unaudited)millions of Canadian dollars
2017
2016 833 391 1,896 2,023 989 949 441 468 4,159 3,831 931 1,030 53,844 53,515 (18,248 ) (17,182 ) 35,596 36,333 186 186 498 274 41,370 41,654 202 202 3,041 3,193 59 488 3,302 3,883 5,013 5,032 3,698 3,656 4,336 4,062 16,349 16,633 1,547 1,566 25,224 25,352 (1,750 ) (1,897 ) 25,021 25,021 41,370 41,654 Three Months to March 31millions of Canadian dollars 2024 2023 Net income (loss) 1,195 1,248 Other comprehensive income (loss), net of income taxes Postretirement benefits liability adjustment (excluding amortization) 4 21 Amortization of postretirement benefits liability adjustment included in net benefit costs12 10 Total other comprehensive income (loss) 16 31 Comprehensive income (loss) 1,211 1,279 The information in the notes to consolidated financial statements is an integral part of these statements. 4(a)IMPERIAL OIL LIMITED Accounts receivable, less estimated doubtful accounts included net amounts receivable from related parties of $87 million (2016 - $172 million).Consolidated balance sheet (U.S. GAAP, unaudited)As atMar 31As atDec 31millions of Canadian dollars 2024 2023 Assets Current assets Cash and cash equivalents 1,176 864 Accounts receivable - net (a)5,204 4,482 Inventories of crude oil and products 2,106 1,944 Materials, supplies and prepaid expenses 1,043 1,008 Total current assets 9,529 8,298 Investments and long-term receivables (b)1,082 1,062 Property, plant and equipment, 56,680 56,200 less accumulated depreciation and depletion (25,841) (25,365) Property, plant and equipment, net 30,839 30,835 Goodwill 166 166 Other assets, including intangibles - net 897 838 Total assets 42,513 41,199 Liabilities Current liabilities Notes and loans payable 121 121 Accounts payable and accrued liabilities (a) (note 7)6,968 6,231 Income taxes payable 17 251 Total current liabilities 7,106 6,603 Long-term debt (c) (note 6)4,006 4,011 Other long-term obligations (note 7)3,860 3,851 Deferred income tax liabilities 4,429 4,512 Total liabilities 19,401 18,977 Shareholders’ equity Common shares at stated value (d) (note 9)992 992 Earnings reinvested 22,781 21,907 Accumulated other comprehensive income (loss) (note 10)(661) (677) Total shareholders’ equity 23,112 22,222 Total liabilities and shareholders’ equity 42,513 41,199 (a) Accounts receivable - net included net amounts receivable from related parties. 696 1,048 (b) Investments and long-term receivables included amounts from related parties. 271 283 (c) Long-term debt included amounts to related parties. 3,447 3,447 (d) Number of common shares authorized (millions). 1,100 1,100 Number of common shares outstanding (millions). 536 536 The information in the notes to consolidated financial statements is an integral part of these statements. 5(b)IMPERIAL OIL LIMITED Notes and loans payable included amounts to related partiesConsolidated statement of $75 million (2016 - $75 million).shareholders’ equity (U.S. GAAP, unaudited) Three Months to March 31millions of Canadian dollars 2024 2023 Common shares at stated value (note 9) At beginning of period 992 1,079 Share purchases at stated value — — At end of period 992 1,079 Earnings reinvested At beginning of period 21,907 21,846 Net income (loss) for the period 1,195 1,248 Share purchases in excess of stated value — — Dividends declared (321) (257) At end of period 22,781 22,837 Accumulated other comprehensive income (loss) (note 10) At beginning of period (677) (512) Other comprehensive income (loss) 16 31 At end of period (661) (481) Shareholders’ equity at end of period 23,112 23,435 The information in the notes to consolidated financial statements is an integral part of these statements. 6(c)IMPERIAL OIL LIMITED Long-term debt included amounts to related parties of $4,447 million (2016 - $4,447 million).(d)Other long-term obligations included amounts to related parties of $71 million (2016 - $104 million).(e)Number of common shares authorized and outstanding were 1,100 million and 838 million, respectively (2016 - 1,100 million and 848 million, respectively).The information in the notes to consolidated financial statements is an integral part of these statements.IMPERIAL OIL LIMITED of cash flows (U.S. GAAP, unaudited)Inflow (outflow) Third Quarter millions of Canadian dollars 2017 2016 2017 2016 371 1,003 627 721 391 398 1,135 1,229 (6 ) (909 ) (219 ) (952 ) 131 215 294 35 (297 ) 275 127 (121 ) 104 (7 ) (13 ) 112 19 (13 ) (429 ) - 81 (241 ) (159 ) (59 ) 43 51 320 299 837 772 1,683 1,264 (241 ) (189 ) (683 ) (893 ) 8 1,194 230 1,244 (1 ) - (1 ) (1 ) (234 ) 1,005 (454 ) 350 - (1,591 ) - (1,679 ) - - - 495 (7 ) (6 ) (20 ) (21 ) (136 ) (127 ) (390 ) (364 ) (250 ) - (377 ) - (393 ) (1,724 ) (787 ) (1,569 ) 210 53 442 45 623 195 391 203 833 248 833 248 (78 ) (44 ) (176 ) (120 ) (b)Cash is composed of cash in bank and cash equivalents at cost. Cash equivalents are all highly liquid securities with maturity of three months or less when purchased.flows (U.S. GAAP, unaudited)The information in the notes to consolidated financial statements is an integral part of these statements.IMPERIAL OIL LIMITED Three Months to March 31millions of Canadian dollars 2024 2023 Operating activities Net income (loss) 1,195 1,248 Adjustments for non-cash items: Depreciation and depletion 490 490 (Gain) loss on asset sales (note 3)(2) (9) Deferred income taxes and other (164) (56) Changes in operating assets and liabilities: Accounts receivable (722) 436 Inventories, materials, supplies and prepaid expenses (196) (479) Income taxes payable (234) (2,077) Accounts payable and accrued liabilities 707 (255) All other items - net (b)2 (119) Cash flows from (used in) operating activities 1,076 (821) Investing activities Additions to property, plant and equipment (497) (429) Proceeds from asset sales (note 3)4 14 Loans to equity companies - net 12 1 Cash flows from (used in) investing activities (481) (414) Financing activities Finance lease obligations - reduction (note 6)(5) (5) Dividends paid (278) (266) Common shares purchased (note 9)— — Cash flows from (used in) financing activities (283) (271) Increase (decrease) in cash and cash equivalents 312 (1,506) Cash and cash equivalents at beginning of period 864 3,749 Cash and cash equivalents at end of period (a) 1,176 2,243 (a) Cash equivalents are all highly liquid securities with maturity of three months or less. (b) Included contributions to registered pension plans. (37) (42) Income taxes (paid) refunded. (700) (2,632) Interest (paid), net of capitalization. (11) (21) The information in the notes to consolidated financial statements is an integral part of these statements. 7IMPERIAL OIL LIMITED Notes to consolidated financial statements (unaudited)1. Basis of financial statement preparationThese unaudited consolidated financial statements have been prepared in accordance with United States Generally Accepted Accounting Principles of the United States of America (GAAP) and follow the same accounting policies and methods of computation as, and should be read in conjunction with, the most recent annual consolidated financial statements filed with the U.S. Securities and Exchange Commission (SEC) in the company’s 20162023 annual report on Form10-K. In the opinion of the company, the information furnished herein reflects all known accruals and adjustments necessary for a fair statement of the results for the periods reported herein. All such adjustments are of a normal recurring nature. Prior data has been reclassified in certain cases to conform to the current presentation basis.The company’s exploration and production activities are accounted for under the “successful efforts” method.The results for the ninethree months ended September 30, 2017,March 31, 2024, are not necessarily indicative of the operations to be expected for the full year.All amounts are in Canadian dollars unless otherwise indicated.IMPERIAL OIL LIMITED8IMPERIAL OIL LIMITED 2. Business segmentsThird Quarter Upstream Downstream Chemical millions of Canadian dollars 2017 2016 2017 2016 2017 2016 1,668 1,316 5,204 4,971 262 281 587 709 241 253 62 58 7 1 15 870 - 1 2,262 2,026 5,460 6,094 324 340 7 16 - - - - 947 861 4,014 3,827 179 188 893 887 394 323 51 51 5 (1 ) 167 238 19 22 - - 438 434 - - 330 346 53 46 3 2 1 (2 ) - - - - 2,183 2,107 5,066 4,868 252 263 79 (81 ) 394 1,226 72 77 17 (55 ) 102 224 20 21 62 (26 ) 292 1,002 52 56 479 432 268 264 99 73 92 149 55 38 5 7 Third Quarter Corporate and Other Eliminations Consolidated millions of Canadian dollars 2017 2016 2017 2016 2017 2016 - - - - 7,134 6,568 - - (890 ) (1,020 ) - - 2 2 - - 24 874 2 2 (890 ) (1,020 ) 7,158 7,442 - - - - 7 16 - - (889 ) (1,019 ) 4,251 3,857 - - - - 1,338 1,261 29 17 (1 ) (1 ) 219 275 - - - - 438 434 5 4 - - 391 398 17 21 - - 18 19 51 42 (890 ) (1,020 ) 6,662 6,260 (49 ) (40 ) - - 496 1,182 (14 ) (11 ) - - 125 179 (35 ) (29 ) - - 371 1,003 (9 ) 3 - - 837 772 7 11 - - 159 205 Three Months to March 31 Upstream Downstream Chemical millions of Canadian dollars 2024 2023 2024 2023 2024 2023 Revenues and other income Revenues (a) (b)42 76 11,879 11,639 328 342 Intersegment sales4,122 3,622 1,748 1,823 90 91 Investment and other income (note 3)4 2 12 20 1 — 4,168 3,700 13,639 13,482 419 433 Expenses Exploration 1 1 — — — — Purchases of crude oil and products1,813 1,543 11,591 11,196 260 274 Production and manufacturing 1,188 1,287 421 411 53 58 Selling and general — — 162 157 26 26 Federal excise tax and fuel charge — — 590 528 1 1 Depreciation and depletion 432 434 45 45 4 4 Non-service pension and postretirement benefit — — — — — — Financing (note 5)1 — — — — — Total expenses 3,435 3,265 12,809 12,337 344 363 Income (loss) before income taxes 733 435 830 1,145 75 70 Income tax expense (benefit) 175 105 199 275 18 17 Net income (loss)558 330 631 870 57 53 Cash flows from (used in) operating activities891 (398) 7 (419) (3) (32) Capital and exploration expenditures (c)290 321 153 74 5 4 Total assets as at March 31 28,661 29,059 11,126 9,535 517 477 Three Months to March 31 Corporate and other Eliminations Consolidated millions of Canadian dollars 2024 2023 2024 2023 2024 2023 Revenues and other income Revenues (a) (b)— — — — 12,249 12,057 Intersegment sales— — (5,960) (5,536) — — Investment and other income (note 3)17 42 — — 34 64 17 42 (5,960) (5,536) 12,283 12,121 Expenses Exploration — — — — 1 1 Purchases of crude oil and products— — (5,958) (5,535) 7,706 7,478 Production and manufacturing 2 — — — 1,664 1,756 Selling and general 60 4 (2) (1) 246 186 Federal excise tax and fuel charge — — — — 591 529 Depreciation and depletion 9 7 — — 490 490 Non-service pension and postretirement benefit 1 20 — — 1 20 Financing (note 5)11 16 — — 12 16 Total expenses 83 47 (5,960) (5,536) 10,711 10,476 Income (loss) before income taxes (66) (5) — — 1,572 1,645 Income tax expense (benefit) (15) — — — 377 397 Net income (loss) (51) (5) — — 1,195 1,248 Cash flows from (used in) operating activities 181 28 — — 1,076 (821) Capital and exploration expenditures (c)48 30 — — 496 429 Total assets as at March 31 2,699 3,815 (490) (771) 42,513 42,115 9(a)IMPERIAL OIL LIMITED Included export sales to the United States of $1,080 million (2016 - $941 million). Export sales to the United States were recorded in all operating segments, with the largest effects in the Upstream segment.(a)Includes export sales to the United States of $2,378 million (2023 - $2,375 million).(b)Revenues include both revenue within the scope of ASC 606 and outside the scope of ASC 606. Trade receivables in "Accounts receivable – net" reported on the Consolidated balance sheet include both receivables within the scope of ASC 606 and outside the scope of ASC 606. Revenue and receivables outside the scope of ASC 606 primarily relate to physically settled commodity contracts accounted for as derivatives. Contractual terms, credit quality and type of customer are generally similar between contracts within the scope of ASC 606 and those outside it.Revenues Three Months to March 31millions of Canadian dollars 2024 2023 Revenue from contracts with customers 9,729 10,520 Revenue outside the scope of ASC 6062,520 1,537 Total 12,249 12,057 (c)Capital and exploration expenditures (CAPEX) include exploration expenses, additions to property, plant and equipment, additions to finance leases, additional investments and acquisitions and the company’s share of similar costs for equity companies. CAPEX excludes the purchase of carbon emission credits.10(b)IMPERIAL OIL LIMITED Capital and exploration expenditures (CAPEX) include exploration expenses, additions to property, plant and equipment, additions to capital leases, additional investments and acquisitions.IMPERIAL OIL LIMITEDNine Months to September 30 Upstream Downstream Chemical millions of Canadian dollars 2017 2016 2017 2016 2017 2016 5,166 3,699 15,087 13,470 824 798 1,494 1,516 792 689 191 156 17 22 248 919 (1 ) 1 6,677 5,237 16,127 15,078 1,014 955 29 75 - - - - 3,089 2,584 12,037 10,139 573 518 2,917 2,634 1,169 1,059 152 149 1 (3 ) 540 729 60 63 - - 1,253 1,237 - - 964 1,053 148 158 9 6 5 (6 ) - - - - 7,005 6,337 15,147 13,322 794 736 (328 ) (1,100 ) 980 1,756 220 219 (103 ) (336 ) 230 363 59 59 (225 ) (764 ) 750 1,393 161 160 904 32 626 1,028 176 205 286 745 128 145 12 21 35,387 36,975 4,671 4,403 365 379 Nine Months to September 30 Corporate and Other Eliminations Consolidated millions of Canadian dollars 2017 2016 2017 2016 2017 2016 - - - - 21,077 17,967 - - (2,477 ) (2,361 ) - - 6 3 - - 270 945 6 3 (2,477 ) (2,361 ) 21,347 18,912 - - - - 29 75 - - (2,473 ) (2,357 ) 13,226 10,884 - - - - 4,238 3,842 29 27 (4 ) (4 ) 626 812 - - - - 1,253 1,237 14 12 - - 1,135 1,229 44 58 - - 49 52 87 97 (2,477 ) (2,361 ) 20,556 18,131 (81 ) (94 ) - - 791 781 (22 ) (26 ) - - 164 60 (59 ) (68 ) - - 627 721 (23 ) (1 ) - - 1,683 1,264 29 37 - - 455 948 1,283 674 (336 ) (337 ) 41,370 42,094 (a)Included export sales to the United States of $3,024 million (2016 - $2,704 million). Export sales to the United States were recorded in all operating segments, with the largest effects in the Upstream segment.(b)Capital and exploration expenditures (CAPEX) include exploration expenses, additions to property, plant and equipment, additions to capital leases, additional investments and acquisitions.IMPERIAL OIL LIMITED3.Investment and other income3. Investment and other incomeInvestment and other income included gains and losses on asset sales as follows: Third Quarter millions of Canadian dollars 2017 2016 2017 2016 8 1,194 230 1,244 2 285 12 292 6 909 219 952 5 774 191 808 (a)The nine months ended September 30, 2017 included a gain of $174 million ($151 million after tax) for the sale of a surplus property in Ontario.(b)Third quarter and nine months ended September 30, 2016, included gains of $0.8 billion ($0.7 billion, after tax) from the sale of company-owned Esso retail sites in British Columbia, Alberta, Saskatchewan, Manitoba, Ontario, Quebec, Nova Scotia and Newfoundland.4.Employee retirement benefits Three Months to March 31millions of Canadian dollars 2024 2023 Proceeds from asset sales 4 14 Book value of asset sales 2 5 Gain (loss) on asset sales, before tax 2 9 Gain (loss) on asset sales, after tax 2 8 4. Employee retirement benefitsThe components of net benefit cost were as follows: Third Quarter Nine Months
to September 30 millions of Canadian dollars 2017 2016 2017 2016 54 50 163 152 77 82 235 240 (104 ) (101 ) (306 ) (300 ) 2 2 7 7 43 39 132 121 72 72 231 220 4 4 12 12 6 7 18 20 2 3 6 10 12 14 36 42 Three Months to March 31millions of Canadian dollars 2024 2023 Pension benefits: Service cost 46 41 Interest cost 91 93 Expected return on plan assets (113) (93) Amortization of prior service cost 7 4 Amortization of actuarial loss (gain) 12 11 Net benefit cost 43 56 Other postretirement benefits: Service cost 4 3 Interest cost 6 7 Amortization of actuarial loss (gain) (2) (2) Net benefit cost 8 8 5. Financing costs Three Months to March 31millions of Canadian dollars 2024 2023 Debt-related interest 52 46 Capitalized interest (41) (30) Net interest expense 11 16 Other interest 1 — Total financing 12 16 115.IMPERIAL OIL LIMITED Financing costs and additional notes and loans payable information Third Quarter Nine Months
to September 30 millions of Canadian dollars 2017 2016 2017 2016 24 32 73 95 (7) (11) (29) (37) 17 21 44 58 1 (2) 5 (6) 18 19 49 52 IMPERIAL OIL LIMITED6. Long-term debtAs atMar 31As atDec 31millions of Canadian dollars 2024 2023 Long-term debt 3,447 3,447 Finance leases559 564 Total long-term debt 4,006 4,011 7. Other long-term obligations As atMar 31As atDec 31millions of Canadian dollars 2024 2023 Employee retirement benefits (a)932 954 Asset retirement obligations and other environmental liabilities (b)2,575 2,564 Share-based incentive compensation liabilities 128 90 Operating lease liability (c)107 111 Other obligations 118 132 Total other long-term obligations 3,860 3,851 (a)Total recorded employee retirement benefits obligations also included $62 million in current liabilities (2023 - $62 million).(b)Total asset retirement obligations and other environmental liabilities also included $235 million in current liabilities (2023 - $235 million).(c)Total operating lease liability also included $77 million in current liabilities (2023 - $87 million). In addition to the total operating lease liability, undiscounted commitments for leases not yet commenced totalled $56 million (2023 - $54 million).126.IMPERIAL OIL LIMITED Long-term debt As at
Sept 30 As at
Dec 31 millions of Canadian dollars 2017 2016 4,447 4,447 566 585 5,013 5,032 8. Financial and derivative instrumentsFinancial instrumentsThe fair value of the company’s financial instruments is determined by reference to various market data and other appropriate valuation techniques. There are no material differences between the fair value of the company’s financial instruments and the recorded carrying value. At March 31, 2024 and December 31, 2023, the fair value of long-term debt ($3,447 million, excluding finance lease obligations) was primarily a level 2 measurement.Derivative instrumentsThe company’s size, strong capital structure and the complementary nature of its business segments reduce the company’s enterprise-wide risk from changes in commodity prices, currency rates and interest rates. In addition, the company uses commodity-based contracts, including derivatives, to manage commodity price risk and to generate returns from trading. Commodity contracts held for trading purposes are presented in the Consolidated statement of income on a net basis in the line "Revenues" and in the Consolidated statement of cash flows in "Cash flows from (used in) operating activities". The company’s commodity derivatives are not accounted for under hedge accounting.Credit risk associated with the company’s derivative position is mitigated by several factors, including the use of derivative clearing exchanges and the quality of and financial limits placed on derivative counterparties. The company maintains a system of controls that includes the authorization, reporting and monitoring of derivative activity.The net notional long/(short) position of derivative instruments was: As atMar 31As at Dec 31 thousands of barrels 2024 2023 Crude (3,950) (4,450) Products (2,060) (490) Realized and unrealized gain/(loss) on derivative instruments recognized in the Consolidated statement of income is included in the following lines on a before-tax basis: Three Months to March 31millions of Canadian dollars 2024 2023 Revenues (24) (23) 137.IMPERIAL OIL LIMITED Other long-term obligations As at
Sept 30 As at
Dec 31 millions of Canadian dollars 2017 2016 1,410 1,645 1,577 1,544 138 139 573 328 3,698 3,656 (a)Total recorded employee retirement benefits obligations also included $58 million in current liabilities (2016 - $58 million).(b)Total asset retirement obligations and other environmental liabilities also included $108 million in current liabilities (2016 - $108 million).8.Common shares As of
Sept 30 As of
Dec 31 thousands of shares 2017 2016 1,100,000 1,100,000 837,581 847,599 From 1995 through September 2017,The estimated fair value of derivative instruments, and the related hierarchy level for the fair value measurement were as follows:At March 31, 2024 millions of Canadian dollars Fair value Effect of
counterparty
nettingEffect of
collateral
nettingNet
carrying
valueLevel 1 Level 2 Level 3 Total Assets Derivative assets (a)50 27 — 77 (50) — 27 Liabilities Derivative liabilities (b)54 60 — 114 (50) (4) 60 (a)Included in the Consolidated balance sheet line: “Materials, supplies and prepaid expenses”, “Accounts receivable - net” and “Other assets, including intangibles - net”.(b)Included in the Consolidated balance sheet line: “Accounts payable and accrued liabilities” and “Other long-term obligations”.At December 31, 2023 millions of Canadian dollars Fair value Effect of
counterparty
nettingEffect of
collateral
nettingNet
carrying
valueLevel 1 Level 2 Level 3 Total Assets Derivative assets (a)28 18 — 46 (16) (12) 18 Liabilities Derivative liabilities (b)16 31 — 47 (16) — 31 (a)Included in the Consolidated balance sheet line: “Materials, supplies and prepaid expenses”, “Accounts receivable - net” and “Other assets, including intangibles - net”.(b)Included in the Consolidated balance sheet line: “Accounts payable and accrued liabilities” and “Other long-term obligations”.At March 31, 2024 and December 31, 2023, the company had $33 million and $24 million, respectively, of collateral under a series of12-month normal course issuer bidmaster netting arrangement not offset against the derivatives on the Consolidated balance sheet in “Accounts receivable - net”, primarily related to initial margin requirements.14IMPERIAL OIL LIMITED 9. Common sharesAs atMar 31As atDec 31thousands of shares 2024 2023 Authorized 1,100,000 1,100,000 Outstanding 535,837 535,837 The company’s common share purchase programs. Cumulatively, 916,563 thousand shares were purchased under these programs. Exxon Mobil Corporation’s participation in these programs, including concurrent programs outside the normal course issuer bids, maintained its ownership interest in Imperial at approximately 69.6 percent.The current12-month normal course issuer bid program was announced on June 22, 2017, under which Imperial plans to continue its share purchase program. The program enables the company to purchase up to a maximum of 25,395,927 common shares (3 percent of the total shares on June 13, 2017), which includes shares purchased under the normal course issuer bid and from Exxon Mobil Corporation concurrent with, but outside of the normal course issuer bid. As in the past, Exxon Mobil Corporation has advised the company that it intends to participate to maintain its ownership percentage at approximately 69.6 percent. The results of these activities are as shownsummarized below:year Purchased shares
thousands Millions of
dollars 906,544 15,708 - - 1 - 6,732 250 10,018 377 916,563 16,085 IMPERIAL OIL LIMITEDThe excess of the purchase cost over the stated value of shares purchased has been recorded as a distribution of earnings reinvested. Thousands of
sharesMillions of
dollarsBalance as at December 31, 2022 584,153 1,079 Purchases at stated value (48,316) (87) Balance as at December 31, 2023 535,837 992 Purchases at stated value — — Balance as at March 31, 2024 535,837 992 The following table provides the calculation of net incomebasic and diluted earnings per common share: Nine Months Third Quarter to September 30 2017 2016 2017 2016 371 1,003 627 721 841.8 847.6 845.5 847.6 0.44 1.18 0.74 0.85 371 1,003 627 721 841.8 847.6 845.5 847.6 3.1 3.2 2.9 3.0 844.9 850.8 848.4 850.6 0.44 1.18 0.74 0.85 Three Months to March 312024 2023 Net income (loss) per common share – basic Net income (loss) (millions of Canadian dollars)1,195 1,248 Weighted-average number of common shares outstanding (millions of shares)535.8 584.2 Net income (loss) per common share (dollars)2.23 2.14 Net income (loss) per common share – diluted Net income (loss) (millions of Canadian dollars)1,195 1,248 Weighted-average number of common shares outstanding (millions of shares)535.8 584.2 Effect of employee share-based awards (millions of shares)1.1 1.2 Weighted-average number of common shares outstanding, assuming dilution (millions of shares)536.9 585.4 Net income (loss) per common share (dollars)2.23 2.13 Dividends per common share – declared (dollars)0.60 0.44 159.IMPERIAL OIL LIMITED Earnings reinvested Nine Months Third Quarter to September 30 millions of Canadian dollars 2017 2016 2017 2016 25,224 23,160 25,352 23,687 371 1,003 627 721 (237 ) - (358 ) - (134 ) (127 ) (397 ) (373 ) 25,224 24,036 25,224 24,036 IMPERIAL OIL LIMITED10.Other comprehensive income (loss) information10. Other comprehensive income (loss) informationChanges in accumulated other comprehensive income (loss):millions of Canadian dollars 2017 2016 (1,897 ) (1,828 )
income 41 100 106 108 (1,750 ) (1,620 ) Amounts reclassified out of accumulated other comprehensive income (loss) -before-tax income (expense): Third Quarter Nine Months
to September 30 millions of Canadian dollars 2017 2016 2017 2016
included in net periodic benefit cost (a) (47 ) (44 ) (145 ) (138 ) Income tax expense (credit) for components of other comprehensive income (loss): Third Quarter Nine Months
to September 30 millions of Canadian dollars 2017 2016 2017 2016 - - 16 37
net periodic benefit cost 13 10 39 30 13 10 55 67 millions of Canadian dollars 2024 2023 Balance at January 1 (677) (512) Postretirement benefits liability adjustment: Current period change excluding amounts reclassified from accumulated other comprehensive income4 21 Amounts reclassified from accumulated other comprehensive income 12 10 Balance at March 31 (661) (481) 11.Recently issued accounting standardsAmounts reclassified out of accumulated other comprehensive income (loss) - before-tax income (expense): In May 2014, the Financial Accounting Standards Board (FASB) issued a new standard,Revenue from Contracts with Customers. The standard establishes a single revenue recognition model for all contracts with customers, eliminates industry specific requirements and expands disclosure requirements. The standard is required to be adopted beginning January 1, 2018. The company expects to adopt the standard using the modified retrospective method, under which prior years’ results are not restated, but supplemental information on the impact of the new standard will be included in the 2018 results. The impact from the standard is not expected to have a material effect on the company’s financial statements.In February 2016, the FASB issued a new standard, Leases. The standard requires all leases with an initial term greater than one year be recorded on the balance sheet as a lease asset and lease liability. The standard is required to be adopted beginning January 1, 2019. Imperial is evaluating the standard and its effect on the company’s financial statements and plans to adopt it in 2019.IMPERIAL OIL LIMITEDIn March 2017, the FASB issued an Accounting Standards Update2017-07, Compensation – Retirement Benefits (Topic 715):Improving the Presentation of Net Periodic Pension Cost and Net Periodic Postretirement Benefit Cost. The update requires that the service cost component of net benefit costs be reported in the same line in the income statement as other compensation costs and that the other components of net benefit costs be presented separately from the service cost component. Additionally, only the service cost component of net benefit costs will be eligible for capitalization. Imperial will adopt the update beginning January 1, 2018. As a result of Imperial’s adoption of the update, the company expects to add a new lineNon-service pension and other postretirement benefit expense to its consolidated statement of income. This line would reflect the other components of net benefit costs as described in the Accounting Standards Update and would include amounts that were previously included in Production and manufacturing expenses, and Selling and general expenses. As of January 1, 2018, these costs will no longer be considered for capitalization. The impact from this change on the company’s net income is not expected to be material. Furthermore, as part of the adoption of the update, the company expects it will include all of these costs in its Corporate and Other expenses.IMPERIAL OIL LIMITED Three Months to March 31millions of Canadian dollars 2024 2023 Amortization of postretirement benefits liability adjustment included in net benefit cost (a)(17) (13) (a) This accumulated other comprehensive income component is included in the computation of net benefit cost (note 4). Income tax expense (credit) for components of other comprehensive income (loss): Three Months to March 31millions of Canadian dollars 2024 2023 Postretirement benefits liability adjustments: Postretirement benefits liability adjustment (excluding amortization) 1 7 Amortization of postretirement benefits liability adjustment included in net benefit cost5 3 Total 6 10 16IMPERIAL OIL LIMITED Item 2.Item 2. Management’s discussion and analysis of financial condition and results of operations
Operating results
Third quarter 2017 vs. third quarter 2016
The company’s of operations
| IMPERIAL OIL LIMITED | ||||||||
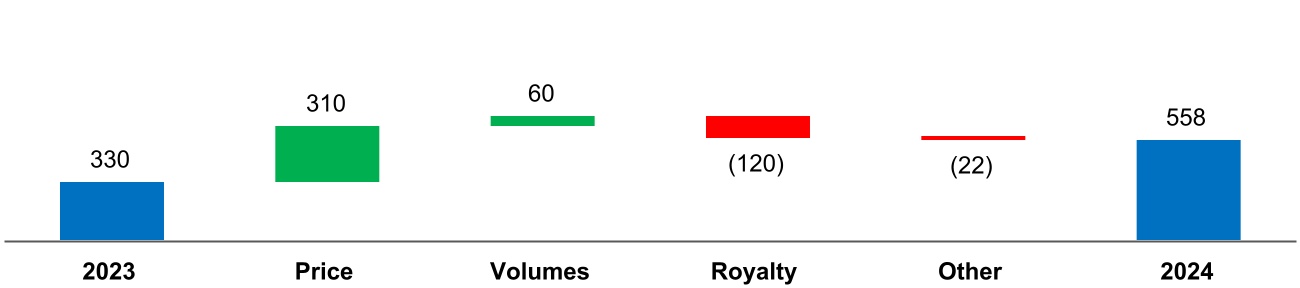
Upstream recorded net incomenarrow in the thirdfirst quarter, of $62 million, compared to a net loss of $26 million in the same period of 2016. Results in the third quarter of 2017 reflected the impact of higher Canadian crude oil realizations of about $190 million and higher Kearl volumes of about $50 million. These impacts were partially offset by lower Syncrude and conventional volumes of about $80 million, including the absence of production at Norman Wells, and higher royalties of about $50 million.
West Texas Intermediate (WTI) averaged US$48.23 per barrel in the third quarter of 2017, up from US$44.94 per barrel in the same quarter of 2016. Western Canada Select (WCS) averaged US$38.29 per barrel and US$31.43 per barrel respectively for the same periods. The WTI / WCS differential narrowed to 21 percent in the third quarter of 2017, from 30 percent in the same period of 2016.
The Canadian dollar averaged US$0.80 in the third quarter of 2017, an increase of US$0.03 from the third quarter of 2016.
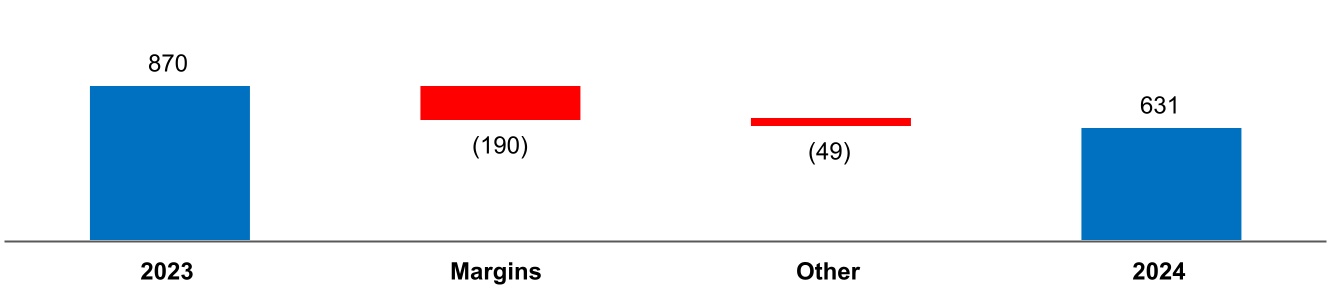
Imperial’s average Canadian dollar realizations for bitumen and synthetic crudes increased generallybut remained in line with the North American benchmarks, adjusted for changes2023 full year average. Refining margins improved in exchange ratesthe first quarter of 2024 primarily driven by industry downtime and transportation costs. Bitumensupply disruptions.
| First Quarter | ||||||||
| millions of Canadian dollars, unless noted | 2024 | 2023 | ||||||
Net income (loss) (U.S. GAAP) | 1,195 | 1,248 | ||||||
Net income (loss) per common share, assuming dilution (dollars) | 2.23 | 2.13 | ||||||
| First Quarter | ||||||||
| Canadian dollars, unless noted | 2024 | 2023 | ||||||
West Texas Intermediate (US$ per barrel) | 76.86 | 75.98 | ||||||
Western Canada Select (US$ per barrel) | 57.50 | 51.42 | ||||||
WTI/WCS Spread (US$ per barrel) | 19.36 | 24.56 | ||||||
Bitumen (per barrel) | 66.56 | 50.33 | ||||||
Synthetic crude oil (per barrel) | 93.51 | 102.45 | ||||||
Average foreign exchange rate (US$) | 0.74 | 0.74 | ||||||
| IMPERIAL OIL LIMITED | ||||||||
| First Quarter | ||||||||
| thousands of barrels per day | 2024 | 2023 | ||||||
Kearl (Imperial's share) | 196 | 184 | ||||||
| Cold Lake | 142 | 141 | ||||||
Syncrude (a) | 73 | 76 | ||||||
Kearl total gross production (thousands of barrels per day) | 277 | 259 | ||||||
Gross2023, Syncrude gross production of Cold Lake bitumen averaged 163,000included about 2 thousand barrels per day in the third quarter, up from 157,000 barrels per day in the same period last year. The higher production was mainly dueof bitumen and other products that were exported to the timing of the steam cycles.
Gross production of Kearl bitumen averaged 182,000 barrels per day in the third quarter (129,000 barrels Imperial’s share) up from 159,000 barrels per day (113,000 barrels Imperial’s share) during the third quarter of 2016. operator's facilities using an existing interconnect pipeline.
The company’s shareCanadian dollars
| First Quarter | ||||||||
| thousands of barrels per day, unless noted | 2024 | 2023 | ||||||
| Refinery throughput | 407 | 417 | ||||||
Refinery capacity utilization (percent) | 94 | 96 | ||||||
| Petroleum product sales | 450 | 455 | ||||||
| IMPERIAL OIL LIMITED | ||||||||
| First Quarter | ||||||||
| millions of Canadian dollars | 2024 | 2023 | ||||||
Net income (loss) (U.S. GAAP) | (51) | (5) | ||||||
| First Quarter | ||||||||
| millions of Canadian dollars | 2024 | 2023 | ||||||
| Cash flows from (used in): | ||||||||
| Operating activities | 1,076 | (821) | ||||||
| Investing activities | (481) | (414) | ||||||
| Financing activities | (283) | (271) | ||||||
| Increase (decrease) in cash and cash equivalents | 312 | (1,506) | ||||||
| Cash and cash equivalents at period end | 1,176 | 2,243 | ||||||
Downstream net income was $292 million in the third quarter, compared to $1,002 million in the same period of 2016. Earnings decreased mainly due to the absence of a $716 million gain from the sale of company-owned retail sites and higher refining turnaround activity of about $100 million. These factors were partly offset by higher refining margins of about $140 million.
Refinery throughput averaged 385,000 barrels per day, compared to 407,000 barrels per day in the third quarter of 2016. Reduced throughput reflects increased turnaround activity associated with the Nanticoke refinery in the third quarter 2017.
Petroleum product sales were 500,000 barrels per day, compared to 505,000 barrels per day in the third quarter of 2016.
IMPERIAL OIL LIMITED
Chemical net income was $52 million in the third quarter, compared to $56 million in the same quarter of 2016.
Net income effects from Corporate and Other were negative $35 million in the third quarter, compared to negative $29 million in the same period of 2016.
IMPERIAL OIL LIMITED
Nine months 2017 vs. nine months 2016
Net income in the first nine months of 2017 was $627 million, or $0.74per-share on a diluted basis versus net income of $721 million or $0.85 per-share in the first nine months of 2016.
Upstream recorded a net loss of $225 million in the first nine months of 2017, compared to a net loss of $764 million from the same period of 2016. Results reflected the impact of higher Canadian crude oil realizations of about $940 million and higher Kearl volumes of about $50 million. These impacts were partially offset by higher royalties of about $150 million, lower Syncrude and conventional volumes of about $130 million, including the absence of production at Norman Wells, higher energy costs of about $90 million, and higher operating expenses at Syncrude of about $90 million.
West Texas Intermediate averaged US$49.40 per barrel in the first nine months of 2017, up from US$41.54 per barrel in the same period of 2016. Western Canada Select averaged US$37.57 per barrel and US$27.74 per barrel respectively for the same periods. The WTI / WCS differential narrowed to 24 percent in the first nine months of 2017, from 33 percent in the same period of 2016.
During the first nine months of 2017, the Canadian dollar strengthened relative to the US dollar versus the same period of 2016. The Canadian dollar averaged US$0.77 in the first nine months of 2017, an increase of about US$0.01 from the same period of 2016.
Imperial’s average Canadian dollar realizations for bitumen and synthetic crudes increased generally in line with the North American benchmarks, adjusted for changes in the exchange rate and transportation costs. Bitumen realizations averaged $37.82 per barrel for the first nine months of 2017, an increase of $14.05 per barrel versus the same period of 2016. Synthetic crude realizations averaged $64.37 per barrel, an increase of $10.92 per barrel from the same period of 2016.
Gross production of Cold Lake bitumen averaged 161,000 barrels per day in the first nine months of 2017, compared to 162,000 barrels per day from the same period of 2016.
Gross production of Kearl bitumen averaged 179,000 barrels per day in the first nine months of 2017 (127,000 barrels Imperial’s share) up from 169,000 barrels per day (120,000 barrels Imperial’s share) from the same period of 2016. Increased 2017 production reflects improved reliability associated with the mining and ore preparation operations.
During the first nine months of 2017, the company’s share of gross production from Syncrude averaged 56,000 barrels per day, compared to 61,000 barrels per day from the same period of 2016. Syncrude year to date production was impacted by the March 2017 fire at the Syncrude Mildred Lake upgrader and planned maintenance. In 2016, production was impacted by the Alberta wildfires and planned maintenance.
Downstream net income was $750 million, compared to $1,393 million from the same period of 2016. Earnings decreased mainly due to the absence of a $719 million gain from the sale of company-owned retail sites and lower marketing margins of approximately $170 million associated with the impact of the retail divestment. These factors were partially offset by a gain of $151 million from the sale of a surplus property and higher industry refining margins of about $90 million.
Refinery throughput averaged 381,000 barrels per day in the first nine months of 2017, up from 351,000 barrels per day from the same period of 2016. Capacity utilization increased to 90 percent from 83 percent in the same period of 2016, reflecting reduced turnaround maintenance activity.
Petroleum product sales were 492,000 barrels per day in the first nine months of 2017, up from 481,000 barrels per day from the same period of 2016. Sales growth continues to be driven by strong collaboration across our downstream value chain and the expansion of Imperial’s wholesale, industrial and commercial networks.
Chemical net income was $161 million, up from $160 million from the same period of 2016.
IMPERIAL OIL LIMITED
For the first nine months of 2017, net income effects from Corporate and Other were negative $59 million, versus negative $68 million from the same period of 2016.
IMPERIAL OIL LIMITED
Liquidity and capital resources
Cash flow generated from operating activities was $837 million in the third quarter, compared with $772 million in the corresponding period in 2016.
Investing activities used net cash of $234 million in the third quarter, compared with $1,005 million cash generated from investing activities in the same period of 2016, reflecting lower proceeds from asset sales.
Cash used in financing activities was $393 million in the third quarter, compared with $1,724 million in the third quarter of 2016, reflecting the absence of debt repayments. Dividends paid in the third quarter of 2017 were $136 million. Theper-share dividend paid in the third quarter was $0.16, up from $0.15 in the same period of 2016. In the second quarter of 2017, Imperial resumed share purchases under its share buyback program. During the third quarter, the company purchased about 6.7 million shares for approximately $250 million.
The company’s cash balance was $833 million at September 30, 2017, versus $248 million at the end of the third quarter of 2016.
Cash flow generated from operating activities was $1,683 million in the first nine months of 2017, compared with $1,264 million in 2016, reflecting higher earnings, excluding the impact of asset sales, partially offset by unfavourable working capital effects.
Investing activities used net cashimpacts related to an income tax catch-up payment of $454 million$2.1 billion in the first nine months of 2017, compared with cash generated fromprior year.
| First Quarter | ||||||||
| millions of Canadian dollars, unless noted | 2024 | 2023 | ||||||
| Dividends paid | 278 | 266 | ||||||
Per share dividend paid (dollars) | 0.50 | 0.44 | ||||||
Share repurchases (a) | — | — | ||||||
Number of shares purchased (millions) (a) | — | — | ||||||
During the first nine months of 20172024, the company purchasedentered into a long-term purchase agreement with a third party for about 10 million shares for $377 million, including shares purchased from Exxon Mobil Corporation.
Recently issued accounting standards
In May 2014,$2 billion. It has no material impact on the Financial Accounting Standards Board (FASB) issued a new standard,Revenue from Contracts with Customers. The standard establishes a single revenue recognition model for all contracts with customers, eliminates industry specific requirements2024 and expands disclosure requirements. The standard is required to be adopted beginning January 1, 2018.2025 obligations disclosed in Imperial's 2023 annual report on Form 10-K. The company expectsdoes not believe that the increased obligation will have a material effect on Imperial's operations, financial condition or financial statements.
| IMPERIAL OIL LIMITED | ||||||||
In February 2016, the FASB issued a new standard, Leases. The standard requires all leases with an initial term greater than one year be recorded
IMPERIAL OIL LIMITED
In March 2017, the FASB issued an Accounting Standards Update2017-07, Compensation – Retirement Benefits (Topic 715):Improving the Presentation of Net Periodic Pension Cost and Net Periodic Postretirement Benefit Cost. The update requires that the service cost component of net benefit costs be reported in the same line in the income statement as other compensation costs and that the other components of net benefit costs be presented separately from the service cost component. Additionally, only the service cost component of net benefit costs will be eligible for capitalization. Imperial will adopt the update beginning January 1, 2018. As a result of Imperial’s adoption of the update, the company expects to add a new lineNon-service pension and other postretirement benefit expense to its consolidated statement of income. This line would reflect the other components of net benefit costs as described in the Accounting Standards Update and would include amounts that were previously included in Production and manufacturing expenses, and Selling and general expenses. As of January 1, 2018, these costs will no longer be considered for capitalization. The impact from this change on the company’s net income is not expected to be material. Furthermore, as part of the adoption of the update, the company expects it will include all of these costs in its Corporate and Other expenses.
Forward-looking statements
Statements in this report regarding future events or conditions are forward-looking statements.made. Actual future financial and operating results, including expectations and assumptions concerning future energy demand, supply and mix; production rates, growth and mix across various assets; project plans, timing, costs, technical evaluations and capacities and the company’s ability to effectively execute on these plans and operate its assets, including the Cold Lake Grand Rapids Phase 1 project and the Strathcona renewable diesel project; capital and environmental expenditures; the ability to offset any ongoing inflationary pressures; and commodity prices, foreign exchange rates and general market conditions, could differ materially duedepending on a number of factors.
IMPERIAL OIL LIMITED
| IMPERIAL OIL LIMITED | ||||||||
Item 3. Quantitative and qualitative disclosures about market riskInformation about market risks for the ninethree months ended September 30, 2017,March 31, 2024, does not differ materially from that discussed on page 2234 of the company’s annual report on Form10-K for the year ended December 31, 2016.2023.
There has not been any change in the company’s internal control over financial reporting during the last fiscal quarter that has materially affected, or is reasonably likely to materially affect, the company’s internal control over financial reporting.Item 4. Controls and proceduresAs indicated in the certifications in Exhibit 31 of this report, the company’s principal executive officer and principal financial officer have evaluated the company’s disclosure controls and procedures as of September 30, 2017.March 31, 2024. Based on that evaluation, these officers have concluded that the company’s disclosure controls and procedures are effective in ensuring that information required to be disclosed by the company in the reports that it files or submits under the Securities Exchange Act of 1934, as amended, is accumulated and communicated to them in a manner that allows for timely decisions regarding required disclosures and are effective in ensuring that such information is recorded, processed, summarized and reported within the time periods specified in the Securities and Exchange Commission’s rules and forms.IMPERIAL OIL LIMITED22IMPERIAL OIL LIMITED PART II. OTHER INFORMATIONItem 1. Legal proceedingsImperial has elected to use a $1 million (U.S. dollars) threshold for disclosing environmental proceedings.
Total number of Average price Total number of Maximum number July 2017 (Jul 1 – Jul 31) August 2017 (Aug 1 – Aug 31) September 2017 (Sept 1 – Sept 30) Item 2. Unregistered sales of equity securities and use of proceedsIssuer purchases of equity securities
shares purchased
paid per share
(dollars)
shares purchased
as part of publicly
announced plans
or programs
of shares that may
yet be purchased
under the plans or
programs(a) - - - 25,395,927 3,876,648 36.42 3,876,648 21,519,279 2,855,022 38.10 2,855,022 18,664,257 (b) (a)On June 22, 2017, the company announced by news release that it had received final approval from the Toronto Stock Exchange for a new normal course issuer bid and will continue its existing share purchase program. The program enables the company to purchase up to a maximumTotal number of 25,395,927 common shares during the period June 27, 2017 to June 26, 2018, which includes shares purchasedAverage price paidper share(Canadian dollars)Total number ofshares purchasedas part of publiclyannounced plansor programsMaximum number
of shares that may
yet be purchased
under the normal course issuer bid and from Exxon Mobil Corporation concurrent with, but outside of the normal course issuer bid. As in the past, Exxon Mobil Corporation has advised the company that it intends to participate to maintain its ownership percentage at approximately 69.6 percent. The program will end should the company purchase the maximum allowable number of shares,plans or on June 26, 2018.
programs (a)(b)January 2024In its most recent quarterly earnings release, the company stated that fourth quarter 2017 share purchases are anticipated to equal approximately $250 million. Purchase plans may be modified at any time without prior notice.(January 1 - January 31) — — — — February 2024 (February 1 - February 29) — — — — March 2024 (March 1 - March 31) — — — — The(a)On June 27, 2023, the company willannounced by news release that it had received final approval from the Toronto Stock Exchange for a new normal course issuer bid and to continue to evaluate its existing share purchase program. The program enabled the company to purchase up to a maximum of 29,207,635 common shares during the period June 29, 2023 to June 28, 2024. This maximum included shares purchased under the normal course issuer bid and from Exxon Mobil Corporation concurrent with, but outside of, the normal course issuer bid. As in the contextpast, Exxon Mobil Corporation advised the company that it intended to participate to maintain its ownership percentage at approximately 69.6 percent. The program ended on October 19, 2023 as a result of its overall capital activities.IMPERIAL OIL LIMITEDItem 5. Other informationDuring the three months ended March 31, 2024, none of the company's directors or officers adopted or terminated a "Rule 10b5-1 trading arrangement" or "non-Rule 10b5-1 trading arrangement," as each term is defined in Item 408(a) of Regulation S-K.23IMPERIAL OIL LIMITED Item 6.Exhibits
IMPERIAL OIL LIMITED
| IMPERIAL OIL LIMITED | ||||||||
Imperial Oil Limited
| ||||||||||
| (Registrant) | ||||||||||
| Date: | April 29, 2024 | /s/ | Daniel E. Lyons | |||||||
| (Signature) | ||||||||||
| Daniel E. Lyons | ||||||||||
| Senior administration, and | controller | |||||||||
| (Principal | accounting officer) | |||||||||
| Date: | April 29, 2024 | /s/ Cathryn Walker | ||||||||
| (Signature) | ||||||||||
| Cathryn Walker | ||||||||||
| Assistant | corporate secretary | |||||||||
24