(Mark One)
| x | Quarterly Report pursuant to Section 13 or 15(d) of the Securities Exchange Act of 1934 |
| For the quarterly period ended March 31, 2019 | |
For the quarterly period ended September 30, 2017
| ¨ | Transition Report pursuant to Section 13 or 15(d) of the Securities Exchange Act of 1934 |
For the transition period fromto
| Massachusetts | 04-2787865 | |
(State or other jurisdiction of incorporation or organization) | (IRS Employer Identification No.) | |
| ||
| One Rogers Street, Cambridge, MA | 02142-1209 | |
| (Address of principal executive offices) | (Zip Code) | |
Large accelerated filerx | Accelerated filer¨ | |||||
Non-accelerated filer¨ | Smaller reporting company¨ | |||||
Emerging growth company | ||||||
| Title of each class | Trading Symbol(s) | Name of each exchange on which registered |
| Common Stock, $.01 par value per share | PEGA | NASDAQ Global Select Market |
May 1, 2019.
Index to Form
| Page | ||||
| ||||
Item 1. Unaudited Condensed Consolidated Financial Statements | ||||
| 2018 | ||||
| 2018 | ||||
| 2018 | ||||
Unaudited Condensed Consolidated Statements of Stockholders’ Equity for the three months ended March 31, 2019 and 2018 | ||||
| Unaudited Condensed Consolidated Statements of Cash Flows for the | ||||
Notes to Unaudited Condensed Consolidated Financial Statements | ||||
Item 2. Management’s Discussion and Analysis of Financial Condition and Results of Operations | ||||
Item 3. Quantitative and Qualitative Disclosures About Market Risk | ||||
| PART II - OTHER INFORMATION | ||||
| ||||
Item 2. Unregistered Sales of Equity Securities and Use of Proceeds | ||||
| Item 6. Exhibits | ||||
| Signature | ||||
| September 30, 2017 | December 31, 2016 | |||||||
Assets | ||||||||
Current assets: | ||||||||
Cash and cash equivalents | $ | 130,568 | $ | 70,594 | ||||
Marketable securities | 63,812 | 63,167 | ||||||
|
|
|
| |||||
Total cash, cash equivalents, and marketable securities | 194,380 | 133,761 | ||||||
Trade accounts receivable, net of allowance of $6,189 and $4,126 | 191,161 | 265,028 | ||||||
Income taxes receivable | 34,864 | 14,155 | ||||||
Other current assets | 17,679 | 12,188 | ||||||
|
|
|
| |||||
Total current assets | 438,084 | 425,132 | ||||||
Property and equipment, net | 39,849 | 38,281 | ||||||
Deferred income taxes | 73,459 | 69,898 | ||||||
Long-term other assets | 5,982 | 3,990 | ||||||
Intangible assets, net | 34,755 | 44,191 | ||||||
Goodwill | 72,941 | 73,164 | ||||||
|
|
|
| |||||
Total assets | $ | 665,070 | $ | 654,656 | ||||
|
|
|
| |||||
Liabilities and Stockholders’ Equity | ||||||||
Current liabilities: | ||||||||
Accounts payable | $ | 12,535 | $ | 14,414 | ||||
Accrued expenses | 39,681 | 36,751 | ||||||
Accrued compensation and related expenses | 53,869 | 60,660 | ||||||
Deferred revenue | 160,931 | 175,647 | ||||||
|
|
|
| |||||
Total current liabilities | 267,016 | 287,472 | ||||||
Income taxes payable | 4,774 | 4,263 | ||||||
Long-term deferred revenue | 6,130 | 10,989 | ||||||
Other long-term liabilities | 15,449 | 16,043 | ||||||
|
|
|
| |||||
Total liabilities | 293,369 | 318,767 | ||||||
|
|
|
| |||||
Stockholders’ equity: | ||||||||
Preferred stock, 1,000 shares authorized; no shares issued and outstanding | — | — | ||||||
Common stock, 200,000 shares authorized; 77,839 shares and 76,591 shares issued and outstanding | 778 | 766 | ||||||
Additionalpaid-in capital | 146,728 | 143,903 | ||||||
Retained earnings | 227,953 | 198,315 | ||||||
Accumulated other comprehensive loss | (3,758 | ) | (7,095 | ) | ||||
|
|
|
| |||||
Total stockholders’ equity | 371,701 | 335,889 | ||||||
|
|
|
| |||||
Total liabilities and stockholders’ equity | $ | 665,070 | $ | 654,656 | ||||
|
|
|
| |||||
| March 31, 2019 | December 31, 2018 | ||||||
| Assets | |||||||
| Current assets: | |||||||
| Cash and cash equivalents | $ | 110,367 | $ | 114,422 | |||
| Marketable securities | 91,804 | 93,001 | |||||
| Total cash, cash equivalents, and marketable securities | 202,171 | 207,423 | |||||
| Accounts receivable | 135,352 | 180,872 | |||||
| Unbilled receivables | 161,480 | 172,656 | |||||
| Other current assets | 63,731 | 49,684 | |||||
| Total current assets | 562,734 | 610,635 | |||||
| Long-term unbilled receivables | 130,494 | 151,237 | |||||
| Goodwill | 72,898 | 72,858 | |||||
| Other long-term assets | 190,433 | 147,823 | |||||
| Total assets | $ | 956,559 | $ | 982,553 | |||
| Liabilities and stockholders’ equity | |||||||
| Current liabilities: | |||||||
| Accounts payable | $ | 11,559 | $ | 16,487 | |||
| Accrued expenses | 40,947 | 45,506 | |||||
| Accrued compensation and related expenses | 56,349 | 84,671 | |||||
| Deferred revenue | 180,845 | 185,145 | |||||
| Other current liabilities | 12,447 | — | |||||
| Total current liabilities | 302,147 | 331,809 | |||||
| Operating lease liabilities | 45,325 | — | |||||
| Deferred income tax liabilities | 8,319 | 6,939 | |||||
| Other long-term liabilities | 12,339 | 22,274 | |||||
| Total liabilities | 368,130 | 361,022 | |||||
| Stockholders’ equity: | |||||||
| Preferred stock, 1,000 shares authorized; none issued | — | — | |||||
Common stock, 200,000 shares authorized; 78,896 and 78,526 shares issued and outstanding at March 31, 2019 and December 31, 2018, respectively | 789 | 785 | |||||
| Additional paid-in capital | 119,182 | 123,205 | |||||
| Retained earnings | 479,779 | 510,863 | |||||
| Accumulated other comprehensive loss | (11,321 | ) | (13,322 | ) | |||
| Total stockholders’ equity | 588,429 | 621,531 | |||||
| Total liabilities and stockholders’ equity | $ | 956,559 | $ | 982,553 | |||
| Three Months Ended September 30, | Nine Months Ended September 30, | |||||||||||||||
| 2017 | 2016 | 2017 | 2016 | |||||||||||||
Revenue: | ||||||||||||||||
Software license | $ | 41,793 | $ | 68,833 | $ | 195,220 | $ | 207,849 | ||||||||
Maintenance | 62,204 | 55,038 | 180,759 | 163,174 | ||||||||||||
Services | 75,818 | 58,931 | 225,063 | 179,633 | ||||||||||||
|
|
|
|
|
|
|
| |||||||||
Total revenue | 179,815 | 182,802 | 601,042 | 550,656 | ||||||||||||
|
|
|
|
|
|
|
| |||||||||
Cost of revenue: | ||||||||||||||||
Software license | 1,276 | 1,313 | 3,826 | 3,646 | ||||||||||||
Maintenance | 6,716 | 6,659 | 20,945 | 18,889 | ||||||||||||
Services | 61,739 | 52,465 | 180,925 | 154,512 | ||||||||||||
|
|
|
|
|
|
|
| |||||||||
Total cost of revenue | 69,731 | 60,437 | 205,696 | 177,047 | ||||||||||||
|
|
|
|
|
|
|
| |||||||||
Gross profit | 110,084 | 122,365 | 395,346 | 373,609 | ||||||||||||
|
|
|
|
|
|
|
| |||||||||
Operating expenses: | ||||||||||||||||
Selling and marketing | 70,209 | 67,032 | 217,384 | 202,126 | ||||||||||||
Research and development | 41,031 | 38,036 | 121,089 | 108,530 | ||||||||||||
General and administrative | 13,133 | 11,725 | 38,174 | 34,067 | ||||||||||||
Acquisition-related | — | 74 | — | 2,903 | ||||||||||||
|
|
|
|
|
|
|
| |||||||||
Total operating expenses | 124,373 | 116,867 | 376,647 | 347,626 | ||||||||||||
|
|
|
|
|
|
|
| |||||||||
(Loss)/income from operations | (14,289 | ) | 5,498 | 18,699 | 25,983 | |||||||||||
Foreign currency transaction (loss)/gain | (552 | ) | 1,082 | (793 | ) | 2,764 | ||||||||||
Interest income, net | 144 | 172 | 470 | 650 | ||||||||||||
Other income/(expense), net | — | (1,237 | ) | 287 | (4,891 | ) | ||||||||||
|
|
|
|
|
|
|
| |||||||||
(Loss)/income before (benefit)/provision for income taxes | (14,697 | ) | 5,515 | 18,663 | 24,506 | |||||||||||
(Benefit)/provision for income taxes | (12,885 | ) | 2,214 | (17,952 | ) | 6,269 | ||||||||||
|
|
|
|
|
|
|
| |||||||||
Net (loss)/income | $ | (1,812 | ) | $ | 3,301 | $ | 36,615 | $ | 18,237 | |||||||
|
|
|
|
|
|
|
| |||||||||
(Loss)/earnings per share: | ||||||||||||||||
Basic | (0.03 | ) | 0.04 | 0.47 | 0.24 | |||||||||||
Diluted | (0.03 | ) | 0.04 | 0.44 | 0.23 | |||||||||||
Weighted-average number of common shares outstanding: | ||||||||||||||||
Basic | 77,691 | 76,278 | 77,258 | 76,323 | ||||||||||||
Diluted | 77,691 | 79,548 | 82,717 | 79,401 | ||||||||||||
Cash dividends declared per share | $ | 0.03 | $ | 0.03 | $ | 0.09 | $ | 0.09 | ||||||||
| Three Months Ended March 31, | |||||||
| 2019 | 2018 | ||||||
| Revenue | |||||||
| Software license | $ | 63,264 | $ | 87,773 | |||
| Maintenance | 67,706 | 64,525 | |||||
| Services | 81,576 | 82,884 | |||||
| Total revenue | 212,546 | 235,182 | |||||
| Cost of revenue | |||||||
| Software license | 1,378 | 1,255 | |||||
| Maintenance | 6,335 | 6,082 | |||||
| Services | 66,724 | 68,277 | |||||
| Total cost of revenue | 74,437 | 75,614 | |||||
| Gross profit | 138,109 | 159,568 | |||||
| Operating expenses | |||||||
| Selling and marketing | 108,865 | 88,383 | |||||
| Research and development | 50,596 | 46,785 | |||||
| General and administrative | 12,676 | 16,464 | |||||
| Total operating expenses | 172,137 | 151,632 | |||||
| (Loss) income from operations | (34,028 | ) | 7,936 | ||||
| Foreign currency transaction loss | (3,712 | ) | (1,085 | ) | |||
| Interest income, net | 723 | 764 | |||||
| Other income, net | — | 363 | |||||
| (Loss) income before benefit from income taxes | (37,017 | ) | 7,978 | ||||
| Benefit from income taxes | (8,300 | ) | (4,222 | ) | |||
| Net (loss) income | $ | (28,717 | ) | $ | 12,200 | ||
| (Loss) earnings per share | |||||||
| Basic | $ | (0.37 | ) | $ | 0.16 | ||
| Diluted | $ | (0.37 | ) | $ | 0.15 | ||
| Weighted-average number of common shares outstanding | |||||||
| Basic | 78,584 | 78,236 | |||||
| Diluted | 78,584 | 83,102 | |||||
| Three Months Ended September 30, | Nine Months Ended September 30, | |||||||||||||||
| 2017 | 2016 | 2017 | 2016 | |||||||||||||
Net (loss)/income | $ | (1,812 | ) | $ | 3,301 | $ | 36,615 | $ | 18,237 | |||||||
Other comprehensive income/(loss), net of tax | ||||||||||||||||
Unrealized gain/(loss) onavailable-for-sale marketable securities, net of tax | 22 | (174 | ) | 148 | 168 | |||||||||||
Foreign currency translation adjustments | 549 | (169 | ) | 3,189 | (1,400 | ) | ||||||||||
|
|
|
|
|
|
|
| |||||||||
Total other comprehensive income/(loss), net of tax | 571 | (343 | ) | 3,337 | (1,232 | ) | ||||||||||
|
|
|
|
|
|
|
| |||||||||
Comprehensive (loss)/income | $ | (1,241 | ) | $ | 2,958 | $ | 39,952 | $ | 17,005 | |||||||
|
|
|
|
|
|
|
| |||||||||
| Three Months Ended March 31, | |||||||
| 2019 | 2018 | ||||||
| Net (loss) income | $ | (28,717 | ) | $ | 12,200 | ||
| Other comprehensive income, net of tax | |||||||
| Unrealized gain (loss) on available-for-sale marketable securities, net of tax | 374 | (188 | ) | ||||
| Foreign currency translation adjustments | 1,627 | 4,450 | |||||
| Total other comprehensive income, net of tax | 2,001 | 4,262 | |||||
| Comprehensive (loss) income | $ | (26,716 | ) | $ | 16,462 | ||
STOCKHOLDERS’ EQUITY
| Nine Months Ended September 30, | ||||||||
| 2017 | 2016 | |||||||
Operating activities: | ||||||||
Net income | $ | 36,615 | $ | 18,237 | ||||
Adjustments to reconcile net income to cash provided by operating activities: | ||||||||
Deferred income taxes | (2,607 | ) | (2,841 | ) | ||||
Depreciation and amortization | 18,703 | 17,896 | ||||||
Stock-based compensation expense | 39,929 | 30,634 | ||||||
Foreign currency transaction loss/(gain) | 793 | (2,764 | ) | |||||
Othernon-cash | (89 | ) | 153 | |||||
Change in operating assets and liabilities: | ||||||||
Trade accounts receivable | 80,580 | 3,940 | ||||||
Income taxes receivable and other current assets | (25,943 | ) | (11,904 | ) | ||||
Accounts payable and accrued expenses | (8,546 | ) | (16,678 | ) | ||||
Deferred revenue | (25,639 | ) | (17,698 | ) | ||||
Other long-term assets and liabilities | 130 | 1,581 | ||||||
|
|
|
| |||||
Cash provided by operating activities | 113,926 | 20,556 | ||||||
Investing activities: | ||||||||
Purchases of marketable securities | (25,687 | ) | (22,614 | ) | ||||
Proceeds from maturities and called marketable securities | 23,124 | 21,838 | ||||||
Sales of marketable securities | — | 62,283 | ||||||
Payments for acquisitions, net of cash acquired | (297 | ) | (49,113 | ) | ||||
Investment in property and equipment | (9,106 | ) | (15,253 | ) | ||||
|
|
|
| |||||
Cash used in investing activities | (11,966 | ) | (2,859 | ) | ||||
Financing activities: | ||||||||
Dividend payments to shareholders | (6,941 | ) | (6,883 | ) | ||||
Common stock repurchases for tax withholdings for net settlement of equity awards | (34,113 | ) | (10,398 | ) | ||||
Common stock repurchases under share repurchase programs | (2,986 | ) | (25,750 | ) | ||||
|
|
|
| |||||
Cash used in financing activities | (44,040 | ) | (43,031 | ) | ||||
Effect of exchange rates on cash and cash equivalents | 2,054 | (1,309 | ) | |||||
|
|
|
| |||||
Net increase/(decrease) in cash and cash equivalents | 59,974 | (26,643 | ) | |||||
Cash and cash equivalents, beginning of period | 70,594 | 93,026 | ||||||
|
|
|
| |||||
Cash and cash equivalents, end of period | $ | 130,568 | $ | 66,383 | ||||
|
|
|
| |||||
thousands, except per share amounts)
| Common Stock | Additional Paid-In Capital | Retained Earnings | Accumulated Other Comprehensive (Loss) Income | Total Stockholders’ Equity | ||||||||||||||||||
| Number of Shares | Amount | |||||||||||||||||||||
| December 31, 2017 | 78,081 | $ | 781 | $ | 152,097 | $ | 509,697 | $ | (6,705 | ) | $ | 655,870 | ||||||||||
| Repurchase of common stock | (101 | ) | (1 | ) | (5,688 | ) | — | — | (5,689 | ) | ||||||||||||
| Issuance of common stock for share-based compensation plans | 566 | 5 | (15,556 | ) | — | — | (15,551 | ) | ||||||||||||||
| Stock-based compensation | — | — | 15,109 | — | — | 15,109 | ||||||||||||||||
| Cash dividends declared ($0.12 per share) | — | — | — | (2,355 | ) | — | (2,355 | ) | ||||||||||||||
| Other comprehensive income | — | — | — | — | 4,262 | 4,262 | ||||||||||||||||
| Net income | — | — | — | 12,200 | — | 12,200 | ||||||||||||||||
| March 31, 2018 | 78,546 | $ | 785 | $ | 145,962 | $ | 519,542 | $ | (2,443 | ) | $ | 663,846 | ||||||||||
| December 31, 2018 | 78,526 | 785 | 123,205 | 510,863 | (13,322 | ) | 621,531 | |||||||||||||||
| Repurchase of common stock | (144 | ) | (1 | ) | (7,586 | ) | — | — | (7,587 | ) | ||||||||||||
| Issuance of common stock for share-based compensation plans | 514 | 5 | (14,843 | ) | — | — | (14,838 | ) | ||||||||||||||
| Stock-based compensation | — | — | 18,406 | — | — | 18,406 | ||||||||||||||||
| Cash dividends declared ($0.12 per share) | — | — | — | (2,367 | ) | — | (2,367 | ) | ||||||||||||||
| Other comprehensive income | — | — | — | — | 2,001 | 2,001 | ||||||||||||||||
| Net loss | — | — | — | (28,717 | ) | (28,717 | ) | |||||||||||||||
| March 31, 2019 | 78,896 | $ | 789 | $ | 119,182 | $ | 479,779 | $ | (11,321 | ) | $ | 588,429 | ||||||||||
| Three Months Ended March 31, | |||||||
| 2019 | 2018 | ||||||
| Operating activities: | |||||||
| Net (loss) income | $ | (28,717 | ) | $ | 12,200 | ||
| Adjustments to reconcile net (loss) income to cash provided by operating activities: | |||||||
| Stock-based compensation | 18,350 | 15,109 | |||||
| Amortization and depreciation | 18,774 | 10,322 | |||||
| Foreign currency transaction loss | 3,712 | 1,085 | |||||
| Other non-cash | 1,471 | 1,137 | |||||
| Change in operating assets and liabilities, net | 9,113 | 15,802 | |||||
| Cash provided by operating activities | 22,703 | 55,655 | |||||
| Investing activities: | |||||||
| Purchases of investments | (7,224 | ) | (35,204 | ) | |||
| Proceeds from maturities and called investments | 8,548 | 5,995 | |||||
| Other | (2,790 | ) | (2,069 | ) | |||
| Cash used in investing activities | (1,466 | ) | (31,278 | ) | |||
| Financing activities: | |||||||
| Dividend payments to shareholders | (2,363 | ) | (2,344 | ) | |||
| Common stock repurchases | (23,224 | ) | (20,708 | ) | |||
| Cash used in financing activities | (25,587 | ) | (23,052 | ) | |||
| Effect of exchange rate changes on cash and cash equivalents | 295 | 2,186 | |||||
| Net (decrease) increase in cash and cash equivalents | (4,055 | ) | 3,511 | ||||
| Cash and cash equivalents, beginning of period | 114,422 | 162,279 | |||||
| Cash and cash equivalents, end of period | $ | 110,367 | $ | 165,790 | |||
2018.
2019.
Stock-Based Compensation
Financial Instruments
In June 2016, the FASB issued ASUNo. 2016-13, “Financial Instruments—Instruments - Credit Losses (Topic 326): Measurement of Credit Losses on Financial Instruments,” which requires measurement and recognition of expected credit losses for financial assets measured at amortized cost, including trade accounts receivable, upon initial recognition of that financial asset using a forward-looking expected loss model, rather than an incurred loss model for credit losses.model. Credit losses relating toavailable-for-sale debt securities should be recorded through an allowance for credit losses when the fair value is below the amortized cost of the asset, removing the concept of “other-than-temporary” impairments. The effective date for the Company will be January 1, 2020, with early adoption permitted. The Company is currently evaluating the effect this ASU will have on its consolidated financial statements and related disclosures.
In February 2016, the FASB issued ASUNo. 2016-02, “Leases (Topic 842),” which requires lessees to record most leases on their balance sheets, recognizing a lease liability for the obligation to make lease payments and aright-of-use asset for the right to use the underlying asset for the lease term. The effective date for the Company will be
Revenue
In May 2014,$54.2 million. The difference between the FASB issued ASUNo. 2014-09, “Revenue from Contracts with Customers (Topic 606)”. This ASU amends the guidance for revenue recognition, creating the new Accounting Standards Codification Topic 606 (“ASC 606”). ASC 606 requires entities to apportion consideration from contracts to performance obligations on a relative standalone selling price basis, based on a five-step model. Under ASC 606, revenue is recognized when a customer obtains control of a promised good or service and is recognized in an amount that reflects the consideration which the entity expects to receive in exchange for the good or service. In addition, ASC 606 requires disclosurevalue of the nature, amount, timing,right of use assets and uncertaintylease liabilities is due to the reclassification of revenueexisting deferred rent, prepaid rent, and cash flows arising from contracts with customers.
The Company has elected the full retrospective adoption model, effectiveunamortized lease incentives as of January 1, 2018. The Company’s quarterly results beginning with the quarter ending March 31, 2018 and comparative prior periods will be compliant with ASC 606. The Company’s Annual Report on Form10-K2019.
PEGASYSTEMS INC.
NOTES TO UNAUDITED CONDENSED CONSOLIDATED FINANCIAL STATEMENTS (continued)
The Company has made significant progress on quantifying the impact of its adoption and identifying necessary changes to our policies, processes, systems, and controls.
The Company expects the following impacts:
PEGASYSTEMS INC.
NOTES TO UNAUDITED CONDENSED CONSOLIDATED FINANCIAL STATEMENTS (continued)
3. MARKETABLE SECURITIES
The Company’s marketable securities are as follows:
| (in thousands) | Amortized Cost | Unrealized Gains | Unrealized Losses | Fair Value | ||||||||||||
September 30, 2017 | ||||||||||||||||
Municipal bonds | $ | 32,764 | $ | 12 | �� | $ | (17 | ) | $ | 32,759 | ||||||
Corporate bonds | 31,079 | 12 | (38 | ) | 31,053 | |||||||||||
|
|
|
|
|
|
|
| |||||||||
| $ | 63,843 | $ | 24 | $ | (55 | ) | $ | 63,812 | ||||||||
|
|
|
|
|
|
|
| |||||||||
December 31, 2016 | ||||||||||||||||
Municipal bonds | $ | 36,746 | $ | — | $ | (139 | ) | $ | 36,607 | |||||||
Corporate bonds | 26,610 | 1 | (51 | ) | 26,560 | |||||||||||
|
|
|
|
|
|
|
| |||||||||
| $ | 63,356 | $ | 1 | $ | (190 | ) | $ | 63,167 | ||||||||
|
|
|
|
|
|
|
| |||||||||
| March 31, 2019 | |||||||||||||||
| (in thousands) | Amortized Cost | Unrealized Gains | Unrealized Losses | Fair Value | |||||||||||
| Municipal bonds | $ | 42,693 | $ | 86 | $ | (20 | ) | $ | 42,759 | ||||||
| Corporate bonds | 48,966 | 142 | (63 | ) | 49,045 | ||||||||||
| $ | 91,659 | $ | 228 | $ | (83 | ) | $ | 91,804 | |||||||
| December 31, 2018 | |||||||||||||||
| (in thousands) | Amortized Cost | Unrealized Gains | Unrealized Losses | Fair Value | |||||||||||
| Municipal bonds | $ | 44,802 | $ | 13 | $ | (110 | ) | $ | 44,705 | ||||||
| Corporate bonds | 48,499 | 23 | (226 | ) | 48,296 | ||||||||||
| $ | 93,301 | $ | 36 | $ | (336 | ) | $ | 93,001 | |||||||
4. DERIVATIVE INSTRUMENTS
In May 2017, the Company discontinued its forward contracts program; however, it will continue to evaluate periodically its foreign exchange exposures and mayre-initiate this program if it is deemed necessary.
The Company has historically used foreign currency forward contracts (“forward contracts”) to hedge its exposure to fluctuations in foreign currency exchange rates associated with its foreign currency denominated cash, accounts receivable, and intercompany receivables and payables held primarily by the U.S. parent company and its United Kingdom (“U.K.”) subsidiary.
At December 31, 2016, the total notional value of the Company’s outstanding forward contracts was $128.4 million.
The fair value of the Company’s outstanding forward contracts was as follows:
| December 31, 2016 | ||||||||
| (in thousands) | Recorded In: | Fair Value | ||||||
Asset Derivatives | ||||||||
Foreign currency forward contracts | Other current assets | $ | 628 | |||||
Liability Derivatives | ||||||||
Foreign currency forward contracts | Accrued expenses | $ | 883 | |||||
As of September 30, 2017, the Company did not have any forward contracts outstanding.
The Company had forward contracts outstanding with total notional values as of September 30, 2016 as follows:
| (in thousands) | ||||
Euro | € | 21,810 | ||
British pound | £ | 5,919 | ||
Australian dollar | A$ | 19,515 | ||
United States dollar | $ | 59,450 | ||
1.4 years.
| (in thousands) | March 31, 2019 | December 31, 2018 | |||||
| Accounts receivable | $ | 135,352 | $ | 180,872 | |||
| Unbilled receivables | 161,480 | 172,656 | |||||
| Long-term unbilled receivables | 130,494 | 151,237 | |||||
| $ | 427,326 | $ | 504,765 | ||||
| (Dollars in thousands) | March 31, 2019 | ||||
| 1 year or less | $ | 161,480 | 55 | % | |
| 1-2 years | 86,496 | 30 | % | ||
| 2-5 years | 43,998 | 15 | % | ||
| $ | 291,974 | 100 | % | ||
| (in thousands) | March 31, 2019 | December 31, 2018 | |||||
Contract assets (1) | $ | 3,380 | $ | 3,711 | |||
Long-term contract assets (2) | 1,818 | 2,543 | |||||
| $ | 5,198 | $ | 6,254 | ||||
| Deferred revenue | $ | 180,845 | $ | 185,145 | |||
Long-term deferred revenue (3) | 5,866 | 5,344 | |||||
| $ | 186,711 | $ | 190,489 | ||||
| (in thousands) | March 31, 2019 | December 31, 2018 | |||||
Deferred contract costs (1) | $ | 64,869 | $ | 64,367 | |||
| Three Months Ended March 31, | |||||||
| (in thousands) | 2019 | 2018 | |||||
Amortization of deferred contract costs (1) | $ | 8,301 | $ | 3,789 | |||
| (in thousands) | Three Months Ended March 31, | ||
| 2019 | |||
| Balance as of January 1, | $ | 72,858 | |
| Currency translation adjustments | 40 | ||
| Balance as of March 31, | $ | 72,898 | |
| Three Months Ended September 30, | Nine Months Ended September 30, | |||||||||||||||
| (in thousands) | 2017 | 2016 | 2017 | 2016 | ||||||||||||
Gain (loss) from the change in the fair value of forward contracts included in other income (expense), net | $ | — | $ | (1,237 | ) | $ | 286 | $ | (4,955 | ) | ||||||
Foreign currency transaction (loss) gain from the remeasurement of foreign currency assets and liabilities | (552 | ) | 1,082 | (793 | ) | 2,764 | ||||||||||
|
|
|
|
|
|
|
| |||||||||
| $ | (552 | ) | $ | (155 | ) | $ | (507 | ) | $ | (2,191 | ) | |||||
|
|
|
|
|
|
|
| |||||||||
5.
| March 31, 2019 | |||||||||||||
| (in thousands) | Useful Lives | Cost | Accumulated Amortization | Net Book Value (1) | |||||||||
| Client-related intangibles | 4-10 years | $ | 63,136 | $ | (52,839 | ) | $ | 10,297 | |||||
| Technology | 2-10 years | 59,742 | (51,730 | ) | 8,012 | ||||||||
| Other | 1 - 5 years | 5,361 | (5,361 | ) | — | ||||||||
| $ | 128,239 | $ | (109,930 | ) | $ | 18,309 | |||||||
| December 31, 2018 | |||||||||||||
| (in thousands) | Useful Lives | Cost | Accumulated Amortization | Net Book Value (1) | |||||||||
| Client-related intangibles | 4-10 years | $ | 63,115 | $ | (51,224 | ) | $ | 11,891 | |||||
| Technology | 2-10 years | 59,742 | (50,398 | ) | 9,344 | ||||||||
| Other | 1 - 5 years | 5,361 | (5,361 | ) | — | ||||||||
| $ | 128,218 | $ | (106,983 | ) | $ | 21,235 | |||||||
| (in thousands) | Three Months Ended March 31, | ||||||
| 2019 | 2018 | ||||||
| Cost of revenue | $ | 1,332 | $ | 1,232 | |||
| Selling and marketing | 1,603 | 1,605 | |||||
| $ | 2,935 | $ | 2,837 | ||||
| (in thousands) | March 31, 2019 | December 31, 2018 | |||||
| Outside professional services expenses | $ | 8,815 | $ | 10,367 | |||
| Income and other taxes | 7,954 | 10,387 | |||||
| Marketing and sales program expenses | 8,318 | 5,860 | |||||
| Dividends payable | 2,367 | 2,363 | |||||
| Employee-related expenses | 5,432 | 3,536 | |||||
| Other | 8,061 | 12,993 | |||||
| $ | 40,947 | $ | 45,506 | ||||
recurring basis
PEGASYSTEMS INC.
NOTES TO UNAUDITED CONDENSED CONSOLIDATED FINANCIAL STATEMENTS (continued)
March 31, 2019.
| Fair Value Measurements at Reporting Date Using | Total | |||||||||||||||||||
| (in thousands) | Level 1 | Level 2 | ||||||||||||||||||
September 30, 2017 | ||||||||||||||||||||
Fair Value Assets: | ||||||||||||||||||||
Money market funds | $ | 655 | $ | — | $ | 655 | ||||||||||||||
Marketable securities: | ||||||||||||||||||||
Municipal bonds | $ | — | $ | 32,759 | 32,759 | |||||||||||||||
Corporate bonds | — | 31,053 | 31,053 | |||||||||||||||||
|
|
|
|
|
| |||||||||||||||
| $ | — | $ | 63,812 | $ | 63,812 | |||||||||||||||
December 31, 2016 | ||||||||||||||||||||
Fair Value Assets: | ||||||||||||||||||||
Money market funds | $ | 458 | $ | — | $ | 458 | ||||||||||||||
Marketable securities: | ||||||||||||||||||||
Municipal bonds | $ | — | $ | 36,607 | $ | 36,607 | ||||||||||||||
Corporate bonds | — | 26,560 | 26,560 | |||||||||||||||||
|
|
|
|
|
| |||||||||||||||
| $ | — | $ | 63,167 | $ | 63,167 | |||||||||||||||
Foreign currency forward contracts | — | 628 | 628 | |||||||||||||||||
Fair Value Liabilities: | ||||||||||||||||||||
Foreign currency forward contracts | $ | — | $ | 883 | $ | 883 | ||||||||||||||
were:
| March 31, 2019 | |||||||||||||||
| (in thousands) | Level 1 | Level 2 | Level 3 | Total | |||||||||||
| Cash equivalents | $ | 12,401 | $ | 10,062 | $ | — | $ | 22,463 | |||||||
| Marketable securities: | |||||||||||||||
| Municipal bonds | $ | — | $ | 42,759 | $ | — | $ | 42,759 | |||||||
| Corporate bonds | — | 49,045 | — | 49,045 | |||||||||||
| Total marketable securities | $ | — | $ | 91,804 | $ | — | $ | 91,804 | |||||||
Investments in privately-held companies (1) | $ | — | $ | — | $ | 3,390 | $ | 3,390 | |||||||
| December 31, 2018 | |||||||||||||||
| (in thousands) | Level 1 | Level 2 | Level 3 | Total | |||||||||||
| Cash equivalents | $ | 10,155 | $ | 10,000 | $ | — | $ | 20,155 | |||||||
| Marketable securities: | |||||||||||||||
| Municipal bonds | $ | — | $ | 44,705 | $ | — | $ | 44,705 | |||||||
| Corporate bonds | — | 48,296 | — | 48,296 | |||||||||||
| Total marketable securities | $ | — | $ | 93,001 | $ | — | $ | 93,001 | |||||||
Investments in privately-held companies (1) | $ | — | $ | — | $ | 3,390 | $ | 3,390 | |||||||
Assets Measured
Assets recorded at fair value on a nonrecurringstraight-line basis such as property and equipment and intangible assets,over the term of the lease. Variable lease costs are recognized at fair value when they are impaired. Duringin the nine months ended September 30, 2017period in which the obligation for those payments is incurred. The Company combines lease and 2016,non-lease components in the determination of lease costs for its office space leases. The lease liability includes lease payments related to options to extend or renew the lease term, if the Company didis reasonably certain it will exercise those options. The Company’s leases do not recognizecontain any impairments of its assets recorded at fairmaterial residual value on a nonrecurring basis.
6. TRADE ACCOUNTS RECEIVABLE, NET OF ALLOWANCE
| (in thousands) | September 30, 2017 | December 31, 2016 | ||||||
Trade accounts receivable | $ | 164,530 | $ | 234,473 | ||||
Unbilled trade accounts receivable | 32,820 | 34,681 | ||||||
|
|
|
| |||||
Total trade accounts receivable | 197,350 | 269,154 | ||||||
Allowance for sales credit memos | (6,189 | ) | (4,126 | ) | ||||
|
|
|
| |||||
| $ | 191,161 | $ | 265,028 | |||||
|
|
|
| |||||
Unbilled trade accounts receivable primarily relate to services earned under time and materials arrangements and to license, maintenance, and cloud arrangements that have commencedguarantees or been delivered in excess of scheduled invoicing.
7. GOODWILL AND OTHER INTANGIBLE ASSETS
The changes in the carrying amount of goodwill for the nine months ended September 30, 2017 as follows:
| (in thousands) | ||||
Balance as of January 1, | $ | 73,164 | ||
Purchase price adjustments to goodwill | (354 | ) | ||
Currency translation adjustments | 131 | |||
|
| |||
Balance as of September 30, | $ | 72,941 | ||
|
| |||
restrictive covenants.
Intangible
| Three Months Ended March 31, | |||
| (in thousands) | 2019 | ||
| Operating lease costs | $ | 4,300 | |
Variable lease costs (1) | 1,321 | ||
| $ | 5,621 | ||
| (in thousands) | March 31, 2019 | ||
Right of use assets (1) | $ | 46,464 | |
Lease liabilities (2) | $ | 12,447 | |
| Long-term lease liabilities | $ | 45,325 | |
| (in thousands) | Range of Remaining Useful Lives | Cost | Accumulated Amortization | Net Book Value | ||||||||||||
September 30, 2017 | ||||||||||||||||
Customer related intangibles | 4-10 years | $ | 63,158 | $ | (43,205 | ) | $ | 19,953 | ||||||||
Technology | 7-10 years | 58,942 | (44,140 | ) | 14,802 | |||||||||||
Other intangibles | — | 5,361 | (5,361 | ) | — | |||||||||||
|
|
|
|
|
| |||||||||||
| $ | 127,461 | $ | (92,706 | ) | $ | 34,755 | ||||||||||
|
|
|
|
|
| |||||||||||
December 31, 2016 | ||||||||||||||||
Customer related intangibles | 4-10 years | $ | 63,091 | $ | (37,573 | ) | $ | 25,518 | ||||||||
Technology | 3-10 years | 58,942 | (40,269 | ) | 18,673 | |||||||||||
Other intangibles | — | 5,361 | (5,361 | ) | — | |||||||||||
|
|
|
|
|
| |||||||||||
| $ | 127,394 | $ | (83,203 | ) | $ | 44,191 | ||||||||||
|
|
|
|
|
| |||||||||||
Amortization expense of intangibles assets is reflectedCompany’s right to use the leased asset during the lease term. Included in other long-term assets.
| March 31, 2019 | ||
| Weighted-average remaining lease term | 4.3 years | |
Weighted-average discount rate (1) | 5.7 | % |
| (in thousands) | March 31, 2019 | ||
| Remainder of 2019 | $ | 11,324 | |
| 2020 | 15,784 | ||
| 2021 | 13,764 | ||
| 2022 | 12,761 | ||
| 2023 | 11,604 | ||
| Total lease payments | 65,237 | ||
Less: imputed interest (1) | (7,465 | ) | |
| $ | 57,772 | ||
| Three Months Ended September 30, | Nine Months Ended September 30, | |||||||||||||||
| (in thousands) | 2017 | 2016 | 2017 | 2016 | ||||||||||||
Cost of revenue | $ | 1,232 | $ | 1,642 | $ | 3,871 | $ | 4,626 | ||||||||
Selling and marketing | 1,873 | 1,867 | 5,608 | 5,274 | ||||||||||||
General and administrative | — | 90 | — | 268 | ||||||||||||
|
|
|
|
|
|
|
| |||||||||
| $ | 3,105 | $ | 3,599 | $ | 9,479 | $ | 10,168 | |||||||||
|
|
|
|
|
|
|
| |||||||||
Futurea result of a lease reassessment event.
| (in thousands) | Operating Leases (1) | ||
| 2019 | $ | 15,993 | |
| 2020 | 14,807 | ||
| 2021 | 13,262 | ||
| 2022 | 12,279 | ||
| 2023 | 11,084 | ||
| $ | 67,425 | ||
| (in thousands) | ||||
Remainder of 2017 | $ | 2,846 | ||
2018 | 11,347 | |||
2019 | 5,555 | |||
2020 | 2,659 | |||
2021 | 2,637 | |||
2022 and thereafter | 9,711 | |||
|
| |||
| $ | 34,755 | |||
|
| |||
8. ACCRUED EXPENSES
| (in thousands) | September 30, 2017 | December 31, 2016 | ||||||
Outside professional services | $ | 13,447 | $ | 10,204 | ||||
Income and other taxes | 5,947 | 10,422 | ||||||
Marketing and sales program expenses | 4,679 | 3,707 | ||||||
Dividends payable | 2,336 | 2,298 | ||||||
Employee related expenses | 4,715 | 3,806 | ||||||
Other | 8,557 | 6,314 | ||||||
|
|
|
| |||||
| $ | 39,681 | $ | 36,751 | |||||
|
|
|
| |||||
its restructuring activities.
9. DEFERRED
| Three Months Ended March 31, | ||
| (in thousands) | 2019 | |
| Cash paid for leases | 5,197 | |
| Right of use assets recognized for new leases (non-cash) | 8,034 | |
| (in thousands) | September 30, 2017 | December 31, 2016 | ||||||
Term license | $ | 5,636 | $ | 15,843 | ||||
Perpetual license | 20,844 | 23,189 | ||||||
Maintenance | 105,588 | 112,397 | ||||||
Cloud | 18,805 | 13,604 | ||||||
Professional Services | 10,058 | 10,614 | ||||||
|
|
|
| |||||
Current deferred revenue | 160,931 | 175,647 | ||||||
Perpetual license | 4,085 | 7,909 | ||||||
Maintenance | 828 | 1,802 | ||||||
Cloud | 1,217 | 1,278 | ||||||
|
|
|
| |||||
Long-term deferred revenue | 6,130 | 10,989 | ||||||
|
|
|
| |||||
| $ | 167,061 | $ | 186,636 | |||||
|
|
|
| |||||
10.
| Three Months Ended March 31, | |||||||||||
| (Dollars in thousands) | 2019 | 2018 | |||||||||
| U.S. | $ | 103,991 | 48 | % | $ | 113,985 | 48 | % | |||
| Other Americas | 28,829 | 14 | % | 17,715 | 8 | % | |||||
| United Kingdom (“U.K.”) | 24,549 | 12 | % | 26,094 | 11 | % | |||||
| Europe (excluding U.K.), Middle East, and Africa | 34,186 | 16 | % | 31,826 | 14 | % | |||||
| Asia-Pacific | 20,991 | 10 | % | 45,562 | 19 | % | |||||
| $ | 212,546 | 100 | % | $ | 235,182 | 100 | % | ||||
| Three Months Ended March 31, | |||||||
| (in thousands) | 2019 | 2018 | |||||
| Perpetual license | $ | 14,950 | $ | 23,078 | |||
| Term license | 48,314 | 64,695 | |||||
| Revenue recognized at a point in time | 63,264 | 87,773 | |||||
| Maintenance | 67,706 | 64,525 | |||||
| Cloud | 27,758 | 15,582 | |||||
| Consulting | 53,818 | 67,302 | |||||
| Revenue recognized over time | 149,282 | 147,409 | |||||
| $ | 212,546 | $ | 235,182 | ||||
| (in thousands) | Three Months Ended March 31, | ||||||
| 2019 | 2018 | ||||||
| Term license | $ | 48,314 | $ | 64,695 | |||
| Cloud | 27,758 | 15,582 | |||||
| Maintenance | 67,706 | 64,525 | |||||
Subscription (1) | 143,778 | 144,802 | |||||
| Perpetual license | 14,950 | 23,078 | |||||
| Consulting | 53,818 | 67,302 | |||||
| $ | 212,546 | $ | 235,182 | ||||
| March 31, 2019 | |||||||||||||||||||||||||
| (Dollars in thousands) | Perpetual license | Term License | Maintenance | Cloud | Consulting | Total | |||||||||||||||||||
| 1 year or less | $ | 10,263 | $ | 44,404 | $ | 187,324 | $ | 115,548 | $ | 13,251 | $ | 370,790 | 58 | % | |||||||||||
| 1-2 years | 998 | 4,274 | 9,350 | 91,539 | 1,363 | 107,524 | 17 | % | |||||||||||||||||
| 2-3 years | 2,180 | 756 | 4,438 | 71,509 | 473 | 79,356 | 13 | % | |||||||||||||||||
| Greater than 3 years | — | 135 | 2,008 | 72,742 | 27 | 74,912 | 12 | % | |||||||||||||||||
| $ | 13,441 | $ | 49,569 | $ | 203,120 | $ | 351,338 | $ | 15,114 | $ | 632,582 | 100 | % | ||||||||||||
| March 31, 2018 | |||||||||||||||||||||||||
| (Dollars in thousands) | Perpetual license | Term License | Maintenance | Cloud | Consulting | Total | |||||||||||||||||||
| 1 year or less | $ | 33,859 | $ | 21,087 | $ | 156,702 | $ | 47,764 | $ | 9,403 | $ | 268,815 | 59 | % | |||||||||||
| 1-2 years | 14,106 | 7,877 | 21,381 | 52,849 | 1,098 | 97,311 | 21 | % | |||||||||||||||||
| 2-3 years | 1,204 | 5,634 | 4,924 | 37,844 | — | 49,606 | 11 | % | |||||||||||||||||
| Greater than 3 years | 382 | 853 | 1,825 | 40,478 | — | 43,538 | 9 | % | |||||||||||||||||
| $ | 49,551 | $ | 35,451 | $ | 184,832 | $ | 178,935 | $ | 10,501 | $ | 459,270 | 100 | % | ||||||||||||
Stock-based compensation expense is reflected in the Company’s unaudited condensed consolidated statements of operations as follows:
| Three Months Ended September 30, | Nine Months Ended September 30, | |||||||||||||||
| (in thousands) | 2017 | 2016 | 2017 | 2016 | ||||||||||||
Cost of revenues | $ | 3,613 | $ | 3,117 | $ | 10,913 | $ | 8,711 | ||||||||
Selling and marketing | 3,976 | 3,468 | 11,482 | 9,395 | ||||||||||||
Research and development | 3,420 | 2,260 | 10,306 | 7,480 | ||||||||||||
General and administrative | 2,480 | 1,983 | 7,228 | 4,706 | ||||||||||||
Acquisition-related | — | (10 | ) | — | 342 | |||||||||||
|
|
|
|
|
|
|
| |||||||||
Total stock-based compensation before tax | $ | 13,489 | $ | 10,818 | $ | 39,929 | $ | 30,634 | ||||||||
|
|
|
|
|
|
|
| |||||||||
Income tax benefit | $ | (4,129 | ) | $ | (3,227 | ) | $ | (12,231 | ) | $ | (8,917 | ) | ||||
During the nine months ended September 30, 2017, the Company issued approximately 1,299,000 shares of common stock to its employees and 18,000 shares of common stock to its
During the nine months ended September 30, 2017, the Company granted approximately 1,052,000 restricted stock units (“RSUs”) and 1,520,000non-qualified stock options to its employees with total fair values of approximately $47.5 million and $20.6 million, respectively. This includes approximately 175,000 RSUs which were granted in connection with the election by employees to receive 50% of their 2017 target incentive compensation under the Company’s Corporate Incentive Compensation Plan in the form of RSUs instead of cash. Stock-based compensation of approximately $7.7 million associated with this RSU grant will be recognized over aone-year period beginning on the grant date.
| Three Months Ended March 31, | |||||||
| (in thousands) | 2019 | 2018 | |||||
| Cost of revenues | $ | 4,519 | $ | 3,701 | |||
| Selling and marketing | 7,374 | 4,658 | |||||
| Research and development | 4,560 | 3,637 | |||||
| General and administrative | 1,897 | 3,113 | |||||
| $ | 18,350 | $ | 15,109 | ||||
| Income tax benefit | $ | (3,740 | ) | $ | (3,141 | ) | |
11.
| Three Months Ended March 31, | ||||||
| 2019 | ||||||
| (in thousands) | Shares | Total Fair Value | ||||
| RSUs | 839 | $ | 53,184 | |||
| Non-qualified stock options | 1,770 | $ | 33,344 | |||
| Three Months Ended March 31, | |||||||
| (Dollars in thousands) | 2019 | 2018 | |||||
| Benefit from income taxes | $ | (8,300 | ) | $ | (4,222 | ) | |
| Effective income tax rate | 22 | % | (53 | )% | |||
| Three Months Ended March 31, | |||||||
| (in thousands, except per share amounts) | 2019 | 2018 | |||||
| Basic | |||||||
| Net (loss) income | $ | (28,717 | ) | $ | 12,200 | ||
| Weighted-average common shares outstanding | 78,584 | 78,236 | |||||
| (Loss) earnings per share, basic | $ | (0.37 | ) | $ | 0.16 | ||
| Diluted | |||||||
| Net (loss) income | $ | (28,717 | ) | $ | 12,200 | ||
| Weighted-average effect of dilutive securities: | |||||||
| Stock options | — | 3,119 | |||||
| RSUs | — | 1,747 | |||||
| Effect of dilutive securities | — | 4,866 | |||||
| Weighted-average common shares outstanding, assuming dilution | 78,584 | 83,102 | |||||
| (Loss) earnings per share, diluted | $ | (0.37 | ) | $ | 0.15 | ||
Outstanding anti-dilutive stock options and RSUs (1) | 5,563 | 397 | |||||
PEGASYSTEMS INC.
NOTES TO UNAUDITED CONDENSED CONSOLIDATED FINANCIAL STATEMENTS (continued)
The calculation of the Company’s basic and diluted earnings per share is as follows:
| Three Months Ended September 30, | Nine Months Ended September 30, | |||||||||||||||
| (in thousands, except per share amounts) | 2017 | 2016 | 2017 | 2016 | ||||||||||||
Basic | ||||||||||||||||
Net (loss)/income | $ | (1,812 | ) | $ | 3,301 | $ | 36,615 | $ | 18,237 | |||||||
|
|
|
|
|
|
|
| |||||||||
Weighted-average common shares outstanding | 77,691 | 76,278 | 77,258 | 76,323 | ||||||||||||
|
|
|
|
|
|
|
| |||||||||
(Loss)/earnings per share, basic | $ | (0.03 | ) | $ | 0.04 | $ | 0.47 | $ | 0.24 | |||||||
|
|
|
|
|
|
|
| |||||||||
Diluted | ||||||||||||||||
Net (loss)/income | $ | (1,812 | ) | $ | 3,301 | $ | 36,615 | $ | 18,237 | |||||||
|
|
|
|
|
|
|
| |||||||||
Weighted-average effect of dilutive securities: | ||||||||||||||||
Stock options | — | 1,933 | 3,519 | 1,851 | ||||||||||||
RSUs | — | 1,337 | 1,940 | 1,227 | ||||||||||||
|
|
|
|
|
|
|
| |||||||||
Effect of assumed exercise of stock options and RSUs | — | 3,270 | 5,459 | 3,078 | ||||||||||||
|
|
|
|
|
|
|
| |||||||||
Weighted-average common shares outstanding, assuming dilution | 77,691 | 79,548 | 82,717 | 79,401 | ||||||||||||
|
|
|
|
|
|
|
| |||||||||
(Loss)/earnings per share, diluted | $ | (0.03 | ) | $ | 0.04 | $ | 0.44 | $ | 0.23 | |||||||
|
|
|
|
|
|
|
| |||||||||
Outstanding stock options and RSUs excluded as impact would be anti-dilutive | 7,232 | 296 | 219 | 368 | ||||||||||||
In periods of loss, all equity awards are excluded, as the inclusion of any equity awards would be anti-dilutive.
12. GEOGRAPHIC INFORMATION AND MAJOR CLIENTS
Geographic Information
Operating segments are defined as components of an enterprise, about which separate financial information is available that is evaluated regularly by the chief operating decision maker (“CODM”) in deciding how to allocate resources and in assessing performance.
The Company develops and licenses software applications for customer engagement and its Pega® Platform, and provides consulting services, maintenance, and training related to its offerings. The Company derives substantially all of its revenue from the sale and support of one group of similar products and services—software that provides case management, business process management, and real-time decisioning solutions to improve customer engagement and operational excellence in the enterprise applications market. To assess performance, the Company’s CODM, who is the chief executive officer, reviews financial information on a consolidated basis. Therefore, the Company determined it has one reportable segment—Customer Engagement Solutions and one reporting unit.
The Company’s international revenue, based upon the clients’ location, is as follows:
| Three Months Ended September 30, | Nine Months Ended September 30, | |||||||||||||||||||||||||||||||
| (Dollars in thousands) | 2017 | 2016 | 2017 | 2016 | ||||||||||||||||||||||||||||
U.S. | $ | 95,087 | 53 | % | $ | 111,274 | 61 | % | $ | 351,330 | 59 | % | $ | 308,049 | 56 | % | ||||||||||||||||
Other Americas | 8,722 | 5 | % | 7,952 | 4 | % | 30,243 | 5 | % | 49,494 | 9 | % | ||||||||||||||||||||
U.K. | 18,485 | 10 | % | 21,490 | 12 | % | 68,003 | 11 | % | 77,181 | 14 | % | ||||||||||||||||||||
Other EMEA(1) | 28,100 | 16 | % | 23,656 | 13 | % | 76,958 | 13 | % | 67,314 | 12 | % | ||||||||||||||||||||
Asia Pacific | 29,421 | 16 | % | 18,430 | 10 | % | 74,508 | 12 | % | 48,618 | 9 | % | ||||||||||||||||||||
|
|
|
|
|
|
|
|
|
|
|
|
|
|
|
| |||||||||||||||||
| $ | 179,815 | 100 | % | $ | 182,802 | 100 | % | $ | 601,042 | 100 | % | $ | 550,656 | 100 | % | |||||||||||||||||
|
|
|
|
|
|
|
|
|
|
|
|
|
|
|
| |||||||||||||||||
PEGASYSTEMS INC.
NOTES TO UNAUDITED CONDENSED CONSOLIDATED FINANCIAL STATEMENTS (continued)
Major Clients
Clients accounting for 10% or more of the Company’s total revenue were as follows:
| Three Months Ended September 30, | Nine Months Ended September 30, | |||||||||||||||
| (in thousands) | 2017 | 2016 | 2017 | 2016 | ||||||||||||
Total revenue | $ | 179,815 | $ | 182,802 | $ | 601,042 | $ | 550,656 | ||||||||
Client A | 10.6 | % | * | * | * | |||||||||||
Clients accounting for 10% or more of the Company’s total trade accounts receivable were as follows:
| (in thousands) | September 30, 2017 | December 31, 2016 | ||||||
Total trade accounts receivable | 197,350 | 269,154 | ||||||
Client A | 12.4 | % | * | |||||
Forward-Looking Statements
2018.
These statements are not guarantees of future performance and involve certain risks, uncertainties, and assumptions that are difficult to predict.
We have (“SEC”).
Business overview
otherwise.
Ourtarget clients includeare Global 3000 companiesorganizations and government agencies that seekrequire applications to manage complex enterprise systemsdifferentiate themselves in the markets they serve. Our applications achieve and customer service issues with greaterfacilitate differentiation by increasing business agility, driving growth, improving productivity, attracting and cost-effectiveness. Our strategy isretaining customers, and reducing risk. We deliver applications tailored to sell a client a series of licenses, each focused on aour clients’ specific purpose or area of operations in support of longer term enterprise-wide digital transformation initiatives.
Our license revenue is primarily derived from sales of our applications and our Pega Platform. Our cloud revenue is derived from the licensing of our hosted Pega Platform and software application environments. Our consulting services revenue is primarily related to new license implementations.
Financial and industry needs.
Management evaluates our financial performance, basedmetrics
(Dollars in thousands, except per share amounts) | Three Months Ended March 31, | Change | |||||||||||
| 2019 | 2018 | ||||||||||||
| Total revenue | $ | 212,546 | $ | 235,182 | $ | (22,636 | ) | (10 | )% | ||||
Subscription revenue (1) | $ | 143,778 | $ | 144,802 | $ | (1,024 | ) | (1 | )% | ||||
| Net (loss) income | $ | (28,717 | ) | $ | 12,200 | $ | (40,917 | ) | * | ||||
| (Loss) earnings per share, diluted | $ | (0.37 | ) | $ | 0.15 | $ | (0.52 | ) | * | ||||
Select Financial Metrics
(Dollars in thousands, except per share amounts) | Three Months Ended September 30, | Nine Months Ended September 30, | ||||||||||||||||||||||||||||||
| 2017 | 2016 | Change | 2017 | 2016 | Change | |||||||||||||||||||||||||||
Total revenue | $ | 179,815 | $ | 182,802 | (2,987 | ) | (2 | )% | $ | 601,042 | $ | 550,656 | $ | 50,386 | 9 | % | ||||||||||||||||
Operating margin | (8 | )% | 3 | % | 3 | % | 5 | % | ||||||||||||||||||||||||
Diluted (loss)/earnings per share | $ | (0.03 | ) | $ | 0.04 | $ | (0.07 | ) | (175 | )% | $ | 0.44 | $ | 0.23 | $ | 0.21 | 91 | % | ||||||||||||||
Cash flow provided by operating activities | 113,926 | 20,556 | 93,370 | 454 | % | |||||||||||||||||||||||||||
Select Performance Metrics
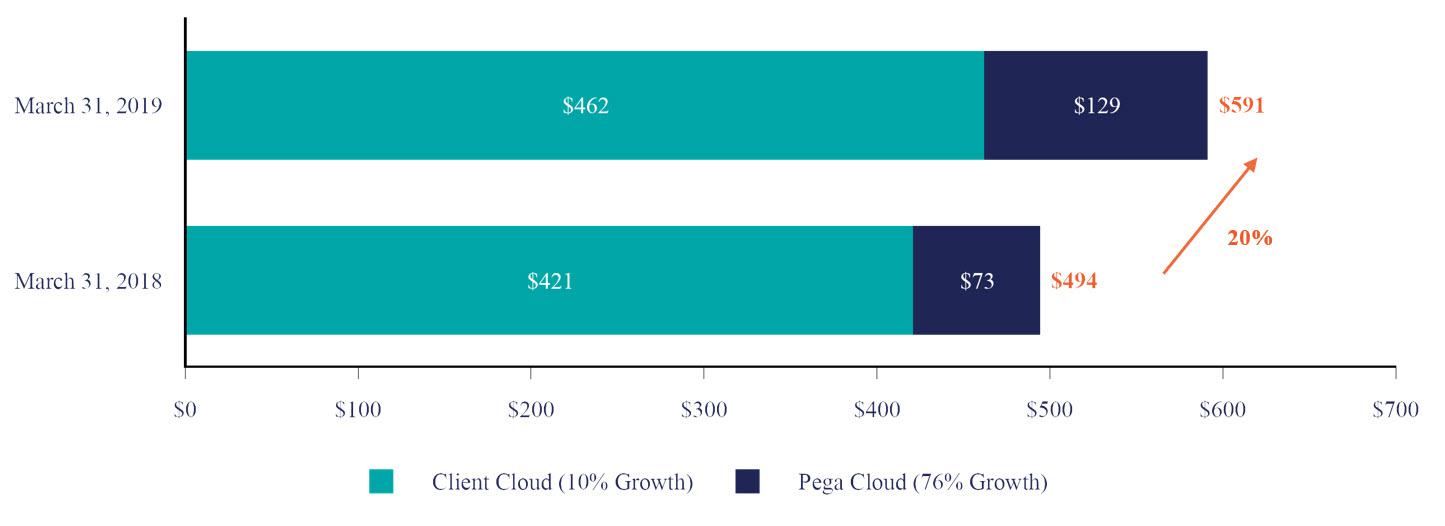
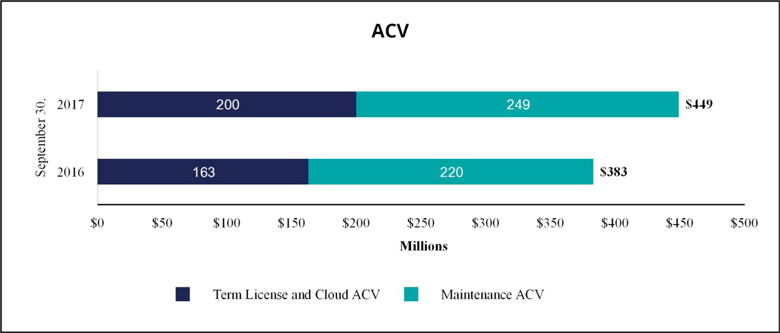
Annual Contract Value (“ACV”)
| March 31, | Change | ||||||||||||
| (Dollars in thousands) | 2019 | 2018 | |||||||||||
| Pega Cloud ACV | $ | 128,636 | $ | 72,966 | $ | 55,670 | 76 | % | |||||
| Client Cloud ACV | 462,130 | 421,159 | 40,971 | 10 | % | ||||||||
| Total ACV | $ | 590,766 | $ | 494,125 | $ | 96,641 | 20 | % | |||||
| September 30, | ||||||||||||||||
| (in thousands) | 2017 | 2016 | Change | |||||||||||||
Term License and Cloud ACV | $ | 200,180 | $ | 163,408 | $ | 36,772 | 23 | % | ||||||||
Maintenance ACV | 248,816 | 220,152 | $ | 28,664 | 13 | % | ||||||||||
|
|
|
| |||||||||||||
Term License, Cloud and Maintenance ACV | $ | 448,996 | $ | 383,560 | $ | 65,436 | 17 | % | ||||||||
|
|
|
| |||||||||||||
Recurring Revenue
A measure
| Three Months Ended September 30, | Nine Months Ended September 30, | |||||||||||||||||||||||||||||||
| (Dollars in thousands) | 2017 | 2016 | Change | 2017 | 2016 | Change | ||||||||||||||||||||||||||
Recurring revenue | ||||||||||||||||||||||||||||||||
Term license | $ | 21,678 | $ | 28,919 | $ | (7,241 | ) | (25 | )% | $ | 106,170 | $ | 102,115 | $ | 4,055 | 4 | % | |||||||||||||||
Maintenance | 62,204 | 55,038 | $ | 7,166 | 13 | % | 180,759 | 163,174 | $ | 17,585 | 11 | % | ||||||||||||||||||||
Cloud | 13,354 | 10,873 | $ | 2,481 | 23 | % | 36,914 | 30,640 | $ | 6,274 | 20 | % | ||||||||||||||||||||
|
|
|
|
|
|
|
| |||||||||||||||||||||||||
Total recurring revenue | $ | 97,236 | $ | 94,830 | $ | 2,406 | 3 | % | $ | 323,843 | $ | 295,929 | $ | 27,914 | 9 | % | ||||||||||||||||
|
|
|
|
|
|
|
| |||||||||||||||||||||||||
Recurring revenue as a percent of total revenue | 54 | % | 52 | % | 54 | % | 54 | % | ||||||||||||||||||||||||
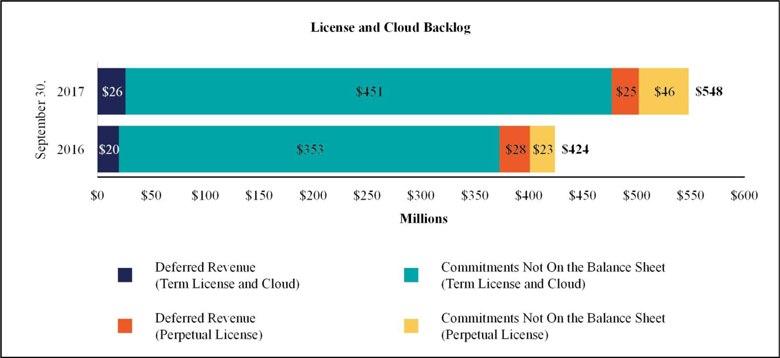
License and Cloud Backlog
A measureeach cloud contract in effect on such date, which is equal to its total value divided by the total number of the continued growthyears.
| March 31, 2019 | |||||||||||||||||||||||||
| (Dollars in thousands) | Perpetual license | Term license | Maintenance | Cloud | Consulting | Total | |||||||||||||||||||
| 1 year or less | $ | 10,263 | $ | 44,404 | $ | 187,324 | $ | 115,548 | $ | 13,251 | $ | 370,790 | 58 | % | |||||||||||
| 1-2 years | 998 | 4,274 | 9,350 | 91,539 | 1,363 | 107,524 | 17 | % | |||||||||||||||||
| 2-3 years | 2,180 | 756 | 4,438 | 71,509 | 473 | 79,356 | 13 | % | |||||||||||||||||
| Greater than 3 years | — | 135 | 2,008 | 72,742 | 27 | 74,912 | 12 | % | |||||||||||||||||
| $ | 13,441 | $ | 49,569 | $ | 203,120 | $ | 351,338 | $ | 15,114 | $ | 632,582 | 100 | % | ||||||||||||
| March 31, 2018 | |||||||||||||||||||||||||
| (Dollars in thousands) | Perpetual license | Term license | Maintenance | Cloud | Consulting | Total | |||||||||||||||||||
| 1 year or less | $ | 33,859 | $ | 21,087 | $ | 156,702 | $ | 47,764 | $ | 9,403 | $ | 268,815 | 59 | % | |||||||||||
| 1-2 years | 14,106 | 7,877 | 21,381 | 52,849 | 1,098 | 97,311 | 21 | % | |||||||||||||||||
| 2-3 years | 1,204 | 5,634 | 4,924 | 37,844 | — | 49,606 | 11 | % | |||||||||||||||||
| Greater than 3 years | 382 | 853 | 1,825 | 40,478 | — | 43,538 | 9 | % | |||||||||||||||||
| $ | 49,551 | $ | 35,451 | $ | 184,832 | $ | 178,935 | $ | 10,501 | $ | 459,270 | 100 | % | ||||||||||||
License and Cloud Backlog is the sum of the following two components:
License and cloud backlog may vary in any given period depending on the amount and timing of when the arrangements are executed, as well as the mix between perpetual, term, and cloud license arrangements, which may depend on our clients’ deployment preferences. A change in the mix may cause our revenues to vary materially from period to period. A higher proportion of term and cloud license arrangements executed will generally result in revenue being recognized over longer periods.
| September 30, | Change | |||||||||||||||||||
| (Dollars in thousands) | 2017 | 2016 | ||||||||||||||||||
Deferred license and cloud revenue on the balance sheet | ||||||||||||||||||||
Term license and cloud | $ | 25,658 | 51 | % | $ | 19,627 | 42 | % | 31 | % | ||||||||||
Perpetual license | 24,929 | 49 | % | 27,653 | 58 | % | (10 | )% | ||||||||||||
|
|
|
| |||||||||||||||||
Total deferred license and cloud revenue | 50,587 | 100 | % | 47,280 | 100 | % | 7 | % | ||||||||||||
|
|
|
| |||||||||||||||||
License and cloud contractual commitments not on the balance sheet | ||||||||||||||||||||
Term license and cloud | 450,535 | 91 | % | 352,804 | 94 | % | 28 | % | ||||||||||||
Perpetual license | 46,459 | 9 | % | 23,483 | 6 | % | 98 | % | ||||||||||||
|
|
|
| |||||||||||||||||
Total license and cloud commitments | 496,994 | 100 | % | 376,287 | 100 | % | 32 | % | ||||||||||||
|
|
|
| |||||||||||||||||
Total license (term and perpetual) and cloud backlog | $ | 547,581 | $ | 423,567 | 29 | % | ||||||||||||||
|
|
|
| |||||||||||||||||
Total term license and cloud backlog | 476,193 | 87 | % | 372,431 | 88 | % | 28 | % | ||||||||||||
|
|
|
| |||||||||||||||||
Critical accounting policies
There have been no changes in our critical accounting policies as disclosed in our Annual Report on Form10-K for the year ended December 31, 2016.
2018:
| Three Months Ended September 30, | Nine Months Ended September 30, | |||||||||||||||||||||||||||||||
| (Dollars in thousands) | 2017 | 2016 | Change | 2017 | 2016 | Change | ||||||||||||||||||||||||||
Total revenue | $ | 179,815 | $ | 182,802 | $ | (2,987 | ) | (2 | )% | $ | 601,042 | $ | 550,656 | $ | 50,386 | 9 | % | |||||||||||||||
Gross profit | $ | 110,084 | $ | 122,365 | $ | (12,281 | ) | (10 | )% | $ | 395,346 | $ | 373,609 | $ | 21,737 | 6 | % | |||||||||||||||
Total operating expenses | $ | 124,373 | $ | 116,867 | $ | 7,506 | 6 | % | $ | 376,647 | $ | 347,626 | $ | 29,021 | 8 | % | ||||||||||||||||
(Loss)/income from operations | $ | (14,289 | ) | $ | 5,498 | $ | (19,787 | ) | (360 | )% | $ | 18,699 | $ | 25,983 | $ | (7,284 | ) | (28 | )% | |||||||||||||
Operating margin | (8 | )% | 3 | % | 3 | % | 5 | % | ||||||||||||||||||||||||
(Loss)/income before (benefit)/provision for income taxes | $ | (14,697 | ) | $ | 5,515 | $ | (20,212 | ) | (366 | )% | $ | 18,663 | $ | 24,506 | $ | (5,843 | ) | (24 | )% | |||||||||||||
Operations”; and
Software
| (Dollars in thousands) | Three Months Ended March 31, | Change | |||||||||||||||
| 2019 | 2018 | ||||||||||||||||
| Term license | $ | 48,314 | 23 | % | $ | 64,695 | 28 | % | $ | (16,381 | ) | (25 | )% | ||||
| Cloud | 27,758 | 13 | % | 15,582 | 7 | % | 12,176 | 78 | % | ||||||||
| Maintenance | 67,706 | 32 | % | 64,525 | 27 | % | 3,181 | 5 | % | ||||||||
Subscription revenue (1) | 143,778 | 68 | % | 144,802 | 62 | % | (1,024 | ) | (1 | )% | |||||||
| Perpetual license | 14,950 | 7 | % | 23,078 | 10 | % | (8,128 | ) | (35 | )% | |||||||
| Consulting | 53,818 | 25 | % | 67,302 | 28 | % | (13,484 | ) | (20 | )% | |||||||
| $ | 212,546 | 100 | % | $ | 235,182 | 100 | % | $ | (22,636 | ) | (10 | )% | |||||
| (Dollars in thousands) | Three Months Ended September 30, | Nine Months Ended September 30, | ||||||||||||||||||||||||||||||||||||||||||||||
| 2017 | 2016 | Change | 2017 | 2016 | Change | |||||||||||||||||||||||||||||||||||||||||||
Perpetual license | $ | 20,115 | 48 | % | $ | 39,914 | 58 | % | $ | (19,799 | ) | (50 | )% | $ | 89,050 | 46 | % | $ | 105,734 | 51 | % | ($ | 16,684 | ) | (16 | )% | ||||||||||||||||||||||
Term license | 21,678 | 52 | % | 28,919 | 42 | % | (7,241 | ) | (25 | )% | 106,170 | 54 | % | 102,115 | 49 | % | 4,055 | 4 | % | |||||||||||||||||||||||||||||
|
|
|
|
|
|
|
|
|
|
|
|
|
|
|
| |||||||||||||||||||||||||||||||||
Total license revenue | $ | 41,793 | 100 | % | $ | 68,833 | 100 | % | $ | (27,040 | ) | (39 | )% | $ | 195,220 | 100 | % | $ | 207,849 | 100 | % | ($ | 12,629 | ) | (6 | )% | ||||||||||||||||||||||
|
|
|
|
|
|
|
|
|
|
|
|
|
|
|
| |||||||||||||||||||||||||||||||||
The is derived from sales of our applications and Pega Platform. Our cloud revenue is derived from our hosted Pega Platform and software applications.
The decrease in perpetual license revenue in the three months ended September 30, 2017 was primarily due to a decrease in the average value of perpetual arrangements executed and a lower percentage of perpetual arrangements executed and recognized in revenue in the current period. The decrease in perpetual license revenue in the nine months ended September 30, 2017 was primarily due to a lower percentage of perpetual arrangements executed and recognized in revenue.
The aggregate value of future revenue expected to be recognized during the remainder of the year under existing noncancellable perpetual arrangements not reflected in deferredmaintenance revenue was $13.3 million as of September 30, 2017 compared to $3.9 million as of September 30, 2016.
The aggregate value of future revenue expected to be recognized during the remainder of the year under existing noncancellable term and cloud arrangements not reflected in deferred revenue was $37.7 million as of September 30, 2017 compared to $26.7 million as of September 30, 2016. For additional information see “Future Cash Receipts from Committed License and Cloud Arrangements” which can be found in “Liquidity and Capital Resources.”
Maintenance revenue
| Three Months Ended September 30, | Nine Months Ended September 30, | |||||||||||||||||||||||||||||||
| (Dollars in thousands) | 2017 | 2016 | Change | 2017 | 2016 | Change | ||||||||||||||||||||||||||
Maintenance | $ | 62,204 | $ | 55,038 | $ | 7,166 | 13 | % | $ | 180,759 | $ | 163,174 | $ | 17,585 | 11 | % | ||||||||||||||||
The increases were primarily due to the continued growth in the aggregate value of the installed base of our software and strong renewal rates significantly in excess of 90%.
Services
| Three Months Ended September 30, | Nine Months Ended September 30, | |||||||||||||||||||||||||||||||||||||||||||||||
| (Dollars in thousands) | 2017 | 2016 | Change | 2017 | 2016 | Change | ||||||||||||||||||||||||||||||||||||||||||
Consulting services | $ | 61,535 | 81 | % | $ | 46,829 | 80 | % | $ | 14,706 | 31 | % | $ | 183,447 | 82 | % | $ | 144,263 | 80 | % | $ | 39,184 | 27 | % | ||||||||||||||||||||||||
Cloud | 13,354 | 18 | % | 10,873 | 18 | % | 2,481 | 23 | % | 36,914 | 16 | % | 30,640 | 17 | % | 6,274 | 20 | % | ||||||||||||||||||||||||||||||
Training | 929 | 1 | % | 1,229 | 2 | % | (300 | ) | (24 | )% | 4,702 | 2 | % | 4,730 | 3 | % | (28 | ) | (1 | )% | ||||||||||||||||||||||||||||
|
|
|
|
|
|
|
|
|
|
|
|
|
|
|
| |||||||||||||||||||||||||||||||||
Total services | $ | 75,818 | 100 | % | $ | 58,931 | 100 | % | $ | 16,887 | 29 | % | $ | 225,063 | 100 | % | $ | 179,633 | 100 | % | $ | 45,430 | 25 | % | ||||||||||||||||||||||||
|
|
|
|
|
|
|
|
|
|
|
|
|
|
|
| |||||||||||||||||||||||||||||||||
Consulting services revenue is primarily generated in the three months ended March 31, 2019 reflects the shift in client preferences in favor of our cloud offerings and away from newperpetual license implementations. arrangements.
The increasesdecrease in consulting services revenue werein the three months ended March 31, 2019 was primarily due to highera decrease in billable hours duringhours.
| Three Months Ended March 31, | Change | ||||||||||||||||
| (Dollars in thousands) | 2019 | 2018 | |||||||||||||||
| Software license | $ | 61,886 | 98 | % | $ | 86,518 | 99 | % | $ | (24,632 | ) | (28 | )% | ||||
| Maintenance | 61,371 | 91 | % | 58,443 | 91 | % | 2,928 | 5 | % | ||||||||
| Cloud | 14,460 | 52 | % | 7,861 | 50 | % | 6,599 | 84 | % | ||||||||
| Consulting | 392 | 1 | % | 6,746 | 10 | % | (6,354 | ) | (94 | )% | |||||||
| $ | 138,109 | 65 | % | $ | 159,568 | 68 | % | $ | (21,459 | ) | (13 | )% | |||||
Cloud revenue representsservice period, while revenue from our Pega Cloud offerings. The increases in cloud revenue were primarily due to continued growth of our cloud client base.
Gross profit
| Three Months Ended September 30, | Nine Months Ended September 30, | |||||||||||||||||||||||||||||||
| (Dollars in thousands) | 2017 | 2016 | Change | 2017 | 2016 | Change | ||||||||||||||||||||||||||
Software license | $ | 40,517 | $ | 67,520 | $ | (27,003 | ) | (40 | )% | $ | 191,394 | $ | 204,203 | $ | (12,809 | ) | (6 | )% | ||||||||||||||
Maintenance | 55,488 | 48,379 | 7,109 | 15 | % | 159,814 | 144,285 | 15,529 | 11 | % | ||||||||||||||||||||||
Services | 14,079 | 6,466 | 7,613 | 118 | % | 44,138 | 25,121 | 19,017 | 76 | % | ||||||||||||||||||||||
|
|
|
|
|
|
|
| |||||||||||||||||||||||||
Total gross profit | $ | 110,084 | $ | 122,365 | $ | (12,281 | ) | (10 | )% | $ | 395,346 | $ | 373,609 | $ | 21,737 | 6 | % | |||||||||||||||
Software license gross profit % | 97 | % | 98 | % | 98 | % | 98 | % | ||||||||||||||||||||||||
Maintenance gross profit % | 89 | % | 88 | % | 88 | % | 88 | % | ||||||||||||||||||||||||
Services gross profit % | 19 | % | 11 | % | 20 | % | 14 | % | ||||||||||||||||||||||||
|
|
|
|
|
|
|
| |||||||||||||||||||||||||
Total gross profit % | 61 | % | 67 | % | 66 | % | 68 | % | ||||||||||||||||||||||||
term and perpetual license arrangements is generally recognized upfront when the license rights become effective.
The increase in total gross profit in the nine months ended September 30, 2017 was primarily due to increased total revenue.
The increases in service gross profit percent in the three and nine months ended September 30, 2017March 31, 2019 was driven by a shift in favor of cloud arrangements, which are lower margin than our term and perpetual license revenue streams. The increase in cloud gross profit percent was driven by cost efficiency gains as our cloud business continues to grow and scale. The decrease in consulting gross profit percent was driven by a decrease in billable hours as consulting resources were transitioning to new projects after completing a large project which began in the second half of 2016 and several additional large projects for which costs were recognizedan increase in 2016 but whose associated revenue was not recognized until after September 30, 2016.
consulting resource availability in Europe as we continue growing and leveraging our partner network.
| Three Months Ended September 30, | Nine Months Ended September 30, | |||||||||||||||||||||||||||||||
| (Dollars in thousands) | 2017 | 2016 | Change | 2017 | 2016 | Change | ||||||||||||||||||||||||||
Selling and marketing | $ | 70,209 | $ | 67,032 | $ | 3,177 | 5 | % | $ | 217,384 | $ | 202,126 | $ | 15,258 | 8 | % | ||||||||||||||||
As a percent of total revenue | 39 | % | 37 | % | 36 | % | 37 | % | ||||||||||||||||||||||||
Selling and marketing headcount, end of period | 934 | 875 | 59 | 7 | % | |||||||||||||||||||||||||||
Selling and marketing expenses include
| Three Months Ended March 31, | Change | ||||||||||||
| (Dollars in thousands) | 2019 | 2018 | |||||||||||
Selling and marketing (1) | $ | 108,865 | $ | 88,383 | $ | 20,482 | 23 | % | |||||
| As a percent of total revenue | 51 | % | 38 | % | |||||||||
Selling and marketing headcount, end of period | 1,282 | 1,082 | 200 | 18 | % | ||||||||
The increase in the nine months ended September 30, 2017 was primarily due to an increase of $4.5 million in compensation and benefits of $12.7 million, respectively, driven by increased headcount and equity compensation, and an increase in employee travel and entertainment, partially offset by a decrease in brand marketing program expenses of $2.2 million.
deferred contract commission amortization. The increase in headcount reflects our efforts to increase our sales capacity to deepen relationships with existing clients and target new accounts in existing industries, as well as to expand coverage in new industries and geographies and to increase the number of sales opportunities.
.
| Three Months Ended September 30, | Nine Months Ended September 30, | |||||||||||||||||||||||||||||||
| (Dollars in thousands) | 2017 | 2016 | Change | 2017 | 2016 | Change | ||||||||||||||||||||||||||
Research and development | $ | 41,031 | $ | 38,036 | $ | 2,995 | 8 | % | $ | 121,089 | $ | 108,530 | $ | 12,559 | 12 | % | ||||||||||||||||
As a percent of total revenue | 23 | % | 21 | % | 20 | % | 20 | % | ||||||||||||||||||||||||
Research and Development headcount, end of period | 1,474 | 1,437 | 37 | 3 | % | |||||||||||||||||||||||||||
Research and development expenses include
| Three Months Ended March 31, | Change | ||||||||||||
| (Dollars in thousands) | 2019 | 2018 | |||||||||||
Research and development (1) | $ | 50,596 | $ | 46,785 | $ | 3,811 | 8 | % | |||||
| As a percent of total revenue | 24 | % | 20 | % | |||||||||
Research and development headcount, end of period | 1,638 | 1,602 | 36 | 2 | % | ||||||||
an increase of $1.6 million in cloud hosting expenses as we expand our cloud-focused research and development activities.
| Three Months Ended September 30, | Nine Months Ended September 30, | |||||||||||||||||||||||||||||||
| (Dollars in thousands) | 2017 | 2016 | Change | 2017 | 2016 | Change | ||||||||||||||||||||||||||
General and administrative | $ | 13,133 | $ | 11,725 | $ | 1,408 | 12 | % | $ | 38,174 | $ | 34,067 | $ | 4,107 | 12 | % | ||||||||||||||||
As a percent of total revenue | 7 | % | 6 | % | 6 | % | 6 | % | ||||||||||||||||||||||||
General and administrative headcount, end of period | 407 | 371 | 36 | 10 | % | |||||||||||||||||||||||||||
General and administrative expenses include
| Three Months Ended March 31, | Change | ||||||||||||
| (Dollars in thousands) | 2019 | 2018 | |||||||||||
General and administrative (1) | $ | 12,676 | $ | 16,464 | $ | (3,788 | ) | (23 | )% | ||||
| As a percent of total revenue | 6 | % | 7 | % | |||||||||
General and administrative headcount, end of period (2) | 373 | 299 | 74 | 25 | % | ||||||||
| Three Months Ended March 31, | Change | ||||||||||||
| (Dollars in thousands) | 2019 | 2018 | |||||||||||
| Cost of revenues | $ | 4,519 | $ | 3,701 | $ | 818 | 22 | % | |||||
| Selling and marketing | 7,374 | 4,658 | 2,716 | 58 | % | ||||||||
| Research and development | 4,560 | 3,637 | 923 | 25 | % | ||||||||
| General and administrative | 1,897 | 3,113 | (1,216 | ) | (39 | )% | |||||||
| $ | 18,350 | $ | 15,109 | $ | 3,241 | 21 | % | ||||||
| Income tax benefit | $ | (3,740 | ) | $ | (3,141 | ) | $ | (599 | ) | 19 | % | ||
Stock-based compensation
| Three Months Ended September 30, | Nine Months Ended September 30, | |||||||||||||||||||||||||||||||
| (in thousands) | 2017 | 2016 | Change | 2017 | 2016 | Change | ||||||||||||||||||||||||||
Cost of revenues | $ | 3,613 | $ | 3,117 | $ | 496 | 16 | % | $ | 10,913 | $ | 8,711 | $ | 2,202 | 25 | % | ||||||||||||||||
Selling and marketing | 3,976 | 3,468 | 508 | 15 | % | 11,482 | 9,395 | 2,087 | 22 | % | ||||||||||||||||||||||
Research and development | 3,420 | 2,260 | 1,160 | 51 | % | 10,306 | 7,480 | 2,826 | 38 | % | ||||||||||||||||||||||
General and administrative | 2,480 | 1,983 | 497 | 25 | % | 7,228 | 4,706 | 2,522 | 54 | % | ||||||||||||||||||||||
Acquisition-related | — | (10 | ) | 10 | (100 | )% | — | 342 | (342 | ) | (100 | )% | ||||||||||||||||||||
|
|
|
|
|
|
|
| |||||||||||||||||||||||||
Total stock-based compensation before tax | $ | 13,489 | $ | 10,818 | $ | 2,671 | 25 | % | $ | 39,929 | $ | 30,634 | $ | 9,295 | 30 | % | ||||||||||||||||
|
|
|
|
|
|
|
| |||||||||||||||||||||||||
Income tax benefit | $ | (4,129 | ) | $ | (3,227 | ) | $ | (902 | ) | 28 | % | $ | (12,231 | ) | $ | (8,917 | ) | $ | (3,314 | ) | 37 | % | ||||||||||
The increases were primarily due to the increased value of our annual periodic equity awards granted in March 20162019 and 2017.2018. These awards generally have a five-year vesting schedule.
Amortization of intangibles
| Three Months Ended September 30, | Nine Months Ended September 30, | |||||||||||||||||||||||||||||||
| (Dollars in thousands) | 2017 | 2016 | Change | 2017 | 2016 | Change | ||||||||||||||||||||||||||
Cost of revenue | $ | 1,232 | $ | 1,642 | $ | (410 | ) | (25 | )% | $ | 3,871 | $ | 4,626 | $ | (755 | ) | (16 | )% | ||||||||||||||
Selling and marketing | 1,873 | 1,867 | 6 | — | % | 5,608 | 5,274 | 334 | 6 | % | ||||||||||||||||||||||
General and administrative | — | 90 | (90 | ) | (100 | )% | — | 268 | (268 | ) | (100 | )% | ||||||||||||||||||||
|
|
|
|
|
|
|
| |||||||||||||||||||||||||
| $ | 3,105 | $ | 3,599 | $ | (494 | ) | (14 | )% | $ | 9,479 | $ | 10,168 | $ | (689 | ) | (7 | )% | |||||||||||||||
|
|
|
|
|
|
|
| |||||||||||||||||||||||||
| Three Months Ended March 31, | Change | ||||||||||||
| (Dollars in thousands) | 2019 | 2018 | |||||||||||
| Foreign currency transaction loss | $ | (3,712 | ) | $ | (1,085 | ) | $ | (2,627 | ) | 242 | % | ||
| Interest income, net | 723 | 764 | (41 | ) | (5 | )% | |||||||
| Other income, net | — | 363 | (363 | ) | (100 | )% | |||||||
| $ | (2,989 | ) | $ | 42 | $ | (3,031 | ) | * | |||||
Non-operating (expense)/income, net
| Three Months Ended September 30, | Nine Months Ended September 30, | |||||||||||||||||||||||||||||||
| (Dollars in thousands) | 2017 | 2016 | Change | 2017 | 2016 | Change | ||||||||||||||||||||||||||
Foreign currency transaction (loss)/gain | $ | (552 | ) | $ | 1,082 | $ | (1,634 | ) | n/m | $ | (793 | ) | $ | 2,764 | $ | (3,557 | ) | n/m | ||||||||||||||
Interest income, net | 144 | 172 | $ | (28 | ) | (16 | )% | 470 | 650 | (180 | ) | (28 | )% | |||||||||||||||||||
Other (expense)/income, net | — | (1,237 | ) | $ | 1,237 | (100 | )% | 287 | (4,891 | ) | 5,178 | n/m | ||||||||||||||||||||
|
|
|
|
|
|
|
| |||||||||||||||||||||||||
| $ | (408 | ) | $ | 17 | $ | (425 | ) | n/m | $ | (36 | ) | $ | (1,477 | ) | $ | 1,441 | (98 | )% | ||||||||||||||
|
|
|
|
|
|
|
| |||||||||||||||||||||||||
n/m - not meaningful
In May 2017, we discontinued our forward contracts program; however, we will continue to evaluate periodically our foreign exchange exposures and mayre-initiate this program if it is deemed necessary.
Historically, we have usedunrealized losses on foreign currency forward contracts (“forward contracts”) to hedgedenominated cash and receivables of our exposureU.K subsidiary due to fluctuations in foreign currency exchange rates associated with our foreign currency denominated cash, accounts receivable,as the British Pound strengthened against the Euro and intercompany receivables and payables held primarily by the U.S. parent company and its United Kingdom (“U.K.”) subsidiary. See Note 4 “Derivative Instruments” of this Quarterly Report on Form 10-Q for additional information.
The total change in the fair value of our foreign currency forward contracts recorded in other income (expense), net, during the three months ended September 30, 2016 was a loss of $1.2 million. The total change in the fair value of our foreign currency forward contracts recorded in other (expense)/income, net, during the nine months ended September 30, 2017 and 2016 was a gain of $0.3 million and a loss of $5 million, respectively.
(Benefit)/provision fordollar.
| Three Months Ended September 30, | Nine Months Ended September 30, | |||||||||||||||||||||||||||||||
| (Dollars in thousands) | 2017 | 2016 | Change | 2017 | 2016 | Change | ||||||||||||||||||||||||||
(Benefit)/provision for income taxes | $ | (12,885 | ) | $ | 2,214 | $ | (15,099 | ) | n/m | $ | (17,952 | ) | $ | 6,269 | $ | (24,221 | ) | n/m | ||||||||||||||
Effective income tax rate | 88 | % | 40 | % | (96 | )% | 26 | % | ||||||||||||||||||||||||
n/m - not meaningful
The (benefit)/provision for income taxes represents current and future amounts for federal, state, and foreign taxes.
The increase in the effective income tax rate in the three months ended September 30, 2017 is primarily due to the significant increase of $3.5 million in excess tax benefits generated by our stock compensation plans on significantly lower income before (benefit)/provision for income taxes, which decreased by $20.2 million.
The decrease in the effective income tax rate in the nine months ended September 30, 2017 is primarily due to the significant increase of $19.1 million in excess tax benefits generated by our stock compensation plans, on significantly lower income before (benefit)/provision for income taxes, which decreased by $5.8 million.
| Three Months Ended March 31, | Change | ||||||||||||
| (Dollars in thousands) | 2019 | 2018 | |||||||||||
| Benefit from income taxes | $ | (8,300 | ) | $ | (4,222 | ) | $ | (4,078 | ) | 97 | % | ||
| Effective income tax rate | 22 | % | (53 | )% | |||||||||
Liquidity
| Nine Months Ended September 30, | ||||||||
| (in thousands) | 2017 | 2016 | ||||||
Cash provided by (used in): | ||||||||
Operating activities | $ | 113,926 | $ | 20,556 | ||||
Investing activities | (11,966 | ) | (2,859 | ) | ||||
Financing activities | (44,040 | ) | (43,031 | ) | ||||
Effect of exchange rate on cash | 2,054 | (1,309 | ) | |||||
|
|
|
| |||||
Net increase/(decrease) in cash and cash equivalents | $ | 59,974 | $ | (26,643 | ) | |||
|
|
|
| |||||
| (in thousands) | September 30, 2017 | December 31, 2016 | ||||||
Total cash, cash equivalents, and marketable securities | $ | 194,380 | $ | 133,761 | ||||
Base Erosion and Anti-Abuse Tax (“BEAT”) provisions of the Tax Reform Act. The Company’s effective income tax rate was also affected by excess tax benefits from stock-based compensation, an increase in U.S. research and development tax credits, and a decrease in uncertain tax positions as a result of the lapse of the statute of limitations on certain foreign reserves.
| Three Months Ended March 31, | |||||||
| (in thousands) | 2019 | 2018 | |||||
| Cash provided by (used in): | |||||||
| Operating activities | $ | 22,703 | $ | 55,655 | |||
| Investing activities | (1,466 | ) | (31,278 | ) | |||
| Financing activities | (25,587 | ) | (23,052 | ) | |||
| Effect of exchange rates on cash and cash equivalents | 295 | 2,186 | |||||
| Net (decrease) increase in cash and cash equivalents | $ | (4,055 | ) | $ | 3,511 | ||
| (in thousands) | March 31, 2019 | December 31, 2018 | |||||
| Held by U.S. entities | $ | 141,051 | $ | 143,533 | |||
| Held by foreign entities | 61,120 | 63,890 | |||||
| Total cash, cash equivalents, and marketable securities | $ | 202,171 | $ | 207,423 | |||
As of September 30, 2017, approximately $61.1 million of our cash and cash equivalents was held in our foreign subsidiaries.
pay.
The primary driver during the nine months ended September 30, 2016 was net income of $18.2 million.
Future Cash Receipts from Committed License and Cloud Arrangements
As of September 30, 2017, none of the amounts shown in the table below had been billed and no revenue had been recognized.
The below amounts for 2018 and subsequent periods may not be recognized in the periods shown below as a result of the adoption of the new revenue recognition standard (ASC 606). (See Note 2. New Accounting Pronouncements contained elsewhere in this Quarterly Report on Form
| September 30, 2017 | ||||||||||||
| (in thousands) | Term and cloud contracts | Perpetual contracts (1) | Total | |||||||||
Remainder of 2017 | $ | 37,723 | $ | 13,274 | $ | 50,997 | ||||||
2018 | 150,629 | 21,213 | 171,842 | |||||||||
2019 | 125,165 | 10,033 | 135,198 | |||||||||
2020 | 85,939 | 1,572 | 87,511 | |||||||||
2021 | 38,203 | 367 | 38,570 | |||||||||
2022 and thereafter | 12,876 | — | 12,876 | |||||||||
|
|
|
|
|
| |||||||
Total | $ | 450,535 | $ | 46,459 | $ | 496,994 | ||||||
|
|
|
|
|
| |||||||
Total contractual future cash receipts due from our existing license and cloud arrangements were approximately $376.3 million as of September 30, 2016.
Cash used in investing activities
During
During the nine months ended September 30, 2016, we acquired OpenSpan for $48.8 million, net of cash acquired, and invested $15.3 million primarily in internally developed software and leasehold improvements at our corporate headquarters, partially offset by proceeds received from the sales of marketable debt securities of $62.3 million.
new investments.
Since 2004, our Board of Directors has approved annual
| Three Months Ended March 31, | |||
| (in thousands) | 2019 | ||
| January 1 | $ | 6,620 | |
Authorizations (2) | 60,000 | ||
| Repurchases | (7,586 | ) | |
| March 31, | $ | 59,034 | |
The following table is a summary
| Nine Months Ended September 30, | ||||||||||||||||||||||||
| 2017 | 2016 | |||||||||||||||||||||||
| (in thousands) | Shares | Amount | Authorization Remaining Under Publicly Announced Share Repurchased Programs | Shares | Amount | Authorization Remaining Under Publicly Announced Share Repurchased Programs | ||||||||||||||||||
Balance as of January 1, | $ | 39,385 | $ | 40,534 | ||||||||||||||||||||
Authorizations | — | — | — | — | — | 25,879 | ||||||||||||||||||
Repurchase for net settlement of tax under stock-based compensation | 682 | (34,791 | ) | — | 414 | (10,791 | ) | — | ||||||||||||||||
Repurchases paid under authorized share repurchase program | 68 | (2,986 | ) | (2,986 | ) | 1,028 | (25,530 | ) | (25,530 | ) | ||||||||||||||
Repurchases unsettled | — | — | — | 6 | (177 | ) | (177 | ) | ||||||||||||||||
|
|
|
|
|
|
|
|
|
|
|
| |||||||||||||
Activity in Period | 750 | $ | (37,777 | ) | $ | (2,986 | ) | 1,448 | $ | (36,498 | ) | $ | 172 | |||||||||||
|
|
|
| |||||||||||||||||||||
Balance as of September 30, | $ | 36,399 | $ | 40,706 | ||||||||||||||||||||
|
|
|
| |||||||||||||||||||||
In additionprogram to June 30, 2020 and increased the shareamount of common stock we are authorized to repurchase by $60 million between March 15, 2019 and June 30, 2020.
| Three Months Ended March 31, | |||||||||||||
| 2019 | 2018 | ||||||||||||
| (in thousands) | Shares | Amount | Shares | Amount | |||||||||
| Tax withholdings for net settlement of equity awards | 232 | $ | 14,838 | 270 | $ | 15,575 | |||||||
Stock repurchase program (1) | |||||||||||||
| Repurchases paid | 141 | 7,387 | 89 | 4,998 | |||||||||
| Repurchases unsettled at period end | 3 | 199 | 12 | 690 | |||||||||
Activity in period (2) | 376 | $ | 22,424 | 371 | $ | 21,263 | |||||||
programs.
(2)During theThese amounts have been excluded from the table above.
| Nine Months Ended September 30, | ||||||||
| (per share) | 2017 | 2016 | ||||||
Dividends Declared | $ | 0.09 | $ | 0.09 | ||||
Dividends Paid | $ | 0.09 | $ | 0.09 | ||||
| Three Months Ended March 31, | |||||||
| (in thousands) | 2019 | 2018 | |||||
| Dividend payments to shareholders | $ | 2,363 | $ | 2,344 | |||
Market risk represents
As of September 30, 2017, we did not have any forward contracts outstanding. See Note 4 “Derivative Instruments” of this Quarterly Report on Form10-Q for further discussion.
Other than the item discussed above, there were no significant changes to our quantitative and qualitative disclosures about market risk during the first nine months ended September 30, 2017. See Part II, Item 7A. Quantitative and Qualitative Disclosures about Market Risk includeddisclosed in our Annual Report on Form10-K for the year ended December 31, 2016 for a more complete discussion of our market risk exposure.
procedures
financial reporting
| (in thousands, except per share amounts) | Total Number of Shares Purchased (1) | Average Price Paid per Share (1) | Total Number of Shares Purchased as Part of Publicly Announced Share Repurchase Program | Approximate Dollar Value of Shares That May Yet Be Purchased at Period End Under Publicly Announced Share Repurchase Programs (2) | |||||||||
| January 1, 2019 - January 31, 2019 | 153 | $ | 51.30 | 129 | $ | 18 | |||||||
| February 1, 2019 - February 28, 2019 | 129 | $ | 63.81 | — | $ | 18 | |||||||
| March 1, 2019 - March 31, 2019 | 285 | $ | 64.97 | 15 | $ | 59,034 | |||||||
| 567 | $ | 61.03 | |||||||||||
Period | Total Number of Shares Purchased (in thousands) | Average Price Paid per Share | Total Number of Shares Purchased as Part of Publicly Announced Share Repurchase Program (1) (in thousands) | Approximate Dollar Value of Shares That May Yet Be Purchased at Period End Under Publicly Announced Share Repurchased Programs (1) (in thousands) | ||||||||||||
July 1, 2017 - July 31, 2017 | 12 | $ | 58.54 | — | $ | 36,399 | ||||||||||
August 1, 2017 - August 31, 2017 | 55 | 56.16 | — | 36,399 | ||||||||||||
September 1, 2017 - September 30, 2017 | 108 | 56.56 | — | 36,399 | ||||||||||||
|
| |||||||||||||||
Total | 175 | $ | 56.57 | |||||||||||||
|
| |||||||||||||||
The following exhibits are filed or furnished, as the case may be made from time to time on the open market or in privately negotiated transactions. Shares may be repurchased in such amounts as partmarket conditions warrant, subject to regulatory and other considerations. We have established a pre-arranged stock repurchase plan, intended to comply with the requirements of this report.
EXHIBIT INDEX
Exhibit No. | Description | |
| 31.1 | ||
| 31.2 | ||
| 101.INS | XBRL Instance document. | |
| 101.SCH | XBRL Taxonomy Extension Schema Document. | |
| 101.CAL | XBRL Taxonomy Calculation Linkbase Document. | |
| 101.DEF | XBRL Taxonomy Extension Definition Linkbase Document. | |
| 101.LAB | XBRL Taxonomy Label Linkbase Document. | |
| 101.PRE | XBRL Taxonomy Presentation Linkbase Document. | |
| Dated: | May 7, 2019 | By: | /s/ KENNETH STILLWELL | ||||||
| Kenneth Stillwell | |||||||||
| Chief Financial Officer and Chief Administrative Officer | |||||||||
| (Principal Financial Officer) | |||||||||
27