FORM10-Q
(Mark One)
| ☒ | Quarterly Report pursuant to Section 13 or 15(d) of the Securities Exchange Act of 1934 | ||||
| For the quarterly period ended June 30, 2021 | |||||
For the quarterly period ended September 30, 2017
| ☐ | Transition Report pursuant to Section 13 or 15(d) of the Securities Exchange Act of 1934 | ||||
For the transition period fromto
| Massachusetts | 04-2787865 | |||||||||||||||||||||||
(State or other jurisdiction of incorporation or organization) | (IRS Employer Identification No.) | |||||||||||||||||||||||
| Title of each class | Trading symbol(s) | Name of each exchange on which registered | ||||||
| Common Stock, $.01 par value per share | PEGA | NASDAQ Global Select Market | ||||||
| Large accelerated filer | x | Accelerated filer | ☐ | ||||||||||||||||||||||||||
| Non-accelerated filer | ☐ | Smaller reporting company | ☐ | ||||||||||||||||||||||||||
| Emerging growth company | ☐ | ||||||||||||||||||||||||||||
July 19, 2021.
PART Item 1. Unaudited Condensed Consolidated Statements of Stockholders’ Equity for the six months ended June 30, 2021 and 2020 Notes to Unaudited Condensed Consolidated Financial Statements Item 2. Management’s Discussion and Analysis of Financial Condition and Results of Operations Item 3. Quantitative and Qualitative Disclosures About Market Risk Item 2. Unregistered Sales of Equity Securities and Use of Proceeds Assets Current assets: Cash and cash equivalents Marketable securities Total cash, cash equivalents, and marketable securities Trade accounts receivable, net of allowance of $6,189 and $4,126 Income taxes receivable Other current assets Total current assets Property and equipment, net Deferred income taxes Long-term other assets Intangible assets, net Goodwill Total assets Liabilities and Stockholders’ Equity Current liabilities: Accounts payable Accrued expenses Accrued compensation and related expenses Deferred revenue Total current liabilities Income taxes payable Long-term deferred revenue Other long-term liabilities Total liabilities Stockholders’ equity: Preferred stock, 1,000 shares authorized; no shares issued and outstanding Common stock, 200,000 shares authorized; 77,839 shares and 76,591 shares issued and outstanding Additionalpaid-in capital Retained earnings Accumulated other comprehensive loss Total stockholders’ equity Total liabilities and stockholders’ equity Revenue: Software license Maintenance Services Total revenue Cost of revenue: Software license Maintenance Services Total cost of revenue Gross profit Operating expenses: Selling and marketing Research and development General and administrative Acquisition-related Total operating expenses (Loss)/income from operations Foreign currency transaction (loss)/gain Interest income, net Other income/(expense), net (Loss)/income before (benefit)/provision for income taxes (Benefit)/provision for income taxes Net (loss)/income (Loss)/earnings per share: Basic Diluted Weighted-average number of common shares outstanding: Basic Diluted Cash dividends declared per share Net (loss)/income Other comprehensive income/(loss), net of tax Unrealized gain/(loss) onavailable-for-sale marketable securities, net of tax Foreign currency translation adjustments Total other comprehensive income/(loss), net of tax Comprehensive (loss)/income Operating activities: Net income Adjustments to reconcile net income to cash provided by operating activities: Deferred income taxes Depreciation and amortization Stock-based compensation expense Foreign currency transaction loss/(gain) Othernon-cash Change in operating assets and liabilities: Trade accounts receivable Income taxes receivable and other current assets Accounts payable and accrued expenses Deferred revenue Other long-term assets and liabilities Cash provided by operating activities Investing activities: Purchases of marketable securities Proceeds from maturities and called marketable securities Sales of marketable securities Payments for acquisitions, net of cash acquired Investment in property and equipment Cash used in investing activities Financing activities: Dividend payments to shareholders Common stock repurchases for tax withholdings for net settlement of equity awards Common stock repurchases under share repurchase programs Cash used in financing activities Effect of exchange rates on cash and cash equivalents Net increase/(decrease) in cash and cash equivalents Cash and cash equivalents, beginning of period Cash and cash equivalents, end of period 2020. 2021. approximately 1.3 years. PEGASYSTEMS INC.Index to FormQUARTERLY REPORT ON FORM 10-QTABLE OF CONTENTSPage I—I - FINANCIAL INFORMATIONUnaudited Condensed Consolidated Financial Statements2020 22020 32020 4Unaudited Condensed Consolidated Statements of Cash Flows for the ninesix months ended SeptemberJune 30, 20172021 and 2016202056152525PART II—OTHER INFORMATIONItem 1A. Risk Factors 252526272PART I—I - FINANCIAL INFORMATIONITEM 1.UNAUDITED CONDENSED CONSOLIDATED FINANCIAL STATEMENTSPEGASYSTEMS INC.UNAUDITED CONDENSED CONSOLIDATED BALANCE SHEETS(in thousands) September 30,
2017 December 31,
2016 $ 130,568 $ 70,594 63,812 63,167 194,380 133,761 191,161 265,028 34,864 14,155 17,679 12,188 438,084 425,132 39,849 38,281 73,459 69,898 5,982 3,990 34,755 44,191 72,941 73,164 $ 665,070 $ 654,656 $ 12,535 $ 14,414 39,681 36,751 53,869 60,660 160,931 175,647 267,016 287,472 4,774 4,263 6,130 10,989 15,449 16,043 293,369 318,767 — — 778 766 146,728 143,903 227,953 198,315 (3,758 ) (7,095 ) 371,701 335,889 $ 665,070 $ 654,656 ITEM 1. FINANCIAL STATEMENTSPEGASYSTEMS INC.UNAUDITED CONDENSED CONSOLIDATED BALANCE SHEETS(in thousands)June 30, 2021 December 31, 2020 Assets Current assets: Cash and cash equivalents $ 139,878 $ 171,899 Marketable securities 271,459 293,269 Total cash, cash equivalents, and marketable securities 411,337 465,168 Accounts receivable 166,226 215,827 Unbilled receivables 236,451 207,155 Other current assets 96,215 88,760 Total current assets 910,229 976,910 Unbilled receivables 144,065 113,278 Goodwill 82,173 79,231 Other long-term assets 466,103 434,843 Total assets $ 1,602,570 $ 1,604,262 Liabilities and stockholders’ equity Current liabilities: Accounts payable $ 22,931 $ 24,028 Accrued expenses 64,093 59,261 Accrued compensation and related expenses 84,900 123,012 Deferred revenue 242,194 232,865 Other current liabilities 16,126 20,969 Total current liabilities 430,244 460,135 Convertible senior notes, net 589,092 518,203 Operating lease liabilities 42,063 59,053 Other long-term liabilities 18,703 24,699 Total liabilities 1,080,102 1,062,090 Stockholders’ equity: Preferred stock, 1,000 shares authorized; NaN issued 0 0 Common stock, 200,000 shares authorized; 81,456 and 80,890 shares issued and outstanding atJune 30, 2021 and December 31, 2020, respectively815 809 Additional paid-in capital 147,670 204,432 Retained earnings 375,069 339,879 Accumulated other comprehensive (loss) (1,086) (2,948) Total stockholders’ equity 522,468 542,172 Total liabilities and stockholders’ equity $ 1,602,570 $ 1,604,262 See notes to unaudited condensed consolidated financial statements.PEGASYSTEMS INC.UNAUDITED CONDENSED CONSOLIDATED STATEMENTS OF OPERATIONS(in thousands, except per share amounts) Three Months Ended
September 30, Nine Months Ended
September 30, 2017 2016 2017 2016 $ 41,793 $ 68,833 $ 195,220 $ 207,849 62,204 55,038 180,759 163,174 75,818 58,931 225,063 179,633 179,815 182,802 601,042 550,656 1,276 1,313 3,826 3,646 6,716 6,659 20,945 18,889 61,739 52,465 180,925 154,512 69,731 60,437 205,696 177,047 110,084 122,365 395,346 373,609 70,209 67,032 217,384 202,126 41,031 38,036 121,089 108,530 13,133 11,725 38,174 34,067 — 74 — 2,903 124,373 116,867 376,647 347,626 (14,289 ) 5,498 18,699 25,983 (552 ) 1,082 (793 ) 2,764 144 172 470 650 — (1,237 ) 287 (4,891 ) (14,697 ) 5,515 18,663 24,506 (12,885 ) 2,214 (17,952 ) 6,269 $ (1,812 ) $ 3,301 $ 36,615 $ 18,237 (0.03 ) 0.04 0.47 0.24 (0.03 ) 0.04 0.44 0.23 77,691 76,278 77,258 76,323 77,691 79,548 82,717 79,401 $ 0.03 $ 0.03 $ 0.09 $ 0.09 3PEGASYSTEMS INC.UNAUDITED CONDENSED CONSOLIDATED STATEMENTS OF OPERATIONS(in thousands, except per share amounts)Three Months Ended
June 30,Six Months Ended
June 30,2021 2020 2021 2020 Revenue Software license $ 116,892 $ 53,323 $ 233,853 $ 147,239 Maintenance 78,782 72,222 154,343 145,917 Pega Cloud 73,293 48,838 141,151 92,304 Consulting 56,735 52,992 109,854 107,506 Total revenue 325,702 227,375 639,201 492,966 Cost of revenue Software license 656 979 1,306 1,663 Maintenance 4,995 5,591 10,781 11,167 Pega Cloud 24,051 18,988 46,608 36,521 Consulting 54,829 51,133 108,283 106,868 Total cost of revenue 84,531 76,691 166,978 156,219 Gross profit 241,171 150,684 472,223 336,747 Operating expenses Selling and marketing 156,423 127,607 305,162 263,631 Research and development 64,395 58,869 126,837 117,596 General and administrative 19,161 15,655 37,431 31,285 Total operating expenses 239,979 202,131 469,430 412,512 Income (loss) from operations 1,192 (51,447) 2,793 (75,765) Foreign currency transaction (loss) gain (403) 4,256 (5,501) (1,691) Interest income 236 242 389 849 Interest expense (1,959) (5,529) (3,839) (7,835) Gain on capped call transactions 26,309 19,419 7,192 827 Other income, net 0 0 106 1,374 Income (loss) before (benefit from) income taxes 25,375 (33,059) 1,140 (82,241) (Benefit from) income taxes (11,916) (12,319) (29,534) (36,129) Net income (loss) $ 37,291 $ (20,740) $ 30,674 $ (46,112) Earnings (loss) per share Basic $ 0.46 $ (0.26) $ 0.38 $ (0.58) Diluted $ 0.43 $ (0.26) $ 0.36 $ (0.58) Weighted-average number of common shares outstanding Basic 81,316 80,224 81,161 80,016 Diluted 90,320 80,224 86,006 80,016 See notes to unaudited condensed consolidated financial statements.PEGASYSTEMS INC.UNAUDITED CONDENSED CONSOLIDATED STATEMENTS OF COMPREHENSIVE INCOME(in thousands) Three Months Ended
September 30, Nine Months Ended
September 30, 2017 2016 2017 2016 $ (1,812 ) $ 3,301 $ 36,615 $ 18,237 22 (174 ) 148 168 549 (169 ) 3,189 (1,400 ) 571 (343 ) 3,337 (1,232 ) $ (1,241 ) $ 2,958 $ 39,952 $ 17,005 4PEGASYSTEMS INC.UNAUDITED CONDENSED CONSOLIDATED STATEMENTS OF COMPREHENSIVE INCOME (LOSS)(in thousands)Three Months Ended
June 30,Six Months Ended
June 30,2021 2020 2021 2020 Net income (loss) $ 37,291 $ (20,740) $ 30,674 $ (46,112) Other comprehensive income, net of tax Unrealized gain on available-for-sale securities 121 0 1,131 100 Foreign currency translation adjustments 1,461 2,028 731 1,514 Total other comprehensive income, net of tax $ 1,582 $ 2,028 $ 1,862 $ 1,614 Comprehensive income (loss) $ 38,873 $ (18,712) $ 32,536 $ (44,498) See notes to unaudited condensed consolidated financial statements.PEGASYSTEMS INC.UNAUDITED CONDENSED CONSOLIDATED STATEMENTS OF CASH FLOWS(in thousands) Nine Months Ended
September 30, 2017 2016 $ 36,615 $ 18,237 (2,607 ) (2,841 ) 18,703 17,896 39,929 30,634 793 (2,764 ) (89 ) 153 80,580 3,940 (25,943 ) (11,904 ) (8,546 ) (16,678 ) (25,639 ) (17,698 ) 130 1,581 113,926 20,556 (25,687 ) (22,614 ) 23,124 21,838 — 62,283 (297 ) (49,113 ) (9,106 ) (15,253 ) (11,966 ) (2,859 ) (6,941 ) (6,883 ) (34,113 ) (10,398 ) (2,986 ) (25,750 ) (44,040 ) (43,031 ) 2,054 (1,309 ) 59,974 (26,643 ) 70,594 93,026 $ 130,568 $ 66,383 5PEGASYSTEMS INC.
UNAUDITED CONDENSED CONSOLIDATED STATEMENTS OF STOCKHOLDERS’ EQUITY
(in thousands, except per share amounts)Common Stock Additional
Paid-In CapitalRetained Earnings Accumulated Other Comprehensive (Loss)Total
Stockholders’ EquityNumber
of SharesAmount December 31, 2019 79,599 $ 796 $ 140,523 $ 410,919 $ (13,228) $ 539,010 Equity component of convertible senior notes, net — — 61,604 — — 61,604 Repurchase of common stock (87) (1) (5,999) — — (6,000) Issuance of common stock for stock compensation plans 564 6 (23,017) — — (23,011) Stock-based compensation — — 23,199 — — 23,199 Cash dividends declared ($0.03 per share) — — — (2,405) — (2,405) Other comprehensive (loss) — — — — (414) (414) Net (loss) — — — (25,372) — (25,372) March 31, 2020 80,076 $ 801 $ 196,310 $ 383,142 $ (13,642) $ 566,611 Repurchase of common stock (23) — (2,199) — — (2,199) Issuance of common stock for stock compensation plans 349 3 (14,085) — — (14,082) Issuance of common stock under the employee stock purchase plan 18 — 1,403 — — 1,403 Stock-based compensation — — 25,674 —�� — 25,674 Cash dividends declared ($0.03 per share) — — — (2,413) — (2,413) Other comprehensive income — — — — 2,028 2,028 Net (loss) — — — (20,740) — (20,740) June 30, 2020 80,420 $ 804 $ 207,103 $ 359,989 $ (11,614) $ 556,282 December 31, 2020 80,890 $ 809 $ 204,432 $ 339,879 $ (2,948) $ 542,172 Cumulative-effect adjustment from adoption of ASU 2020-06, net— — (61,604) 9,399 — (52,205) Repurchase of common stock (70) (1) (9,145) — — (9,146) Issuance of common stock for stock compensation plans 402 4 (25,513) — — (25,509) Issuance of common stock under the employee stock purchase plan 24 — 2,288 — — 2,288 Stock-based compensation — — 30,100 — — 30,100 Cash dividends declared ($0.03 per share) — — — (2,438) — (2,438) Other comprehensive income — — — — 280 280 Net (loss) — — — (6,617) — (6,617) March 31, 2021 81,246 $ 812 $ 140,558 $ 340,223 $ (2,668) $ 478,925 Repurchase of common stock (81) (1) (10,245) — — (10,246) Issuance of common stock for stock compensation plans 267 3 (16,199) — — (16,196) Issuance of common stock under the employee stock purchase plan 24 1 2,858 — — 2,859 Stock-based compensation — — 30,698 — — 30,698 Cash dividends declared ($0.03 per share) — — — (2,445) — (2,445) Other comprehensive income — — — — 1,582 1,582 Net income — — — 37,291 — 37,291 June 30, 2021 81,456 $ 815 $ 147,670 $ 375,069 $ (1,086) $ 522,468 See notes to unaudited condensed consolidated financial statements.6PEGASYSTEMS INC.UNAUDITED CONDENSED CONSOLIDATED STATEMENTS OF CASH FLOWS(in thousands)Six Months Ended
June 30,2021 2020 Operating activities Net income (loss) $ 30,674 $ (46,112) Adjustments to reconcile net income (loss) to cash provided by (used in) operating activities Stock-based compensation 60,788 48,831 (Gain) on capped call transactions (7,192) (827) Deferred income taxes (28,232) (18,399) Amortization of deferred commissions 21,202 16,061 Amortization of debt discount and issuance costs 1,348 6,033 Amortization of intangible assets and depreciation 15,504 10,134 Amortization of investments 1,988 0 Foreign currency transaction loss 5,501 1,691 Other non-cash (4,869) 6,445 Change in operating assets and liabilities, net (77,302) (45,056) Cash provided by (used in) operating activities 19,410 (21,199) Investing activities Purchases of investments (51,601) (1,769) Proceeds from maturities and called investments 68,798 0 Sales of investments 2,450 1,424 Payments for acquisitions, net of cash acquired (4,993) 0 Investment in property and equipment (4,161) (19,059) Cash provided by (used in) investing activities 10,493 (19,404) Financing activities Proceeds from issuance of convertible senior notes 0 600,000 Purchase of capped calls related to convertible senior notes 0 (51,900) Payment of debt issuance costs 0 (14,527) Proceeds from employee stock purchase plan 5,146 1,403 Dividend payments to stockholders (4,865) (4,793) Common stock repurchases (60,998) (44,890) Cash (used in) provided by financing activities (60,717) 485,293 Effect of exchange rate changes on cash and cash equivalents (1,207) (942) Net (decrease) increase in cash and cash equivalents (32,021) 443,748 Cash and cash equivalents, beginning of period 171,899 68,363 Cash and cash equivalents, end of period $ 139,878 $ 512,111 See notes to unaudited condensed consolidated financial statements.7NOTE 1. BASIS OF PRESENTATIONPegasystems Inc. (together with its subsidiaries, “the Company”) has prepared the accompanying unaudited condensed consolidated financial statements pursuant to the rules and regulations of the U.S. Securities and Exchange Commission (“SEC”) regarding interim financial reporting. Accordingly, they do not include all of the information and footnotes required by accounting principles generally accepted in the United States of America (“U.S.”) for complete financial statements. These financial statements and should be read in conjunction with the Company’s audited financial statements included in the Annual Report on Form10-K for the year ended December 31, 2016.In the opinion of management, the Company has prepared the accompanying unaudited condensed consolidated financial statements on the same basis as its audited financial statements, and these financial statements include all adjustments, consisting only of normal recurring adjustments, necessary for a fair presentation of the results of the interim periods presented.All intercompany transactions and balances were eliminated in consolidation. The operating results for the interim periods presented are not necessarily indicative of the results expected for the full year 2017.NOTE 2. NEW ACCOUNTING PRONOUNCEMENTSStock-Based CompensationConvertible debtIn May 2017,August 2020, the Financial Accounting Standards Board (“FASB”) issued Accounting Standards Update (“ASU”)No. 2017-09 “Stock Compensation (Topic 718)2020-06, “Accounting for Convertible Instruments and Contracts in an Entity’s Own Equity” (“ASU 2020-06”), Scopewhich simplifies the accounting for certain financial instruments with characteristics of Modification Accounting” to clarify when toliabilities and equity, including convertible instruments and contracts in an entity’s own equity. The standard eliminates the liability and equity separation model for convertible instruments with a cash conversion feature. As a result, after adoption, entities will no longer separately present in stockholders’ equity an embedded conversion feature for such debt. Additionally, the debt discount resulting from separating the embedded conversion feature will no longer be amortized into income as interest expense over the instrument’s life. Instead, entities will account for a change to the terms or conditions ofconvertible debt instrument wholly as debt unless (1) a share-based payment awardconvertible instrument contains features that require bifurcation as a modification. Underderivative under ASC Topic 815, “Derivatives and Hedging”, or (2) a convertible debt instrument was issued at a substantial premium. The standard also requires the new guidance, modification accounting is required only ifconvertible instruments’ impact on diluted earnings per share (“EPS”) be determined using the fairif-converted method.The Company adopted ASU 2020-06 using the modified retrospective approach on January 1, 2021. Upon adoption, the book value the vesting conditions, or the classification of the award (as equity or liability) changes as a resultCompany’s Convertible Senior Notes (the “Notes”) increased by $69.5 million to $587.7 million, and retained earnings increased by $9.4 million. The retained earnings adjustment reflects the tax effected difference between the value of the change in terms or conditions. The effective date forNotes and the Company will be January 1, 2018. The Company does not expectembedded conversion feature before adoption and the adoption of this standard to have a material effect on its financial position or results of operations.Financial InstrumentsIn June 2016, the FASB issued ASUNo. 2016-13, “Financial Instruments—Credit Losses (Topic 326): Measurement of Credit Losses on Financial Instruments,” which requires measurement and recognition of expected credit losses for financial assets measured atcombined convertible instrument's amortized cost including trade accounts receivable, upon initial recognitionafter adoption.See "Note 8. Debt" for additional information.NOTE 3. MARKETABLE SECURITIESJune 30, 2021 December 31, 2020 (in thousands) Amortized Cost Unrealized Gains Unrealized Losses Fair Value Amortized Cost Unrealized Gains Unrealized Losses Fair Value Government debt $ 2,000 $ 0 $ 0 $ 2,000 $ 39,996 $ 0 $ (8) $ 39,988 Corporate debt 269,649 20 (210) 269,459 253,345 88 (152) 253,281 $ 271,649 $ 20 $ (210) $ 271,459 $ 293,341 $ 88 $ (160) $ 293,269 As of that financial asset usingJune 30, 2021, marketable securities’ maturities ranged from July 2021 to May 2024, with a forward-looking expected loss model, rather than an incurred loss model for credit losses. Credit losses relating toavailable-for-sale debt securities should be recorded through an allowance for credit losses when the fair value is below the amortized costweighted-average remaining maturity of the asset, removing the concept of “other-than-temporary” impairments. The effective date for the Company will be January 1, 2020, with early adoption permitted. The Company is currently evaluating the effect this ASU will have on its consolidated financial statements and related disclosures.LeasesIn February 2016, the FASB issued ASUNo. 2016-02, “Leases (Topic 842),” which requires lessees to record most leases on their balance sheets, recognizing a lease liability for the obligation to make lease payments and aright-of-use asset for the right to use the underlying asset for the lease term. The effective date for the Company will be January 1, 2019, with early adoption permitted. The Company expects that most of its operating lease commitments will be subject to this ASU and recognized as operating lease liabilities andright-of-use assets upon adoption with no material impact to its results of operations and cash flows.RevenueIn May 2014, the FASB issued ASUNo. 2014-09, “Revenue from Contracts with Customers (Topic 606)”. This ASU amends the guidance for revenue recognition, creating the new Accounting Standards Codification Topic 606 (“ASC 606”). ASC 606 requires entities to apportion consideration from contracts to performance obligations on a relative standalone selling price basis, based on a five-step model. Under ASC 606, revenue is recognized when a customer obtains control of a promised good or service and is recognized in an amount that reflects the consideration which the entity expects to receive in exchange for the good or service. In addition, ASC 606 requires disclosure of the nature, amount, timing, and uncertainty of revenue and cash flows arising from contracts with customers.The Company has elected the full retrospective adoption model, effective January 1, 2018. The Company’s quarterly results beginning with the quarter ending March 31, 2018 and comparative prior periods will be compliant with ASC 606. The Company’s Annual Report on Form10-K for the year ended December 31, 2018 will be the Company’s first Annual Report that will be issued in compliance with ASC 606.8PEGASYSTEMS INC.NOTES TO UNAUDITED CONDENSED CONSOLIDATED FINANCIAL STATEMENTS (continued)The Company has made significant progress on quantifyingNOTE 4. RECEIVABLES, CONTRACT ASSETS, AND DEFERRED REVENUEReceivables(in thousands) June 30, 2021 December 31, 2020 Accounts receivable $ 166,226 $ 215,827 Unbilled receivables 236,451 207,155 Long-term unbilled receivables 144,065 113,278 $ 546,742 $ 536,260 Unbilled receivablesUnbilled receivables are client-committed amounts for which revenue recognition precedes billing, and billing is solely subject to the impactpassage of its adoption and identifying necessary changes to our policies, processes, systems, and controls.The Company expects the following impacts:Currently, the Company recognizes revenue from term licenses and perpetual licenses with extended payment terms over the termUnbilled receivables by expected billing date:(Dollars in thousands) June 30, 2021 1 year or less $ 236,451 62 % 1-2 years 88,350 23 % 2-5 years 55,715 15 % $ 380,516 100 % Unbilled receivables by contract effective date:(Dollars in thousands) June 30, 2021 2021 $ 140,395 37 % 2020 131,618 34 % 2019 55,282 15 % 2018 26,688 7 % 2017 and prior 26,533 7 % $ 380,516 100 % Major clientsClients accounting for 10% or more of the agreementCompany’s total receivables:June 30, 2021 December 31, 2020 Client A 13 % * * Client accounted for less than 10% of total receivables.Contract assetsContract assets are client-committed amounts for which revenue recognized exceeds the amount billed to the client, and billing is subject to conditions other than the passage of time, such as completing a related performance obligation.(in thousands) June 30, 2021 December 31, 2020 Contract assets (1)$ 14,031 $ 15,296 Long-term contract assets (2)10,097 7,777 $ 24,128 $ 23,073 (1) Included in other current assets. (2) Included in other long-term assets.Deferred revenueDeferred revenue consists of billings and payments becomereceived in advance of revenue recognition.(in thousands) June 30, 2021 December 31, 2020 Deferred revenue $ 242,194 $ 232,865 Long-term deferred revenue (1)6,041 8,991 $ 248,235 $ 241,856 (1) Included in other long-term liabilities.The change in deferred revenue in the six months ended June 30, 2021 was primarily due or earlier if prepaid, provided all other criteria forto new billings in advance of revenue recognition, have been met, and any corresponding maintenance over the termoffset by $172.1 million of the agreement. The adoption of ASC 606 will result in revenue for performance obligations being recognized as they are satisfied. Therefore, revenue from the term and perpetual license performance obligations with extended payment terms is recognized when control is transferred to the customer. Any unrecognized license revenue from these arrangements,that was included in deferred revenue atas of December 31, 2015, will not be recognized in revenue in future periods but as a cumulative adjustment to retained earnings. Further, term license revenue from new arrangements executed in 2016 and 2017 will be recognized in full in the year that control of the license is transferred to the customer instead of over the term of the agreement. Revenue from the maintenance performance obligations is expected to be recognized on a straight-line basis over the contractual term. Due to the revenue from term and perpetual licenses with extended payment terms being recognized prior to amounts being billed to the customer, the Company expects to recognize a net contract asset on the balance sheet.2020.
PEGASYSTEMS INC.
3. MARKETABLE SECURITIES
The Company’s marketable securities
| (in thousands) | June 30, 2021 | December 31, 2020 | |||||||||
Deferred commissions (1) | $ | 109,803 | $ | 108,624 | |||||||
| Three Months Ended June 30, | Six Months Ended June 30, | ||||||||||||||||||||||
| (in thousands) | 2021 | 2020 | 2021 | 2020 | |||||||||||||||||||
Amortization of deferred commissions (1) | $ | 9,706 | $ | 7,564 | $ | 21,202 | $ | 16,061 | |||||||||||||||
| Six Months Ended June 30, | |||||||||||
| (in thousands) | 2021 | 2020 | |||||||||
| January 1, | $ | 79,231 | $ | 79,039 | |||||||
| Acquisition | 2,701 | 0 | |||||||||
| Currency translation adjustments | 241 | (364) | |||||||||
| June 30, | $ | 82,173 | $ | 78,675 | |||||||
| (in thousands) | Amortized Cost | Unrealized Gains | Unrealized Losses | Fair Value | ||||||||||||
September 30, 2017 | ||||||||||||||||
Municipal bonds | $ | 32,764 | $ | 12 | �� | $ | (17 | ) | $ | 32,759 | ||||||
Corporate bonds | 31,079 | 12 | (38 | ) | 31,053 | |||||||||||
|
|
|
|
|
|
|
| |||||||||
| $ | 63,843 | $ | 24 | $ | (55 | ) | $ | 63,812 | ||||||||
|
|
|
|
|
|
|
| |||||||||
December 31, 2016 | ||||||||||||||||
Municipal bonds | $ | 36,746 | $ | — | $ | (139 | ) | $ | 36,607 | |||||||
Corporate bonds | 26,610 | 1 | (51 | ) | 26,560 | |||||||||||
|
|
|
|
|
|
|
| |||||||||
| $ | 63,356 | $ | 1 | $ | (190 | ) | $ | 63,167 | ||||||||
|
|
|
|
|
|
|
| |||||||||
As of September 30, 2017,recorded at cost and amortized using the Company did not hold any investments with unrealized losses that are considered to be other-than-temporary.
As of September 30, 2017, remaining maturities of marketable debt securities ranged from October 2017 to September 2020, with a weighted-average remaining maturity of approximately 14 months.
4. DERIVATIVE INSTRUMENTS
In May 2017, the Company discontinued its forward contracts program; however, it will continue to evaluate periodically its foreign exchange exposures and mayre-initiate this program if it is deemed necessary.
The Company has historically used foreign currency forward contracts (“forward contracts”) to hedge its exposure to fluctuationsstraight-line method over their estimated useful lives.
| June 30, 2021 | |||||||||||||||||||||||
| (in thousands) | Useful Lives | Cost | Accumulated Amortization | Net Book Value (1) | |||||||||||||||||||
| Client-related | 4-10 years | $ | 63,186 | $ | (56,638) | $ | 6,548 | ||||||||||||||||
| Technology | 2-10 years | 67,142 | (57,644) | 9,498 | |||||||||||||||||||
| Other | 1-5 years | 5,361 | (5,361) | 0 | |||||||||||||||||||
| $ | 135,689 | $ | (119,643) | $ | 16,046 | ||||||||||||||||||
At December 31, 2016, the total notional value of the Company’s outstanding forward contracts was $128.4 million.
The fair value of the Company’s outstanding forward contracts was as follows:
| December 31, 2016 | ||||||||
| (in thousands) | Recorded In: | Fair Value | ||||||
Asset Derivatives | ||||||||
Foreign currency forward contracts | Other current assets | $ | 628 | |||||
Liability Derivatives | ||||||||
Foreign currency forward contracts | Accrued expenses | $ | 883 | |||||
As of September 30, 2017, the Company did not have any forward contracts outstanding.
The Company had forward contracts outstanding with total notional values as of September 30, 2016 as follows:
| (in thousands) | ||||
Euro | € | 21,810 | ||
British pound | £ | 5,919 | ||
Australian dollar | A$ | 19,515 | ||
United States dollar | $ | 59,450 | ||
other long-term assets.
| December 31, 2020 | |||||||||||||||||||||||
| (in thousands) | Useful Lives | Cost | Accumulated Amortization | Net Book Value (1) | |||||||||||||||||||
| Client-related | 4-10 years | $ | 63,168 | $ | (55,877) | $ | 7,291 | ||||||||||||||||
| Technology | 2-10 years | 64,843 | (56,386) | 8,457 | |||||||||||||||||||
| Other | 1-5 years | 5,361 | (5,361) | 0 | |||||||||||||||||||
| $ | 133,372 | $ | (117,624) | $ | 15,748 | ||||||||||||||||||
| Three Months Ended June 30, | Six Months Ended June 30, | ||||||||||||||||||||||
| (in thousands) | 2021 | 2020 | 2021 | 2020 | |||||||||||||||||||
| Cost of revenue | $ | 629 | $ | 647 | $ | 1,258 | $ | 1,294 | |||||||||||||||
| Selling and marketing | 373 | 370 | 746 | 740 | |||||||||||||||||||
| $ | 1,002 | $ | 1,017 | $ | 2,004 | $ | 2,034 | ||||||||||||||||
| (in thousands) | June 30, 2021 | ||||
| 2021 | $ | 1,983 | |||
| 2022 | 3,886 | ||||
| 2023 | 3,618 | ||||
| 2024 | 2,849 | ||||
| 2025 | 2,509 | ||||
| 2026 and thereafter | 1,201 | ||||
| $ | 16,046 | ||||
| Three Months Ended June 30, | Six Months Ended June 30, | ||||||||||||||||||||||
| (in thousands) | 2021 | 2020 | 2021 | 2020 | |||||||||||||||||||
Fixed lease costs (1) | $ | (3,972) | $ | 4,943 | $ | (3,672) | $ | 9,761 | |||||||||||||||
| Short-term lease costs | 515 | 371 | 974 | 826 | |||||||||||||||||||
| Variable lease costs | 1,340 | 969 | 2,727 | 2,247 | |||||||||||||||||||
| $ | (2,117) | $ | 6,283 | $ | 29 | $ | 12,834 | ||||||||||||||||
| (in thousands) | June 30, 2021 | December 31, 2020 | |||||||||
Right of use assets (1) | $ | 51,058 | $ | 67,651 | |||||||
Lease liabilities (2) | $ | 13,682 | $ | 18,541 | |||||||
| Long-term lease liabilities | $ | 42,063 | $ | 59,053 | |||||||
| June 30, 2021 | December 31, 2020 | ||||||||||
| Weighted-average remaining lease term | 4.9 years | 4.7 years | |||||||||
Weighted-average discount rate (1) | 4.6 | % | 5.4 | % | |||||||
| (in thousands) | June 30, 2021 | ||||
| Remainder of 2021 | $ | 8,783 | |||
| 2022 | 13,888 | ||||
| 2023 | 13,300 | ||||
| 2024 | 10,021 | ||||
| 2025 | 6,913 | ||||
| 2026 | 2,653 | ||||
| Thereafter | 7,170 | ||||
| Total lease payments | 62,728 | ||||
Less: imputed interest (1) | (6,983) | ||||
| $ | 55,745 | ||||
| Six Months Ended June 30, | |||||||||||
| (in thousands) | 2021 | 2020 | |||||||||
| Cash paid for leases | $ | 11,605 | $ | 10,945 | |||||||
| Right of use assets recognized for new leases and amendments (non-cash) | $ | 10,160 | $ | 10,077 | |||||||
| (in thousands) | June 30, 2021 | December 31, 2020 | |||||||||
| Principal | $ | 600,000 | $ | 600,000 | |||||||
| Unamortized debt discount | 0 | (71,222) | |||||||||
| Unamortized issuance costs | (10,908) | (10,575) | |||||||||
| Convertible senior notes, net | $ | 589,092 | $ | 518,203 | |||||||
| Conversion options | $ | — | $ | 84,120 | |||||||
| Issuance costs | 0 | (2,037) | |||||||||
| Deferred taxes | 0 | (20,479) | |||||||||
| Additional paid-in capital | $ | 0 | $ | 61,604 | |||||||
| Three Months Ended June 30, | Six Months Ended June 30, | ||||||||||||||||||||||
| (in thousands) | 2021 | 2020 | 2021 | 2020 | |||||||||||||||||||
| Contractual interest expense (0.75% coupon) | $ | 1,125 | $ | 1,125 | $ | 2,250 | $ | 1,575 | |||||||||||||||
| Amortization of debt discount | 0 | 3,757 | 0 | 5,253 | |||||||||||||||||||
| Amortization of issuance costs | 675 | 558 | 1,348 | 780 | |||||||||||||||||||
| $ | 1,800 | $ | 5,440 | $ | 3,598 | $ | 7,608 | ||||||||||||||||
| Six Months Ended June 30, | |||||||||||
| 2021 | 2020 | ||||||||||
| Weighted-average effective interest rate | 1.2 | % | 4.3 | % | |||||||
| June 30, 2021 | |||||||||||||||||
| (in thousands) | Principal | Interest | Total | ||||||||||||||
| 2021 | $ | 0 | $ | 2,250 | $ | 2,250 | |||||||||||
| 2022 | 0 | 4,500 | 4,500 | ||||||||||||||
| 2023 | 0 | 4,500 | 4,500 | ||||||||||||||
| 2024 | 0 | 4,500 | 4,500 | ||||||||||||||
| 2025 | 600,000 | 1,488 | 601,488 | ||||||||||||||
| $ | 600,000 | $ | 17,238 | $ | 617,238 | ||||||||||||
| Six Months Ended June 30, | |||||||||||
| (in thousands) | 2021 | 2020 | |||||||||
| January 1, | $ | 83,597 | $ | 0 | |||||||
| Issuance | 0 | 51,900 | |||||||||
| Fair value adjustment | 7,192 | 827 | |||||||||
| June 30, | $ | 90,789 | $ | 52,727 | |||||||
| Three Months Ended September 30, | Nine Months Ended September 30, | |||||||||||||||
| (in thousands) | 2017 | 2016 | 2017 | 2016 | ||||||||||||
Gain (loss) from the change in the fair value of forward contracts included in other income (expense), net | $ | — | $ | (1,237 | ) | $ | 286 | $ | (4,955 | ) | ||||||
Foreign currency transaction (loss) gain from the remeasurement of foreign currency assets and liabilities | (552 | ) | 1,082 | (793 | ) | 2,764 | ||||||||||
|
|
|
|
|
|
|
| |||||||||
| $ | (552 | ) | $ | (155 | ) | $ | (507 | ) | $ | (2,191 | ) | |||||
|
|
|
|
|
|
|
| |||||||||
5.affiliate transactions.
recurring basis
PEGASYSTEMS INC.
NOTES TO UNAUDITED CONDENSED CONSOLIDATED FINANCIAL STATEMENTS (continued)
underlying equity security. The Company’s assetsventure investments are recorded at fair value based on valuation methods, including observable public companies and transaction prices and unobservable inputs, including the volatility, rights, and obligations of the securities the Company holds.
| June 30, 2021 | December 31, 2020 | ||||||||||||||||||||||||||||||||||||||||||||||
| (in thousands) | Level 1 | Level 2 | Level 3 | Total | Level 1 | Level 2 | Level 3 | Total | |||||||||||||||||||||||||||||||||||||||
| Cash equivalents | $ | 4,650 | $ | 0 | $ | 0 | $ | 4,650 | $ | 42,339 | $ | 14,000 | $ | 0 | $ | 56,339 | |||||||||||||||||||||||||||||||
| Marketable securities | $ | 0 | $ | 271,459 | $ | 0 | $ | 271,459 | $ | 0 | $ | 293,269 | $ | 0 | $ | 293,269 | |||||||||||||||||||||||||||||||
Capped Call Transactions (1) | $ | 0 | $ | 90,789 | $ | 0 | $ | 90,789 | $ | 0 | $ | 83,597 | $ | 0 | $ | 83,597 | |||||||||||||||||||||||||||||||
Venture investments (1) (2) | $ | 0 | $ | 0 | $ | 9,779 | $ | 9,779 | $ | 0 | $ | 0 | $ | 8,345 | $ | 8,345 | |||||||||||||||||||||||||||||||
| Six Months Ended June 30, | |||||||||||
| (in thousands) | 2021 | 2020 | |||||||||
| January 1, | $ | 8,345 | $ | 4,871 | |||||||
| New investments | 500 | 1,769 | |||||||||
| Sales of investments | (400) | (1,424) | |||||||||
| Changes in foreign exchange rates | 14 | (50) | |||||||||
| Changes in fair value: | |||||||||||
| included in other income | 100 | 1,374 | |||||||||
| included in other comprehensive income | 1,220 | 100 | |||||||||
| June 30, | $ | 9,779 | $ | 6,640 | |||||||
| Fair Value Measurements at Reporting Date Using | Total | |||||||||||||||||||
| (in thousands) | Level 1 | Level 2 | ||||||||||||||||||
September 30, 2017 | ||||||||||||||||||||
Fair Value Assets: | ||||||||||||||||||||
Money market funds | $ | 655 | $ | — | $ | 655 | ||||||||||||||
Marketable securities: | ||||||||||||||||||||
Municipal bonds | $ | — | $ | 32,759 | 32,759 | |||||||||||||||
Corporate bonds | — | 31,053 | 31,053 | |||||||||||||||||
|
|
|
|
|
| |||||||||||||||
| $ | — | $ | 63,812 | $ | 63,812 | |||||||||||||||
December 31, 2016 | ||||||||||||||||||||
Fair Value Assets: | ||||||||||||||||||||
Money market funds | $ | 458 | $ | — | $ | 458 | ||||||||||||||
Marketable securities: | ||||||||||||||||||||
Municipal bonds | $ | — | $ | 36,607 | $ | 36,607 | ||||||||||||||
Corporate bonds | — | 26,560 | 26,560 | |||||||||||||||||
|
|
|
|
|
| |||||||||||||||
| $ | — | $ | 63,167 | $ | 63,167 | |||||||||||||||
Foreign currency forward contracts | — | 628 | 628 | |||||||||||||||||
Fair Value Liabilities: | ||||||||||||||||||||
Foreign currency forward contracts | $ | — | $ | 883 | $ | 883 | ||||||||||||||
For certain other financial instruments, including accounts receivablereceivables and accounts payable, the carrying value approximates their fair value due to thethese items’ relatively short maturitymaturity.
Assets Measured at Fair Value on a Nonrecurring Basis
Assets recorded atthe Notes
6. TRADE ACCOUNTS RECEIVABLE, NET OF ALLOWANCE
| (in thousands) | September 30, 2017 | December 31, 2016 | ||||||
Trade accounts receivable | $ | 164,530 | $ | 234,473 | ||||
Unbilled trade accounts receivable | 32,820 | 34,681 | ||||||
|
|
|
| |||||
Total trade accounts receivable | 197,350 | 269,154 | ||||||
Allowance for sales credit memos | (6,189 | ) | (4,126 | ) | ||||
|
|
|
| |||||
| $ | 191,161 | $ | 265,028 | |||||
|
|
|
| |||||
Unbilled trade accounts receivable primarily relate to services earned under time and materials arrangements and to license, maintenance, and cloud arrangements that have commenced or been delivered in excess of scheduled invoicing.
7. GOODWILL AND OTHER INTANGIBLE ASSETS
The changes in the carrying amount of goodwillhierarchy. See "Note 8. Debt" for the nine months ended September 30, 2017 as follows:
| (in thousands) | ||||
Balance as of January 1, | $ | 73,164 | ||
Purchase price adjustments to goodwill | (354 | ) | ||
Currency translation adjustments | 131 | |||
|
| |||
Balance as of September 30, | $ | 72,941 | ||
|
| |||
additional information.
Intangible assets are recorded at cost
| Three Months Ended June 30, | Six Months Ended June 30, | ||||||||||||||||||||||||||||||||||
| (Dollars in thousands) | 2021 | 2020 | 2021 | 2020 | |||||||||||||||||||||||||||||||
| U.S. | $ | 189,297 | 58 | % | $ | 142,811 | 63 | % | $ | 383,865 | 60 | % | $ | 315,228 | 63 | % | |||||||||||||||||||
| Other Americas | 14,058 | 4 | % | 8,930 | 4 | % | 25,959 | 4 | % | 24,272 | 5 | % | |||||||||||||||||||||||
| United Kingdom (“U.K.”) | 32,553 | 10 | % | 21,259 | 9 | % | 60,765 | 10 | % | 43,096 | 9 | % | |||||||||||||||||||||||
| Europe (excluding U.K.), Middle East, and Africa | 45,798 | 14 | % | 34,878 | 15 | % | 97,457 | 15 | % | 66,816 | 14 | % | |||||||||||||||||||||||
| Asia-Pacific | 43,996 | 14 | % | 19,497 | 9 | % | 71,155 | 11 | % | 43,554 | 9 | % | |||||||||||||||||||||||
| $ | 325,702 | 100 | % | $ | 227,375 | 100 | % | $ | 639,201 | 100 | % | $ | 492,966 | 100 | % | ||||||||||||||||||||
| Three Months Ended June 30, | Six Months Ended June 30, | ||||||||||||||||||||||
| (in thousands) | 2021 | 2020 | 2021 | 2020 | |||||||||||||||||||
| Perpetual license | $ | 12,596 | $ | 9,057 | $ | 18,048 | $ | 12,716 | |||||||||||||||
| Term license | 104,296 | 44,266 | 215,805 | 134,523 | |||||||||||||||||||
| Revenue recognized at a point in time | 116,892 | 53,323 | 233,853 | 147,239 | |||||||||||||||||||
| Maintenance | 78,782 | 72,222 | 154,343 | 145,917 | |||||||||||||||||||
| Pega Cloud | 73,293 | 48,838 | 141,151 | 92,304 | |||||||||||||||||||
| Consulting | 56,735 | 52,992 | 109,854 | 107,506 | |||||||||||||||||||
| Revenue recognized over time | 208,810 | 174,052 | 405,348 | 345,727 | |||||||||||||||||||
| $ | 325,702 | $ | 227,375 | $ | 639,201 | $ | 492,966 | ||||||||||||||||
| (in thousands) | Three Months Ended June 30, | Six Months Ended June 30, | |||||||||||||||||||||
| 2021 | 2020 | 2021 | 2020 | ||||||||||||||||||||
| Pega Cloud | $ | 73,293 | $ | 48,838 | $ | 141,151 | $ | 92,304 | |||||||||||||||
| Client Cloud | $ | 183,078 | $ | 116,488 | $ | 370,148 | $ | 280,440 | |||||||||||||||
| Maintenance | 78,782 | 72,222 | 154,343 | 145,917 | |||||||||||||||||||
| Term license | 104,296 | 44,266 | 215,805 | 134,523 | |||||||||||||||||||
Subscription (1) | 256,371 | 165,326 | 511,299 | 372,744 | |||||||||||||||||||
| Perpetual license | 12,596 | 9,057 | 18,048 | 12,716 | |||||||||||||||||||
| Consulting | 56,735 | 52,992 | 109,854 | 107,506 | |||||||||||||||||||
| $ | 325,702 | $ | 227,375 | $ | 639,201 | $ | 492,966 | ||||||||||||||||
| (in thousands) | Range of Remaining Useful Lives | Cost | Accumulated Amortization | Net Book Value | ||||||||||||
September 30, 2017 | ||||||||||||||||
Customer related intangibles | 4-10 years | $ | 63,158 | $ | (43,205 | ) | $ | 19,953 | ||||||||
Technology | 7-10 years | 58,942 | (44,140 | ) | 14,802 | |||||||||||
Other intangibles | — | 5,361 | (5,361 | ) | — | |||||||||||
|
|
|
|
|
| |||||||||||
| $ | 127,461 | $ | (92,706 | ) | $ | 34,755 | ||||||||||
|
|
|
|
|
| |||||||||||
December 31, 2016 | ||||||||||||||||
Customer related intangibles | 4-10 years | $ | 63,091 | $ | (37,573 | ) | $ | 25,518 | ||||||||
Technology | 3-10 years | 58,942 | (40,269 | ) | 18,673 | |||||||||||
Other intangibles | — | 5,361 | (5,361 | ) | — | |||||||||||
|
|
|
|
|
| |||||||||||
| $ | 127,394 | $ | (83,203 | ) | $ | 44,191 | ||||||||||
|
|
|
|
|
| |||||||||||
Amortization expense of intangibles assets is reflected in the Company’s unaudited condensed consolidated statements of operations as follows:
| Three Months Ended September 30, | Nine Months Ended September 30, | |||||||||||||||
| (in thousands) | 2017 | 2016 | 2017 | 2016 | ||||||||||||
Cost of revenue | $ | 1,232 | $ | 1,642 | $ | 3,871 | $ | 4,626 | ||||||||
Selling and marketing | 1,873 | 1,867 | 5,608 | 5,274 | ||||||||||||
General and administrative | — | 90 | — | 268 | ||||||||||||
|
|
|
|
|
|
|
| |||||||||
| $ | 3,105 | $ | 3,599 | $ | 9,479 | $ | 10,168 | |||||||||
|
|
|
|
|
|
|
| |||||||||
Future estimated amortization expense related to intangible assets as of September 30, 2017 is as follows:
| (in thousands) | ||||
Remainder of 2017 | $ | 2,846 | ||
2018 | 11,347 | |||
2019 | 5,555 | |||
2020 | 2,659 | |||
2021 | 2,637 | |||
2022 and thereafter | 9,711 | |||
|
| |||
| $ | 34,755 | |||
|
| |||
8. ACCRUED EXPENSES
| (in thousands) | September 30, 2017 | December 31, 2016 | ||||||
Outside professional services | $ | 13,447 | $ | 10,204 | ||||
Income and other taxes | 5,947 | 10,422 | ||||||
Marketing and sales program expenses | 4,679 | 3,707 | ||||||
Dividends payable | 2,336 | 2,298 | ||||||
Employee related expenses | 4,715 | 3,806 | ||||||
Other | 8,557 | 6,314 | ||||||
|
|
|
| |||||
| $ | 39,681 | $ | 36,751 | |||||
|
|
|
| |||||
term license).
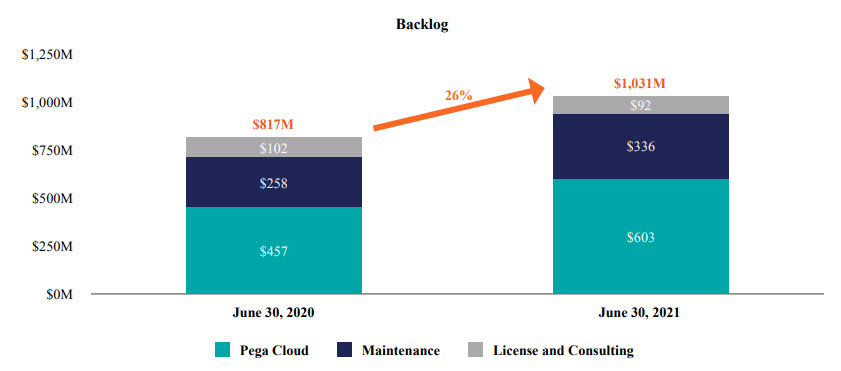
| June 30, 2021 | ||||||||||||||||||||||||||||||||||||||
| (Dollars in thousands) | Perpetual license | Term license | Maintenance | Pega Cloud | Consulting | Total | ||||||||||||||||||||||||||||||||
| 1 year or less | $ | 6,707 | $ | 46,146 | $ | 214,645 | $ | 281,793 | $ | 17,863 | $ | 567,154 | 56 | % | ||||||||||||||||||||||||
| 1-2 years | 234 | 15,708 | 59,164 | 194,841 | 2,675 | 272,622 | 26 | % | ||||||||||||||||||||||||||||||
| 2-3 years | 0 | 909 | 36,076 | 88,855 | 762 | 126,602 | 12 | % | ||||||||||||||||||||||||||||||
| Greater than 3 years | 0 | 255 | 26,564 | 37,246 | 693 | 64,758 | 6 | % | ||||||||||||||||||||||||||||||
| $ | 6,941 | $ | 63,018 | $ | 336,449 | $ | 602,735 | $ | 21,993 | $ | 1,031,136 | 100 | % | |||||||||||||||||||||||||
| June 30, 2020 | ||||||||||||||||||||||||||||||||||||||
| (Dollars in thousands) | Perpetual license | Term license | Maintenance | Pega Cloud | Consulting | Total | ||||||||||||||||||||||||||||||||
| 1 year or less | $ | 8,120 | $ | 53,550 | $ | 186,618 | $ | 191,187 | $ | 21,923 | $ | 461,398 | 57 | % | ||||||||||||||||||||||||
| 1-2 years | 1,700 | 6,187 | 40,153 | 140,860 | 1,986 | 190,886 | 23 | % | ||||||||||||||||||||||||||||||
| 2-3 years | 0 | 6,460 | 20,671 | 88,273 | 631 | 116,035 | 14 | % | ||||||||||||||||||||||||||||||
| Greater than 3 years | 0 | 646 | 10,517 | 37,071 | 626 | 48,860 | 6 | % | ||||||||||||||||||||||||||||||
| $ | 9,820 | $ | 66,843 | $ | 257,959 | $ | 457,391 | $ | 25,166 | $ | 817,179 | 100 | % | |||||||||||||||||||||||||
9. DEFERRED REVENUE
| (in thousands) | September 30, 2017 | December 31, 2016 | ||||||
Term license | $ | 5,636 | $ | 15,843 | ||||
Perpetual license | 20,844 | 23,189 | ||||||
Maintenance | 105,588 | 112,397 | ||||||
Cloud | 18,805 | 13,604 | ||||||
Professional Services | 10,058 | 10,614 | ||||||
|
|
|
| |||||
Current deferred revenue | 160,931 | 175,647 | ||||||
Perpetual license | 4,085 | 7,909 | ||||||
Maintenance | 828 | 1,802 | ||||||
Cloud | 1,217 | 1,278 | ||||||
|
|
|
| |||||
Long-term deferred revenue | 6,130 | 10,989 | ||||||
|
|
|
| |||||
| $ | 167,061 | $ | 186,636 | |||||
|
|
|
| |||||
10.
| Three Months Ended June 30, | Six Months Ended June 30, | ||||||||||||||||||||||
| (Dollars in thousands) | 2021 | 2020 | 2021 | 2020 | |||||||||||||||||||
| Total revenue | $ | 325,702 | $ | 227,375 | $ | 639,201 | $ | 492,966 | |||||||||||||||
| Client A | 13 | % | * | * | * | ||||||||||||||||||
Stock-based compensation expense is reflected in the Company’s unaudited condensed consolidated statements of operations as follows:
| Three Months Ended September 30, | Nine Months Ended September 30, | |||||||||||||||
| (in thousands) | 2017 | 2016 | 2017 | 2016 | ||||||||||||
Cost of revenues | $ | 3,613 | $ | 3,117 | $ | 10,913 | $ | 8,711 | ||||||||
Selling and marketing | 3,976 | 3,468 | 11,482 | 9,395 | ||||||||||||
Research and development | 3,420 | 2,260 | 10,306 | 7,480 | ||||||||||||
General and administrative | 2,480 | 1,983 | 7,228 | 4,706 | ||||||||||||
Acquisition-related | — | (10 | ) | — | 342 | |||||||||||
|
|
|
|
|
|
|
| |||||||||
Total stock-based compensation before tax | $ | 13,489 | $ | 10,818 | $ | 39,929 | $ | 30,634 | ||||||||
|
|
|
|
|
|
|
| |||||||||
Income tax benefit | $ | (4,129 | ) | $ | (3,227 | ) | $ | (12,231 | ) | $ | (8,917 | ) | ||||
During the nine months ended September 30, 2017, the Company issued approximately 1,299,000 shares of common stock to its employees and 18,000 shares of common stock to itsnon-employee directors under the Company’s stock-based compensation plans.
During the nine months ended September 30, 2017, the Company granted approximately 1,052,000 restricted stock units (“RSUs”) and 1,520,000non-qualified stock options to its employees with total fair values of approximately $47.5 million and $20.6 million, respectively. This includes approximately 175,000 RSUs which were granted in connection with the election by employees to receive 50% of their 2017 target incentive compensation under the Company’s Corporate Incentive Compensation Plan in the form of RSUs instead of cash. Stock-based compensation of approximately $7.7 million associated with this RSU grant will be recognized over aone-year period beginning on the grant date.
The Company recognizes stock based compensation on the accelerated recognition method, treating each vesting tranche as if it were an individual grant.
| Three Months Ended June 30, | Six Months Ended June 30, | ||||||||||||||||||||||
| (in thousands) | 2021 | 2020 | 2021 | 2020 | |||||||||||||||||||
| Cost of revenue | $ | 5,849 | $ | 5,384 | $ | 11,774 | $ | 10,536 | |||||||||||||||
| Selling and marketing | 14,748 | 11,592 | 28,468 | 21,310 | |||||||||||||||||||
| Research and development | 6,343 | 5,805 | 13,113 | 11,302 | |||||||||||||||||||
| General and administrative | 3,748 | 2,874 | 7,433 | 5,683 | |||||||||||||||||||
| $ | 30,688 | $ | 25,655 | $ | 60,788 | $ | 48,831 | ||||||||||||||||
| Income tax benefit | $ | (6,192) | $ | (5,107) | $ | (12,183) | $ | (9,689) | |||||||||||||||
11.
| Six Months Ended June 30, 2021 | |||||||||||
| (in thousands) | Shares | Total Fair Value | |||||||||
| RSUs | 753 | $ | 97,483 | ||||||||
| Non-qualified stock options | 1,368 | $ | 51,594 | ||||||||
| Three Months Ended June 30, | Six Months Ended June 30, | ||||||||||||||||||||||
| (Dollars in thousands) | 2021 | 2020 | 2021 | 2020 | |||||||||||||||||||
| (Benefit from) income taxes | $ | (11,916) | $ | (12,319) | $ | (29,534) | $ | (36,129) | |||||||||||||||
| Effective income tax benefit rate | 0 | 0 | (2,591) | % | 44 | % | |||||||||||||||||
| Three Months Ended June 30, | Six Months Ended June 30, | ||||||||||||||||||||||
| (in thousands, except per share amounts) | 2021 | 2020 | 2021 | 2020 | |||||||||||||||||||
| Net income (loss) | $ | 37,291 | $ | (20,740) | $ | 30,674 | $ | (46,112) | |||||||||||||||
| Weighted-average common shares outstanding | 81,316 | 80,224 | 81,161 | 80,016 | |||||||||||||||||||
| Earnings (loss) per share, basic | $ | 0.46 | $ | (0.26) | $ | 0.38 | $ | (0.58) | |||||||||||||||
| Net income (loss) | $ | 37,291 | $ | (20,740) | $ | 30,674 | $ | (46,112) | |||||||||||||||
| Interest expense associated with convertible debt instruments, net of tax | 1,351 | 0 | 0 | 0 | |||||||||||||||||||
| Numerator for diluted EPS | $ | 38,642 | $ | (20,740) | $ | 30,674 | $ | (46,112) | |||||||||||||||
| Weighted-average effect of dilutive securities: | |||||||||||||||||||||||
Convertible debt (1) | 4,443 | 0 | 0 | 0 | |||||||||||||||||||
| Stock options | 3,266 | 0 | 3,416 | 0 | |||||||||||||||||||
| RSUs | 1,295 | 0 | 1,429 | 0 | |||||||||||||||||||
Effect of dilutive securities (2) | 9,004 | 0 | 4,845 | 0 | |||||||||||||||||||
Weighted-average common shares outstanding, assuming dilution (1) (2) (3) | 90,320 | 80,224 | 86,006 | 80,016 | |||||||||||||||||||
| Earnings (loss) per share, diluted | $ | 0.43 | $ | (0.26) | $ | 0.36 | $ | (0.58) | |||||||||||||||
Outstanding anti-dilutive stock options and RSUs (4) | 19 | 5,929 | 22 | 5,939 | |||||||||||||||||||
PEGASYSTEMS INC.
NOTES TO UNAUDITED CONDENSED CONSOLIDATED FINANCIAL STATEMENTS (continued)
| Three Months Ended September 30, | Nine Months Ended September 30, | |||||||||||||||
| (in thousands, except per share amounts) | 2017 | 2016 | 2017 | 2016 | ||||||||||||
Basic | ||||||||||||||||
Net (loss)/income | $ | (1,812 | ) | $ | 3,301 | $ | 36,615 | $ | 18,237 | |||||||
|
|
|
|
|
|
|
| |||||||||
Weighted-average common shares outstanding | 77,691 | 76,278 | 77,258 | 76,323 | ||||||||||||
|
|
|
|
|
|
|
| |||||||||
(Loss)/earnings per share, basic | $ | (0.03 | ) | $ | 0.04 | $ | 0.47 | $ | 0.24 | |||||||
|
|
|
|
|
|
|
| |||||||||
Diluted | ||||||||||||||||
Net (loss)/income | $ | (1,812 | ) | $ | 3,301 | $ | 36,615 | $ | 18,237 | |||||||
|
|
|
|
|
|
|
| |||||||||
Weighted-average effect of dilutive securities: | ||||||||||||||||
Stock options | — | 1,933 | 3,519 | 1,851 | ||||||||||||
RSUs | — | 1,337 | 1,940 | 1,227 | ||||||||||||
|
|
|
|
|
|
|
| |||||||||
Effect of assumed exercise of stock options and RSUs | — | 3,270 | 5,459 | 3,078 | ||||||||||||
|
|
|
|
|
|
|
| |||||||||
Weighted-average common shares outstanding, assuming dilution | 77,691 | 79,548 | 82,717 | 79,401 | ||||||||||||
|
|
|
|
|
|
|
| |||||||||
(Loss)/earnings per share, diluted | $ | (0.03 | ) | $ | 0.04 | $ | 0.44 | $ | 0.23 | |||||||
|
|
|
|
|
|
|
| |||||||||
Outstanding stock options and RSUs excluded as impact would be anti-dilutive | 7,232 | 296 | 219 | 368 | ||||||||||||
$6 million and will increase by 3% annually. In periods of loss, all equity awards are excluded, asaddition, the inclusion of any equity awards would be anti-dilutive.
12. GEOGRAPHIC INFORMATION AND MAJOR CLIENTS
Geographic Information
Operating segments are defined as components ofCompany will receive an enterprise, about which separate financial information is available that is evaluated regularly by the chief operating decision maker (“CODM”) in deciding how to allocate resources and in assessing performance.
The Company develops and licenses software applications for customer engagement and its Pega® Platform, and provides consulting services, maintenance, and training related to its offerings. The Company derives substantially all of its revenueimprovement allowance from the sale and supportlandlord of one group of similar products and services—software that provides case management, business process management, and real-time decisioning solutions to improve customer engagement and operational excellence in the enterprise applications market. To assess performance, the Company’s CODM, who is the chief executive officer, reviews financial information on a consolidated basis. Therefore, the Company determined it has one reportable segment—Customer Engagement Solutions and one reporting unit.
The Company’s international revenue, based upon the clients’ location, is as follows:
| Three Months Ended September 30, | Nine Months Ended September 30, | |||||||||||||||||||||||||||||||
| (Dollars in thousands) | 2017 | 2016 | 2017 | 2016 | ||||||||||||||||||||||||||||
U.S. | $ | 95,087 | 53 | % | $ | 111,274 | 61 | % | $ | 351,330 | 59 | % | $ | 308,049 | 56 | % | ||||||||||||||||
Other Americas | 8,722 | 5 | % | 7,952 | 4 | % | 30,243 | 5 | % | 49,494 | 9 | % | ||||||||||||||||||||
U.K. | 18,485 | 10 | % | 21,490 | 12 | % | 68,003 | 11 | % | 77,181 | 14 | % | ||||||||||||||||||||
Other EMEA(1) | 28,100 | 16 | % | 23,656 | 13 | % | 76,958 | 13 | % | 67,314 | 12 | % | ||||||||||||||||||||
Asia Pacific | 29,421 | 16 | % | 18,430 | 10 | % | 74,508 | 12 | % | 48,618 | 9 | % | ||||||||||||||||||||
|
|
|
|
|
|
|
|
|
|
|
|
|
|
|
| |||||||||||||||||
| $ | 179,815 | 100 | % | $ | 182,802 | 100 | % | $ | 601,042 | 100 | % | $ | 550,656 | 100 | % | |||||||||||||||||
|
|
|
|
|
|
|
|
|
|
|
|
|
|
|
| |||||||||||||||||
PEGASYSTEMS INC.
NOTES TO UNAUDITED CONDENSED CONSOLIDATED FINANCIAL STATEMENTS (continued)
Major Clients
Clients accounting for 10% or more of the Company’s total revenue were as follows:
| Three Months Ended September 30, | Nine Months Ended September 30, | |||||||||||||||
| (in thousands) | 2017 | 2016 | 2017 | 2016 | ||||||||||||
Total revenue | $ | 179,815 | $ | 182,802 | $ | 601,042 | $ | 550,656 | ||||||||
Client A | 10.6 | % | * | * | * | |||||||||||
Clients accounting for 10% or more of the Company’s total trade accounts receivable were as follows:
| (in thousands) | September 30, 2017 | December 31, 2016 | ||||||
Total trade accounts receivable | 197,350 | 269,154 | ||||||
Client A | 12.4 | % | * | |||||
$11.8 million.
Forward-Looking Statements
These forward-looking statements are based on current expectations, estimates, forecasts, and projections about the industry and markets in which we operate, and management’s beliefs and assumptions. In addition, other written or oral statements that constitute forward-looking statements may be made by us or on our behalf. Words such as “expect,” “anticipate,” “intend,” “plan,” “believe,” “could,” “estimate,” “may,” “target,” “strategy,” “is intendedtransition to” “project,” “guidance,” “likely,” “usually,” or variations of such words and similar expressions are intended to identify such forward-looking statements.
These statements are not guarantees of future performance and involve certain risks, uncertainties, and assumptions that are difficult to predict. Important factors that could cause actual future activities and results to differ materially from those expressed in such forward-looking statements include, among others, a more subscription-based business model;
We have no (“SEC”). Except as required by applicable law, we do not undertake and expressly disclaim any obligation to publicly update or revise anythese forward-looking statements publicly, whether as a result offrom new information, future events, or risks. New information, future events or risks may cause theotherwise.
Business overview
Quarterly Report represent our views as of July 28, 2021.
Our clients includeare Global 3000 companiesorganizations and government agencies that seekrequire applications to manage complex enterprise systemsdifferentiate themselves in the markets they serve. Our applications achieve and customer service issues with greaterfacilitate differentiation by increasing business agility, driving growth, improving productivity, attracting and cost-effectiveness. Our strategy isretaining customers, and reducing risk. We deliver applications tailored to our clients’ specific industry needs.
Our license revenue is primarily derived from salesthe “Risk Factors” section of our applicationsAnnual Report on Form 10-K for the year ended December 31, 2020 for additional information.
Financial and Performance Metrics
Management evaluates our financial performance, based a number of select financial and performance metrics. The performance metrics are periodically reviewed and revised to reflect any changes in our business. Historically, Recurring Revenue and License and Cloud Backlog have been our primary performance metrics. However, due to the change in the revenue recognition patterns of term license arrangements as a result of the expected implementation of the new revenue accounting standard (See Note 2) in the first quarter of 2018, we have started tracking Annual Contract Value (“ACV”), a new performance measure.
Select Financial Metrics
(Dollars in thousands, except per share amounts) | Three Months Ended September 30, | Nine Months Ended September 30, | ||||||||||||||||||||||||||||||
| 2017 | 2016 | Change | 2017 | 2016 | Change | |||||||||||||||||||||||||||
Total revenue | $ | 179,815 | $ | 182,802 | (2,987 | ) | (2 | )% | $ | 601,042 | $ | 550,656 | $ | 50,386 | 9 | % | ||||||||||||||||
Operating margin | (8 | )% | 3 | % | 3 | % | 5 | % | ||||||||||||||||||||||||
Diluted (loss)/earnings per share | $ | (0.03 | ) | $ | 0.04 | $ | (0.07 | ) | (175 | )% | $ | 0.44 | $ | 0.23 | $ | 0.21 | 91 | % | ||||||||||||||
Cash flow provided by operating activities | 113,926 | 20,556 | 93,370 | 454 | % | |||||||||||||||||||||||||||
Select Performance Metrics
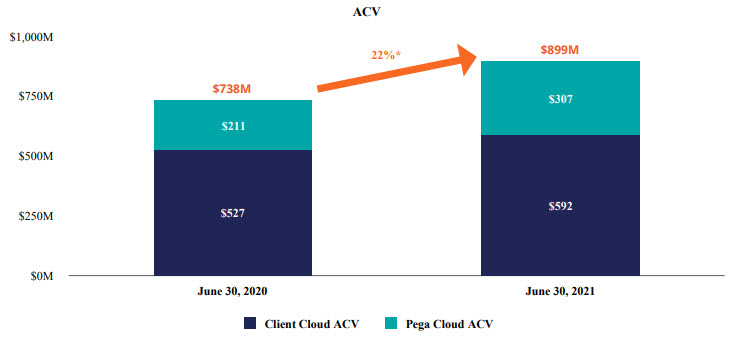
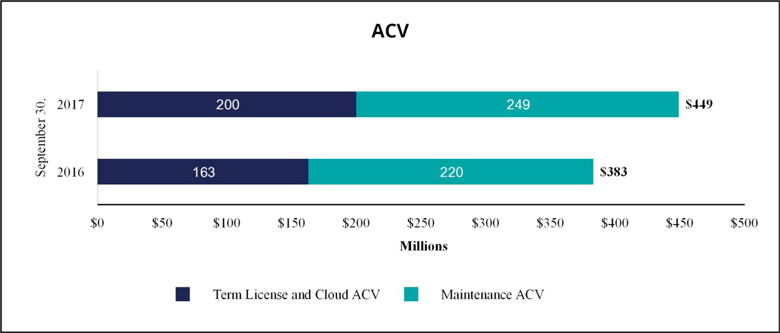
Annual Contract Value (“ACV”)
The change in ACV measures the growth and predictability of future cash flows from committed term license, cloud, and maintenance arrangementsactive contracts as of the end ofmeasurement date. The contract's total value is divided by its duration in years to calculate ACV for term license and Pega Cloud contracts. Maintenance revenue for the particular reporting period.
quarter then ended is multiplied by four to calculate ACV for maintenance. Client Cloud ACV is composed of maintenance ACV and term license ACV. ACV is a performance measure that we believe provides useful information to our management and investors, particularly during our Cloud Transition.
| September 30, | ||||||||||||||||
| (in thousands) | 2017 | 2016 | Change | |||||||||||||
Term License and Cloud ACV | $ | 200,180 | $ | 163,408 | $ | 36,772 | 23 | % | ||||||||
Maintenance ACV | 248,816 | 220,152 | $ | 28,664 | 13 | % | ||||||||||
|
|
|
| |||||||||||||
Term License, Cloud and Maintenance ACV | $ | 448,996 | $ | 383,560 | $ | 65,436 | 17 | % | ||||||||
|
|
|
| |||||||||||||
Recurring Revenue
A measure of the predictability and repeatability of our revenue.
| Three Months Ended September 30, | Nine Months Ended September 30, | |||||||||||||||||||||||||||||||
| (Dollars in thousands) | 2017 | 2016 | Change | 2017 | 2016 | Change | ||||||||||||||||||||||||||
Recurring revenue | ||||||||||||||||||||||||||||||||
Term license | $ | 21,678 | $ | 28,919 | $ | (7,241 | ) | (25 | )% | $ | 106,170 | $ | 102,115 | $ | 4,055 | 4 | % | |||||||||||||||
Maintenance | 62,204 | 55,038 | $ | 7,166 | 13 | % | 180,759 | 163,174 | $ | 17,585 | 11 | % | ||||||||||||||||||||
Cloud | 13,354 | 10,873 | $ | 2,481 | 23 | % | 36,914 | 30,640 | $ | 6,274 | 20 | % | ||||||||||||||||||||
|
|
|
|
|
|
|
| |||||||||||||||||||||||||
Total recurring revenue | $ | 97,236 | $ | 94,830 | $ | 2,406 | 3 | % | $ | 323,843 | $ | 295,929 | $ | 27,914 | 9 | % | ||||||||||||||||
|
|
|
|
|
|
|
| |||||||||||||||||||||||||
Recurring revenue as a percent of total revenue | 54 | % | 52 | % | 54 | % | 54 | % | ||||||||||||||||||||||||
Deferred license and cloud revenue on the balance sheet Term license and cloud Perpetual license Total deferred license and cloud revenue License and cloud contractual commitments not on the balance sheet Term license and cloud Perpetual license Total license and cloud commitments Total license (term and perpetual) and cloud backlog Total term license and cloud backlog Total revenue Gross profit Total operating expenses (Loss)/income from operations Operating margin (Loss)/income before (benefit)/provision for income taxes this Quarterly Report on Form 10-Q to our critical accounting policies as disclosed in our Annual Report on Form 10-K for the year ended December 31, 2020. Perpetual license Term license Total license revenue higher than 90%. Maintenance Consulting services Cloud Training Total services growth. Software license Maintenance Services Total gross profit Software license gross profit % Maintenance gross profit % Services gross profit % Total gross profit % cost-efficiency gains as Pega Cloud grows and scales. Selling and marketing As a percent of total revenue Selling and marketing headcount, end of period compensation. The increase in headcount reflects our efforts to increase our sales capacity to deepen relationships with existing clients and target new Research and development As a percent of total revenue Research and Development headcount, end of period General and administrative As a percent of total revenue General and administrative headcount, end of period Cost of revenues Selling and marketing Research and development General and administrative Acquisition-related Total stock-based compensation before tax Income tax benefit Cost of revenue Selling and marketing General and administrative Foreign currency transaction (loss)/gain Interest income, net Other (expense)/income, net (Benefit)/provision for income taxes Effective income tax rate Cash provided by (used in): Operating activities Investing activities Financing activities Effect of exchange rate on cash Net increase/(decrease) in cash and cash equivalents Total cash, cash equivalents, and marketable securities award holders' exercise behavior. our billings and cash collections. Pega Cloud, term license, and maintenance arrangements are generally billed and collected over the contract term, while perpetual license arrangements are generally billed and collected upfront when the license rights become effective. As client preferences shift in favor of Pega Cloud arrangements, we could experience slower operating cash flow growth, or negative cash flow, in the near term. 2020, we entered into a five-year $100 million senior secured revolving credit agreement with PNC Bank, National Association. As of Remainder of 2017 2018 2019 2020 2021 2022 and thereafter Total Balance as of January 1, Authorizations Repurchase for net settlement of tax under stock-based compensation Repurchases paid under authorized share repurchase program Repurchases unsettled Activity in Period Balance as of September 30, These amounts are not included in the table above. Dividends Declared Dividends Paid procedures 2021. financial reporting Period July 1, 2017 - July 31, 2017 August 1, 2017 - August 31, 2017 September 1, 2017 - September 30, 2017 Total exhibit are considered confidential and have been omitted as permitted under SEC rules and regulations.License and•Pega Cloud BacklogA measure of the continued growth of our business as a result of future contractual commitments by our clients.License and Cloud Backlogrevenue is the sum of the following two components:Deferred license andrevenue under U.S. GAAP for cloud revenue as recorded on the Company’s balance sheet. (See Note 9 “Deferred Revenue”)contracts.License and cloud contractual commitments, which are not recorded on our balance sheet because we have not yet invoiced our clients, nor have we recognized the associated revenue. (See “Future Cash Receipts from Committed License and Cloud Arrangements” which can be found in “Liquidity and Capital Resources” contained elsewhere in this Quarterly Report on Form10-Q for additional information)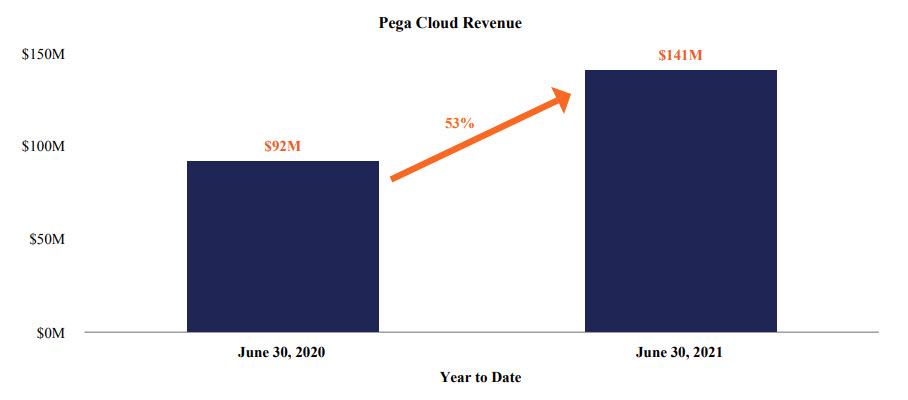
License and cloud backlog may vary in any given period depending on the amount and timing of when the arrangements are executed, as well as the mix between perpetual, term, and cloud license arrangements, which may depend on our clients’ deployment preferences. A change in the mix may cause our revenues to vary materially from period to period. A higher proportion of term and cloud license arrangements executed will generally result in revenue being recognized over longer periods. September 30, Change (Dollars in thousands) 2017 2016 $ 25,658 51 % $ 19,627 42 % 31 % 24,929 49 % 27,653 58 % (10 )% 50,587 100 % 47,280 100 % 7 % 450,535 91 % 352,804 94 % 28 % 46,459 9 % 23,483 6 % 98 % 496,994 100 % 376,287 100 % 32 % $ 547,581 $ 423,567 29 % 476,193 87 % 372,431 88 % 28 % 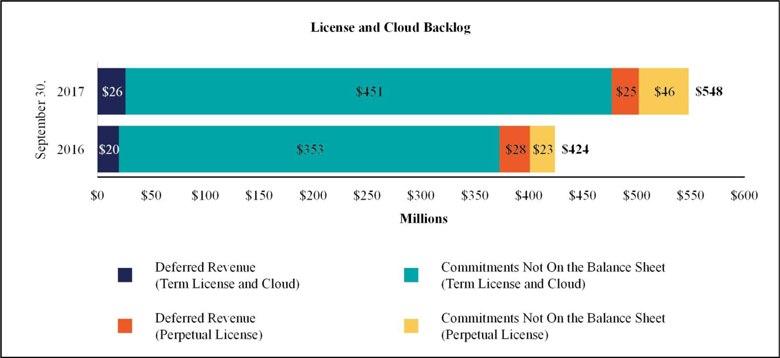
Critical accounting policiesCRITICAL ACCOUNTING POLICIESManagement’s Discussion and Analysis of Financial Condition and Results of Operations is based upon our unaudited condensed consolidated financial statements, which have been prepared in accordance withfollowing accounting principles generally accepted in the U.S.United States and the rules and regulations of the SEC for interim financial reporting. The preparation of these financial statements requires us to make estimates and judgments that affect the reported amounts of assets, liabilities, revenues, and expenses, and the related disclosure of contingent assets and liabilities. We base our estimates and judgments on historical experience, knowledge of current conditions, and expectations of what could occur in the future given the available information.There have been no changes in our critical accounting policies as disclosed in our Annual Report on Form10-K for the year ended December 31, 2016. For more information regarding our critical accounting policies, we encourage you to read the discussion contained in Item 7 under the heading “Critical Accounting Estimates and Significant Judgments” and Note 2 “Significant Accounting Policies” included in the notes to the Consolidated Financial Statements containedfollowing locations in our Annual Report on Form10-K for the year ended December 31, 2016.Results2020:•“Critical Accounting Estimates and Significant Judgments” in Item 7; and•“Note 2. Significant Accounting Policies” in Item 8.21There have been no significant changes other than those disclosed in “Note 2. New Accounting Pronouncements” in Item 1 of Operations Three Months Ended
September 30, Nine Months Ended
September 30, (Dollars in thousands) 2017 2016 Change 2017 2016 Change $ 179,815 $ 182,802 $ (2,987 ) (2 )% $ 601,042 $ 550,656 $ 50,386 9 % $ 110,084 $ 122,365 $ (12,281 ) (10 )% $ 395,346 $ 373,609 $ 21,737 6 % $ 124,373 $ 116,867 $ 7,506 6 % $ 376,647 $ 347,626 $ 29,021 8 % $ (14,289 ) $ 5,498 $ (19,787 ) (360 )% $ 18,699 $ 25,983 $ (7,284 ) (28 )% (8 )% 3 % 3 % 5 % $ (14,697 ) $ 5,515 $ (20,212 ) (366 )% $ 18,663 $ 24,506 $ (5,843 ) (24 )% RESULTS OF OPERATIONSRevenueSoftwareCloud TransitionWe are in the process of transitioning our business to sell software primarily through subscription arrangements, particularly Pega Cloud. Revenue growth has been slower because of this transition. Revenue from Pega Cloud and maintenance arrangements is typically recognized over the contract term. In contrast, revenue from license revenue(Dollars in thousands) Three Months Ended
September 30, Nine Months Ended
September 30, 2017 2016 Change 2017 2016 Change $ 20,115 48 % $ 39,914 58 % $ (19,799 ) (50 )% $ 89,050 46 % $ 105,734 51 % ($ 16,684 ) (16 )% 21,678 52 % 28,919 42 % (7,241 ) (25 )% 106,170 54 % 102,115 49 % 4,055 4 % $ 41,793 100 % $ 68,833 100 % $ (27,040 ) (39 )% $ 195,220 100 % $ 207,849 100 % ($ 12,629 ) (6 )% The mix between perpetualsales is recognized when the license rights become effective, typically upfront.(Dollars in thousands) Three Months Ended
June 30,Change Six Months Ended
June 30,Change 2021 2020 2021 2020 Pega Cloud $ 73,293 23 % $ 48,838 21 % $ 24,455 50 % $ 141,151 22 % $ 92,304 19 % $ 48,847 53 % Client Cloud $ 183,078 56 % $ 116,488 52 % $ 66,590 57 % $ 370,148 58 % $ 280,440 57 % $ 89,708 32 % Maintenance 78,782 24 % 72,222 33 % 6,560 9 % 154,343 24 % 145,917 30 % 8,426 6 % Term license 104,296 32 % 44,266 19 % 60,030 136 % 215,805 34 % 134,523 27 % 81,282 60 % Subscription (1)$ 256,371 79 % $ 165,326 73 % 91,045 55 % 511,299 80 % 372,744 76 % 138,555 37 % Perpetual license 12,596 4 % 9,057 4 % 3,539 39 % 18,048 3 % 12,716 3 % 5,332 42 % Consulting 56,735 17 % 52,992 23 % 3,743 7 % 109,854 17 % 107,506 21 % 2,348 2 % $ 325,702 100 % $ 227,375 100 % $ 98,327 43 % $ 639,201 100 % $ 492,966 100 % $ 146,235 30 % (1) Reflects client arrangements subject to renewal (Pega Cloud, maintenance, and term license arrangements executed in a particular period varies based on clients’ deployment preferences. A changelicense).The total revenue changes in the mix may causethree and six months ended June 30, 2021 generally reflect our revenues to vary materially from period to period. A higher proportionCloud Transition. Other factors impacting our revenue include:•An increasing portion of our term license contracts include multi-year committed maintenance periods instead of annually renewable maintenance. Under multi-year committed maintenance arrangements, executed will generally result ina larger portion of the total contract value is recognized as maintenance revenue over the contract term rather than as term license revenue being recognized over longer periods. Additionally, someupon the effectiveness of our perpetualthe license arrangements include extended payment terms or additional rights of use, which may also result in the recognition of revenue over longer periods.The decrease in perpetual license revenue inrights. In the three months ended SeptemberJune 30, 2017 was primarily due2021, multi-year committed maintenance contributed $4.3 million to a decrease inmaintenance revenue growth and reduced term revenue growth by $15.4 million. In the average value of perpetual arrangements executed and a lower percentage of perpetual arrangements executed and recognized in revenue in the current period. The decrease in perpetual license revenue in the ninesix months ended SeptemberJune 30, 2017 was primarily due2021, multi-year committed maintenance contributed $7.8 million to a lower percentagemaintenance revenue growth and reduced term revenue growth by $20.9 million.•Maintenance renewal rates of perpetual arrangements executed and recognized in revenue.•The decreaseincreases in term license revenue in the three and six months ended SeptemberJune 30, 2017 was2021 were driven by a large, existing customer that expanded their use of our software, renewed an existing multi-year contract, and extended the term of the agreement earlier in the year than anticipated.•The increases in perpetual license revenue were primarily due to aseveral large termperpetual license renewal for which the second year of the term was recognized as revenue in the three months ended September 30, 2016. If the second year of this term license arrangement was not paid in advance in the three months ended September 30, 2016, term license revenue would have decreased 2%. The increase in term license revenue in the nine months ended September 30, 2017 was primarily due to broad based growth amongst new and existing customers offset by a large term license arrangement which was prepaid andcontracts recognized in revenue in the three and six months ended March 31, 2016. If this term license arrangement was not prepaid and recognizedJune 30, 2021.•The increases in consulting revenue in the three and six months ended March 31, 2016 term license revenue would have increased 26%.The aggregate value of future revenue expected to be recognized during the remainder of the year under existing noncancellable perpetual arrangements not reflected in deferred revenue was $13.3 million as of SeptemberJune 30, 2017 compared to $3.9 million as of September 30, 2016.The aggregate value of future revenue expected to be recognized during the remainder of the year under existing noncancellable term and cloud arrangements not reflected in deferred revenue was $37.7 million as of September 30, 2017 compared to $26.7 million as of September 30, 2016. For additional information see “Future Cash Receipts from Committed License and Cloud Arrangements” which can be found in “Liquidity and Capital Resources.”Maintenance revenue Three Months Ended
September 30, Nine Months Ended
September 30, (Dollars in thousands) 2017 2016 Change 2017 2016 Change $ 62,204 $ 55,038 $ 7,166 13 % $ 180,759 $ 163,174 $ 17,585 11 % The increases2021 were primarily due to the continued growthincreases in the aggregate value of the installed basebillable hours. As part of our softwarelong-term strategy, we intend to continue growing and strong renewal rates significantly in excessleveraging our ecosystem of 90%.Services revenue Three Months Ended
September 30, Nine Months Ended
September 30, (Dollars in thousands) 2017 2016 Change 2017 2016 Change $ 61,535 81 % $ 46,829 80 % $ 14,706 31 % $ 183,447 82 % $ 144,263 80 % $ 39,184 27 % 13,354 18 % 10,873 18 % 2,481 23 % 36,914 16 % 30,640 17 % 6,274 20 % 929 1 % 1,229 2 % (300 ) (24 )% 4,702 2 % 4,730 3 % (28 ) (1 )% $ 75,818 100 % $ 58,931 100 % $ 16,887 29 % $ 225,063 100 % $ 179,633 100 % $ 45,430 25 % Consulting services revenue is primarily generated from new license implementations. Our consulting services revenue may fluctuate in future periods dependingpartners on the mix of new implementation projects, we perform as compared to those performed bypotentially reducing our enabled clients or led by our partners.The increases infuture consulting services revenue were primarily due to higher billable hours during the three and nine months ended September 30, 2017 driven by a large project which began in the second half of 2016.Cloud revenue represents revenue from our Pega Cloud offerings. The increases in cloud revenue were primarily due to continued growth of our cloud client base.Gross profit Three Months Ended
September 30, Nine Months Ended
September 30, (Dollars in thousands) 2017 2016 Change 2017 2016 Change $ 40,517 $ 67,520 $ (27,003 ) (40 )% $ 191,394 $ 204,203 $ (12,809 ) (6 )% 55,488 48,379 7,109 15 % 159,814 144,285 15,529 11 % 14,079 6,466 7,613 118 % 44,138 25,121 19,017 76 % $ 110,084 $ 122,365 $ (12,281 ) (10 )% $ 395,346 $ 373,609 $ 21,737 6 % 97 % 98 % 98 % 98 % 89 % 88 % 88 % 88 % 19 % 11 % 20 % 14 % 61 % 67 % 66 % 68 % Three Months Ended
June 30,Change Six Months Ended
June 30,Change (Dollars in thousands) 2021 2020 2021 2020 Software license $ 116,236 99 % $ 52,344 98 % $ 63,892 122 % $ 232,547 99 % $ 145,576 99 % $ 86,971 60 % Maintenance 73,787 94 % 66,631 92 % 7,156 11 % 143,562 93 % 134,750 92 % 8,812 7 % Pega Cloud 49,242 67 % 29,850 61 % 19,392 65 % 94,543 67 % 55,783 60 % 38,760 69 % Consulting 1,906 3 % 1,859 4 % 47 3 % 1,571 1 % 638 1 % 933 146 % $ 241,171 74 % $ 150,684 66 % $ 90,487 60 % $ 472,223 74 % $ 336,747 68 % $ 135,476 40 % •The decreasechanges in total gross profit in the three and six months ended SeptemberJune 30, 2017 was2021 were primarily due to a shift in the mix of license arrangements executed from perpetual to term licensesour Cloud Transition, revenue growth, and an increase in lower margin services revenue.The increase in total gross profit in the nine months ended September 30, 2017 was primarily due to increased total revenue.22Operating expenses(Dollars in thousands) Three Months Ended
June 30,Change Six Months Ended
June 30,Change 2021 2020 2021 2020 % of Revenue % of Revenue % of Revenue % of Revenue Selling and marketing $ 156,423 48 % $ 127,607 56 % $ 28,816 23 % $ 305,162 48 % $ 263,631 53 % $ 41,531 16 % Research and development $ 64,395 20 % $ 58,869 26 % $ 5,526 9 % $ 126,837 20 % $ 117,596 24 % $ 9,241 8 % General and administrative $ 19,161 6 % $ 15,655 7 % $ 3,506 22 % $ 37,431 6 % $ 31,285 6 % $ 6,146 20 % •The increases in service gross profit percentselling and marketing in the three and ninesix months ended SeptemberJune 30, 2017 was driven by a large project which began in the second half of 2016 and several additional large projects for which costs2021 were recognized in 2016 but whose associated revenue was not recognized until after September 30, 2016.Operating expensesSelling and marketing Three Months Ended
September 30, Nine Months Ended
September 30, (Dollars in thousands) 2017 2016 Change 2017 2016 Change $ 70,209 $ 67,032 $ 3,177 5 % $ 217,384 $ 202,126 $ 15,258 8 % 39 % 37 % 36 % 37 % 934 875 59 7 % Selling and marketing expenses include compensation, benefits, and other headcount-related expenses associated with our selling and marketing personnel as well as advertising, promotions, trade shows, seminars, and other programs. Selling and marketing expenses also include the amortization of customer related intangibles.The increase in the three months ended September 30, 2017 was primarily due to an increaseincreases in compensation and benefits of $1.8$22.6 million driven by increasedand $48.0 million, attributable to increases in headcount and equity compensation, partially offset by a decrease in sales commissions associated with the lower value of new license arrangements executed during the three months ended September 30, 2017.The increase in the nine months ended September 30, 2017 was primarily due to an increase in compensation and benefits of $12.7 million, respectively, driven by increased headcount and equity compensation, and an increase in employee travel and entertainment, partially offset by a decrease in brand marketing program expenses of $2.2 million.accountsaccounts.•The increases in existing industries, as well as to expand coverage in new industriesresearch and geographies and to increase the number of sales opportunities.Research and development Three Months Ended
September 30, Nine Months Ended
September 30, (Dollars in thousands) 2017 2016 Change 2017 2016 Change $ 41,031 $ 38,036 $ 2,995 8 % $ 121,089 $ 108,530 $ 12,559 12 % 23 % 21 % 20 % 20 % 1,474 1,437 37 3 % Research and development expenses include compensation, benefits, contracted services, and other headcount-related expenses associated with the creation and development of our products, as well as enhancements and design changes to existing products and integration of acquired technologies.The increases in the three and ninesix months ended SeptemberJune 30, 20172021 were primarily due to increases in compensation and benefits of $2.9$7.2 million and $12.6$11.8 million, respectively, attributable to increasedincreases in headcount and equity compensation.General and administrative Three Months Ended
September 30, Nine Months Ended
September 30, (Dollars in thousands) 2017 2016 Change 2017 2016 Change $ 13,133 $ 11,725 $ 1,408 12 % $ 38,174 $ 34,067 $ 4,107 12 % 7 % 6 % 6 % 6 % 407 371 36 10 % General and administrative expenses include compensation, benefits, and other headcount-related expenses associated with finance, legal, corporate governance, and other administrative headcount. They also include accounting, legal, and other professional consulting and administrative fees. •The increases in general and administrative headcount includes employees in human resources, information technology, and corporate services departments, whose costs are partially allocated to other operating expense areas.The increases in the three and ninesix months ended SeptemberJune 30, 20172021 were primarily due to increases in compensation and benefits of $0.4$2.2 million and $4$3.5 million, respectively, attributable to increasedincreases in headcount and equity compensation. The increasecompensation, and increases in professional services fees of $1.8 million and $3.4 million.•In February 2021, we agreed to accelerate our exit from our Cambridge, Massachusetts headquarters to October 1, 2021, in exchange for a one-time payment from our landlord of $18 million. This agreement was the primary contributor to decreases in facilities expenses of $2.1 million and $3.3 million in selling and marketing, $2.4 million and $3.6 million in research and development, and $1.1 million and $1.6 million in general and administrative, in the ninethree and six months ended SeptemberJune 30, 2017 was partially offset by a decrease of $1.5 million2021.Other income (expense), net(Dollars in thousands) Three Months Ended
June 30,Change Six Months Ended
June 30,Change 2021 2020 2021 2020 Foreign currency transaction (loss) gain $ (403) $ 4,256 $ (4,659) * $ (5,501) $ (1,691) $ (3,810) (225) % Interest income 236 242 (6) (2) % 389 849 (460) (54) % Interest expense (1,959) (5,529) 3,570 65 % (3,839) (7,835) 3,996 51 % Gain on capped call transactions 26,309 19,419 6,890 35 % 7,192 827 6,365 770 % Other income, net — — — * 106 1,374 (1,268) (92) % $ 24,183 $ 18,388 $ 5,795 32 % $ (1,653) $ (6,476) $ 4,823 74 % * not meaningful•The changes in legal fees.Stock-based compensation Three Months Ended
September 30, Nine Months Ended
September 30, (in thousands) 2017 2016 Change 2017 2016 Change $ 3,613 $ 3,117 $ 496 16 % $ 10,913 $ 8,711 $ 2,202 25 % 3,976 3,468 508 15 % 11,482 9,395 2,087 22 % 3,420 2,260 1,160 51 % 10,306 7,480 2,826 38 % 2,480 1,983 497 25 % 7,228 4,706 2,522 54 % — (10 ) 10 (100 )% — 342 (342 ) (100 )% $ 13,489 $ 10,818 $ 2,671 25 % $ 39,929 $ 30,634 $ 9,295 30 % $ (4,129 ) $ (3,227 ) $ (902 ) 28 % $ (12,231 ) $ (8,917 ) $ (3,314 ) 37 % The increasesforeign currency transaction (loss) gain in the three and six months ended June 30, 2021 were primarily due to the increased valueimpact of our annual periodic equity awards granted in March 2016 and 2017. These awards generally have a five-year vesting schedule.Amortization of intangibles Three Months Ended
September 30, Nine Months Ended
September 30, (Dollars in thousands) 2017 2016 Change 2017 2016 Change $ 1,232 $ 1,642 $ (410 ) (25 )% $ 3,871 $ 4,626 $ (755 ) (16 )% 1,873 1,867 6 — % 5,608 5,274 334 6 % — 90 (90 ) (100 )% — 268 (268 ) (100 )% $ 3,105 $ 3,599 $ (494 ) (14 )% $ 9,479 $ 10,168 $ (689 ) (7 )% The decreases in amortization of intangibles in the three and nine months ended September 30, 2017 were due to the amortization in full of certain intangibles acquired through past acquisitions.Non-operating (expense)/income, net Three Months Ended
September 30, Nine Months Ended
September 30, (Dollars in thousands) 2017 2016 Change 2017 2016 Change $ (552 ) $ 1,082 $ (1,634 ) n/m $ (793 ) $ 2,764 $ (3,557 ) n/m 144 172 $ (28 ) (16 )% 470 650 (180 ) (28 )% — (1,237 ) $ 1,237 (100 )% 287 (4,891 ) 5,178 n/m $ (408 ) $ 17 $ (425 ) n/m $ (36 ) $ (1,477 ) $ 1,441 (98 )% n/m - not meaningfulIn May 2017, we discontinued our forward contracts program; however, we will continue to evaluate periodically our foreign exchange exposures and mayre-initiate this program if it is deemed necessary.Historically, we have used foreign currency forward contracts (“forward contracts”) to hedge our exposure to fluctuations in foreign currency exchange rates associated with our foreign currency denominatedcurrency-denominated cash, accounts receivable,receivables, and intercompany receivablesbalances held by our subsidiary in the United Kingdom.•The decreases in interest income in the three and payables heldsix months ended June 30, 2021 were primarily bydue to declines in market interest rates.•The decreases in interest expense in the U.S. parent companythree and its United Kingdom (“U.K.”) subsidiary.six months ended June 30, 2021 were primarily due to our adoption of ASU 2020-06 on January 1, 2021. See Note 4 “Derivative Instruments”"Note 2. New Accounting Pronouncements" in Item 1 of this Quarterly Report on Form 10-Q for additional information.Interest expense related to the Notes:Three Months Ended
June 30,Change Six Months Ended
June 30,Change (in thousands) 2021 2020 2021 2020 Contractual interest expense (0.75% coupon) $ 1,125 $ 1,125 $ — $ 2,250 $ 1,575 $ 675 Amortization of debt discount — 3,757 (3,757) — 5,253 (5,253) Amortization of issuance costs 675 558 117 1,348 780 568 $ 1,800 $ 5,440 $ (3,640) $ 3,598 $ 7,608 $ (4,010) •The total changeincreases in the gain on capped call transactions in the three and six months ended June 30, 2021, were due to fair value ofadjustments driven by increases in our foreign currency forward contracts recordedstock price.•The decrease in other income, (expense), net duringin the threesix months ended SeptemberJune 30, 20162021, was a loss of $1.2 million. The totaldue to larger fair value adjustments on equity securities held in our venture investments portfolio in the six months ended June 30, 2020.23(Benefit from) income taxesThree Months Ended
June 30,Six Months Ended
June 30,(Dollars in thousands) 2021 2020 2021 2020 (Benefit from) income taxes $ (11,916) $ (12,319) $ (29,534) $ (36,129) Effective income tax benefit rate (2,591) % 44 % During the six months ended June 30, 2021, the change in the fair value of our foreign currency forward contracts recorded in other (expense)/income, net, during the nine months ended September 30, 2017 and 2016 was a gain of $0.3 million and a loss of $5 million, respectively.(Benefit)/provision for income taxes Three Months Ended
September 30, Nine Months Ended
September 30, (Dollars in thousands) 2017 2016 Change 2017 2016 Change $ (12,885 ) $ 2,214 $ (15,099 ) n/m $ (17,952 ) $ 6,269 $ (24,221 ) n/m 88 % 40 % (96 )% 26 % n/m - not meaningfulThe (benefit)/provision for income taxes represents current and future amounts for federal, state, and foreign taxes.The increase in the effective income tax benefit rate in the three months ended September 30, 2017 iswas primarily due to the significant increaseimpact of $3.5 million in excessdiscrete tax benefits generated by our stock compensation plansitems on significantly lowera proportionately larger income (loss) before (benefit)/provision for income taxes which decreased by $20.2 million.The decrease in the effective income tax rate in the nine months ended September 30, 2017 is primarily due to theprior period. The most significant increase of $19.1 million in excess tax benefits generated by our stock compensation plans, on significantly lower income before (benefit)/provision for income taxes, which decreased by $5.8 million.The inclusion of excess tax benefits as a component of the provision for income taxes may increase volatility in the effective tax rates of future periods as the amount ofdiscrete items were excess tax benefits from share-basedstock-based compensation awards varies dependingand the impact of changes in statutory tax rates applicable to our U.K.-based deferred tax assets.Stock-based compensation increases the variability of our effective tax rates. The impact of stock-based compensation on a given period depends on our future stock price in relation toprofitability, the fair value of awards, the timing of RSU vesting and exercise behaviorattributes of our stock option holders,compensation awards we grant, and the total value of future grants of share-based compensation awards.Liquidity and capital resources Nine Months Ended
September 30, (in thousands) 2017 2016 $ 113,926 $ 20,556 (11,966 ) (2,859 ) (44,040 ) (43,031 ) 2,054 (1,309 ) $ 59,974 $ (26,643 ) (in thousands) September 30,
2017 December 31,
2016 $ 194,380 $ 133,761 LIQUIDITY AND CAPITAL RESOURCESSix Months Ended
June 30, (in thousands) 2021 2020 Cash provided by (used in): Operating activities $ 19,410 $ (21,199) Investing activities 10,493 (19,404) Financing activities (60,717) 485,293 Effect of exchange rates on cash and cash equivalents (1,207) (942) Net (decrease) increase in cash and cash equivalents $ (32,021) $ 443,748 (in thousands) June 30, 2021 December 31, 2020 Held by U.S. entities $ 306,754 $ 399,138 Held by foreign entities 104,583 66,030 Total cash, cash equivalents, and marketable securities $ 411,337 $ 465,168 We believe that our current cash, cash equivalents, marketable securities, and cash flow from operations, and borrowing capacity will be sufficient to fund our operations, our dividend payments,stock repurchases, and our share repurchase programquarterly cash dividends for at least the next 12 months.As of September 30, 2017, approximately $61.1 million of Whether these resources are adequate to meet our cashliquidity needs beyond that period will depend on our future growth, operating results, and cash equivalents was held inthe investments required to support our foreign subsidiaries. operations. If we require additional capital resources to grow our business, we may seek to finance our operations from available funds or additional external financing.If it becomes necessary to repatriate theseforeign funds, we may be required to pay U.S. tax, net of any applicableand foreign tax credits,taxes upon repatriation. We considerDue to the earningscomplexity of our foreign subsidiaries to be permanently reinvestedincome tax laws and as a result, U.S. taxes on such earnings are not provided. Itregulations, it is impracticalimpracticable to estimate the amount of U.S. taxtaxes we may be requiredwould have to pay upon repatriation duepay.Operating activitiesWe are in the process of transitioning our business to the complexity of the foreign tax credit calculations. There can be no assurance that changes in our plans or other events affecting our operations will not result in materially accelerated or unexpected expenditures.Cash provided by operating activitiesThe primary drivers during the nine months ended September 30, 2017 were net income of $36.6 millionsell software primarily through subscription arrangements, particularly Pega Cloud. This transition has impacted and $80.6 million from trade accounts receivable, largely dueis expected to increased cash collections andcontinue to impact the timing of billings.The primary driver duringchange in cash provided by (used in) operating activities in the ninesix months ended June 30, 2021 was primarily due to a significant increase in client collections.Corporate headquartersIn February 2021, we agreed to accelerate our exit from our existing Cambridge, Massachusetts corporate headquarters to October 1, 2021, in exchange for a one-time payment from our landlord of $18 million, which is expected to be paid in the last quarter of 2021. The accelerated exit from this lease reduced our future lease liabilities by $21.1 million. On March 31, 2021 we leased office space at One Main Street, Cambridge, Massachusetts, to serve as our future corporate headquarters. The approximately 4.5 year lease includes base rent of approximately $2 million per year.New Waltham OfficeOn July 6, 2021, we entered into an office space lease (the “Lease”) for 131 thousand square feet in Waltham, Massachusetts. The lease term of approximately 11 years is expected to commence on August 1, 2021 (the “Lease Commencement Date”), subject to certain adjustments for the initial occupancy date. The annual rent equals the base rent plus our portion of building operating costs and real estate taxes. Rent first becomes payable on August 1, 2022, subject to adjustment based on the Lease Commencement Date. Base rent for the first year is $6 million and will increase by 3% annually. In addition, we will receive an improvement allowance from the landlord of $11.8 million.24Investing activitiesThe change in cash provided by (used in) investing activities in the six months ended June 30, 2021 was primarily driven by investments in financial instruments, an acquisition, and a decrease in office space related capital expenditures.Financing activitiesIn February 2020, we issued $600 million in aggregate principal amount of convertible senior notes due March 1, 2025.In November 2019, and as amended as of February 2020, July 2020, and September 30, 2016 was net income of $18.2 million.Future Cash Receipts from Committed License and Cloud ArrangementsSeptemberJune 30, 2017, none2021, we had no outstanding borrowings under the Credit Facility. See "Note 8. Debt" in Item 1 of the amounts shown in the table below had been billed and no revenue had been recognized.The below amounts for 2018 and subsequent periods may not be recognized in the periods shown below as a result of the adoption of the new revenue recognition standard (ASC 606). (See Note 2. New Accounting Pronouncements contained elsewhere in this Quarterly Report on Form10-Qfor additional information) September 30,
2017 (in thousands) Term and cloud
contracts Perpetual contracts (1) Total $ 37,723 $ 13,274 $ 50,997 150,629 21,213 171,842 125,165 10,033 135,198 85,939 1,572 87,511 38,203 367 38,570 12,876 — 12,876 $ 450,535 $ 46,459 $ 496,994 Stock repurchase programChanges in the remaining stock repurchase authority:(1)These amounts are for perpetual licenses with extended payment terms and/or additional rights of use.(in thousands) Six Months Ended
June 30, 2021December 31, 2020 $ 37,726 Authorizations (1)38,467 Repurchases (2)(19,392) June 30, 2021 $ 56,801 Total contractual future cash receipts due from our existing license and cloud arrangements were approximately $376.3 million as of September 30, 2016.Cash used in investing activitiesDuring the nine months ended September 30, 2017,(1) On June 8, 2021, we purchased $25.7 million of marketable debt securities and made investments of $9.1 million in property and equipment, partially offset by proceeds received from maturities of marketable debt securities (including called marketable debt securities) of $23.1 million.During the nine months ended September 30, 2016, we acquired OpenSpan for $48.8 million, net of cash acquired, and invested $15.3 million primarily in internally developed software and leasehold improvements at our corporate headquarters, partially offset by proceeds received from the sales of marketable debt securities of $62.3 million.Cash used in financing activitiesWe used cash primarily for repurchases of our common stock, share repurchases for tax withholdings for the net settlement of our equity awards, and the payment of our quarterly dividend.Since 2004,announced that our Board of Directors has approved annualextended the current stock repurchase programs that have authorizedprogram’s expiration date to June 30, 2022 and increased the remaining common stock repurchase in the aggregate of upauthority to $195 million of our common stock.$60 million.(2) Purchases under these programsthis program have been made on the open market.The following table is a summary of our repurchase activity: Nine Months Ended
September 30, 2017 2016 (in thousands) Shares Amount Authorization Remaining
Under Publicly Announced
Share Repurchased
Programs Shares Amount Authorization Remaining
Under Publicly Announced
Share Repurchased
Programs $ 39,385 $ 40,534 — — — — — 25,879 682 (34,791 ) — 414 (10,791 ) — 68 (2,986 ) (2,986 ) 1,028 (25,530 ) (25,530 ) — — — 6 (177 ) (177 ) 750 $ (37,777 ) $ (2,986 ) 1,448 $ (36,498 ) $ 172 $ 36,399 $ 40,706 In addition to the shareCommon stock repurchases made under our repurchase programs, we net settled the majority of our employee stock option exercises and RSU vestings, which resulted in the withholding of shares to cover the option exercise price and the minimum statutory tax withholding obligations.Six Months Ended
June 30,2021 2020 (in thousands) Shares Amount Shares Amount Tax withholdings for net settlement of equity awards 328 $ 41,706 411 $ 37,093 Stock repurchase program 151 19,392 110 8,199 479 $ 61,098 521 $ 45,292 During the ninesix months ended SeptemberJune 30, 20172021 and 2016, option and RSU holders net settled a total of 2.4 million shares and 1.6 million shares, respectively, of which only 1.3 million shares and 0.8 million shares, respectively, were issued to the option and RSU holders. The balance of the shares were surrendered to us to pay for the exercise price with respect to options and the applicable taxes for both options and RSUs. During the nine months ended September 30, 2017 and 2016,2020, instead of receiving cash from the equity holders, we withheld shares with a value of $23.7$27.8 million and $10.1$31.2 million, respectively, for the exercise price of options.Dividends Nine Months Ended
September 30, (per share) 2017 2016 $ 0.09 $ 0.09 $ 0.09 $ 0.09 It is our current intentionWe intend to pay a quarterly cash dividend of $0.03 per share, however,share. However, the Board of Directors may terminate or modify thisthe dividend program at any time without prior notice.ITEM 3.QUANTITATIVE AND QUALITATIVE DISCLOSURESix Months Ended
June 30,(in thousands) 2021 2020 Dividend payments to stockholders $ 4,865 $ 4,793 Contractual obligationsAs of June 30, 2021, our contractual obligations were:Payments due by period (in thousands) 2021 2022 2023 2024 2025 2026 and thereafter Other Total Convertible senior notes (1)$ 2,250 $ 4,500 $ 4,500 $ 4,500 $ 601,488 $ — $ — $ 617,238 Purchase obligations (2)28,215 60,242 12,539 1,938 429 — — 103,363 Operating lease obligations (3)8,783 13,888 13,300 10,021 6,913 9,823 — 62,728 Liability for uncertain tax positions (4)— — — — — — 1,665 1,665 $ 39,248 $ 78,630 $ 30,339 $ 16,459 $ 608,830 $ 9,823 $ 1,665 $ 784,994 (1) Includes principal and interest.(2) Represents the fixed or minimum amounts due under purchase obligations for hosting services and sales and marketing programs(3) Excludes the Waltham lease, which we entered into on July 6, 2021. See "Note 14. Subsequent Events" in Item 1 of this Quarterly Report for additional information.(4) We are unable to reasonably estimate the timing of the cash outflow due to uncertainties in the timing of the effective settlement of tax positions.25ITEM 3. QUANTITATIVE AND QUALITATIVE DISCLOSURES ABOUT MARKET RISKMarket risk represents the risk of loss that may affect us due tofrom adverse changes in financial market prices and rates.Foreign currency exposureTranslation riskOur marketforeign operations’ operating expenses are primarily denominated in foreign currencies. However, our international sales are also primarily denominated in foreign currencies, which partially offsets our foreign currency exposure.A hypothetical 10% strengthening in the U.S. dollar against other currencies would have resulted in:Six Months Ended
June 30,2021 2020 (Decrease) increase in revenue (4) % (3) % (Decrease) increase in net income (1) % (15) % Remeasurement risk exposure is primarily related toWe experience fluctuations in foreign exchange rates.Astransaction gains and losses from the remeasurement of September 30, 2017, we did not have any forward contracts outstanding. See Note 4 “Derivative Instruments” of this Quarterly Report on Form10-Q for further discussion.Othermonetary assets and liabilities denominated in currencies other than the item discussed above, there were no significantfunctional currency of the entities in which they are recorded.We are primarily exposed to changes in foreign currency exchange rates associated with the Australian dollar, Euro, and U.S. dollar-denominated cash and cash equivalents, receivables, and intercompany receivables and payables held by our U.K. subsidiary, a British pound functional entity.A hypothetical 10% strengthening in the British pound exchange rate in comparison to our quantitativethe Australian dollar, Euro, and qualitative disclosures about market risk duringU.S. dollar would have resulted in the first nine months ended September 30, 2017. See Part II, Item 7A. Quantitative and Qualitative Disclosures about Market Risk included in our Annual Report on Form10-K for the year ended December 31, 2016 for a more complete discussion of our market risk exposure.following impact:Six Months Ended
June 30,(in thousands) 2021 2020 Foreign currency gain (loss) $ (5,676) $ 8,932 ITEM 4.CONTROLS AND PROCEDURESITEM 4. CONTROLS AND PROCEDURES(a) Evaluation of Disclosure Controlsdisclosure controls and ProceduresOur management, with the participation of our Chief Executive Officer or CEO,(“CEO”) and Chief Financial Officer or CFO,(“CFO”), evaluated the effectiveness of our disclosure controls and procedures (as defined in Rules13a-15(e) and15d-15(e) under the Securities Exchange Act)Act of 1934, as amended (“Exchange Act”)) as of SeptemberJune 30, 2017.2021. In designing and evaluating our disclosure controls and procedures, our management recognized that any controls and procedures, no matter how well designed and operated, can provide only reasonable assurance of achieving their objectives, and our management necessarily applied its judgment in evaluating the cost-benefit relationship of possible controls and procedures. Based on this evaluation, our CEO and CFO concluded that our disclosure controls and procedures were effective as of SeptemberJune 30, 2017.(b) Changes in Internal Controlinternal control over Financial ReportingThere have been no changes in our internal control over financial reporting (as defined in Rules13a-15(f) and15d-15(f) under the Securities Exchange Act) during the quarter ended SeptemberJune 30, 20172021 that have materially affected or are reasonably likely to materially affect our internal control over financial reporting.26PART II—II - OTHER INFORMATIONITEM 1A.RISK FACTORSITEM 1A. RISK FACTORSWe encourage you to consider carefully consider the risk factors identified in Part I, Item 1A. “Risk Factors” inof our Annual Report onForm 10-K for the year ended December 31, 2016.2020, filed with the U.S. Securities and Exchange Commission. These risk factors could materially affect our business, financial condition, and future results, and couldmay cause our actual business and financial results to differ materially from those contained in forward-looking statements made in this Quarterly Report on Form10-Q or elsewhere by management from time to time. There have been no material changes during the nine months ended September 30, 2017 to the risk factors disclosed in our Annual Report on Form10-K for the year ended December 31, 2016.management.ITEM 2.UNREGISTERED SALES OF EQUITY SECURITIES AND USE OF PROCEEDSThe following table sets forth information regarding our repurchasesITEM 2. UNREGISTERED SALES OF EQUITY SECURITIES AND USE OF PROCEEDSIssuer purchases of our commonequity securitiesCommon stock duringrepurchased in the three months ended SeptemberJune 30, 2017: Total Number
of Shares
Purchased
(in thousands) Average Price
Paid per
Share Total Number of
Shares Purchased as Part
of Publicly Announced
Share Repurchase
Program (1)
(in thousands) Approximate Dollar
Value of Shares That
May Yet Be Purchased at
Period End Under Publicly
Announced Share
Repurchased Programs (1)
(in thousands) 12 $ 58.54 — $ 36,399 55 56.16 — 36,399 108 56.56 — 36,399 175 $ 56.57 1.Shares withheld to cover the option exercise price and statutory tax withholding obligations under the net settlement provisions of the company’s stock compensation awards have been included in the above table.2.Since 2004, our Board of Directors has approved stock repurchase programs that have authorized the repurchase, in the aggregate, of up to $195 million of our common stock. On May 30, 2017, we announced that our Board of Directors extended the expiration date of the current stock repurchase program to June 30, 2018 (the “Current Program”). Under the Current Program, purchases may be made from time to time on the open market or in privately negotiated transactions. Shares may be repurchased in such amounts2021:(in thousands, except per share amounts) Total Number of Shares Purchased (1) (2)Average Price Paidper Share (1) (2)Total Number of Shares Purchased as Part of Publicly Announced Share Repurchase Program (2)Approximate Dollar Value of Shares That May Yet Be Purchased at Period End Under Publicly Announced Share Repurchase Programs (2)April 1, 2021 - April 30, 2021 53 $ 125.24 25 $ 25,430 May 1, 2021 - May 31, 2021 96 121.41 25 $ 22,431 June 1, 2021 - June 30, 2021 204 126.99 31 $ 56,801 353 $ 125.20 81 (1) Shares withheld to cover the option exercise price and tax withholding obligations under the net settlement provisions of our stock compensation awards have been included in these amounts.(2) On June 8, 2021, we announced that our Board of Directors extended the current stock repurchase program’s expiration date to June 30, 2022 and increased the remaining stock repurchase authority to $60 million. See "Liquidity and Capital Resources" in Item 2 of this Quarterly Report for additional information.ITEM 6. EXHIBITSExhibit No. Description Incorporation by Reference Filed Herewith Form Exhibit Filing Date 3.1 10-Q 3.1 November 4, 2014 3.2 8-K 3.2 June 15, 2020 10.1 X 10.2** 8-K 10.1 July 9, 2021 31.1 X 31.2 X 32++ X 101.INS Inline XBRL Instance Document - the instance document does not appear in the Interactive Data File because its XBRL tags are embedded within the Inline XBRL document. X 101.SCH Inline XBRL Taxonomy Extension Schema Document. X 101.CAL Inline XBRL Taxonomy Calculation Linkbase Document. X 101.DEF Inline XBRL Taxonomy Extension Definition Linkbase Document. X 101.LAB Inline XBRL Taxonomy Label Linkbase Document. X 101.PRE Inline XBRL Taxonomy Presentation Linkbase Document. X 104 Cover Page Interactive Data File (formatted as Inline XBRL and contained in Exhibit 101) X ++ Indicates that the exhibit is being furnished with this report and is not filed as market conditions warrant, subject to regulatory and other considerations. We have established apre-arranged stock repurchase plan, intended to comply with the requirements of Rule10b5-1 under the Securities Exchange Act of 1934, as amended (the “Exchange Act”), and Rule10b-18 under the Exchange Act (the“10b5-1 Plan”). All share repurchases under the Current Program during closed trading window periods will be made pursuant to the10b5-1 Plan.ITEM 6.EXHIBITSThe following exhibits are filed or furnished, as the case may be, as part of it.** Certain portions of this report.EXHIBIT INDEXExhibit No.Description31.1Certification pursuant to Exchange Act Rules13a-14 and15d-14 of the Chief Executive Officer.31.2Certification pursuant to Exchange Act Rules13a-14 and15d-14 of the Chief Financial Officer.32Certification pursuant to 18 U.S.C. Section 1350 of the Chief Executive Officer and the Chief Financial Officer.101.INSXBRL Instance document.101.SCHXBRL Taxonomy Extension Schema Document.101.CALXBRL Taxonomy Calculation Linkbase Document.101.DEFXBRL Taxonomy Extension Definition Linkbase Document.101.LABXBRL Taxonomy Label Linkbase Document.101.PREXBRL Taxonomy Presentation Linkbase Document.++Management contracts and compensatory plan or arrangements27SIGNATUREPursuant to the requirements of the Securities Exchange Act of 1934, the Registrant has duly caused this report to be signed on its behalf by the undersigned thereunto duly authorized.Pegasystems Inc. Date:Dated:July 28, 2021 November 8, 2017By:By:/s/ KENNETH STILLWELL Kenneth Stillwell Chief FinancialOperating Officer and Chief AdministrativeFinancial Officer(Principal Financial Officer) 27