SECURITIES AND EXCHANGE COMMISSION
Washington, D.C. 20549
____________________________
FORM 10-Q
FORM10-Q
(Mark One)
☒ | | | | | |
| ☒ | Quarterly Report pursuant to Section 13 or 15(d) of the Securities Exchange Act of 1934 |
| For the quarterly period ended September 30, 2021 |
For the quarterly period ended September 30, 2017
☐ | | | | | |
| ☐ | Transition Report pursuant to Section 13 or 15(d) of the Securities Exchange Act of 1934 |
For the transition period fromto
Commission File Number:
1-11859____________________________
(Exact name of Registrant as specified in its charter)
____________________________ | | | | | | | | | | | | | | | | | | | | | | | |
| Massachusetts | | 04-2787865 |
(State or other jurisdiction of incorporation or organization) | | (IRS Employer Identification No.) |
| |
One Rogers Street, Cambridge, MA | | 02142-1209 |
(Address of principal executive offices) | | (Zip Code) |
One Main Street, Cambridge, MA 02142
(Address of principal executive offices, including zip code)
(Registrant’s telephone number, including area code)
____________________________
Securities registered pursuant to Section 12(b) of the Act: | | | | | | | | |
| Title of each class | Trading symbol(s) | Name of each exchange on which registered |
| Common Stock, $.01 par value per share | PEGA | NASDAQ Global Select Market |
Indicate by check mark whether the Registrant (1) has filed all reports required to be filed by Section 13 or 15(d) of the Securities Exchange Act of 1934 during the preceding 12 months (or for such shorter period that the Registrant was required to file such reports), and (2) has been subject to such filing requirements for the past 90 days. Yes ☒ x No ☐¨ Indicate by check mark whether the registrantRegistrant has submitted electronically and posted on its corporate Web site, if any, every Interactive Data File required to be submitted and posted pursuant to Rule 405 of RegulationS-T during the preceding 12 months (or for such shorter period that the registrantRegistrant was required to submit and post such files). Yes ☒ x No ☐¨ Indicate by check mark whether the Registrant is a large accelerated filer, an accelerated filer, anon-accelerated filer, a smaller reporting company, or an emerging growth company. See the definitions of “large accelerated filer,” “accelerated filer,” “smaller reporting company,” and “emerging growth company,”company” inRule 12b-2 of the Exchange Act. | | | | | | | | | | | | | | | | | | | | | | | | | | | | | |
| Large accelerated filer | | ☒ | x | Accelerated filer | ☐ | ☐ |
| | | |
| Non-accelerated filer | ☐ | ☐ (Do not check if smaller reporting company) | | Smaller reporting company | ☐ | ☐ |
| | | |
| | | | Emerging growth company | | ☐ |
If an emerging growth company, indicate by check mark if the registrantRegistrant has elected not to use the extended transition period for complying with any new or revised financial accounting standards provided pursuant to Section 13(a) of the Exchange Act. ☐ Indicate by check mark whether the Registrant is a shell company (as defined inRule 12b-2 of the Exchange Act). Yes ☐No ☒ There were
77,859,95881,675,315 shares of the Registrant’s common stock,
$.01$0.01 par value per share, outstanding on October
27, 2017.19, 2021.
PEGASYSTEMS INC.
Index to Form
QUARTERLY REPORT ON FORM 10-Q
TABLE OF CONTENTS
PART
I—I - FINANCIAL INFORMATION
ITEM 1. | UNAUDITED CONDENSED CONSOLIDATED FINANCIAL STATEMENTS |
PEGASYSTEMS INC.
UNAUDITED CONDENSED CONSOLIDATED BALANCE SHEETS
(in thousands)
| | | | | | | | |
| | | September 30,
2017 | | | December 31,
2016 | |
Assets | | | | | | | | |
Current assets: | | | | | | | | |
Cash and cash equivalents | | $ | 130,568 | | | $ | 70,594 | |
Marketable securities | | | 63,812 | | | | 63,167 | |
| | | | | | | | |
Total cash, cash equivalents, and marketable securities | | | 194,380 | | | | 133,761 | |
Trade accounts receivable, net of allowance of $6,189 and $4,126 | | | 191,161 | | | | 265,028 | |
Income taxes receivable | | | 34,864 | | | | 14,155 | |
Other current assets | | | 17,679 | | | | 12,188 | |
| | | | | | | | |
Total current assets | | | 438,084 | | | | 425,132 | |
Property and equipment, net | | | 39,849 | | | | 38,281 | |
Deferred income taxes | | | 73,459 | | | | 69,898 | |
Long-term other assets | | | 5,982 | | | | 3,990 | |
Intangible assets, net | | | 34,755 | | | | 44,191 | |
Goodwill | | | 72,941 | | | | 73,164 | |
| | | | | | | | |
Total assets | | $ | 665,070 | | | $ | 654,656 | |
| | | | | | | | |
Liabilities and Stockholders’ Equity | | | | | | | | |
Current liabilities: | | | | | | | | |
Accounts payable | | $ | 12,535 | | | $ | 14,414 | |
Accrued expenses | | | 39,681 | | | | 36,751 | |
Accrued compensation and related expenses | | | 53,869 | | | | 60,660 | |
Deferred revenue | | | 160,931 | | | | 175,647 | |
| | | | | | | | |
Total current liabilities | | | 267,016 | | | | 287,472 | |
Income taxes payable | | | 4,774 | | | | 4,263 | |
Long-term deferred revenue | | | 6,130 | | | | 10,989 | |
Other long-term liabilities | | | 15,449 | | | | 16,043 | |
| | | | | | | | |
Total liabilities | | | 293,369 | | | | 318,767 | |
| | | | | | | | |
Stockholders’ equity: | | | | | | | | |
Preferred stock, 1,000 shares authorized; no shares issued and outstanding | | | — | | | | — | |
Common stock, 200,000 shares authorized; 77,839 shares and 76,591 shares issued and outstanding | | | 778 | | | | 766 | |
Additionalpaid-in capital | | | 146,728 | | | | 143,903 | |
Retained earnings | | | 227,953 | | | | 198,315 | |
Accumulated other comprehensive loss | | | (3,758 | ) | | | (7,095 | ) |
| | | | | | | | |
Total stockholders’ equity | | | 371,701 | | | | 335,889 | |
| | | | | | | | |
Total liabilities and stockholders’ equity | | $ | 665,070 | | | $ | 654,656 | |
| | | | | | | | |
ITEM 1. FINANCIAL STATEMENTS
| | | | | | | | | | | |
PEGASYSTEMS INC. UNAUDITED CONDENSED CONSOLIDATED BALANCE SHEETS (in thousands) |
| September 30, 2021 | | December 31, 2020 |
| Assets | | | |
| Current assets: | | | |
| Cash and cash equivalents | $ | 116,411 | | | $ | 171,899 | |
| Marketable securities | 235,437 | | | 293,269 | |
| Total cash, cash equivalents, and marketable securities | 351,848 | | | 465,168 | |
| Accounts receivable | 143,445 | | | 215,827 | |
| Unbilled receivables | 239,774 | | | 207,155 | |
| Other current assets | 93,819 | | | 88,760 | |
| Total current assets | 828,886 | | | 976,910 | |
| Unbilled receivables | 132,147 | | | 113,278 | |
| Goodwill | 81,954 | | | 79,231 | |
| Other long-term assets | 512,410 | | | 434,843 | |
| Total assets | $ | 1,555,397 | | | $ | 1,604,262 | |
| Liabilities and stockholders’ equity | | | |
| Current liabilities: | | | |
| Accounts payable | $ | 25,604 | | | $ | 24,028 | |
| Accrued expenses | 46,583 | | | 59,261 | |
| Accrued compensation and related expenses | 86,018 | | | 123,012 | |
| Deferred revenue | 229,103 | | | 232,865 | |
| Other current liabilities | 13,118 | | | 20,969 | |
| Total current liabilities | 400,426 | | | 460,135 | |
| Convertible senior notes, net | 589,769 | | | 518,203 | |
| Operating lease liabilities | 87,088 | | | 59,053 | |
| Other long-term liabilities | 18,482 | | | 24,699 | |
| Total liabilities | 1,095,765 | | | 1,062,090 | |
| Stockholders’ equity: | | | |
| Preferred stock, 1,000 shares authorized; none issued | — | | | — | |
Common stock, 200,000 shares authorized; 81,670 and 80,890 shares issued and outstanding at September 30, 2021 and December 31, 2020, respectively | 817 | | | 809 | |
| Additional paid-in capital | 148,098 | | | 204,432 | |
| Retained earnings | 316,150 | | | 339,879 | |
| Accumulated other comprehensive (loss) | (5,433) | | | (2,948) | |
| Total stockholders’ equity | 459,632 | | | 542,172 | |
| Total liabilities and stockholders’ equity | $ | 1,555,397 | | | $ | 1,604,262 | |
See notes to unaudited condensed consolidated financial statements.
PEGASYSTEMS INC.
UNAUDITED CONDENSED CONSOLIDATED STATEMENTS OF OPERATIONS
(in thousands, except per share amounts)
| | | | | | | | | | | | | | | | |
| | | Three Months Ended
September 30, | | | Nine Months Ended
September 30, | |
| | | 2017 | | | 2016 | | | 2017 | | | 2016 | |
Revenue: | | | | | | | | | | | | | | | | |
Software license | | $ | 41,793 | | | $ | 68,833 | | | $ | 195,220 | | | $ | 207,849 | |
Maintenance | | | 62,204 | | | | 55,038 | | | | 180,759 | | | | 163,174 | |
Services | | | 75,818 | | | | 58,931 | | | | 225,063 | | | | 179,633 | |
| | | | | | | | | | | | | | | | |
Total revenue | | | 179,815 | | | | 182,802 | | | | 601,042 | | | | 550,656 | |
| | | | | | | | | | | | | | | | |
Cost of revenue: | | | | | | | | | | | | | | | | |
Software license | | | 1,276 | | | | 1,313 | | | | 3,826 | | | | 3,646 | |
Maintenance | | | 6,716 | | | | 6,659 | | | | 20,945 | | | | 18,889 | |
Services | | | 61,739 | | | | 52,465 | | | | 180,925 | | | | 154,512 | |
| | | | | | | | | | | | | | | | |
Total cost of revenue | | | 69,731 | | | | 60,437 | | | | 205,696 | | | | 177,047 | |
| | | | | | | | | | | | | | | | |
Gross profit | | | 110,084 | | | | 122,365 | | | | 395,346 | | | | 373,609 | |
| | | | | | | | | | | | | | | | |
Operating expenses: | | | | | | | | | | | | | | | | |
Selling and marketing | | | 70,209 | | | | 67,032 | | | | 217,384 | | | | 202,126 | |
Research and development | | | 41,031 | | | | 38,036 | | | | 121,089 | | | | 108,530 | |
General and administrative | | | 13,133 | | | | 11,725 | | | | 38,174 | | | | 34,067 | |
Acquisition-related | | | — | | | | 74 | | | | — | | | | 2,903 | |
| | | | | | | | | | | | | | | | |
Total operating expenses | | | 124,373 | | | | 116,867 | | | | 376,647 | | | | 347,626 | |
| | | | | | | | | | | | | | | | |
(Loss)/income from operations | | | (14,289 | ) | | | 5,498 | | | | 18,699 | | | | 25,983 | |
Foreign currency transaction (loss)/gain | | | (552 | ) | | | 1,082 | | | | (793 | ) | | | 2,764 | |
Interest income, net | | | 144 | | | | 172 | | | | 470 | | | | 650 | |
Other income/(expense), net | | | — | | | | (1,237 | ) | | | 287 | | | | (4,891 | ) |
| | | | | | | | | | | | | | | | |
(Loss)/income before (benefit)/provision for income taxes | | | (14,697 | ) | | | 5,515 | | | | 18,663 | | | | 24,506 | |
(Benefit)/provision for income taxes | | | (12,885 | ) | | | 2,214 | | | | (17,952 | ) | | | 6,269 | |
| | | | | | | | | | | | | | | | |
Net (loss)/income | | $ | (1,812 | ) | | $ | 3,301 | | | $ | 36,615 | | | $ | 18,237 | |
| | | | | | | | | | | | | | | | |
(Loss)/earnings per share: | | | | | | | | | | | | | | | | |
Basic | | | (0.03 | ) | | | 0.04 | | | | 0.47 | | | | 0.24 | |
Diluted | | | (0.03 | ) | | | 0.04 | | | | 0.44 | | | | 0.23 | |
Weighted-average number of common shares outstanding: | | | | | | | | | | | | | | | | |
Basic | | | 77,691 | | | | 76,278 | | | | 77,258 | | | | 76,323 | |
Diluted | | | 77,691 | | | | 79,548 | | | | 82,717 | | | | 79,401 | |
Cash dividends declared per share | | $ | 0.03 | | | $ | 0.03 | | | $ | 0.09 | | | $ | 0.09 | |
| | | | | | | | | | | | | | | | | | | | | | | |
PEGASYSTEMS INC. UNAUDITED CONDENSED CONSOLIDATED STATEMENTS OF OPERATIONS (in thousands, except per share amounts) |
| Three Months Ended
September 30, | | Nine Months Ended
September 30, |
| 2021 | | 2020 | | 2021 | | 2020 |
| Revenue | | | | | | | |
| Pega Cloud | $ | 78,369 | | | $ | 54,776 | | | $ | 219,520 | | | $ | 147,080 | |
| Maintenance | 83,188 | | | 74,670 | | | 237,531 | | | 220,587 | |
| Software license | 38,295 | | | 39,784 | | | 272,148 | | | 187,023 | |
| Consulting | 56,416 | | | 56,721 | | | 166,270 | | | 164,227 | |
| Total revenue | 256,268 | | | 225,951 | | | 895,469 | | | 718,917 | |
| Cost of revenue | | | | | | | |
| Pega Cloud | 25,524 | | | 19,717 | | | 72,132 | | | 56,238 | |
| Maintenance | 5,293 | | | 5,478 | | | 16,074 | | | 16,645 | |
| Software license | 656 | | | 691 | | | 1,962 | | | 2,354 | |
| Consulting | 52,749 | | | 51,913 | | | 161,032 | | | 158,781 | |
| Total cost of revenue | 84,222 | | | 77,799 | | | 251,200 | | | 234,018 | |
| Gross profit | 172,046 | | | 148,152 | | | 644,269 | | | 484,899 | |
| Operating expenses | | | | | | | |
| Selling and marketing | 152,479 | | | 132,053 | | | 457,641 | | | 395,684 | |
| Research and development | 64,728 | | | 60,024 | | | 191,565 | | | 177,620 | |
| General and administrative | 20,176 | | | 17,907 | | | 57,607 | | | 49,192 | |
| Total operating expenses | 237,383 | | | 209,984 | | | 706,813 | | | 622,496 | |
| (Loss) from operations | (65,337) | | | (61,832) | | | (62,544) | | | (137,597) | |
| Foreign currency transaction gain (loss) | 518 | | | 4,236 | | | (4,983) | | | 2,545 | |
| Interest income | 166 | | | 243 | | | 555 | | | 1,092 | |
| Interest expense | (1,908) | | | (5,956) | | | (5,747) | | | (13,791) | |
| (Loss) income on capped call transactions | (14,735) | | | 18,989 | | | (7,543) | | | 19,816 | |
| Other income, net | 2 | | | — | | | 108 | | | 1,374 | |
| (Loss) before (benefit from) income taxes | (81,294) | | | (44,320) | | | (80,154) | | | (126,561) | |
| (Benefit from) income taxes | (24,826) | | | (25,053) | | | (54,360) | | | (61,182) | |
| Net (loss) | $ | (56,468) | | | $ | (19,267) | | | $ | (25,794) | | | $ | (65,379) | |
| (Loss) per share | | | | | | | |
| Basic | $ | (0.69) | | | $ | (0.24) | | | $ | (0.32) | | | $ | (0.82) | |
| Diluted | $ | (0.69) | | | $ | (0.24) | | | $ | (0.32) | | | $ | (0.82) | |
| Weighted-average number of common shares outstanding | | | | | | | |
| Basic | 81,526 | | | 80,537 | | | 81,284 | | | 80,191 | |
| Diluted | 81,526 | | | 80,537 | | | 81,284 | | | 80,191 | |
See notes to unaudited condensed consolidated financial statements.
PEGASYSTEMS INC.
UNAUDITED CONDENSED CONSOLIDATED STATEMENTS OF COMPREHENSIVE INCOME
(in thousands)
| | | | | | | | | | | | | | | | |
| | | Three Months Ended
September 30, | | | Nine Months Ended
September 30, | |
| | | 2017 | | | 2016 | | | 2017 | | | 2016 | |
Net (loss)/income | | $ | (1,812 | ) | | $ | 3,301 | | | $ | 36,615 | | | $ | 18,237 | |
Other comprehensive income/(loss), net of tax | | | | | | | | | | | | | | | | |
Unrealized gain/(loss) onavailable-for-sale marketable securities, net of tax | | | 22 | | | | (174 | ) | | | 148 | | | | 168 | |
Foreign currency translation adjustments | | | 549 | | | | (169 | ) | | | 3,189 | | | | (1,400 | ) |
| | | | | | | | | | | | | | | | |
Total other comprehensive income/(loss), net of tax | | | 571 | | | | (343 | ) | | | 3,337 | | | | (1,232 | ) |
| | | | | | | | | | | | | | | | |
Comprehensive (loss)/income | | $ | (1,241 | ) | | $ | 2,958 | | | $ | 39,952 | | | $ | 17,005 | |
| | | | | | | | | | | | | | | | |
| | | | | | | | | | | | | | | | | | | | | | | |
PEGASYSTEMS INC. UNAUDITED CONDENSED CONSOLIDATED STATEMENTS OF COMPREHENSIVE (LOSS) (in thousands) |
| Three Months Ended
September 30, | | Nine Months Ended
September 30, |
| 2021 | | 2020 | | 2021 | | 2020 |
| Net (loss) | $ | (56,468) | | | $ | (19,267) | | | $ | (25,794) | | | $ | (65,379) | |
| Other comprehensive (loss) income, net of tax | | | | | | | |
| Unrealized gain (loss) on available-for-sale securities | 53 | | | (166) | | | 1,184 | | | (66) | |
| Foreign currency translation adjustments | (4,400) | | | 113 | | | (3,669) | | | 1,627 | |
| Total other comprehensive (loss) income, net of tax | $ | (4,347) | | | $ | (53) | | | $ | (2,485) | | | $ | 1,561 | |
| Comprehensive (loss) | $ | (60,815) | | | $ | (19,320) | | | $ | (28,279) | | | $ | (63,818) | |
See notes to unaudited condensed consolidated financial statements.
PEGASYSTEMS INC.
UNAUDITED CONDENSED CONSOLIDATED STATEMENTS OF CASH FLOWS
(in thousands)
| | | | | | | | |
| | | Nine Months Ended
September 30, | |
| | | 2017 | | | 2016 | |
Operating activities: | | | | | | | | |
Net income | | $ | 36,615 | | | $ | 18,237 | |
Adjustments to reconcile net income to cash provided by operating activities: | | | | | | | | |
Deferred income taxes | | | (2,607 | ) | | | (2,841 | ) |
Depreciation and amortization | | | 18,703 | | | | 17,896 | |
Stock-based compensation expense | | | 39,929 | | | | 30,634 | |
Foreign currency transaction loss/(gain) | | | 793 | | | | (2,764 | ) |
Othernon-cash | | | (89 | ) | | | 153 | |
Change in operating assets and liabilities: | | | | | | | | |
Trade accounts receivable | | | 80,580 | | | | 3,940 | |
Income taxes receivable and other current assets | | | (25,943 | ) | | | (11,904 | ) |
Accounts payable and accrued expenses | | | (8,546 | ) | | | (16,678 | ) |
Deferred revenue | | | (25,639 | ) | | | (17,698 | ) |
Other long-term assets and liabilities | | | 130 | | | | 1,581 | |
| | | | | | | | |
Cash provided by operating activities | | | 113,926 | | | | 20,556 | |
Investing activities: | | | | | | | | |
Purchases of marketable securities | | | (25,687 | ) | | | (22,614 | ) |
Proceeds from maturities and called marketable securities | | | 23,124 | | | | 21,838 | |
Sales of marketable securities | | | — | | | | 62,283 | |
Payments for acquisitions, net of cash acquired | | | (297 | ) | | | (49,113 | ) |
Investment in property and equipment | | | (9,106 | ) | | | (15,253 | ) |
| | | | | | | | |
Cash used in investing activities | | | (11,966 | ) | | | (2,859 | ) |
Financing activities: | | | | | | | | |
Dividend payments to shareholders | | | (6,941 | ) | | | (6,883 | ) |
Common stock repurchases for tax withholdings for net settlement of equity awards | | | (34,113 | ) | | | (10,398 | ) |
Common stock repurchases under share repurchase programs | | | (2,986 | ) | | | (25,750 | ) |
| | | | | | | | |
Cash used in financing activities | | | (44,040 | ) | | | (43,031 | ) |
Effect of exchange rates on cash and cash equivalents | | | 2,054 | | | | (1,309 | ) |
| | | | | | | | |
Net increase/(decrease) in cash and cash equivalents | | | 59,974 | | | | (26,643 | ) |
Cash and cash equivalents, beginning of period | | | 70,594 | | | | 93,026 | |
| | | | | | | | |
Cash and cash equivalents, end of period | | $ | 130,568 | | | $ | 66,383 | |
| | | | | | | | |
| | | | | | | | | | | | | | | | | | | | | | | | | | | | | | | | | | | |
PEGASYSTEMS INC.
UNAUDITED CONDENSED CONSOLIDATED STATEMENTS OF STOCKHOLDERS’ EQUITY
(in thousands, except per share amounts) |
| Common Stock | | Additional
Paid-In Capital | | Retained Earnings | | Accumulated Other Comprehensive (Loss) | | Total
Stockholders’ Equity |
| Number
of Shares | | Amount | | | | |
| December 31, 2019 | 79,599 | | | $ | 796 | | | $ | 140,523 | | | $ | 410,919 | | | $ | (13,228) | | | $ | 539,010 | |
| Equity component of convertible senior notes, net | — | | | — | | | 61,604 | | | — | | | — | | | 61,604 | |
| Repurchase of common stock | (87) | | | (1) | | | (5,999) | | | — | | | — | | | (6,000) | |
| Issuance of common stock for stock compensation plans | 564 | | | 6 | | | (23,017) | | | — | | | — | | | (23,011) | |
| Stock-based compensation | — | | | — | | | 23,199 | | | — | | | — | | | 23,199 | |
| Cash dividends declared ($0.03 per share) | — | | | — | | | — | | | (2,405) | | | — | | | (2,405) | |
| Other comprehensive (loss) | — | | | — | | | — | | | — | | | (414) | | | (414) | |
| Net (loss) | — | | | — | | | — | | | (25,372) | | | — | | | (25,372) | |
| March 31, 2020 | 80,076 | | | $ | 801 | | | $ | 196,310 | | | $ | 383,142 | | | $ | (13,642) | | | $ | 566,611 | |
| Repurchase of common stock | (23) | | | — | | | (2,199) | | | — | | | — | | | (2,199) | |
| Issuance of common stock for stock compensation plans | 349 | | | 3 | | | (14,085) | | | — | | | — | | | (14,082) | |
| Issuance of common stock under the employee stock purchase plan | 18 | | | — | | | 1,403 | | | — | | | — | | | 1,403 | |
| Stock-based compensation | — | | | — | | | 25,674 | | | — | | | — | | | 25,674 | |
| Cash dividends declared ($0.03 per share) | — | | | — | | | — | | | (2,413) | | | — | | | (2,413) | |
| Other comprehensive income | — | | | — | | | — | | | — | | | 2,028 | | | 2,028 | |
| Net (loss) | — | | | — | | | — | | | (20,740) | | | — | | | (20,740) | |
| June 30, 2020 | 80,420 | | | $ | 804 | | | $ | 207,103 | | | $ | 359,989 | | | $ | (11,614) | | | $ | 556,282 | |
| Repurchase of common stock | (94) | | | (1) | | | (10,628) | | | — | | | — | | | (10,629) | |
| Issuance of common stock for stock compensation plans | 371 | | | 4 | | | (22,524) | | | — | | | — | | | (22,520) | |
| Stock-based compensation | — | | | — | | | 27,931 | | | — | | | — | | | 27,931 | |
| Cash dividends declared ($0.03 per share) | — | | | — | | | — | | | (2,422) | | | — | | | (2,422) | |
| Other comprehensive (loss) | — | | | — | | | — | | | — | | | (53) | | | (53) | |
| Net (loss) | — | | | — | | | — | | | (19,267) | | | — | | | (19,267) | |
| September 30, 2020 | 80,697 | | | $ | 807 | | | $ | 201,882 | | | $ | 338,300 | | | $ | (11,667) | | | $ | 529,322 | |
| | | | | | | | | | | |
| | | | | | | | | | | | | | | | | | | | | | | | | | | | | | | | | | | |
PEGASYSTEMS INC.
UNAUDITED CONDENSED CONSOLIDATED STATEMENTS OF STOCKHOLDERS’ EQUITY
(in thousands, except per share amounts) |
| Common Stock | | Additional
Paid-In Capital | | Retained Earnings | | Accumulated Other Comprehensive (Loss) | | Total
Stockholders’ Equity |
| Number
of Shares | | Amount | | | | |
| December 31, 2020 | 80,890 | | | $ | 809 | | | $ | 204,432 | | | $ | 339,879 | | | $ | (2,948) | | | $ | 542,172 | |
Cumulative-effect adjustment from adoption of ASU 2020-06, net | — | | | — | | | (61,604) | | | 9,399 | | | — | | | (52,205) | |
| Repurchase of common stock | (70) | | | (1) | | | (9,145) | | | — | | | — | | | (9,146) | |
| Issuance of common stock for stock compensation plans | 402 | | | 4 | | | (25,513) | | | — | | | — | | | (25,509) | |
| Issuance of common stock under the employee stock purchase plan | 24 | | | — | | | 2,288 | | | — | | | — | | | 2,288 | |
| Stock-based compensation | — | | | — | | | 30,100 | | | — | | | — | | | 30,100 | |
| Cash dividends declared ($0.03 per share) | — | | | — | | | — | | | (2,438) | | | — | | | (2,438) | |
| Other comprehensive income | — | | | — | | | — | | | — | | | 280 | | | 280 | |
| Net (loss) | — | | | — | | | — | | | (6,617) | | | — | | | (6,617) | |
| March 31, 2021 | 81,246 | | | $ | 812 | | | $ | 140,558 | | | $ | 340,223 | | | $ | (2,668) | | | $ | 478,925 | |
| Repurchase of common stock | (81) | | | (1) | | | (10,245) | | | — | | | — | | | (10,246) | |
| Issuance of common stock for stock compensation plans | 267 | | | 3 | | | (16,199) | | | — | | | — | | | (16,196) | |
| Issuance of common stock under the employee stock purchase plan | 24 | | | 1 | | | 2,858 | | | — | | | — | | | 2,859 | |
| Stock-based compensation | — | | | — | | | 30,698 | | | — | | | — | | | 30,698 | |
| Cash dividends declared ($0.03 per share) | — | | | — | | | — | | | (2,445) | | | — | | | (2,445) | |
| Other comprehensive income | — | | | — | | | — | | | — | | | 1,582 | | | 1,582 | |
| Net income | — | | | — | | | — | | | 37,291 | | | — | | | 37,291 | |
| June 30, 2021 | 81,456 | | | $ | 815 | | | $ | 147,670 | | | $ | 375,069 | | | $ | (1,086) | | | $ | 522,468 | |
| Repurchase of common stock | (96) | | | (1) | | | (12,795) | | | — | | | — | | | (12,796) | |
| Issuance of common stock for stock compensation plans | 286 | | | 3 | | | (18,117) | | | — | | | — | | | (18,114) | |
| Issuance of common stock under the employee stock purchase plan | 24 | | | — | | | 2,639 | | | — | | | — | | | 2,639 | |
| Stock-based compensation | — | | | — | | | 28,701 | | | — | | | — | | | 28,701 | |
| Cash dividends declared ($0.03 per share) | — | | | — | | | — | | | (2,451) | | | — | | | (2,451) | |
| Other comprehensive (loss) | — | | | — | | | — | | | — | | | (4,347) | | | (4,347) | |
| Net (loss) | — | | | — | | | — | | | (56,468) | | | — | | | (56,468) | |
| September 30, 2021 | 81,670 | | | $ | 817 | | | $ | 148,098 | | | $ | 316,150 | | | $ | (5,433) | | | $ | 459,632 | |
See notes to unaudited condensed consolidated financial statements.
| | | | | | | | | | | |
PEGASYSTEMS INC. UNAUDITED CONDENSED CONSOLIDATED STATEMENTS OF CASH FLOWS (in thousands) |
| Nine Months Ended
September 30, |
| 2021 | | 2020 |
| Operating activities | | | |
| Net (loss) | $ | (25,794) | | | $ | (65,379) | |
| Adjustments to reconcile net (loss) to cash (used in) operating activities | | | |
| Stock-based compensation | 89,483 | | | 76,755 | |
| Loss (gain) on capped call transactions | 7,543 | | | (19,816) | |
| Deferred income taxes | (53,638) | | | (43,476) | |
| Amortization of deferred commissions | 31,388 | | | 24,922 | |
| Amortization of debt discount and issuance costs | 2,025 | | | 10,405 | |
| Amortization of intangible assets and depreciation | 24,030 | | | 15,677 | |
| Amortization of investments | 2,916 | | | 252 | |
| Foreign currency transaction loss (gain) | 4,983 | | | (2,545) | |
| Other non-cash | (8,421) | | | 10,623 | |
| Change in operating assets and liabilities, net | (79,836) | | | (33,675) | |
| Cash (used in) operating activities | (5,321) | | | (26,257) | |
| Investing activities | | | |
| Purchases of investments | (67,170) | | | (190,319) | |
| Proceeds from maturities and called investments | 96,859 | | | — | |
| Sales of investments | 25,123 | | | 1,424 | |
| Payments for acquisitions, net of cash acquired | (4,993) | | | — | |
| Investment in property and equipment | (7,089) | | | (21,806) | |
| Cash provided by (used in) investing activities | 42,730 | | | (210,701) | |
| Financing activities | | | |
| Proceeds from issuance of convertible senior notes | — | | | 600,000 | |
| Purchase of capped calls related to convertible senior notes | — | | | (51,900) | |
| Payment of debt issuance costs | — | | | (14,527) | |
| Proceeds from employee stock purchase plan | 7,786 | | | 1,403 | |
| Dividend payments to stockholders | (7,310) | | | (7,206) | |
| | | |
| | | |
| | | |
| | | |
| Common stock repurchases | (91,907) | | | (78,140) | |
| Cash (used in) provided by financing activities | (91,431) | | | 449,630 | |
| Effect of exchange rate changes on cash and cash equivalents | (1,466) | | | 183 | |
| Net (decrease) increase in cash and cash equivalents | (55,488) | | | 212,855 | |
| Cash and cash equivalents, beginning of period | 171,899 | | | 68,363 | |
| Cash and cash equivalents, end of period | $ | 116,411 | | | $ | 281,218 | |
See notes to unaudited condensed consolidated financial statements.
NOTES TO UNAUDITED CONDENSED CONSOLIDATED FINANCIAL STATEMENTS
NOTE 1. BASIS OF PRESENTATION
Pegasystems Inc. (together with its subsidiaries, “the Company”) has prepared the accompanying unaudited condensed consolidated financial statements pursuant to the rules and regulations of the U.S. Securities and Exchange Commission (“SEC”) regarding interim financial reporting. Accordingly, they do not include all
of the information
and footnotes required by accounting principles generally accepted in the United States of America (“U.S.”) for complete financial
statements. These financial statements
and should be read in conjunction with the Company’s audited financial statements included in the Annual Report on Form
10-K for the year ended December 31,
2016.2020.
In the opinion of management, the Company has prepared the accompanying unaudited condensed consolidated financial statements on the same basis as its audited financial statements, and these financial statements include all adjustments, consisting only of normal recurring adjustments, necessary for a fair presentation of the results of the interim periods presented.
All intercompany transactions and balances were eliminated in consolidation. The operating results for the interim periods presented are not necessarily indicative of the results expected for the full year
2017.2021.
NOTE 2. NEW ACCOUNTING PRONOUNCEMENTS
Stock-Based Compensation
Convertible debt
In May 2017,August 2020, the Financial Accounting Standards Board (“FASB”) issued Accounting Standards Update (“ASU”)No. 2017-09 “Stock Compensation (Topic 718)2020-06, “Accounting for Convertible Instruments and Contracts in an Entity’s Own Equity” (“ASU 2020-06”), Scopewhich simplifies the accounting for certain financial instruments with characteristics of Modification Accounting” to clarify when toliabilities and equity, including convertible instruments and contracts in an entity’s own equity. The standard eliminates the liability and equity separation model for convertible instruments with a cash conversion feature. As a result, after adoption, entities will no longer separately present in stockholders’ equity an embedded conversion feature for such debt. Additionally, the debt discount resulting from separating the embedded conversion feature will no longer be amortized into income as interest expense over the instrument’s life. Instead, entities will account for a change to the terms or conditions ofconvertible debt instrument wholly as debt unless (1) a share-based payment awardconvertible instrument contains features that require bifurcation as a modification. Underderivative under ASC Topic 815, “Derivatives and Hedging”, or (2) a convertible debt instrument was issued at a substantial premium. The standard also requires the new guidance, modification accounting is required only ifconvertible instruments’ impact on diluted earnings per share (“EPS”) be determined using the fairif-converted method.
The Company adopted ASU 2020-06 using the modified retrospective approach on January 1, 2021. Upon adoption, the book value
the vesting conditions, or the classification of the
award (as equity or liability) changes as a resultCompany’s Convertible Senior Notes (the “Notes”) increased by $69.5 million to $587.7 million, and retained earnings increased by $9.4 million. The retained earnings adjustment reflects the tax effected difference between the value of the
change in terms or conditions. The effective date forNotes and the
Company will be January 1, 2018. The Company does not expectembedded conversion feature before adoption and the
adoption of this standard to have a material effect on its financial position or results of operations.Financial Instruments
In June 2016, the FASB issued ASUNo. 2016-13, “Financial Instruments—Credit Losses (Topic 326): Measurement of Credit Losses on Financial Instruments,” which requires measurement and recognition of expected credit losses for financial assets measured atcombined convertible instrument's amortized cost including trade accounts receivable, upon initial recognitionafter adoption.
See "Note 8. Debt" for additional information.
NOTE 3. MARKETABLE SECURITIES | | | | | | | | | | | | | | | | | | | | | | | | | | | | | | | | | | | | | | | | | | | | | | | |
| September 30, 2021 | | December 31, 2020 |
| (in thousands) | Amortized Cost | | Unrealized Gains | | Unrealized Losses | | Fair Value | | Amortized Cost | | Unrealized Gains | | Unrealized Losses | | Fair Value |
| Government debt | $ | 2,000 | | | $ | — | | | $ | — | | | $ | 2,000 | | | $ | 39,996 | | | $ | — | | | $ | (8) | | | $ | 39,988 | |
| Corporate debt | 233,556 | | | 25 | | | (144) | | | 233,437 | | | 253,345 | | | 88 | | | (152) | | | 253,281 | |
| $ | 235,556 | | | $ | 25 | | | $ | (144) | | | $ | 235,437 | | | $ | 293,341 | | | $ | 88 | | | $ | (160) | | | $ | 293,269 | |
As of
that financial asset usingSeptember 30, 2021, marketable securities’ maturities ranged from October 2021 to September 2024, with a
forward-looking expected loss model, rather than an incurred loss model for credit losses. Credit losses relating toavailable-for-sale debt securities should be recorded through an allowance for credit losses when the fair value is below the amortized costweighted-average remaining maturity of
the asset, removing the concept of “other-than-temporary” impairments. The effective date for the Company will be January 1, 2020, with early adoption permitted. The Company is currently evaluating the effect this ASU will have on its consolidated financial statements and related disclosures.Leases
In February 2016, the FASB issued ASUNo. 2016-02, “Leases (Topic 842),” which requires lessees to record most leases on their balance sheets, recognizing a lease liability for the obligation to make lease payments and aright-of-use asset for the right to use the underlying asset for the lease term. The effective date for the Company will be January 1, 2019, with early adoption permitted. The Company expects that most of its operating lease commitments will be subject to this ASU and recognized as operating lease liabilities andright-of-use assets upon adoption with no material impact to its results of operations and cash flows.
Revenue
In May 2014, the FASB issued ASUNo. 2014-09, “Revenue from Contracts with Customers (Topic 606)”. This ASU amends the guidance for revenue recognition, creating the new Accounting Standards Codification Topic 606 (“ASC 606”). ASC 606 requires entities to apportion consideration from contracts to performance obligations on a relative standalone selling price basis, based on a five-step model. Under ASC 606, revenue is recognized when a customer obtains control of a promised good or service and is recognized in an amount that reflects the consideration which the entity expects to receive in exchange for the good or service. In addition, ASC 606 requires disclosure of the nature, amount, timing, and uncertainty of revenue and cash flows arising from contracts with customers.
The Company has elected the full retrospective adoption model, effective January 1, 2018. The Company’s quarterly results beginning with the quarter ending March 31, 2018 and comparative prior periods will be compliant with ASC 606. The Company’s Annual Report on Form10-K for the year ended December 31, 2018 will be the Company’s first Annual Report that will be issued in compliance with ASC 606.
1.2 years.
NOTES TO UNAUDITED CONDENSED CONSOLIDATED FINANCIAL STATEMENTS (continued)
The Company has made significant progress on quantifying
NOTE 4. RECEIVABLES, CONTRACT ASSETS, AND DEFERRED REVENUE
Receivables | | | | | | | | | | | |
| (in thousands) | September 30, 2021 | | December 31, 2020 |
| Accounts receivable | $ | 143,445 | | | $ | 215,827 | |
| Unbilled receivables | 239,774 | | | 207,155 | |
| Long-term unbilled receivables | 132,147 | | | 113,278 | |
| $ | 515,366 | | | $ | 536,260 | |
Unbilled receivables
Unbilled receivables are client-committed amounts for which revenue recognition precedes billing, and billing is solely subject to the
impactpassage of
its adoption and identifying necessary changes to our policies, processes, systems, and controls.The Company expects the following impacts:
time. Currently, the Company recognizes revenue from term licenses and perpetual licenses with extended payment terms over the termUnbilled receivables by expected billing date: | | | | | | | | |
| (Dollars in thousands) | September 30, 2021 |
| 1 year or less | $ | 239,774 | | 64 | % |
| 1-2 years | 80,980 | | 22 | % |
| 2-5 years | 51,167 | | 14 | % |
| $ | 371,921 | | 100 | % |
Unbilled receivables by contract effective date: | | | | | | | | |
| (Dollars in thousands) | September 30, 2021 |
| 2021 | $ | 168,237 | | 45 | % |
| 2020 | 109,904 | | 29 | % |
| 2019 | 47,058 | | 13 | % |
| 2018 | 22,169 | | 6 | % |
| 2017 and prior | 24,553 | | 7 | % |
| $ | 371,921 | | 100 | % |
Major clients
Clients accounting for 10% or more of the agreementCompany’s total receivables: | | | | | | | | | | | |
| September 30, 2021 | | December 31, 2020 |
| Client A | 12 | % | | * |
* Client accounted for less than 10% of total receivables.
Contract assets
Contract assets are client-committed amounts for which revenue recognized exceeds the amount billed to the client, and billing is subject to conditions other than the passage of time, such as completing a related performance obligation. | | | | | | | | | | | |
| (in thousands) | September 30, 2021 | | December 31, 2020 |
Contract assets (1) | $ | 11,495 | | | $ | 15,296 | |
Long-term contract assets (2) | 8,485 | | | 7,777 | |
| $ | 19,980 | | | $ | 23,073 | |
(1) Included in other current assets. (2) Included in other long-term assets.
Deferred revenue
Deferred revenue consists of billings and payments becomereceived in advance of revenue recognition. | | | | | | | | | | | |
| (in thousands) | September 30, 2021 | | December 31, 2020 |
| Deferred revenue | $ | 229,103 | | | $ | 232,865 | |
Long-term deferred revenue (1) | 5,682 | | | 8,991 | |
| $ | 234,785 | | | $ | 241,856 | |
(1) Included in other long-term liabilities.
The change in deferred revenue in the nine months ended September 30, 2021 was primarily due or earlier if prepaid, provided all other criteria forto new billings in advance of revenue recognition, have been met, and any corresponding maintenance over the termoffset by $212.0 million of the agreement. The adoption of ASC 606 will result in revenue for performance obligations being recognized as they are satisfied. Therefore, revenue from the term and perpetual license performance obligations with extended payment terms is recognized when control is transferred to the customer. Any unrecognized license revenue from these arrangements,that was included in deferred revenue atas of December 31, 2015, will not be recognized in revenue in future periods but as a cumulative adjustment to retained earnings. Further, term license revenue from new arrangements executed in 2016 and 2017 will be recognized in full in the year that control of the license is transferred to the customer instead of over the term of the agreement. Revenue from the maintenance performance obligations is expected to be recognized on a straight-line basis over the contractual term. Due to the revenue from term and perpetual licenses with extended payment terms being recognized prior to amounts being billed to the customer, the Company expects to recognize a net contract asset on the balance sheet.2020.
Currently, the Company allocates revenue to licenses under the residual method when it has Vendor Specific Objective Evidence (“VSOE”) for the remaining undelivered elements, which allocates any future credits or significant discounts entirely to the license. The adoption of ASC 606 will result in future credits, significant discounts, and material rights under ASC 606, to be allocated to all performance obligations based upon their relative selling price. Under ASC 606, additional license revenue from the reallocation of such arrangement considerations will be recognized when control is transferred to the customer, which is generally upon delivery of the license.Currently, the Company does not have VSOE for fixed price services, time and materials services in certain geographical areas, and unspecified future products, which results in revenue being deferred in such instances until such time as VSOE exists for all undelivered elements or recognized ratably over the longest performance period. The adoption of ASC 606 eliminates the requirement for VSOE and replaces it with the concept of a stand-alone selling price. Once the transaction price is allocated to each of the performance obligations, the Company can recognize revenue as the performance obligations are delivered, either at a point in time or over time. Under ASC 606, license revenue will be recognized when control is transferred to the customer, professional services revenue will be recognized over time based on input or output measures that reflect the Company’s performance on the contract. This will result in the acceleration of professional services revenue when compared to the current practice of ratable recognition for professional services when there is a lack of VSOE.
Sales commissions and other third party acquisition costs resulting directly from securing contracts with customers are currently expensed when incurred. ASC 606 will require these costs to be recognized as an asset when incurred and to be expensed over the associated contract term. As a practical expedient, if the term of the contract is one year or less, the Company will expense these costs as incurred. The Company expects this change to impact its multi-year cloud offerings and term and perpetual licenses with additional rights of use that extend beyond one year.
ASC 606 provides additional accounting guidance for contract modifications whereby changes must be accounted for either as a retrospective change (creating either a catch up or deferral of past revenues), prospectively with a reallocation of revenues amongst identified performance obligations, or prospectively as separate contracts which will not require any reallocation. This may result in a difference in the timing of the recognition of revenue as compared to how contract modifications are recognized currently.
There will be a corresponding effect on tax liabilities in relation to all of the above impacts.
PEGASYSTEMS INC.
NOTES TO UNAUDITED CONDENSED CONSOLIDATED FINANCIAL STATEMENTS (continued)
3. MARKETABLE SECURITIES
The Company’s marketable securities
NOTE 5. DEFERRED COMMISSIONS | | | | | | | | | | | |
| (in thousands) | September 30, 2021 | | December 31, 2020 |
Deferred commissions (1) | $ | 114,503 | | | $ | 108,624 | |
(1) Included in other long-term assets.
| | | | | | | | | | | | | | | | | | | | | | | |
| Three Months Ended
September 30, | | Nine Months Ended
September 30, |
| (in thousands) | 2021 | | 2020 | | 2021 | | 2020 |
Amortization of deferred commissions (1) | $ | 10,186 | | | $ | 8,861 | | | $ | 31,388 | | | $ | 24,922 | |
(1) Included in selling and marketing expense.
NOTE 6. GOODWILL AND OTHER INTANGIBLES
Goodwill
Change in goodwill: | | | | | | | |
| Nine Months Ended
September 30, |
| (in thousands) | 2021 | | |
| January 1, | $ | 79,231 | | | |
| Acquisition | 2,701 | | | |
| Currency translation adjustments | 22 | | | |
| September 30, | $ | 81,954 | | | |
Intangibles
Intangible assets are as follows: | | | | | | | | | | | | | | | | |
| (in thousands) | | Amortized
Cost | | | Unrealized
Gains | | | Unrealized
Losses | | | Fair
Value | |
September 30, 2017 | | | | | | | | | | | | | | | | |
Municipal bonds | | $ | 32,764 | | | $ | 12 | | �� | $ | (17 | ) | | $ | 32,759 | |
Corporate bonds | | | 31,079 | | | | 12 | | | | (38 | ) | | | 31,053 | |
| | | | | | | | | | | | | | | | |
| | $ | 63,843 | | | $ | 24 | | | $ | (55 | ) | | $ | 63,812 | |
| | | | | | | | | | | | | | | | |
December 31, 2016 | | | | | | | | | | | | | | | | |
Municipal bonds | | $ | 36,746 | | | $ | — | | | $ | (139 | ) | | $ | 36,607 | |
Corporate bonds | | | 26,610 | | | | 1 | | | | (51 | ) | | | 26,560 | |
| | | | | | | | | | | | | | | | |
| | $ | 63,356 | | | $ | 1 | | | $ | (190 | ) | | $ | 63,167 | |
| | | | | | | | | | | | | | | | |
As of September 30, 2017,recorded at cost and amortized using the Company did not hold any investments with unrealized losses that are considered to be other-than-temporary.
As of September 30, 2017, remaining maturities of marketable debt securities ranged from October 2017 to September 2020, with a weighted-average remaining maturity of approximately 14 months.
4. DERIVATIVE INSTRUMENTS
In May 2017, the Company discontinued its forward contracts program; however, it will continue to evaluate periodically its foreign exchange exposures and mayre-initiate this program if it is deemed necessary.
The Company has historically used foreign currency forward contracts (“forward contracts”) to hedge its exposure to fluctuationsstraight-line method over their estimated useful lives.
| | | | | | | | | | | | | | | | | | | | | | | |
| | | September 30, 2021 |
| (in thousands) | Useful Lives | | Cost | | Accumulated Amortization | | Net Book Value (1) |
| Client-related | 4-10 years | | $ | 63,163 | | | $ | (56,988) | | | $ | 6,175 | |
| Technology | 2-10 years | | 67,142 | | | (58,273) | | | 8,869 | |
| Other | 1-5 years | | 5,361 | | | (5,361) | | | — | |
| | | $ | 135,666 | | | $ | (120,622) | | | $ | 15,044 | |
(1) Included in foreign currency exchange rates associated with its foreign currency denominated cash, accounts receivable, and intercompany receivables and payables held primarily by the U.S. parent company and its United Kingdom (“U.K.”) subsidiary.At December 31, 2016, the total notional value of the Company’s outstanding forward contracts was $128.4 million.
The fair value of the Company’s outstanding forward contracts was as follows:
| | | | | | | | |
| | | December 31, 2016 | |
| (in thousands) | | Recorded In: | | | Fair Value | |
Asset Derivatives | | | | | | | | |
Foreign currency forward contracts | | | Other current assets | | | $ | 628 | |
Liability Derivatives | | | | | | | | |
Foreign currency forward contracts | | | Accrued expenses | | | $ | 883 | |
As of September 30, 2017, the Company did not have any forward contracts outstanding.
The Company had forward contracts outstanding with total notional values as of September 30, 2016 as follows:
| | | | |
| (in thousands) | | | |
Euro | | € | 21,810 | |
British pound | | £ | 5,919 | |
Australian dollar | | A$ | 19,515 | |
United States dollar | | $ | 59,450 | |
other long-term assets.
| | | | | | | | | | | | | | | | | | | | | | | |
| | | December 31, 2020 |
| (in thousands) | Useful Lives | | Cost | | Accumulated Amortization | | Net Book Value (1) |
| Client-related | 4-10 years | | $ | 63,168 | | | $ | (55,877) | | | $ | 7,291 | |
| Technology | 2-10 years | | 64,843 | | | (56,386) | | | 8,457 | |
| Other | 1-5 years | | 5,361 | | | (5,361) | | | — | |
| | | $ | 133,372 | | | $ | (117,624) | | | $ | 15,748 | |
(1) Included in other long-term assets.
NOTES TO UNAUDITED CONDENSED CONSOLIDATED FINANCIAL STATEMENTS (continued)
Amortization of intangible assets: | | | | | | | | | | | | | | | | | | | | | | | |
| Three Months Ended
September 30, | | Nine Months Ended
September 30, |
| (in thousands) | 2021 | | 2020 | | 2021 | | 2020 |
| Cost of revenue | $ | 629 | | | $ | 647 | | | $ | 1,887 | | | $ | 1,940 | |
| Selling and marketing | 373 | | | 371 | | | 1,119 | | | 1,111 | |
| | | | | | | |
| $ | 1,002 | | | $ | 1,018 | | | $ | 3,006 | | | $ | 3,051 | |
Future estimated intangibles assets amortization: | | | | | |
| (in thousands) | September 30, 2021 |
| 2021 | $ | 981 | |
| 2022 | 3,886 | |
| 2023 | 3,618 | |
| 2024 | 2,849 | |
| 2025 | 2,509 | |
| 2026 and thereafter | 1,201 | |
| $ | 15,044 | |
NOTE 7. LEASES
Corporate headquarters
In February 2021, the Company agreed to accelerate its exit from its corporate headquarters to October 1, 2021, in exchange for a one-time payment from our landlord of $18 million, which was amortized over the remaining lease term. The income statement impactaccelerated exit from this lease reduced our future lease liabilities by $21.1 million and accelerated corporate headquarters-related depreciation. On March 31, 2021 the Company leased office space at One Main Street, Cambridge, Massachusetts, to serve as its corporate headquarters. The 4.5 year lease includes a base rent of $2 million per year.
New Waltham Office
On July 6, 2021, the Company entered into an office space lease for 131 thousand square feet in Waltham, Massachusetts. The lease term of 11 years began on August 1, 2021. The annual rent equals the base rent plus a portion of building operating costs and real estate taxes. Rent first becomes payable on August 1, 2022. Base rent for the first year is approximately $6 million and will increase by 3 percent annually. In addition, the Company will receive an improvement allowance from the landlord of up to $11.8 million. This lease increased the Company’s lease liabilities and lease-related right of use assets by $42.1 million on August 1, 2021.
Expense | | | | | | | | | | | | | | | | | | | | | | | |
| Three Months Ended
September 30, | | Nine Months Ended
September 30, |
| (in thousands) | 2021 | | 2020 | | 2021 | | 2020 |
Fixed lease costs (1) | $ | (3,108) | | | $ | 5,172 | | | $ | (6,780) | | | $ | 14,933 | |
| Short-term lease costs | 542 | | | 422 | | | 1,516 | | | 1,248 | |
| Variable lease costs | 1,099 | | | 1,259 | | | 3,826 | | | 3,506 | |
| $ | (1,467) | | | $ | 6,853 | | | $ | (1,438) | | | $ | 19,687 | |
(1) The decrease in fixed lease costs in three and nine months ended September 30, 2021 was due to the modification of the corporate headquarters lease.
Right of use assets and lease liabilities | | | | | | | | | | | |
| (in thousands) | September 30, 2021 | | December 31, 2020 |
Right of use assets (1) | $ | 91,349 | | | $ | 67,651 | |
Operating lease liabilities (2) | $ | 10,668 | | | $ | 18,541 | |
| Long-term operating lease liabilities | $ | 87,088 | | | $ | 59,053 | |
(1) Represents the Company’s right to use the leased asset during the lease term. Included in other long-term assets.
(2) Included in other current liabilities.
PEGASYSTEMS INC.
NOTES TO UNAUDITED CONDENSED CONSOLIDATED FINANCIAL STATEMENTS (continued)
Weighted-average remaining lease term and discount rate for the Company’s leases were: | | | | | | | | | | | |
| September 30, 2021 | | December 31, 2020 |
| Weighted-average remaining lease term | 7.8 years | | 4.7 years |
Weighted-average discount rate (1) | 4.4 | % | | 5.4 | % |
(1) The rates implicit in most of the Company’s leases are not readily determinable. Therefore, the Company uses its incremental borrowing rate as the discount rate when measuring operating lease liabilities. The incremental borrowing rate represents an estimate of the interest rate the Company would incur to borrow an amount equal to the lease payments on a collateralized basis over the lease term in a similar economic environment.
Maturities of lease liabilities: | | | | | |
| (in thousands) | September 30, 2021 |
| Remainder of 2021 | $ | 961 | |
| 2022 | 9,948 | |
| 2023 | 19,607 | |
| 2024 | 16,482 | |
| 2025 | 13,607 | |
| 2026 | 9,866 | |
| Thereafter | 48,515 | |
| Total lease payments | 118,986 | |
Less: imputed interest (1) | (21,230) | |
| $ | 97,756 | |
(1) Lease liabilities are measured at the present value of the remaining lease payments using a discount rate determined at lease commencement unless the discount rate is updated due to a lease reassessment event.
Cash flow information | | | | | | | | | | | |
| Nine Months Ended
September 30, |
| (in thousands) | 2021 | | 2020 |
| Cash paid for leases | $ | 14,403 | | | $ | 15,503 | |
| Right of use assets recognized for new leases and amendments (non-cash) | $ | 54,716 | | | $ | 24,276 | |
NOTE 8. DEBT
Convertible senior notes and capped calls
Convertible senior notes
In February 2020, the Company issued Convertible Senior Notes (the "Notes") with an aggregate principal of $600 million, due March 1, 2025, in a private placement. No principal payments are due before maturity. The Notes accrue interest at an annual rate of 0.75%, payable semi-annually in arrears on March 1 and September 1, beginning on September 1, 2020.
Conversion rights
The conversion rate is 7.4045 shares of common stock per $1,000 principal amount of the Notes, representing an initial conversion price of $135.05 per share of common stock. The Company will settle conversions by paying or delivering cash, shares of its common stock, or a combination of cash and shares of its common stock, at the Company’s election, based on the applicable conversion rate. The conversion rate will be adjusted upon certain events, including spin-offs, tender offers, exchange offers, and certain stockholder distributions.
Beginning on September 1, 2024, noteholders may convert their Notes at any time at their election.
Before September 1, 2024, noteholders may convert their Notes in the following circumstances:
•During any calendar quarter beginning after June 30, 2020 (and only during such calendar quarter), if the last reported sale price per share of the Company’s common stock exceeds 130% of the conversion price for each of at least 20 trading days (whether or not consecutive) during the 30 consecutive trading days ending on, and including, the last trading day of the immediately preceding calendar quarter.
•During the 5 consecutive business days immediately after any 5 consecutive trading day period (the “Measurement Period”), if the trading price per $1,000 principal amount of Notes for each trading day of the Measurement Period was less than 98% of the product of the last reported sale price per share of common stock on such trading day and the conversion rate on such trading day.
•Upon certain corporate events or distributions or if the Company calls any Notes for redemption, noteholders may convert before the close of business on the business day immediately before the related redemption date (or, if the Company fails to pay the redemption price in full on the redemption date, until the Company pays the redemption price).
As of September 30, 2021, the Notes were not eligible for conversion.
PEGASYSTEMS INC.
NOTES TO UNAUDITED CONDENSED CONSOLIDATED FINANCIAL STATEMENTS (continued)
Repurchase rights
On or after March 1, 2023 and on or before the 40th scheduled trading day immediately before the maturity date, the Company may redeem for cash all or part of the Notes at a repurchase price equal to 100% of the principal amount, plus accrued and unpaid interest, if the last reported sale price of the Company’s common stock exceeded 130% of the conversion price then in effect for at least 20 trading days (whether or not consecutive) during any 30 consecutive trading day period ending on, and including, the trading day immediately preceding the date on which the Company provides a redemption notice.
If certain corporate events that constitute a “Fundamental Change” occur, each noteholder will have the right to require the Company to repurchase for cash all of such noteholder’s Notes, or any portion of the principal thereof that is equal to $1,000 or a multiple of $1,000, at a repurchase price equal to 100% of the principal amount thereof, plus accrued and unpaid interest. A Fundamental Change relates to mergers, changes in control of the Company, liquidation/dissolution of the Company, or the delisting of the Company’s common stock.
Impact of the Notes
The Company adopted ASU 2020-06 using the modified retrospective approach on January 1, 2021. The standard eliminates the liability and equity separation model for convertible instruments with a cash conversion feature. See "Note 2. New Accounting Pronouncements" for additional information.
Until January 1, 2021, the Notes were separated into liability and equity components.
•The initial carrying amount of the liability component was calculated by measuring a similar debt instrument’s fair value that does not have an associated conversion feature. The excess of the Notes’ principal amount over the initial carrying amount of the liability component, the debt discount, was amortized as interest expense over the Notes’ contractual term.
•The equity component was recorded as an increase to additional paid-in capital and not remeasured.
Upon adoption of ASU 2020-06, the book value of the Notes increased by $69.5 million to $587.7 million, and retained earnings increased by $9.4 million. The retained earnings adjustment reflects the tax effected difference between the value of the Notes and the embedded conversion feature before adoption and the combined convertible instrument's amortized cost after adoption.
Carrying value of the Notes: | | | | | | | | | | | |
| (in thousands) | September 30, 2021 | | December 31, 2020 |
| Principal | $ | 600,000 | | | $ | 600,000 | |
| Unamortized debt discount | — | | | (71,222) | |
| Unamortized issuance costs | (10,231) | | | (10,575) | |
| Convertible senior notes, net | $ | 589,769 | | | $ | 518,203 | |
| | | |
| Conversion options | $ | — | | | $ | 84,120 | |
| Issuance costs | — | | | (2,037) | |
| Deferred taxes | — | | | (20,479) | |
| Additional paid-in capital | $ | — | | | $ | 61,604 | |
Interest expense related to the Notes: | | | | | | | | | | | | | | | | | | | | | | | |
| Three Months Ended
September 30, | | Nine Months Ended
September 30, |
| (in thousands) | 2021 | | 2020 | | 2021 | | 2020 |
| Contractual interest expense (0.75% coupon) | $ | 1,125 | | | $ | 1,125 | | | $ | 3,375 | | | $ | 2,700 | |
| Amortization of debt discount | — | | | 3,807 | | | — | | | 9,060 | |
| Amortization of issuance costs | 677 | | | 565 | | | 2,025 | | | 1,345 | |
| $ | 1,802 | | | $ | 5,497 | | | $ | 5,400 | | | $ | 13,105 | |
PEGASYSTEMS INC.
NOTES TO UNAUDITED CONDENSED CONSOLIDATED FINANCIAL STATEMENTS (continued)
The effective interest rate for the Notes: | | | | | | | | | | | |
| Nine Months Ended
September 30, |
| 2021 | | 2020 |
| Weighted-average effective interest rate | 1.2 | % | | 4.3 | % |
Future payments of principal and contractual interest: | | | | | | | | | | | | | | | | | |
| September 30, 2021 |
| (in thousands) | Principal | | Interest | | Total |
| Remainder of 2021 | $ | — | | | $ | — | | | $ | — | |
| 2022 | — | | | 4,500 | | | 4,500 | |
| 2023 | — | | | 4,500 | | | 4,500 | |
| 2024 | — | | | 4,500 | | | 4,500 | |
| 2025 | 600,000 | | | 1,488 | | | 601,488 | |
| $ | 600,000 | | | $ | 14,988 | | | $ | 614,988 | |
Capped call transactions
In February 2020, the Company entered into privately negotiated capped call transactions (the “Capped Call Transactions”) with certain financial institutions. The Capped Call Transactions cover 4.4 million shares (representing the number of shares for which the Notes are initially convertible) of the Company’s common stock. The Capped Call Transactions are expected to reduce common stock dilution and/or offset any potential cash payments the Company must make, other than for principal and interest, upon conversion of the Notes, with such reduction and/or offset subject to a cap of $196.44. The cap price of the Capped Call Transactions is subject to adjustment upon the occurrence of specified extraordinary events affecting the Company, including mergers and tender offers.
The Capped Call Transactions are accounted for as derivative instruments and do not qualify for the Company’s own equity scope exception in ASC 815 since, in some cases of early settlement, the settlement value of the Capped Call Transactions, calculated following the governing documents, may not represent a fair value measurement. The Capped Call Transactions are classified as other long-term assets and remeasured to fair value at the end of each reporting period, resulting in a non-operating gain or loss.
Change in capped call transactions: | | | | | | | | | | | |
| Nine Months Ended
September 30, |
| (in thousands) | 2021 | | 2020 |
| January 1, | $ | 83,597 | | | $ | — | |
| Issuance | — | | | 51,900 | |
| Fair value adjustment | (7,543) | | | 19,816 | |
| September 30, | $ | 76,054 | | | $ | 71,716 | |
Credit facility
In November 2019, and as amended as of February 2020, July 2020, and September 2020, the Company entered into a five-year $100 million senior secured revolving credit agreement (the “Credit Facility”) with PNC Bank, National Association. The Company may use borrowings to finance working capital needs and for general corporate purposes. Subject to specific conditions, the Credit Facility allows the Company to increase the aggregate commitment to $200 million. The commitments expire on November 4, 2024, and any outstanding
forward contractsloans will be payable on such date. The Credit Facility, as amended, contains customary covenants, including, but not limited to, those relating to additional indebtedness, liens, asset divestitures, and
foreign currency transactions was as follows: | | | | | | | | | | | | | | | | |
| | | Three Months Ended
September 30, | | | Nine Months Ended
September 30, | |
| (in thousands) | | 2017 | | | 2016 | | | 2017 | | | 2016 | |
Gain (loss) from the change in the fair value of forward contracts included in other income (expense), net | | $ | — | | | $ | (1,237 | ) | | $ | 286 | | | $ | (4,955 | ) |
Foreign currency transaction (loss) gain from the remeasurement of foreign currency assets and liabilities | | | (552 | ) | | | 1,082 | | | | (793 | ) | | | 2,764 | |
| | | | | | | | | | | | | | | | |
| | $ | (552 | ) | | $ | (155 | ) | | $ | (507 | ) | | $ | (2,191 | ) |
| | | | | | | | | | | | | | | | |
5.affiliate transactions.
The Company is also required to comply with financial covenants, including:
•Beginning with the fiscal quarter ended September 30, 2020 and ending with the fiscal quarter ended December 31, 2021, at least $200 million in cash and investments held by Pegasystems Inc.
•Beginning with the quarter ended March 31, 2022, a maximum net consolidated leverage ratio of 3.5 to 1.0 (with a step-up in the event of certain acquisitions) and a minimum consolidated interest coverage ratio of 3.5 to 1.0.
As of September 30, 2021 and December 31, 2020, the Company had no outstanding borrowings under the Credit Facility.
PEGASYSTEMS INC.
NOTES TO UNAUDITED CONDENSED CONSOLIDATED FINANCIAL STATEMENTS (continued)
NOTE 9. FAIR VALUE MEASUREMENTS
Assets and
Liabilities Measuredliabilities measured at
Fair Valuefair value on a
Recurring Basisrecurring basis
The Company records its money market funds,cash equivalents, marketable securities, Capped Call Transactions, and forward contractsventure investments at fair value on a recurring basis. Fair value is an exit price, representing the amount that would be received from the sale of an asset or paid to transfer a liability in an orderly transaction between market participants based on assumptions that market participants would use in pricing an asset or liability.
As a basis for classifying the fair value measurements, a three-tier fair value hierarchy, which classifies the fair value measurements based on the inputs used in measuring fair value, was established as follows: (Level 1)
•Level 1 - observable inputs such as quoted prices in active markets for identical assets or liabilities; (Level 2)
•Level 2 - significant other inputs that are observable either directly or indirectly; and (Level 3)
•Level 3 - significant unobservable inputs on which there is little or no market data, which require the Company to develop its own assumptions. This hierarchy requires the Company to use observable market data, when available, and to minimize the use of unobservable inputs when determining fair value. The
Company’s money market funds are classified within Level 1fair value of the
fair value hierarchy. The Company’s marketable securities classified within Level 2 of the fair value hierarchy are valued based on a market approach using quoted prices, when available, or matrix pricing compiled by third party pricing vendors, using observable market inputs such as interest rates, yield curves, and credit risk. The Company’s foreign currency forward contracts, which were all classified within Level 2 of the fair value hierarchy, are valued based on the notional amounts and rates under the contracts and observable market inputs such as currency exchange rates and credit risk. If applicable, the Company will recognize transfers into and out of levels within the fair value hierarchyCapped Call Transactions at the end of
theeach reporting period
in whichis determined using a Black-Scholes option-pricing model. The valuation models use various market-based inputs, including stock price, remaining contractual term, expected volatility, risk-free interest rate, and expected dividend yield. The Company applies judgment when determining expected volatility. The Company considers both historical and implied volatility levels of the
actual event or change in circumstance occurs. There were no transfers between Level 1 and Level 2 during the nine months ended September 30, 2017.PEGASYSTEMS INC.
NOTES TO UNAUDITED CONDENSED CONSOLIDATED FINANCIAL STATEMENTS (continued)
underlying equity security. The Company’s assetsventure investments are recorded at fair value based on valuation methods, including observable public companies and transaction prices and unobservable inputs, including the volatility, rights, and obligations of the securities the Company holds.
Assets and liabilities measured at fair value on a recurring basis consistedbasis: | | | | | | | | | | | | | | | | | | | | | | | | | | | | | | | | | | | | | | | | | | | | | | | |
| September 30, 2021 | | December 31, 2020 |
| (in thousands) | Level 1 | | Level 2 | | Level 3 | | Total | | Level 1 | | Level 2 | | Level 3 | | Total |
| Cash equivalents | $ | 11,087 | | | $ | — | | | $ | — | | | $ | 11,087 | | | $ | 42,339 | | | $ | 14,000 | | | $ | — | | | $ | 56,339 | |
| Marketable securities | $ | — | | | $ | 235,437 | | | $ | — | | | $ | 235,437 | | | $ | — | | | $ | 293,269 | | | $ | — | | | $ | 293,269 | |
Capped Call Transactions (1) | $ | — | | | $ | 76,054 | | | $ | — | | | $ | 76,054 | | | $ | — | | | $ | 83,597 | | | $ | — | | | $ | 83,597 | |
Venture investments (1) (2) | $ | — | | | $ | — | | | $ | 9,713 | | | $ | 9,713 | | | $ | — | | | $ | — | | | $ | 8,345 | | | $ | 8,345 | |
(1) Included in other long-term assets. (2) Investments in privately-held companies.
Changes in venture investments: | | | | | | | | | | | |
| Nine Months Ended
September 30, |
| (in thousands) | 2021 | | 2020 |
| January 1, | $ | 8,345 | | | $ | 4,871 | |
| New investments | 500 | | | 3,006 | |
| Sales of investments | (400) | | | (1,424) | |
| Changes in foreign exchange rates | (52) | | | — | |
| Changes in fair value: | | | |
| included in other income | 100 | | | 1,374 | |
| included in other comprehensive income | 1,220 | | | 100 | |
| September 30, | $ | 9,713 | | | $ | 7,927 | |
The carrying value of
the following: | | | | | | | | | | | | | | | | | | | | |
| | | Fair Value Measurements at Reporting Date Using | | | | | | | | | Total | |
| (in thousands) | | Level 1 | | | Level 2 | | | | |
September 30, 2017 | | | | | | | | | | | | | | | | | | | | |
Fair Value Assets: | | | | | | | | | | | | | | | | | | | | |
Money market funds | | $ | 655 | | | $ | — | | | | | | | | | | | $ | 655 | |
Marketable securities: | | | | | | | | | | | | | | | | | | | | |
Municipal bonds | | $ | — | | | $ | 32,759 | | | | | | | | | | | | 32,759 | |
Corporate bonds | | | — | | | | 31,053 | | | | | | | | | | | | 31,053 | |
| | | | | | | | | | | | | | | | | | | | |
| | $ | — | | | $ | 63,812 | | | | | | | | | | | $ | 63,812 | |
December 31, 2016 | | | | | | | | | | | | | | | | | | | | |
Fair Value Assets: | | | | | | | | | | | | | | | | | | | | |
Money market funds | | $ | 458 | | | $ | — | | | | | | | | | | | $ | 458 | |
Marketable securities: | | | | | | | | | | | | | | | | | | | | |
Municipal bonds | | $ | — | | | $ | 36,607 | | | | | | | | | | | $ | 36,607 | |
Corporate bonds | | | — | | | | 26,560 | | | | | | | | | | | | 26,560 | |
| | | | | | | | | | | | | | | | | | | | |
| | $ | — | | | $ | 63,167 | | | | | | | | | | | $ | 63,167 | |
Foreign currency forward contracts | | | — | | | | 628 | | | | | | | | | | | | 628 | |
Fair Value Liabilities: | | | | | | | | | | | | | | | | | | | | |
Foreign currency forward contracts | | $ | — | | | $ | 883 | | | | | | | | | | | $ | 883 | |
For certain other financial instruments, including accounts receivablereceivables and accounts payable, the carrying value approximates their fair value due to these items’ short maturity.
Fair value of the
relatively short maturity of these items.Assets Measured at Fair Value on a Nonrecurring Basis
Assets recorded atNotes
The Notes’ fair value
on a nonrecurring basis, such(inclusive of the conversion feature embedded in the Notes) was $676.2 million as
propertyof September 30, 2021 and
equipment and intangible assets, are recognized at$706.5 million as of December 31, 2020. The fair value
when they are impaired. Duringwas determined based on the
nine months ended September 30, 2017Notes’ quoted price in an over-the-counter market on the last trading day of the reporting period and
2016,classified within Level 2 in the
Company did not recognize any impairments of its assets recorded at fair value
on a nonrecurring basis.6. TRADE ACCOUNTS RECEIVABLE, NET OF ALLOWANCE
| | | | | | | | |
| (in thousands) | | September 30,
2017 | | | December 31,
2016 | |
Trade accounts receivable | | $ | 164,530 | | | $ | 234,473 | |
Unbilled trade accounts receivable | | | 32,820 | | | | 34,681 | |
| | | | | | | | |
Total trade accounts receivable | | | 197,350 | | | | 269,154 | |
Allowance for sales credit memos | | | (6,189 | ) | | | (4,126 | ) |
| | | | | | | | |
| | $ | 191,161 | | | $ | 265,028 | |
| | | | | | | | |
Unbilled trade accounts receivable primarily relate to services earned under time and materials arrangements and to license, maintenance, and cloud arrangements that have commenced or been delivered in excess of scheduled invoicing.
7. GOODWILL AND OTHER INTANGIBLE ASSETS
The changes in the carrying amount of goodwillhierarchy. See "Note 8. Debt" for the nine months ended September 30, 2017 as follows:
| | | | |
| (in thousands) | | | |
Balance as of January 1, | | $ | 73,164 | |
Purchase price adjustments to goodwill | | | (354 | ) |
Currency translation adjustments | | | 131 | |
| | | | |
Balance as of September 30, | | $ | 72,941 | |
| | | | |
additional information.
NOTES TO UNAUDITED CONDENSED CONSOLIDATED FINANCIAL STATEMENTS (continued)
Intangible assets are recorded at cost
NOTE 10. REVENUE
Geographic revenue | | | | | | | | | | | | | | | | | | | | | | | | | | | | | | | | | | | |
| Three Months Ended
September 30, | | Nine Months Ended
September 30, |
| (Dollars in thousands) | 2021 | | 2020 | | 2021 | | 2020 |
| U.S. | $ | 132,016 | | 52 | % | | $ | 120,971 | | 53 | % | | $ | 515,881 | | 58 | % | | $ | 436,199 | | 61 | % |
| Other Americas | 17,510 | | 7 | % | | 10,737 | | 5 | % | | 43,469 | | 5 | % | | 35,009 | | 5 | % |
| United Kingdom (“U.K.”) | 25,982 | | 10 | % | | 25,150 | | 11 | % | | 86,747 | | 10 | % | | 68,246 | | 9 | % |
| Europe (excluding U.K.), Middle East, and Africa | 46,306 | | 18 | % | | 39,656 | | 18 | % | | 143,763 | | 15 | % | | 106,472 | | 15 | % |
| Asia-Pacific | 34,454 | | 13 | % | | 29,437 | | 13 | % | | 105,609 | | 12 | % | | 72,991 | | 10 | % |
| $ | 256,268 | | 100 | % | | $ | 225,951 | | 100 | % | | $ | 895,469 | | 100 | % | | $ | 718,917 | | 100 | % |
Revenue streams | | | | | | | | | | | | | | | | | | | | | | | |
| Three Months Ended
September 30, | | Nine Months Ended
September 30, |
| (in thousands) | 2021 | | 2020 | | 2021 | | 2020 |
| Pega Cloud | $ | 78,369 | | | $ | 54,776 | | | $ | 219,520 | | | $ | 147,080 | |
| Maintenance | 83,188 | | | 74,670 | | | 237,531 | | | 220,587 | |
| Consulting | 56,416 | | | 56,721 | | | 166,270 | | | 164,227 | |
| Revenue recognized over time | 217,973 | | | 186,167 | | | 623,321 | | | 531,894 | |
| Perpetual license | 2,874 | | | 3,852 | | | 20,922 | | | 16,568 | |
| Term license | 35,421 | | | 35,932 | | | 251,226 | | | 170,455 | |
| Revenue recognized at a point in time | 38,295 | | | 39,784 | | | 272,148 | | | 187,023 | |
| $ | 256,268 | | | $ | 225,951 | | | $ | 895,469 | | | $ | 718,917 | |
| | | | | | | | | | | | | | | | | | | | | | | |
| (in thousands) | Three Months Ended
September 30, | | Nine Months Ended
September 30, |
| 2021 | | 2020 | | 2021 | | 2020 |
| Pega Cloud | $ | 78,369 | | | $ | 54,776 | | | $ | 219,520 | | | $ | 147,080 | |
| Client Cloud | 118,609 | | | 110,602 | | | 488,757 | | | 391,042 | |
| Maintenance | 83,188 | | 74,670 | | 237,531 | | 220,587 |
| Term license | 35,421 | | 35,932 | | 251,226 | | 170,455 |
Cloud subscription (1) | 196,978 | | | 165,378 | | | 708,277 | | | 538,122 | |
| Perpetual license | 2,874 | | | 3,852 | | | 20,922 | | | 16,568 | |
| Consulting | 56,416 | | | 56,721 | | | 166,270 | | | 164,227 | |
| $ | 256,268 | | | $ | 225,951 | | | $ | 895,469 | | | $ | 718,917 | |
(1) Reflects client arrangements subject to renewal (Pega Cloud, maintenance, and
are amortized using the straight-line method over their estimated useful lives as follows: | | | | | | | | | | | | | | | | |
| (in thousands) | | Range of
Remaining
Useful Lives | | | Cost | | | Accumulated
Amortization | | | Net Book
Value | |
September 30, 2017 | | | | | | | | | | | | | | | | |
Customer related intangibles | | | 4-10 years | | | $ | 63,158 | | | $ | (43,205 | ) | | $ | 19,953 | |
Technology | | | 7-10 years | | | | 58,942 | | | | (44,140 | ) | | | 14,802 | |
Other intangibles | | | — | | | | 5,361 | | | | (5,361 | ) | | | — | |
| | | | | | | | | | | | | | | | |
| | | | | | $ | 127,461 | | | $ | (92,706 | ) | | $ | 34,755 | |
| | | | | | | | | | | | | | | | |
December 31, 2016 | | | | | | | | | | | | | | | | |
Customer related intangibles | | | 4-10 years | | | $ | 63,091 | | | $ | (37,573 | ) | | $ | 25,518 | |
Technology | | | 3-10 years | | | | 58,942 | | | | (40,269 | ) | | | 18,673 | |
Other intangibles | | | — | | | | 5,361 | | | | (5,361 | ) | | | — | |
| | | | | | | | | | | | | | | | |
| | | | | | $ | 127,394 | | | $ | (83,203 | ) | | $ | 44,191 | |
| | | | | | | | | | | | | | | | |
Amortization expense of intangibles assets is reflected in the Company’s unaudited condensed consolidated statements of operations as follows:
| | | | | | | | | | | | | | | | |
| | | Three Months Ended
September 30, | | | Nine Months Ended
September 30, | |
| (in thousands) | | 2017 | | | 2016 | | | 2017 | | | 2016 | |
Cost of revenue | | $ | 1,232 | | | $ | 1,642 | | | $ | 3,871 | | | $ | 4,626 | |
Selling and marketing | | | 1,873 | | | | 1,867 | | | | 5,608 | | | | 5,274 | |
General and administrative | | | — | | | | 90 | | | | — | | | | 268 | |
| | | | | | | | | | | | | | | | |
| | $ | 3,105 | | | $ | 3,599 | | | $ | 9,479 | | | $ | 10,168 | |
| | | | | | | | | | | | | | | | |
Future estimated amortization expense related to intangible assets asterm license).
Remaining performance obligations ("Backlog")
Expected future revenue from existing non-cancellable contracts:
As of September 30, 2017 is as follows: | | | | |
| (in thousands) | | | |
Remainder of 2017 | | $ | 2,846 | |
2018 | | | 11,347 | |
2019 | | | 5,555 | |
2020 | | | 2,659 | |
2021 | | | 2,637 | |
2022 and thereafter | | | 9,711 | |
| | | | |
| | $ | 34,755 | |
| | | | |
8. ACCRUED EXPENSES
| | | | | | | | |
| (in thousands) | | September 30,
2017 | | | December 31,
2016 | |
Outside professional services | | $ | 13,447 | | | $ | 10,204 | |
Income and other taxes | | | 5,947 | | | | 10,422 | |
Marketing and sales program expenses | | | 4,679 | | | | 3,707 | |
Dividends payable | | | 2,336 | | | | 2,298 | |
Employee related expenses | | | 4,715 | | | | 3,806 | |
Other | | | 8,557 | | | | 6,314 | |
| | | | | | | | |
| | $ | 39,681 | | | $ | 36,751 | |
| | | | | | | | |
2021:
| | | | | | | | | | | | | | | | | | | | | | | | | | | | | | | | | | | | | | |
| Pega Cloud | | Client Cloud | | | | Consulting | | Total |
| (Dollars in thousands) | | Maintenance | | Term license | | Perpetual license | | |
| 1 year or less | $ | 284,359 | | | $ | 196,667 | | | $ | 49,265 | | | $ | 15,686 | | | $ | 31,673 | | | $ | 577,650 | | 56 | % |
| 1-2 years | 177,214 | | | 59,360 | | | 16,872 | | | 1,064 | | | 6,561 | | | 261,071 | | 25 | % |
| 2-3 years | 79,775 | | | 37,734 | | | 420 | | | 4,094 | | | 5,165 | | | 127,188 | | 12 | % |
| Greater than 3 years | 30,113 | | | 33,935 | | | 245 | | | 2,127 | | | 1,697 | | | 68,117 | | 7 | % |
| $ | 571,461 | | | $ | 327,696 | | | $ | 66,802 | | | $ | 22,971 | | | $ | 45,096 | | | $ | 1,034,026 | | 100 | % |
NOTES TO UNAUDITED CONDENSED CONSOLIDATED FINANCIAL STATEMENTS (continued)
9. DEFERRED REVENUE
| | | | | | | | |
| (in thousands) | | September 30,
2017 | | | December 31,
2016 | |
Term license | | $ | 5,636 | | | $ | 15,843 | |
Perpetual license | | | 20,844 | | | | 23,189 | |
Maintenance | | | 105,588 | | | | 112,397 | |
Cloud | | | 18,805 | | | | 13,604 | |
Professional Services | | | 10,058 | | | | 10,614 | |
| | | | | | | | |
Current deferred revenue | | | 160,931 | | | | 175,647 | |
Perpetual license | | | 4,085 | | | | 7,909 | |
Maintenance | | | 828 | | | | 1,802 | |
Cloud | | | 1,217 | | | | 1,278 | |
| | | | | | | | |
Long-term deferred revenue | | | 6,130 | | | | 10,989 | |
| | | | | | | | |
| | $ | 167,061 | | | $ | 186,636 | |
| | | | | | | | |
10. STOCK-BASED COMPENSATION
Stock-based compensation expense is reflected in the Company’s unaudited condensed consolidated statements of operations as follows:
| | | | | | | | | | | | | | | | |
| | | Three Months Ended
September 30, | | | Nine Months Ended
September 30, | |
| (in thousands) | | 2017 | | | 2016 | | | 2017 | | | 2016 | |
Cost of revenues | | $ | 3,613 | | | $ | 3,117 | | | $ | 10,913 | | | $ | 8,711 | |
Selling and marketing | | | 3,976 | | | | 3,468 | | | | 11,482 | | | | 9,395 | |
Research and development | | | 3,420 | | | | 2,260 | | | | 10,306 | | | | 7,480 | |
General and administrative | | | 2,480 | | | | 1,983 | | | | 7,228 | | | | 4,706 | |
Acquisition-related | | | — | | | | (10 | ) | | | — | | | | 342 | |
| | | | | | | | | | | | | | | | |
Total stock-based compensation before tax | | $ | 13,489 | | | $ | 10,818 | | | $ | 39,929 | | | $ | 30,634 | |
| | | | | | | | | | | | | | | | |
Income tax benefit | | $ | (4,129 | ) | | $ | (3,227 | ) | | $ | (12,231 | ) | | $ | (8,917 | ) |
During the nine months ended September 30, 2017, the Company issued approximately 1,299,000 shares of common stock to its employees and 18,000 shares of common stock to itsnon-employee directors under the Company’s stock-based compensation plans.
During the nine months ended September 30, 2017, the Company granted approximately 1,052,000 restricted stock units (“RSUs”) and 1,520,000non-qualified stock options to its employees with total fair values of approximately $47.5 million and $20.6 million, respectively. This includes approximately 175,000 RSUs which were granted in connection with the election by employees to receive 50% of their 2017 target incentive compensation under the Company’s Corporate Incentive Compensation Plan in the form of RSUs instead of cash. Stock-based compensation of approximately $7.7 million associated with this RSU grant will be recognized over aone-year period beginning on the grant date.
The Company recognizes stock based compensation on the accelerated recognition method, treating each vesting tranche as if it were an individual grant.
As of September 30, 2017,2020:
| | | | | | | | | | | | | | | | | | | | | | | | | | | | | | | | | | | | | | |
| Pega Cloud | | Client Cloud | | | | Consulting | | Total |
| (Dollars in thousands) | | Maintenance | | Term license | | Perpetual license | | |
| 1 year or less | $ | 211,661 | | | $ | 170,643 | | | $ | 50,788 | | | $ | 8,708 | | | $ | 14,977 | | | $ | 456,777 | | 54 | % |
| 1-2 years | 157,500 | | | 40,631 | | | 5,341 | | | 1,700 | | | 2,042 | | | 207,214 | | 25 | % |
| 2-3 years | 93,283 | | | 18,277 | | | 7,052 | | | — | | | 770 | | | 119,382 | | 14 | % |
| Greater than 3 years | 44,363 | | | 9,597 | | | 4 | | | — | | | 653 | | | 54,617 | | 7 | % |
| $ | 506,807 | | | $ | 239,148 | | | $ | 63,185 | | | $ | 10,408 | | | $ | 18,442 | | | $ | 837,990 | | 100 | % |
NOTE 11. STOCK-BASED COMPENSATION
Expense | | | | | | | | | | | | | | | | | | | | | | | |
| Three Months Ended
September 30, | | Nine Months Ended
September 30, |
| (in thousands) | 2021 | | 2020 | | 2021 | | 2020 |
| Cost of revenue | $ | 5,114 | | | $ | 5,100 | | | $ | 16,889 | | | $ | 15,636 | |
| Selling and marketing | 13,376 | | | 12,658 | | | 41,844 | | | 33,968 | |
| Research and development | 6,231 | | | 5,765 | | | 19,343 | | | 17,066 | |
| General and administrative | 3,974 | | | 4,402 | | | 11,407 | | | 10,085 | |
| $ | 28,695 | | | $ | 27,925 | | | $ | 89,483 | | | $ | 76,755 | |
| Income tax benefit | $ | (5,845) | | | $ | (5,604) | | | $ | (18,028) | | | $ | (15,293) | |
As of September 30, 2021, the Company had
approximately $56.8$131.7 million of unrecognized stock-based compensation expense, net of estimated forfeitures,
related to all unvested RSUs and unvested stock options thatwhich is expected to be recognized over a weighted-average period of 2.1 years.
11. EARNINGS
Grants | | | | | | | | | | | |
| Nine Months Ended
September 30, 2021 |
| (in thousands) | Shares | | Total Fair Value |
| Restricted stock units | 819 | | | $ | 106,286 | |
| Non-qualified stock options | 1,472 | | | $ | 55,643 | |
| Common stock | 5 | | | $ | 601 | |
NOTE 12. INCOME TAXES
Effective income tax rate
| | | | | | | | | | | | | | | | | | | | | | | |
| Three Months Ended
September 30, | | Nine Months Ended
September 30, |
| (Dollars in thousands) | 2021 | | 2020 | | 2021 | | 2020 |
| (Benefit from) income taxes | $ | (24,826) | | | $ | (25,053) | | | $ | (54,360) | | | $ | (61,182) | |
| Effective income tax benefit rate | 0 | | 0 | | 68 | % | | 48 | % |
The change in the effective income tax benefit rate was primarily due to the impact of discrete tax items on a proportionately larger (loss) before income taxes in the nine months ended September 30, 2020. The most significant discrete items were excess tax benefits from stock-based compensation and the impact of changes in statutory tax rates applicable to our U.K.-based deferred tax assets.As of September 30, 2021 and December 31, 2020, the Company’s deferred tax assets were $157.9 million and $88.1 million, respectively.
NOTE 13. (LOSS) PER SHARE
Basic
earnings(loss) per share is
computedcalculated using the weighted-average number of common shares outstanding during the
applicable period. Diluted
earnings(loss) per share is
computedcalculated using the weighted-average number of common shares outstanding during the
applicable period, plus the dilutive effect of outstanding
options and RSUs, using the treasury stock method. Certain shares related to some of the Company’s outstanding stock options,
RSUs, and
RSUs were excluded from the computation of diluted earnings per share because they were anti-dilutive in the periods presented, but could be dilutive in the future.convertible senior notes.
NOTES TO UNAUDITED CONDENSED CONSOLIDATED FINANCIAL STATEMENTS (continued)
Calculation of (loss) per share: | | | | | | | | | | | | | | | | | | | | | | | |
| Three Months Ended
September 30, | | Nine Months Ended
September 30, |
| (in thousands, except per share amounts) | 2021 | | 2020 | | 2021 | | 2020 |
| Net (loss) | $ | (56,468) | | | $ | (19,267) | | | $ | (25,794) | | | $ | (65,379) | |
| Weighted-average common shares outstanding | 81,526 | | | 80,537 | | | 81,284 | | | 80,191 | |
| (Loss) per share, basic | $ | (0.69) | | | $ | (0.24) | | | $ | (0.32) | | | $ | (0.82) | |
| | | | | | | |
| Net (loss) | $ | (56,468) | | | $ | (19,267) | | | $ | (25,794) | | | $ | (65,379) | |
| | | | | | | |
| | | | | | | |
| | | | | | | |
| | | | | | | |
| | | | | | | |
| | | | | | | |
| | | | | | | |
Weighted-average common shares outstanding, assuming dilution (1) (2) (3) | 81,526 | | | 80,537 | | | 81,284 | | | 80,191 | |
| (Loss) per share, diluted | $ | (0.69) | | | $ | (0.24) | | | $ | (0.32) | | | $ | (0.82) | |
| | | | | | | |
Outstanding anti-dilutive stock options and RSUs (4) | 5,815 | | | 6,622 | | | 6,136 | | | 6,166 | |
(1) The
calculation ofshares underlying the conversion options in the Company’s
basic and diluted earnings per share is as follows: | | | | | | | | | | | | | | | | |
| | | Three Months Ended
September 30, | | | Nine Months Ended
September 30, | |
| (in thousands, except per share amounts) | | 2017 | | | 2016 | | | 2017 | | | 2016 | |
Basic | | | | | | | | | | | | | | | | |
Net (loss)/income | | $ | (1,812 | ) | | $ | 3,301 | | | $ | 36,615 | | | $ | 18,237 | |
| | | | | | | | | | | | | | | | |
Weighted-average common shares outstanding | | | 77,691 | | | | 76,278 | | | | 77,258 | | | | 76,323 | |
| | | | | | | | | | | | | | | | |
(Loss)/earnings per share, basic | | $ | (0.03 | ) | | $ | 0.04 | | | $ | 0.47 | | | $ | 0.24 | |
| | | | | | | | | | | | | | | | |
Diluted | | | | | | | | | | | | | | | | |
Net (loss)/income | | $ | (1,812 | ) | | $ | 3,301 | | | $ | 36,615 | | | $ | 18,237 | |
| | | | | | | | | | | | | | | | |
Weighted-average effect of dilutive securities: | | | | | | | | | | | | | | | | |
Stock options | | | — | | | | 1,933 | | | | 3,519 | | | | 1,851 | |
RSUs | | | — | | | | 1,337 | | | | 1,940 | | | | 1,227 | |
| | | | | | | | | | | | | | | | |
Effect of assumed exercise of stock options and RSUs | | | — | | | | 3,270 | | | | 5,459 | | | | 3,078 | |
| | | | | | | | | | | | | | | | |
Weighted-average common shares outstanding, assuming dilution | | | 77,691 | | | | 79,548 | | | | 82,717 | | | | 79,401 | |
| | | | | | | | | | | | | | | | |
(Loss)/earnings per share, diluted | | $ | (0.03 | ) | | $ | 0.04 | | | $ | 0.44 | | | $ | 0.23 | |
| | | | | | | | | | | | | | | | |
Outstanding stock options and RSUs excluded as impact would be anti-dilutive | | | 7,232 | | | | 296 | | | | 219 | | | | 368 | |
Notes are included using the if-converted method, if dilutive in the period. If the outstanding conversion options were fully exercised, the Company would issue an additional 4.4 million shares.
(2) In periods of loss, all
equity awardsdilutive securities are excluded as
thetheir inclusion
of any equity awards would be anti-dilutive.
12. GEOGRAPHIC INFORMATION AND MAJOR CLIENTS
Geographic Information
Operating segments are defined as components of an enterprise, about which separate financial information is available that is evaluated regularly by the chief operating decision maker (“CODM”) in deciding how to allocate resources and in assessing performance.
The Company develops and licenses software applications for customer engagement and its Pega® Platform, and provides consulting services, maintenance, and training related to its offerings. The Company derives substantially all of its revenue from the sale and support of one group of similar products and services—software that provides case management, business process management, and real-time decisioning solutions to improve customer engagement and operational excellence in the enterprise applications market. To assess performance, the Company’s CODM, who is the chief executive officer, reviews financial information on a consolidated basis. Therefore, the Company determined it has one reportable segment—Customer Engagement Solutions and one reporting unit.
(3) The Company’s
international revenue, based upon the clients’ location, is as follows: | | | | | | | | | | | | | | | | | | | | | | | | | | | | | | | | |
| | | Three Months Ended
September 30, | | | Nine Months Ended
September 30, | |
| (Dollars in thousands) | | 2017 | | | 2016 | | | 2017 | | | 2016 | |
U.S. | | $ | 95,087 | | | | 53 | % | | $ | 111,274 | | | | 61 | % | | $ | 351,330 | | | | 59 | % | | $ | 308,049 | | | | 56 | % |
Other Americas | | | 8,722 | | | | 5 | % | | | 7,952 | | | | 4 | % | | | 30,243 | | | | 5 | % | | | 49,494 | | | | 9 | % |
U.K. | | | 18,485 | | | | 10 | % | | | 21,490 | | | | 12 | % | | | 68,003 | | | | 11 | % | | | 77,181 | | | | 14 | % |
Other EMEA(1) | | | 28,100 | | | | 16 | % | | | 23,656 | | | | 13 | % | | | 76,958 | | | | 13 | % | | | 67,314 | | | | 12 | % |
Asia Pacific | | | 29,421 | | | | 16 | % | | | 18,430 | | | | 10 | % | | | 74,508 | | | | 12 | % | | | 48,618 | | | | 9 | % |
| | | | | | | | | | | | | | | | | | | | | | | | | | | | | | | | |
| | $ | 179,815 | | | | 100 | % | | $ | 182,802 | | | | 100 | % | | $ | 601,042 | | | | 100 | % | | $ | 550,656 | | | | 100 | % |
| | | | | | | | | | | | | | | | | | | | | | | | | | | | | | | | |
(1) | Includes Europe, the Middle East and Africa, but excludes the United Kingdom. |
PEGASYSTEMS INC.
NOTES TO UNAUDITED CONDENSED CONSOLIDATED FINANCIAL STATEMENTS (continued)
Major Clients
Clients accounting for 10% or moreCapped Call Transactions convert to 4.4 million shares of the Company’s total revenue were as follows:
| | | | | | | | | | | | | | | | |
| | | Three Months Ended
September 30, | | | Nine Months Ended
September 30, | |
| (in thousands) | | 2017 | | | 2016 | | | 2017 | | | 2016 | |
Total revenue | | $ | 179,815 | | | $ | 182,802 | | | $ | 601,042 | | | $ | 550,656 | |
Client A | | | 10.6 | % | | | * | | | | * | | | | * | |
* | Client accounted for less than 10% of total revenue. |
Clients accountingcommon stock (representing the number of shares for 10% which the Notes are initially convertible). The Capped Call Transactions are expected to reduce common stock dilution and/or moreoffset any potential cash payments the Company must make, other than for principal and interest, upon conversion of the Company’s total trade accounts receivableNotes, with such reduction and/or offset subject to a cap of $196.44. The Capped Call Transactions are excluded from weighted-average common shares outstanding, assuming dilution, in all periods as their effect would be anti-dilutive.
(4) Outstanding stock options and RSUs that were
as follows: | | | | | | | | |
| (in thousands) | | September 30,
2017 | | | December 31,
2016 | |
Total trade accounts receivable | | | 197,350 | | | | 269,154 | |
Client A | | | 12.4 | % | | | * | |
* | Client accounted for less than 10% of total trade account receivable |
anti-dilutive under the treasury stock method in the period were excluded from the computation of diluted (loss) per share. These awards may be dilutive in the future.
ITEM 2. | MANAGEMENT’S DISCUSSION AND ANALYSIS OF FINANCIAL CONDITION AND RESULTS OF OPERATIONS |
Forward-Looking Statements
ITEM 2. MANAGEMENT’S DISCUSSION AND ANALYSIS OF FINANCIAL CONDITION AND RESULTS OF OPERATIONS
FORWARD-LOOKING STATEMENTS
This Quarterly Report on Form10-Q (“Quarterly Report”) contains or incorporates forward-looking statements within the meaning of the Private Securities Litigation Reform Act of 1995. These
Words such as expects, anticipates, intends, plans, believes, will, could, should, estimates, may, targets, strategies, projects, forecasts, guidance, likely, and usually, or variations of such words and other similar expressions identify forward-looking statements, include,which are based on current expectations and assumptions.
Forward-looking statements deal with future events and are subject to risks and uncertainties that are difficult to predict, including, but are not limited to, statements about to:
•our future financial performance and business plans, plans;
•the adequacy of our liquidity and capital resources, resources;
•the continued payment of our quarterly dividends by the Company, and dividends;
•the timing of revenue recognition under license and cloud arrangements and are described more completely in Part Irecognition;
•management of our Annual Report on Form10-K for the year ended December 31, 2016.These forward-looking statements are based on current expectations, estimates, forecasts, and projections about the industry and markets in which we operate, and management’s beliefs and assumptions. In addition, other written or oral statements that constitute forward-looking statements may be made by us or on our behalf. Words such as “expect,” “anticipate,” “intend,” “plan,” “believe,” “could,” “estimate,” “may,” “target,” “strategy,” “is intendedtransition to” “project,” “guidance,” “likely,” “usually,” or variations of such words and similar expressions are intended to identify such forward-looking statements.
These statements are not guarantees of future performance and involve certain risks, uncertainties, and assumptions that are difficult to predict. Important factors that could cause actual future activities and results to differ materially from those expressed in such forward-looking statements include, among others, a more subscription-based business model;
•variation in demand for our products and services, andincluding among clients in the difficulty in predicting public sector;
•the completionimpact of product acceptance and other factors affectingactual or threatened public health emergencies, such as the timing of license revenue recognition; Coronavirus (“COVID-19”);
•reliance on third party relationships; third-party service providers;
•compliance with our debt obligations and covenants;
•the potential lossimpact of vendor specific objective evidence for our consulting services; convertible senior notes and Capped Call Transactions;
•reliance on key personnel;
•the inherent risks associated with international operations and relocation of our corporate headquarters;
•the continued uncertainties in international economies; the Company’s continued effort to market and sell both domestically and internationally; global economy;
•foreign currency exchange rates; the financial impact of any future acquisitions;
•the potential legal and financial liabilities and reputation damage due to cyber-attackscyber-attacks;
•security breaches and security breaches;flaws;
•our ability to protect our intellectual property rights and costs associated with defending such rights;
•our client retention rate; and
•management of the Company’sour growth.
These risks and
other factorsothers that
couldmay cause actual results to differ materially from those expressed in such forward-looking statements are described
more completelyfurther in Part I of
the Company’sour Annual Report on Form
10-K for the year ended December 31,
2016 as well as2020, and other filings we make with the
U.S. Securities and Exchange Commission
We have no (“SEC”). Except as required by applicable law, we do not undertake and expressly disclaim any obligation to publicly update or revise anythese forward-looking statements publicly, whether as a result offrom new information, future events, or risks. New information, future events or risks may cause theotherwise.
The forward-looking
events we discussstatements contained in this
report not to occur or to materially change.Business overview
Quarterly Report represent our views as of October 27, 2021.
BUSINESS OVERVIEW
We develop, market, license, host, and support enterprise software applications that help organizations simplify business complexity. Our intelligent technology and scalable architecture enable the world’s leading brands and government agencies to solve problems quickly and transform for marketing, sales,tomorrow. Our clients are able to make better decisions and get work done using real-time artificial intelligence (“AI”) and intelligent automation on applications built on the low-code, cloud-native Pega Platform™, enabling our clients to streamline service, increase customer lifetime value, and operations. In addition, we licenseboost efficiency. Our consulting and client success teams, along with our world-class partners, leverage our Pega® Platform for Express™ methodology and low code to allow clients that wish to builddesign and extend their own applications. The Pega Platform assists ourdeploy critical applications quickly and collaboratively.
Our target clients
in building, deploying, and evolving enterprise applications, creating an environment in which business and IT can collaborate to manage back office operations, front office sales, marketing, and/or customer service needs. We also provide consulting services, maintenance, and training for our software. Our software applications and Pega Platform can be deployed on Pega, partner, or customer-managed cloud architectures.Our clients includeare Global 3000 companiesorganizations and government agencies that seekrequire applications to manage complex enterprise systemsdifferentiate themselves in the markets they serve. Our applications achieve and customer service issues with greaterfacilitate differentiation by increasing business agility, driving growth, improving productivity, attracting and cost-effectiveness. Our strategy isretaining customers, and reducing risk. We deliver applications tailored to our clients’ specific industry needs.
Cloud Transition
We are transitioning our business to sell software primarily through subscription arrangements, particularly Pega Cloud. Until we substantially complete our Cloud Transition, which we expect will occur in 2023, we may experience lower revenue growth and lower operating cash flow growth or negative cash flow. Operating performance and the actual mix of revenue and new arrangements in each period can fluctuate based on client preferences for our perpetual and subscription offerings. See the “Risk Factors” section of our Annual Report on Form 10-K for the year ended December 31, 2020 for additional information.
Coronavirus (“COVID-19”)
As of September 30, 2021, COVID-19 has not had a
client a series of licenses, each focusedmaterial impact on
a specific purpose or areaour results of operations
or financial condition. See “Coronavirus (“COVID-19”)” in
support of longer term enterprise-wide digital transformation initiatives.Our license revenue is primarily derived from salesthe “Risk Factors” section of our applicationsAnnual Report on Form 10-K for the year ended December 31, 2020 for additional information.
Performance metrics
We use performance metrics to analyze and assess our Pega Platform. Our cloud revenue is derived fromoverall performance, make operating decisions, and forecast and plan for future periods, including:
Annual contract value (“ACV”) | Increased 22% since September 30, 2020
•ACV represents the licensingannualized value of our hosted Pega Platform and software application environments. Our consulting services revenue is primarily related to new license implementations.Financial and Performance Metrics
Management evaluates our financial performance, based a number of select financial and performance metrics. The performance metrics are periodically reviewed and revised to reflect any changes in our business. Historically, Recurring Revenue and License and Cloud Backlog have been our primary performance metrics. However, due to the change in the revenue recognition patterns of term license arrangements as a result of the expected implementation of the new revenue accounting standard (See Note 2) in the first quarter of 2018, we have started tracking Annual Contract Value (“ACV”), a new performance measure.
Select Financial Metrics
| | | | | | | | | | | | | | | | | | | | | | | | | | | | | | | | |
(Dollars in thousands, except per share amounts) | | Three Months Ended
September 30, | | | | | | Nine Months Ended
September 30, | | | | |
| | 2017 | | | 2016 | | | Change | | | 2017 | | | 2016 | | | Change | |
Total revenue | | $ | 179,815 | | | $ | 182,802 | | | | (2,987 | ) | | | (2 | )% | | $ | 601,042 | | | $ | 550,656 | | | $ | 50,386 | | | | 9 | % |
Operating margin | | | (8 | )% | | | 3 | % | | | | | | | | | | | 3 | % | | | 5 | % | | | | | | | | |
Diluted (loss)/earnings per share | | $ | (0.03 | ) | | $ | 0.04 | | | $ | (0.07 | ) | | | (175 | )% | | $ | 0.44 | | | $ | 0.23 | | | $ | 0.21 | | | | 91 | % |
Cash flow provided by operating activities | | | | | | | | | | | | | | | | | | | 113,926 | | | | 20,556 | | | | 93,370 | | | | 454 | % |
Select Performance Metrics
Annual Contract Value (“ACV”)
The change in ACV measures the growth and predictability of future cash flows from committed term license, cloud, and maintenance arrangementsactive contracts as of the end ofmeasurement date. The contract's total value is divided by its duration in years to calculate ACV for term license and Pega Cloud contracts. Maintenance revenue for the particular reporting period.
quarter then ended is multiplied by four to calculate ACV for maintenance. Client Cloud ACV is the sumcomposed of the following two components:
Termmaintenance ACV and term license ACV. ACV is a performance measure that we believe provides useful information to our management and investors, particularly during our Cloud contract value divided by the number of committed contract yearsTransition.
Quarterly Maintenance
Note: Foreign currency exchange rate changes contributed 1-2% to total ACV growth in 2021.
Remaining performance obligations (“Backlog”) | Increased 23% since September 30, 2020
•Backlog represents expected future revenue reported for the current three months ended period multiplied by 4.
| | | | | | | | | | | | | | | | |
| | | September 30, | | | | |
| (in thousands) | | 2017 | | | 2016 | | | Change | |
Term License and Cloud ACV | | $ | 200,180 | | | $ | 163,408 | | | $ | 36,772 | | | | 23 | % |
Maintenance ACV | | | 248,816 | | | | 220,152 | | | $ | 28,664 | | | | 13 | % |
| | | | | | | | | | | | | | | | |
Term License, Cloud and Maintenance ACV | | $ | 448,996 | | | $ | 383,560 | | | $ | 65,436 | | | | 17 | % |
| | | | | | | | | | | | | | | | |
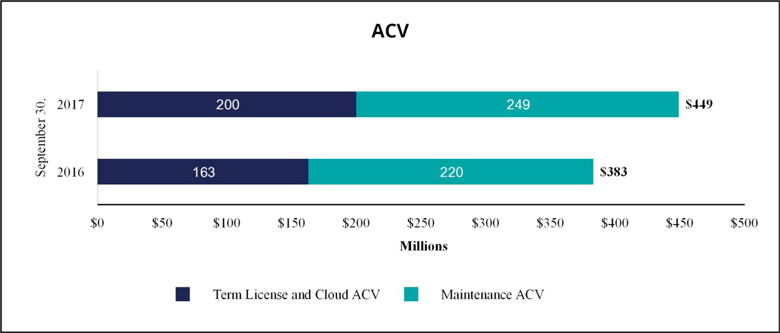
Recurring Revenue
A measure of the predictability and repeatability of our revenue.
| | | | | | | | | | | | | | | | | | | | | | | | | | | | | | | | |
| | | Three Months Ended
September 30, | | | | | | Nine Months Ended
September 30, | | | | |
| (Dollars in thousands) | | 2017 | | | 2016 | | | Change | | | 2017 | | | 2016 | | | Change | |
Recurring revenue | | | | | | | | | | | | | | | | | | | | | | | | | | | | | | | | |
Term license | | $ | 21,678 | | | $ | 28,919 | | | $ | (7,241 | ) | | | (25 | )% | | $ | 106,170 | | | $ | 102,115 | | | $ | 4,055 | | | | 4 | % |
Maintenance | | | 62,204 | | | | 55,038 | | | $ | 7,166 | | | | 13 | % | | | 180,759 | | | | 163,174 | | | $ | 17,585 | | | | 11 | % |
Cloud | | | 13,354 | | | | 10,873 | | | $ | 2,481 | | | | 23 | % | | | 36,914 | | | | 30,640 | | | $ | 6,274 | | | | 20 | % |
| | | | | | | | | | | | | | | | | | | | | | | | | | | | | | | | |
Total recurring revenue | | $ | 97,236 | | | $ | 94,830 | | | $ | 2,406 | | | | 3 | % | | $ | 323,843 | | | $ | 295,929 | | | $ | 27,914 | | | | 9 | % |
| | | | | | | | | | | | | | | | | | | | | | | | | | | | | | | | |
Recurring revenue as a percent of total revenue | | | 54 | % | | | 52 | % | | | | | | | | | | | 54 | % | | | 54 | % | | | | | | | | |
License and Cloud Backlog
A measure of the continued growth of our business as a result of future contractual commitments by our clients.
License and Cloud Backlog is the sum of the following two components:
Deferred license and cloud revenue as recorded on the Company’s balance sheet. (See Note 9 “Deferred Revenue”)
License and cloud contractual commitments, which are not recorded on our balance sheet because we have not yet invoiced our clients, nor have we recognized the associated revenue. (See “Future Cash Receipts from Committed License and Cloud Arrangements” which can be found in “Liquidity and Capital Resources” contained elsewhere in this Quarterly Report on Form10-Q for additional information)existing non-cancellable contracts.
License and cloud backlog may vary in any given period depending on the amount and timing of when the arrangements are executed, as well as the mix between perpetual, term, and cloud license arrangements, which may depend on our clients’ deployment preferences. A change in the mix may cause our revenues to vary materially from period to period. A higher proportion of term and cloud license arrangements executed will generally result in revenue being recognized over longer periods.
| | | | | | | | | | | | | | | | | | | | |
| | | September 30, | | | Change | |
| (Dollars in thousands) | | 2017 | | | 2016 | | |
Deferred license and cloud revenue on the balance sheet | | | | | | | | | | | | | | | | | | | | |
Term license and cloud | | $ | 25,658 | | | | 51 | % | | $ | 19,627 | | | | 42 | % | | | 31 | % |
Perpetual license | | | 24,929 | | | | 49 | % | | | 27,653 | | | | 58 | % | | | (10 | )% |
| | | | | | | | | | | | | | | | | | | | |
Total deferred license and cloud revenue | | | 50,587 | | | | 100 | % | | | 47,280 | | | | 100 | % | | | 7 | % |
| | | | | | | | | | | | | | | | | | | | |
License and cloud contractual commitments not on the balance sheet | | | | | | | | | | | | | | | | | | | | |
Term license and cloud | | | 450,535 | | | | 91 | % | | | 352,804 | | | | 94 | % | | | 28 | % |
Perpetual license | | | 46,459 | | | | 9 | % | | | 23,483 | | | | 6 | % | | | 98 | % |
| | | | | | | | | | | | | | | | | | | | |
Total license and cloud commitments | | | 496,994 | | | | 100 | % | | | 376,287 | | | | 100 | % | | | 32 | % |
| | | | | | | | | | | | | | | | | | | | |
Total license (term and perpetual) and cloud backlog | | $ | 547,581 | | | | | | | $ | 423,567 | | | | | | | | 29 | % |
| | | | | | | | | | | | | | | | | | | | |
Total term license and cloud backlog | | | 476,193 | | | | 87 | % | | | 372,431 | | | | 88 | % | | | 28 | % |
| | | | | | | | | | | | | | | | | | | | |
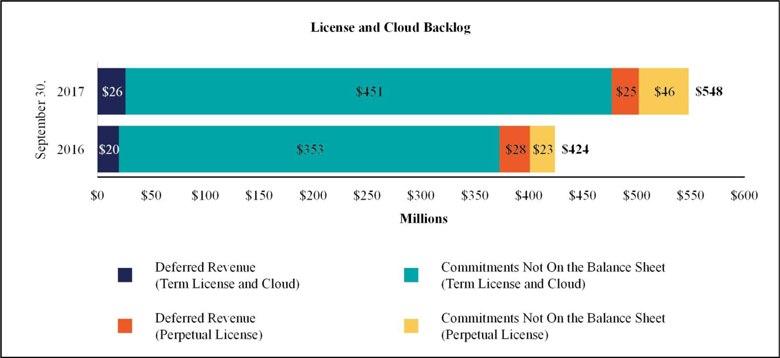
Critical accounting policies
CRITICAL ACCOUNTING POLICIES
Management’s Discussion and Analysis of Financial Condition and Results of Operations is based upon our unaudited condensed consolidated financial statements, which have been prepared
in accordance withfollowing accounting principles generally accepted in the
U.S.United States and the rules and regulations of the SEC for interim financial reporting. The preparation of these financial statements requires us to make estimates and judgments that affect the reported amounts of assets, liabilities, revenues,
and expenses, and the related disclosure of contingent assets and liabilities. We base our estimates and judgments on historical experience, knowledge of current conditions, and expectations of what could occur in the future given
the available information.
For more information about our critical accounting policies, we encourage you to read the discussion in the following locations in our Annual Report on Form 10-K for the year ended December 31, 2020:
•“Critical Accounting Estimates and Significant Judgments” in Item 7; and
•“Note 2. Significant Accounting Policies” in Item 8.
There have been no significant changes other than those disclosed in “Note 2. New Accounting Pronouncements” in Item 1 of this Quarterly Report on Form 10-Q to our critical accounting policies as disclosed in our Annual Report on Form10-K for the year ended December 31, 2016. For more information regarding2020.
RESULTS OF OPERATIONS
Revenue
Cloud Transition
We are transitioning our critical accounting policies, we encourage youbusiness to readsell software primarily through subscription arrangements, particularly Pega Cloud. Revenue growth has been slower because of this transition. Revenue from Pega Cloud and maintenance arrangements is typically recognized over the discussion contained in Item 7 undercontract term while revenue from license sales is recognized when the heading “Critical Accounting Estimateslicense rights become effective, typically upfront. | | | | | | | | | | | | | | | | | | | | | | | | | | | | | | | | | | | | | | | | | | | | | | | | | | | | | |
| (Dollars in thousands) | Three Months Ended
September 30, | | Change | | Nine Months Ended
September 30, | | Change |
| 2021 | | 2020 | | | 2021 | | 2020 | |
| Pega Cloud | $ | 78,369 | | 31 | % | | $ | 54,776 | | 24 | % | | $ | 23,593 | | 43 | % | | $ | 219,520 | | 25 | % | | $ | 147,080 | | 20 | % | | $ | 72,440 | | 49 | % |
| Client Cloud | $ | 118,609 | | 46 | % | | $ | 110,602 | | 49 | % | | $ | 8,007 | | 7 | % | | $ | 488,757 | | 54 | % | | $ | 391,042 | | 55 | % | | $ | 97,715 | | 25 | % |
| Maintenance | 83,188 | 32% | | 74,670 | 33% | | 8,518 | 11% | | 237,531 | 26% | | 220,587 | 31% | | 16,944 | 8% |
| Term license | 35,421 | 14% | | 35,932 | 16% | | (511) | (1)% | | 251,226 | 28% | | 170,455 | 24% | | 80,771 | 47% |
Cloud subscription (1) | $ | 196,978 | | 77 | % | | $ | 165,378 | | 73 | % | | $ | 31,600 | | 19 | % | | $ | 708,277 | | 79 | % | | $ | 538,122 | | 75 | % | | $ | 170,155 | | 32 | % |
| Perpetual license | 2,874 | | 1 | % | | 3,852 | | 2 | % | | (978) | | (25) | % | | 20,922 | | 2 | % | | 16,568 | | 2 | % | | 4,354 | | 26 | % |
| Consulting | 56,416 | | 22 | % | | 56,721 | | 25 | % | | (305) | | (1) | % | | 166,270 | | 19 | % | | 164,227 | | 23 | % | | 2,043 | | 1 | % |
| $ | 256,268 | | 100 | % | | $ | 225,951 | | 100 | % | | $ | 30,317 | | 13 | % | | $ | 895,469 | | 100 | % | | $ | 718,917 | | 100 | % | | $ | 176,552 | | 25 | % |
(1) Reflects client arrangements subject to renewal (Pega Cloud, maintenance, and Significant Judgments” and Note 2 “Significant Accounting Policies” includedterm license).
The revenue changes in the notes to the Consolidated Financial Statements containedthree and nine months ended September 30, 2021 generally reflect our Cloud Transition. Other factors impacting our revenue include:
•The increases in our Annual Report on Form10-K for the year ended December 31, 2016.Results of Operations
| | | | | | | | | | | | | | | | | | | | | | | | | | | | | | | | |
| | | Three Months Ended
September 30, | | | | | | Nine Months Ended
September 30, | | | | |
| (Dollars in thousands) | | 2017 | | | 2016 | | | Change | | | 2017 | | | 2016 | | | Change | |
Total revenue | | $ | 179,815 | | | $ | 182,802 | | | $ | (2,987 | ) | | | (2 | )% | | $ | 601,042 | | | $ | 550,656 | | | $ | 50,386 | | | | 9 | % |
Gross profit | | $ | 110,084 | | | $ | 122,365 | | | $ | (12,281 | ) | | | (10 | )% | | $ | 395,346 | | | $ | 373,609 | | | $ | 21,737 | | | | 6 | % |
Total operating expenses | | $ | 124,373 | | | $ | 116,867 | | | $ | 7,506 | | | | 6 | % | | $ | 376,647 | | | $ | 347,626 | | | $ | 29,021 | | | | 8 | % |
(Loss)/income from operations | | $ | (14,289 | ) | | $ | 5,498 | | | $ | (19,787 | ) | | | (360 | )% | | $ | 18,699 | | | $ | 25,983 | | | $ | (7,284 | ) | | | (28 | )% |
Operating margin | | | (8 | )% | | | 3 | % | | | | | | | | | | | 3 | % | | | 5 | % | | | | | | | | |
(Loss)/income before (benefit)/provision for income taxes | | $ | (14,697 | ) | | $ | 5,515 | | | $ | (20,212 | ) | | | (366 | )% | | $ | 18,663 | | | $ | 24,506 | | | $ | (5,843 | ) | | | (24 | )% |
Revenue
Software license revenue
| | | | | | | | | | | | | | | | | | | | | | | | | | | | | | | | | | | | | | | | | | | | | | | | |
| (Dollars in thousands) | | Three Months Ended
September 30, | | | | | | Nine Months Ended
September 30, | | | | |
| | 2017 | | | 2016 | | | Change | | | 2017 | | | 2016 | | | Change | |
Perpetual license | | $ | 20,115 | | | | 48 | % | | $ | 39,914 | | | | 58 | % | | $ | (19,799 | ) | | | (50 | )% | | $ | 89,050 | | | | 46 | % | | $ | 105,734 | | | | 51 | % | | ($ | 16,684 | ) | | | (16 | )% |
Term license | | | 21,678 | | | | 52 | % | | | 28,919 | | | | 42 | % | | | (7,241 | ) | | | (25 | )% | | | 106,170 | | | | 54 | % | | | 102,115 | | | | 49 | % | | | 4,055 | | | | 4 | % |
| | | | | | | | | | | | | | | | | | | | | | | | | | | | | | | | | | | | | | | | | | | | | | | | |
Total license revenue | | $ | 41,793 | | | | 100 | % | | $ | 68,833 | | | | 100 | % | | $ | (27,040 | ) | | | (39 | )% | | $ | 195,220 | | | | 100 | % | | $ | 207,849 | | | | 100 | % | | ($ | 12,629 | ) | | | (6 | )% |
| | | | | | | | | | | | | | | | | | | | | | | | | | | | | | | | | | | | | | | | | | | | | | | | |
The mix between perpetual and term license arrangements executed in a particular period varies based on clients’ deployment preferences. A change in the mix may cause our revenues to vary materially from period to period. A higher proportion of term license arrangements executed will generally result in license revenue being recognized over longer periods. Additionally, some of our perpetual license arrangements include extended payment terms or additional rights of use, which may also result in the recognition of revenue over longer periods.
The decrease in perpetual license revenue in the three months ended September 30, 2017 waswere primarily due to a decrease in the average value of perpetual arrangements executed and a lower percentage of perpetual arrangements executed andseveral large software license contracts recognized in revenue in the current period. The decrease in perpetual license revenue in the nine months ended September 30, 2017 was primarily due to a lower percentage2021.
•An increasing portion of perpetual arrangements executed and recognized in revenue.The decrease inour term license contracts include multi-year committed maintenance periods instead of annually renewable maintenance. Under multi-year committed maintenance arrangements, a larger portion of the total contract value is recognized as maintenance revenue inover the contract term rather than upon the effectiveness of the license rights as term license revenue. In the three months ended September 30, 2017 was primarily due2021, multi-year committed maintenance contributed $4.8 million to a largemaintenance revenue growth and reduced term license renewal for which the second year of the term was recognized as revenue in the three months ended September 30, 2016. If the second year of this term license arrangement was not paid in advance in the three months ended September 30, 2016, term license revenue would have decreased 2%. The increase in term license revenue ingrowth by $1.0 million. In the nine months ended September 30, 2017 was primarily due2021, multi-year committed maintenance contributed $12.6 million to broad basedmaintenance revenue growth amongst new and existing customers offsetreduced term revenue growth by a large term license arrangement which was prepaid and recognized in revenue in the three months ended March 31, 2016. If this term license arrangement was not prepaid and recognized in revenue in the three months ended March 31, 2016 term license revenue would have increased 26%.
The aggregate value of future revenue expected to be recognized during the remainder of the year under existing noncancellable perpetual arrangements not reflected in deferred revenue was $13.3 million as of September 30, 2017 compared to $3.9 million as of September 30, 2016.
The aggregate value of future revenue expected to be recognized during the remainder of the year under existing noncancellable term and cloud arrangements not reflected in deferred revenue was $37.7 million as of September 30, 2017 compared to $26.7 million as of September 30, 2016. For additional information see “Future Cash Receipts from Committed License and Cloud Arrangements” which can be found in “Liquidity and Capital Resources.”
$22.0 million.
•Maintenance revenue | | | | | | | | | | | | | | | | | | | | | | | | | | | | | | | | |
| | | Three Months Ended
September 30, | | | | | | Nine Months Ended
September 30, | | | | |
| (Dollars in thousands) | | 2017 | | | 2016 | | | Change | | | 2017 | | | 2016 | | | Change | |
Maintenance | | $ | 62,204 | | | $ | 55,038 | | | $ | 7,166 | | | | 13 | % | | $ | 180,759 | | | $ | 163,174 | | | $ | 17,585 | | | | 11 | % |
The increases were primarily due to the continued growth in the aggregate value of the installed base of our software and strong renewal rates significantly in excess of higher than 90%.
Services revenue
| | | | | | | | | | | | | | | | | | | | | | | | | | | | | | | | | | | | | | | | | | | | | | | | |
| | | Three Months Ended
September 30, | | | | | | Nine Months Ended
September 30, | | | | |
| (Dollars in thousands) | | 2017 | | | 2016 | | | Change | | | 2017 | | | 2016 | | | Change | |
Consulting services | | $ | 61,535 | | | | 81 | % | | $ | 46,829 | | | | 80 | % | | $ | 14,706 | | | | 31 | % | | $ | 183,447 | | | | 82 | % | | $ | 144,263 | | | | 80 | % | | $ | 39,184 | | | | 27 | % |
Cloud | | | 13,354 | | | | 18 | % | | | 10,873 | | | | 18 | % | | | 2,481 | | | | 23 | % | | | 36,914 | | | | 16 | % | | | 30,640 | | | | 17 | % | | | 6,274 | | | | 20 | % |
Training | | | 929 | | | | 1 | % | | | 1,229 | | | | 2 | % | | | (300 | ) | | | (24 | )% | | | 4,702 | | | | 2 | % | | | 4,730 | | | | 3 | % | | | (28 | ) | | | (1 | )% |
| | | | | | | | | | | | | | | | | | | | | | | | | | | | | | | | | | | | | | | | | | | | | | | | |
Total services | | $ | 75,818 | | | | 100 | % | | $ | 58,931 | | | | 100 | % | | $ | 16,887 | | | | 29 | % | | $ | 225,063 | | | | 100 | % | | $ | 179,633 | | | | 100 | % | | $ | 45,430 | | | | 25 | % |
| | | | | | | | | | | | | | | | | | | | | | | | | | | | | | | | | | | | | | | | | | | | | | | | |
Consulting services revenue is primarily generated from new license implementations. Our consulting services revenue may fluctuate in future periods depending on the mix of new implementation projects we perform as compared to those performed by our enabled clients or led by our partners.
•The increaseschanges in consulting services revenue were primarily due to higher billable hours duringin the three and nine months ended September 30, 2017 driven by a large project which began in the second half of 2016.Cloud revenue represents revenue from our Pega Cloud offerings. The increases in cloud revenue2021 were primarily due to continued growthchanges in billable hours. As part of our cloud client base.
long-term strategy, we intend to continue growing and leveraging our ecosystem of partners on implementation projects, potentially reducing our future consulting revenue growth.
Gross profit | | | | | | | | | | | | | | | | | | | | | | | | | | | | | | | | |
| | | Three Months Ended
September 30, | | | | | | Nine Months Ended
September 30, | | | | |
| (Dollars in thousands) | | 2017 | | | 2016 | | | Change | | | 2017 | | | 2016 | | | Change | |
Software license | | $ | 40,517 | | | $ | 67,520 | | | $ | (27,003 | ) | | | (40 | )% | | $ | 191,394 | | | $ | 204,203 | | | $ | (12,809 | ) | | | (6 | )% |
Maintenance | | | 55,488 | | | | 48,379 | | | | 7,109 | | | | 15 | % | | | 159,814 | | | | 144,285 | | | | 15,529 | | | | 11 | % |
Services | | | 14,079 | | | | 6,466 | | | | 7,613 | | | | 118 | % | | | 44,138 | | | | 25,121 | | | | 19,017 | | | | 76 | % |
| | | | | | | | | | | | | | | | | | | | | | | | | | | | | | | | |
Total gross profit | | $ | 110,084 | | | $ | 122,365 | | | $ | (12,281 | ) | | | (10 | )% | | $ | 395,346 | | | $ | 373,609 | | | $ | 21,737 | | | | 6 | % |
Software license gross profit % | | | 97 | % | | | 98 | % | | | | | | | | | | | 98 | % | | | 98 | % | | | | | | | | |
Maintenance gross profit % | | | 89 | % | | | 88 | % | | | | | | | | | | | 88 | % | | | 88 | % | | | | | | | | |
Services gross profit % | | | 19 | % | | | 11 | % | | | | | | | | | | | 20 | % | | | 14 | % | | | | | | | | |
| | | | | | | | | | | | | | | | | | | | | | | | | | | | | | | | |
Total gross profit % | | | 61 | % | | | 67 | % | | | | | | | | | | | 66 | % | | | 68 | % | | | | | | | | |
| | | | | | | | | | | | | | | | | | | | | | | | | | | | | | | | | | | | | | | | | | | | | | | | | | | | | |
| Three Months Ended
September 30, | | Change | | Nine Months Ended
September 30, | | Change |
| (Dollars in thousands) | 2021 | | 2020 | | | 2021 | | 2020 | |
| Pega Cloud | $ | 52,845 | | 67 | % | | $ | 35,059 | | 64 | % | | $ | 17,786 | | 51 | % | | $ | 147,388 | | 67 | % | | $ | 90,842 | | 62 | % | | $ | 56,546 | | 62 | % |
| Maintenance | 77,895 | | 94 | % | | 69,192 | | 93 | % | | 8,703 | | 13 | % | | 221,457 | | 93 | % | | 203,942 | | 92 | % | | 17,515 | | 9 | % |
| Software license | 37,639 | | 98 | % | | 39,093 | | 98 | % | | (1,454) | | (4) | % | | 270,186 | | 99 | % | | 184,669 | | 99 | % | | 85,517 | | 46 | % |
| Consulting | 3,667 | | 6 | % | | 4,808 | | 8 | % | | (1,141) | | (24) | % | | 5,238 | | 3 | % | | 5,446 | | 3 | % | | (208) | | (4) | % |
| $ | 172,046 | | 67 | % | | $ | 148,152 | | 66 | % | | $ | 23,894 | | 16 | % | | $ | 644,269 | | 72 | % | | $ | 484,899 | | 67 | % | | $ | 159,370 | | 33 | % |
•The decreasechanges in total gross profit in the three months ended September 30, 2017 was primarily due to a shift in the mix of license arrangements executed from perpetual to term licenses and an increase in lower margin services revenue.The increase in total gross profit in the nine months ended September 30, 2017 was primarily due to increased total revenue.
The increases in service gross profit percent in the three and nine months ended September 30, 2017 was driven by a large project which began2021 were primarily due to our Cloud Transition, revenue growth, and cost-efficiency gains as Pega Cloud grows and scales.
•The decrease in the second half of 2016 and several additional large projects for which costs were recognized in 2016 but whose associated revenue was not recognized until after September 30, 2016.Operating expenses
Selling and marketing
| | | | | | | | | | | | | | | | | | | | | | | | | | | | | | | | |
| | | Three Months Ended
September 30, | | | | | | Nine Months Ended
September 30, | | | | |
| (Dollars in thousands) | | 2017 | | | 2016 | | | Change | | | 2017 | | | 2016 | | | Change | |
Selling and marketing | | $ | 70,209 | | | $ | 67,032 | | | $ | 3,177 | | | | 5 | % | | $ | 217,384 | | | $ | 202,126 | | | $ | 15,258 | | | | 8 | % |
As a percent of total revenue | | | 39 | % | | | 37 | % | | | | | | | | | | | 36 | % | | | 37 | % | | | | | | | | |
Selling and marketing headcount, end of period | | | | | | | | | | | | | | | | | | | 934 | | | | 875 | | | | 59 | | | | 7 | % |
Selling and marketing expenses include compensation, benefits, and other headcount-related expenses associated with our selling and marketing personnel as well as advertising, promotions, trade shows, seminars, and other programs. Selling and marketing expenses also include the amortization of customer related intangibles.
The increaseconsulting gross profit percent in the three months ended September 30, 20172021 was due to a decrease in consultant utilization in North America.
Operating expenses | | | | | | | | | | | | | | | | | | | | | | | | | | | | | | | | | | | | | | | | | | | | | | | | | | | | | |
| (Dollars in thousands) | Three Months Ended
September 30, | | Change | | Nine Months Ended
September 30, | | Change |
| 2021 | | 2020 | | | 2021 | | 2020 | |
| | % of Revenue | | | % of Revenue | | | | | | % of Revenue | | | % of Revenue | | | |
| Selling and marketing | $ | 152,479 | | 59 | % | | $ | 132,053 | | 58 | % | | $ | 20,426 | | 15 | % | | $ | 457,641 | | 51 | % | | $ | 395,684 | | 55 | % | | $ | 61,957 | | 16 | % |
| Research and development | $ | 64,728 | | 25 | % | | $ | 60,024 | | 27 | % | | $ | 4,704 | | 8 | % | | $ | 191,565 | | 21 | % | | $ | 177,620 | | 25 | % | | $ | 13,945 | | 8 | % |
| General and administrative | $ | 20,176 | | 8 | % | | $ | 17,907 | | 8 | % | | $ | 2,269 | | 13 | % | | $ | 57,607 | | 6 | % | | $ | 49,192 | | 7 | % | | $ | 8,415 | | 17 | % |
•The increases in selling and marketing in the three and nine months ended September 30, 2021 were primarily due to an increaseincreases in compensation and benefits of $1.8$15.8 million driven by increasedand $63.8 million, attributable to increases in headcount, sales commissions, and equity compensation, partially offset by a decrease in sales commissions associated with the lower value of new license arrangements executed during the three months ended September 30, 2017.The increase in the nine months ended September 30, 2017 was primarily due to an increase in compensation and benefits of $12.7 million, respectively, driven by increased headcount and equity compensation, and an increase in employee travel and entertainment, partially offset by a decrease in brand marketing program expenses of $2.2 million.
compensation. The increase in headcount reflects our efforts to increase our sales capacity to deepen relationships with existing clients and target new accountsaccounts.
•The increases in existing industries, as well as to expand coverage in new industriesresearch and geographies and to increase the number of sales opportunities.Research and development
| | | | | | | | | | | | | | | | | | | | | | | | | | | | | | | | |
| | | Three Months Ended
September 30, | | | | | | Nine Months Ended
September 30, | | | | |
| (Dollars in thousands) | | 2017 | | | 2016 | | | Change | | | 2017 | | | 2016 | | | Change | |
Research and development | | $ | 41,031 | | | $ | 38,036 | | | $ | 2,995 | | | | 8 | % | | $ | 121,089 | | | $ | 108,530 | | | $ | 12,559 | | | | 12 | % |
As a percent of total revenue | | | 23 | % | | | 21 | % | | | | | | | | | | | 20 | % | | | 20 | % | | | | | | | | |
Research and Development headcount, end of period | | | | | | | | | | | | | | | | | | | 1,474 | | | | 1,437 | | | | 37 | | | | 3 | % |
Research and development expenses include compensation, benefits, contracted services, and other headcount-related expenses associated with the creation and development of our products, as well as enhancements and design changes to existing products and integration of acquired technologies.
The increases in the three and nine months ended September 30, 20172021 were primarily due to increases in compensation and benefits of $2.9$5.1 million and $12.6$16.9 million, respectively, attributable to increased headcount and equity compensation.
General and administrative
| | | | | | | | | | | | | | | | | | | | | | | | | | | | | | | | |
| | | Three Months Ended
September 30, | | | | | | Nine Months Ended
September 30, | | | | |
| (Dollars in thousands) | | 2017 | | | 2016 | | | Change | | | 2017 | | | 2016 | | | Change | |
General and administrative | | $ | 13,133 | | | $ | 11,725 | | | $ | 1,408 | | | | 12 | % | | $ | 38,174 | | | $ | 34,067 | | | $ | 4,107 | | | | 12 | % |
As a percent of total revenue | | | 7 | % | | | 6 | % | | | | | | | | | | | 6 | % | | | 6 | % | | | | | | | | |
General and administrative headcount, end of period | | | | | | | | | | | | | | | | | | | 407 | | | | 371 | | | | 36 | | | | 10 | % |
General and administrative expenses include compensation, benefits, and other headcount-related expenses associated with finance, legal, corporate governance, and other administrativeincreases in headcount. They also include accounting, legal, and other professional consulting and administrative fees.
•The increases in general and administrative headcount includes employees in human resources, information technology, and corporate services departments, whose costs are partially allocated to other operating expense areas.The increases in the three and nine months ended September 30, 20172021 were primarily due to increases in compensation and benefits of $0.4 million and $4$3.8 million, respectively, attributable to increasedincreases in headcount and equity compensation. The increasecompensation, and increases in legal and other professional services fees of $2.7 million and $6.1 million.
•In February 2021, we agreed to accelerate our exit from our Cambridge, Massachusetts headquarters to October 1, 2021, in exchange for a one-time payment from our landlord of $18 million. This agreement was the nine months ended September 30, 2017 was partially offset by a decreaseprimary contributor to decreases in facilities expenses of $1.5$2.1 million and $5.5 million in legal fees.Stock-based compensation
| | | | | | | | | | | | | | | | | | | | | | | | | | | | | | | | |
| | | Three Months Ended
September 30, | | | | | | Nine Months Ended
September 30, | | | | |
| (in thousands) | | 2017 | | | 2016 | | | Change | | | 2017 | | | 2016 | | | Change | |
Cost of revenues | | $ | 3,613 | | | $ | 3,117 | | | $ | 496 | | | | 16 | % | | $ | 10,913 | | | $ | 8,711 | | | $ | 2,202 | | | | 25 | % |
Selling and marketing | | | 3,976 | | | | 3,468 | | | | 508 | | | | 15 | % | | | 11,482 | | | | 9,395 | | | | 2,087 | | | | 22 | % |
Research and development | | | 3,420 | | | | 2,260 | | | | 1,160 | | | | 51 | % | | | 10,306 | | | | 7,480 | | | | 2,826 | | | | 38 | % |
General and administrative | | | 2,480 | | | | 1,983 | | | | 497 | | | | 25 | % | | | 7,228 | | | | 4,706 | | | | 2,522 | | | | 54 | % |
Acquisition-related | | | — | | | | (10 | ) | | | 10 | | | | (100 | )% | | | — | | | | 342 | | | | (342 | ) | | | (100 | )% |
| | | | | | | | | | | | | | | | | | | | | | | | | | | | | | | | |
Total stock-based compensation before tax | | $ | 13,489 | | | $ | 10,818 | | | $ | 2,671 | | | | 25 | % | | $ | 39,929 | | | $ | 30,634 | | | $ | 9,295 | | | | 30 | % |
| | | | | | | | | | | | | | | | | | | | | | | | | | | | | | | | |
Income tax benefit | | $ | (4,129 | ) | | $ | (3,227 | ) | | $ | (902 | ) | | | 28 | % | | $ | (12,231 | ) | | $ | (8,917 | ) | | $ | (3,314 | ) | | | 37 | % |
The increases were primarily due to the increased value of our annual periodic equity awards grantedselling and marketing, $2.0 million and $5.6 million in March 2016research and 2017. These awards generally have a five-year vesting schedule.
Amortization of intangibles
| | | | | | | | | | | | | | | | | | | | | | | | | | | | | | | | |
| | | Three Months Ended
September 30, | | | | | | Nine Months Ended
September 30, | | | | |
| (Dollars in thousands) | | 2017 | | | 2016 | | | Change | | | 2017 | | | 2016 | | | Change | |
Cost of revenue | | $ | 1,232 | | | $ | 1,642 | | | $ | (410 | ) | | | (25 | )% | | $ | 3,871 | | | $ | 4,626 | | | $ | (755 | ) | | | (16 | )% |
Selling and marketing | | | 1,873 | | | | 1,867 | | | | 6 | | | | — | % | | | 5,608 | | | | 5,274 | | | | 334 | | | | 6 | % |
General and administrative | | | — | | | | 90 | | | | (90 | ) | | | (100 | )% | | | — | | | | 268 | | | | (268 | ) | | | (100 | )% |
| | | | | | | | | | | | | | | | | | | | | | | | | | | | | | | | |
| | $ | 3,105 | | | $ | 3,599 | | | $ | (494 | ) | | | (14 | )% | | $ | 9,479 | | | $ | 10,168 | | | $ | (689 | ) | | | (7 | )% |
| | | | | | | | | | | | | | | | | | | | | | | | | | | | | | | | |
The decreasesdevelopment, and $1.0 million and $2.8 million in amortization of intangiblesgeneral and administrative, in the three and nine months ended September 30, 20172021.
Other income (expense), net | | | | | | | | | | | | | | | | | | | | | | | | | | | | | | | | | | | | | | | | | |
| (Dollars in thousands) | Three Months Ended
September 30, | | Change | | Nine Months Ended
September 30, | | Change |
| 2021 | | 2020 | | | 2021 | | 2020 | |
| Foreign currency transaction gain (loss) | $ | 518 | | | $ | 4,236 | | | $ | (3,718) | | (88) | % | | $ | (4,983) | | | $ | 2,545 | | | $ | (7,528) | | * |
| Interest income | 166 | | | 243 | | | (77) | | (32) | % | | 555 | | | 1,092 | | | (537) | | (49) | % |
| Interest expense | (1,908) | | | (5,956) | | | 4,048 | | 68 | % | | (5,747) | | | (13,791) | | | 8,044 | | 58 | % |
| (Loss) income on capped call transactions | (14,735) | | | 18,989 | | | (33,724) | | * | | (7,543) | | | 19,816 | | | (27,359) | | * |
| Other income, net | 2 | | | — | | | 2 | | * | | 108 | | | 1,374 | | | (1,266) | | (92) | % |
| $ | (15,957) | | | $ | 17,512 | | | $ | (33,469) | | * | | $ | (17,610) | | | $ | 11,036 | | | $ | (28,646) | | * |
* not meaningful
•The changes in foreign currency transaction gain (loss) in the three and nine months ended September 30, 2021 were primarily due to the amortization in fullimpact of certain intangibles acquired through past acquisitions.Non-operating (expense)/income, net
| | | | | | | | | | | | | | | | | | | | | | | | | | | | | | | | |
| | | Three Months Ended
September 30, | | | | | | Nine Months Ended
September 30, | | | | |
| (Dollars in thousands) | | 2017 | | | 2016 | | | Change | | | 2017 | | | 2016 | | | Change | |
Foreign currency transaction (loss)/gain | | $ | (552 | ) | | $ | 1,082 | | | $ | (1,634 | ) | | | n/m | | | $ | (793 | ) | | $ | 2,764 | | | $ | (3,557 | ) | | | n/m | |
Interest income, net | | | 144 | | | | 172 | | | $ | (28 | ) | | | (16 | )% | | | 470 | | | | 650 | | | | (180 | ) | | | (28 | )% |
Other (expense)/income, net | | | — | | | | (1,237 | ) | | $ | 1,237 | | | | (100 | )% | | | 287 | | | | (4,891 | ) | | | 5,178 | | | | n/m | |
| | | | | | | | | | | | | | | | | | | | | | | | | | | | | | | | |
| | $ | (408 | ) | | $ | 17 | | | $ | (425 | ) | | | n/m | | | $ | (36 | ) | | $ | (1,477 | ) | | $ | 1,441 | | | | (98 | )% |
| | | | | | | | | | | | | | | | | | | | | | | | | | | | | | | | |
n/m - not meaningful
In May 2017, we discontinued our forward contracts program; however, we will continue to evaluate periodically our foreign exchange exposures and mayre-initiate this program if it is deemed necessary.
Historically, we have used foreign currency forward contracts (“forward contracts”) to hedge our exposure to fluctuations in foreign currency exchange rates associated with our foreign currency denominatedcurrency-denominated cash, accounts receivable,receivables, and intercompany receivables and payablesbalances held primarily by the U.S. parent company and its United Kingdom (“U.K.”) subsidiary. See Note 4 “Derivative Instruments” of this Quarterly Report on Form 10-Q for additional information.
The total changeour subsidiary in the fair value of our foreign currency forward contracts recordedUnited Kingdom.
•The decreases in otherinterest income (expense), net, duringin the three months ended September 30, 2016 was a loss of $1.2 million. The total change in the fair value of our foreign currency forward contracts recorded in other (expense)/income, net, during theand nine months ended September 30, 2017 and 2016 was a gain of $0.3 million and a loss of $5 million, respectively.(Benefit)/provision for income taxes
| | | | | | | | | | | | | | | | | | | | | | | | | | | | | | | | |
| | | Three Months Ended
September 30, | | | | | | Nine Months Ended
September 30, | | | | |
| (Dollars in thousands) | | 2017 | | | 2016 | | | Change | | | 2017 | | | 2016 | | | Change | |
(Benefit)/provision for income taxes | | $ | (12,885 | ) | | $ | 2,214 | | | $ | (15,099 | ) | | | n/m | | | $ | (17,952 | ) | | $ | 6,269 | | | $ | (24,221 | ) | | | n/m | |
Effective income tax rate | | | 88 | % | | | 40 | % | | | | | | | | | | | (96 | )% | | | 26 | % | | | | | | | | |
n/m - not meaningful
2021 were primarily due to declines in market interest rates.
•The (benefit)/provision for income taxes represents current and future amounts for federal, state, and foreign taxes.The increasedecreases in interest expense in the effective income tax rate in the three and nine months ended September 30, 2017 is2021 were primarily due to our adoption of ASU 2020-06 on January 1, 2021. See "Note 2. New Accounting Pronouncements" in Item 1 of this Quarterly Report for additional information.
Interest expense related to the significant increase of $3.5 millionNotes:
| | | | | | | | | | | | | | | | | | | | | | | | | | | | | | | | | | | |
| Three Months Ended
September 30, | | Change | | Nine Months Ended
September 30, | | Change |
| (in thousands) | 2021 | | 2020 | | | 2021 | | 2020 | |
| Contractual interest expense (0.75% coupon) | $ | 1,125 | | | $ | 1,125 | | | $ | — | | | $ | 3,375 | | | $ | 2,700 | | | $ | 675 | |
| Amortization of debt discount | — | | | 3,807 | | | (3,807) | | | — | | | 9,060 | | | (9,060) | |
| Amortization of issuance costs | 677 | | | 565 | | | 112 | | | 2,025 | | | 1,345 | | | 680 | |
| $ | 1,802 | | | $ | 5,497 | | | $ | (3,695) | | | $ | 5,400 | | | $ | 13,105 | | | $ | (7,705) | |
•The decreases in excess tax benefits generatedthe (loss) income on capped call transactions in the three and nine months ended September 30, 2021, were due to fair value adjustments driven by changes in our stock compensation plans on significantly lower income before (benefit)/provision for income taxes, which decreased by $20.2 million.price.
•The decrease in the effectiveother income, tax ratenet in the nine months ended September 30, 2017 is2021, was due to larger fair value adjustments on equity securities held in our venture investments portfolio in the nine months ended September 30, 2020.
(Benefit from) income taxes | | | | | | | | | | | | | | | | | | | | | | | |
| Three Months Ended
September 30, | | Nine Months Ended
September 30, |
| (Dollars in thousands) | 2021 | | 2020 | | 2021 | | 2020 |
| (Benefit from) income taxes | $ | (24,826) | | | $ | (25,053) | | | $ | (54,360) | | | $ | (61,182) | |
| Effective income tax benefit rate | | | | | 68 | % | | 48 | % |
During the nine months ended September 30, 2021, the change in our effective income tax benefit rate was primarily due to the
significant increaseimpact of
$19.1 million in excessdiscrete tax
benefits generated by our stock compensation plans,items on
significantly lower incomea proportionately larger (loss) before
(benefit)/provision for income taxes
which decreased by $5.8 million.The inclusion of excess tax benefits as a component of the provision for income taxes may increase volatility in the effective tax rates of future periods as the amount ofnine months ended September 30, 2020. The most significant discrete items were excess tax benefits from share-basedstock-based compensation awards varies dependingand the impact of changes in statutory tax rates applicable to our U.K.-based deferred tax assets.
Stock-based compensation increases the variability of our effective tax rates. The impact on our
futureeffective tax rate in each period depends on our profitability and the tax deductions from our stock compensation activity, which depend upon our stock price
in relation to the fair value of awards, the timing of RSU vesting and exercise behavior of our stock option holders, and the
total value of future grants of share-based compensation awards.Liquidity and capital resources
| | | | | | | | |
| | | Nine Months Ended
September 30, | |
| (in thousands) | | 2017 | | | 2016 | |
Cash provided by (used in): | | | | | | | | |
Operating activities | | $ | 113,926 | | | $ | 20,556 | |
Investing activities | | | (11,966 | ) | | | (2,859 | ) |
Financing activities | | | (44,040 | ) | | | (43,031 | ) |
Effect of exchange rate on cash | | | 2,054 | | | | (1,309 | ) |
| | | | | | | | |
Net increase/(decrease) in cash and cash equivalents | | $ | 59,974 | | | $ | (26,643 | ) |
| | | | | | | | |
| | |
| (in thousands) | | September 30,
2017 | | | December 31,
2016 | |
Total cash, cash equivalents, and marketable securities | | $ | 194,380 | | | $ | 133,761 | |
award holders' exercise behavior.
LIQUIDITY AND CAPITAL RESOURCES | | | | | | | | | | | |
| Nine Months Ended
September 30, |
| (in thousands) | 2021 | | 2020 |
| Cash provided by (used in): | | | |
| Operating activities | $ | (5,321) | | | $ | (26,257) | |
| Investing activities | 42,730 | | | (210,701) | |
| Financing activities | (91,431) | | | 449,630 | |
| Effect of exchange rates on cash and cash equivalents | (1,466) | | | 183 | |
| Net (decrease) increase in cash and cash equivalents | $ | (55,488) | | | $ | 212,855 | |
| | | | | | | | | | | |
| (in thousands) | September 30, 2021 | | December 31, 2020 |
| Held by U.S. entities | $ | 267,378 | | | $ | 399,138 | |
| Held by foreign entities | 84,470 | | | 66,030 | |
| Total cash, cash equivalents, and marketable securities | $ | 351,848 | | | $ | 465,168 | |
We believe that our current cash, cash
equivalents, marketable securities, and cash flow from operations,
and borrowing capacity will be sufficient to fund our operations,
our dividend payments,stock repurchases, and
our share repurchase programquarterly cash dividends for at least the next 12 months.
As of September 30, 2017, approximately $61.1 million of Whether these resources are adequate to meet our cashliquidity needs beyond that period will depend on our future growth, operating results, and cash equivalents was held inthe investments needed to support our foreign subsidiaries. operations. If we require additional capital resources to grow our business, we may utilize available funds or additional external financing.
If it becomes necessary to repatriate theseforeign funds, we may be requiredhave to pay U.S. tax, net of any applicableand foreign tax credits,taxes upon repatriation. We considerDue to the earningscomplexity of our foreign subsidiaries to be permanently reinvestedincome tax laws and as a result, U.S. taxes on such earnings are not provided. Itregulations, it is impracticalimpracticable to estimate the amount of U.S. taxtaxes we may be requiredwould have to pay upon repatriation duepay.
Operating activities
We are transitioning our business to
sell software primarily through subscription arrangements, particularly Pega Cloud. This transition has impacted and is expected to continue to impact the
complexitytiming of
our billings and cash collections. Pega Cloud, term license, and maintenance arrangements are generally billed and collected over the
foreign tax credit calculations. There can be no assurance that changescontract term, while perpetual license arrangements are generally billed and collected upfront when the license rights become effective. As client preferences shift in
our plansfavor of Pega Cloud arrangements, we could experience slower operating cash flow growth, or
other events affecting our operations will not resultnegative cash flow, in
materially accelerated or unexpected expenditures.Cash provided bythe near term.
The change in cash (used in) operating activities
The primary drivers during in the nine months ended September 30, 2017 were net income2021 was primarily due to a significant increase in client collections.
Corporate headquarters
In February 2021, we agreed to accelerate our exit from our previous corporate headquarters to October 1, 2021, in exchange for a one-time payment from our landlord of $36.6$18 million, which was paid in October 2021. The accelerated exit from this lease reduced our future lease liabilities by $21.1 million. On March 31, 2021 we leased office space at One Main Street, Cambridge, Massachusetts, to serve as our corporate headquarters. The 4.5 year lease includes a base rent of $2 million per year.
New Waltham Office
On July 6, 2021, we entered into an office space lease for 131 thousand square feet in Waltham, Massachusetts. The lease term of 11 years began on August 1, 2021. The annual rent equals the base rent plus a portion of building operating costs and real estate taxes. Rent first becomes payable on August 1, 2022. Base rent for the first year is approximately $6 million and $80.6will increase by 3% annually. In addition, we will receive an improvement allowance from the landlord of up to $11.8 million from trade accounts receivable, largely due toas part of the lease. This lease increased our lease liabilities and lease-related right of use assets by $42.1 million on August 1, 2021.
Investing activities
The change in cash collections and the timing of billings.The primary driver duringprovided by (used in) investing activities in the nine months ended September 30, 20162021 was net incomeprimarily driven by investments in financial instruments, an acquisition,
and a decrease in office space related capital expenditures. Financing activities
Debt financing
In February 2020, we issued $600 million in aggregate principal amount of $18.2 million.Future Cash Receipts from Committed Licenseconvertible senior notes which mature on March 1, 2025. In November 2019, and Cloud Arrangements
as amended as of February 2020, July 2020, and September 2020, we entered into a five-year $100 million senior secured revolving credit agreement with PNC Bank, National Association. As of September 30, 2017, none2021, we had no outstanding borrowings under the Credit Facility. See "Note 8. Debt" in Item 1 of the amounts shown in the table below had been billed and no revenue had been recognized.
The below amounts for 2018 and subsequent periods may not be recognized in the periods shown below as a result of the adoption of the new revenue recognition standard (ASC 606). (See Note 2. New Accounting Pronouncements contained elsewhere in this Quarterly Report on Form10-Qfor additional information)
| | | | | | | | | | | | |
| | | September 30,
2017 | |
| (in thousands) | | Term and cloud
contracts | | | Perpetual contracts (1) | | | Total | |
Remainder of 2017 | | $ | 37,723 | | | $ | 13,274 | | | $ | 50,997 | |
2018 | | | 150,629 | | | | 21,213 | | | | 171,842 | |
2019 | | | 125,165 | | | | 10,033 | | | | 135,198 | |
2020 | | | 85,939 | | | | 1,572 | | | | 87,511 | |
2021 | | | 38,203 | | | | 367 | | | | 38,570 | |
2022 and thereafter | | | 12,876 | | | | — | | | | 12,876 | |
| | | | | | | | | | | | |
Total | | $ | 450,535 | | | $ | 46,459 | | | $ | 496,994 | |
| | | | | | | | | | | | |
Stock repurchase program
Changes in the remaining stock repurchase authority:(1) | These amounts are for perpetual licenses with extended payment terms and/or additional rights of use. | | | | |
| (in thousands) | Nine Months Ended
September 30, 2021 |
| December 31, 2020 | $ | 37,726 | |
Authorizations (1) | 38,467 | |
Repurchases (2) | (32,188) | |
| September 30, 2021 | $ | 44,005 | |
Total contractual future cash receipts due from
(1) On June 8, 2021, we announced that our
existing licenseBoard of Directors extended the current stock repurchase program’s expiration date to June 30, 2022 and
cloud arrangements were approximately $376.3 million as of September 30, 2016.Cash used in investing activities
increased the remaining common stock repurchase authority to $60 million.
(2) All purchases under this program have been made on the open market.
Common stock repurchases | | | | | | | | | | | | | | | | | | | | | | | |
| Nine Months Ended
September 30, |
| 2021 | | 2020 |
| (in thousands) | Shares | | Amount | | Shares | | Amount |
| Tax withholdings for net settlement of equity awards | 462 | | | $ | 59,819 | | | 599 | | | $ | 59,613 | |
| Stock repurchase program | 248 | | | 32,188 | | | 204 | | | 18,828 | |
| 710 | | | $ | 92,007 | | | 803 | | | $ | 78,441 | |
During the nine months ended September 30,
2017, we purchased $25.7 million of marketable debt securities2021 and
made investments of $9.1 million in property and equipment, partially offset by proceeds received from maturities of marketable debt securities (including called marketable debt securities) of $23.1 million.During the nine months ended September 30, 2016, we acquired OpenSpan for $48.8 million, net of cash acquired, and invested $15.3 million primarily in internally developed software and leasehold improvements at our corporate headquarters, partially offset by proceeds received from the sales of marketable debt securities of $62.3 million.
Cash used in financing activities
We used cash primarily for repurchases of our common stock, share repurchases for tax withholdings for the net settlement of our equity awards, and the payment of our quarterly dividend.
Since 2004, our Board of Directors has approved annual stock repurchase programs that have authorized the repurchase in the aggregate of up to $195 million of our common stock. Purchases under these programs have been made on the open market.
The following table is a summary of our repurchase activity:
| | | | | | | | | | | | | | | | | | | | | | | | |
| | | Nine Months Ended
September 30, | |
| | | 2017 | | | 2016 | |
| (in thousands) | | Shares | | | Amount | | | Authorization Remaining
Under Publicly Announced
Share Repurchased
Programs | | | Shares | | | Amount | | | Authorization Remaining
Under Publicly Announced
Share Repurchased
Programs | |
Balance as of January 1, | | | | | | | | | | $ | 39,385 | | | | | | | | | | | $ | 40,534 | |
Authorizations | | | — | | | | — | | | | — | | | | — | | | | — | | | | 25,879 | |
Repurchase for net settlement of tax under stock-based compensation | | | 682 | | | | (34,791 | ) | | | — | | | | 414 | | | | (10,791 | ) | | | — | |
Repurchases paid under authorized share repurchase program | | | 68 | | | | (2,986 | ) | | | (2,986 | ) | | | 1,028 | | | | (25,530 | ) | | | (25,530 | ) |
Repurchases unsettled | | | — | | | | — | | | | — | | | | 6 | | | | (177 | ) | | | (177 | ) |
| | | | | | | | | | | | | | | | | | | | | | | | |
Activity in Period | | | 750 | | | $ | (37,777 | ) | | $ | (2,986 | ) | | | 1,448 | | | $ | (36,498 | ) | | $ | 172 | |
| | | | | | | | | | | | | | | | | | | | | | | | |
Balance as of September 30, | | | | | | | | | | $ | 36,399 | | | | | | | | | | | $ | 40,706 | |
| | | | | | | | | | | | | | | | | | | | | | | | |
In addition to the share repurchases made under our repurchase programs, we net settled the majority of our employee stock option exercises and RSU vestings, which resulted in the withholding of shares to cover the option exercise price and the minimum statutory tax withholding obligations.
During the nine months ended September 30, 2017 and 2016, option and RSU holders net settled a total of 2.4 million shares and 1.6 million shares, respectively, of which only 1.3 million shares and 0.8 million shares, respectively, were issued to the option and RSU holders. The balance of the shares were surrendered to us to pay for the exercise price with respect to options and the applicable taxes for both options and RSUs. During the nine months ended September 30, 2017 and 2016,2020, instead of receiving cash from the equity holders, we withheld shares with a value of $23.7$47.1 million and $10.1$49.5 million, respectively, for the exercise price of options.
These amounts are not included in the table above.
Dividends
| | | | | | | | |
| | | Nine Months Ended
September 30, | |
| (per share) | | 2017 | | | 2016 | |
Dividends Declared | | $ | 0.09 | | | $ | 0.09 | |
Dividends Paid | | $ | 0.09 | | | $ | 0.09 | |
It is our current intention
We intend to pay a quarterly cash dividend of $0.03 per share, however,share. However, the Board of Directors may terminate or modify thisthe dividend program at any time without prior notice.ITEM 3. | QUANTITATIVE AND QUALITATIVE DISCLOSURE |
| | | | | | | | | | | |
| Nine Months Ended
September 30, |
| (in thousands) | 2021 | | 2020 |
| Dividend payments to stockholders | $ | 7,310 | | | $ | 7,206 | |
Contractual obligations
As of September 30, 2021, our contractual obligations were: | | | | | | | | | | | | | | | | | | | | | | | | | | | | | | | | | | | | | | | | | | | | | | | |
| Payments due by period | | |
| (in thousands) | Remainder of 2021 | | 2022 | | 2023 | | 2024 | | 2025 | | 2026 and thereafter | | Other | | Total |
Convertible senior notes (1) | $ | — | | | $ | 4,500 | | | $ | 4,500 | | | $ | 4,500 | | | $ | 601,488 | | | $ | — | | | $ | — | | | $ | 614,988 | |
Purchase obligations (2) | 7,386 | | | 64,810 | | | 18,361 | | | 5,271 | | | 429 | | | — | | | — | | | 96,257 | |
| Operating lease obligations | 961 | | | 9,948 | | | 19,607 | | | 16,482 | | | 13,607 | | | 58,381 | | | — | | | 118,986 | |
Liability for uncertain tax positions (3) | — | | | — | | | — | | | — | | | — | | | — | | | 1,677 | | | 1,677 | |
| $ | 8,347 | | | $ | 79,258 | | | $ | 42,468 | | | $ | 26,253 | | | $ | 615,524 | | | $ | 58,381 | | | $ | 1,677 | | | $ | 831,908 | |
(1) Includes principal and interest.
(2) Represents the fixed or minimum amounts due under purchase obligations for hosting services and sales and marketing programs.
(3) We are unable to reasonably estimate the timing of this cash outflow due to uncertainties in the timing of the effective settlement of tax positions.
ITEM 3. QUANTITATIVE AND QUALITATIVE DISCLOSURES ABOUT MARKET RISK
Market risk representsis the risk of loss that may affect us due tofrom adverse changes in financial market prices and rates.
Foreign currency exposure
Translation risk
Our
market risk exposure isinternational operations’ operating expenses are primarily
related to fluctuationsdenominated in foreign
exchange rates.Ascurrencies. However, our international sales are also primarily denominated in foreign currencies, which partially offsets our foreign currency exposure.
A hypothetical 10% strengthening in the U.S. dollar against other currencies would have resulted in: | | | | | | | | | | | |
| Nine Months Ended
September 30, |
| 2021 | | 2020 |
| (Decrease) increase in revenue | (4) | % | | (4) | % |
| (Decrease) increase in net (loss) | (9) | % | | (13) | % |
Remeasurement risk
We experience transaction gains and losses from the remeasurement of
September 30, 2017, we did not have any forward contracts outstanding. See Note 4 “Derivative Instruments” of this Quarterly Report on Form10-Q for further discussion.Othermonetary assets and liabilities denominated in currencies other than the item discussed above, there were no significantfunctional currency of the entities in which they are recorded.
We are primarily exposed to changes in foreign currency exchange rates associated with the Australian dollar, Euro, and U.S. dollar-denominated cash, cash equivalents, receivables, and intercompany balances held by our U.K. subsidiary, a British pound functional entity.
A hypothetical 10% strengthening in the British pound exchange rate in comparison to our quantitativethe Australian dollar, Euro, and qualitative disclosures about market risk duringU.S. dollar would have resulted in the first nine months ended September 30, 2017. See Part II, Item 7A. Quantitative and Qualitative Disclosures about Market Risk included in our Annual Report on Form10-K for the year ended December 31, 2016 for a more complete discussion of our market risk exposure.following impact: | | | | | | | | | | | |
| Nine Months Ended
September 30, |
| (in thousands) | 2021 | | 2020 |
| Foreign currency gain (loss) | $ | (4,480) | | | $ | (6,326) | |
ITEM 4. | CONTROLS AND PROCEDURES |
ITEM 4. CONTROLS AND PROCEDURES
(a) Evaluation of
Disclosure Controlsdisclosure controls and
Proceduresprocedures
Our management, with the participation of our Chief Executive Officer
or CEO,(“CEO”) and Chief Financial Officer
or CFO,(“CFO”), evaluated the effectiveness of our disclosure controls and procedures (as defined in Rules
13a-15(e) and
15d-15(e) under the Securities Exchange
Act)Act of 1934, as amended (“Exchange Act”)) as of September 30,
2017.2021. In designing and evaluating our disclosure controls and procedures, our management recognized that any controls and procedures, no matter how well designed and operated, can provide only reasonable assurance of achieving their objectives, and our management necessarily applied its judgment in evaluating the cost-benefit relationship of possible controls and procedures. Based on this evaluation, our CEO and CFO concluded that our disclosure controls and procedures were effective as of September 30,
2017.2021.
(b) Changes in
Internal Controlinternal control over
Financial Reportingfinancial reporting
There have been no changes in our internal control over financial reporting (as defined in Rules
13a-15(f) and
15d-15(f) under the
Securities Exchange Act) during the quarter ended September 30,
20172021 that have materially affected or are reasonably likely to materially affect our internal control over financial reporting.
PART
II—II - OTHER INFORMATION
ITEM 1A. RISK FACTORS
We encourage you to carefully consider the risk factors identified in
Part I, Item 1A. “Risk Factors”
inof our Annual Report on
Form 10-K for the year ended December 31,
2016.2020, filed with the U.S. Securities and Exchange Commission. These risk factors could materially affect our business, financial condition, and future results, and
couldmay cause our actual business and financial results to differ materially from those contained in forward-looking statements made in this Quarterly Report on Form
10-Q or elsewhere by
management from time to time. There have been no material changes during the nine months ended September 30, 2017 to the risk factors disclosed in our Annual Report on Form10-K for the year ended December 31, 2016.management.ITEM 2. | UNREGISTERED SALES OF EQUITY SECURITIES AND USE OF PROCEEDS |
The following table sets forth information regarding our repurchases
ITEM 2. UNREGISTERED SALES OF EQUITY SECURITIES AND USE OF PROCEEDS
Issuer purchases of our commonequity securities
Common stock duringrepurchased in the three months ended September 30, 2017: | | | | | | | | | | | | | | | | |
Period | | Total Number
of Shares
Purchased
(in thousands) | | | Average Price
Paid per
Share | | | Total Number of
Shares Purchased as Part
of Publicly Announced
Share Repurchase
Program (1)
(in thousands) | | | Approximate Dollar
Value of Shares That
May Yet Be Purchased at
Period End Under Publicly
Announced Share
Repurchased Programs (1)
(in thousands) | |
July 1, 2017 - July 31, 2017 | | | 12 | | | $ | 58.54 | | | | — | | | $ | 36,399 | |
August 1, 2017 - August 31, 2017 | | | 55 | | | | 56.16 | | | | — | | | | 36,399 | |
September 1, 2017 - September 30, 2017 | | | 108 | | | | 56.56 | | | | — | | | | 36,399 | |
| | | | | | | | | | | | | | | | |
Total | | | 175 | | | $ | 56.57 | | | | | | | | | |
| | | | | | | | | | | | | | | | |
1. | Shares withheld to cover the option exercise price and statutory tax withholding obligations under the net settlement provisions of the company’s stock compensation awards have been included in the above table. |
2. | Since 2004, our Board of Directors has approved stock repurchase programs that have authorized the repurchase, in the aggregate, of up to $195 million of our common stock. On May 30, 2017, we announced that our Board of Directors extended the expiration date of the current stock repurchase program to June 30, 2018 (the “Current Program”). Under the Current Program, purchases may be made from time to time on the open market or in privately negotiated transactions. Shares may be repurchased in such amounts2021: | | | | | | | | | | | | | | | | | | | | | | | | | (in thousands, except per share amounts) | Total Number of Shares Purchased (1) (2) | | Average Price Paid per Share (1) (2) | | Total Number of Shares Purchased as Part of Publicly Announced Share Repurchase Program (2) | | Approximate Dollar Value of Shares That May Yet Be Purchased at Period End Under Publicly Announced Share Repurchase Programs (2) | | July 1, 2021 - July 31, 2021 | 46 | | $ | 135.62 | | | 31 | | $ | 52,603 | | | August 1, 2021 - August 31, 2021 | 167 | | 130.67 | | | 34 | | $ | 48,204 | | | September 1, 2021 - September 30, 2021 | 160 | | 138.24 | | | 31 | | $ | 44,005 | | | 373 | | $ | 134.52 | | | 96 | | |
(1) Shares withheld to cover the option exercise price and tax withholding obligations under the net settlement provisions of our stock compensation awards have been included in these amounts. (2) On June 8, 2021, we announced that our Board of Directors extended the current stock repurchase program’s expiration date to June 30, 2022 and increased the remaining stock repurchase authority to $60 million. See "Liquidity and Capital Resources" in Item 2 of this Quarterly Report for additional information. ITEM 6. EXHIBITS | | | | | | | | | | | | | | | | | | | | | | | | | | | | | | | | | | Exhibit No. | | Description | | Incorporation by Reference | | Filed Herewith | | | Form | | Exhibit | | Filing Date | | | 3.1 | | | | 10-Q | | 3.1 | | November 4, 2014 | | | | 3.2 | | | | 8-K | | 3.2 | | June 15, 2020 | | | | 10.1 | | | | 10-Q | | 10.1 | | July 28, 2021 | | | | 10.2** | | | | 8-K | | 10.1 | | July 9, 2021 | | | | 31.1 | | | | | | | | | | X | | 31.2 | | | | | | | | | | X | | 32++ | | | | | | | | | | X | | 101.INS | | Inline XBRL Instance Document - the instance document does not appear in the Interactive Data File because its XBRL tags are embedded within the Inline XBRL document. | | | | | | | | X | | 101.SCH | | Inline XBRL Taxonomy Extension Schema Document. | | | | | | | | X | | 101.CAL | | Inline XBRL Taxonomy Calculation Linkbase Document. | | | | | | | | X | | 101.DEF | | Inline XBRL Taxonomy Extension Definition Linkbase Document. | | | | | | | | X | | 101.LAB | | Inline XBRL Taxonomy Label Linkbase Document. | | | | | | | | X | | 101.PRE | | Inline XBRL Taxonomy Presentation Linkbase Document. | | | | | | | | X | | 104 | | Cover Page Interactive Data File (formatted as Inline XBRL and contained in Exhibit 101) | | | | | | | | X |
++ Indicates that the exhibit is being furnished with this report and is not filed as market conditions warrant, subject to regulatory and other considerations. We have established apre-arranged stock repurchase plan, intended to comply with the requirements of Rule10b5-1 under the Securities Exchange Act of 1934, as amended (the “Exchange Act”), and Rule10b-18 under the Exchange Act (the“10b5-1 Plan”). All share repurchases under the Current Program during closed trading window periods will be made pursuant to the10b5-1 Plan. |
The following exhibits are filed or furnished, as the case may be, as part of it.
** Certain portions of this
report.EXHIBIT INDEX
++ | Management contracts and compensatory plan or arrangements |
exhibit are considered confidential and have been omitted as allowed under SEC rules and regulations.
Pursuant to the requirements of the Securities Exchange Act of 1934, the Registrant has duly caused this report to be signed on its behalf by the undersigned thereunto duly authorized. | | | | | | | | | | | |
| | | | Pegasystems Inc. |
| | | |
Date:Dated: | October 27, 2021 | November 8, 2017By: | | By: | | /s/ KENNETH STILLWELL |
| | | | | | Kenneth Stillwell |
| | | | | | Chief FinancialOperating Officer and Chief AdministrativeFinancial Officer |
| | | | | | (Principal Financial Officer) |
27