Index to Form
| Page | ||||||||
PART | ||||||||
Item 1. | ||||||||
Unaudited Condensed Consolidated Balance Sheets as of September 30, | ||||||||
| 2022 | ||||||||
| 2022 | ||||||||
Unaudited Condensed Consolidated Statements of Stockholders’ Equity for the nine months ended September 30, 2023 and 2022 | ||||||||
| Unaudited Condensed Consolidated Statements of Cash Flows for the nine months ended September 30, | ||||||||
Notes to Unaudited Condensed Consolidated Financial Statements | ||||||||
Item 2. Management’s Discussion and Analysis of Financial Condition and Results of Operations | ||||||||
Item 3. Quantitative and Qualitative Disclosures About Market Risk | ||||||||
| ||||||||
PART II - OTHER INFORMATION | ||||||||
| Item 1. Legal Proceedings | ||||||||
| Item 1A. Risk Factors | ||||||||
Item 2. Unregistered Sales of Equity Securities and Use of Proceeds | ||||||||
Item 5. Other Information | ||||||||
| Item 6. Exhibits | ||||||||
PEGASYSTEMS INC.
UNAUDITED CONDENSED CONSOLIDATED BALANCE SHEETS
(in thousands)
| September 30, 2017 | December 31, 2016 | |||||||
Assets | ||||||||
Current assets: | ||||||||
Cash and cash equivalents | $ | 130,568 | $ | 70,594 | ||||
Marketable securities | 63,812 | 63,167 | ||||||
|
|
|
| |||||
Total cash, cash equivalents, and marketable securities | 194,380 | 133,761 | ||||||
Trade accounts receivable, net of allowance of $6,189 and $4,126 | 191,161 | 265,028 | ||||||
Income taxes receivable | 34,864 | 14,155 | ||||||
Other current assets | 17,679 | 12,188 | ||||||
|
|
|
| |||||
Total current assets | 438,084 | 425,132 | ||||||
Property and equipment, net | 39,849 | 38,281 | ||||||
Deferred income taxes | 73,459 | 69,898 | ||||||
Long-term other assets | 5,982 | 3,990 | ||||||
Intangible assets, net | 34,755 | 44,191 | ||||||
Goodwill | 72,941 | 73,164 | ||||||
|
|
|
| |||||
Total assets | $ | 665,070 | $ | 654,656 | ||||
|
|
|
| |||||
Liabilities and Stockholders’ Equity | ||||||||
Current liabilities: | ||||||||
Accounts payable | $ | 12,535 | $ | 14,414 | ||||
Accrued expenses | 39,681 | 36,751 | ||||||
Accrued compensation and related expenses | 53,869 | 60,660 | ||||||
Deferred revenue | 160,931 | 175,647 | ||||||
|
|
|
| |||||
Total current liabilities | 267,016 | 287,472 | ||||||
Income taxes payable | 4,774 | 4,263 | ||||||
Long-term deferred revenue | 6,130 | 10,989 | ||||||
Other long-term liabilities | 15,449 | 16,043 | ||||||
|
|
|
| |||||
Total liabilities | 293,369 | 318,767 | ||||||
|
|
|
| |||||
Stockholders’ equity: | ||||||||
Preferred stock, 1,000 shares authorized; no shares issued and outstanding | — | — | ||||||
Common stock, 200,000 shares authorized; 77,839 shares and 76,591 shares issued and outstanding | 778 | 766 | ||||||
Additionalpaid-in capital | 146,728 | 143,903 | ||||||
Retained earnings | 227,953 | 198,315 | ||||||
Accumulated other comprehensive loss | (3,758 | ) | (7,095 | ) | ||||
|
|
|
| |||||
Total stockholders’ equity | 371,701 | 335,889 | ||||||
|
|
|
| |||||
Total liabilities and stockholders’ equity | $ | 665,070 | $ | 654,656 | ||||
|
|
|
| |||||
PEGASYSTEMS INC. UNAUDITED CONDENSED CONSOLIDATED BALANCE SHEETS (in thousands) | |||||||||||
| September 30, 2023 | December 31, 2022 | ||||||||||
| Assets | |||||||||||
| Current assets: | |||||||||||
| Cash and cash equivalents | $ | 169,023 | $ | 145,054 | |||||||
| Marketable securities | 167,286 | 152,167 | |||||||||
| Total cash, cash equivalents, and marketable securities | 336,309 | 297,221 | |||||||||
| Accounts receivable, net | 168,795 | 255,150 | |||||||||
| Unbilled receivables, net | 199,948 | 213,719 | |||||||||
| Other current assets | 71,438 | 80,388 | |||||||||
| Total current assets | 776,490 | 846,478 | |||||||||
| Unbilled receivables, net | 73,795 | 95,806 | |||||||||
| Goodwill | 81,437 | 81,399 | |||||||||
| Other long-term assets | 290,807 | 333,989 | |||||||||
| Total assets | $ | 1,222,529 | $ | 1,357,672 | |||||||
| Liabilities and stockholders’ equity | |||||||||||
| Current liabilities: | |||||||||||
| Accounts payable | $ | 20,541 | $ | 18,195 | |||||||
| Accrued expenses | 43,624 | 50,355 | |||||||||
| Accrued compensation and related expenses | 93,511 | 127,728 | |||||||||
| Deferred revenue | 297,067 | 325,212 | |||||||||
| Other current liabilities | 18,038 | 17,450 | |||||||||
| Total current liabilities | 472,781 | 538,940 | |||||||||
| Convertible senior notes, net | 498,753 | 593,609 | |||||||||
| Operating lease liabilities | 68,874 | 79,152 | |||||||||
| Other long-term liabilities | 14,485 | 15,128 | |||||||||
| Total liabilities | 1,054,893 | 1,226,829 | |||||||||
| Commitments and contingencies (Note 15) | |||||||||||
| Stockholders’ equity: | |||||||||||
| Preferred stock, 1,000 shares authorized; none issued | — | — | |||||||||
Common stock, 200,000 shares authorized; 83,523 and 82,436 shares issued and outstanding at September 30, 2023 and December 31, 2022, respectively | 835 | 824 | |||||||||
| Additional paid-in capital | 343,259 | 229,602 | |||||||||
| Accumulated deficit | (151,370) | (76,513) | |||||||||
| Accumulated other comprehensive (loss) | (25,088) | (23,070) | |||||||||
| Total stockholders’ equity | 167,636 | 130,843 | |||||||||
| Total liabilities and stockholders’ equity | $ | 1,222,529 | $ | 1,357,672 | |||||||
PEGASYSTEMS INC.
UNAUDITED CONDENSED CONSOLIDATED STATEMENTS OF OPERATIONS
(in thousands, except per share amounts)
| Three Months Ended September 30, | Nine Months Ended September 30, | |||||||||||||||
| 2017 | 2016 | 2017 | 2016 | |||||||||||||
Revenue: | ||||||||||||||||
Software license | $ | 41,793 | $ | 68,833 | $ | 195,220 | $ | 207,849 | ||||||||
Maintenance | 62,204 | 55,038 | 180,759 | 163,174 | ||||||||||||
Services | 75,818 | 58,931 | 225,063 | 179,633 | ||||||||||||
|
|
|
|
|
|
|
| |||||||||
Total revenue | 179,815 | 182,802 | 601,042 | 550,656 | ||||||||||||
|
|
|
|
|
|
|
| |||||||||
Cost of revenue: | ||||||||||||||||
Software license | 1,276 | 1,313 | 3,826 | 3,646 | ||||||||||||
Maintenance | 6,716 | 6,659 | 20,945 | 18,889 | ||||||||||||
Services | 61,739 | 52,465 | 180,925 | 154,512 | ||||||||||||
|
|
|
|
|
|
|
| |||||||||
Total cost of revenue | 69,731 | 60,437 | 205,696 | 177,047 | ||||||||||||
|
|
|
|
|
|
|
| |||||||||
Gross profit | 110,084 | 122,365 | 395,346 | 373,609 | ||||||||||||
|
|
|
|
|
|
|
| |||||||||
Operating expenses: | ||||||||||||||||
Selling and marketing | 70,209 | 67,032 | 217,384 | 202,126 | ||||||||||||
Research and development | 41,031 | 38,036 | 121,089 | 108,530 | ||||||||||||
General and administrative | 13,133 | 11,725 | 38,174 | 34,067 | ||||||||||||
Acquisition-related | — | 74 | — | 2,903 | ||||||||||||
|
|
|
|
|
|
|
| |||||||||
Total operating expenses | 124,373 | 116,867 | 376,647 | 347,626 | ||||||||||||
|
|
|
|
|
|
|
| |||||||||
(Loss)/income from operations | (14,289 | ) | 5,498 | 18,699 | 25,983 | |||||||||||
Foreign currency transaction (loss)/gain | (552 | ) | 1,082 | (793 | ) | 2,764 | ||||||||||
Interest income, net | 144 | 172 | 470 | 650 | ||||||||||||
Other income/(expense), net | — | (1,237 | ) | 287 | (4,891 | ) | ||||||||||
|
|
|
|
|
|
|
| |||||||||
(Loss)/income before (benefit)/provision for income taxes | (14,697 | ) | 5,515 | 18,663 | 24,506 | |||||||||||
(Benefit)/provision for income taxes | (12,885 | ) | 2,214 | (17,952 | ) | 6,269 | ||||||||||
|
|
|
|
|
|
|
| |||||||||
Net (loss)/income | $ | (1,812 | ) | $ | 3,301 | $ | 36,615 | $ | 18,237 | |||||||
|
|
|
|
|
|
|
| |||||||||
(Loss)/earnings per share: | ||||||||||||||||
Basic | (0.03 | ) | 0.04 | 0.47 | 0.24 | |||||||||||
Diluted | (0.03 | ) | 0.04 | 0.44 | 0.23 | |||||||||||
Weighted-average number of common shares outstanding: | ||||||||||||||||
Basic | 77,691 | 76,278 | 77,258 | 76,323 | ||||||||||||
Diluted | 77,691 | 79,548 | 82,717 | 79,401 | ||||||||||||
Cash dividends declared per share | $ | 0.03 | $ | 0.03 | $ | 0.09 | $ | 0.09 | ||||||||
PEGASYSTEMS INC. UNAUDITED CONDENSED CONSOLIDATED STATEMENTS OF OPERATIONS (in thousands, except per share amounts) | |||||||||||||||||||||||
| Three Months Ended September 30, | Nine Months Ended September 30, | ||||||||||||||||||||||
| 2023 | 2022 | 2023 | 2022 | ||||||||||||||||||||
| Revenue | |||||||||||||||||||||||
| Subscription services | $ | 201,578 | $ | 174,885 | $ | 586,192 | $ | 516,750 | |||||||||||||||
| Subscription license | 74,342 | 31,112 | 200,066 | 210,245 | |||||||||||||||||||
| Consulting | 55,976 | 55,511 | 167,396 | 175,451 | |||||||||||||||||||
| Perpetual license | 2,747 | 9,223 | 4,729 | 18,929 | |||||||||||||||||||
| Total revenue | 334,643 | 270,731 | 958,383 | 921,375 | |||||||||||||||||||
| Cost of revenue | |||||||||||||||||||||||
| Subscription services | 35,906 | 34,541 | 109,553 | 103,104 | |||||||||||||||||||
| Subscription license | 629 | 628 | 1,971 | 1,923 | |||||||||||||||||||
| Consulting | 57,204 | 57,778 | 176,262 | 171,162 | |||||||||||||||||||
| Perpetual license | 24 | 103 | 51 | 173 | |||||||||||||||||||
| Total cost of revenue | 93,763 | 93,050 | 287,837 | 276,362 | |||||||||||||||||||
| Gross profit | 240,880 | 177,681 | 670,546 | 645,013 | |||||||||||||||||||
| Operating expenses | |||||||||||||||||||||||
| Selling and marketing | 131,598 | 153,517 | 425,253 | 472,951 | |||||||||||||||||||
| Research and development | 74,955 | 75,342 | 224,262 | 221,173 | |||||||||||||||||||
| General and administrative | 27,321 | 26,043 | 73,893 | 94,530 | |||||||||||||||||||
| Restructuring | 17,822 | — | 21,450 | — | |||||||||||||||||||
| Total operating expenses | 251,696 | 254,902 | 744,858 | 788,654 | |||||||||||||||||||
| (Loss) from operations | (10,816) | (77,221) | (74,312) | (143,641) | |||||||||||||||||||
| Foreign currency transaction gain (loss) | 1,994 | 3,826 | (3,971) | 8,415 | |||||||||||||||||||
| Interest income | 2,532 | 520 | 5,831 | 1,036 | |||||||||||||||||||
| Interest expense | (1,533) | (1,992) | (5,229) | (5,882) | |||||||||||||||||||
| (Loss) on capped call transactions | (2,294) | (6,876) | (449) | (56,381) | |||||||||||||||||||
| Other income (loss), net | 6,383 | (29) | 18,668 | 6,497 | |||||||||||||||||||
| (Loss) before provision for income taxes | (3,734) | (81,772) | (59,462) | (189,956) | |||||||||||||||||||
| Provision for income taxes | 3,545 | 11,748 | 15,395 | 190,239 | |||||||||||||||||||
| Net (loss) | $ | (7,279) | $ | (93,520) | $ | (74,857) | $ | (380,195) | |||||||||||||||
| (Loss) per share | |||||||||||||||||||||||
| Basic | $ | (0.09) | $ | (1.14) | $ | (0.90) | $ | (4.65) | |||||||||||||||
| Diluted | $ | (0.09) | $ | (1.14) | $ | (0.90) | $ | (4.65) | |||||||||||||||
| Weighted-average number of common shares outstanding | |||||||||||||||||||||||
| Basic | 83,336 | 81,996 | 82,996 | 81,842 | |||||||||||||||||||
| Diluted | 83,336 | 81,996 | 82,996 | 81,842 | |||||||||||||||||||
PEGASYSTEMS INC.
UNAUDITED CONDENSED CONSOLIDATED STATEMENTS OF COMPREHENSIVE INCOME
(in thousands)
| Three Months Ended September 30, | Nine Months Ended September 30, | |||||||||||||||
| 2017 | 2016 | 2017 | 2016 | |||||||||||||
Net (loss)/income | $ | (1,812 | ) | $ | 3,301 | $ | 36,615 | $ | 18,237 | |||||||
Other comprehensive income/(loss), net of tax | ||||||||||||||||
Unrealized gain/(loss) onavailable-for-sale marketable securities, net of tax | 22 | (174 | ) | 148 | 168 | |||||||||||
Foreign currency translation adjustments | 549 | (169 | ) | 3,189 | (1,400 | ) | ||||||||||
|
|
|
|
|
|
|
| |||||||||
Total other comprehensive income/(loss), net of tax | 571 | (343 | ) | 3,337 | (1,232 | ) | ||||||||||
|
|
|
|
|
|
|
| |||||||||
Comprehensive (loss)/income | $ | (1,241 | ) | $ | 2,958 | $ | 39,952 | $ | 17,005 | |||||||
|
|
|
|
|
|
|
| |||||||||
PEGASYSTEMS INC. UNAUDITED CONDENSED CONSOLIDATED STATEMENTS OF COMPREHENSIVE (LOSS) (in thousands) | |||||||||||||||||||||||
| Three Months Ended September 30, | Nine Months Ended September 30, | ||||||||||||||||||||||
| 2023 | 2022 | 2023 | 2022 | ||||||||||||||||||||
| Net (loss) | $ | (7,279) | $ | (93,520) | $ | (74,857) | $ | (380,195) | |||||||||||||||
| Other comprehensive (loss), net of tax | |||||||||||||||||||||||
| Unrealized (loss) on available-for-sale securities | (40) | (73) | (281) | (1,000) | |||||||||||||||||||
| Foreign currency translation adjustments | (3,687) | (6,700) | (1,737) | (20,936) | |||||||||||||||||||
| Total other comprehensive (loss), net of tax | (3,727) | (6,773) | (2,018) | (21,936) | |||||||||||||||||||
| Comprehensive (loss) | $ | (11,006) | $ | (100,293) | $ | (76,875) | $ | (402,131) | |||||||||||||||
PEGASYSTEMS INC.
UNAUDITED CONDENSED CONSOLIDATED STATEMENTS OF CASH FLOWS
(in thousands)
| Nine Months Ended September 30, | ||||||||
| 2017 | 2016 | |||||||
Operating activities: | ||||||||
Net income | $ | 36,615 | $ | 18,237 | ||||
Adjustments to reconcile net income to cash provided by operating activities: | ||||||||
Deferred income taxes | (2,607 | ) | (2,841 | ) | ||||
Depreciation and amortization | 18,703 | 17,896 | ||||||
Stock-based compensation expense | 39,929 | 30,634 | ||||||
Foreign currency transaction loss/(gain) | 793 | (2,764 | ) | |||||
Othernon-cash | (89 | ) | 153 | |||||
Change in operating assets and liabilities: | ||||||||
Trade accounts receivable | 80,580 | 3,940 | ||||||
Income taxes receivable and other current assets | (25,943 | ) | (11,904 | ) | ||||
Accounts payable and accrued expenses | (8,546 | ) | (16,678 | ) | ||||
Deferred revenue | (25,639 | ) | (17,698 | ) | ||||
Other long-term assets and liabilities | 130 | 1,581 | ||||||
|
|
|
| |||||
Cash provided by operating activities | 113,926 | 20,556 | ||||||
Investing activities: | ||||||||
Purchases of marketable securities | (25,687 | ) | (22,614 | ) | ||||
Proceeds from maturities and called marketable securities | 23,124 | 21,838 | ||||||
Sales of marketable securities | — | 62,283 | ||||||
Payments for acquisitions, net of cash acquired | (297 | ) | (49,113 | ) | ||||
Investment in property and equipment | (9,106 | ) | (15,253 | ) | ||||
|
|
|
| |||||
Cash used in investing activities | (11,966 | ) | (2,859 | ) | ||||
Financing activities: | ||||||||
Dividend payments to shareholders | (6,941 | ) | (6,883 | ) | ||||
Common stock repurchases for tax withholdings for net settlement of equity awards | (34,113 | ) | (10,398 | ) | ||||
Common stock repurchases under share repurchase programs | (2,986 | ) | (25,750 | ) | ||||
|
|
|
| |||||
Cash used in financing activities | (44,040 | ) | (43,031 | ) | ||||
Effect of exchange rates on cash and cash equivalents | 2,054 | (1,309 | ) | |||||
|
|
|
| |||||
Net increase/(decrease) in cash and cash equivalents | 59,974 | (26,643 | ) | |||||
Cash and cash equivalents, beginning of period | 70,594 | 93,026 | ||||||
|
|
|
| |||||
Cash and cash equivalents, end of period | $ | 130,568 | $ | 66,383 | ||||
|
|
|
| |||||
| PEGASYSTEMS INC. UNAUDITED CONDENSED CONSOLIDATED STATEMENTS OF STOCKHOLDERS’ EQUITY (in thousands, except per share amounts) | |||||||||||||||||||||||||||||||||||
| Common Stock | Additional Paid-In Capital | Retained Earnings (Accumulated Deficit) | Accumulated Other Comprehensive (Loss) | Total Stockholders’ Equity | |||||||||||||||||||||||||||||||
| Number of Shares | Amount | ||||||||||||||||||||||||||||||||||
| December 31, 2021 | 81,712 | $ | 817 | $ | 145,810 | $ | 276,449 | $ | (6,988) | $ | 416,088 | ||||||||||||||||||||||||
| Repurchase of common stock | (242) | (2) | (22,581) | — | — | (22,583) | |||||||||||||||||||||||||||||
| Issuance of common stock for stock compensation plans | 297 | 3 | (12,131) | — | — | (12,128) | |||||||||||||||||||||||||||||
| Issuance of common stock under the employee stock purchase plan | 35 | — | 2,446 | — | — | 2,446 | |||||||||||||||||||||||||||||
| Stock-based compensation | — | — | 28,227 | — | — | 28,227 | |||||||||||||||||||||||||||||
| Cash dividends declared ($0.03 per share) | — | — | — | (2,455) | — | (2,455) | |||||||||||||||||||||||||||||
| Other comprehensive (loss) | — | — | — | — | (2,548) | (2,548) | |||||||||||||||||||||||||||||
| Net (loss) | — | — | — | (379) | — | (379) | |||||||||||||||||||||||||||||
| March 31, 2022 | 81,802 | $ | 818 | $ | 141,771 | $ | 273,615 | $ | (9,536) | $ | 406,668 | ||||||||||||||||||||||||
| Repurchase of common stock | (38) | — | (1,925) | — | — | (1,925) | |||||||||||||||||||||||||||||
| Issuance of common stock for stock compensation plans | 117 | 1 | (3,252) | — | — | (3,251) | |||||||||||||||||||||||||||||
| Issuance of common stock under the employee stock purchase plan | 59 | — | 2,357 | — | — | 2,357 | |||||||||||||||||||||||||||||
| Stock-based compensation | — | — | 31,300 | — | — | 31,300 | |||||||||||||||||||||||||||||
| Cash dividends declared ($0.03 per share) | — | — | — | (2,459) | — | (2,459) | |||||||||||||||||||||||||||||
| Other comprehensive (loss) | — | — | — | — | (12,615) | (12,615) | |||||||||||||||||||||||||||||
| Net (loss) | — | — | — | (286,296) | — | (286,296) | |||||||||||||||||||||||||||||
| June 30, 2022 | 81,940 | $ | 819 | $ | 170,251 | $ | (15,140) | $ | (22,151) | $ | 133,779 | ||||||||||||||||||||||||
| Issuance of common stock for stock compensation plans | 138 | 2 | (2,198) | — | — | (2,196) | |||||||||||||||||||||||||||||
| Issuance of common stock under the employee stock purchase plan | 86 | 1 | 2,362 | — | — | 2,363 | |||||||||||||||||||||||||||||
| Stock-based compensation | — | — | 33,774 | — | — | 33,774 | |||||||||||||||||||||||||||||
| Cash dividends declared ($0.03 per share) | — | — | — | (2,466) | — | (2,466) | |||||||||||||||||||||||||||||
| Other comprehensive (loss) | — | — | — | — | (6,773) | (6,773) | |||||||||||||||||||||||||||||
| Net (loss) | — | — | — | (93,520) | — | (93,520) | |||||||||||||||||||||||||||||
| September 30, 2022 | 82,164 | $ | 822 | $ | 204,189 | $ | (111,126) | $ | (28,924) | $ | 64,961 | ||||||||||||||||||||||||
| PEGASYSTEMS INC. UNAUDITED CONDENSED CONSOLIDATED STATEMENTS OF STOCKHOLDERS’ EQUITY (in thousands, except per share amounts) | |||||||||||||||||||||||||||||||||||
| Common Stock | Additional Paid-In Capital | Retained Earnings (Accumulated Deficit) | Accumulated Other Comprehensive (Loss) | Total Stockholders’ Equity | |||||||||||||||||||||||||||||||
| Number of Shares | Amount | ||||||||||||||||||||||||||||||||||
| December 31, 2022 | 82,436 | $ | 824 | $ | 229,602 | $ | (76,513) | $ | (23,070) | $ | 130,843 | ||||||||||||||||||||||||
| Issuance of common stock for stock compensation plans | 452 | 4 | 668 | — | — | 672 | |||||||||||||||||||||||||||||
| Issuance of common stock under the employee stock purchase plan | 52 | 1 | 2,142 | — | — | 2,143 | |||||||||||||||||||||||||||||
| Stock-based compensation | — | — | 42,557 | — | — | 42,557 | |||||||||||||||||||||||||||||
| Cash dividends declared ($0.03 per share) | — | — | (2,488) | — | — | (2,488) | |||||||||||||||||||||||||||||
| Other comprehensive income | — | — | — | — | 1,543 | 1,543 | |||||||||||||||||||||||||||||
| Net (loss) | — | — | — | (20,774) | — | (20,774) | |||||||||||||||||||||||||||||
| March 31, 2023 | 82,940 | $ | 829 | $ | 272,481 | $ | (97,287) | $ | (21,527) | $ | 154,496 | ||||||||||||||||||||||||
| Issuance of common stock for stock compensation plans | 225 | 2 | 1,824 | — | — | 1,826 | |||||||||||||||||||||||||||||
| Issuance of common stock under the employee stock purchase plan | 47 | 1 | 1,980 | — | — | 1,981 | |||||||||||||||||||||||||||||
| Stock-based compensation | — | — | 36,227 | — | — | 36,227 | |||||||||||||||||||||||||||||
| Cash dividends declared ($0.03 per share) | — | — | (2,496) | — | — | (2,496) | |||||||||||||||||||||||||||||
| Other comprehensive income | — | — | — | — | 166 | 166 | |||||||||||||||||||||||||||||
| Net (loss) | — | — | — | (46,804) | — | (46,804) | |||||||||||||||||||||||||||||
| June 30, 2023 | 83,212 | $ | 832 | $ | 310,016 | $ | (144,091) | $ | (21,361) | $ | 145,396 | ||||||||||||||||||||||||
| Issuance of common stock for stock compensation plans | 257 | 3 | 2,447 | — | — | 2,450 | |||||||||||||||||||||||||||||
| Issuance of common stock under the employee stock purchase plan | 54 | — | 2,003 | — | — | 2,003 | |||||||||||||||||||||||||||||
| Stock-based compensation | — | — | 31,299 | — | — | 31,299 | |||||||||||||||||||||||||||||
| Cash dividends declared ($0.03 per share) | — | — | (2,506) | — | — | (2,506) | |||||||||||||||||||||||||||||
| Other comprehensive (loss) | — | — | — | — | (3,727) | (3,727) | |||||||||||||||||||||||||||||
| Net (loss) | — | — | — | (7,279) | — | (7,279) | |||||||||||||||||||||||||||||
| September 30, 2023 | 83,523 | $ | 835 | $ | 343,259 | $ | (151,370) | $ | (25,088) | $ | 167,636 | ||||||||||||||||||||||||
PEGASYSTEMS INC. UNAUDITED CONDENSED CONSOLIDATED STATEMENTS OF CASH FLOWS (in thousands) | |||||||||||
| Nine Months Ended September 30, | |||||||||||
| 2023 | 2022 | ||||||||||
| Operating activities | |||||||||||
| Net (loss) | $ | (74,857) | $ | (380,195) | |||||||
| Adjustments to reconcile net (loss) to cash provided by (used in) operating activities | |||||||||||
| Stock-based compensation | 110,083 | 93,301 | |||||||||
| Deferred income taxes | (188) | 169,489 | |||||||||
| Loss on capped call transactions | 449 | 56,381 | |||||||||
| Amortization of deferred commissions | 43,974 | 39,752 | |||||||||
| Lease expense | 12,018 | 11,500 | |||||||||
| Amortization of intangible assets and depreciation | 14,181 | 12,381 | |||||||||
| Foreign currency transaction loss (gain) | 3,971 | (8,415) | |||||||||
| Other non-cash | (16,487) | (1,705) | |||||||||
| Change in operating assets and liabilities, net | 44,776 | (5,935) | |||||||||
| Cash provided by (used in) operating activities | 137,920 | (13,446) | |||||||||
| Investing activities | |||||||||||
| Purchases of investments | (190,466) | (39,056) | |||||||||
| Proceeds from maturities and called investments | 169,836 | 53,952 | |||||||||
| Sales of investments | 10,725 | 18,415 | |||||||||
| Payments for acquisitions, net of cash acquired | — | (922) | |||||||||
| Investment in property and equipment | (14,271) | (22,285) | |||||||||
| Cash (used in) provided by investing activities | (24,176) | 10,104 | |||||||||
| Financing activities | |||||||||||
| Repurchases of convertible senior notes | (88,989) | — | |||||||||
| Dividend payments to stockholders | (7,458) | (7,368) | |||||||||
| Proceeds from employee stock purchase plan | 6,127 | 7,166 | |||||||||
| Proceeds from stock option exercises | 6,602 | — | |||||||||
| Common stock repurchases | (1,654) | (43,282) | |||||||||
| Other | 341 | — | |||||||||
| Cash (used in) financing activities | (85,031) | (43,484) | |||||||||
| Effect of exchange rate changes on cash, cash equivalents, and restricted cash | (1,621) | (5,513) | |||||||||
| Net increase (decrease) in cash, cash equivalents, and restricted cash | 27,092 | (52,339) | |||||||||
| Cash, cash equivalents, and restricted cash, beginning of period | 145,054 | 159,965 | |||||||||
| Cash, cash equivalents, and restricted cash, end of period | $ | 172,146 | $ | 107,626 | |||||||
| Cash and cash equivalents | $ | 169,023 | $ | 107,626 | |||||||
| Restricted cash included in other long-term assets | 3,123 | — | |||||||||
| Total cash, cash equivalents, and restricted cash | $ | 172,146 | $ | 107,626 | |||||||
2022.
| September 30, 2023 | December 31, 2022 | ||||||||||||||||||||||||||||||||||||||||||||||
| (in thousands) | Amortized Cost | Unrealized Gains | Unrealized Losses | Fair Value | Amortized Cost | Unrealized Gains | Unrealized Losses | Fair Value | |||||||||||||||||||||||||||||||||||||||
| Government debt | $ | 17,931 | $ | — | $ | (18) | $ | 17,913 | $ | 2,960 | $ | — | $ | (52) | $ | 2,908 | |||||||||||||||||||||||||||||||
| Corporate debt | 149,927 | — | (554) | 149,373 | 151,906 | — | (2,647) | 149,259 | |||||||||||||||||||||||||||||||||||||||
| $ | 167,858 | $ | — | $ | (572) | $ | 167,286 | $ | 154,866 | $ | — | $ | (2,699) | $ | 152,167 | ||||||||||||||||||||||||||||||||
| (in thousands) | September 30, 2023 | December 31, 2022 | |||||||||
| Accounts receivable, net | $ | 168,795 | $ | 255,150 | |||||||
| Unbilled receivables, net | 199,948 | 213,719 | |||||||||
| Long-term unbilled receivables, net | 73,795 | 95,806 | |||||||||
| $ | 442,538 | $ | 564,675 | ||||||||
2. NEW ACCOUNTING PRONOUNCEMENTS
Stock-Based Compensation
In May 2017, the Financial Accounting Standards Board (“FASB”) issued Accounting Standards Update (“ASU”)No. 2017-09 “Stock Compensation (Topic 718), Scope of Modification Accounting” to clarify when to account for a changewhich revenue recognition precedes billing. Billing is solely subject to the terms or conditionspassage of a share-based payment award as a modification. Under the new guidance, modification accounting is required only if the fair value, the vesting conditions, or the classification of the award (as equity or liability) changes as a result of the change in terms or conditions. Thetime.
| (Dollars in thousands) | September 30, 2023 | |||||||
| 1 year or less | $ | 199,948 | 73 | % | ||||
| 1-2 years | 58,604 | 21 | % | |||||
| 2-5 years | 15,191 | 6 | % | |||||
| $ | 273,743 | 100 | % | |||||
Financial Instruments
In June 2016, the FASB issued ASUNo. 2016-13, “Financial Instruments—Credit Losses (Topic 326): Measurement of Credit Losses on Financial Instruments,” which requires measurement and recognition of expected credit losses for financial assets measured at amortized cost, including trade accounts receivable, upon initial recognition of that financial asset using a forward-looking expected loss model, rather than an incurred loss model for credit losses. Credit losses relating toavailable-for-sale debt securities should be recorded through an allowance for credit losses when the fair value is below the amortized cost of the asset, removing the concept of “other-than-temporary” impairments. The effective date for the Company will be January 1, 2020, with early adoption permitted. The Company is currently evaluating the effect this ASU will have on its consolidated financial statements and related disclosures.
Leases
In February 2016, the FASB issued ASUNo. 2016-02, “Leases (Topic 842),” which requires lessees to record most leases on their balance sheets, recognizing a lease liability for the obligation to make lease payments and aright-of-use asset for the right to use the underlying asset for the lease term. The effective date for the Company will be January 1, 2019, with early adoption permitted. The Company expects that most of its operating lease commitments will be subject to this ASU and recognized as operating lease liabilities andright-of-use assets upon adoption with no material impact to its results of operations and cash flows.
Revenue
In May 2014, the FASB issued ASUNo. 2014-09, “Revenue from Contracts with Customers (Topic 606)”. This ASU amends the guidance for revenue recognition, creating the new Accounting Standards Codification Topic 606 (“ASC 606”). ASC 606 requires entities to apportion consideration from contracts to performance obligations on a relative standalone selling price basis, based on a five-step model. Under ASC 606, revenue is recognized when a customer obtains control of a promised good or service and is recognized in an amount that reflects the consideration which the entity expects to receive in exchange for the good or service. In addition, ASC 606 requires disclosure of the nature, amount, timing, and uncertainty of revenue and cash flows arising from contracts with customers.
The Company has elected the full retrospective adoption model, effective January 1, 2018. The Company’s quarterly results beginning with the quarter ending March 31, 2018 and comparative prior periods will be compliant with ASC 606. The Company’s Annual Report on Form10-K for the year ended December 31, 2018 will be the Company’s first Annual Report that will be issued in compliance with ASC 606.
date:
| (Dollars in thousands) | September 30, 2023 | |||||||
| 2023 | $ | 90,227 | 33 | % | ||||
| 2022 | 92,065 | 34 | % | |||||
| 2021 | 62,729 | 23 | % | |||||
| 2020 | 19,820 | 7 | % | |||||
| 2019 and prior | 8,902 | 3 | % | |||||
| $ | 273,743 | 100 | % | |||||
The Company has made significant progress on quantifying
The Company expects the following impacts:
| (in thousands) | September 30, 2023 | December 31, 2022 | |||||||||
Contract assets (1) | $ | 13,263 | $ | 17,546 | |||||||
Long-term contract assets (2) | 10,732 | 16,470 | |||||||||
| $ | 23,995 | $ | 34,016 | ||||||||
| (in thousands) | September 30, 2023 | December 31, 2022 | |||||||||
| Deferred revenue | $ | 297,067 | $ | 325,212 | |||||||
Long-term deferred revenue (1) | 2,605 | 3,552 | |||||||||
| $ | 299,672 | $ | 328,764 | ||||||||
| (in thousands) | September 30, 2023 | December 31, 2022 | |||||||||
Deferred commissions (1) | $ | 107,399 | $ | 130,195 | |||||||
| Three Months Ended September 30, | Nine Months Ended September 30, | ||||||||||||||||||||||
| (in thousands) | 2023 | 2022 | 2023 | 2022 | |||||||||||||||||||
Amortization of deferred commissions (1) | $ | 14,947 | $ | 11,597 | $ | 43,974 | $ | 39,752 | |||||||||||||||
| Nine Months Ended September 30, | |||||||||||
| (in thousands) | 2023 | 2022 | |||||||||
| January 1, | $ | 81,399 | $ | 81,923 | |||||||
| Currency translation adjustments | 38 | (722) | |||||||||
| September 30, | $ | 81,437 | $ | 81,201 | |||||||
| September 30, 2023 | |||||||||||||||||||||||
| (in thousands) | Useful Lives | Cost | Accumulated Amortization | Net Book Value (1) | |||||||||||||||||||
| Client-related | 4-10 years | $ | 63,086 | $ | (59,661) | $ | 3,425 | ||||||||||||||||
| Technology | 2-10 years | 68,103 | (63,579) | 4,524 | |||||||||||||||||||
| Other | 1-5 years | 5,361 | (5,361) | — | |||||||||||||||||||
| $ | 136,550 | $ | (128,601) | $ | 7,949 | ||||||||||||||||||
3. MARKETABLE SECURITIES
The Company’s marketable securities are as follows:
| (in thousands) | Amortized Cost | Unrealized Gains | Unrealized Losses | Fair Value | ||||||||||||
September 30, 2017 | ||||||||||||||||
Municipal bonds | $ | 32,764 | $ | 12 | �� | $ | (17 | ) | $ | 32,759 | ||||||
Corporate bonds | 31,079 | 12 | (38 | ) | 31,053 | |||||||||||
|
|
|
|
|
|
|
| |||||||||
| $ | 63,843 | $ | 24 | $ | (55 | ) | $ | 63,812 | ||||||||
|
|
|
|
|
|
|
| |||||||||
December 31, 2016 | ||||||||||||||||
Municipal bonds | $ | 36,746 | $ | — | $ | (139 | ) | $ | 36,607 | |||||||
Corporate bonds | 26,610 | 1 | (51 | ) | 26,560 | |||||||||||
|
|
|
|
|
|
|
| |||||||||
| $ | 63,356 | $ | 1 | $ | (190 | ) | $ | 63,167 | ||||||||
|
|
|
|
|
|
|
| |||||||||
As
| December 31, 2022 | |||||||||||||||||||||||
| (in thousands) | Useful Lives | Cost | Accumulated Amortization | Net Book Value (1) | |||||||||||||||||||
| Client-related | 4-10 years | $ | 63,076 | $ | (58,623) | $ | 4,453 | ||||||||||||||||
| Technology | 2-10 years | 68,056 | (61,621) | 6,435 | |||||||||||||||||||
| Other | 1-5 years | 5,361 | (5,361) | — | |||||||||||||||||||
| $ | 136,493 | $ | (125,605) | $ | 10,888 | ||||||||||||||||||
| (in thousands) | September 30, 2023 | ||||
| Remainder of 2023 | $ | 964 | |||
| 2024 | 3,169 | ||||
| 2025 | 2,615 | ||||
| 2026 | 874 | ||||
| 2027 | 327 | ||||
| $ | 7,949 | ||||
As of September 30, 2017, remaining maturities of marketable debt securities ranged from October 2017 to September 2020, with a weighted-average remaining maturity of approximately 14 months.
4. DERIVATIVE INSTRUMENTS
In May 2017, the Company discontinued its forward contracts program; however, it will continue to evaluate periodically its foreign exchange exposures and mayre-initiate this program if it is deemed necessary.
The Company has historically used foreign currency forward contracts (“forward contracts”) to hedge its exposure to fluctuations in foreign currency exchange rates associated with its foreign currency denominated cash, accounts receivable, and intercompany receivables and payables held primarily by the U.S. parent company and its United Kingdom (“U.K.”) subsidiary.
At December 31, 2016, the total notional value of the Company’s outstanding forward contracts was $128.4 million.
The fair value of the Company’s outstanding forward contracts was as follows:
| December 31, 2016 | ||||||||
| (in thousands) | Recorded In: | Fair Value | ||||||
Asset Derivatives | ||||||||
Foreign currency forward contracts | Other current assets | $ | 628 | |||||
Liability Derivatives | ||||||||
Foreign currency forward contracts | Accrued expenses | $ | 883 | |||||
As of September 30, 2017, the Company did not have any forward contracts outstanding.
The Company had forward contracts outstanding with total notional values as of September 30, 2016 as follows:
| (in thousands) | ||||
Euro | € | 21,810 | ||
British pound | £ | 5,919 | ||
Australian dollar | A$ | 19,515 | ||
United States dollar | $ | 59,450 | ||
intangible assets:
| Three Months Ended September 30, | Nine Months Ended September 30, | ||||||||||||||||||||||
| (in thousands) | 2023 | 2022 | 2023 | 2022 | |||||||||||||||||||
| Cost of revenue | $ | 622 | $ | 705 | $ | 1,949 | $ | 2,017 | |||||||||||||||
| Selling and marketing | 343 | 343 | 1,028 | 1,028 | |||||||||||||||||||
| $ | 965 | $ | 1,048 | $ | 2,977 | $ | 3,045 | ||||||||||||||||
| (in thousands) | September 30, 2023 | December 31, 2022 | |||||||||
| Income tax receivables | $ | 19,663 | $ | 25,354 | |||||||
| Contract assets | 13,263 | 17,546 | |||||||||
| Other | 38,512 | 37,488 | |||||||||
| $ | 71,438 | $ | 80,388 | ||||||||
| (in thousands) | September 30, 2023 | December 31, 2022 | |||||||||
| Deferred commissions | $ | 107,399 | $ | 130,195 | |||||||
| Right of use assets | 65,871 | 76,114 | |||||||||
| Property and equipment | 49,481 | 55,056 | |||||||||
| Venture investments | 19,348 | 13,069 | |||||||||
| Contract assets | 10,732 | 16,470 | |||||||||
| Intangible assets | 7,949 | 10,888 | |||||||||
| Capped call transactions | 1,792 | 2,582 | |||||||||
| Deferred income taxes | 5,046 | 4,795 | |||||||||
| Restricted cash | 3,123 | — | |||||||||
| Other | 20,066 | 24,820 | |||||||||
| $ | 290,807 | $ | 333,989 | ||||||||
| (in thousands) | September 30, 2023 | December 31, 2022 | |||||||||
| Operating lease liabilities | $ | 15,532 | $ | 14,976 | |||||||
| Dividends payable | 2,506 | 2,474 | |||||||||
| $ | 18,038 | $ | 17,450 | ||||||||
| (in thousands) | September 30, 2023 | December 31, 2022 | |||||||||
| Deferred revenue | $ | 2,605 | $ | 3,552 | |||||||
| Income taxes payable | 2,017 | 3,207 | |||||||||
| Other | 9,863 | 8,369 | |||||||||
| $ | 14,485 | $ | 15,128 | ||||||||
| Three Months Ended September 30, | Nine Months Ended September 30, | ||||||||||||||||||||||
| (in thousands) | 2023 | 2022 | 2023 | 2022 | |||||||||||||||||||
| Fixed lease costs | $ | 4,718 | $ | 4,688 | $ | 14,979 | $ | 14,747 | |||||||||||||||
| Short-term lease costs | 660 | 916 | 2,137 | 2,510 | |||||||||||||||||||
| Variable lease costs | 2,254 | 905 | 6,414 | 2,395 | |||||||||||||||||||
| $ | 7,632 | $ | 6,509 | $ | 23,530 | $ | 19,652 | ||||||||||||||||
| (in thousands) | September 30, 2023 | December 31, 2022 | |||||||||
Right of use assets (1) | $ | 65,871 | $ | 76,114 | |||||||
Operating lease liabilities (2) | $ | 15,532 | $ | 14,976 | |||||||
| Long-term operating lease liabilities | $ | 68,874 | $ | 79,152 | |||||||
| September 30, 2023 | December 31, 2022 | ||||||||||
| Weighted-average remaining lease term | 7.0 years | 7.5 years | |||||||||
Weighted-average discount rate (1) | 4.0 | % | 4.1 | % | |||||||
| (in thousands) | September 30, 2023 | ||||
| Remainder of 2023 | $ | 4,775 | |||
| 2024 | 17,976 | ||||
| 2025 | 14,870 | ||||
| 2026 | 10,853 | ||||
| 2027 | 9,808 | ||||
| 2028 | 9,245 | ||||
| Thereafter | 30,054 | ||||
| Total lease payments | 97,581 | ||||
Less: imputed interest (1) | (13,175) | ||||
| $ | 84,406 | ||||
| Nine Months Ended September 30, | |||||||||||
| (in thousands) | 2023 | 2022 | |||||||||
| Cash paid for operating leases, net of tenant improvement allowances | $ | 14,378 | $ | 11,628 | |||||||
| Right of use assets recognized for new leases and amendments (non-cash) | $ | 1,782 | $ | 6,618 | |||||||
| (in thousands) | September 30, 2023 | December 31, 2022 | |||||||||
| Principal | $ | 502,270 | $ | 600,000 | |||||||
| Unamortized issuance costs | (3,517) | (6,391) | |||||||||
| Convertible senior notes, net | $ | 498,753 | $ | 593,609 | |||||||
| Three Months Ended September 30, | Nine Months Ended September 30, | ||||||||||||||||||||||
| (in thousands) | 2023 | 2022 | 2023 | 2022 | |||||||||||||||||||
| Contractual interest expense (0.75% coupon) | $ | 827 | $ | 1,125 | $ | 2,949 | $ | 3,375 | |||||||||||||||
| Amortization of issuance costs | 613 | 724 | 1,988 | 2,163 | |||||||||||||||||||
| $ | 1,440 | $ | 1,849 | $ | 4,937 | $ | 5,538 | ||||||||||||||||
| September 30, 2023 | |||||||||||||||||
| (in thousands) | Principal | Interest | Total | ||||||||||||||
| 2024 | $ | — | $ | 3,767 | $ | 3,767 | |||||||||||
| 2025 | 502,270 | 1,884 | 504,154 | ||||||||||||||
| $ | 502,270 | $ | 5,651 | $ | 507,921 | ||||||||||||
| Nine Months Ended September 30, | |||||||||||
| (in thousands) | 2023 | 2022 | |||||||||
| January 1, | $ | 2,582 | $ | 59,964 | |||||||
| Settlements | (341) | — | |||||||||
| Fair value adjustment | (449) | (56,381) | |||||||||
| September 30, | $ | 1,792 | $ | 3,583 | |||||||
| Year to Date | |||||||||||||||||||||||
| (in thousands) | March 31, 2023 | June 30, 2023 | September 30, 2023 | December 31, 2023 | |||||||||||||||||||
| Minimum Consolidated EBITDA (as defined in the Credit Facility) | $ | 38,862 | $ | 59,894 | $ | 95,597 | $ | 214,590 | |||||||||||||||
| Three Months Ended September 30, | Nine Months Ended September 30, | |||||||||||||||
| (in thousands) | 2017 | 2016 | 2017 | 2016 | ||||||||||||
Gain (loss) from the change in the fair value of forward contracts included in other income (expense), net | $ | — | $ | (1,237 | ) | $ | 286 | $ | (4,955 | ) | ||||||
Foreign currency transaction (loss) gain from the remeasurement of foreign currency assets and liabilities | (552 | ) | 1,082 | (793 | ) | 2,764 | ||||||||||
|
|
|
|
|
|
|
| |||||||||
| $ | (552 | ) | $ | (155 | ) | $ | (507 | ) | $ | (2,191 | ) | |||||
|
|
|
|
|
|
|
| |||||||||
5.it optimizes its go-to-market strategy and reassesses its office space needs:
| Three months ended | Expense | ||||||||||
| Employee severance and related benefits and closure of a US office | December 31, 2022 | $ | 21,743 | ||||||||
| Office space reduction | March 31, 2023 | $ | 1,241 | ||||||||
| Employee severance and related benefits | June 30, 2023 | $ | 1,581 | ||||||||
| Employee severance and related benefits and closure of a foreign office | September 30, 2023 | $ | 17,236 | ||||||||
| Nine Months Ended September 30, | |||||
| (in thousands) | 2023 | ||||
| January 1, | $ | 18,573 | |||
| Costs incurred | 19,921 | ||||
| Cash disbursements | (21,576) | ||||
| Currency translation adjustments | (203) | ||||
| September 30, | $ | 16,715 | |||
recurring basis
PEGASYSTEMS INC.
NOTES TO UNAUDITED CONDENSED CONSOLIDATED FINANCIAL STATEMENTS (continued)
implied volatility levels. The Company’s assetsventure investments are recorded at fair value based on multiple valuation methods, including observable public companies and transaction prices and unobservable inputs, including the volatility, rights, and obligations of the securities the Company holds.
| Fair Value Measurements at Reporting Date Using | Total | |||||||||||||||||||
| (in thousands) | Level 1 | Level 2 | ||||||||||||||||||
September 30, 2017 | ||||||||||||||||||||
Fair Value Assets: | ||||||||||||||||||||
Money market funds | $ | 655 | $ | — | $ | 655 | ||||||||||||||
Marketable securities: | ||||||||||||||||||||
Municipal bonds | $ | — | $ | 32,759 | 32,759 | |||||||||||||||
Corporate bonds | — | 31,053 | 31,053 | |||||||||||||||||
|
|
|
|
|
| |||||||||||||||
| $ | — | $ | 63,812 | $ | 63,812 | |||||||||||||||
December 31, 2016 | ||||||||||||||||||||
Fair Value Assets: | ||||||||||||||||||||
Money market funds | $ | 458 | $ | — | $ | 458 | ||||||||||||||
Marketable securities: | ||||||||||||||||||||
Municipal bonds | $ | — | $ | 36,607 | $ | 36,607 | ||||||||||||||
Corporate bonds | — | 26,560 | 26,560 | |||||||||||||||||
|
|
|
|
|
| |||||||||||||||
| $ | — | $ | 63,167 | $ | 63,167 | |||||||||||||||
Foreign currency forward contracts | — | 628 | 628 | |||||||||||||||||
Fair Value Liabilities: | ||||||||||||||||||||
Foreign currency forward contracts | $ | — | $ | 883 | $ | 883 | ||||||||||||||
For certainbasis:
| September 30, 2023 | December 31, 2022 | ||||||||||||||||||||||||||||||||||||||||||||||
| (in thousands) | Level 1 | Level 2 | Level 3 | Total | Level 1 | Level 2 | Level 3 | Total | |||||||||||||||||||||||||||||||||||||||
| Cash equivalents | $ | 22,686 | $ | — | $ | — | $ | 22,686 | $ | 2,526 | $ | — | $ | — | $ | 2,526 | |||||||||||||||||||||||||||||||
| Marketable securities | $ | — | $ | 167,286 | $ | — | $ | 167,286 | $ | — | $ | 152,167 | $ | — | $ | 152,167 | |||||||||||||||||||||||||||||||
Capped Call Transactions (1) | $ | — | $ | 1,792 | $ | — | $ | 1,792 | $ | — | $ | 2,582 | $ | — | $ | 2,582 | |||||||||||||||||||||||||||||||
Venture investments (1) (2) | $ | — | $ | — | $ | 19,348 | $ | 19,348 | $ | — | $ | — | $ | 13,069 | $ | 13,069 | |||||||||||||||||||||||||||||||
Assets Measured at Fair Value on a Nonrecurring Basis
Assets recorded at fair value on a nonrecurring basis, such as property and equipment and intangible assets, are recognized at fair value when they are impaired. During the nine months ended September 30, 2017 and 2016, the Company did not recognize any impairments of its assets recorded at fair value on a nonrecurring basis.
6. TRADE ACCOUNTS RECEIVABLE, NET OF ALLOWANCE
| (in thousands) | September 30, 2017 | December 31, 2016 | ||||||
Trade accounts receivable | $ | 164,530 | $ | 234,473 | ||||
Unbilled trade accounts receivable | 32,820 | 34,681 | ||||||
|
|
|
| |||||
Total trade accounts receivable | 197,350 | 269,154 | ||||||
Allowance for sales credit memos | (6,189 | ) | (4,126 | ) | ||||
|
|
|
| |||||
| $ | 191,161 | $ | 265,028 | |||||
|
|
|
| |||||
Unbilled trade accounts receivable primarily relate to services earned under time and materials arrangements and to license, maintenance, and cloud arrangements that have commenced or been deliveredlong-term assets.
7. GOODWILL AND OTHER INTANGIBLE ASSETS
The changes in the carrying amount of goodwill for the nine months ended September 30, 2017 as follows:
| (in thousands) | ||||
Balance as of January 1, | $ | 73,164 | ||
Purchase price adjustments to goodwill | (354 | ) | ||
Currency translation adjustments | 131 | |||
|
| |||
Balance as of September 30, | $ | 72,941 | ||
|
| |||
privately-held companies.
Intangible assets are recorded at cost
| Nine Months Ended September 30, | |||||||||||
| (in thousands) | 2023 | 2022 | |||||||||
| January 1, | $ | 13,069 | $ | 7,648 | |||||||
| New investments | 400 | 400 | |||||||||
| Sales of investments | (2,773) | (3,954) | |||||||||
| Changes in foreign exchange rates | 27 | (675) | |||||||||
| Changes in fair value: | |||||||||||
| included in other income (loss), net | 10,886 | 5,989 | |||||||||
| included in other comprehensive (loss) | (2,261) | 2,502 | |||||||||
| September 30, | $ | 19,348 | $ | 11,910 | |||||||
| (in thousands) | Range of Remaining Useful Lives | Cost | Accumulated Amortization | Net Book Value | ||||||||||||
September 30, 2017 | ||||||||||||||||
Customer related intangibles | 4-10 years | $ | 63,158 | $ | (43,205 | ) | $ | 19,953 | ||||||||
Technology | 7-10 years | 58,942 | (44,140 | ) | 14,802 | |||||||||||
Other intangibles | — | 5,361 | (5,361 | ) | — | |||||||||||
|
|
|
|
|
| |||||||||||
| $ | 127,461 | $ | (92,706 | ) | $ | 34,755 | ||||||||||
|
|
|
|
|
| |||||||||||
December 31, 2016 | ||||||||||||||||
Customer related intangibles | 4-10 years | $ | 63,091 | $ | (37,573 | ) | $ | 25,518 | ||||||||
Technology | 3-10 years | 58,942 | (40,269 | ) | 18,673 | |||||||||||
Other intangibles | — | 5,361 | (5,361 | ) | — | |||||||||||
|
|
|
|
|
| |||||||||||
| $ | 127,394 | $ | (83,203 | ) | $ | 44,191 | ||||||||||
|
|
|
|
|
| |||||||||||
Amortization expenseNotes
| Three Months Ended September 30, | Nine Months Ended September 30, | |||||||||||||||
| (in thousands) | 2017 | 2016 | 2017 | 2016 | ||||||||||||
Cost of revenue | $ | 1,232 | $ | 1,642 | $ | 3,871 | $ | 4,626 | ||||||||
Selling and marketing | 1,873 | 1,867 | 5,608 | 5,274 | ||||||||||||
General and administrative | — | 90 | — | 268 | ||||||||||||
|
|
|
|
|
|
|
| |||||||||
| $ | 3,105 | $ | 3,599 | $ | 9,479 | $ | 10,168 | |||||||||
|
|
|
|
|
|
|
| |||||||||
Future estimated amortization expense related to intangible assetsNotes outstanding (including the embedded conversion feature) was $460.3 million as of September 30, 2017 is2023 and $521.1 million as follows:
| (in thousands) | ||||
Remainder of 2017 | $ | 2,846 | ||
2018 | 11,347 | |||
2019 | 5,555 | |||
2020 | 2,659 | |||
2021 | 2,637 | |||
2022 and thereafter | 9,711 | |||
|
| |||
| $ | 34,755 | |||
|
| |||
8. ACCRUED EXPENSES
| (in thousands) | September 30, 2017 | December 31, 2016 | ||||||
Outside professional services | $ | 13,447 | $ | 10,204 | ||||
Income and other taxes | 5,947 | 10,422 | ||||||
Marketing and sales program expenses | 4,679 | 3,707 | ||||||
Dividends payable | 2,336 | 2,298 | ||||||
Employee related expenses | 4,715 | 3,806 | ||||||
Other | 8,557 | 6,314 | ||||||
|
|
|
| |||||
| $ | 39,681 | $ | 36,751 | |||||
|
|
|
| |||||
of December 31, 2022. In the nine months ended September 30, 2023 the Company repurchased Notes representing $97.7 million in aggregate principal amount.
| Three Months Ended September 30, | Nine Months Ended September 30, | ||||||||||||||||||||||||||||||||||
| (Dollars in thousands) | 2023 | 2022 | 2023 | 2022 | |||||||||||||||||||||||||||||||
| U.S. | $ | 154,741 | 47 | % | $ | 148,200 | 55 | % | $ | 489,645 | 51 | % | $ | 513,197 | 56 | % | |||||||||||||||||||
| Other Americas | 23,497 | 7 | % | 18,546 | 7 | % | 58,013 | 6 | % | 80,558 | 9 | % | |||||||||||||||||||||||
| United Kingdom (“U.K.”) | 41,622 | 12 | % | 24,074 | 9 | % | 112,751 | 12 | % | 83,837 | 9 | % | |||||||||||||||||||||||
| Europe (excluding U.K.), Middle East, and Africa | 67,880 | 20 | % | 46,212 | 17 | % | 173,551 | 18 | % | 140,586 | 15 | % | |||||||||||||||||||||||
| Asia-Pacific | 46,903 | 14 | % | 33,699 | 12 | % | 124,423 | 13 | % | 103,197 | 11 | % | |||||||||||||||||||||||
| $ | 334,643 | 100 | % | $ | 270,731 | 100 | % | $ | 958,383 | 100 | % | $ | 921,375 | 100 | % | ||||||||||||||||||||
| Three Months Ended September 30, | Nine Months Ended September 30, | ||||||||||||||||||||||
| (in thousands) | 2023 | 2022 | 2023 | 2022 | |||||||||||||||||||
| Perpetual license | $ | 2,747 | $ | 9,223 | $ | 4,729 | $ | 18,929 | |||||||||||||||
| Subscription license | 74,342 | 31,112 | 200,066 | 210,245 | |||||||||||||||||||
| Revenue recognized at a point in time | 77,089 | 40,335 | 204,795 | 229,174 | |||||||||||||||||||
| Maintenance | 83,538 | 77,526 | 245,210 | 235,568 | |||||||||||||||||||
| Pega Cloud | 118,040 | 97,359 | 340,982 | 281,182 | |||||||||||||||||||
| Consulting | 55,976 | 55,511 | 167,396 | 175,451 | |||||||||||||||||||
| Revenue recognized over time | 257,554 | 230,396 | 753,588 | 692,201 | |||||||||||||||||||
| Total revenue | $ | 334,643 | $ | 270,731 | $ | 958,383 | $ | 921,375 | |||||||||||||||
9. DEFERRED REVENUE
| (in thousands) | September 30, 2017 | December 31, 2016 | ||||||
Term license | $ | 5,636 | $ | 15,843 | ||||
Perpetual license | 20,844 | 23,189 | ||||||
Maintenance | 105,588 | 112,397 | ||||||
Cloud | 18,805 | 13,604 | ||||||
Professional Services | 10,058 | 10,614 | ||||||
|
|
|
| |||||
Current deferred revenue | 160,931 | 175,647 | ||||||
Perpetual license | 4,085 | 7,909 | ||||||
Maintenance | 828 | 1,802 | ||||||
Cloud | 1,217 | 1,278 | ||||||
|
|
|
| |||||
Long-term deferred revenue | 6,130 | 10,989 | ||||||
|
|
|
| |||||
| $ | 167,061 | $ | 186,636 | |||||
|
|
|
| |||||
10. STOCK-BASED COMPENSATION
Stock-based compensation expense is reflected in the Company’s unaudited condensed consolidated statements of operations as follows:
| Three Months Ended September 30, | Nine Months Ended September 30, | |||||||||||||||
| (in thousands) | 2017 | 2016 | 2017 | 2016 | ||||||||||||
Cost of revenues | $ | 3,613 | $ | 3,117 | $ | 10,913 | $ | 8,711 | ||||||||
Selling and marketing | 3,976 | 3,468 | 11,482 | 9,395 | ||||||||||||
Research and development | 3,420 | 2,260 | 10,306 | 7,480 | ||||||||||||
General and administrative | 2,480 | 1,983 | 7,228 | 4,706 | ||||||||||||
Acquisition-related | — | (10 | ) | — | 342 | |||||||||||
|
|
|
|
|
|
|
| |||||||||
Total stock-based compensation before tax | $ | 13,489 | $ | 10,818 | $ | 39,929 | $ | 30,634 | ||||||||
|
|
|
|
|
|
|
| |||||||||
Income tax benefit | $ | (4,129 | ) | $ | (3,227 | ) | $ | (12,231 | ) | $ | (8,917 | ) | ||||
During the nine months ended September 30, 2017, the Company issued approximately 1,299,000 shares of common stock to its employees and 18,000 shares of common stock to itsnon-employee directors under the Company’s stock-based compensation plans.
During the nine months ended September 30, 2017, the Company granted approximately 1,052,000 restricted stock units (“RSUs”
| Three Months Ended September 30, | Nine Months Ended September 30, | ||||||||||||||||||||||
| (in thousands) | 2023 | 2022 | 2023 | 2022 | |||||||||||||||||||
| Pega Cloud | $ | 118,040 | $ | 97,359 | $ | 340,982 | $ | 281,182 | |||||||||||||||
| Maintenance | 83,538 | 77,526 | 245,210 | 235,568 | |||||||||||||||||||
| Subscription services | 201,578 | 174,885 | 586,192 | 516,750 | |||||||||||||||||||
| Subscription license | 74,342 | 31,112 | 200,066 | 210,245 | |||||||||||||||||||
| Subscription | 275,920 | 205,997 | 786,258 | 726,995 | |||||||||||||||||||
| Consulting | 55,976 | 55,511 | 167,396 | 175,451 | |||||||||||||||||||
| Perpetual license | 2,747 | 9,223 | 4,729 | 18,929 | |||||||||||||||||||
| $ | 334,643 | $ | 270,731 | $ | 958,383 | $ | 921,375 | ||||||||||||||||
The Company recognizes stock based compensation on the accelerated recognition method, treating each vesting tranche as if it were an individual grant.
| (Dollars in thousands) | Subscription services | Subscription license | Perpetual license | Consulting | Total | |||||||||||||||||||||||||||||||||
| Maintenance | Pega Cloud | |||||||||||||||||||||||||||||||||||||
| 1 year or less | $ | 202,610 | $ | 391,324 | $ | 48,427 | $ | 4,567 | $ | 39,335 | $ | 686,263 | 54 | % | ||||||||||||||||||||||||
| 1-2 years | 58,610 | 239,787 | 4,356 | 2,696 | 3,662 | 309,111 | 24 | % | ||||||||||||||||||||||||||||||
| 2-3 years | 28,585 | 121,778 | 8,518 | — | 1,100 | 159,981 | 13 | % | ||||||||||||||||||||||||||||||
| Greater than 3 years | 17,478 | 89,870 | 2,664 | — | — | 110,012 | 9 | % | ||||||||||||||||||||||||||||||
| $ | 307,283 | $ | 842,759 | $ | 63,965 | $ | 7,263 | $ | 44,097 | $ | 1,265,367 | 100 | % | |||||||||||||||||||||||||
| (Dollars in thousands) | Subscription services | Subscription license | Perpetual license | Consulting | Total | |||||||||||||||||||||||||||||||||
| Maintenance | Pega Cloud | |||||||||||||||||||||||||||||||||||||
| 1 year or less | $ | 191,045 | $ | 328,111 | $ | 69,753 | $ | 814 | $ | 27,968 | $ | 617,691 | 53 | % | ||||||||||||||||||||||||
| 1-2 years | 55,141 | 213,304 | 4,113 | 4,505 | 6,699 | 283,762 | 25 | % | ||||||||||||||||||||||||||||||
| 2-3 years | 24,496 | 115,416 | 1,420 | 2,252 | 1,648 | 145,232 | 13 | % | ||||||||||||||||||||||||||||||
| Greater than 3 years | 16,198 | 82,807 | 1,734 | — | 508 | 101,247 | 9 | % | ||||||||||||||||||||||||||||||
| $ | 286,880 | $ | 739,638 | $ | 77,020 | $ | 7,571 | $ | 36,823 | $ | 1,147,932 | 100 | % | |||||||||||||||||||||||||
| Three Months Ended September 30, | Nine Months Ended September 30, | ||||||||||||||||||||||
| (in thousands) | 2023 | 2022 | 2023 | 2022 | |||||||||||||||||||
| Cost of revenue | $ | 6,410 | $ | 6,797 | $ | 22,497 | $ | 19,754 | |||||||||||||||
| Selling and marketing | 10,401 | 12,933 | 43,410 | 36,524 | |||||||||||||||||||
| Research and development | 7,375 | 7,724 | 24,286 | 22,425 | |||||||||||||||||||
| General and administrative | 7,113 | 6,320 | 19,890 | 14,598 | |||||||||||||||||||
| $ | 31,299 | $ | 33,774 | $ | 110,083 | $ | 93,301 | ||||||||||||||||
| Income tax benefit | $ | (316) | $ | (600) | $ | (1,569) | $ | (1,505) | |||||||||||||||
11. EARNINGS
| Nine Months Ended September 30, 2023 | |||||||||||
| (in thousands) | Shares | Total Fair Value | |||||||||
| Restricted stock units | 1,514 | $ | 70,962 | ||||||||
| Non-qualified stock options | 911 | $ | 19,142 | ||||||||
Performance stock options (1) | 906 | $ | 18,265 | ||||||||
| Common stock | 13 | $ | 600 | ||||||||
| Three Months Ended September 30, | Nine Months Ended September 30, | ||||||||||||||||||||||
| (Dollars in thousands) | 2023 | 2022 | 2023 | 2022 | |||||||||||||||||||
| Provision for income taxes | $ | 3,545 | $ | 11,748 | $ | 15,395 | $ | 190,239 | |||||||||||||||
| Effective income tax rate | (26) | % | (100) | % | |||||||||||||||||||
| Three Months Ended September 30, | Nine Months Ended September 30, | ||||||||||||||||||||||
| (in thousands, except per share amounts) | 2023 | 2022 | 2023 | 2022 | |||||||||||||||||||
| Net (loss) | $ | (7,279) | $ | (93,520) | $ | (74,857) | $ | (380,195) | |||||||||||||||
| Weighted-average common shares outstanding | 83,336 | 81,996 | 82,996 | 81,842 | |||||||||||||||||||
| (Loss) per share, basic | $ | (0.09) | $ | (1.14) | $ | (0.90) | $ | (4.65) | |||||||||||||||
| Net (loss) | $ | (7,279) | $ | (93,520) | $ | (74,857) | $ | (380,195) | |||||||||||||||
Weighted-average common shares outstanding, assuming dilution (1) (2) (3) | 83,336 | 81,996 | 82,996 | 81,842 | |||||||||||||||||||
| (Loss) per share, diluted | $ | (0.09) | $ | (1.14) | $ | (0.90) | $ | (4.65) | |||||||||||||||
Outstanding anti-dilutive stock options and RSUs (4) | 2,255 | 3,019 | 1,652 | 3,589 | |||||||||||||||||||
anti-dilutive.
The calculation
| Three Months Ended September 30, | Nine Months Ended September 30, | |||||||||||||||
| (in thousands, except per share amounts) | 2017 | 2016 | 2017 | 2016 | ||||||||||||
Basic | ||||||||||||||||
Net (loss)/income | $ | (1,812 | ) | $ | 3,301 | $ | 36,615 | $ | 18,237 | |||||||
|
|
|
|
|
|
|
| |||||||||
Weighted-average common shares outstanding | 77,691 | 76,278 | 77,258 | 76,323 | ||||||||||||
|
|
|
|
|
|
|
| |||||||||
(Loss)/earnings per share, basic | $ | (0.03 | ) | $ | 0.04 | $ | 0.47 | $ | 0.24 | |||||||
|
|
|
|
|
|
|
| |||||||||
Diluted | ||||||||||||||||
Net (loss)/income | $ | (1,812 | ) | $ | 3,301 | $ | 36,615 | $ | 18,237 | |||||||
|
|
|
|
|
|
|
| |||||||||
Weighted-average effect of dilutive securities: | ||||||||||||||||
Stock options | — | 1,933 | 3,519 | 1,851 | ||||||||||||
RSUs | — | 1,337 | 1,940 | 1,227 | ||||||||||||
|
|
|
|
|
|
|
| |||||||||
Effect of assumed exercise of stock options and RSUs | — | 3,270 | 5,459 | 3,078 | ||||||||||||
|
|
|
|
|
|
|
| |||||||||
Weighted-average common shares outstanding, assuming dilution | 77,691 | 79,548 | 82,717 | 79,401 | ||||||||||||
|
|
|
|
|
|
|
| |||||||||
(Loss)/earnings per share, diluted | $ | (0.03 | ) | $ | 0.04 | $ | 0.44 | $ | 0.23 | |||||||
|
|
|
|
|
|
|
| |||||||||
Outstanding stock options and RSUs excluded as impact would be anti-dilutive | 7,232 | 296 | 219 | 368 | ||||||||||||
securities matters. Regardless of the outcome, legal disputes can have a material effect on the Company because of defense and settlement costs, diversion of management resources, and other factors.
12. GEOGRAPHIC INFORMATION AND MAJOR CLIENTS
Geographic Information
Operating segments are defined as componentsalleged misappropriation of an enterprise, about which separate financial information is available that is evaluated regularly by the chief operating decision maker (“CODM”) in deciding how to allocate resources and in assessing performance.
trade secrets. The Company develops and licenses software applications for customer engagement and its Pega® Platform, and provides consulting services, maintenance, and training relatedis unable to its offerings. The Company derives substantially allreasonably estimate possible damages because of, its revenueamong other things, uncertainty as to the outcome of appellate proceedings and/or any potential new trial resulting from the saleappellate proceedings.
The Company’s international revenue,amended complaint was filed that does not add any new parties or legal claims, is based upon the clients’ location,same general factual allegations as the original complaint, and now seeks unspecified damages on behalf of a class of purchasers of the Company’s securities between June 16, 2020 and May 9, 2022. The Company moved to dismiss the consolidated amended complaint on December 19, 2022. The hearing on the Company’s motion to dismiss took place on May 17, 2023. After hearing argument from both sides, the Court denied the Company’s motion from the bench and stated that a written opinion would follow. On June 30, 2023, the Company filed its Answer to the complaint. On July 24, 2023, the Court issued its written opinion denying the motion to dismiss as to the Company and Defendant Trefler but granting the motion without prejudice as to Mr. Stillwell. The Company believes it has strong defenses to the claims brought against the defendants and intends to defend against these claims vigorously. The Company is as follows:
| Three Months Ended September 30, | Nine Months Ended September 30, | |||||||||||||||||||||||||||||||
| (Dollars in thousands) | 2017 | 2016 | 2017 | 2016 | ||||||||||||||||||||||||||||
U.S. | $ | 95,087 | 53 | % | $ | 111,274 | 61 | % | $ | 351,330 | 59 | % | $ | 308,049 | 56 | % | ||||||||||||||||
Other Americas | 8,722 | 5 | % | 7,952 | 4 | % | 30,243 | 5 | % | 49,494 | 9 | % | ||||||||||||||||||||
U.K. | 18,485 | 10 | % | 21,490 | 12 | % | 68,003 | 11 | % | 77,181 | 14 | % | ||||||||||||||||||||
Other EMEA(1) | 28,100 | 16 | % | 23,656 | 13 | % | 76,958 | 13 | % | 67,314 | 12 | % | ||||||||||||||||||||
Asia Pacific | 29,421 | 16 | % | 18,430 | 10 | % | 74,508 | 12 | % | 48,618 | 9 | % | ||||||||||||||||||||
|
|
|
|
|
|
|
|
|
|
|
|
|
|
|
| |||||||||||||||||
| $ | 179,815 | 100 | % | $ | 182,802 | 100 | % | $ | 601,042 | 100 | % | $ | 550,656 | 100 | % | |||||||||||||||||
|
|
|
|
|
|
|
|
|
|
|
|
|
|
|
| |||||||||||||||||
unable to reasonably estimate possible damages or a range of possible damages in this matter given the stage of the lawsuit, the Company’s belief that it has strong defenses to the claims asserted, its intent to defend against these claims, and there being no specified quantum of damages sought in the complaint.
Major Clients
Clients accounting for 10% or more
| Three Months Ended September 30, | Nine Months Ended September 30, | |||||||||||||||
| (in thousands) | 2017 | 2016 | 2017 | 2016 | ||||||||||||
Total revenue | $ | 179,815 | $ | 182,802 | $ | 601,042 | $ | 550,656 | ||||||||
Client A | 10.6 | % | * | * | * | |||||||||||
Clientsconsolidated and a joint motion to stay the consolidated case is pending before the Court. The Company also has received confidential demand letters raising substantially the same allegations set forth in the foregoing derivative complaints. On April 12, 2023, the Company’s board of directors (other than Mr. Trefler, who recused himself), formed a committee consisting solely of independent directors, to review, analyze, and investigate the matters raised in the demands and to determine in good faith what actions (if any) are reasonably believed to be appropriate under similar circumstances and reasonably believed to be in the best interests of the Company in response to the demand letters. The Company is unable to reasonably estimate possible damages or a range of possible damages in this matter given the stage of the lawsuit and there being no specified quantum of damages sought in the complaint.
| (in thousands) | September 30, 2017 | December 31, 2016 | ||||||
Total trade accounts receivable | 197,350 | 269,154 | ||||||
Client A | 12.4 | % | * | |||||
above-described litigation with Appian Corporation. The Company is fully cooperating with the SEC’s requests.
Forward-Looking Statements
These forward-looking statements are based on current expectations, estimates, forecasts, and projections about the industry and markets in which we operate, and management’s beliefs and assumptions. In addition, other written or oral statements that constitute forward-looking statements may be made by us or on our behalf. Words such as “expect,” “anticipate,” “intend,” “plan,” “believe,” “could,” “estimate,” “may,” “target,” “strategy,” “is intendedtransition to” “project,” “guidance,” “likely,” “usually,” or variations of such words and similar expressions are intended to identify such forward-looking statements.
These statements are not guarantees of future performance and involve certain risks, uncertainties, and assumptions that are difficult to predict. Important factors that could cause actual future activities and results to differ materially from those expressed in such forward-looking statements include, among others, a more subscription-based business model;
We have (“SEC”).
Business overview
a substitute for financial measures prepared under U.S. GAAP. A reconciliation of GAAP and non-GAAP measures is located with each non-GAAP measure.
Our clients includeare Global 3000 companies2000 organizations and government agencies that seekrequire solutions to manage complex enterprise systemsdistinguish themselves in the markets they serve. Our solutions achieve and customer service issuesfacilitate differentiation by increasing business agility, driving growth, improving productivity, attracting and retaining customers, and reducing risk. Along with greater agility and cost-effectiveness. Our strategy isour partners, we deliver solutions tailored to sell a client a series of licenses, each focused on athe specific purpose or area of operations in support of longer term enterprise-wide digital transformation initiatives.
Our license revenue is primarily derived from salesindustry needs of our applicationsclients.
Financial and Performance Metrics
Management evaluates our financial performance, based a number of select financial and performance metrics. The performance metrics are periodically reviewed and revised to reflect any changes in our business. Historically, Recurring Revenue and License and Cloud Backlog have been our primary performance metrics. However, due to the change in the revenue recognition patterns of term license arrangements as a result of the expected implementation of the new revenue accounting standard (See Note 2) in the first quarter of 2018, we have started tracking Annual Contract Value (“ACV”), a new performance measure.
Select Financial Metrics
(Dollars in thousands, except per share amounts) | Three Months Ended September 30, | Nine Months Ended September 30, | ||||||||||||||||||||||||||||||
| 2017 | 2016 | Change | 2017 | 2016 | Change | |||||||||||||||||||||||||||
Total revenue | $ | 179,815 | $ | 182,802 | (2,987 | ) | (2 | )% | $ | 601,042 | $ | 550,656 | $ | 50,386 | 9 | % | ||||||||||||||||
Operating margin | (8 | )% | 3 | % | 3 | % | 5 | % | ||||||||||||||||||||||||
Diluted (loss)/earnings per share | $ | (0.03 | ) | $ | 0.04 | $ | (0.07 | ) | (175 | )% | $ | 0.44 | $ | 0.23 | $ | 0.21 | 91 | % | ||||||||||||||
Cash flow provided by operating activities | 113,926 | 20,556 | 93,370 | 454 | % | |||||||||||||||||||||||||||
Select Performance Metrics
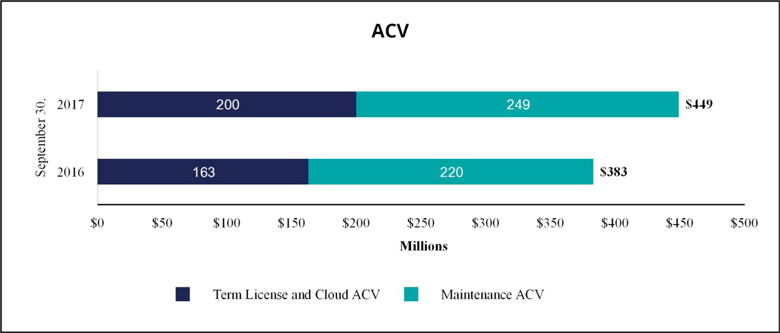
Annual Contract Value (“ACV”)
The change in ACV measures the growth and predictability of future cash flows from committed term license, cloud, and maintenance arrangementsactive contracts as of the endmeasurement date. The contract's total value is divided by its duration in years to calculate ACV. ACV is a performance measure that we believe provides useful information to our management and investors.
change was $3 million and 0.3% of Total ACV or less for all quarters in 2022. Previously disclosed ACV amounts have been updated to allow for comparability. This simplification, made possible by improvements to the Company’s financial systems, ensures that ACV for all contract types and lengths is consistently calculated as the sum of the following two components:
| September 30, | ||||||||||||||||
| (in thousands) | 2017 | 2016 | Change | |||||||||||||
Term License and Cloud ACV | $ | 200,180 | $ | 163,408 | $ | 36,772 | 23 | % | ||||||||
Maintenance ACV | 248,816 | 220,152 | $ | 28,664 | 13 | % | ||||||||||
|
|
|
| |||||||||||||
Term License, Cloud and Maintenance ACV | $ | 448,996 | $ | 383,560 | $ | 65,436 | 17 | % | ||||||||
|
|
|
| |||||||||||||
Recurring Revenue
A measurefour, and ACV for contracts less than 12 months was equal to the contract’s total value. The Company believes the simplified methodology better represents the current value of its contracts and better aligns its definition with comparable companies.

| (in millions, except percentages) | Q3 22 | Q3 23 | 1-Year Change | ||||||||||||||||||||||||||||||||
| ACV | $ | 1,040 | $ | 1,169 | 12 | % | |||||||||||||||||||||||||||||
| Impact of changes in foreign exchange rates | — | (22) | |||||||||||||||||||||||||||||||||
| Constant Currency ACV | $ | 1,040 | $ | 1,147 | 10 | % | |||||||||||||||||||||||||||||


| (Dollars in thousands) | Nine Months Ended September 30, | ||||||||||||||||
| 2023 | 2022 | ||||||||||||||||
Margin (2) | Margin (2) | ||||||||||||||||
| Cash provided by (used in) operating activities | $ | 137,920 | 14 | % | $ | (13,446) | (1) | % | |||||||||
| Investment in property and equipment | (14,271) | (22,285) | |||||||||||||||
| Free cash flow | $ | 123,649 | 13 | % | $ | (35,731) | (4) | % | |||||||||
Additional information (3) | |||||||||||||||||
| Legal fees | $ | 5,867 | $ | 37,944 | |||||||||||||
| Restructuring | 21,576 | — | |||||||||||||||
| Interest on convertible senior notes | 4,134 | 4,500 | |||||||||||||||
| Other | — | 3,266 | |||||||||||||||
| $ | 31,577 | $ | 45,710 | ||||||||||||||
| Three Months Ended September 30, | Nine Months Ended September 30, | |||||||||||||||||||||||||||||||
| (Dollars in thousands) | 2017 | 2016 | Change | 2017 | 2016 | Change | ||||||||||||||||||||||||||
Recurring revenue | ||||||||||||||||||||||||||||||||
Term license | $ | 21,678 | $ | 28,919 | $ | (7,241 | ) | (25 | )% | $ | 106,170 | $ | 102,115 | $ | 4,055 | 4 | % | |||||||||||||||
Maintenance | 62,204 | 55,038 | $ | 7,166 | 13 | % | 180,759 | 163,174 | $ | 17,585 | 11 | % | ||||||||||||||||||||
Cloud | 13,354 | 10,873 | $ | 2,481 | 23 | % | 36,914 | 30,640 | $ | 6,274 | 20 | % | ||||||||||||||||||||
|
|
|
|
|
|
|
| |||||||||||||||||||||||||
Total recurring revenue | $ | 97,236 | $ | 94,830 | $ | 2,406 | 3 | % | $ | 323,843 | $ | 295,929 | $ | 27,914 | 9 | % | ||||||||||||||||
|
|
|
|
|
|
|
| |||||||||||||||||||||||||
Recurring revenue as a percent of total revenue | 54 | % | 52 | % | 54 | % | 54 | % | ||||||||||||||||||||||||
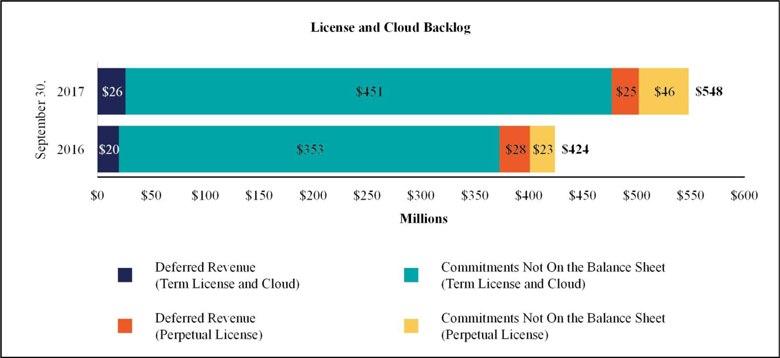
Licensecore business operations and Cloud Backlog
A measureongoing operational performance.
License0.75%, payable semi-annually in arrears on March 1 and CloudSeptember 1, beginning September 1, 2020.

| (in millions, except percentages) | Q3 22 | Q3 2023 | 1-Year Growth Rate | ||||||||||||||
| Backlog - GAAP | $ | 1,148 | $ | 1,265 | 10 | % | |||||||||||
| Impact of changes in foreign exchange rates | — | (33) | |||||||||||||||
| Constant currency backlog | $ | 1,148 | $ | 1,232 | 7 | % | |||||||||||
License and cloud backlog may vary in any given period depending on the amount and timing of when the arrangements are executed, as well as the mix between perpetual, term, and cloud license arrangements, which may depend on our clients’ deployment preferences. A change in the mix may cause our revenuesQ3 2022 foreign exchange rates to vary materially from period to period. A higher proportion of term and cloud license arrangements executed will generally result in revenue being recognized over longer periods.
| September 30, | Change | |||||||||||||||||||
| (Dollars in thousands) | 2017 | 2016 | ||||||||||||||||||
Deferred license and cloud revenue on the balance sheet | ||||||||||||||||||||
Term license and cloud | $ | 25,658 | 51 | % | $ | 19,627 | 42 | % | 31 | % | ||||||||||
Perpetual license | 24,929 | 49 | % | 27,653 | 58 | % | (10 | )% | ||||||||||||
|
|
|
| |||||||||||||||||
Total deferred license and cloud revenue | 50,587 | 100 | % | 47,280 | 100 | % | 7 | % | ||||||||||||
|
|
|
| |||||||||||||||||
License and cloud contractual commitments not on the balance sheet | ||||||||||||||||||||
Term license and cloud | 450,535 | 91 | % | 352,804 | 94 | % | 28 | % | ||||||||||||
Perpetual license | 46,459 | 9 | % | 23,483 | 6 | % | 98 | % | ||||||||||||
|
|
|
| |||||||||||||||||
Total license and cloud commitments | 496,994 | 100 | % | 376,287 | 100 | % | 32 | % | ||||||||||||
|
|
|
| |||||||||||||||||
Total license (term and perpetual) and cloud backlog | $ | 547,581 | $ | 423,567 | 29 | % | ||||||||||||||
|
|
|
| |||||||||||||||||
Total term license and cloud backlog | 476,193 | 87 | % | 372,431 | 88 | % | 28 | % | ||||||||||||
|
|
|
| |||||||||||||||||
Critical accounting policies
all periods shown.
| (Dollars in thousands) | Three Months Ended September 30, | Change | Nine Months Ended September 30, | Change | |||||||||||||||||||||||||||||||||||||||||||||||||
| 2023 | 2022 | 2023 | 2022 | ||||||||||||||||||||||||||||||||||||||||||||||||||
| Pega Cloud | $ | 118,040 | 35 | % | $ | 97,359 | 36 | % | $ | 20,681 | 21 | % | $ | 340,982 | 36 | % | $ | 281,182 | 31 | % | $ | 59,800 | 21 | % | |||||||||||||||||||||||||||||
| Maintenance | 83,538 | 25 | % | 77,526 | 29 | % | 6,012 | 8 | % | 245,210 | 25 | % | 235,568 | 25 | % | 9,642 | 4 | % | |||||||||||||||||||||||||||||||||||
| Subscription services | 201,578 | 60 | % | 174,885 | 65 | % | 26,693 | 15 | % | 586,192 | 61 | % | 516,750 | 56 | % | 69,442 | 13 | % | |||||||||||||||||||||||||||||||||||
| Subscription license | 74,342 | 22 | % | 31,112 | 11 | % | 43,230 | 139 | % | 200,066 | 21 | % | 210,245 | 23 | % | (10,179) | (5) | % | |||||||||||||||||||||||||||||||||||
| Subscription | 275,920 | 82 | % | 205,997 | 76 | % | 69,923 | 34 | % | 786,258 | 82 | % | 726,995 | 79 | % | 59,263 | 8 | % | |||||||||||||||||||||||||||||||||||
| Consulting | 55,976 | 17 | % | 55,511 | 21 | % | 465 | 1 | % | 167,396 | 18 | % | 175,451 | 19 | % | (8,055) | (5) | % | |||||||||||||||||||||||||||||||||||
| Perpetual license | 2,747 | 1 | % | 9,223 | 3 | % | (6,476) | (70) | % | 4,729 | — | % | 18,929 | 2 | % | (14,200) | (75) | % | |||||||||||||||||||||||||||||||||||
| $ | 334,643 | 100 | % | $ | 270,731 | 100 | % | $ | 63,912 | 24 | % | $ | 958,383 | 100 | % | $ | 921,375 | 100 | % | $ | 37,008 | 4 | % | ||||||||||||||||||||||||||||||
Results of Operations
| Three Months Ended September 30, | Nine Months Ended September 30, | |||||||||||||||||||||||||||||||
| (Dollars in thousands) | 2017 | 2016 | Change | 2017 | 2016 | Change | ||||||||||||||||||||||||||
Total revenue | $ | 179,815 | $ | 182,802 | $ | (2,987 | ) | (2 | )% | $ | 601,042 | $ | 550,656 | $ | 50,386 | 9 | % | |||||||||||||||
Gross profit | $ | 110,084 | $ | 122,365 | $ | (12,281 | ) | (10 | )% | $ | 395,346 | $ | 373,609 | $ | 21,737 | 6 | % | |||||||||||||||
Total operating expenses | $ | 124,373 | $ | 116,867 | $ | 7,506 | 6 | % | $ | 376,647 | $ | 347,626 | $ | 29,021 | 8 | % | ||||||||||||||||
(Loss)/income from operations | $ | (14,289 | ) | $ | 5,498 | $ | (19,787 | ) | (360 | )% | $ | 18,699 | $ | 25,983 | $ | (7,284 | ) | (28 | )% | |||||||||||||
Operating margin | (8 | )% | 3 | % | 3 | % | 5 | % | ||||||||||||||||||||||||
(Loss)/income before (benefit)/provision for income taxes | $ | (14,697 | ) | $ | 5,515 | $ | (20,212 | ) | (366 | )% | $ | 18,663 | $ | 24,506 | $ | (5,843 | ) | (24 | )% | |||||||||||||
Revenue
Software license revenue
| (Dollars in thousands) | Three Months Ended September 30, | Nine Months Ended September 30, | ||||||||||||||||||||||||||||||||||||||||||||||
| 2017 | 2016 | Change | 2017 | 2016 | Change | |||||||||||||||||||||||||||||||||||||||||||
Perpetual license | $ | 20,115 | 48 | % | $ | 39,914 | 58 | % | $ | (19,799 | ) | (50 | )% | $ | 89,050 | 46 | % | $ | 105,734 | 51 | % | ($ | 16,684 | ) | (16 | )% | ||||||||||||||||||||||
Term license | 21,678 | 52 | % | 28,919 | 42 | % | (7,241 | ) | (25 | )% | 106,170 | 54 | % | 102,115 | 49 | % | 4,055 | 4 | % | |||||||||||||||||||||||||||||
|
|
|
|
|
|
|
|
|
|
|
|
|
|
|
| |||||||||||||||||||||||||||||||||
Total license revenue | $ | 41,793 | 100 | % | $ | 68,833 | 100 | % | $ | (27,040 | ) | (39 | )% | $ | 195,220 | 100 | % | $ | 207,849 | 100 | % | ($ | 12,629 | ) | (6 | )% | ||||||||||||||||||||||
|
|
|
|
|
|
|
|
|
|
|
|
|
|
|
| |||||||||||||||||||||||||||||||||
The mix between perpetual and term license arrangements executed in a particular period varies based on clients’ deployment preferences. A change in the mix may cause our revenues to vary materially from period to period. A higher proportion of term license arrangements executed will generally result in license revenue being recognized over longer periods. Additionally, some of our perpetual license arrangements include extended payment terms or additional rights of use, which may also result in the recognition of revenue over longer periods.
The decrease in perpetualsubscription license revenue in the three months ended September 30, 20172023 was primarily due to a decreaseincreased license deliveries in the average value of perpetual arrangements executed and a lower percentage of perpetual arrangements executed and recognized in revenue in the current period.three months ended September 30, 2023. The decrease in perpetualsubscription license revenue in the nine months ended September 30, 20172023 was primarily due to a lower percentage of perpetual arrangements executed andseveral large multi-year contracts recognized in revenue.
The decrease in term license revenue in the three months ended September 30, 2017 was primarily due to a large term license renewal for which the second year of the term was recognized as revenue in the three months ended September 30, 2016. If the second year of this term license arrangement was not paid in advance in the three months ended September 30, 2016, term license revenue would have decreased 2%. The increase in term license revenue in the nine months ended September 30, 20172022.
The aggregate value of future revenue expected to be recognized during the remainder of the year under existing noncancellable perpetual arrangements not reflected in deferred revenue was $13.3 million as of September 30, 2017 compared to $3.9 million as of September 30, 2016.
The aggregate value of future revenue expected to be recognized during the remainder of the year under existing noncancellable term and cloud arrangements not reflected in deferred revenue was $37.7 million as of September 30, 2017 compared to $26.7 million as of September 30, 2016. For additional information see “Future Cash Receipts from Committed License and Cloud Arrangements” which can be found in “Liquidity and Capital Resources.”
Maintenance revenue
| Three Months Ended September 30, | Nine Months Ended September 30, | |||||||||||||||||||||||||||||||
| (Dollars in thousands) | 2017 | 2016 | Change | 2017 | 2016 | Change | ||||||||||||||||||||||||||
Maintenance | $ | 62,204 | $ | 55,038 | $ | 7,166 | 13 | % | $ | 180,759 | $ | 163,174 | $ | 17,585 | 11 | % | ||||||||||||||||
The increases were primarily due to the continued growth in the aggregate value of the installed base of our software and strong renewal rates significantly in excess of 90%.
Services revenue
| Three Months Ended September 30, | Nine Months Ended September 30, | |||||||||||||||||||||||||||||||||||||||||||||||
| (Dollars in thousands) | 2017 | 2016 | Change | 2017 | 2016 | Change | ||||||||||||||||||||||||||||||||||||||||||
Consulting services | $ | 61,535 | 81 | % | $ | 46,829 | 80 | % | $ | 14,706 | 31 | % | $ | 183,447 | 82 | % | $ | 144,263 | 80 | % | $ | 39,184 | 27 | % | ||||||||||||||||||||||||
Cloud | 13,354 | 18 | % | 10,873 | 18 | % | 2,481 | 23 | % | 36,914 | 16 | % | 30,640 | 17 | % | 6,274 | 20 | % | ||||||||||||||||||||||||||||||
Training | 929 | 1 | % | 1,229 | 2 | % | (300 | ) | (24 | )% | 4,702 | 2 | % | 4,730 | 3 | % | (28 | ) | (1 | )% | ||||||||||||||||||||||||||||
|
|
|
|
|
|
|
|
|
|
|
|
|
|
|
| |||||||||||||||||||||||||||||||||
Total services | $ | 75,818 | 100 | % | $ | 58,931 | 100 | % | $ | 16,887 | 29 | % | $ | 225,063 | 100 | % | $ | 179,633 | 100 | % | $ | 45,430 | 25 | % | ||||||||||||||||||||||||
|
|
|
|
|
|
|
|
|
|
|
|
|
|
|
| |||||||||||||||||||||||||||||||||
Consulting services revenue is primarily generated from new license implementations. Our consulting services revenue may fluctuate in future periods depending on the mix of new implementation projects we perform as compared to those performed by our enabled clients or led by our partners.
The increases in consulting services revenue were primarily due to higher billable hours during the three and nine months ended September 30, 2017 driven by a large project which began in the second half2023 reflects our strategy of 2016.
Cloud revenue represents revenue from our Pega Cloud offerings. promoting subscription-based arrangements.
| (Dollars in thousands) | Three Months Ended September 30, | Change | Nine Months Ended September 30, | Change | |||||||||||||||||||||||||||||||||||||||||||||||||
| 2023 | 2022 | 2023 | 2022 | ||||||||||||||||||||||||||||||||||||||||||||||||||
| Pega Cloud | $ | 88,553 | 75 | % | $ | 68,673 | 71 | % | $ | 19,880 | 29 | % | $ | 250,943 | 74 | % | $ | 194,350 | 69 | % | $ | 56,593 | 29 | % | |||||||||||||||||||||||||||||
| Maintenance | 77,119 | 92 | % | 71,671 | 92 | % | 5,448 | 8 | % | 225,696 | 92 | % | 219,296 | 93 | % | 6,400 | 3 | % | |||||||||||||||||||||||||||||||||||
| Subscription services | 165,672 | 82 | % | 140,344 | 80 | % | 25,328 | 18 | % | 476,639 | 81 | % | 413,646 | 80 | % | 62,993 | 15 | % | |||||||||||||||||||||||||||||||||||
| Subscription license | 73,713 | 99 | % | 30,484 | 98 | % | 43,229 | 142 | % | 198,095 | 99 | % | 208,322 | 99 | % | (10,227) | (5) | % | |||||||||||||||||||||||||||||||||||
| Subscription | 239,385 | 87 | % | 170,828 | 83 | % | 68,557 | 40 | % | 674,734 | 86 | % | 621,968 | 86 | % | 52,766 | 8 | % | |||||||||||||||||||||||||||||||||||
| Consulting | (1,228) | (2) | % | (2,267) | (4) | % | 1,039 | 46 | % | (8,866) | (5) | % | 4,289 | 2 | % | (13,155) | * | ||||||||||||||||||||||||||||||||||||
| Perpetual license | 2,723 | 99 | % | 9,120 | 99 | % | (6,397) | (70) | % | 4,678 | 99 | % | 18,756 | 99 | % | (14,078) | (75) | % | |||||||||||||||||||||||||||||||||||
| $ | 240,880 | 72 | % | $ | 177,681 | 66 | % | $ | 63,199 | 36 | % | $ | 670,546 | 70 | % | $ | 645,013 | 70 | % | $ | 25,533 | 4 | % | ||||||||||||||||||||||||||||||
Gross profit
| Three Months Ended September 30, | Nine Months Ended September 30, | |||||||||||||||||||||||||||||||
| (Dollars in thousands) | 2017 | 2016 | Change | 2017 | 2016 | Change | ||||||||||||||||||||||||||
Software license | $ | 40,517 | $ | 67,520 | $ | (27,003 | ) | (40 | )% | $ | 191,394 | $ | 204,203 | $ | (12,809 | ) | (6 | )% | ||||||||||||||
Maintenance | 55,488 | 48,379 | 7,109 | 15 | % | 159,814 | 144,285 | 15,529 | 11 | % | ||||||||||||||||||||||
Services | 14,079 | 6,466 | 7,613 | 118 | % | 44,138 | 25,121 | 19,017 | 76 | % | ||||||||||||||||||||||
|
|
|
|
|
|
|
| |||||||||||||||||||||||||
Total gross profit | $ | 110,084 | $ | 122,365 | $ | (12,281 | ) | (10 | )% | $ | 395,346 | $ | 373,609 | $ | 21,737 | 6 | % | |||||||||||||||
Software license gross profit % | 97 | % | 98 | % | 98 | % | 98 | % | ||||||||||||||||||||||||
Maintenance gross profit % | 89 | % | 88 | % | 88 | % | 88 | % | ||||||||||||||||||||||||
Services gross profit % | 19 | % | 11 | % | 20 | % | 14 | % | ||||||||||||||||||||||||
|
|
|
|
|
|
|
| |||||||||||||||||||||||||
Total gross profit % | 61 | % | 67 | % | 66 | % | 68 | % | ||||||||||||||||||||||||
The decrease in total gross profit in the three months ended September 30, 2017 was primarily due to a shift in the mix of license arrangements executed from perpetual to term licenses and an increase in lower margin services revenue.
The increase in total gross profit in the nine months ended September 30, 2017 was primarily due to increased total revenue.
The increases in servicePega Cloud gross profit percent in the three and nine months ended September 30, 2017 was driven by a large project which began2023 were primarily due to increased cost efficiency, particularly for hosting services, as Pega Cloud continues to grow and scale.
Operating expenses
Selling and marketing
| Three Months Ended September 30, | Nine Months Ended September 30, | |||||||||||||||||||||||||||||||
| (Dollars in thousands) | 2017 | 2016 | Change | 2017 | 2016 | Change | ||||||||||||||||||||||||||
Selling and marketing | $ | 70,209 | $ | 67,032 | $ | 3,177 | 5 | % | $ | 217,384 | $ | 202,126 | $ | 15,258 | 8 | % | ||||||||||||||||
As a percent of total revenue | 39 | % | 37 | % | 36 | % | 37 | % | ||||||||||||||||||||||||
Selling and marketing headcount, end of period | 934 | 875 | 59 | 7 | % | |||||||||||||||||||||||||||
Selling and marketing expenses include compensation, benefits, and other headcount-related expenses associated with our selling and marketing personnel as well as advertising, promotions, trade shows, seminars, and other programs. Selling and marketing expenses also include the amortization of customer related intangibles.
The increase in the threenine months ended September 30, 20172023 was primarily due to an increase in compensation and benefits as a result of $1.8 million, driven by increased headcount and equity compensation, partially offset by a decreaseheadcount.
2023 was primarily due to higher consultant utilization in the Americas. The increasedecrease in consulting profit percent in the nine months ended September 30, 20172023, was primarily due to an increaselower consultant realization rates in the Americas.
| (Dollars in thousands) | Three Months Ended September 30, | Change | Nine Months Ended September 30, | Change | |||||||||||||||||||||||||||||||||||||
| 2023 | 2022 | 2023 | 2022 | ||||||||||||||||||||||||||||||||||||||
| Selling and marketing | $ | 131,598 | $ | 153,517 | $ | (21,919) | (14) | % | $ | 425,253 | $ | 472,951 | $ | (47,698) | (10) | % | |||||||||||||||||||||||||
| % of Revenue | 39 | % | 57 | % | 44 | % | 51 | % | |||||||||||||||||||||||||||||||||
| Research and development | $ | 74,955 | $ | 75,342 | $ | (387) | (1) | % | $ | 224,262 | $ | 221,173 | $ | 3,089 | 1 | % | |||||||||||||||||||||||||
| % of Revenue | 22 | % | 28 | % | 23 | % | 24 | % | |||||||||||||||||||||||||||||||||
| General and administrative | $ | 27,321 | $ | 26,043 | $ | 1,278 | 5 | % | $ | 73,893 | $ | 94,530 | $ | (20,637) | (22) | % | |||||||||||||||||||||||||
| % of Revenue | 8 | % | 10 | % | 8 | % | 10 | % | |||||||||||||||||||||||||||||||||
| Restructuring | $ | 17,822 | $ | — | $ | 17,822 | 100 | % | $ | 21,450 | $ | — | $ | 21,450 | 100 | % | |||||||||||||||||||||||||
| % of Revenue | 5 | % | — | % | 2 | % | — | % | |||||||||||||||||||||||||||||||||
this Quarterly Report.
Research and development
| Three Months Ended September 30, | Nine Months Ended September 30, | |||||||||||||||||||||||||||||||
| (Dollars in thousands) | 2017 | 2016 | Change | 2017 | 2016 | Change | ||||||||||||||||||||||||||
Research and development | $ | 41,031 | $ | 38,036 | $ | 2,995 | 8 | % | $ | 121,089 | $ | 108,530 | $ | 12,559 | 12 | % | ||||||||||||||||
As a percent of total revenue | 23 | % | 21 | % | 20 | % | 20 | % | ||||||||||||||||||||||||
Research and Development headcount, end of period | 1,474 | 1,437 | 37 | 3 | % | |||||||||||||||||||||||||||
Researchresearch and development expenses include compensation, benefits, contracted services, and other headcount-related expenses associated withfor the creation and development ofnine months ended September 30, 2023 was primarily due to additional investments in our products as well as enhancements and designservices.
The increasesadministrative in the three and nine months ended September 30, 20172023 were primarily due to an increase of $2.3 million in the three months ended September 30, 2023 and a decrease of $21.4 million in the nine months ended September 30, 2023 in legal fees and related expenses arising from proceedings outside the ordinary course of business. We expect to continue to incur additional costs for these proceedings. See "Note 15. Commitments and Contingencies" in Part I, Item 1 of this Quarterly Report and “Risk Factors” in Part I, Item 1A of our Annual Report for the year ended December 31, 2022 for additional information.
General and administrative
| Three Months Ended September 30, | Nine Months Ended September 30, | |||||||||||||||||||||||||||||||
| (Dollars in thousands) | 2017 | 2016 | Change | 2017 | 2016 | Change | ||||||||||||||||||||||||||
General and administrative | $ | 13,133 | $ | 11,725 | $ | 1,408 | 12 | % | $ | 38,174 | $ | 34,067 | $ | 4,107 | 12 | % | ||||||||||||||||
As a percent of total revenue | 7 | % | 6 | % | 6 | % | 6 | % | ||||||||||||||||||||||||
General and administrative headcount, end of period | 407 | 371 | 36 | 10 | % | |||||||||||||||||||||||||||
General and administrative expenses include compensation, benefits, and other headcount-related expenses associated with finance, legal, corporate governance, and other administrative headcount. They also include accounting, legal, and other professional consulting and administrative fees.
| (Dollars in thousands) | Three Months Ended September 30, | Change | Nine Months Ended September 30, | Change | |||||||||||||||||||||||||||||||||||||
| 2023 | 2022 | 2023 | 2022 | ||||||||||||||||||||||||||||||||||||||
| Foreign currency transaction gain (loss) | $ | 1,994 | $ | 3,826 | $ | (1,832) | (48) | % | $ | (3,971) | $ | 8,415 | $ | (12,386) | * | ||||||||||||||||||||||||||
| Interest income | 2,532 | 520 | 2,012 | 387 | % | 5,831 | 1,036 | 4,795 | 463 | % | |||||||||||||||||||||||||||||||
| Interest expense | (1,533) | (1,992) | 459 | 23 | % | (5,229) | (5,882) | 653 | 11 | % | |||||||||||||||||||||||||||||||
| (Loss) on capped call transactions | (2,294) | (6,876) | 4,582 | 67 | % | (449) | (56,381) | 55,932 | 99 | % | |||||||||||||||||||||||||||||||
| Other income (loss), net | 6,383 | (29) | 6,412 | * | 18,668 | 6,497 | 12,171 | 187 | % | ||||||||||||||||||||||||||||||||
| $ | 7,082 | $ | (4,551) | $ | 11,633 | * | $ | 14,850 | $ | (46,315) | $ | 61,165 | * | ||||||||||||||||||||||||||||
The increasesforeign currency transaction gain (loss) in the three and nine months ended September 30, 2017 were primarily due to increases in compensation and benefits of $0.4 million and $4 million, respectively, attributable to increased headcount and equity compensation. The increase in the nine months ended September 30, 2017 was partially offset by a decrease of $1.5 million in legal fees.
Stock-based compensation
| Three Months Ended September 30, | Nine Months Ended September 30, | |||||||||||||||||||||||||||||||
| (in thousands) | 2017 | 2016 | Change | 2017 | 2016 | Change | ||||||||||||||||||||||||||
Cost of revenues | $ | 3,613 | $ | 3,117 | $ | 496 | 16 | % | $ | 10,913 | $ | 8,711 | $ | 2,202 | 25 | % | ||||||||||||||||
Selling and marketing | 3,976 | 3,468 | 508 | 15 | % | 11,482 | 9,395 | 2,087 | 22 | % | ||||||||||||||||||||||
Research and development | 3,420 | 2,260 | 1,160 | 51 | % | 10,306 | 7,480 | 2,826 | 38 | % | ||||||||||||||||||||||
General and administrative | 2,480 | 1,983 | 497 | 25 | % | 7,228 | 4,706 | 2,522 | 54 | % | ||||||||||||||||||||||
Acquisition-related | — | (10 | ) | 10 | (100 | )% | — | 342 | (342 | ) | (100 | )% | ||||||||||||||||||||
|
|
|
|
|
|
|
| |||||||||||||||||||||||||
Total stock-based compensation before tax | $ | 13,489 | $ | 10,818 | $ | 2,671 | 25 | % | $ | 39,929 | $ | 30,634 | $ | 9,295 | 30 | % | ||||||||||||||||
|
|
|
|
|
|
|
| |||||||||||||||||||||||||
Income tax benefit | $ | (4,129 | ) | $ | (3,227 | ) | $ | (902 | ) | 28 | % | $ | (12,231 | ) | $ | (8,917 | ) | $ | (3,314 | ) | 37 | % | ||||||||||
The increases2023 were primarily due to the increased valueimpact of fluctuations in foreign currency exchange rates associated with foreign currency-denominated cash and receivables held by our annual periodic equity awards grantedsubsidiary in March 2016 and 2017. These awards generally have a five-year vesting schedule.
Amortization of intangibles
| Three Months Ended September 30, | Nine Months Ended September 30, | |||||||||||||||||||||||||||||||
| (Dollars in thousands) | 2017 | 2016 | Change | 2017 | 2016 | Change | ||||||||||||||||||||||||||
Cost of revenue | $ | 1,232 | $ | 1,642 | $ | (410 | ) | (25 | )% | $ | 3,871 | $ | 4,626 | $ | (755 | ) | (16 | )% | ||||||||||||||
Selling and marketing | 1,873 | 1,867 | 6 | — | % | 5,608 | 5,274 | 334 | 6 | % | ||||||||||||||||||||||
General and administrative | — | 90 | (90 | ) | (100 | )% | — | 268 | (268 | ) | (100 | )% | ||||||||||||||||||||
|
|
|
|
|
|
|
| |||||||||||||||||||||||||
| $ | 3,105 | $ | 3,599 | $ | (494 | ) | (14 | )% | $ | 9,479 | $ | 10,168 | $ | (689 | ) | (7 | )% | |||||||||||||||
|
|
|
|
|
|
|
| |||||||||||||||||||||||||
the United Kingdom.
Non-operating (expense)/income, net
| Three Months Ended September 30, | Nine Months Ended September 30, | |||||||||||||||||||||||||||||||
| (Dollars in thousands) | 2017 | 2016 | Change | 2017 | 2016 | Change | ||||||||||||||||||||||||||
Foreign currency transaction (loss)/gain | $ | (552 | ) | $ | 1,082 | $ | (1,634 | ) | n/m | $ | (793 | ) | $ | 2,764 | $ | (3,557 | ) | n/m | ||||||||||||||
Interest income, net | 144 | 172 | $ | (28 | ) | (16 | )% | 470 | 650 | (180 | ) | (28 | )% | |||||||||||||||||||
Other (expense)/income, net | — | (1,237 | ) | $ | 1,237 | (100 | )% | 287 | (4,891 | ) | 5,178 | n/m | ||||||||||||||||||||
|
|
|
|
|
|
|
| |||||||||||||||||||||||||
| $ | (408 | ) | $ | 17 | $ | (425 | ) | n/m | $ | (36 | ) | $ | (1,477 | ) | $ | 1,441 | (98 | )% | ||||||||||||||
|
|
|
|
|
|
|
| |||||||||||||||||||||||||
n/m - not meaningful
In May 2017, we discontinued our forward contracts program; however, we will continue to evaluate periodically our foreign exchange exposures and mayre-initiate this program if it is deemed necessary.
Historically, we have used foreign currency forward contracts (“forward contracts”) to hedge our exposure to fluctuationsmarket interest rates.
The total changeinterest expense in the fair value of our foreign currency forward contracts recorded in other income (expense), net, during the three and nine months ended September 30, 2016 was a loss2023 were due to our repurchases of $1.2 million. The total changeConvertible Senior Notes in the fair value of our foreign currency forward contracts recorded in other (expense)/income, net, during the nine months ended September 30, 20172023. For additional information, see "Note 8. Debt" in Part I, Item 1 of this Quarterly Report.
(Benefit)/provisionnine months ended September 30, 2023 were due to fair value adjustments for income taxes
| Three Months Ended September 30, | Nine Months Ended September 30, | |||||||||||||||||||||||||||||||
| (Dollars in thousands) | 2017 | 2016 | Change | 2017 | 2016 | Change | ||||||||||||||||||||||||||
(Benefit)/provision for income taxes | $ | (12,885 | ) | $ | 2,214 | $ | (15,099 | ) | n/m | $ | (17,952 | ) | $ | 6,269 | $ | (24,221 | ) | n/m | ||||||||||||||
Effective income tax rate | 88 | % | 40 | % | (96 | )% | 26 | % | ||||||||||||||||||||||||
n/m - not meaningful
The (benefit)/provision for income taxes represents current and future amounts for federal, state, and foreign taxes.
our capped call transactions.
| Nine Months Ended September 30, | |||||||||||||||||||||||
| (Dollars in thousands) | 2023 | 2022 | |||||||||||||||||||||
| Provision for income taxes | $ | 15,395 | $ | 190,239 | |||||||||||||||||||
| Effective income tax rate | (26) | % | (100) | % | |||||||||||||||||||
The inclusion of excess tax benefits as a component of the provision for income taxes may increase volatilityassets in the effectiveU.S. and U.K. and projected taxable income in the U.S., partially offset by available tax rates of future periods ascredits and losses in the amount of excess tax benefits from share-based compensation awards varies depending on our future stock price in relation to the fair value of awards, the timing of RSU vesting and exercise behavior of our stock option holders, and the total value of future grants of share-based compensation awards.
Liquidity and capital resources
| Nine Months Ended September 30, | ||||||||
| (in thousands) | 2017 | 2016 | ||||||
Cash provided by (used in): | ||||||||
Operating activities | $ | 113,926 | $ | 20,556 | ||||
Investing activities | (11,966 | ) | (2,859 | ) | ||||
Financing activities | (44,040 | ) | (43,031 | ) | ||||
Effect of exchange rate on cash | 2,054 | (1,309 | ) | |||||
|
|
|
| |||||
Net increase/(decrease) in cash and cash equivalents | $ | 59,974 | $ | (26,643 | ) | |||
|
|
|
| |||||
| (in thousands) | September 30, 2017 | December 31, 2016 | ||||||
Total cash, cash equivalents, and marketable securities | $ | 194,380 | $ | 133,761 | ||||
U.S.
| Nine Months Ended September 30, | |||||||||||
| (in thousands) | 2023 | 2022 | |||||||||
| Cash provided by (used in): | |||||||||||
| Operating activities | $ | 137,920 | $ | (13,446) | |||||||
| Investing activities | (24,176) | 10,104 | |||||||||
| Financing activities | (85,031) | (43,484) | |||||||||
| Effect of exchange rate changes on cash, cash equivalents, and restricted cash | (1,621) | (5,513) | |||||||||
| Net increase (decrease) in cash, cash equivalents, and restricted cash | $ | 27,092 | $ | (52,339) | |||||||
| (in thousands) | September 30, 2023 | December 31, 2022 | |||||||||
| Held by U.S. entities | $ | 217,735 | $ | 248,389 | |||||||
| Held by foreign entities | 118,574 | 48,832 | |||||||||
| Total cash, cash equivalents, and marketable securities | $ | 336,309 | $ | 297,221 | |||||||
As of September 30, 2017, approximately $61.1 million ofmonths and to meet our known long-term cash requirements. Whether these resources are adequate to meet our liquidity needs beyond that period will depend on our future growth, operating results, and cash equivalents was held inthe investments needed to support our foreign subsidiaries. operations. We may utilize available funds or seek external financing if we require additional capital resources.
Cashcash provided by (used in) operating activities
The primary drivers during in the nine months ended September 30, 2017 were net income of $36.6 million and $80.6 million from trade accounts receivable, largely2023 was primarily due to increasedgrowth in client collections, the impact of our cost-efficiency initiatives, and lower legal fees and related costs arising from proceedings outside the ordinary course of business. We expect to continue to incur additional costs for these proceedings. For additional information, see “Note 9. Restructuring” and "Note 15. Commitments and Contingencies" in Part I, Item 1 of this Quarterly Report.
The primary driver during(used in) provided by investing activities in the nine months ended September 30, 20162023 was net incomeprimarily due to our investments in financial instruments and reduced investment in property and equipment as we optimize our office space.
Future Cash Receipts from Committed License and Cloud Arrangements
As of September 30, 2017, none of the amounts shown in the table below had been billed and no revenue had been recognized.
The below amounts for 2018 and subsequent periods may not be recognized in the periods shown below as a result of the adoption of the new revenue recognition standard (ASC 606). (See Note 2. New Accounting Pronouncements contained elsewhere in this Quarterly Reportconvertible senior notes, which mature on Form10-Q for additional information)
| September 30, 2017 | ||||||||||||
| (in thousands) | Term and cloud contracts | Perpetual contracts (1) | Total | |||||||||
Remainder of 2017 | $ | 37,723 | $ | 13,274 | $ | 50,997 | ||||||
2018 | 150,629 | 21,213 | 171,842 | |||||||||
2019 | 125,165 | 10,033 | 135,198 | |||||||||
2020 | 85,939 | 1,572 | 87,511 | |||||||||
2021 | 38,203 | 367 | 38,570 | |||||||||
2022 and thereafter | 12,876 | — | 12,876 | |||||||||
|
|
|
|
|
| |||||||
Total | $ | 450,535 | $ | 46,459 | $ | 496,994 | ||||||
|
|
|
|
|
| |||||||
Total contractual future cash receipts due from our existing license and cloud arrangements were approximately $376.3 million as of September 30, 2016.
Cash used in investing activities
DuringMarch 1, 2025. In the nine months ended September 30, 2017,2023, we purchased $25.7paid $89 million of marketable debt securities and made investments of $9.1to repurchase $97.7 million in propertyaggregate principal amount of convertible senior notes. As of September 30, 2023, we had $502 million in aggregate principal amount of convertible senior notes outstanding due on March 1, 2025. For additional information, see "Note 8. Debt" in Part I, Item 1 of this Quarterly Report.
| (in thousands) | Nine Months Ended September 30, 2023 | ||||
| December 31, 2022 | $ | 58,075 | |||
Authorizations (1) | 1,925 | ||||
| September 30, 2023 | $ | 60,000 | |||
During
| Nine Months Ended September 30, | |||||||||||||||||||||||
| 2023 | 2022 | ||||||||||||||||||||||
| (in thousands) | Shares | Amount | Shares | Amount | |||||||||||||||||||
| Stock repurchase program | — | — | 279 | 24,508 | |||||||||||||||||||
| Tax withholdings for net settlement of equity awards | 39 | 1,654 | 253 | 17,575 | |||||||||||||||||||
| 39 | $ | 1,654 | 532 | $ | 42,083 | ||||||||||||||||||
Cash used in financing activities
We used cash primarily for repurchases of our common stock, share repurchases for tax withholdings for the net settlement of our equity awards, and the payment of our quarterly dividend.
Since 2004, our Board of Directors has approved annual stock repurchase programs that have authorized the repurchase in the aggregate of up to $195 million of our common stock. Purchases under these programs have been made on the open market.
The following table is a summary of our repurchase activity:
| Nine Months Ended September 30, | ||||||||||||||||||||||||
| 2017 | 2016 | |||||||||||||||||||||||
| (in thousands) | Shares | Amount | Authorization Remaining Under Publicly Announced Share Repurchased Programs | Shares | Amount | Authorization Remaining Under Publicly Announced Share Repurchased Programs | ||||||||||||||||||
Balance as of January 1, | $ | 39,385 | $ | 40,534 | ||||||||||||||||||||
Authorizations | — | — | — | — | — | 25,879 | ||||||||||||||||||
Repurchase for net settlement of tax under stock-based compensation | 682 | (34,791 | ) | — | 414 | (10,791 | ) | — | ||||||||||||||||
Repurchases paid under authorized share repurchase program | 68 | (2,986 | ) | (2,986 | ) | 1,028 | (25,530 | ) | (25,530 | ) | ||||||||||||||
Repurchases unsettled | — | — | — | 6 | (177 | ) | (177 | ) | ||||||||||||||||
|
|
|
|
|
|
|
|
|
|
|
| |||||||||||||
Activity in Period | 750 | $ | (37,777 | ) | $ | (2,986 | ) | 1,448 | $ | (36,498 | ) | $ | 172 | |||||||||||
|
|
|
| |||||||||||||||||||||
Balance as of September 30, | $ | 36,399 | $ | 40,706 | ||||||||||||||||||||
|
|
|
| |||||||||||||||||||||
In addition to the share repurchases made under our repurchase programs, we net settled the majority of our employee stock option exercises and RSU vestings, which resulted in the withholding of shares to cover the option exercise price and the minimum statutory tax withholding obligations.
During the nine months ended September 30, 2017 and 2016, option and RSU holders net settled a total of 2.4 million shares and 1.6 million shares, respectively, of which only 1.3 million shares and 0.8 million shares, respectively, were issued to the option and RSU holders. The balance of the shares were surrendered to us to pay for the exercise price with respect to options and the applicable taxes for both options and RSUs. During the nine months ended September 30, 2017 and 2016,2022, instead of receiving cash from the equity holders, we withheld shares with a value of $23.7$1.0 million and $10.1$11.5 million, respectively, for the exercise price of options.
These amounts are not included in the table above.
| Nine Months Ended September 30, | ||||||||
| (per share) | 2017 | 2016 | ||||||
Dividends Declared | $ | 0.09 | $ | 0.09 | ||||
Dividends Paid | $ | 0.09 | $ | 0.09 | ||||
It is our current intention
| Nine Months Ended September 30, | |||||||||||
| (in thousands) | 2023 | 2022 | |||||||||
| Dividend payments to stockholders | $ | 7,458 | $ | 7,368 | |||||||
| Payments due by period | |||||||||||||||||||||||||||||||||||||||||||||||
| (in thousands) | Remainder of 2023 | 2024 | 2025 | 2026 | 2027 | 2028 and after | Other | Total | |||||||||||||||||||||||||||||||||||||||
Convertible senior notes (1) | $ | — | $ | 3,767 | $ | 504,154 | $ | — | $ | — | $ | — | $ | — | $ | 507,921 | |||||||||||||||||||||||||||||||
Purchase obligations (2) | 43,491 | 134,122 | 126,065 | 120,745 | 134,060 | 177 | — | 558,660 | |||||||||||||||||||||||||||||||||||||||
| Operating lease obligations | 4,775 | 17,976 | 14,870 | 10,853 | 9,808 | 39,299 | — | 97,581 | |||||||||||||||||||||||||||||||||||||||
Venture investment commitments (3) | 500 | 500 | — | — | — | — | — | 1,000 | |||||||||||||||||||||||||||||||||||||||
Liability for uncertain tax positions (4) | — | — | — | — | — | — | 2,017 | 2,017 | |||||||||||||||||||||||||||||||||||||||
| $ | 48,766 | $ | 156,365 | $ | 645,089 | $ | 131,598 | $ | 143,868 | $ | 39,476 | $ | 2,017 | $ | 1,167,179 | ||||||||||||||||||||||||||||||||
our discretion.
Ascurrencies. However, our international sales are also primarily denominated in foreign currencies, partially offsetting our foreign currency exposure.
| Nine Months Ended September 30, | |||||||||||
| 2023 | 2022 | ||||||||||
| (Decrease) in revenue | (4) | % | (4) | % | |||||||
| (Decrease) increase in net income | (5) | % | 2 | % | |||||||
Othermonetary assets and liabilities denominated in currencies other than the item discussed above, there were no significantfunctional currency of the entities in which they are recorded.
| Nine Months Ended September 30, | |||||||||||
| (in thousands) | 2023 | 2022 | |||||||||
| Foreign currency (loss) | $ | (11,351) | $ | (6,335) | |||||||
procedures
2023.
financial reporting
The following table sets forth information regarding our repurchases
Period | Total Number of Shares Purchased (in thousands) | Average Price Paid per Share | Total Number of Shares Purchased as Part of Publicly Announced Share Repurchase Program (1) (in thousands) | Approximate Dollar Value of Shares That May Yet Be Purchased at Period End Under Publicly Announced Share Repurchased Programs (1) (in thousands) | ||||||||||||
July 1, 2017 - July 31, 2017 | 12 | $ | 58.54 | — | $ | 36,399 | ||||||||||
August 1, 2017 - August 31, 2017 | 55 | 56.16 | — | 36,399 | ||||||||||||
September 1, 2017 - September 30, 2017 | 108 | 56.56 | — | 36,399 | ||||||||||||
|
| |||||||||||||||
Total | 175 | $ | 56.57 | |||||||||||||
|
| |||||||||||||||
(1) For additional information, see "Liquidity and Capital Resources" in Part I, Item 2 of this Quarterly Report. (2) Includes shares withheld to cover the option exercise price and tax withholding obligations for stock compensation awards subject to net settlement provisions. ITEM 5. OTHER INFORMATION Rule 10b5-1 and non-rule 10b5-1 trading arrangements During the three months ended September 30, 2023, no director or officer of the Company adopted or terminated a “Rule 10b5-1 trading arrangement” or “non-Rule 10b5-1 trading arrangement,” as each term is defined in Item 408(a) of Regulation S-K. ITEM 6. EXHIBITS
+ Indicates that the exhibit is being furnished with this report and is not filed as | |||||||||||||||||||||||||||||||||||||||||||||||||||||||||||||||||||||||||||||||||||||||||||||||||||||||||||||||||||||||||||||||||||||||||||||||||||||||||||||||||||||||||||||||||||||||||||||||||||||||||||||||||||||||||||||||||||||||||||||||||||||||||||||||||||||||||||||||||||||||||||||||||||||||||||||||||||||||||||||||||||||||||||||||||||||||||||||||||||||||||||||||||||||||||||||||||||||||||||||||||||||||||||||||||||||||||||||||||||||||||||||||||||||||||||||||||||||||||||||||||||||||||||||||||||||||||||||||||||||||||||||||||||||||||||||||||||||||||||||||||||||||||||||||||||||||||||||||||||||||||||||||||||||||||||||||||||||||
The following exhibits are filed or furnished, as the case may be, as part of this report.
EXHIBIT INDEX
|
| |
| Pegasystems Inc. | |||||||||||||||
| October 25, 2023 | /s/ KENNETH STILLWELL | ||||||||||||||
| Kenneth Stillwell | |||||||||||||||
| Chief | |||||||||||||||
| (Principal Financial Officer) | |||||||||||||||
27