UNITED STATES
SECURITIES AND EXCHANGE COMMISSION
Washington, D.C. 20549
FORM10-Q
(Mark One)
| ☒ | Quarterly Report pursuant to Section 13 or 15(d) of the Securities Exchange Act of 1934 |
For the quarterly period ended September 30, 2017March 31, 2018
OR
| ☐ | Transition Report pursuant to Section 13 or 15(d) of the Securities Exchange Act of 1934 |
For the transition period fromto
Commission File Number:1-11859
PEGASYSTEMS INC.
(Exact name of Registrant as specified in its charter)
| Massachusetts | 04-2787865 | |
(State or other jurisdiction of incorporation or organization) | (IRS Employer Identification No.) | |
| One Rogers Street, Cambridge, MA | 02142-1209 | |
| (Address of principal executive offices) | (Zip Code) | |
(617)374-9600
(Registrant’s telephone number, including area code)
Indicate by check mark whether the Registrant (1) has filed all reports required to be filed by Section 13 or 15(d) of the Securities Exchange Act of 1934 during the preceding 12 months (or for such shorter period that the Registrant was required to file such reports), and (2) has been subject to such filing requirements for the past 90 days. Yes ☒ No ☐
Indicate by check mark whether the registrantRegistrant has submitted electronically and posted on its corporate Web site, if any, every Interactive Data File required to be submitted and posted pursuant to Rule 405 of RegulationS-T during the preceding 12 months (or for such shorter period that the registrantRegistrant was required to submit and post such files). Yes ☒ No ☐
Indicate by check mark whether the Registrant is a large accelerated filer, an accelerated filer, anon-accelerated filer, a smaller reporting company, or an emerging growth company. See the definitions of “large accelerated filer,” “accelerated filer,” “smaller reporting company,” and “emerging growth company,”company” inRule 12b-2 of the Exchange Act.
| Large accelerated filer | ☒ | Accelerated filer ☐ | ||||||
Non-accelerated filer | ☐ (Do not check if smaller reporting company) | Smaller reporting company | ☐ | |||||
| Emerging growth company | ☐ | |||||||
If an emerging growth company, indicate by check mark if the registrantRegistrant has elected not to use the extended transition period for complying with any new or revised financial accounting standards provided pursuant to Section 13(a) of the Exchange Act. ☐
Indicate by check mark whether the Registrant is a shell company (as defined inRule 12b-2 of the Exchange Act). Yes ☐ No ☒
There were 77,859,95878,575,803 shares of the Registrant’s common stock, $.01$0.01 par value per share, outstanding on October 27, 2017.
May 1, 2018.
QUARTERLY REPORT ON FORM10-Q
Index to Form10-QTABLE OF CONTENTS
PART I—I - FINANCIAL INFORMATION
| ITEM 1. | UNAUDITED CONDENSED CONSOLIDATED FINANCIAL STATEMENTS |
PEGASYSTEMS INC.
UNAUDITED CONDENSED CONSOLIDATED BALANCE SHEETS
(in thousands)
| March 31, 2018 | December 31, 2017 | |||||||||||||||
| September 30, 2017 | December 31, 2016 |
| As Adjusted(1) | |||||||||||||
Assets | ||||||||||||||||
Current assets: | ||||||||||||||||
Cash and cash equivalents | $ | 130,568 | $ | 70,594 | $ | 165,790 | $ | 162,279 | ||||||||
Marketable securities | 63,812 | 63,167 | 89,047 | 61,469 | ||||||||||||
|
|
|
| |||||||||||||
Total cash, cash equivalents, and marketable securities | 194,380 | 133,761 | 254,837 | 223,748 | ||||||||||||
Trade accounts receivable, net of allowance of $6,189 and $4,126 | 191,161 | 265,028 | ||||||||||||||
Income taxes receivable | 34,864 | 14,155 | ||||||||||||||
Accounts receivable | 164,981 | 222,735 | ||||||||||||||
Unbilled receivables | 153,657 | 158,898 | ||||||||||||||
Other current assets | 17,679 | 12,188 | 50,692 | 41,135 | ||||||||||||
|
|
|
| |||||||||||||
Total current assets | 438,084 | 425,132 | 624,167 | 646,516 | ||||||||||||
Property and equipment, net | 39,849 | 38,281 | ||||||||||||||
Deferred income taxes | 73,459 | 69,898 | ||||||||||||||
Long-term other assets | 5,982 | 3,990 | ||||||||||||||
Intangible assets, net | 34,755 | 44,191 | ||||||||||||||
Long-term unbilled receivables | 180,077 | 160,708 | ||||||||||||||
Goodwill | 72,941 | 73,164 | 73,017 | 72,952 | ||||||||||||
Other long-term assets | 128,694 | 131,391 | ||||||||||||||
|
|
|
| |||||||||||||
Total assets | $ | 665,070 | $ | 654,656 | $ | 1,005,955 | $ | 1,011,567 | ||||||||
|
|
|
| |||||||||||||
Liabilities and Stockholders’ Equity | ||||||||||||||||
Liabilities and stockholders’ equity | ||||||||||||||||
Current liabilities: | ||||||||||||||||
Accounts payable | $ | 12,535 | $ | 14,414 | $ | 12,175 | $ | 17,370 | ||||||||
Accrued expenses | 39,681 | 36,751 | 48,278 | 45,508 | ||||||||||||
Accrued compensation and related expenses | 53,869 | 60,660 | 44,093 | 66,040 | ||||||||||||
Deferred revenue | 160,931 | 175,647 | 175,586 | 166,297 | ||||||||||||
|
|
|
| |||||||||||||
Total current liabilities | 267,016 | 287,472 | 280,132 | 295,215 | ||||||||||||
Income taxes payable | 4,774 | 4,263 | ||||||||||||||
Long-term deferred revenue | 6,130 | 10,989 | ||||||||||||||
Deferred income tax liabilities | 39,932 | 38,463 | ||||||||||||||
Other long-term liabilities | 15,449 | 16,043 | 23,768 | 23,652 | ||||||||||||
|
|
|
| |||||||||||||
Total liabilities | 293,369 | 318,767 | 343,832 | 357,330 | ||||||||||||
|
| |||||||||||||||
Stockholders’ equity: | ||||||||||||||||
Preferred stock, 1,000 shares authorized; no shares issued and outstanding | — | — | — | — | ||||||||||||
Common stock, 200,000 shares authorized; 77,839 shares and 76,591 shares issued and outstanding | 778 | 766 | ||||||||||||||
Common stock, 200,000 shares authorized; 78,546 shares and 78,081 issued and outstanding at March 31, 2018 and December 31, 2017, respectively | 785 | 781 | ||||||||||||||
Additionalpaid-in capital | 146,728 | 143,903 | 145,962 | 152,097 | ||||||||||||
Retained earnings | 227,953 | 198,315 | 517,893 | 508,051 | ||||||||||||
Accumulated other comprehensive loss | (3,758 | ) | (7,095 | ) | (2,517) | (6,692) | ||||||||||
|
|
|
| |||||||||||||
Total stockholders’ equity | 371,701 | 335,889 | 662,123 | 654,237 | ||||||||||||
|
|
|
| |||||||||||||
Total liabilities and stockholders’ equity | $ | 665,070 | $ | 654,656 | $ | 1,005,955 | $ | 1,011,567 | ||||||||
|
|
|
| |||||||||||||
| (1) | The Company adopted the new revenue recognition standard (“ASC 606”) on January 1, 2018 and has adjusted prior periods to conform. See Note 2. “New Accounting Pronouncements” for additional information. |
See notes to unaudited condensed consolidated financial statements.
PEGASYSTEMS INC.
UNAUDITED CONDENSED CONSOLIDATED STATEMENTS OF OPERATIONS
(in thousands, except per share amounts)
| Three Months Ended September 30, | Nine Months Ended September 30, | Three Months Ended March 31, | ||||||||||||||||||||||
| 2017 | 2016 | 2017 | 2016 | 2018 | 2017 | |||||||||||||||||||
Revenue: | ||||||||||||||||||||||||
| As Adjusted(1) | |||||||||||||||||||||||
Revenue | ||||||||||||||||||||||||
Software license | $ | 41,793 | $ | 68,833 | $ | 195,220 | $ | 207,849 | $ | 87,773 | $ | 127,008 | ||||||||||||
Maintenance | 62,204 | 55,038 | 180,759 | 163,174 | 64,525 | 58,713 | ||||||||||||||||||
Services | 75,818 | 58,931 | 225,063 | 179,633 | 82,884 | 70,588 | ||||||||||||||||||
|
|
|
|
|
| |||||||||||||||||||
Total revenue | 179,815 | 182,802 | 601,042 | 550,656 | 235,182 | 256,309 | ||||||||||||||||||
|
|
|
|
|
| |||||||||||||||||||
Cost of revenue: | ||||||||||||||||||||||||
Cost of revenue | ||||||||||||||||||||||||
Software license | 1,276 | 1,313 | 3,826 | 3,646 | 1,255 | 1,300 | ||||||||||||||||||
Maintenance | 6,716 | 6,659 | 20,945 | 18,889 | 6,082 | 7,218 | ||||||||||||||||||
Services | 61,739 | 52,465 | 180,925 | 154,512 | 68,277 | 59,572 | ||||||||||||||||||
|
|
|
|
|
| |||||||||||||||||||
Total cost of revenue | 69,731 | 60,437 | 205,696 | 177,047 | 75,614 | 68,090 | ||||||||||||||||||
|
|
|
|
|
| |||||||||||||||||||
Gross profit | 110,084 | 122,365 | 395,346 | 373,609 | 159,568 | 188,219 | ||||||||||||||||||
|
|
|
|
|
| |||||||||||||||||||
Operating expenses: | ||||||||||||||||||||||||
Operating expenses | ||||||||||||||||||||||||
Selling and marketing | 70,209 | 67,032 | 217,384 | 202,126 | 88,383 | 69,681 | ||||||||||||||||||
Research and development | 41,031 | 38,036 | 121,089 | 108,530 | 46,785 | 40,296 | ||||||||||||||||||
General and administrative | 13,133 | 11,725 | 38,174 | 34,067 | 16,464 | 12,335 | ||||||||||||||||||
Acquisition-related | — | 74 | — | 2,903 | ||||||||||||||||||||
|
|
|
|
|
| |||||||||||||||||||
Total operating expenses | 124,373 | 116,867 | 376,647 | 347,626 | 151,632 | 122,312 | ||||||||||||||||||
|
|
|
|
|
| |||||||||||||||||||
(Loss)/income from operations | (14,289 | ) | 5,498 | 18,699 | 25,983 | |||||||||||||||||||
Income from operations | 7,936 | 65,907 | ||||||||||||||||||||||
|
| |||||||||||||||||||||||
Foreign currency transaction (loss)/gain | (552 | ) | 1,082 | (793 | ) | 2,764 | (1,085) | 745 | ||||||||||||||||
Interest income, net | 144 | 172 | 470 | 650 | 764 | 205 | ||||||||||||||||||
Other income/(expense), net | — | (1,237 | ) | 287 | (4,891 | ) | 363 | (279) | ||||||||||||||||
|
|
|
|
|
| |||||||||||||||||||
(Loss)/income before (benefit)/provision for income taxes | (14,697 | ) | 5,515 | 18,663 | 24,506 | |||||||||||||||||||
Income before (benefit)/provision for income taxes | 7,978 | 66,578 | ||||||||||||||||||||||
(Benefit)/provision for income taxes | (12,885 | ) | 2,214 | (17,952 | ) | 6,269 | (4,222) | 13,615 | ||||||||||||||||
|
|
|
|
|
| |||||||||||||||||||
Net (loss)/income | $ | (1,812 | ) | $ | 3,301 | $ | 36,615 | $ | 18,237 | |||||||||||||||
Net income | $ | 12,200 | $ | 52,963 | ||||||||||||||||||||
|
|
|
|
|
| |||||||||||||||||||
(Loss)/earnings per share: | ||||||||||||||||||||||||
Earnings per share | ||||||||||||||||||||||||
Basic | (0.03 | ) | 0.04 | 0.47 | 0.24 | $ | 0.16 | $ | 0.69 | |||||||||||||||
Diluted | (0.03 | ) | 0.04 | 0.44 | 0.23 | $ | 0.15 | $ | 0.65 | |||||||||||||||
Weighted-average number of common shares outstanding: | ||||||||||||||||||||||||
Weighted-average number of common shares outstanding | ||||||||||||||||||||||||
Basic | 77,691 | 76,278 | 77,258 | 76,323 | 78,236 | 76,761 | ||||||||||||||||||
Diluted | 77,691 | 79,548 | 82,717 | 79,401 | 83,102 | 81,875 | ||||||||||||||||||
Cash dividends declared per share | $ | 0.03 | $ | 0.03 | $ | 0.09 | $ | 0.09 | $ | 0.03 | $ | 0.03 | ||||||||||||
| (1) | The Company adopted ASC 606 on January 1, 2018 and has adjusted prior periods to conform. See Note 2. “New Accounting Pronouncements” for additional information. |
See notes to unaudited condensed consolidated financial statements.
PEGASYSTEMS INC.
UNAUDITED CONDENSED CONSOLIDATED STATEMENTS OF COMPREHENSIVE INCOME
(in thousands)
| Three Months Ended September 30, | Nine Months Ended September 30, | |||||||||||||||
| 2017 | 2016 | 2017 | 2016 | |||||||||||||
Net (loss)/income | $ | (1,812 | ) | $ | 3,301 | $ | 36,615 | $ | 18,237 | |||||||
Other comprehensive income/(loss), net of tax | ||||||||||||||||
Unrealized gain/(loss) onavailable-for-sale marketable securities, net of tax | 22 | (174 | ) | 148 | 168 | |||||||||||
Foreign currency translation adjustments | 549 | (169 | ) | 3,189 | (1,400 | ) | ||||||||||
|
|
|
|
|
|
|
| |||||||||
Total other comprehensive income/(loss), net of tax | 571 | (343 | ) | 3,337 | (1,232 | ) | ||||||||||
|
|
|
|
|
|
|
| |||||||||
Comprehensive (loss)/income | $ | (1,241 | ) | $ | 2,958 | $ | 39,952 | $ | 17,005 | |||||||
|
|
|
|
|
|
|
| |||||||||
| Three Months Ended March 31, | ||||||||
| 2018 | 2017 | |||||||
| As Adjusted(1) | |||||||
Net income | $ | 12,200 | $ | 52,963 | ||||
Other comprehensive income, net of tax | ||||||||
Unrealized (loss)/gain onavailable-for-sale marketable securities, net of tax | (188) | 127 | ||||||
Foreign currency translation adjustments | 4,363 | 2,229 | ||||||
|
|
|
| |||||
Total other comprehensive income, net of tax | 4,175 | 2,356 | ||||||
|
|
|
| |||||
Comprehensive income | $ | 16,375 | $ | 55,319 | ||||
|
|
|
| |||||
| (1) | The Company adopted ASC 606 on January 1, 2018 and has adjusted prior periods to conform. See Note 2. “New Accounting Pronouncements” for additional information. |
See notes to unaudited condensed consolidated financial statements.
PEGASYSTEMS INC.
UNAUDITED CONDENSED CONSOLIDATED STATEMENTS OF CASH FLOWS
(in thousands)
| Nine Months Ended September 30, | ||||||||
| 2017 | 2016 | |||||||
Operating activities: | ||||||||
Net income | $ | 36,615 | $ | 18,237 | ||||
Adjustments to reconcile net income to cash provided by operating activities: | ||||||||
Deferred income taxes | (2,607 | ) | (2,841 | ) | ||||
Depreciation and amortization | 18,703 | 17,896 | ||||||
Stock-based compensation expense | 39,929 | 30,634 | ||||||
Foreign currency transaction loss/(gain) | 793 | (2,764 | ) | |||||
Othernon-cash | (89 | ) | 153 | |||||
Change in operating assets and liabilities: | ||||||||
Trade accounts receivable | 80,580 | 3,940 | ||||||
Income taxes receivable and other current assets | (25,943 | ) | (11,904 | ) | ||||
Accounts payable and accrued expenses | (8,546 | ) | (16,678 | ) | ||||
Deferred revenue | (25,639 | ) | (17,698 | ) | ||||
Other long-term assets and liabilities | 130 | 1,581 | ||||||
|
|
|
| |||||
Cash provided by operating activities | 113,926 | 20,556 | ||||||
Investing activities: | ||||||||
Purchases of marketable securities | (25,687 | ) | (22,614 | ) | ||||
Proceeds from maturities and called marketable securities | 23,124 | 21,838 | ||||||
Sales of marketable securities | — | 62,283 | ||||||
Payments for acquisitions, net of cash acquired | (297 | ) | (49,113 | ) | ||||
Investment in property and equipment | (9,106 | ) | (15,253 | ) | ||||
|
|
|
| |||||
Cash used in investing activities | (11,966 | ) | (2,859 | ) | ||||
Financing activities: | ||||||||
Dividend payments to shareholders | (6,941 | ) | (6,883 | ) | ||||
Common stock repurchases for tax withholdings for net settlement of equity awards | (34,113 | ) | (10,398 | ) | ||||
Common stock repurchases under share repurchase programs | (2,986 | ) | (25,750 | ) | ||||
|
|
|
| |||||
Cash used in financing activities | (44,040 | ) | (43,031 | ) | ||||
Effect of exchange rates on cash and cash equivalents | 2,054 | (1,309 | ) | |||||
|
|
|
| |||||
Net increase/(decrease) in cash and cash equivalents | 59,974 | (26,643 | ) | |||||
Cash and cash equivalents, beginning of period | 70,594 | 93,026 | ||||||
|
|
|
| |||||
Cash and cash equivalents, end of period | $ | 130,568 | $ | 66,383 | ||||
|
|
|
| |||||
| Three Months Ended March 31, | ||||||||
| 2018 | 2017 | |||||||
| As Adjusted(1) | |||||||
Operating activities: | ||||||||
Net income | $ | 12,200 | $ | 52,963 | ||||
Adjustments to reconcile net income to cash provided by operating activities: | ||||||||
Change in operating assets and liabilities, net | 19,591 | (47,555) | ||||||
Stock-based compensation expense | 15,109 | 12,508 | ||||||
Depreciation and amortization of intangible assets | 6,145 | 6,088 | ||||||
Othernon-cash | 2,610 | 8,440 | ||||||
|
|
|
| |||||
Cash provided by operating activities | 55,655 | 32,444 | ||||||
Investing activities: | ||||||||
Purchases of investments | (35,204) | (3,322) | ||||||
Proceeds from maturities and called investments | 5,995 | 2,300 | ||||||
Other | (2,069) | (2,705) | ||||||
|
|
|
| |||||
Cash used in investing activities | (31,278) | (3,727) | ||||||
Financing activities: | ||||||||
Dividend payments to shareholders | (2,344) | (2,298) | ||||||
Common stock repurchases | (20,708) | (13,696) | ||||||
|
|
|
| |||||
Cash used in financing activities | (23,052) | (15,994) | ||||||
Effect of exchange rates on cash and cash equivalents | 2,186 | 521 | ||||||
|
|
|
| |||||
Net increase in cash and cash equivalents | 3,511 | 13,244 | ||||||
Cash and cash equivalents, beginning of period | 162,279 | 70,594 | ||||||
|
|
|
| |||||
Cash and cash equivalents, end of period | $ | 165,790 | $ | 83,838 | ||||
|
|
|
| |||||
| (1) | The Company adopted ASC 606 on January 1, 2018 and has adjusted prior periods to conform. See Note 2. “New Accounting Pronouncements” for additional information. |
See notes to unaudited condensed consolidated financial statements.
PEGASYSTEMS INC.
NOTES TO UNAUDITED CONDENSED CONSOLIDATED FINANCIAL STATEMENTS
1. BASIS OF PRESENTATION
Pegasystems Inc. (together with its subsidiaries, “the Company”) has prepared the accompanying unaudited condensed consolidated financial statements pursuant to the rules and regulations of the U.S. Securities and Exchange Commission (“SEC”) regarding interim financial reporting. Accordingly, they do not include all of the information and footnotes required by accounting principles generally accepted in the United States of America (“U.S.”) for complete financial statements and should be read in conjunction with the Company’s audited financial statements included in the Annual Report on Form10-K for the year ended December 31, 2016.2017.
On January 1, 2018 the Company adopted Accounting Standards Update (“ASU”) ASUNo. 2014-09, “Revenue from Contracts with Customers (Topic 606)” using the full retrospective method which required each prior reporting period presented to be adjusted to reflect the application of this ASU. See Note 2. “New Accounting Pronouncements” for additional information.
In the opinion of management, the Company has prepared the accompanying unaudited condensed consolidated financial statements on the same basis as its audited financial statements, and these financial statements include all adjustments, consisting only of normal recurring adjustments, necessary for a fair presentation of the results of the interim periods presented.
The operating results for the interim periods presented are not necessarily indicative of the results expected for the full year 2017.2018.
2. NEW ACCOUNTING PRONOUNCEMENTS
Stock-Based Compensation
In May 2017, the Financial Accounting Standards Board (“FASB”) issued Accounting Standards Update (“ASU”)No. 2017-09 “Stock Compensation (Topic 718), Scope of Modification Accounting” to clarify when to account for a change to the terms or conditions of a share-based payment award as a modification. Under the new guidance, modification accounting is required only if the fair value, the vesting conditions, or the classification of the award (as equity or liability) changes as a result of the change in terms or conditions. The effective date for the Company will be January 1, 2018. The Company does not expect the adoption of this standard to have a material effect on its financial position or results of operations.
Financial Instruments
In June 2016, the FASBFinancial Accounting Standards Board (“FASB”) issued ASUNo. 2016-13, “Financial Instruments—Instruments - Credit Losses (Topic 326): Measurement of Credit Losses on Financial Instruments,” which requires measurement and recognition of expected credit losses for financial assets measured at amortized cost, including trade accounts receivable, upon initial recognition of that financial asset using a forward-looking expected loss model, rather than an incurred loss model for credit losses. Credit losses relating toavailable-for-sale debt securities should be recorded through an allowance for credit losses when the fair value is below the amortized cost of the asset, removing the concept of “other-than-temporary” impairments. The effective date for the Company will be January 1, 2020, with early adoption permitted. The Company is currently evaluating the effect this ASU will have on its consolidated financial statements and related disclosures.
Leases
In February 2016, the FASB issued ASUNo. 2016-02, “Leases (Topic 842),” which requires lessees to record most leases on their balance sheets, recognizing a lease liability for the obligation to make lease payments and aright-of-use asset for the right to use the underlying asset for the lease term. The effective date for the Company will be January 1, 2019, with early adoption permitted. The Company expects that most of its operating lease commitments will be subject to this ASU and recognized as operating lease liabilities andright-of-use assets upon adoption with no material impact to its results of operations and cash flows.
RevenueASC 606 and ASC340-40
In May 2014, the FASB issued ASUNo. 2014-09, “Revenue from Contracts with Customers (Topic 606)”. This ASU amends the guidance for revenue recognition, creating the new Accounting Standards Codification Topic 606 (“ASC 606”).The Company adopted ASC 606 requires entities to apportion consideration from contracts to performance obligationsand ASC340-40 on a relative standalone selling price basis, based on a five-step model. Under ASC 606, revenue is recognized when a customer obtains control of a promised good or service and is recognized in an amount that reflects the consideration which the entity expects to receive in exchange for the good or service. In addition, ASC 606 requires disclosure of the nature, amount, timing, and uncertainty of revenue and cash flows arising from contracts with customers.
The Company has electedJanuary 1, 2018 using the full retrospective adoption model, effective January 1, 2018. The Company’s quarterly results beginning withmethod, which required the quarter ending March 31, 2018 and comparativeCompany to retrospectively adjust the prior periods will be compliant withpresented.
The most significant impacts of adopting ASC 606. The Company’s Annual Report on Form606 and ASC10-K340-40 for the year ended December 31, 2018 will be the Company’s first Annual Report that will be issued in compliance with ASC 606.were as follows:
| • | Perpetual licenses with extended payment terms and term licenses- Revenue from perpetual license with extended payment terms and term license is now recognized when control is transferred to the client, the point in time when the client can use and benefit from the license. Previously the Company recognized revenue over the term of the agreements as payments became due or earlier if prepaid. Any unrecognized license revenue from these arrangements is recognized in the period that control transfers, as either a cumulative adjustment to retained earnings as of December 31, 2015 or as revenue in periods thereafter. Unbilled receivables in the Company’s unaudited condensed consolidated balance sheets increased significantly due to the revenue from perpetual license with extended payment terms and term license being recognized prior to amounts billed, or prepaid by, clients. |
| • | Allocation of future credits and significant discounts - The perpetual or term licenses delivered are a separate performance obligation which now requires us to allocate any future credits and discounts to the performance obligations in the arrangement based upon their relative stand-alone selling prices. |
PEGASYSTEMS INC.
NOTES TO UNAUDITED CONDENSED CONSOLIDATED FINANCIAL STATEMENTS (continued)
| • | Deferred contract costs - Sales incentive programs and other incremental and recoverable costs to obtain a contract were previously expensed when incurred. ASC340-40 requires these costs to be recognized as an asset when incurred and to be expensed over the period of expected benefit, which is on average five years. This change primarily impacts the Company’s contracts related to multi-year cloud offerings, maintenance on term and perpetual licenses, and those long-term term and perpetual licenses with client usage rights that increase over time. |
The Company has made significant progress
| • | Taxes - The corresponding effect on tax balances in relation to all of the above impacts has also been recognized. |
For additional information on quantifying the impact of its adoption and identifying necessary changes to ourCompany’s accounting policies processes, systems, and controls.
The Company expects the following impacts:
The impact of the license is transferred to the customer instead of over the term of the agreement. Revenue from the maintenance performance obligations is expected to be recognized on a straight-line basis over the contractual term. Due to the revenue from termadoption ASC 606 and perpetual licenses with extended payment terms being recognized prior to amounts being billed to the customer, the Company expects to recognize a net contract assetASC340-40 on the Company’s unaudited condensed consolidated balance sheet.
| December 31, 2017 | ||||||||||||
| (in thousands) | Previously reported | Adjustments | As adjusted | |||||||||
Accounts receivable and unbilled receivables | $ | 248,331 | $ | 133,302 | $ | 381,633 | ||||||
Contract assets | — | 914 | 914 | |||||||||
Long-term unbilled receivables | — | 160,708 | 160,708 | |||||||||
Deferred income taxes | 57,127 | (42,887) | 14,240 | |||||||||
Deferred contract costs | — | 37,924 | 37,924 | |||||||||
Other assets(1) | 416,148 | — | 416,148 | |||||||||
|
|
|
|
|
| |||||||
Total Assets | 721,606 | 289,961 | 1,011,567 | |||||||||
|
|
|
|
|
| |||||||
Deferred revenue | 195,073 | (28,776) | 166,297 | |||||||||
Long-term deferred revenue | 6,591 | (2,885) | 3,706 | |||||||||
Deferred income tax liabilities | — | 38,463 | 38,463 | |||||||||
Other liabilities(2) | 148,864 | — | 148,864 | |||||||||
|
|
|
|
|
| |||||||
Total liabilities | 350,528 | 6,802 | 357,330 | |||||||||
Foreign currency translation adjustments | (3,494) | (2,966) | (6,460) | |||||||||
Retained earnings | 221,926 | 286,125 | 508,051 | |||||||||
Other equity(3) | 152,646 | — | 152,646 | |||||||||
|
|
|
|
|
| |||||||
Total stockholders’ equity | 371,078 | 283,159 | 654,237 | |||||||||
|
|
|
|
|
| |||||||
Total liabilities and stockholders’ equity | $ | 721,606 | $ | 289,961 | $ | 1,011,567 | ||||||
|
|
|
|
|
| |||||||
| (1) | Includes cash and cash equivalents, marketable securities, income taxes receivable, other current assets, property and equipment, intangible assets, goodwill, and other long-term assets (as reflected in the consolidated balance sheets in the Annual Report on Form10-K for the year ended December 31, 2017). |
| (2) | Includes accounts payable, accrued expenses, accrued compensation and related expenses, income taxes payable, and other long-term liabilities (as reflected in the consolidated balance sheets in the Annual Report on Form10-K for the year ended December 31, 2017). |
| (3) | Includes common stock, additionalpaid-in capital, and net unrealized loss onavailable-for-sale marketable securities (as reflected in the consolidated balance sheets in the Annual Report on Form10-K for the year ended December 31, 2017). |
PEGASYSTEMS INC.
NOTES TO UNAUDITED CONDENSED CONSOLIDATED FINANCIAL STATEMENTS (continued)
| Three Months Ended | ||||||||||||
| March 31, 2017 | ||||||||||||
| (in thousands, except per share amounts) | Previously reported | Adjustments | As adjusted | |||||||||
Revenue: | ||||||||||||
Software license | $ | 92,390 | $ | 34,618 | $ | 127,008 | ||||||
Maintenance | 58,965 | (252) | 58,713 | |||||||||
Services | 71,892 | (1,304) | 70,588 | |||||||||
|
|
|
|
|
| |||||||
Total revenue | 223,247 | 33,062 | 256,309 | |||||||||
|
|
|
|
|
| |||||||
Cost of revenue: | ||||||||||||
Software license | 1,300 | — | 1,300 | |||||||||
Maintenance | 7,218 | — | 7,218 | |||||||||
Services | 59,572 | — | 59,572 | |||||||||
|
|
|
|
|
| |||||||
Total cost of revenue | 68,090 | — | 68,090 | |||||||||
|
|
|
|
|
| |||||||
Gross profit | 155,157 | 33,062 | 188,219 | |||||||||
|
|
|
|
|
| |||||||
Operating expenses: | ||||||||||||
Selling and marketing | 71,288 | (1,607 | ) | 69,681 | ||||||||
Research and development | 40,296 | — | 40,296 | |||||||||
General and administrative | 12,335 | — | 12,335 | |||||||||
|
|
|
|
|
| |||||||
Total operating expenses | 123,919 | (1,607 | ) | 122,312 | ||||||||
|
|
|
|
|
| |||||||
Income from operations | 31,238 | 34,669 | 65,907 | |||||||||
|
|
|
|
|
| |||||||
Foreign currency transaction gain | 676 | 69 | 745 | |||||||||
Interest income, net | 165 | 40 | 205 | |||||||||
Other expense, net | (279) | — | (279) | |||||||||
|
|
|
|
|
| |||||||
Income before provision for income taxes | 31,800 | 34,778 | 66,578 | |||||||||
Provision for income taxes | 4,779 | 8,836 | 13,615 | |||||||||
|
|
|
|
|
| |||||||
Net income | $ | 27,021 | $ | 25,942 | $ | 52,963 | ||||||
|
|
|
|
|
| |||||||
Earnings per share: | ||||||||||||
Basic | $ | 0.35 | $ | 0.69 | ||||||||
|
|
|
| |||||||||
Diluted | $ | 0.33 | $ | 0.65 | ||||||||
|
|
|
| |||||||||
Weighted-average number of common shares outstanding: | ||||||||||||
Basic | 76,761 | 76,761 | ||||||||||
Diluted | 81,875 | 81,875 | ||||||||||
Adoption of ASC 606 had no impact on total cash from or used in operating, financing, or investing activities in the Company’s unaudited condensed consolidated statements of cash flows for the three months ended March 31, 2017.
3. MARKETABLE SECURITIES
The Company’s marketable securities are as follows:
| March 31, 2018 | ||||||||||||||||
| (in thousands) | Amortized Cost | Unrealized Gains | Unrealized Losses | Fair Value | ||||||||||||
Municipal bonds | $ | 50,782 | $ | — | $ | (191) | $ | 50,591 | ||||||||
Corporate bonds | 38,761 | 1 | (306) | 38,456 | ||||||||||||
|
|
|
|
|
|
|
| |||||||||
| $ | 89,543 | $ | 1 | $ | (497) | $ | 89,047 | |||||||||
|
|
|
|
|
|
|
| |||||||||
| December 31, 2017 | ||||||||||||||||
| (in thousands) | Amortized Cost | Unrealized Gains | Unrealized Losses | Fair Value | ||||||||||||
Municipal bonds | $ | 32,996 | $ | — | $ | (148) | $ | 32,848 | ||||||||
Corporate bonds | 28,757 | 1 | (137) | 28,621 | ||||||||||||
|
|
|
|
|
|
|
| |||||||||
| $ | 61,753 | $ | 1 | $ | (285) | $ | 61,469 | |||||||||
|
|
|
|
|
|
|
| |||||||||
PEGASYSTEMS INC.
NOTES TO UNAUDITED CONDENSED CONSOLIDATED FINANCIAL STATEMENTS (continued)
| (in thousands) | Amortized Cost | Unrealized Gains | Unrealized Losses | Fair Value | ||||||||||||
September 30, 2017 | ||||||||||||||||
Municipal bonds | $ | 32,764 | $ | 12 | �� | $ | (17 | ) | $ | 32,759 | ||||||
Corporate bonds | 31,079 | 12 | (38 | ) | 31,053 | |||||||||||
|
|
|
|
|
|
|
| |||||||||
| $ | 63,843 | $ | 24 | $ | (55 | ) | $ | 63,812 | ||||||||
|
|
|
|
|
|
|
| |||||||||
December 31, 2016 | ||||||||||||||||
Municipal bonds | $ | 36,746 | $ | — | $ | (139 | ) | $ | 36,607 | |||||||
Corporate bonds | 26,610 | 1 | (51 | ) | 26,560 | |||||||||||
|
|
|
|
|
|
|
| |||||||||
| $ | 63,356 | $ | 1 | $ | (190 | ) | $ | 63,167 | ||||||||
|
|
|
|
|
|
|
| |||||||||
As of September 30, 2017,March 31, 2018, the Company did not hold any investments with unrealized losses that are considered to be other-than-temporary.
As of September 30, 2017,March 31, 2018, remaining maturities of marketable debt securities ranged from October 2017May 2018 to September 2020,February 2021, with a weighted-average remaining maturity of approximately 14 months.1.4 years.
4. DERIVATIVE INSTRUMENTSRECEIVABLES, CONTRACT ASSETS, AND DEFERRED REVENUE
In MayReceivables
(in thousands)
| March 31, 2018 | December 31, 2017 | ||||||
Accounts receivable | $ | 164,981 | $ | 222,735 | ||||
Unbilled receivables | 153,657 | 158,898 | ||||||
Long-term unbilled receivables | 180,077 | 160,708 | ||||||
|
|
|
| |||||
Total receivables | $ | 498,715 | $ | 542,341 | ||||
|
|
|
| |||||
Unbilled receivables is the amount due from clients where the only condition on the right of payment is the passage of time. The Company regularly reassesses receivables for collectability. As of March 31, 2018 and December 31, 2017, the Company discontinued its forwardallowance for doubtful accounts was not material.
Long-term unbilled receivables are expected to be billed as follows:
(in thousands)
| March 31, 2018 | |||
2019 | $ | 82,518 | ||
2020 | 58,433 | |||
2021 | 31,129 | |||
2022 and thereafter | 7,997 | |||
|
| |||
| $ | 180,077 | |||
|
| |||
Contract assets and deferred revenue
(in thousands)
| March 31, 2018 | December 31, 2017 | ||||||
Contract assets(1) | $ | 788 | $ | 914 | ||||
Deferred revenue | 175,586 | 166,297 | ||||||
Long-term deferred revenue(2) | $ | 3,277 | $ | 3,706 | ||||
(1)Included in other current assets in the unaudited condensed consolidated balance sheets.
(2) Included in other long-term liabilities in the unaudited condensed consolidated balance sheets.
Contract assets and deferred revenue are presented net at the contract level for each reporting period. Contract assets are unbilled amounts resulting from client contracts program; however, it will continuewhere revenue recognized exceeds the amount billed to evaluate periodically its foreign exchange exposuresthe client and mayre-initiate this program if itthe right to payment is deemed necessary.subject to conditions other than the passage of time, such as the completion of a related performance obligation. Deferred revenue consists of billings and payments received in advance of revenue recognition.
The Company has historically used foreign currency forward contracts (“forward contracts”)change in deferred revenue in the three months ended March 31, 2018, excluding the impact of the netting of contract assets and deferred revenue, was primarily due to hedge its exposure to fluctuationsnew billings in foreign currency exchange rates associated with its foreign currency denominated cash, accounts receivable,advance of revenue recognition and intercompany receivables and payables held primarily by the U.S. parent company and its United Kingdom (“U.K.”) subsidiary.
At$101.6 million of revenue recognized that was included in deferred revenue at December 31, 2016, the total notional value2017.
Major clients
No client represented 10% or more of the Company’s outstanding forwardtotal receivables as of March 31, 2018 or December 31, 2017.
5. DEFERRED CONTRACT COSTS
Sales incentives paid by the Company are considered incremental and recoverable costs of obtaining a contract with a client. These costs are deferred, as a long-term asset, and then amortized using the straight-line method over the period of benefit which is on average five years. The Company determined the period of benefit by taking into consideration client contracts, was $128.4 million.
The fair value of the Company’s outstanding forward contracts was as follows:
| December 31, 2016 | ||||||||
| (in thousands) | Recorded In: | Fair Value | ||||||
Asset Derivatives | ||||||||
Foreign currency forward contracts | Other current assets | $ | 628 | |||||
Liability Derivatives | ||||||||
Foreign currency forward contracts | Accrued expenses | $ | 883 | |||||
As of September 30, 2017, the Company did not have any forward contracts outstanding.
technology, and other factors. The Company had forward contracts outstanding with total notional valuesutilizes a practical expedient available under ASC 606 to expense costs to obtain a contract as of September 30, 2016 as follows:incurred when the original
| (in thousands) | ||||
Euro | € | 21,810 | ||
British pound | £ | 5,919 | ||
Australian dollar | A$ | 19,515 | ||
United States dollar | $ | 59,450 | ||
PEGASYSTEMS INC.
NOTES TO UNAUDITED CONDENSED CONSOLIDATED FINANCIAL STATEMENTS (continued)
amortization period is one year or less. During the three months ended March 31, 2018 and 2017, impairment of deferred contract costs was not material.
(in thousands)
| March 31, 2018 | December 31, 2017 | ||
Deferred contract costs(1) | $ 39,781 | $ 37,924 | ||
(1) Included in other long-term assets in the unaudited condensed consolidated balance sheets.
Amortization of deferred contract costs was as follows: | ||||
Three Months Ended March 31, | ||||
| (in thousands) | 2018 | 2017 | ||
Amortization of deferred contract costs(1) | $3,789 | $2,594 | ||
(1) Included in selling and marketing expenses in the unaudited condensed consolidated statement of operations.
6. GOODWILL AND OTHER INTANGIBLE ASSETS
The income statement impactchanges in the carrying amount of the Company’s outstanding forward contracts and foreign currency transactions wasgoodwill were as follows:
| Three Months Ended September 30, | Nine Months Ended September 30, | |||||||||||||||
| (in thousands) | 2017 | 2016 | 2017 | 2016 | ||||||||||||
Gain (loss) from the change in the fair value of forward contracts included in other income (expense), net | $ | — | $ | (1,237 | ) | $ | 286 | $ | (4,955 | ) | ||||||
Foreign currency transaction (loss) gain from the remeasurement of foreign currency assets and liabilities | (552 | ) | 1,082 | (793 | ) | 2,764 | ||||||||||
|
|
|
|
|
|
|
| |||||||||
| $ | (552 | ) | $ | (155 | ) | $ | (507 | ) | $ | (2,191 | ) | |||||
|
|
|
|
|
|
|
| |||||||||
| (in thousands) | Three Months Ended March 31, | |||
| 2018 | ||||
Balance as of January 1, | $ | 72,952 | ||
Purchase price adjustments to goodwill | — | |||
Currency translation adjustments | 65 | |||
Balance as of March 31, | $ | 73,017 | ||
5.Intangible assets are recorded at cost and are amortized using the straight-line method over their estimated useful lives as follows:
March 31, 2018 | ||||||||
| (in thousands) | Useful Lives | Cost | Accumulated | Net Book Value(1) | ||||
Client-related intangibles | 9-10 years | $ 63,197 | $ (46,456) | $ 16,741 | ||||
Technology | 7-10 years | 58,942 | (46,603) | 12,339 | ||||
Other intangibles | — | 5,361 | (5,361) | — | ||||
|
|
| ||||||
| $ 127,500 | $ (98,420) | $ 29,080 | ||||||
|
|
| ||||||
(1) Included in other long-term assets in the unaudited condensed consolidated balance sheet. | ||||||||
December 31, 2017 | ||||||||
| (in thousands) | Useful Lives | Cost | Accumulated | Net Book Value(1) | ||||
Client-related intangibles | 9-10 years | $ 63,164 | $ (44,835) | $ 18,329 | ||||
Technology | 7-10 years | 58,942 | (45,372) | 13,570 | ||||
Other intangibles | — | 5,361 | (5,361) | — | ||||
|
|
| ||||||
| $ 127,467 | $ (95,568) | $ 31,899 | ||||||
|
|
| ||||||
PEGASYSTEMS INC.
NOTES TO UNAUDITED CONDENSED CONSOLIDATED FINANCIAL STATEMENTS (continued)
| (1) | Included in other long-term assets in the unaudited condensed consolidated balance sheets. |
Amortization of intangibles assets is reflected in the Company’s unaudited condensed consolidated statements of operations as follows:
| Three Months Ended March 31, | ||||||||
| (in thousands) | 2018 | 2017 | ||||||
Cost of revenue |
$ |
1,232 |
|
$ |
1,334 |
| ||
Selling and marketing | 1,605 | 1,866 | ||||||
|
|
|
| |||||
| $ | 2,837 | $ | 3,200 | |||||
|
|
|
| |||||
7. ACCRUED EXPENSES
| (in thousands) | March 31, 2018 | December 31, 2017 | ||||||
Outside professional services |
$ |
15,152 |
|
$ |
14,468 |
| ||
Income and other taxes | 7,272 | 7,420 | ||||||
Marketing and sales program expenses | 8,724 | 6,444 | ||||||
Dividends payable | 2,358 | 2,344 | ||||||
Employee-related expenses | 5,091 | 4,065 | ||||||
Other | 9,681 | 10,767 | ||||||
|
|
|
| |||||
| $ | 48,278 | $ | 45,508 | |||||
|
|
|
| |||||
8. FAIR VALUE MEASUREMENTS
Assets and Liabilities Measured at Fair Value on a Recurring Basis
The Company records its money market funds,cash equivalents, marketable securities, and forward contractsinvestments in privately-held companies at fair value on a recurring basis. Fair value is an exit price, representing the amount that would be received from the sale of an asset or paid to transfer a liability in an orderly transaction between market participants based on assumptions that market participants would use in pricing an asset or liability.
As a basis for classifying the fair value measurements, a three-tier fair value hierarchy, which classifies the fair value measurements based on the inputs used in measuring fair value, was established as follows: (Level 1)
The Company’s cash equivalents are composed of money market funds and time deposits which are classified withinas Level 1 ofand Level 2, respectively, in the fair value hierarchy. The Company’s marketable securities, which are classified within Level 2 of the fair value hierarchy are valued based on a market approach using quoted prices, when available, or matrix pricing compiled by third party pricing vendors, using observable market inputs such as interest rates, yield curves, and credit risk. The Company’s foreign currency forward contracts, which were allinvestments in privately-held companies are classified within Level 23 of the fair value hierarchy and are valued based on the notional amountsusing model-based techniques, including option pricing models and rates under the contracts and observable market inputs such as currency exchange rates and credit risk. discounted cash flow models.
If applicable, the Company will recognize transfers into and out of levels within the fair value hierarchy at the end of the reporting period in which the actual event or change in circumstance occurs. There were no transfers between Level 1 and Level 2levels during the ninethree months ended September 30, 2017.March 31, 2018.
PEGASYSTEMS INC.
NOTES TO UNAUDITED CONDENSED CONSOLIDATED FINANCIAL STATEMENTS (continued)
The Company’s assets and liabilities measured at fair value on a recurring basis consisted of the following:were as follows:
| Fair Value Measurements at Reporting Date Using | Total | |||||||||||||||||||
| (in thousands) | Level 1 | Level 2 | ||||||||||||||||||
September 30, 2017 | ||||||||||||||||||||
Fair Value Assets: | ||||||||||||||||||||
Money market funds | $ | 655 | $ | — | $ | 655 | ||||||||||||||
Marketable securities: | ||||||||||||||||||||
Municipal bonds | $ | — | $ | 32,759 | 32,759 | |||||||||||||||
Corporate bonds | — | 31,053 | 31,053 | |||||||||||||||||
|
|
|
|
|
| |||||||||||||||
| $ | — | $ | 63,812 | $ | 63,812 | |||||||||||||||
December 31, 2016 | ||||||||||||||||||||
Fair Value Assets: | ||||||||||||||||||||
Money market funds | $ | 458 | $ | — | $ | 458 | ||||||||||||||
Marketable securities: | ||||||||||||||||||||
Municipal bonds | $ | — | $ | 36,607 | $ | 36,607 | ||||||||||||||
Corporate bonds | — | 26,560 | 26,560 | |||||||||||||||||
|
|
|
|
|
| |||||||||||||||
| $ | — | $ | 63,167 | $ | 63,167 | |||||||||||||||
Foreign currency forward contracts | — | 628 | 628 | |||||||||||||||||
Fair Value Liabilities: | ||||||||||||||||||||
Foreign currency forward contracts | $ | — | $ | 883 | $ | 883 | ||||||||||||||
| March 31, 2018 | ||||||||||||||||
| Level 1 | Level 2 | Level 3 | Total | |||||||||||||
Cash equivalents | $ | 130 | $ | 30,072 | $ | — | $ | 30,202 | ||||||||
Marketable securities: | ||||||||||||||||
Municipal bonds | $ | — | $ | 50,591 | $ | — | $ | 50,591 | ||||||||
Corporate bonds | — | 38,456 | — | 38,456 | ||||||||||||
|
|
|
|
|
|
|
| |||||||||
Total marketable securities | $ | — | $ | 89,047 | $ | — | $ | 89,047 | ||||||||
Investments in privately-held companies(1) | $ | — | $ | — | $ | 2,060 | $ | 2,060 | ||||||||
(1) Included in other long-term assets in the unaudited condensed consolidated balance sheets. |
| |||||||||||||||
| December 31, 2017 | ||||||||||||||||
| Level 1 | Level 2 | Level 3 | Total | |||||||||||||
Cash equivalents | $ | 2,720 | $ | 40,051 | $ | — | $ | 42,771 | ||||||||
Marketable securities: | ||||||||||||||||
Municipal bonds | $ | — | $ | 32,848 | $ | — | $ | 32,848 | ||||||||
Corporate bonds | — | 28,621 | — | 28,621 | ||||||||||||
|
|
|
|
|
|
|
| |||||||||
Total marketable securities | $ | — | $ | 61,469 | $ | — | $ | 61,469 | ||||||||
Investments in privately-held companies(1) | $ | — | $ | — | $ | 1,030 | $ | 1,030 | ||||||||
(1) Included in other long-term assets in the unaudited condensed consolidated balance sheets. |
| |||||||||||||||
For certain other financial instruments, including accounts receivable and accounts payable, the carrying value approximates their fair value due to the relatively short maturity of these items.
Assets Measured at Fair Value on a Nonrecurring Basis
Assets recorded at fair value on a nonrecurring basis, such asincluding property and equipment and intangible assets, are recognized at fair value when they are impaired. During the ninethree months ended September 30,March 31, 2018 and 2017, and 2016, the Company did not recognize any impairments of its assets recorded at fair value on a nonrecurring basis.
6. TRADE ACCOUNTS RECEIVABLE, NET OF ALLOWANCE9. REVENUE
Revenue policy
The Company’s revenue is derived from sales of software licenses, maintenance fees related to the Company’s software licenses, and services.
| (in thousands) | September 30, 2017 | December 31, 2016 | ||||||
Trade accounts receivable | $ | 164,530 | $ | 234,473 | ||||
Unbilled trade accounts receivable | 32,820 | 34,681 | ||||||
|
|
|
| |||||
Total trade accounts receivable | 197,350 | 269,154 | ||||||
Allowance for sales credit memos | (6,189 | ) | (4,126 | ) | ||||
|
|
|
| |||||
| $ | 191,161 | $ | 265,028 | |||||
|
|
|
| |||||
Unbilled trade accounts receivable
Contracts with multiple performance obligations
The Company’s license and cloud arrangements often contain multiple performance obligations, including maintenance, consulting, and training. For contracts with multiple performance obligations, the Company accounts for individual performance obligations separately if they are distinct. The transaction price is allocated to the separate performance obligations on a relative stand-alone selling price basis. If the transaction price contains discounts or expects to provide a future price concession, these elements are considered when determining the transaction price prior to allocation. Variable fees within the transaction price will be estimated and recognized in revenue as the Company satisfies its performance obligations to the extent it is probable that have commenceda significant reversal of cumulative revenue recognized will not occur when the uncertainty associated with the variable fee is resolved. If the contract grants the client the option to acquire additional products or been deliveredservices, the Company assesses whether or not any discount on the products and services is in excess of scheduled invoicing.
7. GOODWILL AND OTHER INTANGIBLE ASSETS
The changes in the carrying amount of goodwilllevels normally available to similar clients and, if so, accounts for the nine months ended September 30, 2017that discount as follows:an additional performance obligation.
| (in thousands) | ||||
Balance as of January 1, | $ | 73,164 | ||
Purchase price adjustments to goodwill | (354 | ) | ||
Currency translation adjustments | 131 | |||
|
| |||
Balance as of September 30, | $ | 72,941 | ||
|
| |||
PEGASYSTEMS INC.
NOTES TO UNAUDITED CONDENSED CONSOLIDATED FINANCIAL STATEMENTS (continued)
Software licenses
The Company has concluded that its software licenses are distinct performance obligations as the client can benefit from the software on its own. Software license revenue is typically recognized at a point in time when control is transferred to the client, which is defined as the point in time when the client can use and benefit from the license. The software license is delivered before related services are provided and is functional without services, updates, and technical support. The Company’s license arrangements generally contain multiple performance obligations, including consulting, training, and maintenance. Stand-alone selling price for software licenses is determined using the residual approach. The Company utilizes the residual approach as license performance obligations are sold for a broad range of amounts (the selling price is highly variable) and a stand-alone selling price is not discernible from past transactions or other observable evidence. Periodically, the Company evaluates whether the residual approach is appropriate for its license and cloud performance obligations when sold with other performance obligations. As a result, if the standalone selling price analysis illustrates that the license and cloud performance obligations are no longer highly variable, the Company will utilize the relative allocation method for such arrangements.
Term license fees are usually payable in advance on a monthly, quarterly, or annual basis over the term of the license agreement, which is typically three to five years and may be renewed for additional terms at the client’s option. Perpetual license fees are usually payable when the contract is executed. The Company recognizes software license revenue when control is transferred, and the corresponding difference between the amount invoiced and recognized as revenue is recorded as unbilled receivables, as the payment of consideration is subject only to the passage of time.
Maintenance
Maintenance revenue includes revenue from client support and related professional services. Client support includes software upgrades on a whenand-if available basis, telephone support, and bug fixes or patches. Maintenance is priced as a percentage of the selling price of the related software license, which is highly variable. The Company determined the standalone selling price of maintenance based on this pricing relationship, which has remained constant within a narrow range, and observable data from standalone sales of maintenance, along with all other observable data.
The Company has identified two separate distinct performance obligations of maintenance:
| 1. | software upgrades and updates; and |
Intangible assets
| 2. | technical support. |
These performance obligations are recorded at costdistinct within the contract and, although they are amortized usingnot sold separately, the straight-line methodcomponents are not essential to the functionality of the other components. Each of the performance obligations included in maintenance revenue is a stand-alone obligation that is recognized over their estimated useful lives as follows:the passage of the contractual term, which is typically one year. Maintenance fees are usually payable in advance on a monthly, quarterly, or annual basis over the term of the agreement.
Services
| (in thousands) | Range of Remaining Useful Lives | Cost | Accumulated Amortization | Net Book Value | ||||||||||||
September 30, 2017 | ||||||||||||||||
Customer related intangibles | 4-10 years | $ | 63,158 | $ | (43,205 | ) | $ | 19,953 | ||||||||
Technology | 7-10 years | 58,942 | (44,140 | ) | 14,802 | |||||||||||
Other intangibles | — | 5,361 | (5,361 | ) | — | |||||||||||
|
|
|
|
|
| |||||||||||
| $ | 127,461 | $ | (92,706 | ) | $ | 34,755 | ||||||||||
|
|
|
|
|
| |||||||||||
December 31, 2016 | ||||||||||||||||
Customer related intangibles | 4-10 years | $ | 63,091 | $ | (37,573 | ) | $ | 25,518 | ||||||||
Technology | 3-10 years | 58,942 | (40,269 | ) | 18,673 | |||||||||||
Other intangibles | — | 5,361 | (5,361 | ) | — | |||||||||||
|
|
|
|
|
| |||||||||||
| $ | 127,394 | $ | (83,203 | ) | $ | 44,191 | ||||||||||
|
|
|
|
|
| |||||||||||
Amortization expenseThe Company’s services revenue is comprised of intangibles assetsconsulting and training, including software license implementations, training, reimbursable expenses, and cloud which is reflected inderived from sales of the Company’s unaudited condensed consolidated statementshosted Pega Platform and software application environments. The Company has concluded that most services are distinct performance obligations. Consulting may be provided on a stand-alone basis or bundled with license and software maintenance services.
The stand-alone selling price for consulting in time and materials contracts is determined by observable prices in similar transactions without multiple performance obligations and recognized as revenue as the services are performed. Fees for time and materials consulting contracts are usually payable shortly after the service is provided.
The Company estimates the stand-alone selling price for fixed price services based on the estimated hours versus actual hours in similar geographies and for similar contract sizes. Revenue for fixed price services is recognized over time as the services are provided. Fees for fixed price services consulting contracts are usually payable as contract milestones are achieved.
The stand-alone selling price of operationscloud sales of production environments is determined based on the residual approach when sold with services and is recognized over the term of the service. The Company utilizes the residual approach as follows:
| Three Months Ended September 30, | Nine Months Ended September 30, | |||||||||||||||
| (in thousands) | 2017 | 2016 | 2017 | 2016 | ||||||||||||
Cost of revenue | $ | 1,232 | $ | 1,642 | $ | 3,871 | $ | 4,626 | ||||||||
Selling and marketing | 1,873 | 1,867 | 5,608 | 5,274 | ||||||||||||
General and administrative | — | 90 | — | 268 | ||||||||||||
|
|
|
|
|
|
|
| |||||||||
| $ | 3,105 | $ | 3,599 | $ | 9,479 | $ | 10,168 | |||||||||
|
|
|
|
|
|
|
| |||||||||
Future estimated amortization expense related to intangible assets ascloud performance obligations are sold for a broad range of September 30, 2017amounts (the selling price is as follows:highly variable) and a stand-alone selling price is not discernible from past transactions or other observable evidence. The stand-alone selling price for cloud sales of development and testing environments is developed using observable prices in similar transactions without multiple performance obligations and is recognized over time over the term of the service. Cloud fees are usually payable in advance on a monthly, quarterly, or annual basis over the term of the service.
| (in thousands) | ||||
Remainder of 2017 | $ | 2,846 | ||
2018 | 11,347 | |||
2019 | 5,555 | |||
2020 | 2,659 | |||
2021 | 2,637 | |||
2022 and thereafter | 9,711 | |||
|
| |||
| $ | 34,755 | |||
|
| |||
8. ACCRUED EXPENSES
| (in thousands) | September 30, 2017 | December 31, 2016 | ||||||
Outside professional services | $ | 13,447 | $ | 10,204 | ||||
Income and other taxes | 5,947 | 10,422 | ||||||
Marketing and sales program expenses | 4,679 | 3,707 | ||||||
Dividends payable | 2,336 | 2,298 | ||||||
Employee related expenses | 4,715 | 3,806 | ||||||
Other | 8,557 | 6,314 | ||||||
|
|
|
| |||||
| $ | 39,681 | $ | 36,751 | |||||
|
|
|
| |||||
PEGASYSTEMS INC.
NOTES TO UNAUDITED CONDENSED CONSOLIDATED FINANCIAL STATEMENTS (continued)
Contract modifications
The Company sometimes enters into amendments to previously executed contracts which constitute contract modifications. The Company assesses each of these contract modifications to determine:
| 1. | If the additional products and services are distinct from the products and services in the original arrangement, and |
| 2. | If the amount of consideration expected for the added products and services reflects the stand-alone selling price of those products and services. |
A contract modification meeting both criteria is accounted for as a separate contract. A contract modification not meeting both criteria is considered a change to the original contract and is accounted for on either:
| 1. | a prospective basis as a termination of the existing contract and the creation of a new contract; or |
| 2. | a cumulativecatch-up basis. |
Geographic revenue
| Three Months Ended March 31, | ||||||||||||||||
| (in thousands) | 2018 | 2017 | ||||||||||||||
U.S. | $ | 113,985 | 48% | $ | 169,662 | 67% | ||||||||||
Other Americas | 17,715 | 8% | 10,406 | 4% | ||||||||||||
United Kingdom | 26,094 | 11% | 26,342 | 10% | ||||||||||||
Europe, Middle East, and Africa excluding the United Kingdom | 31,826 | 14% | 24,211 | 9% | ||||||||||||
Asia-Pacific | 45,562 | 19% | 25,688 | 10% | ||||||||||||
|
|
|
| |||||||||||||
Total Revenue | $ | 235,182 | 100% | $ | 256,309 | 100% | ||||||||||
|
|
|
| |||||||||||||
Major products and services
| Three Months Ended March 31, | ||||||||
| (in thousands) | 2018 | 2017 | ||||||
Perpetual license | $ | 23,078 | $ | 37,899 | ||||
Term license | 64,695 | 89,109 | ||||||
|
|
|
| |||||
Performance obligations transferred at a point in time | 87,773 | 127,008 | ||||||
Maintenance | 64,525 | 58,713 | ||||||
Cloud | 15,582 | 10,402 | ||||||
Consulting and training | 67,302 | 60,186 | ||||||
|
|
|
| |||||
Performance obligations transferred over time | 147,409 | 129,301 | ||||||
|
|
|
| |||||
Total Revenue | $ | 235,182 | $ | 256,309 | ||||
|
|
|
| |||||
During the three months ended March 31, 2018 and 2017, there were no material changes in the Company’s estimate of variable fees. The amount of revenue recognized from performance obligations satisfied in prior periods was not material.
Transaction price allocated to remaining performance obligations
Transaction price allocated to remaining performance obligations represents contracted revenue that has not yet been recognized. Transaction price on remaining performance obligations was $291 million as of March 31, 2018, of which the Company expects to recognize $198.3 million prior to January 1, 2020. These amounts do not include contracts that have an original expected duration of one year or less. For reporting periods ending prior to January 1, 2018, the date of initial adoption of ASC 606, the Company has elected the practical expedient and not compiled and disclosed the amount of the transaction price allocated to the remaining performance obligations.
PEGASYSTEMS INC.
NOTES TO UNAUDITED CONDENSED CONSOLIDATED FINANCIAL STATEMENTS (continued)
9. DEFERRED REVENUEMajor clients
Clients accounting for 10% or more of the Company’s total revenue were as follows:
| (in thousands) | September 30, 2017 | December 31, 2016 | ||||||
Term license | $ | 5,636 | $ | 15,843 | ||||
Perpetual license | 20,844 | 23,189 | ||||||
Maintenance | 105,588 | 112,397 | ||||||
Cloud | 18,805 | 13,604 | ||||||
Professional Services | 10,058 | 10,614 | ||||||
|
|
|
| |||||
Current deferred revenue | 160,931 | 175,647 | ||||||
Perpetual license | 4,085 | 7,909 | ||||||
Maintenance | 828 | 1,802 | ||||||
Cloud | 1,217 | 1,278 | ||||||
|
|
|
| |||||
Long-term deferred revenue | 6,130 | 10,989 | ||||||
|
|
|
| |||||
| $ | 167,061 | $ | 186,636 | |||||
|
|
|
| |||||
| Three Months Ended March 31, | ||||||||||||
| (in thousands) | 2018 | 2017 | ||||||||||
|
| |||||||||||
Total revenue | $ 235,182 | $ | 256,309 | |||||||||
Client A | * | 14% | ||||||||||
Client B | * | 11% | ||||||||||
*Client accounted for less than 10% of total revenue.
10. STOCK-BASED COMPENSATION
Stock-based compensation expense is reflected in the Company’s unaudited condensed consolidated statements of operations as follows:Expense
| Three Months Ended September 30, | Nine Months Ended September 30, | |||||||||||||||
| (in thousands) | 2017 | 2016 | 2017 | 2016 | ||||||||||||
Cost of revenues | $ | 3,613 | $ | 3,117 | $ | 10,913 | $ | 8,711 | ||||||||
Selling and marketing | 3,976 | 3,468 | 11,482 | 9,395 | ||||||||||||
Research and development | 3,420 | 2,260 | 10,306 | 7,480 | ||||||||||||
General and administrative | 2,480 | 1,983 | 7,228 | 4,706 | ||||||||||||
Acquisition-related | — | (10 | ) | — | 342 | |||||||||||
|
|
|
|
|
|
|
| |||||||||
Total stock-based compensation before tax | $ | 13,489 | $ | 10,818 | $ | 39,929 | $ | 30,634 | ||||||||
|
|
|
|
|
|
|
| |||||||||
Income tax benefit | $ | (4,129 | ) | $ | (3,227 | ) | $ | (12,231 | ) | $ | (8,917 | ) | ||||
During the nine months ended September 30, 2017, the Company issued approximately 1,299,000 shares of common stock to its employees and 18,000 shares of common stock to itsnon-employee directors under the Company’s stock-based compensation plans.
During the nine months ended September 30, 2017, the Company granted approximately 1,052,000 restricted stock units (“RSUs”) and 1,520,000non-qualified stock options to its employees with total fair values of approximately $47.5 million and $20.6 million, respectively. This includes approximately 175,000 RSUs which were granted in connection with the election by employees to receive 50% of their 2017 target incentive compensation under the Company’s Corporate Incentive Compensation Plan in the form of RSUs instead of cash. Stock-based compensation of approximately $7.7 million associated with this RSU grant will be recognized over aone-year period beginning on the grant date.
| Three Months Ended March 31, | ||||||||
| (in thousands) | 2018 | 2017 | ||||||
Cost of revenues | $ | 3,701 | $ | 3,622 | ||||
Selling and marketing | 4,658 | 3,405 | ||||||
Research and development | 3,637 | 3,312 | ||||||
General and administrative | 3,113 | 2,169 | ||||||
|
|
|
| |||||
| $ | 15,109 | $ | 12,508 | |||||
|
|
|
| |||||
Income tax benefit | $ | (3,141) | $ | (3,815) | ||||
The Company recognizes stock basedstock-based compensation on the accelerated recognition method, treating each vesting tranche as if it were an individual grant. As of September 30, 2017,March 31, 2018, the Company had, approximately $56.8net of estimated forfeitures, $92.5 million of unrecognized stock-based compensation expense, net of estimated forfeitures, related to all unvested RSUsrestricted stock units (“RSUs”) and unvested stock options, that iswhich was expected to be recognized over a weighted-average period of 2.12.3 years.
Grants
The Company granted the following stock-based compensation awards:
| Three Months Ended March 31, | ||||||||
| (in thousands) | Shares | Total Fair Value | ||||||
RSUs(1) | 858 | $ | 49,600 | |||||
Non-qualified stock options | 1,377 | $ | 24,700 | |||||
| (1) | Includes approximately 0.1 million RSUs which were granted in connection with the election by certain employees to receive 50% of their 2018 target incentive compensation under the Company’s Corporate Incentive Compensation Plan in the form of RSUs instead of cash. Stock-based compensation of approximately $8.2 million associated with this RSU grant is expected to be recognized over aone-year period beginning on the grant date. |
RSU vestings and stock option exercises
During the three months ended March 31, 2018, 0.6 million shares of common stock were issued due to stock option exercises and RSU vestings under the Company’s stock-based compensation plans.
PEGASYSTEMS INC.
NOTES TO UNAUDITED CONDENSED CONSOLIDATED FINANCIAL STATEMENTS (continued)
11. INCOME TAXES
Effective Tax Rate
The Company computes its (benefit)/provision for income taxes by applying the estimated annual effective tax rate to year to date income before (benefit)/provision for income taxes and adjusts for discrete tax items recorded in the period.
| Three Months Ended March 31, | ||||||||
| (Dollars in thousands) | 2018 | 2017 | ||||||
(Benefit)/provision for income taxes | $ | (4,222) | $ | 13,615 | ||||
Effective income tax rate | (53)% | 20% | ||||||
During the three months ended March 31, 2018, the Company’s effective tax rate changed primarily due to the following factors:
Tax Reform Act
On December 22, 2017, the Tax Cuts and Jobs Act of 2017 (“Tax Reform Act”) was enacted into law, which significantly changed U.S. tax law and included many provisions such as a reduction of the U.S. federal statutory tax rate, imposed aone-time transition tax on deemed repatriation of deferred foreign earnings, and included a provision to tax global intangiblelow-taxed income (“GILTI”) of foreign subsidiaries, a special tax deduction for foreign derived intangible income, and a base erosion anti-abuse tax measure (“BEAT”) that may tax payments between a U.S. corporation and its foreign subsidiaries, among other tax changes.
Under the SEC Staff Accounting Bulletin No. 118 (“SAB 118”), the Company recognized the provisional tax impacts in the three months ended December 31, 2017 that included $20.4 million of income tax expense tore-measure its net deferred tax assets to the 21% enacted rate. However, the Company has revised its provisional amount to reflect the impact of the retrospective adoption of ASC 606 and has recognized a $12.6 million income tax benefit for the remeasurement of its net deferred tax liabilities on a retrospective basis in the three months ended December 31, 2017.
The final amounts may differ from those provisional amounts, possibly materially, due to, among other things, additional analysis, changes in interpretations and assumptions the Company has made, additional regulatory guidance that may be issued, and actions the Company may take as a result of the Tax Reform Act.
The Tax Reform Act also provided for aone-time deemed mandatory repatriation of post-1986 undistributed foreign subsidiary earnings and profits through December 31, 2017. However, based on the Company’s provisional analysis performed as of that date, the Company does not expect to be subject to theone-time transition tax due to the Company’s foreign subsidiaries being in a net accumulated deficit position. During the three months ended March 31, 2018, the Company recognized no significant adjustments to these estimates.
The Tax Reform Act provides the following new anti-abuse provisions beginning in 2018:
PEGASYSTEMS INC.
NOTES TO UNAUDITED CONDENSED CONSOLIDATED FINANCIAL STATEMENTS (continued)
12. EARNINGS PER SHARE
Basic earnings per share is computed using the weighted-average number of common shares outstanding during the applicable period. Diluted earnings per share is computed using the weighted-average number of common shares outstanding during the applicable period, plus the dilutive effect of outstanding stock options and RSUs, using the treasury stock method. Certain shares related to someIn periods of the Company’s outstandingloss, all stock options and RSUs wereare excluded, from the computation of diluted earnings per share because they were anti-dilutive in the periods presented, but couldas their inclusion would be dilutive in the future.
PEGASYSTEMS INC.
NOTES TO UNAUDITED CONDENSED CONSOLIDATED FINANCIAL STATEMENTS (continued)
anti-dilutive.
The calculation of the Company’s basic and diluted earnings per share is as follows:
| Three Months Ended September 30, | Nine Months Ended September 30, | |||||||||||||||
| (in thousands, except per share amounts) | 2017 | 2016 | 2017 | 2016 | ||||||||||||
Basic | ||||||||||||||||
Net (loss)/income | $ | (1,812 | ) | $ | 3,301 | $ | 36,615 | $ | 18,237 | |||||||
|
|
|
|
|
|
|
| |||||||||
Weighted-average common shares outstanding | 77,691 | 76,278 | 77,258 | 76,323 | ||||||||||||
|
|
|
|
|
|
|
| |||||||||
(Loss)/earnings per share, basic | $ | (0.03 | ) | $ | 0.04 | $ | 0.47 | $ | 0.24 | |||||||
|
|
|
|
|
|
|
| |||||||||
Diluted | ||||||||||||||||
Net (loss)/income | $ | (1,812 | ) | $ | 3,301 | $ | 36,615 | $ | 18,237 | |||||||
|
|
|
|
|
|
|
| |||||||||
Weighted-average effect of dilutive securities: | ||||||||||||||||
Stock options | — | 1,933 | 3,519 | 1,851 | ||||||||||||
RSUs | — | 1,337 | 1,940 | 1,227 | ||||||||||||
|
|
|
|
|
|
|
| |||||||||
Effect of assumed exercise of stock options and RSUs | — | 3,270 | 5,459 | 3,078 | ||||||||||||
|
|
|
|
|
|
|
| |||||||||
Weighted-average common shares outstanding, assuming dilution | 77,691 | 79,548 | 82,717 | 79,401 | ||||||||||||
|
|
|
|
|
|
|
| |||||||||
(Loss)/earnings per share, diluted | $ | (0.03 | ) | $ | 0.04 | $ | 0.44 | $ | 0.23 | |||||||
|
|
|
|
|
|
|
| |||||||||
Outstanding stock options and RSUs excluded as impact would be anti-dilutive | 7,232 | 296 | 219 | 368 | ||||||||||||
In periods of loss, all equity awards are excluded, as the inclusion of any equity awards would be anti-dilutive.
12. GEOGRAPHIC INFORMATION AND MAJOR CLIENTS
Geographic Information
Operating segments are defined as components of an enterprise, about which separate financial information is available that is evaluated regularly by the chief operating decision maker (“CODM”) in deciding how to allocate resources and in assessing performance.
The Company develops and licenses software applications for customer engagement and its Pega® Platform, and provides consulting services, maintenance, and training related to its offerings. The Company derives substantially all of its revenue from the sale and support of one group of similar products and services—software that provides case management, business process management, and real-time decisioning solutions to improve customer engagement and operational excellence in the enterprise applications market. To assess performance, the Company’s CODM, who is the chief executive officer, reviews financial information on a consolidated basis. Therefore, the Company determined it has one reportable segment—Customer Engagement Solutions and one reporting unit.
The Company’s international revenue, based upon the clients’ location, is as follows:
| Three Months Ended September 30, | Nine Months Ended September 30, | |||||||||||||||||||||||||||||||
| (Dollars in thousands) | 2017 | 2016 | 2017 | 2016 | ||||||||||||||||||||||||||||
U.S. | $ | 95,087 | 53 | % | $ | 111,274 | 61 | % | $ | 351,330 | 59 | % | $ | 308,049 | 56 | % | ||||||||||||||||
Other Americas | 8,722 | 5 | % | 7,952 | 4 | % | 30,243 | 5 | % | 49,494 | 9 | % | ||||||||||||||||||||
U.K. | 18,485 | 10 | % | 21,490 | 12 | % | 68,003 | 11 | % | 77,181 | 14 | % | ||||||||||||||||||||
Other EMEA(1) | 28,100 | 16 | % | 23,656 | 13 | % | 76,958 | 13 | % | 67,314 | 12 | % | ||||||||||||||||||||
Asia Pacific | 29,421 | 16 | % | 18,430 | 10 | % | 74,508 | 12 | % | 48,618 | 9 | % | ||||||||||||||||||||
|
|
|
|
|
|
|
|
|
|
|
|
|
|
|
| |||||||||||||||||
| $ | 179,815 | 100 | % | $ | 182,802 | 100 | % | $ | 601,042 | 100 | % | $ | 550,656 | 100 | % | |||||||||||||||||
|
|
|
|
|
|
|
|
|
|
|
|
|
|
|
| |||||||||||||||||
Three Months Ended | ||||
| (in thousands, except per share amounts) | 2018 | 2017 | ||
Basic | ||||
Net income | $ 12,200 | $ 52,963 | ||
Weighted-average common shares outstanding | 78,236 | 76,761 | ||
|
| |||
Earnings per share, basic | $ 0.16 | $ 0.69 | ||
|
| |||
Diluted | ||||
Net income | $ 12,200 | $ 52,963 | ||
Weighted-average effect of dilutive securities: | ||||
Stock options | 3,119 | 3,184 | ||
RSUs | 1,747 | 1,930 | ||
|
| |||
Effect of dilutive securities | 4,866 | 5,114 | ||
|
| |||
Weighted-average common shares outstanding, assuming dilution | 83,102 | 81,875 | ||
|
| |||
Earnings per share, diluted | $ 0.15 | $ 0.65 | ||
|
| |||
Outstanding anti-dilutive stock options and RSUs(1) | 397 | 314 | ||
| (1) |
PEGASYSTEMS INC.
NOTES TO UNAUDITED CONDENSED CONSOLIDATED FINANCIAL STATEMENTS (continued)
Major Clients
Clients accounting for 10% or more of the Company’s total revenue were as follows:
| Three Months Ended September 30, | Nine Months Ended September 30, | |||||||||||||||
| (in thousands) | 2017 | 2016 | 2017 | 2016 | ||||||||||||
Total revenue | $ | 179,815 | $ | 182,802 | $ | 601,042 | $ | 550,656 | ||||||||
Client A | 10.6 | % | * | * | * | |||||||||||
Clients accounting for 10% or more of the Company’s total trade accounts receivable were as follows:
| (in thousands) | September 30, 2017 | December 31, 2016 | ||||||
Total trade accounts receivable | 197,350 | 269,154 | ||||||
Client A | 12.4 | % | * | |||||
Forward-Looking Statements
ITEM 2. MANAGEMENT’S DISCUSSION AND ANALYSIS OF FINANCIAL CONDITION AND RESULTS OF OPERATIONS
FORWARD-LOOKING STATEMENTS
This Quarterly Report on Form10-Q contains or incorporates forward-looking statements within the meaning of the Private Securities Litigation Reform Act of 1995. These statements include, but are not limited to, statements about our future financial performance and business plans, the adequacy of our liquidity and capital resources, the continued payment of quarterly dividends, by the Company, and the timing of revenue recognition under license and cloud arrangements and are described more completely in Part I of our Annual Report on Form10-K for the year ended December 31, 2016.2017.
These forward-looking statements are based on current expectations, estimates, forecasts, and projections about the industry and markets in which we operate, and management’s beliefs and assumptions. In addition, other written or oral statements that constitute forward-looking statements may be made by us or on our behalf. Words such as “expect,” “anticipate,” “intend,” “plan,” “believe,” “could,” “estimate,” “may,” “target,” “strategy,” “is intended to,” “project,” “guidance,” “likely,” “usually,” or variations of such words and similar expressions are intended to identify such forward-looking statements.
These statements are not guarantees of future performance and involve certain risks, uncertainties, and assumptions that are difficult to predict. Important factors that could cause actual future activities and results to differ materially from those expressed in such forward-looking statements include, among others, variation in demand for our products and services and the difficulty in predicting the completion of product acceptance and other factors affecting the timing of license revenue recognition; reliance on third party relationships; our beliefs and the potential losstiming of vendor specific objective evidence forthe completion of our consulting services;analysis regarding the impact of the Tax Cuts and Jobs Act of 2017, including its impact on income tax expense and deferred tax assets; the inherent risks associated with international operations and the continued uncertainties in international economies; the Company’sglobal economy; our continued effort to market and sell both domestically and internationally; foreign currency exchange rates; the financial impact of any future acquisitions; the potential legal and financial liabilities and reputation damage due to cyber-attacks and security breaches; and management of the Company’sour growth. These risks, and other factors that could cause actual results to differ materially from those expressed in such forward-looking statements, are described more completely in Part I of the Company’sour Annual Report on Form10-K for the year ended December 31, 20162017 as well as other filings we make with the U.S. Securities and Exchange Commission (“SEC”).
We haveInvestors are cautioned not to place undue reliance on such forward-looking statements and there are no assurances that the matters contained in such statements will be achieved. Although subsequent events may cause our view to change, except as required by applicable law, we do not undertake and specifically disclaim any obligation to publicly update or revise anythese forward-looking statements whether as athe result of new information, future events or risks. New information, future events or risks may cause the forward-looking events we discuss in this report not to occur or to materially change.otherwise.
Business overviewBUSINESS OVERVIEW
We develop, market, license, and support software applications for marketing, sales, service,customer engagement and operations. Indigital process automation, in addition we licenseto licensing our Pega® Platform application development product for clients that wish to build and extend their own applications. The Pega Platform assists our clientsand applications help connect enterprises to their customers in building, deploying,real-time across channels, streamline business operations, and evolving enterprise applications, creating an environment in which business and IT can collaborateadapt to manage back office operations, front office sales, marketing, and/or customer service needs. We also provide consulting services, maintenance, and training for our software. Our software applications and Pega Platform can be deployed on Pega, partner, or customer-managed cloud architectures.meet changing requirements.
Our clients include Global 3000 companies and government agencies that seek to manage complex enterprise systems and customer service issues with greater agility and cost-effectiveness. Our strategy is to sell a client a series of licenses, each focused on a specific purpose or area of operations in support of longer term enterprise-wide digital transformation initiatives.
Our license revenue is primarily derived from sales of our applications and our Pega Platform. Our cloud revenue is derived from the licensing of our hosted software application and Pega Platform and software application environments. Our consulting services revenue is primarily related to new license implementations.
Financial and Performance Metrics
Management evaluates our financial performance, based a number of select financial and performance metrics. The performance metrics are periodically reviewed and revised to reflect any changes in our business. Historically, Recurring Revenue and License and Cloud Backlog have been our primary performance metrics. However, due to the change in the revenue recognition patterns of term license arrangements as a result of the expected implementation ofWe adopted the new revenue accountingrecognition standard (See(“ASC 606”) effective January 1, 2018 using the full retrospective method. See Note 2)2. “New Accounting Pronouncements” included in Item 1. “Unaudited Condensed Consolidated Financial Statements” for additional information.
| (Dollars in thousands, except per share amounts) | Three Months Ended March 31, | |||||||||||||||
| 2018 | 2017 | Change | ||||||||||||||
Total revenue | $ | 235,182 | $ | 256,309 | $ | (21,127 | ) | (8)% | ||||||||
Net income | $ | 12,200 | $ | 52,963 | $ | (40,763 | ) | (77)% | ||||||||
Diluted earnings per share | $ | 0.15 | $ | 0.65 | $ | (0.50 | ) | (77)% | ||||||||
Cash provided by operating activities | $ | 55,655 | $ | 32,444 | $ | 23,211 | 72% | |||||||||
The decrease in total revenue in the first quarterthree months ended March 31, 2018 was primarily due to a large term license arrangement recognized in revenue in the three months ended March 31, 2017 and a shift in client preferences to cloud arrangements. Cloud arrangements are generally recognized in revenue over the term of 2018, we have started tracking the cloud contract, as compared to other arrangements, which are generally recognized in revenue on the contract effective date.
Annual Contract Value (“ACV”), a new performance measure.
Select Financial Metrics
(Dollars in thousands, except per share amounts) | Three Months Ended September 30, | Nine Months Ended September 30, | ||||||||||||||||||||||||||||||
| 2017 | 2016 | Change | 2017 | 2016 | Change | |||||||||||||||||||||||||||
Total revenue | $ | 179,815 | $ | 182,802 | (2,987 | ) | (2 | )% | $ | 601,042 | $ | 550,656 | $ | 50,386 | 9 | % | ||||||||||||||||
Operating margin | (8 | )% | 3 | % | 3 | % | 5 | % | ||||||||||||||||||||||||
Diluted (loss)/earnings per share | $ | (0.03 | ) | $ | 0.04 | $ | (0.07 | ) | (175 | )% | $ | 0.44 | $ | 0.23 | $ | 0.21 | 91 | % | ||||||||||||||
Cash flow provided by operating activities | 113,926 | 20,556 | 93,370 | 454 | % | |||||||||||||||||||||||||||
Select Performance Metrics
Annual Contract Value (“ACV”)(1)
The change in ACV measures the growth and predictability of future cash flows from committed term, license, cloud, and maintenance arrangements as of the end of the particular reporting period.
| March 31, | ||||||||||||||||
| (in thousands) | 2018 | 2017 | Change | |||||||||||||
Term and Cloud ACV | $ | 236,025 | $ | 193,004 | $ | 43,021 | 22% | |||||||||
Maintenance ACV | 258,100 | 234,852 | $ | 23,248 | 10% | |||||||||||
|
|
|
| |||||||||||||
Total ACV | $ | 494,125 | $ | 427,856 | $ | 66,269 | 15% | |||||||||
|
|
|
| |||||||||||||
(1)ACV, as of a given date, is the sum of the following two components:
| September 30, | ||||||||||||||||
| (in thousands) | 2017 | 2016 | Change | |||||||||||||
Term License and Cloud ACV | $ | 200,180 | $ | 163,408 | $ | 36,772 | 23 | % | ||||||||
Maintenance ACV | 248,816 | 220,152 | $ | 28,664 | 13 | % | ||||||||||
|
|
|
| |||||||||||||
Term License, Cloud and Maintenance ACV | $ | 448,996 | $ | 383,560 | $ | 65,436 | 17 | % | ||||||||
|
|
|
| |||||||||||||
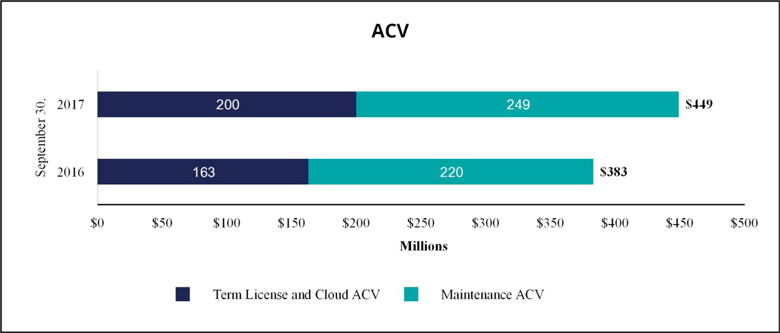
Recurring Revenue
A measure of the predictability and repeatability of our revenue.
| Three Months Ended September 30, | Nine Months Ended September 30, | |||||||||||||||||||||||||||||||
| (Dollars in thousands) | 2017 | 2016 | Change | 2017 | 2016 | Change | ||||||||||||||||||||||||||
Recurring revenue | ||||||||||||||||||||||||||||||||
Term license | $ | 21,678 | $ | 28,919 | $ | (7,241 | ) | (25 | )% | $ | 106,170 | $ | 102,115 | $ | 4,055 | 4 | % | |||||||||||||||
Maintenance | 62,204 | 55,038 | $ | 7,166 | 13 | % | 180,759 | 163,174 | $ | 17,585 | 11 | % | ||||||||||||||||||||
Cloud | 13,354 | 10,873 | $ | 2,481 | 23 | % | 36,914 | 30,640 | $ | 6,274 | 20 | % | ||||||||||||||||||||
|
|
|
|
|
|
|
| |||||||||||||||||||||||||
Total recurring revenue | $ | 97,236 | $ | 94,830 | $ | 2,406 | 3 | % | $ | 323,843 | $ | 295,929 | $ | 27,914 | 9 | % | ||||||||||||||||
|
|
|
|
|
|
|
| |||||||||||||||||||||||||
Recurring revenue as a percent of total revenue | 54 | % | 52 | % | 54 | % | 54 | % | ||||||||||||||||||||||||
License and Cloud Backlog
A measure of the continued growth of our business as a result of future contractual commitments by our clients.
License and Cloud Backlog is the sum of the following two components:
License and cloud backlog may vary in any given period depending on the amount and timing of when the arrangements are executed, as well as the mix between perpetual, term, and cloud license arrangements, which may depend on our clients’ deployment preferences. A change in the mix may cause our revenues to vary materially from period to period. A higher proportion of term and cloud license arrangements executed will generally result in revenue being recognized over longer periods.
| September 30, | Change | |||||||||||||||||||
| (Dollars in thousands) | 2017 | 2016 | ||||||||||||||||||
Deferred license and cloud revenue on the balance sheet | ||||||||||||||||||||
Term license and cloud | $ | 25,658 | 51 | % | $ | 19,627 | 42 | % | 31 | % | ||||||||||
Perpetual license | 24,929 | 49 | % | 27,653 | 58 | % | (10 | )% | ||||||||||||
|
|
|
| |||||||||||||||||
Total deferred license and cloud revenue | 50,587 | 100 | % | 47,280 | 100 | % | 7 | % | ||||||||||||
|
|
|
| |||||||||||||||||
License and cloud contractual commitments not on the balance sheet | ||||||||||||||||||||
Term license and cloud | 450,535 | 91 | % | 352,804 | 94 | % | 28 | % | ||||||||||||
Perpetual license | 46,459 | 9 | % | 23,483 | 6 | % | 98 | % | ||||||||||||
|
|
|
| |||||||||||||||||
Total license and cloud commitments | 496,994 | 100 | % | 376,287 | 100 | % | 32 | % | ||||||||||||
|
|
|
| |||||||||||||||||
Total license (term and perpetual) and cloud backlog | $ | 547,581 | $ | 423,567 | 29 | % | ||||||||||||||
|
|
|
| |||||||||||||||||
Total term license and cloud backlog | 476,193 | 87 | % | 372,431 | 88 | % | 28 | % | ||||||||||||
|
|
|
| |||||||||||||||||
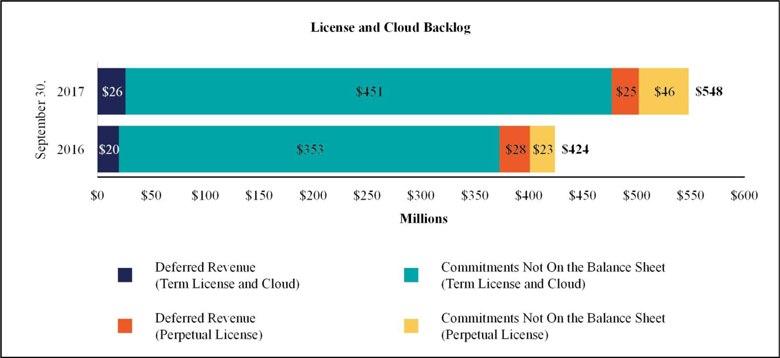
Critical accounting policiesCRITICAL ACCOUNTING POLICES
Management’s Discussion and Analysis of Financial Condition and Results of Operations is based upon our unaudited condensed consolidated financial statements, which have been prepared in accordance with accounting principles generally accepted in the U.S.United States (U.S.) and the rules and regulations of the SEC for interim financial reporting. The preparation of these financial statements requires us to make estimates and judgments that affect the reported amounts of assets, liabilities, revenues, and expenses, and the related disclosure of contingent assets and liabilities. We base our estimates and judgments on historical experience, knowledge of current conditions, and expectations of what could occur in the future given available information.
ThereRevenue
We account for revenue in accordance with ASC 606. Our revenue recognition policies require us to make significant judgments and estimates.
Our clients’ contracts typically contain promises to transfer multiple products and services. Judgment is required to determine whether each product and service is considered to be a distinct performance obligation that should be accounted for separately under the contract. We allocate the transaction price to the distinct performance obligations based on relative stand-alone selling price. We estimate stand-alone selling price based on the prices charged to clients, or by using information such as market conditions and other observable inputs. However, the selling price of our software licenses and cloud performance obligations are highly variable. Thus, we estimate stand-alone selling price for software licenses and cloud performance obligations using the residual approach, determined based on total transaction price minus the stand-alone selling price of other performance obligations promised in the contract.
In applying our revenue recognition policy, we must determine which portions of our revenue are recognized currently and which portions must be deferred and recognized in future periods. We analyze various factors including, but not limited to, the selling price of undelivered services when sold on a stand-alone basis, our pricing policies, and contractual terms and conditions in helping us to make such judgments about revenue recognition. Changes in judgment on any of these factors could materially impact the timing and amount of revenue recognized in a given period.
Deferred Contract Costs
Sales incentives paid by us are considered incremental and recoverable costs of obtaining a contract with a client. These costs are deferred and then amortized over the period of benefit, which is on average five years. We determined the period of benefit by taking into consideration our client contracts, our technology, and other factors.
Except as described above, there have been no changes in our critical accounting policies as disclosed in our Annual Report on Form10-K for the year ended December 31, 2016. 2017.
For more information regarding our critical accounting policies, we encourage you to read the discussion contained in Item 7 under the heading “Criticalfollowing locations:
Results
RESULTS OF OPERATIONS
| Three Months Ended September 30, | Nine Months Ended September 30, | |||||||||||||||||||||||||||||||
| (Dollars in thousands) | 2017 | 2016 | Change | 2017 | 2016 | Change | ||||||||||||||||||||||||||
Total revenue | $ | 179,815 | $ | 182,802 | $ | (2,987 | ) | (2 | )% | $ | 601,042 | $ | 550,656 | $ | 50,386 | 9 | % | |||||||||||||||
Gross profit | $ | 110,084 | $ | 122,365 | $ | (12,281 | ) | (10 | )% | $ | 395,346 | $ | 373,609 | $ | 21,737 | 6 | % | |||||||||||||||
Total operating expenses | $ | 124,373 | $ | 116,867 | $ | 7,506 | 6 | % | $ | 376,647 | $ | 347,626 | $ | 29,021 | 8 | % | ||||||||||||||||
(Loss)/income from operations | $ | (14,289 | ) | $ | 5,498 | $ | (19,787 | ) | (360 | )% | $ | 18,699 | $ | 25,983 | $ | (7,284 | ) | (28 | )% | |||||||||||||
Operating margin | (8 | )% | 3 | % | 3 | % | 5 | % | ||||||||||||||||||||||||
(Loss)/income before (benefit)/provision for income taxes | $ | (14,697 | ) | $ | 5,515 | $ | (20,212 | ) | (366 | )% | $ | 18,663 | $ | 24,506 | $ | (5,843 | ) | (24 | )% | |||||||||||||
| Three Months Ended March 31, | ||||||||||||||||
| (Dollars in thousands) | 2018 | 2017 | Change | |||||||||||||
Total revenue | $ | 235,182 | $ | 256,309 | $ | (21,127 | ) | (8)% | ||||||||
Gross profit | $ | 159,568 | $ | 188,219 | $ | (28,651 | ) | (15)% | ||||||||
Income from operations | $ | 7,936 | $ | 65,907 | $ | (57,971 | ) | (88)% | ||||||||
Net income | $ | 12,200 | $ | 52,963 | $ | (40,763 | ) | (77)% | ||||||||
Revenue
RevenueSoftware license
Software license revenue
| (Dollars in thousands) | Three Months Ended September 30, | Nine Months Ended September 30, | ||||||||||||||||||||||||||||||||||||||||||||||
| 2017 | 2016 | Change | 2017 | 2016 | Change | |||||||||||||||||||||||||||||||||||||||||||
Perpetual license | $ | 20,115 | 48 | % | $ | 39,914 | 58 | % | $ | (19,799 | ) | (50 | )% | $ | 89,050 | 46 | % | $ | 105,734 | 51 | % | ($ | 16,684 | ) | (16 | )% | ||||||||||||||||||||||
Term license | 21,678 | 52 | % | 28,919 | 42 | % | (7,241 | ) | (25 | )% | 106,170 | 54 | % | 102,115 | 49 | % | 4,055 | 4 | % | |||||||||||||||||||||||||||||
|
|
|
|
|
|
|
|
|
|
|
|
|
|
|
| |||||||||||||||||||||||||||||||||
Total license revenue | $ | 41,793 | 100 | % | $ | 68,833 | 100 | % | $ | (27,040 | ) | (39 | )% | $ | 195,220 | 100 | % | $ | 207,849 | 100 | % | ($ | 12,629 | ) | (6 | )% | ||||||||||||||||||||||
|
|
|
|
|
|
|
|
|
|
|
|
|
|
|
| |||||||||||||||||||||||||||||||||
The mix between perpetual and term license arrangements executed in a particular period varies based on clients’ deployment preferences. A change in the mix may cause our revenues to vary materially from period to period. A higher proportion of term license arrangements executed will generally result in license revenue being recognized over longer periods. Additionally, some of our perpetual license arrangements include extended payment terms or additional rights of use, which may also result in the recognition of revenue over longer periods.
| (Dollars in thousands) | Three Months Ended March 31, | |||||||||||||||||||||||
| 2018 | 2017 | Change | ||||||||||||||||||||||
Perpetual license | $ | 23,078 | 26% | $ | 37,899 | 30% | $ | (14,821 | ) | (39)% | ||||||||||||||
Term license | 64,695 | 74% | 89,109 | 70% | (24,414 | ) | (27)% | |||||||||||||||||
|
|
|
| |||||||||||||||||||||
Total software license | $ | 87,773 | 100% | $ | 127,008 | 100% | $ | (39,235 | ) | (31)% | ||||||||||||||
|
|
|
| |||||||||||||||||||||
The decrease in perpetual license revenue in the three months ended September 30, 2017March 31, 2018 was primarily due to a decrease in the average value of perpetual arrangements executed and a lower percentage of perpetual arrangements executed and recognized in revenue in the current period. The decrease in perpetual license revenue in the ninethree months ended September 30, 2017 wasMarch 31, 2018 driven primarily dueby a shift in client preferences to a lower percentage of perpetual arrangements executed and recognized in revenue.cloud arrangements.
The decrease in term license revenue in the three months ended September 30, 2017March 31, 2018 was primarily due to a large term license renewal for which the second year of the term was recognized as revenue in the three months ended September 30, 2016. If the second year of this term license arrangement was not paid in advance in the three months ended September 30, 2016, term license revenue would have decreased 2%. The increase in term license revenue in the nine months ended September 30, 2017 was primarily due to broad based growth amongst new and existing customers offset by a large term license arrangement which was prepaid and recognized in revenue in the three months ended March 31, 2016. If this term license arrangement was not prepaid2017 and recognizeda shift in revenue in the three months ended March 31, 2016 term license revenue would have increased 26%.client preferences to cloud arrangements.
The aggregate value of future revenue expected to be recognized during the remainder of the year under existing noncancellable perpetual arrangements not reflected in deferred revenue was $13.3 million as of September 30, 2017 compared to $3.9 million as of September 30, 2016.
The aggregate value of future revenue expected to be recognized during the remainder of the year under existing noncancellable term and cloud arrangements not reflected in deferred revenue was $37.7 million as of September 30, 2017 compared to $26.7 million as of September 30, 2016. For additional information see “Future Cash Receipts from Committed License and Cloud Arrangements” which can be found in “Liquidity and Capital Resources.”
Maintenance revenue
| Three Months Ended September 30, | Nine Months Ended September 30, | Three Months Ended March 31, | ||||||||||||||||||||||||||||||||||||||||||||||
| (Dollars in thousands) | 2017 | 2016 | Change | 2017 | 2016 | Change | 2018 | 2017 | Change | |||||||||||||||||||||||||||||||||||||||
Maintenance | $ | 62,204 | $ | 55,038 | $ | 7,166 | 13 | % | $ | 180,759 | $ | 163,174 | $ | 17,585 | 11 | % | $ | 64,525 | $ | 58,713 | $ | 5,812 | 10% | |||||||||||||||||||||||||
The increases wereincrease in maintenance revenue was primarily due to the continued growth in the aggregate value of the installed base of our software and strong renewal rates significantly in excess of 90%.
Services revenue
| Three Months Ended September 30, | Nine Months Ended September 30, | Three Months Ended March 31, | ||||||||||||||||||||||||||||||||||||||||||||||||||||||||||||||||||||||
| (Dollars in thousands) | 2017 | 2016 | Change | 2017 | 2016 | Change | 2018 | 2017 | Change | |||||||||||||||||||||||||||||||||||||||||||||||||||||||||||||||
Consulting services | $ | 61,535 | 81 | % | $ | 46,829 | 80 | % | $ | 14,706 | 31 | % | $ | 183,447 | 82 | % | $ | 144,263 | 80 | % | $ | 39,184 | 27 | % | ||||||||||||||||||||||||||||||||||||||||||||||||
Cloud | 13,354 | 18 | % | 10,873 | 18 | % | 2,481 | 23 | % | 36,914 | 16 | % | 30,640 | 17 | % | 6,274 | 20 | % | $ | 15,582 | 19% | $ | 10,402 | 15% | $ | 5,180 | 50% | |||||||||||||||||||||||||||||||||||||||||||||
Training | 929 | 1 | % | 1,229 | 2 | % | (300 | ) | (24 | )% | 4,702 | 2 | % | 4,730 | 3 | % | (28 | ) | (1 | )% | ||||||||||||||||||||||||||||||||||||||||||||||||||||
Consulting and training | 67,302 | 81% | 60,186 | 85% | 7,116 | 12% | ||||||||||||||||||||||||||||||||||||||||||||||||||||||||||||||||||
|
|
|
|
|
|
|
|
|
|
|
| |||||||||||||||||||||||||||||||||||||||||||||||||||||||||||||
Total services | $ | 75,818 | 100 | % | $ | 58,931 | 100 | % | $ | 16,887 | 29 | % | $ | 225,063 | 100 | % | $ | 179,633 | 100 | % | $ | 45,430 | 25 | % | $ | 82,884 | 100% | $ | 70,588 | 100% | $ | 12,296 | 17% | |||||||||||||||||||||||||||||||||||||||
|
|
|
|
|
|
|
|
|
|
|
| |||||||||||||||||||||||||||||||||||||||||||||||||||||||||||||
Consulting servicesThe increase in cloud revenue iswas primarily generated from new license implementations.due to the continued growth of our cloud client base driven by a shift in client preferences to cloud arrangements.
The increase in consulting and training revenue was primarily due to higher billable hours during the three months ended March 31, 2018. Our consulting servicesand training revenue may fluctuate in future periods depending on the mix of new implementation projects we perform as compared to those performed by our enabled clients or led by our partners.
The increases in consulting services revenue were primarily due to higher billable hours during the three and nine months ended September 30, 2017 driven by a large project which began in the second half of 2016.
Cloud revenue represents revenue from our Pega Cloud offerings. The increases in cloud revenue were primarily due to continued growth of our cloud client base.
Gross profit
| Three Months Ended September 30, | Nine Months Ended September 30, | Three Months Ended March 31, | ||||||||||||||||||||||||||||||||||||||||||||||||||||||
| (Dollars in thousands) | 2017 | 2016 | Change | 2017 | 2016 | Change | 2018 | 2017 | Change | |||||||||||||||||||||||||||||||||||||||||||||||
Software license | $ | 40,517 | $ | 67,520 | $ | (27,003 | ) | (40 | )% | $ | 191,394 | $ | 204,203 | $ | (12,809 | ) | (6 | )% | $ | 86,518 | 99% | $ | 125,708 | 99% | $ | (39,190 | ) | (31)% | ||||||||||||||||||||||||||||
Maintenance | 55,488 | 48,379 | 7,109 | 15 | % | 159,814 | 144,285 | 15,529 | 11 | % | 58,443 | 91% | 51,495 | 88% | 6,948 | 13 % | ||||||||||||||||||||||||||||||||||||||||
Cloud | 7,861 | 50% | 4,669 | 45% | 3,192 | 68 % | ||||||||||||||||||||||||||||||||||||||||||||||||||
Consulting and training | 6,746 | 10% | 6,347 | 11% | 399 | 6 % | ||||||||||||||||||||||||||||||||||||||||||||||||||
|
|
|
| |||||||||||||||||||||||||||||||||||||||||||||||||||||
Services | 14,079 | 6,466 | 7,613 | 118 | % | 44,138 | 25,121 | 19,017 | 76 | % | 14,607 | 18% | 11,016 | 16% | 3,591 | 33 % | ||||||||||||||||||||||||||||||||||||||||
|
|
|
|
|
|
|
| |||||||||||||||||||||||||||||||||||||||||||||||||
Total gross profit | $ | 110,084 | $ | 122,365 | $ | (12,281 | ) | (10 | )% | $ | 395,346 | $ | 373,609 | $ | 21,737 | 6 | % | $ | 159,568 | 68% | $ | 188,219 | 73% | $ | (28,651 | ) | (15) % | |||||||||||||||||||||||||||||
Software license gross profit % | 97 | % | 98 | % | 98 | % | 98 | % | ||||||||||||||||||||||||||||||||||||||||||||||||
Maintenance gross profit % | 89 | % | 88 | % | 88 | % | 88 | % | ||||||||||||||||||||||||||||||||||||||||||||||||
Services gross profit % | 19 | % | 11 | % | 20 | % | 14 | % | ||||||||||||||||||||||||||||||||||||||||||||||||
|
|
|
|
|
|
|
| |||||||||||||||||||||||||||||||||||||||||||||||||
Total gross profit % | 61 | % | 67 | % | 66 | % | 68 | % | ||||||||||||||||||||||||||||||||||||||||||||||||
The decrease in total gross profit in the three months ended September 30, 2017March 31, 2018 was primarily due to a large term license arrangement recognized in revenue in the three months ended March 31, 2017. Additionally we have experienced a shift in client preferences to cloud arrangements, which are generally recognized in revenue over the mixterm of licensethe cloud contract, as compared to other arrangements, executed from perpetual to term licenses and an increasewhich are generally recognized in lower margin services revenue.revenue on the contract effective date.
The increase in total gross profit in the nine months ended September 30, 2017 was primarily due to increased total revenue.
The increases in servicemaintenance gross profit percent in the three and nine months ended September 30, 2017March 31, 2018 was driven by a large project which began$0.5 million decrease in client support expenses as we transferred client support resources to support our growing cloud business.
The increase in cloud gross profit percent in the second half of 2016three months ended March 31, 2018 was driven by cost efficiency gains as our cloud business continues to grow and several additional large projects for which costs were recognizedscale, partially offset by a $0.5 million increase in 2016 but whose associated revenue was not recognized until after September 30, 2016.client support expenses as we expanded our cloud client support function to sustain our growing cloud business.
If we had transferred these resources on January 1, 2017, the change in maintenance and cloud gross profit and gross profit percent would have been as follows:
| Three Months Ended March 31, | Change | |||||||||||||||||||||||
| (Dollars in thousands) | 2018 | 2017 | ||||||||||||||||||||||
Maintenance | $ | 58,443 | 91% | $ | 51,995 | 89% | $ | 6,448 | 12% | |||||||||||||||
Cloud | $ | 7,861 | 50% | $ | 4,169 | 40% | $ | 3,692 | 89% | |||||||||||||||
Operating expenses
Operating expenses
Selling and marketing
| Three Months Ended September 30, | Nine Months Ended September 30, | Three Months Ended March 31, | Change | |||||||||||||||||||||||||||||||||||||||||||||
| (Dollars in thousands) | 2017 | 2016 | Change | 2017 | 2016 | Change | 2018 | 2017 | ||||||||||||||||||||||||||||||||||||||||
Selling and marketing | $ | 70,209 | $ | 67,032 | $ | 3,177 | 5 | % | $ | 217,384 | $ | 202,126 | $ | 15,258 | 8 | % | $ | 88,383 | $ | 69,681 | $ | 18,702 | 27% | |||||||||||||||||||||||||
As a percent of total revenue | 39 | % | 37 | % | 36 | % | 37 | % | 38% | 27% | ||||||||||||||||||||||||||||||||||||||
Selling and marketing headcount, end of period | 934 | 875 | 59 | 7 | % | 1,082 | 900 | 182 | 20% | |||||||||||||||||||||||||||||||||||||||
Selling and marketing expenses include compensation, benefits, and other headcount-related expenses associated with our selling and marketing personnel as well as advertising, promotions, trade shows, seminars, and other programs. Selling and marketing expenses also include the amortization of customer relatedclient-related intangibles.
The increase in the three months ended September 30, 2017March 31, 2018 was primarily due to an increase in compensation and benefits of $1.8$11.6 million, driven by increased headcount and equity compensation, partially offset by a decrease in salesamortization of deferred commissions, increased spending on event marketing and digital advertising, and the expenses associated with the lower value of new license arrangements executed during the three months ended September 30, 2017.
The increaseassigning contract negotiation resources to drive efficiencies in the nine months ended September 30, 2017 was primarily due to an increasesales process in compensation and benefitssupport of $12.7 million, respectively, driven by increased headcount and equity compensation, and an increase in employee travel and entertainment, partially offset by a decrease in brand marketing program expenses of $2.2 million.our long-term growth.
The increase in headcount reflects our efforts to increase our sales capacity to target new accounts in existing industries, as well as to expand coverage in new industries and geographies, and to increase the number of sales opportunities.
Research and development
| Three Months Ended September 30, | Nine Months Ended September 30, | |||||||||||||||||||||||||||||||
| (Dollars in thousands) | 2017 | 2016 | Change | 2017 | 2016 | Change | ||||||||||||||||||||||||||
Research and development | $ | 41,031 | $ | 38,036 | $ | 2,995 | 8 | % | $ | 121,089 | $ | 108,530 | $ | 12,559 | 12 | % | ||||||||||||||||
As a percent of total revenue | 23 | % | 21 | % | 20 | % | 20 | % | ||||||||||||||||||||||||
Research and Development headcount, end of period | 1,474 | 1,437 | 37 | 3 | % | |||||||||||||||||||||||||||
Research and development As a percent of total revenue Research and Development headcount, end of period Three Months Ended
March 31, Change (Dollars in thousands) 2018 2017 $ 46,785 $ 40,296 $ 6,489 16% 20% 16% 1,602 1,441 161 11%
Research and development expenses include compensation, benefits, contracted services, and other headcount-related expenses associated with the creation and development of our products, as well as enhancements and design changes to existing products and the integration of acquired technologies.
The increasesincrease in the three and nine months ended September 30, 2017 wereMarch 31, 2018 was primarily due to increasesan increase in compensation and benefits of $2.9$4.6 million and $12.6 million, respectively, attributable to increased headcount, and equity compensation.the expansion of our application development team to support the continued development of our software.
General and administrative
| Three Months Ended September 30, | Nine Months Ended September 30, | Three Months Ended March 31, | Change | |||||||||||||||||||||||||||||||||||||||||||||
| (Dollars in thousands) | 2017 | 2016 | Change | 2017 | 2016 | Change | 2018 | 2017 | ||||||||||||||||||||||||||||||||||||||||
General and administrative | $ | 13,133 | $ | 11,725 | $ | 1,408 | 12 | % | $ | 38,174 | $ | 34,067 | $ | 4,107 | 12 | % | $ | 16,464 | $ | 12,335 | $ | 4,129 | 33 % | |||||||||||||||||||||||||
As a percent of total revenue | 7 | % | 6 | % | 6 | % | 6 | % | 7% | 5% | ||||||||||||||||||||||||||||||||||||||
General and administrative headcount, end of period | 407 | 371 | 36 | 10 | % | 299 | 384 | (85 | ) | (22)% | ||||||||||||||||||||||||||||||||||||||
General and administrative expenses include compensation, benefits, and other headcount-related expenses associated with finance, legal, corporate governance, and other administrative headcount. They also include accounting, legal, and other professional consulting and administrative fees. The general and administrative headcount includes employees in human resources, information technology, and corporate services departments, whose costs are partially allocated to other operating expense areas.
The increasesincrease in the three and nine months ended September 30, 2017 wereMarch 31, 2018 was primarily due to increasesan increase in compensation and benefits of $0.4$1.1 million, and $4 million, respectively, attributable to increased headcountequity compensation, and equity compensation. Thean increase in the nine months ended September 30, 2017 was partially offset by a decrease of $1.5$1 million in legal fees. The decrease in headcount reflects the realignment of contract negotiation and product development resources to augment our selling and marketing and research development functions, respectively.
Stock-based compensation
| Three Months Ended September 30, | Nine Months Ended September 30, | Three Months Ended March 31, | Change | |||||||||||||||||||||||||||||||||||||||||||||
| (in thousands) | 2017 | 2016 | Change | 2017 | 2016 | Change | 2018 | 2017 | ||||||||||||||||||||||||||||||||||||||||
Cost of revenues | $ | 3,613 | $ | 3,117 | $ | 496 | 16 | % | $ | 10,913 | $ | 8,711 | $ | 2,202 | 25 | % | $ | 3,701 | $ | 3,622 | $ | 79 | 2 % | |||||||||||||||||||||||||
Selling and marketing | 3,976 | 3,468 | 508 | 15 | % | 11,482 | 9,395 | 2,087 | 22 | % | 4,658 | 3,405 | 1,253 | 37 % | ||||||||||||||||||||||||||||||||||
Research and development | 3,420 | 2,260 | 1,160 | 51 | % | 10,306 | 7,480 | 2,826 | 38 | % | 3,637 | 3,312 | 325 | 10 % | ||||||||||||||||||||||||||||||||||
General and administrative | 2,480 | 1,983 | 497 | 25 | % | 7,228 | 4,706 | 2,522 | 54 | % | 3,113 | 2,169 | 944 | 44 % | ||||||||||||||||||||||||||||||||||
Acquisition-related | — | (10 | ) | 10 | (100 | )% | — | 342 | (342 | ) | (100 | )% | ||||||||||||||||||||||||||||||||||||
|
|
|
|
|
| |||||||||||||||||||||||||||||||||||||||||||
Total stock-based compensation before tax | $ | 13,489 | $ | 10,818 | $ | 2,671 | 25 | % | $ | 39,929 | $ | 30,634 | $ | 9,295 | 30 | % | ||||||||||||||||||||||||||||||||
| $ | 15,109 | $ | 12,508 | $ | 2,601 | 21 % | ||||||||||||||||||||||||||||||||||||||||||
|
|
|
|
|
| |||||||||||||||||||||||||||||||||||||||||||
Income tax benefit | $ | (4,129 | ) | $ | (3,227 | ) | $ | (902 | ) | 28 | % | $ | (12,231 | ) | $ | (8,917 | ) | $ | (3,314 | ) | 37 | % | $ | (3,141) | $ | (3,815) | $ | 674 | (18)% | |||||||||||||||||||
The increases wereincrease was primarily due to the increased value of our annual periodic equity awards granted in March 20162018 and 2017. These awards generally have a five-year vesting schedule.
Amortization of intangibles
| Three Months Ended September 30, | Nine Months Ended September 30, | |||||||||||||||||||||||||||||||
| (Dollars in thousands) | 2017 | 2016 | Change | 2017 | 2016 | Change | ||||||||||||||||||||||||||
Cost of revenue | $ | 1,232 | $ | 1,642 | $ | (410 | ) | (25 | )% | $ | 3,871 | $ | 4,626 | $ | (755 | ) | (16 | )% | ||||||||||||||
Selling and marketing | 1,873 | 1,867 | 6 | — | % | 5,608 | 5,274 | 334 | 6 | % | ||||||||||||||||||||||
General and administrative | — | 90 | (90 | ) | (100 | )% | — | 268 | (268 | ) | (100 | )% | ||||||||||||||||||||
|
|
|
|
|
|
|
| |||||||||||||||||||||||||
| $ | 3,105 | $ | 3,599 | $ | (494 | ) | (14 | )% | $ | 9,479 | $ | 10,168 | $ | (689 | ) | (7 | )% | |||||||||||||||
|
|
|
|
|
|
|
| |||||||||||||||||||||||||
The decreases in amortization of intangibles in the three and nine months ended September 30, 2017 were due to the amortization in full of certain intangibles acquired through past acquisitions.
Non-operating income/(expense)/income,, net
| Three Months Ended September 30, | Nine Months Ended September 30, | Three Months Ended March 31, | Change | |||||||||||||||||||||||||||||||||||||||||||||
| (Dollars in thousands) | 2017 | 2016 | Change | 2017 | 2016 | Change | 2018 | 2017 | ||||||||||||||||||||||||||||||||||||||||
Foreign currency transaction (loss)/gain | $ | (552 | ) | $ | 1,082 | $ | (1,634 | ) | n/m | $ | (793 | ) | $ | 2,764 | $ | (3,557 | ) | n/m | $ | (1,085) | $ | 745 | $ | (1,830) | n/m | |||||||||||||||||||||||
Interest income, net | 144 | 172 | $ | (28 | ) | (16 | )% | 470 | 650 | (180 | ) | (28 | )% | 764 | 205 | 559 | 273 % | |||||||||||||||||||||||||||||||
Other (expense)/income, net | — | (1,237 | ) | $ | 1,237 | (100 | )% | 287 | (4,891 | ) | 5,178 | n/m | ||||||||||||||||||||||||||||||||||||
Other income/(expense), net | 363 | (279) | 642 | n/m | ||||||||||||||||||||||||||||||||||||||||||||
|
|
|
|
|
| |||||||||||||||||||||||||||||||||||||||||||
| $ | (408 | ) | $ | 17 | $ | (425 | ) | n/m | $ | (36 | ) | $ | (1,477 | ) | $ | 1,441 | (98 | )% | $ | 42 | $ | 671 | $ | (629) | (94)% | |||||||||||||||||||||||
|
|
|
|
|
| |||||||||||||||||||||||||||||||||||||||||||
n/m - not meaningful
In May 2017, we discontinued our forward contracts program; however, we will continueThe change in foreign currency transaction (loss)/gain is primarily due to evaluate periodically ourunrealized losses on foreign exchange exposures and mayre-initiate this program if it is deemed necessary.
Historically,currency denominated receivables. The adoption of ASC 606 materially increased the unbilled receivables we have used foreign currency forward contracts (“forward contracts”) to hedge our exposure torecorded, which has increased the impact of fluctuations in foreign currency exchange rates associated withreported in our foreign currency denominated cash, accounts receivable,unaudited condensed consolidated statements of operations. See Item 3. “Quantitative and intercompany receivables and payables held primarily by the U.S. parent company and its United Kingdom (“U.K.”) subsidiary. See Note 4 “Derivative Instruments” of this Quarterly Report on Form 10-QQualitative Disclosures about Market Risk” for additional information.
The total change in the fair value of our foreign currency forward contracts recorded in other income (expense), net, during the three months ended September 30, 2016 was a loss of $1.2 million. The total change in the fair value of our foreign currency forward contracts recorded in other (expense)/income, net, during the nine months ended September 30, 2017 and 2016 was a gain of $0.3 million and a loss of $5 million, respectively.
(Benefit)/provision for income taxes
| Three Months Ended September 30, | Nine Months Ended September 30, | Three Months Ended March 31, | Change | |||||||||||||||||||||||||||||||||||||||||||||
| (Dollars in thousands) | 2017 | 2016 | Change | 2017 | 2016 | Change | 2018 | 2017 | ||||||||||||||||||||||||||||||||||||||||
(Benefit)/provision for income taxes | $ | (12,885 | ) | $ | 2,214 | $ | (15,099 | ) | n/m | $ | (17,952 | ) | $ | 6,269 | $ | (24,221 | ) | n/m | $ | (4,222) | $ | 13,615 | $ | (17,837) | n/m | |||||||||||||||||||||||
Effective income tax rate | 88 | % | 40 | % | (96 | )% | 26 | % | (53)% | 20% | ||||||||||||||||||||||||||||||||||||||
n/m - not meaningful
The (benefit)/provision for income taxes represents current and future amounts for federal, state, and foreign taxes.
The increase in the effective income tax rate inDuring the three months ended September 30, 2017 isMarch 31, 2018, our effective tax rate changed primarily due to the significant increase of $3.5 million in following factors:
The
The inclusion of excess tax benefits from stock-based compensation as a component of the provision for income taxes may increasehas increased the volatility inof the effective tax rates ofin recent periods, and may continue to do so in future periods, as the amount of excess tax benefits from share-basedstock-based compensation awards varies depending on our future stock price in relation to the fair value of awards, the timing of RSU vesting andvestings, exercise behavior of our stock option holders, and the total value of future grants of share-basedstock-based compensation awards.
Liquidity and capital resourcesLIQUIDITY AND CAPITAL RESOURCES
| Nine Months Ended September 30, | Three Months Ended March 31, | |||||||||||||||
| (in thousands) | 2017 | 2016 | 2018 | 2017 | ||||||||||||
Cash provided by (used in): | ||||||||||||||||
Operating activities | $ | 113,926 | $ | 20,556 | $ | 55,655 | $ | 32,444 | ||||||||
Investing activities | (11,966 | ) | (2,859 | ) | (31,278) | (3,727) | ||||||||||
Financing activities | (44,040 | ) | (43,031 | ) | (23,052) | (15,994) | ||||||||||
Effect of exchange rate on cash | 2,054 | (1,309 | ) | |||||||||||||
Effect of exchange rates on cash and cash equivalents | 2,186 | 521 | ||||||||||||||
|
|
|
| |||||||||||||
Net increase/(decrease) in cash and cash equivalents | $ | 59,974 | $ | (26,643 | ) | |||||||||||
Net increase in cash and cash equivalents | $ | 3,511 | $ | 13,244 | ||||||||||||
|
|
|
| |||||||||||||
| (in thousands) | September 30, 2017 | December 31, 2016 | March 31, 2018 | December 31, 2017 | ||||||||||||
Held in U.S. entities | $ | 168,135 | $ | 136,444 | ||||||||||||
Held in foreign entities | 86,702 | 87,304 | ||||||||||||||
|
| |||||||||||||||
Total cash, cash equivalents, and marketable securities | $ | 194,380 | $ | 133,761 | $ | 254,837 | $ | 223,748 | ||||||||
|
| |||||||||||||||
We believe that our current cash, cash equivalents, marketable securities, and cash flow from operations will be sufficient to fund our operations, our dividend payments,quarterly cash dividends, and our share repurchase programstock repurchases for at least the next 12 months.
As of September 30, 2017, approximately $61.1 million of our cash and cash equivalents was held in our foreign subsidiaries. If it becomesbecame necessary to repatriate theseforeign funds, we may be required to pay U.S. tax, net of any applicablestate and local taxes, as well as foreign tax credits,taxes, upon repatriation. We considerDue to the earningscomplexity of our foreign subsidiaries to be permanently reinvestedthe income tax laws and as a result, U.S. taxes on such earnings are not provided. Itthe effects of the Tax Reform Act, it is impracticalimpracticable to estimate the amount of U.S. taxtaxes we may be requiredwould have to pay upon repatriation due to the complexity of the foreign tax credit calculations. There can be no assurance that changes in our plans or other events affecting our operations will not result in materially accelerated or unexpected expenditures.pay.
Cash provided by operating activities
The primary drivers during the ninethree months ended September 30, 2017March 31, 2018 were net income of $36.6$12.2 million and $80.6$49.6 million from trade accounts receivable,receivables and contract assets, largely due to increased cash collections and the timing of billings.
The primary driver during the ninethree months ended September 30, 2016March 31, 2017 was net income of $18.2$53.0 million.
Future Cash Receipts from Committed License and Cloud Arrangements
As of September 30, 2017, none of the amounts shown in the table below had been billed and no revenue had been recognized.
The below amounts for 2018 and subsequent periods may not be recognized in the periods shown below as a result of the adoption of the new revenue recognition standard (ASC 606). (See Note 2. New Accounting Pronouncements contained elsewhere in this Quarterly Report on Form10-Q for additional information)
| September 30, 2017 | ||||||||||||
| (in thousands) | Term and cloud contracts | Perpetual contracts (1) | Total | |||||||||
Remainder of 2017 | $ | 37,723 | $ | 13,274 | $ | 50,997 | ||||||
2018 | 150,629 | 21,213 | 171,842 | |||||||||
2019 | 125,165 | 10,033 | 135,198 | |||||||||
2020 | 85,939 | 1,572 | 87,511 | |||||||||
2021 | 38,203 | 367 | 38,570 | |||||||||
2022 and thereafter | 12,876 | — | 12,876 | |||||||||
|
|
|
|
|
| |||||||
Total | $ | 450,535 | $ | 46,459 | $ | 496,994 | ||||||
|
|
|
|
|
| |||||||
Total contractual future cash receipts due from our existing license and cloud arrangements were approximately $376.3 million as of September 30, 2016.
Cash used in investing activities
During the ninethree months ended September 30, 2017,March 31, 2018, we purchased $25.7investments of $35.2 million of marketable debt securities and made investments of $9.1$2.1 million in property and equipment, partially offset by proceeds received from maturities of marketable debt securitiesinvestments (including called marketable debt securities) of $23.1$6 million.
During the ninethree months ended September 30, 2016,March 31, 2017, we acquired OpenSpan for $48.8purchased investments of $3.3 million, net of cash acquired, and invested $15.3 million primarily in internally developed software and leasehold improvements at our corporate headquarters, partially offset by proceeds received from the salesmaturities of investments (including called marketable debt securitiessecurities) of $62.3$2.3 million. We also invested $2.4 million primarily for leasehold improvements for the build out of additional office space at our Hyderabad, India location.
Cash used in financing activities
We used cash primarily for repurchases of our common stock shareunder our publicly announced stock repurchase programs, stock repurchases for tax withholdings for the net settlement of our equity awards, and the payment of our quarterly dividend.
Since 2004, our Board of Directors has approved annual stock repurchase programs that have authorized the repurchase in the aggregate of up to $195 million of our common stock. Purchases under these programs have been made on the open market. As of March 31, 2018, $159.2 million had been repurchased, $29.2 million remained available for repurchase, and $6.4 million had expired.
The following table is a summary of our repurchase activity:Common stock repurchases
| Nine Months Ended September 30, | ||||||||||||||||||||||||
| 2017 | 2016 | |||||||||||||||||||||||
| (in thousands) | Shares | Amount | Authorization Remaining Under Publicly Announced Share Repurchased Programs | Shares | Amount | Authorization Remaining Under Publicly Announced Share Repurchased Programs | ||||||||||||||||||
Balance as of January 1, | $ | 39,385 | $ | 40,534 | ||||||||||||||||||||
Authorizations | — | — | — | — | — | 25,879 | ||||||||||||||||||
Repurchase for net settlement of tax under stock-based compensation | 682 | (34,791 | ) | — | 414 | (10,791 | ) | — | ||||||||||||||||
Repurchases paid under authorized share repurchase program | 68 | (2,986 | ) | (2,986 | ) | 1,028 | (25,530 | ) | (25,530 | ) | ||||||||||||||
Repurchases unsettled | — | — | — | 6 | (177 | ) | (177 | ) | ||||||||||||||||
|
|
|
|
|
|
|
|
|
|
|
| |||||||||||||
Activity in Period | 750 | $ | (37,777 | ) | $ | (2,986 | ) | 1,448 | $ | (36,498 | ) | $ | 172 | |||||||||||
|
|
|
| |||||||||||||||||||||
Balance as of September 30, | $ | 36,399 | $ | 40,706 | ||||||||||||||||||||
|
|
|
| |||||||||||||||||||||
| Three Months Ended March 31, | ||||||||||||||||
| 2018 | 2017 | |||||||||||||||
| (in thousands) | Shares | Amount | Shares | Amount | ||||||||||||
Tax withholdings for net settlement of equity awards | 270 | $ | 15,575 | 289 | $ | 12,504 | ||||||||||
Stock repurchase program(1) | ||||||||||||||||
Repurchases paid | 89 | 4,998 | 29 | 1,260 | ||||||||||||
Repurchases unsettled at period end | 12 | 690 | 5 | 238 | ||||||||||||
|
|
|
|
|
|
|
| |||||||||
Activity in Period(2) | 371 | $ | 21,263 | 323 | $ | 14,002 | ||||||||||
|
|
|
|
|
|
|
| |||||||||
In addition to the share repurchases made under our repurchase programs, we net settled the majority of our employee stock option exercises and RSU vestings, which resulted in the withholding of shares to cover the option exercise price and the minimum statutory tax withholding obligations.
During the nine months ended September 30, 2017 and 2016, option and RSU holders net settled a total of 2.4 million shares and 1.6 million shares, respectively, of which only 1.3 million shares and 0.8 million shares, respectively, were issued to the option and RSU holders. The balance of the shares were surrendered to us to pay for the exercise price with respect to options and the applicable taxes for both options and RSUs. During the nine months ended September 30, 2017 and 2016, instead of receiving cash from the equity holders, we withheld shares with a value of $23.7 million and $10.1 million, respectively, for the exercise price of options.
| (1) | Represents activity under our publicly announced stock repurchase programs. |
| (2) | During the three months ended March 31, 2018 and 2017, instead of receiving cash from the equity holders, we withheld shares with a value of $11.2 million and $7.7 million for the exercise price of options. These amounts have been excluded from the table above. |
Dividends
| Nine Months Ended September 30, | ||||||||
| (per share) | 2017 | 2016 | ||||||
Dividends Declared | $ | 0.09 | $ | 0.09 | ||||
Dividends Paid | $ | 0.09 | $ | 0.09 | ||||
| Three Months Ended March 31, | ||||
| (per share) | 2018 | 2017 | ||
Dividends declared | $ 0.03 | $ 0.03 | ||
During the three months ended March 31, 2018 and 2017, we paid cash dividends of $2.3 million. It is our current intention to pay a quarterly cash dividend of $0.03 per share, however, the Board of Directors may terminate or modify this dividend program at any time without prior notice.
| ITEM 3. | QUANTITATIVE AND QUALITATIVE |
Market risk represents the risk of loss that may affect us due to adverse changes in financial market prices and rates. Our market risk exposure is primarily related to fluctuations in foreign exchange rates.
As of September 30, 2017, we did not have any forward contracts outstanding. See Note 4 “Derivative Instruments” of this Quarterly Report on Form10-Q for further discussion.
Other than the item discussed above,below, there were no significant changes to our quantitative and qualitative disclosures about market risk exposure during the first ninethree months ended September 30, 2017. March 31, 2018.
See Part II, Item 7A. Quantitative“Quantitative and Qualitative Disclosures about Market RiskRisk” and Item 1A. “Risk Factors - We are exposed to fluctuations in currency exchange rates that could negatively impact our financial results and cash flows” included in our Annual Report on Form10-K for the year ended December 31, 20162017 for a more complete discussion of our market risk exposure.
Foreign currency exposure
Translation Risk
Our international sales are usually denominated in foreign currencies. However, the operating expenses of our foreign operations are also primarily denominated in foreign currencies, which partially offset our foreign currency exposure.
A hypothetical 10% strengthening in the U.S. dollar against other currencies would result in the following impact:
Three Months Ended March 31, | ||||
2018 | 2017 | |||
Revenue | (4)% | (3)% | ||
Net Income | (13)% | (4)% | ||
Remeasurement Risk(1)
We have experienced and expect to continue to experience fluctuations in our results of operations as a result of transaction gains or losses related to remeasuring monetary assets and liabilities that are denominated in currencies other than the functional currency of the entities in which they are recorded. We are primarily exposed to changes in foreign currency exchange rates associated with Australian dollar, Euro, and U.S. dollar denominated cash and cash equivalents, accounts receivable, unbilled receivables, and intercompany receivables and payables held by our U.K. subsidiary, a British pound functional entity.
A hypothetical 10% strengthening in the British pound exchange rate in comparison to the Australian dollar, Euro, and U.S. dollar would result in the following impact:
| (Dollars in thousands) | March 31, 2018 | December 31, 2017 | ||||||
Foreign currency transaction (loss)/gain | $ | (8,200) | $ | (5,800) | ||||
| (1) | The adoption of ASC 606 materially increased the unbilled receivables we have recorded, which has increased the impact of fluctuations in foreign exchange rates reported in our unaudited condensed consolidated statements of operations. |
| ITEM 4. | CONTROLS AND PROCEDURES |
(a) Evaluation of Disclosure Controls and Procedures
Our management, with the participation of our Chief Executive Officer or CEO,(“CEO”) and Chief Financial Officer or CFO,(“CFO”) evaluated the effectiveness of our disclosure controls and procedures (as defined in Rules13a-15(e) and15d-15(e) under the Securities Exchange Act)Act of 1934, as amended (“Exchange Act”)) as of September 30, 2017.March 31, 2018. In designing and evaluating our disclosure controls and procedures, our management recognized that any controls and procedures, no matter how well designed and operated, can provide only reasonable assurance of achieving their objectives, and our management necessarily applied its judgment in evaluating the cost-benefit relationship of possible controls and procedures. Based on this evaluation, our CEO and CFO concluded that our disclosure controls and procedures were effective as of September 30, 2017.March 31, 2018.
(b) Changes in Internal Control over Financial Reporting
There have been no changes in our internal control over financial reporting (as defined in Rules13a-15(f) and15d-15(f) under the Securities Exchange Act)Act during the quarter ended September 30, 2017March 31, 2018 that have materially affected, or are reasonably likely to materially affect, our internal control over financial reporting.
PART II—II - OTHER INFORMATION
| ITEM 1A. | RISK FACTORS |
We encourage you to carefully consider the risk factors identified in Part I, Item 1A. “Risk Factors” inof our Annual Report onForm 10-K for the year ended December 31, 2016.2017. These risk factors could materially affect our business, financial condition, and future results and could cause our actual business and financial results to differ materially from those contained in forward-looking statements made in this Quarterly Report on Form10-Q or elsewhere by management from time to time. There have been no material changes during the ninethree months ended September 30, 2017March 31, 2018 to the risk factors disclosed in our Annual Report on Form10-K for the year ended December 31, 2016.2017.
| ITEM 2. | UNREGISTERED SALES OF EQUITY SECURITIES AND USE OF PROCEEDS |
The following table sets forth information regarding our repurchases of our common stock during the three months ended September 30, 2017:March 31, 2018:
Period | Total Number of Shares Purchased (in thousands) | Average Price Paid per Share | Total Number of Shares Purchased as Part of Publicly Announced Share Repurchase Program (1) (in thousands) | Approximate Dollar Value of Shares That May Yet Be Purchased at Period End Under Publicly Announced Share Repurchased Programs (1) (in thousands) | ||||||||||||
July 1, 2017 - July 31, 2017 | 12 | $ | 58.54 | — | $ | 36,399 | ||||||||||
August 1, 2017 - August 31, 2017 | 55 | 56.16 | — | 36,399 | ||||||||||||
September 1, 2017 - September 30, 2017 | 108 | 56.56 | — | 36,399 | ||||||||||||
|
| |||||||||||||||
Total | 175 | $ | 56.57 | |||||||||||||
|
| |||||||||||||||
(in thousands, except per share
amounts)
| Total Number of Shares Purchased(1) | Average Price Paid | Total Number of Shares Purchased as Part | Approximate Dollar Value of Shares That May Yet Be Purchased at Period End Under Publicly Announced Share Repurchase Programs(2) | ||||||||
January 1, 2018 - January 31, 2018 | 58 | $ 49.63 | 21 | $ | 33,855 | |||||||
February 1, 2018 - February 28, 2018 | 68 | 55.06 | 17 | 32,985 | ||||||||
March 1, 2018 - March 31, 2018 | 435 | 59.37 | 63 | 29,204 | ||||||||
| ||||||||||||
Total | 561 | 57.84 | ||||||||||
| ||||||||||||
| (1) | Shares withheld to cover the option exercise price and statutory tax withholding obligations under the net settlement provisions of |
| (2) | Since 2004, our Board of Directors has approved stock repurchase programs that have authorized the repurchase, in the aggregate, of up to $195 million of our common stock. On May 30, 2017, we announced that our Board of Directors extended the expiration date of the current stock repurchase program to June 30, 2018 (the “Current Program”). Under the Current Program, purchases may be made from time to time on the open market or in privately negotiated transactions. Shares may be repurchased in such amounts as market conditions warrant, subject to regulatory and other considerations. We have established apre-arranged stock repurchase plan, intended to comply with the requirements of Rule10b5-1 under the |
| ITEM 6. | EXHIBITS |
The following exhibits are filed or furnished, as the case may be, as part of this report.
EXHIBIT INDEX
Exhibit No. | Description | |
10.1++ | 2018 Executive Officers Base Salaries and Target Bonsus Percentages and Incentives (Filed as Exhibit 99.1 to the Registrant’s March 9, 2018 Form8-K and incorporated herein by reference). | |
31.1 | Certification pursuant to Exchange Act Rules13a-14 and15d-14 of the Chief Executive Officer. | |
31.2 | Certification pursuant to Exchange Act Rules13a-14 and15d-14 of the Chief Financial Officer. | |
32+ | Certification pursuant to 18 U.S.C. Section 1350 of the Chief Executive Officer and the Chief Financial Officer. | |
101.INS | XBRL Instance document. | |
101.SCH | XBRL Taxonomy Extension Schema Document. | |
101.CAL | XBRL Taxonomy Calculation Linkbase Document. | |
101.DEF | XBRL Taxonomy Extension Definition Linkbase Document. | |
101.LAB | XBRL Taxonomy Label Linkbase Document. | |
101.PRE | XBRL Taxonomy Presentation Linkbase Document. | |
+ Indicates that the exhibit is being furnished with this report and is not filed as a part of it.
++Management contracts and compensatory plan or arrangements
Pursuant to the requirements of the Securities Exchange Act of 1934, the Registrant has duly caused this report to be signed on its behalf by the undersigned thereunto duly authorized.
| Pegasystems Inc. | ||||||
| By: | /s/ KENNETH STILLWELL | |||||
| Kenneth Stillwell | ||||||
| Chief Financial Officer and Chief Administrative Officer | ||||||
| (Principal Financial Officer) | ||||||
2730