SECURITIES AND EXCHANGE COMMISSION
____________________
____________________
☒ |
| |
| x | Quarterly Report pursuant to Section 13 or 15(d) of the Securities Exchange Act of 1934 |
| For the quarterly period ended March 31, 2019 |
For the quarterly period ended March 31, 2018
☐ |
| |
| ¨ | Transition Report pursuant to Section 13 or 15(d) of the Securities Exchange Act of 1934 |
Commission File Number:
1-11859____________________
(Exact name of
Registrantregistrant as specified in its charter)
____________________
|
| |
| Massachusetts | | 04-2787865 |
| (State or other jurisdiction of incorporation or organization) | | (IRS Employer Identification No.) |
| |
| One Rogers Street, Cambridge, MA | | 02142-1209 |
| (Address of principal executive offices) | | (Zip Code) |
(Registrant’s telephone number, including area code)
____________________
Indicate by check mark whether the Registrant (1) has filed all reports required to be filed by Section 13 or 15(d) of the Securities Exchange Act of 1934 during the preceding 12 months (or for such shorter period that the Registrant was required to file such reports), and (2) has been subject to such filing requirements for the past 90 days. Yes ☒ x No ☐¨ Indicate by check mark whether the Registrant has submitted electronically and posted on its corporate Web site, if any, every Interactive Data File required to be submitted and posted pursuant to Rule 405 of RegulationS-T during the preceding 12 months (or for such shorter period that the Registrant was required to submit and post such files). Yes ☒ x No ☐¨ Indicate by check mark whether the Registrant is a large accelerated filer, an accelerated filer, a
non-accelerated filer, a smaller reporting company, or an emerging growth company. See the definitions of “large accelerated filer,” “accelerated filer,” “smaller reporting company,” and “emerging growth company” in
Rule 12b-2 of the Exchange Act.
| | | |
| | | | |
Large accelerated filer ☒x | | Accelerated filer ☐¨
| | Non-accelerated filer ☐(Do not check if smaller reporting company)
¨ | | Smaller reporting company ☐¨ | | Emerging growth company ☐¨ |
If an emerging growth company, indicate by check mark if the Registrant has elected not to use the extended transition period for complying with any new or revised financial accounting standards provided pursuant to Section 13(a) of the Exchange Act. ☐¨ Indicate by check mark whether the Registrant is a shell company (as defined inRule 12b-2 of the Exchange Act). Yes ☐ ¨ No ☒x Securities registered pursuant to Section 12(b) of the Act:
|
| | |
| Title of each class | Trading Symbol(s) | Name of each exchange on which registered |
| Common Stock, $.01 par value per share | PEGA | NASDAQ Global Select Market |
There were
78,575,80378,908,093 shares of the Registrant’s common stock, $0.01 par value per share, outstanding on May 1,
2018.2019.
QUARTERLY REPORT ON FORM
10-Q
PART I - FINANCIAL INFORMATION
ITEM 1. | UNAUDITED CONDENSED CONSOLIDATED FINANCIAL STATEMENTS |
ITEM 1. UNAUDITED CONDENSED CONSOLIDATED FINANCIAL STATEMENTS
UNAUDITED CONDENSED CONSOLIDATED BALANCE SHEETS
(in thousands)
| | | | | | | | |
| | | March 31,
2018 | | | December 31,
2017 | |
| | | | | | As Adjusted(1) | |
Assets | | | | | | | | |
Current assets: | | | | | | | | |
Cash and cash equivalents | | $ | 165,790 | | | $ | 162,279 | |
Marketable securities | | | 89,047 | | | | 61,469 | |
| | | | | | | | |
Total cash, cash equivalents, and marketable securities | | | 254,837 | | | | 223,748 | |
Accounts receivable | | | 164,981 | | | | 222,735 | |
Unbilled receivables | | | 153,657 | | | | 158,898 | |
Other current assets | | | 50,692 | | | | 41,135 | |
| | | | | | | | |
Total current assets | | | 624,167 | | | | 646,516 | |
Long-term unbilled receivables | | | 180,077 | | | | 160,708 | |
Goodwill | | | 73,017 | | | | 72,952 | |
Other long-term assets | | | 128,694 | | | | 131,391 | |
| | | | | | | | |
Total assets | | $ | 1,005,955 | | | $ | 1,011,567 | |
| | | | | | | | |
Liabilities and stockholders’ equity | | | | | | | | |
Current liabilities: | | | | | | | | |
Accounts payable | | $ | 12,175 | | | $ | 17,370 | |
Accrued expenses | | | 48,278 | | | | 45,508 | |
Accrued compensation and related expenses | | | 44,093 | | | | 66,040 | |
Deferred revenue | | | 175,586 | | | | 166,297 | |
| | | | | | | | |
Total current liabilities | | | 280,132 | | | | 295,215 | |
Deferred income tax liabilities | | | 39,932 | | | | 38,463 | |
Other long-term liabilities | | | 23,768 | | | | 23,652 | |
| | | | | | | | |
Total liabilities | | | 343,832 | | | | 357,330 | |
Stockholders’ equity: | | | | | | | | |
Preferred stock, 1,000 shares authorized; no shares issued and outstanding | | | — | | | | — | |
Common stock, 200,000 shares authorized; 78,546 shares and 78,081 issued and outstanding at March 31, 2018 and December 31, 2017, respectively | | | 785 | | | | 781 | |
Additionalpaid-in capital | | | 145,962 | | | | 152,097 | |
Retained earnings | | | 517,893 | | | | 508,051 | |
Accumulated other comprehensive loss | | | (2,517) | | | | (6,692) | |
| | | | | | | | |
Total stockholders’ equity | | | 662,123 | | | | 654,237 | |
| | | | | | | | |
Total liabilities and stockholders’ equity | | $ | 1,005,955 | | | $ | 1,011,567 | |
| | | | | | | | |
| (1) | The Company adopted the new revenue recognition standard (“ASC 606”) on January 1, 2018 and has adjusted prior periods to conform. See Note 2. “New Accounting Pronouncements” for additional information. |
|
| | | | | | | |
| | March 31, 2019 | | December 31, 2018 |
| Assets | | | |
| Current assets: | | | |
| Cash and cash equivalents | $ | 110,367 |
|
| $ | 114,422 |
|
| Marketable securities | 91,804 |
|
| 93,001 |
|
| Total cash, cash equivalents, and marketable securities | 202,171 |
| | 207,423 |
|
| Accounts receivable | 135,352 |
|
| 180,872 |
|
| Unbilled receivables | 161,480 |
|
| 172,656 |
|
| Other current assets | 63,731 |
|
| 49,684 |
|
| Total current assets | 562,734 |
| | 610,635 |
|
| Long-term unbilled receivables | 130,494 |
|
| 151,237 |
|
| Goodwill | 72,898 |
|
| 72,858 |
|
| Other long-term assets | 190,433 |
|
| 147,823 |
|
| Total assets | $ | 956,559 |
| | $ | 982,553 |
|
| Liabilities and stockholders’ equity | | | |
| Current liabilities: | | | |
| Accounts payable | $ | 11,559 |
|
| $ | 16,487 |
|
| Accrued expenses | 40,947 |
|
| 45,506 |
|
| Accrued compensation and related expenses | 56,349 |
|
| 84,671 |
|
| Deferred revenue | 180,845 |
|
| 185,145 |
|
| Other current liabilities | 12,447 |
| | — |
|
| Total current liabilities | 302,147 |
| | 331,809 |
|
| Operating lease liabilities | 45,325 |
| | — |
|
| Deferred income tax liabilities | 8,319 |
|
| 6,939 |
|
| Other long-term liabilities | 12,339 |
|
| 22,274 |
|
| Total liabilities | 368,130 |
| | 361,022 |
|
| Stockholders’ equity: | | | |
| Preferred stock, 1,000 shares authorized; none issued | — |
| | — |
|
Common stock, 200,000 shares authorized; 78,896 and 78,526 shares issued and outstanding at March 31, 2019 and December 31, 2018, respectively | 789 |
|
| 785 |
|
| Additional paid-in capital | 119,182 |
|
| 123,205 |
|
| Retained earnings | 479,779 |
|
| 510,863 |
|
| Accumulated other comprehensive loss | (11,321 | ) | | (13,322 | ) |
| Total stockholders’ equity | 588,429 |
| | 621,531 |
|
| Total liabilities and stockholders’ equity | $ | 956,559 |
| | $ | 982,553 |
|
See notes to unaudited condensed consolidated financial statements.
UNAUDITED CONDENSED CONSOLIDATED STATEMENTS OF OPERATIONS
(in thousands, except per share amounts)
| | | | | | | | |
| | | Three Months Ended
March 31, | |
| | | 2018 | | | 2017 | |
| | | | | | As Adjusted(1) | |
Revenue | | | | | | | | |
Software license | | $ | 87,773 | | | $ | 127,008 | |
Maintenance | | | 64,525 | | | | 58,713 | |
Services | | | 82,884 | | | | 70,588 | |
| | | | | | | | |
Total revenue | | | 235,182 | | | | 256,309 | |
| | | | | | | | |
Cost of revenue | | | | | | | | |
Software license | | | 1,255 | | | | 1,300 | |
Maintenance | | | 6,082 | | | | 7,218 | |
Services | | | 68,277 | | | | 59,572 | |
| | | | | | | | |
Total cost of revenue | | | 75,614 | | | | 68,090 | |
| | | | | | | | |
Gross profit | | | 159,568 | | | | 188,219 | |
| | | | | | | | |
Operating expenses | | | | | | | | |
Selling and marketing | | | 88,383 | | | | 69,681 | |
Research and development | | | 46,785 | | | | 40,296 | |
General and administrative | | | 16,464 | | | | 12,335 | |
| | | | | | | | |
Total operating expenses | | | 151,632 | | | | 122,312 | |
| | | | | | | | |
Income from operations | | | 7,936 | | | | 65,907 | |
| | | | | | | | |
Foreign currency transaction (loss)/gain | | | (1,085) | | | | 745 | |
Interest income, net | | | 764 | | | | 205 | |
Other income/(expense), net | | | 363 | | | | (279) | |
| | | | | | | | |
Income before (benefit)/provision for income taxes | | | 7,978 | | | | 66,578 | |
(Benefit)/provision for income taxes | | | (4,222) | | | | 13,615 | |
| | | | | | | | |
Net income | | $ | 12,200 | | | $ | 52,963 | |
| | | | | | | | |
Earnings per share | | | | | | | | |
Basic | | $ | 0.16 | | | $ | 0.69 | |
Diluted | | $ | 0.15 | | | $ | 0.65 | |
Weighted-average number of common shares outstanding | | | | | | | | |
Basic | | | 78,236 | | | | 76,761 | |
Diluted | | | 83,102 | | | | 81,875 | |
Cash dividends declared per share | | $ | 0.03 | | | $ | 0.03 | |
| (1) | The Company adopted ASC 606 on January 1, 2018 and has adjusted prior periods to conform. See Note 2. “New Accounting Pronouncements” for additional information. |
|
| | | | | | | |
| | Three Months Ended
March 31, |
| | 2019 | | 2018 |
| Revenue | | | |
| Software license | $ | 63,264 |
| | $ | 87,773 |
|
| Maintenance | 67,706 |
| | 64,525 |
|
| Services | 81,576 |
| | 82,884 |
|
| Total revenue | 212,546 |
| | 235,182 |
|
| Cost of revenue | | | |
| Software license | 1,378 |
| | 1,255 |
|
| Maintenance | 6,335 |
| | 6,082 |
|
| Services | 66,724 |
| | 68,277 |
|
| Total cost of revenue | 74,437 |
| | 75,614 |
|
| Gross profit | 138,109 |
| | 159,568 |
|
| Operating expenses | | | |
| Selling and marketing | 108,865 |
| | 88,383 |
|
| Research and development | 50,596 |
| | 46,785 |
|
| General and administrative | 12,676 |
| | 16,464 |
|
| Total operating expenses | 172,137 |
| | 151,632 |
|
| (Loss) income from operations | (34,028 | ) | | 7,936 |
|
| Foreign currency transaction loss | (3,712 | ) | | (1,085 | ) |
| Interest income, net | 723 |
| | 764 |
|
| Other income, net | — |
| | 363 |
|
| (Loss) income before benefit from income taxes | (37,017 | ) | | 7,978 |
|
| Benefit from income taxes | (8,300 | ) | | (4,222 | ) |
| Net (loss) income | $ | (28,717 | ) | | $ | 12,200 |
|
| (Loss) earnings per share | | | |
| Basic | $ | (0.37 | ) | | $ | 0.16 |
|
| Diluted | $ | (0.37 | ) | | $ | 0.15 |
|
| Weighted-average number of common shares outstanding | | | |
| Basic | 78,584 |
| | 78,236 |
|
| Diluted | 78,584 |
| | 83,102 |
|
See notes to unaudited condensed consolidated financial statements.
UNAUDITED CONDENSED CONSOLIDATED STATEMENTS OF COMPREHENSIVE
(LOSS) INCOME
(in thousands)
| | | | | | | | |
| | | Three Months Ended
March 31, | |
| | | 2018 | | | 2017 | |
| | | | | | As Adjusted(1) | |
Net income | | $ | 12,200 | | | $ | 52,963 | |
Other comprehensive income, net of tax | | | | | | | | |
Unrealized (loss)/gain onavailable-for-sale marketable securities, net of tax | | | (188) | | | | 127 | |
Foreign currency translation adjustments | | | 4,363 | | | | 2,229 | |
| | | | | | | | |
Total other comprehensive income, net of tax | | | 4,175 | | | | 2,356 | |
| | | | | | | | |
Comprehensive income | | $ | 16,375 | | | $ | 55,319 | |
| | | | | | | | |
| (1) | The Company adopted ASC 606 on January 1, 2018 and has adjusted prior periods to conform. See Note 2. “New Accounting Pronouncements” for additional information. |
|
| | | | | | | |
| | Three Months Ended
March 31, |
| | 2019 | | 2018 |
| Net (loss) income | $ | (28,717 | ) | | $ | 12,200 |
|
| Other comprehensive income, net of tax | | | |
| Unrealized gain (loss) on available-for-sale marketable securities, net of tax | 374 |
| | (188 | ) |
| Foreign currency translation adjustments | 1,627 |
| | 4,450 |
|
| Total other comprehensive income, net of tax | 2,001 |
| | 4,262 |
|
| Comprehensive (loss) income | $ | (26,716 | ) | | $ | 16,462 |
|
See notes to unaudited condensed consolidated financial statements.
UNAUDITED CONDENSED CONSOLIDATED STATEMENTS OF
CASH FLOWSSTOCKHOLDERS’ EQUITY
(in
thousands) | | | | | | | | |
| | | Three Months Ended
March 31, | |
| | | 2018 | | | 2017 | |
| | | | | | As Adjusted(1) | |
Operating activities: | | | | | | | | |
Net income | | $ | 12,200 | | | $ | 52,963 | |
Adjustments to reconcile net income to cash provided by operating activities: | | | | | | | | |
Change in operating assets and liabilities, net | | | 19,591 | | | | (47,555) | |
Stock-based compensation expense | | | 15,109 | | | | 12,508 | |
Depreciation and amortization of intangible assets | | | 6,145 | | | | 6,088 | |
Othernon-cash | | | 2,610 | | | | 8,440 | |
| | | | | | | | |
Cash provided by operating activities | | | 55,655 | | | | 32,444 | |
Investing activities: | | | | | | | | |
Purchases of investments | | | (35,204) | | | | (3,322) | |
Proceeds from maturities and called investments | | | 5,995 | | | | 2,300 | |
Other | | | (2,069) | | | | (2,705) | |
| | | | | | | | |
Cash used in investing activities | | | (31,278) | | | | (3,727) | |
Financing activities: | | | | | | | | |
Dividend payments to shareholders | | | (2,344) | | | | (2,298) | |
Common stock repurchases | | | (20,708) | | | | (13,696) | |
| | | | | | | | |
Cash used in financing activities | | | (23,052) | | | | (15,994) | |
Effect of exchange rates on cash and cash equivalents | | | 2,186 | | | | 521 | |
| | | | | | | | |
Net increase in cash and cash equivalents | | | 3,511 | | | | 13,244 | |
Cash and cash equivalents, beginning of period | | | 162,279 | | | | 70,594 | |
| | | | | | | | |
Cash and cash equivalents, end of period | | $ | 165,790 | | | $ | 83,838 | |
| | | | | | | | |
| (1) | The Company adopted ASC 606 on January 1, 2018 and has adjusted prior periods to conform. See Note 2. “New Accounting Pronouncements” for additional information. |
thousands, except per share amounts)
|
| | | | | | | | | | | | | | | | | | | | | | |
| | Common Stock | | Additional Paid-In Capital | | Retained Earnings | | Accumulated Other Comprehensive (Loss) Income | | Total Stockholders’ Equity |
| | Number
of Shares | | Amount | | | | |
| December 31, 2017 | 78,081 |
| | $ | 781 |
| | $ | 152,097 |
| | $ | 509,697 |
| | $ | (6,705 | ) | | $ | 655,870 |
|
| Repurchase of common stock | (101 | ) | | (1 | ) | | (5,688 | ) | | — |
| | — |
| | (5,689 | ) |
| Issuance of common stock for share-based compensation plans | 566 |
| | 5 |
| | (15,556 | ) | | — |
| | — |
| | (15,551 | ) |
| Stock-based compensation | — |
| | — |
| | 15,109 |
| | — |
| | — |
| | 15,109 |
|
| Cash dividends declared ($0.12 per share) | — |
| | — |
| | — |
| | (2,355 | ) | | — |
| | (2,355 | ) |
| Other comprehensive income | — |
| | — |
| | — |
| | — |
| | 4,262 |
| | 4,262 |
|
| Net income | — |
| | — |
| | — |
| | 12,200 |
| | — |
| | 12,200 |
|
| March 31, 2018 | 78,546 |
| | $ | 785 |
| | $ | 145,962 |
| | $ | 519,542 |
| | $ | (2,443 | ) | | $ | 663,846 |
|
| | | | | | | | | | | | |
| December 31, 2018 | 78,526 |
| | 785 |
| | 123,205 |
| | 510,863 |
| | (13,322 | ) | | 621,531 |
|
| Repurchase of common stock | (144 | ) | | (1 | ) | | (7,586 | ) | | — |
| | — |
| | (7,587 | ) |
| Issuance of common stock for share-based compensation plans | 514 |
| | 5 |
| | (14,843 | ) | | — |
| | — |
| | (14,838 | ) |
| Stock-based compensation | — |
| | — |
| | 18,406 |
| | — |
| | — |
| | 18,406 |
|
| Cash dividends declared ($0.12 per share) | — |
| | — |
| | — |
| | (2,367 | ) | | — |
| | (2,367 | ) |
| Other comprehensive income | — |
| | — |
| | — |
| | — |
| | 2,001 |
| | 2,001 |
|
| Net loss | — |
| | — |
| | — |
| | (28,717 | ) | |
|
| | (28,717 | ) |
| March 31, 2019 | 78,896 |
| | $ | 789 |
| | $ | 119,182 |
| | $ | 479,779 |
| | $ | (11,321 | ) | | $ | 588,429 |
|
See notes to unaudited condensed consolidated financial statements.
UNAUDITED CONDENSED CONSOLIDATED STATEMENTS OF CASH FLOWS
(in thousands)
|
| | | | | | | |
| | Three Months Ended
March 31, |
| | 2019 | | 2018 |
| Operating activities: | | | |
| Net (loss) income | $ | (28,717 | ) | | $ | 12,200 |
|
| Adjustments to reconcile net (loss) income to cash provided by operating activities: | | | |
| Stock-based compensation | 18,350 |
| | 15,109 |
|
| Amortization and depreciation | 18,774 |
| | 10,322 |
|
| Foreign currency transaction loss | 3,712 |
| | 1,085 |
|
| Other non-cash | 1,471 |
| | 1,137 |
|
| Change in operating assets and liabilities, net | 9,113 |
| | 15,802 |
|
| Cash provided by operating activities | 22,703 |
| | 55,655 |
|
| Investing activities: |
|
| | |
| Purchases of investments | (7,224 | ) | | (35,204 | ) |
| Proceeds from maturities and called investments | 8,548 |
| | 5,995 |
|
| Other | (2,790 | ) | | (2,069 | ) |
| Cash used in investing activities | (1,466 | ) | | (31,278 | ) |
| Financing activities: | | | |
| Dividend payments to shareholders | (2,363 | ) | | (2,344 | ) |
| Common stock repurchases | (23,224 | ) | | (20,708 | ) |
| Cash used in financing activities | (25,587 | ) | | (23,052 | ) |
| Effect of exchange rate changes on cash and cash equivalents | 295 |
| | 2,186 |
|
| Net (decrease) increase in cash and cash equivalents | (4,055 | ) | | 3,511 |
|
| Cash and cash equivalents, beginning of period | 114,422 |
| | 162,279 |
|
| Cash and cash equivalents, end of period | $ | 110,367 |
| | $ | 165,790 |
|
See notes to unaudited condensed consolidated financial statements.
PEGASYSTEMS INC.
NOTES TO UNAUDITED CONDENSED CONSOLIDATED FINANCIAL STATEMENTS
Pegasystems Inc. (together with its subsidiaries, “the Company”) has prepared the accompanying unaudited condensed consolidated financial statements pursuant to the rules and regulations of the U.S. Securities and Exchange Commission (“SEC”) regarding interim financial reporting. Accordingly, they do not include all
of the information and footnotes required by accounting principles generally accepted in the United States of America (“U.S.”) for complete financial statements and should be read in conjunction with the Company’s audited financial statements included in the Annual Report on Form
10-K for the year ended December 31,
2017.On January 1, 2018 the Company adopted Accounting Standards Update (“ASU”) ASUNo. 2014-09, “Revenue from Contracts with Customers (Topic 606)” using the full retrospective method which required each prior reporting period presented to be adjusted to reflect the application of this ASU. See Note 2. “New Accounting Pronouncements” for additional information.
2018.
In the opinion of management, the Company has prepared the accompanying unaudited condensed consolidated financial statements on the same basis as its audited financial statements, and these financial statements include all adjustments, consisting only of normal recurring adjustments, necessary for a fair presentation of the results of the interim periods presented.
The operating results for the interim periods presented are not necessarily indicative of the results expected for the full year
2018.2019.
2. NEW ACCOUNTING PRONOUNCEMENTS
Financial
Instrumentsinstruments
In June 2016, the Financial Accounting Standards Board (“FASB”) issued
ASUAccounting Standards Update No. 2016-13, “Financial Instruments - Credit Losses (Topic 326): Measurement of Credit Losses on Financial Instruments,” which requires measurement and recognition of expected credit losses for financial assets measured at amortized cost, including accounts receivable, upon initial recognition of that financial asset using a forward-looking expected loss model, rather than an incurred loss
model for credit losses.model. Credit losses relating to
available-for-sale debt securities should be recorded through an allowance for credit losses when the fair value is below the amortized cost of the asset, removing the concept of “other-than-temporary” impairments. The effective date for the Company will be January 1, 2020, with early adoption permitted. The Company is currently evaluating the effect this ASU will have on its consolidated financial statements and related disclosures.
Leases
In February 2016, the FASB issued ASUNo. 2016-02, “Leases (Topic 842),” which requires lessees to record most leases on their balance sheets, recognizing a lease liability for the obligation to make lease payments and aright-of-use asset for the right to use the underlying asset for the lease term. The effective date for the Company will be
On January 1, 2019, the Company adopted Accounting Standards Codifications 842 “Leases” (“ASC 842”) using the modified retrospective method, reflecting any cumulative effect as an adjustment to equity. Results for reporting periods beginning on or after January 1, 2019 are presented under ASC 842, while prior period amounts were not adjusted and continue to be reported in accordance with early adoption permitted. the Company’s historic accounting under ASC 840 “Leases”.
The Company
expectselected the permitted practical expedients to not reassess the following related to leases that
mostcommenced before the effective date of
its operatingASC 842: (i) whether any expired or existing contracts contain leases; (ii) the lease
commitments will be subject to this ASUclassification for any expired or existing leases; and
recognized as operating(iii) initial direct costs for any existing leases. Upon adoption, the Company recorded right of use assets of $41.8 million and lease liabilities
andright-of-useof $54.2 million. The difference between the value of the right of use assets
upon adoption with no material impactand lease liabilities is due to
its resultsthe reclassification of
operationsexisting deferred rent, prepaid rent, and
cash flows.ASC 606 and ASC340-40
In May 2014, the FASB issued ASUNo. 2014-09, “Revenue from Contracts with Customers (Topic 606)”. The Company adopted ASC 606 and ASC340-40 onunamortized lease incentives as of January 1, 2018 using the full retrospective method, which required the Company to retrospectively adjust the prior periods presented.
The most significant impacts of adopting ASC 606 and ASC340-40 were as follows:
| • | | Perpetual licenses with extended payment terms and term licenses- Revenue from perpetual license with extended payment terms and term license is now recognized when control is transferred to the client, the point in time when the client can use and benefit from the license. Previously the Company recognized revenue over the term of the agreements as payments became due or earlier if prepaid. Any unrecognized license revenue from these arrangements is recognized in the period that control transfers, as either a cumulative adjustment to retained earnings as of December 31, 2015 or as revenue in periods thereafter. Unbilled receivables in the Company’s unaudited condensed consolidated balance sheets increased significantly due to the revenue from perpetual license with extended payment terms and term license being recognized prior to amounts billed, or prepaid by, clients. |
| • | | Allocation of future credits and significant discounts - The perpetual or term licenses delivered are a separate performance obligation which now requires us to allocate any future credits and discounts to the performance obligations in the arrangement based upon their relative stand-alone selling prices. |
PEGASYSTEMS INC.
NOTES TO UNAUDITED CONDENSED CONSOLIDATED FINANCIAL STATEMENTS (continued)
| • | | Deferred contract costs - Sales incentive programs and other incremental and recoverable costs to obtain a contract were previously expensed when incurred. ASC340-40 requires these costs to be recognized as an asset when incurred and to be expensed over the period of expected benefit, which is on average five years. This change primarily impacts the Company’s contracts related to multi-year cloud offerings, maintenance on term and perpetual licenses, and those long-term term and perpetual licenses with client usage rights that increase over time. |
| • | | Taxes - The corresponding effect on tax balances in relation to all of the above impacts has also been recognized. |
For additional information on the Company’s accounting policies as a result of the adoption of ASC 606 and ASC340-40 see Note 4. “Receivables, Contract Assets, and Deferred Revenue”, Note 5. “Deferred Contract Costs”, and2019.
See Note 9.
“Revenue”.The impact of the adoption ASC 606 and ASC340-40 on the Company’s unaudited condensed consolidated balance sheet and unaudited condensed consolidated statement of operations is:
| | | | | | | | | | | | |
| | | December 31, 2017 | |
| (in thousands) | | Previously reported | | | Adjustments | | | As adjusted | |
Accounts receivable and unbilled receivables | | $ | 248,331 | | | $ | 133,302 | | | $ | 381,633 | |
Contract assets | | | — | | | | 914 | | | | 914 | |
Long-term unbilled receivables | | | — | | | | 160,708 | | | | 160,708 | |
Deferred income taxes | | | 57,127 | | | | (42,887) | | | | 14,240 | |
Deferred contract costs | | | — | | | | 37,924 | | | | 37,924 | |
Other assets(1) | | | 416,148 | | | | — | | | | 416,148 | |
| | | | | | | | | | | | |
Total Assets | | | 721,606 | | | | 289,961 | | | | 1,011,567 | |
| | | | | | | | | | | | |
Deferred revenue | | | 195,073 | | | | (28,776) | | | | 166,297 | |
Long-term deferred revenue | | | 6,591 | | | | (2,885) | | | | 3,706 | |
Deferred income tax liabilities | | | — | | | | 38,463 | | | | 38,463 | |
Other liabilities(2) | | | 148,864 | | | | — | | | | 148,864 | |
| | | | | | | | | | | | |
Total liabilities | | | 350,528 | | | | 6,802 | | | | 357,330 | |
Foreign currency translation adjustments | | | (3,494) | | | | (2,966) | | | | (6,460) | |
Retained earnings | | | 221,926 | | | | 286,125 | | | | 508,051 | |
Other equity(3) | | | 152,646 | | | | — | | | | 152,646 | |
| | | | | | | | | | | | |
Total stockholders’ equity | | | 371,078 | | | | 283,159 | | | | 654,237 | |
| | | | | | | | | | | | |
Total liabilities and stockholders’ equity | | $ | 721,606 | | | $ | 289,961 | | | $ | 1,011,567 | |
| | | | | | | | | | | | |
| (1) | Includes cash and cash equivalents, marketable securities, income taxes receivable, other current assets, property and equipment, intangible assets, goodwill, and other long-term assets (as reflected in the consolidated balance sheets in the Annual Report on Form10-K for the year ended December 31, 2017). |
| (2) | Includes accounts payable, accrued expenses, accrued compensation and related expenses, income taxes payable, and other long-term liabilities (as reflected in the consolidated balance sheets in the Annual Report on Form10-K for the year ended December 31, 2017). |
| (3) | Includes common stock, additionalpaid-in capital, and net unrealized loss onavailable-for-sale marketable securities (as reflected in the consolidated balance sheets in the Annual Report on Form10-K for the year ended December 31, 2017). |
PEGASYSTEMS INC.
NOTES TO UNAUDITED CONDENSED CONSOLIDATED FINANCIAL STATEMENTS (continued)
| | | | | | | | | | | | |
| | | Three Months Ended | |
| | | March 31, 2017 | |
| (in thousands, except per share amounts) | | Previously reported | | | Adjustments | | | As adjusted | |
Revenue: | | | | | | | | | | | | |
Software license | | $ | 92,390 | | | $ | 34,618 | | | $ | 127,008 | |
Maintenance | | | 58,965 | | | | (252) | | | | 58,713 | |
Services | | | 71,892 | | | | (1,304) | | | | 70,588 | |
| | | | | | | | | | | | |
Total revenue | | | 223,247 | | | | 33,062 | | | | 256,309 | |
| | | | | | | | | | | | |
Cost of revenue: | | | | | | | | | | | | |
Software license | | | 1,300 | | | | — | | | | 1,300 | |
Maintenance | | | 7,218 | | | | — | | | | 7,218 | |
Services | | | 59,572 | | | | — | | | | 59,572 | |
| | | | | | | | | | | | |
Total cost of revenue | | | 68,090 | | | | — | | | | 68,090 | |
| | | | | | | | | | | | |
Gross profit | | | 155,157 | | | | 33,062 | | | | 188,219 | |
| | | | | | | | | | | | |
Operating expenses: | | | | | | | | | | | | |
Selling and marketing | | | 71,288 | | | | (1,607 | ) | | | 69,681 | |
Research and development | | | 40,296 | | | | — | | | | 40,296 | |
General and administrative | | | 12,335 | | | | — | | | | 12,335 | |
| | | | | | | | | | | | |
Total operating expenses | | | 123,919 | | | | (1,607 | ) | | | 122,312 | |
| | | | | | | | | | | | |
Income from operations | | | 31,238 | | | | 34,669 | | | | 65,907 | |
| | | | | | | | | | | | |
Foreign currency transaction gain | | | 676 | | | | 69 | | | | 745 | |
Interest income, net | | | 165 | | | | 40 | | | | 205 | |
Other expense, net | | | (279) | | | | — | | | | (279) | |
| | | | | | | | | | | | |
Income before provision for income taxes | | | 31,800 | | | | 34,778 | | | | 66,578 | |
Provision for income taxes | | | 4,779 | | | | 8,836 | | | | 13,615 | |
| | | | | | | | | | | | |
Net income | | $ | 27,021 | | | $ | 25,942 | | | $ | 52,963 | |
| | | | | | | | | | | | |
Earnings per share: | | | | | | | | | | | | |
Basic | | $ | 0.35 | | | | | | | $ | 0.69 | |
| | | | | | | | | | | | |
Diluted | | $ | 0.33 | | | | | | | $ | 0.65 | |
| | | | | | | | | | | | |
Weighted-average number of common shares outstanding: | | | | | | | | | | | | |
Basic | | | 76,761 | | | | | | | | 76,761 | |
Diluted | | | 81,875 | | | | | | | | 81,875 | |
Adoption of ASC 606 had no impact on total cash from or used in operating, financing, or investing activities in the Company’s unaudited condensed consolidated statements of cash flows“Leases” for the three months ended March 31, 2017.
additional information.
3. MARKETABLE SECURITIES | | | | | | | | | | | | | | | | |
| | | March 31, 2018 | |
| (in thousands) | | Amortized Cost | | | Unrealized Gains | | | Unrealized Losses | | | Fair Value | |
Municipal bonds | | $ | 50,782 | | | $ | — | | | $ | (191) | | | $ | 50,591 | |
Corporate bonds | | | 38,761 | | | | 1 | | | | (306) | | | | 38,456 | |
| | | | | | | | | | | | | | | | |
| | $ | 89,543 | | | $ | 1 | | | $ | (497) | | | $ | 89,047 | |
| | | | | | | | | | | | | | | | |
| | | | | | | | | | | | | | | | |
| | | December 31, 2017 | |
| (in thousands) | | Amortized Cost | | | Unrealized Gains | | | Unrealized Losses | | | Fair Value | |
Municipal bonds | | $ | 32,996 | | | $ | — | | | $ | (148) | | | $ | 32,848 | |
Corporate bonds | | | 28,757 | | | | 1 | | | | (137) | | | | 28,621 | |
| | | | | | | | | | | | | | | | |
| | $ | 61,753 | | | $ | 1 | | | $ | (285) | | | $ | 61,469 | |
| | | | | | | | | | | | | | | | |
PEGASYSTEMS INC.
NOTES TO UNAUDITED CONDENSED CONSOLIDATED FINANCIAL STATEMENTS (continued)
|
| | | | | | | | | | | | | | | |
| | March 31, 2019 |
| (in thousands) | Amortized Cost | | Unrealized Gains | | Unrealized Losses | | Fair Value |
| Municipal bonds | $ | 42,693 |
| | $ | 86 |
| | $ | (20 | ) | | $ | 42,759 |
|
| Corporate bonds | 48,966 |
| | 142 |
| | (63 | ) | | 49,045 |
|
| | $ | 91,659 |
| | $ | 228 |
| | $ | (83 | ) | | $ | 91,804 |
|
|
| | | | | | | | | | | | | | | |
| | December 31, 2018 |
| (in thousands) | Amortized Cost | | Unrealized Gains | | Unrealized Losses | | Fair Value |
| Municipal bonds | $ | 44,802 |
| | $ | 13 |
| | $ | (110 | ) | | $ | 44,705 |
|
| Corporate bonds | 48,499 |
| | 23 |
| | (226 | ) | | 48,296 |
|
| | $ | 93,301 |
| | $ | 36 |
| | $ | (336 | ) | | $ | 93,001 |
|
As of March 31,
2018,2019, the Company did not hold any investments with unrealized losses that are considered to be other-than-temporary.
As of March 31,
2018, remaining2019, maturities of marketable securities ranged from
May 2018April 2019 to
February 2021,August 2022, with a weighted-average remaining maturity of approximately 1.4 years.
PEGASYSTEMS INC.
NOTES TO UNAUDITED CONDENSED CONSOLIDATED FINANCIAL STATEMENTS (continued)
4. RECEIVABLES, CONTRACT ASSETS, AND DEFERRED REVENUE
Receivables | | | | | | | | |
(in thousands) | | March 31,
2018 | | | December 31,
2017 | |
Accounts receivable | | $ | 164,981 | | | $ | 222,735 | |
Unbilled receivables | | | 153,657 | | | | 158,898 | |
Long-term unbilled receivables | | | 180,077 | | | | 160,708 | |
| | | | | | | | |
Total receivables | | $ | 498,715 | | | $ | 542,341 | |
| | | | | | | | |
|
| | | | | | | |
| (in thousands) | March 31, 2019 | | December 31, 2018 |
| Accounts receivable | $ | 135,352 |
| | $ | 180,872 |
|
| Unbilled receivables | 161,480 |
| | 172,656 |
|
| Long-term unbilled receivables | 130,494 |
| | 151,237 |
|
| $ | 427,326 |
| | $ | 504,765 |
|
Unbilled receivables are client committed amounts for which revenue recognition precedes billing, and billing is the amount due from clients where the only condition on the right of payment issolely subject to the passage of time. The Company regularly reassesses receivables for collectability.
As of March 31,
20182019 and December 31,
2017,2018, the allowance for doubtful accounts was not material.
Long-term unbilled
Unbilled receivables are expected to be billed in the future as follows: | | | | |
(in thousands) | | March 31,
2018 | |
2019 | | $ | 82,518 | |
2020 | | | 58,433 | |
2021 | | | 31,129 | |
2022 and thereafter | | | 7,997 | |
| | | | |
| | $ | 180,077 | |
| | | | |
|
| | | | | |
| (Dollars in thousands) | March 31, 2019 |
| 1 year or less | $ | 161,480 |
| 55 | % |
| 1-2 years | 86,496 |
| 30 | % |
| 2-5 years | 43,998 |
| 15 | % |
| | $ | 291,974 |
| 100 | % |
Contract assets and deferred revenue | | | | | | | | |
(in thousands) | | March 31,
2018 | | | December 31,
2017 | |
Contract assets(1) | | $ | 788 | | | $ | 914 | |
Deferred revenue | | | 175,586 | | | | 166,297 | |
Long-term deferred revenue(2) | | $ | 3,277 | | | $ | 3,706 | |
|
| | | | | | | |
| (in thousands) | March 31, 2019 | | December 31, 2018 |
Contract assets (1) | $ | 3,380 |
| | $ | 3,711 |
|
Long-term contract assets (2) | 1,818 |
| | 2,543 |
|
| | $ | 5,198 |
| | $ | 6,254 |
|
| Deferred revenue | $ | 180,845 |
| | $ | 185,145 |
|
Long-term deferred revenue (3) | 5,866 |
| | 5,344 |
|
| | $ | 186,711 |
| | $ | 190,489 |
|
(1)Included in other current assets in the unaudited condensed consolidated balance sheets.assets.
(2) Included in other long-term liabilitiesassets. (3) Included in the unaudited condensed consolidated balance sheets.Contract assets and deferred revenue are presented net at the contract level for each reporting period. other long-term liabilities.
Contract assets are
unbilled amounts
resulting fromunder client contracts where revenue recognized exceeds the amount billed to the client and the right to payment is subject to conditions other than the passage of time, such as the completion of a related performance obligation. Deferred revenue consists of billings and payments received in advance of revenue recognition.
Contract assets and deferred revenue are netted at the contract level for each reporting period.
The change in deferred revenue in the three months ended March 31,
2018,2019 was primarily due to $89.4 million of revenue recognized, excluding the impact of
the netting
of contract assets and deferred revenue
was primarily due to new billings in advance of revenue recognition and $101.6 million of revenue recognizedat the contract level, during the period that was included in deferred revenue at December 31,
2017.Major clients
No client represented 10% or more2018, partially offset by new billings in advance of the Company’s total receivables as of March 31, 2018 or December 31, 2017.
revenue recognition.
5. DEFERRED CONTRACT COSTS
Sales incentives paid by
The Company recognizes an asset for the Company are considered incremental and recoverable costs of obtaining a client contract, with a client. Thesewhich primarily relate to sales commissions, if the Company expects to benefit from those costs for more than one year. Deferred costs are deferred, asamortized on a long-term asset, and then amortized using the straight-line methodbasis over the benefit period, of benefit which is on average five5 years. The Company determined the period of benefit by taking into consideration client contracts, the Company’s technology, |
| | | | | | | |
| (in thousands) | March 31, 2019 | | December 31, 2018 |
Deferred contract costs (1) | $ | 64,869 |
| | $ | 64,367 |
|
(1) Included in other long-term assets.
|
| | | | | | | |
| | Three Months Ended
March 31, |
| (in thousands) | 2019 | | 2018 |
Amortization of deferred contract costs (1) | $ | 8,301 |
| | $ | 3,789 |
|
(1)Included in selling and other factors. The Company utilizes a practical expedient available under ASC 606 to expense costs to obtain a contract as incurred when the originalmarketing expenses
. NOTES TO UNAUDITED CONDENSED CONSOLIDATED FINANCIAL STATEMENTS (continued)
amortization period is one year or less. During the three months ended March 31, 2018 and 2017, impairment of deferred contract costs was not material.
| | | | |
(in thousands) | | March 31, 2018 | | December 31, 2017 |
Deferred contract costs(1) | | $ 39,781 | | $ 37,924 |
(1) Included in other long-term assets in the unaudited condensed consolidated balance sheets. Amortization of deferred contract costs was as follows: |
| | | Three Months Ended March 31, |
| (in thousands) | | 2018 | | 2017 |
Amortization of deferred contract costs(1) | | $3,789 | | $2,594 |
(1) Included in selling and marketing expenses in the unaudited condensed consolidated statement of operations.
6. GOODWILL AND OTHER INTANGIBLE ASSETS
Goodwill
The changeschange in the carrying amount of goodwill were as follows: | | | | |
(in thousands) | | Three Months Ended
March 31, | |
| 2018 | |
Balance as of January 1,
| | $ | 72,952 | |
Purchase price adjustments to goodwill
| | | — | |
Currency translation adjustments
| | | 65 | |
| | | | |
Balance as of March 31,
| | $ | 73,017 | |
| | | | |
was:
|
| | | |
| (in thousands) | Three Months Ended
March 31, |
| 2019 |
| Balance as of January 1, | $ | 72,858 |
|
| Currency translation adjustments | 40 |
|
| Balance as of March 31, | $ | 72,898 |
|
Intangibles
Intangible assets are recorded at cost and are amortized using the straight-line method over their estimated useful lives as follows: | | | | | | | | |
| | | | | March 31, 2018 |
| (in thousands) | | Useful Lives | | Cost | | Accumulated
Amortization | | Net Book Value(1) |
Client-related intangibles | | 9-10 years | | $ 63,197 | | $ (46,456) | | $ 16,741 |
Technology | | 7-10 years | | 58,942 | | (46,603) | | 12,339 |
Other intangibles | | — | | 5,361 | | (5,361) | | — |
| | | | | | | | |
| | | | $ 127,500 | | $ (98,420) | | $ 29,080 |
| | | | | | | | |
|
(1) Included in other long-term assets in the unaudited condensed consolidated balance sheet. |
| | |
| | | | | December 31, 2017 |
| (in thousands) | | Useful Lives | | Cost | | Accumulated
Amortization | | Net Book Value(1) |
Client-related intangibles | | 9-10 years | | $ 63,164 | | $ (44,835) | | $ 18,329 |
Technology | | 7-10 years | | 58,942 | | (45,372) | | 13,570 |
Other intangibles | | — | | 5,361 | | (5,361) | | — |
| | | | | | | | |
| | | | $ 127,467 | | $ (95,568) | | $ 31,899 |
| | | | | | | | |
PEGASYSTEMS INC.
NOTES TO UNAUDITED CONDENSED CONSOLIDATED FINANCIAL STATEMENTS (continued)
| (1) | Included in other long-term assets in the unaudited condensed consolidated balance sheets. |
|
| | | | | | | | | | | | | |
| | | | March 31, 2019 |
| (in thousands) | Useful Lives | | Cost | | Accumulated
Amortization | | Net Book Value (1) |
| Client-related intangibles | 4-10 years | | $ | 63,136 |
| | $ | (52,839 | ) | | $ | 10,297 |
|
| Technology | 2-10 years | | 59,742 |
| | (51,730 | ) | | 8,012 |
|
| Other | 1 - 5 years | | 5,361 |
| | (5,361 | ) | | — |
|
| | | | $ | 128,239 |
| | $ | (109,930 | ) | | $ | 18,309 |
|
(1) Included in other long-term assets.
|
| | | | | | | | | | | | | |
| | | | December 31, 2018 |
| (in thousands) | Useful Lives | | Cost | | Accumulated Amortization | | Net Book Value (1) |
| Client-related intangibles | 4-10 years | | $ | 63,115 |
| | $ | (51,224 | ) | | $ | 11,891 |
|
| Technology | 2-10 years | | 59,742 |
| | (50,398 | ) | | 9,344 |
|
| Other | 1 - 5 years | | 5,361 |
| | (5,361 | ) | | — |
|
| | | | $ | 128,218 |
| | $ | (106,983 | ) | | $ | 21,235 |
|
(1) Included in other long-term assets.
Amortization of intangiblesintangible assets is reflected in the Company’s unaudited condensed consolidated statements of operations as follows: | | | | | | | | |
| | | Three Months Ended
March 31, | |
| (in thousands) | | 2018 | | | 2017 | |
Cost of revenue | | $ | 1,232 | | | $ | 1,334 | |
Selling and marketing | | | 1,605 | | | | 1,866 | |
| | | | | | | | |
| | $ | 2,837 | | | $ | 3,200 | |
| | | | | | | | |
was:
|
| | | | | | | |
| (in thousands) | Three Months Ended
March 31, |
| 2019 | | 2018 |
| Cost of revenue | $ | 1,332 |
| | $ | 1,232 |
|
| Selling and marketing | 1,603 |
| | 1,605 |
|
| | $ | 2,935 |
| | $ | 2,837 |
|
7. ACCRUED EXPENSES | | | | | | | | |
| (in thousands) | | March 31,
2018 | | | December 31,
2017 | |
Outside professional services | | $ | 15,152 | | | $ | 14,468 | |
Income and other taxes | | | 7,272 | | | | 7,420 | |
Marketing and sales program expenses | | | 8,724 | | | | 6,444 | |
Dividends payable | | | 2,358 | | | | 2,344 | |
Employee-related expenses | | | 5,091 | | | | 4,065 | |
Other | | | 9,681 | | | | 10,767 | |
| | | | | | | | |
| | $ | 48,278 | | | $ | 45,508 | |
| | | | | | | | |
|
| | | | | | | |
| (in thousands) | March 31, 2019 | | December 31, 2018 |
| Outside professional services expenses | $ | 8,815 |
| | $ | 10,367 |
|
| Income and other taxes | 7,954 |
| | 10,387 |
|
| Marketing and sales program expenses | 8,318 |
| | 5,860 |
|
| Dividends payable | 2,367 |
| | 2,363 |
|
| Employee-related expenses | 5,432 |
| | 3,536 |
|
| Other | 8,061 |
| | 12,993 |
|
| | $ | 40,947 |
| | $ | 45,506 |
|
8. FAIR VALUE MEASUREMENTS
Assets and
Liabilities Measuredliabilities measured at
Fair Valuefair value on a
Recurring Basisrecurring basis
The Company records its cash equivalents, marketable securities, and investments in privately-held companies at fair value on a recurring basis. Fair value is an exit price, representing the amount that would be received from the sale of an asset or paid to transfer a liability in an orderly transaction between market participants based on assumptions that market participants would use in pricing an asset or liability.
PEGASYSTEMS INC.
NOTES TO UNAUDITED CONDENSED CONSOLIDATED FINANCIAL STATEMENTS (continued)
As a basis for classifying the fair value measurements, a three-tier fair value hierarchy, which classifies the fair value measurements based on the inputs used in measuring fair value, was established as follows:
Level 1 - observable inputs such as quoted prices in active markets for identical assets or liabilities;
Level 2 - significant other inputs that are observable either directly or indirectly; and
Level 3 - significant unobservable inputs on which there is little or no market data, which require the Company to develop its own assumptions. This hierarchy requires the Company to use observable market data, when available, and to minimize the use of unobservable inputs when determining fair value.
The Company’s cash equivalents are composed of money market funds and time deposits, which are classified
aswithin Level 1 and Level 2, respectively, in the fair value hierarchy. The Company’s marketable securities, which are classified within Level 2 of the fair value hierarchy are valued based on a market approach using quoted prices, when available, or matrix pricing compiled by third party pricing vendors, using observable market inputs such as interest rates, yield curves, and credit risk. The Company’s investments in privately-held companies are classified within Level 3 of the fair value
hierarchy and are valued using model-based techniques, including option pricing models and discounted cash flow models.hierarchy.
If applicable, the Company will recognize transfers into and out of levels within the fair value hierarchy at the end of the reporting period in which the actual event or change in circumstance occurs. There were no transfers between levels during the three months ended March 31,
2018.PEGASYSTEMS INC.
NOTES TO UNAUDITED CONDENSED CONSOLIDATED FINANCIAL STATEMENTS (continued)
2019.
The Company’s assets and liabilities measured at fair value on a recurring basis were as follows: | | | | | | | | | | | | | | | | |
| | | March 31, 2018 | |
| | | Level 1 | | | Level 2 | | | Level 3 | | | Total | |
Cash equivalents | | $ | 130 | | | $ | 30,072 | | | $ | — | | | $ | 30,202 | |
Marketable securities: | | | | | | | | | | | | | | | | |
Municipal bonds | | $ | — | | | $ | 50,591 | | | $ | — | | | $ | 50,591 | |
Corporate bonds | | | — | | | | 38,456 | | | | — | | | | 38,456 | |
| | | | | | | | | | | | | | | | |
Total marketable securities | | $ | — | | | $ | 89,047 | | | $ | — | | | $ | 89,047 | |
Investments in privately-held companies(1) | | $ | — | | | $ | — | | | $ | 2,060 | | | $ | 2,060 | |
(1) Included in other long-term assets in the unaudited condensed consolidated balance sheets. | |
| |
| | | December 31, 2017 | |
| | | Level 1 | | | Level 2 | | | Level 3 | | | Total | |
Cash equivalents | | $ | 2,720 | | | $ | 40,051 | | | $ | — | | | $ | 42,771 | |
Marketable securities: | | | | | | | | | | | | | | | | |
Municipal bonds | | $ | — | | | $ | 32,848 | | | $ | — | | | $ | 32,848 | |
Corporate bonds | | | — | | | | 28,621 | | | | — | | | | 28,621 | |
| | | | | | | | | | | | | | | | |
Total marketable securities | | $ | — | | | $ | 61,469 | | | $ | — | | | $ | 61,469 | |
Investments in privately-held companies(1) | | $ | — | | | $ | — | | | $ | 1,030 | | | $ | 1,030 | |
(1) Included in other long-term assets in the unaudited condensed consolidated balance sheets. | |
were:
|
| | | | | | | | | | | | | | | |
| | March 31, 2019 |
| (in thousands) | Level 1 | | Level 2 | | Level 3 | | Total |
| Cash equivalents | $ | 12,401 |
| | $ | 10,062 |
| | $ | — |
| | $ | 22,463 |
|
| Marketable securities: | | | | | | | |
| Municipal bonds | $ | — |
| | $ | 42,759 |
| | $ | — |
| | $ | 42,759 |
|
| Corporate bonds | — |
| | 49,045 |
| | — |
| | 49,045 |
|
| Total marketable securities | $ | — |
| | $ | 91,804 |
| | $ | — |
| | $ | 91,804 |
|
Investments in privately-held companies (1) | $ | — |
| | $ | — |
| | $ | 3,390 |
| | $ | 3,390 |
|
(1) Included in other long-term assets.
|
| | | | | | | | | | | | | | | |
| | December 31, 2018 |
| (in thousands) | Level 1 | | Level 2 | | Level 3 | | Total |
| Cash equivalents | $ | 10,155 |
| | $ | 10,000 |
| | $ | — |
| | $ | 20,155 |
|
| Marketable securities: | | | | | | | |
| Municipal bonds | $ | — |
| | $ | 44,705 |
| | $ | — |
| | $ | 44,705 |
|
| Corporate bonds | — |
| | 48,296 |
| | — |
| | 48,296 |
|
| Total marketable securities | $ | — |
| | $ | 93,001 |
| | $ | — |
| | $ | 93,001 |
|
Investments in privately-held companies (1) | $ | — |
| | $ | — |
| | $ | 3,390 |
| | $ | 3,390 |
|
(1) Included in other long-term assets.
For certain other financial instruments, including accounts receivable and accounts payable, the carrying value approximates
their fair value due to the relatively short maturity of these items.
Assets Measured at Fair Value on a Nonrecurring Basis
Assets recorded at fair value on a nonrecurring basis, including property and equipment and intangible assets, are recognized at fair value when they are impaired. During the three months ended March 31, 2018 and 2017, the Company did not recognize any impairments of its assets recorded at fair value on a nonrecurring basis.
9.
REVENUERevenue policy
LEASES
The Company’s revenue is derived from salesleases are primarily for office space used in the ordinary course of software licenses, maintenance fees related tobusiness.
Accounting policy
All the Company’s
software licenses, and services.License revenue is primarily derived from sales of the Company’s software applications and Pega Platform.
Maintenance revenue includes revenue from client support including software upgrades, on a whenand-if available basis, telephone support, and bug fixes or patches.
Cloud revenue is derived from sales of the Company’s hosted Pega Platform and software application environments.
Consulting revenue is primarily related to new license implementations.
Contracts with multiple performance obligations
leases are operating leases. The Company’s license and cloud arrangements often contain multiple performance obligations, including maintenance, consulting, and training. For contracts with multiple performance obligations, the Company accounts for individual performance obligations separatelya contract as a lease when it has the right to control the asset for a period of time while obtaining substantially all of the asset’s economic benefits. The Company determines the initial classification and measurement of its operating right of use assets and lease liabilities at the lease commencement date and thereafter if theymodified. Fixed lease costs are distinct. The transaction price is allocated to the separate performance obligationsrecognized on a relative stand-alone selling price basis. Ifstraight-line basis over the transaction price contains discounts or expects to provide a future price concession, these elementsterm of the lease. Variable lease costs are considered when determining the transaction price prior to allocation. Variable fees within the transaction price will be estimated and recognized in revenue asthe period in which the obligation for those payments is incurred. The Company combines lease and non-lease components in the determination of lease costs for its office space leases. The lease liability includes lease payments related to options to extend or renew the lease term, if the Company satisfies its performance obligations to the extentis reasonably certain it is probable that a significant reversal of cumulative revenue recognized will exercise those options. The Company’s leases do not occur when the uncertainty associated with the variable fee is resolved. If the contract grants the client the option to acquire additional productscontain any material residual value guarantees or services, the Company assesses whether or not any discount on the products and services is in excess of levels normally available to similar clients and, if so, accounts for that discount as an additional performance obligation.
restrictive covenants.
NOTES TO UNAUDITED CONDENSED CONSOLIDATED FINANCIAL STATEMENTS (continued)
Software licenses
|
| | | |
| | Three Months Ended
March 31, |
| (in thousands) | 2019 |
| Operating lease costs | $ | 4,300 |
|
Variable lease costs (1) | 1,321 |
|
| | $ | 5,621 |
|
(1) Lease costs that are not fixed at lease commencement.
Right of use assets and lease liabilities |
| | | |
| (in thousands) | March 31, 2019 |
Right of use assets (1) | $ | 46,464 |
|
Lease liabilities (2) | $ | 12,447 |
|
| Long-term lease liabilities | $ | 45,325 |
|
(1) An asset that represents the Company’s right to use the leased asset during the lease term. Included in other long-term assets. (2) Included in other current liabilities.
The weighted-average remaining lease term and discount rate for the Company’s leases were: |
| | |
| March 31, 2019 |
| Weighted-average remaining lease term | 4.3 years |
|
Weighted-average discount rate (1) | 5.7 | % |
(1) The rate implicit in the lease is not readily determinable in most of the Company’s leases, and therefore the Company has concluded thatuses its software licenses are distinct performance obligationsincremental borrowing rate as the client can benefit fromdiscount rate when measuring operating lease liabilities. The incremental borrowing rate represents an estimate of the software on its own. Software license revenue is typically recognizedinterest rate the Company would incur at a point in time when control is transferredlease commencement to borrow an amount equal to the client, which is defined as the point in time when the client can use and benefit from the license. The software license is delivered before related services are provided and is functional without services, updates, and technical support. The Company’s license arrangements generally contain multiple performance obligations, including consulting, training, and maintenance. Stand-alone selling price for software licenses is determined using the residual approach. The Company utilizes the residual approach as license performance obligations are sold for a broad range of amounts (the selling price is highly variable) and a stand-alone selling price is not discernible from past transactions or other observable evidence. Periodically, the Company evaluates whether the residual approach is appropriate for its license and cloud performance obligations when sold with other performance obligations. As a result, if the standalone selling price analysis illustrates that the license and cloud performance obligations are no longer highly variable, the Company will utilize the relative allocation method for such arrangements.Term license fees are usually payable in advancelease payments on a monthly, quarterly, or annualcollateralized basis over the term of the license agreement, which is typically three to five years and may be renewed for additional termslease.
Maturities of lease liabilities were: |
| | | |
| (in thousands) | March 31, 2019 |
| Remainder of 2019 | $ | 11,324 |
|
| 2020 | 15,784 |
|
| 2021 | 13,764 |
|
| 2022 | 12,761 |
|
| 2023 | 11,604 |
|
| Total lease payments | 65,237 |
|
Less: imputed interest (1) | (7,465 | ) |
| | $ | 57,772 |
|
(1) Lease liabilities are measured at the client’s option. Perpetual license fees are usually payable whenpresent value of the contractremaining lease payments using a discount rate determined at lease commencement unless the discount rate is executed. The Company recognizes software license revenue when control is transferred, andupdated as a result of a lease reassessment event.
As of December 31, 2018, the corresponding difference between the amount invoiced and recognizedCompany’s future minimum rental payments required under operating leases with noncancellable terms in excess of one year as revenue is recorded as unbilled receivables, as the payment of consideration is subject onlydetermined prior to the passageadoption of time.Maintenance
Maintenance revenue includes revenue from client support and related professional services. Client support includes software upgrades on a whenASC 842 were:
|
| | | |
| (in thousands) | Operating Leases (1) |
| 2019 | $ | 15,993 |
|
| 2020 | 14,807 |
|
| 2021 | 13,262 |
|
| 2022 | 12,279 |
|
| 2023 | 11,084 |
|
| | $ | 67,425 |
|
and-if(1) available basis, telephone support, and bug fixes or patches. Maintenance is priced as a percentageOperating leases include future minimum rent payments, net of estimated sublease income for facilities that the selling price of the related software license, which is highly variable. The Company determined the standalone selling price of maintenance based on this pricing relationship, which has remained constant within a narrow range, and observable data from standalone sales of maintenance, along with all other observable data.The Company has identified two separate distinct performance obligations of maintenance:
| 1. | software upgrades and updates; and |
These performance obligations are distinct within the contract and, although they are not sold separately, the components are not essentialvacated pursuant to the functionality of the other components. Each of the performance obligations included in maintenance revenue is a stand-alone obligation that is recognized over the passage of the contractual term, which is typically one year. Maintenance fees are usually payable in advance on a monthly, quarterly, or annual basis over the term of the agreement.
Services
The Company’s services revenue is comprised of consulting and training, including software license implementations, training, reimbursable expenses, and cloud which is derived from sales of the Company’s hosted Pega Platform and software application environments. The Company has concluded that most services are distinct performance obligations. Consulting may be provided on a stand-alone basis or bundled with license and software maintenance services.
The stand-alone selling price for consulting in time and materials contracts is determined by observable prices in similar transactions without multiple performance obligations and recognized as revenue as the services are performed. Fees for time and materials consulting contracts are usually payable shortly after the service is provided.
The Company estimates the stand-alone selling price for fixed price services based on the estimated hours versus actual hours in similar geographies and for similar contract sizes. Revenue for fixed price services is recognized over time as the services are provided. Fees for fixed price services consulting contracts are usually payable as contract milestones are achieved.
The stand-alone selling price of cloud sales of production environments is determined based on the residual approach when sold with services and is recognized over the term of the service. The Company utilizes the residual approach as cloud performance obligations are sold for a broad range of amounts (the selling price is highly variable) and a stand-alone selling price is not discernible from past transactions or other observable evidence. The stand-alone selling price for cloud sales of development and testing environments is developed using observable prices in similar transactions without multiple performance obligations and is recognized over time over the term of the service. Cloud fees are usually payable in advance on a monthly, quarterly, or annual basis over the term of the service.
its restructuring activities.
NOTES TO UNAUDITED CONDENSED CONSOLIDATED FINANCIAL STATEMENTS (continued)
Contract modifications
The Company sometimes enters into amendments to previously executed contracts which constitute contract modifications. The Company assesses each of these contract modifications to determine:
|
| | |
| | 1.Three Months Ended
March 31, |
| (in thousands) | If the additional products and services are distinct from the products and services in the original arrangement, and2019 |
| Cash paid for leases | 5,197 |
|
| Right of use assets recognized for new leases (non-cash) | 8,034 |
|
| 2. | If the amount of consideration expected for the added products and services reflects the stand-alone selling price of those products and services. |
A contract modification meeting both criteria is accounted for as a separate contract. A contract modification not meeting both criteria is considered a change
10. REVENUE
|
| | | | | | | | | | | |
| | Three Months Ended
March 31, |
| (Dollars in thousands) | 2019 | | 2018 |
| U.S. | $ | 103,991 |
| 48 | % | | $ | 113,985 |
| 48 | % |
| Other Americas | 28,829 |
| 14 | % | | 17,715 |
| 8 | % |
| United Kingdom (“U.K.”) | 24,549 |
| 12 | % | | 26,094 |
| 11 | % |
| Europe (excluding U.K.), Middle East, and Africa | 34,186 |
| 16 | % | | 31,826 |
| 14 | % |
| Asia-Pacific | 20,991 |
| 10 | % | | 45,562 |
| 19 | % |
| | $ | 212,546 |
| 100 | % | | $ | 235,182 |
| 100 | % |
Revenue streams |
| | | | | | | |
| | Three Months Ended
March 31, |
| (in thousands) | 2019 | | 2018 |
| Perpetual license | $ | 14,950 |
| | $ | 23,078 |
|
| Term license | 48,314 |
| | 64,695 |
|
| Revenue recognized at a point in time | 63,264 |
| | 87,773 |
|
| Maintenance | 67,706 |
| | 64,525 |
|
| Cloud | 27,758 |
| | 15,582 |
|
| Consulting | 53,818 |
| | 67,302 |
|
| Revenue recognized over time | 149,282 |
| | 147,409 |
|
| | $ | 212,546 |
| | $ | 235,182 |
|
|
| | | | | | | |
| (in thousands) | Three Months Ended
March 31, |
| 2019 | | 2018 |
| Term license | $ | 48,314 |
| | $ | 64,695 |
|
| Cloud | 27,758 |
| | 15,582 |
|
| Maintenance | 67,706 |
| | 64,525 |
|
Subscription (1) | 143,778 |
| | 144,802 |
|
| Perpetual license | 14,950 |
| | 23,078 |
|
| Consulting | 53,818 |
| | 67,302 |
|
| | $ | 212,546 |
| | $ | 235,182 |
|
(1) Reflects client arrangements (term license, cloud, and maintenance) that are subject to the original contract and is accounted forrenewal.
PEGASYSTEMS INC.
NOTES TO UNAUDITED CONDENSED CONSOLIDATED FINANCIAL STATEMENTS (continued)
Remaining performance obligations
Revenue recognition timing on either: | 1. | a prospective basis as a termination of the existing contract and the creation of a new contract; or |
| 2. | a cumulativeexisting contracts: | | | | | | | | | | | | | | | | | | | | | | | | | | | | | March 31, 2019 | | (Dollars in thousands) | Perpetual license | | Term License | | Maintenance | | Cloud | | Consulting | | Total | | 1 year or less | $ | 10,263 |
| | $ | 44,404 |
| | $ | 187,324 |
| | $ | 115,548 |
| | $ | 13,251 |
| | $ | 370,790 |
| 58 | % | | 1-2 years | 998 |
| | 4,274 |
| | 9,350 |
| | 91,539 |
| | 1,363 |
| | 107,524 |
| 17 | % | | 2-3 years | 2,180 |
| | 756 |
| | 4,438 |
| | 71,509 |
| | 473 |
| | 79,356 |
| 13 | % | | Greater than 3 years | — |
| | 135 |
| | 2,008 |
| | 72,742 |
| | 27 |
| | 74,912 |
| 12 | % | | | $ | 13,441 |
| | $ | 49,569 |
| | $ | 203,120 |
| | $ | 351,338 |
| | $ | 15,114 |
| | $ | 632,582 |
| 100 | % |
| | | | | | | | | | | | | | | | | | | | | | | | | | | | | March 31, 2018 | | (Dollars in thousands) | Perpetual license | | Term License | | Maintenance | | Cloud | | Consulting | | Total | | 1 year or less | $ | 33,859 |
| | $ | 21,087 |
| | $ | 156,702 |
| | $ | 47,764 |
| | $ | 9,403 |
| | $ | 268,815 |
| 59 | % | | 1-2 years | 14,106 |
| | 7,877 |
| | 21,381 |
| | 52,849 |
| | 1,098 |
| | 97,311 |
| 21 | % | | 2-3 years | 1,204 |
| | 5,634 |
| | 4,924 |
| | 37,844 |
| | — |
| | 49,606 |
| 11 | % | | Greater than 3 years | 382 |
| | 853 |
| | 1,825 |
| | 40,478 |
| | — |
| | 43,538 |
| 9 | % | | | $ | 49,551 |
| | $ | 35,451 |
| | $ | 184,832 |
| | $ | 178,935 |
| | $ | 10,501 |
| | $ | 459,270 |
| 100 | % |
catch-up basis.
|
Geographic revenue
| | | | | | | | | | | | | | | | |
| | | Three Months Ended
March 31, | |
| (in thousands) | | 2018 | | | 2017 | |
U.S. | | $ | 113,985 | | | | 48% | | | $ | 169,662 | | | | 67% | |
Other Americas | | | 17,715 | | | | 8% | | | | 10,406 | | | | 4% | |
United Kingdom | | | 26,094 | | | | 11% | | | | 26,342 | | | | 10% | |
Europe, Middle East, and Africa excluding the United Kingdom | | | 31,826 | | | | 14% | | | | 24,211 | | | | 9% | |
Asia-Pacific | | | 45,562 | | | | 19% | | | | 25,688 | | | | 10% | |
| | | | | | | | |
Total Revenue | | $ | 235,182 | | | | 100% | | | $ | 256,309 | | | | 100% | |
| | | | | | | | |
Major products and services
| | | | | | | | |
| | | Three Months Ended
March 31, | |
| (in thousands) | | 2018 | | | 2017 | |
Perpetual license | | $ | 23,078 | | | $ | 37,899 | |
Term license | | | 64,695 | | | | 89,109 | |
| | | | | | | | |
Performance obligations transferred at a point in time | | | 87,773 | | | | 127,008 | |
Maintenance | | | 64,525 | | | | 58,713 | |
Cloud | | | 15,582 | | | | 10,402 | |
Consulting and training | | | 67,302 | | | | 60,186 | |
| | | | | | | | |
Performance obligations transferred over time | | | 147,409 | | | | 129,301 | |
| | | | | | | | |
Total Revenue | | $ | 235,182 | | | $ | 256,309 | |
| | | | | | | | |
During the three months ended March 31, 2018 and 2017, there were no material changes in the Company’s estimate of variable fees. The amount of revenue recognized from performance obligations satisfied in prior periods was not material.
Transaction price allocated to remaining performance obligations
Transaction price allocated to remaining performance obligations represents contracted revenue that has not yet been recognized. Transaction price on remaining performance obligations was $291 million as of March 31, 2018, of which the Company expects to recognize $198.3 million prior to January 1, 2020. Theseabove amounts do not include contracts that have an original expected duration of one year or less. For reporting periods ending prior to January 1, 2018, the date of initial adoption of ASC 606, the Company has elected the practical expedient and not compiled and disclosed the amount of the transaction price allocated to the remaining performance obligations.
PEGASYSTEMS INC.
NOTES TO UNAUDITED CONDENSED CONSOLIDATED FINANCIAL STATEMENTS (continued)
Major clients
Clients accounting for 10% or more of the Company’s total revenue were as follows:
| | | | | | | | | | | | |
| | | Three Months Ended
March 31, | |
| (in thousands) | | 2018 | | | | | | 2017 | |
| | | | |
Total revenue | | | $ 235,182 | | | | $ | | | | 256,309 | |
Client A | | | * | | | | | | | | 14% | |
Client B | | | * | | | | | | | | 11% | |
*Client accounted for less than 10% of total revenue.
10.
11. STOCK-BASED COMPENSATION
Expense | | | | | | | | |
| | | Three Months Ended
March 31, | |
| (in thousands) | | 2018 | | | 2017 | |
Cost of revenues | | $ | 3,701 | | | $ | 3,622 | |
Selling and marketing | | | 4,658 | | | | 3,405 | |
Research and development | | | 3,637 | | | | 3,312 | |
General and administrative | | | 3,113 | | | | 2,169 | |
| | | | | | | | |
| | $ | 15,109 | | | $ | 12,508 | |
| | | | | | | | |
Income tax benefit | | $ | (3,141) | | | $ | (3,815) | |
|
| | | | | | | |
| | Three Months Ended
March 31, |
| (in thousands) | 2019 | | 2018 |
| Cost of revenues | $ | 4,519 |
|
| $ | 3,701 |
|
| Selling and marketing | 7,374 |
|
| 4,658 |
|
| Research and development | 4,560 |
|
| 3,637 |
|
| General and administrative | 1,897 |
|
| 3,113 |
|
| | $ | 18,350 |
|
| $ | 15,109 |
|
| Income tax benefit | $ | (3,740 | ) |
| $ | (3,141 | ) |
The Company recognizes stock-based compensation
onusing the accelerated recognition method, treating each vesting tranche as if it were an individual grant. As of March 31,
2018,2019, the Company had
net of estimated forfeitures, $92.5$114.1 million of unrecognized stock-based compensation expense,
net of estimated forfeitures, related to all unvested restricted stock units (“RSUs”) and stock
options, which wasoptions. These amounts are expected to be recognized over a weighted-average period of 2.3 years.
The Company granted the following stock-based compensation awards: | | | | | | | | |
| | | Three Months Ended
March 31, | |
| (in thousands) | | Shares | | | Total Fair Value | |
RSUs(1) | | | 858 | | | $ | 49,600 | |
Non-qualified stock options | | | 1,377 | | | $ | 24,700 | |
(1) | Includes approximately 0.1 million RSUs which were granted in connection with the election by certain employees to receive 50% of their 2018 target incentive compensation under the Company’s Corporate Incentive Compensation Plan in the form of RSUs instead of cash. Stock-based compensation of approximately $8.2 million associated with this RSU grant is expected to be recognized over aone-year period beginning on the grant date. |
|
| | | | | | |
| | Three Months Ended
March 31, |
| | 2019 |
| (in thousands) | Shares | | Total Fair Value |
| RSUs | 839 |
| | $ | 53,184 |
|
| Non-qualified stock options | 1,770 |
| | $ | 33,344 |
|
RSU vestings and stock option exercises
During the three months ended March 31,
2018, 0.62019, 0.5 million shares of common stock were issued due to stock option exercises and RSU vestings under the Company’s stock-based compensation plans.
NOTES TO UNAUDITED CONDENSED CONSOLIDATED FINANCIAL STATEMENTS (continued)
11.
Effective Tax RateThe Company computes its (benefit)/provision for income taxes by applying the estimated annual effective tax rate to year to date income before (benefit)/provision for income taxes and adjusts for discrete tax items recorded in the period.
| | | | | | | | |
| | | Three Months Ended
March 31, | |
| (Dollars in thousands) | | 2018 | | | 2017 | |
(Benefit)/provision for income taxes | | $ | (4,222) | | | $ | 13,615 | |
Effective income tax rate | | | (53)% | | | | 20% | |
|
| | | | | | | |
| | Three Months Ended
March 31, |
| (Dollars in thousands) | 2019 | | 2018 |
| Benefit from income taxes | $ | (8,300 | ) | | $ | (4,222 | ) |
| Effective income tax rate | 22 | % | | (53 | )% |
During the three months ended March 31, 2018,2019, the Company’s effective income tax rate changed primarily due to the following factors:Global Intangible Low-Taxed Income (“GILTI”) and Base Erosion and Anti-Abuse Tax (“BEAT”) provisions of the Tax Reform Act. The Company’s effective income tax rate was also affected by excess tax benefits from stock-based compensation, were disproportionately greater relative to income before (benefit)/provision for income taxes;
a decrease in the estimated annual effective income tax rate primarily due to the reduction of the U.S. statutory federal tax rate from 35% to 21% pursuant to the Tax Reform Act; and
an increase in U.S. research and development tax credits.
Tax Reform Act
On December 22, 2017, the Tax Cuts and Jobs Act of 2017 (“Tax Reform Act”) was enacted into law, which significantly changed U.S. tax law and included many provisions such as a reduction of the U.S. federal statutory tax rate, imposed aone-time transition tax on deemed repatriation of deferred foreign earnings, and included a provision to tax global intangiblelow-taxed income (“GILTI”) of foreign subsidiaries, a special tax deduction for foreign derived intangible income,credits, and a base erosion anti-abusedecrease in uncertain tax measure (“BEAT”) that may tax payments between a U.S. corporation and its foreign subsidiaries, among other tax changes.
Under the SEC Staff Accounting Bulletin No. 118 (“SAB 118”), the Company recognized the provisional tax impacts in the three months ended December 31, 2017 that included $20.4 million of income tax expense tore-measure its net deferred tax assets to the 21% enacted rate. However, the Company has revised its provisional amount to reflect the impact of the retrospective adoption of ASC 606 and has recognized a $12.6 million income tax benefit for the remeasurement of its net deferred tax liabilities on a retrospective basis in the three months ended December 31, 2017.
The final amounts may differ from those provisional amounts, possibly materially, due to, among other things, additional analysis, changes in interpretations and assumptions the Company has made, additional regulatory guidance that may be issued, and actions the Company may takepositions as a result of the Tax Reform Act.
The Tax Reform Act also provided for aone-time deemed mandatory repatriation of post-1986 undistributed foreign subsidiary earnings and profits through December 31, 2017. However, based on the Company’s provisional analysis performed as of that date, the Company does not expect to be subject to theone-time transition tax due to the Company’s foreign subsidiaries being in a net accumulated deficit position. During the three months ended March 31, 2018, the Company recognized no significant adjustments to these estimates.
The Tax Reform Act provides the following new anti-abuse provisions beginning in 2018:
The GILTI provisions require the Company to include in its U.S. income tax base foreign subsidiary earnings in excess of an allowable return on the foreign subsidiary’s tangible assets. The Company expects that it will be subject to incremental U.S. tax resulting from GILTI inclusions beginning in 2018. As of March 31, 2018, the Company has included an estimatelapse of the effectstatute of its GILTI provisions in its estimated annual effective tax rate. The Company continues to monitor IRS guidance and will update its estimates as guidance is issued.
The BEAT provisions in the Tax Reform Act impose an alternative minimum taxlimitations on taxpayers with substantial base-erosion payments. The Company’s preliminary assessment is that the Company will not be subject to the BEAT in 2018. The Company continues to monitor IRS guidance and will update its estimates as guidance is issued.certain foreign reserves.
PEGASYSTEMS INC.
NOTES TO UNAUDITED CONDENSED CONSOLIDATED FINANCIAL STATEMENTS (continued)
12.
Basic earnings per share is computed using the weighted-average number of common shares outstanding during the applicable period. Diluted earnings per share is computed using the weighted-average number of common shares outstanding during the applicable period, plus the dilutive effect of outstanding stock options and RSUs, using the treasury stock method. In periods of loss, all stock options and RSUs are excluded, as their inclusion would be anti-dilutive.
The calculation of the basic and diluted earnings per share is as follows: | | | | |
| | | Three Months Ended
March 31, |
| (in thousands, except per share amounts) | | 2018 | | 2017 |
Basic | | | | |
Net income | | $ 12,200 | | $ 52,963 |
Weighted-average common shares outstanding | | 78,236 | | 76,761 |
| | | | |
Earnings per share, basic | | $ 0.16 | | $ 0.69 |
| | | | |
| | | | |
Diluted | | | | |
Net income | | $ 12,200 | | $ 52,963 |
Weighted-average effect of dilutive securities: | | | | |
Stock options | | 3,119 | | 3,184 |
RSUs | | 1,747 | | 1,930 |
| | | | |
Effect of dilutive securities | | 4,866 | | 5,114 |
| | | | |
Weighted-average common shares outstanding, assuming dilution | | 83,102 | | 81,875 |
| | | | |
Earnings per share, diluted | | $ 0.15 | | $ 0.65 |
| | | | |
| | | | |
Outstanding anti-dilutive stock options and RSUs(1) | | 397 | | 314 |
(1) | Certain outstanding stock options and RSUs were excluded from the computation of diluted earnings per share because they were anti-dilutive in the period presented. These awards may be dilutive in the future. |
was: |
| | | | | | | |
| | Three Months Ended
March 31, |
| (in thousands, except per share amounts) | 2019 | | 2018 |
| Basic | | | |
| Net (loss) income | $ | (28,717 | ) | | $ | 12,200 |
|
| Weighted-average common shares outstanding | 78,584 |
|
| 78,236 |
|
| (Loss) earnings per share, basic | $ | (0.37 | ) | | $ | 0.16 |
|
| | | | |
| Diluted | | | |
| Net (loss) income | $ | (28,717 | ) | | $ | 12,200 |
|
| Weighted-average effect of dilutive securities: | | | |
| Stock options | — |
| | 3,119 |
|
| RSUs | — |
| | 1,747 |
|
| Effect of dilutive securities | — |
| | 4,866 |
|
| Weighted-average common shares outstanding, assuming dilution | 78,584 |
| | 83,102 |
|
| (Loss) earnings per share, diluted | $ | (0.37 | ) | | $ | 0.15 |
|
| | | | |
Outstanding anti-dilutive stock options and RSUs (1) | 5,563 |
| | 397 |
|
(1) Certain outstanding stock options and RSUs were excluded from the computation of diluted earnings per share because they were anti-dilutive in the period presented. These awards may be dilutive in the future.
ITEM 2. MANAGEMENT’S DISCUSSION AND ANALYSIS OF FINANCIAL CONDITION AND RESULTS OF OPERATIONS
FORWARD-LOOKING STATEMENTS
This Quarterly Report on Form
10-Q contains or incorporates forward-looking statements within the meaning of the Private Securities Litigation Reform Act of 1995. These statements include, but are not limited to, statements about our future financial performance and business plans, the adequacy of our liquidity and capital resources, the continued payment of quarterly dividends,
and the timing of revenue recognition, and are described more completely in Part I of our Annual Report on Form
10-K for the year ended December 31,
2017.2018.
These forward-looking statements are based on current expectations, estimates, forecasts, and projections about the industry and markets in which we operate, and management’s beliefs and assumptions. In addition, other written or oral statements that constitute forward-looking statements may be made by us or on our behalf. Words such as “expect,” “anticipate,” “intend,” “plan,” “believe,” “could,” “estimate,” “may,” “target,” “strategy,” “is intended to,” “project,” “guidance,” “likely,” “usually,” or variations of such words and similar expressions are intended to identify such forward-looking statements.These statements are not guarantees of future performance and involve certain risks, uncertainties, and assumptions that are difficult to predict.
Important factors that could cause actual future activities and results to differ materially from those expressed in such forward-looking statements include, among others, variation in demand for our products and services,
and the difficulty in predicting factors affecting the timing of license revenue recognition; reliance on third party
relationships; our beliefs and the timing of the completion of our analysis regarding the impact of the Tax Cuts and Jobs Act of 2017, including its impactrelationships, reliance on
income tax expense and deferred tax assets;key personnel, the inherent risks associated with international operations and the continued uncertainties in the global
economy;economy, our continued effort to market and sell both domestically and
internationally;internationally, foreign currency exchange
rates; the financial impact of any future acquisitions;rates, the potential legal and financial liabilities and reputation damage due to cyber-attacks and security
breaches;breaches, and management of our growth. These risks and other factors that could cause actual results to differ materially from those expressed in such forward-looking statements are described more completely in Part I of our Annual Report on Form
10-K for the year ended December 31,
20172018 as well as other filings we make with the U.S. Securities and Exchange Commission (“SEC”).
Investors are cautioned not to place undue reliance on such forward-looking statements and there are no assurances that the
mattersresults contained in such statements will be achieved. Although
subsequentnew information, future events,
or risks may cause
our viewactual results to
change,differ materially from future results expressed or implied by such forward-looking statements, except as required by applicable law, we do not undertake and specifically disclaim any obligation to publicly update or revise these forward-looking statements whether as the result of new information, future events, or otherwise.
We develop, market, license, and support
enterprise software applications
that help organizations transform the way they engage with their customers and process and complete work across their enterprise. We license our no-code Pega Platform™ for
customer engagement and digital process automation, in addition to licensing our Pega Platformrapid application development
product forto clients that wish to build and extend their own
business applications.
TheOur cloud-architected portfolio of customer engagement and digital process automation applications leverages artificial intelligence (“AI”), case management, and robotic automation technology, built on our unified no-code Pega Platform,
empowering businesses to quickly design, extend, and
applications help connect enterprises toscale their
customers in real-time across channels, streamline business operations, and adaptenterprise applications to meet
changing requirements.strategic business needs.
Our
target clients
includeare Global 3000
companiesorganizations and government agencies that
seekrequire applications to
manage complex enterprise systems and customer service issues with greater agility and cost-effectiveness. Our strategy is to sell a client a series of licenses, each focused on a specific purpose or area of operations in support of longer term enterprise-wide digital transformation initiatives.Our license revenue is primarily derived from sales of our applications and Pega Platform. Our cloud revenue is derived from our hosted software application and Pega Platform environments. Our consulting revenue is primarily related to new license implementations.
Financial and Performance Metrics
We adopted the new revenue recognition standard (“ASC 606”) effective January 1, 2018 using the full retrospective method. See Note 2. “New Accounting Pronouncements” included in Item 1. “Unaudited Condensed Consolidated Financial Statements” for additional information.
| | | | | | | | | | | | | | | | |
| (Dollars in thousands, except per share amounts) | | Three Months Ended
March 31, | | | | | | | |
| | 2018 | | | 2017 | | | Change | |
Total revenue | | $ | 235,182 | | | $ | 256,309 | | | $ | (21,127 | ) | | | (8)% | |
Net income | | $ | 12,200 | | | $ | 52,963 | | | $ | (40,763 | ) | | | (77)% | |
Diluted earnings per share | | $ | 0.15 | | | $ | 0.65 | | | $ | (0.50 | ) | | | (77)% | |
Cash provided by operating activities | | $ | 55,655 | | | $ | 32,444 | | | $ | 23,211 | | | | 72% | |
The decrease in total revenuedifferentiate themselves in the three months ended March 31, 2018 was primarily duemarkets they serve. Our applications achieve and facilitate differentiation by increasing business agility, driving growth, improving productivity, attracting and retaining customers, and reducing risk. We deliver applications tailored to our clients’ specific industry needs.
Performance metrics
We utilize a large termnumber of different performance measures in analyzing and assessing our overall performance, making operating decisions, and forecasting and planning for future periods. |
| | | | | | | | | | | | | |
(Dollars in thousands, except per share amounts) | Three Months Ended
March 31, | | Change |
| 2019 | | 2018 | |
| Total revenue | $ | 212,546 |
| | $ | 235,182 |
| | $ | (22,636 | ) | (10 | )% |
Subscription revenue (1) | $ | 143,778 |
| | $ | 144,802 |
| | $ | (1,024 | ) | (1 | )% |
| Net (loss) income | $ | (28,717 | ) | | $ | 12,200 |
| | $ | (40,917 | ) | * |
|
| (Loss) earnings per share, diluted | $ | (0.37 | ) | | $ | 0.15 |
| | $ | (0.52 | ) | * |
|
* not meaningful
(1) Reflects client arrangements (term license, arrangement recognized in revenue in the three months ended March 31, 2017cloud, and a shift in client preferencesmaintenance) that are subject to cloud arrangements. Cloud arrangements are generally recognized in revenue over the term of the cloud contract, as compared to other arrangements, which are generally recognized in revenue on the contract effective date.renewal.
Annual Contract Value (“ACV”)(1) The change in ACV measures the growth and predictability of future cash flows from committed term,Pega cloud and maintenanceclient cloud committed arrangements as of the end of the particular reporting period. | | | | | | | | | | | | | | | | |
| | | March 31, | | | | | | | |
| (in thousands) | | 2018 | | | 2017 | | | Change | |
Term and Cloud ACV | | $ | 236,025 | | | $ | 193,004 | | | $ | 43,021 | | | | 22% | |
Maintenance ACV | | | 258,100 | | | | 234,852 | | | $ | 23,248 | | | | 10% | |
| | | | | | | | | | | | | | | | |
Total ACV | | $ | 494,125 | | | $ | 427,856 | | | $ | 66,269 | | | | 15% | |
| | | | | | | | | | | | | | | | |
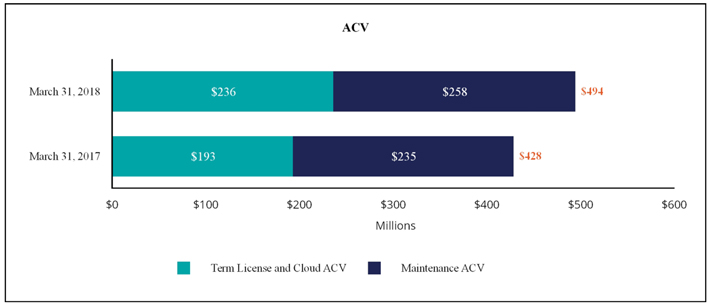
|
| | | | | | | | | | | | | |
| | March 31, | | Change |
| (Dollars in thousands) | 2019 | | 2018 | |
| Pega Cloud ACV | $ | 128,636 |
| | $ | 72,966 |
| | $ | 55,670 |
| 76 | % |
| Client Cloud ACV | 462,130 |
| | 421,159 |
| | 40,971 |
| 10 | % |
| Total ACV | $ | 590,766 |
| | $ | 494,125 |
| | $ | 96,641 |
| 20 | % |
(1) ACV, as of a given date, is the sum of the following two components: TheClient Cloud: the sum of (1) the annual value of each term and cloudlicense contract in effect on such date, with the annual value of a term or cloud contract beingwhich is equal to theits total value of the contract divided by the total number of years of the contract.
Maintenanceand (2) maintenance revenue reported for the quarter ended on such date, multiplied by four. We do not provide hosting for Client Cloud arrangements
Pega Cloud: the total of the annual value of each cloud contract in effect on such date, which is equal to its total value divided by the total number of years.
Remaining performance obligations
Revenue recognition timing on existing contracts:
|
| | | | | | | | | | | | | | | | | | | | | | | | | |
| | March 31, 2019 |
| (Dollars in thousands) | Perpetual license | | Term license | | Maintenance | | Cloud | | Consulting | | Total |
| 1 year or less | $ | 10,263 |
| | $ | 44,404 |
| | $ | 187,324 |
| | $ | 115,548 |
| | $ | 13,251 |
| | $ | 370,790 |
| 58 | % |
| 1-2 years | 998 |
| | 4,274 |
| | 9,350 |
| | 91,539 |
| | 1,363 |
| | 107,524 |
| 17 | % |
| 2-3 years | 2,180 |
| | 756 |
| | 4,438 |
| | 71,509 |
| | 473 |
| | 79,356 |
| 13 | % |
| Greater than 3 years | — |
| | 135 |
| | 2,008 |
| | 72,742 |
| | 27 |
| | 74,912 |
| 12 | % |
| | $ | 13,441 |
| | $ | 49,569 |
| | $ | 203,120 |
| | $ | 351,338 |
| | $ | 15,114 |
| | $ | 632,582 |
| 100 | % |
|
| | | | | | | | | | | | | | | | | | | | | | | | | |
| | March 31, 2018 |
| (Dollars in thousands) | Perpetual license | | Term license | | Maintenance | | Cloud | | Consulting | | Total |
| 1 year or less | $ | 33,859 |
| | $ | 21,087 |
| | $ | 156,702 |
| | $ | 47,764 |
| | $ | 9,403 |
| | $ | 268,815 |
| 59 | % |
| 1-2 years | 14,106 |
| | 7,877 |
| | 21,381 |
| | 52,849 |
| | 1,098 |
| | 97,311 |
| 21 | % |
| 2-3 years | 1,204 |
| | 5,634 |
| | 4,924 |
| | 37,844 |
| | — |
| | 49,606 |
| 11 | % |
| Greater than 3 years | 382 |
| | 853 |
| | 1,825 |
| | 40,478 |
| | — |
| | 43,538 |
| 9 | % |
| | $ | 49,551 |
| | $ | 35,451 |
| | $ | 184,832 |
| | $ | 178,935 |
| | $ | 10,501 |
| | $ | 459,270 |
| 100 | % |
The above amounts include contracts that have an original expected duration of one year or less.
CRITICAL ACCOUNTING POLICES
Management’s Discussion and Analysis of Financial Condition and Results of Operations is based upon our unaudited condensed consolidated financial statements, which have been prepared in accordance with accounting principles generally accepted in the United States (U.S.
(“U.S.”) and the rules and regulations of the SEC for interim financial reporting. The preparation of these financial statements requires us to make estimates and judgments that affect the reported amounts of assets, liabilities, revenues, and expenses, and the related disclosure of contingent assets and liabilities. We base our estimates and judgments on historical experience, knowledge of current conditions, and expectations of what could occur in the future given available information.
Revenue
We account for revenue in accordance with ASC 606. Our revenue recognition policies require us to make significant judgments and estimates.
Our clients’ contracts typically contain promises to transfer multiple products and services. Judgment is required to determine whether each product and service is considered to be a distinct performance obligation that should be accounted for separately under the contract. We allocate the transaction price to the distinct performance obligations based on relative stand-alone selling price. We estimate stand-alone selling price based on the prices charged to clients, or by using information such as market conditions and other observable inputs. However, the selling price of our software licenses and cloud performance obligations are highly variable. Thus, we estimate stand-alone selling price for software licenses and cloud performance obligations using the residual approach, determined based on total transaction price minus the stand-alone selling price of other performance obligations promised in the contract.
In applying our revenue recognition policy, we must determine which portions of our revenue are recognized currently and which portions must be deferred and recognized in future periods. We analyze various factors including, but not limited to, the selling price of undelivered services when sold on a stand-alone basis, our pricing policies, and contractual terms and conditions in helping us to make such judgments about revenue recognition. Changes in judgment on any of these factors could materially impact the timing and amount of revenue recognized in a given period.
Deferred Contract Costs
Sales incentives paid by us are considered incremental and recoverable costs of obtaining a contract with a client. These costs are deferred and then amortized over the period of benefit, which is on average five years. We determined the period of benefit by taking into consideration our client contracts, our technology, and other factors.
Except as described above, there have been no changes in our critical accounting policies as disclosed in our Annual Report on Form10-K for the year ended December 31, 2017.
For more information regarding our critical accounting policies, we encourage you to read the discussion contained in the following
locations:locations in our Annual Report on Form 10-K for the year ended December 31, 2018:“Critical Accounting Estimates and Significant Judgments” in Item 7. “Management’s Discussion and Analysis of Financial Condition and Results of Operations”; and
Note 2. “Significant Accounting Policies” in Item 8. “Financial Statements and Supplementary Data” both of which are contained.
There have been no significant changes to our critical accounting policies as disclosed in our Annual Report on Form10-K for the year ended December 31, 2017.
Note 2. “New Accounting Pronouncements”, Note 4. “Receivables, Contract Assets, and Deferred Revenue”, and Note 9. “Revenue” contained in Item 1. “Unaudited Condensed Consolidated Financial Statements” of this Quarterly Reporting on Form10-Q for the three months ended March 31, 2018.
RESULTS OF OPERATIONS
| | | | | | | | | | | | | | | | |
| | | Three Months Ended
March 31, | | | | | | | |
| (Dollars in thousands) | | 2018 | | | 2017 | | | Change | |
Total revenue | | $ | 235,182 | | | $ | 256,309 | | | $ | (21,127 | ) | | | (8)% | |
Gross profit | | $ | 159,568 | | | $ | 188,219 | | | $ | (28,651 | ) | | | (15)% | |
Income from operations | | $ | 7,936 | | | $ | 65,907 | | | $ | (57,971 | ) | | | (88)% | |
Net income | | $ | 12,200 | | | $ | 52,963 | | | $ | (40,763 | ) | | | (77)% | |
|
| | | | | | | | | | | | | | | | | |
| (Dollars in thousands) | Three Months Ended
March 31, | | Change |
| 2019 | | 2018 | |
| Term license | $ | 48,314 |
| 23 | % | | $ | 64,695 |
| 28 | % | | $ | (16,381 | ) | (25 | )% |
| Cloud | 27,758 |
| 13 | % | | 15,582 |
| 7 | % | | 12,176 |
| 78 | % |
| Maintenance | 67,706 |
| 32 | % | | 64,525 |
| 27 | % | | 3,181 |
| 5 | % |
Subscription revenue (1) | 143,778 |
| 68 | % | | 144,802 |
| 62 | % | | (1,024 | ) | (1 | )% |
| Perpetual license | 14,950 |
| 7 | % | | 23,078 |
| 10 | % | | (8,128 | ) | (35 | )% |
| Consulting | 53,818 |
| 25 | % | | 67,302 |
| 28 | % | | (13,484 | ) | (20 | )% |
| | $ | 212,546 |
| 100 | % | | $ | 235,182 |
| 100 | % | | $ | (22,636 | ) | (10 | )% |
(1) Reflects client arrangements (term license, | | | | | | | | | | | | | | | | | | | | | | | | |
| (Dollars in thousands) | | Three Months Ended
March 31, | | | | | | | |
| | 2018 | | | 2017 | | | Change | |
Perpetual license | | $ | 23,078 | | | | 26% | | | $ | 37,899 | | | | 30% | | | $ | (14,821 | ) | | | (39)% | |
Term license | | | 64,695 | | | | 74% | | | | 89,109 | | | | 70% | | | | (24,414 | ) | | | (27)% | |
| | | | | | | | | | | | | | | | |
Total software license | | $ | 87,773 | | | | 100% | | | $ | 127,008 | | | | 100% | | | $ | (39,235 | ) | | | (31)% | |
| | | | | | | | | | | | | | | | |
The decrease cloud, and maintenance) that are subject to renewal.
Our license revenue is derived from sales of our applications and Pega Platform. Our cloud revenue is derived from our hosted Pega Platform and software applications.
We expect our revenue mix to continue to shift in
favor of our subscription offerings, particularly cloud arrangements, which could result in slower total revenue growth in the near term. Revenue from cloud arrangements is generally recognized over the service period, while revenue from term and perpetual license
revenue inarrangements is generally recognized upfront when the
three months ended March 31, 2018 was primarily due to a decrease in the value of perpetual arrangements executed in the three months ended March 31, 2018 driven primarily by a shift in client preferences to cloud arrangements.license rights become effective.
Subscription revenue
The decrease in term license revenue in the three months ended March 31,
20182019 was primarily due to
a large term license arrangement recognizedlower average revenue per arrangement. The increase in
cloud revenue in the three months ended March 31,
2017 and a2019 reflects the shift in client preferences to cloud
arrangements from other types of arrangements.
Maintenance
| | | | | | | | | | | | | | | | |
| | | Three Months Ended
March 31, | | | | | | | |
| (Dollars in thousands) | | 2018 | | | 2017 | | | Change | |
Maintenance | | $ | 64,525 | | | $ | 58,713 | | | $ | 5,812 | | | | 10% | |
The increase in maintenance revenue was primarily due to the continued growth in the aggregate value of the installed base of our software and strong renewal rates
significantly in excess of 90%.
Services
| | | | | | | | | | | | | | | | | | | | | | | | |
| | | Three Months Ended
March 31, | | | | | | | |
| (Dollars in thousands) | | 2018 | | | 2017 | | | Change | |
Cloud | | $ | 15,582 | | | | 19% | | | $ | 10,402 | | | | 15% | | | $ | 5,180 | | | | 50% | |
Consulting and training | | | 67,302 | | | | 81% | | | | 60,186 | | | | 85% | | | | 7,116 | | | | 12% | |
| | | | | | | | | | | | | | | | |
Total services | | $ | 82,884 | | | | 100% | | | $ | 70,588 | | | | 100% | | | $ | 12,296 | | | | 17% | |
| | | | | | | | | | | | | | | | |
Perpetual license
The
increasedecrease in
cloudperpetual license revenue
was primarily due to the continued growth of our cloud client base driven by a shift in
client preferences to cloud arrangements.The increase in consulting and training revenue was primarily due to higher billable hours during the three months ended March 31, 2018. 2019 reflects the shift in client preferences in favor of our cloud offerings and away from perpetual license arrangements.
Consulting
Our consulting
and training revenue
may fluctuate in future periodsfluctuates depending
onupon the mix of new implementation projects we perform as compared to those performed by our enabled clients or led by our partners.
The decrease in consulting revenue in the three months ended March 31, 2019 was primarily due to a decrease in billable hours.
Gross profit | | | | | | | | | | | | | | | | | | | | | | | | |
| | | Three Months Ended
March 31, | | | | |
| (Dollars in thousands) | | 2018 | | | 2017 | | | Change | |
Software license | | $ | 86,518 | | | | 99% | | | $ | 125,708 | | | | 99% | | | $ | (39,190 | ) | | | (31)% | |
Maintenance | | | 58,443 | | | | 91% | | | | 51,495 | | | | 88% | | | | 6,948 | | | | 13 % | |
Cloud | | | 7,861 | | | | 50% | | | | 4,669 | | | | 45% | | | | 3,192 | | | | 68 % | |
Consulting and training | | | 6,746 | | | | 10% | | | | 6,347 | | | | 11% | | | | 399 | | | | 6 % | |
| | | | | | | | | | | | | | | | |
Services | | | 14,607 | | | | 18% | | | | 11,016 | | | | 16% | | | | 3,591 | | | | 33 % | |
| | | | | | | | | | | | | | | | |
Total gross profit | | $ | 159,568 | | | | 68% | | | $ | 188,219 | | | | 73% | | | $ | (28,651 | ) | | | (15) % | |
| | | | | | | | | | | | | | | | |
|
| | | | | | | | | | | | | | | | | |
| | Three Months Ended
March 31, | | Change |
| (Dollars in thousands) | 2019 | | 2018 | |
| Software license | $ | 61,886 |
| 98 | % | | $ | 86,518 |
| 99 | % | | $ | (24,632 | ) | (28 | )% |
| Maintenance | 61,371 |
| 91 | % | | 58,443 |
| 91 | % | | 2,928 |
| 5 | % |
| Cloud | 14,460 |
| 52 | % | | 7,861 |
| 50 | % | | 6,599 |
| 84 | % |
| Consulting | 392 |
| 1 | % | | 6,746 |
| 10 | % | | (6,354 | ) | (94 | )% |
| | $ | 138,109 |
| 65 | % | | $ | 159,568 |
| 68 | % | | $ | (21,459 | ) | (13 | )% |
The recent shift in our revenue mix toward cloud arrangements has resulted in slower total gross profit growth as our cloud business continues to grow and scale. Revenue from cloud arrangements is generally recognized over the service period, while revenue from term and perpetual license arrangements is generally recognized upfront when the license rights become effective.
The decrease in total gross profit in the three months ended March 31, 20182019 was primarily due to a largethe decrease in term and perpetual license arrangement recognized in revenue inreflecting the three months ended March 31, 2017. Additionally we have experienced a shift in client preferences totoward our cloud arrangements, which are generally recognizedofferings.
The decrease in
revenue over the term of the cloud contract, as compared to other arrangements, which are generally recognized in revenue on the contract effective date.The increase in maintenancetotal gross profit percent in the three months ended March 31, 20182019 was driven by a $0.5 million decreaseshift in client support expenses as we transferred client support resources to supportfavor of cloud arrangements, which are lower margin than our growing cloud business.
term and perpetual license revenue streams. The increase in cloud gross profit percent in the three months ended March 31, 2018 was driven by cost efficiency gains as our cloud business continues to grow and scale, partially offset by a $0.5 million increasescale. The decrease in client support expenses as we expanded our cloud client support function to sustain our growing cloud business.
If we had transferred these resources on January 1, 2017, the change in maintenance and cloud gross profit andconsulting gross profit percent would have beenwas driven by a decrease in billable hours as follows:
| | | | | | | | | | | | | | | | | | | | | | | | |
| | | Three Months Ended
March 31, | | | Change | |
| (Dollars in thousands) | | 2018 | | | 2017 | | |
Maintenance | | $ | 58,443 | | | | 91% | | | $ | 51,995 | | | | 89% | | | $ | 6,448 | | | | 12% | |
Cloud | | $ | 7,861 | | | | 50% | | | $ | 4,169 | | | | 40% | | | $ | 3,692 | | | | 89% | |
consulting resources were transitioning to new projects after completing a large project which began in the second half of 2016 and an increase in consulting resource availability in Europe as we continue growing and leveraging our partner network.
Selling and marketing | | | | | | | | | | | | | | | | |
| | | Three Months Ended
March 31, | | | Change | |
| (Dollars in thousands) | | 2018 | | | 2017 | | |
Selling and marketing | | $ | 88,383 | | | $ | 69,681 | | | $ | 18,702 | | | | 27% | |
As a percent of total revenue | | | 38% | | | | 27% | | | | | | | | | |
Selling and marketing headcount, end of period | | | 1,082 | | | | 900 | | | | 182 | | | | 20% | |
Selling and marketing expenses include
|
| | | | | | | | | | | | | |
| | Three Months Ended
March 31, | | Change |
| (Dollars in thousands) | 2019 | | 2018 | |
Selling and marketing (1) | $ | 108,865 |
| | $ | 88,383 |
| | $ | 20,482 |
| 23 | % |
| As a percent of total revenue | 51 | % | | 38 | % | | | |
Selling and marketing headcount, end of period | 1,282 |
| | 1,082 |
| | 200 |
| 18 | % |
(1) Includes compensation, benefits, and other headcount-related expenses associated with our selling and marketing personnel as well as advertising, promotions, trade shows, seminars, and other programs. Selling and marketing expenses also include the amortization of client-related intangibles. The increase in the three months ended March 31, 20182019 was primarily due to an increase in compensation and benefits of $11.6$17.7 million, driven byattributable to increased headcount, and equity compensation, amortizationan increase of $4.5 million in deferred commissions, increased spending on event marketing and digital advertising, and the expenses associated with assigning contract negotiation resources to drive efficiencies in the sales process in support of our long-term growth.commission amortization. The increase in headcount reflects our efforts to increase our sales capacity to deepen relationships with existing clients and target new accounts in existing industries, as well as to expand coverage in new industries and geographies, and to increase the number of sales opportunities.
. Research and development | | | | | | | | | | | | | | | | |
| | | Three Months Ended
March 31, | | | Change | |
| (Dollars in thousands) | | 2018 | | | 2017 | | |
Research and development | | $ | 46,785 | | | $ | 40,296 | | | $ | 6,489 | | | | 16% | |
As a percent of total revenue | | | 20% | | | | 16% | | | | | | | | | |
Research and Development headcount, end of period | | | 1,602 | | | | 1,441 | | | | 161 | | | | 11% | |
Research and development expenses include
|
| | | | | | | | | | | | | |
| | Three Months Ended
March 31, | | Change |
| (Dollars in thousands) | 2019 | | 2018 | |
Research and development (1) | $ | 50,596 |
| | $ | 46,785 |
| | $ | 3,811 |
| 8 | % |
| As a percent of total revenue | 24 | % | | 20 | % | | | |
Research and development headcount, end of period | 1,638 |
| | 1,602 |
| | 36 |
| 2 | % |
(1) Includes compensation, benefits, contracted services, and other headcount-related expenses associated with the creation and development of our products, as well as enhancements and design changes to existing products and the integration of acquired technologies. The increase in the three months ended March 31,
20182019 was primarily due to an increase in compensation and benefits of
$4.6$2.1 million, attributable to
increasedan increase in headcount, and
the expansionan increase of
$1.6 million in cloud hosting expenses as we expand our
applicationcloud-focused research and development
team to support the continued development of our software.activities.
General and administrative | | | | | | | | | | | | | | | | |
| | | Three Months Ended
March 31, | | | Change | |
| (Dollars in thousands) | | 2018 | | | 2017 | | |
General and administrative | | $ | 16,464 | | | $ | 12,335 | | | $ | 4,129 | | | | 33 % | |
As a percent of total revenue | | | 7% | | | | 5% | | | | | | | | | |
General and administrative headcount, end of period | | | 299 | | | | 384 | | | | (85 | ) | | | (22)% | |
General and administrative expenses include
|
| | | | | | | | | | | | | |
| | Three Months Ended
March 31, | | Change |
| (Dollars in thousands) | 2019 | | 2018 | |
General and administrative (1) | $ | 12,676 |
| | $ | 16,464 |
| | $ | (3,788 | ) | (23 | )% |
| As a percent of total revenue | 6 | % | | 7 | % | | | |
General and administrative headcount, end of period (2) | 373 |
| | 299 |
| | 74 |
| 25 | % |
(1) Includes compensation, benefits, and other headcount-related expenses associated with finance, legal, corporate governance, and other administrative headcount. They also includeAlso includes accounting, legal, and other professional consulting and administrative fees. (2)The general and administrative headcount includes employees in human resources, information technology and corporate services departments, whose costs are partially allocated to other operating expense areas. The decrease in the three months ended March 31, 2019 was primarily due to a decrease in compensation and benefits of $1.2 million, due to a decrease in equity compensation, and a decrease of $1.9 million in legal and other professional services fees. Despite the headcount increase, associated compensation and benefits did not increase because these costs are primarily allocated to other operating expense areas.
|
| | | | | | | | | | | | | |
| | Three Months Ended
March 31, | | Change |
| (Dollars in thousands) | 2019 | | 2018 | |
| Cost of revenues | $ | 4,519 |
| | $ | 3,701 |
| | $ | 818 |
| 22 | % |
| Selling and marketing | 7,374 |
| | 4,658 |
| | 2,716 |
| 58 | % |
| Research and development | 4,560 |
| | 3,637 |
| | 923 |
| 25 | % |
| General and administrative | 1,897 |
| | 3,113 |
| | (1,216 | ) | (39 | )% |
| | $ | 18,350 |
| | $ | 15,109 |
| | $ | 3,241 |
| 21 | % |
| Income tax benefit | $ | (3,740 | ) | | $ | (3,141 | ) | | $ | (599 | ) | 19 | % |
The increase in the three months ended March 31,
2018 was primarily due to an increase in compensation and benefits of $1.1 million, attributable to equity compensation, and an increase of $1 million in legal fees. The decrease in headcount reflects the realignment of contract negotiation and product development resources to augment our selling and marketing and research development functions, respectively.Stock-based compensation
| | | | | | | | | | | | | | | | |
| | | Three Months Ended
March 31, | | | Change | |
| (in thousands) | | 2018 | | | 2017 | | |
Cost of revenues | | $ | 3,701 | | | $ | 3,622 | | | $ | 79 | | | | 2 % | |
Selling and marketing | | | 4,658 | | | | 3,405 | | | | 1,253 | | | | 37 % | |
Research and development | | | 3,637 | | | | 3,312 | | | | 325 | | | | 10 % | |
General and administrative | | | 3,113 | | | | 2,169 | | | | 944 | | | | 44 % | |
| | | | | | | | | | | | | | | | |
| | $ | 15,109 | | | $ | 12,508 | | | $ | 2,601 | | | | 21 % | |
| | | | | | | | | | | | | | | | |
Income tax benefit | | $ | (3,141) | | | $ | (3,815) | | | $ | 674 | | | | (18)% | |
The increase2019 was primarily due to the increased value of our annual periodic equity awards granted in March 20182019 and 2017.2018. These awards generally have a five-year vesting schedule.
Non-operating (expense) income, net income/(expense), net | | | | | | | | | | | | | | | | |
| | | Three Months Ended
March 31, | | | Change | |
| (Dollars in thousands) | | 2018 | | | 2017 | | |
Foreign currency transaction (loss)/gain | | $ | (1,085) | | | $ | 745 | | | $ | (1,830) | | | | n/m | |
Interest income, net | | | 764 | | | | 205 | | | | 559 | | | | 273 % | |
Other income/(expense), net | | | 363 | | | | (279) | | | | 642 | | | | n/m | |
| | | | | | | | | | | | | | | | |
| | $ | 42 | | | $ | 671 | | | $ | (629) | | | | (94)% | |
| | | | | | | | | | | | | | | | |
n/m -
|
| | | | | | | | | | | | | |
| | Three Months Ended
March 31, | | Change |
| (Dollars in thousands) | 2019 | | 2018 | |
| Foreign currency transaction loss | $ | (3,712 | ) | | $ | (1,085 | ) | | $ | (2,627 | ) | 242 | % |
| Interest income, net | 723 |
| | 764 |
| | (41 | ) | (5 | )% |
| Other income, net | — |
| | 363 |
| | (363 | ) | (100 | )% |
| $ | (2,989 | ) | | $ | 42 |
| | $ | (3,031 | ) | * |
|
The change in foreign currency transaction
(loss)/gain isloss was primarily due to unrealized losses on foreign currency denominated
receivables. The adoptioncash and receivables of
ASC 606 materially increased the unbilled receivables we have recorded, which has increased the impact ofour U.K subsidiary due to fluctuations in foreign
currency exchange rates
reported in our unaudited condensed consolidated statements of operations. See Item 3. “Quantitativeas the British Pound strengthened against the Euro and
Qualitative Disclosures about Market Risk” for additional information.(Benefit)/provision forU.S. dollar.
Benefit from income taxes | | | | | | | | | | | | | | | | |
| | | Three Months Ended
March 31, | | | Change | |
| (Dollars in thousands) | | 2018 | | | 2017 | | |
(Benefit)/provision for income taxes | | $ | (4,222) | | | $ | 13,615 | | | $ | (17,837) | | | | n/m | |
Effective income tax rate | | | (53)% | | | | 20% | | | | | | | | | |
n/m - not meaningful
During the three months ended March 31, 2018, our effective tax rate changed primarily due to the following factors:
excess tax benefits from stock-based compensation were disproportionately greater relative to income before (benefit)/provision for income taxes;
a decrease in the estimated annual effective income tax rate primarily due to the reduction of the U.S. statutory federal tax rate from 35% to 21% pursuant to the Tax Reform Act; and |
| | | | | | | | | | | | | |
| | Three Months Ended
March 31, | | Change |
| (Dollars in thousands) | 2019 | | 2018 | |
| Benefit from income taxes | $ | (8,300 | ) | | $ | (4,222 | ) | | $ | (4,078 | ) | 97 | % |
| Effective income tax rate | 22 | % | | (53 | )% | | | |
an increase in U.S. research and development tax credits.
The inclusion of excess tax benefits from stock-based compensation as a component ofin the provision for income taxes has increased the volatilityvariability of the effective tax rates in recent periods, andperiods. This fluctuation may continue to do so in future periods, as the amount of excess tax benefits from stock-based compensation awards varies depending on our future stock price in relation to the fair value of awards, the timing of RSU vestings, the exercise behavior of our stock option holders, and the total value of future grants of stock-based compensation awards.
During the three months ended March 31, 2019, the Company’s effective income tax rate changed primarily due to the Global Intangible Low-Taxed Income (“GILTI”) and Base Erosion and Anti-Abuse Tax (“BEAT”) provisions of the Tax Reform Act. The Company’s effective income tax rate was also affected by excess tax benefits from stock-based compensation, an increase in U.S. research and development tax credits, and a decrease in uncertain tax positions as a result of the lapse of the statute of limitations on certain foreign reserves.
LIQUIDITY AND CAPITAL RESOURCES | | | | | | | | |
| | | Three Months Ended
March 31, | |
| (in thousands) | | 2018 | | | 2017 | |
Cash provided by (used in): | | | | | | | | |
Operating activities | | $ | 55,655 | | | $ | 32,444 | |
Investing activities | | | (31,278) | | | | (3,727) | |
Financing activities | | | (23,052) | | | | (15,994) | |
Effect of exchange rates on cash and cash equivalents | | | 2,186 | | | | 521 | |
| | | | | | | | |
Net increase in cash and cash equivalents | | $ | 3,511 | | | $ | 13,244 | |
| | | | | | | | |
| | |
| (in thousands) | | March 31,
2018 | | | December 31,
2017 | |
Held in U.S. entities | | $ | 168,135 | | | $ | 136,444 | |
Held in foreign entities | | | 86,702 | | | | 87,304 | |
| | | | | | | | |
Total cash, cash equivalents, and marketable securities | | $ | 254,837 | | | $ | 223,748 | |
| | | | | | | | |
|
| | | | | | | |
| | Three Months Ended
March 31, |
| (in thousands) | 2019 | | 2018 |
| Cash provided by (used in): | | | |
| Operating activities | $ | 22,703 |
| | $ | 55,655 |
|
| Investing activities | (1,466 | ) | | (31,278 | ) |
| Financing activities | (25,587 | ) | | (23,052 | ) |
| Effect of exchange rates on cash and cash equivalents | 295 |
| | 2,186 |
|
| Net (decrease) increase in cash and cash equivalents | $ | (4,055 | ) | | $ | 3,511 |
|
|
| | | | | | | |
| (in thousands) | March 31, 2019 | | December 31, 2018 |
| Held by U.S. entities | $ | 141,051 |
| | $ | 143,533 |
|
| Held by foreign entities | 61,120 |
| | 63,890 |
|
| Total cash, cash equivalents, and marketable securities | $ | 202,171 |
| | $ | 207,423 |
|
We believe that our current cash, cash equivalents, marketable securities, and cash flow from operations will be sufficient to fund our operations, quarterly cash dividends, and stock repurchases for at least the next 12 months.
If it became necessary to repatriate foreign funds, we may be required to pay U.S. state and local taxes, as well as foreign taxes, upon repatriation. Due to the complexity of
the income tax laws
and regulations, and the effects of the Tax Reform Act, it is impracticable to estimate the amount of taxes we would have to pay.
Cash provided by operating activitiesThe primary drivers during
As client preferences continue to shift in favor of cloud arrangements, we could continue to experience slower operating cash flow growth in the
near term. Cash from cloud arrangements is generally collected throughout the service period of three
months ended March 31, 2018 were net income of $12.2 million and $49.6 millionto five years, while cash from
receivables and contract assets, largely due to increased cash collections andperpetual license arrangements is generally collected upfront, shortly after the
timing of billings.license rights become effective.
The primary driver during the three months ended March 31,
20172019 was
net income$78.1 million in cash generated from client receivables, largely due to cash collections and the timing of
$53.0 million.billings.
Cash used in investing activitiesDuring
Cash used in investing activities is primarily driven by the
three months ended March 31, 2018, we purchased investmentstiming of
$35.2 millioninvestment maturities and
made investmentspurchases of
$2.1 million in property and equipment, partially offset by proceeds received from maturities of investments (including called marketable debt securities) of $6 million.During the three months ended March 31, 2017, we purchased investments of $3.3 million, partially offset by proceeds received from maturities of investments (including called marketable debt securities) of $2.3 million. We also invested $2.4 million primarily for leasehold improvements for the build out of additional office space at our Hyderabad, India location.
new investments.
Cash used in financing activities We used cash primarily for repurchases of our common stock under our publicly announced stock repurchase programs, stock repurchases for tax withholdings for the net settlement of our equity awards, and the payment of our quarterly dividend.
Since 2004, our Board of Directors has approved annual
Stock repurchase program (1)
The changes in the remaining stock repurchase programs that have authorized the repurchase in the aggregate of up to $195 million of our common stock.authority was: |
| | | |
| | Three Months Ended
March 31, |
| (in thousands) | 2019 |
| January 1 | $ | 6,620 |
|
Authorizations (2) | 60,000 |
|
| Repurchases | (7,586 | ) |
| March 31, | $ | 59,034 |
|
(1) Purchases under these programs have been made on the open market. As(2) On March 15, 2019, we announced that our Board of Directors extended the expiration date of the current stock repurchase program to June 30, 2020 and increased the amount of common stock we are authorized to repurchase by $60 million between March 31, 2018, $159.2 million had been repurchased, $29.2 million remained available for repurchase,15, 2019 and $6.4 million had expired.June 30, 2020.
Common stock repurchases | | | | | | | | | | | | | | | | |
| | | Three Months Ended
March 31, | |
| | | 2018 | | | 2017 | |
| (in thousands) | | Shares | | | Amount | | | Shares | | | Amount | |
Tax withholdings for net settlement of equity awards | | | 270 | | | $ | 15,575 | | | | 289 | | | $ | 12,504 | |
Stock repurchase program(1) | | | | | | | | | | | | | | | | |
Repurchases paid | | | 89 | | | | 4,998 | | | | 29 | | | | 1,260 | |
Repurchases unsettled at period end | | | 12 | | | | 690 | | | | 5 | | | | 238 | |
| | | | | | | | | | | | | | | | |
Activity in Period(2) | | | 371 | | | $ | 21,263 | | | | 323 | | | $ | 14,002 | |
| | | | | | | | | | | | | | | | |
| (1) | Represents activity under our publicly announced stock repurchase programs. |
| (2) | During the three months ended March 31, 2018 and 2017, instead of receiving cash from the equity holders, we withheld shares with a value of $11.2 million and $7.7 million for the exercise price of options. These amounts have been excluded from the table above. |
Dividends
| | | | |
| | | Three Months Ended
March 31, |
| (per share) | | 2018 | | 2017 |
Dividends declared | | $ 0.03 | | $ 0.03 |
|
| | | | | | | | | | | | | |
| | Three Months Ended
March 31, |
| | 2019 | | 2018 |
| (in thousands) | Shares | | Amount | | Shares | | Amount |
| Tax withholdings for net settlement of equity awards | 232 |
| | $ | 14,838 |
| | 270 |
| | $ | 15,575 |
|
Stock repurchase program (1) | | | | | | | |
| Repurchases paid | 141 |
| | 7,387 |
| | 89 |
| | 4,998 |
|
| Repurchases unsettled at period end | 3 |
| | 199 |
| | 12 |
| | 690 |
|
Activity in period (2) | 376 |
| | $ | 22,424 |
| | 371 |
| | $ | 21,263 |
|
(1) Represents activity under our publicly announced stock repurchase programs. (2)During the three months ended March 31, 2019 and 2018, instead of receiving cash from the equity holders, we withheld shares with a value of $12.2 million and 2017, we paid cash dividends$11.2 million, respectively, for the exercise price of $2.3 million. options. These amounts have been excluded from the table above.
|
| | | | | | | |
| | Three Months Ended
March 31, |
| (in thousands) | 2019 | | 2018 |
| Dividend payments to shareholders | $ | 2,363 |
| | $ | 2,344 |
|
It is our current intention to pay a quarterly cash dividend of $0.03 per share, however, the Board of Directors may terminate or modify
thisthe dividend program at any time without prior notice.
ITEM 3. | QUANTITATIVE AND QUALITATIVE DISCLOSURES ABOUT MARKET RISK |
Market risk represents the risk of loss that may affect us due to adverse
ITEM 3. QUANTITATIVE AND QUALITATIVE DISCLOSURES ABOUT MARKET RISK
There have been no material changes
in financial market prices and rates. Our market risk exposure is primarily related to fluctuations in foreign exchange rates. Other than the item discussed below, there were no significant changes to our market risk exposure during the
first three months ended March 31,
2018.See Item 7A. “Quantitative and Qualitative Disclosures about Market Risk” and Item 1A. “Risk Factors - We are exposed2019 to fluctuations in currency exchange rates that could negatively impact our financial results and cash flows” includedthe market risk exposure disclosed in our Annual Report on Form10-K for the year ended December 31, 2017 for a more complete discussion of our market risk exposure.
Foreign currency exposure
Translation Risk
Our international sales are usually denominated in foreign currencies. However, the operating expenses of our foreign operations are also primarily denominated in foreign currencies, which partially offset our foreign currency exposure.
A hypothetical 10% strengthening in the U.S. dollar against other currencies would result in the following impact:
| | | | |
| | | Three Months Ended March 31, |
| | | 2018 | | 2017 |
Revenue | | (4)% | | (3)% |
Net Income | | (13)% | | (4)% |
Remeasurement Risk(1)
We have experienced and expect to continue to experience fluctuations in our results of operations as a result of transaction gains or losses related to remeasuring monetary assets and liabilities that are denominated in currencies other than the functional currency of the entities in which they are recorded. We are primarily exposed to changes in foreign currency exchange rates associated with Australian dollar, Euro, and U.S. dollar denominated cash and cash equivalents, accounts receivable, unbilled receivables, and intercompany receivables and payables held by our U.K. subsidiary, a British pound functional entity.
A hypothetical 10% strengthening in the British pound exchange rate in comparison to the Australian dollar, Euro, and U.S. dollar would result in the following impact:
| | | | | | | | |
| | |
| (Dollars in thousands) | | March 31,
2018 | | | December 31,
2017 | |
Foreign currency transaction (loss)/gain | | $ | (8,200) | | | $ | (5,800) | |
| (1) | The adoption of ASC 606 materially increased the unbilled receivables we have recorded, which has increased the impact of fluctuations in foreign exchange rates reported in our unaudited condensed consolidated statements of operations. |
2018. ITEM 4. | CONTROLS AND PROCEDURES |
ITEM 4. CONTROLS AND PROCEDURES
(a) Evaluation of
Disclosure Controlsdisclosure controls and
Proceduresprocedures
Our management, with the participation of our Chief Executive Officer (“CEO”) and Chief Financial Officer (“CFO”), evaluated the effectiveness of our disclosure controls and procedures (as defined in Rules13a-15(e) and15d-15(e) under the Securities Exchange Act of 1934, as amended (“Exchange Act”)) as of March 31, 2018.2019. In designing and evaluating our disclosure controls and procedures, our management recognized that any controls and procedures, no matter how well designed and operated, can provide only reasonable assurance of achieving their objectives, and our management necessarily applied its judgment in evaluating the cost-benefit relationship of possible controls and procedures. Based on this evaluation, our CEO and CFO concluded that our disclosure controls and procedures were effective as of March 31, 2018.2019
. (b) Changes in
Internal Controlinternal control over
Financial Reportingfinancial reporting
There have been no changes in our internal control over financial reporting (as defined in Rules13a-15(f) and15d-15(f) under the Exchange ActAct) during the quarter ended March 31, 20182019 that have materially affected, or are reasonably likely to materially affect, our internal control over financial reporting.
PART II - OTHER INFORMATION
ITEM 1A. RISK FACTORS
We encourage you to carefully consider the risk factors identified in Item 1A. “Risk Factors” of our Annual Report onForm 10-K for the year ended December 31, 2017.2018. These risk factors could materially affect our business, financial condition, and future results and could cause our actual business and financial results to differ materially from those contained in forward-looking statements made in this Quarterly Report on Form10-Q or elsewhere by management from time to time.
There have been no material changes during the three months ended March 31,
20182019 to the risk factors disclosed in our Annual Report on Form
10-K for the year ended December 31,
2017.2018.ITEM 2. | UNREGISTERED SALES OF EQUITY SECURITIES AND USE OF PROCEEDS |
ITEM 2. UNREGISTERED SALES OF EQUITY SECURITIES AND USE OF PROCEEDS
The following table sets forth information regarding our repurchases of our common stock during the three months ended March 31,
2018: | | | | | | | | | | | | |
(in thousands, except per share amounts) | | Total Number
of Shares
Purchased(1) | | Average Price Paid
per
Share(1) | | Total Number of Shares Purchased as Part
of Publicly Announced Share
Repurchase Program | | | | Approximate Dollar
Value of Shares That
May Yet Be Purchased at Period End
Under Publicly Announced Share
Repurchase Programs(2) | |
January 1, 2018 - January 31, 2018 | | 58 | | $ 49.63 | | 21 | | | | $ | 33,855 | |
February 1, 2018 - February 28, 2018 | | 68 | | 55.06 | | 17 | | | | | 32,985 | |
March 1, 2018 - March 31, 2018 | | 435 | | 59.37 | | 63 | | | | | 29,204 | |
| | | | | | | | | | | | |
Total | | 561 | | 57.84 | | | | | | | | |
| | | | | | | | | | | | |
|
| | | | | | | | | | | | | |
| (in thousands, except per share amounts) | Total Number of Shares Purchased (1) | | Average Price Paid per Share (1) | | Total Number of Shares Purchased as Part of Publicly Announced Share Repurchase Program | | Approximate Dollar Value of Shares That May Yet Be Purchased at Period End Under Publicly Announced Share Repurchase Programs (2) |
| January 1, 2019 - January 31, 2019 | 153 |
| | $ | 51.30 |
| | 129 |
| | $ | 18 |
|
| February 1, 2019 - February 28, 2019 | 129 |
| | $ | 63.81 |
| | — |
| | $ | 18 |
|
| March 1, 2019 - March 31, 2019 | 285 |
| | $ | 64.97 |
| | 15 |
| | $ | 59,034 |
|
| 567 |
| | $ | 61.03 |
| | | | |
(1) Shares withheld to cover the option exercise price and tax withholding obligations under the net settlement provisions of our stock compensation awards have been included in these amounts.
(2) On March 15, 2019, we announced that our Board of Directors extended the expiration date of the current stock repurchase program to June 30, 2020 and increased the amount of common stock we are authorized to repurchase by $60 million between March 15, 2019 and June 30, 2020 (the “Current Program”). Under the Current Program, purchases may be made from time to time on the open market or in privately negotiated transactions. Shares may be repurchased in such amounts as market conditions warrant, subject to regulatory and other considerations. We have established a pre-arranged stock repurchase plan, intended to comply with the requirements of Rule 10b5-1 under the Exchange Act, and Rule 10b-18 under the Exchange Act (the “10b5-1 Plan”). All stock repurchases under the Current Program during closed trading window periods will be made pursuant to the 10b5-1 Plan.
| (1) | Shares withheld to cover the option exercise price and statutory tax withholding obligations under the net settlement provisions of our stock compensation awards have been included in these amounts. |
| (2) | Since 2004, our Board of Directors has approved stock repurchase programs that have authorized the repurchase, in the aggregate, of up to $195 million of our common stock. On May 30, 2017, we announced that our Board of Directors extended the expiration date of the current stock repurchase program to June 30, 2018 (the “Current Program”). Under the Current Program, purchases may be made from time to time on the open market or in privately negotiated transactions. Shares may be repurchased in such amounts as market conditions warrant, subject to regulatory and other considerations. We have established apre-arranged stock repurchase plan, intended to comply with the requirements of Rule10b5-1 under the Exchange Act, and Rule10b-18 under the Exchange Act (the“10b5-1 Plan”). All stock repurchases under the Current Program during closed trading window periods will be made pursuant to the10b5-1 Plan. |
+ Indicates that the exhibit is being furnished with this report and is not filed as a part of it.
++Management contracts and compensatory plan or arrangements
Pursuant to the requirements of the Securities Exchange Act of 1934, the Registrant has duly caused this report to be signed on its behalf by the undersigned thereunto duly authorized.
| | | | | | |
| | | | Pegasystems Inc. |
| | | |
Dated: May 10, 2018 | | Pegasystems Inc. |
| | By: |
| Dated: | May 7, 2019 | By: | /s/ KENNETH STILLWELL |
| | | | | | Kenneth Stillwell |
| | | | | | Chief Financial Officer and Chief Administrative Officer |
| | | | | | (Principal Financial Officer) |
30