UNITED STATES

SECURITIES AND EXCHANGE COMMISSION

WASHINGTON, D.C. 20549

FORM10-Q

(Mark One)

QUARTERLY REPORT PURSUANT TO SECTION 13 OR 15(d) OF THE SECURITIES EXCHANGE ACT OF 1934 FOR THE QUARTERLY PERIOD ENDED JUNE 30, 2018MARCH 31, 2019

OR

TRANSITION REPORT PURSUANT TO SECTION 13 OR 15(d) OF THE SECURITIES EXCHANGE ACT OF 1934 FOR THE TRANSITION PERIOD FROMTO

Commission File Number:001-33551


LOGOLOGO

The Blackstone Group L.P.

(Exact name of Registrant as specified in its charter)


Delaware

20-8875684

(State or other jurisdiction of

incorporation or organization)


20-8875684

(I.R.S. Employer

Identification No.)

345 Park Avenue

New York, New York 10154

(Address of principal executive offices)(Zip Code)

(212)583-5000

(Registrant’s telephone number, including area code)


Indicate by check mark whether the Registrant (1) has filed all reports required to be filed by Section 13 or 15(d) of the Securities Exchange Act of 1934 during the preceding 12 months (or for such shorter period that the Registrant was required to file such reports), and (2) has been subject to such filing requirements for the past 90 days.                    Yes No

Indicate by check mark whether the registrant has submitted electronically and posted on its corporate Web site, if any, every Interactive Data File required to be submitted and posted pursuant to Rule 405 of RegulationS-T (§232.405 of this chapter) during the preceding 12 months (or for such shorter period that the registrant was required to submit and post such files).                                                                                         Yes No

Indicate by check mark whether the Registrant is a large accelerated filer, an accelerated filer, anon-accelerated filer, a smaller reporting company, or an emerging growth company. See the definitions of “large accelerated filer,” “accelerated filer,” “smaller reporting company,” and “emerging growth company” in Rule12b-2 of the Exchange Act.


Large accelerated filer

  Accelerated filer

Non-accelerated filer

  Smaller reporting company 

(Do not check if a smaller reporting company)

  Emerging growth company

If an emerging growth company, indicate by check mark if the registrant has elected not to use the extended transition period for complying with any new or revised financial accounting standards provided pursuant to Section 13(a) of the Exchange Act.

Indicate by check mark whether the Registrant is a shell company (as defined in Rule12b-2 of the Exchange Act). Yes No

Securities registered pursuant to Section 12(b) of the Act:

    Title of each class    

    Trading Symbol(s)    

    Name of each exchange on which registered    
    Common units representing limited partner interests    

BX

    New York Stock Exchange    

The number of the Registrant’s voting common units representing limited partner interests outstanding as of August 2, 2018May 3, 2019 was 667,149,651.658,866,467.


TABLE OF CONTENTSTable of Contents


      Page 

PARTPart I.


FINANCIAL INFORMATIONFinancial Information


ITEMItem 1.

  Financial Statements5
Unaudited Condensed Consolidated Financial Statements—March 31, 2019 and 2018:

FINANCIAL STATEMENTSCondensed Consolidated Statements of Financial Condition as of March  31, 2019 and December 31, 2018

   5 
  

Unaudited Condensed Consolidated Financial Statements — June 30, 2018 and 2017:

Condensed Consolidated Statements of Financial Condition as of June 30, 2018 and December  31, 2017

5

Condensed Consolidated Statements of Operations for the Three and Six Months Ended June  30,March 31, 2019 and 2018 and 2017

   7 
  

Condensed Consolidated Statements of Comprehensive Income for the Three and Six Months Ended June  30,March 31, 2019 and 2018 and 2017

   8 
  

Condensed Consolidated Statements of Changes in Partners’ Capital for the SixThree Months Ended June 30,March 31, 2019 and 2018 and 2017

   9 
  

Condensed Consolidated Statements of Cash Flows for the SixThree Months Ended June 30,March 31, 2019 and 2018 and 2017

   11 
  

Notes to Condensed Consolidated Financial Statements

   1413 

ITEMItem 1A.


UNAUDITED SUPPLEMENTAL PRESENTATION OF STATEMENTS OF FINANCIAL CONDITIONUnaudited Supplemental Presentation of Statements of Financial Condition

   6561 

ITEMItem 2.


MANAGEMENT’S DISCUSSION AND ANALYSIS OF FINANCIAL CONDITION AND RESULTS OF OPERATIONSManagement’s Discussion and Analysis of Financial Condition and Results of Operations

   6763 

ITEMItem 3.


QUANTITATIVE AND QUALITATIVE DISCLOSURES ABOUT MARKET RISKQuantitative and Qualitative Disclosures About Market Risk

   137120 

ITEMItem 4.


CONTROLS AND PROCEDURESControls and Procedures

   141124 

PARTPart II.


OTHER INFORMATIONOther Information


ITEMItem 1.


LEGAL PROCEEDINGSLegal Proceedings

   142125 

ITEMItem 1A.


RISK FACTORSRisk Factors

   142126 

ITEMItem 2.


UNREGISTERED SALES OF EQUITY SECURITIES AND USE OF PROCEEDSUnregistered Sales of Equity Securities and Use of Proceeds

   142127 

ITEMItem 3.


DEFAULTS UPON SENIOR SECURITIESDefaults Upon Senior Securities

   143128 

ITEMItem 4.


MINE SAFETY DISCLOSURESMine Safety Disclosures

   143128 

ITEMItem 5.


OTHER INFORMATIONOther Information

   143128 

ITEMItem 6.


EXHIBITSExhibits

   143128 

SIGNATURESSignatures

   145130 

Forward-Looking Statements

This report may contain forward-looking statements within the meaning of Section 27A of the Securities Act of 1933 and Section 21E of the Securities Exchange Act of 1934 which reflect our current views with respect to, among other things, our operations, taxes, earnings and financial performance, and unitshare repurchases and distribution activities.distributions. You can identify these forward-looking statements by the use of words such as “outlook,” “indicator,” “believes,” “expects,” “potential,” “continues,” “may,” “will,” “should,” “seeks,” “approximately,” “predicts,” “intends,” “plans,” “estimates,” “anticipates” or the negative version of these words or other comparable words. Such forward-looking statements are subject to various risks and uncertainties. Accordingly, there are or will be important factors that could cause actual outcomes or results to differ materially from those indicated in these statements. We believe these factors include but are not limited to those described under the section entitled “Risk Factors” in our Annual Report onForm10-K for the year ended December 31, 20172018 and in this report, as such factors may be updated from time to time in our periodic filings with the United States Securities and Exchange Commission (“SEC”), which are accessible on the SEC’s website at www.sec.gov. These factors should not be construed as exhaustive and should be read in conjunction with the other cautionary statements that are included in this report and in our other periodic filings. The forward-looking statements speak only as of the date of this report, and we undertake no obligation to publicly update or review any forward-looking statement, whether as a result of new information, future developments or otherwise.

Website and Social Media Disclosure

We use our website (www.blackstone.com), Facebook page (www.facebook.com/blackstone), Twitter (www.twitter.com/blackstone), LinkedIn (www.linkedin.com/company/blackstonegroup), Instagram (www.instagram.com/blackstone), SoundCloud (www.soundcloud.com/blackstone-300250613), PodBean (www.blackstone.podbean.com), Spotify (https://open.spotify.com/show/1PqaIgd12KgRN8rlijBhE7) and YouTube (www.youtube.com/user/blackstonegroup) accounts as channels of distribution of company information. The information we post through these channels may be deemed material. Accordingly, investors should monitor these channels, in addition to following our press releases, SEC filings and public conference calls and webcasts. In addition, you may automatically receivee-mail email alerts and other information about Blackstone when you enroll youre-mail email address by visiting the “Contact Us/Email Alerts” section of our website at http://ir.blackstone.com. The contents of our website, any alerts and social media channels are not, however, a part of this report.


In this report, references to “Blackstone,” the “Partnership,” “we,” “us” or “our” refer to The Blackstone Group L.P. and its consolidated subsidiaries. Unless the context otherwise requires, references in this report to the ownership of Mr. Stephen A. Schwarzman, our founder, and other Blackstone personnel include the ownership of personal planning vehicles and family members of these individuals.

On April 18, 2019, we announced our decision to convert (the “Conversion”) The Blackstone Group L.P. from a Delaware limited partnership to a Delaware corporation named The Blackstone Group Inc. (the “Corporation”). See “Part I. Item 2. Management’s Discussion and Analysis of Financial Condition and Results of Operations – Conversion to a Corporation.”

“Blackstone Funds,” “our funds” and “our investment funds” refer to the private equity funds, real estate funds, funds of hedge funds, hedge funds, credit-focused funds, collateralized loan obligationobligations (“CLO”), real estate investment trusts and registered investment companies that are managed by Blackstone. “Our carry funds” refers to the private equity funds, real estate funds and certain of the hedge fund solutions and credit-focused funds (with multi-year drawdown, commitment-based structures that only pay carry on the realization of an investment) that are managed by Blackstone. We refer to our general corporate private equity funds as Blackstone Capital Partners (“BCP”) funds, ourenergy-focused private equity funds as Blackstone Energy Partners (“BEP”) funds, our core private equity fund as Blackstone Core Equity Partners (“BCEP”), our opportunistic investment platform that invests globally across asset classes, industries and geographies as Blackstone Tactical Opportunities (“Tactical Opportunities”), our secondary private equity fund of funds business as Strategic Partners Fund Solutions (“Strategic Partners”),

our infrastructure-focused funds as Blackstone Infrastructure Partners (“BIP”), our life sciences private investment platform, Blackstone Life Sciences (“BXLS”), our multi-asset investment program for eligible high net worth investors offering exposure to certain of our key illiquid investment strategies through a single commitment as Blackstone Total Alternatives Solution (“BTAS”) and our capital markets services business as Blackstone Capital Markets (“BXCM”). We refer to our real estate opportunistic funds as Blackstone Real Estate

Partners (“BREP”) funds and our real estate debt investment funds as Blackstone Real Estate Debt Strategies (“BREDS”) funds. We refer to our core+ real estate funds, which target substantially stabilized assets in prime markets, as Blackstone Property Partners (“BPP”) funds. We refer to our real estate investment trusts as “REITs”, to Blackstone Mortgage Trust, Inc., ourNYSE-listed REIT, as “BXMT”, and to Blackstone Real Estate Income Trust, Inc., ournon-exchange traded REIT, as “BREIT”. “Our hedge funds” refers to our funds of hedge funds, hedge funds, certain of our real estate debt investment funds, including a registered investment company, and certain other credit-focused funds which are managed by Blackstone. “BIS” refers to Blackstone Insurance Solutions, which partners with insurers to deliver bespoke, capital-efficientcapital efficient investments tailored to each insurer’s needs and risk profile.

“Assets Under Management” refers to the assets we manage. Our Assets Under Management equals the sum of:


 (a)

the fair value of the investments held by our carry funds and ourside-by-side andco-investment entities managed by us, plus (1) the capital that we are entitled to call from investors in those funds and entities pursuant to the terms of their respective capital commitments, including capital commitments to funds that have yet to commence their investment periods, or (2) for certain credit-orientedcredit-focused funds the amounts available to be borrowed under asset based credit facilities,


 (b)

the net asset value of (1) our hedge funds and real estate debt carry funds, open ended core+ real estate fund,BPP, certainco-investments managed by us, and our Hedge Fund Solutions and certain credit-focused carry and drawdown funds (plus, in each case, the capital that we are entitled to call from investors in those funds, including commitments yet to commence their investment periods), and (2) our funds of hedge funds, our Hedge Fund Solutions registered investment companies, and ournon-exchange traded REIT,BREIT,


 (c)

the invested capital, fair value or net asset value of assets we manage pursuant to separately managed accounts,


 (d)

the amount of debt and equity outstanding for our CLOs during the reinvestment period,


 (e)

the aggregate par amount of collateral assets, including principal cash, for our CLOs after the reinvestment period,


 (f)

the gross or net amount of assets (including leverage where applicable) for our credit-focused registered investment companies, and


 (g)

the fair value of common stock, preferred stock, convertible debt, or similar instruments issued by BXMT.

Our carry funds are commitment-based drawdown structured funds that do not permit investors to redeem their interests at their election. Our funds of hedge funds, hedge funds, funds structured like hedge funds and other open ended funds in our Hedge Fund Solutions, Credit and Real Estate segments generally have structures that afford an investor the right to withdraw or redeem their interests on a periodic basis (for example, annually or quarterly), typically with 30 to 95 days’ notice, depending on the fund and the liquidity profile of the underlying assets. Investment advisory agreements related to certain separately managed accounts in our Hedge Fund Solutions and Credit segments, excluding our BIS separately managed accounts, may generally be terminated by an investor on 30 to 90 days’ notice.

“Fee-Earning Assets Under Management” refers to the assets we manage on which we derive management fees and/or performance revenues. OurFee-Earning Assets Under Management equals the sum of:

 (a)

for our Private Equity segment funds and Real Estate segment carry funds, including certain real estate debt investment fundsBREDS and certain of our Hedge Fund Solutions funds, the amount of capital commitments, remaining invested capital, fair value, net asset value or par value of assets held, depending on the fee terms of the fund,


 (b)

for our credit-focused carry funds, the amount of remaining invested capital (which may include leverage) or net asset value, depending on the fee terms of the fund,

 (c)

the remaining invested capital or fair value of assets held inco-investment vehicles managed by us on which we receive fees,


 (d)

the net asset value of our funds of hedge funds, hedge funds, open ended core+ real estate fund,BPP, certainco-investments managed by us, certain registered investment companies, ournon-exchange traded REIT,BREIT, and certain of our Hedge Fund Solutions drawdown funds,


 (e)

the invested capital, fair value of assets or the net asset value we manage pursuant to separately managed accounts,


 (f)

the net proceeds received from equity offerings and accumulated core earnings of BXMT, subject to certain adjustments,


 (g)

the aggregate par amount of collateral assets, including principal cash, of our CLOs, and


 (h)

the gross amount of assets (including leverage) or the net assets (plus leverage where applicable) for certain of our credit-focused registered investment companies.

Each of our segments may include certainFee-Earning Assets Under Management on which we earn performance revenues but not management fees.

Our calculations of assets under management andfee-earning assets under management may differ from the calculations of other asset managers, and as a result this measure may not be comparable to similar measures presented by other asset managers. In addition, our calculation of assets under management includes commitments to, and the fair value of, invested capital in our funds from Blackstone and our personnel, regardless of whether such commitments or invested capital are subject to fees. Our definitions of assets under management andfee-earning assets under management are not based on any definition of assets under management andfee-earning assets under management that is set forth in the agreements governing the investment funds that we manage.

For our carry funds, total assets under management includes the fair value of the investments held, whereasfee-earning assets under management includes the amount of capital commitments, the remaining amount of invested capital at cost depending on whether the investment period has or has not expired or the fee terms of the fund. As such,fee-earning assets under management may be greater than total assets under management when the aggregate fair value of the remaining investments is less than the cost of those investments.

“Perpetual Capital” refers to the component of assets under management with an indefinite term, that is not in liquidation, and for which there is no requirement to return capital to investors through redemption requests in the ordinary course of business, except where funded by new capital inflows. Perpetual Capital includesco-investment capital with an investor right to convert into Perpetual Capital.

This report does not constitute an offer of any Blackstone Fund.

PARTPart I.    FINANCIAL INFORMATIONFinancial Information


ITEMItem 1.

FINANCIAL STATEMENTSFinancial Statements

THE BLACKSTONE GROUPThe Blackstone Group L.P.

Condensed Consolidated Statements of Financial Condition (Unaudited)

(Dollars in Thousands, Except Unit Data)

   June 30,
2018
  December 31,
2017
 

Assets


Cash and Cash Equivalents

  $1,710,251  $1,992,497 

Cash Held by Blackstone Funds and Other

   288,675   1,929,531 

Investments (including assets pledged of $217,832 and $169,746 at June 30, 2018 and December 31, 2017, respectively)

   22,008,182   24,434,049 

Accounts Receivable

   917,717   875,018 

Due from Affiliates

   2,015,949   2,028,137 

Intangible Assets, Net

   380,844   409,828 

Goodwill

   1,778,192   1,778,192 

Other Assets

   252,936   242,697 

Deferred Tax Assets

   722,551   725,970 


Total Assets

  $30,075,297  $34,415,919 


Liabilities and Partners’ Capital


Loans Payable

  $10,195,403  $14,815,436 

Due to Affiliates

   967,250   937,158 

Accrued Compensation and Benefits

   2,987,977   2,623,492 

Securities Sold, Not Yet Purchased

   155,780   154,380 

Repurchase Agreements

   182,489   118,840 

Accounts Payable, Accrued Expenses and Other Liabilities

   950,802   2,043,522 


Total Liabilities

   15,439,701   20,692,828 


Commitments and Contingencies


RedeemableNon-Controlling Interests in Consolidated Entities

   158,799   210,944 


Partners’ Capital


The Blackstone Group L.P. Partners’ Capital


Partners’ Capital (common units: 673,544,082 issued and outstanding as of June 30, 2018; 659,526,093 issued and outstanding as of December 31, 2017)

   7,105,225   6,668,511 

Accumulated Other Comprehensive Loss

   (57,876  (34,018


Total The Blackstone Group L.P. Partners’ Capital

   7,047,349   6,634,493 

Non-Controlling Interests in Consolidated Entities

   3,492,621   3,253,148 

Non-Controlling Interests in Blackstone Holdings

   3,936,827   3,624,506 


Total Partners’ Capital

   14,476,797   13,512,147 


Total Liabilities and Partners’ Capital

  $30,075,297  $34,415,919 


   March 31, December 31,
   2019 2018

Assets


Cash and Cash Equivalents

   $1,570,741   $2,207,841 

Cash Held by Blackstone Funds and Other

   217,625   337,320 

Investments (including assets pledged of $275,707 and $279,502 at March 31, 2019 and December 31, 2018, respectively)

   21,180,950   20,377,031 

Accounts Receivable

   711,889   636,238 

Due from Affiliates

   2,320,291   1,994,123 

Intangible Assets, Net

   450,757   468,507 

Goodwill

   1,869,860   1,869,860 

Other Assets

   302,033   294,248 

Right-of-Use Assets

   521,932    

Deferred Tax Assets

   728,873   739,482 


Total Assets

   $29,874,951   $28,924,650 


Liabilities and Partners’ Capital


Loans Payable

   $10,011,155   $9,951,862 

Due to Affiliates

   1,045,452   1,035,776 

Accrued Compensation and Benefits

   3,001,597   2,942,128 

Securities Sold, Not Yet Purchased

   128,106   142,617 

Repurchase Agreements

   218,865   222,202 

Operating Lease Liabilities

   587,408    

Accounts Payable, Accrued Expenses and Other Liabilities

   735,667   875,979 


Total Liabilities

   15,728,250   15,170,564 


Commitments and Contingencies


RedeemableNon-Controlling Interests in Consolidated Entities

   136,941   141,779 


Partners’ Capital


The Blackstone Group L.P. Partners’ Capital


Partners’ Capital (common units: 665,331,887 issued and outstanding as of March 31, 2019; 663,212,830 issued and outstanding as of December 31, 2018)

   6,501,072   6,415,700 

Accumulated Other Comprehensive Loss

   (32,430  (36,476


Total The Blackstone Group L.P. Partners’ Capital

   6,468,642   6,379,224 

Non-Controlling Interests in Consolidated Entities

   3,852,346   3,648,766 

Non-Controlling Interests in Blackstone Holdings

   3,688,772   3,584,317 


Total Partners’ Capital

   14,009,760   13,612,307 


Total Liabilities and Partners’ Capital

   $29,874,951   $28,924,650 


continued…

continued...

See notes to condensed consolidated financial statements.

The Blackstone Group L.P.

THE BLACKSTONE GROUP L.P.

Condensed Consolidated Statements of Financial Condition (Unaudited)

(Dollars in Thousands)

The following presents the portion of the consolidated balances presented above attributable to consolidated Blackstone Funds which are variable interest entities. The following assets may only be used to settle obligations of these consolidated Blackstone Funds and these liabilities are only the obligations of these consolidated Blackstone Funds and they do not have recourse to the general credit of Blackstone.


  March 31,  December 31,
  June 30,
2018
   December 31,
2017
   2019  2018

Assets


Cash Held by Blackstone Funds

  $286,045   $1,580,296 

Cash Held by Blackstone Funds and Other

   $217,625    $337,030 

Investments

   8,601,714    12,948,653    8,591,469    8,363,669 

Accounts Receivable

   340,307    470,156    307,224    179,863 

Due from Affiliates

   24,360    46,112    6,495    6,303 

Other Assets

   3,141    5,189    990    3,880 


Total Assets

  $9,255,567   $15,050,406    $9,123,803    $8,890,745 


Liabilities


Loans Payable

  $6,707,045   $11,300,621    $6,561,111    $6,480,711 

Due to Affiliates

   100,306    86,393    171,826    129,370 

Securities Sold, Not Yet Purchased

   111,162    89,907    82,412    92,603 

Repurchase Agreements

   182,489    118,840    218,865    222,202 

Accounts Payable, Accrued Expenses and Other Liabilities

   396,224    1,562,534    288,275    252,176 


Total Liabilities

  $7,497,226   $13,158,295    $7,322,489    $7,177,062 


See notes to condensed consolidated financial statements.

THE BLACKSTONE GROUPThe Blackstone Group L.P.

Condensed Consolidated Statements of Operations (Unaudited)

(Dollars in Thousands, Except Unit and Per Unit Data)


  Three Months Ended
June 30,
  Six Months Ended
June 30,
 
  2018  2017  2018  2017 

Revenues


Management and Advisory Fees, Net

 $721,384  $690,857  $1,450,233  $1,336,341 


Incentive Fees

  19,378   40,303   31,944   86,814 


Investment Income (Loss)


Performance Allocations


Realized

  503,376   602,662   773,016   1,714,567 

Unrealized

  440,351   95,532   1,068,440   (29,089

Principal Investments


Realized

  129,197   125,058   171,342   376,402 

Unrealized

  103,468   7,275   215,242   (32,913


Total Investment Income

  1,176,392   830,527   2,228,040   2,028,967 


Interest and Dividend Revenue

  40,073   33,703   75,458   62,198 

Other

  675,343   (59,664  616,026   (63,876


Total Revenues

  2,632,570   1,535,726   4,401,701   3,450,444 


Expenses


Compensation and Benefits


Compensation

  427,479   367,203   816,882   718,792 

Incentive Fee Compensation

  9,743   21,032   16,405   43,497 

Performance Allocations Compensation


Realized

  186,398   195,738   298,460   562,216 

Unrealized

  189,991   86,910   444,426   94,443 


Total Compensation and Benefits

  813,611   670,883   1,576,173   1,418,948 

General, Administrative and Other

  145,828   119,552   272,541   228,938 

Interest Expense

  39,320   41,089   77,991   81,335 

Fund Expenses

  17,622   49,669   72,607   73,745 


Total Expenses

  1,016,381   881,193   1,999,312   1,802,966 


Other Income


Net Gains from Fund Investment Activities

  73,519   110,054   184,118   176,186 


Income Before Provision for Taxes

  1,689,708   764,587   2,586,507   1,823,664 

Provision for Taxes

  138,731   29,608   193,226   87,045 


Net Income

  1,550,977   734,979   2,393,281   1,736,619 

Net Income (Loss) Attributable to RedeemableNon-Controlling Interests in Consolidated Entities

  905   991   (370  2,991 

Net Income Attributable toNon-Controlling Interests in Consolidated Entities

  129,078   112,944   284,577   251,629 

Net Income Attributable toNon-Controlling Interests in Blackstone Holdings

  678,952   283,637   999,160   692,683 


Net Income Attributable to The Blackstone Group L.P.

 $742,042  $337,407  $1,109,914  $789,316 


Net Income Per Common Unit


Common Units, Basic

 $1.09  $0.51  $1.64  $1.19 


Common Units, Diluted

 $1.09  $0.50  $1.63  $1.18 


Weighted-Average Common Units Outstanding


Common Units, Basic

  681,794,492   664,681,299   678,156,936   662,820,839 


Common Units, Diluted

  682,010,610   1,200,006,339   1,210,727,948   1,199,756,390 


Distributions Declared Per Common Unit

 $0.35  $0.87  $1.20  $1.34 


   Three Months Ended
   March 31,
   2019  2018

Revenues


Management and Advisory Fees, Net

   $809,726    $728,849 


Incentive Fees

   12,132    12,566 


Investment Income


Performance Allocations


Realized

   242,375    269,640 

Unrealized

   663,999    628,089 

Principal Investments


Realized

   73,261    42,145 

Unrealized

   169,044    111,774 


Total Investment Income

   1,148,679    1,051,648 


Interest and Dividend Revenue

   44,084    35,385 

Other

   10,250    (59,317


Total Revenues

   2,024,871    1,769,131 


Expenses


Compensation and Benefits


Compensation

   471,397    389,403 

Incentive Fee Compensation

   5,406    6,662 

Performance Allocations Compensation


Realized

   86,395    112,062 

Unrealized

   287,015    254,435 


Total Compensation and Benefits

   850,213    762,562 

General, Administrative and Other

   146,062    126,713 

Interest Expense

   42,002    38,671 

Fund Expenses

   2,887    54,985 


Total Expenses

   1,041,164    982,931 


Other Income


Net Gains from Fund Investment Activities

   130,325    110,599 


Income Before Provision for Taxes

   1,114,032    896,799 

Provision for Taxes

   41,155    54,495 


Net Income

   1,072,877    842,304 

Net Income (Loss) Attributable to RedeemableNon-Controlling Interests in Consolidated Entities

   2,480    (1,275

Net Income Attributable toNon-Controlling Interests in Consolidated Entities

   186,833    155,499 

Net Income Attributable toNon-Controlling Interests in Blackstone Holdings

   402,260    320,208 


Net Income Attributable to The Blackstone Group L.P.

   $481,304    $367,872 


Net Income Per Common Unit


Common Units, Basic

   $0.71    $0.55 


Common Units, Diluted

   $0.71    $0.53 


Weighted-Average Common Units Outstanding


Common Units, Basic

   674,507,698    674,479,140 


Common Units, Diluted

   1,200,480,240    1,210,573,854 


See notes to condensed consolidated financial statements.

THE BLACKSTONE GROUPThe Blackstone Group L.P.

Condensed Consolidated Statements of Comprehensive Income (Unaudited)

(Dollars in Thousands)


   Three Months Ended
June 30,
   Six Months Ended
June 30,
 
   2018  2017   2018  2017 

Net Income

  $1,550,977  $734,979   $2,393,281  $1,736,619 

Other Comprehensive Income (Loss), Net of Tax — Currency Translation Adjustment

   (30,674  35,089    (26,248  46,593 


Comprehensive Income

   1,520,303   770,068    2,367,033   1,783,212 

Less:


Comprehensive Income (Loss) Attributable to RedeemableNon-Controlling Interests in Consolidated Entities

   905   991    (370  2,991 

Comprehensive Income Attributable toNon-Controlling Interests in Consolidated Entities

   129,077   140,311    282,187   282,814 

Comprehensive Income Attributable toNon-Controlling Interests in Blackstone Holdings

   678,952   283,637    999,160   692,683 


Comprehensive Income Attributable to The Blackstone Group L.P.

  $711,369  $345,129   $1,086,056  $804,724 


   Three Months Ended
   March 31,
   2019  2018

Net Income

   $1,072,877    $842,304 

Other Comprehensive Income, Net of Tax - Currency Translation Adjustment

   7,183    4,426 


Comprehensive Income

   1,080,060    846,730 

Less:


Comprehensive Income (Loss) Attributable to RedeemableNon-Controlling Interests in Consolidated Entities

   2,480    (1,275

Comprehensive Income Attributable toNon-Controlling Interests in Consolidated Entities

   186,833    153,110 

Comprehensive Income Attributable toNon-Controlling Interests in Blackstone Holdings

   405,397    320,208 


Comprehensive Income Attributable to The Blackstone Group L.P.

   $485,350    $374,687 


See notes to condensed consolidated financial statements.

THE BLACKSTONE GROUPThe Blackstone Group L.P.

Condensed Consolidated Statements of Changes in Partners’ Capital (Unaudited)

(Dollars in Thousands, Except Unit Data)

     The Blackstone Group L.P.             
  Common
Units
  Partners’
Capital
  Accumulated
Other
Compre-
hensive
Income
(Loss)
  Total  Non-
Controlling
Interests in
Consolidated
Entities
  Non-
Controlling
Interests in
Blackstone
Holdings
  Total
Partners’
Capital
  Redeemable
Non-
Controlling
Interests in
Consolidated
Entities
 

Balance at December 31, 2017

  659,526,093  $6,668,511  $(34,018 $6,634,493  $3,253,148  $3,624,506  $13,512,147  $210,944 

Transfer Out Due to Deconsolidation of Fund Entities

  —     —     —     —     (197,091  —     (197,091  —   

Net Income (Loss)

  —     1,109,914   —     1,109,914   284,577   999,160   2,393,651   (370

Currency Translation Adjustment

  —     —     (23,858  (23,858  (2,390  —     (26,248  —   

Capital Contributions

  —     —     —     —     424,132   —     424,132   1,100 

Capital Distributions

  —     (806,770  —     (806,770  (291,963  (682,564  (1,781,297  (52,875

Transfer ofNon-Controlling Interests in Consolidated Entities

  —     —     —     —     22,208   —     22,208   —   

Deferred Tax Effects Resulting from Acquisition of Ownership Interests fromNon-Controlling Interest Holders

  —     10,922   —     10,922   —     —     10,922   —   

Equity-Based Compensation

  —     100,519   —     100,519   —     79,900   180,419   —   

Net Delivery of Vested Blackstone Holdings Partnership Units and Blackstone Common Units

  3,032,372   (14,496  —     (14,496  —     (835  (15,331  —   

Repurchase of Common Units and Blackstone Holdings Partnership Units

  (2,200,000  (71,685  —     (71,685  —     —     (71,685  —   

Change in The Blackstone Group L.P.’s Ownership Interest

  —     835   —     835   —     (835  —     —   

Conversion of Blackstone Holdings Partnership Units to Blackstone Common Units

  12,434,878   82,505   —     82,505   —     (82,505  —     —   

Issuance of Common Units

  750,739   24,970   —     24,970   —     —     24,970   —   


Balance at June 30, 2018

  673,544,082  $7,105,225  $(57,876 $7,047,349  $3,492,621  $3,936,827  $14,476,797  $158,799 


     The Blackstone Group L.P.        
       Accumulated         Redeemable
       Other   Non- Non-   Non-
       Compre-   Controlling Controlling   Controlling
       hensive   Interests in Interests in Total Interests in
   Common Partners’ Income   Consolidated Blackstone Partners’ Consolidated
   Units Capital (Loss) Total Entities Holdings Capital Entities

Balance at December 31, 2018

   663,212,830   $6,415,700   $(36,476  $6,379,224   $3,648,766   $3,584,317   $13,612,307   $141,779 

Net Income

      481,304      481,304   186,833   402,260   1,070,397   2,480 

Currency Translation Adjustment

         4,046   4,046      3,137   7,183    

Capital Contributions

               159,505      159,505    

Capital Distributions

      (390,263     (390,263  (141,498  (340,046  (871,807  (7,318

Transfer ofNon-Controlling Interests in Consolidated Entities

               (1,260     (1,260   

Deferred Tax Effects Resulting from Acquisition of Ownership Interests fromNon-Controlling Interest Holders

      2,167      2,167         2,167    

Equity-Based Compensation

      51,859      51,859      40,812   92,671    

Net Delivery of Vested Blackstone Holdings Partnership Units and Blackstone Common Units

   1,812,474   (9,251     (9,251     (3  (9,254   

Repurchase of Common Units and Blackstone Holdings Partnership Units

   (1,544,115  (52,149     (52,149        (52,149   

Change in The Blackstone Group L.P.’s Ownership Interest

      (10,965     (10,965     10,965       

Conversion of Blackstone Holdings Partnership Units to Blackstone Common Units

   1,850,698   12,670      12,670      (12,670      


Balance at March 31, 2019

   665,331,887   $6,501,072   $(32,430  $6,468,642   $3,852,346   $3,688,772   $14,009,760   $136,941 


continued…

continued...

See notes to condensed consolidated financial statements.

The Blackstone Group L.P.

THE BLACKSTONE GROUP L.P.

Condensed Consolidated Statements of Changes in Partners’ Capital (Unaudited)

(Dollars in Thousands, Except Unit Data)


     The Blackstone Group L.P.             
  Common
Units
  Partners’
Capital
  Accumulated
Other
Compre-
hensive
Income
(Loss)
  Total  Non-
Controlling
Interests in
Consolidated
Entities
  Non-
Controlling
Interests in
Blackstone
Holdings
  Total
Partners’
Capital
  Redeemable
Non-
Controlling
Interests in
Consolidated
Entities
 

Balance at December 31, 2016

  643,459,542  $6,521,531  $(62,887 $6,458,644  $2,428,964  $3,434,483  $12,322,091  $185,390 

Net Income

  —     789,316   —     789,316   251,629   692,683   1,733,628   2,991 

Currency Translation Adjustment

  —     —     15,408   15,408   31,185   —     46,593   —   

Consolidation of a Fund Entity

  —     —     —     —     387,006   —     387,006   —   

Capital Contributions

  —     (147  —     (147  375,308   —     375,161   21,353 

Capital Distributions

  —     (882,742  —     (882,742  (348,513  (754,398  (1,985,653  (19,034

Transfer ofNon-Controlling Interests in Consolidated Entities

  —     —     —     —     (2,408  —     (2,408  —   

Deferred Tax Effects Resulting from Acquisition of Ownership Interests fromNon-Controlling Interest Holders

  —     7,286   —     7,286   —     —     7,286   —   

Equity-Based Compensation

  —     87,964   —     87,964   —     72,561   160,525   —   

Net Delivery of Vested Blackstone Holdings Partnership Units and Blackstone Common Units

  3,775,544   (12,429  —     (12,429  —     (790  (13,219  —   

Change in The Blackstone Group L.P.’s Ownership Interest

  —     (13,821  —     (13,821  —     13,821   —     —   

Conversion of Blackstone Holdings Partnership Units to Blackstone Common Units

  6,566,308   43,520   —     43,520   —     (43,520  —     —   


Balance at June 30, 2017

  653,801,394  $6,540,478  $(47,479 $6,492,999  $3,123,171  $3,414,840  $13,031,010  $190,700 


      The Blackstone Group L.P.        
        Accumulated         Redeemable
        Other   Non- Non-   Non-
        Compre-   Controlling Controlling   Controlling
        hensive   Interests in Interests in Total Interests in
   Common  Partners’ Income   Consolidated Blackstone Partners’ Consolidated
   Units  Capital (Loss) Total Entities Holdings Capital Entities

Balance at December 31, 2017

   659,526,093   $6,668,511   $(34,018  $6,634,493   $3,253,148   $3,624,506   $13,512,147   $210,944 

Transfer Out Due to Deconsolidation of Fund Entities

                (197,091     (197,091   

Net Income (Loss)

       367,872      367,872   155,499   320,208   843,579   (1,275

Currency Translation Adjustment

          6,815   6,815   (2,389     4,426    

Capital Contributions

                223,509      223,509   1,100 

Capital Distributions

       (570,570     (570,570  (121,711  (492,159  (1,184,440  (1,759

Transfer ofNon-Controlling Interests in Consolidated Entities

                22,989      22,989    

Deferred Tax Effects Resulting from Acquisition of Ownership Interests fromNon-Controlling Interest Holders

       3,520      3,520         3,520    

Equity-Based Compensation

       41,439      41,439      33,102   74,541    

Net Delivery of Vested Blackstone Holdings Partnership Units and Blackstone Common Units

   3,077,431    (11,870     (11,870     (481  (12,351   

Change in The Blackstone Group L.P.’s Ownership Interest

       (6,124     (6,124     6,124       

Conversion of Blackstone Holdings Partnership Units to Blackstone Common Units

   3,458,489    23,661      23,661      (23,661      

Issuance of Blackstone Common Units

   750,739    24,970      24,970         24,970    


Balance at March 31, 2018

   666,812,752   $6,541,409   $(27,203  $6,514,206   $3,333,954   $3,467,639   $13,315,799   $209,010 


See notes to condensed consolidated financial statements.

The Blackstone Group L.P.

THE BLACKSTONE GROUP L.P.

Condensed Consolidated Statements of Cash Flows (Unaudited)

(Dollars in Thousands)


   Six Months Ended
June 30,
 
   2018  2017 

Operating Activities


Net Income

  $2,393,281  $1,736,619 

Adjustments to Reconcile Net Income to Net Cash Used in Operating Activities


Blackstone Funds Related


Net Realized Gains on Investments

   (995,992  (2,284,430

Changes in Unrealized (Gains) Losses on Investments

   (290,232  41,952 

Non-Cash Performance Allocations

   (1,068,440  29,089 

Non-Cash Performance Allocations and Incentive Fee Compensation

   757,064   700,156 

Equity-Based Compensation Expense

   208,994   179,729 

Amortization of Intangibles

   28,984   21,927 

OtherNon-Cash Amounts Included in Net Income

   172,435   132,973 

Cash Flows Due to Changes in Operating Assets and Liabilities


Cash Acquired with Consolidation of Fund Entity

   31,422   13,822 

Cash Relinquished with Deconsolidation of Fund Entities

   (899,959  (33,566

Accounts Receivable

   (8,030  191,454 

Reverse Repurchase Agreements

   —     118,495 

Due from Affiliates

   (330,468  (131,421

Other Assets

   (29,640  9,772 

Accrued Compensation and Benefits

   (417,051  (621,807

Securities Sold, Not Yet Purchased

   5,005   (73,633

Accounts Payable, Accrued Expenses and Other Liabilities

   (476,348  (700,274

Repurchase Agreements

   63,649   (14,713

Due to Affiliates

   31,306   (26,290

Investments Purchased

   (9,706,998  (7,991,469

Cash Proceeds from Sale of Investments

   7,870,341   8,279,495 


Net Cash Used in Operating Activities

   (2,660,677  (422,120


Investing Activities


Purchase of Furniture, Equipment and Leasehold Improvements

   (8,898  (13,663


Net Cash Used in Investing Activities

   (8,898  (13,663


   Three Months Ended March 31,
   2019 2018

Operating Activities


Net Income

   $1,072,877   $842,304 

Adjustments to Reconcile Net Income to Net Cash Provided by (Used in) Operating Activities


Blackstone Funds Related


Net Realized Gains on Investments

   (324,140  (306,440

Changes in Unrealized Gains on Investments

   (275,047  (209,015

Non-Cash Performance Allocations

   (663,999  (628,089

Non-Cash Performance Allocations and Incentive Fee Compensation

   378,816   373,159 

Equity-Based Compensation Expense

   121,179   92,223 

Amortization of Intangibles

   17,750   14,492 

OtherNon-Cash Amounts Included in Net Income

   (6,282  86,332 

Cash Flows Due to Changes in Operating Assets and Liabilities


Cash Acquired with Consolidation of Fund Entity

      31,422 

Cash Relinquished with Deconsolidation of Fund Entities

      (899,959

Accounts Receivable

   106,815   132,711 

Due from Affiliates

   (309,916  (186,713

Other Assets

   6,577   (5,918

Accrued Compensation and Benefits

   (347,853  (403,634

Securities Sold, Not Yet Purchased

   (14,883  16,003 

Accounts Payable, Accrued Expenses and Other Liabilities

   (356,158  (391,003

Repurchase Agreements

   (3,338  23,678 

Due to Affiliates

   28,964   11,469 

Investments Purchased

   (882,973  (5,007,608

Cash Proceeds from Sale of Investments

   1,582,142   4,644,753 


Net Cash Provided by (Used in) Operating Activities

   130,531   (1,769,833


Investing Activities


Purchase of Furniture, Equipment and Leasehold Improvements

   (18,858  (4,686


Net Cash Used in Investing Activities

   (18,858  (4,686


Financing Activities


Distributions toNon-Controlling Interest Holders in Consolidated Entities

   (148,782  (123,422

Contributions fromNon-Controlling Interest Holders in Consolidated Entities

   157,880   221,578 

Payments Under Tax Receivable Agreement

   (84,640   

Net Settlement of Vested Common Units and Repurchase of Common and Blackstone Holdings Partnership Units

   (61,403  (12,351

Proceeds from Loans Payable

   16   2,248,376 


continued…continued...

See notes to condensed consolidated financial statements.

The Blackstone Group L.P.

THE BLACKSTONE GROUP L.P.

Condensed Consolidated Statements of Cash Flows (Unaudited)

(Dollars in Thousands)


   Six Months Ended
June 30,
 
   2018  2017 

Financing Activities


Distributions toNon-Controlling Interest Holders in Consolidated Entities

  $(338,849 $(330,209

Contributions fromNon-Controlling Interest Holders in Consolidated Entities

   421,801   392,983 

Payments Under Tax Receivable Agreement

   —     (59,667

Net Settlement of Vested Common Units and Repurchase of Common and Blackstone Holdings Partnership Units

   (87,016  (13,220

Proceeds from Loans Payable

   3,218,399   2,550,559 

Repayment and Repurchase of Loans Payable

   (1,004,660  (127,464

Distributions to Unitholders

   (1,489,334  (1,637,287


Net Cash Provided by Financing Activities

   720,341   775,695 


Effect of Exchange Rate Changes on Cash and Cash Equivalents, Cash Held by Blackstone Funds and Other, and Restricted Cash

   11,671   72,188 


Cash and Cash Equivalents, Cash Held by Blackstone Funds and Other, and Restricted Cash


Net Increase (Decrease)

   (1,937,563  412,100 

Beginning of Period

   3,936,489   2,860,955 


End of Period

  $1,998,926  $3,273,055 


Supplemental Disclosure of Cash Flows Information


Payments for Interest

  $84,040  $77,111 


Payments for Income Taxes

  $109,944  $46,919 


Supplemental Disclosure ofNon-Cash Investing and Financing Activities


Non-Cash Contributions fromNon-Controlling Interest Holders

  $—    $1,327 


Non-Cash Distributions toNon-Controlling Interest Holders

  $(5,924 $(37,339


Net Assets Related to the Consolidation of a Fund Entity

  $—    $387,006 


Transfer of Interests toNon-Controlling Interest Holders

  $22,208  $(2,408


Change in The Blackstone Group L.P.’s Ownership Interest

  $835  $(13,821


Net Settlement of Vested Common Units

  $100,861  $62,631 


Conversion of Blackstone Holdings Units to Common Units

  $82,505  $43,520 


Acquisition of Ownership Interests fromNon-Controlling Interest Holders


Deferred Tax Asset

  $(74,130 $(48,017


Due to Affiliates

  $63,208  $40,731 


Partners’ Capital

  $10,922  $7,286 


Issuance of Common Units

  $24,970  $—   


continued…

                                                
   Three Months Ended March 31,
   2019 2018

Financing Activities (Continued)


Repayment and Repurchase of Loans Payable

   $(823  $(1,004,660

Distributions to Unitholders

   (730,309  (1,062,729


Net Cash Provided by (Used in) Financing Activities

   (868,061  266,792 


Effect of Exchange Rate Changes on Cash and Cash Equivalents and Cash Held by Blackstone Funds and Other

   (407  21,368 


Cash and Cash Equivalents and Cash Held by Blackstone Funds and Other


Net Decrease

   (756,795  (1,486,359

Beginning of Period

   2,545,161   3,936,489 


End of Period

   $1,788,366   $2,450,130 


Supplemental Disclosure of Cash Flows Information


Payments for Interest

   $42,979   $41,764 


Payments for Income Taxes

   $10,656   $20,201 


Supplemental Disclosure ofNon-Cash Investing and Financing Activities


Non-Cash Contributions fromNon-Controlling Interest Holders

   $242   $ 


Non-Cash Distributions toNon-Controlling Interest Holders

   $(34  $ 


Transfer of Interests toNon-Controlling Interest Holders

   $(1,260  $22,989 


Change in The Blackstone Group L.P.’s Ownership Interest

   $(10,965  $(6,124


Net Settlement of Vested Common Units

   $55,951   $98,870 


Conversion of Blackstone Holdings Units to Common Units

   $12,670   $23,661 


Acquisition of Ownership Interests fromNon-Controlling Interest Holders


Deferred Tax Asset

   $(14,572  $(23,818


Due to Affiliates

   $12,405   $20,298 


Partners’ Capital

   $2,167   $3,520 


Issuance of New Units

   $   $24,970 


The following table provides a reconciliation of Cash and Cash Equivalents and Cash Held by Blackstone Funds and Other reported within the Condensed Consolidated Statements of Financial Condition:


   March 31, December 31,
   2019 2018

Cash and Cash Equivalents

   $1,570,741   $2,207,841 

Cash Held by Blackstone Funds and Other

   217,625   337,320 


   $1,788,366   $2,545,161 


See notes to condensed consolidated financial statements.

THE BLACKSTONE GROUP L.P.

Condensed Consolidated Statements of Cash Flows (Unaudited)

(Dollars in Thousands)


The following table provides a reconciliation of Cash and Cash Equivalents, Cash Held by Blackstone Funds and Other, and Restricted Cash reported within the Condensed Consolidated Statements of Financial Condition:Group L.P.

   June 30,
2018
   December 31,
2017
 

Cash and Cash Equivalents

  $1,710,251   $1,992,497 

Cash Held by Blackstone Funds and Other

   288,675    1,929,531 

Restricted Cash included in Other Assets

   —      14,461 


  $1,998,926   $3,936,489 


See notes to condensed consolidated financial statements.

THE BLACKSTONE GROUP L.P.

Notes to Condensed Consolidated Financial Statements (Unaudited)

(All Dollars Are in Thousands, Except Unit and Per Unit Data, Except Where Noted)


1.

ORGANIZATIONOrganization

The Blackstone Group L.P., together with its subsidiaries (“Blackstone” or the “Partnership”), is a leading global manager of private capital. The alternative asset management business includes the management of private equity funds, real estate funds, real estate investment trusts (“REITs”), funds of hedge funds, hedge funds, credit-focused funds, collateralized loan obligation (“CLO”) vehicles, separately managed accounts and registered investment companies (collectively referred to as the “Blackstone Funds”). Blackstone’s business is organized into four segments: private equity, real estate, hedge fund solutionsReal Estate, Private Equity, Hedge Fund Solutions and credit.Credit.

The Partnership was formed as a Delaware limited partnership on March 12, 2007. The Partnership is managed and operated by its general partner, Blackstone Group Management L.L.C., which is in turn wholly owned by Blackstone’s senior managing directors and controlled by one of Blackstone’s founders, Stephen A. Schwarzman (the “Founder”). The activities of the Partnership are conducted through its holding partnerships: Blackstone Holdings I L.P., Blackstone Holdings AI L.P., Blackstone Holdings II L.P., Blackstone Holdings III L.P. and Blackstone Holdings IV L.P. (collectively, “Blackstone Holdings”, “Blackstone Holdings Partnerships” or the “Holding Partnerships”). The Partnership, through its wholly owned subsidiaries, is the sole general partner in each of these Holding Partnerships.

Generally, holders of the limited partner interests in the Holding Partnerships may, four times each year, exchange their limited partnership interests (“Partnership Units”) for Blackstone common units, on aone-to-one basis, exchanging one Partnership Unit from each of the Holding Partnerships for one Blackstone common unit.


2.

SUMMARY OF SIGNIFICANT ACCOUNTING POLICIESSummary of Significant Accounting Policies

Basis of Presentation

The accompanying unaudited condensed consolidated financial statements of the Partnership have been prepared in accordance with accounting principles generally accepted in the United States of America (“GAAP”) for interim financial information and the instructions toForm 10-Q. The condensed consolidated financial statements, including these notes, are unaudited and exclude some of the disclosures required in audited financial statements. Management believes it has made all necessary adjustments (consisting of only normal recurring items) so that the condensed consolidated financial statements are presented fairly and that estimates made in preparing its condensed consolidated financial statements are reasonable and prudent. The operating results presented for interim periods are not necessarily indicative of the results that may be expected for any other interim period or for the entire year. These condensed consolidated financial statements should be read in conjunction with the audited consolidated financial statements included in the Partnership’s Annual Report onForm 10-K for the year ended December 31, 20172018 filed with the Securities and Exchange Commission.

The condensed consolidated financial statements include the accounts of the Partnership, its wholly owned or majority-owned subsidiaries, the consolidated entities which are considered to be variable interest entities and for which the Partnership is considered the primary beneficiary, and certain partnerships or similar entities which are not considered variable interest entities but in which the general partner is presumed to have control.

All intercompany balances and transactions have been eliminated in consolidation.

Restructurings within consolidated CLOs are treated as investment purchases or sales, as applicable, in the Condensed Consolidated Statements of Cash Flows.

Consolidation

THE BLACKSTONE GROUP L.P.

Notes to Condensed Consolidated Financial Statements—Continued

(All Dollars Are in Thousands, Except Unit and Per Unit Data, Except Where Noted)

Consolidation

The Partnership consolidates all entities that it controls through a majority voting interest or otherwise, including those Blackstone Funds in which the general partner has a controlling financial interest. The Partnership has a controlling financial interest in Blackstone Holdings because the limited partners do not have the right to

The Blackstone Group L.P.

Notes to Condensed Consolidated Financial Statements (Unaudited) - Continued

(All Dollars Are in Thousands, Except Unit and Per Unit Data, Except Where Noted)

dissolve the partnerships or have substantive kick outkick-out rights or participating rights that would overcome the control held by the Partnership. Accordingly, the Partnership consolidates Blackstone Holdings and recordsnon-controlling interests to reflect the economic interests of the limited partners of Blackstone Holdings.

In addition, the Partnership consolidates all variable interest entities (“VIE”) in which it is the primary beneficiary. An enterprise is determined to be the primary beneficiary if it holds a controlling financial interest. A controlling financial interest is defined as (a) the power to direct the activities of a VIE that most significantly impact the entity’s economic performance and (b) the obligation to absorb losses of the entity or the right to receive benefits from the entity that could potentially be significant to the VIE. The consolidation guidance requires an analysis to determine (a) whether an entity in which the Partnership holds a variable interest is a VIE and (b) whether the Partnership’s involvement, through holding interests directly or indirectly in the entity or contractually through other variable interests, (for example, management and performance related fees), would give it a controlling financial interest. Performance of that analysis requires the exercise of judgment.

The Partnership determines whether it is the primary beneficiary of a VIE at the time it becomes involved with a variable interest entity and continuously reconsiders that conclusion. In determining whether the Partnership is the primary beneficiary, Blackstone evaluates its control rights as well as economic interests in the entity held either directly or indirectly by the Partnership. The consolidation analysis can generally be performed qualitatively; however, if it is not readily apparent that the Partnership is not the primary beneficiary, a quantitative analysis may also be performed. Investments and redemptions (either by the Partnership, affiliates of the Partnership or third parties) or amendments to the governing documents of the respective Blackstone Funds could affect an entity’s status as a VIE or the determination of the primary beneficiary. At each reporting date, the Partnership assesses whether it is the primary beneficiary and will consolidate or deconsolidate accordingly.

Assets of consolidated VIEs that can only be used to settle obligations of the consolidated VIE and liabilities of a consolidated VIE for which creditors (or beneficial interest holders) do not have recourse to the general credit of Blackstone are presented in a separate section in the Condensed Consolidated Statements of Financial Condition.

Blackstone’s other disclosures regarding VIEs are discussed in Note 9. “Variable Interest Entities”.

Revenue Recognition

Revenues primarily consist of management and advisory fees, incentive fees, investment income, interest and dividend revenue and other.

Management and advisory fees and incentive fees are accounted for as contracts with customers. Under the guidance for contracts with customers, an entity is required to (a) identify the contract(s) with a customer, (b) identify the performance obligations in the contract, (c) determine the transaction price, (d) allocate the transaction price to the performance obligations in the contract, and (e) recognize revenue when (or as) the entity satisfies a performance obligation. In determining the transaction price, an entity may include variable consideration only to the extent that it is probable that a significant reversal in the amount of cumulative revenue recognized would not occur when the uncertainty associated with the variable consideration is resolved. See Note 18,19. “Segment Reporting” for a disaggregated presentation of revenues from contracts with customers.

THE BLACKSTONE GROUP L.P.

Notes to Condensed Consolidated Financial Statements—Continued

(All Dollars Are in Thousands, Except Unit and Per Unit Data, Except Where Noted)

Investment Income represents the unrealized and realized gains and losses on the Partnership’s Performance Allocations and Principal Investments. Interest and Dividend Revenue comprises primarily interest and dividend income earned on principal investments held by the Partnership. Other Revenue consists of miscellaneous income and foreign exchange gains and losses arising on transactions denominated in currencies other than U.S. dollars.

Management and Advisory Fees, Net — Management and Advisory Fees, Net are comprised of management fees, including base management fees, transaction and other fees and advisory fees net of management fee reductions and offsets.

The Blackstone Group L.P.

Notes to Condensed Consolidated Financial Statements (Unaudited) - Continued

(All Dollars Are in Thousands, Except Unit and Per Unit Data, Except Where Noted)

The Partnership earns base management fees from limited partners of funds in each of its managed funds, at a fixed percentage of assets under management, net asset value, total assets, committed capital or invested capital. These customer contracts require the Partnership to provide investment management services, which represents a performance obligation that the Partnership satisfies over time. Management fees are a form of variable consideration because the fees the Partnership is entitled to vary based on fluctuations in the basis for the management fee. The amount recorded as revenue is generally determined at the end of the period because these management fees are payable on a regular basis (typically quarterly) and are not subject to clawback once paid.

Transaction, advisory and other fees (including monitoring fees) are principally fees charged to the limited partners of funds indirectly through the managed funds and portfolio companies. The investment advisory agreements generally require that the investment adviser reduce the amount of management fees payable by the limited partners to the Partnership (“management fee reductions”) by an amount equal to a portion of the transaction and other fees paid to the Partnership by the portfolio companies. The amount of the reduction varies by fund, the type of fee paid by the portfolio company and the previously incurred expenses of the fund. These fees and associated management fee reductions are a component of the transaction price for the Partnership’s performance obligation to provide investment management services to the limited partners of funds and are recognized as changes to the transaction price in the period in which they are charged and the services are performed.

Management fee offsets are reductions to management fees payable by the limited partners of the Blackstone Funds, which are based on the amount such limited partners reimburse the Blackstone Funds or the Partnership primarily for placement fees. Providing investment management services requires the Partnership to arrange for services on behalf of its customers. In those situations where the Partnership is acting as an agent on behalf of the limited partners of funds, it presents the cost of services as net against management fee revenue. In all other situations, the Partnership is primarily responsible for fulfilling the services and is therefore acting as a principal for those arrangements. As a result, the cost of those services is presented gross as Compensation or General, Administrative and Other expense, as appropriate, with any reimbursement from the limited partners of the funds recorded as Management and Advisory Fees, Net.

Accrued but unpaid Management and Advisory Fees, net of management fee reductions and management fee offsets, as of the reporting date are included in Accounts Receivable or Due from Affiliates in the Condensed Consolidated Statements of Financial Condition.

Incentive Fees — Contractual fees earned based on the performance of Blackstone Funds (“Incentive Fees”) are a form of variable consideration in theirBlackstone’s contracts with customers to provide investment management services. Incentive Fees are earned based on fund performance during the period, subject to the achievement of minimum return levels, or high water marks, in accordance with the respective terms set out in each fund’s governing agreements. Incentive Fees will not be recognized as revenue until (a) it is probable that a significant reversal in the amount of cumulative revenue recognized will not occur, or (b) the uncertainty associated with the variable

THE BLACKSTONE GROUP L.P.

Notes to Condensed Consolidated Financial Statements—Continued

(All Dollars Are in Thousands, Except Unit and Per Unit Data, Except Where Noted)

consideration is subsequently resolved. Incentive Fees are typically recognized as revenue when realized at the end of the measurement period. Once realized, such fees are not subject to clawback or reversal. Accrued but unpaid Incentive Fees charged directly to investors in Blackstone Funds as of the reporting date are recorded within Due from Affiliates in the Condensed Consolidated Statements of Financial Condition.

Investment Income (Loss) — Investment Income (Loss) represents the unrealized and realized gains and losses on the Partnership’s Performance Allocations and Principal Investments.

In certain fund structures across private equity, real estate, hedge fund solutions and credit-focused funds (“carry funds”), Blackstone, through its subsidiaries, invests alongside its limited partners in a partnership and is entitled to itspro-rata share of the results of the fund (a“pro-rata allocation”). In addition to apro-rata allocation, and assuming certain investment returns are achieved, Blackstone is entitled to a disproportionate allocation of

The Blackstone Group L.P.

Notes to Condensed Consolidated Financial Statements (Unaudited) - Continued

(All Dollars Are in Thousands, Except Unit and Per Unit Data, Except Where Noted)

the income otherwise allocable to the limited partners, commonly referred to as carried interest (“Performance Allocations”).

Performance Allocations are made to the general partner based on cumulative fund performance to date, subject to a preferred return to limited partners. At the end of each reporting period, the Partnership calculates the balance of accrued Performance Allocations (“Accrued Performance Allocations”) that would be due to the Partnership for each fund, pursuant to the fund agreements, as if the fair value of the underlying investments were realized as of such date, irrespective of whether such amounts have been realized. As the fair value of underlying investments varies between reporting periods, it is necessary to make adjustments to amounts recorded as Accrued Performance Allocations to reflect either (a) positive performance resulting in an increase in the Accrued Performance Allocation to the general partner or (b) negative performance that would cause the amount due to the Partnership to be less than the amount previously recognized as revenue, resulting in a negative adjustment to the Accrued Performance Allocation to the general partner. In each scenario, it is necessary to calculate the Accrued Performance Allocation on cumulative results compared to the Accrued Performance Allocation recorded to date and make the required positive or negative adjustments. The Partnership ceases to record negative Performance Allocations once previously Accrued Performance Allocations for such fund have been fully reversed. The Partnership is not obligated to pay guaranteed returns or hurdles, and therefore, cannot have negative Performance Allocations over the life of a fund. Accrued Performance Allocations as of the reporting date are reflected in Investments in the Condensed Consolidated Statements of Financial Condition.

Performance Allocations are realized when an underlying investment is profitably disposed of and the fund’s cumulative returns are in excess of the preferred return or, in limited instances, after certain thresholds for return of capital are met. Performance Allocations are subject to clawback to the extent that the Performance Allocation received to date exceeds the amount due to Blackstone based on cumulative results. As such, the accrual for potential repayment of previously received Performance Allocations, which is a component of Due to Affiliates, represents all amounts previously distributed to Blackstone Holdings andnon-controlling interest holders that would need to be repaid to the Blackstone carry funds if the Blackstone carry funds were to be liquidated based on the current fair value of the underlying funds’ investments as of the reporting date. The actual clawback liability, however, generally does not become realized until the end of a fund’s life except for certain funds, including certain Blackstone real estate funds, multi-asset class investment funds and credit-focused funds, which may have an interim clawback liability.

Principal Investments include the unrealized and realized gains and losses on the Partnership’s principal investments, including its investments in Blackstone Funds that are not consolidated and receivepro-rata allocations, its equity method investments, and other principal investments. Income (Loss) on Principal Investments

THE BLACKSTONE GROUP L.P.

Notes to Condensed Consolidated Financial Statements—Continued

(All Dollars Are in Thousands, Except Unit and Per Unit Data, Except Where Noted)

is realized when the Partnership redeems all or a portion of its investment or when the Partnership receives cash income, such as dividends or distributions. Unrealized Income (Loss) on Principal Investments results from changes in the fair value of the underlying investment as well as the reversal of unrealized gain (loss) at the time an investment is realized.

Interest and Dividend Revenue — Interest and Dividend Revenue comprises primarily interest and dividend income earned on principal investments not accounted for under the equity method held by Blackstone.

Other Revenue — Other Revenue consists of miscellaneous income and foreign exchange gains and losses arising on transactions denominated in currencies other than U.S. dollars.

Fair Value of Financial Instruments

GAAP establishes a hierarchical disclosure framework which prioritizes and ranks the level of market price observability used in measuring financial instruments at fair value. Market price observability is affected by a number of factors, including the type of financial instrument, the characteristics specific to the financial instrument and the state of the marketplace, including the existence and transparency of transactions between market

The Blackstone Group L.P.

Notes to Condensed Consolidated Financial Statements (Unaudited) - Continued

(All Dollars Are in Thousands, Except Unit and Per Unit Data, Except Where Noted)

participants. Financial instruments with readily available quoted prices in active markets generally will have a higher degree of market price observability and a lesser degree of judgment used in measuring fair value.

Financial instruments measured and reported at fair value are classified and disclosed based on the observability of inputs used in the determination of fair values, as follows:


Level I Quoted prices are available in active markets for identical financial instruments as of the reporting date. The types of financial instruments in Level I include listed equities, listed derivatives and mutual funds with quoted prices. The Partnership does not adjust the quoted price for these investments, even in situations where Blackstone holds a large position and a sale could reasonably impact the quoted price.


Level II Pricing inputs are other than quoted prices in active markets, which are either directly or indirectly observable as of the reporting date, and fair value is determined through the use of models or other valuation methodologies. Financial instruments which are generally included in this category include corporate bonds and loans, including corporate bonds and loans held within CLO vehicles, government and agency securities, less liquid and restricted equity securities, and certainover-the-counter derivatives where the fair value is based on observable inputs. Senior and subordinated notes issued by CLO vehicles are classified within Level II of the fair value hierarchy.


Level III Pricing inputs are unobservable for the financial instruments and includes situations where there is little, if any, market activity for the financial instrument. The inputs into the determination of fair value require significant management judgment or estimation. Financial instruments that are included in this category generally include general and limited partnership interests in private equity and real estate funds, credit-focused funds, distressed debt andnon-investment grade residual interests in securitizations, certain corporate bonds and loans held within CLO vehicles, and certainover-the-counter derivatives where the fair value is based on unobservable inputs.

In certain cases, the inputs used to measure fair value may fall into different levels of the fair value hierarchy. In such cases, the determination of which category within the fair value hierarchy is appropriate for any given

THE BLACKSTONE GROUP L.P.

Notes to Condensed Consolidated Financial Statements—Continued

(All Dollars Are in Thousands, Except Unit and Per Unit Data, Except Where Noted)

financial instrument is based on the lowest level of input that is significant to the fair value measurement. The Partnership’s assessment of the significance of a particular input to the fair value measurement in its entirety requires judgment and considers factors specific to the financial instrument.

Transfers between levels of the fair value hierarchy are recognized at the beginning of the reporting period.

Level II Valuation Techniques

Financial instruments classified within Level II of the fair value hierarchy comprise debt instruments, including certain corporate loans and bonds held by Blackstone’s consolidated CLO vehicles and debt securities sold, not yet purchased. Certain equity securities and derivative instruments valued using observable inputs are also classified as Level II.

The valuation techniques used to value financial instruments classified within Level II of the fair value hierarchy are as follows:


Debt Instruments and Equity Securities are valued on the basis of prices from an orderly transaction between market participants provided by reputable dealers or pricing services. In determining the value of a particular investment, pricing services may use certain information with respect to transactions in such investments, quotations from dealers, pricing matrices and market transactions in comparable investments and various relationships between investments. The valuation of certain equity securities is based on an observable price for an identical security adjusted for the effect of a restriction.


Freestanding Derivatives are valued using contractual cash flows and observable inputs comprising yield curves, foreign currency rates and credit spreads.

The Blackstone Group L.P.

Notes to Condensed Consolidated Financial Statements (Unaudited) - Continued

(All Dollars Are in Thousands, Except Unit and Per Unit Data, Except Where Noted)


Senior and subordinate notes issued by CLO vehicles are classified based on the more observable fair value of CLO assets less (a) the fair value of any beneficial interests held by Blackstone, and (b) the carrying value of any beneficial interests that represent compensation for services.

Level III Valuation Techniques

In the absence of observable market prices, Blackstone values its investments using valuation methodologies applied on a consistent basis. For some investments little market activity may exist; management’s determination of fair value is then based on the best information available in the circumstances, and may incorporate management’s own assumptions and involves a significant degree of judgment, taking into consideration a combination of internal and external factors, including the appropriate risk adjustments fornon-performance and liquidity risks. Investments for which market prices are not observable include private investments in the equity of operating companies, real estate properties, certain funds of hedge funds and credit-focused investments.

Private Equity Investments The fair values of private equity investments are determined by reference to projected net earnings, earnings before interest, taxes, depreciation and amortization (“EBITDA”), the discounted cash flow method, public market or private transactions, valuations for comparable companies and other measures which, in many cases, are based on unaudited information at the time received. Valuations may be derived by reference to observable valuation measures for comparable companies or transactions (for example, multiplying a key performance metric of the investee company, such as EBITDA, by a relevant valuation multiple observed in the range of comparable companies or transactions), adjusted by management for differences between the investment and the referenced comparables, and in some instances by reference to option pricing models or other similar methods. Where a discounted cash flow method is used, a terminal value is derived by reference to EBITDA or price/earnings exit multiples.

THE BLACKSTONE GROUP L.P.

Notes to Condensed Consolidated Financial Statements—Continued

(All Dollars Are in Thousands, Except Unit and Per Unit Data, Except Where Noted)

Real Estate Investments The fair values of real estate investments are determined by considering projected operating cash flows, sales of comparable assets, if any, and replacement costs, among other measures. The methods used to estimate the fair value of real estate investments include the discounted cash flow method and/or capitalization rates (“cap rates”) analysis. Valuations may be derived by reference to observable valuation measures for comparable companies or assets (for example, multiplying a key performance metric of the investee company or asset, such as EBITDA, by a relevant valuation multiple observed in the range of comparable companies or transactions), adjusted by management for differences between the investment and the referenced comparables, and in some instances by reference to option pricing models or other similar methods. Where a discounted cash flow method is used, a terminal value is derived by reference to an exit EBITDA multiple or capitalization rate. Additionally, where applicable, projected distributable cash flow throughflow-through debt maturity will be considered in support of the investment’s fair value.

Credit-Focused Investments The fair values of credit-focused investments are generally determined on the basis of prices between market participants provided by reputable dealers or pricing services. For credit-focused investments that are not publicly traded or whose market prices are not readily available, Blackstone may utilize other valuation techniques, including the discounted cash flow method or a market approach. The discounted cash flow method projects the expected cash flows of the debt instrument based on contractual terms, and discounts such cash flows back to the valuation date using a market-based yield. The market-based yield is estimated using yields of publicly traded debt instruments issued by companies operating in similar industries as the subject investment, with similar leverage statistics and time to maturity.

The market approach is generally used to determine the enterprise value of the issuer of a credit investment, and considers valuation multiples of comparable companies or transactions. The resulting enterprise value will dictate whether or not such credit investment has adequate enterprise value coverage. In cases of distressed credit instruments, the market approach may be used to estimate a recovery value in the event of a restructuring.

Level III Valuation Process

The Blackstone Group L.P.

Investments classified within Level III of the fair value hierarchy are valued on a quarterly basis, taking into consideration factors including any changesNotes to Condensed Consolidated Financial Statements (Unaudited) - Continued

(All Dollars Are in Blackstone’s weighted-average cost of capital assumptions, discounted cash flow projectionsThousands, Except Unit and exit multiple assumptions, as well as any changes in economic and other relevant conditions, and valuation models are updated accordingly. The valuation process also includes a review by an independent valuation party, at least annually for all investments, and quarterly for certain investments, to corroborate the values determined by management. The valuations of Blackstone’s investments are reviewed quarterly by a valuation committee chaired by Blackstone’s Vice Chairman and includes senior heads of each of Blackstone’s businesses, as well as representatives of legal and finance. Each quarter, the valuations of Blackstone’s investments are also reviewed by the Audit Committee in a meeting attended by the chairman of the valuation committee. The valuations are further tested by comparison to actual sales prices obtained on disposition of the investments.Per Unit Data, Except Where Noted)

Investments, at Fair Value

The Blackstone Funds are accounted for as investment companies under the American Institute of Certified Public Accountants Accounting and Auditing Guide,Investment Companies, and in accordance with the GAAP guidance on investment companies and reflect their investments, including majority-owned and controlled investments (the “Portfolio Companies”), at fair value. Such consolidated funds’ investments are reflected in Investments on the Condensed Consolidated Statements of Financial Condition at fair value, with unrealized gains and losses resulting from changes in fair value reflected as a component of Net Gains

THE BLACKSTONE GROUP L.P.

Notes to Condensed Consolidated Financial Statements—Continued

(All Dollars Are in Thousands, Except Unit and Per Unit Data, Except Where Noted)

from Fund Investment Activities in the Condensed Consolidated Statements of Operations. Fair value is the amount that would be received to sell an asset or paid to transfer a liability, in an orderly transaction between market participants at the measurement date, at current market conditions (i.e., the exit price).

Blackstone’s principal investments are presented at fair value with unrealized appreciation or depreciation and realized gains and losses recognized in the Condensed Consolidated Statements of Operations within Investment Income (Loss).

For certain instruments, the Partnership has elected the fair value option. Such election is irrevocable and is applied on an investment by investment basis at initial recognition. The Partnership has applied the fair value option for certain loans and receivables and certain investments in private debt securities that otherwise would not have been carried at fair value with gains and losses recorded in net income. The methodology for measuring the fair value of such investments is consistent with the methodology applied to private equity, real estate, credit-focused and funds of hedge funds investments. Changes in the fair value of such instruments are recognized in Investment Income (Loss) in the Condensed Consolidated Statements of Operations. Interest income on interest bearing loans and receivables and debt securities on which the fair value option has been elected is based on stated coupon rates adjusted for the accretion of purchase discounts and the amortization of purchase premiums. This interest income is recorded within Interest and Dividend Revenue.

The Partnership has elected the fair value option for the assets of consolidated CLO vehicles. As permitted under GAAP, the Partnership measures the liabilities of consolidated CLO vehicles as (a) the sum of the fair value of the consolidated CLO assets and the carrying value of anynon-financial assets held temporarily, less (b) the sum of the fair value of any beneficial interests retained by the Partnership (other than those that represent compensation for services) and the Partnership’s carrying value of any beneficial interests that represent compensation for services. As a result of this measurement alternative, there is no attribution of amounts toNon-Controlling Interests for consolidated CLO vehicles. Assets of the consolidated CLOs are presented within Investments within the Condensed Consolidated Statements of Financial Condition and Liabilities within Loans Payable for the amounts due to unaffiliated third parties and Due to Affiliates for the amounts held bynon-consolidated affiliates. Changes in the fair value of consolidated CLO assets and liabilities and related interest, dividend and other income are presented within Net Gains from Fund Investment Activities. Expenses of consolidated CLO vehicles are presented in Fund Expenses.

The Partnership has elected the fair value option for certain proprietary investments that would otherwise have been accounted for using the equity method of accounting. The fair value of such investments is based on quoted prices in an active market or using the discounted cash flow method. Changes in fair value are recognized in Investment Income (Loss) in the Condensed Consolidated Statements of Operations.

Further disclosure on instruments for which the fair value option has been elected is presented in Note 7. “Fair Value Option”.

The investments of consolidated Blackstone Funds in funds of hedge funds (“Investee Funds”) are valued at net asset value (“NAV”) per share of the Investee Fund. In limited circumstances, the Partnership may determine, based on its own due diligence and investment procedures, that NAV per share does not represent fair value. In such circumstances, the Partnership will estimate the fair value in good faith and in a manner that it reasonably chooses, in accordance with the requirements of GAAP.

The Blackstone Group L.P.

Notes to Condensed Consolidated Financial Statements (Unaudited) - Continued

(All Dollars Are in Thousands, Except Unit and Per Unit Data, Except Where Noted)

Certain investments of Blackstone and of the consolidated Blackstone funds of hedge funds and credit-focused funds measure their investments in underlying funds at fair value using NAV per share without adjustment. The

THE BLACKSTONE GROUP L.P.

Notes to Condensed Consolidated Financial Statements—Continued

(All Dollars Are in Thousands, Except Unit and Per Unit Data, Except Where Noted)

terms of the investee’s investment generally provide for minimum holding periods orlock-ups, the institution of gates on redemptions or the suspension of redemptions or an ability to side pocketside-pocket investments, at the discretion of the investee’s fund manager, and as a result, investments may not be redeemable at, or within three months of, the reporting date. A side pocketside-pocket is used by hedge funds and funds of hedge funds to separate investments that may lack a readily ascertainable value, are illiquid or are subject to liquidity restriction. Redemptions are generally not permitted until the investments within a side pocketside-pocket are liquidated or it is deemed that the conditions existing at the time that required the investment to be included in the side pocketside-pocket no longer exist. As the timing of either of these events is uncertain, the timing at which the Partnership may redeem an investment held in a side pocketside-pocket cannot be estimated. Further disclosure on instruments for which fair value is measured using NAV per share is presented in Note 5. “Net Asset Value as Fair Value”.

Security and loan transactions are recorded on a trade date basis.

Equity Method Investments

Investments in which the Partnership is deemed to exert significant influence, but not control, are accounted for using the equity method of accounting except in cases where the fair value option has been elected. The Partnership has significant influence over all Blackstone Funds in which it invests but does not consolidate. Therefore, its investments in such Blackstone Funds, which include both a proportionate and disproportionate allocation of the profits and losses (as is the case with carry funds that include a Performance Allocation), are accounted for under the equity method. Under the equity method of accounting, the Partnership’s share of earnings (losses) from equity method investments is included in Investment Income (Loss) in the Condensed Consolidated Statements of Operations.

In cases where the Partnership’s equity method investments provide for a disproportionate allocation of the profits and losses (as is the case with carry funds that include a Performance Allocation), the Partnership’s share of earnings (losses) from equity method investments is determined using a balance sheet approach referred to as the hypothetical liquidation at book value (“HLBV”) method. Under the HLBV method, at the end of each reporting period the Partnership calculates the Accrued Performance Allocations that would be due to the Partnership for each fund pursuant to the fund agreements as if the fair value of the underlying investments were realized as of such date, irrespective of whether such amounts have been realized. As the fair value of underlying investments varies between reporting periods, it is necessary to make adjustments to amounts recorded as Accrued Performance Allocations to reflect either (a) positive performance resulting in an increase in the Accrued Performance Allocation to the general partner, or (b) negative performance that would cause the amount due to the Partnership to be less than the amount previously recognized as revenue, resulting in a negative adjustment to the Accrued Performance Allocation to the general partner. In each scenario, it is necessary to calculate the Accrued Performance Allocation on cumulative results compared to the Accrued Performance Allocation recorded to date and make the required positive or negative adjustments. The Partnership ceases to record negative Performance Allocations once previously Accrued Performance Allocations for such fund have been fully reversed. The Partnership is not obligated to pay guaranteed returns or hurdles, and therefore, cannot have negative Performance Allocations over the life of a fund. The carrying amounts of equity method investments are reflected in Investments in the Condensed Consolidated Statements of Financial Condition.

Results from Blackstone’s investments in Strategic Partners funds are reported on a three month lag.

Compensation and Benefits

Compensation and Benefits — Compensation — Compensation and Benefits consists of (a) employee compensation, comprising salary and bonus, and benefits paid and payable to employees and senior managing

THE BLACKSTONE GROUP L.P.

Notes to Condensed Consolidated Financial Statements—Continued

(All Dollars Are in Thousands, Except Unit and Per Unit Data, Except Where Noted)

directors and (b) equity-based compensation associated with the grants of equity-based awards to employees and senior managing directors. Compensation cost relating to the issuance of equity-based awards to senior managing directors and employees is measured at fair value at the grant date, taking into consideration expected forfeitures, and expensed over the vesting period on a straight-line basis, taking into consideration expected forfeitures, except in the case of (a) equity-based awards that do not require future service, which are

The Blackstone Group L.P.

Notes to Condensed Consolidated Financial Statements (Unaudited) - Continued

(All Dollars Are in Thousands, Except Unit and Per Unit Data, Except Where Noted)

expensed immediately, and (b) certain awards to recipients that meet specified criteria making them eligible for retirement treatment (allowing such recipient to keep a percentage of those awards upon departure from Blackstone after becoming eligible for retirement), for which the expense for the portion of the award that would be retained in the event of retirement is either expensed immediately or amortized to the retirement date. Cash settled equity-based awards are classified as liabilities and are remeasured at the end of each reporting period.

Compensation and Benefits — Incentive Fee Compensation — Incentive Fee Compensation consists of compensation paid based on Incentive Fees.

Compensation and Benefits — Performance Allocations Compensation —Performance Allocation Compensation consists of compensation paid based on Performance Allocations (which may be distributed in cash orin-kind). Such compensation expense is subject to both positive and negative adjustments. Unlike Performance Allocations, compensation expense is based on the performance of individual investments held by a fund rather than on a fund by fund basis. These amounts may also include allocations of investment income from Blackstone’s principal investments, to senior managing directors and employees participating in certain profit sharing initiatives.

Reverse Repurchase and Repurchase Agreements

Securities purchased under agreements to resell (“reverse repurchase agreements”) and securities sold under agreements to repurchase (“repurchase agreements”), comprised primarily of U.S. andnon-U.S. government and agency securities, are asset-backed securities and corporate debt, and represent collateralized financing transactions. Such transactions are recorded in the Condensed Consolidated Statements of Financial Condition at their contractual amounts and include accrued interest. The carrying value of reverse repurchase and repurchase agreements approximates fair value.

The Partnership manages credit exposure arising from reverse repurchase agreements and repurchase agreements by, in appropriate circumstances, entering into master netting agreements and collateral arrangements with counterparties that provide the Partnership, in the event of a counterparty default, the right to liquidate collateral and the right to offset a counterparty’s rights and obligations.

The Partnership takes possession of securities purchased under reverse repurchase agreements and is permitted to repledge, deliver or otherwise use such securities. The Partnership also pledges its financial instruments to counterparties to collateralize repurchase agreements. Financial instruments pledged that can be repledged, delivered or otherwise used by the counterparty are recorded in Investments in the Condensed Consolidated Statements of Financial Condition. Additional disclosures relating to repurchase agreements are discussed in Note 10. “Repurchase Agreements”.

Blackstone does not offset assets and liabilities relating to reverse repurchase agreements and repurchase agreements in its Condensed Consolidated Statements of Financial Condition. Additional disclosures relating to offsetting are discussed in Note 11. “Offsetting of Assets and Liabilities”.

Securities Sold, Not Yet Purchased

Securities Sold, Not Yet Purchased consist of equity and debt securities that the Partnership has borrowed and sold. The Partnership is required to “cover” its short sale in the future by purchasing the security at prevailing

THE BLACKSTONE GROUP L.P.

Notes to Condensed Consolidated Financial Statements—Continued

(All Dollars Are in Thousands, Except Unit and Per Unit Data, Except Where Noted)

market prices and delivering it to the counterparty from which it borrowed the security. The Partnership is exposed to loss in the event that the price at which a security may have to be purchased to cover a short sale exceeds the price at which the borrowed security was sold short.

Securities Sold, Not Yet Purchased are recorded at fair value in the Condensed Consolidated Statements of Financial Condition.

The Blackstone Group L.P.

Notes to Condensed Consolidated Financial Statements (Unaudited) - Continued

(All Dollars Are in Thousands, Except Unit and Per Unit Data, Except Where Noted)

Derivative Instruments

The Partnership recognizes all derivatives as assets or liabilities on its Condensed Consolidated Statements of Financial Condition at fair value. On the date the Partnership enters into a derivative contract, it designates and documents each derivative contract as one of the following: (a) a hedge of a recognized asset or liability (“fair value hedge”), (b) a hedge of a forecasted transaction or of the variability of cash flows to be received or paid related to a recognized asset or liability (“cash flow hedge”), (c) a hedge of a net investment in a foreign operation, or (d) a derivative instrument not designated as a hedging instrument (“freestanding derivative”). For a fair value hedge, Blackstone records changes in the fair value of the derivative and, to the extent that it is highly effective, changes in the fair value of the hedged asset or liability attributable to the hedged risk, in current period earnings in General, Administrative and Other in the Condensed Consolidated Statements of Operations. Changes in the fair value of derivatives designated as hedging instruments caused by factors other than changes in the risk being hedged, which are excluded from the assessment of hedge effectiveness, are recognized in current period earnings. Gains or losses on a derivative instrument that is designated as, and is effective as, an economic hedge of a net investment in a foreign operation are reported in the cumulative translation adjustment section of other comprehensive income to the extent it is effective as a hedge. The ineffective portion of a net investment hedge is recognized in current period earnings.

The Partnership formally documents at inception its hedge relationships, including identification of the hedging instruments and the hedged items, its risk management objectives, strategy for undertaking the hedge transaction and the Partnership’s evaluation of effectiveness of its hedged transaction. At least monthly, the Partnership also formally assesses whether the derivative it designated in each hedging relationship is expected to be, and has been, highly effective in offsetting changes in estimated fair values or cash flows of the hedged items using either the regression analysis or the dollar offset method. For net investment hedges, the Partnership uses a method based on changes in spot rates to measure effectiveness. If it is determined that a derivative is not highly effective at hedging the designated exposure, hedge accounting is discontinued. The Partnership may also at any time remove a designation of a fair value hedge. The fair values of hedging derivative instruments are reflected within Other Assets in the Condensed Consolidated Statements of Financial Condition.

For freestanding derivative contracts, the Partnership presents changes in fair value in current period earnings. Changes in the fair value of derivative instruments held by consolidated Blackstone Funds are reflected in Net Gains from Fund Investment Activities or, where derivative instruments are held by the Partnership, within Investment Income (Loss) in the Condensed Consolidated Statements of Operations. The fair value of freestanding derivative assets of the consolidated Blackstone Funds are recorded within Investments, the fair value of freestanding derivative assets that are not part of the consolidated Blackstone Funds are recorded within Other Assets and the fair value of freestanding derivative liabilities are recorded within Accounts Payable, Accrued Expenses and Other Liabilities in the Condensed Consolidated Statements of Financial Condition.

The Partnership has elected to not offset derivative assets and liabilities or financial assets in its Condensed Consolidated Statements of Financial Condition, including cash, that may be received or paid as part of collateral

THE BLACKSTONE GROUP L.P.

Notes to Condensed Consolidated Financial Statements—Continued

(All Dollars Are in Thousands, Except Unit and Per Unit Data, Except Where Noted)

arrangements, even when an enforceable master netting agreement is in place that provides the Partnership, in the event of counterparty default, the right to liquidate collateral and the right to offset a counterparty’s rights and obligations.

Blackstone’s other disclosures regarding derivative financial instruments are discussed in Note 6. “Derivative Financial Instruments”.

Blackstone’s disclosures regarding offsetting are discussed in Note 11. “Offsetting of Assets and Liabilities”.

Leases

Blackstone determines if an arrangement is a lease at inception of the arrangement. Blackstone primarily enters into operating leases, as the lessee, for office space. Operating leases are included inRight-of-Use (“ROU”)

The Blackstone Group L.P.

Notes to Condensed Consolidated Financial Statements (Unaudited) - Continued

(All Dollars Are in Thousands, Except Unit and Per Unit Data, Except Where Noted)

Assets and Operating Lease Liabilities on our Condensed Consolidated Statement of Financial Condition. ROU Assets and Operating Lease Liabilities are recognized based on the present value of the future minimum lease payments over the lease term at the commencement date. Blackstone determines the present value of the lease payments using an incremental borrowing rate based on information available at the inception date. Leases may include options to extend or terminate the lease which are included in the ROU Assets and Operating Lease Liability when they are reasonably certain of exercise.

Certain leases include lease and nonlease components, which are accounted for as one single lease component. Occupancy lease agreements, in addition to contractual rent payments, generally include additional payments for certain costs incurred by the landlord, such as building expenses and utilities. To the extent these are fixed or determinable, they are included as part of the minimum lease payments used to measure the Operating Lease Liability. Operating lease expense associated with minimum lease payments is recognized on a straight-line basis over the lease term. When additional payments are based on usage or vary based on other factors, they are expensed when incurred as variable lease expense.

Minimum lease payments for leases with an initial term of twelve months or less are not recorded on the Condensed Consolidated Statement of Financial Condition. Blackstone recognizes lease expense for these leases on a straight-line basis over the lease term.

Affiliates

Blackstone considers its Founder, senior managing directors, employees, the Blackstone Funds and the Portfolio Companies to be affiliates.

Distributions

Distributions are reflected in the condensed consolidated financial statements when declared.

Recent Accounting Developments

In May 2014, the Financial Accounting Standards Board (“FASB”) issued amended guidance on revenue from contracts with customers. The new guidance was effective for Blackstone beginning January 1, 2018 and was adopted on a full retrospective basis. The guidance requires that an entity should recognize revenue to depict the transfer of promised goods or services to customers in an amount that reflects the consideration to which the entity expects to be entitled in exchange for those goods or services. An entity is required to (a) identify the contract(s) with a customer, (b) identify the performance obligations in the contract, (c) determine the transaction price, (d) allocate the transaction price to the performance obligations in the contract, and (e) recognize revenue when (or as) the entity satisfies a performance obligation. In determining the transaction price, an entity may include variable consideration only to the extent that it is probable that a significant reversal in the amount of cumulative revenue recognized would not occur when the uncertainty associated with the variable consideration is resolved.

Blackstone has concluded that its Management and Advisory Fees and Incentive Fees are within the scope of the amended revenue recognition guidance. The adoption of the amended guidance did not have a material impact on the recognition of Management and Advisory Fees. For Incentive Fees, the amended guidance changes the presentation and delays the recognition of revenues compared to the prior accounting treatment. These amounts were previously recognized within Realized and Unrealized Performance Fees — Incentive Fees in the Condensed Consolidated Statements of Operations. Under the amended guidance, these amounts will be recognized separately within Incentive Fees. Blackstone recorded a net reduction to Partners’ Capital of $2.4 million and $1.9 million as of December 31, 2016 and December 31, 2017, respectively, as a result of adopting the amended guidance. For the three months ended June 30, 2017, the impact on Total Revenues, Net Income Attributable to The Blackstone Group L.P., Net Income Per Common Unit — Basic, and Net Income Per Common Unit — Diluted was a reduction of $13.6 million, $5.4 million, $0.01 per common unit, and $0.01 per common unit, respectively. For the six months ended June 30, 2017, the impact on Total Revenues, Net Income Attributable to The Blackstone Group L.P., Net Income Per Common Unit — Basic, and Net Income Per Common Unit — Diluted was a reduction of $39.6 million, $15.3 million, $0.02 per common unit, and $0.02 per common unit, respectively. Also, the reimbursement of certain costs incurred in the process of providing investment management services, primarily travel costs, that were previously presented net in the Condensed Consolidated Statements of Operations are presented gross under the amended guidance. For the three and six months ended June 30, 2017, these costs were

THE BLACKSTONE GROUP L.P.

Notes to Condensed Consolidated Financial Statements—Continued

(All Dollars Are in Thousands, Except Unit and Per Unit Data, Except Where Noted)

$4.3 million and $7.6 million, respectively, and are presented in General, Administrative and Other Expenses with the related reimbursement presented in Management and Advisory Fees, Net in the Condensed Consolidated Statements of Operations.

Blackstone has concluded that investments made alongside its limited partners in a partnership which entitle Blackstone to apro-rata allocation and a disproportionate Performance Allocation represent equity method investments that are not in the scope of the amended revenue recognition guidance. Therefore, effective January 1, 2018, Blackstone amended the recognition and measurement of Performance Allocations. This accounting change will not change the timing or amount of revenue recognized related to Performance Allocation arrangements. These amounts were previously recognized within Realized and Unrealized Performance Fees – Carried Interest and Incentive Fees in the Condensed Consolidated Statements of Operations. Under the equity method of accounting Blackstone recognizes Performance Allocations within Investment Income along with the allocations proportionate to Blackstone’s ownership interests in the Blackstone Funds. Blackstone applied a retrospective application consistent with the requirements for presentation of a change in accounting principle.

In January 2016, the FASB issued amended guidance on the classification and measurement of financial instruments. The new guidance was effective for Blackstone beginning on January 1, 2018 and was adopted on a modified retrospective basis. However, changes to the accounting for equity securities without a readily determinable fair value will be applied prospectively as permitted under the guidance. This amended guidance did not have an impact on Blackstone’s financial statements as of and for the three and six months ended June 30, 2018.

In February 2016, the FASB issued amended guidance on the accounting for leases. The new guidance was effective for Blackstone beginning January 1, 2019 and was adopted on a modified retrospective basis. Blackstone elected to apply the guidance to each lease that had commenced as of the adoption date. As a result, periods prior to January 1, 2019 are presented in accordance with previous GAAP. Blackstone also elected a package of practical expedients which resulted in no requirement to reassess (a) whether any expired or existing contracts are or contain leases, (b) the lease classification for any expired or existing leases and (c) the recognition requirements for initial direct costs for any existing leases. Blackstone also elected a practical expedient to account for lease and nonlease components as a single lease component. Short-term leases, which have a stated lease term of twelve months or less, have been excluded from the Operating Lease Liability and ROU Assets as a result of a policy election made by Blackstone.

The guidance requires the recognition of lease assets and lease liabilities for those leases previously classified as operating leases under previous GAAP. The guidanceand it retains a distinction between finance leases and operating leases. The classification criteria for distinguishing between finance leases and operating leases are substantially similar, but not identical to, to the classification criteria for distinguishing between capital leases and operating leases under previous GAAP. The recognition, measurement and presentation of expenses and cash flows arising from a lease by a lessee have not changed significantly from previous GAAP.

For operating leases, a lessee is required to do the following: (a) recognize aright-of-use asset and a lease liability, initially measured at the present value of the lease payments, in the Condensed Consolidated Statement of Financial Condition, (b) recognize a single lease cost, calculated so that the cost of the lease is allocated over the lease term on a generally straight-line basis, and (c) classify all cash payments within operating activities in the statementCondensed Consolidated Statements of cash flows.

The guidance is effective for fiscal periods beginning after December 15, 2018. Early application is permitted. Blackstone is evaluating the impactCash Flows. Upon adoption of the amendednew guidance, Blackstone recognized Operating Lease Liabilities of $601.7 million and corresponding ROU Assets of $540.7 million on the Condensed Consolidated Statement of Financial Condition. It isThese amounts were calculated as the present value of remaining lease payments on existing leases as of January 1, 2019, discounted using an incremental borrowing rate for each

The Blackstone Group L.P.

Notes to Condensed Consolidated Financial Statements (Unaudited) - Continued

(All Dollars Are in Thousands, Except Unit and Per Unit Data, Except Where Noted)

lease as of the adoption date. The guidance did not expected to have a material impact on the Condensed Consolidated Statements of Operations or the Condensed Consolidated Statements of Cash Flows.

In November 2016,

3.

Intangible Assets

Intangible Assets, Net consists of the FASB issued amended guidance on classificationfollowing:

                                                      
   March 31, December 31,
   2019 2018

Finite-Lived Intangible Assets / Contractual Rights

   $1,712,576   $1,712,576 

Accumulated Amortization

   (1,261,819  (1,244,069


Intangible Assets, Net

   $450,757   $468,507 


Amortization expense associated with Blackstone’s intangible assets was $17.7 million and presentation$14.5 million for the three months ended March 31, 2019 and 2018, respectively.

Amortization of restricted cash onIntangible Assets held at March 31, 2019 is expected to be $71.0 million, $71.0 million, $71.0 million, $63.3 million, and $34.3 million for each of the statementyears ending December 31, 2019, 2020, 2021, 2022, and 2023, respectively. Blackstone’s intangible assets as of cash flows. March 31, 2019 are expected to amortize over a weighted-average period of 8.4 years.

4.

Investments

Investments consist of the following:

                                                      
   March 31,  December 31,
   2019  2018

Investments of Consolidated Blackstone Funds

   $8,603,847    $8,376,338 

Equity Method Investments


Partnership Investments

   3,815,993    3,649,423 

Accrued Performance Allocations

   6,486,450    5,883,924 

Corporate Treasury Investments

   2,005,174    2,206,493 

Other Investments

   269,486    260,853 


   $21,180,950    $20,377,031 


Blackstone’s share of Investments of Consolidated Blackstone Funds totaled $384.7 million and $366.5 million at March 31, 2019 and December 31, 2018, respectively.

The new guidance was effective for Blackstone beginning on January 1, 2018 and was adopted on a retrospective basis. Under the new guidance, reporting entities are required to explain the changes in the combined total of restricted and unrestricted balances in the statement of cash flows. Therefore, amounts generally described as restricted cash or restricted cash equivalents (hereinafter referred to as “restricted cash”) should be combined with unrestricted cash and cash equivalents when reconciling the beginning and end of period

Group L.P.

THE BLACKSTONE GROUP L.P.

Notes to Condensed Consolidated Financial Statements—Statements (Unaudited) - Continued

(All Dollars Are in Thousands, Except Unit and Per Unit Data, Except Where Noted)


balances on the statement of cash flows. Reporting entities are also required to disclose how the statement of cash flows reconciles to the balance sheet in any situation in which the balance sheet includes more than one line item of cash, cash equivalents, and restricted cash. For the six months ended June 30, 2017 the new guidance resulted in a decrease in Net Cash Used in Operating Activities of $463.5 million, a decrease in Net Cash Provided by Investing Activities of $18.0 million, and an increase in Effect of Exchange Rate Changes on Cash and Cash Equivalents, Cash Held by Blackstone Funds, and Restricted Cash of $58.3 million. Additionally, the new guidance increased the December 31, 2016 Beginning of Period and June 30, 2017 End of Period balances by $1.0 billion and $1.5 billion, respectively, in the Condensed Consolidated Statement of Cash Flows for the six months ended June 30, 2017.

3.

INTANGIBLE ASSETS

Intangible Assets, Net consists of the following:

   June 30,
2018
   December 31,
2017
 

Finite-Lived Intangible Assets / Contractual Rights

  $1,594,876   $1,594,876 

Accumulated Amortization

   (1,214,032   (1,185,048


Intangible Assets, Net

  $380,844   $409,828 


Amortization expense associated with Blackstone’s intangible assets was $14.5 million and $29.0 million for the three and six month periods ended June 30, 2018, respectively, and $11.0 million and $21.9 million for the three and six month periods ended June 30, 2017, respectively.

Amortization of Intangible Assets held at June 30, 2018 is expected to be $57.9 million, $57.9 million, $57.9 million, $57.9 million, and $50.2 million for each of the years ending December 31, 2018, 2019, 2020, 2021 and 2022, respectively. Blackstone’s intangible assets as of June 30, 2018 are expected to amortize over a weighted-average period of 8.8 years.

4.

INVESTMENTS

Investments consist of the following:

   June 30,
2018
   December 31,
2017
 

Investments of Consolidated Blackstone Funds

  $8,608,565   $12,954,121 

Equity Method Investments


Partnership Investments

   3,589,234    3,263,131 

Accrued Performance Allocations

   6,354,179    5,328,280 

Corporate Treasury Investments

   3,088,001    2,566,043 

Other Investments

   368,203    322,474 


  $22,008,182   $24,434,049 


Blackstone’s share of Investments of Consolidated Blackstone Funds totaled $373.5 million and $488.4 million at June 30, 2018 and December 31, 2017, respectively.

THE BLACKSTONE GROUP L.P.

Notes to Condensed Consolidated Financial Statements—Continued

(All Dollars Are in Thousands, Except Unit and Per Unit Data, Except Where Noted)

Investments of Consolidated Blackstone Funds

The following table presents the Realized and Net Change in Unrealized Gains (Losses) on investments held by the consolidated Blackstone Funds and a reconciliation to Other Income – Net Gains from Fund Investment Activities in the Condensed Consolidated Statements of Operations:


   Three Months Ended
June 30,
   Six Months Ended
June 30,
 
   2018  2017   2018   2017 

Realized Gains

  $52,236  $51,777   $34,378   $107,685 

Net Change in Unrealized Gains (Losses)

   (22,278  19,483    74,963    (9,039


Realized and Net Change in Unrealized Gains from Consolidated Blackstone Funds

   29,958   71,260    109,341    98,646 

Interest and Dividend Revenue Attributable to Consolidated Blackstone Funds

   43,561   38,794    74,777    77,540 


Other Income — Net Gains from Fund Investment Activities

  $73,519  $110,054   $184,118   $176,186 


   Three Months Ended March 31,
   2019 2018

Realized Losses

   $(2,912  $(17,858

Net Change in Unrealized Gains

   106,003   97,241 


Realized and Net Change in Unrealized Gains from Consolidated Blackstone Funds

   103,091   79,383 

Interest and Dividend Revenue Attributable to Consolidated Blackstone Funds

   27,234   31,216 


Other Income - Net Gains from Fund Investment Activities

   $130,325   $110,599 


Equity Method Investments

Blackstone’s equity method investments include Partnership Investments, which represent the pro ratapro-rata investments, and any associated Accrued Performance Allocations in private equity funds, real estate funds, funds of hedge funds and credit-focused funds. Partnership Investments also includes the 40%non-controlling interest in Pátria Investments Limited and Pátria Investimentos Ltda. (collectively, “Pátria”).

Blackstone evaluates each of its equity method investments, excluding Accrued Performance Allocations, to determine if any were significant as defined by guidance from the United States Securities and Exchange Commission. As of and for the sixthree months ended June 30,March 31, 2019 and 2018, and 2017, no individual equity method investment held by Blackstone met the significance criteria. As such, Blackstone is not required to present separate financial statements for any of its equity method investments.

Partnership Investments

Blackstone recognized net gains related to its Partnership Investments accounted for under the equity method of $165.6$155.4 million and $124.1$162.5 million for the three months ended June 30,March 31, 2019 and 2018, and 2017, respectively. The Partnership recognized net gains related to its equity method investments of $328.1 million and $292.6 million for the six months ended June 30, 2018 and 2017, respectively.

THE BLACKSTONE GROUP L.P.

Notes to Condensed Consolidated Financial Statements—Continued

(All Dollars Are in Thousands, Except Unit and Per Unit Data, Except Where Noted)

Accrued Performance Allocations

Accrued Performance Allocations to the Partnership in respect of performance of certain Blackstone Funds were as follows:


 Private
Equity
 Real Estate Hedge Fund
Solutions
 Credit Total   Real Private Hedge Fund    

Accrued Performance Allocations,
December 31, 2017

 $1,916,971  $2,859,307  $13,802  $538,200  $5,328,280 
  Estate Equity Solutions Credit Total

Accrued Performance Allocations, December 31, 2018

   $2,853,261   $2,642,119   $22,921   $365,623   $5,883,924 

Performance Allocations as a Result of Changes in Fund Fair Values

  1,110,884   606,245   17,384   144,893   1,879,406    446,166   390,972   17,070   63,564   917,772 

Foreign Exchange Loss

  —     (37,950  —     —     (37,950   (11,398           (11,398

Fund Distributions

  (217,712  (484,316  (7,081  (106,448  (815,557   (101,274  (193,415  (497  (8,662  (303,848


Accrued Performance Allocations, June 30, 2018

 $2,810,143  $2,943,286  $24,105  $576,645  $6,354,179 

Accrued Performance Allocations, March 31, 2019

   $3,186,755   $2,839,676   $39,494   $420,525   $6,486,450 


The Blackstone Group L.P.

Notes to Condensed Consolidated Financial Statements (Unaudited) - Continued

(All Dollars Are in Thousands, Except Unit and Per Unit Data, Except Where Noted)

Corporate Treasury Investments

The portion of corporate treasury investments included in Investments represents the Partnership’s investments into primarily fixed income securities, mutual fund interests, and other fund interests. These strategies are managed by a combination of Blackstone personnel and third party advisors. The following table presents the Realized and Net Change in Unrealized Gains (Losses) on these investments:


  Three Months Ended
June 30,
   Six Months Ended
June 30,
   Three Months Ended March 31,
  2018 2017   2018 2017   2019  2018

Realized Gains (Losses)

  $4,774  $2,252   $7,113  $(3,429

Realized Gains

   $317    $2,339 

Net Change in Unrealized Gains (Losses)

   (6,702  12,815    (14,896  43,295    48,659    (8,194


  $(1,928) $15,067   $(7,783) $39,866    $48,976    $(5,855


Other Investments

Other Investments consist primarily of proprietary investment securities held by Blackstone. Other investments includesInvestments include equity investments without readily determinable fair values which have a carrying value of $24.5$44.0 million as of June 30, 2018. During the three months ended June 30, 2018, an investment which previously did not have a readily determinable fair value completed an initial public offering and is now carried at fair value with realized and unrealized gains or losses recorded within Investment Income on the Condensed Consolidated Statement of Operations. This event resulted in an unrealized gain of $50.0 million during the three and six months ended June 30, 2018.March 31, 2019. The following table presents Blackstone’s Realized and Net Change in Unrealized Gains (Losses) in Other Investments:


   Three Months Ended
June 30,
   Six Months Ended
June 30,
 
   2018   2017   2018   2017 

Realized Gains

  $16,207   $2,865   $16,319   $2,870 

Net Change in Unrealized Gains

   49,643    4,803    45,411    10,291 


  $65,850   $7,668   $61,730   $13,161 


THE BLACKSTONE GROUP L.P.

Notes to Condensed Consolidated Financial Statements—Continued

(All Dollars Are in Thousands, Except Unit and Per Unit Data, Except Where Noted)

                                                      
   Three Months Ended March 31,
   2019  2018

Realized Gains

   $24,236    $112 

Net Change in Unrealized Gains (Losses)

   10,722    (4,232


   $34,958    $(4,120


5.

NET ASSET VALUE AS FAIR VALUENet Asset Value as Fair Value

A summary of fair value by strategy type alongside the remaining unfunded commitments and ability to redeem such investments as of June 30, 2018March 31, 2019 is presented below:


        Redemption  
     Unfunded  Frequency Redemption

Strategy

  Fair Value   Unfunded
Commitments
   Redemption
Frequency
(if currently
eligible)
 Redemption
Notice Period
   Fair Value  Commitments  (if currently eligible) Notice Period

Diversified Instruments

  $209,697   $131    (a  (a   $213,598    $130    (a)   (a) 

Credit Driven

   114,592    268    (b  (b   85,520    268    (b)   (b) 

Equity

   38,839    —      (c  (c   38,786        (c)   (c) 

Commodities

   1,806    —      (d  (d   1,686        (d)   (d) 


  $364,934   $399       $339,590    $398    


(a)

Diversified Instruments include investments in funds that invest across multiple strategies. Investments representing 3% of the fair value of the investments in this category may not be redeemed at, or within three months of, the reporting date. The remaining 97% of investments in this category are redeemable as of the reporting date.

(b)

The Credit Driven category includes investments in hedge funds that invest primarily in domestic and international bonds. Investments representing 41%31% of the fair value of the investments in this category may not be redeemed at, or within three months of, the reporting date. The remaining 59%69% of investments in this category are redeemable as of the reporting date.

(c)

The Equity category includes investments in hedge funds that invest primarily in domestic and international equity securities. Investments representing 100% of the fair value of the investments in this category may not be redeemed at, or within three months of, the reporting date. As of the reporting date, the investee fund manager had elected to side-pocket 8% of Blackstone’s investments in the category.

The Blackstone Group L.P.

Notes to Condensed Consolidated Financial Statements (Unaudited) - Continued

(All Dollars Are in Thousands, Except Unit and Per Unit Data, Except Where Noted)

(d)

The Commodities category includes investments in commodities-focused funds that primarily invest in futures and physical-based commodity driven strategies. Investments representing 100% of the fair value of the investments in this category may not be redeemed at, or within three months of, the reporting date.


6.

DERIVATIVE FINANCIAL INSTRUMENTSDerivative Financial Instruments

Blackstone and the consolidated Blackstone Funds enter into derivative contracts in the normal course of business to achieve certain risk management objectives and for general investment purposes. Blackstone may enter into derivative contracts in order to hedge its interest rate risk exposure against the effects of interest rate changes. Additionally, Blackstone may also enter into derivative contracts in order to hedge its foreign currency risk exposure against the effects of a portion of itsnon-U.S. dollar denominated currency net investments. As a result of the use of derivative contracts, Blackstone and the consolidated Blackstone Funds are exposed to the risk that counterparties will fail to fulfill their contractual obligations. To mitigate such counterparty risk, Blackstone and the consolidated Blackstone Funds enter into contracts with certain major financial institutions, all of which have investment grade ratings. Counterparty credit risk is evaluated in determining the fair value of derivative instruments.

Net Investment Hedges

To manage the potential exposure from adverse changes in currency exchange rates arising from Blackstone’s net investment in foreign operations, during December 2014, Blackstone entered into several foreign currency

THE BLACKSTONE GROUP L.P.

Notes to Condensed Consolidated Financial Statements—Continued

(All Dollars Are in Thousands, Except Unit and Per Unit Data, Except Where Noted)

forward contracts to hedge a portion of the net investment in Blackstone’snon-U.S. dollar denominated foreign operations.

Blackstone uses foreign currency forward contracts to hedge portions of Blackstone’s net investments in foreign operations. The gains and losses due to change in fair value attributable to changes in spot exchange rates on foreign currency derivatives designated as net investment hedges were recognized in Other Comprehensive Income, Net of Tax - Currency Translation Adjustment. For the three months ended June 30, 2018March 31, 2019 there was no resulting gain or loss. For the six months ended June 30, 2018 the resulting loss was $1.4 million.

Freestanding Derivatives

Freestanding derivatives are instruments that Blackstone and certain of the consolidated Blackstone Funds have entered into as part of their overall risk management and investment strategies. These derivative contracts are not designated as hedging instruments for accounting purposes. Such contracts may include interest rate swaps, foreign exchange contracts, equity swaps, options, futures and other derivative contracts.

The Blackstone Group L.P.

Notes to Condensed Consolidated Financial Statements (Unaudited) - Continued

(All Dollars Are in Thousands, Except Unit and Per Unit Data, Except Where Noted)

The table below summarizes the aggregate notional amount and fair value of the derivative financial instruments. The notional amount represents the absolute value amount of all outstanding derivative contracts.


  June 30, 2018  December 31, 2017 
  Assets  Liabilities  Assets  Liabilities 
  Notional  Fair
Value
  Notional  Fair
Value
  Notional  Fair
Value
  Notional  Fair
Value
 

Net Investment Hedges


Foreign Currency Contracts

 $—    $—    $—    $—    $—    $—    $50,857  $453 


Freestanding Derivatives


Blackstone


Interest Rate Contracts

  944,822   22,123   922,672   48,711   225,550   2,042   1,530,751   27,275 

Foreign Currency Contracts

  198,028   782   98,298   570   279,050   2,097   296,252   2,975 

Credit Default Swaps

  5,001   125   20,532   2,168   2,073   304   2,073   304 

Investments of Consolidated Blackstone Funds


Foreign Currency Contracts

  114,194   5,295   11,099   1,087   493,181   24,087   264,693   5,628 

Credit Default Swaps

  32,306   1,565   50,056   4,839   45,670   3,731   45,582   5,163 

Total Return Swaps

  25,325   488   —     —     25,645   526   —     —   


  1,319,676   30,378   1,102,657   57,375   1,071,169   32,787   2,139,351   41,345 


 $1,319,676  $30,378  $1,102,657  $57,375  $1,071,169  $32,787  $2,190,208  $41,798 


THE BLACKSTONE GROUP L.P.

Notes to Condensed Consolidated Financial Statements—Continued

(All Dollars Are in Thousands, Except Unit and Per Unit Data, Except Where Noted)

                                                                                                                                                
   March 31, 2019  December 31, 2018
   Assets  Liabilities  Assets  Liabilities
      Fair     Fair     Fair     Fair
   Notional  Value  Notional  Value  Notional  Value  Notional  Value

Freestanding Derivatives


Blackstone


Interest Rate Contracts

   $380,710    $14,101    $1,078,852    $17,820    $798,137    $43,632    $844,620    $39,164 

Foreign Currency Contracts

   106,502    899    229,075    1,833    224,841    1,286    245,371    1,636 

Credit Default Swaps

   2,052    118    35,037    2,178            34,060    4,004 

Investments of Consolidated Blackstone Funds


Foreign Currency Contracts

   14,205    279    121,184    900    108,271    524    16,952    164 

Interest Rate Contracts

   8,500    19    11,000    369            10,000    311 

Credit Default Swaps

           73,212    2,373    20,952    55    46,685    5,710 

Total Return Swaps

   2,089    15    28,527    776            31,440    1,855 

Equity Options

   1    39                         


   514,059    15,470    1,576,887    26,249    1,152,201    45,497    1,229,128    52,844 


   $514,059    $15,470    $1,576,887    $26,249    $1,152,201    $45,497    $1,229,128    $52,844 


The table below summarizes the impact to the Condensed Consolidated Statements of Operations from derivative financial instruments:


  Three Months Ended
June 30,
 Six Months Ended
June 30,
   Three Months Ended March 31,
  2018 2017 2018 2017   2019 2018

Net Investment Hedges — Foreign Currency Contracts


Net Investment Hedges - Foreign Currency Contracts


Hedge Ineffectiveness

  $—    $(13 $(8 $(35  $  $(8


Freestanding Derivatives


Realized Gains (Losses)


Interest Rate Contracts

  $449  $(3,007 $2,070  $(3,947  $(2,248 $1,621 

Foreign Currency Contracts

   12,321   (6,663  8,238   (3,312   1,672   (4,083

Credit Default Swaps

   (107  268   (508  (1,658   1,110   (401

Total Return Swaps

   173   —     174   —      (120  1 

Equity Options

   (8   


   $406  $(2,862
  $12,836  $(9,402 $9,974  $(8,917  


Net Change in Unrealized Gains (Losses)


Interest Rate Contracts

  $37,261  $(426 $(39 $(643  $(8,263 $(37,300

Foreign Currency Contracts

   1,456   14,642   (2,272  12,682    (1,564  (3,728

Credit Default Swaps

   615   1,214   488   3,161    3,941   (127

Total Return Swaps

   (5  —     52   —      978   57 

Equity Options

   (50   


  $39,327  $15,430  $(1,771 $15,200   $(4,958 $(41,098


As of June 30, 2018 and December 31, 2017, the Partnership had not designated any derivatives as cash flow hedges.

The Blackstone Group L.P.

THE BLACKSTONE GROUP L.P.

Notes to Condensed Consolidated Financial Statements—Statements (Unaudited) - Continued

(All Dollars Are in Thousands, Except Unit and Per Unit Data, Except Where Noted)

As of March 31, 2019 and December 31, 2018, the Partnership had not designated any derivatives as cash flow hedges.


7.

FAIR VALUE OPTIONFair Value Option

The following table summarizes the financial instruments for which the fair value option has been elected:


  March 31,  December 31,
  June 30,
2018
   December 31,
2017
   2019  2018

Assets


Loans and Receivables

  $346,603   $239,659    $208,226    $304,173 

Equity and Preferred Securities

   502,095    475,485    414,804    390,095 

Debt Securities

   522,033    418,061    548,440    529,698 

Assets of Consolidated CLO Vehicles


Corporate Loans

   7,082,085    10,825,759    6,965,348    6,766,700 

Corporate Bonds

   —      690,125 

Other

   —      458 


  $8,452,816   $12,649,547    $8,136,818    $7,990,666 


Liabilities


Liabilities of Consolidated CLO Vehicles


Senior Secured Notes


Loans Payable

  $6,528,326   $10,594,656    $6,484,323    $6,473,233 

Due to Affiliates

   3,269    996    42,733    3,201 

Subordinated Notes


Loans Payable

   175,900    703,164    76,457    7,478 

Due to Affiliates

   63,279    40,390    49,976    52,811 


  $6,770,774   $11,339,206    $6,653,489    $6,536,723 


The following tablestable presents the Realized and Net Change in Unrealized Gains (Losses) on financial instruments on which the fair value option was elected:


   Three Months Ended June 30, 
   2018  2017 
   Realized
Gains
   Net Change
in Unrealized
Gains (Losses)
  Realized
Gains (Losses)
  Net Change
in Unrealized
Gains (Losses)
 

Assets


Equity and Preferred Securities

  $—     $(2,095 $1  $7,116 

Debt Securities

   15    (2,878  —     —   

Assets of Consolidated CLO Vehicles


Corporate Loans

   1,074    (25,896  (543  25,084 

Corporate Bonds

   —      —     2,580   (927

Other

   —      —     65   129 


  $1,089   $(30,869 $2,103  $31,402 


Liabilities


Liabilities of Consolidated CLO Vehicles —


Subordinated Notes

  $—     $16,846  $—    $24,800 


   Three Months Ended March 31,
   2019 2018
     Net Change   Net Change
   Realized in Unrealized Realized in Unrealized
   Gains (Losses) Gains (Losses) Gains (Losses) Gains

Assets


Loans and Receivables

   $(1,084  $(760  $   $ 

Equity and Preferred Securities

   1   22,365      228 

Debt Securities

   (35  14,932   812   581 

Assets of Consolidated CLO Vehicles


Corporate Loans

   (3,851  179,802   (5,473  18,850 

Corporate Bonds

         (24,056  9,693 

Other

            6 


   $(4,969  $216,339   $(28,717  $29,358 


Liabilities


Liabilities of Consolidated CLO Vehicles


Senior Secured Notes

   $   $(51,560  $   $ 

Subordinated Notes

      (66,144     43,614 


   $   $(117,704  $   $43,614 


The Blackstone Group L.P.

THE BLACKSTONE GROUP L.P.

Notes to Condensed Consolidated Financial Statements—Statements (Unaudited) - Continued

(All Dollars Are in Thousands, Except Unit and Per Unit Data, Except Where Noted)


   Six Months Ended June 30, 
   2018  2017 
   Realized
Gains (Losses)
  Net Change
in Unrealized
Gains (Losses)
  Realized
Gains
   Net Change
in Unrealized
Gains (Losses)
 

Assets


Loans and Receivables

  $—    $—    $—     $7,418 

Equity and Preferred Securities

   —     (1,867  1    20,225 

Debt Securities

   827   (2,297  —      —   

Assets of Consolidated CLO Vehicles


Corporate Loans

   (4,399  (7,046  1,329    13,695 

Corporate Bonds

   (24,056  9,693   8,214    (6,801

Other

   —     6   65    129 


  $(27,628 $(1,511 $9,609   $34,666 


Liabilities


Liabilities of Consolidated CLO Vehicles —


Subordinated Notes

  $—    $60,460 ��$—     $32,712 


The following table presents information for those financial instruments for which the fair value option was elected:


  March 31, 2019  December 31, 2018
    For Financial Assets    For Financial Assets
    Past Due (a)    Past Due (a)
 June 30, 2018 December 31, 2017   (Deficiency)    Excess  Excess
(Deficiency)
    Excess
   For Financial Assets
Past  Due (a)
   For Financial Assets
Past Due (a)
   of Fair Value Fair  of Fair Value  of Fair Value Fair  of Fair Value
 Excess
(Deficiency)
of Fair Value
Over Principal
 Fair
Value
 Excess
of Fair Value
Over Principal
 Excess
(Deficiency) of
Fair Value
Over Principal
 Fair
Value
 (Deficiency)
of Fair Value
Over Principal
   Over Principal       Value        Over Principal  Over Principal       Value        Over Principal

Loans and Receivables

 $933  $—    $—    $1,207  $—    $—      $(149  $    $    $2,421   $    $ 

Debt Securities

  (2,131  —     —     (372  —     —      2,697           (26,660       

Assets of Consolidated CLO Vehicles


Corporate Loans

  (10,752  —     —     (13,495  57,778   (19,633   (126,907          (301,085       

Corporate Bonds

  —     —     —     (21,455  —     —   


 $(11,950 $—    $—    $(34,115 $57,778  $(19,633   $        (124,359  $    $    $(325,324  $    $ 


(a)

Corporate Loans and Corporate Bonds within CLO assets are classified as past due if contractual payments are more than one day past due.

As of June 30, 2018March 31, 2019 and December 31, 2017,2018, no Loans and Receivables for which the fair value option was elected were past due or innon-accrual status. As of June 30, 2018March 31, 2019 and December 31, 2017,2018, no Corporate Bonds included within the Assets of Consolidated CLO Vehicles for which the fair value option was elected were past due or innon-accrual status.

THE BLACKSTONE GROUPThe Blackstone Group L.P.

Notes to Condensed Consolidated Financial Statements—Statements (Unaudited) - Continued

(All Dollars Are in Thousands, Except Unit and Per Unit Data, Except Where Noted)


8.

FAIR VALUE MEASUREMENTS OF FINANCIAL INSTRUMENTSFair Value Measurements of Financial Instruments

The following tables summarize the valuation of the Partnership’s financial assets and liabilities by the fair value hierarchy:


   June 30, 2018 
   Level I   Level II   Level III   NAV   Total 

Assets


Cash and Cash Equivalents — Money Market Funds

  $538,418   $—     $—     $—     $538,418 


Investments


Investments of Consolidated Blackstone Funds (a)


Investment Funds

   —      —      —      86,463    86,463 

Equity Securities

   51,212    51,051    159,109    —      261,372 

Partnership and LLC Interests

   —      1,527    313,992    —      315,519 

Debt Instruments

   —      771,977    83,801    —      855,778 

Freestanding Derivatives


Foreign Currency Contracts

   —      5,295    —      —      5,295 

Credit Default Swaps

   —      1,565    —      —      1,565 

Total Return Swaps

   —      488    —      —      488 

Assets of Consolidated CLO Vehicles —Corporate Loans

   —      6,552,263    529,822    —      7,082,085 


Total Investments of Consolidated Blackstone Funds

   51,212    7,384,166    1,086,724    86,463    8,608,565 


Corporate Treasury Investments


Equity Securities

   309,131    —      —      —      309,131 

Debt Instruments

   —      2,491,430    28,221    —      2,519,651 

Other

   —      —      —      259,219    259,219 


Total Corporate Treasury Investments

   309,131    2,491,430    28,221    259,219    3,088,001 


Other Investments

   248,494    13,955    86,502    19,252    368,203 


Total Investments

   608,837    9,889,551    1,201,447    364,934    12,064,769 


Accounts Receivable — Loans and Receivables

   —      —      346,603    —      346,603 


Other Assets


Freestanding Derivatives


Interest Rate Contracts

   935    21,188    —      —      22,123 

Foreign Currency Contracts

   —      782    —      —      782 

Credit Default Swaps

   —      125    —      —      125 


Total Other Assets

   935    22,095    —      —      23,030 


  $1,148,190   $9,911,646   $1,548,050   $364,934   $12,972,820 


   March 31, 2019
   Level I  Level II  Level III  NAV  Total

Assets


Cash and Cash Equivalents - Money Market Funds and Short-Term Investments

   $462,734    $    $    $    $462,734 


Investments


Investments of Consolidated Blackstone Funds (a)


Investment Funds

               65,478    65,478 

Equity Securities

   36,300    45,867    197,096        279,263 

Partnership and LLC Interests

       10,912    362,047        372,959 

Debt Instruments

       794,631    125,816        920,447 

Freestanding Derivatives


Foreign Currency Contracts

       279            279 

Total Return Swaps

       15            15 

Interest Rate Swaps

       19            19 

Other

       39            39 

Assets of Consolidated CLO Vehicles


Corporate Loans

       6,406,507    558,841        6,965,348 


Total Investments of Consolidated Blackstone Funds

   36,300    7,258,269    1,243,800    65,478    8,603,847 


Corporate Treasury Investments


Equity Securities

   242,696��               242,696 

Debt Instruments

   41,923    1,420,827    32,804        1,495,554 

Other

               266,924    266,924 


Total Corporate Treasury Investments

   284,619    1,420,827    32,804    266,924    2,005,174 


Other Investments

   193,200        26,329    7,188    226,717 


Total Investments

   514,119    8,679,096    1,302,933    339,590    10,835,738 


Accounts Receivable - Loans and Receivables

           208,226        208,226 


Other Assets


Freestanding Derivatives


Interest Rate Contracts

   479    13,622            14,101 

Foreign Currency Contracts

       899            899 

Credit Default Swaps

       118            118 


Total Other Assets

   479    14,639            15,118 


   $977,332    $8,693,735    $1,511,159    $339,590    $11,521,816 


The Blackstone Group L.P.

THE BLACKSTONE GROUP L.P.

Notes to Condensed Consolidated Financial Statements—Statements (Unaudited) - Continued

(All Dollars Are in Thousands, Except Unit and Per Unit Data, Except Where Noted)


   June 30, 2018 
   Level I   Level II   Level III   Total 

Liabilities


Loans Payable — Liabilities of Consolidated CLO Vehicles (a)


Senior Secured Notes (b)

  $—     $6,528,326   $—     $6,528,326 

Subordinated Notes (b)

   —      175,900    —      175,900 


Total Loans Payable

   —      6,704,226    —      6,704,226 


Due to Affiliates — Liabilities of Consolidated CLO Vehicles (a)


Senior Secured Notes (b)

   —      3,269    —      3,269 

Subordinated Notes (b)

   —      63,279    —      63,279 


Total Due to Affiliates

   —      66,548    —      66,548 


Securities Sold, Not Yet Purchased

   —      155,780    —      155,780 


Accounts Payable, Accrued Expenses and Other Liabilities


Liabilities of Consolidated Blackstone Funds — Freestanding Derivatives (a)


Foreign Currency Contracts

   —      1,087    —      1,087 

Credit Default Swaps

   —      4,839    —      4,839 


Total Liabilities of Consolidated Blackstone Funds

   —      5,926    —      5,926 


Freestanding Derivatives


Interest Rate Contracts

   551    48,160    —      48,711 

Foreign Currency Contracts

   —      570    —      570 

Credit Default Swaps

   —      2,168    —      2,168 


Total Freestanding Derivatives

   551    50,898    —      51,449 


Total Accounts Payable, Accrued Expenses and Other Liabilities

   551    56,824    —      57,375 


  $551   $6,983,378   $—     $6,983,929 


   March 31, 2019
   Level I  Level II  Level III  Total

Liabilities


Loans Payable - Liabilities of Consolidated CLO Vehicles (a)


Senior Secured Notes (b)

   $    $6,484,323    $    $6,484,323 

Subordinated Notes (b)

       76,457        76,457 


Total Loans Payable

       6,560,780        6,560,780 


Due to Affiliates - Liabilities of Consolidated CLO Vehicles (a)


Senior Secured Notes (b)

       42,733        42,733 

Subordinated Notes (b)

       49,976        49,976 


Total Due to Affiliates

       92,709        92,709 


Securities Sold, Not Yet Purchased

   33,035    95,071        128,106 


Accounts Payable, Accrued Expenses and Other Liabilities


Liabilities of Consolidated Blackstone Funds - Freestanding Derivatives (a)


Foreign Currency Contracts

       900        900 

Credit Default Swaps

       2,373        2,373 

Total Return Swaps

       776        776 

Interest Rate Swaps

       369        369 


Total Liabilities of Consolidated Blackstone Funds

       4,418        4,418 


Freestanding Derivatives


Interest Rate Contracts

   885    16,935        17,820 

Foreign Currency Contracts

       1,833        1,833 

Credit Default Swaps

       2,178        2,178 


Total Freestanding Derivatives

   885    20,946        21,831 


Total Accounts Payable, Accrued Expenses and Other Liabilities

   885    25,364        26,249 


   $33,920    $6,773,924    $    $6,807,844 


THE BLACKSTONE GROUP

The Blackstone Group L.P.

Notes to Condensed Consolidated Financial Statements—Statements (Unaudited) - Continued

(All Dollars Are in Thousands, Except Unit and Per Unit Data, Except Where Noted)


   December 31, 2017 
   Level I   Level II   Level III   NAV   Total 

Assets


Cash and Cash Equivalents — Money Market Funds

  $853,680   $—     $—     $—     $853,680 


Investments


Investments of Consolidated Blackstone Funds (a)


Investment Funds

   —      —      —      130,339    130,339 

Equity Securities

   67,443    44,026    131,867    —      243,336 

Partnership and LLC Interests

   —      2,549    331,448    —      333,997 

Debt Instruments

   —      643,608    58,155    —      701,763 

Freestanding Derivatives


Foreign Currency Contracts

   —      101    —      —      101 

Credit Default Swaps

   —      3,731    —      —      3,731 

Total Return Swaps

   —      526    —      —      526 

Assets of Consolidated CLO Vehicles


Corporate Loans

   —      10,318,316    507,443    —      10,825,759 

Corporate Bonds

   —      690,125    —      —      690,125 

Freestanding Derivatives — Foreign Currency Contracts

   —      23,986    —      —      23,986 

Other

   —      —      458    —      458 


Total Investments of Consolidated Blackstone Funds

   67,443    11,726,968    1,029,371    130,339    12,954,121 


Corporate Treasury Investments


Equity Securities

   282,866    —      —      —      282,866 

Debt Instruments

   —      1,943,654    24,249    —      1,967,903 

Other

   —      —      —      315,274    315,274 


Total Corporate Treasury Investments

   282,866    1,943,654    24,249    315,274    2,566,043 


Other Investments

   193,072    14,162    95,393    19,847    322,474 


Total Investments

   543,381    13,684,784    1,149,013    465,460    15,842,638 


Accounts Receivable — Loans and Receivables

   —      —      239,659    —      239,659 


Other Assets


Freestanding Derivatives


Interest Rate Contracts

   575    1,467    —      —      2,042 

Foreign Currency Contracts

   —      2,097    —      —      2,097 

Credit Default Swaps

   —      304    —      —      304 


Total Other Assets

   575    3,868    —      —      4,443 


  $1,397,636   $13,688,652   $1,388,672   $465,460   $16,940,420 


   December 31, 2018
   Level I  Level II  Level III  NAV  Total

Assets


Cash and Cash Equivalents - Money Market Funds and Short-Term Investments

   $623,526    $    $    $    $623,526 


Investments


Investments of Consolidated Blackstone Funds (a)


Investment Funds

               80,726    80,726 

Equity Securities

   42,937    34,946    201,566        279,449 

Partnership and LLC Interests

       7,170    355,273        362,443 

Debt Instruments

       752,622    133,819        886,441 

Freestanding Derivatives


Foreign Currency Contracts

       524            524 

Credit Default Swaps

       55            55 

Assets of Consolidated CLO Vehicles


Corporate Loans

       6,093,342    673,358        6,766,700 


Total Investments of Consolidated Blackstone Funds

   42,937    6,888,659    1,364,016    80,726    8,376,338 


Corporate Treasury Investments


Equity Securities

   233,834                233,834 

Debt Instruments

   243,297    1,444,968    24,568        1,712,833 

Other

               259,826    259,826 


Total Corporate Treasury Investments

   477,131    1,444,968    24,568    259,826    2,206,493 


Other Investments

   176,432        31,617    7,581    215,630 


Total Investments

   696,500    8,333,627    1,420,201    348,133    10,798,461 


Accounts Receivable - Loans and Receivables

           304,173        304,173 


Other Assets


Freestanding Derivatives


Interest Rate Contracts

   1,274    42,358            43,632 

Foreign Currency Contracts

       1,286            1,286 


Total Other Assets

   1,274    43,644            44,918 


   $1,321,300    $8,377,271    $1,724,374    $348,133    $11,771,078 


THE BLACKSTONE GROUP

The Blackstone Group L.P.

Notes to Condensed Consolidated Financial Statements—Statements (Unaudited) - Continued

(All Dollars Are in Thousands, Except Unit and Per Unit Data, Except Where Noted)


   December 31, 2017 
   Level I   Level II   Level III   Total 

Liabilities


Loans Payable — Liabilities of Consolidated CLO Vehicles (a)


Senior Secured Notes (b)

  $—     $10,594,656   $—     $10,594,656 

Subordinated Notes (b)

   —      703,164    —      703,164 


Total Loans Payable

   —      11,297,820    —      11,297,820 


Due to Affiliates — Liabilities of Consolidated CLO Vehicles (a)


Senior Secured Notes (b)

   —      996    —      996 

Subordinated Notes (b)

   —      40,390    —      40,390 


Total Due to Affiliates

   —      41,386    —      41,386 


Securities Sold, Not Yet Purchased

   —      154,380    —      154,380 


Accounts Payable, Accrued Expenses and Other Liabilities


Liabilities of Consolidated Blackstone Funds — Freestanding Derivatives (a)


Foreign Currency Contracts

   —      5,628    —      5,628 

Credit Default Swaps

   —      5,163    —      5,163 


Total Liabilities of Consolidated Blackstone Funds

   —      10,791    —      10,791 


Freestanding Derivatives


Interest Rate Contracts

   415    26,860    —      27,275 

Foreign Currency Contracts

   —      2,975    —      2,975 

Credit Default Swaps

   —      304    —      304 


Total Freestanding Derivatives

   415    30,139    —      30,554 


Net Investment Hedges — Foreign Currency Contracts

   —      453    —      453 


Total Accounts Payable, Accrued Expenses and Other Liabilities

   415    41,383    —      41,798 


  $415   $11,534,969   $—     $11,535,384 


   December 31, 2018
   Level I  Level II  Level III  Total

Liabilities


Loans Payable - Liabilities of Consolidated CLO Vehicles (a)


Senior Secured Notes (b)

   $    $6,473,233    $    $6,473,233 

Subordinated Notes (b)

       7,478        7,478 


Total Loans Payable

       6,480,711        6,480,711 


Due to Affiliates - Liabilities of Consolidated CLO Vehicles (a)


Senior Secured Notes (b)

       3,201        3,201 

Subordinated Notes (b)

       52,811        52,811 


Total Due to Affiliates

       56,012        56,012 


Securities Sold, Not Yet Purchased

   35,959    106,658        142,617 


Accounts Payable, Accrued Expenses and Other Liabilities


Liabilities of Consolidated Blackstone Funds - Freestanding Derivatives (a)


Foreign Currency Contracts

       164        164 

Credit Default Swaps

       5,710        5,710 

Total Return Swaps

       1,855        1,855 

Interest Rate Swaps

       311        311 


Total Liabilities of Consolidated Blackstone Funds

       8,040        8,040 


Freestanding Derivatives


Interest Rate Contracts

   3,080    36,084        39,164 

Foreign Currency Contracts

       1,636        1,636 

Credit Default Swaps

       4,004        4,004 


Total Freestanding Derivatives

   3,080    41,724        44,804 


Total Accounts Payable, Accrued Expenses and Other Liabilities

   3,080    49,764        52,844 


   $39,039    $6,693,145    $    $6,732,184 


(a)

Pursuant to GAAP consolidation guidance, the Partnership is required to consolidate all VIEs in which it has been identified as the primary beneficiary, including certain CLO vehicles and other funds in which a consolidated entity of the Partnership, such as the general partner of the fund, has a controlling financial interest. While the Partnership is required to consolidate certain funds, including CLO vehicles, for GAAP purposes, the Partnership has no ability to utilize the assets of these funds and there is no recourse to the Partnership for their liabilities since these are client assets and liabilities.

(b)

Senior and subordinatesubordinated notes issued by CLO vehicles are classified based on the more observable fair value of CLO assets less (a)(1) the fair value of any beneficial interests held by Blackstone, and (b)(2) the carrying value of any beneficial interests that represent compensation for services.

The following table summarizes the fair value transfers between Level I and Level II for positions that existed as of June 30, 2018 and 2017, respectively:Blackstone Group L.P.

   Three Months Ended
June 30,
   Six Months Ended
June 30,
 
       2018           2017           2018           2017     

Transfers from Level I into Level II (a)

  $—     $762   $—     $762 

Transfers from Level II into Level I (b)

  $—     $—     $447   $—   

THE BLACKSTONE GROUP L.P.

Notes to Condensed Consolidated Financial Statements—Statements (Unaudited) - Continued

(All Dollars Are in Thousands, Except Unit and Per Unit Data, Except Where Noted)


(a)

Transfers out of Level I represent those financial instruments for which restrictions exist and adjustments were made to an otherwise observable price to reflect fair value at the reporting date.

(b)

Transfers into Level I represent those financial instruments for which an unadjusted quoted price in an active market became available for the identical asset.

The following table summarizes the quantitative inputs and assumptions used for items categorized in Level III of the fair value hierarchy as of June 30, 2018:March 31, 2019:


     Valuation  Unobservable     Weighted-
 Fair Value Valuation
Techniques
 Unobservable
Inputs
 Ranges Weighted-
Average (a)
  Fair Value  

Techniques


Inputs


Ranges

  Average (a)

Financial Assets


Investments of Consolidated Blackstone Funds


Equity Securities

 $118,659  Discounted Cash Flows  Discount Rate  7.1% - 25.7% 12.6%   $157,403   Discounted Cash Flows  Discount Rate  6.9% - 28.5%   13.0% 
    Revenue CAGR  -11.9% - 37.3% 7.1%      Revenue CAGR  -44.6% - 33.4%   7.2% 
    Book Value Multiple  1.1x - 9.5x 8.3x      Book Value Multiple  0.9x - 9.5x   8.9x 
    Exit Capitalization Rate  5.0% - 11.4% 8.1%      Exit Capitalization Rate  4.3% - 11.4%   7.5% 
    Exit Multiple - EBITDA  2.8x - 16.0x 10.2x      Exit Multiple - EBITDA  3.2x - 17.4x   10.7x 
    ExitMultiple - NOI  8.8x - 12.8x 11.0x      Exit Multiple - NOI  12.8x   N/A 
    ExitMultiple - P/E  10.0x - 17.0x 14.2x      Exit Multiple - P/E  17.0x   N/A 
  1,477  Market Comparable Companies  Book Value Multiple  0.7x - 0.9x 0.8x   26,280   Market Comparable Companies  Book Value Multiple  0.9x   N/A 
    ExitMultiple - EBITDA  8.0x N/A      Dollar/Acre Multiple  $7.0 - $34.2   $27.9 
  28,049  Other  N/A  N/A N/A      EBITDA Multiple  8.0x - 13.0x   12.8x 
  10,870  Transaction Price  N/A  N/A N/A   6,423   Other  N/A  N/A   N/A 
  54  Third Party Pricing  N/A  N/A N/A   6,990   Transaction Price  N/A  N/A   N/A 

Partnership and LLC Interests

  267,616  Discounted Cash Flows  Discount Rate  4.6% - 26.5% 9.9%   297,357   Discounted Cash Flows  Discount Rate  3.8% - 26.5%   9.7% 
    Revenue CAGR  -2.1% - 45.5% 7.6%      Revenue CAGR  -6.0% - 33.2%   18.9% 
    Book Value Multiple  8.5x - 9.3x 9.2x      Book Value Multiple  9.3x   N/A 
    Exit Capitalization Rate  1.5% - 25.0% 5.9%      Exit Capitalization Rate  3.0% - 15.0%   6.2% 
    ExitMultiple - EBITDA  0.1x - 28.6x 10.5x      Exit Multiple - EBITDA  3.5x - 15.8x   10.0x 
    ExitMultiple - NOI  12.5x N/A      Exit Multiple - NOI  13.3x   N/A 
  578  Market Comparable Companies  Book Value Multiple  1.0x N/A   9,468   Market Comparable Companies  Book Value Multiple  1.2x   N/A 
  27,668  Other  N/A  N/A N/A      Dollar/Acre Multiple  $6.3 - $12.0   $7.7 
  543  Third Party Pricing  N/A  N/A N/A   2,360   Other  N/A  N/A   N/A 
  17,587  Transaction Price  N/A  N/A N/A   52,862   Transaction Price  N/A  N/A   N/A 

Debt Instruments

  7,384  Discounted Cash Flows  Discount Rate  6.3% - 16.7% 9.5%   9,098   Discounted Cash Flows  Discount Rate  7.0% - 19.3%   9.9% 
    Revenue CAGR  23.6% N/A      Exit Capitalization Rate  4.2%   N/A 
    Exit Capitalization Rate  3.9% N/A      Exit Multiple - EBITDA  6.5x   N/A 
  63,737  Third Party Pricing  N/A  N/A N/A   102,868   Third Party Pricing  N/A  N/A   N/A 
  12,680  Transaction Price  N/A  N/A N/A   26   Other  N/A  N/A   N/A 
   13,824   Transaction Price  N/A  N/A   N/A 

Assets of Consolidated CLO Vehicles

  37  Discounted Cash Flows  Discount Rate  8.0% N/A   40   Discounted Cash Flows  Discount Rate  3.5%   N/A 
  529,785  Third Party Pricing  N/A  N/A N/A   558,801   Third Party Pricing  N/A  N/A   N/A 


Total Investments of Consolidated Blackstone Funds

  1,086,724        1,243,800         


continued …

continued...

THE BLACKSTONE GROUPThe Blackstone Group L.P.

Notes to Condensed Consolidated Financial Statements—Statements (Unaudited) - Continued

(All Dollars Are in Thousands, Except Unit and Per Unit Data, Except Where Noted)


  Fair Value  Valuation
Techniques
 Unobservable
Inputs
  Ranges Weighted-
Average (a)

Corporate Treasury
Investments

 $11,070  Discounted Cash Flows  Discount Rate  0.7% - 6.0% 4.1%
    Default Rate  2.0% N/A
    Pre-payment Rate  20.0% N/A
    Recovery Lag  12 Months N/A
    Recovery Rate  30.0% - 70.0% 68.0%
    Reinvestment Rate  LIBOR + 350bps - LIBOR + 391
    LIBOR + 400bps bps
  17,151  Third Party Pricing  N/A  N/A N/A

Loans and Receivables

  217,709  Discounted Cash Flows  Discount Rate  5.8% - 10.2% 9.0%
  128,894  Transaction Price  N/A  N/A N/A

Other Investments

  61,105  Discounted Cash Flows  Discount Rate  0.7% - 8.9% 1.9%
    Default Rate  2.0% N/A
    Pre-payment Rate  20.0% N/A
    Recovery Lag  12 Months N/A
    Recovery Rate  70.0% N/A
    Reinvestment Rate  LIBOR + 400 bps N/A
  25,397  Transaction Price  N/A  N/A N/A


 $1,548,050     


      Valuation  Unobservable     Weighted-
   Fair Value  

Techniques


Inputs


Ranges

  Average (a)

Corporate Treasury Investments

   $9,378   Discounted Cash Flows  Discount Rate  6.2% - 9.4%   8.2% 
      Default Rate  2.0%   N/A 
      Pre-payment Rate  20.0%   N/A 
      Recovery Lag  12 Months   N/A 
      Recovery Rate  30.0% - 70.0%   67.6% 
      Reinvestment Rate  LIBOR + 400 bps   N/A 
   23,426   Third Party Pricing  N/A  N/A   N/A 

Loans and Receivables

   208,226   Discounted Cash Flows  Discount Rate  5.6% - 10.0%   7.5% 

Other Investments

   25,092   Discounted Cash Flows  Discount Rate  0.9% - 29.8%   3.6% 
      Default Rate  2.0%   N/A 
      Pre-payment Rate  20.0%   N/A 
      Recovery Lag  12 Months   N/A 
      Recovery Rate  70.0%   N/A 
      Reinvestment Rate  LIBOR + 400 bps   N/A 
   1,237   Transaction Price  N/A  N/A   N/A 


   $1,511,159         


THE BLACKSTONE GROUP

The Blackstone Group L.P.

Notes to Condensed Consolidated Financial Statements—Statements (Unaudited) - Continued

(All Dollars Are in Thousands, Except Unit and Per Unit Data, Except Where Noted)


The following table summarizes the quantitative inputs and assumptions used for items categorized in Level III of the fair value hierarchy as of December 31, 2017:2018:


  Fair Value  Valuation
Techniques
 Unobservable
Inputs
  Ranges Weighted-
Average (a)

Financial Assets


Investments of Consolidated Blackstone Funds


Equity Securities

 $91,753  Discounted Cash Flows  Discount Rate  7.1% - 31.4% 12.6%
    Revenue CAGR  1.0% - 49.4% 7.1%
    Exit Capitalization Rate  5.0% - 11.4% 8.5%
    Exit Multiple - EBITDA  4.0x - 16.0x 9.9x
    ExitMultiple - NOI  8.8x - 12.5x 10.5x
    Exit Multiple - P/E  9.5x - 17.0x 11.0x
  862  Market Comparable Companies  Book Value Multiple  0.8x - 0.9x 0.9x
    ExitMultiple - EBITDA  8.0x N/A
  17,536  Other  N/A  N/A N/A
  21,716  Transaction Price  N/A  N/A N/A

Partnership and LLC Interests

  293,744  Discounted Cash Flows  Discount Rate  4.6% - 26.5% 9.8%
    Revenue CAGR  -22.2% - 71.5% 8.4%
    Exit Capitalization Rate  3.1% - 10.0% 5.7%
    Exit Multiple - EBITDA  0.1x - 15.0x 8.6x
    Exit Multiple - NOI  12.5x N/A
  530  Market Comparable Companies  Book Value Multiple  1.0x N/A
  22,346  Other  N/A  N/A N/A
  758  Third Party Pricing  N/A  N/A N/A
  14,070  Transaction Price  N/A  N/A N/A

Debt Instruments

  6,122  Discounted Cash Flows  Discount Rate  6.6% - 18.4% 9.6%
    Revenue CAGR  7.7% N/A
    Exit Capitalization Rate  8.3% N/A
    Exit Multiple - NOI  12.0x N/A
  50,136  Third Party Pricing  N/A  N/A N/A
  1,897  Transaction Price  N/A  N/A N/A

Assets of Consolidated CLO Vehicles

  8,277  Market Comparable Companies  EBITDA Multiple  7.0x N/A
  499,624  Third Party Pricing  N/A  N/A N/A


Total Investments of Consolidated Blackstone Funds

  1,029,371     

Corporate Treasury Investments

  8,886  Discounted Cash Flows  Discount Rate  5.1% - 6.3% 5.4%
    Default Rate  2.0% N/A
    Pre-payment Rate  20% N/A
    Recovery Lag  12 Months N/A
    Recovery Rate  30.0% - 70.0% 68.1%
    Reinvestment Rate  LIBOR + 400 bps N/A
  15,363  Third Party Pricing  N/A  N/A N/A

Loans and Receivables

  239,659  Discounted Cash Flows  Discount Rate  7.1% - 10.3% 8.8%

Other Investments

  65,821  Discounted Cash Flows  Discount Rate  0.7% - 13.0% 2.2%
    Default Rate  2.0% N/A
    Pre-payment Rate  20.0% N/A
    Recovery Lag  12 Months N/A
    Recovery Rate  70.0% N/A
    Reinvestment Rate  LIBOR + 400 bps - LIBOR + 401
    LIBOR + 413 bps bps
  29,572  Transaction Price  N/A  N/A N/A


 $1,388,672     


      Valuation  Unobservable     Weighted-
   Fair Value  

Techniques


Inputs


Ranges

  Average (a)

Financial Assets


Investments of Consolidated Blackstone Funds


Equity Securities

   $138,725   Discounted Cash Flows  Discount Rate  7.1% - 26.1%   12.6% 
      Revenue CAGR  -0.8% - 32.4%   6.6% 
      Book Value Multiple  0.9x - 9.5x   8.3x 
      Exit Capitalization Rate  5.0% - 11.4%   8.0% 
      Exit Multiple - EBITDA  0.1x - 17.5x   10.3x 
      Exit Multiple - NOI  12.8x   N/A 
      Exit Multiple - P/E  17.0x   N/A 
   21,050   Market Comparable Companies  Book Value Multiple  0.8x - 8.0x   1.3x 
      Dollar/Acre Multiple  $7.0 - $44.1   $32.9 
   21,492   Other  N/A  N/A   N/A 
   20,250   Transaction Price  N/A  N/A   N/A 
   49   Third Party Pricing  N/A  N/A   N/A 

Partnership and LLC Interests

   295,251   Discounted Cash Flows  Discount Rate  4.1% - 26.5%   9.7% 
      Revenue CAGR  -1.1% - 48.4%   26.9% 
      Book Value Multiple  8.5x - 9.3x   9.2x 
      Exit Capitalization Rate  2.9% - 15.0%   6.3% 
      Exit Multiple - EBITDA  0.1x - 15.3x   10.0x 
      Exit Multiple - NOI  13.3x   N/A 
   9,444   Market Comparable Companies  Book Value Multiple  1.1x   N/A 
      Dollar/Acre Multiple  $5.3 - $12.0   $7.5 
   9,390   Other  N/A  N/A   N/A 
   41,188   Transaction Price  N/A  N/A   N/A 

Debt Instruments

   8,342   Discounted Cash Flows  Discount Rate  7.0% - 19.3%   9.8% 
      Revenue CAGR  0.7%   N/A 
      Exit Multiple - EBITDA  6.5x   N/A 
   120,843   Third Party Pricing  N/A  N/A   N/A 
   4,634   Transaction Price  N/A  N/A   N/A 

Assets of Consolidated CLO Vehicles

   41   Discounted Cash Flows  Discount Rate  5.0%   N/A 
   673,317   Third Party Pricing  N/A  N/A   N/A 


Total Investments of Consolidated Blackstone Funds

   1,364,016         

THE BLACKSTONE GROUP L.P.continued...

The Blackstone Group L.P.

Notes to Condensed Consolidated Financial Statements—Statements (Unaudited) - Continued

(All Dollars Are in Thousands, Except Unit and Per Unit Data, Except Where Noted)


      Valuation  Unobservable     Weighted-
   Fair Value  

Techniques


Inputs


Ranges

  Average (a)

Corporate Treasury Investments

   $7,947   Discounted Cash Flows  Discount Rate  4.4% - 7.5%   6.6% 
      Default Rate  2.0%   N/A 
      Pre-payment Rate  20.0%   N/A 
      Recovery Lag  12 Months -   13 Months 
        21 Months  
      Recovery Rate  17.5% - 70.0%   67.7% 
      Reinvestment Rate  LIBOR + 400 bps   N/A 
   16,621   Third Party Pricing  N/A  N/A   N/A 

Loans and Receivables

   304,173   Discounted Cash Flows  Discount Rate  6.1% - 12.8%   8.7% 

Other Investments

   26,631   Discounted Cash Flows  Discount Rate  1.0% - 15.0%   2.8% 
      Default Rate  2.0%   N/A 
      Pre-payment Rate  20.0%   N/A 
      Recovery Lag  12 Months   N/A 
      Recovery Rate  70.0%   N/A 
      Reinvestment Rate  LIBOR + 400 bps   N/A 
   4,986   Transaction Price  N/A  N/A   N/A 


   $1,724,374         


N/A

Not applicable.

CAGR

Compound annual growth rate.

EBITDA

Earnings before interest, taxes, depreciation and amortization.

Exit Multiple

Ranges include the last twelve months EBITDA, forward EBITDA and price/earnings exit multiples.

NOI

Net operating income.

P/E

Price-earnings ratio.

Third Party Pricing

Third Party Pricing is generally determined on the basis of unadjusted prices between market participants provided by reputable dealers or pricing services.

Transaction Price

Includes recent acquisitions or transactions.

(a)

Unobservable inputs were weighted based on the fair value of the investments included in the range.

The significant unobservable inputs used in the fair value measurement of corporate treasury investments, debt instruments and other investments as of the reporting date are discount rates, default rates, recovery rates, recovery lag,pre-payment rates and reinvestment rates. Increases (decreases) in any of the discount rates, default rates, recovery lag andpre-payment rates in isolation would resulthave resulted in a lower (higher) fair value measurement. Increases (decreases) in any of the recovery rates and reinvestment rates in isolation would resulthave resulted in a higher (lower) fair value measurement. Generally, a change in the assumption used for default rates may be accompanied by a directionally similar change in the assumption used for recovery lag and a directionally opposite change in the assumption used for recovery rates andpre-payment rates.

The significant unobservable inputs used in the fair value measurement of equity securities, partnership and limited liability company (“LLC”) interests, debt instruments, assets of consolidated CLO vehicles and loans and receivables are discount rates, exit capitalization rates, exit multiples, EBITDA multiples and revenue compound annual growth rates. Increases (decreases) in any of discount rates and exit capitalization rates in isolation can resultcould have resulted in a lower (higher) fair value measurement. Increases (decreases) in any of exit multiples and revenue compound annual growth rates in isolation can resultcould have resulted in a higher (lower) fair value measurement.

Since December 31, 2017,2018, there have been no changes in valuation techniques within Level II and Level III that have had a material impact on the valuation of financial instruments.

The Blackstone Group L.P.

Notes to Condensed Consolidated Financial Statements (Unaudited) - Continued

(All Dollars Are in Thousands, Except Unit and Per Unit Data, Except Where Noted)

The following tables summarize the changes in financial assets and liabilities measured at fair value for which the Partnership has used Level III inputs to determine fair value and does not include gains or losses that were reported in Level III in prior years or for instruments that were transferred out of Level III prior to the end of the respective reporting period. Total realized and unrealized gains and losses recorded for Level III investments are reported in either

THE BLACKSTONE GROUP L.P.

Notes to Condensed Consolidated Financial Statements—Continued

(All Dollars Are in Thousands, Except Unit and Per Unit Data, Except Where Noted)

Investment Income (Loss) or Net Gains from Fund Investment Activities in the Condensed Consolidated Statements of Operations.


  Level III Financial Assets at Fair Value
Three Months Ended June 30,
 
  2018  2017 
  Investments
of
Consolidated
Funds
  Loans and
Receivables
  Other
Investments (a)
  Total  Investments
of
Consolidated
Funds
  Loans and
Receivables
  Other
Investments (a)
  Total 

Balance, Beginning of Period

 $963,151  $163,135  $117,349  $1,243,635  $685,966  $112,056  $138,433  $936,455 

Transfer In Due to Consolidation and Acquisition

  —     —     —     —     35,040   —     —     35,040 

Transfer Out Due to Deconsolidation

  —     —     —     —     (44,095  —     —     (44,095

Transfer In to Level III (b)

  152,666   —     —     152,666   68,127   —     6,473   74,600 

Transfer Out of Level III (b)

  (117,217  —     (7,649  (124,866  (105,165  —     (11,930  (117,095

Purchases

  203,223   294,258   15,327   512,808   112,405   268,222   9,155   389,782 

Sales

  (127,718  (110,508  (23,304  (261,530  (46,140  (75,342  (34,014  (155,496

Settlements

  —     (5,634  (1  (5,635  —     (1,392  (993  (2,385

Changes in Gains Included in Earnings and Other Comprehensive Income

  12,619   5,352   13,001   30,972   9,606   2,735   8,565   20,906 


Balance, End of Period

 $1,086,724  $346,603  $114,723  $1,548,050  $715,744  $306,279  $115,689  $1,137,712 


Changes in Unrealized Gains (Losses) Included in Earnings Related to Investments Still Held at the Reporting Date

 $146  $5,353  $(49 $5,450  $(2,163 $2,735  $123  $695 


THE BLACKSTONE GROUP L.P.

Notes to Condensed Consolidated Financial Statements—Continued

(All Dollars Are in Thousands, Except Unit and Per Unit Data, Except Where Noted)

                                                                                                                        
  Level III Financial Assets at Fair Value
  Three Months Ended March 31,
  2019 2018
  Investments       Investments      
 Level III Financial Assets at Fair Value
Six Months Ended June 30,
   of Loans Other   of Loans Other  
 2018 2017   Consolidated and Investments   Consolidated and Investments  
 Investments
of
Consolidated
Funds
 Loans and
Receivables
 Other
Investments (a)
 Total Investments
of
Consolidated
Funds
 Loans and
Receivables
 Other
Investments (a)
 Total   Funds Receivables (a) Total Funds Receivables (a) Total

Balance, Beginning of Period

 $1,029,371  $239,659  $119,642  $1,388,672  $685,873  $211,359  $130,588  $1,027,820    $1,364,016   $304,173   $56,185   $1,724,374   $1,029,371   $239,659   $119,642   $1,388,672 

Transfer In Due to Consolidation and Acquisition

  50,043   —     —     50,043   34,651   —     —     34,651                50,043         50,043 

Transfer Out Due to Deconsolidation

  (217,182  —     —     (217,182  (38,629  —     —     (38,629               (217,182        (217,182

Transfer In to Level III (b)

  180,401   —     —     180,401   63,125   —     16,396   79,521    151,085      12,806   163,891   117,089         117,089 

Transfer Out of Level III (b)

  (141,104  —     (15,717  (156,821  (140,571  —     (18,010  (158,581   (307,800     (13,850  (321,650  (101,336     (8,068  (109,404

Purchases

  408,823   370,921   19,812   799,556   219,248   337,705   21,603   578,556    76,995   72,291   7,569   156,855   193,859   76,663   4,486   275,008 

Sales

  (260,865  (263,703  (23,479  (548,047  (145,890  (251,502  (44,045  (441,437   (62,933  (165,668  (871  (229,472  (133,311  (153,194  (175  (286,680

Settlements

  —     (9,317  (4  (9,321  —     (3,894  (1,093  (4,987      (7,151     (7,151     (3,683  (4  (3,687

Changes in Gains Included in Earnings and Other Comprehensive Income

  37,237   9,043   14,469   60,749   37,937   12,611   10,250   60,798 

Changes in Gains Included in Earnings

   22,437   4,581   (2,706  24,312   24,618   3,690   1,468   29,776 


Balance, End of Period

 $1,086,724  $346,603  $114,723  $1,548,050  $715,744  $306,279  $115,689  $1,137,712    $1,243,800   $208,226   $59,133   $1,511,159   $963,151   $163,135   $117,349   $1,243,635 


Changes in Unrealized Gains (Losses) Included in Earnings Related to Investments Still Held at the Reporting Date

 $19,265  $9,044  $(289 $28,020  $1,031  $12,610  $462  $14,103    $27,922   $   $(2,132  $ 25,790   $19,119   $3,691   $(251  $22,559 


(a)

Represents corporate treasury investments and Other Investments.

(b)

Transfers in and out of Level III financial assets and liabilities were due to changes in the observability of inputs used in the valuation of such assets and liabilities.

There were no Level III financial liabilities as of and for the three and six months ended June 30, 2018March 31, 2019 and 2017.2018.


9.

VARIABLE INTEREST ENTITIESVariable Interest Entities

Pursuant to GAAP consolidation guidance, the Partnership consolidates certain VIEs in which it is determined that the Partnership is the primary beneficiary either directly or indirectly, through a consolidated entity or affiliate. VIEs include certain private equity, real estate, credit-focused or funds of hedge funds entities and CLO vehicles. The purpose of such VIEs is to provide strategy specific investment opportunities for investors in exchange for management and performance based fees. The investment strategies of the Blackstone Funds differ by product; however, the fundamental risks of the Blackstone Funds have similar characteristics, including loss of invested capital and loss of management fees and performance based fees. In Blackstone’s role as general partner, collateral manager or investment adviser, it generally considers itself the sponsor of the applicable Blackstone Fund. The Partnership does not provide performance guarantees and has no other financial obligation to provide funding to consolidated VIEs other than its own capital commitments.

THE BLACKSTONE GROUP L.P.

Notes to Condensed Consolidated Financial Statements—Continued

(All Dollars Are in Thousands, Except Unit and Per Unit Data, Except Where Noted)

The assets of consolidated variable interest entities may only be used to settle obligations of these consolidated Blackstone Funds.entities. In addition, there is no recourse to the Partnership for the consolidated VIEs’ liabilities including the liabilities of the consolidated CLO vehicles.

During the six months ended June 30, 2018, the Partnership’s ownership interest in certain CLO and other vehicles originated outside of the U.S. was diluted such that the Partnership determined that it was no longer the primary beneficiary of these VIEs and deconsolidated these vehicles. As of the date of deconsolidation, the Partnership’s Total Assets, Total Liabilities andNon-Controlling Interests in Consolidated Entities were reduced by $8.9 billion, $8.7 billion and $196.1 million, respectively. The Partnership will continue to receive management fees and Performance Allocations from these vehicles following the dilution of its ownership interest.

The Partnership holds variable interests in certain VIEs which are not consolidated as it is determined that the Partnership is not the primary beneficiary. The Partnership’s involvement with such entities is in the form of direct equity interests and fee arrangements. The maximum exposure to loss represents the loss of assets

The Blackstone Group L.P.

Notes to Condensed Consolidated Financial Statements (Unaudited) - Continued

(All Dollars Are in Thousands, Except Unit and Per Unit Data, Except Where Noted)

recognized by Blackstone relating tonon-consolidated entities, any amounts due tonon-consolidated entitiesVIEs and any clawback obligation relating to previously distributed Performance Allocations. The assets and liabilities recognized in the Partnership’s Condensed Consolidated Statements of Financial Condition related to the Partnership’s interest in thesenon-consolidated VIEs and the Partnership’s maximum exposure to loss relating tonon-consolidated VIEs were as follows:


  March 31,  December 31,
  June 30,
2018
   December 31,
2017
   2019  2018

Investments

  $969,868   $805,501    $1,014,960    $942,700 

Accounts Receivable

   —      15,760 

Due from Affiliates

   252,603    81,465    300,227    254,744 


Total VIE Assets

   1,222,471    902,726 

Due to Affiliates

   4,110    179 

Potential Clawback Obligation

   55,832    98,331    171,559    159,691 


Maximum Exposure to Loss

  $1,282,413   $1,001,236    $1,486,746    $1,357,135 


Amounts Due toNon-Consolidated VIEs

   $356    $207 


10.

REPURCHASE AGREEMENTSRepurchase Agreements

At June 30, 2018,March 31, 2019, the Partnership pledged securities with a carrying value of $217.8$275.7 million and cash to collateralize its repurchase agreements. Such securities can be repledged, delivered or otherwise used by the counterparty.

At December 31, 2017,2018, the Partnership pledged securities with a carrying value of $169.7$279.5 million and cash to collateralize its repurchase agreements. Such securities can be repledged, delivered or otherwise used by the counterparty.

THE BLACKSTONE GROUP L.P.

Notes to Condensed Consolidated Financial Statements—Continued

(All Dollars Are in Thousands, Except Unit and Per Unit Data, Except Where Noted)

The following tables provide information regarding the Partnership’s Repurchase Agreements obligation by type of collateral pledged:


  March 31, 2019
  Remaining Contractual Maturity of the Agreements
  June 30, 2018   Overnight        Greater   
  Remaining Contractual Maturity of the Agreements   and  Up to  30 - 90  than   
  Overnight and
Continuous
   Up to 30
Days
   30 - 90
Days
   Greater than
90 days
   Total   Continuous  30 Days  Days  90 days  Total

Repurchase Agreements


Asset-Backed Securities

  $—     $48,796   $109,116   $24,577   $182,489    $    $52,456    $117,413    $48,996    $218,865 


Gross Amount of Recognized Liabilities for Repurchase Agreements in Note 11. “Offsetting of Assets and Liabilities”

Gross Amount of Recognized Liabilities for Repurchase Agreements in Note 11. “Offsetting of Assets and Liabilities”


  $182,489 

Gross Amount of Recognized Liabilities for Repurchase Agreements in Note 11. “Offsetting of Assets and Liabilities”


   $218,865 


Amounts Related to Agreements Not Included in Offsetting Disclosure in Note 11. “Offsetting of Assets and Liabilities”

Amounts Related to Agreements Not Included in Offsetting Disclosure in Note 11. “Offsetting of Assets and Liabilities”


  $—   

Amounts Related to Agreements Not Included in Offsetting Disclosure in Note 11. “Offsetting of Assets and Liabilities”


   $ 


The Blackstone Group L.P.

Notes to Condensed Consolidated Financial Statements (Unaudited) - Continued

(All Dollars Are in Thousands, Except Unit and Per Unit Data, Except Where Noted)


   December 31, 2017 
   Remaining Contractual Maturity of the Agreements 
   Overnight and
Continuous
   Up to 30
Days
   30 - 90
Days
   Greater than
90 days
   Total 

Repurchase Agreements


Asset-Backed Securities

  $—     $22,756   $96,084   $—     $118,840 


Gross Amount of Recognized Liabilities for Repurchase Agreements in Note 11. “Offsetting of Assets and Liabilities”


  $118,840 


Amounts Related to Agreements Not Included in Offsetting Disclosure in Note 11. “Offsetting of Assets and Liabilities”


  $—   


   December 31, 2018
   Remaining Contractual Maturity of the Agreements
   Overnight        Greater   
   and  Up to  30 - 90  than   
   Continuous  30 Days  Days  90 days  Total

Repurchase Agreements


Asset-Backed Securities

   $    $42,908    $144,731    $34,563    $222,202 


Gross Amount of Recognized Liabilities for Repurchase Agreements in Note 11. “Offsetting of Assets and Liabilities”


   $222,202 


Amounts Related to Agreements Not Included in Offsetting Disclosure in Note 11. “Offsetting of Assets and Liabilities”


   $ 


11.

OFFSETTING OF ASSETS AND LIABILITIESOffsetting of Assets and Liabilities

The following tables present the offsetting of assets and liabilities as of June 30,March 31, 2019 and December 31, 2018:


   Gross and Net
Amounts of Assets
Presented in the
Statement of
Financial Condition
   Gross Amounts Not Offset in
the Statement of Financial
Condition
     
   Financial
Instruments (a)
   Cash Collateral
Received
   Net Amount 

Assets


Freestanding Derivatives

  $25,934   $23,822   $—     $2,112 


   March 31, 2019
   Gross and Net         
   Amounts of  Gross Amounts Not Offset   
   Assets Presented  in the Statement of   
   in the Statement  Financial Condition   
   of Financial  Financial  Cash Collateral   
   Condition  Instruments (a)  Received  Net Amount

Assets


Freestanding Derivatives

   $15,470    $14,636    $94    $740 


   March 31, 2019
   Gross and Net         
   Amounts of         
   Liabilities  Gross Amounts Not Offset   
   Presented in the  in the Statement of   
   Statement of  Financial Condition   
   Financial  Financial  Cash Collateral   
   Condition  Instruments (a)  Pledged  Net Amount

Liabilities


Freestanding Derivatives

   $26,093    $10,842    $13,691    $1,560 

Repurchase Agreements

   218,865    218,865         


   $244,958    $229,707    $13,691    $1,560 


The Blackstone Group L.P.

THE BLACKSTONE GROUP L.P.

Notes to Condensed Consolidated Financial Statements—Statements (Unaudited) - Continued

(All Dollars Are in Thousands, Except Unit and Per Unit Data, Except Where Noted)


   Gross and Net
Amounts of Liabilities
Presented in the
Statement of
Financial Condition
   Gross Amounts Not Offset in
the Statement of Financial
Condition
     
   Financial
Instruments (a)
   Cash Collateral
Pledged
   Net Amount 

Liabilities


Freestanding Derivatives

  $57,375   $43,943   $6,811   $6,621 

Repurchase Agreements

   182,489    182,489    —      —   


  $239,864   $226,432   $6,811   $6,621 


   December 31, 2018
   Gross and Net         
   Amounts of  Gross Amounts Not Offset   
   Assets Presented  in the Statement of   
   in the Statement  Financial Condition   
   of Financial  Financial  Cash Collateral   
   Condition  Instruments (a)  Received  Net Amount

Assets


Freestanding Derivatives

   $45,416    $37,788    $5,547    $2,081 


   December 31, 2018
   Gross and Net         
   Amounts of         
   Liabilities  Gross Amounts Not Offset   
   Presented in the  in the Statement of   
   Statement of  Financial Condition   
   Financial  Financial  Cash Collateral   
   Condition  Instruments (a)  Pledged  Net Amount

Liabilities


Freestanding Derivatives

   $52,844    $35,905    $15,377    $1,562 

Repurchase Agreements

   222,202    222,202         


   $275,046    $258,107    $15,377    $1,562 


(a)

Amounts presented are inclusive of both legally enforceable master netting agreements, and financial instruments received or pledged as collateral. Financial instruments received or pledged as collateral offset derivative counterparty risk exposure, but do not reduce net balance sheet exposure.

The following tables present the offsetting of assets and liabilities as of December 31, 2017:

   Gross and Net
Amounts of Assets
Presented in the
Statement of

Financial Condition
   Gross Amounts Not Offset in
the Statement of Financial
Condition
     
   Financial
Instruments
   Cash Collateral
Received
   Net Amount 

Assets


Freestanding Derivatives

  $8,801   $3,279   $—     $5,522 


   Gross and Net
Amounts of Liabilities
Presented in the
Statement of

Financial Condition
   Gross Amounts Not Offset in
the Statement of Financial
Condition
     
   Financial
Instruments
   Cash Collateral
Pledged
   Net Amount 

Liabilities


Net Investment Hedges

  $453   $—     $—     $453 

Freestanding Derivatives

   36,234    3,279    32,405    550 

Repurchase Agreements

   118,840    118,840    —      —   


  $155,527   $122,119   $32,405   $1,003 


Repurchase Agreements are presented separately on the Condensed Consolidated Statements of Financial Condition. Freestanding Derivative assets are included in Other Assets in the Condensed Consolidated Statements of Financial Condition. The following table presents the components of Other Assets:


  March 31,  December 31,
  June 30, 2018   December 31, 2017   2019  2018

Furniture, Equipment and Leasehold Improvements, Net

  $122,318   $126,566    $133,544    $120,372 

Prepaid Expenses

   90,687    78,723    139,880    110,732 

Other Assets

   16,901    32,965 

Freestanding Derivatives

   23,030    4,443    15,118    44,918 

Other

   13,491    18,226 


  $252,936   $242,697    $302,033    $294,248 


Freestanding Derivative liabilities are included in Accounts Payable, Accrued Expenses and Other Liabilities in the Condensed Consolidated Statements of Financial Condition and are not a significant component thereof.

The Blackstone Group L.P.

THE BLACKSTONE GROUP L.P.

Notes to Condensed Consolidated Financial Statements—Statements (Unaudited) - Continued

(All Dollars Are in Thousands, Except Unit and Per Unit Data, Except Where Noted)


Notional Pooling Arrangement

Blackstone has a notional cash pooling arrangement with a financial institution for cash management purposes. This arrangement allows for cash withdrawals based upon aggregate cash balances on deposit at the same financial institution. Cash withdrawals cannot exceed aggregate cash balances on deposit. The net balance of cash on deposit and overdrafts is used as a basis for calculating net interest expense or income. As of June 30, 2018,March 31, 2019, the aggregate cash balance on deposit relating to the cash pooling arrangement was $1.5$1.1 billion, which was offset with an accompanying overdraft of $1.5$1.1 billion.


12.

BORROWINGSBorrowings

On April 10, 2019, Blackstone, through its indirect subsidiary Blackstone Holdings Finance Co. L.L.C. (the “Issuer”), issued €600 million aggregate principal amount of Senior Notes due April 10, 2029 (the “2029 Notes”). The 2029 Notes have an interest rate of 1.500% per annum, accruing from April 10, 2019. Interest on the 2029 Notes is payable annually in arrears on April 10 of each year, commencing on April 10, 2020. The 2029 Notes will be fully and unconditionally guaranteed (the “Guarantees”), jointly and severally, by The Blackstone Group L.P., Blackstone Holdings I L.P., Blackstone Holdings AI L.P., Blackstone Holdings II L.P., Blackstone Holdings III L.P. and Blackstone Holdings IV L.P. (the “Guarantors”). The Guarantees are unsecured and unsubordinated obligations of the Guarantors. Transaction costs related to the issuance of the 2029 Notes have been capitalized and are being amortized over the life of the 2029 Notes. The 2029 Notes are not included in the March 31, 2019 Condensed Consolidated Statement of Financial Condition.

The following table presents the general characteristics of each of our Notes,notes, as well as their carrying value and fair value. The Notesnotes are included in Loans Payable within the Condensed Consolidated Statements of Financial Condition. All of the Notesnotes were issued at a discount. All of the Notesnotes accrue interest from the Issue Dateissue date thereof and all pay interest in arrears on a semi-annual basis or annual basis as indicated by the Interest Payment Dates.their respective interest payment dates.


  March 31, 2019  December 31, 2018
  June 30, 2018   December 31, 2017   Carrying  Fair  Carrying  Fair

Senior Notes

  Carrying
Value
   Fair
Value (a)
   Carrying
Value
   Fair
Value (a)
   Value  Value (a)  Value  Value (a)

5.875%, Due 3/15/2021

  $398,727   $425,360   $398,514   $438,320    $399,059    $421,680    $398,947    $421,720 

4.750%, Due 2/15/2023

   394,645    418,840    394,137    434,200    395,431    423,440    395,166    417,600 

2.000%, Due 5/19/2025

   346,136    369,728    355,425    385,433    332,658    353,434    339,959    352,197 

1.000%, Due 10/5/2026

   691,478    677,906    709,871    711,440    664,747    665,205    679,193    647,564 

3.150%, Due 10/2/2027

   296,557    284,700    296,399    295,320    296,799    289,200    296,717    285,030 

6.250%, Due 8/15/2042

   238,119    294,700    238,019    328,200    238,274    297,375    238,221    289,225 

5.000%, Due 6/15/2044

   488,640    526,000    488,536    574,100    488,801    517,400    488,747    490,150 

4.450%, Due 7/15/2045

   343,981    337,260    343,925    372,575    344,068    335,265    344,038    329,770 

4.000%, Due 10/2/2047

   290,075    266,400    289,989    296,940    290,207    265,890    290,163    262,800 


  $3,488,358   $3,600,894   $3,514,815   $3,836,528    $3,450,044    $3,568,889    $3,471,151    $3,496,056 


(a)

Fair value is determined by broker quote and these notes would be classified as Level II within the fair value hierarchy.

The Blackstone Group L.P.

Notes to Condensed Consolidated Financial Statements (Unaudited) - Continued

(All Dollars Are in Thousands, Except Unit and Per Unit Data, Except Where Noted)

Included within Loans Payable and Due to Affiliates within the Condensed Consolidated Statements of Financial Condition are amounts due to holders of debt securities issued by Blackstone’s consolidated CLO vehicles. Borrowings through the consolidated CLO vehicles consisted of the following:


  March 31, 2019  December 31, 2018
       Weighted-       Weighted-
     Weighted- Average     Weighted- Average
     Average Remaining     Average Remaining
  June 30, 2018   December 31, 2017   Borrowing  Interest Maturity in  Borrowing  Interest Maturity in
  Borrowing
Outstanding
   Weighted-
Average
Interest
Rate
 Weighted-
Average
Remaining
Maturity in
Years
   Borrowing
Outstanding
   Weighted-
Average
Interest
Rate
 Weighted-
Average
Remaining
Maturity in
Years
   Outstanding  Rate Years  Outstanding  Rate Years

Senior Secured Notes

  $6,533,425    3.83  3.2   $10,689,240    2.35  4.1    $6,530,613    4.31%   7.0    $6,531,550    4.20%   7.5 

Subordinated Notes

   331,735    (a  N/A    894,367    (a)   N/A    321,866    (a)   N/A    331,735    (a)   N/A 


  $6,865,160      $11,583,607       $6,852,479       $6,863,285    


(a)

The Subordinated Notes do not have contractual interest rates but instead receive distributions from the excess cash flows of the CLO vehicles.

THE BLACKSTONE GROUP L.P.

Notes to Condensed Consolidated Financial Statements—Continued

(All Dollars Are in Thousands, Except Unit and Per Unit Data, Except Where Noted)

Senior Secured Notes and Subordinated Notes comprise the following amounts:


  March 31, 2019  December 31, 2018
     Amounts Due to Non-     Amounts Due to Non-
  June 30, 2018   December 31, 2017      Consolidated Affiliates     Consolidated Affiliates
  Fair Value   Amounts Due to Non-
Consolidated Affiliates
   Fair Value   Amounts Due to Non-
Consolidated Affiliates
      Borrowing        Borrowing   
  Borrowing
Outstanding
   Fair Value   Borrowing
Outstanding
   Fair Value   Fair Value  Outstanding  Fair Value  Fair Value  Outstanding  Fair Value

Senior Secured Notes

  $6,531,595   $3,250   $3,269   $10,595,652   $1,000   $996    $6,527,056    $42,750    $42,733    $6,476,434    $3,250    $3,201 

Subordinated Notes

   239,179    111,659    63,279    743,554    53,400    40,390    126,433    81,790    49,976    60,289    111,659    52,811 


  $6,770,774   $114,909   $66,548   $11,339,206   $54,400   $41,386    $6,653,489    $124,540    $92,709    $6,536,723    $114,909    $56,012 


The Loans Payable of the consolidated CLO vehicles are collateralized by assets held by each respective CLO vehicle and assets of one vehicle may not be used to satisfy the liabilities of another. As of June 30, 2018 and December 31, 2017, the fair value of the consolidated CLO assets was $7.5 billion and $13.4 billion, respectively. This collateral consisted of Cash, Corporate Loans, Corporate Bonds and other securities. As of March 31, 2019 and December 31, 2018, the fair value of the consolidated CLO assets was $7.3 billion and $7.1 billion, respectively.

Scheduled principal payments for borrowings as of June 30, 2018March 31, 2019 were as follows:


  Operating
Borrowings
   Blackstone Fund
Facilities/CLO
Vehicles
   Total
Borrowings
      Blackstone Fund   

2018

  $—     $2,819   $2,819 
  Operating  Facilities/CLO  Total
  Borrowings  Vehicles  Borrowings

2019

   —      —      —      $    $331    $331 

2020

   —      —      —               

2021

   400,000    —      400,000    400,000        400,000 

2022

   —      —      —               

2023

   400,000        400,000 

Thereafter

   3,151,560    6,865,160    10,016,720    2,709,620    6,852,479    9,562,099 


  $3,551,560   $6,867,979   $10,419,539    $3,509,620    $6,852,810    $10,362,430 


13.

Leases

The Partnership enters intonon-cancelable lease and sublease agreements primarily for office space, which expire on various dates through 2030. As of March 31, 2019 the weighted-average remaining lease term was 8.0 years and the weighted-average discount rate was 2.5%.

The Blackstone Group L.P.

Notes to Condensed Consolidated Financial Statements (Unaudited) - Continued

(All Dollars Are in Thousands, Except Unit and Per Unit Data, Except Where Noted)

The components of lease expense were as follows:

INCOME TAXESThree Months Ended
March 31, 2019

Operating Lease Cost

Straight-Line Lease Cost (a)

 $21,865

Variable Lease Cost

3,105

Sublease Income

(164

 $24,806

(a)

Straight-line lease cost includes short-term leases, which are immaterial.

Supplemental cash flow information related to leases were as follows:

Three Months Ended
March 31, 2019

Operating Cash Flows from Operating Leases

 $22,132

Right-of-Use Assets Obtained in Exchange for New Operating Lease Liabilities

388

The following table shows the undiscounted cash flows on an annual basis for Operating Lease Liabilities as of March 31, 2019:

2019

   $59,318 

2020

   79,301 

2021

   84,866 

2022

   77,853 

2023

   76,212 

Thereafter

   272,494 


Total Lease Payments (a)

   650,044 

Less: Imputed Interest

   (62,636


Present Value of Operating Lease Liabilities

   $                  587,408 


(a)

Excludes $117.9 million of lease payments for signed leases that have not yet commenced.

As of December 31, 2018, the aggregate minimum future payments, net of sublease income, required on operating leases are as follows:

2019

   $78,506 

2020

   72,191 

2021

   80,914 

2022

   79,094 

2023

   77,248 

Thereafter

   273,347 


Total

   $                    661,300 


14.

Income Taxes

Blackstone’s effective tax rate was 8.2%3.7% and 3.9%6.1% for the three months ended June 30,March 31, 2019 and 2018, and 2017, respectively, and 7.5% and 4.8% for the six months ended June 30, 2018 and 2017, respectively. Blackstone’s income tax provision was $138.7$41.2 million and $29.6$54.5 million for the three months ended June 30,March 31, 2019 and 2018, and 2017, respectively, and $193.2 million and $87.0 million for the six months ended June 30, 2018 and 2017, respectively.

The Blackstone Group L.P.

Notes to Condensed Consolidated Financial Statements (Unaudited) - Continued

(All Dollars Are in Thousands, Except Unit and Per Unit Data, Except Where Noted)

The Blackstone Group L.P. and certain of its subsidiaries operate in the U.S. as partnerships for income tax purposes (partnerships generally are not subject to federal income taxes) and generally as corporate entities innon-U.S. jurisdictions. Blackstone’s effective tax rate for the three and six months ended June 30,March 31, 2019 and 2018 and 2017 was substantially due to the fact that certain corporate subsidiaries are subject to federal, state, local and foreign income taxes (as applicable) and other subsidiaries are subject to New York City unincorporated business taxes.

THE BLACKSTONE GROUP L.P.

Notes to Condensed Consolidated Financial Statements—Continued

(All Dollars Are in Thousands, Except Unit and Per Unit Data, Except Where Noted)


14.15.

NET INCOME PER COMMON UNITNet Income Per Common Unit

Basic and diluted net income per common unit for the three and six months ended June 30,March 31, 2019 and March 31, 2018 and June 30, 2017 was calculated as follows:


 Three Months Ended
June 30,
 Six Months Ended
June 30,
   Three Months Ended March 31,
 2018 2017 2018 2017   2019  2018

Net Income for Per Common Unit Calculation


Net Income for Per Common Unit Calculations


Net Income Attributable to The Blackstone Group L.P., Basic

 $742,042  $337,407  $1,109,914  $789,316    $481,304    $367,872 

Incremental Net Income from Assumed Exchange of Blackstone Holdings Partnership Units

  —     260,488   858,727   624,716    369,889    278,746 


Net Income Attributable to The Blackstone Group L.P., Diluted

 $742,042  $597,895  $1,968,641  $1,414,032    $851,193    $646,618 


Units Outstanding


Weighted-Average Common Units Outstanding, Basic

  681,794,492   664,681,299   678,156,936   662,820,839    674,507,698    674,479,140 

Weighted-Average Unvested Deferred Restricted Common Units

  216,118   998,974   207,526   904,079    207,752    198,934 

Weighted-Average Blackstone Holdings Partnership Units

  —     534,326,066   532,363,486   536,031,472    525,764,790    535,895,780 


Weighted-Average Common Units Outstanding, Diluted

  682,010,610   1,200,006,339   1,210,727,948   1,199,756,390    1,200,480,240    1,210,573,854 


Net Income Per Common Unit, Basic

 $1.09  $0.51  $1.64  $1.19    $0.71    $0.55 


Net Income Per Common Unit, Diluted

 $1.09  $0.50  $1.63  $1.18    $0.71    $0.53 


Distributions Declared Per Common Unit (a)

 $0.35  $0.87  $1.20  $1.34    $0.58    $0.85 


(a)

Distributions declared reflects the calendar date of the declaration for each distribution.

The Weighted-Average Common Units Outstanding, Basic includes vested deferred restricted common units that have been earned for which issuance of the related common units is deferred until future periods.

The Partnership applies the treasury stock method to determine the dilutive weighted-average common units outstanding. The Partnership applies the“if-converted” method to the Blackstone Holdings Partnership Units to determine the dilutive weighted-average common units represented by the Blackstone Holdings Partnership Units.

In computing the dilutive effect that the exchange of Blackstone Holdings Partnership Units would have on net income per common unit, the Partnership considered that net income available to holders of common units would increase due to the elimination ofnon-controlling interests in Blackstone Holdings, inclusive of any tax impact. Because the hypothetical conversion may result in a different tax rate, the Blackstone Holdings Partnership Units are considered anti-dilutive in certain periods and dilutive in other periods.

THE BLACKSTONE GROUP L.P.

Notes to Condensed Consolidated Financial Statements—Continued

(All Dollars Are in Thousands, Except Unit and Per Unit Data, Except Where Noted)

The following table summarizes the anti-dilutive securities for the three and six months ended June 30, 2018 and 2017:

   Three Months Ended
June 30,
   Six Months Ended
June 30,
 
   2018   2017   2018   2017 

Weighted-Average Blackstone Holdings Partnership Units

   528,872,187    —      —      —   

Unit Repurchase Program

On April 16, 2018, the Boardboard of Directorsdirectors of our general partner, Blackstone Group Management L.L.C., authorized the repurchase by Blackstone of up to $1.0 billion of Blackstone common units and Blackstone Holdings Partnership Units. Under the unit repurchase program, units may be repurchased from time to time in open market transactions, in privately negotiated transactions or otherwise. The timing and the actual number of units repurchased will depend on a variety of factors, including legal requirements, price and economic and market conditions. The unit repurchase program may be changed, suspended or discontinued at any time and does not have a specified expiration date.

The Blackstone Group L.P.

Notes to Condensed Consolidated Financial Statements (Unaudited) - Continued

(All Dollars Are in Thousands, Except Unit and Per Unit Data, Except Where Noted)

During the three and six months ended June 30, 2017, no units were repurchased. During the three and six months ended June 30, 2018,March 31, 2019, Blackstone repurchased 2.21.5 million Blackstone common units at a total cost of $71.7$52.1 million. During the three months ended March 31, 2018, no units were repurchased. As of June 30, 2018,March 31, 2019, the amount remaining available for repurchases under this program was $928.3$406.4 million.


15.16.

EQUITY-BASED COMPENSATIONEquity-Based Compensation

The Partnership has granted equity-based compensation awards to Blackstone’s senior managing directors,non-partner professionals,non-professionals and selected external advisers under the Partnership’s 2007 Equity Incentive Plan (the “Equity Plan”). The Equity Plan allows for the granting of options, unit appreciation rights or other unit-based awards (units, restricted units, restricted common units, deferred restricted common units, phantom restricted common units or other unit-based awards based in whole or in part on the fair value of the Blackstone common units or Blackstone Holdings Partnership Units) which may contain certain service or performance requirements. As of January 1, 2018,2019, the Partnership had the ability to grant 172,155,134171,502,746 units under the Equity Plan.

For the three and six months ended June 30,March 31, 2019 and March 31, 2018, the Partnership recorded compensation expense of $116.8$121.2 million and $209.0$92.2 million, respectively, in relation to its equity-based awards with corresponding tax benefits of $20.1$18.6 million and $34.5$14.5 million, respectively. For the three and six months ended June 30, 2017, the Partnership recorded compensation expense of $88.5 million and $179.7 million, respectively, in relation to its equity-based awards with corresponding tax benefits of $22.7 million and $36.8 million, respectively.

As of June 30, 2018,March 31, 2019, there was $793.8$943.6 million of estimated unrecognized compensation expense related to unvested awards. This cost is expected to be recognized over a weighted-average period of 4.02.9 years.

Total vested and unvested outstanding units, including Blackstone common units, Blackstone Holdings Partnership Units and deferred restricted common units, were 1,203,395,0011,196,324,909 as of June 30, 2018.March 31, 2019. Total outstanding unvested phantom units were 44,85049,075 as of June 30, 2018.

March 31, 2019.

THE BLACKSTONE GROUP L.P.A summary of the status of the Partnership’s unvested equity-based awards as of March 31, 2019 and of changes during the period January 1, 2019 through March 31, 2019 is presented below:

                                                                                                                                                
   Blackstone Holdings  The Blackstone Group L.P.
        Equity Settled Awards  Cash Settled Awards
        Deferred       
     Weighted-  Restricted Weighted-    Weighted-
     Average  Common Average    Average
   Partnership Grant Date  Units and Grant Date  Phantom Grant Date

Unvested Units

  Units Fair Value  Options Fair Value  Units Fair Value

Balance, December 31, 2018

   31,554,127   $34.38    9,312,268   $31.43    46,808   $34.66 

Granted

   78,238   32.02    1,607,798   30.03        

Vested

   (1,723,439  34.57    (1,877,552  29.80    (80  33.47 

Forfeited

   (92,957  32.17    (120,008  31.55        


Balance, March 31, 2019

   29,815,969   $34.02    8,922,506   $31.50    46,728   $33.29 


The Blackstone Group L.P.

Notes to Condensed Consolidated Financial Statements—Statements (Unaudited) - Continued

(All Dollars Are in Thousands, Except Unit and Per Unit Data, Except Where Noted)


A summary of the status of the Partnership’s unvested equity-based awards as of June 30, 2018 and of changes during the period January 1, 2018 through June 30, 2018 is presented below:

   Blackstone Holdings   The Blackstone Group L.P. 
          Equity Settled Awards   Cash Settled Awards 

Unvested Units

  Partnership
Units
  Weighted-
Average
Grant
Date Fair
Value
   Deferred
Restricted
Common
Units and
Options
  Weighted-
Average
Grant
Date Fair
Value
   Phantom
Units
  Weighted-
Average
Grant
Date Fair
Value
 

Balance, December 31, 2017

   30,023,189  $35.26    9,019,974  $30.03    44,196  $31.85 

Granted

   2,224,551   32.01    3,343,695   32.48    117   33.43 

Vested

   (2,161,371  36.27    (3,309,089  30.48    (151  32.99 

Forfeited

   (56,362  32.89    (213,508  30.34    —     —   


Balance, June 30, 2018

   30,030,007  $34.95    8,841,072  $30.76    44,162  $32.24 


Units Expected to Vest

The following unvested units, after expected forfeitures, as of June 30, 2018,March 31, 2019, are expected to vest:


     Weighted-
     Average
         Service Period    
  Units   Weighted-Average
Service Period in
Years
   Units  in Years

Blackstone Holdings Partnership Units

   26,551,896    3.5    26,705,736   3.0

Deferred Restricted Blackstone Common Units

   7,761,280    2.1    7,591,629   2.3


Total Equity-Based Awards

   34,313,176    3.2            34,297,365   2.9


Phantom Units

   37,120    2.4    39,024   2.3


16.17.

RELATED PARTY TRANSACTIONSRelated Party Transactions

Affiliate Receivables and Payables

Due from Affiliates and Due to Affiliates consisted of the following:


   June 30,
2018
   December 31,
2017
 

Due from Affiliates


Advances Made on Behalf of CertainNon-Controlling Interest Holders and Blackstone Employees Principally for Investments in Blackstone Funds

  $413,095   $410,877 

Amounts Due from Portfolio Companies and Funds

   514,064    587,955 

Management Fees and Performance Allocations Due fromNon-Consolidated Funds

   547,235    594,484 

Payments Made on Behalf ofNon-Consolidated Entities

   526,087    355,766 

Investments Redeemed inNon-Consolidated Funds

   14,355    77,943 

Accrual for Potential Clawback of Previously Distributed Performance Allocations

   1,113    1,112 


  $2,015,949   $2,028,137 


   March 31,  December 31,
   2019  2018

Due from Affiliates


Management Fees, Performance Revenues, Reimbursable Expenses and Other Receivables fromNon-Consolidated Entities and Portfolio Companies

   $1,816,801    $1,520,100 

Due from CertainNon-Controlling Interest Holders and Blackstone Employees

   491,734    462,475 

Accrual for Potential Clawback of Previously Distributed Performance Allocations

   11,756    11,548 


   $2,320,291    $1,994,123 


   March 31,  December 31,
   2019  2018

Due to Affiliates


Due to CertainNon-Controlling Interest Holders in Connection with the Tax Receivable Agreements

   $725,034    $796,902 

Due toNon-Consolidated Entities

   138,581    99,728 

Due to Note-Holders of Consolidated CLO Vehicles

   92,708    56,012 

Due to CertainNon-Controlling Interest Holders and Blackstone Employees

   48,320    53,613 

Accrual for Potential Repayment of Previously Received Performance Allocations

   40,809    29,521 


   $1,045,452    $1,035,776 


THE BLACKSTONE GROUP L.P.

Notes to Condensed Consolidated Financial Statements—Continued

(All Dollars Are in Thousands, Except Unit and Per Unit Data, Except Where Noted)

   June 30,
2018
   December 31,
2017
 

Due to Affiliates


Due to CertainNon-Controlling Interest Holders in Connection with the Tax Receivable Agreements

  $779,758   $715,734 

Distributions Received on Behalf of CertainNon-Controlling Interest Holders and Blackstone Employees

   63,349    87,829 

Distributions Received on Behalf of Blackstone Entities

   4,373    38,789 

Payments Made byNon-Consolidated Entities

   51,050    51,249 

Due to Note Holders of Consolidated CLO Vehicles

   66,548    41,386 

Accrual for Potential Repayment of Previously Received Performance Allocations

   2,172    2,171 


  $967,250   $937,158 


Interests of the Founder, Senior Managing Directors, Employees and Other Related Parties

The Founder, senior managing directors, employees and certain other related parties invest on a discretionary basis in the consolidated Blackstone Funds both directly and through consolidated entities. These investments generally are subject to preferential management fee and performance allocation or incentive fee arrangements. As of June 30, 2018March 31, 2019 and December 31, 2017,2018, such investments aggregated $843.8$877.8 million and $813.2$842.9 million, respectively. Their share of the Net Income Attributable to RedeemableNon-Controlling andNon-Controlling Interests in Consolidated Entities aggregated $37.0$31.0 million and $20.0$28.9 million for the three months ended June 30,March 31, 2019 and 2018, respectively.

The Blackstone Group L.P.

Notes to Condensed Consolidated Financial Statements (Unaudited) - Continued

(All Dollars Are in Thousands, Except Unit and 2017, respectively, and $65.8 million and $50.5 million for the six months ended June 30, 2018 and 2017, respectively.Per Unit Data, Except Where Noted)

Loans to Affiliates

Loans to affiliates consist of interest bearing advances to certain Blackstone individuals to finance their investments in certain Blackstone Funds. These loans earn interest at Blackstone’s cost of borrowing and such interest totaled $1.2$2.4 million and $1.1$1.3 million for the three months ended June 30,March 31, 2019 and 2018, and 2017, respectively, and $2.5 million and $1.3 million for the six months ended June 30, 2018 and 2017, respectively.

Contingent Repayment Guarantee

Blackstone and its personnel who have received Performance Allocation distributions have guaranteed payment on a several basis (subject to a cap) to the carry funds of any clawback obligation with respect to the excess Performance Allocation allocated to the general partners of such funds and indirectly received thereby to the extent that either Blackstone or its personnel fails to fulfill its clawback obligation, if any. The Accrual for Potential Repayment of Previously Received Performance Allocations represents amounts previously paid to Blackstone Holdings andnon-controlling interest holders that would need to be repaid to the Blackstone Funds if the carry funds were to be liquidated based on the fair value of their underlying investments as of June 30, 2018.March 31, 2019. See Note 17.18. “Commitments and Contingencies — Contingencies — Contingent Obligations (Clawback)”.

Aircraft and Other Services

In the normal course of business, Blackstone personnel make use of aircraft owned as personal assets by Stephen A. Schwarzman; an aircraft owned jointly as a personal asset by Hamilton E. James, Blackstone’s Executive Vice Chairman and a Director of Blackstone, and another senior managing director; an aircraft owned as

THE BLACKSTONE GROUP L.P.

Notes to Condensed Consolidated Financial Statements—Continued

(All Dollars Are in Thousands, Except Unit and Per Unit Data, Except Where Noted)

a personal asset by Jonathan D. Gray, Blackstone’s President and Chief Operating Officer and a Director of Blackstone; and an aircraft owned jointly as a personal asset by Bennett J. Goodman,Co-Founder of GSO Capital and a Director of Blackstone, and anothera former senior managing director (each such aircraft, “Personal Aircraft”). Mr. Schwarzman paid for his purchases of his Personal Aircraft himself. Mr. James paid for his interest in his jointly owned Personal Aircraft. Mr. Goodman paid for his interest in his jointly owned Personal Aircraft. Mr. Gray paid for his purchase of his Personal Aircraft himself. Mr. Schwarzman, Mr. James, Mr. Goodman and Mr. Gray respectively bear operating, personnel and maintenance costs associated with the operation of such Personal Aircraft. Payment by Blackstone for the use of the Personal Aircraft by Blackstone employees is made based on market rates.

In addition, on occasion, certain of Blackstone’s executive officers and employee directors and their families may make personal use of aircraft in which Blackstone owns a fractional interest, as well as other assets of Blackstone. Any such personal use of Blackstone assets is charged to the executive officer or employee director based on market rates and usage. Personal use of Blackstone resources is also reimbursed to Blackstone based on market rates.

The transactions described herein are not material to the Condensed Consolidated Financial Statements.

Tax Receivable Agreements

Blackstone used a portion of the proceeds from the IPO and the sale ofnon-voting common units to Beijing Wonderful Investments to purchase interests in the predecessor businesses from the predecessor owners. In addition, holders of Blackstone Holdings Partnership Units may exchange their Blackstone Holdings Partnership Units for Blackstone common units on aone-for-one basis. The purchase and subsequent exchanges are expected to result in increases in the tax basis of the tangible and intangible assets of Blackstone Holdings and therefore reduce the amount of tax that Blackstone’s wholly owned subsidiaries would otherwise be required to pay in the future.

One of the subsidiaries of the Partnership which is a corporate taxpayer has entered into tax receivable agreements with each of the predecessor owners and additional tax receivable agreements have been executed, and will continue to be executed, with newly-admitted senior managing directors and others who acquire Blackstone Holdings Partnership Units. The agreements provide for the payment by the corporate taxpayer to such owners of 85% of the amount of cash savings, if any, in U.S. federal, state and local income tax that the corporate

The Blackstone Group L.P.

Notes to Condensed Consolidated Financial Statements (Unaudited) - Continued

(All Dollars Are in Thousands, Except Unit and Per Unit Data, Except Where Noted)

taxpayers actually realize as a result of the aforementioned increases in tax basis and of certain other tax benefits related to entering into these tax receivable agreements. For purposes of the tax receivable agreements, cash savings in income tax will be computed by comparing the actual income tax liability of the corporate taxpayers to the amount of such taxes that the corporate taxpayers would have been required to pay had there been no increase to the tax basis of the tangible and intangible assets of Blackstone Holdings as a result of the exchanges and had the corporate taxpayers not entered into the tax receivable agreements.

Assuming no future material changes in the relevant tax law and that the corporate taxpayers earn sufficient taxable income to realize the full tax benefit of the increased amortization of the assets, the expected future payments under the tax receivable agreements (which are taxable to the recipients) will aggregate $779.8$725.0 million over the next 15 years. Theafter-tax net present value of these estimated payments totals $282.8$256.5 million assuming a 15% discount rate and using Blackstone’s most recent projections relating to the estimated timing of the benefit to be received. Future payments under the tax receivable agreements in respect of subsequent exchanges would be in addition to these amounts. The payments under the tax receivable agreements are not conditioned upon continued ownership of Blackstone equity interests by thepre-IPO owners and the others mentioned above.

THE BLACKSTONE GROUP L.P.

Notes to Condensed Consolidated Financial Statements—Continued

(All Dollars Are in Thousands, Except Unit and Per Unit Data, Except Where Noted)

Amounts related to the deferred tax asset resulting from the increase in tax basis from the exchange of Blackstone Holdings Partnership Units to Blackstone common units, the resulting remeasurement of net deferred tax assets at the Blackstone ownership percentage at the balance sheet date, the due to affiliates for the future payments resulting from the tax receivable agreements and resulting adjustment to partners’ capital are included as Acquisition of Ownership Interests fromNon-Controlling Interest Holders in the Supplemental Disclosure ofNon-Cash Investing and Financing Activities in the Condensed Consolidated Statements of Cash Flows.

Other

Blackstone does business with and on behalf of some of its Portfolio Companies; all such arrangements are on a negotiated basis.

Additionally, please see Note 17.18. “Commitments and Contingencies — Contingencies — Guarantees” for information regarding guarantees provided to a lending institution for certain loans held by employees.


17.18.

COMMITMENTS AND CONTINGENCIESCommitments and Contingencies

Commitments

Investment Commitments

Blackstone had $2.4$3.0 billion of investment commitments as of June 30, 2018March 31, 2019 representing general partner capital funding commitments to the Blackstone Funds, limited partner capital funding to other funds and Blackstone principal investment commitments. The consolidated Blackstone Funds had signed investment commitments of $545.2$475.7 million as of June 30, 2018March 31, 2019 which includes $155.4$93.9 million of signed investment commitments for portfolio company acquisitions in the process of closing.

Contingencies

Guarantees

Certain of Blackstone’s consolidated real estate funds guarantee payments to third parties in connection with theon-going business activities and/or acquisitions of their Portfolio Companies. There is no direct recourse to the Partnership to fulfill such obligations. To the extent that underlying funds are required to fulfill guarantee obligations, the Partnership’s invested capital in such funds is at risk. Total investments at risk in respect of guarantees extended by consolidated real estate funds was $15.9$27.5 million as of June 30, 2018.March 31, 2019.

The Blackstone Group L.P.

Notes to Condensed Consolidated Financial Statements (Unaudited) - Continued

(All Dollars Are in Thousands, Except Unit and Per Unit Data, Except Where Noted)

The Blackstone Holdings Partnerships provided guarantees to a lending institution for certain loans held by employees either for investment in Blackstone Funds or for members’ capital contributions to The Blackstone Group International Partners LLP. The amount guaranteed as of June 30, 2018March 31, 2019 was $185.7$192.9 million.

Litigation

FromBlackstone may from time to time be involved in litigation and claims incidental to the conduct of its business. Blackstone’s businesses are also subject to extensive regulation, which may result in regulatory proceedings against the Partnership.

Blackstone is named asaccrues a defendantliability for legal proceedings only when those matters present loss contingencies that are both probable and reasonably estimable. In such cases, there may be an exposure to loss in legal actions relating to transactions conducted in the ordinary courseexcess of business.any amounts accrued. Although there can be no assurance of the outcome of such legal actions, in the opinion ofbased on information known by management, Blackstone does not have a potential liability related to any current legal proceeding or claim that would individually or in the aggregate materially affect its results of operations, financial position or cash flows.

In December 2017, a purported derivative suit (Mayberry v. KKR & Co., L.P., et al.) was filed in the Commonwealth of Kentucky Franklin County Circuit Court on behalf of the Kentucky Retirement System (“KRS”) by eight of its members and beneficiaries alleging various breaches of fiduciary duty and other violations of Kentucky state law in connection with KRS’s investment in three hedge funds of funds, including a fund managed by Blackstone Alternative Asset Management L.P. (“BAAM L.P.”). The suit names more than 30 defendants, including The Blackstone Group L.P.; BAAM L.P.; Stephen A. Schwarzman, as Chairman and CEO of Blackstone; and J. Tomilson Hill, as then-President and CEO of the Hedge Fund Solutions Group, Vice Chairman of Blackstone and CEO of BAAM (collectively, the “Blackstone Defendants”). Aside from the Blackstone Defendants, the action also names current and former KRS trustees and former KRS officers and various other service providers to KRS and their related persons.

THE BLACKSTONE GROUPThe plaintiffs filed an amended complaint in January 2018. In November 2018, the Circuit Court granted one defendant’s motion to dismiss and denied all other defendants’ motions to dismiss, including those of the Blackstone Defendants. In January 2019, certain of the KRS trustee and officer defendants noticed appeals from the denial of the motions to dismiss to the Kentucky Court of Appeals, and also filed a motion to stay the Mayberry proceedings in Circuit Court pending the outcome of those appeals. In addition, several defendants, including Blackstone and BAAM L.P., filed petitions in the Kentucky Court of Appeals for a writ of prohibition against the ongoing Mayberry proceedings on the ground that the plaintiffs lack standing. In April 2019, the KRS trustee and officer defendants’ appeals were transferred to the Kentucky Supreme Court.

NotesOn April 23, 2019, the Kentucky Court of Appeals granted the Blackstone Defendants’ petition for a writ of prohibition and vacated the Circuit Court’s November 30, 2018 Opinion and Order denying the motion to Condensed Consolidated Financial Statements—Continueddismiss for lack of standing. On April 24, 2019, the Mayberry Plaintiffs filed a notice of appeal of that order to the Kentucky Supreme Court.

(All Dollars Are in Thousands, Except UnitBlackstone believes that this suit is totally without merit and Per Unit Data, Except Where Noted)intends to defend it vigorously.

Contingent Obligations (Clawback)

Performance Allocations are subject to clawback to the extent that the Performance Allocations received to date with respect to a fund exceeds the amount due to Blackstone based on cumulative results of that fund. The actual clawback liability, however, generally does not become realized until the end of a fund’s life except for certain Blackstone real estate funds, multi-asset class investment funds and credit-focused funds, which may have an interim clawback liability. The lives of the carry funds, including available contemplated extensions, for which a liability for potential clawback obligations has been recorded for financial reporting purposes, are currently anticipated to expire at various points through 2028. Further extensions of such terms may be implemented under given circumstances.

The Blackstone Group L.P.

Notes to Condensed Consolidated Financial Statements (Unaudited) - Continued

(All Dollars Are in Thousands, Except Unit and Per Unit Data, Except Where Noted)

For financial reporting purposes, when applicable, the general partners record a liability for potential clawback obligations to the limited partners of some of the carry funds due to changes in the unrealized value of a fund’s remaining investments and where the fund’s general partner has previously received Performance Allocation distributions with respect to such fund’s realized investments.

The following table presents the clawback obligations by segment:


  March 31, 2019  December 31, 2018
     Current and       Current and  
  June 30, 2018   December 31, 2017   Blackstone  Former    Blackstone  Former  

Segment

  Blackstone
Holdings
   Current and
Former  Personnel
   Total   Blackstone
Holdings
   Current and
Former  Personnel
   Total   Holdings  Personnel (a) Total  Holdings  Personnel (a) Total

Real Estate

   $16,130    $10,295   $26,425    $15,770    $10,053   $25,823 

Private Equity

   24,684    (13,089  11,595    13,296    (12,448  848 

Credit

  $1,059   $1,113   $2,172   $1,059   $1,112   $2,171    1,328    1,461   2,789    1,355    1,495   2,850 


   $42,142    $(1,333  $40,809    $30,421    $(900  $29,521 


(a)

The split of clawback between Blackstone Holdings and Current and Former Personnel is based on the performance of individual investments held by a fund rather than on a fund by fund basis.

For Private Equity, Real Estate, and certain Credit Funds, a portion of the Performance Allocations paid to current and former Blackstone personnel is held in segregated accounts in the event of a cash clawback obligation. These segregated accounts are not included in the Condensed Consolidated Financial Statements of the Partnership, except to the extent a portion of the assets held in the segregated accounts may be allocated to a consolidated Blackstone fund of hedge funds. At June 30, 2018, $696.5March 31, 2019, $691.8 million was held in segregated accounts for the purpose of meeting any clawback obligations of current and former personnel if such payments are required.

In the Credit segment, payment of Performance Allocations to the Partnership by the majority of the stressed/distressed, mezzanine and credit alpha strategies funds isare substantially deferred under the terms of the partnership agreements. This deferral mitigates the need to hold funds in segregated accounts in the event of a cash clawback obligation.

If, at June 30, 2018,March 31, 2019, all of the investments held by our carry funds were deemed worthless, a possibility that management views as remote, the amount of Performance Allocations subject to potential clawback would be $6.5$6.9 billion, on anafter-tax basis where applicable, of which Blackstone Holdings is potentially liable for $6.0$6.3 billion if current and former Blackstone personnel default on their share of the liability, a possibility that management also views as remote.


18.19.

SEGMENT REPORTINGSegment Reporting

Blackstone transacts its primary business in the United States and substantially all of its revenues are generated domestically.

Blackstone conducts its alternative asset management businesses through four segments:


Private Equity — Blackstone’s Private Equity segment primarily comprises its management of flagship corporate private equity funds,sector-focused corporate private equity funds, includingenergy-focused

THE BLACKSTONE GROUP L.P.

Notes to Condensed Consolidated Financial Statements—Continued

(All Dollars Are in Thousands, Except Unit and Per Unit Data, Except Where Noted)

funds, a core private equity fund, an opportunistic investment platform, a secondary private equity fund of funds business, a multi-asset investment program for eligible high net worth investors and a capital markets services business.

Real Estate Blackstone’s Real Estate segment primarily comprises its management of global, European-focusedEurope and Asian-focusedAsia-focused opportunistic real estate funds, high yieldhigh-yield real estate debt funds, liquid real estate debt funds, core+ real estate funds, a NYSE-listed REIT and anon-exchange traded REIT.

Private Equity – Blackstone’s Private Equity segment primarily comprises its management of flagship corporate private equity funds, sector and geographically-focused corporate private equity funds, including energy and Asia-focused funds, a core private equity fund, an opportunistic investment platform, a secondary fund of funds business, infrastructure-focused funds, a life sciences private

The Blackstone Group L.P.

Notes to Condensed Consolidated Financial Statements (Unaudited) - Continued

(All Dollars Are in Thousands, Except Unit and Per Unit Data, Except Where Noted)

investment platform, a multi-asset investment program for eligible high net worth investors and a capital markets services business.


Hedge Fund Solutions – The largest component of Blackstone’s Hedge Fund Solutions segment is comprised principally of Blackstone Alternative Asset Management, (“BAAM”), which manages a broad range of commingled and customized hedge fund of fund solutions andsolutions. The segment also includes investment platforms that seed new hedge fund businesses, purchase minority ownership interests in more established hedge funds, invest in special situation opportunities, create alternative solutions in regulated structuresthe form of mutual funds and UCITS and trade directly.


Credit Blackstone’s Credit segment consists principally of GSO Capital Partners LP, (“GSO”), which is organized into performing credit strategies (which include mezzanine lending funds, middle market direct lending funds and other performing credit strategies)strategy funds), distressed strategies (which include credit alpha strategies, stressed/distressed funds and energy strategies), and long only strategies (which consist of CLOs, closed end funds, commingledopen end funds and separately managed accounts), Harvest (which invests in. In addition, the segment includes a publicly traded master limited partnerships holding primarily midstream energy assets in the U.S.),partnership investment platform, Harvest, and our insurer-focused platform, Blackstone Insurance Solutions (which partners with insurers to deliver customizable and diversified portfolios of Blackstone products across asset classes, as well as the option for full management of insurance companies’ investment portfolios).Solutions.

These business segments are differentiated by their various sources of income.investment strategies. The Real Estate, Private Equity, Real Estate, Hedge Fund Solutions and Credit segments primarily earn their income from management fees and investment returns on assets under management.

Blackstone uses Economic Income as a keySegment Distributable Earnings is Blackstone’s segment profitability measure of value creation, a benchmark ofused to make operating decisions and assess performance and in making resource deployment and compensation decisions across itsBlackstone’s four segments. Economic Income presents revenues and expensesBlackstone’s segments are presented on a basis that deconsolidates the investment funds Blackstone manages, and excludesFunds, eliminatesnon-controlling ownership interests in Blackstone’s consolidated Operating Partnerships, removes the amortization of intangiblesintangible assets and other activity referred to as “Transaction-Related Charges”.removes Transaction-Related Charges. Transaction-Related Charges arise from corporate actions including acquisitions, divestitures and Blackstone’s initial public offering. They consist primarily of equity-based compensation charges, gains and losses on contingent consideration arrangements, changes in the balance of the tax receivable agreement resulting from a change in tax law or similar event, transaction costs and any gains or losses associated with these corporate actions.

For segment reporting purposes, Segment Distributable Earnings is presented along with its major components, Fee Related Earnings and Net Realizations. Fee Related Earnings is used to assess Blackstone’s ability to generate profits from revenues that are measured and received on a recurring basis and not subject to future realization events. Net Realizations is the sum of Realized Principal Investment Income and Realized Performance Revenues less Realized Performance Compensation. Performance Allocations and Incentive Fees are presented together and referred to collectively as Performance Revenues or Performance Compensation.

Senior management makes operating decisions and assesses the performance of each of Blackstone’s business segments based on financial and operating metrics and data that is presented without the consolidation of any of the

The Blackstone Funds that are consolidated into the Condensed Consolidated Financial Statements.

Group L.P.

THE BLACKSTONE GROUP L.P.

Notes to Condensed Consolidated Financial Statements—Statements (Unaudited) - Continued

(All Dollars Are in Thousands, Except Unit and Per Unit Data, Except Where Noted)


Segment Presentation

The following tables presentspresent the financial data for Blackstone’s four segments as of March 31, 2019 and for the three months ended June 30, 2018March 31, 2019 and 2017:2018.


  Three Months Ended June 30, 2018 
  Private
Equity
  Real
Estate
  Hedge  Fund
Solutions
  Credit  Total
Segments
 

Revenues


Management and Advisory Fees, Net


Base Management Fees

 $195,521  $249,680  $129,553  $118,161  $692,915 

Transaction, Advisory and Other Fees, Net

  12,780   23,859   812   3,461   40,912 

Management Fee Offsets

  (4,351  (3,785  —     (2,697  (10,833


Total Management and Advisory Fees, Net

  203,950   269,754   130,365   118,925   722,994 


Performance Revenues


Realized Incentive Fees

  —     11,394   6,887   1,223   19,504 

Realized Performance Allocations

  138,171   351,630   383   13,371   503,555 

Unrealized Performance Allocations

  498,274   (160,578  9,930   92,798   440,424 


Total Performance Revenues

  636,445   202,446   17,200   107,392   963,483 


Principal Investment Income (Loss)


Realized

  32,600   50,199   7,766   4,082   94,647 

Unrealized

  84,247   (28,044  (4,841  764   52,126 


Total Principal Investment Income

  116,847   22,155   2,925   4,846   146,773 

Interest and Dividend Revenue

  11,549   14,494   5,152   10,532   41,727 

Other

  26,667   30,457   17,619   19,673   94,416 


Total Revenues

  995,458   539,306   173,261   261,368   1,969,393 


Expenses


Compensation

  103,798   109,599   48,086   55,907   317,390 

Performance Compensation


Realized Incentive Fees

  —     5,820   4,155   (232  9,743 

Realized Performance Allocations

  68,513   109,233   937   7,715   186,398 

Unrealized Performance Allocations

  193,747   (51,370  2,772   44,842   189,991 


Total Compensation and Benefits

  366,058   173,282   55,950   108,232   703,522 

Interest Expense

  12,773   11,389   5,900   8,823   38,885 

Other Operating Expenses

  36,047   36,026   18,494   31,899   122,466 


Total Expenses

  414,878   220,697   80,344   148,954   864,873 


Economic Income

 $580,580  $318,609  $92,917  $112,414  $1,104,520 


   March 31, 2019 and the Three Months Then Ended
   Real Private Hedge Fund   Total
   Estate Equity Solutions Credit Segments

Management and Advisory Fees, Net


Base Management Fees

   $260,245   $219,417   $137,328   $140,528   $757,518 

Transaction, Advisory and Other Fees, Net

   23,911   37,291   318   3,630   65,150 

Management Fee Offsets

   (280  (4,985     (3,341  (8,606


Total Management and Advisory Fees, Net

   283,876   251,723   137,646   140,817   814,062 

Fee Related Performance Revenues

   6,676         1,103   7,779 

Fee Related Compensation

   (114,816  (107,587  (42,954  (58,674  (324,031

Other Operating Expenses

   (38,986  (34,201  (17,885  (32,239  (123,311


Fee Related Earnings

   136,750   109,935   76,807   51,007   374,499 


Realized Performance Revenues

   77,182   156,599   4,091   8,897   246,769 

Realized Performance Compensation

   (29,900  (50,556  (1,413  (3,371  (85,240

Realized Principal Investment Income (Loss)

   (2,131  25,139   (283  3,183   25,908 


Total Net Realizations

   45,151   131,182   2,395   8,709   187,437 


Total Segment Distributable Earnings

   $181,901   $241,117   $79,202   $59,716   $561,936 


Segment Assets

   $7,861,900   $7,868,736   $2,014,350   $3,667,241   $21,412,227 


   Three Months Ended March 31, 2018
   Real Private Hedge Fund   Total
   Estate Equity Solutions Credit Segments

Management and Advisory Fees, Net


Base Management Fees

   $226,526   $182,961   $129,228   $168,441   $707,156 

Transaction, Advisory and Other Fees, Net

   23,088   11,094   345   2,539   37,066 

Management Fee Offsets

   (1,668  (3,193     (3,317  (8,178


Total Management and Advisory Fees, Net

   247,946   190,862   129,573   167,663   736,044 

Fee Related Performance Revenues

   4,503         (666  3,837 

Fee Related Compensation

   (100,610  (89,566  (39,639  (66,259  (296,074

Other Operating Expenses

   (29,417  (31,151  (18,785  (27,739  (107,092


Fee Related Earnings

   122,422   70,145   71,149   72,999   336,715 


Realized Performance Revenues

   151,181   77,123   10,177   39,890   278,371 

Realized Performance Compensation

   (56,115  (33,045  (2,923  (22,746  (114,829

Realized Principal Investment Income

   14,690   6,338   640   7,025   28,693 


Total Net Realizations

   109,756   50,416   7,894   24,169   192,235 


Total Segment Distributable Earnings

   $232,178   $120,561   $79,043   $97,168   $528,950 


The Blackstone Group L.P.

THE BLACKSTONE GROUP L.P.

Notes to Condensed Consolidated Financial Statements—Statements (Unaudited) - Continued

(All Dollars Are in Thousands, Except Unit and Per Unit Data, Except Where Noted)


   Three Months Ended June 30, 2017 
   Private
Equity
  Real
Estate
  Hedge  Fund
Solutions
  Credit  Total
Segments
 

Revenues


Management and Advisory Fees, Net


Base Management Fees

  $177,684  $227,865  $128,698  $137,121  $671,368 

Transaction, Advisory and Other Fees, Net

   17,289   16,087   1,696   3,820   38,892 

Management Fee Offsets

   (3,753  (5,018  —     (4,653  (13,424


Total Management and Advisory Fees, Net

   191,220   238,934   130,394   136,288   696,836 


Performance Revenues


Realized Incentive Fees

   —     4,878   6,548   28,877   40,303 

Realized Performance Allocations

   198,168   389,441   447   15,040   603,096 

Unrealized Performance Allocations

   9   89,688   14,849   (8,839  95,707 


Total Performance Revenues

   198,177   484,007   21,844   35,078   739,106 


Principal Investment Income (Loss)


Realized

   41,168   57,599   225   1,895   100,887 

Unrealized

   (25,892  (20,519  11,578   1,666   (33,167


Total Principal Investment Income

   15,276   37,080   11,803   3,561   67,720 

Interest and Dividend Revenue

   7,922   14,493   4,674   6,614   33,703 

Other

   (16,124  (22,965  (10,720  (12,660  (62,469


Total Revenues

   396,471   751,549   157,995   168,881   1,474,896 


Expenses


Compensation

   90,676   110,266   47,361   56,954   305,257 

Performance Compensation


Realized Incentive Fees

   —     2,711   4,097   14,224   21,032 

Realized Performance Allocations

   63,060   124,512   265   7,901   195,738 

Unrealized Performance Allocations

   22,219   64,254   5,968   (5,531  86,910 


Total Compensation and Benefits

   175,955   301,743   57,691   73,548   608,937 

Interest Expense

   10,728   14,787   6,688   8,091   40,294 

Other Operating Expenses

   28,592   33,379   16,318   27,549   105,838 


Total Expenses

   215,275   349,909   80,697   109,188   755,069 


Economic Income

  $181,196  $401,640  $77,298  $59,693  $719,827 


THE BLACKSTONE GROUP L.P.

Reconciliations of Total Segment Amounts

The following tables reconcile the Total Segment Revenues, Expenses and Distributable Earnings to their equivalent GAAP measure for the three months ended March 31, 2019 and 2018 along with Total Assets as of March 31, 2019:

                                    
   Three Months Ended
   March 31,
   2019 2018

Revenues


Total GAAP Revenues

   $2,024,871   $1,769,131 

Less: Unrealized Performance Revenues (a)

   (664,333  (628,339

Less: Unrealized Principal Investment Income (b)

   (139,925  (13,978

Less: Interest and Dividend Revenue (c)

   (46,699  (36,385

Less: Other Revenue (d)

   (13,189  60,894 

Impact of Consolidation (e)

   (69,849  (103,524

Amortization of Intangibles (f)

   387   387 

Transaction-Related Charges (g)

   1,468   (2,582

Intersegment Eliminations

   1,787   1,341 


Total Segment Revenue (h)

   $1,094,518   $1,046,945 


   Three Months Ended
   March 31,
   2019 2018

Expenses


Total GAAP Expenses

   $1,041,164   $982,931 

Less: Unrealized Performance Allocations Compensation (i)

   (287,015  (254,435

Less: Equity-Based Compensation (j)

   (66,776  (44,148

Less: Interest Expense (k)

   (41,638  (38,238

Impact of Consolidation (e)

   (10,861  (59,899

Amortization of Intangibles (f)

   (16,096  (14,486

Transaction-Related Charges (g)

   (87,983  (55,071

Intersegment Eliminations

   1,787   1,341 


Total Segment Expenses (l)

   $532,582   $517,995 


   Three Months Ended
   March 31,
   2019 2018

Other Income


Total GAAP Other Income

   $130,325   $110,599 

Impact of Consolidation (e)

   (130,325  (110,599


Total Segment Other Income

   $   $ 


The Blackstone Group L.P.

Notes to Condensed Consolidated Financial Statements—Statements (Unaudited) - Continued

(All Dollars Are in Thousands, Except Unit and Per Unit Data, Except Where Noted)


The following table reconciles the Total Segments to Blackstone’s Income Before Provision for Taxes for the three months ended June 30, 2018 and 2017:


   Three Months Ended June 30, 2018 
   Revenues   Expenses   Other
Income
   Economic
Income /
Income
Before
Provision for
Taxes (a)
 

Total Segments

  $1,969,393   $864,873   $—     $1,104,520 


Adjustments


Impact of Consolidation (b)

   82,752    26,288    73,519    129,983 

Amortization of Intangibles (c)

   (387   14,486    —      (14,873

Intersegment Eliminations

   (1,293   (1,293   —      —   

Transaction-Related Charges (d)

   582,105    112,027    —      470,078 


Total Adjustments

   663,177    151,508    73,519    585,188 


Blackstone Consolidated

  $2,632,570   $1,016,381   $73,519   $1,689,708 


   Three Months Ended June 30, 2017 
   Revenues   Expenses   Other
Income
   Economic
Income /
Income
Before
Provision for
Taxes (a)
 

Total Segments

  $1,474,896   $755,069   $—     $719,827 


Adjustments


Impact of Consolidation (b)

   57,503    53,622    110,054    113,935 

Amortization of Intangibles (c)

   (387   10,957    —      (11,344

Intersegment Eliminations

   (1,628   (1,628   —      —   

Transaction-Related Charges (d)

   5,342    63,173    —      (57,831


Total Adjustments

   60,830    126,124    110,054    44,760 


Blackstone Consolidated

  $1,535,726   $881,193   $110,054   $764,587 


   Three Months Ended
   March 31,
   2019 2018

Income Before Provision for Taxes


Total GAAP Income Before Provision for Taxes

   $1,114,032   $896,799 

Less: Unrealized Performance Revenues (a)

   (664,333  (628,339

Less: Unrealized Principal Investment Income (b)

   (139,925  (13,978

Less: Interest and Dividend Revenue (c)

   (46,699  (36,385

Less: Other Revenue (d)

   (13,189  60,894 

Plus: Unrealized Performance Allocations Compensation (i)

   287,015   254,435 

Plus: Equity-Based Compensation (j)

   66,776   44,148 

Plus: Interest Expense (k)

   41,638   38,238 

Impact of Consolidation (e)

   (189,313  (154,224

Amortization of Intangibles (f)

   16,483   14,873 

Transaction-Related Charges (g)

   89,451   52,489 


Total Segment Distributable Earnings

   $561,936   $528,950 


As of
March 31,
2019

Total Assets

Total GAAP Assets

 $29,874,951

Impact of Consolidation (e)

(8,462,724

Total Segment Assets

 $  21,412,227

Segment basis presents revenues and expenses on a basis that deconsolidates the investment funds Blackstone manages and excludes the amortization of intangibles and Transaction-Related Charges.

(a)

Represents Total Segments Economic Income reconciled to Blackstone Consolidated Income Before Provision for Taxes.This adjustment removes Unrealized Performance Revenues on a segment basis.

(b)

This adjustment removes Unrealized Principal Investment Income on a segment basis.

(c)

This adjustment removes Interest and Dividend Revenue on a segment basis.

(d)

This adjustment removes Other Revenue on a segment basis.

(e)

The Impact of Consolidation adjustment represents the effect of consolidating Blackstone Funds, the elimination of Blackstone’s interest in these funds, the increase to revenue representing the reimbursement of certain expenses by Blackstone Funds, which are presented gross under GAAP but netted against Other Operating Expenses in the segment presentation, and the removal of amounts associated with the ownership of Blackstone consolidated operating partnerships held bynon-controlling interests.

(c)(f)

Amortization of intangibles consists of the amortization of transaction-related intangibles including intangibles associated with Blackstone’sBlackstones investment in Patria,Pátria, which is accounted for under the equity method.

(d)(g)

Transaction-Related Charges arise from corporate actions including acquisitions, divestitures, and Blackstone’s initial public offering. They consist primarily of equity-based compensation charges, gains and losses on contingent consideration arrangements, changes in the balance of the tax receivable agreement resulting from a change in tax law or similar event, transaction costs and any gains or losses associated with these corporate actions.

The Blackstone Group L.P.

THE BLACKSTONE GROUP L.P.

Notes to Condensed Consolidated Financial Statements—Statements (Unaudited) - Continued

(All Dollars Are in Thousands, Except Unit and Per Unit Data, Except Where Noted)


(h)actions. During

Total Segment Revenues is comprised of the three months ended June 30, 2018, Transaction-Related Charges include $580.9 million of Other Revenues received upon the conclusion of Blackstone’s investmentsub-advisory relationship with FS Investments’ funds.following:

                                                
   Three Months Ended
   March 31,
   2019  2018

Total Segment Management and Advisory Fees, Net

   $814,062    $736,044 

Total Segment Fee Related Performance Revenues

   7,779    3,837 

Total Segment Realized Performance Revenues

   246,769    278,371 

Total Segment Realized Principal Investment Income

   25,908    28,693 


Total Segment Revenues

   $    1,094,518    $    1,046,945 


(i)

This adjustment removes Unrealized Performance Allocations Compensation.

(j)

This adjustment removes Equity-Based Compensation on a segment basis.

(k)

This adjustment removes Interest Expense, excluding interest expense related to the Tax Receivable Agreement.

(l)

Total Segment Expenses is comprised of the following:

                                                
   Three Months Ended
   March 31,
   2019  2018

Total Segment Fee Related Compensation

   $324,031    $296,074 

Total Segment Realized Performance Compensation

   85,240    114,829 

Total Segment Other Operating Expenses

   123,311    107,092 


Total Segment Expenses

   $      532,582    $      517,995 


Reconciliations of Total Segment Components

The following tables presentreconcile the financial data for Blackstone’s four segments ascomponents of andTotal Segments to their equivalent GAAP measures, reported on the Condensed Consolidated Statement of Operations for the sixthree months ended June 30, 2018March 31, 2019 and 2017:2018:


  June 30, 2018 and the Six Months Then Ended 
  Private
Equity
  Real
Estate
  Hedge Fund
Solutions
  Credit  Total
Segments
 

Revenues


Management and Advisory Fees, Net


Base Management Fees

 $378,482  $476,206  $258,781  $286,602  $1,400,071 

Transaction, Advisory and Other Fees, Net

  23,874   46,947   1,157   6,000   77,978 

Management Fee Offsets

  (7,544  (5,453  —     (6,014  (19,011


Total Management and Advisory Fees, Net

  394,812   517,700   259,938   286,588   1,459,038 


Performance Revenues


Realized Incentive Fees

  —     15,769   15,058   1,243   32,070 

Realized Performance Allocations

  215,294   502,939   2,389   52,575   773,197 

Unrealized Performance Allocations

  895,590   65,864   14,991   92,318   1,068,763 


Total Performance Revenues

  1,110,884   584,572   32,438   146,136   1,874,030 


Principal Investment Income (Loss)


Realized

  38,938   64,889   8,406   11,107   123,340 

Unrealized

  101,615   (25,357  (4,401  (5,753  66,104 


Total Principal Investment Income

  140,553   39,532   4,005   5,354   189,444 

Interest and Dividend Revenue

  20,092   29,622   9,964   18,434   78,112 

Other

  10,259   8,960   7,331   6,972   33,522 


Total Revenues

  1,676,600   1,180,386   313,676   463,484   3,634,146 


Expenses


Compensation

  203,527   222,423   98,386   129,381   653,717 

Performance Compensation


Realized Incentive Fees

  —     8,030   8,189   186   16,405 

Realized Performance Allocations

  101,558   163,416   3,352   30,134   298,460 

Unrealized Performance Allocations

  372,549   27,800   4,958   39,119   444,426 


Total Compensation and Benefits

  677,634   421,669   114,885   198,820   1,413,008 

Interest Expense

  22,906   25,538   12,171   16,508   77,123 

Other Operating Expenses

  67,198   65,443   37,279   59,638   229,558 


Total Expenses

  767,738   512,650   164,335   274,966   1,719,689 


Economic Income

 $908,862  $667,736  $149,341  $188,518  $1,914,457 


Segment Assets

 $7,574,520  $7,536,885  $2,275,685  $4,099,397  $21,486,487 


   Three Months Ended
   March 31,
   2019  2018

Management and Advisory Fees, Net


GAAP

   $809,726    $728,849 

Segment Adjustment (a)

   4,336    7,195 


Total Segment

   $814,062    $736,044 


The Blackstone Group L.P.

THE BLACKSTONE GROUP L.P.

Notes to Condensed Consolidated Financial Statements—Statements (Unaudited) - Continued

(All Dollars Are in Thousands, Except Unit and Per Unit Data, Except Where Noted)


  Six Months Ended June 30, 2017 
  Private
Equity
  Real
Estate
  Hedge  Fund
Solutions
  Credit  Total
Segments
 

Revenues


Management and Advisory Fees, Net


Base Management Fees

 $354,390  $425,744  $257,166  $277,026  $1,314,326 

Transaction, Advisory and Other Fees, Net

  33,465   37,366   1,955   6,328   79,114 

Management Fee Offsets

  (15,943  (8,568  —     (22,512  (47,023


Total Management and Advisory Fees, Net

  371,912   454,542   259,121   260,842   1,346,417 


Performance Revenues


Realized Incentive Fees

  —     7,760   20,635   58,419   86,814 

Realized Performance Allocations

  780,849   909,314   1,044   23,837   1,715,044 

Unrealized Performance Allocations

  (184,469  81,642   33,664   40,792   (28,371


Total Performance Revenues

  596,380   998,716   55,343   123,048   1,773,487 


Principal Investment Income (Loss)


Realized

  122,462   177,178   (407  4,548   303,781 

Unrealized

  (66,414  (104,372  29,871   8,813   (132,102


Total Principal Investment Income

  56,048   72,806   29,464   13,361   171,679 

Interest and Dividend Revenue

  14,583   26,587   8,671   12,358   62,199 

Other

  (17,924  (26,115  (12,330  (14,387  (70,756


Total Revenues

  1,020,999   1,526,536   340,269   395,222   3,283,026 


Expenses


Compensation

  174,279   212,968   94,965   112,072   594,284 

Performance Compensation


Realized Incentive Fees

  —     4,044   11,111   28,342   43,497 

Realized Performance Allocations

  244,693   304,468   568   12,487   562,216 

Unrealized Performance Allocations

  (17,137  82,046   12,390   17,144   94,443 


Total Compensation and Benefits

  401,835   603,526   119,034   170,045   1,294,440 

Interest Expense

  21,155   29,422   13,231   15,936   79,744 

Other Operating Expenses

  56,353   64,243   32,697   49,007   202,300 


Total Expenses

  479,343   697,191   164,962   234,988   1,576,484 


Economic Income

 $541,656  $829,345  $175,307  $160,234  $1,706,542 


   Three Months Ended
   March 31,
   2019 2018

GAAP Realized Performance Revenues to Total Segment Fee Related Performance Revenues


GAAP


Incentive Fees

   $12,132   $12,566 

Investment Income - Realized Performance Allocations

   242,375   269,640 


GAAP

   254,507   282,206 

Total Segment


Less: Realized Performance Revenues

   (246,769  (278,371

Segment Adjustment (b)

   41   2 


Total Segment

   $7,779   $3,837 


   Three Months Ended
   March 31,
   2019 2018

GAAP Compensation to Total Segment Fee Related Compensation


GAAP


Compensation

   $471,397   $389,403 

Incentive Fee Compensation

   5,406   6,662 

Realized Performance Allocations Compensation

   86,395   112,062 


GAAP

   563,198   508,127 

Total Segment


Less: Realized Performance Compensation

   (85,240  (114,829

Less: Equity-Based Compensation - Operating Compensation

   (63,708  (40,248

Less: Equity-Based Compensation - Performance Compensation

   (3,068  (3,900

Segment Adjustment (c)

   (87,151  (53,076


Total Segment

   $324,031   $296,074 


   Three Months Ended
   March 31,
   2019 2018

GAAP General, Administrative and Other to Total Segment Other Operating Expenses


GAAP

   $146,062   $126,713 

Segment Adjustment (d)

   (22,751  (19,621


Total Segment

   $123,311   $107,092 


THE BLACKSTONE GROUP

The Blackstone Group L.P.

Notes to Condensed Consolidated Financial Statements—Statements (Unaudited) - Continued

(All Dollars Are in Thousands, Except Unit and Per Unit Data, Except Where Noted)


The following table reconciles the Total Segments to Blackstone’s Income Before Provision for Taxes and Total Assets as of and for the six months ended June 30, 2018 and 2017:


   June 30, 2018 and the Six Months Then Ended 
   Revenues  Expenses  Other
Income
   Economic
Income /
Income
Before
Provision for
Taxes (a)
  Total
Assets
 

Total Segments

  $3,634,146  $1,719,689  $—     $1,914,457  $21,486,487 


Adjustments


Impact of Consolidation (b)

   186,276   86,187   184,118    284,207   8,588,810 

Amortization of Intangibles (c)

   (774  28,972   —      (29,746  —   

Intersegment Eliminations

   (2,634  (2,634  —      —     —   

Transaction-Related Charges (d)

   584,687   167,098   —      417,589   —   


Total Adjustments

   767,555   279,623   184,118    672,050   8,588,810 


Blackstone Consolidated

  $4,401,701  $1,999,312  $184,118   $2,586,507  $30,075,297 


   Three Months Ended
   March 31,
   2019 2018

Realized Performance Revenues


GAAP


Incentive Fees

   $12,132   $12,566 

Investment Income - Realized Performance Allocations

   242,375   269,640 


GAAP

   254,507   282,206 

Total Segment


Less: Fee Related Performance Revenues

   (7,779  (3,837

Segment Adjustment (b)

   41   2 


Total Segment

   $246,769   $278,371 


   Three Months Ended
   March 31,
   2019 2018

Realized Performance Compensation


GAAP


Incentive Fee Compensation

   $5,406   $6,662 

Realized Performance Allocation Compensation

   86,395   112,062 


GAAP

   91,801   118,724 

Total Segment


Less: Fee Related Performance Compensation

   (3,493  5 

Less: Equity-Based Compensation - Performance Compensation

   (3,068  (3,900


Total Segment

   $85,240   $114,829 


   Three Months Ended
   March 31,
   2019 2018

Realized Principal Investment Income


GAAP

   $73,261   $42,145 

Segment Adjustment (e)

   (47,353  (13,452


Total Segment

   $25,908   $28,693 


   Six Months Ended June 30, 2017 
   Revenues  Expenses  Other
Income
   Economic
Income /
Income
Before
Provision for
Taxes (a)
 

Total Segments

  $3,283,026  $1,576,484  $—     $1,706,542 


Adjustments


Impact of Consolidation (b)

   159,142   80,708   176,186    254,620 

Amortization of Intangibles (c)

   (774  21,914   —      (22,688

Intersegment Eliminations

   (3,067  (3,067  —      —   

Transaction-Related Charges (d)

   12,117   126,927   —      (114,810


Total Adjustments

   167,418   226,482   176,186    117,122 


Blackstone Consolidated

  $3,450,444  $1,802,966  $176,186   $1,823,664 


Segment basis presents revenues and expenses on a basis that deconsolidates the investment funds Blackstone manages and excludes the amortization of intangibles, the expense of equity-based awards and Transaction-Related Charges.

(a)

Represents Total Segments Economic Income reconciled to Blackstone Consolidated Income Before Provision for Taxes.

(b)

The Impact(1) the add back of Consolidation adjustment represents the effect of consolidatingnet management fees earned from consolidated Blackstone Funds which have been eliminated in consolidation, and (2) the eliminationremoval of Blackstone’s interest in these funds, the increase to revenue representingfrom the reimbursement of certain expenses by the Blackstone Funds, which are presented gross under GAAP but netted against Other Operating Expenses in the segment presentation,Total Segment measures.

(b)

Represents the add back of Performance Revenues earned from consolidated Blackstone Funds which have been eliminated in consolidation.

(c)

Represents the removal of Transaction-Related Charges that are not recorded in the Total Segment measures.

(d)

Represents the removal of (1) the amortization of transaction-related intangibles, and (2) certain expenses reimbursed by the Blackstone Funds, which are presented gross under GAAP but netted against Other Operating Expenses in the Total Segment measures.

The Blackstone Group L.P.

Notes to Condensed Consolidated Financial Statements (Unaudited) - Continued

(All Dollars Are in Thousands, Except Unit and Per Unit Data, Except Where Noted)

(e)

Represents (1) the add back of Principal Investment Income, including general partner income, earned from consolidated Blackstone Funds which have been eliminated in consolidation, and (2) the removal of amounts associated with the ownership of Blackstone consolidated operating partnerships held bynon-controlling interests.

(c)

Amortization of intangibles consists of the amortization of transaction-related intangibles including intangibles associated with Blackstone’s investment in Patria, which is accounted for under the equity method.

(d)

Transaction-Related Charges arise from corporate actions including acquisitions, divestitures, and Blackstone’s initial public offering. They consist primarily of equity-based compensation charges, gains and losses on contingent consideration arrangements, changes in the balance of the tax receivable agreement resulting from a change in tax law or similar event, transaction costs and any gains or losses associated with these corporate

THE BLACKSTONE GROUP L.P.

Notes to Condensed Consolidated Financial Statements—Continued

(All Dollars Are in Thousands, Except Unit and Per Unit Data, Except Where Noted)

actions. During the six months ended June 30, 2018, Transaction-Related Charges include $580.9 million of Other Revenues received upon the conclusion of Blackstone’s investmentsub-advisory relationship with FS Investments’ funds.


19.20.

SUBSEQUENT EVENTSSubsequent Events

There have been no events since June 30, 2018 that require recognition or disclosure in the Condensed ConsolidatedOn April 10, 2019, Blackstone issued €600 million aggregate principal amount of 1.500% Senior Notes which will mature on April 10, 2029. See Note 12. “Borrowings” for additional information.

On April 18, 2019, Blackstone announced its decision to convert The Blackstone Group L.P. from a Delaware limited partnership to a Delaware corporation named The Blackstone Group Inc. (the “Conversion”). The Conversion is expected to become effective on July 1, 2019.

Item 1A. Unaudited Supplemental Presentation of Statements of Financial Statements.

Condition

ITEM 1A.

UNAUDITED SUPPLEMENTAL PRESENTATION OF STATEMENTS OF FINANCIAL CONDITION

THE BLACKSTONE GROUP L.P.

Unaudited Consolidating Statements of Financial Condition

(Dollars in Thousands)


   June 30, 2018 
   Consolidated
Operating
Partnerships
  Consolidated
Blackstone
Funds (a)
   Reclasses and
Eliminations
  Consolidated 

Assets


Cash and Cash Equivalents

  $1,710,251  $—     $—    $1,710,251 

Cash Held by Blackstone Funds and Other

   —     288,675    —     288,675 

Investments

   14,053,517   8,605,998    (651,333  22,008,182 

Accounts Receivable

   577,074   340,643    —     917,717 

Due from Affiliates

   2,014,267   25,534    (23,852  2,015,949 

Intangible Assets, Net

   380,844   —      —     380,844 

Goodwill

   1,778,192   —      —     1,778,192 

Other Assets

   249,791   3,145    —     252,936 

Deferred Tax Assets

   722,551   —      —     722,551 


Total Assets

  $21,486,487  $9,263,995   $(675,185 $30,075,297 


Liabilities and Partners’ Capital


Loans Payable

  $3,488,358  $6,707,045   $—    $10,195,403 

Due to Affiliates

   868,286   489,596    (390,632  967,250 

Accrued Compensation and Benefits

   2,987,977   —      —     2,987,977 

Securities Sold, Not Yet Purchased

   44,618   111,162    —     155,780 

Repurchase Agreements

   —     182,489    —     182,489 

Accounts Payable, Accrued Expenses and Other Liabilities

   554,194   396,608    —     950,802 


Total Liabilities

   7,943,433   7,886,900    (390,632  15,439,701 


RedeemableNon-Controlling Interests in Consolidated Entities

   22,503   136,296    —     158,799 


Partners’ Capital


Partners’ Capital

   7,105,225   284,553    (284,553  7,105,225 

Accumulated Other Comprehensive Loss

   (57,876  —      —     (57,876

Non-Controlling Interests in Consolidated Entities

   2,536,375   956,246    —     3,492,621 

Non-Controlling Interests in Blackstone Holdings

   3,936,827   —      —     3,936,827 


Total Partners’ Capital

   13,520,551   1,240,799    (284,553  14,476,797 


Total Liabilities and Partners’ Capital

  $21,486,487  $9,263,995   $(675,185 $30,075,297 


continued…

                                                                                                
   March 31, 2019
   Consolidated Consolidated   
   Operating Blackstone  Reclasses and  
   Partnerships Funds (a)  Eliminations Consolidated

Assets


Cash and Cash Equivalents

   $1,570,741   $    $   $1,570,741 

Cash Held by Blackstone Funds and Other

      217,625       217,625 

Investments

   13,228,439   8,603,847    (651,336  21,180,950 

Accounts Receivable

   404,665   307,224       711,889 

Due from Affiliates

   2,335,917   7,688    (23,314  2,320,291 

Intangible Assets, Net

   450,757          450,757 

Goodwill

   1,869,860          1,869,860 

Other Assets

   301,043   990       302,033 

Right-of-Use Assets

   521,932          521,932 

Deferred Tax Assets

   728,873          728,873 


Total Assets

   $21,412,227   $9,137,374    $(674,650  $29,874,951 


Liabilities and Partners’ Capital


Loans Payable

   $3,450,044   $6,561,111    $   $10,011,155 

Due to Affiliates

   875,011   557,465    (387,024  1,045,452 

Accrued Compensation and Benefits

   3,001,597          3,001,597 

Securities Sold, Not Yet Purchased

   45,694   82,412       128,106 

Repurchase Agreements

      218,865       218,865 

Operating Lease Liabilities

   587,408          587,408 

Accounts Payable, Accrued Expenses and Other Liabilities

   447,392   288,275       735,667 


Total Liabilities

   8,407,146   7,708,128    (387,024  15,728,250 


RedeemableNon-Controlling Interests in Consolidated Entities

   22,000   114,941       136,941 


Partners’ Capital


Partners’ Capital

   6,501,072   287,626    (287,626  6,501,072 

Accumulated Other Comprehensive Loss

   (32,430         (32,430

Non-Controlling Interests in Consolidated Entities

   2,825,667   1,026,679       3,852,346 

Non-Controlling Interests in Blackstone Holdings

   3,688,772          3,688,772 


Total Partners’ Capital

   12,983,081   1,314,305    (287,626  14,009,760 


Total Liabilities and Partners’ Capital

   $21,412,227   $9,137,374    $(674,650  $29,874,951 


THE BLACKSTONE GROUP L.P.

Unaudited Consolidating Statements of Financial Condition

(Dollars in Thousands)


   December 31, 2017 
   Consolidated
Operating
Partnerships
  Consolidated
Blackstone
Funds (a)
   Reclasses and
Eliminations
  Consolidated 

Assets


Cash and Cash Equivalents

  $1,992,497  $—     $—    $1,992,497 

Cash Held by Blackstone Funds and Other

   345,668   1,583,863    —     1,929,531 

Investments

   12,087,525   13,093,670    (747,146  24,434,049 

Accounts Receivable

   404,071   470,947    —     875,018 

Due from Affiliates

   2,009,866   47,325    (29,054  2,028,137 

Intangible Assets, Net

   409,828   —      —     409,828 

Goodwill

   1,778,192   —      —     1,778,192 

Other Assets

   234,603   8,094    —     242,697 

Deferred Tax Assets

   725,970   —      —     725,970 


Total Assets

  $19,988,220  $15,203,899   $(776,200 $34,415,919 


Liabilities and Partners’ Capital


Loans Payable

  $3,514,815  $11,300,621   $—    $14,815,436 

Due to Affiliates

   852,123   339,138    (254,103  937,158 

Accrued Compensation and Benefits

   2,623,492   —      —     2,623,492 

Securities Sold, Not Yet Purchased

   64,473   89,907    —     154,380 

Repurchase Agreements

   —     118,840    —     118,840 

Accounts Payable, Accrued Expenses and Other Liabilities

   477,615   1,565,907    —     2,043,522 


Total Liabilities

   7,532,518   13,414,413    (254,103  20,692,828 


RedeemableNon-Controlling Interests in Consolidated Entities

   22,000   188,944    —     210,944 


Partners’ Capital


Partners’ Capital

   6,669,327   378,030    (378,846  6,668,511 

Accumulated Other Comprehensive Income (Loss)

   (34,836  —      818   (34,018

Non-Controlling Interests in Consolidated Entities

   2,174,705   1,222,512    (144,069  3,253,148 

Non-Controlling Interests in Blackstone Holdings

   3,624,506   —      —     3,624,506 


Total Partners’ Capital

   12,433,702   1,600,542    (522,097  13,512,147 


Total Liabilities and Partners’ Capital

  $19,988,220  $15,203,899   $(776,200 $34,415,919 


   December 31, 2018
   Consolidated Consolidated   
   Operating Blackstone  Reclasses and  
   Partnerships Funds (a)  Eliminations Consolidated

Assets


Cash and Cash Equivalents

   $2,207,841   $    $   $2,207,841 

Cash Held by Blackstone Funds and Other

      337,320       337,320 

Investments

   12,596,138   8,376,338    (595,445  20,377,031 

Accounts Receivable

   455,308   180,930       636,238 

Due from Affiliates

   2,011,324   7,405    (24,606  1,994,123 

Intangible Assets, Net

   468,507          468,507 

Goodwill

   1,869,860          1,869,860 

Other Assets

   290,366   3,882       294,248 

Deferred Tax Assets

   739,482          739,482 


Total Assets

   $20,638,826   $8,905,875    $(620,051  $28,924,650 


Liabilities and Partners’ Capital


Loans Payable

   $3,471,151   $6,480,711    $   $9,951,862 

Due to Affiliates

   907,748   470,780    (342,752  1,035,776 

Accrued Compensation and Benefits

   2,942,128          2,942,128 

Securities Sold, Not Yet Purchased

   50,014   92,603       142,617 

Repurchase Agreements

      222,202       222,202 

Accounts Payable, Accrued Expenses and Other Liabilities

   622,490   253,489       875,979 


Total Liabilities

   7,993,531   7,519,785    (342,752  15,170,564 


RedeemableNon-Controlling Interests in Consolidated Entities

   22,000   119,779       141,779 


Partners’ Capital


Partners’ Capital

   6,415,700   277,299    (277,299  6,415,700 

Accumulated Other Comprehensive Loss

   (36,476         (36,476

Non-Controlling Interests in Consolidated Entities

   2,659,754   989,012       3,648,766 

Non-Controlling Interests in Blackstone Holdings

   3,584,317          3,584,317 


Total Partners’ Capital

   12,623,295   1,266,311    (277,299  13,612,307 


Total Liabilities and Partners’ Capital

   $20,638,826   $8,905,875    $(620,051  $28,924,650 


(a)

The Consolidated Blackstone Funds consisted of the following:

Blackstone / GSO Global Dynamic Credit Feeder Fund (Cayman) LP

Blackstone / GSO Global Dynamic Credit Funding Designated Activity Company

Blackstone / GSO Global Dynamic Credit Master Fund

Blackstone / GSO Global Dynamic Credit USD Feeder Fund (Ireland)

Blackstone / GSO Loan Financing Limited*

Blackstone Real Estate Partners VI.C — ESH L.P.*

Blackstone Real Estate Special Situations Fund L.P.*

Blackstone Real Estate Special Situations Offshore Fund Ltd.

Blackstone Strategic Alliance Fund L.P.

BSSF I AIV L.P.*

BTD CP Holdings LP

Collateralized loan obligation vehicles

GSO Legacy Associates 2 LLC*

GSO Legacy Associates LLC*

Mezzanineside-by-side investment vehicles

Private equityside-by-side investment vehicles

Real estateside-by-side investment vehicles

* Consolidated as of December  31, 2018 only.

*

Item 2.  Management’s Discussion and Analysis of Financial Condition and Results of Operations

Consolidated as of December 31, 2017 only.

ITEM 2.

MANAGEMENT’S DISCUSSION AND ANALYSIS OF FINANCIAL CONDITION AND RESULTS OF OPERATIONS

The following discussion and analysis should be read in conjunction with The Blackstone Group L.P.’s condensed consolidated financial statements and the related notes included within this Quarterly Report onForm 10-Q.

Our Business

Blackstone is one of the largest independent managers of private capital in the world. Our business is organized into four segments:


Private Equity. We are a world leader in private equity investing, having managed seven general private equity funds, as well as three sector-focused funds, since we established this business in 1987. Our Private Equity segment includes our corporate private equity business, which consists of our flagship private equity funds (Blackstone Capital Partners (“BCP”) funds), our sector-focused private equity funds, including our energy-focused funds (Blackstone Energy Partners (“BEP”) funds), and our Asia-focused fund (Blackstone Capital Partners Asia (“BCP Asia”) fund). In addition, our Private Equity segment includes our core private equity fund, Blackstone Core Equity Partners (“BCEP”), our opportunistic investment platform that invests globally across asset classes, industries and geographies, Blackstone Tactical Opportunities (“Tactical Opportunities”), our secondary private equity fund of funds business, Strategic Partners Fund Solutions (“Strategic Partners”), our infrastructure-focused funds, Blackstone Infrastructure Partners (“BIP”), a multi-asset investment program for eligible high net worth investors offering exposure to certain of Blackstone’s key illiquid investment strategies through a single commitment, Blackstone Total Alternatives Solution (“BTAS”) and our capital markets services business, Blackstone Capital Markets (“BXCM”).

Our corporate private equity business pursues transactions throughout the world across a variety of transaction types, including large buyouts,mid-cap buyouts, buy and build platforms (which involve multiple acquisitions behind a single management team and platform) and growth equity/development projects (which involve significant minority investments in mature companies and greenfield development projects in energy and power). Tactical Opportunities invests globally across asset classes, industries and geographies, seeking to identify and execute on attractive, differentiated investment opportunities, leveraging the intellectual capital across our various businesses while continuously optimizing its approach in the face of ever changing market conditions. Strategic Partners focuses on delivering access to a range of opportunities, leveraging its proprietary database to acquire single fund interests or complex portfolios in an efficient and timely manner. BIP focuses on investments in core and core+ infrastructure in the energy, transportation, communications and water and waste sectors.

Real Estate. Our Real Estatereal estate group is one of the largest real estate investment managers in the world. We operate as one globally integrated business, with investments in North America, Europe, Asia and Latin America. Our Real Estatereal estate investment team seeks to establish a differentiated view and capitalizes on our scale and proprietary information advantages to invest with conviction and generate attractive risk-adjusted returns for our investors over the long term.long-term.

Our Blackstone Real Estate Partners (“BREP”) funds are geographically diversified and target a broad range of “opportunistic” real estate and real estate-relatedestate related investments. The BREP funds include global funds as well as funds focused specifically on Europe or Asia investments. We seek to acquire high quality, well-located yet undermanaged assets at an attractive basis, address any property or business issues through active asset management and sell the assets once our business plan is accomplished. BREP has made significant investments in hotels, office buildings, shopping centers,industrial assets, residential and industrial assets,shopping centers, as well as a variety of real estate operating companies.

Our core+ real estate business, Blackstone Property Partners (“BPP”) has assembled a global portfolio of high quality core+ investments across the U.S., Europe and Asia. We manage several core+ real estate funds, which target substantially stabilized assets in prime markets with a focus on office,industrial, multifamily, industrialoffice and retail assets.

BREIT, anon-exchange traded REIT,real estate investment trust (“REIT”), is focused on investing primarily in stabilized income-oriented commercial real estate in the U.S. and to a lesser extent, investing in real estate-related securities.

Our Blackstone Real Estate Debt Strategies (“BREDS”) vehicles target debt investment opportunities collateralized by commercial real estate in both public and private markets, primarily in the U.S. and Europe. BREDS’ scale and investment mandates enable it to provide a variety of lending and investment options including mezzanine loans, senior loans and liquid securities. The BREDS platform includes a number of high yieldhigh-yield real estate debt funds, liquid real estate debt funds and BXMT, a NYSE-listed real estate investment trust (“REIT”).


Private Equity. We are a world leader in private equity investing, having managed seven general private equity funds, as well as three sector-focused funds and a geographically-focused fund, since we established this business in 1987. Our Private Equity segment includes our corporate private equity business, which consists of (a) our flagship private equity funds (Blackstone Capital Partners (“BCP”) funds), (b) our sector-focused private equity funds, including our energy-focused funds (Blackstone Energy Partners (“BEP”) funds), (c) our Asia-focused fund (Blackstone Capital Partners Asia (“BCP Asia”) fund) and (d) our core private equity fund, Blackstone Core Equity Partners (“BCEP”). In addition, our Private Equity segment includes (a) our opportunistic investment platform that invests globally across asset classes, industries and geographies, Blackstone Tactical Opportunities (“Tactical Opportunities”), (b) our secondary fund of funds business, Strategic Partners Fund Solutions (“Strategic Partners”), (c) our

infrastructure-focused funds, Blackstone Infrastructure Partners (“BIP”), (d) our life sciences private investment platform, Blackstone Life Sciences (“BXLS”), (e) a multi-asset investment program for eligible high net worth investors offering exposure to certain of Blackstone’s key illiquid investment strategies through a single commitment, Blackstone Total Alternatives Solution (“BTAS”) and (f) our capital markets services business, Blackstone Capital Markets (“BXCM”).

Our corporate private equity business pursues transactions throughout the world across a variety of transaction types, including large buyouts,mid-cap buyouts, buy and build platforms (which involve multiple acquisitions behind a single management team and platform) and growth equity/development projects (which involve significant minority investments in mature companies and greenfield development projects in energy and power). Within our corporate private equity business, our core private equity fund targets control-oriented investments in high quality companies with durable businesses and seeks to offer a lower level of risk and a longer hold period than traditional private equity. Tactical Opportunities invests globally across asset classes, industries and geographies, seeking to identify and execute on attractive, differentiated investment opportunities, leveraging the intellectual capital across our various businesses while continuously optimizing its approach in the face of ever-changing market conditions. Strategic Partners is a total fund solutions provider that acquires interests in high quality private funds from original holders seeking liquidity,co-investments alongside financial sponsors and provides investment advisory services to clients investing in primary and secondary investments in private funds andco-investments. BIP focuses on infrastructure investments in the energy, transportation, communications and water and waste sectors. BXLS is a private investment platform with capabilities to invest across the life cycle of companies and products within the life sciences sector.

Hedge Fund Solutions. Blackstone’sThe largest component of our Hedge Fund Solutions segment is comprised principally of Blackstone Alternative Asset Management (“BAAM”). BAAM is the world’s largest discretionary allocator to hedge funds, managing a broad range of commingled and customized fund solutions since its inception in 1990. The Hedge Fund Solutions segment also includes investment platforms that seed new hedge fund businesses, purchase minority ownership interests in more established hedge funds, invest in special situation opportunities, create alternative solutions in regulated structuresthe form of mutual funds and UCITS and trade directly.


Credit. Our creditCredit segment consists principally of GSO Capital Partners LP (“GSO”) which was founded in 2005 and subsequently acquired by Blackstone in 2008.. GSO is one of the largest leveraged finance-focusedcredit alternative asset managers in the world and is the largest manager of collateralized loan obligations (“CLOs”) globally. The investment portfolios of the funds we manageGSO manages orsub-advisesub-advises predominantly consist of loans and securities ofnon-investment grade companies spread across the capital structure including senior debt, subordinated debt, preferred stock and common equity.

The GSO business is organized into three overarching strategies: performing credit, distressed and long only. Our performing credit strategies include mezzanine lending funds, middle market direct lending funds and other performing credit strategy funds. Our distressed strategies include credit alpha strategies, stressed/distressed funds and energy strategies. GSO’s long only strategies consist of CLOs, closed end funds, commingledopen ended funds and separately managed accounts.

In addition, our credit businessCredit segment includes our publicly traded master limited partnership (“MLP”) and investment platform, which areis managed by Harvest. Harvest, which was founded in 2005 and subsequently acquired by Blackstone in 2017, primarily invests capital raised from institutional investors in separately managed accounts and pooled vehicles, investing in publicly traded MLPs holding primarily midstream energy assets in the U.S.

Our insurer-focused platform, BIS, also a part of our Credit segment, delivers to insurers bespoke, capital-efficientcapital efficient investments and diversified portfolios of Blackstone products across asset classes tailored to their needs and risk profile.

We generate revenue from fees earned pursuant to contractual arrangements with funds, fund investors and fund portfolio companies (including management, transaction and monitoring fees), and from capital markets services. We invest in the funds we manage and we are entitled to apro-rata share of the results of the fund (a

“pro-rata(a “pro-rata allocation”). In addition to apro-rata allocation, and assuming certain investment returns are achieved, we are entitled to a disproportionate allocation of the income otherwise allocable to the limited partners, commonly referred to as carried interest (“Performance Allocations”). In certain structures, we receive a contractual incentive fee from an investment fund in the event that specified cumulative investment returns are achieved (an “Incentive Fee”, and together with Performance Allocations, “Performance Revenues”). The composition of our revenues will vary based on market conditions and the cyclicality of the different businesses in which we operate. Net investment gains and investment income generated by the Blackstone Funds, principally private equity and real estate funds, are driven by value created by our operating and strategic initiatives as well as overall market conditions. Fair values are affected by changes in the fundamentals of the portfolio company, the portfolio company’s industry, the overall economy and other market conditions.

Business Environment

Blackstone’s businesses are materially affected by conditions in the financial markets and economic conditions in the U.S., Europe, Asia and, to a lesser extent, elsewhere in the world.

The secondfirst quarter of 2019 was characterized by a significant rally in global equity and credit markets, which rebounded sharply from December lows. Fears of an impending credit bubble or recession, which had impacted sentiment in the fourth quarter of 2018, saw continued market volatility, drivenabated while investors were also encouraged by concerns oversigns of progress in trade protectionism, risingnegotiations between the U.S. and China. At the same time, the U.S. Federal Reserve paused its cycle of interest ratesrate increases, while central banks in Europe and uneven globalChina loosened monetary policy amid signs of slowing economic growth. While

In the U.S., equity markets advanced significantly in the first quarter of 2019, with the S&P 500 up 14%, its largest first quarter advance in 20 years, and the Dow Jones and Nasdaq indices up 11% and 17%, respectively. Volatility declined significantly, with the CBOE Volatility Index declined 19% indown 46% during the second quarter after peaking in February, the index is up 46% since the beginning of 2018. Strong U.S. economic growthfirst quarter. Global and corporate earnings led the S&P 500 higher, up 3% in the second quarter, but a stronger U.S. dollar (with the U.S. dollar index up 5% in the second quarter) weighed on global market indices. While theregional equity indices also rose sharply. The MSCI World Index rose 1%increased 12%, the MSCI World ex. U.S. index fell 2%,Europe Index rose 10% and the MSCI EuropeAsia Index increased 9%.

In fixed income, a more dovish shift in U.S. monetary policy led government and Asia indices declined 3% and 5%, respectively. Emerging market equities underperformed, with the MSCI Emerging Markets Index down 9% in the quarter.

While the global economy continuescorporate bond yields to reflect positive momentum, the growth cycle has become less synchronized with signs of slowing in Europe, Japan and China. In the U.S., the Bureau of Economic Analysis’ initial report on second quarter 2018 GDP indicated growth of 4.1%, the strongest quarter of growth since 2014, but with most economists expecting growth to slow in the second half of 2018. Monetary policy continues to tighten, and thetrend lower. The U.S. Federal Reserve raised interest rates in June for the seventh time since December 2015, withkept the current target range set tounchanged at1.75-2.0%.Ten-year2.25-2.5%, citing a strong labor market but somewhat slower economic growth.Ten-year U.S. Treasury yields rosedeclined to 3.11%2.41% during the quarter before ending the quarter at 2.85%, furthering investor concernswith lower interest rates expected to persist over the potential negative impact to values of fixed income and longer duration assets.next year. The Bloomberg Barclays U.S. Aggregate Bond Index was down 0.2%index rose 2.9%, U.S. investment grade corporates were down 1.0%up 5.1% and high yield corporates advanced 1.0%7.3% for the quarter. High yield spreads were largely flat fortightened by 126 basis points during the quarter, while issuance was up 5% year-over-year.

Energy rebounded meaningfully during the quarter and issuance fell 24% year over year.the S&P 500 Energy Index advanced 16%. The price of crude oil rose 32% to $60 per barrel, still well below historical averages, while the Henry Hub Natural Gas spot price declined 16%. Spot prices for other commodities increased, with the Bloomberg Commodity Index up 6% during the quarter.

GlobalDespite a rebound in global equity markets, equity issuance for both initial public offerings andfollow-on offerings remained strong, with the first half of the year marking the second consecutive first half to surpass $400 billion in volume.declined 41% year-over-year, reaching a three-year low. Global merger and acquisition volume for the first half of the year reached a record $2.5 trillion, up 61% year over year duealso fell to a significant increase in deals greater than $5$806 billion, which reached a record $1 trillion. Despite healthy deal activity during the first half of 2018, ongoing concerns over market volatility and trade and antitrust policy may adversely impact futuredown 33% year-over-year.

The global transaction activity.

Energy rallied sharply in the quarter,growth cycle has become less synchronized with the S&P 500 Energy Index up 13%. The Henry Hub Natural Gas spot price rose 7%U.S. in a more mature phase and the pricesigns of crude oil increased, with West Texas Intermediate Crude up 14%slowing in Europe, Japan and China. However, most economists continue to $74 per barrel. Oil and gas prices, however, remain well below historical averages. Spot prices for other commodities were mixed, with the Bloomberg Commodity Index flat during the quarter.

Inexpect moderate economic growth in the near term, most economists expect continued healthy economic growth and the continued normalizationwith no signals of monetary policyan imminent recession in the U.S. and to a lesser extent, Europe, althoughAlthough the broader outlook remains constructive, global trade tensions and rising geopolitical instability present ongoing concerns.continue to pose additional risks.

Notable Transactions

On April 9, 2018,10, 2019, Blackstone concluded its investmentissuedsub-advisory relationship with FS Investments’ funds600 million aggregate principal amount of 1.500% Senior Notes maturing on April 10, 2029.

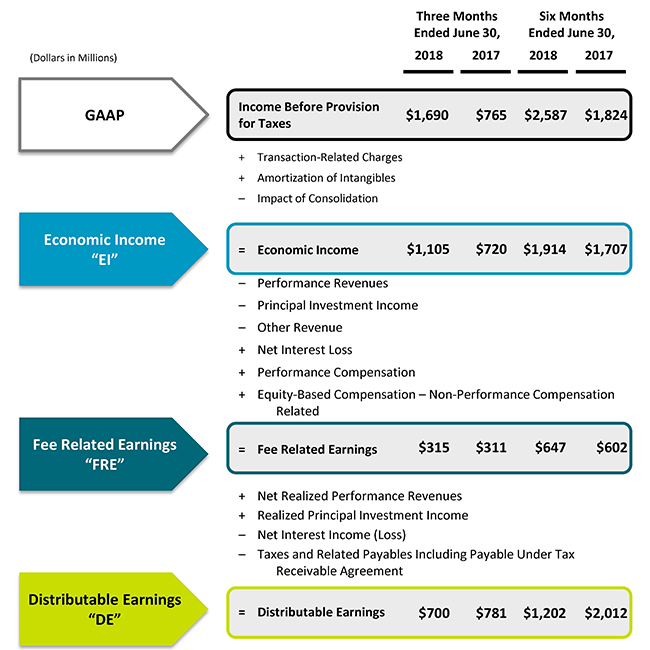
On April 18, 2019, we announced our decision to convert (the “FS Funds”“Conversion”), as previously announced. At March 31, 2018, the FS Funds represented $20.0 billion of Total Assets Under Management. Over time, we believe we will replace and ultimately overtake the prior level of revenue and earnings associated with oursub-advisory relationship with FS Investments. As part of the transaction, The Blackstone received proceedsGroup L.P. (the “Partnership”) from FS Investments of $580.9 million which is recorded as Other Revenues within the Condensed Consolidated Statement of Operations for the three months ended June 30, 2018. This amount is characterized as a Transaction-Related Charge and therefore is not included in Economic Income, Fee Related Earnings, or Distributable Earnings for the three months ended June 30, 2018.Delaware limited partnership to a Delaware corporation named The Blackstone intendsGroup Inc. (the “Corporation”). See “– Conversion to distribute a portion of theafter-tax proceeds to unitholders resulting in an anticipated incremental $0.30 per common unit and per Blackstone Holdings Partnership unit over the second, third and fourth quarters of 2018, of which $0.10 per common unit was distributed on August 6, 2018.Corporation.”

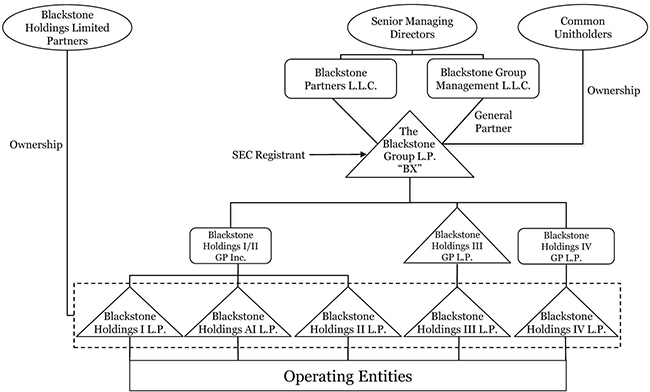
Organizational Structure

The simplified diagram below depicts our current organizational structure. The diagram does not depict all of our subsidiaries, including intermediate holding companies through which certain of the subsidiaries depicted are held.


LOGO

LOGOConversion to a Corporation

On April 18, 2019, we announced our decision to convert The Blackstone Group L.P. from a Delaware limited partnership to a Delaware corporation named The Blackstone Group Inc. We expect the Conversion to become effective on July 1, 2019 (such date and time at which the Conversion becomes effective, the “Effective Time”). The Conversion was unanimously approved by the board of directors of our general partner, Blackstone Group Management L.L.C., following our receipt of special approval of the Conversion from the conflicts committee of the board of directors of our general partner pursuant to our limited partnership agreement. Under Section 14.3(d) of our limited partnership agreement, no vote of the unitholders is required or will be sought for the Conversion.

We believe that the Conversion will make it significantly easier for both domestic and international investors to own our stock. We expect that simplifying the tax reporting of our owners by eliminatingSchedule K-1s will make our equity eligible for investment by a broader universe of institutional investors that today are restricted from owning it. Following the Conversion, we also anticipate that our Class A common stock

will be eligible for inclusion in benchmark stock indices underlying a meaningful portion of the total exchange-traded and index fund market by assets under management, including CRSP, MSCI and Total Market indices. Further, simplifying our tax structure should increase the appeal of our equity tonon-U.S. investors for whom certain kinds of pass through income can be problematic. As a result, we believe the Conversion will meaningfully expand our global investor base and drive greater value for our shareholders over time.

The Conversion is expected to qualify for thenon-recognition of gain or loss to our unitholders for U.S. federal income tax purposes. The application of thenon-recognition rules tonon-U.S. unitholders in the context of the Conversion is dependent on local tax requirements. All unitholders should consult their own advisors as to the consequences of the Conversion to them. Final ScheduleK-1s will be issued in respect of our final taxable period as a limited partnership ending June 30, 2019, which we anticipate will become available in March, 2020. Following the Conversion, dividends will be reported to stockholders onForm 1099-DIV. We believe this change will simplify our stockholders’ tax reporting obligations. For U.S. federal income tax purposes, any dividends we pay following the Conversion generally will be treated as qualified dividend income (generally taxable to U.S. individual stockholders at capital gain rates) paid by a domestic corporation to the extent paid out of our current or accumulated earnings and profits, as determined for U.S. federal income tax purposes.

Following the Conversion, all of the net income attributable to the Corporation will be subject to U.S. federal (and state and local) corporate income taxes. See “Part II. Item 1A. Risk Factors — Following the Conversion, we expect to pay more corporate income taxes than we would have as a limited partnership.”

Conversion Steps

In order to implement the Conversion, Blackstone Group Management L.L.C., in its capacity as the Partnership’s general partner, will file with the Secretary of State of the State of Delaware a Certificate of Conversion (the “Certificate of Conversion”) and, in its capacity as sole incorporator of the Corporation, will file with the Secretary of State of the State of Delaware a Certificate of Incorporation (the “Certificate of Incorporation”). As a result, at the Effective Time, the Partnership will convert to the Corporation.

As a result of the Conversion, the business and affairs of the Corporation will be overseen by a board of directors of the Corporation, rather than by the board of directors of our general partner. At the Effective Time, the directors of our general partner immediately prior to the Effective Time will become the directors of the Corporation and cease to be directors of our general partner. In addition, the audit committee and executive committee of our general partner’s board, and the membership thereof, immediately prior to the Effective Time, will be replicated at the Corporation at the Effective Time. The board of directors of the Corporation will also have a compensation committee, the members of which will be appointed by Blackstone Group Management L.L.C., as the sole holder of Class C Common Stock. Mr. Schwarzman will initially be the sole member of the compensation committee. Following the Conversion, when the provisions of our existing partnership agreement that contemplate a standing conflicts committee will no longer apply, disinterested members of our board of directors will continue to address conflicts, including by referral of such matters to the audit committee or such other committee of disinterested directors as the board deems appropriate. In addition, at the Effective Time, the executive officers of our general partner will become the executive officers of the Corporation.

Reorganization and Amendments to Material Agreements

In connection with the Conversion, at or prior to the Effective Time, Blackstone Holdings I/II GP Inc., a wholly owned subsidiary of the Partnership, will convert from a Delaware corporation to a Delaware limited liability company and we will effect certain other ancillary restructuring steps (such restructuring steps, together with the Conversion, the “Transactions”). At or prior to the Effective Time, we will also amend certain of Blackstone’s existing agreements to give effect to and reflect the Transactions. These changes are generally clarifying and conforming in nature and intended to preserve the status quo.

Capital Stock of the Corporation

At the Effective Time, (a) each common unit of the Partnership (“Common Unit”) outstanding immediately prior to the Effective Time will be converted into one issued and outstanding, fully paid and nonassessable share of Class A common stock, $0.00001 par value per share, of the Corporation (“Class A Common Stock”), (b) the special voting unit (“Special Voting Unit”) of the Partnership outstanding immediately prior to the Effective Time will be converted into one issued and outstanding, fully paid and nonassessable share of Class B common stock, $0.00001 par value per share, of the Corporation (“Class B Common Stock”) and (c) the general partner units of the Partnership outstanding immediately prior to the Effective Time will be converted into one issued and outstanding, fully paid and nonassessable share of Class C common stock, $0.00001 par value per share, of the Corporation (“Class C Common Stock”).

As a result of the Conversion, holders of Common Units will become holders of Class A Common Stock, which will continue to be listed on the NYSE under the symbol “BX” at the opening of trading immediately following the Effective Time. Blackstone Partners L.L.C., an entity owned by senior managing directors of Blackstone and controlled by Mr. Schwarzman and the current holder of the Special Voting Unit, will be the sole holder of the Class B Common Stock. Blackstone Group Management L.L.C., a separate entity owned by senior managing directors of Blackstone and controlled by Mr. Schwarzman and the current general partner of the Partnership, will be the sole holder of the Class C Common Stock.

Prior to the Effective Time, we will notify the NYSE that the Certificate of Conversion will be filed with the Secretary of State of Delaware and request that, as of the open of business on July 2, 2019, the NYSE cease trading of the Common Units on the NYSE and commence trading of the Class A Common Stock on the NYSE under the existing ticker symbol “BX.” It is expected that the Class A Common Stock will have the same CUSIP number as the existing Common Units.

The Certificate of Incorporation and Bylaws of the Corporation will provide our Class A common stockholders following the Conversion with substantially the same rights and obligations that our common unitholders have under the Partnership’s limited partnership agreement. Accordingly, the Class A Common Stock generally will benon-voting like the existing Common Units. More specifically, the Certificate of Incorporation will provide that, holders of the Class A Common Stock will not have any voting rights or powers except as required by the Delaware General Corporation Law or as expressly provided in the Certificate of Incorporation. Similarly, the Class B Common Stock generally will benon-voting like the existing Special Voting Unit. The holder of the Class B Common Stock generally will vote together with the Class A Common Stock as a single class on those few matters that may be submitted for a vote of the Class A Common Stock. The Class C Common Stock that will be held by the entity that has served as the Partnership’s general partner will be the only class of the Corporation’s common stock entitled to vote at a meeting of stockholders (or to take similar action by written consent) in the election of directors and generally with respect to all other matters submitted to a vote of stockholders. As a result, the Corporation will be a “controlled company” within the meaning of the corporate governance standards of the NYSE and, like the Partnership, will qualify for exceptions from certain corporate governance rules of the NYSE.

Under the existing partnership agreement of the Partnership, our general partner may, upon the approval of the holders of at leasttwo-thirds of the voting power of our outstanding Common Units and Special Voting Units voting together as a single class, be replaced with a successor general partner designated by a majority of the voting power of such classes voting together as a single class. Similarly, under the Certificate of Incorporation, the holder of the Class C Common Stock may, upon the approval of the stockholders holding at leasttwo-thirds of the voting power of our outstanding shares of Class A Common Stock and Class B Common Stock voting together as a single class, be required to transfer its shares of Class C Common Stock to a successor holder of Class C Common Stock designated by the stockholders holding a majority of the voting power of such classes voting together as a single class.

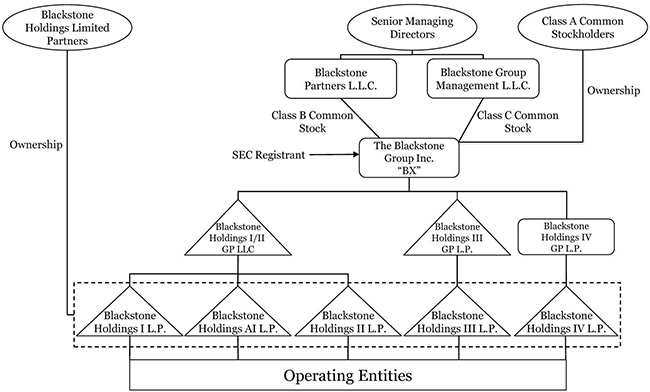
The simplified diagram below depicts our organizational structure following the Conversion. The diagram does not depict all of our subsidiaries, including intermediate holding companies through which certain of the subsidiaries depicted are held.

LOGO

Key Financial Measures and Indicators

We manage our business using keytraditional financial measures and indicatorskey operating metrics since we believe theythese metrics measure the productivity of our investment activities. Our key financial measures and indicators are discussed below.

Revenues

Revenues primarily consist of management and advisory fees, incentive fees, investment income, interest and dividend revenue and other. Please refer to “Part I. Item 1. Business — Incentive Arrangements / Fee Structure”We prepare our Condensed Consolidated Financial Statements in our Annual Report onForm 10-K for the year ended December 31, 2017 and “— Critical Accounting Policies — Revenue Recognition” for additional information regarding the manner in which Base Management Fees and Incentive Fees are generated.

Management and advisory fees and incentive fees are accounted for as contractsaccordance with customers. Under the guidance for contracts with customers, an entity is required to (a) identify the contract(s) with a customer, (b) identify the performance obligations in the contract, (c) determine the transaction price, (d) allocate the transaction price to the performance obligations in the contract, and (e) recognize revenue when (or as) the entity satisfies a performance obligation. In determining the transaction price, an entity may include variable consideration only to the extent that it is probable that a significant reversal in the amount of cumulative revenue recognized would not occur when the uncertainty associated with the variable consideration is resolved.GAAP. See Note 18. “Segment Reporting”2. “Summary of Significant Accounting Policies” in the “Notes to Condensed Consolidated Financial Statements” in “Part I. Item 1. Financial Statements” for a disaggregated presentation of revenues from contracts with customers.and “— Critical Accounting Policies.” Our keynon-GAAP financial measures and operating indicators and metrics are discussed below.

Investment Income represents the unrealized and realized gains and losses on the Partnership’s Performance Allocations and Principal Investments. Interest and Dividend Revenue comprises primarily interest and dividend income earned on principal investments held by us. Other Revenue consists of miscellaneous income and foreign exchange gains and losses arising on transactions denominated in currencies other than U.S. dollars.

Management and Advisory Fees, Net — Management and Advisory Fees, Net are comprised of management fees, including base management fees, transaction and other fees and advisory fees net of management fee reductions and offsets.

The Partnership earns base management fees from limited partners of funds in each of its managed funds, at a fixed percentage of assets under management, net asset value, total assets, committed capital or invested capital. These customer contracts require the Partnership to provide investment management services, which represents a performance obligation that the Partnership satisfies over time. Management fees are a form of variable consideration because the fees the Partnership is entitled to vary based on fluctuations in the basis for the management fee. The amount recorded as revenue is generally determined at the end of the period because these management fees are payable on a regular basis (typically quarterly) and are not subject to clawback once paid.

Transaction, advisory and other fees (including monitoring fees) are principally fees charged to the limited partners of funds indirectly through the managed funds and portfolio companies. The investment advisory agreements generally require that the investment adviser reduce the amount of management fees payable by the limited partners to the Partnership (“management fee reductions”) by an amount equal to a portion of the transaction and other fees paid to the Partnership by the portfolio companies. The amount of the reduction varies by fund, the type of fee paid by the portfolio company and the previously incurred expenses of the fund. These fees and associated management fee reductions are a component of the transaction price for our performance obligation to provide investment management services to the limited partners of funds and are recognized as changes to the transaction price in the period in which they are charged and the services are performed.

Management fee offsets are reductions to management fees payable by the limited partners of the Blackstone Funds, which are based on the amount such limited partners reimburse the Blackstone Funds or the Partnership primarily for placement fees. Providing investment management services requires the Partnership to arrange for services on behalf of its customers. In those situations where we are acting as an agent on behalf of the limited partners of funds, it presents the cost of services as net against management fee revenue. In all other situations, the Partnership is primarily responsible for fulfilling the services and is therefore acting as a principal for those arrangements. As a result, the cost of those services is presented gross as Compensation or General, Administrative and Other expense, as appropriate, with any reimbursement from the limited partners of the funds recorded as Management and Advisory Fees, Net.

Accrued but unpaid Management and Advisory Fees, net of management fee reductions and management fee offsets, as of the reporting date are included in Accounts Receivable or Due from Affiliates in the Condensed Consolidated Statements of Financial Condition.

Incentive Fees —Contractual fees earned based on the performance of Blackstone Funds (“Incentive Fees”) are a form of variable consideration in their contracts with customers to provide investment management services.

Incentive Fees are earned based on fund performance during the period, subject to the achievement of minimum return levels, or high water marks, in accordance with the respective terms set out in each fund’s governing agreements. Incentive Fees will not be recognized as revenue until (a) it is probable that a significant reversal in the amount of cumulative revenue recognized will not occur, or (b) the uncertainty associated with the variable consideration is subsequently resolved. Incentive Fees are typically recognized as revenue when realized at the end of the measurement period. Once realized, such fees are not subject to clawback or reversal. Accrued but unpaid Incentive Fees charged directly to investors in Blackstone Funds as of the reporting date are recorded within Due from Affiliates in the Condensed Consolidated Statements of Financial Condition.

Investment Income (Loss) — Investment Income (Loss) represents the unrealized and realized gains and losses on the Partnership’s Performance Allocations and Principal Investments.

In certain fund structures across private equity, real estate, hedge fund solutions and credit-focused funds (“carry funds”), Blackstone, through its subsidiaries, invests alongside its limited partners in a partnership and is entitled to itspro-rata share of the results of the fund (a“pro-rata allocation”). In addition to apro-rata allocation, and assuming certain investment returns are achieved, Blackstone is entitled to a disproportionate allocation of the income otherwise allocable to the limited partners, commonly referred to as carried interest (“Performance Allocations”).

Performance Allocations are made to the general partner based on cumulative fund performance to date, subject to a preferred return to limited partners. At the end of each reporting period, the Partnership calculates the balance of accrued Performance Allocations (“Accrued Performance Allocations”) that would be due to the Partnership for each fund, pursuant to the fund agreements, as if the fair value of the underlying investments were realized as of such date, irrespective of whether such amounts have been realized. As the fair value of underlying investments varies between reporting periods, it is necessary to make adjustments to amounts recorded as Accrued Performance Allocations to reflect either (a) positive performance resulting in an increase in the Accrued Performance Allocation to the general partner or (b) negative performance that would cause the amount due to the Partnership to be less than the amount previously recognized as revenue, resulting in a negative adjustment to the Accrued Performance Allocation to the general partner. In each scenario, it is necessary to calculate the Accrued Performance Allocation on cumulative results compared to the Accrued Performance Allocation recorded to date and make the required positive or negative adjustments. The Partnership ceases to record negative Performance Allocations once previously Accrued Performance Allocations for such fund have been fully reversed. The Partnership is not obligated to pay guaranteed returns or hurdles, and therefore, cannot have negative Performance Allocations over the life of a fund. Accrued Performance Allocations as of the reporting date are reflected in Investments in the Condensed Consolidated Statements of Financial Condition.

Performance Allocations are realized when an underlying investment is profitably disposed of and the fund’s cumulative returns are in excess of the preferred return or, in limited instances, after certain thresholds for return of capital are met. Performance Allocations are subject to clawback to the extent that the Performance Allocation received to date exceeds the amount due to Blackstone based on cumulative results. As such, the accrual for potential repayment of previously received Performance Allocations, which is a component of Due to Affiliates, represents all amounts previously distributed to Blackstone Holdings andnon-controlling interest holders that would need to be repaid to the Blackstone carry funds if the Blackstone carry funds were to be liquidated based on the current fair value of the underlying funds’ investments as of the reporting date. The actual clawback liability, however, generally does not become realized until the end of a fund’s life except for certain funds, including certain Blackstone real estate funds, multi-asset class investment funds and credit-focused funds, which may have an interim clawback liability.

Principal Investments include the unrealized and realized gains and losses on the Partnership’s principal investments, including its investments in Blackstone Funds that are not consolidated and receivepro-rata allocations, its equity method investments, and other principal investments. Income (Loss) on Principal Investments is realized when the Partnership redeems all or a portion of its investment or when the Partnership receives cash

income, such as dividends or distributions. Unrealized Income (Loss) on Principal Investments results from changes in the fair value of the underlying investment as well as the reversal of unrealized gain (loss) at the time an investment is realized.

Interest and Dividend Revenue — Interest and Dividend Revenue comprises primarily interest and dividend income earned on principal investments held by Blackstone.

Other Revenue — Other Revenue consists of miscellaneous income and foreign exchange gains and losses arising on transactions denominated in currencies other than U.S. dollars.

Expenses

Compensation and Benefits — Compensation —Compensation and Benefits consists of (a) employee compensation, comprising salary and bonus, and benefits paid and payable to employees and senior managing directors and (b) equity-based compensation associated with the grants of equity-based awards to employees and senior managing directors. Compensation cost relating to the issuance of equity-based awards to senior managing directors and employees is measured at fair value at the grant date, taking into consideration expected forfeitures, and expensed over the vesting period on a straight-line basis, except in the case of (a) equity-based awards that do not require future service, which are expensed immediately, and (b) certain awards to recipients that meet specified criteria making them eligible for retirement treatment (allowing such recipient to keep a percentage of those awards upon departure from Blackstone after becoming eligible for retirement), for which the expense for the portion of the award that would be retained in the event of retirement is either expensed immediately or amortized to the retirement date. Cash settled equity-based awards are classified as liabilities and are remeasured at the end of each reporting period.

Compensation and Benefits — Incentive Fee Compensation —Incentive Fee Compensation consists of compensation paid based on Incentive Fees.

Compensation and Benefits — Performance Allocations Compensation —Performance Allocation Compensation consists of compensation paid based on Performance Allocations (which may be distributed in cash orin-kind). Such compensation expense is subject to both positive and negative adjustments. Unlike Performance Allocations, compensation expense is based on the performance of individual investments held by a fund rather than on a fund by fund basis. These amounts may also include allocations of investment income from Blackstone’s principal investments, to senior managing directors and employees participating in certain profit sharing initiatives.

Other Operating Expenses —Other Operating Expenses represents general and administrative expenses including interest expense, occupancy and equipment expenses and other expenses, which consist principally of professional fees, public company costs, travel and related expenses, communications and information services and depreciation and amortization.

Fund Expenses —The expenses of our consolidated Blackstone Funds consist primarily of interest expense, professional fees and other third party expenses.

Non-Controlling Interests in Consolidated Entities

Non-Controlling Interests in Consolidated Entities represent the component of Partners’ Capital in consolidated Blackstone Funds held by third party investors and employees. The percentage interests held by third parties and employees is adjusted for general partner allocations and by subscriptions and redemptions in funds of hedge funds and certain credit-focused funds which occur during the reporting period. In addition, allnon-controlling interests in consolidated Blackstone Funds are attributed a share of income (loss) arising from the respective funds and a share of other comprehensive income, if applicable. Income (Loss) is allocated tonon-controlling interests in consolidated entities based on the relative ownership interests of third party investors and employees after considering any contractual arrangements that govern the allocation of income (loss) such as fees allocable to The Blackstone Group L.P.

RedeemableNon-Controlling Interests in Consolidated Entities

Non-controlling interests related to funds of hedge funds are subject to annual, semi-annual or quarterly redemption by investors in these funds following the expiration of a specified period of time, or may be withdrawn subject to a redemption fee during the period when capital may not be withdrawn. As limited partners in these types of funds have been granted redemption rights, amounts relating to third party interests in such consolidated funds are presented as RedeemableNon-Controlling Interests in Consolidated Entities within the Condensed Consolidated Statements of Financial Condition. When redeemable amounts become legally payable to investors, they are classified as a liability and included in Accounts Payable, Accrued Expenses and Other Liabilities in the Condensed Consolidated Statements of Financial Condition. For all consolidated funds in which redemption rights have not been granted,non-controlling interests are presented within Partners’ Capital in the Condensed Consolidated Statements of Financial Condition asNon-Controlling Interests in Consolidated Entities.

Non-Controlling Interests in Blackstone Holdings

Non-Controlling Interests in Blackstone Holdings represent the component of Partners’ Capital in the consolidated Blackstone Holdings Partnerships held by Blackstone personnel and others who are limited partners of the Blackstone Holdings Partnerships.

Certain costs and expenses are borne directly by the Holdings Partnerships. Income (Loss), excluding those costs directly borne by and attributable to the Holdings Partnerships, is attributable toNon-Controlling Interests in Blackstone Holdings. This residual attribution is based on the year to date average percentage of Blackstone Holdings Partnership Units held by Blackstone personnel and others who are limited partners of the Blackstone Holdings Partnerships.

Income Taxes

The Blackstone Holdings Partnerships and certain of their subsidiaries operate in the U.S. as partnerships for U.S. federal income tax purposes and generally as corporate entities innon-U.S. jurisdictions. Accordingly, these entities in some cases are subject to New York City unincorporated business taxes ornon-U.S. income taxes. In addition, certain of the wholly owned subsidiaries of the Partnership and the Blackstone Holdings Partnerships will be subject to federal, state and local corporate income taxes at the entity level and the related tax provision attributable to the Partnership’s share of this income tax is reflected in the Condensed Consolidated Financial Statements.

Income taxes are accounted for using the asset and liability method of accounting. Under this method, deferred tax assets and liabilities are recognized for the expected future tax consequences of differences between the carrying amounts of assets and liabilities and their respective tax basis, using tax rates in effect for the year in which the differences are expected to reverse. The effect on deferred assets and liabilities of a change in tax rates is recognized in income in the period when the change is enacted. Deferred tax assets are reduced by a valuation allowance when it is more likely than not that some portion or all of the deferred tax assets will not be realized. Current and deferred tax liabilities are recorded within Accounts Payable, Accrued Expenses and Other Liabilities in the Condensed Consolidated Statements of Financial Condition.

Blackstone uses the flow-through method to account for investment tax credits. Under this method, the investment tax credits are recognized as a reduction to income tax expense.

Blackstone analyzes its tax filing positions in all of the U.S. federal, state, local and foreign tax jurisdictions where it is required to file income tax returns, as well as for all open tax years in these jurisdictions. Blackstone records uncertain tax positions on the basis of atwo-step process: (a) a determination is made whether it is more likely than not that the tax positions will be sustained based on the technical merits of the position and (b) those tax positions that meet themore-likely-than-not threshold are recognized as the largest amount of tax benefit that is

greater than 50 percent likely to be realized upon ultimate settlement with the related tax authority. Blackstone recognizes accrued interest and penalties related to uncertain tax positions in General, Administrative, and Other expenses within the Condensed Consolidated Statements of Operations.

Certain past legislative proposals by members of the U.S. Congress would treat carried interest as not meeting the qualifying income requirements under the publicly traded partnership rules (after a transition period in the case of existing publicly traded partnerships). If similar legislation were enacted and applied to us, we would not qualify as a partnership for U.S. federal income tax purposes unless we held carried interest through corporations. If we were taxed as a corporation or held carried interest through taxable subsidiary corporations, our effective tax rate could increase significantly.

States and other jurisdictions have also considered legislation to increase taxes with respect to carried interest. For example, New Jersey recently enacted legislation which eliminates an exclusion from New Jersey source income (for non-residents) for carried interest and income from providing investment management services, which is not expected to materially affect our common unitholders, and authorizes a contingent 17% surtax on such management income for gross income tax and corporate income tax purposes. These carried interest provisions remain non-operative as they are dependent upon Connecticut, New York and Massachusetts enacting legislation with identical provisions. In addition, New York State has considered legislation, which could cause anon-resident of New York State who holds our common units to be subject to New York State income tax on carried interest earned by entities in which we hold an indirect interest, thereby requiring thenon-resident to file a New York State income tax return reporting such carried interest income. As part of that same proposal, New York State also considered a state tax surcharge of 17% on carried interest in addition to the personal income tax. Similar proposals are under consideration in other jurisdictions such as California. Whether or when similar legislation will be enacted is unclear.

Finally, several state and local jurisdictions are evaluating ways to subject partnerships to entity level taxation through the imposition of state or local income, franchise or other forms of taxation or to increase the amount of such taxation. For example, although it would not affect us materially, Connecticut recently enacted an income tax on pass-through entities doing business in Connecticut, and states in which we do business may consider similar tax changes. These and other proposals have recently been under heightened consideration in light of U.S. federal income tax legislation, known as the Tax Cuts and Jobs Act, which was signed into law on December 22, 2017 (the “Tax Reform Bill”).

Meaningfully quantifying the potential impact on Blackstone of this potential future legislation or any similar legislation is not possible at this time. Multiple versions of legislation in this area have been proposed over the last few years that have included significantly different provisions regarding effective dates and the treatment of invested capital, tiered entities and cross-border operations, among other matters. Depending upon what version of the legislation, if any, were enacted, the potential impact on a public company such as Blackstone in a given year could differ significantly and could be material. In addition, even if these legislative proposals would not themselves impose a tax on a publicly traded partnership such as Blackstone, they could force Blackstone and other publicly traded partnerships to restructure their operations so as to prevent disqualifying income from reaching the publicly traded partnership in amounts that would disqualify the partnership from treatment as a partnership for U.S. federal income tax purposes. Such a restructuring could result in more income being earned in corporate subsidiaries, thereby increasing corporate income tax liability indirectly borne by the publicly traded partnership. In addition, we, and our common unitholders, could be taxed on any such restructuring. The nature of any such restructuring would depend on the precise provisions of the legislation that was ultimately enacted, as well as the particular facts and circumstances of Blackstone’s operations at the time any such legislation were to take effect, making the task of predicting the amount of additional tax highly speculative.

The recently enacted Tax Reform Bill has resulted in fundamental changes to the Internal Revenue Code. Changes to U.S. tax laws resulting from the Tax Reform Bill, including reduction to the federal corporate income tax rate, partial limitation on the deductibility of business interest expense, and a longer three-year holding period requirement for carried interest to be treated as long-term capital gain could have a material effect on our business operations and our funds’ investment activities. These and other changes from the Tax Reform Bill — including

limitations on the use, carryback and carryforward of net operating losses and changes relating to the scope and timing of U.S. taxation on earnings from international business operations — could also have a significant effect on the business of our portfolio companies. The exact impact of the Tax Reform Bill for future years is still unclear and difficult to quantify, but these changes could have a material adverse effect on our business, results of operations and financial condition. In addition, other changes could be enacted in the future to increase the corporate tax rate, limit further the deductibility of interest, subject carried interest to more onerous taxation or effect other changes that could have a material adverse effect on our business, results of operations and financial condition.

Congress, the Organization for EconomicCo-operation and Development (“OECD”) and other government agencies in jurisdictions in which we and our affiliates invest or do business have maintained a focus on issues related to the taxation of multinational companies. The OECD, which represents a coalition of member countries, is contemplating changes to numerous long-standing tax principles through its base erosion and profit shifting (“BEPS”) project, which is focused on a number of issues, including the shifting of profits between affiliated entities in different tax jurisdictions, interest deductibility and eligibility for the benefits of double tax treaties. Several of the proposed measures are potentially relevant to some of our structures and could have an adverse tax impact on our funds, investors and/or our portfolio companies. Some member countries have been moving forward on the BEPS agenda but, because timing of implementation and the specific measures adopted will vary among participating states, significant uncertainty remains regarding the impact of BEPS proposals. If implemented, these proposals could result in a loss of tax treaty benefits and increased taxes on income from our investments.

A number of European jurisdictions have enacted taxes on financial transactions, and the European Commission has proposed legislation to harmonize these taxes under theso-called “enhanced cooperation procedure,” which provides for adoption ofEU-level legislation applicable to some but not all EU Member States. These contemplated changes, if adopted by individual countries, could increase tax uncertainty and/or costs faced by us, our portfolio companies and our investors, change our business model and cause other adverse consequences. The timing or impact of these proposals is unclear at this point. In addition, tax laws, regulations and interpretations are subject to continual changes, which could adversely affect our structures or returns to our investors. For instance, various countries have adopted or proposed tax legislation that may adversely affect portfolio companies and investment structures in countries in which our funds have invested and may limit the benefits of additional investments in those countries.

In addition, legislation enacted in 2015 significantly changed the rules for U.S. federal income tax audits of partnerships. Such audits will be conducted at the partnership level, and unless a partnership qualifies for and affirmatively elects an alternative procedure, any adjustments to the amount of tax due (including interest and penalties) will be payable by the partnership. Under an elective alternative procedure, a partnership would issue information returns to persons who were partners in the audited year, who would then be required to take the adjustments into account in calculating their own tax liability, and the partnership would not be liable for the adjustments. If a partnership elects the alternative procedure for a given adjustment, the amount of taxes for which its partners would be liable would be increased by any applicable penalties and a special interest charge. There can be no assurance that we will be eligible to make such an election or that we will, in fact, make such an election for any given adjustment. If we do not or are not able to make such an election, then (a) our then-current common unitholders, in the aggregate, could indirectly bear income tax liabilities in excess of the aggregate amount of taxes that would have been due had we elected the alternative procedure, and (b) a given common unitholder may indirectly bear taxes attributable to income allocable to other common unitholders or former common unitholders, including taxes (as well as interest and penalties) with respect to periods prior to such holder’s ownership of common units. Amounts available for distribution to our common unitholders may be reduced as a result of our obligation to pay any taxes associated with an adjustment. Many issues with respect to, and the overall effect of, this legislation on us are uncertain, and common unitholders should consult their own tax advisors regarding all aspects of this legislation as it affects their particular circumstances.

Economic Income

Blackstone uses Economic Income as a key measure of value creation, a benchmark of performance and in making resource deployment and compensation decisions across its four segments. Economic Income presents revenues and expenses on a basis that deconsolidates the investment funds Blackstone manages, and excludes the amortization of

intangibles and other activity referred to as “Transaction-Related Charges”. Transaction-Related Charges arise from corporate actions including acquisitions, divestitures, and Blackstone’s initial public offering. They consist primarily of equity-based compensation charges, gains and losses on contingent consideration arrangements, changes in the balance of the tax receivable agreement resulting from a change in tax law or similar event, transaction costs and any gains or losses associated with these corporate actions. For segment reporting purposes, Performance Allocations and Incentive Fees are presented together and referred to collectively as Performance Revenues or Performance Compensation. Economic Income, our principal segment measure, is derived from and reconciled to, but not equivalent to, its most directly comparable GAAP measure of Income (Loss) Before Provision for Taxes. See Note 18. “Segment Reporting” in the “Notes to Condensed Consolidated Financial Statements” in “Part I. Item 1. Financial Statements”.

Economic Net Income

Economic Net Income (“ENI”) represents Economic Income adjusted to include current period taxes. Current period taxes represent the total tax provision calculated under accounting principles generally accepted in the United States of America (“GAAP”) adjusted to include only the current tax provision (benefit) calculated on Income (Loss) Before Provision for Taxes and adjusted to exclude the tax impact of any divestitures. ENI is derived from and reconciled to, but not equivalent to, its most directly comparable GAAP measure of Income (Loss) Before Provision for Taxes.See “— Non-GAAP Financial Measures” for our reconciliation of Economic Net Income.

Fee Related Earnings

Blackstone uses Fee Related Earnings, which is derived from Economic Income, as a performance measure to assess its ability to generate profits from revenues that are not subject to future realization events. Fee Related Earnings represents Economic Income adjusted to exclude: (a) the income related to Performance Revenue and related Performance Compensation, (b) income earned from Blackstone’s investments in the Blackstone Funds, (c) net interest income (loss), (d) equity-based compensation, and (e) Other Revenue. Fee Related Earnings equals contractual fee revenues less (a) cash compensation expenses (which excludes Performance Compensation), and (b) Other Operating Expenses. Fee Related Earnings is derived from and reconciled to, but not equivalent to, its most directly comparable GAAP measure of Income (Loss) Before Provision for Taxes. See “—Non-GAAP Financial Measures” for our reconciliation of Fee Related Earnings.

Distributable Earnings

Distributable Earnings which is derived from ourBlackstone’s segment reported results,results. Distributable Earnings is a supplemental measureused to assess performance and amounts available for distributions to Blackstone unitholders, including Blackstone personnel and others who are limited partners of the Blackstone Holdings partnerships.Partnerships. Distributable Earnings is intendedthe sum of Segment Distributable Earnings plus Net Interest Income (Loss) less Taxes and Related Payables. Distributable Earnings excludes unrealized activity and is derived from and reconciled to, showbut not equivalent to, its most directly comparable GAAP measure of Income (Loss) Before Provision for Taxes.See “— Non-GAAP Financial Measures” for our reconciliation of Distributable Earnings.

Net Interest Income (Loss) is presented on a segment basis and is equal to Interest and Dividend Revenue less Interest Expense, adjusted for the amountimpact of consolidation of Blackstone Funds, and interest expense associated with the Tax Receivable Agreement.

Taxes and Related Payables represent the total GAAP tax provision adjusted to include only the current tax provision (benefit) calculated on Income (Loss) Before Provision for Taxes excluding the tax impact of any divestitures and including the Payable under the Tax Receivable Agreement.

Segment Distributable Earnings

Segment Distributable Earnings is Blackstone’s segment profitability measure used to make operating decisions and assess performance across Blackstone’s four segments. Segment Distributable Earnings represents the net realized earnings withoutof Blackstone’s segments and is the effectssum of Fee Related Earnings and Net Realizations for each segment. Blackstone’s segments are presented on a basis that deconsolidates Blackstone Funds, eliminatesnon-controlling ownership interests in Blackstone’s consolidated Operating Partnerships, removes the amortization of intangible assets and removes Transaction-Related Charges. Transaction-Related Charges arise from corporate actions including acquisitions, divestitures and Blackstone’s initial public offering. They consist primarily of equity-based compensation charges, gains and losses on contingent consideration arrangements, changes in the balance of the consolidationtax receivable agreement resulting from a change in tax law or similar event, transaction costs and any gains or losses associated with these corporate actions. Segment Distributable Earnings excludes unrealized activity and is derived from and reconciled to, but not equivalent to, its most directly comparable GAAP measure of Income (Loss) Before Provision for Taxes. See “—Non-GAAP Financial Measures” for our reconciliation of Segment Distributable Earnings.

Net Realizations is presented on a segment basis and is the Blackstone Funds. Distributablesum of Realized Principal Investment Income and Realized Performance Revenues (which refers to Realized Performance Revenues excluding Fee Related Performance Revenues), less Realized Performance Compensation (which refers to Realized Performance Compensation excluding Fee Related Performance Compensation and Equity-Based Performance Compensation).

Fee Related Earnings

Fee Related Earnings is a performance measure used to assess Blackstone’s ability to generate profits from revenues that are measured and received on a recurring basis and not subject to future realization events. Fee Related Earnings equals management and advisory fees (net of management fee reductions and offsets) plus Fee Related Performance Revenues, less (a) Fee Related Compensation on a segment basis, and (b) Other Operating Expenses. Fee Related Earnings is derived from and reconciled to, but not equivalent to, its most directly comparable GAAP measure of Income (Loss) Before Provision for Taxes. See “—Non-GAAP Financial Measures” for our reconciliation of DistributableFee Related Earnings.

Distributable EarningsFee Related Compensation is presented on a segment basis and refers to the sum across all segments of:compensation expense, excluding Equity-Based Compensation, directly related to (a) Total Management Advisory and OtherAdvisory Fees, Net and (b) InterestFee Related Performance Revenues, referred to as Fee Related Performance Compensation.

Fee Related Performance Revenues refers to the realized portion of Performance Revenues from Perpetual Capital that are (a) measured and Dividend Revenue, (c) Realized Incentive Fees, (d) Realized Performance Allocations,received on a recurring basis, and (e) Realized Principal Investment Income (Loss); less (a) Compensation, excluding(b) not dependent on realization events from the expense of equity-based awards, (b) Realized Incentive Fee Compensation, (c) Realized Performance Allocations Compensation, (d) Interest Expense, (e) Other Operating Expenses, and (f) Taxes and Related Payables Under the Tax Receivable Agreement.underlying investments.

Adjusted Earnings Before Interest, Taxes and Depreciation and Amortization

Adjusted Earnings Before Interest, Taxes and Depreciation and Amortization (“Adjusted EBITDA”), is a supplemental measure used to assess performance derived from Blackstone’s segment results and may be used to assess ourits ability to service ourits borrowings. Adjusted EBITDA represents Distributable Earnings plus the addition of (a) Interest Expense on a segment basis, (b) Taxes and Related Payables,

Including Payable Under Tax Receivable Agreement, and (c) Depreciation and Amortization. Adjusted EBITDA is derived from and reconciled to, but not equivalent to, its most directly comparable GAAP measure of Income (Loss) Before Provision for Taxes. See “—Non-GAAP Financial Measures” for our reconciliation of Adjusted EBITDA.

Summary Walkdown of GAAP toNon-GAAP Financial Measures

The relationship of our GAAP tonon-GAAP financial measures is presented in the summary walkdown below. The summary walkdown shows how eachnon-GAAP financial measure is related to the othernon-GAAP financial measures. This presentation is not meant to be a detailed calculation of each measure, but to show the relationship between the measures. For the calculation of each of thesenon-GAAP financial measures and a full reconciliation of Income Before Provision for Taxes to Distributable Earnings, please see “—Non-GAAP Financial Measures”.

LOGO

Operating Metrics

The alternative asset management business is a complex business that is primarily based on managing third party capital and does not require substantial capital investment to support rapid growth. However, there also can be volatility associated with its earnings and cash flows. Since our inception, we have developed and used various key operating metrics to assess and monitor the operating performance of our various alternative asset management businesses in order to monitor the effectiveness of our value creating strategies.

Assets Under Management. Assets Under Management refers to the assets we manage. Our Assets Under Management equals the sum of:


 (a)

the fair value of the investments held by our carry funds and ourside-by-side andco-investment entities managed by us, plus (1) the capital that we are entitled to call from investors in those funds and entities pursuant to the terms of their respective capital commitments, including capital commitments to funds that have yet to commence their investment periods, or (2) for certain credit-orientedcredit-focused funds the amounts available to be borrowed under asset based credit facilities,


 (b)

the net asset value of (1) our hedge funds and real estate debt carry funds, open ended core+ real estate fund,BPP, certainco-investments managed by us, and our Hedge Fund Solutions and certain credit-focused carry and drawdown funds (plus, in each case, the capital that we are entitled to call from investors in those funds, including commitments yet to commence their investment periods), and (2) our funds of hedge funds, our Hedge Fund Solutions registered investment companies, and ournon-exchange traded REIT,BREIT,


 (c)

the invested capital, fair value or net asset value of assets we manage pursuant to separately managed accounts,


 (d)

the amount of debt and equity outstanding for our CLOs during the reinvestment period,


 (e)

the aggregate par amount of collateral assets, including principal cash, for our CLOs after the reinvestment period,


 (f)

the gross or net amount of assets (including leverage where applicable) for our credit-focused registered investment companies, and


 (g)

the fair value of common stock, preferred stock, convertible debt, or similar instruments issued by BXMT.

Our carry funds are commitment-based drawdown structured funds that do not permit investors to redeem their interests at their election. Our funds of hedge funds, hedge funds, funds structured like hedge funds and other open ended funds in our Hedge Fund Solutions, Credit and Real Estate segments generally have structures that afford an investor the right to withdraw or redeem their interests on a periodic basis (for example, annually or quarterly), typically with 30 to 95 days’ notice, depending on the fund and the liquidity profile of the underlying assets. Investment advisory agreements related to certain separately managed accounts in our Hedge Fund Solutions and Credit segments, excluding our BIS separately managed accounts, may generally be terminated by an investor on 30 to 90 days’ notice.

Fee-Earning Assets Under Management.Fee-Earning Assets Under Management refers to the assets we manage on which we derive management fees and/or performance revenues. OurFee-Earning Assets Under Management equals the sum of:


 (a)

for our Private Equity segment funds and Real Estate segment carry funds, including certain real estate debt investment fundsBREDS and certain of our Hedge Fund Solutions funds, the amount of capital commitments, remaining invested capital, fair value, net asset value or par value of assets held, depending on the fee terms of the fund,


 (b)

for our credit-focused carry funds, the amount of remaining invested capital (which may include leverage) or net asset value, depending on the fee terms of the fund,


 (c)

the remaining invested capital or fair value of assets held inco-investment vehicles managed by us on which we receive fees,

 (d)

the net asset value of our funds of hedge funds, hedge funds, open ended core+ real estate fund,BPP, certainco-investments managed by us, certain registered investment companies, ournon-exchange traded REIT,BREIT, and certain of our Hedge Fund Solutions drawdown funds,

 (e)

the invested capital, fair value of assets or the net asset value we manage pursuant to separately managed accounts,


 (f)

the net proceeds received from equity offerings and accumulated core earnings of BXMT, subject to certain adjustments,


 (g)

the aggregate par amount of collateral assets, including principal cash, of our CLOs, and


 (h)

the gross amount of assets (including leverage) or the net assets (plus leverage where applicable) for certain of our credit-focused registered investment companies.

Each of our segments may include certainFee-Earning Assets Under Management on which we earn performance revenues but not management fees.

Our calculations of assets under management andfee-earning assets under management may differ from the calculations of other asset managers, and as a result this measure may not be comparable to similar measures presented by other asset managers. In addition, our calculation of assets under management includes commitments to, and the fair value of, invested capital in our funds from Blackstone and our personnel, regardless of whether such commitments or invested capital are subject to fees. Our definitions of assets under management andfee-earning assets under management are not based on any definition of assets under management andfee-earning assets under management that is set forth in the agreements governing the investment funds that we manage.

For our carry funds, total assets under management includes the fair value of the investments held, whereasfee-earning assets under management includes the amount of capital commitments, the remaining amount of invested capital at cost depending on whether the investment period has or has not expired or the fee terms of the fund. As such,fee-earning assets under management may be greater than total assets under management when the aggregate fair value of the remaining investments is less than the cost of those investments.

Perpetual Capital. Perpetual Capital refers to the component of assets under management with an indefinite term, that is not in liquidation, and for which there is no requirement to return capital to investors through redemption requests in the ordinary course of business, except where funded by new capital inflows. Perpetual Capital includesco-investment capital with an investor right to convert into Perpetual Capital.

Limited Partner Capital Invested. Limited Partner Capital Invested represents the aggregate amount of Limited Partnerthird party capital commitments which wereinvested by our funds and vehicles, including investments closed but not yet funded by investors during each period presented, including (a) capital invested by our carry and drawdown funds during each period presented, plus theand vehicles, (b) certain perpetual capital invested including undistributed proceeds that are reinvested, and (c) capital invested throughco-investmentsfee-payingco-investments arranged by us that were made by limited partnersthird parties in investments of our carry and perpetual funds on which we receive management fees, Performance Allocations or Incentive Fees.and vehicles.

TheDry Powder. Dry Powder represents the amount of committed undrawn capital available for investment or reinvestment, including general partner and employee commitments, is known as dry powdercapital, and is an indicator of the capital we have available for future investments.

Performance Revenue Eligible Assets Under Management. Performance Revenue Eligible Assets Under Management represents invested and to be invested capital at fair value, including capital closed for funds whose investment period has not yet commenced, on which performance fees could be earned if certain hurdles are met.

Income Tax Current Developments

As described in “— Conversion to a Corporation”, on April 18, 2019, we announced our decision to convert The Blackstone Group L.P. from a limited partnership to a corporation. As a result of the Conversion, which we expect will be effective on July 1, 2019, certain aspects of the below tax discussion may no longer be relevant as noted below.

Certain past legislative proposals would treat certain publicly traded partnerships as corporations for federal income tax purposes. If similar legislation were enacted and applied to us, we would not qualify as a partnership for U.S. federal income tax purposes. This would no longer be relevant to us following the Conversion.

States and other jurisdictions have also considered legislation to increase taxes with respect to carried interest. For example, New Jersey recently enacted legislation which eliminates an exclusion from New Jersey source income (fornon-residents) for carried interest and income from providing investment management services, which is not expected to materially affect our common unitholders, and authorizes a contingent 17% surtax on such management income for gross income tax and corporate income tax purposes. These carried interest provisions remainnon-operative as they are dependent upon Connecticut, New York and Massachusetts enacting legislation with identical provisions. In addition, New York State recently introduced legislation which would tax income from certain investment management services provided by a partner (whether or not a New York resident), which could cause anon-resident of New York State who holds our common units to be subject to New York State income tax on carried interest earned by entities in which we hold an indirect interest, thereby requiring thenon-resident to file a New York State income tax return reporting such carried interest income. As part of that legislation, New York also proposed a state tax surcharge of 19% on carried interest in addition to the personal income tax. Similar to the New Jersey legislation, the New York legislation would not take effect until similar legislation is enacted by Connecticut, New Jersey and Massachusetts. Similar proposals are under consideration in other jurisdictions such as California. Whether or when similar legislation will be enacted is unclear. Although these proposals would no longer apply to the Partnership following the Conversion, if enacted, they could increase the amount of taxes that our employees and other key personnel would be required to pay and, as a result, could impact our ability to recruit, retain and motivate employees and key personnel in the relevant jurisdictions.

Finally, several state and local jurisdictions are evaluating ways to subject partnerships to entity level taxation through the imposition of state or local income, franchise or other forms of taxation or to increase the amount of such taxation. For example, although we believe it would not affect us materially, Connecticut recently enacted an income tax on pass through entities doing business in Connecticut, and states in which we do business may consider similar tax changes. These and other proposals have recently been under heightened consideration in light of U.S. federal income tax legislation, known as the Tax Cuts and Jobs Act, which was signed into law on December 22, 2017 (the “Tax Reform Bill”). Although these proposals would no longer apply to the Partnership following the Conversion, they may apply to any of our subsidiaries which are partnerships.

The Tax Reform Bill has resulted in fundamental changes to the Internal Revenue Code. Changes to U.S. tax laws resulting from the Tax Reform Bill, including partial limitation on the deductibility of business interest expense, and a longer three-year holding period requirement for carried interest to be treated as long-term capital gain could have an adverse effect on our business operations and our funds’ investment activities. These and other changes from the Tax Reform Bill—including limitations on the use, carryback and carryforward of net operating losses and changes relating to the scope and timing of U.S. taxation on earnings from international business operations—could also have an adverse effect on our portfolio companies. The exact impact of the Tax Reform Bill for future years is difficult to quantify, but these changes could have an adverse effect on our business, results of operations and financial condition. In addition, other changes could be enacted in the future to increase the corporate tax rate, limit further the deductibility of interest, subject carried interest to more onerous taxation or effect other changes that could have a material adverse effect on our business, results of operations and financial condition.

Congress, the Organization for EconomicCo-operation and Development (“OECD”) and other government agencies in jurisdictions in which we and our affiliates invest or do business have maintained a focus on issues related to the taxation of multinational companies. The OECD, which represents a coalition of member countries, is contemplating changes to numerous long-standing tax principles through its base erosion and profit shifting (“BEPS”) project, which is focused on a number of issues, including the shifting of profits between affiliated entities in different tax jurisdictions, interest deductibility and eligibility for the benefits of double tax treaties. Several of the proposed measures are potentially relevant to some of our structures and could have an adverse tax impact on our funds, investors and/or our portfolio companies. Some member countries have been moving forward on the

BEPS agenda but, because timing of implementation and the specific measures adopted will vary among participating states, significant uncertainty remains regarding the impact of BEPS proposals. If implemented, these proposals could result in a loss of tax treaty benefits and increased taxes on income from our investments.

A number of European jurisdictions have enacted taxes on financial transactions, and the European Commission has proposed legislation to harmonize these taxes under theso-called “enhanced cooperation procedure,” which provides for adoption ofEU-level legislation applicable to some but not all EU Member States. These contemplated changes, if adopted by individual countries, could increase tax uncertainty and/or costs faced by us, our portfolio companies and our investors, and cause other adverse consequences. The timing or impact of these proposals is unclear at this point. In addition, tax laws, regulations and interpretations are subject to continual changes, which could adversely affect our structures or returns to our investors. For instance, various countries have adopted or proposed tax legislation that may adversely affect portfolio companies and investment structures in countries in which our funds have invested and may limit the benefits of additional investments in those countries.

In addition, legislation enacted in 2015 significantly changed the rules for U.S. federal income tax audits of partnerships. Such audits will be conducted at the partnership level, and unless a partnership qualifies for and affirmatively elects an alternative procedure, any adjustments to the amount of tax due (including interest and penalties) will be payable by the partnership. Under an elective alternative procedure, a partnership would issue information returns to persons who were partners in the audited year, who would then be required to take the adjustments into account in calculating their own tax liability, and the partnership would not be liable for the adjustments. If a partnership elects the alternative procedure for a given adjustment, the amount of taxes for which its partners would be liable would be increased by any applicable penalties and a special interest charge. There can be no assurance that we will be eligible to make such an election or that we will, in fact, make such an election for any given adjustment. If we do not or are not able to make such an election, then (a) our then-current common unitholders, in the aggregate, could indirectly bear income tax liabilities in excess of the aggregate amount of taxes that would have been due had we elected the alternative procedure, and (b) a given common unitholder may indirectly bear taxes attributable to income allocable to other common unitholders or former common unitholders, including taxes (as well as interest and penalties) with respect to periods prior to such holder’s ownership of common units. Amounts available for distribution to our common unitholders may be reduced as a result of our obligation to pay any taxes associated with an adjustment. This legislation applies to any taxable years in which we are a partnership commencing after December 31, 2017 and will apply to audits of taxable years of the Partnership prior to the Conversion (which such audits may occur after the Conversion) and will continue to apply to any of our subsidiaries which are partnerships. Many issues with respect to, and the overall effect of, this legislation on us are uncertain, and common unitholders should consult their own tax advisors regarding all aspects of this legislation as it affects their particular circumstances.

Please see “Part II. Item 1A. Risk Factors — Following the Conversion, we expect to pay more corporate income taxes than we would have as a limited partnership.” and “— Conversion to a Corporation” for a further discussion of certain expected tax consequences of the Conversion.

Consolidated Results of Operations

Following is a discussion of our consolidated results of operations for the three and six months ended June 30, 2018March 31, 2019 and 2017.2018. For a more detailed discussion of the factors that affected the results of our four business segments (which are presented on a basis that deconsolidates the investment funds we manage) in these periods, see “—‘‘— Segment Analysis”. below.

The following table sets forth information regarding our consolidated results of operations and certain key operating metrics for the three and six months ended June 30, 2018March 31, 2019 and 2017:2018:


  Three Months Ended    
 Three Months Ended
June 30,
 2018 vs. 2017 Six Months Ended
June 30,
 2018 vs. 2017   March 31, 2019 vs. 2018
 2018 2017 $ % 2018 2017 $ %   2019  2018 $ %
 (Dollars in Thousands)   (Dollars in Thousands)

Revenues


Management and Advisory Fees, Net

 $721,384  $690,857  $30,527   4%  $1,450,233  $1,336,341  $113,892   9   $809,726    $728,849   $80,877  11% 


Incentive Fees

  19,378   40,303   (20,925)   -52%   31,944   86,814   (54,870)   -63   12,132    12,566  (434 -3% 


Investment Income (Loss)


Investment Income


Performance Allocations


Realized

  503,376   602,662   (99,286)   -16%   773,016   1,714,567   (941,551)   -55   242,375    269,640  (27,265 -10% 

Unrealized

  440,351   95,532   344,819   361%   1,068,440   (29,089)   1,097,529   N/M    663,999    628,089  35,910  6% 

Principal Investments


Realized

  129,197   125,058   4,139   3%   171,342   376,402   (205,060)   -54   73,261    42,145  31,116  74% 

Unrealized

  103,468   7,275   96,193   N/M   215,242   (32,913)   248,155   N/M    169,044    111,774  57,270  51% 


Total Investment Income

  1,176,392   830,527   345,865   42%   2,228,040   2,028,967   199,073   10   1,148,679    1,051,648  97,031  9% 


Interest and Dividend Revenue

  40,073   33,703   6,370   19%   75,458   62,198   13,260   21   44,084    35,385  8,699  25% 

Other

  675,343   (59,664)   735,007   N/M   616,026   (63,876)   679,902   N/M    10,250    (59,317 69,567  N/M 


Total Revenues

  2,632,570   1,535,726   1,096,844   71%   4,401,701   3,450,444   951,257   28   2,024,871    1,769,131  255,740  14% 


Expenses


Compensation and Benefits


Compensation

  427,479   367,203   60,276   16%   816,882   718,792   98,090   14   471,397    389,403  81,994  21% 

Incentive Fee Compensation

  9,743   21,032   (11,289)   -54%   16,405   43,497   (27,092)   -62   5,406    6,662  (1,256 -19% 

Performance Allocations Compensation


Realized

  186,398   195,738   (9,340)   -5%   298,460   562,216   (263,756)   -47   86,395    112,062  (25,667 -23% 

Unrealized

  189,991   86,910   103,081   119%   444,426   94,443   349,983   371   287,015    254,435  32,580  13% 


Total Compensation and Benefits

  813,611   670,883   142,728   21%   1,576,173   1,418,948   157,225   11   850,213    762,562  87,651  11% 

General, Administrative and Other

  145,828   119,552   26,276   22%   272,541   228,938   43,603   19   146,062    126,713  19,349  15% 

Interest Expense

  39,320   41,089   (1,769)   -4%   77,991   81,335   (3,344)   -4   42,002    38,671  3,331  9% 

Fund Expenses

  17,622   49,669   (32,047)   -65%   72,607   73,745   (1,138)   -2   2,887    54,985  (52,098 -95% 


Total Expenses

  1,016,381   881,193   135,188   15%   1,999,312   1,802,966   196,346   11   1,041,164    982,931  58,233  6% 


Other Income


Net Gains from Fund Investment Activities

  73,519   110,054   (36,535)   -33%   184,118   176,186   7,932   5   130,325    110,599  19,726  18% 


Income Before Provision for Taxes

  1,689,708   764,587   925,121   121%   2,586,507   1,823,664   762,843   42   1,114,032    896,799  217,233  24% 

Provision for Taxes

  138,731   29,608   109,123   369%   193,226   87,045   106,181   122   41,155    54,495  (13,340 -24% 


Net Income

  1,550,977   734,979   815,998   111%   2,393,281   1,736,619   656,662   38       1,072,877        842,304      230,573  27% 

Net Income (Loss) Attributable to RedeemableNon-Controlling Interests in Consolidated Entities

  905   991   (86)   -9%   (370)   2,991   (3,361)   N/M    2,480    (1,275 3,755  N/M 

Net Income Attributable toNon-Controlling Interests in Consolidated Entities

  129,078   112,944   16,134   14%   284,577   251,629   32,948   13   186,833    155,499  31,334  20% 

Net Income Attributable toNon-Controlling Interests in Blackstone Holdings

  678,952   283,637   395,315   139%   999,160   692,683   306,477   44   402,260    320,208  82,052  26% 


Net Income Attributable to The Blackstone Group L.P.

 $742,042  $337,407  $404,635   120%  $1,109,914  $789,316  $320,598   41   $481,304    $367,872   $113,432  31% 


N/M       Not meaningful.

Three Months Ended June 30, 2018March 31, 2019 Compared to Three Months Ended June 30, 2017March 31, 2018

Revenues

Revenues were $2.6$2.0 billion for the three months ended June 30, 2018,March 31, 2019, an increase of $1.1 billion$255.7 million compared to $1.5$1.8 billion for the three months ended June 30, 2017.March 31, 2018. The increase in Revenues was primarily attributable to increases of $735.0 million in Other Revenue, $345.9$97.0 million in Investment Income, and $30.5$80.9 million in Management and Advisory Fees, Net, partially offset by a decrease of $20.9and $69.6 million in Incentive Fees.

The increase in Other Revenue was primarily due to the proceeds received from the conclusion of oursub-advisory relationship with FS Investments’ funds and a foreign exchange gain on our euro denominated bonds.Revenues.

The increase in Investment Income was primarily attributable to increaseincreases in our Private EquityReal Estate, Credit and CreditHedge Fund Solutions segments of $539.8$88.8 million, $50.8 million and $101.3$29.0 million, respectively, partially offset by a decrease in our Real Estate segment of $303.0 million. The increase in our Private Equity segment was primarily due to corporate private equity. Corporate private equity carrying value increased 9.5% in the three months ended June 30, 2018 compared to 2.8% in the three months ended June 30, 2017.of $36.7 million. The increase in our Credit segment was primarily attributable to higher returns in our performing credit strategies, and distressed strategies. The decrease in our Real Estate segment was primarily attributable to lowerhigher net appreciation of investment holdings in our BREP opportunistic funds compared to the comparable quarter in 2017.2018. The carrying value of investments for our BREP opportunistic funds increased 2.7% compared to 5.4%4.7% versus 3.5% in the comparable quarter in 2018. The increase in our Credit segment was primarily attributable to higher returns in performing credit and distressed strategies and an increase in unrealized gains in investments of which Blackstone owns a share for the three months ended March 31, 2019 compared to the three months ended March 31, 2018. These gains were partially offset by the recognition of more realizations in the three months ended March 31, 2018, related to a mezzanine fund crossing its carry threshold during the fourth quarter of 2017. The increase in our Hedge Fund Solutions segment was primarily due to the year-over-year net appreciation of investments of which Blackstone owns a share. The decrease in our Private Equity segment was primarily attributable to corporate private equity and Tactical Opportunities. Corporate private equity carrying value increased 4.6% in the three months ended March 31, 2019 compared to 6.4% in the three months ended March 31, 2018. Tactical Opportunities carrying value increased 2.8% in the three months ended March 31, 2019 versus 5.2% in the three months ended March 31, 2018.

The increase in Management and Advisory Fees, Net was primarily due to increases in our Private Equity and Real Estate and Private Equity segments of $30.8$60.9 million and $12.7$35.9 million, respectively, partially offset by a decrease in our Credit segment of $17.4$26.8 million. The increase in our Private Equity segment was primarily due to the increase inFee-Earning Assets Under Management across the segment. The increase in our Real Estate segment was primarily due to AUMFee-Earning Assets Under Management growth in our core+ real estate funds and the launch of BREP Asia II in the fourth quarter of 2017. The increase in our Private Equity segment was primarily attributable to the launch of the third vintage of the Tactical Opportunities program.funds. The decrease in our Credit segment was primarily attributabledue to a contractual agreement with FS Investments pursuant to which, in connection with the conclusion of oursub-advisory relationship with FS Investments,respect to the business development companies (“BDCs”), we received a fixed payment in the first quarter of 2018, partially offset by the acquisition of Harvest.growth in BIS and certain GSO funds.

The decreaseincrease in Incentive FeesOther Revenue was primarily attributable to a decrease inthe result of foreign exchange gains on our Credit segment of $27.7 million, primarily due to the conclusion of oursub-advisory relationship with FS Investments.euro denominated bonds.

Expenses

Expenses were $1.0 billion for the three months ended June 30, 2018,March 31, 2019, an increase of $135.2$58.2 million compared to $881.2$982.9 million for the three months ended June 30, 2017.March 31, 2018. The increase was primarily attributable to increases of $87.7 million in Performance AllocationsTotal Compensation and Compensation,Benefits and $19.3 million in General, Administrative and Other Expenses, partially offset by a decrease of $52.1 million in Fund Expenses. The increase of $93.7 million in Performance AllocationsTotal Compensation and Benefits was primarily due to thean increase of $82.0 million in Compensation. The increase in Investment Income. The increase of $60.3 million in Compensation was primarily due to the increase in Management and Advisory Fees, Net, on which a portion of compensation is based, as well as investmentbased. The increase in initiatives.General, Administrative and Other Expenses was primarily due to fundraising and other expenses in the Real Estate segment and growth in new business initiatives, including BIS and BXLS. The decrease of $32.0 million in Fund Expenses was due to a decrease of $28.9$52.4 million in our Credit segment primarily from the deconsolidation of certain CLO and other vehicles in 2018.

Six Months Ended June 30, 2018 Compared to Six Months Ended June 30, 2017

Revenues

Revenues were $4.4 billion for the six months ended June 30, 2018, an increase of $951.3 million compared to $3.5 billion for the six months ended June 30, 2017. The increase in Revenues was primarily attributable to increases of $679.9 million in Other Revenue, $199.1 million in Investment Income and $113.9 million in Management and Advisory Fees, Net, partially offset by a decrease of $54.9 million in Incentive Fees.

The increase in Other Revenue was primarily due to the proceeds received from the conclusion of oursub-advisory relationship with FS Investments’ funds and a foreign exchange gain on our euro denominated bonds.

The increase in Investment Income was primarily attributable to increases in our Private Equity and Credit segments of $599.0 million and $72.3 million, respectively, partially offset by decreases in our Real Estate and Hedge Fund Solutions segments of $455.4 million and $42.8 million, respectively. The increase in our Private Equity segment was due to corporate private equity. Corporate private equity carrying value increased 16.4% in the six months ended June 30, 2018 compared to 9.3% in the six months ended June 30, 2017. The increase in our Credit segment was primarily attributable to higher returns in our performing credit strategies, and distressed strategies. The decrease in our Real Estate segment was primarily attributable to lower net appreciation of investment holdings in our BREP opportunistic funds compared to the comparable quarter in 2017. The carrying value of investments for our BREP opportunistic funds increased 6.0% compared to 10.5% in the comparable quarter in 2017. The decrease in our Hedge Fund Solutions segment was due to lower returns across the segment compared to the second quarter of 2017.

The increase in Management and Advisory Fees, Net was primarily due to increases in our Real Estate, Credit and Private Equity segments of $63.2 million, $25.7 million and $22.9 million, respectively. The increase in our Real Estate segment was primarily due to AUM growth in our core+ real estate funds and the launch of BREP Europe V in the fourth quarter of 2016 (and the corresponding expiration of its fee holiday in the second quarter of 2017) and the launch of BREP Asia II in the fourth quarter of 2017. The increase in our Credit segment was primarily attributable to the acquisition of Harvest and inclusion of our insurance solutions initiative, partially offset by the conclusion of oursub-advisory relationship with FS Investments. The increase in our Private Equity segment was primarily attributable to the launch of the third vintage of the Tactical Opportunities program and BCP Asia.    

The decrease in Incentive Fees was primarily attributable to a decrease in our Credit segment of $57.2 million. The decrease in our Credit segment was primarily attributable to the conclusion of oursub-advisory relationship with FS Investments.

Expenses    

Expenses were $2.0 billion for the six months ended June 30, 2018, an increase of $196.3 million compared to $1.8 billion for the six months ended June 30, 2017. The increase was primarily attributable to increases in Compensation and Performance Allocations Compensation, partially offset by a decrease in Incentive Fee Compensation. The increase of $98.1 million in Compensation was due to the increase in Management and Advisory Fees, Net, on which a portion of compensation is based, as well as investment in initiatives. The increase of $86.2 million in Performance Allocations Compensation was primarily due to the increase in Investment Income. The decrease of $27.1 million in Incentive Fee Compensation was primarily due to the decrease in Realized Incentive Fees in our Credit segment, on which a portion of Incentive Fee Compensation is based.

Other Income

Three Months Ended June 30, 2018 Compared to Three Months Ended June 30, 2017

Other Income was $73.5$130.3 million for the three months ended June 30, 2018, a decreaseMarch 31, 2019, an increase of $36.5$19.7 million compared to $110.1$110.6 million for the three months ended June 30, 2017. The decrease in Other Income was due to a decrease in Net Gains from Fund Investment Activities. The decrease in Other Income – Net Gain from Fund Investment Activities was principally driven by a decrease in our Credit segment of $42.2 million primarily from the deconsolidation of certain CLOs and other vehicles inMarch 31, 2018.

Six Months Ended June 30, 2018 Compared to Six Months Ended June 30, 2017

Other Income was $184.1 million for the six months ended June 30, 2018, an increase of $7.9 million compared to $176.2 million for the six months ended June 30, 2017. The increase in Other

Income was due to an

increase in Net Gains from Fund Investment Activities. The increase in Other Income  Net GainGains from Fund Investment Activities was principally driven by increases of $20.6 million in our Private Equity segment and $10.0$10.1 million in our Credit Segment, partially offset by a decrease of $16.8segment and $6.6 million in our Real Estate segment. The increase in our Private Equity segment was primarily the result of a year over year net increase in the appreciation of investments. The increase in our Credit segment was primarily driven by newly launcheda year-over-year net increase in appreciation of CLOs and the launch of new CLOs in 2019, partially offset by the deconsolidation of certain long only strategies.CLO and other vehicles. The decreaseincrease in our Real Estate segment was primarily the result ofdriven by a year over yearyear-over-year net decreaseincrease in the appreciation of investments across the Real Estate funds.in BREDS.

Provision for Taxes

The following table summarizes Blackstone’s tax position:


  Three Months Ended
  Three Months Ended
June 30,
 Six Months Ended
June 30,
   March 31,
  2018 2017 2018 2017   2019  2018

Income Before Provision for Taxes

  $1,689,708  $764,587  $2,586,507  $1,823,664    $1,114,032    $896,799 

Provision for Taxes

  $138,731  $29,608  $193,226  $87,045    $41,155    $54,495 

Effective Income Tax Rate

   8.2  3.9  7.5  4.8   3.7%    6.1% 

The following table reconciles the effective income tax rate to the U.S. federal statutory tax rate:


  Three Months Ended 2019
  Three Months Ended
June 30,
 2018
vs.
 Six Months Ended
June 30,
 2018
vs.
   March 31, vs.
      2018         2017     2017     2018         2017     2017   2019 2018 2018

Statutory U.S. Federal Income Tax Rate

   21.0  35.0  -14.0  21.0  35.0  -14.0   21.0  21.0  - 

Income Passed Through to Common Unitholders andNon-Controlling Interest Holders (a)

   -14.7  -29.0  14.3  -15.3  -29.7  14.4   -17.5  -16.3  -1.2% 

State and Local Income Taxes

   2.1  0.8  1.3  1.9  1.0  0.9   0.9  1.7  -0.8% 

Other

   -0.2  -2.9  2.7  -0.1  -1.5  1.4   -0.7  -0.3  -0.4% 


Effective Income Tax Rate

   8.2  3.9  4.3  7.5  4.8  2.7   3.7  6.1  -2.4% 


(a)

Includes income that is not taxable to the Partnership and its subsidiaries. Such income is directly taxable to the Partnership’s unitholders and thenon-controlling interest holders.

Three Months Ended June 30, 2018 Compared to Three Months Ended June 30, 2017

Blackstone’s Provision for Taxes for the three months ended June 30,March 31, 2019 and 2018 and 2017 was $138.7$41.2 million and $29.6$54.5 million, respectively. This resulted in an effective tax rate of 8.2%3.7% and 3.9%6.1%, respectively.

The Tax Reform Bill enacted in late 2017 reduced the federal corporate income tax rate from 35% to 21% effective January 1, 2018. The decrease in theBlackstone’s effective tax rate for the three months ended March 31, 2019, compared to the three months ended March 31, 2018 resulted primarily from the rate reduction was offset by the corresponding reductionincrease in the benefit for the exclusion of income passed through to common unitholders andnon-controlling interest holders.interests. In addition, an unrecognized tax benefit included in state and local income taxes for the reductionperiod ended March 31, 2018 with no corresponding amount in the federal corporate income tax rate reducedperiod ended March 31, 2019 contributed to the benefit for the income tax rate differential between the U.S. and foreign jurisdictions on foreign income and the federal income tax benefit for state income taxes resulting in an overall increasedecrease in the effective tax rate for the three months ended June 30, 2018March 31, 2019 compared to the three months ended June 30, 2017.

Six Months Ended June 30, 2018 Compared to Six Months Ended June 30, 2017

Blackstone’s Provision for Taxes for the six months ended June 30, 2018 and 2017 was $193.2 million and $87.0 million, respectively. This resulted in an effective tax rate of 7.5% and 4.8%, respectively.

The Tax Reform Bill enacted in late 2017 reduced the federal corporate income tax rate from 35% to 21% effective January 1,March 31, 2018. The decrease in the effective tax rate from the rate reduction was offset by the corresponding reduction in the benefit for the exclusion of income passed through to common unitholders andnon-controlling interest holders. In addition, the reduction in the federal corporate income tax rate reduced the benefit for the income tax rate differential between the U.S. and foreign jurisdictions on foreign income and the federal income tax benefit for state income taxes resulting in an overall increase in the effective tax rate for the six months ended June 30, 2018 compared to the six months ended June 30, 2017.

All factors are expected to impact the effective tax rate for future years.

Additional information regarding our income taxes can be found in Note 13.14. “Income Taxes” in the “Notes to Condensed Consolidated Financial Statements” in “Part I. Item 1. Financial Statements” of this filing.

On April 18, 2019, we announced our Conversion from a Delaware limited partnership to the Corporation. See “Part II. Item 1A. Risk Factors — Following the Conversion, we expect to pay more corporate income taxes than we would have as a limited partnership” and “— Conversion to a Corporation.”

Non-Controlling Interests in Consolidated Entities

The Net Income Attributable to RedeemableNon-Controlling Interests in Consolidated Entities and Net Income Attributable toNon-Controlling Interests in Consolidated Entities is attributable to the consolidated

Blackstone Funds. The amounts of these items vary directly with the performance of the consolidated Blackstone Funds and largely eliminate the amount of Other Income Net Gains from Fund Investment Activities from the Net Income (Loss) Attributable to The Blackstone Group L.P.

Net Income Attributable toNon-Controlling Interests in Blackstone Holdings is derived from the Income Before Provision for Taxes, excluding the Net Gains from Fund Investment Activities and the percentage allocation of the income between Blackstone personnel and others who are limited partners of Blackstone Holdings and The Blackstone Group L.P. after considering any contractual arrangements that govern the allocation of income such as fees allocable to The Blackstone Group L.P.

For the three months ended June 30,March 31, 2019 and 2018, and 2017, the Net Income Before Taxes allocated to Blackstone Holdings was 43.9%personnel and 45.0%, respectively. For the six months ended June 30, 2018 and 2017, the net income before taxes allocated toothers who are limited partners of Blackstone Holdings was 44.1%44.0% and 45.2%44.4%, respectively. The decreasesdecrease of 1.1% in the three month period and 1.1% in the six month period were0.4% was primarily due to conversions of Blackstone Holdings Partnership Units to Blackstone common units and the vesting of common units.

The Other Income — Reduction of Tax Receivable Agreement Liability was entirely allocated to The Blackstone Group L.P.

Operating Metrics

The following graphs and tables summarize theFee-Earning Assets Under Management by Segment and Total Assets Under Management by Segment, followed by a rollforward of activity for the three and six months ended June 30, 2018March 31, 2019 and 2017.2018. For a description of how Assets Under Management andFee-Earning Assets Under Management are determined, please see “— Key Financial Measures and Indicators — Operating Metrics — Assets Under Management andFee-Earning Assets Under Management”:


LOGOLOGO


Note:

Note:       Totals may not add due to rounding.

  Three Months Ended 
  June 30, 2018  June 30, 2017 
  Private
Equity
  Real
Estate
  Hedge Fund
Solutions
  Credit  Total  Private
Equity
  Real
Estate
  Hedge Fund
Solutions
  Credit  Total 
  (Dollars in Thousands) 

Fee-Earning Assets Under Management


Balance, Beginning of Period

 $72,398,415  $87,284,578  $73,570,498  $111,397,306  $344,650,797  $68,227,286  $71,904,741  $68,812,528  $71,270,996  $280,215,551 

Inflows, including Commitments (a)

  7,057,401   5,937,991   2,379,116   5,579,039   20,953,547   2,219,991   3,376,228   1,805,294   4,946,453   12,347,966 

Outflows, including Distributions (b)

  (617,880  (1,381,867  (4,355,699  (21,548,439  (27,903,885  (1,114,755  (98,811  (3,330,068  (929,653  (5,473,287

Realizations (c)

  (1,000,261  (2,459,391  (100,122  (1,414,399  (4,974,173  (1,400,348  (2,371,349  (176,568  (3,276,948  (7,225,213


Net Inflows (Outflows)

  5,439,260   2,096,733   (2,076,705  (17,383,799  (11,924,511  (295,112  906,068   (1,701,342  739,852   (350,534

Market Appreciation (Depreciation) (d)(f)

  208,022   (604,810  395,497   253,150   251,859   97,496   899,434   713,278   359,286   2,069,494 


Balance, End of Period

 $78,045,697  $88,776,501  $71,889,290  $94,266,657  $332,978,145  $68,029,670  $73,710,243  $67,824,464  $72,370,134  $281,934,511 


Increase (Decrease)

 $5,647,282  $1,491,923  $(1,681,208 $(17,130,649 $(11,672,652 $(197,616 $1,805,502  $(988,064 $1,099,138  $1,718,960 

Increase (Decrease)

  8  2  -2  -15  -3  -0  3  -1  2  1
  Six Months Ended 
  June 30, 2018  June 30, 2017 
  Private
Equity
  Real
Estate
  Hedge Fund
Solutions
  Credit  Total  Private
Equity
  Real
Estate
  Hedge Fund
Solutions
  Credit  Total 
  (Dollars in Thousands) 

Fee-Earning Assets Under Management


Balance, Beginning of Period

 $70,140,883  $83,984,824  $69,914,061  $111,304,230  $335,343,998  $69,110,457  $72,030,054  $66,987,553  $68,964,608  $277,092,672 

Inflows, including Commitments (a)

  10,461,715   9,488,268   6,195,502   11,131,172   37,276,657   3,329,520   5,501,521   4,988,598   10,392,598   24,212,237 

Outflows, including Distributions (b)

  (1,087,275  (1,592,458  (5,258,000  (23,593,109  (31,530,842  (1,119,448  (195,323  (5,599,328  (1,740,847  (8,654,946

Realizations (c)

  (1,736,535  (3,953,617  (155,877  (3,408,975  (9,255,004  (3,563,368  (5,151,011  (623,692  (6,073,764  (15,411,835


Net Inflows (Outflows)

  7,637,905   3,942,193   781,625   (15,870,912  (3,509,189  (1,353,296  155,187   (1,234,422  2,577,987   145,456 

Market Appreciation (Depreciation) (d)(g)

  266,909   849,484   1,193,604   (1,166,661  1,143,336   272,509   1,525,002   2,071,333   827,539   4,696,383 


Balance, End of Period

 $78,045,697  $88,776,501  $71,889,290  $94,266,657  $332,978,145  $68,029,670  $73,710,243  $67,824,464  $72,370,134  $281,934,511 


Increase (Decrease)

 $7,904,814  $4,791,677  $1,975,229  $(17,037,573 $(2,365,853 $(1,080,787 $1,680,189  $836,911  $3,405,526  $4,841,839 

Increase (Decrease)

  11  6  3  -15  -1  -2  2  1  5  2

Annualized Base Management Fee Rate (e)

  1.00  1.12  0.72  0.50  0.83  1.04  1.24  0.76  0.76  0.95
                                                                                                                                                                                    
   Three Months Ended
   March 31, 2019 March 31, 2018
     Private Hedge Fund       Private Hedge Fund    
   Real Estate Equity Solutions Credit Total Real Estate Equity Solutions Credit Total
   (Dollars in Thousands)

Fee-Earning Assets Under Management


Balance, Beginning of Period

   $93,252,724   $80,008,166   $72,280,606   $96,986,011   $342,527,507   $83,984,824   $70,140,883   $69,914,061   $111,304,230   $335,343,998 

Inflows, including Commitments (a)

   2,733,865   8,662,716   1,634,506   3,865,578   16,896,665   3,550,277   3,404,314   3,816,386   5,552,133   16,323,110 

Outflows, including Distributions (b)

   (264,682  (728,583  (2,067,733  (3,242,104  (6,303,102  (210,591  (469,395  (902,301  (2,044,670  (3,626,957

Realizations (c)

   (2,213,818  (2,561,011  (164,436  (966,850  (5,906,115  (1,494,226  (736,274  (55,755  (1,994,576  (4,280,831


Net Inflows (Outflows)

   255,365   5,373,122   (597,663  (343,376  4,687,448   1,845,460   2,198,645   2,858,330   1,512,887   8,415,322 

Market Appreciation
(Depreciation) (d)(f)

   714,945   65,580   1,964,071   3,033,843   5,778,439   1,454,294   58,887   798,107   (1,419,811  891,477 


Balance, End of Period

   $94,223,034   $85,446,868   $73,647,014   $99,676,478   $352,993,394   $87,284,578   $72,398,415   $73,570,498   $111,397,306   $344,650,797 


Increase

   $970,310   $5,438,702   $1,366,408   $2,690,467   $10,465,887   $3,299,754   $2,257,532   $3,656,437   $93,076   $9,306,799 

Increase

   1  7  2  3  3  4  3  5  0  3

Annualized Base Management Fee Rate (e)

   1.10  1.03  0.75  0.56  0.86  1.04  1.01  0.70  0.60  0.82
   Three Months Ended
   March 31, 2019 March 31, 2018
     Private Hedge Fund       Private Hedge Fund    
   Real Estate Equity Solutions Credit Total Real Estate Equity Solutions Credit Total
   (Dollars in Thousands)

Total Assets Under Management


Balance, Beginning of Period

   $136,247,229   $130,665,286   $77,814,516   $127,515,286   $472,242,317   $115,340,363   $105,560,576   $75,090,834   $138,136,470   $434,128,243 

Inflows, including Commitments (a)

   5,033,851   28,471,460   2,568,943   6,832,870   42,907,124   3,622,876   3,534,463   3,940,614   7,081,405   18,179,358 

Outflows, including Distributions (b)

   (1,150,181  (243,000  (2,107,618  (4,555,183  (8,055,982  (148,161  (378,660  (1,126,689  (1,960,217  (3,613,727

Realizations (c)

   (3,058,141  (3,742,658  (186,558  (1,272,836  (8,260,193  (2,666,715  (1,041,784  (56,072  (2,492,284  (6,256,855


Net Inflows

   825,529   24,485,802   274,767   1,004,851   26,590,949   808,000   2,114,019   2,757,853   2,628,904   8,308,776 

Market Appreciation
(Depreciation) (d)(h)

   3,261,285   3,837,660   2,093,489   3,752,062   12,944,496   3,427,521   3,739,619   808,864   (799,197  7,176,807 


Balance, End of Period

   $140,334,043   $158,988,748   $80,182,772   $132,272,199   $511,777,762   $119,575,884   $111,414,214   $78,657,551   $139,966,177   $449,613,826 


Increase

   $4,086,814   $28,323,462   $2,368,256   $4,756,913   $39,535,445   $4,235,521   $5,853,638   $3,566,717   $1,829,707   $15,485,583 

Increase

   3  22  3  4  8  4  6  5  1  4

  Three Months Ended 
  June 30, 2018  June 30, 2017 
  Private
Equity
  Real
Estate
  Hedge Fund
Solutions
  Credit  Total  Private
Equity
  Real Estate  Hedge Fund
Solutions
  Credit  Total 
  (Dollars in Thousands) 

Total Assets Under Management


Balance, Beginning of Period

 $111,414,214  $119,575,884  $78,657,551  $139,966,177  $449,613,826  $99,707,057  $102,070,930  $73,303,381  $93,115,549  $368,196,917 

Inflows, including Commitments (a)

  6,282,722   5,124,391   2,995,023   5,687,114   20,089,250   1,731,553   3,199,773   1,968,985   5,171,173   12,071,484 

Outflows, including Distributions (b)

  (401,296  (1,002,502  (4,544,409  (21,647,826  (27,596,033  (287,123  (867,119  (3,360,854  (1,135,777  (5,650,873

Realizations (c)

  (2,058,727  (4,326,910  (126,015  (1,791,552  (8,303,204  (2,795,612  (4,564,380  (185,929  (3,550,374  (11,096,295


Net Inflows (Outflows)

  3,822,699   (205,021  (1,675,401  (17,752,264  (15,809,987  (1,351,182  (2,231,726  (1,577,798  485,022   (4,675,684

Market Appreciation (d)(h)

  4,287,605   29,110   420,928   845,174   5,582,817   1,663,841   4,195,083   750,861   925,263   7,535,048 


Balance, End of Period

 $119,524,518  $119,399,973  $77,403,078  $123,059,087  $439,386,656  $100,019,716  $104,034,287  $72,476,444  $94,525,834  $371,056,281 


Increase (Decrease)

 $8,110,304  $(175,911 $(1,254,473 $(16,907,090 $(10,227,170 $312,659  $1,963,357  $(826,937 $1,410,285  $2,859,364 

Increase (Decrease)

  7  -0  -2  -12  -2  0  2  -1  2  1
  Six Months Ended 
  June 30, 2018  June 30, 2017 
  Private
Equity
  Real
Estate
  Hedge Fund
Solutions
  Credit  Total  Private
Equity
  Real
Estate
  Hedge Fund
Solutions
  Credit  Total 
  (Dollars in Thousands) 

Total Assets Under Management


Balance, Beginning of Period

 $105,560,576  $115,340,363  $75,090,834  $138,136,470  $434,128,243  $100,189,994  $101,963,652  $71,119,718  $93,280,101  $366,553,465 

Inflows, including Commitments (a)

  9,817,185   8,747,267   6,935,637   12,768,519   38,268,608   4,355,225   6,529,257   5,609,665   9,534,387   26,028,534 

Outflows, including Distributions (b)

  (779,956  (1,150,663  (5,671,098  (23,608,043  (31,209,760  (509,999  (1,077,244  (5,862,592  (3,222,969  (10,672,804

Realizations (c)

  (3,100,511  (6,993,625  (182,087  (4,283,836  (14,560,059  (8,962,912  (11,249,184  (689,120  (6,812,909  (27,714,125


Net Inflows (Outflows)

  5,936,718   602,979   1,082,452   (15,123,360  (7,501,211  (5,117,686  (5,797,171  (942,047  (501,491  (12,358,395

Market Appreciation (d)(i)

  8,027,224   3,456,631   1,229,792   45,977   12,759,624   4,947,408   7,867,806   2,298,773   1,747,224   16,861,211 


Balance, End of Period

 $119,524,518  $119,399,973  $77,403,078  $123,059,087  $439,386,656  $100,019,716  $104,034,287  $72,476,444  $94,525,834  $371,056,281 


Increase (Decrease)

 $13,963,942  $4,059,610  $2,312,244  $(15,077,383 $5,258,413  $(170,278 $2,070,635  $1,356,726  $1,245,733  $4,502,816 

Increase (Decrease)

  13  4  3  -11  1  -0  2  2  1  1


(a)

Inflows represent contributions in our hedge funds andclosed-end closed ended mutual funds, increases in available capital for our carry funds (capital raises, recallable capital and increasedside-by-side commitments) and CLOs, increases in the capital we manage pursuant to separately managed account programs, allocations from multi-asset products to other strategies and acquisitions.

(b)

Outflows represent redemptions in our hedge funds andclosed-end closed ended mutual funds, client withdrawals from our separately managed account programs and decreases in available capital for our carry funds (expired capital, expense drawdowns and decreasedside-by-side commitments).

(c)

Realizations represent realizations from the disposition of assets or capital returned to investors from CLOs.

(d)

Market appreciation (depreciation) includes realized and unrealized gains (losses) on portfolio investments and the impact of foreign exchange rate fluctuations.

(e)

Represents the annualized current quarter’s Base Management Fee divided by period endFee-Earning Assets Under Management.

(f)

For the three months ended June 30, 2018,March 31, 2019, the impact toFee-Earning Assets Under Management due to foreign exchange rate fluctuations was $(1.3) billion, $(697.4)$(232.4) million, $(110.3) million and $(2.0) billion$(342.7) million for the Real Estate, Credit and Total segments, respectively. For the three months ended June 30, 2017,March 31, 2018, such impact was $(1.0)$632.5 million, $544.1 million, $673.7$396.9 million and $1.2 billion for the Private Equity, Real Estate, Credit and Total segments, respectively.

(g)

For the six months ended June 30, 2018, the impact toFee-Earning Assets Under Management due to foreign exchange rate fluctuations was $(711.4) million, $(300.5) million and $(1.0)$1.0 billion for the Real Estate, Credit and Total segments, respectively. For the six months ended June 30, 2017, such impact was $1.2 million, $819.6 million, $834.5 million and $1.7 billion for the Private Equity, Real Estate, Credit and Total segments, respectively.

(h)(g)

For the three months ended June 30, 2018,March 31, 2019, the impact to Total Assets Under Management due to foreign exchange rate fluctuations was $(743.3)$(428.3) million, $(2.7) billion, $(882.7)$171.7 million, $(107.6) million and $(4.3) billion$(364.3) million for the Real Estate, Private Equity, Real Estate, Credit and Total segments, respectively. For the three months ended June 30, 2017,March 31, 2018, such impact was $363.9$1.1 billion, $473.1 million, $1.2 billion, $866.6$442.8 million and $2.4$2.1 billion for the Real Estate, Private Equity, Real Estate, Credit and Total segments, respectively.

(i)

For the six months ended June 30, 2018, the impact to Total Assets Under Management due to foreign exchange rate fluctuations was $(270.2) million, $(1.5) billion, $(439.9) million and $(2.2) billion for the Private Equity, Real Estate, Credit and Total segments, respectively. For the six months ended June 30, 2017, such impact was $606.0 million, $1.7 billion, $1.1 billion and $3.4 billion for the Private Equity, Real Estate, Credit and Total segments, respectively.

Fee-Earning Assets Under Management

Fee-Earning Assets Under Management were $333.0 billion at June 30, 2018, a decrease of $11.7 billion, compared to $344.7$353.0 billion at March 31, 2019, an increase of $10.5 billion, compared to $342.5 billion at December 31, 2018. The net decreaseincrease was due to:

Inflows of $16.9 billion related to:

o

$8.7 billion in our Private Equity segment driven by $5.3 billion from Strategic Partners, $1.0 billion from BIP, $939.1 million from Tactical Opportunities, $773.4 million from multi-asset products and $620.8 million from core private equity,

o

$3.9 billion in our Credit segment driven by $1.2 billion from certain long only and MLP strategies, $1.1 billion of capital raised from new CLO launches, $973.0 million from direct lending and $628.9 million from our distressed strategies,

o

$2.7 billion in our Real Estate segment driven by $906.9 million from BREIT, $856.8 million from BREDS, $568.9 million from BPP U.S. and $323.0 million from BPP Europe andco-investment, and

o

$1.6 billion in our Hedge Fund Solutions segment driven by $775.7 million from individual investor and specialized solutions, $537.4 million from customized solutions and $321.4 million from commingled products.

Market appreciation of $5.8 billion due to:

o

$3.0 billion of appreciation in our Credit segment driven by $2.4 billion of appreciation from certain long only and MLP strategies as well as $670.2 million of appreciation from BIS,

o

$2.0 billion of appreciation in our Hedge Fund Solutions segment driven by returns from BAAM’s Principal Solutions Composite of 3.4% gross (3.2% net), and

o

$714.9 million of appreciation in our Real Estate segment driven by $614.3 million of appreciation from our core+ real estate funds ($708.8 million from market appreciation and $94.5 million from foreign exchange depreciation) and $138.0 million of foreign exchange depreciation from BREP opportunistic funds andco-investment, all of which was from foreign exchange depreciation.

Offsetting these increases were:


Outflows of $27.9$6.3 billion primarily attributable to:


$21.5 billion in our Credit segment driven by the conclusion of oursub-advisory relationship with FS Investment. The remaining outflows were mainly related to certain long only and MLP strategies,

o

$3.2 billion in our Credit segment driven by $1.8 billion from certain long only and MLP strategies and $1.2 billion from BIS,

o

$2.1 billion in our Hedge Fund Solutions segment driven by $1.2 billion from customized solutions and $839.0 million from individual investor and specialized solutions, and

o

$728.6 million in our Private Equity segment driven by $342.5 million from corporate private equity, $194.1 million from BXLS and $138.9 million from Tactical Opportunities.


$4.4 billion in our Hedge Fund Solutions segment, reflecting investors’ liquidity needs and certain strategic shifts in their programs, primarily driven by outflows of $2.2 billion from customized solutions, $1.4 billion from commingled products and $675.1 million from individual investor and specialized solutions, and

$1.4 billion in our Real Estate segment primarily driven by $787.0 million of uninvested capital at the close of a BPP separately managed account’s investment period and $513.5 million of redemptions from the BREDS liquids funds.

Realizations of $5.0$5.9 billion primarily driven by:


o

$2.6 billion in our Private Equity segment driven by $1.6 billion from corporate private equity, $463.8 million from Strategic Partners, $351.3 million from Tactical Opportunities, and $139.3 million from core private equity,

o

$2.2 billion in our Real Estate segment driven by $1.2 billion from BREP opportunistic funds andco-investment, $585.2 million from core+ real estate funds and $462.2 million from BREDS, and

o

$966.9 million in our Credit segment driven by $359.3 million of realizations from distressed strategies, $293.5 million of realizations from mezzanine funds and $179.6 million from certain long only and MLP strategies.

$2.5

Hedge

Fund Solutions had net inflows of $1.2 billion from April 1 through May 1, 2019.

Total

Assets Under Management

Total Assets Under Management were $511.8 billion in our Real Estate segment driven by $1.1at March 31, 2019, an increase of $39.5 billion, from BREP opportunistic funds andco-investment, $1.0compared to $472.2 billion from BREDS and $360.5 million from core+ real estate funds,

$1.4 billion in our Credit segment driven by $574.7 million of capital returned to investors from CLOs that are post theirre-investment periods, $376.7 million of realizations from distressed strategies, and $268.1 million of realizations from mezzanine funds, and

$1.0 billion in our Private Equity segment driven by $465.7 million from Tactical Opportunities, $371.7 million from Strategic Partners and $162.8 million from corporate private equity.

Offsetting these decreases were:at December 31, 2018. The net increase was due to:


Inflows of $21.0$42.9 billion primarily related to:


$7.1 billion in our Private Equity segment driven by $4.5 billion from BIP, $1.2 billion from Tactical Opportunities, $742.5 million from core private equity, $616.8 million from corporate private equity and $140.0 million from Strategic Partners,

$5.6 billion in our Credit segment driven by $4.4 billion from certain long only and MLP strategies, $2.1 billion of capital raised from new CLO launches and CLO refinancings, $912.6 million from our distressed strategies, $484.0 million from BIS and $424.1 million from mezzanine funds, partially offset by $2.8 billion of allocations from insurance multi-asset products to other strategies,

$5.9 billion in our Real Estate segment driven by $2.7 billion from BREDS, $1.5 billion from BPP U.S. andco-investment, $749.7 million from BREIT, $624.4 million from BPP Europe andco-investment and $271.6 million from BREP opportunistic funds andco-investment, and

$2.4 billion in our Hedge Fund Solutions segment driven by growth of $1.2 billion in customized solutions, $814.6 million in individual investor and specialized solutions and $398.3 million in commingled products.

o

$28.5 billion in our Private Equity segment driven by $22.5 billion from corporate private equity, $2.7 billion from Strategic Partners, $2.1 billion from Tactical Opportunities, and $1.1 billion from BIP,

o

$6.8 billion in our Credit segment driven by $2.8 billion from distressed strategies, $1.6 billion from direct lending $1.3 billion from certain long only and MLP strategies and $1.1 billion of capital raised from CLO launches,

o

$5.0 billion in our Real Estate segment driven by $2.5 billion from additional closings in the ninth global opportunistic fund, $906.9 million from BREIT, $470.6 million from BPP U.S., $391.9 million from BREDS and $320.5 million from BPP Europe andco-investment, and

o

$2.6 billion in our Hedge Fund Solutions segment driven by $1.4 billion from customized solutions, $813.5 million from individual investor and specialized solutions and $334.7 million from commingled products.


Market appreciation of $251.9 million due to:

$395.5 million appreciation in our Hedge Fund Solutions segment driven by returns from BAAM’s Principal Solutions Composite of 1.5% gross (1.3% net),

$253.2 million appreciation in our Credit segment driven by $950.5 million of appreciation from market activity ($1.4 billion from long only and MLP strategies, offset by $411.4 million from BIS) and foreign exchange depreciation of $697.4 million mainly related to CLOs and mezzanine funds,

$208.0 million appreciation in our Private Equity segment driven by Strategic Partners, and

Partially offset by $604.8 million depreciation in our Real Estate segment driven by $542.6 million of depreciation from BREP opportunistic funds andco-investment, all of which was from foreign exchange depreciation and $180.5 million of depreciation from core+ real estate funds ($801.4 million from foreign exchange depreciation offset by $620.9 million from market appreciation).

BAAM had net inflows of $2.3 billion from July 1 through August 1, 2018.

Fee-Earning Assets Under Management were $333.0 billion at June 30, 2018, a decrease of $2.4 billion, compared to $335.3 billion at December 31, 2017. The net decrease was due to:

Outflows of $31.5 billion primarily attributable to:

$23.6 billion in our Credit segment driven by the conclusion of oursub-advisory relationship with FS Investment. The remaining outflows were mainly related to certain long only and MLP strategies,

$5.3 billion in our Hedge Fund Solutions segment, reflecting investors’ liquidity needs and certain strategic shifts in their programs, driven by outflows of $2.5 billion from customized solutions, $1.5 billion from commingled products and $1.3 billion from individual investor and specialized solutions,

$1.6 billion in our Real Estate segment primarily driven by $787.0 million of uninvested capital at the close of a BPP separately managed account’s investment period and $689.9 million of redemptions from the BREDS liquids funds, and

$1.1 billion in our Private Equity segment driven by reductions of $575.1 million from Tactical Opportunities and $512.2 million from multi-asset products.

Realizations of $9.3 billion primarily driven by:

$4.0 billion in our Real Estate segment driven by $1.8 billion from BREP opportunistic funds andco-investment, $1.5 billion from BREDS and $582.4 million from core+ real estate funds,

$3.4 billion in our Credit segment driven by $1.4 billion of realizations from distressed strategies, $1.1 billion of capital returned to investors from CLOs that are post theirre-investment periods and $495.6 million of realizations from mezzanine funds, and

$1.7 billion in our Private Equity segment driven by $842.6 million from Strategic Partners, $642.3 million from Tactical Opportunities and $251.6 million from corporate private equity.

Offsetting these decreases were:

Inflows of $37.3 billion related to:

$11.1 billion in our Credit segment driven by $6.2 billion from certain long only and MLP strategies, $3.8 billion of capital raised from new CLO launches and CLO refinancings, $2.0 billion from BIS and $1.5 billion from our distressed strategies, partially offset by $3.1 billion of allocation from insurance multi-asset products to other strategies,

$10.5 billion in our Private Equity segment driven by $4.5 billion from BIP, $2.9 billion from Tactical Opportunities, $916.1 million from multi-asset products, $846.8 million from corporate private equity, $742.5 million from core private equity and $574.8 million from Strategic Partners,

$9.5 billion in our Real Estate segment driven by $3.1 billion from BREDS, $1.8 billion from BPP U.S. andco-investment, $1.6 billion from BREP opportunistic funds andco-investment, $1.4 billion from BPP Europe andco-investment and $1.4 billion from BREIT, and

$6.2 billion in our Hedge Fund Solutions segment driven by growth of $3.0 billion in customized solutions, $2.4 billion in individual investor and specialized solutions and $822.1 million in commingled products.

Market appreciation of $1.1$12.9 billion due to:


$1.2 billion in our Hedge Fund Solutions segment driven by returns from BAAM’s Principal Solutions Composite of 2.7% gross (2.3% net),

$849.5 million appreciation in our Real Estate segment primarily driven by $910.1 million of appreciation from core+ real estate funds ($1.4 billion from market appreciation offset by $452.9 million from foreign exchange depreciation) and $217.2 million of market appreciation from BREDS, offset by $258.5 million of foreign exchange depreciation from BREP opportunistic funds andco-investment, and

Partially offset by $1.2 billion depreciation in our Credit segment driven by $966.2 million of market activity depreciation from BIS and $300.5 million of foreign exchange depreciation, mainly related to CLOs.

Total Assets Under Management

Total Assets Under Management were $439.4 billion at June 30, 2018, a decrease of $10.2 billion, compared to $449.6 billion at March 31, 2018. The net decrease was due to:

Outflows of $27.6 billion primarily attributable to:

$21.6 billion in our Credit segment driven by the conclusion of oursub-advisory relationship with FS Investment. The remaining outflows were mainly related to certain long only and MLP strategies,

$4.5 billion in our Hedge Fund Solutions segment, reflecting investors’ liquidity needs and certain strategic shifts in their programs, driven by outflows of $2.3 billion from customized solutions, $1.5 billion from commingled products and $779.0 million from individual investor and specialized solutions, and

$1.0 billion in our Real Estate segment driven by redemptions from the BREDS liquid funds and a release of reserves from BREDS drawdown funds.

Realizations of $8.3 billion primarily driven by:

$4.3 billion in our Real Estate segment driven by $3.2 billion from BREP opportunistic funds andco-investment, $693.8 million from BREDS and $397.9 million from core+ real estate funds,

$2.1 billion in our Private Equity segment driven by continued disposition activity across the segment, mainly related to $862.5 million from corporate private equity, $706.4 million from Tactical Opportunities and $489.8 million from Strategic Partners, and

$1.8 billion in our Credit segment driven by $574.7 million from capital returned to investors from CLOs that are post theirre-investment periods, $554.7 million from our distressed strategies and $465.6 million from our mezzanine strategies.

Total Assets Under Management realizations in our Private Equity and Real Estate segments generally represent the total proceeds and typically exceed theFee-Earning Assets Under Management realizations which generally represent only the invested capital.

Offsetting these decreases were:

Inflows of $20.0 billion related to:

$6.3 billion in our Private Equity segment driven by $4.6 billion from BIP, $1.0 billion from Tactical Opportunities, $569.2 million from corporate private equity and $128.5 million from Strategic Partners,

$5.7 billion in our Credit segment driven by $4.6 billion from certain long only and MLP strategies, $2.1 billion of capital raised from CLO launches and CLO refinancings, $982.4 million from distressed strategies, $484.2 million from BIS, $301.5 million from mezzanine funds, partially offset by $2.8 billion of allocations from insurance multi-asset products to other strategies,

$5.1 billion in our Real Estate segment driven by $2.1 billion from BREDS, $1.5 billion from BPP U.S. andco-investment, $749.7 million from BREIT, $331.1 million from BPP Europe andco-investment and $200.3 million from the close of the second Asian opportunistic fund, and

$3.0 billion in our Hedge Fund Solutions segment driven by growth of $1.4 billion in individual investor and specialized solutions, $1.2 billion in customized solutions and $423.0 million in commingled products.

Market appreciation of $5.6 billion due to:

$4.3 billion in our Private Equity segment driven by carrying value increase in corporate private equity, Strategic Partners and Tactical Opportunities of 9.5%, 5.8% and 2.1%, respectively, which included $743.3 million of foreign exchange depreciation across the segment,

$845.2 million in our Credit segment driven by $1.2 billion of appreciation from certain long only and MLP strategies ($1.4 billion from market appreciation offset by $235.0 million from foreign

 o

exchange depreciation)$3.8 billion of appreciation in our Private Equity segment driven by carrying value increase in corporate private equity, Strategic Partners and Tactical Opportunities of 4.6%, offset by $411.44.6% and 2.8%, respectively, which included $171.7 million of depreciationforeign exchange appreciation across the segment,

o

$3.8 billion of appreciation in our Credit segment driven by $2.5 billion of appreciation from certain long only and MLP strategies, $670.2 million of appreciation from BIS alland $341.2 million of appreciation from distressed strategies,

o

$3.3 billion of appreciation in our Real Estate segment driven by carrying value increases in our opportunistic and core+ real estate funds of 4.7% and 2.7%, respectively, which was from market activity,includes $428.3 million of foreign exchange depreciation across the segment, and

o

$2.1 billion of appreciation in our Hedge Fund Solutions segment driven by reasons noted above inFee-Earning Assets Under Management.

$420.9 million in our Hedge Fund Solutions segment driven by reasons noted above inFee-Earning Assets Under Management.

Total Assets Under Management market appreciation (depreciation) in our Private Equity and Real Estate segments generally represents the change in fair value of the investments held and typically exceeds theFee-Earning Assets Under Management market appreciation (depreciation).

Total Assets Under Management were $439.4 billion at June 30, 2018, an increase of $5.3 billion, compared to $434.1 billion at December 31, 2017. The net increase was due to:

Inflows of $38.3 billion related to:

$12.8 billion in our Credit segment driven by $6.5 billion from certain long only and MLP strategies, $3.9 billion of capital raised from CLO launches and CLO refinancings, $3.0 billion from distressed strategies, $2.0 billion from BIS and $358.7 million from mezzanine funds, partially offset by $3.1 billion of allocations from insurance multi-asset products to other strategies,

$9.8 billion in our Private Equity segment driven by $4.6 billion from BIP, $2.9 billion from Tactical Opportunities, $967.4 million from corporate private equity, $914.5 million from Strategic Partners and $415.6 million from multi-asset products,

$8.7 billion in our Real Estate segment driven by $2.5 billion from BREDS, $2.0 billion from BPP U.S. andco-investment, $1.4 billion from BREIT, $1.2 billion from the close of the second Asian opportunistic fund and $1.0 billion from BPP Europe andco-investment, and

$6.9 billion in our Hedge Fund Solutions segment driven by growth of $3.1 billion in individual investor and specialized solutions, $3.0 billion in customized solutions and $853.4 million in commingled products.

Market appreciation of $12.8 billion due to:

$8.0 billion in our Private Equity segment driven by carrying value increase in corporate private equity, Strategic Partners and Tactical Opportunities of 16.4%, 13.5% and 7.3%, respectively, which included $270.2 million of foreign exchange depreciation across the segment,

$3.5 billion in our Real Estate segment driven by carrying value increases in our opportunistic and core+ real estate funds of 6.0% and 5.7%, respectively, which includes $1.5 billion of foreign exchange depreciation across the segment, and

$1.2 billion in our Hedge Fund Solutions segment driven by reasons noted above inFee-Earning Assets Under Management.

Offsetting these increases were:


Realizations of $8.3 billion driven by:

o

$3.7 billion in our Private Equity segment driven by continued disposition activity across the segment, mainly related to $2.2 billion from corporate private equity, $621.0 million from Tactical Opportunities, $520.3 million from Strategic Partners, $240.5 million from core private equity, and $147.8 million from BXLS,

o

$3.1 billion in our Real Estate segment driven by $2.1 billion from BREP opportunistic andco-investment, $607.9 million from core+ real estate funds and $358.9 million from BREDS, and

o

$1.3 billion in our Credit segment driven by $466.7 million from our distressed strategies, $394.4 million from our mezzanine strategies and $185.5 million from certain long only and MLP strategies.

Total Assets Under Management realizations in our Private Equity and Real Estate segments generally represents the total proceeds and typically exceeds theFee-Earning Assets Under Management realizations which generally represents only the invested capital.

Outflows of $31.2$8.1 billion primarily attributable to:


$23.6 billion in our Credit segment driven by the conclusion of oursub-advisory relationship with FS Investment. The remaining outflows were mainly related to certain long only and MLP strategies,

$5.7 billion in our Hedge Fund Solutions segment, reflecting investors’ liquidity needs and certain strategic shifts in their programs, driven by outflows of $2.5 billion from customized solutions, $1.6 billion from individual investors and specialized solutions and $1.5 billion from commingled products, and

$1.2 billion in our Real Estate segment driven by redemptions from the BREDS liquids funds and a release of reserves from BREDS drawdown funds.

o

$4.6 billion in our Credit segment driven by $1.8 billion from certain long only and MLP strategies, $1.3 billion from direct lending and $1.2 billion from BIS,

o

$2.1 billion in our Hedge Fund Solutions segment driven by $1.2 billion from customized solutions and $851.3 million from individual investor and specialized solutions, and

o

$1.2 billion in our Real Estate segment driven by the end of a core+ vehicle investment period and redemptions from the BREDS liquids funds.

Realizations of $14.6 billion primarily driven by:

$7.0 billion in our Real Estate segment driven by $5.2 billion from BREP opportunistic funds andco-investment, $1.2 billion from BREDS and $654.4 million from core+ real estate funds,

$4.3 billion in our Credit segment driven by $1.9 billion from our distressed strategies, $1.1 billion from capital returned to investors from CLOs that are post theirre-investment periods and $846.5 million from our mezzanine strategies, and

$3.1 billion in our Private Equity segment driven by continued disposition activity across the segment, mainly related to $1.2 billion from corporate private equity, $955.6 million from Strategic Partners and $927.9 million from Tactical Opportunities.

Limited Partner Capital Invested

The following presents the limited partner capital investedLimited Partner Capital Invested for each of the respective three month periods:


LOGOLOGO


Note:

Note:    Totals may not add due to rounding.


   Three Months Ended
June 30,
   Six Months Ended
June 30,
 
   2017   2018   2017   2018 
   (Dollars in Thousands) 

Limited Partner Capital Invested


Private Equity

  $3,846,841   $2,356,960   $8,583,229   $5,658,909 

Real Estate

   2,371,918    4,538,154    4,962,337    8,792,355 

Hedge Fund Solutions (a)

   89,985    112,753    211,842    868,571 

Credit

   1,490,880    1,018,831    3,752,146    2,030,192 


  $7,799,624   $8,026,698   $17,509,554   $17,350,027 


(a)

Limited Partner Capital Invested for the Hedge Fund Solutions segment has been updated for an adjustment applicable to the three months ended March 31, 2017.

                                                
   Three Months Ended
   March 31,
   2018  2019
   (Dollars in Thousands)

Limited Partner Capital Invested


Real Estate

   $4,254,201    $3,040,066 

Private Equity

   3,301,949    6,428,992 

Hedge Fund Solutions

   755,818    108,006 

Credit

   1,011,361    1,267,299 


   $9,323,329    $10,844,363 


Dry Powder

The following presents the dry powderour Dry Powder as of quarter end of each period:


LOGOLOGO


Note:

Totals may not add due to rounding.

(a)

Represents illiquid drawdown funds, only; excludes marketable vehicles; includes bothFee-Earning (third party)a component of perpetual capital andfee-payingco-investments; includesfee-paying third party capital as well as general partner and employee commitmentscapital that dodoes not earn fees. Amounts are reduced by outstanding capital commitments, to invest, but for which capital has not yet been called.invested.


   June 30, 
   2017   2018 
   (Dollars in Thousands) 

Dry Powder Available for Investment


Private Equity

  $37,503,446   $36,425,713 

Real Estate

   31,678,807    26,545,329 

Hedge Fund Solutions

   3,838,039    3,501,849 

Credit

   16,995,736    21,844,231 


  $90,016,028   $88,317,122 


   March 31,
   2018  2019
   (Dollars in Thousands)

Dry Powder Available for Investment


Real Estate

   $31,897,502    $41,128,351 

Private Equity

   34,664,602    64,005,647 

Hedge Fund Solutions

   3,375,255    3,307,835 

Credit

   22,813,365    24,191,898 


   $92,750,724    $132,633,731 


Net Accrued Performance Revenues

The following table presents the Accrued Performance Revenues, net of performance compensation, of the Blackstone Funds as of June 30, 2018March 31, 2019 and 2017.2018. Net Accrued Performance Revenues presented do not include clawback amounts, if any, which are disclosed in Note 17.18. “Commitments and Contingencies — Contingencies —Contingent— Contingent Obligations (Clawback)” in the “Notes to Condensed Consolidated Financial Statements” in “Part I. Item 1. Financial Statements” of this filing. The Net Accrued Performance Revenues as of each reporting date iswere principally unrealized; if realized, such amount can be a significant component of Distributable Earnings.

                                                
  June 30,   March 31,
  2018   2017   2019  2018
  (Dollars in Millions) 

Private Equity


BCP IV

  $99   $86 

BCP V

   87    68 

BCP VI

   911    579 

BCP VII

   94    —   

BEP I

   142    89 

BEP II

   50    12 

Tactical Opportunities

   152    117 

Strategic Partners

   91    46 

BTAS

   30    27 

Other

   1    4 


Total Private Equity (a)

   1,657    1,028 


   (Dollars in Millions)

Real Estate


BREP IV

   14    8    $1    $10 

BREP V

   159    238    62    205 

BREP VI

   132    229    88    184 

BREP VII

   592    544    552    606 

BREP VIII

   317    211    464    288 

BREP International II

   7     

BREP Europe III

   33    169        61 

BREP Europe IV

   211    367    213    220 

BREP Europe V

   61    —      137    41 

BREP Asia I

   110    76    137    112 

BPP

   194    118    245    174 

BREIT

   10    3    11    14 

BREDS

   29    21    23    32 

BTAS

   31    —      38    25 


Total Real Estate (a)

   1,893    1,984    1,978    1,972 


Private Equity


BCP IV

   42    70 

BCP V

       70 

BCP VI

   789    783 

BCP VII

   256    59 

BCP Asia

   6     

BEP I

   131    91 

BEP II

   70    34 

Tactical Opportunities

   158    138 

Strategic Partners

   109    81 

BCEP

   21     

BTAS

   50    19 

Other

   1    3 


Total Private Equity (a)

   1,633    1,348 


Hedge Fund Solutions

   23    29    26    19 


Credit

   299    216    222    266 


Total Blackstone Net Accrued Performance Revenues

  $3,872   $3,257    $3,859    $3,605 


(a)

Real Estate and Private Equity and Real Estate includeCo-Investments, as applicable.

For the year ended March 31, 2019, Net Accrued Performance Revenues receivable was increased by netNet Accrued Performance Revenues of $2.3$1.4 billion for the six months ended June 30, 2018 and decreased by net realized distributions of $1.7 billion for the six months ended June 30, 2018.$1.2 billion.

Performance Revenue Eligible Assets Under Management

The following representspresents our Invested Performance Revenue Eligible Assets Under Management as of June 30, 2018:quarter end for each period:


LOGOLOGO


Note:

Totals may not add due to rounding.

Perpetual Capital

The following presents our Perpetual Capital as of quarter end for each period:

LOGO

(a)Note:

Represents invested andTotals may not add due to be invested capital at fair value, including closed commitments for funds whose investment period has not yet commenced, on which Performance Revenue could be earned if certain hurdles are met.

(b)

Represents dry powder exclusive ofnon-revenue earning general partner and employee commitments.rounding.

Investment Record

Fund returns information for our significant funds is included throughout this discussion and analysis to facilitate an understanding of our results of operations for the periods presented. The fund returns information reflected in this discussion and analysis is not indicative of the financial performance of The Blackstone Group L.P. and is also not necessarily indicative of the future performance of any particular fund. An investment in The Blackstone Group L.P. is not an investment in any of our funds. There can be no assurance that any of our funds or our other existing and future funds will achieve similar returns.

The following table presents the investment record of our significant drawdown funds from inception through June 30, 2018:March 31, 2019:

                                                                                                                                                                                                      
      Unrealized Investments Realized Investments Total Investments    
Fund (Investment Period Committed Available     %         Net IRRs (d)

Beginning Date / Ending Date) (a)

 Capital Capital (b) Value MOIC (c) Public Value MOIC (c) Value MOIC (c) Realized Total
  (Dollars in Thousands, Except Where Noted)

Real Estate


Pre-BREP

  $140,714   $   $   N/A   -   $345,190   2.5x   $345,190   2.5x   33%   33% 

BREP I (Sep 1994 /Oct 1996)

  380,708         N/A   -   1,327,708   2.8x   1,327,708   2.8x   40%   40% 

BREP II (Oct 1996 / Mar 1999)

  1,198,339         N/A   -   2,531,614   2.1x   2,531,614   2.1x   19%   19% 

BREP III (Apr 1999 / Apr 2003)

  1,522,708         N/A   -   3,330,406   2.4x   3,330,406   2.4x   21%   21% 

BREP IV (Apr 2003 / Dec 2005)

  2,198,694      208,353   0.3x   20%   4,290,925   2.2x   4,499,278   1.6x   33%   12% 

BREP V (Dec 2005 / Feb 2007)

  5,539,418      560,418   1.5x   28%   12,716,417   2.4x   13,276,835   2.3x   12%   11% 

BREP VI (Feb 2007 / Aug 2011)

  11,060,444      1,085,024   2.1x   -   26,474,555   2.5x   27,559,579   2.5x   13%   13% 

BREP VII (Aug 2011 / Apr 2015)

  13,495,496   2,001,709   9,900,355   1.7x   18%   19,119,840   2.1x   29,020,195   1.9x   26%   17% 

BREP VIII (Apr 2015 / Oct 2020)

  16,585,524   5,467,780   15,084,938   1.4x   1%   5,029,991   1.6x   20,114,929   1.4x   26%   16% 

BREP IX (TBD)

  17,964,219   17,964,219      N/A   -      N/A      N/A   N/A   N/A 


Total Global BREP

  $70,086,264   $ 25,433,708   $26,839,088   1.4x   8%   $75,166,646   2.3x   $102,005,734   2.0x   19%   16% 


BREP Int’l (Jan 2001 / Sep 2005)

  €824,172   €   €   N/A   -   €1,367,665   2.1x   €1,367,665   2.1x   23%   23% 

BREP Int’l II (Sep 2005 / Jun 2008) (e)

  1,629,748      161,201   2.8x   -   2,387,198   1.8x   2,548,399   1.8x   8%   8% 

BREP Europe III (Jun 2008 / Sep 2013)

  3,205,167   468,156   656,505   0.9x   -   5,495,093   2.5x   6,151,598   2.1x   21%   15% 

BREP Europe IV (Sep 2013 / Dec 2016)

  6,709,145   1,356,149   4,243,522   1.6x   13%   7,468,133   2.0x   11,711,655   1.8x   24%   17% 

BREP Europe V (Dec 2016 / Jun 2022)

  7,943,145   3,116,571   6,074,523   1.3x   -   144,494   2.4x   6,219,017   1.3x   73%   17% 


Total Euro BREP

  €20,311,377   €4,940,876   €11,135,751   1.4x   5%   €16,862,583   2.1x   €27,998,334   1.7x   16%   14% 


BREP Asia I (Jun 2013 / Dec 2017)

  $5,096,418   $1,728,859  $4,259,488   1.5x   -   $3,051,743   1.8x   $7,311,231   1.6x   21%   15% 

BREP Asia II (Dec 2017 / Jun 2023)

  7,174,723   5,843,040   1,444,947   1.0x   -   2,000   N/M   1,446,947   1.0x   N/M   N/M 

BREPCo-Investment (f)

  7,055,974   171,656   2,129,980   1.9x   40%   12,123,536   2.1x   14,253,516   2.1x   15%   15% 


Total BREP

  $114,281,146   $38,719,937   $47,728,263   1.4x   8%   $111,805,369   2.2x   $159,533,632   1.9x   18%   15% 


BPP (g)

  27,257,859   2,830,562   29,175,585   1.2x   -   4,134,665   2.4x   33,310,250   1.3x   N/M   11% 

BREDS High-Yield (h)    

  12,011,754   2,509,514   3,467,107   1.1x   -   10,484,654   1.3x   13,951,761   1.2x   11%   11% 


        Unrealized Investments  Realized Investments  Total Investments  Net IRRs (c) 

Fund (Investment Period Beginning Date / Ending Date)

 Committed
Capital
  Available
Capital (a)
  Value  MOIC (b)  %
Public
  Value  MOIC (b)  Value  MOIC (b)  Realized  Total 
  (Dollars in Thousands, Except Where Noted) 

Private Equity


BCP I (Oct 1987 / Oct 1993)

 $859,081  $—    $—     N/A   —    $1,741,738   2.6x  $1,741,738   2.6x   19  19

BCP II (Oct 1993 / Aug 1997)

  1,361,100   —     —     N/A   —     3,256,819   2.5x   3,256,819   2.5x   32  32

BCP III (Aug 1997 / Nov 2002)

  3,967,422   —     —     N/A   —     9,184,688   2.3x   9,184,688   2.3x   14  14

BCOM (Jun 2000 / Jun 2006)

  2,137,330   24,575   17,086   1.3x   —     2,953,649   1.4x   2,970,735   1.4x   7  6

BCP IV (Nov 2002 / Dec 2005)

  6,773,182   207,524   872,299   0.9x   50  20,677,725   3.2x   21,550,024   2.9x   42  36

BCP V (Dec 2005 / Jan 2011)

  21,022,164   1,052,763   2,256,568   1.1x   30  36,189,148   2.0x   38,445,716   1.9x   9  8

BCP VI (Jan 2011 / May 2016)

  15,190,523   1,800,629   17,512,669   1.8x   32  8,990,744   2.1x   26,503,413   1.9x   23  15

BEP I (Aug 2011 / Feb 2015)

  2,436,904   168,684   2,947,107   1.7x   36  1,416,870   2.0x   4,363,977   1.8x   29  15

BEP II (Feb 2015 / Feb 2021)

  4,874,208   1,698,584   2,884,607   1.4x   —     65,371   2.9x   2,949,978   1.4x   N/M   15

BCP VII (May 2016 / May 2022)

  18,494,651   12,230,285   5,644,440   1.4x   —     311,717   1.2x   5,956,157   1.4x   N/M   17

BCP Asia (Dec 2017 / Dec 2023) (d)

  2,369,469   2,208,544   13,992   N/A   —     —     N/A   13,992   N/A   N/A   N/M 


Total Corporate Private Equity

 $79,486,034  $19,391,588  $32,148,768   1.5x   24 $84,788,469   2.2x  $116,937,237   2.0x   17  15


Tactical Opportunities

 $18,427,737  $8,426,505  $9,781,454   1.2x   10 $5,287,948   1.7x  $15,069,402   1.4x   26  12

Tactical OpportunitiesCo-Investment and Other

  5,119,604   1,409,243   3,670,283   1.2x   2  1,198,810   1.6x   4,869,093   1.3x   N/A   18

Strategic PartnersI-V andCo-Investment (e)

  11,913,113   1,796,921   2,020,522   N/M   —     15,588,672   N/M   17,609,194   1.5x   N/A   13

Strategic Partners VI LBO, RE and SMA (e)

  7,402,171   2,070,236   3,500,627   N/M   —     2,739,347   N/M   6,239,974   1.5x   N/A   21

Strategic Partners VII (e)

  7,669,970   2,334,958   4,876,510   N/M   —     350,751   N/M   5,227,261   1.3x   N/A   54

Strategic Partners RA II (e)

  1,806,807   1,446,595   262,612   N/M   —     12,940   N/M   275,552   1.2x   N/A   24

BCEP (Jan 2017 / Jan 2021) (f)

  4,755,620   2,605,464   2,214,439   1.0x   —     —     N/A   2,214,439   1.0x   N/A   3

Other Funds andCo-Investment (g)

  1,621,936   442,069   68,639   0.9x   22  637,161   0.9x   705,800   0.9x   N/M   N/M 
           

Real Estate


Pre-BREP

 $140,714  $—    $—     N/A   —    $345,190   2.5x  $345,190   2.5x   33  33

BREP I (Sep 1994 / Oct 1996)

  380,708   —     —     N/A   —     1,327,708   2.8x   1,327,708   2.8x   40  40

BREP II (Oct 1996 / Mar 1999)

  1,198,339   —     —     N/A   —     2,531,614   2.1x   2,531,614   2.1x   19  19

BREP III (Apr 1999 / Apr 2003)

  1,522,708   —     —     N/A   —     3,330,406   2.4x   3,330,406   2.4x   21  21

BREP IV (Apr 2003 / Dec 2005)

  2,198,694   —     313,328   0.4x   30  4,259,530   2.2x   4,572,858   1.7x   35  12

BREP V (Dec 2005 / Feb 2007)

  5,539,418   —     1,181,187   2.3x   31  12,230,080   2.3x   13,411,267   2.3x   12  11

BREP VI (Feb 2007 / Aug 2011)

  11,060,444   556,530   1,554,579   1.6x   3  25,908,690   2.6x   27,463,269   2.5x   14  13

BREP VII (Aug 2011 / Apr 2015)

  13,495,034   2,058,135   11,964,442   1.7x   19  16,641,294   2.1x   28,605,736   1.9x   29  18

BREP VIII (Apr 2015 / Oct 2020)

  16,419,603   8,407,055   11,023,120   1.4x   2  4,003,140   1.5x   15,026,260   1.4x   27  17


Total Global BREP

 $51,955,662  $11,021,720  $26,036,656   1.5x   11 $70,577,652   2.3x  $96,614,308   2.0x   19  16


BREP Int’l (Jan 2001 / Sep 2005)

 824,172  —    —     N/A   —    1,369,016   2.1x  1,369,016   2.1x   23  23

BREP Int’l II (Sep 2005 / Jun 2008) (h)

  1,629,748   —     140,384   0.5x   —     2,294,647   2.0x   2,435,031   1.7x   10  8

BREP Europe III (Jun 2008 / Sep 2013)

  3,205,167   463,758   1,154,882   1.3x   —     5,199,477   2.5x   6,354,359   2.2x   21  16

BREP Europe IV (Sep 2013 / Dec 2016)

  6,709,145   1,333,963   4,903,348   1.5x   10  6,316,424   2.0x   11,219,772   1.8x   25  18

BREP Europe V (Dec 2016 / Jun 2022)

  7,855,686   4,256,899   4,164,195   1.2x   4  14,155   N/M   4,178,350   1.2x   N/M   19


Total Euro BREP

 20,223,918  6,054,620  10,362,809   1.3x   7 15,193,719   2.1x  25,556,528   1.7x   17  14


BREP Asia I (Jun 2013 / Dec 2017)

 $5,096,522  $1,881,675  $4,253,540   1.4x   —    $2,508,819   1.8x  $6,762,359   1.5x   23  16

BREP Asia II (Dec 2017 / Jun 2023)

  7,105,707   7,008,667   262,033   N/M   —     —     N/M   262,033   N/M   N/M   N/M 

BREPCo-Investment (i)

  6,892,347   146,573   2,098,516   1.7x   51  11,800,844   2.1x   13,899,360   2.1x   16  16


Total BREP

 $95,817,573  $27,054,144  $44,954,095   1.4x   11 $104,310,222   2.2x  $149,264,317   1.9x   19  16


BPP (j)

 $25,307,653  $2,882,693  $25,930,125   1.2x   —    $2,678,843   N/A  $28,608,968   1.2x   N/M   12

BREDS (k)

 $13,247,759  $4,600,992  $2,966,415   1.1x   —    $9,474,771   1.3x  $12,441,186   1.3x   12  11

continued...

        Unrealized Investments  Realized Investments  Total Investments  Net IRRs (c) 

Fund (Investment Period Beginning Date / Ending Date)

 Committed
Capital
  Available
Capital (a)
  Value  MOIC (b)  %
Public
  Value  MOIC (b)  Value  MOIC (b)  Realized  Total 
  (Dollars in Thousands, Except Where Noted) 

Hedge Fund Solutions


BSCH (Dec 2013 / Jun 2020) (l)

 $3,298,575  $2,356,290  $973,480   1.0x   —    $256,301   N/A  $1,229,781   1.3x   N/A   6

BSCHCo-Investment

  276,000   164,877   102,280   0.9x   —     24,167   N/A   126,447   1.1x   N/A   9


Total Hedge Fund Solutions

 $3,574,575  $2,521,167  $1,075,760   1.0x   —    $280,468   N/A  $1,356,228   1.3x   N/A   6


Credit (m)


Mezzanine I (Jul 2007 / Oct 2011)

 $2,000,000  $97,114  $45,909   0.8x   —    $4,770,221   1.6x  $4,816,130   1.6x   N/A   17

Mezzanine II (Nov 2011 / Nov 2016)

  4,120,000   1,146,274   2,535,690   1.1x   —     4,100,043   1.6x   6,635,733   1.4x   N/A   13

Mezzanine III (Sep 2016 / Sep 2021)

  6,639,133   3,457,539   2,547,038   1.1x   —     636,892   1.5x   3,183,930   1.2x   N/A   13

Stressed / Distressed Investing I (Sep 2009 / May 2013)

  3,253,143   175,000   417,641   0.7x   —     5,568,943   1.5x   5,986,584   1.4x   N/A   11

Stressed / Distressed Investing II (Jun 2013 / Jun 2018)

  5,125,000   648,283   2,846,622   1.1x   —     2,968,264   1.4x   5,814,886   1.2x   N/A   13

Stressed / Distressed Investing III (Dec 2017 / Dec 2022)

  7,356,380   6,329,287   769,329   1.1x   —     23,341   N/A   792,670   1.1x   N/A   N/A 

Energy Select Opportunities (Nov 2015 / Nov 2018)

  2,856,867   1,108,540   1,875,069   1.2x   —     415,064   1.7x   2,290,133   1.2x   N/A   19
           

Euro


European Senior Debt Fund (Feb 2015 / Feb 2019)

 1,964,689  1,560,617  1,811,098   1.0x   —    656,896   1.5x  2,467,994   1.1x   N/A   11


Total Credit

 $33,616,933  $14,784,215  $13,151,845   1.1x   —    $19,235,263   1.5x  $32,387,108   1.3x   N/A   14


      Unrealized Investments Realized Investments Total Investments    
Fund (Investment Period Committed Available     %         Net IRRs (d)

Beginning Date / Ending Date) (a)

 Capital Capital (b) Value MOIC (c) Public Value MOIC (c) Value MOIC (c) Realized Total
  (Dollars in Thousands, Except Where Noted)

Private Equity


BCP I (Oct 1987 / Oct 1993)

  $859,081  $  $   N/A   -   $1,741,738   2.6x   $1,741,738   2.6x   19%   19% 

BCP II (Oct 1993 / Aug 1997)

  1,361,100         N/A   -   3,256,819   2.5x   3,256,819   2.5x   32%   32% 

BCP III (Aug 1997 / Nov 2002)

  3,967,422         N/A   -   9,184,688   2.3x   9,184,688   2.3x   14%   14% 

BCOM (Jun 2000 / Jun 2006)

  2,137,330   24,575   15,639   1.2x   -   2,953,649   1.4x   2,969,288   1.4x   7%   6% 

BCP IV (Nov 2002 / Dec 2005)

  6,773,182   204,794   344,504   2.2x   50%   21,251,054   2.9x   21,595,558   2.9x   37%   36% 

BCP V (Dec 2005 / Jan 2011)

  21,013,586   1,039,733   993,106   0.9x   40%   37,058,962   1.9x   38,052,068   1.9x   8%   8% 

BCP VI (Jan 2011 / May 2016)

  15,191,350   1,767,265   14,578,233   1.8x   34%   12,817,204   2.1x   27,395,437   1.9x   21%   14% 

BEP I (Aug 2011 / Feb 2015)

  2,435,285   224,784   2,524,303   1.7x   48%   2,047,071   2.3x   4,571,374   1.9x   26%   14% 

BEP II (Feb 2015 / Feb 2021)

  4,902,640   1,000,390   4,564,315   1.3x   -   227,225   2.0x   4,791,540   1.4x   45%   13% 

BCP VII (May 2016 / May 2022)

  18,590,630   8,728,039   12,741,883   1.4x   -   452,900   1.3x   13,194,783   1.4x   35%   19% 

BCP Asia (Dec 2017 / Dec 2023)

  2,405,153   2,076,729   221,543   2.0x   -      N/A   221,543   2.0x   N/A   75% 

BEP III (TBD)

  3,684,191   3,684,191      N/A   -      N/A      N/A   N/A   N/A 

BCP VIII (TBD)

  22,225,158   22,225,158      N/A   -      N/A      N/A   N/A   N/A 


Total Corporate Private Equity

  $105,546,108   $40,975,658   $35,983,526   1.5x   19%   $90,991,310   2.2x   $ 126,974,836   1.9x   16%   15% 


Tactical Opportunities

  21,911,160   10,394,383   9,898,867   1.3x   9%   6,806,144   1.7x   16,705,011   1.4x   21%   11% 

Tactical OpportunitiesCo-Investment and Other

  6,520,129   2,519,961   3,653,882   1.2x   2%   1,514,218   1.6x   5,168,100   1.3x   25%   14% 


Total Tactical Opportunities

  $28,431,289   $12,914,344   $13,552,749   1.3x   7%   $8,320,362   1.7x   $21,873,111   1.4x   22%   11% 


Strategic PartnersI-V (i)

  11,862,601   1,762,708   1,530,629   N/M   -   16,166,460   N/M   17,697,089   1.5x   N/A   13% 

Strategic Partners VI (Apr 2014 / Apr 2016) (i)

  4,362,750   1,154,067   1,861,262   N/M   -   2,746,833   N/M   4,608,095   1.5x   N/A   19% 

Strategic Partners VII (May 2016 / Mar 2019) (i)

  7,489,970   2,235,603   5,989,257   N/M   -   803,805   N/M   6,793,062   1.4x   N/A   35% 

Strategic Partners RA II (May 2017 / TBD) (i)

  1,749,807   703,386   756,243   N/M   -   30,361   N/M   786,604   1.1x   N/A   18% 

Strategic Partners VIII (Mar 2019 / TBD) (i)

  5,281,164   4,880,068      N/A   -      N/A      N/A   N/A   N/A 

Strategic Partners RE, SMA and
Other (i)

  4,590,901   1,317,461   1,541,602   N/M   -   891,633   N/M   2,433,235   1.3x   N/A   17% 


Total Strategic Partners

  $35,337,193   $12,053,293   $11,678,993   N/M   -   $20,639,092   N/M   $32,318,085   1.5x   N/A   14% 


BCEP (Jan 2017 / Jan 2021) (j)

  4,755,613   2,141,452   2,995,210   1.1x   -   240,480   1.7x   3,235,690   1.2x   27%   11% 

BIP

  6,467,667   5,285,446   1,182,221   1.0x   100%      N/A   1,182,221   1.0x   N/A   N/M 

Other Funds andCo-Investment (k)    

  1,557,393   325,028   100,137   1.0x   17%   635,564   0.9x   735,701   1.0x   N/M   N/M 

continued...

                                                                                                                                                                   ��                                  
      Unrealized Investments Realized Investments Total Investments    
Fund (Investment Period Committed Available     %         Net IRRs (d)

Beginning Date / Ending Date) (a)

 Capital Capital (b) Value MOIC (c) Public Value MOIC (c) Value MOIC (c) Realized Total
  (Dollars in Thousands, Except Where Noted)

Hedge Fund Solutions


Total Strategic Capital Holdings (Dec 2013 / Jun 2020) (l)

  $3,378,575   $759,351   $2,709,970   1.5x   -   $356,189   N/M   $3,066,159   1.7x   N/A   8% 


Credit (m)


Mezzanine I (Jul 2007 / Oct 2011)

  $2,000,000   $97,114   $26,156   1.3x   -   $4,772,132   1.6x   $4,798,288   1.6x   N/A   17% 

Mezzanine II (Nov 2011 / Nov 2016)

  4,120,000   1,168,881   1,867,420   1.0x   -   4,760,395   1.6x   6,627,815   1.4x  ��N/A   12% 

Mezzanine III (Sep 2016 / Sep 2021)

  6,639,133   2,013,193   3,676,683   1.1x   -   1,079,275   1.6x   4,755,958   1.2x   N/A   13% 

Stressed / Distressed Investing I (Sep 2009 / May 2013)

  3,253,143   135,000   216,928   0.4x   -   5,745,131   1.6x   5,962,059   1.4x   N/A   11% 

Stressed / Distressed Investing II (Jun 2013 / Jun 2018)

  5,125,000   547,170   2,100,835   0.9x   -   3,756,349   1.3x   5,857,184   1.2x   N/A   8% 

Stressed / Distressed Investing III (Dec 2017 / Dec 2022)

  7,356,380   5,678,860   1,479,363   1.0x   -   382,591   1.3x   1,861,954   1.1x   N/A   N/A 

Energy Select Opportunities (Nov 2015 / Nov 2018)

  2,856,867   943,281   2,073,685   1.2x   -   569,083   1.7x   2,642,768   1.3x   N/A   13% 

Energy Select Opportunities II (Feb 2019 / Feb 2024)

  3,347,431   2,811,011   91,152   1.0x   -      N/A   91,152   1.0x   N/M   N/M 

Euro


European Senior Debt Fund (Feb 2015 / Feb 2019)

  €1,964,689  335,732   €2,082,059   1.0x   -   €881,841   1.5x  2,963,900   1.2x   N/A   10% 


Total Credit

  $36,964,363   $13,771,503   $13,870,061   1.0x   -   $22,075,083   1.5x   $35,945,144   1.3x   N/A   12% 


The returns presented herein represent those of the applicable Blackstone Funds and not those of The Blackstone Group L.P.


N/M

Not meaningful.

N/A

Not applicable.

(a)

The returns presented herein exclude investment vehicles where Blackstone does not earn fees.

(b)

Available Capital represents total investable capital commitments, includingside-by-side, adjusted for certain expenses and expired or recallable capital and may include leverage, less invested capital. This amount is not reduced by outstanding commitments to investments.

(b)(c)

Multiple of Invested Capital (“MOIC”) represents carrying value, before management fees, expenses and carried interest,Performance Revenues, divided by invested capital.

(c)(d)

Net Internal Rate of Return (“IRR”) represents the annualized inception to June 30, 2018March 31, 2019 IRR on total invested capital based on realized proceeds and unrealized value, as applicable, after management fees, expenses and carried interest.

(d)

Includes foreign currency gain or loss on invested undrawn capital, if any.Performance Revenues.

(e)

Realizations are treated as return of capital until fully recovered and therefore unrealized and realized MOICs are not meaningful.

(f)

BCEP, or Blackstone Core Equity Partners, is a core private equity fund which invests with a more modest risk profile and longer hold period.

(g)

Returns for Other Funds andCo-Investment are not meaningful as these funds have limited transaction activity.

(h)

The 10%8% Realized Net IRR and 8% Total Net IRR exclude investors that opted out of the Hilton investment opportunity. Overall BREP International II performance reflects a 9%7% Realized Net IRR and a 6%7% Total Net IRR.

(i)(f)

BREPCo-Investment representsco-investment capital raised for various BREP investments. The Net IRR reflected is calculated by aggregating eachco-investment’s realized proceeds and unrealized value, as applicable, after management fees, expenses and carried interest.Performance Revenues.

(j)(g)

BPP represents the core+ real estate funds which invest with a more modest risk profile and lower leverage. Excludes BREIT.

(h)

BREDS High-Yield represents the flagship real estate debt drawdown funds only and excludes BREDSHigh-Grade.

(i)

Realizations are treated as return of capital until fully recovered and therefore unrealized and realized MOICs are not meaningful. Returns are calculated from results that are reported on a three month lag.

(j)

BCEP, or Blackstone Core Equity Partners, is a core private equity fund which invests with a more modest risk profile and longer hold period.

(k)

Excludes Capital Trust drawdown funds.Returns for Other Funds andCo-Investment are not meaningful as these funds have limited transaction activity.

(l)

BSCH, orRepresents Blackstone Strategic Capital Holdings (includingCo-investment) which is a permanent capital vehicle focused on acquiring strategic minority positions in alternative asset managers.

(m)

Funds presented represent the flagship credit drawdown funds only. The Total Credit Net IRR is the combined IRR of the eight credit drawdown funds presented.

Segment Analysis

Discussed below is our Economic IncomeSegment Distributable Earnings for each of our segments. This information is reflected in the manner utilized by our senior management to make operating decisions, assess performance and allocate resources. References to “our” sectors or investments may also refer to portfolio companies and investments of the underlying funds that we manage.

For

Real Estate

The following table presents the results of operations for our Real Estate segment:

                                                                        
   Three Months Ended    
   March 31, 2019 vs. 2018
   2019 2018 $ %
   (Dollars in Thousands)

Management Fees, Net


Base Management Fees

   $260,245   $226,526   $33,719   15

Transaction and Other Fees, Net

   23,911   23,088   823   4

Management Fee Offsets

   (280  (1,668  1,388   -83


Total Management Fees, Net

   283,876   247,946   35,930   14

Fee Related Performance Revenues

   6,676   4,503   2,173   48

Fee Related Compensation

   (114,816  (100,610  (14,206  14

Other Operating Expenses

   (38,986  (29,417  (9,569  33


Fee Related Earnings

   136,750   122,422   14,328   12


Realized Performance Revenues

   77,182   151,181   (73,999  -49

Realized Performance Compensation

   (29,900  (56,115  26,215   -47

Realized Principal Investment Income (Loss)

   (2,131  14,690   (16,821  N/


Net Realizations

   45,151   109,756   (64,605  -59


Segment Distributable Earnings

   $181,901   $232,178   $(50,277  -22


N/M      Not meaningful.

Three Months Ended March 31, 2019 Compared to Three Months Ended March 31, 2018

Segment Distributable Earnings were $181.9 million for the three months ended March 31, 2019, a decrease of $50.3 million compared to $232.2 million for the three months ended March 31, 2018. The decrease in Segment Distributable Earnings was primarily attributable to a decrease of $64.6 million in Net Realizations, partially offset by an increase of $14.3 million in Fee Related Earnings.

Segment Distributable Earnings in our Real Estate segment reporting purposes, revenuesin the first quarter of 2019 were lower compared to the first quarter of 2018, primarily driven by lower realizations following a volatile fourth quarter, which was characterized by growing macroeconomic and expensesgeopolitical concerns, such as concerns over U.S. Federal Reserve policy, Brexit, the “trade war” with China and the rate of global growth. The stock market subsequently experienced a rally in the first quarter of 2019 in light of greater optimism around these concerns but the decline in the fourth quarter of 2018 still resulted in a lag in realizations. Although our Real Estate funds had $3.1 billion of realizations in the first quarter of 2019, future periods of volatility could similarly contribute to a more challenging environment for realizations going forward. Overall, operating trends in our Real Estate portfolio remain stable and supply-demand fundamentals remain positive in most markets, although decelerating growth in certain sectors, including retail, may contribute to a more challenging environment for our portfolio companies. Capital deployment in opportunistic investments in the United States continues to be challenging, as distress levels are presentedlow and asset values are relatively high. Nonetheless, our Real Estate funds deployed or committed an aggregate of $4.4 billion of capital in the first quarter of 2019, with meaningful investment activity outside of North America and in stabilized income-generating properties in the U.S. In the event global markets enter a period of slower growth relative to recent years, periods of difficult market conditions or economic slowdown (which may be across industries, sectors or geographies) may contribute to adverse operating performance at our portfolio companies. In turn, this may limit attractive realization opportunities for our funds. Although the Federal Reserve has signaled that it would be patient with respect to near-term interest rate increases, to the extent interest rates rise, the cost of debt financing for our real estate businesses and assets will likely increase. Rising interest rates, as well as a stronger U.S. dollar and higher inflation, would also potentially negatively impact Segment Distributable Earnings in our Real Estate segment, particularly if occurring against a backdrop of slowing economic growth. Segment Distributable

Earnings in our Real Estate segment would also potentially be negatively impacted if pressure on a basis that deconsolidateswages and other inputs increasingly pressure profit margins. See “Part I. Item 1A. Risk Factors — Risks Related to Our Business — Difficult market conditions can adversely affect our business in many ways, including by reducing the value or performance of the investments made by our investment funds, we manage. Asmaking it more difficult to find opportunities for our funds to exit and realize value from existing investments and reducing the ability of our investment funds to raise or deploy capital, each of which could materially reduce our revenue, earnings and cash flow and adversely affect our financial prospects and condition.” in our Annual Report onForm 10-K for the year ended December 31, 2018.

Fee Related Earnings

Fee Related Earnings were $136.8 million for the three months ended March 31, 2019, an increase of $14.3 million compared to $122.4 million for the three months ended March 31, 2018. The increase in Fee Related Earnings was primarily attributable to an increase of $35.9 million in Management Fees, Net, partially offset by an increase of $14.2 million in Fee Related Compensation.

Management Fees, Net were $283.9 million for the three months ended March 31, 2019, an increase of $35.9 million compared to $247.9 million for the three months ended March 31, 2018, primarily driven by an increase in Base Management Fees. Base Management Fees were $260.2 million for the three months ended March 31, 2019, an increase of $33.7 million compared to $226.5 million for the three months ended March 31, 2018, primarily due toFee-Earning Assets Under Management growth in our core+ real estate funds.

Fee Related Compensation was $114.8 million for the three months ended March 31, 2019, an increase of $14.2 million, compared to $100.6 million for the three months ended March 31, 2018. The increase was primarily due to the increase in Management Fees, Net, on which a result, segment revenues are greater thanportion of Fee Related Compensation is based.

Net Realizations

Net Realizations were $45.2 million for the three months ended March 31, 2019, a decrease of $64.6 million, compared to $109.8 million for the three months ended March 31, 2018. The decrease in Net Realizations was primarily attributable to decreases of $74.0 million in Realized Performance Revenues and $16.8 million in Realized Principal Investment Income (Loss), partially offset by a decrease of $26.2 million in Realized Performance Compensation.

Realized Performance Revenues were $77.2 million for the three months ended March 31, 2019, a decrease of $74.0 million, compared to $151.2 million for the three months ended March 31, 2018. The decrease was due to lower realized gains in the three months ended March 31, 2019 compared to the three months ended March 31, 2018.

Realized Principal Investment Income (Loss) was $(2.1) million for the three months ended March 31, 2019, a decrease of $16.8 million, compared to $14.7 million for the three months ended March 31, 2018. The decrease was primarily due to lower Realized Principal Investment Income for BREP VI and certain BREDS liquids funds.

Realized Performance Compensation was $29.9 million for the three months ended March 31, 2019, a decrease of $26.2 million, compared to $56.1 million for the three months ended March 31, 2018. The decrease was due to the decrease in Realized Performance Revenues.

Fund Returns

Fund return information for our significant funds is included throughout this discussion and analysis to facilitate an understanding of our results of operations for the periods presented. The fund returns information reflected in this discussion and analysis is not indicative of the financial performance of The Blackstone Group L.P. and is also not necessarily indicative of the future performance of any particular fund. An investment in The

Blackstone Group L.P. is not an investment in any of our funds. There can be no assurance that any of our funds or our other existing and future funds will achieve similar returns.

The following table presents the internal rates of return, except where noted, of our significant real estate funds:

                                                                                                
   Three Months Ended  March 31, 2019
   March 31,  Inception to Date
   2019  2018  Realized  Total

Fund / Composite (a)

  Gross  Net  Gross  Net  Gross  Net  Gross  Net

BREP IV

   -1%    -1%    1%    1%    56%    33%    22%    12% 

BREP V

   7%    6%    1%    1%    15%    12%    14%    11% 

BREP VI

   1%    1%    -1%    -1%    18%    13%    17%    13% 

BREP VII

   5%    5%    4%    3%    35%    26%    24%    17% 

BREP VIII

   3%    2%    5%    4%    37%    26%    23%    16% 

BREP International II (b)(c)

   108%    65%    5%    4%    10%    8%    9%    8% 

BREP Europe III (b)

   -    -1%    2%    1%    30%    21%    23%    15% 

BREP Europe IV (b)

   5%    4%    5%    3%    33%    24%    24%    17% 

BREP Europe V (b)

   5%    4%    7%    4%    98%    73%    27%    17% 

BREP Asia I

   5%    4%    3%    2%    29%    21%    22%    15% 

BREP Asia II

   7%    2%    N/M    N/M    N/M    N/M    N/M    N/M 

BREPCo-Investment (d)

   14%    13%    -    -1%    18%    15%    18%    15% 

BPP (e)

   3%    2%    3%    3%    N/M    N/M    13%    11% 

BREDS High-Yield (f)

   4%    3%    5%    3%    15%    11%    15%    11% 

BREDS High-Grade (f)

   2%    2%    N/M    N/M    10%    9%    8%    6% 

BREDS Liquid (g)

   6%    5%    2%    2%    N/A    N/A    11%    8% 

BXMT (h)

   N/A    10%    N/A    -    N/A    N/A    N/A    13% 

BREIT (h)

   N/A    2%    N/A    2%    N/A    N/A    12%    9% 

The returns presented herein represent those presented on a consolidated GAAP basis because fund management fees recognized in certain segments are received fromof the applicable Blackstone Funds and eliminated in consolidation when presented on a consolidated GAAP basis. Furthermore, segment expenses are lower than related amounts presented on a consolidated GAAP basis duenot those of The Blackstone Group L.P.

N/M

Not meaningful.

N/A

Not applicable.

(a)

Net returns are based on the change in carrying value (realized and unrealized) after management fees, expenses and Performance Revenues.

(b)

Euro-based internal rates of return.

(c)

The 8% Realized Net IRR and 8% Total Net IRR exclude investors that opted out of the Hilton investment opportunity. Overall BREP International II Performance reflects a 7% Realized Net IRR and a 7% Total Net IRR.

(d)

Excludes fully realizedco-investments prior to Blackstone’s IPO.

(e)

BPP represents the core+ real estate funds which invest with a more modest risk profile and lower leverage. Excludes BREIT.

(f)

Effective March 31, 2019, the former BREDS Drawdown composite is being presented by its components, BREDS High-Yield and BREDS High-Grade. BREDS High-Yield represents the flagship real estate debt drawdown funds and excludes the BREDS High-Grade drawdown fund, which has a different risk-return profile. Inception to date returns are from July 1, 2009 and July 1, 2017 for BREDS High-Yield and BREDS High-Grade, respectively. Prior periods have been updated to reflect this presentation.

(g)

BREDS Liquid represents BREDS funds that invest in liquid real estate debt securities, except funds in liquidation and insurance mandates with specific investment objectives. Effective June 30, 2018, the returns presented represent summarized asset-weighted gross and net rates of return. Inception to Date returns are presented on an annualized basis. Prior periods have been updated to reflect such rates of return.

(h)

Reflects annualized return of a shareholder invested in the REIT as of the beginning of each period presented, assuming reinvestment of all dividends received during the period, and no upfront selling

commission for BREIT, net of all fees and expenses incurred by the REIT. For BXMT, return incorporates the closing NYSE stock price as of each period end, and for BREIT, return incorporates the final Class S NAV/share as of each period end. Inception to date returns are from May 22, 2013 and January 1, 2017 for BXMT and BREIT, respectively.

As of March 31, 2019, the exclusion of fund expenses that are paid by Limited Partnersinvestment period for BREP International II had expired and the eliminationfund was not above its carried interest threshold. BREP International II Investors that opted out of the Hilton investment opportunity are not expected to exceed the carried interest threshold in future periods. However, since gains are not earnednon-controllingpro-rata, interests.certain BREP International II investors who participated in the Hilton investment opportunity have exceeded the carried interest threshold this quarter.

The Real Estate segment has three funds in their investment period, which were above their respective carried interest thresholds as of March 31, 2019: BREP VIII, BREP Europe V and BREDS III.

Private EquityReal Estate

The following table presents the results of operations for our Private EquityReal Estate segment:


  Three Months
Ended June 30,
  2018 vs. 2017  Six Months Ended
June 30,
  2018 vs. 2017 
  2018  2017  $  %  2018  2017  $  % 
  (Dollars in Thousands) 

Revenues


Management and Advisory Fees, Net


Base Management Fees

 $195,521  $177,684  $17,837   10 $378,482  $354,390  $24,092   7

Transaction, Advisory and Other Fees, Net

  12,780   17,289   (4,509  -26  23,874   33,465   (9,591  -29

Management Fee Offsets

  (4,351  (3,753  (598  16  (7,544  (15,943  8,399   -53


Total Management and Advisory Fees, Net

  203,950   191,220   12,730   7  394,812   371,912   22,900   6


Performance Revenues


Realized Performance Allocations

  138,171   198,168   (59,997  -30  215,294   780,849   (565,555  -72

Unrealized Performance Allocations

  498,274   9   498,265   N/M   895,590   (184,469  1,080,059   N/M 


Total Performance Revenues

  636,445   198,177   438,268   221  1,110,884   596,380   514,504   86


Principal Investment Income (Loss)


Realized

  32,600   41,168   (8,568  -21  38,938   122,462   (83,524  -68

Unrealized

  84,247   (25,892  110,139   N/M   101,615   (66,414  168,029   N/M 


Total Principal Investment Income

  116,847   15,276   101,571   665  140,553   56,048   84,505   151

Interest and Dividend Revenue

  11,549   7,922   3,627   46  20,092   14,583   5,509   38

Other

  26,667   (16,124  42,791   N/M   10,259   (17,924  28,183   N/M 


Total Revenues

  995,458   396,471   598,987   151  1,676,600   1,020,999   655,601   64


�� 


Expenses


Compensation

  103,798   90,676   13,122   14  203,527   174,279   29,248   17

Performance Compensation


Realized Performance Allocations

  68,513   63,060   5,453   9  101,558   244,693   (143,135  -58

Unrealized Performance Allocations

  193,747   22,219   171,528   772  372,549   (17,137  389,686   N/M 


Total Compensation and Benefits

  366,058   175,955   190,103   108  677,634   401,835   275,799   69

Interest Expense

  12,773   10,728   2,045   19  22,906   21,155   1,751   8

Other Operating Expenses

  36,047   28,592   7,455   26  67,198   56,353   10,845   19


Total Expenses

  414,878   215,275   199,603   93  767,738   479,343   288,395   60


Economic Income

 $580,580  $181,196  $399,384   220 $908,862  $541,656  $367,206   68


   Three Months Ended    
   March 31, 2019 vs. 2018
   2019 2018 $ %
   (Dollars in Thousands)

Management Fees, Net


Base Management Fees

   $260,245   $226,526   $33,719   15

Transaction and Other Fees, Net

   23,911   23,088   823   4

Management Fee Offsets

   (280  (1,668  1,388   -83


Total Management Fees, Net

   283,876   247,946   35,930   14

Fee Related Performance Revenues

   6,676   4,503   2,173   48

Fee Related Compensation

   (114,816  (100,610  (14,206  14

Other Operating Expenses

   (38,986  (29,417  (9,569  33


Fee Related Earnings

   136,750   122,422   14,328   12


Realized Performance Revenues

   77,182   151,181   (73,999  -49

Realized Performance Compensation

   (29,900  (56,115  26,215   -47

Realized Principal Investment Income (Loss)

   (2,131  14,690   (16,821  N/


Net Realizations

   45,151   109,756   (64,605  -59


Segment Distributable Earnings

   $181,901   $232,178   $(50,277  -22


N/M      Not meaningful.

Three Months Ended June 30, 2018March 31, 2019 Compared to Three Months Ended June 30, 2017March 31, 2018

Revenues

RevenuesSegment Distributable Earnings were $995.5$181.9 million for the three months ended June 30, 2018, an increaseMarch 31, 2019, a decrease of $599.0$50.3 million compared to $396.5$232.2 million for the three months ended June 30, 2017.March 31, 2018. The increasedecrease in RevenuesSegment Distributable Earnings was primarily attributable to increasesa decrease of $438.3$64.6 million in Performance Revenues and $101.6Net Realizations, partially offset by an increase of $14.3 million in Principal Investment Income.Fee Related Earnings.

RevenuesSegment Distributable Earnings in our Private EquityReal Estate segment in the secondfirst quarter of 2019 were lower compared to the first quarter of 2018, were higher compared to the second quarter of 2017, primarily driven by increased Performance Revenues largely duelower realizations following a volatile fourth quarter, which was characterized by growing macroeconomic and geopolitical concerns, such as concerns over U.S. Federal Reserve policy, Brexit, the “trade war” with China and the rate of global growth. The stock market subsequently experienced a rally in the first quarter of 2019 in light of greater optimism around these concerns but the decline in the fourth quarter of 2018 still resulted in a lag in realizations. Although our Real Estate funds had $3.1 billion of realizations in the first quarter of 2019, future periods of volatility could similarly contribute to positive performancea more challenging environment for realizations going forward. Overall, operating trends in our corporate private equityReal Estate portfolio remain stable and supply-demand fundamentals remain positive in most markets, although decelerating growth in certain sectors, including retail, may contribute to a more challenging environment for our portfolio companies. Capital deployment in opportunistic investments particularly in energy and technology. The market environmentthe United States continues to be generally characterized by high priceschallenging, as distress levels are low and as a result, the market for new investments remains challenging.asset values are relatively high. Nonetheless, in the second quarter of 2018 weour Real Estate funds deployed $2.6 billion andor committed an additional $1.9aggregate of $4.4 billion of capital in the first quarter of 2019, with meaningful investment activity outside of North America and in stabilized income-generating properties in the U.S. In the event global markets enter a period of slower growth relative to recent years, periods of difficult market conditions or economic slowdown (which may be across the segment. U.S. tax reform is expectedindustries, sectors or geographies) may contribute to have a neutral to slightly positive impactadverse operating performance at our portfolio companies. In turn, this may limit attractive realization opportunities for our U.S. private equity investments. Realizations of $2.1 billion infunds. Although the quarter were driven by activity across our corporate private equity funds, Tactical Opportunities and Strategic Partners, although volatility couldFederal Reserve has signaled that it would be a factor in fewer realizations going forward. Although we and our portfolio companies are operating against a backdrop of continuing economic strength and improving fundamentals that we expect will benefit our businesses,patient with respect to near-term interest rate increases, to the extent interest rates are expected to continue to rise, throughout 2018 and will likely increase the cost of debt financing for usour real estate businesses and assets will likely increase. Rising interest rates, as well as a stronger U.S. dollar and higher inflation, would also potentially negatively impact Segment Distributable Earnings in our portfolio companies. RevenuesReal Estate segment, particularly if occurring against a backdrop of slowing economic growth. Segment Distributable

Earnings in the Private Equityour Real Estate segment would likelyalso potentially be negatively impacted if pressure on wages and other inputs and higher tariffs increasingly pressure profit margins. Revenues in our Private Equity segment would also likely be negatively impacted from rising interest rates, a stronger U.S. dollar and higher inflation, although such impact may be meaningfully mitigated if occurring against a backdrop of corresponding economic growth. See “Item“Part I. Item 1A. Risk Factors — Risks Related to Our Business — Difficult market conditions can adversely affect our business in many ways, including by reducing the value or performance of the investments made by our investment funds, making it more difficult to find opportunities for our funds to exit and realize value from existing investments and reducing the ability of our investment funds to raise or deploy capital, each of which could materially reduce our revenue, earnings and cash flow and adversely affect our financial prospects and condition.” in our Annual Report onForm10-K for the year ended December 31, 2017.2018.

Performance RevenuesFee Related Earnings

Fee Related Earnings were $636.4$136.8 million for the three months ended June 30, 2018,March 31, 2019, an increase of $438.3$14.3 million compared to $198.2$122.4 million for the three months ended June 30, 2017, driven by corporate private equity. Corporate private equity carrying value increased 9.5% in the three months ended June 30, 2018 compared to 2.8% in the three months ended June 30, 2017.

Principal Investment Income was $116.8 million for the three months ended June 30, 2018, an increase of $101.6 million compared to $15.3 million for the three months ended June 30, 2017, primarily driven by anMarch 31, 2018. The increase in the appreciation of our investment holdings.

Expenses

Expenses were $414.9 million for the three months ended June 30, 2018, an increase of $199.6 million compared to $215.3 million for the three months ended June 30, 2017. The increaseFee Related Earnings was primarily attributable to an increase of $190.1$35.9 million in Total Compensation and Benefits. The increase in Total Compensation and Benefits was primarily due toManagement Fees, Net, partially offset by an increase of $177.0$14.2 million in PerformanceFee Related Compensation. Performance Compensation increased as a result of the increase in Performance Revenues.

Six Months Ended June 30, 2018 Compared to Six Months Ended June 30, 2017

Revenues

RevenuesManagement Fees, Net were $1.7 billion$283.9 million for the sixthree months ended June 30, 2018,March 31, 2019, an increase of $655.6$35.9 million compared to $1.0 billion for the six months ended June 30, 2017. The increase in Revenues was primarily attributable to increases of $514.5 million in Performance Revenues, $84.5 million in Principal Investment Income and $22.9 million in Total Management and Advisory Fees, Net.

Performance Revenues were $1.1 billion for the six months ended June 30, 2018, an increase of $514.5 million, compared to $596.4$247.9 million for the sixthree months ended June 30, 2017, driven by corporate private equity. Corporate private equity carrying value increased 16.4% in the six months ended June 30,March 31, 2018, compared to 9.3% in the six months ended June 30, 2017.

Principal Investment Income was $140.6 million for the six months ended June 30, 2018, an increase of $84.5 million, compared to $56.0 million for the six months ended June 30, 2017. The increase was due to an increase in the appreciation of our investment holdings.

Total Management and Advisory Fees, Net were $394.8 million for the six months ended June 30, 2018, an increase of $22.9 million compared to $371.9 million for the six months ended June 30, 2017, primarily driven by an increase in Base Management Fees. Base Management Fees were $378.5$260.2 million for the sixthree months ended June 30, 2018,March 31, 2019, an increase of $24.1$33.7 million compared to $354.4$226.5 million for the sixthree months ended June 30, 2017,March 31, 2018, primarily due to the launch of the third vintage of the Tactical Opportunities program and BCP Asia.Fee-Earning Assets Under Management growth in our core+ real estate funds.

Expenses

Expenses were $767.7Fee Related Compensation was $114.8 million for the sixthree months ended June 30, 2018,March 31, 2019, an increase of $288.4$14.2 million, compared to $479.3$100.6 million for the sixthree months ended June 30, 2017.March 31, 2018. The increase was primarily attributable to an increase of $275.8 million in Total Compensation and Benefits. The increase in Total Compensation and Benefits was primarily due to increases of $246.6 million in Performance Compensation and $29.2 million in Compensation. Performance Compensation increased as a result of the increase in Performance Revenues. Compensation increased primarily due to the increase in Management and Advisory Fees, Net, on which a portion of compensationFee Related Compensation is based, as well as investmentbased.

Net Realizations

Net Realizations were $45.2 million for the three months ended March 31, 2019, a decrease of $64.6 million, compared to $109.8 million for the three months ended March 31, 2018. The decrease in initiatives.Net Realizations was primarily attributable to decreases of $74.0 million in Realized Performance Revenues and $16.8 million in Realized Principal Investment Income (Loss), partially offset by a decrease of $26.2 million in Realized Performance Compensation.

Realized Performance Revenues were $77.2 million for the three months ended March 31, 2019, a decrease of $74.0 million, compared to $151.2 million for the three months ended March 31, 2018. The decrease was due to lower realized gains in the three months ended March 31, 2019 compared to the three months ended March 31, 2018.

Realized Principal Investment Income (Loss) was $(2.1) million for the three months ended March 31, 2019, a decrease of $16.8 million, compared to $14.7 million for the three months ended March 31, 2018. The decrease was primarily due to lower Realized Principal Investment Income for BREP VI and certain BREDS liquids funds.

Realized Performance Compensation was $29.9 million for the three months ended March 31, 2019, a decrease of $26.2 million, compared to $56.1 million for the three months ended March 31, 2018. The decrease was due to the decrease in Realized Performance Revenues.

Fund Returns

Fund returnsreturn information for our significant funds is included throughout this discussion and analysis to facilitate an understanding of our results of operations for the periods presented. The fund returns information reflected in this discussion and analysis is not indicative of the financial performance of The Blackstone Group L.P. and is also not necessarily indicative of the future performance of any particular fund. An investment in The

Blackstone Group L.P. is not an investment in any of our funds. There can be no assurance that any of our funds or our other existing and future funds will achieve similar returns.

The following table presents the internal rates of return, except where noted, of our significant private equityreal estate funds:


   Three Months Ended
June 30,
  Six Months Ended
June 30,
  June 30, 2018
Inception to Date
 
   2018  2017  2018  2017  Realized  Total 

Fund (a)

  Gross  Net  Gross  Net  Gross  Net  Gross  Net  Gross  Net  Gross  Net 

BCP IV

   24  21  1  1  16  14  -1  -1  56  42  50  36

BCP V

   14  11  2  1  12  9  5  4  11  9  10  8

BCP VI

   8  7  4  3  16  13  13  11  29  23  20  15

BCP VII

   8  5  N/M   N/M   20  12  N/M   N/M   N/M   N/M   36  17

BEP I

   19  16  -2  -2  19  16  8  7  37  29  19  15

BEP II

   8  5  2  —     18  11  13  8  N/M   N/M   29  15

BCOM

   -2  -2  -17  -17  2  1  -14  -14  13  7  13  6

Tactical Opportunities

   2  2  5  4  8  6  8  14  28  26  15  12

Tactical OpportunitiesCo-Investment and Other

   8  5  6  5  12  10  10  6  N/A   N/A   20  18

Strategic PartnersI-V andCo-Investment (b)

   2  1  2  1  4  3  4  3  N/A   N/A   16  13

Strategic Partners VI


LBO, RE and SMA (b)

   6  5  3  2  12  11  8  6  N/A   N/A   26  21

Strategic Partners VII (b)

   9  8  N/M   N/M   21  18  N/M   N/M   N/A   N/A   67  54
                                                                                                
   Three Months Ended  March 31, 2019
   March 31,  Inception to Date
   2019  2018  Realized  Total

Fund / Composite (a)

  Gross  Net  Gross  Net  Gross  Net  Gross  Net

BREP IV

   -1%    -1%    1%    1%    56%    33%    22%    12% 

BREP V

   7%    6%    1%    1%    15%    12%    14%    11% 

BREP VI

   1%    1%    -1%    -1%    18%    13%    17%    13% 

BREP VII

   5%    5%    4%    3%    35%    26%    24%    17% 

BREP VIII

   3%    2%    5%    4%    37%    26%    23%    16% 

BREP International II (b)(c)

   108%    65%    5%    4%    10%    8%    9%    8% 

BREP Europe III (b)

   -    -1%    2%    1%    30%    21%    23%    15% 

BREP Europe IV (b)

   5%    4%    5%    3%    33%    24%    24%    17% 

BREP Europe V (b)

   5%    4%    7%    4%    98%    73%    27%    17% 

BREP Asia I

   5%    4%    3%    2%    29%    21%    22%    15% 

BREP Asia II

   7%    2%    N/M    N/M    N/M    N/M    N/M    N/M 

BREPCo-Investment (d)

   14%    13%    -    -1%    18%    15%    18%    15% 

BPP (e)

   3%    2%    3%    3%    N/M    N/M    13%    11% 

BREDS High-Yield (f)

   4%    3%    5%    3%    15%    11%    15%    11% 

BREDS High-Grade (f)

   2%    2%    N/M    N/M    10%    9%    8%    6% 

BREDS Liquid (g)

   6%    5%    2%    2%    N/A    N/A    11%    8% 

BXMT (h)

   N/A    10%    N/A    -    N/A    N/A    N/A    13% 

BREIT (h)

   N/A    2%    N/A    2%    N/A    N/A    12%    9% 

The returns presented herein represent those of the applicable Blackstone Funds and not those of The Blackstone Group L.P.


N/M

Not meaningful.

N/A

N/M Not meaningful.

N/A Not applicable.

(a)

Net returns are based on the change in carrying value (realized and unrealized) after management fees, expenses and carried interest allocations.Performance Revenues.

(b)

RealizationsEuro-based internal rates of return.

(c)

The 8% Realized Net IRR and 8% Total Net IRR exclude investors that opted out of the Hilton investment opportunity. Overall BREP International II Performance reflects a 7% Realized Net IRR and a 7% Total Net IRR.

(d)

Excludes fully realizedco-investments prior to Blackstone’s IPO.

(e)

BPP represents the core+ real estate funds which invest with a more modest risk profile and lower leverage. Excludes BREIT.

(f)

Effective March 31, 2019, the former BREDS Drawdown composite is being presented by its components, BREDS High-Yield and BREDS High-Grade. BREDS High-Yield represents the flagship real estate debt drawdown funds and excludes the BREDS High-Grade drawdown fund, which has a different risk-return profile. Inception to date returns are treated asfrom July 1, 2009 and July 1, 2017 for BREDS High-Yield and BREDS High-Grade, respectively. Prior periods have been updated to reflect this presentation.

(g)

BREDS Liquid represents BREDS funds that invest in liquid real estate debt securities, except funds in liquidation and insurance mandates with specific investment objectives. Effective June 30, 2018, the returns presented represent summarized asset-weighted gross and net rates of return. Inception to Date returns are presented on an annualized basis. Prior periods have been updated to reflect such rates of return.

(h)

Reflects annualized return of capital until fully recovereda shareholder invested in the REIT as of the beginning of each period presented, assuming reinvestment of all dividends received during the period, and therefore inceptionno upfront selling

commission for BREIT, net of all fees and expenses incurred by the REIT. For BXMT, return incorporates the closing NYSE stock price as of each period end, and for BREIT, return incorporates the final Class S NAV/share as of each period end. Inception to date realized returns are not applicable.

from May 22, 2013 and January 1, 2017 for BXMT and BREIT, respectively.

The corporate private equity funds within the Private Equity segment have five funds with closed investment periods: BCP IV, BCP V, BCP VI, BCOM and BEP I. As of June 30, 2018, BCP IVMarch 31, 2019, the investment period for BREP International II had expired and the fund was not above its carried interest threshold (i.e.,threshold. BREP International II Investors that opted out of the preferred return payableHilton investment opportunity are not expected to its limited partners beforeexceed the general partner is eligible to receive carried interest) and would still be above its carried interest threshold even if all remaining investments were valued at zero. BCP V is comprised of two fund classes based onin future periods. However, since gains are not earnedpro-rata, certain BREP International II investors who participated in the timings of fund closings,Hilton investment opportunity have exceeded the BCP V “main fund” andBCP V-AC fund. Within these fund classes, the general partner is subject to equalization such that (a) the general partner accrues carried interest when the respective carried interest for either fund class is positive and (b) the general partner realizes carried interest so long as clawback obligations, if any, for either of the respective fund classes are fully satisfied. During the quarter, both fund classesthreshold this quarter.

The Real Estate segment has three funds in aggregatetheir investment period, which were above their respective carried interest thresholds. BCP VI is currently above its carried interest threshold. BCOM is currently above its carried interest thresholdthresholds as of March 31, 2019: BREP VIII, BREP Europe V and has generated inception to date positive returns. We are entitled to retain previously realized carried interest up to 20% of BCOM’s net gains. As a result, Performance Revenues are recognized from BCOM on current period gains and losses. BEP I is currently above its carried interest threshold.

BREDS III.

Real Estate

The following table presents the results of operations for our Real Estate segment:


  Three Months Ended
June 30,
  2018 vs. 2017  Six Months Ended
June 30,
  2018 vs. 2017 
  2018  2017  $  %  2018  2017  $  % 
  (Dollars in Thousands) 

Revenues


Management Fees, Net


Base Management Fees

 $249,680  $227,865  $21,815   10 $476,206  $425,744  $50,462   12

Transaction and Other Fees, Net

  23,859   16,087   7,772   48  46,947   37,366   9,581   26

Management Fee Offsets

  (3,785  (5,018  1,233   -25  (5,453  (8,568  3,115   -36


Total Management Fees, Net

  269,754   238,934   30,820   13  517,700   454,542   63,158   14


Performance Revenues


Realized Incentive Fees

  11,394   4,878   6,516   134  15,769   7,760   8,009   103

Realized Performance Allocations

  351,630   389,441   (37,811  -10  502,939   909,314   (406,375  -45

Unrealized Performance Allocations

  (160,578  89,688   (250,266  N/M   65,864   81,642   (15,778  -19


Total Performance Revenues

  202,446   484,007   (281,561  -58  584,572   998,716   (414,144  -41


Principal Investment Income (Loss)


Realized

  50,199   57,599   (7,400  -13  64,889   177,178   (112,289  -63

Unrealized

  (28,044  (20,519  (7,525  37  (25,357  (104,372  79,015   -76


Total Principal Investment Income

  22,155   37,080   (14,925  -40  39,532   72,806   (33,274  -46

Interest and Dividend Revenue

  14,494   14,493   1   0  29,622   26,587   3,035   11

Other

  30,457   (22,965  53,422   N/M   8,960   (26,115  35,075   N/M 


Total Revenues

  539,306   751,549   (212,243  -28  1,180,386   1,526,536   (346,150  -23


Expenses


Compensation

  109,599   110,266   (667  -1  222,423   212,968   9,455   4

Performance Compensation


Realized Incentive Fees

  5,820   2,711   3,109   115  8,030   4,044   3,986   99

Realized Performance Allocations

  109,233   124,512   (15,279  -12  163,416   304,468   (141,052  -46

Unrealized Performance Allocations

  (51,370  64,254   (115,624  N/M   27,800   82,046   (54,246  -66


Total Compensation and Benefits

  173,282   301,743   (128,461  -43  421,669   603,526   (181,857  -30

Interest Expense

  11,389   14,787   (3,398  -23  25,538   29,422   (3,884  -13

Other Operating Expenses

  36,026   33,379   2,647   8  65,443   64,243   1,200   2


Total Expenses

  220,697   349,909   (129,212  -37  512,650   697,191   (184,541  -26


Economic Income

 $318,609  $401,640  $(83,031  -21 $667,736  $829,345  $(161,609  -19


   Three Months Ended    
   March 31, 2019 vs. 2018
   2019 2018 $ %
   (Dollars in Thousands)

Management Fees, Net


Base Management Fees

   $260,245   $226,526   $33,719   15

Transaction and Other Fees, Net

   23,911   23,088   823   4

Management Fee Offsets

   (280  (1,668  1,388   -83


Total Management Fees, Net

   283,876   247,946   35,930   14

Fee Related Performance Revenues

   6,676   4,503   2,173   48

Fee Related Compensation

   (114,816  (100,610  (14,206  14

Other Operating Expenses

   (38,986  (29,417  (9,569  33


Fee Related Earnings

   136,750   122,422   14,328   12


Realized Performance Revenues

   77,182   151,181   (73,999  -49

Realized Performance Compensation

   (29,900  (56,115  26,215   -47

Realized Principal Investment Income (Loss)

   (2,131  14,690   (16,821  N/


Net Realizations

   45,151   109,756   (64,605  -59


Segment Distributable Earnings

   $181,901   $232,178   $(50,277  -22


N/M      Not meaningful.

Three Months Ended June 30, 2018March 31, 2019 Compared to Three Months Ended June 30, 2017March 31, 2018

Revenues

RevenuesSegment Distributable Earnings were $539.3$181.9 million for the three months ended June 30, 2018,March 31, 2019, a decrease of $212.2$50.3 million compared to $751.5$232.2 million for the three months ended June 30, 2017.March 31, 2018. The decrease in RevenuesSegment Distributable Earnings was primarily attributable to decreasesa decrease of $281.6$64.6 million in Performance Revenues and $14.9 million in Principal Investment Income,Net Realizations, partially offset by increases $53.4an increase of $14.3 million in Other Revenue and $30.8 million in Total Management Fees, Net.Fee Related Earnings.

RevenuesSegment Distributable Earnings in our Real Estate segment in the secondfirst quarter of 20182019 were lower compared to the second quarter of 2017, primarily driven by lower Performance Revenues resulting from lower appreciation in our real estate opportunistic funds compared to the first quarter of 2017.2018, primarily driven by lower realizations following a volatile fourth quarter, which was characterized by growing macroeconomic and geopolitical concerns, such as concerns over U.S. Federal Reserve policy, Brexit, the “trade war” with China and the rate of global growth. The stock market subsequently experienced a rally in the first quarter of 2019 in light of greater optimism around these concerns but the decline in the fourth quarter of 2018 still resulted in a lag in realizations. Although our Real Estate funds had $3.1 billion of realizations in the first quarter of 2019, future periods of volatility could similarly contribute to a more challenging environment for realizations going forward. Overall, operating trends in our Real Estate portfolio remain stable and supply-demand fundamentals remain positive in most markets, although we see decelerating growth in certain sectors, notably retail. Asincluding retail, may contribute to a result of less distress and rising asset values compared to prior yearsmore challenging environment for our portfolio companies. Capital deployment in opportunistic investments in the United States the opportunistic investment environment continues to be challenging.challenging, as distress levels are low and asset values are relatively high. Nonetheless, our Real Estate funds deployed $4.6 billion andor committed an additional $6.0aggregate of $4.4 billion of capital in the first quarter includingof 2019, with meaningful investment activity outside of North America and in six large public company transactions. Volatility could be a factor in fewer realizations going forward, although our Real Estate funds had $4.3 billion of realizationsstabilized income-generating properties in the second quarter. Overall, we believe U.S. tax reform will haveIn the event global markets enter a neutralperiod of slower growth relative to slightly positive impactrecent years, periods of difficult market conditions or economic slowdown (which may be across industries, sectors or geographies) may contribute to adverse operating performance at our portfolio companies. In turn, this may limit attractive realization opportunities for our real estate investments.funds. Although we are operating against a backdrop of continuing economic strength and improving fundamentalsthe Federal Reserve has signaled that we expect will benefit our businesses,it would be patient with respect to near-term interest rate increases, to the extent interest rates are expected to continue to rise, throughout 2018 and will likely increase the cost of debt financing for our real estate businesses and assets. Revenuesassets will likely increase. Rising interest rates, as well as a stronger U.S. dollar and higher inflation, would also potentially negatively impact Segment Distributable Earnings in our Real Estate segment, particularly if occurring against a backdrop of slowing economic growth. Segment Distributable

Earnings in our Real Estate segment would likelyalso potentially be negatively impacted if pressure on wages and other inputs increasingly pressure profit margins. Revenues in our Real Estate segment would also likely be negatively impacted from rising interest rates, a stronger U.S. dollar and higher inflation, although such impact may be meaningfully mitigated if occurring against a backdrop of economic strength and improving fundamentals. See “Item“Part I. Item 1A. Risk Factors — Risks Related to Our Business — Difficult market conditions can adversely affect our business in many ways, including by reducing the value or performance of the investments made by our investment funds, making it more difficult to find opportunities for our funds to exit and realize value from existing investments and reducing the ability of our investment funds to raise or deploy capital, each of which could materially reduce our revenue, earnings and cash flow and adversely affect our financial prospects and condition.” in our Annual Report onForm10-K for the year ended December 31, 2017.2018.

Performance RevenuesFee Related Earnings

Fee Related Earnings were $202.4$136.8 million for the three months ended June 30, 2018, a decreaseMarch 31, 2019, an increase of $281.6$14.3 million compared to $484.0$122.4 million for the three months ended June 30, 2017.March 31, 2018. The decreaseincrease in Performance RevenuesFee Related Earnings was dueprimarily attributable to lower net appreciationan increase of investment holdings$35.9 million in our BREP opportunistic funds compared to the comparable quarterManagement Fees, Net, partially offset by an increase of $14.2 million in 2017. For the three months ended June 30, 2018, the carrying value of investments for our BREP opportunistic funds increased 2.7% compared to 5.4% in the comparable 2017 quarter.Fee Related Compensation.

Principal Investment Income was $22.2Management Fees, Net were $283.9 million for the three months ended June 30, 2018, a decreaseMarch 31, 2019, an increase of $14.9$35.9 million compared to $37.1$247.9 million for the three months ended June 30, 2017. The decrease in Principal Investment Income was primarily due to lower net appreciation of the Partnership’s principal investments.

Other Revenue was $30.5 million for the three months ended June 30,March 31, 2018, and increase of $53.4 million compared to $(23.0) million for the three months ended June 30, 2017, primarily due to foreign exchange gain on our euro denominated bonds.

Total Management Fees, Net were $269.8 million for the three months ended June 30, 2018, an increase of $30.8 million compared to $238.9 million for the three months ended June 30, 2017, driven primarily by an increase in Base Management Fees. Base Management Fees were $249.7 million for the three months ended June 30, 2018, an increase of $21.8 million compared to $227.9 million for the three months ended June 30, 2017, primarily due to AUM growth in our core+ real estate funds and the launch of BREP Asia II in the fourth quarter of 2017.

Expenses

Expenses were $220.7 million for the three months ended June 30, 2018, a decrease of $129.2 million compared to $349.9 million for the three months ended June 30, 2017. The decrease was primarily attributable to a decrease in Performance Compensation of $127.8 million. Performance Compensation decreased as a result of the decrease in Performance Revenues.

Six Months Ended June 30, 2018 Compared to Six Months Ended June 30, 2017

Revenues

Revenues were $1.2 billion for the six months ended June 30, 2018, a decrease of $346.2 million compared to $1.5 billion for the six months ended June 30, 2017. The decrease in Revenues was primarily attributable to decreases of $414.1 million in Performance Revenues and $33.3 million in Principal Investment Income, partially offset by an increase of $63.2 million in Total Management Fees, Net.

Performance Revenues were $584.6 million for the six months ended June 30, 2018, a decrease of $414.1 million compared to $998.7 million for the six months ended June 30, 2017. Performance Revenues decreased due to the lower net appreciation of investment holdings in our BREP opportunistic funds compared to the comparable quarter in 2017. For the six months ended June 30, 2018, the carrying value of investments for our BREP opportunistic funds increased 6.0% compared to 10.5% for the comparable 2017 period.

Principal Investment Income was $39.5 million for the six months ended June 30, 2018, a decrease of $33.3 million compared to $72.8 million for the six months ended June 30, 2017, primarily due to lower net appreciation of the Partnership’s principal investments.

Total Management Fees, Net were $517.7 million for the six months ended June 30, 2018, an increase of $63.2 million compared to $454.5 million for the six months ended June 30, 2017, primarily driven by an increase in Base Management Fees. Base Management Fees were $476.2$260.2 million for the sixthree months ended June 30, 2018,March 31, 2019, an increase of $50.5$33.7 million compared to $425.7$226.5 million for the sixthree months ended June 30, 2017,March 31, 2018, primarily due toFee-Earning Assets Under Management growth in our core+ real estate funds, the launch of BREP Europe V in the fourth quarter of 2016 (and the corresponding expiration of its fee holiday in the second quarter of 2017) and the launch of BREP Asia II in the fourth quarter of 2017.funds.

The Annualized Base Management Fee Rate decreased from 1.24% at June 30, 2017 to 1.12% at June 30, 2018. The decreaseRelated Compensation was principally due growth in several core+ funds, some of which include Base Management Fee holidays.

Expenses

Expenses were $512.7$114.8 million for the sixthree months ended June 30, 2018, a decreaseMarch 31, 2019, an increase of $184.5$14.2 million, compared to $697.2$100.6 million for the sixthree months ended June 30, 2017.March 31, 2018. The decrease was primarily attributable to a decrease of $181.9 million in Total Compensation and Benefits. The decrease in Total Compensation and Benefits was attributable to a decrease of $191.3 million in Performance Compensation, partially offset by an increase of $9.5 million in Compensation. Performance Compensation decreased as a result of the decrease in Performance Revenues. The increase in Compensation was primarily due to the increase in Total Management Fees, Net, on which a portion of compensationFee Related Compensation is based.

Net Realizations

Net Realizations were $45.2 million for the three months ended March 31, 2019, a decrease of $64.6 million, compared to $109.8 million for the three months ended March 31, 2018. The decrease in Net Realizations was primarily attributable to decreases of $74.0 million in Realized Performance Revenues and $16.8 million in Realized Principal Investment Income (Loss), partially offset by a decrease of $26.2 million in Realized Performance Compensation.

Realized Performance Revenues were $77.2 million for the three months ended March 31, 2019, a decrease of $74.0 million, compared to $151.2 million for the three months ended March 31, 2018. The decrease was due to lower realized gains in the three months ended March 31, 2019 compared to the three months ended March 31, 2018.

Realized Principal Investment Income (Loss) was $(2.1) million for the three months ended March 31, 2019, a decrease of $16.8 million, compared to $14.7 million for the three months ended March 31, 2018. The decrease was primarily due to lower Realized Principal Investment Income for BREP VI and certain BREDS liquids funds.

Realized Performance Compensation was $29.9 million for the three months ended March 31, 2019, a decrease of $26.2 million, compared to $56.1 million for the three months ended March 31, 2018. The decrease was due to the decrease in Realized Performance Revenues.

Fund Returns

Fund return information for our significant funds is included throughout this discussion and analysis to facilitate an understanding of our results of operations for the periods presented. The fund returns information reflected in this discussion and analysis is not indicative of the financial performance of The Blackstone Group L.P.

and is also not necessarily indicative of the future performance of any particular fund. An investment in The

Blackstone Group L.P. is not an investment in any of our funds. There can be no assurance that any of our funds or our other existing and future funds will achieve similar returns.

The following table presents the internal rates of return, except where noted, of our significant real estate funds:


 Three Months Ended
June 30,
 Six Months Ended
June 30,
 June 30, 2018
Inception to Date
   Three Months Ended  March 31, 2019
 2018 2017 2018 2017 Realized Total   March 31,  Inception to Date

Fund (a)

 Gross Net Gross Net Gross Net Gross Net Gross Net Gross Net 
  2019  2018  Realized  Total

Fund / Composite (a)

  Gross  Net  Gross  Net  Gross  Net  Gross  Net

BREP IV

  7  5  3  2  8  6  1  1  58  35  22  12   -1%    -1%    1%    1%    56%    33%    22%    12% 

BREP V

  5  5  3  2  6  5  4  3  15  12  14  11   7%    6%    1%    1%    15%    12%    14%    11% 

BREP VI

  2  1  9  7  1  1  11  9  18  14  17  13   1%    1%    -1%    -1%    18%    13%    17%    13% 

BREP VII

  1  1  3  2  5  4  7  6  40  29  25  18   5%    5%    4%    3%    35%    26%    24%    17% 

BREP VIII

  4  3  6  5  9  6  13  9  41  27  26  17   3%    2%    5%    4%    37%    26%    23%    16% 

BREP International II (b)(c)

  9  8  12  11  14  12  7  6  12  10  9  8   108%    65%    5%    4%    10%    8%    9%    8% 

BREP Europe III (b)

  -1  -1  6  5  1  —     14  11  31  21  24  16   -    -1%    2%    1%    30%    21%    23%    15% 

BREP Europe IV (b)

  6  5  8  7  11  9  22  18  35  25  25  18   5%    4%    5%    3%    33%    24%    24%    17% 

BREP Europe V (b)

  6  4  N/M   N/M   12  8  N/M   N/M   N/M   N/M   34  19   5%    4%    7%    4%    98%    73%    27%    17% 

BREP Asia I

  1  —     8  6  4  3  15  11  32  23  23  16   5%    4%    3%    2%    29%    21%    22%    15% 

BREP Asia II

  N/M   N/M   N/A   N/A   N/M   N/M   N/A   N/A   N/M   N/M   N/M   N/M    7%    2%    N/M    N/M    N/M    N/M    N/M    N/M 

BREPCo-Investment (d)

  4  3  6  5  3  2  8  7  18  16  18  16   14%    13%    -    -1%    18%    15%    18%    15% 

BPP (e)

  2  2  3  3  6  5  6  5  N/M   N/M   14  12   3%    2%    3%    3%    N/M    N/M    13%    11% 

BREDS Drawdown

  1  —     3  3  5  4  8  6  16  12  15  11

BREDS Liquid (f)

  3  2  4  3  5  4  7  6  N/A   N/A   11  8

BREDS High-Yield (f)

   4%    3%    5%    3%    15%    11%    15%    11% 

BREDS High-Grade (f)

   2%    2%    N/M    N/M    10%    9%    8%    6% 

BREDS Liquid (g)

   6%    5%    2%    2%    N/A    N/A    11%    8% 

BXMT (h)

   N/A    10%    N/A    -    N/A    N/A    N/A    13% 

BREIT (h)

   N/A    2%    N/A    2%    N/A    N/A    12%    9% 

The returns presented herein represent those of the applicable Blackstone Funds and not those of The Blackstone Group L.P.


N/M

Not meaningful.

N/A

N/M Not meaningful.

N/A Not applicable.

(a)

Net returns are based on the change in carrying value (realized and unrealized) after management fees, expenses and performance revenues.Performance Revenues.

(b)

Euro-based internal rates of return.

(c)

The 10%8% Realized Net IRR and 8% Total Net IRR exclude investors that opted out of the Hilton investment opportunity. Overall BREP International II Performance reflects a 9%7% Realized Net IRR and a 6%7% Total Net IRR.

(d)

Excludes fully realizedco-investments prior to Blackstone’s IPO.

(e)

BPP represents the core+ real estate funds which invest with a more modest risk profile and lower leverage. Excludes BREIT.

(f)

Effective March 31, 2019, the former BREDS Drawdown composite is being presented by its components, BREDS High-Yield and BREDS High-Grade. BREDS High-Yield represents the flagship real estate debt drawdown funds and excludes the BREDS High-Grade drawdown fund, which has a different risk-return profile. Inception to date returns are from July 1, 2009 and July 1, 2017 for BREDS High-Yield and BREDS High-Grade, respectively. Prior periods have been updated to reflect this presentation.

(g)

BREDS Liquid represents BREDS funds that invest in liquid real estate debt securities, except funds in liquidation and insurance mandates with specific investment objectives. Effective June 30, 2018, the returns presented represent summarized asset-weighted gross and net rates of return. Inception to Date returns are presented on an annualized basis. Prior periods have been updated to reflect such rates of return.

(h)

Reflects annualized return of a shareholder invested in the REIT as of the beginning of each period presented, assuming reinvestment of all dividends received during the period, and no upfront selling

commission for BREIT, net of all fees and expenses incurred by the REIT. For BXMT, return incorporates the closing NYSE stock price as of each period end, and for BREIT, return incorporates the final Class S NAV/share as of each period end. Inception to date returns are from May 22, 2013 and January 1, 2017 for BXMT and BREIT, respectively.

The following table presentsAs of March 31, 2019, the investment period for BREP International II had expired and the fund was not above its carried interest threshold. BREP International II Investors that opted out of the Hilton investment opportunity are not expected to exceed the carried interest status of our real estate carry funds with expiredthreshold in future periods. However, since gains are not earnedpro-rata, certain BREP International II investors who participated in the Hilton investment periods which are currently not generating performance revenues as of June 30, 2018:opportunity have exceeded the carried interest threshold this quarter.

   Gain to Cross Carried Interest Threshold (a) 

Fully Invested Funds

  Amount   % Change in
Total Enterprise
Value (b)
  % Change in
Equity Value
 
   (Amounts in Millions)        

BREP International II (Sep 2005 / Jun 2008)

  869    154  656

(a)

The general partner of each fund is allocated carried interest when the annualized returns, net of management fees and expenses, exceed the preferred return as dictated by the fund agreements. The preferred return is calculated for each limited partner individually. The Gain to Cross Carried Interest Threshold represents the increase in equity at the fund level (excluding ourside-by-side investments) that is required for the general partner to begin accruing carried interest, assuming the gain is earnedpro-rata across the fund’s investments and is achieved at the reporting date. However, since gains are not earnedpro-rata, it is possible that certain investors may exceed the carried interest threshold with smaller percentage increases in Equity Value.

(b)

Total Enterprise Value is the respective fund’spro-rata ownership of the privately held portfolio companies’ Enterprise Value.

The Real Estate segment has three funds in their investment period, which were above their respective carried interest thresholds as of June 30, 2018:March 31, 2019: BREP VIII, BREP Europe V and BREDS III.

Private Equity

The following table presents the results of operations for our Private Equity segment:

                                                                        
   Three Months Ended    
   March 31, 2019 vs. 2018
   2019 2018 $ %
   (Dollars in Thousands)

Management and Advisory Fees, Net


Base Management Fees

   $219,417   $182,961   $36,456   20

Transaction, Advisory and Other Fees, Net

   37,291   11,094   26,197   236

Management Fee Offsets

   (4,985  (3,193  (1,792  56


Total Management and Advisory Fees, Net

   251,723   190,862   60,861   32

Fee Related Compensation

   (107,587  (89,566  (18,021  20

Other Operating Expenses

   (34,201  (31,151  (3,050  10


Fee Related Earnings

   109,935   70,145   39,790   57


Realized Performance Revenues

   156,599   77,123   79,476   103

Realized Performance Compensation

   (50,556  (33,045  (17,511  53

Realized Principal Investment Income

   25,139   6,338   18,801   297


Net Realizations

   131,182   50,416   80,766   160


Segment Distributable Earnings

   $241,117   $120,561   $120,556   100


N/M

Not meaningful.

Three Months Ended March 31, 2019 Compared to Three Months Ended March 31, 2018

Segment Distributable Earnings were $241.1 million for the three months ended March 31, 2019, an increase of $120.6 million compared to $120.6 million for the three months ended March 31, 2018. The increase in Segment Distributable Earnings was primarily attributable to increases of $39.8 million in Fee Related Earnings and $80.8 million in Net Realizations.

Segment Distributable Earnings in our Private Equity segment in the first quarter of 2019 were higher compared to the first quarter of 2018, primarily driven by corporate private equity realizations as well as an increase inFee-Earning Assets Under Management, particularly in Strategic Partners and BIP. The volatility in the fourth quarter of 2018 was fueled by macroeconomic and geopolitical concerns, such as concerns over U.S. Federal Reserve policy, Brexit, the “trade war” with China and the rate of global growth. These concerns subsided amid greater optimism in the first quarter of 2019 and the stock market experienced a rally. Although our Private Equity segment had $3.7 billion of realizations in the first quarter of 2019, future periods of volatility could contribute to a more challenging environment for realizations going forward. The market environment continues to be generally characterized by high prices, and this can make deployment of capital more difficult. Nonetheless, we deployed or

committed an aggregate of $10.7 billion of capital across the segment in the first quarter of 2019. Decelerating growth in certain sectors may contribute to a more challenging environment for our portfolio companies. In the event global markets enter a period of slower growth relative to recent years, periods of difficult market conditions or economic slowdown (which may be across industries, sectors or geographies) may contribute to adverse operating performance at our portfolio companies. In turn, this may limit attractive realization opportunities for our funds. Although the Federal Reserve has signaled that it would be patient with respect to near-term interest rate increases, to the extent interest rates rise, the cost of debt financing for us and our portfolio companies will likely increase. Rising interest rates, as well as a stronger U.S. dollar and higher inflation, would also potentially negatively impact Segment Distributable Earnings in our Private Equity segment, particularly if occurring against a backdrop of slowing economic growth. Segment Distributable Earnings in the Private Equity segment would also potentially be negatively impacted if pressure on wages and other inputs and higher tariffs increasingly pressure profit margins. See “Part I. Item 1A. Risk Factors — Risks Related to Our Business — Difficult market conditions can adversely affect our business in many ways, including by reducing the value or performance of the investments made by our investment funds, making it more difficult to find opportunities for our funds to exit and realize value from existing investments and reducing the ability of our investment funds to raise or deploy capital, each of which could materially reduce our revenue, earnings and cash flow and adversely affect our financial prospects and condition.” in our Annual Report on Form10-K for the year ended December 31, 2018.

Fee Related Earnings

Fee Related Earnings were $109.9 million for the three months ended March 31, 2019, an increase of $39.8 million, compared to $70.1 million for the three months ended March 31, 2018. The increase in Fee Related Earnings was primarily attributable to an increase of $60.9 million in Management and Advisory Fees, Net, partially offset by an increase of $18.0 million in Fee Related Compensation.

Management and Advisory Fees, Net were $251.7 million for the three months ended March 31, 2019, an increase of $60.9 million compared to $190.9 million for the three months ended March 31, 2018, primarily driven by increases in Base Management Fees and Transaction, Advisory and Other Fees, Net. Base Management Fees were $219.4 million for the three months ended March 31, 2019, an increase of $36.5 million compared to $183.0 million for the three months ended March 31, 2018, primarily due to the increase inFee-Earning Assets Under Management across the segment. Transaction, Advisory and Other Fees, Net were $37.3 million for the three months ended March 31, 2019, an increase of $26.2 million compared to $11.1 million for the three months ended March 31, 2018, primarily due to BIP investment activity.

Fee Related Compensation was $107.6 million for the three months ended March 31, 2019, an increase of $18.0 million, compared to $89.6 million for the three months ended March 31, 2018. The increase was primarily due to the increase in Management and Advisory Fees, Net, on which a portion of Fee Related Compensation is based.    

Net Realizations

Net Realizations were $131.2 million for the three months ended March 31, 2019, an increase of $80.8 million, compared to $50.4 million for the three months ended March 31, 2018. The increase in Net Realizations was primarily attributable to increases of $79.5 million in Realized Performance Revenues and $18.8 million in Realized Principal Investment Income, partially offset by an increase of $17.5 million in Realized Performance Compensation.

Realized Performance Revenues were $156.6 million for the three months ended March 31, 2019, an increase of $79.5 million, compared to $77.1 million for the three months ended March 31, 2018. The increase was primarily due to increased realizations in BCP IV and BCP VI.

Realized Principal Investment Income was $25.1 million for the three months ended March 31, 2019, an increase of $18.8 million, compared to $6.3 million for the three months ended March 31, 2018. The increase was primarily due to a realization on one of Blackstone’s balance sheet investments.

Realized Performance Compensation was $50.6 million for the three months ended March 31, 2019, an increase of $17.5 million, compared to $33.0 million for the three months ended March 31, 2018. The increase was due to the increase in Realized Performance Revenues.

Fund Returns

Fund returns information for our significant funds is included throughout this discussion and analysis to facilitate an understanding of our results of operations for the periods presented. The fund returns information reflected in this discussion and analysis is not indicative of the financial performance of The Blackstone Group L.P. and is also not necessarily indicative of the future performance of any particular fund. An investment in The Blackstone Group L.P. is not an investment in any of our funds. There can be no assurance that any of our funds or our other existing and future funds will achieve similar returns.

The following table presents the internal rates of return of our significant private equity funds:

                                                                                                
   Three Months Ended  March 31, 2019
   March 31,  Inception to Date
   2019  2018  Realized  Total

Fund (a)

  Gross  Net  Gross  Net  Gross  Net  Gross  Net

BCP IV

   33%    24%    -7%    -6%    50%    37%    50%    36% 

BCP V

   -    1%    -1%    -1%    11%    8%    10%    8% 

BCP VI

   6%    5%    8%    7%    27%    21%    19%    14% 

BCP VII

   4%    2%    11%    7%    62%    35%    34%    19% 

BEP I

   11%    9%    -    -    31%    26%    18%    14% 

BEP II

   -    -    9%    6%    59%    45%    24%    13% 

BCOM

   -9%    -9%    3%    3%    13%    7%    13%    6% 

Tactical Opportunities

   4%    3%    5%    4%    26%    21%    15%    11% 

Tactical OpportunitiesCo-Investment and Other

   1%    1%    6%    6%    27%    25%    16%    14% 

Strategic PartnersI-V (b)

   1%    -    2%    2%    N/A    N/A    16%    13% 

Strategic Partners VI (b)

   2%    2%    6%    5%    N/A    N/A    24%    19% 

Strategic Partners VII (b)

   7%    5%    11%    9%    N/A    N/A    44%    35% 

Strategic Partners RA II (b)

   5%    4%    N/M    N/M    N/A    N/A    25%    18% 

Strategic Partners RE, SMA and Other (b)

   3%    3%    6%    6%    N/A    N/A    21%    17% 

The returns presented herein represent those of the applicable Blackstone Funds and not those of The Blackstone Group L.P.

N/M

Not meaningful.

N/A

Not applicable.

(a)

Net returns are based on the change in carrying value (realized and unrealized) after management fees, expenses and Performance Revenues.

(b)

Realizations are treated as return of capital until fully recovered and therefore inception to date realized returns are not applicable. Returns are calculated from results that are reported on a three month lag.

The corporate private equity funds within the Private Equity segment have five funds with closed investment periods: BCP IV, BCP V, BCP VI, BCOM and BEP I. As of March 31, 2019, BCP IV was above its carried interest threshold (i.e., the preferred return payable to its limited partners before the general partner is eligible to receive carried interest) and would still be above its carried interest threshold even if all remaining investments were valued at zero. BCP V is comprised of two fund classes based on the timings of fund closings, the BCP V “main fund” andBCP V-AC fund. Within these fund classes, the general partner is subject to equalization such that (a) the general partner accrues carried interest when the respective carried interest for either fund class is positive and (b) the general partner realizes carried interest so long as clawback obligations, if any, for either of the respective fund classes are fully satisfied. During the quarter, BCP V is currently below its carried interest threshold, while BCP

V-AC is above its carried interest threshold. BCP VI is currently above its carried interest threshold. BCOM is currently above its carried interest threshold. We are entitled to retain previously realized carried interest up to 20% of BCOM’s net gains. As a result, Performance Revenues are recognized from BCOM on current period gains and losses. BEP I is currently above its carried interest threshold.

Hedge Fund Solutions

The following table presents the results of operations for our Hedge Fund Solutions segment:


  Three Months Ended
June 30,
  2018 vs. 2017  Six Months Ended
June 30,
  2018 vs. 2017 
  2018  2017  $  %  2018  2017  $  % 
  (Dollars in Thousands) 

Revenues


Management Fees, Net


Base Management Fees

 $129,553  $128,698  $855   1 $258,781  $257,166  $1,615   1

Transaction and Other Fees, Net

  812   1,696   (884  -52  1,157   1,955   (798  -41


Total Management Fees, Net

  130,365   130,394   (29  -0  259,938   259,121   817   0


Performance Revenues


Realized Incentive Fees

  6,887   6,548   339   5  15,058   20,635   (5,577  -27

Realized Performance Allocations

  383   447   (64  -14  2,389   1,044   1,345   129

Unrealized Performance Allocations

  9,930   14,849   (4,919  -33  14,991   33,664   (18,673  -55


Total Performance Revenues

  17,200   21,844   (4,644  -21  32,438   55,343   (22,905  -41


Principal Investment Income (Loss)


Realized

  7,766   225   7,541   N/M   8,406   (407  8,813   N/M 

Unrealized

  (4,841  11,578   (16,419  N/M   (4,401  29,871   (34,272  N/M 


Total Principal Investment Income

  2,925   11,803   (8,878  -75  4,005   29,464   (25,459  -86

Interest and Dividend Revenue

  5,152   4,674   478   10  9,964   8,671   1,293   15

Other

  17,619   (10,720  28,339   N/M   7,331   (12,330  19,661   N/M 


Total Revenues

  173,261   157,995   15,266   10  313,676   340,269   (26,593  -8


Expenses


Compensation

  48,086   47,361   725   2  98,386   94,965   3,421   4

Performance Compensation


Realized Incentive Fees

  4,155   4,097   58   1  8,189   11,111   (2,922  -26

Realized Performance Allocations

  937   265   672   254  3,352   568   2,784   490

Unrealized Performance Allocations

  2,772   5,968   (3,196  -54  4,958   12,390   (7,432  -60


Total Compensation and Benefits

  55,950   57,691   (1,741  -3  114,885   119,034   (4,149  -3

Interest Expense

  5,900   6,688   (788  -12  12,171   13,231   (1,060  -8

Other Operating Expenses

  18,494   16,318   2,176   13  37,279   32,697   4,582   14


Total Expenses

  80,344   80,697   (353  -0  164,335   164,962   (627  -0


Economic Income

 $92,917  $77,298  $15,619   20 $149,341  $175,307  $(25,966  -15


   Three Months Ended    
   March 31, 2019 vs. 2018
   2019 2018 $ %
   (Dollars in Thousands)

Management Fees, Net


Base Management Fees

   $137,328   $      129,228   $8,100   6% 

Transaction and Other Fees, Net

   318   345   (27       -8% 


Total Management Fees, Net

   137,646   129,573   8,073   6% 

Fee Related Compensation

   (42,954  (39,639        (3,315  8% 

Other Operating Expenses

         (17,885  (18,785  900   -5% 


Fee Related Earnings

   76,807   71,149   5,658   8% 


Realized Performance Revenues

   4,091   10,177   (6,086  -60% 

Realized Performance Compensation

   (1,413  (2,923  1,510   -52% 

Realized Principal Investment Income (Loss)

   (283  640   (923  N/M 


Net Realizations

   2,395   7,894   (5,499  -70% 


Segment Distributable Earnings

   $79,202   $79,043   $159   0% 


N/M

Not meaningful.

N/M Not meaningful.

Three Months Ended June 30, 2018March 31, 2019 Compared to Three Months Ended June 30, 2017March 31, 2018

Revenues

RevenuesSegment Distributable Earnings were $173.3$79.2 million for the three months ended June 30, 2018,March 31, 2019, an increase of $15.3$0.2 million compared to $158.0$79.0 million for the three months ended June 30, 2017.March 31, 2018. The increase in RevenuesSegment Distributable Earnings was primarily attributable to an increase of $28.3$5.7 million in Other Revenue,Fee Related Earnings, partially offset by a decrease of $8.9$5.5 million in Principal Investment Income.

Net Realizations.

RevenuesSegment Distributable Earnings in our Hedge Fund Solutions segment in the secondfirst quarter of 2018 increased2019 were modestly higher compared to the secondfirst quarter of 20172018. This increase was primarily driven by an increase in Other Revenue largely due to foreign exchange gainFee Related Earnings as a result of a reduction in Blackstone’s euro denominated bonds. Although we are operating againstplacement fees that was, however, somewhat offset by a backdropdecrease in Net Realizations as a result of continuing economic strength and improving fundamentals that we expect will benefit our businesses, interest rates are expected to rise throughoutcertain funds entering 2019 with loss carryforward balances following a volatile fourth quarter of 2018 and will likely increase our cost of debt financing.for capital markets. Segment Distributable Earnings in the Hedge Fund Solutions revenuessegment would likely be negatively impacted if we failed to anticipatein the event of a significant or sustained decline in global, regional or sector asset prices, deterioration of global market conditions, deteriorated, or withdrawal of assets by investors as a result of liquidity needs, performance or other reasonsreasons. In addition, Segment Distributable Earnings in our Hedge Fund Solutions segment may be negatively impacted by a prolonged weak equity market environment, which may be caused investors to withdraw assets.by concerns over macroeconomic and geopolitical factors such as a rise in interest rate and concerns over Brexit, the “trade war” with China and the rate of global growth. See “Item“Part I. Item 1A. Risk Factors — Risks Related to Our Business — Difficult market conditions can adversely affect our business in many ways, including by reducing the value or performance of the investments made by our investment funds, making it more difficult to find opportunities for our funds to exit and realize value from existing investments and reducing the ability of our investment funds to raise or deploy capital, each of which could materially reduce our revenue, earnings and cash flow and adversely affect our financial prospects and condition” and “— Hedge fund investments are subject to numerous additional risks.” in our Annual Report on Form10-K for the year ended December 31, 2017.2018. The segment operates multiple business lines, manages strategies that are both long and short asset classes and

generates a majority of its revenue through management fees, all of which we believe may provide a level of downside protection to Hedge Fund Solutions revenues.Segment Distributable Earnings. Over time we anticipate an increasing change in the mix of our product offerings to products whose performance-basedperformance based fees represent a more significant proportion of the fees than has historically been the case for such products.

Other Revenue was $17.6Fee Related Earnings

Fee Related Earnings were $76.8 million for the three months ended June 30, 2018,March 31, 2019, an increase of $28.3$5.7 million, compared to $(10.7)$71.1 million for the three months ended June 30, 2017.March 31, 2018. The increase in Fee Related Earnings was primarily attributable to an increase of $8.1 million in Management Fees, Net, partially offset by an increase $3.3 million in Fee Related Compensation.

Management Fees, Net were $137.6 million for the three months ended March 31, 2019, an increase of $8.1 million, compared to $129.6 million for the three months ended March 31, 2018. The increase was primarily due to foreign exchange gainan increase in Base Management Fees. Base Management Fees were $137.3 million for the three months ended March 31, 2019, an increase of $8.1 million, compared to $129.2 million for the three months ended March 31, 2018, primarily due to a reduction in placement fees, which offset Base Management Fees.

Fee Related Compensation was $42.9 million for the three months ended March 31, 2019, an increase of $3.3 million, compared to $39.6 million for the three months ended March 31, 2018. The increase was primarily due to the increase in Management Fees, Net, on our euro denominated bonds.which a portion of Fee Related Compensation is based.

Principal Investment IncomeNet Realizations

Net Realizations were $2.4 million for the three months ended March 31, 2019, a decrease of $5.5 million, compared to $7.9 million for the three months ended March 31, 2018. The decrease in Net Realizations was primarily attributable to a decrease of $6.1 million in Realized Performance Revenues, partially offset by a decrease of $1.5 million in Realized Performance Compensation.

Realized Performance Revenues were $4.1 million for the three months ended March 31, 2019, a decrease of $6.1 million, compared to $10.2 million for the three months ended March 31, 2018. The decrease was primarily driven by funds entering 2019 with loss carryforward balances.

Realized Performance Compensation was $1.4 million for the three months ended March 31, 2019, a decrease of $1.5 million, compared to $2.9 million for the three months ended June 30, 2018, a decrease of $8.9 million compared to $11.8 million for the three months ended June 30, 2017.March 31, 2018. The decrease was primarily due to lower returns in investments of which Blackstone owns a share compared to the second quarter of 2017.

Expenses

Expenses were $80.3 million for the three months ended June 30, 2018, relatively stable compared to $80.7 million for the three months ended June 30, 2017.

Six Months Ended June 30, 2018 Compared to Six Months Ended June 30, 2017

Revenues

Revenues were $313.7 million for the six months ended June 30, 2018, a decrease of $26.6 million compared to $340.3 million for the six months ended June 30, 2017. The decrease in Revenues was primarily attributable to decreases of $22.9 million inRealized Performance Revenues and $25.5 million in Principal Investment Income, partially offset by an increase of $19.7 million in Other Revenue.Revenues.

Performance Revenues were $32.4 million for the six months ended June 30, 2018, a decrease of $22.9 million compared to $55.3 million for the six months ended June 30, 2017. The decrease was primarily driven by lower returns across a number of strategies, including customized solutions, commingled products, individual investor solutions and specialized solutions compared to the second quarter of 2017.

Principal Investment Income was $4.0 million for the six months ended June 30, 2018, a decrease of $25.5 million compared to $29.5 million for the six months ended June 30, 2017. The decrease was primarily due to lower returns in investments of which Blackstone owns a share compared to the second quarter of 2017.

Other Revenue was $7.3 million for the six months ended June 30, 2018, an increase of $19.7 million compared to $(12.3) million for the six months ended June 30, 2017. The increase was primarily due to foreign exchange gain on our euro denominated bonds.

Expenses

Expenses were $164.3 million for the six months ended June 30, 2018, relatively stable compared to $165.0 million for the six months ended June 30, 2017.

Operating Metrics

The following table presents information regarding our IncentiveFee-Earning Assets Under Management:


   Fee-Earning Assets Under
Management Eligible for
Incentive Fees
   Estimated % Above
High Water Mark /
Benchmark (a)
 
   As of June 30,   As of June 30, 
   2017   2018   2017  2018 
   (Dollars in Thousands)        

BAAM-Managed Funds (b)

  $38,778,670   $42,720,613    84  87
                                                                                                
   Fee-Earning Assets Under  Estimated % Above
   Management Eligible for  High Water Mark /
   Incentive Fees  Benchmark (a)
   As of March 31,  As of March 31,
   2019  2018  2019 2018
   (Dollars in Thousands)     

Hedge Fund Solutions Managed Funds (b)

   $43,705,601    $44,211,985    76  76


(a)

Estimated % Above High Water Mark/Benchmark represents the percentage ofFee-Earning Assets Under Management Eligible for Incentive Fees that as of the dates presented would earn incentive fees when the applicableBAAM-managed Hedge Fund Solutions managed fund has positive investment performance relative to a benchmark, where applicable. Incremental positive performance in the applicable Blackstone Funds may cause additional assets to reach their respective High Water Mark or clear a benchmark return, thereby resulting in an increase in Estimated % Above High Water Mark/Benchmark.

(b)

For theBAAM-managed Hedge Fund Solutions managed funds, at June 30, 2018March 31, 2019, the incremental appreciation needed for the 13%24% ofFee-Earning Assets Under Management below their respective High Water Marks/Benchmarks to reach their respective High Water Marks/Benchmarks was $393.1$480.9 million, a decrease of $11.2$15.0 million, compared to $404.3$495.8 million at June 30, 2017.March 31, 2018. Of theFee-Earning Assets Under Management below their respective High Water Marks/Benchmarks as of June 30, 2018, 67%March 31, 2019, 84% were within 5% of reaching their respective High Water Mark.

Composite Returns

Composite returns information is included throughout this discussion and analysis to facilitate an understanding of our results of operations for the periods presented. The composite returns information reflected in this discussion and analysis is not indicative of the financial performance of The Blackstone Group L.P. and is also not necessarily indicative of the future results of any particular fund. An investment in The Blackstone Group L.P. is not an investment in any of our funds or composites. There can be no assurance that any of our funds or composites or our other existing and future funds or composites will achieve similar returns.

The following table presents the return information of the BAAM Principal Solutions Composite:


  Three Average Annual Returns (a)
 Three
Months Ended
June 30,
 Six
Months Ended
June 30,
  Average Annual Returns (a)   Months Ended Periods Ended
 Periods Ended June 30, 2018   March 31, March 31, 2019
 2018 2017 2018 2017 One
Year
 Three
Year
 Five
Year
 Historical   2019 2018 One Year Three Year Five Year Historical

Composite

 Gross Net Gross Net Gross Net Gross Net Gross Net Gross Net Gross Net Gross Net   Gross Net Gross Net Gross Net Gross Net Gross Net Gross Net

BAAM Principal Solutions Composite (b)

  1  1  1  1  3  2  4  4  7  6  5  4  6  5  7 


6

   3  3  1  1  4  3  7  6  5  4  7  6

The returns presented herein represent those of the applicable Blackstone Funds and not those of The Blackstone Group L.P.


(a)

Composite returns present a summarized asset-weighted return measure to evaluate the overall performance of the applicable class of Blackstone Funds.

(b)

BAAM’s Principal Solutions (“BPS”) Composite covers the period from January 2000 to present, although BAAM’s inception date is September 1990. The BPS Composite includes only BAAM-managed commingled and customized multi-manager funds and accounts. None of the other platforms/strategies managed through the Blackstone Hedge Fund Solutions Group are included in the composite (except for investments by BPS funds/accounts directly into those platforms/strategies). BAAM-managed funds in liquidation andnon-fee-paying assets (in the case of net returns) are excluded from the composite. The historical return is from January 1, 2000.

Credit

The following table presents the results of operations for our Credit segment:


  Three Months Ended
June 30,
  2018 vs. 2017  Six Months Ended
June 30,
  2018 vs. 2017 
  2018  2017  $  %  2018  2017  $  % 
  (Dollars in Thousands) 

Revenues


Management Fees, Net


Base Management Fees

 $118,161  $137,121  $(18,960  -14 $286,602  $277,026  $9,576   3

Transaction and Other Fees, Net

  3,461   3,820   (359  -9  6,000   6,328   (328  -5

Management Fee Offsets

  (2,697  (4,653  1,956   -42  (6,014  (22,512  16,498   -73


Total Management Fees, Net

  118,925   136,288   (17,363  -13  286,588   260,842   25,746   10


Performance Revenues


Realized Incentive Fees

  1,223   28,877   (27,654  -96  1,243   58,419   (57,176  -98

Realized Performance Allocations

  13,371   15,040   (1,669  -11  52,575   23,837   28,738   121

Unrealized Performance Allocations

  92,798   (8,839  101,637   N/M   92,318   40,792   51,526   126


Total Performance Revenues

  107,392   35,078   72,314   206  146,136   123,048   23,088   19


Principal Investment Income (Loss)


Realized

  4,082   1,895   2,187   115  11,107   4,548   6,559   144

Unrealized

  764   1,666   (902  -54  (5,753  8,813   (14,566  N/M 


Total Principal Investment Income

  4,846   3,561   1,285   36  5,354   13,361   (8,007  -60

Interest and Dividend Revenue

  10,532   6,614   3,918   59  18,434   12,358   6,076   49

Other

  19,673   (12,660  32,333   N/M   6,972   (14,387  21,359   N/M 


Total Revenues

  261,368   168,881   92,487   55  463,484   395,222   68,262   17


Expenses


Compensation

  55,907   56,954   (1,047  -2  129,381   112,072   17,309   15

Performance Compensation


Realized Incentive Fees

  (232  14,224   (14,456  N/M   186   28,342   (28,156  -99

Realized Performance Allocations

  7,715   7,901   (186  -2  30,134   12,487   17,647   141

Unrealized Performance Allocations

  44,842   (5,531  50,373   N/M   39,119   17,144   21,975   128


Total Compensation and Benefits

  108,232   73,548   34,684   47  198,820   170,045   28,775   17

Interest Expense

  8,823   8,091   732   9  16,508   15,936   572   4

Other Operating Expenses

  31,899   27,549   4,350   16  59,638   49,007   10,631   22


Total Expenses

  148,954   109,188   39,766   36  274,966   234,988   39,978   17


Economic Income

 $112,414  $59,693  $52,721   88 $188,518  $160,234  $28,284   18


   Three Months Ended    
   March 31, 2019 vs. 2018
   2019 2018 $ %
   (Dollars in Thousands)

Management Fees, Net


Base Management Fees

   $140,528   $168,441   $(27,913  -17

Transaction and Other Fees, Net

   3,630   2,539   1,091   43

Management Fee Offsets

   (3,341  (3,317  (24  1


Total Management Fees, Net

   140,817   167,663   (26,846  -16

Fee Related Performance Revenues

   1,103   (666  1,769   N/

Fee Related Compensation

   (58,674  (66,259  7,585   -11

Other Operating Expenses

   (32,239  (27,739  (4,500  16


Fee Related Earnings

   51,007   72,999   (21,992  -30


Realized Performance Revenues

   8,897   39,890   (30,993  -78

Realized Performance Compensation

   (3,371  (22,746  19,375   -85

Realized Principal Investment Income

   3,183   7,025   (3,842  -55


Net Realizations

   8,709   24,169   (15,460  -64


Segment Distributable Earnings

   $59,716   $97,168   $(37,452  -39


N/M      Not meaningful.

Three Months Ended June 30, 2018March 31, 2019 Compared to Three Months Ended June 30, 2017March 31, 2018

Revenues

RevenuesSegment Distributable Earnings were $261.4$59.7 million for the three months ended June 30, 2018, an increaseMarch 31, 2019, a decrease of $92.5$37.5 million, compared to $168.9$97.2 million for the three months ended June 30, 2017. This changeMarch 31, 2018. The decrease in Segment Distributable Earnings was primarily attributable to

increases decreases of $72.3$22.0 million in Performance RevenuesFee Related Earnings and $32.3$15.5 million in Other Revenue, partially offset by a decrease of $17.4 million in Total Management Fees, Net.Net Realizations.

RevenuesSegment Distributable Earnings in our Credit segment in the secondfirst quarter of 2019 were lower compared to the first quarter of 2018, were higher compared to the second quarter of 2017, primarily driven by higher Performance Revenueslower Fee Related Earnings as a result of higher appreciation in the Performing Credit and Distressed Strategies, partially offset by the conclusion of our investmentsub-advisory relationship with FS Investments. While the conclusion of the relationship with FS Investments will adversely affect revenuesin April 2018. Lower Segment Distributable Earnings were also driven by lower Net Realizations in the near term, we believe we will replace and ultimately overtake2019 period compared to the prior level2018 period as a result of revenue associated with suchsub-advisory relationship. Despitea mezzanine fund crossing its carried interest threshold in the relatively low interest rate environment,fourth quarter of 2017, which resulted in higher Realized Performance Revenues in the first quarter of 2018. In the first quarter of 2019, the investment pace ofacross our Credit fundssegment remained active, with $2.4an aggregate of $3.5 billion of capital deployed or committed, duringalthough the second quarter. We believecurrently low levels of distress contribute to a challenging capital deployment environment. Although the impactFederal Reserve has signaled that it would be patient with respect to near-term interest rate increases, to the extent interest rates rise, and such rise occurs concurrently with a period of U.S. tax reform is a net positive foreconomic weakness or slowdown in growth, capital deployment in our Credit segment’s U.S.-based portfolio companies with the exception of highly levered companies where the new limits onsegment may also be challenged. In addition, interest expense deductibility may offset the law’s other benefits. While interest rates are expected to continue to rise in the course of 2018 andrate increases could adversely affect RevenuesSegment Distributable Earnings in our Credit segment, although we believe our current portfolio is somewhat insulated because much of our debt portfolio is floating rate, short duration and/or held to maturity. Moreover, such increases are expected to be against a backdrop of continuing economic strength and improving fundamentals, and the riseOur Segment Distributable Earnings in interest rates may create investment opportunities. Ourour Credit segment revenues may however,also be negatively impacted by our failure to accurately assess and react to risk;risk, such as, for example, a sustained period of depressed energy and commodity prices; andprices or weakened market fundamentals, thatwhich may lead to, among other things, ratings downgrades. See “Item“Part I. Item 1A. Risk Factors — Risks Related to Our Business — Difficult market conditions can adversely affect our business in many ways, including by reducing the value or performance of the investments made by our investment funds, making it more difficult to find opportunities for our funds to exit and realize value from existing investments and reducing the ability of our investment funds to raise or deploy capital, each of which could

materially reduce our revenue, earnings and cash flow and adversely affect our financial prospects and condition.” in our Annual Report on Form10-K for the year ended December 31, 2017.2018.

Performance RevenuesFee Related Earnings

Fee Related Earnings were $107.4$51.0 million for the three months ended June 30, 2018, an increaseMarch 31, 2019, a decrease of $72.3$22.0 million, compared to $35.1$73.0 million for the three months ended June 30, 2017. This changeMarch 31, 2018. The decrease in Fee Related Earnings was primarily attributable to higher returnsa decrease of $26.8 million in our performing credit strategiesManagement Fees, Net and distressed strategies,an increase of $4.5 million in Other Operating Expenses, partially offset by a decrease of $7.6 million in Fee Related Compensation.

Management Fees, Net were $140.8 million for the three months ended March 31, 2019, a decrease of $26.8 million, compared to $167.7 million for the three months ended March 31, 2018, primarily driven by a decrease in Base Management Fees. Base Management Fees were $140.5 million for the three months ended March 31, 2019, a decrease of $27.9 million, compared to $168.4 million for the three months ended March 31, 2018, primarily due to a contractual agreement with FS Investments pursuant to which, in connection with the conclusion of oursub-advisory relationship with FS Investments.respect to the BDCs, we received a fixed payment in the first quarter of 2018, partially offset by growth in BIS and certain GSO funds.

Other Revenue was $19.7Operating Expenses were $32.2 million for the three months ended June 30, 2018,March 31, 2019, an increase of $32.3$4.5 million, compared to $(12.7)$27.7 million for the three months ended June 30, 2017,March 31, 2018. The increase was primarily due to foreign exchange gain onthe growth in our euro denominated bonds.new business initiatives, including BIS, partially offset by decreased legal and consulting expenses within GSO.

Total Management Fees, Net were $118.9Fee Related Compensation was $58.7 million for the three months ended June 30, 2018,March 31, 2019, a decrease of $17.4$7.6 million, compared to $136.3$66.3 million for the three months ended June 30, 2017.March 31, 2018. The decrease was primarily attributable to an increase in Base Management Fees. Base Management Fees were $118.2 million for the three months ended June 30, 2018, a decrease of $19.0 million compared to $137.1 million for the three months ended June 30, 2017, primarily due to the conclusion of oursub-advisory relationship with FS Investments, partially offset by the acquisition of Harvest.

Expenses

Expenses were $149.0 million for the three months ended June 30, 2018, an increase of $39.8 million compared to $109.2 million for the three months ended June 30, 2017. The increase in expenses was primarily attributable to increases of $35.7 million in Performance Compensation and $4.3 million in Other Operating Expenses. The increase in Performance Compensation was due to the increase in Performance Revenues. The increase in Other Operating Expenses was primarily due to an increase in business development and communication and information services, partially offset by a decrease in professional fees.

Six Months Ended June 30, 2018 Compared to Six Months Ended June 30, 2017

Revenues

Revenues were $463.5 million for the six months ended June 30, 2018, an increase of $68.3 million compared to $395.2 million for the six months ended June 30, 2017. This change was primarily attributable to increases of $25.7 million in Total Management Fees, Net, $23.1 in Performance Revenues, and $21.4 million in Other Revenue, partially offset by a decrease of $8.0 million in Principal Investment Income.

Total Management Fees, Net were $286.6 million for the six months ended June 30, 2018, an increase of $25.7 million compared to $260.8 million for the six months ended June 30, 2017. The increase was primarily attributable to the addition of management fees as a result of the acquisition of Harvest and the inclusion of BIS, partially offset by the conclusion of oursub-advisory relationship with FS Investments.

The Annualized Base Management Fee Rate decreased from 0.76% at June 30, 2017 to 0.50% at June 30, 2018. The decrease was principally due to the inclusion of our insurance solutions initiative and the related feeramp-up period in the first quarter of 2018.

Performance Revenues were $146.1 million for the six months ended June 30, 2018, an increase of $23.1 million compared to $123.0 million for the six months ended June 30, 2017. This change was primarily attributable to higher returns in our performing credit strategies and distressed strategies, partially offset by the conclusion of oursub-advisory relationship with FS Investments.

Other Revenue was $7.0 million for the six months ended June 30, 2018, an increase of $21.4 million compared to $(14.4) million for the six months ended June 30, 2017, primarily due to foreign exchange gain on our euro denominated bonds.

Principal Investment Income was $5.4 million for the six months ended June 30, 2018, a decrease of $8.0 million compared to $13.4 million for the six months ended June 30, 2017, primarily due to the unrealized investment losses in Blackstone’s investments in GSO funds, as well as our long only funds.

Expenses

Expenses were $275.0 million for the six months ended June 30, 2018, an increase of $40.0 million compared to $235.0 million for the six months ended June 30, 2017. The increase in expenses was primarily attributable to increases of $17.3 million in Compensation, $11.5 million in Performance Compensation and $10.6 million in Other Operating Expenses. The increase in Compensation was due to the increase in Management Fees, Net, on which a portion of compensationFee Related Compensation is based, as well as investmentbased.

Net Realizations

Net Realizations were $8.7 million for the three months ended March 31, 2019, a decrease of $15.5 million, compared to $24.2 million for the three months ended March 31, 2018. The decrease in initiatives.Net Realizations was primarily attributable to a decrease of $31.0 million in Realized Performance Revenues, partially offset by a decrease of $19.4 million in Realized Performance Compensation.

Realized Performance Revenues were $8.9 million for the three months ended March 31, 2019, a decrease of $31.0 million, compared to $39.9 million for the three months ended March 31, 2018. The increasedecrease was primarily attributable to the recognition of more realizations in the three months ended March 31, 2018 related to a mezzanine fund crossing its carry threshold the prior quarter.

Realized Performance Compensation was $3.4 million for the three months ended March 31, 2019, a decrease of $19.4 million, compared to $22.7 million for the three months ended March 31, 2018. The decrease was due to the increasedecrease in Realized Performance Revenues. The increase in Other Operating Expenses was primarily due to an increase in business development and communication and information services.

Fund Returns

Fund return information for our significant businesses is included throughout this discussion and analysis to facilitate an understanding of our results of operations for the periods presented. The fund returns information reflected in this discussion and analysis is not indicative of the financial performance of The Blackstone Group L.P. and is also not necessarily indicative of the future results of any particular fund. An investment in The Blackstone Group L.P. is not an investment in any of our funds. There can be no assurance that any of our funds or our other existing and future funds will achieve similar returns.

The following table presents combined internal rates of return of the segment’s performing credit and distressed strategies funds:


  Three Months Ended
June 30,
 Six Months Ended
June 30,
  June 30, 2018
Inception to Date
   Three Months Ended March 31, March 31, 2019
  2018 2017 2018 2017   2019 2018 Inception to Date

Composite (a)

  Gross Net Gross Net Gross Net Gross Net Gross Net   Gross Net Gross Net Gross Net

Performing Credit Strategies (b)

   5  4  2  —     8  6  5  3  15  9   4  3  3  2  14  9

Distressed Strategies (c)

   4  3  -1  -2  3  2  2  —     11  7   4  3  -   -1  10  6

The returns presented herein represent those of the applicable Blackstone Funds and not those of The Blackstone Group L.P.


(a)

Net returns are based on the change in carrying value (realized and unrealized) after management fees, expenses and performance revenues,Performance Allocations, net of tax advances.

(b)

Performing Credit Strategies include mezzanine lending funds, BDCs and other performing credit strategy funds. Performing Credit Strategies’ returns represent the IRR of the combined cash flows of thefee-earning funds exceeding $100 million of fair value at each respective quarter end excluding the Blackstone Funds that were contributed to GSO as part of Blackstone’s acquisition of GSO in March 2008. The inception to date returns are from July 16, 2007.

(c)

Distressed Strategies include stressed/distressed funds, credit alpha strategies and energy strategies. Distressed Strategies’ returns represent the IRR of the combined cash flows of thefee-earning funds exceeding $100 million of fair value at each respective quarter end. The inception to date returns are from August 1, 2005.

As of June 30, 2018,March 31, 2019, there was $14.9$17.2 billion of Performance Revenue eligible assets under management invested in Credit strategies that were above the hurdle necessary to generate Incentive Fees or carried interest.Performance Allocations. This represented 37% of the total Performance Revenue eligible assets at fair value across all Credit strategies.

Non-GAAP Financial Measures

The following tables set forth the calculations of thenon-GAAP financial measures used by management when assessing the performance of our business. Thesenon-GAAP financial measures are presented without the consolidation of any Blackstone Funds that are consolidated into the Condensed Consolidated Financial Statements. Consequently, allnon-GAAP financial measures exclude the assets, liabilities and operating results related to the Blackstone Funds. See “— Key Financial Measures and Indicators” for our definitions of Economic Income, Economic Net Income,Distributable Earnings, Segment Distributable Earnings, Fee Related Earnings Distributable Earnings and Adjusted EBITDA.

The following table calculates Blackstone’s Fee Related Earnings, Distributable Earnings and Economic Net Income:

LOGO

(a)

Represents the total segment amounts of the respective captions. See Note 18. “Segment Reporting” in the “Notes to Condensed Consolidated Financial Statements” in “Part I. Item 1. Financial Statements” of this filing.

(b)

Detail on this amount is included in the table below.

The following table calculates the components of Fee Related Earnings, Distributable Earnings and Economic Net Income in the above table identified by note (b):

LOGO

(a)

Represents the total segment amounts of the respective captions. See Note 18. “Segment Reporting” in the “Notes to Condensed Consolidated Financial Statements” in “Part I. Item 1. Financial Statements” of this filing.

(b)

Represents the equity-based compensation expense component of Compensation.

(c)

Represents the total equity-based compensation expense component of Realized Incentive Fees Compensation and Realized Performance Allocations Compensation.

(d)

Taxes and Related Payables represent the total GAAP tax provision adjusted to include only the current tax provision (benefit) calculated on Income (Loss) Before Provision for Taxes and to exclude the tax impact on any divestitures and the Payable Under Tax Receivable Agreement.

(e)

Representstax-related payables including the Payable Under Tax Receivable Agreement, which is a component of Taxes and Related Payables.

(f)

Represents all equity-based compensation expenses included in Economic Income. This excludes all transaction-related equity-based charges.

The following table is a reconciliation of Net Income Attributable to The Blackstone Group L.P. to Economic Income, of Economic Income to Economic Net Income, of Economic Net Income toDistributable Earnings, Total Segment Distributable Earnings, Fee Related Earnings of Fee Related Earnings to Distributable Earnings and of Distributable Earnings to Adjusted EBITDA:EBITDA for the three months ended March 31, 2019 and 2018:


LOGO

LOGO


(a)

This adjustment removes Transaction-Related Charges.Charges, which are excluded from Blackstone’s segment presentation. Transaction-Related Charges arise from corporate actions including acquisitions, divestitures, and Blackstone’s initial public offering. TheThey consist primarily of equity-based compensation charges, gains and losses on contingent consideration arrangements, changes in the balance of the tax receivable agreement resulting from a change in tax law or similar event, transaction costs and any gaingains or losses associated with these corporate actions.

(b)

This adjustment removes the amortization of transaction-related intangibles, which are excluded from Blackstone’s segment presentation. This amount includes amortization of intangibles associated with Blackstones investment in Pátria, which is accounted for under the equity method.

(c)

This adjustment reverses the effect of consolidating the Blackstone Funds, andwhich are excluded from Blackstone’s segment presentation. This adjustment includes the elimination ofnon-controlling interests Blackstone’s interest in these funds, the increase to revenue representing the reimbursement of certain expenses by Blackstone Funds, which are presented gross under GAAP but netted against Other Operating Expenses in the segment presentation, and the removal of amounts associated with the ownership of Blackstone consolidated operating partnerships.partnerships held bynon-controlling interests.

(c)(d)

This adjustment removes Unrealized Performance Revenues on a segment basis. The Segment Adjustment represents the add back of performance revenues earned from consolidated Blackstone Funds which have been eliminated in consolidation.

                                                
   Three Months Ended
   March 31,
   2019  2018

GAAP Unrealized Performance Allocations

   $663,999    $628,089 

Segment Adjustment

   334    250 


Unrealized Performance Revenues

   $664,333    $628,339 


(e)

This adjustment removes Unrealized Performance Allocations Compensation.

(f)

This adjustment removes Unrealized Principal Investment Income on a segment basis. The Segment Adjustment represents (1) the add back of Principal Investment Income, including general partner income, earned from consolidated Blackstone Funds which have been eliminated in consolidation, and (2) the removal of amounts associated with the ownership of Blackstone consolidated operating partnerships held bynon-controlling interests.

                                                
   Three Months Ended
   March 31,
   2019 2018

GAAP Unrealized Principal Investment Income

   $169,044   $111,774 

Segment Adjustment

   (29,119  (97,796


Unrealized Principal Investment Income

   $139,925   $13,978 


(g)

This adjustment removes Other Revenues on a segment basis. The Segment Adjustment represents (1) the add back of Other Revenues earned from consolidated Blackstone Funds which have been eliminated in consolidation, and (2) the removal of certain Transaction-Related Charges.

                                                
   Three Months Ended
   March 31,
   2019  2018

GAAP Other Revenue

   $10,250    $(59,317

Segment Adjustment

   2,939    (1,577


Other Revenues

   $13,189    $(60,894


(h)

This adjustment removes Equity-Based Compensation on a segment basis.

(i)

Taxes represent the total GAAP tax provision adjusted to include only the current tax provision (benefit) calculated on Income (Loss) Before Provision for Taxes and adjusted to exclude the tax impact onof any divestitures. Related Payables representtax-related payables including the amount payable under the Tax Receivable Agreement.

                                                
   Three Months Ended
   March 31,
   2019  2018

Taxes

   $15,344    $18,228 

Related Payables

   13,695    6,814 


Taxes and Related Payables

   $29,039    $25,042 


(d)(j)

This adjustment removes total segment Performance Revenues.

(e)

This adjustment removes total segment Principal Investment Income (Loss).

(f)

This adjustment removes total segment Other Revenues.

(g)

This adjustment removes total segment Interest and Dividend Revenue less totalInterest Expense on a segment Interest Expense.basis. The Segment Adjustment represents (1) the add back of Other Revenues earned from consolidated Blackstone Funds which have been eliminated in consolidation, and (2) the removal of interest expense associated with the Tax Receivable Agreement.

                                                
   Three Months Ended
   March 31,
   2019 2018

GAAP Interest and Dividend Revenue

   $44,084   $35,385 

Segment Adjustment

   2,615   1,000 


Interest and Dividend Revenue

   46,699   36,385 


GAAP Interest Expense

   42,002   38,671 

Segment Adjustment

   (364  (433


Interest Expense

   41,638   38,238 


Net Interest Income (Loss)

   $5,061   $(1,853


(h)(k)

This adjustment removes the total segment amountamounts of Realized Performance Compensation, comprised of Incentive Fee Compensation and Performance Allocations Compensation.Revenues.

(i)(l)

This adjustment removes the component of total segment Compensation that is equity-based.

(j)

This adjustment adds the total segment amounts orof Realized Incentive Fees and Realized Performance Allocations, net of realized Performance Compensation.

(k)(m)

This adjustment addsremoves the total segment amount of Realized Principal Investment Income.

(l)

Taxes and Related Payables Including Payable Under Tax Receivable Agreement represent the total GAAP tax provision adjusted to include only the current tax provision (benefit) calculated on Income (Loss) Before Provision for Taxes and to exclude the tax impact on any divestitures and the Payable Under Tax Receivable Agreement.

(m)(n)

This adjustment adds back the totalInterest Expense on a segment amount of Interest Expense.basis.

Liquidity and Capital Resources

General

Blackstone’s business model derives revenue primarily from third party assets under management. Blackstone is not a capital or balance sheet intensive business and targets operating expense levels such that total management and advisory fees exceed total operating expenses each period. As a result, we require limited capital resources to support the working capital or operating needs of our businesses. We draw primarily on the long-term committed capital of our limited partner investors to fund the investment requirements of the Blackstone Funds and use our own realizations and cash flows to invest in growth initiatives, make commitments to our own funds, where our minimum general partner commitments are generally less than 5% of the limited partner commitments of a fund, and pay distributions to unitholders.

Fluctuations in our statement of financial condition result primarily from activities of the Blackstone Funds which are consolidated as well as business transactions, such as the issuance of senior notes described below. The majority economic ownership interests of the Blackstone Funds are reflected as RedeemableNon-Controlling Interests in Consolidated Entities andNon-Controlling Interests in Consolidated Entities in the Condensed Consolidated Financial Statements. The consolidation of these Blackstone Funds has no net effect on the Partnership’s Net Income or Partners’ Capital. Additionally, fluctuations in our statement of financial condition also include appreciation or depreciation in Blackstone investments in the Blackstone Funds, additional investments

and redemptions of such interests in the Blackstone Funds and the collection of receivables related to management and advisory fees.

Total assets were $30.1$29.9 billion as of June 30, 2018, a decreaseMarch 31, 2019, an increase of $4.3 billion$950.3 million, or 3%, from December 31, 2017.2018. The decreaseincrease in total assets was principally due to a decrease of $8.9 billion from the deconsolidation of CLOs and other fund entities, partially offset by an increase of $2.7 billion from the launch of new consolidated CLOs.

Total liabilities were $15.4 billion as of June 30, 2018, a decrease of $5.3 billion from December 31, 2017. The decrease$773.4 million in total liabilities was primarily dueassets attributable to a decrease of $8.7 billion from the deconsolidation of CLOs and other fund entities, partially offset by an increase of $2.7 billion from the launch ofconsolidated operating partnerships. Effective January 1, 2019 Blackstone adopted new consolidated CLOs.

The deconsolidation of the CLOs and fund vehicles was the result of the dilution of Blackstone’s ownership interests in these vehicles during the six months ended June 30, 2018. As a result of the dilution, Blackstone determined that it was no longer the primary beneficiary of these VIEs under GAAP guidance and deconsolidated these vehicles.on the accounting for leases on a modified retrospective basis. See Note 9. “Variable Interest Entities”2. “Summary of Significant Accounting Policies” in the “Notes to Condensed Consolidated Financial Statements” in “Part I. Item 1. Financial Statements” of this filing. The adoption resulted in the recognition ofRight-of-Use Assets of $521.9 million as of March 31, 2019. The other net variances of the assets attributable to the consolidated operating partnerships were relatively unchanged.

Total liabilities were $15.7 billion as of March 31, 2019, an increase of $557.7 million, or 4%, from December 31, 2018. The increase in total liabilities was principally due to an increase of $413.6 million in total liabilities attributable to the consolidated operating partnerships. Effective January 1, 2019 Blackstone adopted new GAAP guidance on the accounting for leases on a modified retrospective basis. The adoption resulted in the recognition of Operating Lease Liabilities of $587.4 million as of March 31, 2019. The other net variances of the liabilities attributable to the consolidated operating partnerships were relatively unchanged.

Sources and Uses of Liquidity

We have multiple sources of liquidity to meet our capital needs, including annual cash flows, accumulated earnings in the businesses, the proceeds from our issuances of senior notes, liquid investments we hold on our balance sheet for our own use and access to our $1.5$1.6 billion committed revolving credit facility. As of June 30, 2018,March 31, 2019, Blackstone had $1.7$1.6 billion in cash and cash equivalents, $3.5$2.5 billion invested in corporate treasury investments, $2.0 billion invested in Blackstone Funds and other investments, against $3.6$3.5 billion in borrowings from our bond issuances, and no borrowings outstanding under our revolving credit facility.

On April 10, 2019, Blackstone issued600 million aggregate principal amount of 1.500% Senior Notes maturing on April 10, 2029. Blackstone intends to use the net proceeds from the sale of the notes for general corporate purposes.

In addition to the cash we received from our debt offerings and availability under our committed revolving credit facility, we expect to receive (a) cash generated from operating activities, (b) carried interestPerformance Allocations and incentive feeIncentive Fee realizations, and (c) realizations on the carry and hedge fund investments that we make. The amounts received from these three sources in particular may vary substantially from year to year and quarter to quarter depending on the frequency and size of realization events or net returns experienced by our investment funds. Our available capital could be adversely affected if there are prolonged periods of few substantial realizations from our investment funds accompanied by substantial capital calls for new investments from those investment funds. Therefore, Blackstone’s commitments to our funds are taken into consideration when managing our overall liquidity and cash position.

We expect that our primary liquidity needs will be cash to (a) provide capital to facilitate the growth of our existing businesses which principally includes funding our general partner andco-investment commitments to our funds, (b) provide capital to facilitate our expansion into new businesses that are complementary, (c) pay operating expenses, including cash compensation to our employees and other obligations as they arise, (d) fund modest capital expenditures, (e) repay borrowings and related interest costs, (f) pay income taxes, (g) repurchase our common units and Blackstone Holdings partnership units,Partnership Units pursuant to our unit repurchase program, and (h) make distributions to our unitholders and the holders of Blackstone Holdings Partnership Units.

On April 18, 2019, we announced our Conversion from a Delaware limited partnership to the Corporation. Following the Conversion, all of the net income attributable to the Corporation will be subject to U.S. federal (and state and local) corporate income taxes. See “Part II. Item 1A. Risk Factors — Following the Conversion, we expect to pay more corporate income taxes than we would have as a limited partnership.” and “— Conversion to a Corporation.”

Our own capital commitments to our funds, the funds we invest in and our investment strategies as of June 30, 2018March 31, 2019 consisted of the following:


   Blackstone and General
Partner
   Senior Managing Directors
and Certain Other
Professionals (a)
 

Fund

  Original
Commitment
   Remaining
Commitment
   Original
Commitment
   Remaining
Commitment
 
   (Dollars in Thousands) 

Private Equity


BCP V

  $629,356   $30,730   $—     $—   

BCP VI

   719,718    107,468    250,000    37,330 

BCP VII

   500,000    387,552    225,000    174,398 

BEP I

   50,000    4,703    —      —   

BEP II

   80,000    45,198    26,667    15,066 

BCEP

   120,000    66,408    18,992    10,405 

BCP Asia

   40,000    40,000    13,333    13,333 

Tactical Opportunities

   367,752    192,011    105,251    64,004 

Strategic Partners

   409,738    235,881    58,627    30,951 

BIP

   112,333    112,333    —      —   

Other (b)

   248,592    26,328    —      —   

continued…

                                                                                                
   Blackstone and  Senior Managing Directors
and Certain Other
   General Partner  Professionals (a)

Fund

  Original
Commitment
  Remaining
Commitment
  Original
Commitment
  Remaining
Commitment
   (Dollars in Thousands)

Real Estate


BREP VII

   $300,000    $44,053    $100,000    $14,684 

BREP VIII

   300,000    97,888    100,000    32,629 

BREP IX

   300,000    300,000    100,000    100,000 

BREP Europe III

   100,000    13,231    35,000    4,410 

BREP Europe IV

   130,000    23,842    43,333    7,947 

BREP Europe V

   150,000    63,893    43,333    18,458 

BREP Asia I

   50,000    14,806    16,667    4,935 

BREP Asia II

   70,707    57,489    23,569    19,163 

BREDS II

   50,000    6,227    16,667    2,076 

BREDS III

   50,000    18,732    16,667    6,244 

BPP

   109,258    21,889         

Other (b)

   56,959    7,548         

Private Equity


BCP V

   629,356    30,642         

BCP VI

   719,718    107,631    250,000    37,386 

BCP VII

   500,000    240,748    225,000    108,337 

BCP VIII

   500,000    500,000    225,000    225,000 

BEP I

   50,000    4,728         

BEP II

   80,000    22,328    26,667    7,443 

BEP III

   72,239    72,239    24,080    24,080 

BCEP

   120,000    54,317    18,992    8,597 

BCP Asia

   40,000    37,961    13,333    12,654 

Tactical Opportunities

   422,699    219,713    123,166    73,238 

Strategic Partners

   511,465    301,621    77,690    46,661 

BIP

   112,333    71,102         

BXLS

   10,500    7,762         

Other (b)

   262,711    34,912         

Hedge Fund Solutions


Strategic Alliance

   50,000    2,033         

Strategic Alliance II

   50,000    1,482         

Strategic Alliance III

   22,000    17,135         

Strategic Holdings LP

   154,610    87,447         

Other (b)

   4,700    2,707         

Credit


Capital Opportunities Fund II LP

   120,000    33,950    110,101    31,149 

Capital Opportunities Fund III LP

   130,783    73,238    30,431    17,345 

GSO Euro Senior Debt Fund LP

   63,000    19,357    56,992    17,511 

GSO Capital Solutions

   50,000    5,780    27,666    3,198 

GSO Capital Solutions II

   125,000    52,036    119,959    49,938 

GSO Capital Solutions III

   151,000    133,062    30,542    26,913 

GSO Energy Select Opportunities Fund

   80,000    41,259    74,657    38,504 

GSO Energy Select Opportunities Fund II

   66,949    63,390    22,316    21,130 

GSO Credit Alpha Fund LP

   52,102    7,465    50,191    7,191 

GSO Credit Alpha Fund II LP

   25,500    19,536    5,887    4,481 

Other (b)

   186,884    67,162    21,726    5,153 

Other


Treasury

   215,094    33,917         


    $    7,245,567   $    3,036,258   $    2,029,632   $    976,455


   Blackstone and General
Partner
   Senior Managing Directors
and Certain Other
Professionals (a)
 

Fund

  Original
Commitment
   Remaining
Commitment
   Original
Commitment
   Remaining
Commitment
 
   (Dollars in Thousands) 

Real Estate


BREP VI

  $750,000   $36,809   $150,000   $12,270 

BREP VII

   300,000    45,290    100,000    15,097 

BREP VIII

   300,000    153,463    100,000    51,154 

BREP Europe III

   100,000    13,231    35,000    4,631 

BREP Europe IV

   130,000    23,842    43,333    7,947 

BREP Europe V

   150,000    83,124    43,333    24,014 

BREP Asia I

   50,000    16,063    16,667    5,354 

BREP Asia II

   71,061    68,423    23,687    22,808 

BREDS II

   50,000    6,227    16,667    2,076 

BREDS III

   50,000    30,769    16,667    10,256 

Other (b)

   151,917    27,925    —      —   

Hedge Fund Solutions


Strategic Alliance

   50,000    2,033    —      —   

Strategic Alliance II

   50,000    1,482    —      —   

Strategic Alliance III

   22,000    19,769    —      —   

Strategic Holdings LP

   156,748    110,261    —      —   

Other (b)

   3,320    1,905    —      —   

Credit


Capital Opportunities Fund II LP

   120,000    34,439    110,527    31,720 

Capital Opportunities Fund III LP

   130,783    98,654    30,431    23,210 

GSO Euro Senior Debt Fund LP

   63,000    28,070    57,194    25,483 

BMezz II

   17,692    160    —      —   

GSO Capital Solutions

   50,000    6,398    27,666    3,540 

GSO Capital Solutions II

   125,000    59,718    120,534    57,584 

GSO Capital Solutions III

   151,000    146,130    30,542    29,570 

GSO Energy Select Opportunities Fund

   80,000    43,324    74,747    40,479 

GSO Credit Alpha Fund LP

   52,102    7,815    50,285    7,543 

Other (b)

   136,141    51,926    35,830    11,044 

Other


Treasury

   233,855    72,100    —      —   


  $6,822,108   $2,437,962   $1,780,980   $731,267 


(a)

For some of the general partner commitments shown in the table above, we require our senior managing directors and certain other professionals to fund a portion of the commitment even though the ultimate obligation to fund the aggregate commitment is ours pursuant to the governing agreements of the respective funds. The amounts of the aggregate applicable general partner original and remaining commitment are shown in the table above. In addition, certain senior managing directors and other professionals are required to fund a de minimis amount of the commitment in the other private equity, real estate and credit-focused carry funds. We expect our commitments to be drawn down over time and to be funded by available cash and cash generated from operations and realizations. Taking into account prevailing market conditions and both the liquidity and cash or liquid investment balances, we believe that the sources of liquidity described above will be more than sufficient to fund our working capital requirements.

(b)

Represents capital commitments to a number of other funds in each respective segment.

As of June 30, 2018,March 31, 2019, Blackstone Holdings Finance Co. L.L.C. (the “Issuer”), an indirect subsidiary of the Partnership, had issued and outstanding the following senior notes (collectively the “Notes”):


Senior Notes (a)

  Aggregate
Principal
Amount
(Dollars/Euros
in Thousands)
 

5.875%, Due 3/15/2021

  $400,000 

4.750%, Due 2/15/2023

  $400,000 

2.000%, Due 5/19/2025

  300,000 

1.000%, Due 10/5/2026

  600,000 

3.150%, Due 10/2/2027

  $300,000 

6.250%, Due 8/15/2042

  $250,000 

5.000%, Due 6/15/2044

  $500,000 

4.450%, Due 7/15/2045

  $350,000 

4.000%, Due 10/2/2047

  $300,000 


(a)

The Notes are unsecured and unsubordinated obligations of the Issuer and are fully and unconditionally guaranteed, jointly and severally, by The Blackstone Group L.P. and each of the Blackstone Holdings Partnerships. The Notes contain customary covenants and financial restrictions that, among other things, limit the Issuer and the guarantors’ ability, subject to certain exceptions, to incur indebtedness secured by liens on voting stock or profit participating equity interests of their subsidiaries or merge, consolidate or sell, transfer or lease assets. The Notes also contain customary events of default. All or a portion of the Notes may be redeemed at our option, in whole or in part, at any time and from time to time, prior to their stated maturity, at the make-whole redemption price set forth in the Notes. If a change of control repurchase event occurs, the Notes are subject to repurchase at the repurchase price as set forth in the Notes.

Blackstone, through indirect subsidiaries, has a $1.5$1.6 billion unsecured revolving credit facility (the “Credit Facility”) with Citibank, N.A., as Administrative Agentadministrative agent with a maturity date of August 31, 2021.September 21, 2023. Borrowings may also be made in U.K. sterling, euros, Swiss francs, or Japanese yen or Canadian dollars, in each case subject to certainsub-limits. The Credit Facility contains customary representations, covenants and events of default. Financial covenants consist of a maximum net leverage ratio and a requirement to keep a minimum amount offee-earning assets under management, each tested quarterly.

On April 16, 2018, the Boardboard of Directorsdirectors of our general partner, Blackstone Group Management L.L.C., authorized the repurchase of up to $1.0 billion of Blackstone common units and Blackstone Holdings Partnership Units. Under the unit repurchase program, units may be repurchased from time to time in open market

transactions, in privately negotiated transactions or otherwise. The timing and the actual number of units repurchased will depend on a variety of factors, including legal requirements, price and economic and market conditions. The unit repurchase program may be changed, suspended or discontinued at any time and does not have a specified expiration date.

During the three and six months ended June 30, 2018,March 31, 2019, we repurchased 2.21.5 million Blackstone common units as part of the unit repurchase program at a total cost of $71.7$52.1 million. As of June 30, 2018,March 31, 2019, the amount remaining available for repurchases under the program was $928.3$406.4 million.

Distributions

Our intention is to distribute quarterly to holders of our publicly traded common unitholdersequity approximately 85% of The Blackstone Group L.P.’sthe publicly traded entity’s share of Distributable Earnings, subject to adjustment by amounts determined by Blackstone’s general partnerboard of directors to be necessary or appropriate to provide for the conduct of its business, to make appropriate investments in its business and funds, to comply with applicable law, any of its debt instruments or other agreements, or to provide for future cash requirements such astax-related payments, clawback obligations and distributions to unitholders for any ensuing quarter. The amount to be distributed could also be adjusted upward in any one quarter.

For Blackstone’s definition of Distributable Earnings, see “— Key Financial Measures and Indicators”.

All of the foregoing is subject to the qualification that the declaration and payment of any distributions are at the sole discretion of our general partnerboard of directors and our general partnerboard of directors may change our distribution policy at any time, including, without limitation, to reduce the quarterly distribution payable to holders of our publicly traded common unitholdersequity or even to eliminate such distributions entirely.

Because the publicly traded entity and/or its wholly owned subsidiaries of The Blackstone Group L.P. must pay taxes and make payments under the tax receivable agreements, the amounts ultimately distributed by The Blackstone Group L.P.the publicly traded entity to itsholders of our publicly traded common unitholdersequity in respect of each fiscal year are generally expected to be less, on a per unit or share basis, than the amounts distributed by the Blackstone Holdings Partnerships to the Blackstone personnel and others who are limited partners of the Blackstone Holdings Partnerships in respect of their Blackstone Holdings Partnership Units. Following the Conversion, we expect to pay more corporate income taxes than we would have as a limited partnership, which will increase this difference in the amounts distributed on a per unit or share basis.

The following graph shows fiscal quarterly and annual per common unitholder distributions for 20172018 and 2018.2019. Distributions are declared and paid in the quarter subsequent to the quarter in which they are earned.


LOGOLOGO

With respect to the secondfirst quarter of fiscal year 2018,2019, we have paid to common unitholders a distribution of $0.58$0.37 per common unit, aggregating $0.93 per common unit in respect of the six months ended June 30, 2018.unit. With respect to fiscal year 2017,2018, we paid common unitholders aggregate distributions of $2.70$2.15 per common unit.

In addition, Blackstone intends to distribute a portion of theafter-tax proceeds from the conclusion of itssub-advisory relationship with FS Investments, resulting in an anticipated incremental $0.30 per common unit over the second, third and fourth quarters of 2018, of which $0.10 per common unit was distributed on August 6. 2018.

Leverage

We may under certain circumstances use leverage opportunistically and over time to create the most efficient capital structure for Blackstone and our public common unitholders. In addition to the borrowings from our bond issuances and our revolving credit facility, we may use reverse repurchase agreements, repurchase agreements and securities sold, not yet purchased. All of these positions are held in a separately managed portfolio. Reverse repurchase agreements are entered into primarily to take advantage of opportunistic yields otherwise absent in the overnight markets and also to use the collateral received to cover securities sold, not yet purchased. Repurchase

agreements are entered into primarily to opportunistically yield higher spreads on purchased securities. The balances held in these financial instruments fluctuate based on Blackstone’s liquidity needs, market conditions and investment risk profiles.

Generally our funds in our private equityPrivate Equity segment, our opportunistic real estate funds, funds of hedge funds and certain credit-focused funds have not utilized substantial leverage at the fund level other than for (a) short-term borrowings between the date of an investment and the receipt of capital from the investing fund’s investors, and (b) long-term borrowings for certain investments in aggregate amounts which are generally 1% to 25% of the capital commitments of the respective fund. Our carry funds make direct or indirect investments in companies that utilize leverage in their capital structure. The degree of leverage employed varies among portfolio companies.

Certain of our Real Estate debt hedge funds, Hedge Fund Solutions funds andcredit-focused funds use leverage in order to obtain additional market exposure, enhance returns on invested capital and/or to bridge

short-term cash needs. The forms of leverage primarily employed by these funds include purchasing securities on margin, utilizing collateralized financing and using derivative instruments.

The following table presents information regarding these financial instruments in our Condensed Consolidated Statements of Financial Condition:


   Repurchase
Agreements
   Securities
Sold, Not  Yet
Purchased
 
   (Dollars in Millions) 

Balance, June 30, 2018

  $182.5   $155.8 

Balance, December 31, 2017

  $118.8   $154.4 

Six Months Ended June 30, 2018


Average Daily Balance

  $152.1   $153.4 

Maximum Daily Balance

  $189.7   $174.7 
                                                
      Securities
   Repurchase  Sold, Not Yet
   Agreements  Purchased
   (Dollars in Millions)

Balance, March 31, 2019

  $218.9   $128.1 

Balance, December 31, 2018

  $222.2   $142.6 

Three Months Ended March 31, 2019


    Average Daily Balance

  $221.9   $133.3 

    Maximum Daily Balance

  $224.6   $142.9 

Contractual Obligations, Commitments and Contingencies

The following table sets forth information relating to our contractual obligations as of June 30, 2018March 31, 2019 on a consolidated basis and on a basis deconsolidating the Blackstone Funds:


Contractual Obligations

  July 1, 2018 to
December 31, 2018
 2019-2020 2021-2022 Thereafter Total   April 1, 2019 to
December 31, 2019
 2020-2021 2022-2023 Thereafter Total
  (Dollars in Thousands)   (Dollars in Thousands)

Operating Lease Obligations (a)

  $39,275  $142,824  $155,189  $344,234  $681,522    $61,863   $186,806   $184,170   $335,745   $768,584 

Purchase Obligations

   17,738   21,852   1,957   —     41,547    34,268   24,259   50      58,577 

Blackstone Issued Notes and Revolving Credit Facility (b)

   —     —     400,000   3,151,560   3,551,560       400,000   400,000   2,709,620   3,509,620 

Interest on Blackstone Issued Notes and Revolving Credit Facility (c)

   67,088   268,342   233,092   1,614,048   2,182,570    96,762   255,473   210,723   1,511,479   2,074,437 

Blackstone Funds and CLO Vehicles Debt Obligations Payable (d)

   2,819   —     —     6,865,160   6,867,979    331         6,852,479   6,852,810 

Interest on Blackstone Funds and CLO Vehicles Debt Obligations Payable (e)

   125,235   500,734   500,734   1,841,871   2,968,574    210,521   563,515   563,515   1,792,619   3,130,170 

Blackstone Funds Capital Commitments to Investee Funds (f)

   545,210   —     —     —     545,210    475,740            475,740 

Due to CertainNon-Controlling Interest Holders in Connection with Tax Receivable Agreements (g)

   —     153,953   136,473   498,876   789,302       141,730   144,390   453,800   739,920 

Unrecognized Tax Benefits, Including Interest and Penalties (h)

   2,684   —     —     —     2,684                 

Blackstone Operating Entities Capital Commitments to Blackstone Funds and Other (i)

   2,437,962   —     —     —     2,437,962    3,036,258            3,036,258 


Consolidated Contractual Obligations

   3,238,011   1,087,705   1,427,445   14,315,749   20,068,910    3,915,743   1,571,783   1,502,848   13,655,742   20,646,116 

Blackstone Funds and CLO Vehicles Debt Obligations Payable (d)

   (2,819  —     —     (6,865,160  (6,867,979   (331        (6,852,479  (6,852,810

Interest on Blackstone Funds and CLO Vehicles Debt Obligations Payable (e)

   (125,235  (500,734  (500,734  (1,841,871  (2,968,574   (210,521  (563,515  (563,515  (1,792,619  (3,130,170

Blackstone Funds Capital Commitments to Investee Funds (f)

   (545,210  —     —     —     (545,210   (475,740           (475,740


Blackstone Operating Entities Contractual Obligations

  $2,564,747  $586,971  $926,711  $5,608,718  $9,687,147    $3,229,151   $1,008,268   $939,333   $5,010,644   $10,187,396 


(a)

We lease our primary office space and certain office equipment under agreements that expire through 2030. In connection with certain office spaceOccupancy lease agreements, wein addition to contractual rent payments, generally include additional payments for certain costs incurred by the landlord, such as building expenses, and utilities. To the extent these are responsible for escalation payments.fixed or determinable they are included in the table above. The contractual obligation table above includes only guaranteed minimum lease payments for such leases and does not project potential escalation or other lease-related payments. These leases are classified as operating leases for financial statement purposes andthat are recognized as suchOperating Lease Liabilities, short-term leases that are not recorded as liabilities on the Condensed Consolidated Statements of Financial Condition.Operating Lease Liabilities and leases that have been signed but not yet commenced which are not recorded as Operating Lease Liabilities. The amounts in this table are presented net of contractual sublease commitments.

(b)

Represents the principal amount due on the senior notes we issued. As of June 30, 2018,March 31, 2019, we had no outstanding borrowings under our revolver. See “— Notable Transactions” for information about additional notes issued subsequent to quarter end.

(c)

Represents interest to be paid over the maturity of our senior notes and borrowings under our revolving credit facility which has been calculated assuming nopre-payments are made and debt is held until its final maturity date. These amounts exclude commitment fees for unutilized borrowings under our revolver.

(d)

These obligations are those of the Blackstone Funds including the consolidated CLO vehicles.

(e)

Represents interest to be paid over the maturity of the related consolidated Blackstone Funds’ and CLO vehicles’ debt obligations which has been calculated assuming nopre-payments will be made and debt will be held until its final maturity date. The future interest payments are calculated using variable rates in effect as of June 30, 2018,March 31, 2019, at spreads to market rates pursuant to the financing agreements, and range from 2.9%0.8% to 8.7%9.2%. The majority of the borrowings are due on demand and for purposes of this schedule are assumed to mature within one year. Interest on the majority of these borrowings rolls over into the principal balance at each reset date.

(f)

These obligations represent commitments of the consolidated Blackstone Funds to make capital contributions to investee funds and portfolio companies. These amounts are generally due on demand and are therefore presented in the less than one year category.

(g)

Represents obligations by the Partnership’s corporate subsidiary to make payments under the Tax Receivable Agreements to certainnon-controlling interest holders for the tax savings realized from the taxable purchases of their interests in connection with the reorganization at the time of Blackstone’s IPO in 2007 and subsequent purchases. The obligation represents the amount of the payments currently expected to be made, which are dependent on the tax savings actually realized as determined annually without discounting for the timing of the payments. As required by GAAP, the amount of the obligation included in the Condensed Consolidated Financial Statements and shown in Note 16.17. “Related Party Transactions” (see “Part I. Item 1. Financial Statements”) differs to reflect the net present value of the payments due to certainnon-controlling interest holders.

(h)

The total represents gross unrecognized tax benefits of $1.2 million and interest and penalties of $1.5 million. In addition, Blackstone is not able to make a reasonably reliable estimate of the timing of payments in individual years in connection with gross unrecognized benefits of $16.6$21.5 million and interest of $1.5$1.8 million; therefore, such amounts are not included in the above contractual obligations table.

(i)

These obligations represent commitments by us to provide general partner capital funding to the Blackstone Funds, limited partner capital funding to other funds and Blackstone principal investment commitments. These amounts are generally due on demand and are therefore presented in the less than one year category; however, a substantial amount of the capital commitments are expected to be called over the next three years. We expect to continue to make these general partner capital commitments as we raise additional amounts for our investment funds over time.

Guarantees

Blackstone and certain of its consolidated funds provide financial guarantees. The amounts and nature of these guarantees are described in Note 17.18. “Commitments and Contingencies — Contingencies — Guarantees” in the “Notes to Condensed Consolidated Financial Statements” in “Part I. Item 1. Financial Statements” of this filing.

Indemnifications

In many of its service contracts, Blackstone agrees to indemnify the third party service provider under certain circumstances. The terms of the indemnities vary from contract to contract and the amount of indemnification liability, if any, cannot be determined and has not been included in the table above or recorded in our Condensed Consolidated Financial Statements as of June 30, 2018.March 31, 2019.

Clawback Obligations

Performance Allocations are subject to clawback to the extent that the Performance Allocations received to date with respect to a fund exceeds the amount due to Blackstone based on cumulative results of that fund. The actual clawback liability, however, generally does not become realized until the end of a fund’s life except for certain Blackstone real estate funds, multi-asset class investment funds and credit-focused funds, which may have an interim clawback liability. The lives of the carry funds, including available contemplated extensions, for which a

liability for potential clawback obligations has been recorded for financial reporting purposes, are currently anticipated to expire at various points through 2028. Further extensions of such terms may be implemented under given circumstances.

For financial reporting purposes, when applicable, the general partners record a liability for potential clawback obligations to the limited partners of some of the carry funds due to changes in the unrealized value of a fund’s remaining investments and where the fund’s general partner has previously received Performance Allocation distributions with respect to such fund’s realized investments.

As of June 30, 2018,March 31, 2019, the total clawback obligations were $2.2$40.8 million, of which $1.1$42.1 million related to Blackstone Holdings and $1.1$(1.3) million related to current and former Blackstone personnel. The split of clawback between Blackstone Holdings and current and former personnel is based on the performance of individual investments held by a fund rather than on a fund by fund basis. If, at June 30, 2018,March 31, 2019, all of the investments held by our carry funds were deemed worthless, a possibility that management views as remote, the amount of Performance Allocations subject to potential clawback would be $6.5$6.9 billion, on anafter-tax basis where applicable, of which Blackstone Holdings is potentially liable for $6.0$6.3 billion if current and former Blackstone personnel default on their share of the liability, a possibility that management also views as remote. See Note 16.17. “Related Party Transactions” and Note 17.18. “Commitments and Contingencies” in the “Notes to Condensed Consolidated Financial Statements” in “Part I. Item 1. Financial Statements” of this filing.

Critical Accounting Policies

We prepare our Condensed Consolidated Financial Statements in accordance with GAAP. In applying many of these accounting principles, we need to make assumptions, estimates and/or judgments that affect the reported amounts of assets, liabilities, revenues and expenses in our condensed consolidated financial statements. We base our estimates and judgments on historical experience and other assumptions that we believe are reasonable under the circumstances. These assumptions, estimates and/or judgments, however, are often subjective. Actual results may be affected negatively based on changing circumstances. If actual amounts are ultimately different from our estimates, the revisions are included in our results of operations for the period in which the actual amounts become known. We believe the following critical accounting policies could potentially produce materially different results if we were to change underlying assumptions, estimates and/or judgments. SeeFor a description of our accounting policies, see Note 2. “Summary of Significant Accounting Policies” in the “Notes to Condensed Consolidated Financial Statements” in “Part I. Item 1. Financial Statements” of this filing.

Principles of Consolidation

The Partnership consolidates all entities that it controls throughFor a majority voting interest or otherwise, including those Blackstone Funds in which the general partner has a controlling financial interest. The Partnership has a controlling financial interest in Blackstone Holdings because the limited partners do not have the right to dissolve the partnerships or have substantive kick out rights or participating rights that would overcome the control held by the Partnership. Accordingly, the Partnership consolidates Blackstone Holdingsdescription of our accounting policy on consolidation, see Note 2. “Summary of Significant Accounting Policies — Consolidation” and recordsnon-controlling interests to reflect the economic interests of the limited partners of Blackstone Holdings.

In addition, the Partnership consolidates all variable interest entities (“VIE”) in which it is the primary beneficiary. An enterprise is determined to be the primary beneficiary if it holds a controlling financial interest. A controlling financial interest is defined as (a) the power to direct the activities of a VIE that most significantly impact the entity’s economic performance and (b) the obligation to absorb losses of the entity or the right to receive benefits from the entity that could potentially be significant to the VIE. The consolidation guidance requires an analysis to determine (a) whether an entity in which the Partnership holds a variable interest is a VIE and (b) whether the Partnership’s involvement, through holding interests directly or indirectly in the entity or contractually through other variable interests (for example, management and performance related fees), would give it a controlling financial interest. Performance of that analysis requires the exercise of judgment.

The Partnership determines whether it is the primary beneficiary of a VIE at the time it becomes involved with a variable interest entity and continuously reconsiders that conclusion. In determining whether the Partnership is the primary beneficiary, Blackstone evaluates its control rights as well as economic interests in the entity held either directly or indirectly by the Partnership. The consolidation analysis can generally be performed qualitatively; however, if it is not readily apparent that the Partnership is not the primary beneficiary, a quantitative analysis may also be performed. Investments and redemptions (either by the Partnership, affiliates of the Partnership or third parties) or amendments to the governing documents of the respective Blackstone Funds could affect an entity’s status as a VIE or the determination of the primary beneficiary. At each reporting date, the Partnership assesses whether it is the primary beneficiary and will consolidate or deconsolidate accordingly.

Assets of consolidated VIEs that can only be used to settle obligations of the consolidated VIE and liabilities of a consolidated VIE for which creditors (or beneficial interest holders) do not have recourse to the general credit of Blackstone are presented in a separate section in the Condensed Consolidated Statements of Financial Condition.

Revenue Recognition

Revenues primarily consist of management and advisory fees, incentive fees, investment income, interest and dividend revenue and other. Please refer to “Part I. Item 1. Business – Incentive Arrangements / Fee Structure” in our Annual Report onForm 10-K for the year ended December 31, 2017 for additional information regarding the manner in which Base Management Fees and Incentive Fees are generated.

Management and advisory fees and incentive fees are accounted for as contracts with customers. Under the guidance for contracts with customers, an entity is required to (a) identify the contract(s) with a customer, (b) identify the performance obligations in the contract, (c) determine the transaction price, (d) allocate the transaction price to the performance obligations in the contract, and (e) recognize revenue when (or as) the entity satisfies a performance obligation. In determining the transaction price, an entity may include variable consideration only to the extent that it is probable that a significant reversal in the amount of cumulative revenue recognized would not occur when the uncertainty associated with the variable consideration is resolved. See Note 18. “Segment Reporting”9. “Variable Interest Entities” in the “Notes to Condensed Consolidated Financial Statements” in “Part I. Item 1. Financial Statements” of this filing for detailed information on Blackstone’s consolidation policy and its involvement with VIEs. The following discussion is intended to provide supplemental information about how the application of consolidation principles impact our financial results, and management’s process for implementing those principles including areas of significant judgment.

The determination that the Partnership holds a disaggregatedcontrolling financial interest in a Blackstone Fund significantly changes the presentation of revenues from contractsour condensed consolidated financial statements. In our Condensed Consolidated Statements of Financial Position included in this filing, we present 100% of the assets and liabilities of consolidated VIEs along with customers.

Investment Incomeanon-controlling interest which represents the unrealizedportion of the consolidated vehicle’s interests held by third parties. However, assets of our consolidated VIEs can only be used to settle obligations of the consolidated VIE and realized gains and losses onare not available for general use by the Partnership’sPartnership. Further, the liabilities of our consolidated VIEs do not have recourse to the general credit of Blackstone. In the Condensed Consolidated Statements of Operations, we eliminate any management fees, Incentive Fees, or Performance Allocations received or accrued from consolidated VIEs as they are considered intercompany transactions. We recognize 100% of the consolidated VIE’s investment income (loss) and Principal Investments. Interestallocate the portion of that income (loss) attributable to

third party ownership tonon-controlling interests in arriving at Net Income Attributable to The Blackstone Group L.P.

The assessment of whether we consolidate a Blackstone Fund we manage requires the application of significant judgment. These judgments are applied both at the time we become involved with the VIE and Dividend on an ongoing basis and include, but are not limited to:

Determining whether our management fees, Incentive Fees or Performance Allocations represent variable interests – We make judgments as to whether the fees we earn are commensurate with the level of effort required for those fees and at market rates. In making this judgment, we consider, among other things, the extent of third party investment in the entity and the terms of any other interests we hold in the VIE.

Determining whetherkick-out rights are substantive – We make judgments as to whether the third party investors in a partnership entity have the ability to remove the general partner, the investment manager or its equivalent, or to dissolve (liquidate) the partnership entity, through a simple majority vote. This includes an evaluation of whether barriers to exercise these rights exist.

Concluding whether the Partnership has an obligation to absorb losses or the right to receive benefits that could potentially be significant to the VIE – As there is no explicit threshold in GAAP to define “potentially significant,” management must apply judgment and evaluate both quantitative and qualitative factors to conclude whether this threshold is met.

Revenue comprises primarily interestRecognition

For a description of our accounting policy on revenue recognition, see Note 2. “Summary of Significant Accounting Policies — Revenue Recognition” in the “Notes to Condensed Consolidated Financial Statements” in “Part I. Item 1. Financial Statements”. For additional description of the nature of our revenue arrangements, including how management fees, Incentive Fees, and dividend income earnedPerformance Allocations are generated, please refer to “Part I. Item 1. Business — Incentive Arrangements / Fee Structure” in our Annual Report on principal investments held by us. Other Revenue consistsForm10-K for the year ended December 31, 2018. The following discussion is intended to provide supplemental information about how the application of miscellaneous incomerevenue recognition principles impact our financial results, and foreign exchange gains and losses arising on transactions denominated in currencies other than U.S. dollars.management’s process for implementing those principles including areas of significant judgment.

Management and Advisory Fees, NetManagement and Advisory Fees, Net are comprised of management fees, including base management fees, transaction and other fees and advisory fees net of management fee reductions and offsets.

The Partnership earns base management fees from limited partners of fundsthe investors in each of its managed funds and investment vehicles, at a fixed percentage of a calculation base which is typically assets under management, net asset value, total assets, committed capital or invested capital. These customer contracts require the Partnership to provide investment management services, which represents a performance obligation that the Partnership satisfies over time. Management fees are a form of variable consideration because the fees the Partnership is entitled to vary based on fluctuations in the basis for the management fee. The amount recorded as revenue is generally determined at the end of the period because these management fees are payable on a regular basis (typically quarterly) and are not subject to clawback once paid. The range of management fee rates and the calculation base from which they are earned, generally, are as follows:

On private equity, real estate, and certain of our hedge fund solutions and credit-focused funds:


0.25% to 1.75%2.00% of committed capital or invested capital during the investment period,

0.25% to 1.50% of invested capital, committed capital and investment fair value subsequent to the investment period for private equity and real estate funds, and


0.75% to 1.50% of invested capital or net asset value subsequent to the investment period for certain of our hedge fund solutions andcredit-focused funds.

On real estate, credit andMLP-focused funds structured like hedge funds:


0.50% to 1.50% of net asset value.

On credit andMLP-focused separately managed accounts:


0.25% to 1.50% of net asset value or total assets.

On real estate separately managed accounts:


0.50% to 2.00% of invested capital, net operating income or net asset value.

On funds of hedge funds, certain hedge funds and separately managed accounts invested in hedge funds:


0.50%0.25% to 1.25%1.50% of net asset value.

On CLO vehicles:


0.40% to 0.65% of the aggregate par amount of collateral assets, including principal cash.

On credit-focused registered andnon-registered investment companies:


0.35% to 1.50% of total assets or net asset value.

The investment adviser of BXMT receives annual management fees based upon 1.50% of BXMT’s net proceeds received from equity offerings and accumulated “core earnings” (which is generally equal to its GAAP net income excluding certainnon-cash and other items), subject to certain adjustments. The investment adviser of ournon-exchange traded REITBREIT receives a management fee of 1.25% per annum of net asset value, payable monthly.

Transaction, advisory and other fees (including monitoring fees) are principally fees charged to the limited partners of funds indirectly through the managed funds and portfolio companies. The investment advisory agreements generally require that the investment adviser reduce the amount of management fees payable by the limited partners to the Partnership (“management fee reductions”) by an amount equal to a portion of the transaction and other fees paid to the Partnership by the portfolio companies. The amount of the reduction varies by fund, the type of fee paid by the portfolio company and the previously incurred expenses of the fund. These fees and associated management fee reductions are a component of the transaction price for our performance obligation to provide investment management services to the limited partners of funds and are recognized as changes to the transaction price in the period in which they are charged and the services are performed.

Management fee offsetscalculations based on committed capital or invested capital are reductions to management fees payable bymechanical in nature and therefore do not require the limited partnersuse of significant estimates or judgments. Management fee calculations based on net asset value, total assets, or investment fair value depend on the fair value of the Blackstone Funds, whichunderlying investments within the funds. Estimates and assumptions are basedmade when determining the fair value of the underlying investments within the funds and could vary depending on the amount such limited partners reimburse the Blackstone Funds or the Partnership primarilyvaluation methodology that is used as well as economic conditions. See “— Fair Value” below for placement fees. Providing investment management services requires the Partnership to arrange for services on behalf of its customers. In those situations where we are acting as an agent on behalffurther discussion of the limited partners of funds, it presentsjudgment required for determining the cost of services as net against management fee revenue. In all other situations, the Partnership is primarily responsible for fulfilling the services and is therefore acting as a principal for those arrangements. As a result, the cost of those services is presented gross as Compensation or General, Administrative and Other expense, as appropriate, with any reimbursement from the limited partnersfair value of the funds recorded as Management and Advisory Fees, Net.underlying investments.

Accrued but unpaid Management and Advisory Fees, net of management fee reductions and management fee offsets, as of the reporting date are included in Accounts Receivable or Due from Affiliates in the Condensed Consolidated Statements of Financial Condition.

Incentive Fees —Contractual fees earned based on the performance of Blackstone Funds (“Incentive Fees”) are a form of variable consideration in their contracts with customers to provide investment management services. Incentive Fees are earned based on fund performance during the period, subject to the achievement of minimum return levels, or high water marks, in accordance with the respective terms set out in each fund’s governing agreements. Incentive Fees will not be recognized as revenue until (a) it is probable that a significant reversal in the amount of cumulative revenue recognized will not occur, or (b) the uncertainty associated with the variable consideration is subsequently resolved. Incentive Fees are typically recognized as revenue when realized at the end of the measurement period. Once realized, such fees are not subject to clawback or reversal. Accrued but unpaid Incentive Fees charged directly to investors in Blackstone Funds as of the reporting date are recorded within Due from Affiliates in the Condensed Consolidated Statements of Financial Condition.

Investment Income (Loss)Investment Income (Loss) represents the unrealized and realized gains and losses on the Partnership’s Performance Allocations and Principal Investments.

In certain fund structures across private equity, real estate, hedge fund solutions and credit-focused funds (“carry funds”), Blackstone, through its subsidiaries, invests alongside its limited partners in a partnership and is entitled to itspro-rata share of the results of the fund (a“pro-rata allocation”). In addition to apro-rata allocation, and assuming certain investment returns are achieved, Blackstone is entitled to a disproportionate allocation of the income otherwise allocable to the limited partners, commonly referred to as carried interest (“Performance Allocations”).

Performance Allocations are made to the general partner based on cumulative fund performance to date, subject to a preferred return to limited partners. AtBlackstone has concluded that investments made alongside its limited partners in a partnership which entitle Blackstone to a Performance Allocation represent equity method investments that are not in the scope of the GAAP guidance on accounting for revenues from contracts with customers. Blackstone accounts for these arrangements under the equity method of accounting. Under the equity method Blackstone’s share of earnings (losses) from equity method investments is determined using a balance sheet approach referred to as the hypothetical liquidation at book value (“HLBV”) method. Under the HLBV method, at the end of each reporting period the PartnershipBlackstone calculates the balance of Accruedaccrued Performance Allocations that would be due to the PartnershipBlackstone for each fund pursuant to the fund agreements as if the fair value of the underlying investments were realized as of such date, irrespective of whether such amounts have been realized. As the fair value of underlying investments varies between reporting periods, it is necessary to make adjustments to amounts recorded as Accrued Performance Allocations to reflect either (a) positive performance resulting in an increase in the Accrued Performance Allocation to the general partner or (b) negative performance that would cause the amount due to the Partnership to be less than the amount previously recognized as revenue, resulting in a negative adjustment to the Accrued Performance Allocation to the general partner. In each scenario, it is necessary to calculate the Accrued Performance Allocation on cumulative results compared to the Accrued Performance Allocation recorded to date and make the required positive or negative adjustments. The Partnership ceases to record negative Performance Allocations once previously Accrued Performance Allocations for such fund have been fully reversed. The Partnership is not obligated to pay guaranteed returns or hurdles, and therefore, cannot have negative Performance Allocations over the life of a fund. Accrued Performance Allocations as of the reporting date are reflected in Investments in the Condensed Consolidated Statements of Financial Condition.

Performance Allocations are realized when an underlying investment is profitably disposed of and the fund’s cumulative returns are in excess of the preferred return or, in limited instances, after certain thresholds for return of capital are met. Performance Allocations are subject to clawback to the extent that the Performance Allocation received to date exceeds the amount due to Blackstone based on cumulative results. As such,

The change in the fair value of the investments held by certain Blackstone Funds is a significant input into the accrued Performance Allocation calculation and accrual for potential repayment of previously received Performance Allocations, which is a component of Due to Affiliates, represents all amounts previously distributed to Blackstone HoldingsAllocations. Estimates andnon-controlling interest holders that would need to be repaid to the Blackstone carry funds if the Blackstone carry funds were to be liquidated based on the current fair value of the underlying funds’ investments as of the reporting date. The actual clawback liability, however, generally does not become realized until the end of a fund’s life except for certain funds, including certain Blackstone real estate funds, multi-asset class investment funds and credit-focused funds, which may have an interim clawback liability.

Principal Investments include the unrealized and realized gains and losses on the Partnership’s principal investments, including its investments in Blackstone Funds that assumptions are not consolidated and receivepro-rata

allocations, its equity method investments, and other principal investments. Income (Loss) on Principal Investments is realizedmade when the Partnership redeems all or a portion of its investment or when the Partnership receives cash income, such as dividends or distributions. Unrealized Income (Loss) on Principal Investments results from changes indetermining the fair value of the underlying investment as well asinvestments within the reversalfunds. See “— Fair Value” below for further discussion related to significant estimates and assumptions used for determining fair value of unrealized gain (loss) at the time an investment is realized.underlying investments.

Interest and Dividend RevenueFair Value — Interest and Dividend Revenue comprises primarily interest and dividend income earned on principal investments held by Blackstone.

Other Revenue — Other Revenue consistsThe Partnership uses fair value throughout the reporting process. For a description of miscellaneous income and foreign exchange gains and losses arising on transactions denominated in currencies other than U.S. dollars.

Expenses

Our expenses include compensation and benefits expense and general and administrative expenses. Ourour accounting policies related thereto are as follows:

Compensation and Benefitsto valuation, see Note 2. “Summary of Significant Accounting Policies — Compensation — Compensation and Benefits consists of (a) employee compensation, comprising salary and bonus, and benefits paid and payable to employees and senior managing directors and (b) equity-based compensation associated with the grants of equity-based awards to employees and senior managing directors. Compensation cost relating to the issuance of equity-based awards to senior managing directors and employees is measured at fair value at the grant date, taking into consideration expected forfeitures, and expensed over the vesting period on a straight-line basis, except in the case of (a) equity-based awards that do not require future service, which are expensed immediately and (b) certain awards to recipients that meet specified criteria making them eligible for retirement treatment (allowing such recipient to keep a percentage of those awards upon departure from Blackstone after becoming eligible for retirement), for which the expense for the portion of the award that would be retained in the event of retirement is either expensed immediately or amortized to the retirement date. Cash settled equity-based awards are classified as liabilities and are remeasured at the end of each reporting period.

Compensation and Benefits — Incentive Fee Compensation —Incentive Fee Compensation consists of compensation paid based on Incentive Fees.

Compensation and Benefits — Performance Allocations Compensation —Performance Allocation Compensation consists of compensation paid based on Performance Allocations (which may be distributed in cash orin-kind). Such compensation expense is subject to both positive and negative adjustments. Unlike Performance Allocations, compensation expense is based on the performance of individual investments held by a fund rather than on a fund by fund basis. These amounts may also include allocations of investment income from Blackstone’s principal investments, to senior managing directors and employees participating in certain profit sharing initiatives.

Other Operating Expenses — Other Operating Expenses represents general and administrative expenses including interest expense, occupancy and equipment expenses and other expenses, which consist principally of professional fees, public company costs, travel and related expenses, communications and information services and depreciation and amortization.

Fund Expenses — The expenses of our consolidated Blackstone Funds consist primarily of interest expense, professional fees and other third party expenses.

Fair Value of Financial InstrumentsInstruments” and “Summary of Significant Accounting Policies — Investments at Fair Value” in the “Notes to Condensed Consolidated Financial Statements” in “Part I. Item 1. Financial Statements” of this filing. The following discussion is intended to provide supplemental information about how the application of fair value principles

impact our financial results, and management’s process for implementing those principles including areas of significant judgment.

The fair value of the investments held by Blackstone Funds is the primary input to the calculation of certain of our management fees, Incentive Fees, Performance Allocations and the related Compensation we recognize. The Blackstone Funds are accounted for as investment companies under the American Institute of Certified Public Accountants Accounting and Auditing Guide,Investment Companies, and in accordance with the GAAP establishesguidance on investment companies and reflect their investments, including majority-owned and controlled investments (the “Portfolio Companies”), at fair value. In the absence of observable market prices, we utilize valuation methodologies applied on a hierarchical disclosure framework which prioritizesconsistent basis and ranksassumptions that we believe market participants would use to determine the levelfair value of the investments. For some investments where little market price observability usedactivity may exist management’s determination of fair value is then based on the best information available in measuringthe circumstances, may incorporate management’s own assumptions and involves a significant degree of judgment, taking into consideration a combination of internal and external factors, including the appropriate risk adjustments fornon-performance and liquidity risks.

The Partnership has also elected the fair value option for certain instruments it owns directly, including loans and receivables and investments in private debt securities, the assets of consolidated CLO vehicles and other proprietary investments. The Partnership is required to measure certain financial instruments at fair value. Marketvalue, including debt instruments, equity securities and freestanding derivatives.

Fair Value of Investments or Instruments that are Publicly Traded

Securities that are publicly traded and for which a quoted market exists will be valued at the closing price observability is affected byof such securities in the principal market in which the security trades, or in the absence of a

number of factors, including principal market, in the type of financial instrument,most advantageous market on the characteristics specific to the financial instrument and the statevaluation date. When a quoted price in an active market exists, no block discounts or control premiums are permitted regardless of the marketplace, includingsize of the existencepublic security held. In some cases, securities will include legal and transparencycontractual restrictions limiting their purchase and sale for a period of transactions between market participants. Financial instruments with readily available quoted pricestime, such as may be required under SEC Rule 144 or by underwriters in active markets generally will have a higher degreecertain transactions. A discount to publicly traded price may be appropriate in those cases; the amount of market price observability and a lesser degree of judgment used in measuring fair value.

Financial instruments measured and reported at fair value are classified and disclosedthe discount shall be determined based on the observabilitytime period that must pass before the restricted security becomes unrestricted or otherwise available for sale.

Fair Value of inputs usedInvestments or Instruments that are not Publicly Traded

Investments for which market prices are not observable include private investments in the determinationequity or debt of operating companies or real estate properties. Our primary methodology for determining the fair values as follows:

Level I — Quoted prices are available in active markets for identical financial instruments as of such investments is the reporting date. The types of financial instruments in Level I include listed equities, listed derivatives and mutual funds with quoted prices. The Partnership does not adjust the quoted price for these investments, even in situations where Blackstone holds a large position and a sale could reasonably impact the quoted price.

Level II — Pricing inputs are other than quoted prices in active markets,income approach which are either directly or indirectly observable as of the reporting date, and fair value is determined through the use of models or other valuation methodologies. Financial instruments which are generally included in this category include corporate bonds and loans, including corporate bonds and loans held within CLO vehicles, government and agency securities, less liquid and restricted equity securities, and certainover-the-counter derivatives where the fair value is based on observable inputs. Senior and subordinated notes issued by CLO vehicles are classified within Level II of the fair value hierarchy.

Level III — Pricing inputs are unobservable for the financial instruments and includes situations where there is little, if any, market activity for the financial instrument. The inputs into the determinationprovides an indication of fair value require significant management judgment or estimation. Financial instruments that are included in this category generally include general and limited partnership interests in private equity and real estate funds, credit-focused funds, distressed debt andnon-investment grade residual interests in securitizations, certain corporate bonds and loans held within CLO vehicles, and certainover-the-counter derivatives where the fair value is based on unobservable inputs.the present value of cash flows that a business, security, or property is expected to generate in the future. The most widely used methodology under the income approach is the discounted cash flow method which includes significant assumptions about the underlying investment’s projected net earnings or cash flows, discount rate, capitalization rate and exit multiple. Our secondary methodology, generally used to corroborate the results of the income approach, is the market approach. The most widely used methodology under the market approach relies upon valuations for comparable public companies, transactions, or assets, and includes making judgments about which companies, transactions, or assets are comparable.

In certain cases the inputs used to measure fair value may fall into different levels of the fair value hierarchy. In such cases, the determination of which category within the fair value hierarchy is appropriate for any given financial instrument is based on the lowest level of input that is significant to the fair value measurement. The Partnership’s assessment of the significance of a particular input to the fair value measurement in its entirety requires judgmentdebt and considers factors specific to the financial instrument.

Transfers between levels of the fair value hierarchy are recognized at the beginning of the reporting period.

Level II Valuation Techniques

Financial instruments classified within Level II of the fair value hierarchy comprise debt instruments, including certain corporate loans and bonds held by Blackstone’s consolidated CLO vehicles and debt securities sold, not yet purchased. Certain equity securities and derivative instruments valued using observable inputs are also classified as Level II.

The valuation techniques used to value financial instruments classified within Level II of the fair value hierarchy are as follows:

Debt Instruments and Equity Securities are valued on the basis of prices from an orderly transaction between market participants provided by reputable dealers or pricing services. In determining the value of a particular investment, pricing services may use certain information with respect to transactions in such investments, quotations from dealers, pricing matrices and market transactions in comparable investments and various relationships between investments. The valuation of certain equity securities is based

Management Process on an observable price for an identical security adjusted forFair Value

Due to the effect of a restriction.

Freestanding Derivatives are valued using contractual cash flows and observable inputs comprising yield curves, foreign currency rates and credit spreads.

Senior and subordinate notes issued by CLO vehicles are classified based on the more observable fair value of CLO assets less (a) the fair value of any beneficial interests held by Blackstone, and (b) the carrying value of any beneficial interests that represent compensation for services.

Level III Valuation Techniques

In the absence of observable market prices, Blackstone values its investments using valuation methodologies applied on a consistent basis. For some investments little market activity may exist; management’s determinationimportance of fair value is then based onthroughout the best information availablecondensed consolidated financial statements and the significant judgment required to be applied in the circumstances,arriving at those fair values, we have developed a process around

valuation that incorporates several levels of approval and may incorporate management’s own assumptions and involves a significant degree of judgment, taking into consideration a combination ofreview from both internal and external factors, including the appropriate risk adjustments fornon-performance and liquidity risks. Investments for which market prices are not observable include privatesources. Blackstone Fund investments in the equity of operating companies, real estate properties, certain funds of hedge funds and credit-focused investments.

Private Equity Investments — The fair values of private equity investments are determined by reference to projected net earnings, earnings before interest, taxes, depreciation and amortization (“EBITDA”), the discounted cash flow method, public market or private transactions, valuations for comparable companies and other measures which, in many cases, are based on unaudited information at the time received. Valuations may be derived by reference to observable valuation measures for comparable companies or transactions (for example, multiplying a key performance metric of the investee company, such as EBITDA, by a relevant valuation multiple observed in the range of comparable companies or transactions), adjusted by management for differences between the investment and the referenced comparables, and in some instances by reference to option pricing models or other similar methods. Where a discounted cash flow method is used, a terminal value is derived by reference to EBITDA or price/earnings exit multiples.

Real Estate Investments —The fair values of real estate investments are determined by considering projected operating cash flows, sales of comparable assets, if any, and replacement costs, among other measures. The methods used to estimate the fair value of real estate investments include the discounted cash flow method and/or capitalization rates (“cap rates”) analysis. Valuations may be derived by reference to observable valuation measures for comparable companies or assets (for example, multiplying a key performance metric of the investee company or asset, such as EBITDA, by a relevant valuation multiple observed in the range of comparable companies or transactions), adjusted by management for differences between the investment and the referenced comparables, and in some instances by reference to option pricing models or other similar methods. Where a discounted cash flow method is used, a terminal value is derived by reference to an exit EBITDA multiple or capitalization rate. Additionally, where applicable, projected distributable cash flow through debt maturity will be considered in support of the investment’s fair value.

Credit-Focused Investments — The fair values of credit-focused investments are generally determined on the basis of prices between market participants provided by reputable dealers or pricing services. For credit-focused investments that are not publicly traded or whose market prices are not readily available, Blackstone may utilize other valuation techniques, including the discounted cash flow method or a market approach. The discounted cash flow method projects the expected cash flows of the debt instrument based on contractual terms, and discounts such cash flows back to the valuation date using a market-based yield. The market-based yield is estimated using yields of publicly traded debt instruments issued by companies operating in similar industries as the subject investment, with similar leverage statistics and time to maturity.

The market approach is generally used to determine the enterprise value of the issuer of a credit investment, and considers valuation multiples of comparable companies or transactions. The resulting enterprise value will dictate whether or not such credit investment has adequate enterprise value coverage. In cases of distressed credit instruments, the market approach may be used to estimate a recovery value in the event of a restructuring.

Level III Valuation Process

Investments classified within Level III of the fair value hierarchy are valued on a quarterly basis taking into consideration factors includingby our internal valuation teams, which are independent from our investment teams.

For investments valued utilizing the income method, our valuation team generally has a direct line of communication with each of the Portfolio Company finance teams and collects financial data used to support projections used in a discounted cash flow analysis. The valuation team then analyzes the data received and updates the valuation models reflecting any changes in Blackstone’sthe underlying discounted cash flow projections, weighted-average cost of capital, assumptions, discounted cash flow projections and exit multiple, assumptions,and any other valuation input relevant economic conditions.

The results of all valuations of investments held by Blackstone Fund and investment vehicles are reviewed by the relevant business unit’ssub-committee, which is made up of key personnel, typically the chief investment officer, chief operating officer, chief financial officer, chief compliance officer (or their respective equivalents where applicable) and other Senior Managing Directors in the business. Following review and approval by each business unit’ssub-committee, the results are reviewed and must be approved by Blackstone’s firm-wide valuation committee chaired by Blackstone’s Chief Financial Officer and including senior heads of each of Blackstone’s businesses, as well as any changes in economicrepresentatives from legal and other relevant conditions, and valuation models are updated accordingly. The valuation process also includesfinance. To further corroborate our results, we generally obtain a reviewpositive assurance opinion by an independent valuation party, at least annually for all investments and quarterly for certain investments, to corroborate the values determined by management. The valuations of Blackstone’s investments are reviewed quarterly by a valuation committee chaired by Blackstone’s Vice Chairman and includes senior heads of each of Blackstone’s businesses, as well as representatives of legal and finance.investments. Each quarter, the valuations of Blackstone’s investments are also reviewed by the Audit Committeeaudit committee comprised of ournon-employee directors in a meeting attended by the chairman of the valuation committee. The valuations are further tested by comparison to actual sales prices obtained on disposition of the investments.

Investments, at Fair Value

The Blackstone Funds are accounted for as investment companies under the American Institute of Certified Public Accountants Accounting and Auditing Guide,Investment Companies, and reflect their investments, including majority-owned and controlled investments (the “Portfolio Companies”), at fair value. Such consolidated funds’ investments are reflected in Investments on the Condensed Consolidated Statements of Financial Condition at fair value, with unrealized gains and losses resulting from changes in fair value reflected as a component of Net Gains from Fund Investment Activities in the Condensed Consolidated Statements of Operations. Fair value is the amount that would be received to sell an asset or paid to transfer a liability, in an orderly transaction between market participants at the measurement date, at current market conditions (i.e., the exit price).

Blackstone’s principal investments are presented at fair value with unrealized appreciation or depreciation and realized gains and losses recognized in the Condensed Consolidated Statements of Operations within Investment Income (Loss).

For certain instruments, the Partnership has elected the fair value option. Such election is irrevocable and is applied on an investment by investment basis at initial recognition. The Partnership has applied the fair value option for certain loans and receivables and certain investments in private debt securities that otherwise would not have been carried at fair value with gains and losses recorded in net income. The methodology for measuring the fair value of such investments is consistent with the methodology applied to private equity, real estate, credit-focused and funds of hedge funds investments. Changes in the fair value of such instruments are recognized in Investment Income (Loss) in the Condensed Consolidated Statements of Operations. Interest income on interest bearing loans and receivables and debt securities on which the fair value option has been elected is based on stated coupon rates adjusted for the accretion of purchase discounts and the amortization of purchase premiums. This interest income is recorded within Interest and Dividend Revenue.

The Partnership has elected the fair value option for the assets of consolidated CLO vehicles. As permitted under GAAP, the Partnership measures the liabilities of consolidated CLO vehicles as (a) the sum of the fair value of the consolidated CLO assets and the carrying value of any non-financial assets held temporarily, less (b) the sum of the fair value of any beneficial interests retained by the Partnership (other than those that represent compensation for services) and the Partnership’s carrying value of any beneficial interests that represent compensation for services. As a result of this measurement alternative, there is no attribution of amounts toNon-Controlling Interests for consolidated CLO vehicles. Assets of the consolidated CLOs are presented within Investments within the Condensed Consolidated Statements of Financial Condition and Liabilities within Loans Payable for the amounts due to unaffiliated third parties and Due to Affiliates for the amounts held bynon-consolidated affiliates. Changes in the fair value of consolidated CLO assets and liabilities and related interest, dividend and other income are presented within Net Gains from Fund Investment Activities. Expenses of consolidated CLO vehicles are presented in Fund Expenses.

The Partnership has elected the fair value option for certain proprietary investments that would otherwise have been accounted for using the equity method of accounting. The fair value of such investments is based on quoted prices in an active market or using the discounted cash flow method. Changes in fair value are recognized in Investment Income (Loss) in the Condensed Consolidated Statements of Operations.

Further disclosure on instruments for which the fair value option has been elected is presented in Note 7. “Fair Value Option” in the “Notes to Condensed Consolidated Financial Statements” in “Part I. Item 1. Financial Statements” of this filing.

The investments of consolidated Blackstone Funds in funds of hedge funds (“Investee Funds”) are valued at net asset value (“NAV”) per share of the Investee Fund. In limited circumstances, the Partnership may determine, based on its own due diligence and investment procedures, that NAV per share does not represent fair value. In such circumstances, the Partnership will estimate the fair value in good faith and in a manner that it reasonably chooses, in accordance with the requirements of GAAP.

Certain investments of Blackstone and of the consolidated Blackstone funds of hedge funds and credit-focused funds measure their investments in underlying funds at fair value using NAV per share without adjustment. The terms of the investee’s investment generally provide for minimum holding periods orlock-ups, the institution of gates on redemptions or the suspension of redemptions or an ability to side pocket investments, at the discretion of the investee’s fund manager, and as a result, investments may not be redeemable at, or within three months of, the reporting date. A side pocket is used by hedge funds and funds of hedge funds to separate investments that may lack a readily ascertainable value, are illiquid or are subject to liquidity restriction. Redemptions are generally not permitted until the investments within a side pocket are liquidated or it is deemed that the conditions existing at the time that required the investment to be included in the side pocket no longer exist. As the timing of either of these events is uncertain, the timing at which the Partnership may redeem an investment held in a side pocket cannot be estimated. Further disclosure on instruments for which fair value is measured using NAV per share is presented in Note 5. “Net Asset Value as Fair Value” in the “Notes to Condensed Consolidated Financial Statements” in “Part I. Item 1. Financial Statements” of this filing.

Intangibles and Goodwill

Blackstone’s intangible assets consist of contractual rights to earn future fee income, including management and advisory fees, Incentive Fees and Performance Allocations. Identifiable finite-lived intangible assets are amortized on a straight-line basis over their estimated useful lives, ranging from three to twenty years, reflecting the contractual lives of such assets. Amortization expense is included within General, Administrative and Other in the Condensed Consolidated Statements of Operations. The Partnership does not hold any indefinite-lived intangible assets. Intangible assets are reviewed for impairment when events or changes in circumstances indicate that the carrying amount may not be recoverable.

Goodwill comprises goodwill arising from the contribution and reorganization of the Partnership’s predecessor entities in 2007 immediately prior to its IPO, the acquisition of GSO in 2008 and the acquisition of Strategic Partners in 2013 and the acquisition of Harvest in 2017. Goodwill is reviewed for impairment at least annually utilizing a qualitative or quantitative approach, and more frequently if circumstances indicate impairment may have occurred. The impairment testing for goodwill under the qualitative approach is based first on a qualitative assessment to determine if it is more likely than not that the fair value of Blackstone’s operating segments is less than their respective carrying values. The operating segment is the reporting level for testing the impairment of goodwill. If it is determined that it is more likely than not that an operating segment’s fair value is less than its carrying value or when the quantitative approach is used, atwo-step quantitative assessment is performed to (a) calculate the fair value of the operating segment and compare it to its carrying value, and (b) if the carrying value exceeds its fair value, to measure an impairment loss.

Senior management has organized the firm into four operating segments. All of the components in each segment have similar economic characteristics and senior management makes key operating decisions based on the

performance of each segment. Therefore, we believe that operating segment is the appropriate reporting level for testing the impairment of goodwill.

The carrying value of goodwill was $1.8 billion as of June 30, 2018 and December 31, 2017. At June 30, 2018 and December 31, 2017, we determined that there was no evidence of goodwill impairment.

Off-Balance Sheet Arrangements

In the normal course of business, we enter into variousengage inoff-balance sheet arrangements, including sponsoringtransactions in derivatives, guarantees, commitments, indemnifications and owning limited or general partner interests in consolidated andnon-consolidated funds, entering into derivative transactions, entering into operating leases and entering into guarantee arrangements. We also have ongoing capital commitment arrangements with certain of our consolidated andnon-consolidated drawdown funds.potential contingent repayment obligations. We do not have anyoff-balance sheet arrangements that would require us to fund losses or guarantee target returns to investors in our funds.

Further disclosure on ouroff-balance sheet arrangements is presented in the “Notes to Condensed Consolidated Financial Statements” in “Part I. Item 1. Financial Statements” of this filing as follows:

Note 6. “Derivative Financial Instruments”,


Note 9. “Variable Interest Entities”, and


Note 17.18. “Commitments and Contingencies — Commitments — Investment Commitments” and “— Contingencies — Guarantees”.

Recent Accounting Developments

Information regarding recent accounting developments and their impact on Blackstone can be found in Note 2. “Summary of Significant Accounting Policies” in the “Notes to Condensed Consolidated Financial Statements” in “Part I. Item 1. Financial Statements” of this filing.

Item 3.  Quantitative and Qualitative Disclosures About Market Risk

ITEM 3.

QUANTITATIVE AND QUALITATIVE DISCLOSURES ABOUT MARKET RISK

Our predominant exposure to market risk is related to our role as general partner or investment adviser to the Blackstone Funds and the sensitivities to movements in the fair value of their investments, including the effect on management fees, performance revenues and investment income.

Although the Blackstone Funds share many common themes, each of our alternative asset management operations runs its own investment and risk management processes, subject to our overall risk tolerance and philosophy:


The investment process of our carry funds involves a detailed analysis of potential investments, and asset management teams are assigned to oversee the operations, strategic development, financing and capital deployment decisions of each portfolio investment. Key investment decisions are subject to approval by the applicable investment committee, which is comprised of Blackstone senior managing directors and senior management.

the applicable investment committee, which is comprised of Blackstone senior managing directors and senior management.


In our capacity as adviser to certain funds in our Hedge Fund Solutions and Credit segments, we continuously monitor a variety of markets for attractive trading opportunities, applying a number of traditional and customized risk management metrics to analyze risk related to specific assets or portfolios. In addition, we perform extensive credit and cash flow analyses of borrowers, credit-based assets and underlying hedge fund managers, and have extensive asset management teams that monitor covenant compliance by, and relevant financial data of, borrowers and other obligors, asset pool performance statistics, tracking of cash payments relating to investments and ongoing analysis of the credit status of investments.

Effect on Fund Management Fees

Our management fees are based on (a) third parties’ capital commitments to a Blackstone Fund, (b) third parties’ capital invested in a Blackstone Fund or (c) the net asset value, or NAV, of a Blackstone Fund, as described in our Condensed Consolidated Financial Statements. Management fees will only be directly affected by short-term changes in market conditions to the extent they are based on NAV or represent permanent impairments of value. These management fees will be increased (or reduced) in direct proportion to the effect of changes in the fair value of our investments in the related funds. The proportion of our management fees that are based on NAV is dependent on the number and types of Blackstone Funds in existence and the current stage of each fund’s life cycle. For the sixthree months ended June 30,March 31, 2019 and March 31, 2018, and June 30, 2017, the percentages of our fund management fees based on the NAV of the applicable funds or separately managed accounts, were as follows:


   Six Months Ended
June 30,
 
   2018  2017 

Fund Management Fees Based on the NAV of the Applicable Funds or Separately Managed Accounts

   36  33
                                                
   Three Months Ended
   March 31,
   2019 2018

Fund Management Fees Based on the NAV of the Applicable Funds or Separately Managed Accounts

   39  34

Market Risk

The Blackstone Funds hold investments which are reported at fair value. Based on the fair value as of June 30,March 31, 2019 and March 31, 2018, and June 30, 2017, we estimate that a 10% decline in fair value of the investments would result in the following declines in Management Fees, Performance Revenues, Net of Related Compensation Expense and Investment Income:


   June 30, 
   2018   2017 
   Management
Fees (a)
   Performance
Revenues, Net of
Related
Compensation
Expense (b)
   Investment
Income (b)
   Management
Fees (a)
   Performance
Revenues, Net
of Related
Compensation
Expense (b)
   Investment
Income (b)
 
   (Dollars in Thousands) 

10% Decline in Fair Value of the Investments

  $81,847   $1,398,609   $194,951   $90,486   $1,211,590   $173,568 
                                                                                                                                                
   March 31,
   2019  2018
      Performance        Performance   
      Revenues,        Revenues,   
      Net of Related        Net of Related   
   Management  Compensation  Investment  Management  Compensation  Investment
   Fees (a)  Expense (b)  Income (b)  Fees (a)  Expense (b)  Income (b)
   (Dollars in Thousands)

10% Decline in Fair Value of the Investments

   $119,049    $1,553,981    $172,363    $79,791    $1,427,077    $196,308 


(a)

Represents the annualized effect of the 10% decline.

(b)

Represents the reporting date effect of the 10% decline.

Total Assets Under Management, excluding undrawn capital commitments and the amount of capital raised for our CLOs, by segment, and the percentage amount classified as Level III investments as defined within the fair value standards of GAAP, are as follows:


  June 30, 2018   March 31, 2019
  Total Assets Under Management,
Excluding Undrawn Capital
Commitments and the Amount of
Capital Raised for CLOs
   Percentage Amount
Classified as Level III
Investments
   Total Assets Under Management,   
  (Dollars in Thousands)       Excluding Undrawn Capital  Percentage Amount
  Commitments and the Amount of  Classified as Level III
  Capital Raised for CLOs  Investments
  (Dollars in Thousands)   

Real Estate

   $                    97,760,353  85%

Private Equity

  $66,163,644    67   $                    74,101,678  69%

Real Estate

  $85,022,062    83

Credit

  $74,267,341    33   $                    76,507,314  34%

The fair value of our investments and securities can vary significantly based on a number of factors that take into consideration the diversity of the Blackstone Funds’ investment portfolio and on a number of factors and inputs such as similar transactions, financial metrics, and industry comparatives, among others. See “Part I. Item 1A. Risk

Factors” in our Annual Report onForm 10-K for the year ended December 31, 2017.2018. Also see “Part I. Item 2. Management’s Discussion and Analysis of Financial Condition and Results of Operations — Critical Accounting Policies — Investments, at Fair Value”. We believe these fair value amounts should be utilized with caution as our intent and strategy is to hold investments and securities until prevailing market conditions are beneficial for investment sales.

Investors in all of our carry funds (and certain of our credit-focused funds and funds of hedge funds) make capital commitments to those funds that we are entitled to call from those investors at any time during prescribed periods. We depend on investors fulfilling their commitments when we call capital from them in order for those funds to consummate investments and otherwise pay their related obligations when due, including management fees. We have not had investors fail to honor capital calls to any meaningful extent and any investor that did not fund a capital call would be subject to having a significant amount of its existing investment forfeited in that fund; however, if investors were to fail to satisfy a significant amount of capital calls for any particular fund or funds, those funds could be materially and adversely affected.

Exchange Rate Risk

The Blackstone Funds hold investments that are denominated innon-U.S. dollar currencies that may be affected by movements in the rate of exchange between the U.S. dollar andnon-U.S. dollar currencies. Additionally, a portion of our management fees are denominated innon-U.S. dollar currencies. We estimate that as of June 30,March 31, 2019 and March 31, 2018, and June 30, 2017, a 10% decline in the rate of exchange of all foreign currencies against the U.S. dollar would result in the following declines in Management Fees, Performance Revenues, Net of Related Compensation Expense and Investment Income:

   June 30, 
   2018   2017 
   Management
Fees (a)
   Performance
Revenues, Net of
Related
Compensation
Expense (b)
   Investment
Income (b)
   Management
Fees (a)
   Performance
Revenues, Net of
Related
Compensation
Expense (b)
   Investment
Income (b)
 
   (Dollars in Thousands) 

10% Decline in the Rate of Exchange of All Foreign Currencies Against the U.S. Dollar

  $19,067   $324,948   $31,021   $10,790   $299,715   $29,360 
                                                                                                                                                
   March 31,
   2019  2018
      Performance        Performance   
      Revenues,        Revenues,   
      Net of Related        Net of Related   
   Management  Compensation  Investment  Management  Compensation  Investment
   Fees (a)  Expense (b)  Income (b)  Fees (a)  Expense (b)  Income (b)
   (Dollars in Thousands)

10% Decline in the Rate of Exchange of All Foreign Currencies Against the U.S. Dollar

   $21,116    $391,498    $23,726    $21,035    $349,169    $26,591 


(a)

Represents the annualized effect of the 10% decline.

(b)

Represents the reporting date effect of the 10% decline.

Interest Rate Risk

Blackstone has debt obligations payable that accrue interest at variable rates. Interest rate changes may therefore affect the amount of our interest payments, future earnings and cash flows. Based on our debt obligations payable as of June 30,March 31, 2019 and March 31, 2018, and June 30, 2017, we estimate that interest expense relating to variable rates would increase on an annual basis, in the event interest rates were to increase by one percentage point, as follows:


   June 30, 
   2018   2017 
   (Dollars in Thousands) 

Annualized Increase in Interest Expense Due to a One Percentage Point Increase in Interest Rates

  $28   $28 
                                                
   March 31,
   2019  2018
   (Dollars in Thousands)

Annualized Increase in Interest Expense Due to a One Percentage Point Increase in Interest Rates (a)

   $    $28 

(a)

As of March 31, 2019 Blackstone had no such debt obligations payable outstanding.

Blackstone has a diversified portfolio of liquid assets to meet the liquidity needs of various businesses. This portfolio includes cash, open ended money market mutual funds, open ended bond mutual funds, marketable

investment securities, freestanding derivative contracts, repurchase and reverse repurchase agreements and other investments. If interest rates were to increase by one percentage point, we estimate that our annualized investment income would decrease, offset by an estimated increase in interest income on an annual basis from interest on floating rate assets, as follows:


   June 30, 
   2018   2017 
   Annualized
Decrease in
Investment
Income
  Annualized
Increase in
Interest Income
from Floating
Rate Assets
   Annualized
Decrease in
Investment
Income
  Annualized
Increase in
Interest Income
from Floating
Rate Assets
 
   (Dollars in Thousands) 

One Percentage Point Increase in Interest Rates

  $22,267(a)  $23,892   $33,166(a)  $23,769 
                                                                                                
   March 31,
   2019  2018
     Annualized    Annualized
   Annualized Increase in  Annualized Increase in
   Decrease in Interest Income  Decrease in Interest Income
   Investment from Floating  Investment from Floating
   Income Rate Assets  Income Rate Assets
   (Dollars in Thousands)

One Percentage Point Increase in Interest Rates

   $3,830(a)   $28,158    $12,911(a)   $19,068 


(a)

As of June 30,March 31, 2019 and 2018, and 2017, this represents 0.4%0.1% and 0.7%0.3% of our portfolio of liquid assets, respectively.

Blackstone has U.S. dollar andnon-U.S. dollar based interest rate derivatives whose future cash flows and present value may be affected by movement in their respective underlying yield curves. We estimate that as of June 30, 2018,March 31, 2019, a one percentage point increase parallel shift in global yield curves would result in the following impact on Other Revenue:


   June 30, 
   2018   2017 
   (Dollars in Thousands) 

Annualized Increase in Other Revenue Due to a One Percentage Point Increase in Interest Rates

  $19,413   $—  (a) 
                                                
   March 31,
   2019  2018
   (Dollars in Thousands)

Annualized Increase in Other Revenue Due to a One Percentage Point Increase in Interest Rates

   $15,119    $25,019 

(a)

Blackstone held no interest rate risk derivatives as of June 30, 2017 which impact Other Revenue.

Credit Risk

Certain Blackstone Funds and the Investee Funds are subject to certain inherent risks through their investments.

Our portfolio of liquid assets contain certain credit risks including, but not limited to, exposure to uninsured deposits with financial institutions, unsecured corporate bonds and mortgage-backed securities. These exposures are actively monitored on a continuous basis and positions are reallocated based on changes in risk profile, market or economic conditions.

We estimate that our annualized investment income would decrease, if credit spreads were to increase by one percentage point, as follows:


   June 30, 
   2018   2017 
   (Dollars in Thousands) 

Decrease in Annualized Investment Income Due to a One Percentage Point Increase in Credit Spreads (a)

  $36,437   $48,103 
                                                
   March 31,
   2019  2018
   (Dollars in Thousands)

Decrease in Annualized Investment Income Due to a One Percentage Point Increase in Credit Spreads (a)

   $75,148    $32,724 


(a)

As of June 30,March 31, 2019 and 2018, and 2017, this represents 0.7%1.9% and 1.0%0.7% of our portfolio of liquid assets, respectively.

Certain of our entities hold derivative instruments that contain an element of risk in the event that the counterparties may be unable to meet the terms of such agreements. We minimize our risk exposure by limiting the counterparties with which we enter into contracts to banks and investment banks that meet established credit and capital guidelines. We do not expect any counterparty to default on its obligations and therefore do not expect to incur any loss due to counterparty default.

Item 4.  Controls and Procedures

ITEM 4.

CONTROLS AND PROCEDURES

We maintain “disclosure controls and procedures,” as such term is defined inRules 13a-15(e) and15d-15(e) under the Securities Exchange Act of 1934 (the “Exchange Act”), that are designed to ensure that information required to be disclosed by us in reports that we file or submit under the Exchange Act is recorded, processed, summarized and reported within the time periods specified in Securities and Exchange Commission rules and forms, and that such information is accumulated and communicated to our management, including our Chief Executive Officer and Chief Financial Officer, as appropriate, to allow timely decisions regarding required disclosure. In designing disclosure controls and procedures, our management necessarily was required to apply its judgment in evaluating the cost-benefit relationship of possible disclosure controls and procedures. The design of any disclosure controls and procedures also is based in part upon certain assumptions about the likelihood of future events, and there can be no assurance that any design will succeed in achieving its stated goals under all potential future conditions. Any controls and procedures, no matter how well designed and operated, can provide only reasonable assurance of achieving the desired objectives.

Our management, including our Chief Executive Officer and Chief Financial Officer, evaluated the effectiveness of our disclosure controls and procedures pursuant toRule 13a-15 under the Exchange Act as of the end of the period covered by this report. Based on that evaluation, our Chief Executive Officer and Chief Financial Officer have concluded that, as of the end of the period covered by this report, our disclosure controls and procedures (as defined inRule 13a-15(e) under the Exchange Act) are effective at the reasonable assurance level to accomplish their objectives of ensuring that information we are required to disclose in reports that we file or submit under the Exchange Act is recorded, processed, summarized and reported within the time periods specified in Securities and Exchange Commission rules and forms, and that such information is accumulated and communicated to our management, including our Chief Executive Officer and Chief Financial Officer, as appropriate, to allow timely decisions regarding required disclosure.

No change in our internal control over financial reporting (as such term is defined inRules 13a-15(f) and15d-15(f) under the Exchange Act) occurred during our most recent quarter, that has materially affected, or is reasonably likely to materially affect, our internal control over financial reporting.

PARTPart II.    OTHER INFORMATIONOther Information

Item 1.  Legal Proceedings

ITEM 1.

LEGAL PROCEEDINGS

We may from time to time be involved in litigation and claims incidental to the conduct of our business. Our businesses are also subject to extensive regulation, which may result in regulatory proceedings against us. See “Part I. Item 1A. Risk Factors” in our Annual Report onForm 10-K for the year ended December 31, 2017.2018. We are not currently subject to any pending legal (including judicial, regulatory, administrative or arbitrationarbitration) proceedings that we expect to have a material impact on our consolidated financial statements. However, given the inherent unpredictability of these types of proceedings and the potentially large and/or indeterminate amounts that could be sought, an adverse outcome in certain matters could have a material effect on Blackstone’s financial results in any particular period.

In December 2017, a purported derivative suit (Mayberry v. KKR & Co., L.P., et al.) was filed in the Commonwealth of Kentucky Franklin County Circuit Court on behalf of the Kentucky Retirement System (“KRS”) by eight of its members and beneficiaries alleging various breaches of fiduciary duty and other violations of Kentucky state law in connection with KRS’s investment in three hedge funds of funds, including a fund managed by Blackstone Alternative Asset Management L.P. (“BAAM L.P.”). The suit names more than 30 defendants, including The Blackstone Group L.P.; BAAM L.P.; Stephen A. Schwarzman, as Chairman and CEO of Blackstone; and J. Tomilson Hill, as then-President and CEO of the Hedge Fund Solutions Group, Vice Chairman of Blackstone and CEO of BAAM (collectively, the “Blackstone Defendants”). Aside from the Blackstone Defendants, the action also names current and former KRS trustees and former KRS officers and various other service providers to KRS and their related persons.

ITEM 1A.

The plaintiffs filed an amended complaint in January 2018. In November 2018, the Circuit Court granted one defendant’s motion to dismiss and denied all other defendants’ motions to dismiss, including those of the Blackstone Defendants. In January 2019, certain of the KRS trustee and officer defendants noticed appeals from the denial of the motions to dismiss to the Kentucky Court of Appeals, and also filed a motion to stay the Mayberry proceedings in Circuit Court pending the outcome of those appeals. In addition, several defendants, including Blackstone and BAAM L.P., filed petitions in the Kentucky Court of Appeals for a writ of prohibition against the ongoing Mayberry proceedings on the ground that the plaintiffs lack standing. In April 2019, the KRS trustee and officer defendants’ appeals were transferred to the Kentucky Supreme Court.

On April 23, 2019, the Kentucky Court of Appeals granted the Blackstone Defendants’ petition for a writ of prohibition and vacated the Circuit Court’s November 30, 2018 Opinion and Order denying the motion to dismiss for lack of standing. On April 24, 2019, the Mayberry Plaintiffs filed a notice of appeal of that order to the Kentucky Supreme Court.

Blackstone believes that this suit is totally without merit and intends to defend it vigorously.

Item 1A. Risk Factors

Following the Conversion, we expect to pay more corporate income taxes than we would have as a limited partnership.

On April 18, 2019, we announced our decision to convert The Blackstone Group L.P. from a limited partnership to a corporation. We anticipate that the Conversion will be effective on July 1, 2019. Following the Conversion, all of the net income attributable to the Corporation will be subject to U.S. federal (and state and local) corporate income taxes, which we anticipate will have a dilutive impact to Distributable Earnings per share of Class A Common Stock and net income attributable to the Corporation and reduce the amount of cash available for dividends to our Class A common stockholders, although this dilution should initially be mitigated by a tax basisstep-up related to the Conversion. As a result of the tax basisstep-up, we anticipate that the dilutive impact to Distributable Earnings from the Conversion will be negligible in the near-term and approximately 2% to 5% annually on average over the next five years. In the long-term, we expect tax dilution to Distributable Earnings to be in the 12% to 13% range annually. Our estimates of the dilutive impact of the Conversion toafter-tax earnings are presented for illustrative purposes only and are subject to various risks and uncertainties. Actual results could differ materially from these estimates. Among other things, these estimates are based on the currently enacted maximum U.S. federal corporate income tax rate of 21%. This rate may increase in the future, which would cause us to pay more corporate income taxes than currently anticipated.

Following the Conversion, because all of the net income attributable to the Corporation will be subject to corporate income taxes, we expect the amount of the Corporation’s cash tax savings from future exchanges of Blackstone Holdings Partnership Units for shares of Class A Common Stock to increase as compared to the cash tax savings historically realized by the Partnership from such exchanges for common units. As a result, we expect the amount the Corporation will be required to pay under the tax receivable agreement (i.e., 85% of cash tax savings it realizes) will in the aggregate over time be higher for exchanges following the Conversion. This would similarly have the effect of increasing the amount of any early termination payment or the amounts due upon the occurrence of an acceleration event, which are determined in part by reference to amounts payable in respect of future exchanges.

We may fail to realize the anticipated benefits of the Conversion or those benefits may take longer to realize than expected or not offset the costs of the Conversion, which could have a material and adverse impact on the trading price of our securities.

We believe that the Conversion will, among other things, make it significantly easier for both domestic and international investors to own our stock, expand our global investor base and drive greater value for all of our shareholders over time. However, the level of investor interest in our Class A Common Stock may not meet our expectations. For example, benchmark stock indices may change their eligibility requirements in a manner that is adverse to us or otherwise determine not to include our Class A Common Stock. Moreover, even if we succeed in having our shares included in key stock indices and simplify our tax structure and reporting, this may not result in the increased demand for our stock that we anticipate. Consequently, we may fail to realize the anticipated benefits of the Conversion or those benefits may take longer to realize than we expect. Moreover, there can be no assurance that the anticipated benefits of the Conversion will offset its costs, which could be greater than we expect, particularly if there were to be an increase in the U.S. federal corporate income tax rate. Our failure to achieve the anticipated benefits of the Conversion at all or in a timely manner, or a failure of any benefits realized to offset its costs, could have a material and adverse impact on the trading price of our securities.

Because our Class A Common Stock generally will benon-voting, we will not be required to comply with certain provisions of U.S. securities laws relating to proxy statements, shareholder proposals and other matters.

Our Class A Common Stock will generally benon-voting following the Conversion as the common units are today. As a result, the stockholder approval requirements of the NYSE will generally not apply to us following the Conversion. Accordingly, following the Conversion, we will continue not to be required to file proxy statements or information statements under Section 14 of the Exchange Act except in those limited circumstances where a vote

of holders of our Class A Common Stock is required under our certificate of incorporation or Delaware law. Accordingly, holders of Class A Common Stock will not begin to receive these materials as a result of the Conversion. In addition, we will continue not to be subject to the“say-on-pay” and“say-on-frequency” provisions of the Dodd-Frank Act. As a result, our Class A common stockholders will not have an opportunity to provide anon-binding vote on the compensation of our named executive officers. Moreover, holders of our Class A Common Stock will not be able to bring matters before our annual meeting of stockholders or nominate directors at such meeting, nor will they generally be able to submit stockholder proposals underRule 14a-8 of the Exchange Act.

RISK FACTORS

For a discussion of our other potential risks and uncertainties, see the information under the heading “Risk Factors” in our Annual Report onForm 10-K for the year ended December 31, 20172018 and in our subsequently filed Quarterly Reports onForm 10-Q, all of which are accessible on the Securities and Exchange Commission’s website at www.sec.gov.

See “Part I. Item 2. Management’s Discussion and Analysis of Financial Condition and Results of Operations — Business Environment” in this report for a discussion of the conditions in the financial markets and economic conditions affecting our businesses. This discussion updates, and should be read together with, the risk factor entitled “Difficult market conditions can adversely affect our business in many ways, including by reducing the value or performance of the investments made by our investment funds and reducing the ability of our investment funds to raise or deploy capital, each of which could materially reduce our revenue, earnings and cash flow and adversely affect our financial prospects and condition.” in our Annual Report onForm 10-K for the year ended December 31, 2017.2018.

The risks described above, in our Annual Report onForm 10-K and in our subsequently filed Quarterly Reports onForm 10-Q, are not the only risks facing us. Additional risks and uncertainties not currently known to us or that we currently deem to be immaterial also may materially adversely affect our business, financial condition and/or operating results.

Item 2. Unregistered Sales of Equity Securities and Use of Proceeds

ITEM 2.

UNREGISTERED SALES OF EQUITY SECURITIES AND USE OF PROCEEDS

The following table sets forth information regarding repurchases of our common units during the quarter ended June 30, 2018.March 31, 2019:


Period

  Total Number
of Units
Purchased
   Average
Price Paid
per Unit
   Total Number of Units
Purchased as Part of
Publicly Announced
Plans or Programs (a)
   Approximate Dollar
Value of Units that
May Yet Be Purchased
Under the Program
(Dollars in Thousands) (a)
 

Apr. 1 — Apr. 30, 2018

   —     $—      —     $1,000,000 

May 1 — May 31, 2018

   217,390   $31.68    217,390   $993,113 

Jun. 1 — Jun. 30, 2018

   1,982,610   $32.68    1,982,610   $928,315 


   2,200,000      2,200,000   


Period

  Total Number
of Units
Purchased
  Average
Price Paid
per Unit
  Total Number of Units
Purchased as Part of
Publicly Announced
Plans or Programs (a)
  Approximate Dollar
Value of Units that
May Yet Be Purchased
Under the Program
(Dollars in Thousands) (a)

Jan. 1 - Jan. 31, 2019

      $       $458,499 

Feb. 1 - Feb. 28, 2019

   1,544,115   $33.77    1,544,115   $406,350 

Mar. 1 - Mar. 31, 2019

      $       $406,350 


   1,544,115      1,544,115   


(a)

On April 16, 2018, the Boardboard of Directorsdirectors of our general partner, Blackstone Group Management L.L.C., authorized the repurchase of up to $1.0 billion of Blackstone common units and Blackstone Holdings Partnership Units. Under the unit repurchase program, units may be repurchased from time to time in open market transactions, in privately negotiated transactions or otherwise. The timing and the actual number of units repurchased will depend on a variety of factors, including legal requirements, price and economic and market

conditions. The unit repurchase program may be changed, suspended or discontinued at any time and does not have a specified expiration date. See “Part I. Item 1. Financial Statements Notes to Condensed Consolidated Financial Statements – Note 14.15. Net Income Per Common Unit” and “Part I. Item 2. Management’s Discussion and Analysis of Financial Condition and Results of Operations – Liquidity and Capital Resources Sources and Uses of Liquidity” for further information regarding this unit repurchase program.

As permitted by our policies and procedures governing transactions in our securities by our directors, executive officers and other employees, from time to time some of these persons may establish plans or arrangements complying withRule 10b5-1 under the Exchange Act, and similar plans and arrangements relating to our common units and Blackstone Holdings Partnership Units.

Item 3. Defaults Upon Senior Securities

ITEM 3.

DEFAULTS UPON SENIOR SECURITIES

Not applicable.

Item 4. Mine Safety Disclosures

ITEM 4.

MINE SAFETY DISCLOSURES

Not applicable.

Item  5. Other Information

ITEM 5.

OTHER INFORMATION

None.

Item 6. Exhibits

ITEM 6.

EXHIBITS


Exhibit
Number


Exhibit Description

  10.1*3.1*  Form of Aircraft Dry Lease Agreement between GH4 Partners LLC andPost-Conversion Certificate of Incorporation of The Blackstone Administrative Services Partnership L.P.Group Inc.
  10.2*3.2*  Form of Aircraft Dry Lease Agreement between XB Partners LLC andPost-Conversion Bylaws of The Blackstone Administrative Services Partnership L.P.Group Inc.
  10.3*Form of Aircraft Dry Lease Agreement between GBBX Associates LLC, WLBX LLC and Blackstone Administrative Services Partnership L.P.
31.1*  Certification of the Chief Executive Officer pursuant to Rule13a-14(a).
31.2*  Certification of the Chief Financial Officer pursuant to Rule13a-14(a).
32.1*  Certification of the Chief Executive Officer pursuant to 18 U.S.C. Section 1350, as adopted pursuant to Section 906 of the Sarbanes-Oxley Act of 2002 (furnished herewith).
32.2*  Certification of the Chief Financial Officer pursuant to 18 U.S.C. Section 1350, as adopted pursuant to Section 906 of the Sarbanes-Oxley Act of 2002 (furnished herewith).
101.INS*  XBRL Instance Document.
101.SCH*  XBRL Taxonomy Extension Schema Document.
101.CAL*  XBRL Taxonomy Extension Calculation Linkbase Document.
101.DEF*  XBRL Taxonomy Extension Definition Linkbase Document.
101.LAB*  XBRL Taxonomy Extension Label Linkbase Document.
101.PRE*  XBRL Taxonomy Extension Presentation Linkbase Document.


*

Filed herewith.

The agreements and other documents filed as exhibits to this report are not intended to provide factual information or other disclosure other than with respect to the terms of the agreements or other documents themselves, and you should not rely on them for that purpose. In particular, any representations and warranties made by us in these agreements or other documents were made solely within the specific context of the relevant agreement or document and may not describe the actual state of affairs as of the date they were made or at any other time.

SIGNATURESSignatures

Pursuant to the requirements of the Securities Exchange Act of 1934, the Registrant has duly caused this report to be signed on its behalf by the undersigned thereunto duly authorized.

Date:    August 8, 2018May 9, 2019


The Blackstone Group L.P.
By: 

Blackstone Group Management L.L.C.,

its General Partner

 its General Partner

/s/ Michael S. Chae

Name: Michael S. Chae
Title: Chief Financial Officer
 (Principal Financial Officer and
Authorized Signatory)


145

130