Item 2. Management’s Discussion and Analysis of Financial Condition and Results of Operations.
References herein to “Company,” “we,” “us,” or “our” refer to Nuveen Global Cities REIT, Inc. and its subsidiaries unless the context specifically requires otherwise.
The following discussion should be read in conjunction with the unaudited consolidated financial statements and notes thereto appearing elsewhere in this Quarterly Report on Form
10-Q. In addition to historical data, this discussion contains forward-looking statements about our business, operations and financial performance based on current expectations that involve risks, uncertainties and assumptions. Our actual results may differ materially from those in this discussion as a result of various factors, including but not limited to those discussed under
“Risk“Item 1A. Risk Factors” in our
Registration Statement filed pursuant to Rule 424(b)(3) as filedAnnual Report on
JanuaryForm 10-K for the year ended December 31,
2018.2019 and elsewhere in this Quarterly Report on Form 10-Q.
Forward-Looking Statements
This Quarterly Report on Form
10-Q contains forward-looking statements about our business, operations and financial performance, including, in particular, statements about our plans, strategies and objectives. You can generally identify forward-looking statements by our use of forward-looking terminology such as “may,” “will,” “expect,” “intend,” “anticipate,” “estimate,” “believe,” “continue” or other similar words. These statements include our plans and objectives for future operations, including plans and objectives relating to future growth and availability of funds, and are based on current expectations that involve numerous risks, uncertainties and assumptions. Assumptions relating to these statements involve judgments with respect to, among other things, future economic, competitive and market conditions and future business decisions, all of which are difficult or impossible to accurately predict and many of which are beyond our control. Although we believe the assumptions underlying the forward-looking statements, and the forward-looking statements themselves, are reasonable, any of the assumptions could be inaccurate and, therefore, there can be no assurance that these forward-looking statements will prove to be accurate and our actual results, performance and achievements may be materially different from that expressed or implied by these forward-looking statements as a result of various factors, including but not limited to those discussed under “Risk Factors” in
ourAnnual Report on Form
10-K for the year ended December 31,
2018,2019, and elsewhere in this Quarterly Report on Form
10-Q. In light of the significant uncertainties inherent in these forward-looking statements, the inclusion of this information should not be regarded as a representation by us or any other person that our objectives and plans, which we consider to be reasonable, will be achieved. Readers are cautioned not to place undue reliance on these forward-looking statements, which speak only as of the date this Quarterly Report on Form
10-Q is filed with the
SEC.Securities and Exchange Commission (the “SEC”). Except as required by law, we do not undertake to update or revise any forward-looking statements contained in this Quarterly Report on Form
10-Q.While management believes the assumptions underlying any of its forward-looking statements and information to be reasonable, such information may be subject to uncertainties and may involve certain risks which may be difficult to predict and are beyond management’s control. These risks and uncertainties could cause actual results to differ materially from those contained in any forward-looking statement. These risks and uncertainties include, but are not limited to, the risks associated with the following:
•COVID-19 Risks. In response to the novel coronavirus pandemic (commonly known as “COVID-19”), governmental authorities throughout the world, including the United States, have taken significant measures to inhibit the spread of the disease, such as prohibiting people from congregating in heavily populated areas, instituting localized quarantines, restricting nonessential travel, issuing “stay-at-home” orders, closing schools, and most notably, restricting the types of businesses that may continue to operate. The restrictions have had an adverse impact on economic and market conditions across the world. It is possible that public health officials and governmental authorities in the markets in which we have investments may impose additional restrictions in an effort to further slow the spread of the COVID-19 pandemic or may relax or revoke existing restrictions too quickly, which could, in either case, exacerbate the severity of adverse impacts on the economy. Moreover, the market volatility and economic uncertainty surrounding the COVID-19 pandemic may negatively impact our liquid investments, such as those in REIT securities, and our investments in the International Affiliated Funds. These and other consequences of the COVID-19 pandemic are expected to have an adverse effect on the Company’s business and results of operations.
Nuveen Global Cities REIT, Inc. is a Maryland corporation formed on May 1, 2017.2017 and qualifies as a real estate investment trust (“REIT”) for U.S. federal income tax purposes commencing with the taxable year ended December 31, 2018. We were formed to invest in properties in or around certain global cities selected for their resilience, long-term structural performance and ability to deliver an attractive and stable distribution yield. We expect that a majority of our real estate investments will be located in the United States and that a substantial but lesser portion of our portfolio will include real properties located in Canada, Europe and the Asia-Pacific region. We will seek to complement our real property investments by investing a smaller portion of our portfolio in real estate-related assets. We are externally managed by our advisor, Nuveen Real Estate Global
Cities Advisors, LLC (“Nuveen Real Estate Global Cities Advisors” or the “Advisor”), an investment advisory affiliate of Nuveen Real Estate. Nuveen Real Estate is the real estate investment management division of our sponsor, Nuveen, LLC (together with its affiliates, “Nuveen” or the “Sponsor”). Nuveen is the asset management arm and wholly owned subsidiary of Teachers Insurance and Annuity Association of America (“TIAA”). We intend to elect to be taxed as a real estate investment trust (“REIT”) for U.S. federal income tax purposes.
On January 31, 2018, our Registration Statement on Form
S-11 was declared effective by the
Securities and Exchange Commission (the “SEC”).SEC. We have registered with the SEC an offering of up to $5 billion in shares of common stock (the “Offering”), consisting of up to $4 billion in shares in our primary offering and up to $1 billion in shares pursuant to our distribution reinvestment plan. We intend to publicly sell any combination of four classes of shares of our common stock, Class
DT shares, Class S shares, Class
TD shares and Class I shares, with a dollar value up to the maximum offering amount. The publicly offered share classes have different upfront selling commissions and ongoing stockholder servicing fees. The purchase price per share for each class of common stock in the Offering will vary and will generally equal our prior month’s
Net Asset Valuenet asset value (“NAV”) per share, as calculated monthly, plus applicable upfront selling commissions and dealer manager fees.
TIAA Investment
TIAA invested $200,000 through the purchase of 20,000 shares of common stock at $10.00 per share as our initial capitalization. Subsequent to our initial capitalization, TIAA purchased
$300$300.0 million in shares (less the $200,000 initial capitalization amount) and has fully funded its commitment to purchase
$300$300.0 million of our Class N common stock.
Q1 2020 Highlights
Operating results:
•Raised $42.5 million of net proceeds during the three months ended March 31, 2020.
•Declared and paid Q4 2019, January 2020 and February 2020 distributions totaling $8.7 million during the three months ended March 31, 2020.
•Aggregate quarterly and trailing 12 months total net return of -0.20% and 7.44%.
Investments:
•Funded an additional $6.4 million towards the $30.0 million commitment to APCF with a remaining unfunded commitment of $13.6 million.
•Made investments in real estate-related securities with 87 holdings as of March 31, 2020 and a total cost basis of $34.4 million.
Financings:
•Used proceeds from issuance of common stock to pay down the credit facility by $42.5 million.
Our investment objectives are to:
•provide regular, stable cash distributions;
•target institutional quality, stabilized commercial real estate to achieve an attractive distribution yield;
•preserve and protect stockholders’ invested capital;
•realize appreciation from proactive investment management and asset management; and
•seek diversification by investing across leading global cities and across real estate sectors including office, industrial, multifamily, retail and retail.
other.We cannot assure you that we will achieve our investment objectives.
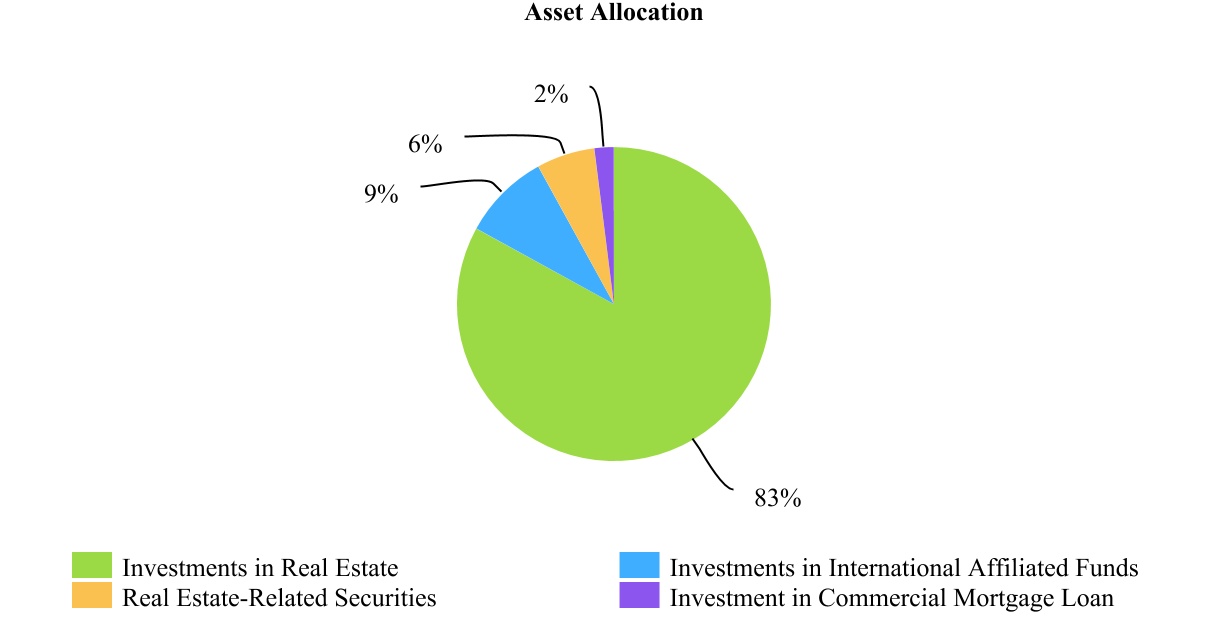
The following chart outlines the allocation of our investments based on fair value as of March 31, 2020:
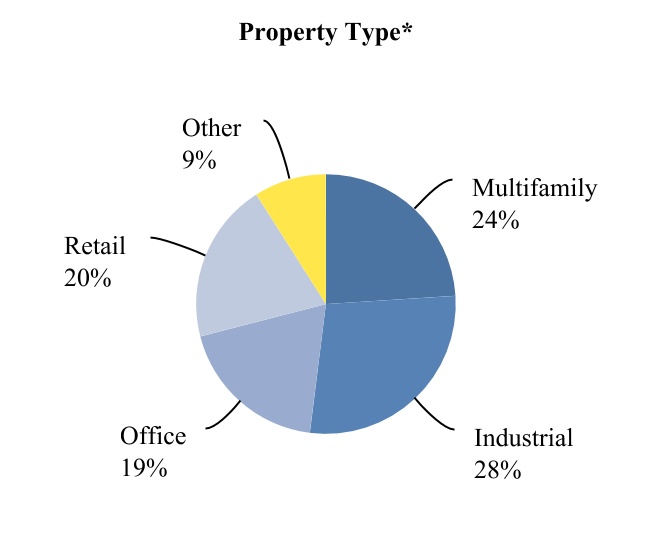
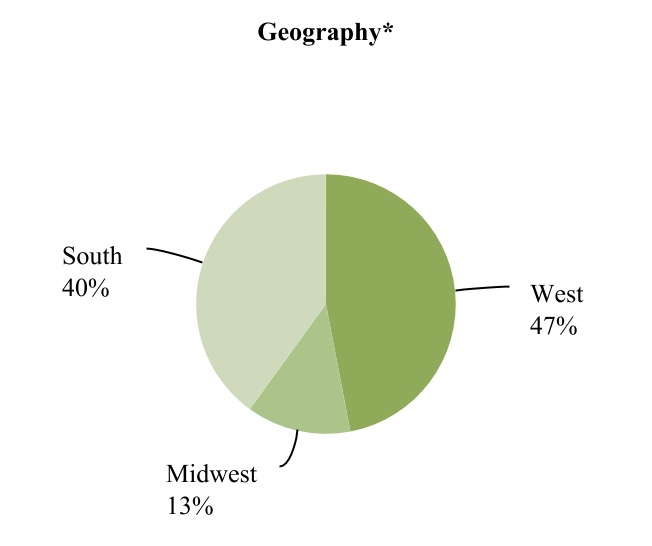
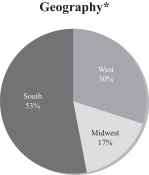
The following charts further describe the diversification of our investments in real properties based on fair value as of March 31, 2020:
(*) Based upon the market value of the properties.
Investments in Real Estate
The following charts provide information on the nature and geographical locations of our real properties as of March 31,
2019: | | | | | | | | | | | | | | | | | | | | | | | | | | | | |
Sector and Property/Portfolio Name | | Number of
Properties | | | Location | | | Acquisition
Date | | | Ownership
Interest | | | Acquisition Price
(in thousands) | | | Sq Feet (in
thousands)/
# of units | | | Occupancy | |
Multifamily: | | | | | | | | | | | | | | | | | | | | | | | | | | | | |
Kirkland Crossing | | | 1 | | | | Aurora, IL | | | | Dec, 2017 | | | | 100 | % | | $ | 54,218 | | | | 246 | units | | | 95 | % |
Tacara Steiner Ranch | | | 1 | | | | Austin, TX | | | | June, 2018 | | | | 100 | % | | | 47,909 | | | | 266 | units | | | 89 | % |
| | | | | | | | | | | | | | | | | | | | | | | | | | | | |
Total Multifamily | | | 2 | | | | | | | | | | | | | | | $ | 102,127 | | | | 512 | units | | | 92 | % |
| | | | | | | | | | | | | | | | | | | | | | | | | | | | |
Industrial: | | | | | | | | | | | | | | | | | | | | | | | | | | | | |
West Phoenix Industrial | | | 1 | | | | Phoenix, AZ | | | | Dec, 2017 | | | | 100 | % | | $ | 16,785 | | | | 265 | sq ft. | | | 100 | % |
Denver Industrial | | | 3 | | |
| Golden &
Denver, CO |
| | | Dec, 2017 | | | | 100 | % | | | 51,135 | | | | 486 | sq ft. | | | 96 | % |
Henderson Interchange | | | 1 | | | | Henderson, NV | | | | Dec, 2018 | | | | 100 | % | | | 25,074 | | | | 197 | sq ft. | | | 100 | % |
| | | | | | | | | | | | | | | | | | | | | | | | | | | | |
Total Industrial | | | 5 | | | | | | | | | | | | | | | $ | 92,994 | | | | 948 | sq ft. | | | 98 | % |
| | | | | | | | | | | | | | | | | | | | | | | | | | | | |
Retail: | | | | | | | | | | | | | | | | | | | | | | | | | | | | |
Main Street at Kingwood | | | 1 | | | | Houston, TX | | | | Oct, 2018 | | | | 100 | % | | $ | 85,696 | | | | 199 | sq ft. | | | 98 | % |
| | | | | | | | | | | | | | | | | | | | | | | | | | | | |
Total Retail | | | 1 | | | | | | | | | | | | | | | $ | 85,696 | | | | 199 | sq ft. | | | 98 | % |
| | | | | | | | | | | | | | | | | | | | | | | | | | | | |
Office: | | | | | | | | | | | | | | | | | | | | | | | | | | | | |
Defoor Hills | | | 1 | | | | Atlanta, GA | | | | June, 2018 | | | | 100 | % | | $ | 33,808 | | | | 91 | sq ft. | | | 100 | % |
| | | | | | | | | | | | | | | | | | | | | | | | | | | | |
Total Office | | | 1 | | | | | | | | | | | | | | | $ | 33,808 | | | | 91 | sq ft. | | | 100 | % |
| | | | | | | | | | | | | | | | | | | | | | | | | | | | |
Total Investment Properties | | | 9 | | | | | | | | | | | | | | | $
| 314,626
|
| | | | | | | | |
| | | | | | | | | | | | | | | | | | | | | | | | | | | | |
(*) Based upon the market value of the properties.
Kirkland Crossing
On December 8, 2017, we acquired the Kirkland Crossing Apartments (“Kirkland Crossing”), a multifamily property from an unaffiliated third party for approximately $54.1 million, exclusive of closing costs. Constructed in 2003, Kirkland Crossing consists of 266 units with a mix ofone-,two- and three-bedroom units, and is located in Aurora, Illinois, a suburb of Chicago. As of March 31, 2019,in-place rents at Kirkland Crossing were approximately $1,628 per unit. Consistent with most multifamily apartment properties, Kirkland Crossing has lease terms that are generally one year.
2020:West Phoenix Industrial
On December 21, 2017, we acquired West Phoenix Industrial (“West Phoenix Industrial”) from an unaffiliated third party for a gross purchase price of approximately $16.9 million, exclusive of closing costs. Constructed in 1998, West Phoenix Industrial is an industrial warehouse/distribution building totaling 264,981 square feet, and is located in Phoenix’s Southwest submarket. As of March 31, 2019, West Phoenix Industrial was 100% leased to two tenants with a weighted average remaining lease term of 2.2 years at a weighted average rent of $3.94 per square foot per year.
Denver Industrial Portfolio
On December 28, 2017, we acquired a fee simple interest in an approximately 486,000 square foot three-property industrial portfolio located in the Central and West submarkets of Denver, Colorado (the “Denver Industrial Portfolio”). The portfolio was acquired from an unaffiliated third party for approximately $51.0 million, excluding closing costs. The Denver Industrial Portfolio is 96% leased to 20 tenants as of March 31, 2019. The portfolio is comprised of oneClass-A, 261,825 square foot bulk distribution warehouse (“16600 Table Mountain”) that is leased to two tenants, one 71,193 square foot urbansmall-bay warehouse that is leased to four tenants (“6400 Broadway”), and one 152,966 square foot urban infill property that is comprised of three buildings and leased to 14 tenants (“Bryant Street Quad”). The remaining weighted average lease term across the portfolio is 3.2 years.
Defoor Hills
On June 15, 2018, we acquired 2282 and 2300 Defoor Hills (“Defoor Hills”) from an unaffiliated third party for approximately $33.8 million, including purchase price credits and transaction costs. Built in 1970 and redeveloped in 2017, Defoor Hills is a 90,820 square foot adaptive reuse/creative office property located in the West Midtown submarket of Atlanta, Georgia. As of March 31, 2019, Defoor Hills was 100% leased to three tenants with a weighted average remaining lease term of 11 years at a weighted average rent of $21.52 per square foot per year.
Tacara at Steiner Ranch
On June 25, 2018, we acquired Tacara at Steiner Ranch (“Tacara”), a multifamily property located in Austin, Texas, from an unaffiliated third party for approximately $47.9 million, including transaction costs. Constructed in 2017, Tacara consists of 246 units with a mix ofone-,two- and three-bedroom units. As of March 31, 2019, weighted averagein-place rents at Tacara were approximately $1,425 per unit. Consistent with most multifamily apartment properties, Tacara has lease terms that are generally one year.
Main Street at Kingwood
On October 25, 2018, we acquired Main Street at Kingwood from an unaffiliated third party for approximately $86 million, inclusive of acquisition adjustments. Built in 2016, Main Street at Kingwood is a 185,751 square foot grocery-anchored retail shopping center. At the time of acquisition, Main Street at Kingwood was 98% leased to 36 tenants with a weighted average remaining lease term of 13.9 years at a weighted average rent of $23.52 per square foot per year.
Henderson Interchange
In December 2018, we acquired Henderson Interchange from an unaffiliated third party for approximately $25.1 million. Built in 2017, Henderson Interchange is a 197,210 square foot industrial property. As of March 31, 2019, Henderson Interchange was 100% leased to three tenants with a weighted average remaining lease term of
| | | | | | | | | | | | | | | | | | | | | | | | | | | | | | | | | | | | | | | | | | | | | | | |
Sector and Property/Portfolio Name | | Number of
Properties | | Location | | Acquisition Date | | Ownership
Interest | | Acquisition Price (in thousands) | | Sq Feet (in thousands) / # of units | | | Occupancy |
| Multifamily: | | | | | | | | | | | | | | | |
| Kirkland Crossing | | 1 | | Aurora, IL | | Dec, 2017 | | 100% | | $ | 54,218 | | | 266 | units | | 93 | % |
| Tacara Steiner Ranch | | 1 | | Austin, TX | | June, 2018 | | 100% | | 47,909 | | | 246 | units | | 95 | % |
| Total Multifamily | | 2 | | | | | | | | 102,127 | | | 512 | units | | 94 | % |
| Industrial: | | | | | | | | | | | | | | | |
| West Phoenix Industrial | | 1 | | Phoenix, AZ | | Dec, 2017 | | 100% | | 16,785 | | | 265 | sq ft. | | 100 | % |
| Denver Industrial | | 3 | | Golden & Denver, CO | | Dec, 2017 | | 100% | | 51,135 | | | 486 | sq ft. | | 100 | % |
| Henderson Interchange | | 1 | | Henderson, NV | | Dec, 2018 | | 100% | | 25,074 | | | 197 | sq ft. | | 100 | % |
| Globe Street Industrial | | 1 | | Moreno Valley, CA | | Oct, 2019 | | 100% | | 19,445 | | | 252 | sq ft. | | 100 | % |
| Total Industrial | | 6 | | | | | | | | 112,439 | | | 1200 | sq ft. | | 100 | % |
| Retail: | | | | | | | | | | | | | | | |
| Main Street at Kingwood | | 1 | | Houston, TX | | Oct, 2018 | | 100% | | 85,696 | | | 199 | sq ft. | | 98 | % |
| Total Retail | | 1 | | | | | | | | 85,696 | | | 199 | sq ft. | | 98 | % |
| Office: | | | | | | | | | | | | | | | |
| Defoor Hills | | 1 | | Atlanta, GA | | June, 2018 | | 100% | | 33,808 | | | 91 | sq ft. | | 100 | % |
| East Sego Lily | | 1 | | Salt Lake City, UT | | May, 2019 | | 100% | | 44,422 | | | 149 | sq ft. | | 100 | % |
| Total Office | | 2 | | | | | | | | 78,230 | | | 240 | sq ft. | | 100 | % |
| Other: | | | | | | | | | | | | | | | | | |
| 9725 Datapoint | | 1 | | San Antonio, TX | | Dec, 2019 | | 100% | | 36,526 | | | 205 | sq ft. | | 100 | % |
| Total Other | | 1 | | | | | | | | 36,526 | | | 205 | sq ft. | | 100 | % |
| Total Investment Properties | | 12 | | | | | | | | $ | 415,018 | | | | | | |
approximately 7 years. Henderson Interchange is located within the key industrial market in the Henderson submarket in southwest Las Vegas, Nevada.
The following schedule details the expiring leases at our industrial, retail, office and officeother properties by annualized base rent and square footage as of March 31, 20192020 ($ and square feet data in thousands). The table below excludes our multifamily properties as substantially all leases at such properties expire within 12 months.
| | | | | | | | | | | | | | | | | | | | |
Year | | Number of
Expiring
Leases | | | Annualized
Base Rent(1) | | | % of Total
Annualized
Base Rent
Expiring | | | Square
Feet | | | % of Total
Square Feet
Expiring | |
Remaining 2019 | | | 2 | | | | 528 | | | | 5 | % | | | 89 | | | | 7 | % |
2020 | | | 3 | | | | 998 | | | | 9 | % | | | 232 | | | | 19 | % |
2021 | | | 7 | | | | 597 | | | | 5 | % | | | 110 | | | | 9 | % |
2022 | | | 15 | | | | 2,052 | | | | 18 | % | | | 270 | | | | 22 | % |
2023 | | | 6 | | | | 641 | | | | 5 | % | | | 56 | | | | 5 | % |
2024 | | | 3 | | | | 417 | | | | 4 | % | | | 40 | | | | 3 | % |
2025 | | | 3 | | | | 262 | | | | 2 | % | | | 17 | | | | 1 | % |
2026 | | | 2 | | | | 146 | | | | 1 | % | | | 105 | | | | 9 | % |
2027 | | | 11 | | | | 1,271 | | | | 11 | % | | | 32 | | | | 3 | % |
2028 | | | 5 | | | | 810 | | | | 7 | % | | | 64 | | | | 5 | % |
Thereafter | | | 8 | | | | 3,942 | | | | 34 | % | | | 199 | | | | 16 | % |
| | | | | | | | | | | | | | | | | | | | |
Total | | | 65 | | | | 11,666 | | | | 100 | % | | | 1,214 | | | | 100 | % |
| | | | | | | | �� | | | | | | | | | | | | |
1) | the annualized March 31, 2019 base rent per leased square foot of the applicable year excluding tenant recoveries, straight-line rent and above-market and below-market lease amortization.
|
| | | | | | | | | | | | | | | | | | | | | | | | | | | | | | | | |
| Year | | Number of
Expiring
Leases | | Annualized Base Rent(1) | | % of Total
Annualized Base
Rent Expiring | | Square Feet | | % of Total
Square Feet
Expiring |
| 2020 (Remaining) | | 2 | | | 944 | | | 5 | % | | 220 | | | 12 | % |
| 2021 | | 8 | | | 747 | | | 4 | % | | 114 | | | 6 | % |
| 2022 | | 15 | | | 2,103 | | | 11 | % | | 275 | | | 15 | % |
| 2023 | | 6 | | | 652 | | | 3 | % | | 56 | | | 3 | % |
| 2024 | | 9 | | | 1,868 | | | 10 | % | | 170 | | | 9 | % |
| 2025 | | 11 | | | 3,052 | | | 16 | % | | 342 | | | 19 | % |
| 2026 | | 2 | | | 819 | | | 4 | % | | 105 | | | 6 | % |
| 2027 | | 11 | | | 2,969 | | | 15 | % | | 90 | | | 5 | % |
| 2028 | | 5 | | | 825 | | | 4 | % | | 64 | | | 3 | % |
| Thereafter | | 12 | | | 5,571 | | | 28 | % | | 406 | | | 22 | % |
| Total | | 81 | | | $ | 19,550 | | | 100 | % | | 1,842 | | | 100 | % |
(1)The annualized March 31, 2020 base rent per leased square foot of the applicable year excluding tenant recoveries, straight-line rent and above-market and below-market lease amortization.
Investments in Real Estate-Related Securities
The Company has elected the fair market value option for accounting for
As part of our investment strategy we invest in real estate-related securities
and changes in fair value are recorded in the current period earnings. Dividend income is recorded when declared. The resulting dividend income and gains and losses are recorded as a component of realized and unrealized income from real estate-related securities on the Consolidated Statements of Operations.During the three months ended March 31, 2019, we acquired $2.9 millionincluding shares of common stock of publicly-traded REITs. The fair value of our real estate-related investments was approximately $34.0 million asestate investment trusts. As of March 31, 2019.
Investment2020, we have 87 holdings and have invested $34.4 million in securities that are valued at $30.0 million on the balance sheet. The losses can be attributed to the adverse market conditions related to the COVID-19 pandemic.
Investments in International Affiliated Funds
We report our
Investment in ECF:
ECF was formed in March 2016 as an open-end, Euro-denominated fund that seeks to build a diversified portfolio of high quality and stabilized commercial real estate with good fundamentals (i.e., core real estate) located in or around certain investment cities in Europe selected for their resilience, potential for long-term structural performance and ability to deliver an attractive and stable distribution yield. As of the European Cities Partnership SCSp (“ECF”)latest available information, ECF has total equity commitments of $1.3 billion and Asia Pacific Cities Fund FCP (“APCF”), investment funds managed byhas called $1.2 billion of these commitments. ECF has 12 assets with a gross asset value of $2.0 billion and has a loan to value ration of 34.2%. The ECF portfolio is well diversified and has a balanced country exposure with 31% in UK, 19% in Netherlands, 17% in Finland, 16% in Spain, 12% in Italy and 5% in France resulting in an affiliateannualized since inception income return of TIAA (the “International Affiliated Funds”), under4.3%
On December 22, 2017, the
equity methodCompany entered into a subscription agreement to invest approximately $27.8 million (€25.0 million) into ECF. As of
accounting. The equity method income from the investments in the International Affiliated Funds represent our allocable share of each fund’s net income for the three months ended March 31,
2019 and is reported as income (loss) from equity investment in unconsolidated international affiliated funds on our Consolidated Statements of Operations.This includes our allocable share of2020, the International Affiliated Funds income and expense, realized gains and losses and unrealized appreciation or depreciation as determined from the financial statements of ECF and APCF (which carry investments at fair value in accordance with the applicable GAAP) when received by us. All contributions to or distributions from the investment in the International Affiliated Funds is accrued when notice is received and recorded as a receivable from or payable to the International Affiliated Funds on the Consolidated Balance Sheets.
Company has fully satisfied its commitment. For the three months ended March 31, 2020 and March 31, 2019, the Company recorded approximately $163,000 inthe following components of net income and unrealized loss based on its allocable share from ECF ($ in thousands):
| | | | | | | | | | | |
| Three Months Ended March 31, | | |
| 2020 | | 2019 |
| Operating income | $ | 428 | | | | $ | 185 | |
| Unrealized gains (losses) | 738 | | (22) | |
| Net income | $ | 1,166 | | | $ | 163 | |
Investment in APCF:
APCF was launched in November 2018 as an open-end, U.S. dollar denominated fund that is reflectedseeks durable income and capital appreciation from a balanced and diversified portfolio of real estate investments in a defined list of investment cities in the Asia-Pacific region. As of the latest available information, APCF has total equity commitments of $422 million and has called $242 million of these commitments. APCF has 3 assets with a gross asset value of $376 million and has a loan to value ratio of
39%. As APCF ramps up, it currently has 16% exposure in Australia, 72% in Japan and 12% in South Korea resulting in an
annualized since inception income return of 3.0%.
On November 9, 2018, the Company entered into a subscription agreement to invest $10.0 million into APCF. Subsequently, on
September 11, 2019, the
Consolidated StatementsCompany increased its commitment by $20.0 million. As of
Operations.March 31, 2020, the Company has funded $16.4 million of its total $30.0 million commitment.
For the three months ended March 31, 2020 and March 31, 2019, the Company recorded approximately $328,000 in lossesthe following components of net income based on its allocable share from APCF that is reflected on the Consolidated Statements($ in thousands):
| | | | | | | | | | | |
| Three Months Ended March 31, | | |
| 2020 | | 2019 |
| Operating income (loss) | $ | 249 | | | | $ | (25) | |
| Unrealized gains (losses) | 275 | | (302) | |
| Net income (loss) | $ | 524 | | | $ | (327) | |
Investment in Commercial Mortgage Loan
We originated our first commercial mortgage loan on March 28, 2019
forto finance the acquisition and renovation of an industrial property
located in
Masbeth, NY.Maspeth, New York. The initial term of the loan
is 3was three years with
an option to extend twice for 1 year each.two one-year extension options. Based on the terms of the loan, we funded the loan on a 60% loan to cost basis amounting to
$46$46.0 million. The borrower has the option to
upsizeup-size the loan in two phases up to 80% loan to cost basis with a corresponding reduction in the interest
rate. The borrowerrate and can request the
upsizeup-size once an anchor lease for the property is signed and other requirements have been fulfilled.
On June 6, 2019, we sold the senior portion of the loan for $34.3 million to an unaffiliated party and retained the subordinate mortgage, receiving proceeds of $34.0 million, which is net of disposition fees.
The fair value of the subordinate mortgage was $12.8 million as of March 31, 2020, resulting in unrealized losses of $0.3 million for the three months ended March 31, 2020. In addition, the Company recognized interest income from its investment in commercial mortgage loan of $0.2 million for the three month ended March 31, 2020. The unrealized loss can be attributable to widening credit spreads during the quarter in response to the market instability introduced by the COVID-19 pandemic.
Loan terms for the mezzanine loan as of March 31, 2020 are summarized below ($ in thousands):
| | | | | | | | | | | | | | | | | | | | | | | | | | | | | | | | | | | | | | | | | | | | | | | | | | | | | | | | | | | | | | |
Investment Name | | Asset
Type | | Location | | Interest
Rate | | Origination
Date | | Maturity
Date | | Periodic
Payment
Terms | | Commitment
Amount | | Unfunded
Amount | | Principal
Receivable | | Fair
Value |
| 55 Grand Ave | | Mezzanine Loan | | Masbeth, NY | | Libor + 570 bps | | March 28, 2019 | | March 29, 2022 | | Interest Only | | $14,375 | | $1,213 | | $13,162 | | $12,831 |
Factors Impacting Our Operating Results
Our results of operations are affected by a number of factors and depend on the rental revenue we receive from the properties that we acquire, the timing of lease expirations, general market conditions, operating expenses, the competitive environment for real estate assets and income from our investments in real estate-related securities and the International Affiliated Funds.
The outbreak of the novel coronavirus (“COVID-19”) and subsequent global pandemic began significantly impacting the U.S. and global financial markets and economies during the quarter ended March 31, 2020. The worldwide spread of COVID-19 has created significant uncertainty in the global economy. At this time we reasonably expect tenants will request certain rent relief and lease modifications from this unprecedented event; however, such requests haven’t been significant as of March 31, 2020 for our direct real estate. Our investments in the International Affiliated Funds may be similarly and negatively impacted by COVID-19 in the foreign countries where their investments are located. The duration and extent of COVID-19 over the long-term cannot be reasonably estimated at this time. The ultimate impact of COVID-19 and the extent to which COVID-19 impacts the Company will depend on future developments.
We receive income primarily from rental revenue generated by the properties that we acquire. The amount of rental revenue depends upon a number of factors, including: our ability to enter into leases with increasing or market value rents for the properties that we acquire; and rent collection, which primarily relates to each future tenant’s financial condition and ability to make rent payments to us on time.
We face competition from a diverse mix of market participants, including but not limited to, other companies with similar business models, independent investors, hedge funds and other real estate investors. Competition from others may diminish our opportunities to acquire a desired property on favorable terms or at all. In addition, this competition may put pressure on us to reduce the rental rates below those that we expect to charge for the properties that we acquire, which would adversely affect our financial results.
Our operating expenses include general and administrative expenses, including legal, accounting, and other expenses related to corporate governance, public reporting and compliance with the various provisions of U.S. securities laws. As we have with the leases associated with our initial industrial, retail, office and other properties, we generally expect to structure our industrial leases so that the tenant is responsible for taxes, maintenance, insurance, and structural repairs with respect to the premises throughout the lease term. Increases or decreases in such operating expenses will impact our overall financial performance.performance
.
OurQualification as a REIT We have been organized and we intend to elect, and to operate our business so as to qualify,elected to be taxed as a REIT for U.S. federal income tax purposes commencing with ourthe taxable year endingended December 31, 2018. Shares of our common stock are subject to restrictions on ownership and transfer that are intended, among other
purposes, to assist us in qualifying and maintaining our qualification as a REIT. In order for us to qualify as a REIT under the Internal Revenue Code (the “Code”), we are required to, among other things, distribute as dividends at least 90% of our REIT taxable income, determined without regard to the dividends-paid deduction and excluding net capital gains, to our stockholders and meet certain tests regarding the nature of our income and assets. In order to satisfy a requirement that no five or fewer individuals own (or be treated as owning) more than 50% of our stock, subject to certain exceptions, no person or entity may own, or be deemed to own, by virtue of the applicable constructive ownership provisions of the Code, more than 9.8% (in value or number of shares, whichever is more restrictive) of the aggregate of our outstanding shares of stock or more than 9.8% (in value or number of shares, whichever is more restrictive) of our outstanding common stock.
Tax legislation commonly referred to as the Tax Cuts & Jobs Act (the “TCJA”) was enacted on December 22, 2017. Among other things, the TCJA
reducesreduced the U.S. federal corporate income tax rate from 35% to 21% and
createscreated new taxes on certain foreign-sourced earnings.
Although management is still evaluatingFederal legislation intended to ameliorate the economic impact of the COVID-19 pandemic, the Coronavirus Aid, Relief and Economic Security Act )the "CARES Act"), was enacted on March 27, 2020, which, among other things, makes technical corrections to, or modifies on a temporary basis, certain of the provisions of the TCJA. Management has evaluated the effects of
TCJA, as modified by the
TCJA, we do not believeCARES Act and concluded that the TCJA will
not materially impact
ourits consolidated financial statements.
This is due to the fact that we are operating in a manner which will (1) allow us to qualify as a REIT and (2) result in a full valuation allowance being recorded against our deferred tax balances. WeThe Company also
estimateestimates that the
new taxes on foreign-sourced earnings
imposed under the TCJA are not likely to apply to
ourits foreign investments.
Federal legislation intended to ameliorate the economic impact of the
COVID-19 pandemic, the Coronavirus Aid, Relief and Economic Security Act (the “CARES Act”), was enacted on March 27,
2020, which makes technical corrections to, or modifies on a temporary basis, certain of the provisions of the TCJA.
Management has evaluated the effects of the TCJA, as modified by the CARES Act, and concluded that the TCJA will not
materially impact its consolidated financial statements. We also estimate that the taxes on foreign-sourced earnings imposed
under the TCJA are not likely to apply to its foreign investments.
On December 22, 2017, the SEC staff issued Staff Accounting Bulletin No. 118 (“SAB 118”), which provides guidance on accounting for the tax effects of the TCJA. SAB 118 provides a measurement period that should not extend beyond one year from the TCJA enactment date for companies to complete the accounting under ASC 740, Income Taxes. Although we believe that the impacts of the TCJA will be immaterial to our financial results, we continue to analyze certain aspects of the TCJA, therefore our estimates may change as additional information becomes available. Many of the provisions of the TCJA will require guidance through the issuance of Treasury regulations in order to assess their effect. There may be a substantial delay before such regulations are promulgated, increasing the uncertainty as to the ultimate effect of the statutory amendments on us. It is also likely that there will be technical corrections legislation proposed with respect to the TCJA this year, the effect of which cannot be predicted and may be adverse to us or our stockholders.
The following table sets forth the results of our operations for the three months ended March 31, 2020 and 2019 ($ in thousands):
| | | | | | | | | | | | | | | | | | | | | | | |
| Three Months Ended March 31, | | | | | | | | | | |
| 2020 | | 2019 | | 2020 vs 2019 | | | | | | |
| Revenues | | | | | | | | | | | |
| Rental revenue | $ | 9,458 | | | $ | 6,745 | | | $ | 2,713 | | | | | | | |
| Income from commercial mortgage loan | 245 | | | 21 | | | 224 | | | | | | | |
| Total revenues | 9,703 | | | 6,766 | | | 2,937 | | | | | | | |
| Expenses | | | | | | | | | | | |
| Rental property operating | 2,962 | | | 2,286 | | | 676 | | | | | | | |
| General and administrative | 1,034 | | | 958 | | | 76 | | | | | | | |
| Advisory fee due to affiliate | 727 | | | 467 | | | 260 | | | | | | | |
| Depreciation and amortization | 4,144 | | | 3,387 | | | 757 | | | | | | | |
| Total Expenses | 8,867 | | | 7,098 | | | 1,769 | | | | | | | |
| Other income (expense) | | | | | | | | | | | |
| Realized and unrealized (loss) income from real estate-related securities | (7,667) | | | 4,986 | | | (12,653) | | | | | | | |
| Income (loss) from equity investment in unconsolidated international affiliated funds | 1,690 | | | (165) | | | 1,881 | | | | | | | |
| Unrealized loss on commercial mortgage loan | (331) | | | — | | | (331) | | | | | | | |
| Interest income | 35 | | | 11 | | | (2) | | | | | | | |
| Interest expense | (1,189) | | | (752) | | | (437) | | | | | | | |
| Net (loss) income | (6,626) | | | 3,748 | | | 10,374 | | | | | | | |
| Net income attributable to Series A preferred stock | 4 | | | 4 | | | — | | | | | | | |
| Net (loss) income attributable to common stockholders | $ | (6,630) | | | $ | (3,740) | | | $ | 10,374 | | | | | | | |
Rental Revenue, Rental Property Operating Expenses, Depreciation and
2018 (in thousands): | | | | | | | | |
| | | Three Months
Ended
March 31, 2019 | | | Three Months
Ended
March 31, 2018 | |
Revenues | | | | | | | | |
Rental revenue | | $ | 6,745 | | | $ | 2,822 | |
Interest income from commercial mortgage loan | | | 21 | | | | — | |
| | | | | | | | |
Total Revenues | | | 6,766 | | | | 2,822 | |
Expenses | | | | | | | | |
Rental property operating expenses | | | 2,286 | | | | 966 | |
General and administrative expenses | | | 958 | | | | 1,691 | |
Advisory fee due to affiliate | | | 467 | | | | 295 | |
Depreciation and amortization | | | 3,387 | | | | 1,773 | |
| | | | | | | | |
Total Expenses | | | 7,098 | | | | 4,725 | |
Other Income | | | | | | | | |
Realized and unrealized income from real estate-related securities | | | 4,986 | | | | 388 | |
Income (loss) from equity investment in unconsolidated international affiliated funds | | | (165 | ) | | | — | |
Interest income | | | 11 | | | | — | |
Interest expense | | | (752 | ) | | | — | |
| | | | | | | | |
Net income | | | 3,748 | | | | (1,515 | ) |
| | | | | | | | |
Net income attributable to non-controlling interests | | | 4 | | | | — | |
| | | | | | | | |
Net income attributable to NREIT stockholders | | $ | 3,744 | | | $ | (1,515 | ) |
| | | | | | | | |
Amortization
Due to acquisitions of real estate and Real Estate-Related Securities we have made since we commenced principal operations in December 2017, our results of operationsrevenues and operating expenses for the three and months ended March 31, 2019 and 20182020 are not comparable. However, certain properties in our portfolio were owned for both the full three months ended March 31, 2020 and March 31, 2019 and are further discussed below.
Income from Commercial Mortgage Loan
During the three months ended March 31, 2020, we earned a full quarter of interest income and origination fees from our commercial mortgage loan compared to partial quarter income activity for the three months ending March 31, 2019, as the commercial mortgage loan was originated in March 2019.
General and Administrative Expenses
During the three months ended March 31, 2020, general and administrative expenses increased primarily due to professional fees incurred as a result of the growth of our portfolio as compared to the three months ending March 31, 2019.
Advisory Fee Due to Affiliate
During the three months ended March 31, 2020, the advisory fee due increased by $0.3 million compared to the three months ending March 31, 2019 due to the growth of our NAV.
Realized and unrealized loss from Real Estate-Related Securities
During the three months ended March 31, 2020, realized and unrealized losses from real estate-related securities increased $12.7 million compared to the three months ending March 31, 2019 due primarily to the adverse market conditions related to the COVID-19 pandemic.
Income from Equity Investment in Unconsolidated International Affiliated Funds
During the three months ended March 31, 2020, income from International Affiliated Funds increased $1.9 million compared to the three months ended March 31, 2019 primarily due to unrealized gains on current quarter property valuations along with an increase in ownership for both ECF and 2018APCF due to additional fundings.
Interest Expense
During the three months ended March 31, 2020, interest expense increased $0.4 million compared to the year ended three months ending March 31, 2019. The increase was primarily due to the growth in our portfolio of real estate and
are discussed further below.related indebtedness along with a mortgage payable on our retail property.
Same Property Results of Operations
We evaluate our consolidated results of operations on a same property basis, which allows us to analyze our property operating results excluding acquisitions during the periods under comparison. Properties in our portfolio are considered same property if they were owned for the full periods presented, otherwise they are considered
non-same property. Newly acquired or recently developed properties that have not achieved stabilized occupancy are excluded from same property results and are considered
non-same property. We do not consider our real estate-related securities
segmentand International Affiliated Funds segments to be same property.
For the three months ended March 31,
20192020 and March
31,2018,31, 2019, our same property portfolio consisted of
three industrial, two multifamily, one
multifamilyoffice and
two industrial properties.one retail property.
Same property operating results are measured by calculating same property net operating income (“NOI”). Same property NOI is a supplementalnon-GAAP disclosure of our operating results that we believe is meaningful as it enables management to evaluate the impact of occupancy, rents, leasing activity, and other controllable property operating results at our real estate properties. We define same property NOI as operating revenues less operating expenses, which exclude (i) depreciation and amortization, (ii) interest expense and othernon-property related
revenue and expenses items such as (a) general and administrative expenses, (b) management fee, (c) performance participation allocation, (d) interest income, and (e)(d) income from Real Estate-Related Securities.
real estate-related securities.
Our same property NOI may not be comparable to that of other REITs and should not be considered to be more relevant or accurate in evaluating our operating performance than the current GAAP methodology used in calculating net income (loss).
The following table reconciles GAAP net
loss(loss) income attributable to
NREITour stockholders to same property NOI for the three months ended March 31,
20192020 and
2018March 31, 2019 ($ in thousands):
| | | | | | | | |
| | | Three Months Ended
March 31, | |
| | | 2019 | | | 2018 | |
Net income (loss) attributable to NREIT stockholders | | $ | 3,744 | | | $ | (1,515) | |
Adjustments to reconcile to same property NOI | | | | | | | | |
General and administrative | | | 958 | | | | 1,691 | |
Advisory fee due to affiliate | | | 467 | | | | 295 | |
Depreciation and amortization | | | 3,387 | | | | 1,773 | |
Income from investment in International Affiliated Funds | | | (159 | ) | | | | |
Income from real-estate related securities | | | (4,986 | ) | | | (388 | ) |
Interest income from Commercial Mortgage Loan | | | (21 | ) | | | — | |
Unrealized (loss) from investment in international affiliated funds | | | 324 | | | | — | |
Interest income | | | (11 | ) | | | — | |
Interest expense | | | 752 | | | | — | |
Series A Preferred Stock | | | 4 | | | | — | |
| | | | | | | | |
NOI | | $ | 4,459 | | | $ | 1,856 | |
Non-same property NOI | | | 2,741 | | | | 14 | |
| | | | | | | | |
Same property NOI | | $ | 1,718 | | | $ | 1,842 | |
| | | | | | | | |
| | | | | | | | | | | | | | | |
| Three Months Ended March 31, | | | | | | |
| 2020 | | 2019 | | | | |
| Net (loss) income attributable to common stockholders | $ | (6,630) | | | $ | 3,744 | | | | | |
| Adjustments to reconcile to same property NOI | | | | | | | |
| General and administrative | 1,034 | | | 958 | | | | | |
| Advisory fee due to affiliate | 727 | | | 467 | | | | | |
| Depreciation and amortization | 4,144 | | | 3,387 | | | | | |
| Income (loss) from real estate-related securities | 7,667 | | | (4,986) | | | | | |
| Income from commercial mortgage loan | (245) | | | (21) | | | | | |
| (Income) loss from equity investment in unconsolidated international affiliated funds | (1,690) | | | 165 | | | | | |
| Interest income | (35) | | | (11) | | | | | |
| Interest expense | 1,189 | | | 752 | | | | | |
| Series A preferred stock | 4 | | | 4 | | | | | |
| NOI | 6,165 | | | 4,459 | | | | | |
| Non-same property NOI | 1,692 | | | — | | | | | |
| Same property NOI | $ | 4,473 | | | $ | 4,459 | | | | | |
The following table details the components of same property NOI for the three months ended March 31,
20192020 and
2018March 31, 2019 ($ in thousands):
| | | | | | | | | | | | |
Same Property NOI | | Three months Ended
March 31, | | | 2019 vs.
2018 | |
| | | 2019 | | | 2018 | |
Rental revenue | | $ | 2,774 | | | $ | 2,806 | | | $ | (32 | ) |
| | | | | | | | | | | | |
Total revenues | | | 2,774 | | | | 2,806 | | | | (32 | ) |
Property operating | | | 1,056 | | | | 964 | | | | 92 | |
| | | | | | | | | | | | |
Total expenses | | | 1,056 | | | | 964 | | | | 92 | |
| | | | | | | | | | | | |
Same property NOI | | $ | 1,718 | | | $ | 1,842 | | | ($ | 124 | ) |
| | | | | | | | | | | | |
Same Property—Revenue
Rental Revenue—Our rental revenue includes contracted rental income from our tenants based on the leases and tenant reimbursement income for costs related to common area maintenance, real estate taxes and other recoverable costs. We include tenant reimbursement income in our rental revenue that amounted to $0.5 million for the three months ended March 31, 2019 and March 31, 2018.
Same Property—Expenses
Rental property operating expenses—Property operating expenses for the three months ended March 31, 2019 and March 31, 2018 primarily includes real estate taxes, utilities and other maintenance expenses associated with our real properties.
General and administrative expenses—General and administrative expenses for the three months ended March 31, 2019 and March 31, 2018 primarily includes audit and other professional fees.
Advisory fee due to affiliate—The advisory fee for the three months ended March 31, 2019 and March 31, 2018 related to amounts owed to the Advisor.
Depreciation and amortization—Depreciation and amortization for the three months ended March 31, 2019 and March 31, 2018 relates to property, furniture and fixtures, equipment and intangible assets in connection with our real properties.
Net income (loss)—Our net income (loss) for the three ended March 31, 2019 and March 31, 2018 amounted to $1.7 million and $1.8 million, respectively.
| | | | | | | | | | | | | | | | | | | | | | | |
| March 31 | | | | 2020 vs 2019 | | |
| 2020 | | 2019 | | $ | | % |
| Rental revenue | $ | 6,719 | | | $ | 6,741 | | | $ | (22) | | | 1 | % |
| Total revenues | 6,719 | | | 6,741 | | | (22) | | | 1 | % |
| Rental property operating | 2,246 | | | 2,282 | | | (36) | | | (1) | % |
| Total expenses | 2,246 | | | 2,282 | | | (36) | | | (1) | % |
| Same property NOI | $ | 4,473 | | | $ | 4,459 | | | $ | 14 | | | — | % |
Liquidity and Capital Resources
Our primary needs for liquidity and capital resources are to fund our investments, to make distributions to our stockholders, to repurchase shares of our common stock pursuant to our share repurchase plan, to pay our offering and operating fees and expenses and to pay interest on any outstanding indebtedness we may incur. We will obtain the funds required to purchase investments and conduct our operations from the net proceeds of the Offering and any future offerings we may conduct, from secured and unsecured borrowings from banks and other lenders and from any undistributed funds from operations. Generally, cash needs for items other than asset acquisitions are expected to be met from operations
and use of proceeds from
our credit facility, and cash needs for asset acquisitions are funded by
the Offering and futurepublic offerings
we may conductof our common stock and debt financings. However, there may be a delay between the sale of our shares and our purchase of assets, which could result in a delay in the benefits to our stockholders, if any, of returns generated from our investment operations. Once we have raised substantial proceeds in the
Offeringpublic offering and acquired a broad portfolio of real estate investments, our target leverage ratio will be approximately 30% to 50% of our gross real estate assets (measured using the fair market value of gross real estate assets, including equity in our securities portfolio), including property and entity-level debt, but excluding debt on the securities portfolio, although it may exceed this level during our offering stage. Our leverage ratio calculation will also factor in the leverage ratios of other vehicles and funds established by
Nuveen Real EstateNRE in which we may invest, including the International Affiliated Funds. Our charter restricts the amount of indebtedness we may incur to 300% of our net assets, which approximates 75% of the aggregate cost of our investments, but does not restrict the amount of indebtedness we may incur with respect to any single investment. However, we may borrow in excess of this amount if such excess is approved by a majority of our independent directors, and disclosed to stockholders in the next quarterly report, along with justification for such excess.
If we are unable to raise substantial funds
in our Offering, we will make fewer investments resulting in less diversification in terms of the type, number and size of investments we make and the value of an investment in us will fluctuate with the performance of the specific assets we acquire. Further, we have certain fixed operating expenses, including certain expenses as a publicly offered REIT, regardless of whether we are able to raise substantial funds. Our inability to raise substantial funds would increase our fixed operating expenses as a percentage of gross income, reducing our net income and limiting our ability to make distributions.
Our operating fees and expenses include, among other things, the advisory feestockholder servicing fees we pay to the Advisor,Dealer Manager, legal, audit and valuation expenses, federal and state filing fees, printing expenses, administrative fees, transfer agent fees, marketing and distribution expenses and fees related to acquiring, financing, appraising and managing our
properties. The stockholder servicing fees we pay to the Dealer Manager are accrued up to a maximum amount of 8.75% of the sum of the gross proceeds at the time of the sale of common shares. We do not have any office or personnel expenses as we do not have any employees. We may reimburse the Advisor for certainout-of-pocket expenses in connection with our operations.operations and we did not have any cost to reimburse for three months ended March 31, 2020. The Advisor has agreed to advance all of our organization and offering expenses on our behalf (other than upfront selling commissions, dealer manager fees and stockholder servicing fees) through the first anniversary of our first acquisition.the commencement of the Offering. These expenses include legal, accounting, printing, mailing and filing fees and expenses, due diligence expenses of participating broker-dealers supported by detailed and itemized invoices, costs in connection with preparing sales materials, design and website expenses, fees and expenses of our transfer agent, fees to attend retail seminars sponsored by participating broker-dealers and reimbursements for customary travel, lodging, and meals, but exclude selling commissions, dealer manager fees and stockholder servicing fees. We will reimburse the Advisor for all such advanced expenses ratably overit incurred in 60 equal monthly installments commencing on the 60 months followingearlier of the first anniversary of our first investment acquisition.date the Company's NAV reaches $1.0 billion or January 31, 2023. For purposes of calculating our NAV, the organization and offering expenses paid by the Advisor through the first anniversary of our first investment acquisition are not recognized as expenses or as a component of equity and will not be reflected in our NAV until we reimburse the Advisor for these costs.
As of March 31, 2019,2020, the Advisor and its affiliates had incurred organization and offering expenses on our behalf of $4.7$4.6 million. Organization costs of $1.1 million consisting ofhave been expensed and offering costs of $3.6$3.5 million are a component of equity in the form of additional paid in capital.
We elected to be taxed as a REIT under Sections 856 through 860 of the Code, commencing with our taxable year ended December 31, 2018 and intend to continue to qualify as a REIT. In order to maintain our qualification as a REIT, we are required to, among other things, distribute as dividends at least 90% of our REIT taxable income, determined without regard to the dividends-paid deduction and excluding net capital gains, to our stockholders and meet certain tests regarding the nature of our income and assets.
On October 24, 2018, we entered into a credit agreement (“Credit Agreement”) with Wells Fargo Bank, National Association (“Wells Fargo”), as administrative agent and lead arranger. The Credit Agreement initially provided for aggregate commitments of up to $60 million for unsecured revolving loans, with an accordion feature that may increase the aggregate commitments to up to $500 million. On December 17, 2018 and June 11, 2019, we amended the Credit Agreement to increase the Credit Facility to $150 million and organization costs of $1.1 million. Such costs became$210 million in aggregate commitments, respectively, with all other terms remaining the same. Loans outstanding under the Credit Agreement bear interest, at our liabilityOperating Partnership’s option, at either an adjusted base rate or an adjusted LIBOR rate, in each case, plus an applicable margin. The applicable margin ranges from 1.30% to 1.90% for borrowings at the adjusted LIBOR rate, in each case, based on January 31, 2018, the date as of which the Offering was declared effective. After the first anniversarytotal leverage ratio of the commencementOperating Partnership and its subsidiaries. Loans under the Credit Facility will mature three years from October 24, 2018, with an option to extend twice for an additional year pursuant to the terms of the first acquisition,Credit Agreement.
As of March 31, 2020, we had $85.3 in borrowings and had outstanding accrued interest of $0.2 million. For the three months ended March 31, 2020, we incurred $0.7 million in interest expense.
As of March 31, 2020, the Company is in compliance with all loan covenants.
On November 8, 2019, we entered into a loan agreement ("Mortgage Payable") secured by Main Street at Kingwood with Nationwide Life Insurance Company ("Nationwide") as the lender. The Mortgage Payable provides for an aggregate principal amount of $48.0 million and will
reimbursemature on December 1, 2026. Interest is accrued on the
Advisor for any organization and offering expenses that it incurs on our behalf as and when incurred. After the termination of each three-year public offering, the Advisor has agreed to reimburse us to the extent that the organization and offering expenses that we incur with respect to that offering exceed 15%unpaid principal balance of the
gross proceeds fromMortgage Payable at the
Offering.rate of 3.15% per annum.
As of March 31, 2020, we had $48.0 million in borrowings and $0.1 million in accrued interest outstanding under the Mortgage Payable. For the three months ended March 31, 2020, we incurred $0.4 million in interest expense.
The following table
sets forthprovides a breakdown of the
primary sourcesnet change in our cash and
uses ofcash equivalents and restricted cash for the three months ended March 31,
2020 and 2019
(in($ in thousands):
| | | | |
| | | Three Months
Ended
March 31, 2019 | |
Cash flows provided by operating activities | | $ | 1,485 | |
Cash flows used in investing activities | | | (44,199 | ) |
Cash flows provided by financing activities | | | 46,062 | |
| | | | |
Net increase in cash and cash equivalents and restricted cash | | $ | 3,348 | |
| | | | |
Operating activities—
| | | | | | | | | | | |
| Three Months Ended March 31, | | |
| 2020 | | 2019 |
| Cash flows provided by operating activities | $ | 4,022 | | | $ | 2,581 | |
| Cash flows used in investing activities | (10,446) | | | (45,295) | |
| Cash flows provided by financing activities | 3,578 | | | 46,062 | |
| Net (decrease) increase in cash and cash equivalents and restricted cash | $ | (2,846) | | | $ | 3,348 | |
Cash flows provided by operating activities
forincreased $1.4 million during the three months ended March 31,
2019 were $1.5 million which primarily related2020 compared to the
net income adjusted for non-cash items ($1.5 million).Investing activities—corresponding period in the 2019 due to increased cash flows from the operations of our investments in real estate as a result of growth in the size of our portfolio and positive leasing activity.
Cash flows used in investing activities
were approximately $44.2decreased by $34.8 million
forduring the three months ended March 31,
2020 compared to the corresponding period in the 2019
which primarily
due to a $44.7 million reduction in fundings related to
the origination and funding of aour commercial mortgage loan
($45.2 million) and acquisitions of real estate-related investment securities ($2.9 million). This was partially offset by
proceeds froman additional funding of $6.4 million towards the
sale of real-estate related securities of $2.9$30.0 million
andcommitment to APCF along with an increase in
restricted cash related to commercial mortgage loannet purchase and sale activity on our real estate-related securities portfolio of
$1.1$2.7 million.
Financing activities—
Cash flows provided by financing activities were $46.1decreased by $42.5 million forduring the three months ended March 31, 2020 compared to the corresponding period in the 2019 which primarily relateddue to borrowings froma net increase in repayments on the credit facility of $45.0$67.5 million to finance the mortgage loan and $2.5a $6.2 million of subscriptions receivedincrease in advance. This was partiallydistributions offset by an increase in net proceeds from the quarterly distribution to investors in Januaryissuance of ($2.5 million).common stock of $31.5 million.
Non-GAAP Metrics
Funds from Operations and Adjusted Funds from Operations
We believe funds from operations (“FFO”) is a meaningful supplemental
non-GAAP operating metric. Our consolidated financial statements are presented under historical cost accounting which, among other things, requires depreciation of real estate investments to be calculated on a
straight linestraight-line basis. As a result, our operating results imply that the value of our real estate investments will decrease evenly over a set time period. However, we believe that the value of real estate investments will fluctuate over time based on market conditions and as such, depreciation under historical cost accounting may be less informative. FFO is a standard REIT industry metric defined by the National
AssociationalAssociation of Real Estate Investment Trusts (“NAREIT”).
FFO, as defined by NAREIT and presented below, is calculated as net income or loss (computed in accordance with GAAP), excluding gains or losses from sales of depreciable real property and impairment write-downs on depreciable real property, plus real estate-related depreciation and amortization.
The following table presents a reconciliation of FFO to net loss ($ in thousands):
| | | | | | | | |
| | | Three Months
Ended March 31,
2019 | | | Three Months
Ended March 31,
2018 | |
Net income (loss) | | $ | 3,748 | | | $ | (1,515 | ) |
Adjustments: | | | | | | | | |
Real estate depreciation and amortization | | | 3,387 | | | | 1,773 | |
| | | | | | | | |
Funds From Operations | | $ | 7,135 | | | $ | 258 | |
| | | | | | | | |
We also believe that Adjusted FFO (“AFFO”) is a meaningful supplemental
non-GAAP disclosure of our operating results. AFFO further adjusts FFO in order for our operating results to reflect the specific characteristics of our business by adjusting for items we believe are not related to our core operations. Our adjustments to FFO to arrive to AFFO include straight-line rental income, amortization of
above-and below-market lease intangibles, organization costs, unrealized gains or losses from changes in fair value of real estate-related securities,
and amortization of restricted stock
award, andawards, unamortized origination fee related to the commercial mortgage
loan.loan, and unrealized loss (income) from investments in international affiliated funds. AFFO is not defined by NAREIT and our calculation of AFFO may not be comparable to the disclosures made by other REITs.
The following table presents a reconciliation of
net (loss) income to FFO
and to AFFO ($ in thousands):
| | | | | | | | |
| | | Three Months
Ended March 31,
2019 | | | Three Months
Ended March 31,
2018 | |
Funds From Operations | | $ | 7,135 | | | $ | 258 | |
Adjustments: | | | | | | | | |
Straight-line rental income | | | (410 | ) | | | (45 | ) |
Amortization of below market lease intangibles | | | (87 | ) | | | (16 | ) |
Organization costs | | | — | | | | 873 | |
Unrealized (gain) from changes in fair value of real estate-related securities | | | (4,769 | ) | | | (274 | ) |
Loss from equity investment in unconsolidated international affiliated funds | | | 324 | | | | | |
Amortization of restricted stock awards | | | 11 | | | | 11 | |
Unamortized origination fee related to commercial mortgage loan | | | 430 | | | | — | |
| | | | | | | | |
Adjusted Funds from Operations attributable to stockholders | | $ | 2,634 | | | $ | 807 | |
| | | | | | | | |
| | | | | | | | | | | | | | | | | | |
| | Three Months Ended March 31, | | | | | | |
| | 2020 | | 2019 | | | | |
| Net (loss) income | | $ | (6,626) | | | | $ | 3,748 | | | | | |
| Adjustments: | | | | | | | | | | | |
| Real estate depreciation and amortization | | 4,270 | | | | 3,387 | | | | | |
| Funds from Operations | | (2,356) | | | | 7,135 | | | | | |
| Adjustments: | | — | | | | — | | | | | |
| Straight-line rental income | | (665) | | | | (410) | | | | | |
| Amortization of above and below market lease intangibles | | (180) | | | | (87) | | | | | |
| Unrealized loss (gain) from changes in fair value of real estate related securities | | 6,498 | | (4,769) | | | | | |
| Unrealized loss on commercial mortgage loan | | 331 | | | | — | | | | | |
| Amortization of restricted stock awards | | 11 | | | | 11 | | | | | |
| Unrealized (income) loss from investment in international affiliated funds | | (1,408) | | | | 324 | | | | | |
| Unamortized origination fee related to commercial mortgage loan | | | — | | | | 430 | | | | | |
| Adjusted Funds from Operations attributable to stockholders | | $ | 2,231 | | | | $ | 2,634 | | | | | |
FFO and AFFO should not be considered to be more relevant or accurate than the current GAAP methodology in calculating net income (loss) or in evaluating our operating performance. In addition, FFO and AFFO should not be considered as alternatives to net income (loss) as indications of our performance or as alternatives to cash flows from operating activities as indications of our liquidity, but rather should be reviewed in conjunction with these and other GAAP measurements. Further, FFO and AFFO are not intended to be used as liquidity measures indicative of cash flow available to fund our cash needs, including our ability to make distributions to our stockholders.
Distribution Policy
We intend to distribute sufficient income so that we satisfy the requirements for qualification as a REIT. In order to qualify as a REIT, we are required to distribute 90% of our annual REIT taxable income, determined without regard to the dividends-paid deduction and excluding net capital gains, to our stockholders. Our distribution policy is set by our board of directors and is subject to change based on available cash flows. We cannot guarantee the amount of distributions paid, if any. Our stockholders will not be entitled to receive a distribution if the shares are repurchased prior to the applicable time of the record date. In connection with a distribution to our stockholders, our board of directors approves a quarterly distribution for a certain dollar amount for each class of our common stock. We then calculate each stockholder’s specific distribution amount for the quarter using applicable record and declaration dates, and the distributions begin to accrue on the date we admit our stockholders.
We initially established monthly record dates for quarterly distributions to stockholders of record as of the last day of each applicable month typically payable within 25 days following month end. On January 17, 2020, our board of directors amended our distribution policy to reflect that we intend to pay distributions monthly rather than quarterly going forward, subject to the discretion of the board of directors. The net distribution varies for each class based on the applicable stockholder servicing fee, which is deducted from the monthly distribution per share and paid directly to the applicable distributor.
Based on the monthly record dates established by the board of directors, we accrue for distribution on a monthly basis. We accrued $1.9 million for March 2020 in Distribution Payable on the Consolidated Balance Sheets.
For the three months ended March 31, 2020, we declared and paid distributions in the amount of $8.7 million, which consists of a 4th quarter distribution of $5.1 million and two monthly distributions totaling $3.6 million, resulting from the amendment of our distribution policy to reflect our intention to pay monthly rather than quarter distributions.
The following table summarizes our distributions declared
and paid during the three months ended March 31,
2020 and March 31, 2019 ($ in thousands):
| | | | | | | | |
| | | For the Three Months | |
| | | Ended March 31, 2019 | |
| | | Amount | | | Percentage | |
Distributions | | | | | | | | |
Payable in cash | | $ | 2,474 | | | | 99.60 | % |
Reinvested in shares | | | 10 | | | | 0.40 | % |
| | | | | | | | |
Total distributions | | $ | 2,484 | | | | 100.00 | % |
| | | | | | | | |
Sources of Distributions | | | | | | | | |
Cash flows from operating activities | | $ | 2,484 | | | | 100.00 | % |
Offering proceeds | | | — | | | | — | % |
| | | | | | | | |
Total sources of distributions | | $ | 2,484 | | | | 100.00 | % |
| | | | | | | | |
Cash flows from operating activities | | $ | 1,485 | | | | | |
| | | | | | | | |
Funds from Operations | | $ | 7,131 | | | | | |
| | | | | | | | |
| | | | | | | | | | | | | | | | | | | | | | | |
| For the Three Months Ended March 31, 2020 | | | | For the Three Months Ended March 31, 2019 | | |
| Amount | | Percentage | | Amount | | Percentage |
| Distributions | | | | | | | |
| Paid in cash | $ | 8,419 | | | 96.61 | % | | $ | 2,474 | | | 99.60 | % |
| Reinvested in shares | 295 | | | 3.39 | % | | 10 | | | 0.40 | % |
| Total distributions | $ | 8,714 | | | 100.00 | % | | $ | 2,484 | | | 100.00 | % |
| Sources of distributions | | | | | | | |
| Cash flows from operating activities | $ | 4,022 | | | 47.77 | % | | $ | 2,474 | | | 100.00 | % |
| Debt proceeds | 4,397 | | | 52.23 | % | | — | | | 0.00 | % |
| Total sources of distributions | $ | 8,419 | | | 100.00 | % | | $ | 2,474 | | | 100.00 | % |
| Cash flows from operating activities | $ | 4,022 | | | | | $ | 2,581 | | | |
| | | | | | | |
We calculate NAV per share in accordance with the valuation guidelines that have been approved by our board of directors. We believe our
Net Asset Value (“NAV”)NAV is a meaningful supplemental non-GAAP operating metric. The following table provides a breakdown of the major components of our NAV as of March 31,
20182020 ($ and shares in thousands, except per share data):
| | | | |
Components of NAV | | March 31, 2019 | |
Investments in real property | | $ | 326,042 | |
Investments in real estate-related securities | | | 33,952 | |
Investment in international affiliated funds | | | 28,004 | |
Investment in mortgage loan | | | 45,564 | |
Cash and cash equivalents | | | 5,485 | |
Restricted cash | | | 3,562 | |
Other assets | | | 1,787 | |
Debt obligations | | | (115,000 | ) |
Subscriptions received in advance | | | (2,467 | ) |
Other liabilities | | | (8,766 | ) |
Stockholder servicing fees payable the following month(1) | | | — | |
| | | | |
Net Asset Value | | $ | 318,163 | |
| | | | |
Number of Outstanding Shares | | | 30,037 | |
| | | | |
(1) | | | | | | | | |
| Components of NAV | | March 31, 2020 |
| Investments in real property | | $ | 445,032 | |
| Investments in international affiliated funds | | 45,047 | |
| Investments in real estate-related securities | | 30,047 | |
| Investments in commercial mortgage loan | | 12,831 | |
| Cash and cash equivalents | | 10,044 | |
| Restricted cash | | 2,781 | |
| Other assets | | 2,829 | |
| Debt obligations | | (132,277) | |
| Other liabilities | | (8,433) | |
| Subscriptions received in advance | | (2,781) | |
Stockholder servicing fees only applypayable the following month(1) | | (30) | |
| Net Asset Value | | $ | 405,090 | |
Net Assets Value attributable to Class S, Class T and Class D shares. For purposesSeries A preferred stock | | $ | 129 | |
| Net Asset Value attributable to common stockholders | | $ | 404,961 | |
Number of NAV we recognize the stockholder servicing fee as a reductionoutstanding shares of NAV on a monthly basis as such fee is paid. Under GAAP, we accrue the full cost of the stockholder servicing fee as an offering cost at the time we sell Class S, Class T and Class D shares. As of March 31, 2019, we have accrued under GAAP approximately $74,000 of stockholder servicing fees payable to the Dealer Manager related to the Class D and Class T shares sold, respectively.common stock | | 37,662 | |
(1)Stockholder servicing fees only apply to Class T, Class S and Class D shares. For purposes of NAV we recognize the stockholder servicing fee as a reduction of NAV on a monthly basis as such fee is paid. Under GAAP, we accrue the full cost of the stockholder servicing fee as an offering cost at the time we sell Class T, Class S and Class D shares. As of March 31, 2020, we have accrued under GAAP approximately $3.2 million of stockholder servicing fees payable to the Dealer Manager related to the Class T, Class S and Class D shares sold.
The following table provides a breakdown of our total NAV and NAV per share by share class as of March 31,
2019 (in2020 ($ in thousands, except per share data):
| | | | | | | | | | | | | | | | | | | | |
| NAV Per Share | | Class N Shares | | | Class I Shares | | | Class D Shares | | | Class T Shares | | | Total | |
Net asset value | | $ | 314,939 | | | $ | 2,188 | | | $ | 515 | | | $ | 521 | | | $ | 318,163 | |
Number of outstanding shares | | | 29,730 | | | | 208 | | | | 49 | | | | 50 | | | | 30,037 | |
| | | | | | | | | | | | | | | | | | | | |
NAV per share as of March 31, 2019 | | $ | 10.59 | | | $ | 10.52 | | �� | $ | 10.50 | | | $ | 10.42 | | | | | |
As
| | | | | | | | | | | | | | | | | | | | | | | | | | | | | | | | | | | | | | |
| NAV Per Share | | Class T Shares | | Class S Shares | | Class D Shares | | Class I Shares | | Class N Shares | | Total |
| Net asset value | | $ | 24,833 | | | | $ | 13,202 | | | $ | 11,849 | | | $ | 34,067 | | | $ | 321,010 | | | $ | 404,961 | |
| Number of outstanding shares | | 2,358 | | | | 1,256 | | | 1,116 | | | 3,201 | | | 29,731 | | | 37,662 | |
| NAV per shares as of March 31, 2020 | | $ | 10.53 | | | | $ | 10.51 | | | | $ | 10.62 | | | | $ | 10.64 | | | | $ | 10.80 | | | |
Set forth below are the weighted averages of the key assumptions in the discounted cash flow methodology used in the March 31,
20192020 valuations, based on property types. Once we own more than one
office or retail
and other property, we will include the key assumptions for such property
type. | | | | |
Property Type | | Discount Rate | | Exit Capitalization Rate |
Industrial | | 7.04% | | 6.20% |
Multifamily | | 7.00% | | 5.40% |
types.
| | | | | | | | | | | | | | |
| Property Type | | Discount Rate | | Exit Capitalization Rate |
| Industrial | | 6.81% | | 6.01% |
| Multifamily | | 6.88 | | 5.40 |
| Office | | 7.17 | | 6.42 |
These assumptions are determined by our independent valuation advisor. A change in these assumptions would impact the calculation of the value of our property investments. For example, assuming all other factors remain unchanged, the changes listed below would result in the following effects on our investment values:
| | | | | | | | |
Input | | Hypothetical
Change | | | Industrial
Investment Values | | Multifamily
Investment Values |
Discount rate | | | 0.25% decrease | | | +1.8% | | +2.0% |
(weighted average) | | | 0.25% increase | | | (2.0%) | | (1.8%) |
Exit capitalization rate | | | 0.25% decrease | | | +2.5% | | +3.1% |
(weighted average) | | | 0.25% increase | | | (2.5%) | | (2.7%) |
| | | | | | | | | | | | | | | | | | | | | | | | | | |
| Input | | Hypothetical
Change | | Industrial
Investment
Values | | Multifamily
Investment
Values | | Office
Investment
Values |
| Discount Rate | | 0.25% decrease | | | +3.0% | | +1.8% | | +2.1% |
| (weighted average) | | 0.25% increase | | | (1.0)% | | (2.0)% | | (1.5)% |
| Exit Capitalization Rate | | 0.25% decrease | | | +3.8% | | +2.9% | | +2.7% |
| (weighted average) | | 0.25% increase | | | (1.5)% | | (2.9)% | | 2.0% |
The following table reconciles stockholders’ equity per our
consolidated balance sheetConsolidated Balance Sheets to our NAV ($ in thousands):
| | | | |
Reconciliation of Stockholders’ Equity to NAV | | March 31, 2019 | |
Stockholders’ equity under GAAP | | $ | 290,487 | |
Adjustments: | | | | |
Organization and offering costs(1) | | | 4,414 | |
Accrued stockholder servicing fees(2) | | | 74 | |
Unrealized real estate appreciation(3) | | | 11,043 | |
Accumulated depreciation and amortization(4) | | | 13,244 | |
Origination fee income(5) | | | 430 | |
Straight-line rent receivable | | | (1,529 | ) |
| | | | |
Net Asset Value | | $ | 318,163 | |
| | | | |
(1) | The Advisor and its affiliates agreed
| | | | | | | |
| | March 31, 2020 |
Reconciliation of Stockholders’ Equity to advance organizationNAV | | | |
| Stockholders’ equity under US GAAP | | $ | 343,905 | |
| Adjustments: | | |
Organization and offering costs on our behalf through December 31, 2018 and had incurred organization and offering expenses of $4.6 million. Organization costs of $1.1 million are expensed and Offering costs of $3.5 million is a component of equity in the form of additional paid in capital. For NAV, such costs will be recognized as a reduction to NAV as they are reimbursed over 60 months. For the three months ended March 31, 2019, the Company recognized a reduction to its NAV by $0.2 million for costs related to the reimbursement.(1) | | 4,648 | |
(2) | Accrued stockholder servicing fee represents the accrual for the full cost of the stockholder servicing fee for Class D and Class T shares. Under GAAP, we accrued the full cost of the stockholder servicing fee payable over the life of each share (assuming such share remains outstanding the length of time required to pay the maximum stockholder servicing fee) as an offering cost at the time we sold Class D and Class T shares. For purposes of NAV we recognize the stockholder servicing fee as a reduction of NAV on a monthly basis as such fee is paid.fees(2) | | 3,247 | |
(3) | Our investments in
Unrealized real estate are presented under historical cost in our GAAP consolidated financial statements. As such, any increases in the fair market value of our investments in real estate are not included in our GAAP results. For purposes of determining our NAV, our investments in real estate are recorded at fair value.appreciation(3) | | 27,718 | |
Unrealized mortgage payable appreciation(4) | We depreciate our investments in real estate and amortize certain other assets and liabilities in accordance with GAAP. Such
| 1,000 | |
Accumulated depreciation and amortization is not recorded for purposes of determining our NAV.(5) | | 27,572 | |
| Straight-line rent receivable | | (3,000) | |
| Net Asset Value | | $ | 405,090 | |
| | |
(5) | In addition, we received origination fee income from the origination of our commercial mortgage loan. For purposes of NAV we recognize the origination fee as income upfront whereas for GAAP, the income is amortized as income over the life of the commercial mortgage loan originated.
|
(1)The Advisor and its affiliates agreed to advance organization and offering costs on our behalf through December 31, 2018 and had incurred organization and offering expenses of $4.6 million. Organization costs of $1.1 million are expensed and Offering costs of $3.5 million is a component of equity in the form of additional paid-in capital. For NAV, such costs will be recognized as a reduction to NAV as they are reimbursed over 60 months commencing on the earlier of the date the NAV reaches $1.0 billion or January 31, 2023.
(2) Accrued stockholder servicing fee represents the accrual for the full cost of the stockholder servicing fee for Class T, Class S, and Class D shares. Under GAAP, we accrue the full cost of the stockholder servicing fee payable over the life of each share (assuming such share remains outstanding the length of time required to pay the maximum stockholder servicing fee) as an offering cost at the time we sold the shares. For purposes of NAV, we recognize the stockholder servicing fee as a reduction of NAV on a monthly basis as such fee is paid.
(3) Our investments in real estate are presented under historical cost in our GAAP consolidated financial statements. As such, any changes in the fair market value of our investments in real estate are not included in our GAAP results. For purposes of determining our NAV, our investments in real estate are recorded at fair value.
(4) Our mortgage payable is presented under historical cost in our GAAP consolidated financial statements. As such, any changes in the fair market value of our mortgage payable is not included in our GAAP results. For purposes of determining our NAV, our mortgage payable is recorded at fair value.
(5) In accordance with GAAP, we depreciate our investments in real estate and amortize certain other assets and liabilities . Such depreciation and amortization is not recorded for purposes of determining our NAV. Additionally, we retire the cost of our asset when a tenant vacates and remove the associated accumulated depreciation and amortization from the accounts with the resulting gains or losses reflected in net income or loss for the period.
As with any valuation methodology, our methodology is based upon a number of estimates and assumptions that may not be accurate or complete. Different parties with different assumptions and estimates could derive a different NAV per share. Accordingly, with respect to our NAV per share, we can provide no assurance that:
(1) | a stockholder would be able to realize this NAV per share upon attempting to resell his or her shares;
|
(2) | we would be able to achieve, for our stockholders, the NAV per share, upon a listing of our shares of common stock on a national securities exchange, selling our real estate portfolio, or merging withan-other company; or
|
(3) | the NAV per share, or the methodologies relied upon to estimate the NAV per share, will be found by any regulatory authority to comply with any regulatory requirements.
|
(1)a stockholder would be able to realize this NAV per share upon attempting to resell his or her shares;
(2)we would be able to achieve, for our stockholders, the NAV per share, upon a listing of our shares of common stock on a national securities exchange, selling our real estate portfolio, or merging with an-other company; or
(3)the NAV per share, or the methodologies relied upon to estimate the NAV per share, will be found by any regulatory authority to comply with any regulatory requirements.
Furthermore, the NAV per share was calculated as of a particular point in time. The NAV per share will fluctuate over time in response to, among other things, changes in real estate market fundamentals, capital markets activities, and attributes specific to the properties and assets within our portfolio.
Critical Accounting Policies
The preparation of the consolidated financial statements in accordance with GAAP involves significant judgements and assumptions and require estimates about matters that are inherently uncertain. These judgments affect our reported amounts of assets and liabilities and our disclosure of contingent assets and liabilities at the dates of the consolidated financial statements and the reported amounts of revenue and expenses during the reporting periods. With different estimates or assumptions, materially different amounts could be reported in our consolidated financial statements. Additionally, other companies may utilize different estimates that may impact the comparability of our results of operations to those of companies in similar businesses. We consider our accounting policies over investments in real estate and revenue recognition to be our critical accounting policies. See Note 2 “Summary of Significant Accounting Policies” to the consolidated financial statements in this Quarterly Report on Form10-Q for further descriptions of such critical accounting policies along with other significant accounting policy disclosures.
Recent Accounting Pronouncements
See Note 2 “Summary of Significant Accounting Policies” to the consolidated financial statements in this Quarterly Report on Form
10-Q for a discussion concerning recent accounting pronouncements.
The following table aggregates our contractual obligations and commitments with payments due subsequent to March 31,
2019 (in2020 ($ in thousands):
| | | | | | | | | | | | | | | | | | | | |
Obligations | | Total | | | Less than
1 year | | | 1-3 years | | | 3-5 years | | | More than
5 years | |
Organization and offering expenses | | $ | 4,648 | | | $ | 1,162 | | | $ | 1,859 | | | $ | 1,627 | | | $ | — | |
Indebtedness | | | 115,000 | | | | — | | | | 115,000 | | | | — | | | | — | |
| | | | | | | | | | | | | | | | | | | | |
Total | | $ | 119,648 | | | $ | 1,162 | | | $ | 116,859 | | | $ | 1,627 | | | $ | — | |
| | | | | | | | | | | | | | | | | | | | |
| | | | | | | | | | | | | | | | | | | | | | | | | | | | | | | | |
| Obligations | | Total | | Less than
1 year | | 1-3 Years | | 3-5
Years | | More than
5 Years |
| Indebtedness | | $ | 133,277 | | | | $ | — | | | | $ | 85,277 | | | | $ | — | | | | $ | 48,000 | |
| APCF unfunded commitment | | 13,623 | | | | 13,623 | | | | — | | | | — | | | | — | |
| Organization and offering costs | | 4,648 | | | | — | | | | — | | | | 1,472 | | | | 3,176 | |
Interest expense(1) | | 13,703 | | | | 2,871 | | | | 6,422 | | | | 3,024 | | | | 1,386 | |
| Total | | $ | 165,251 | | | $ | 16,494 | | | $ | 91,699 | | | $ | 4,496 | | | $ | 52,562 | |
(1) Represents interest expense for our fixed rate Mortgage payable and Credit facility with the assumption that its paid off at maturity.
Off-Balance Sheet Arrangements
We have no
off-balance sheet arrangements.
Item 3. | Quantitative and Qualitative Disclosures About Market Risk.
|
As of March 31, 2019 our investments in real estate-related securities consisted of $34.0 million in shares of common stock of publicly-traded REITs.
Item 3. Quantitative and Qualitative Disclosures About Market Risk.
We may be exposed to interest rate changes primarily as a result of long-term debt used to maintain liquidity, fund capital expenditures and expand our investment portfolio and operations. Market fluctuations in real estate financing may affect the availability and cost of funds needed to expand our investment portfolio. In addition, restrictions upon the availability of real estate financing or high interest rates for real estate loans could adversely affect our ability to dispose of real estate in the future. We seek to limit the impact of interest rate changes on earnings and cash flows and to lower our overall borrowing costs. We may use derivative financial instruments to hedge exposures to changes in interest rates on loans secured by our assets. Also, we are exposed to both credit risk and market risk.
Market risk is the adverse effect on the value of a financial instrument that results from a change in interest rates. The market risk associated with interest-rate contracts is managed by establishing and monitoring parameters that limit the types and degree of market risk that may be undertaken. With regard to variable rate financing, we assess our interest rate cash flow risk by continually identifying and monitoring changes in interest rate exposures that may adversely impact expected future cash flows and by evaluating hedging opportunities. We maintain risk management control systems to monitor interest rate cash flow risk attributable to both our outstanding and forecasted debt obligations as well as our potential offsetting hedge positions. While this hedging strategy is designed to minimize the impact on our net income and funds from operations from changes in interest rates, the overall returns on your investment may be reduced. Our board of directors has not yet established policies and procedures regarding our use of derivative financial instruments for hedging or other purposes.
Credit Risk
Credit risk is the failure of the counterparty to perform under the terms of the derivative contract. If the fair value of a derivative contract is positive, the counterparty will owe us, which creates credit risk for us. If the fair value of a derivative contract is negative, we will owe the counterparty and, therefore, do not have credit risk. We seek to minimize the credit risk in derivative instruments by entering into transactions with high-quality counterparties. We did not have derivatives as of March 31, 2020.
Currency Risk
We may be exposed to currency risks related to our international investments, including our investments in the International Affiliated Funds. We may seek to manage or mitigate our risk to the exposure of the effects of currency changes through the use of a wide variety of derivative financial instruments. We did not have derivatives as of March 31, 2020.
Interest Rate Risk
We are exposed to interest rate risk with respect to our
investmentsvariable-rate indebtedness, whereas an increase in
real estate-related securities dueinterest rates would directly result in higher interest expense costs. We may seek to
changes inmanage of mitigate our risk to the
fair valueexposure of interest risk through interest rate protection agreements to fix or cap a portion of our
investments. The fair value may fluctuate, thus the amount we will realize upon any sale of our investments is unknown.variable rate debt. As of March 31,
2019,2020, the
fair value at which we may sell our investments in real estate-related securities is not known, but we believe that a 10% change in the fair valueoutstanding principal balance of our
investments in real estate-related securities may result in an unrealized loss of $3.4 million.As of March 31, 2019, our investment in the International Affiliated Fundsvariable rate indebtedness was $85.3 million and consisted of $18.4 million in shares of European Cities Partnership SCSp, a Euro-denominated fund. We may be exposedour Credit Facility, which is indexed to foreign currency risk with respect to our investment in the International Affiliated Fund due to changes in the foreign currency exchange rates. Foreign currencies may fluctuate, thus the amount we will realize upon any sale of our investmentone month U.S. Dollar-denominated LIBOR.
Our credit facility is
unknown.Certain of our mortgage loans, term loans, revolving credit facilities, affiliate line of credit and repurchase agreements are variable rate and indexed to one-month U.S. Dollar denominated LIBOR. For the three months ended March 31, 2019,2020, a 10% increase in one-month U.S. DollarU.S denominated LIBOR would have resulted in increased interest expense of $0.1 million.
The fair market values of the credit facility is sensitive to changes in LIBOR. Similarly, due to the variable rate on our credit facility a 100 basis point increase in LIBOR will reduce our net income by $0.9 million and a similar basis point decrease will increase our net income by $0.9 million.
COVID-19 Developments
In December 2019, a novel strain of coronavirus emerged in Wuhan, Hubei Province, China. While initially the outbreak was largely concentrated in China and caused significant disruptions to its economy, it has now spread to several other countries and infections have been reported globally. The World Health Organization has declared the coronavirus outbreak a pandemic, the Health and Human Services Secretary has declared a public health emergency in the United States in response to the outbreak and the President of the United States has declared the coronavirus outbreak a national emergency. Due to the fact our properties are located in the United States, the coronavirus will impact our investments and operating results to the extent that its continued spread within the United States reduces occupancy, increases the cost of operation, negatively impacts the ability to obtain necessary goods and services or provide adequate staffing, limits hours or necessitates the closure of such properties or results in an economic downturn and corporate bankruptcies. Similarly, our investments in the International Affiliated Funds may be negatively impacted by the impact of coronavirus on the foreign countries where their investments are located. The extent to which the coronavirus impacts our investments and operations will depend on future developments, which are highly uncertain and cannot be predicted with confidence, including the duration of the outbreak, new information that may emerge concerning the severity of the coronavirus and the actions taken to contain the coronavirus or treat its impact, among others. To
the extent our investments and operating results are impacted, this may impact our liquidity and need for capital resources within the next twelve months.
Item 4. | Controls and Procedures.
|
Item 4. Controls and Procedures.
Evaluation of Disclosure Controls and Procedures
An evaluation of the effectiveness of the design and operation of our “disclosure controls and procedures” (as defined in Rule13a-15(e) under the Securities Exchange Act of 1934, as amended (the “Exchange Act”)), as of the end of the period covered by this Quarterly Report on Form10-Q was made under the supervision and with the participation of our management, including our Chief Executive Officer (“CEO”) and Chief Financial Officer (“CFO”). Based upon this evaluation, our CEO and CFO have concluded that our disclosure controls and procedures (a) are effective to ensure that information required to be disclosed by us in reports filed or submitted under the Exchange Act is recorded, processed, summarized and reported within the time periods specified by
SEC rules and forms and (b) include, without limitation, controls and procedures designed to ensure that information required to be disclosed by us in reports filed or submitted under the Exchange Act is accumulated and communicated to our management, including our CEO and CFO, as appropriate to allow timely decisions regarding required disclosure.
Changes in Internal Controls over Financial Reporting
There have been no changes in our “internal control over financial reporting” (as defined in Rule13a-15(f) of the Exchange Act) that occurred during the period covered by this Quarterly Report on Form10-Q that have materially affected, or are reasonably likely to materially affect, our internal control over financial reporting.
PART II—OTHER INFORMATION
Item 1. | Legal Proceedings.
|
Item 1. Legal Proceedings.
Neither we nor the Advisor are currently involved in any material litigation.
There
Item 1A. Risk Factors.
Our share repurchase program requires that we follow certain restrictive procedures with respect to new investments if, during any consecutive 24-month period, we do not have at least one month in which we fully satisfy 100% of properly submitted repurchase requests or accept all properly submitted tenders in a self-tender offer for our shares, which may adversely affect our flexibility and our ability to achieve our investment objectives.
Subject to certain exceptions, our share repurchase program generally requires that if, during any consecutive 24-month period, we do not have at least one month in which we fully satisfy 100% of properly submitted repurchase requests or accept all properly submitted tenders in a self-tender offer for our shares, we will not make any new investments (excluding short-term cash management investments under 30 days in duration) and we will use all available investable assets to satisfy repurchase requests (subject to the limitations under the program) until all outstanding repurchase requests have been
no material changessatisfied. If triggered, this requirement may prevent us from pursuing potentially accretive investment opportunities and may keep us from fully realizing our investment objectives. In addition, this requirement may limit our ability to
the risk factors previously disclosed under “Risk Factors” inpay distributions to our
Annual Report on Form10-K.stockholders. Item 2. | Unregistered Sales of Equity Securities and Use of Proceeds.
|
Item 2. Unregistered Sales of Equity Securities
As compensation for their service, our independent directors received 6,560 Class I shares and Use of restricted stock at $10.29 per share on February 1, 2019 pursuant to our Independent Director Restricted Share Plan. These transactions claimed to be exempt from the registration provisionsProceeds.
Unregistered Sales of
theEquity Securities
Act of 1933, as amended, by virtue of Section 4(a)(2) thereof, as these transactions did not involve any public offering.
None.
On January 31, 2018, the Registration Statement on Form
S-11 (File
No. 333-222231) for our initial public offering of up to $5 billion in shares of our common stock was declared effective under the Securities Act. The offering price for each class of our common stock is determined monthly and is made available on our website and in prospectus supplement filings.
As of March 31,
2019,2020, we received
netgross proceeds of
$3.1$385.1 million from the Offering. The following table summarizes certain information about the Offering proceeds therefrom ($ in thousands except for share data):
| | | | | | | | | | | | | | | | | | | | |
| | | Class S Shares | | | Class T Shares | | | Class D Shares | | | Class I Shares | | | Total | |
Offering proceeds: | | | | | | | | | | | | | | | | | | | | |
Shares sold | | | — | | | | 49,624 | | | | 48,606 | | | | 207,822 | | | | 306,052 | |
Gross offering proceeds | | $ | — | | | $ | 511,344 | | | $ | 498,785 | | | $ | 2,125,294 | | | $ | 3,135,423 | |
Selling commissions and other dealer manager fees | | | — | | | | — | | | | — | | | | — | | | | — | |
Accrued stockholder servicing fees | | | — | | | | — | | | | (74 | ) | | | — | | | | (74 | ) |
| | | | | | | | | | | | | | | | | | | | |
Net offering proceeds | | $ | — | | | $ | 511,344 | | | $ | 498,711 | | | $ | 2,125,294 | | | $ | 3,135,349 | |
| | | | | | | | | | | | | | | | | | | | |
| | | | | | | | | | | | | | | | | | | | | | | | | | | | | | | | | | | |
| Class T
Shares | | Class S
Shares | | Class D
Shares | | Class I
Shares | | Class N
Shares | | Total |
| Offering proceeds: | | | | | | | | | | | |
| Shares sold | 2,358,700 | | | 1,255,756 | | | 1,115,645 | | | 3,201,009 | | | 29,730,608 | | | 37,661,718 | |
| Gross offering proceeds | $ | 300,499 | | | $ | 12,072 | | | $ | 34,081 | | | $ | 25,012 | | | $ | 13,390 | | | $ | 385,054 | |
| Selling commissions and other dealer manager fees | (499) | | | (164) | | | — | | | — | | | — | | | $ | (663) | |
| Accrued stockholder servicing fees | (1,488) | | | (797) | | | (1,062) | | | — | | | — | | | $ | (3,347) | |
| Net offering proceeds | $ | 298,512 | | | $ | 11,111 | | | $ | 33,019 | | | $ | 25,012 | | | $ | 13,390 | | | $ | 381,044 | |
We primarily used the net proceeds from the
Offering andunregistered sales along with the
unregistered salesOffering toward the acquisition of
$315$411 million of real estate, investments in
International Affiliated Fundsinternational affiliated funds of
$28$45 million,
investment in a commercial mortgage loan of
$46$13 million and
$30$34 million in real estate-related securities. In addition to the net proceeds from the Offering, we financed our investments with
$115$85 million of financing from the credit
facility.facility and $48 million from mortgage payable. In addition, we may from time to time use proceeds from the Offering to pay down our credit facility if there are no acquisitions at the time proceeds are received. See Item 2—“Management’s Discussion and Analysis of Financial Condition and Results of Operations—Liquidity and Capital Resources” for additional details on our borrowings.
We have adopted a share repurchase plan, whereby on a monthly basis, stockholders may request that we repurchase all or any portion of their shares. We may choose to repurchase all, some or none of the shares that have been requested to be repurchased at the end of any particular month, in our discretion, subject to any
limitations in the share repurchase plan. The total amount of aggregate repurchases of Class T, Class S, Class D, and Class I shares will be limited to 2% of the aggregate NAV per month and and 5% of the aggregate NAV per calendar quarter. Shares would be repurchased at a price equal to the transaction price on the applicable repurchase date, subject to any early repurchase deduction. Shares that have not been outstanding for at least one year would be repurchased at 95% of the transaction price. Due to the illiquid nature of investments in real estate, we may not have sufficient liquid resources to fund repurchase requests and has established limitations on the amount of funds we may use for repurchases during any calendar month and quarter. Further, we may modify, suspend or terminate the share repurchase plan. During
We did not repurchase any shares during the three months ended March 31,
2019, we did not repurchase any shares of our securities.2020. Item 3. | Defaults Upon Senior Securities.
|
Item 3. Defaults Upon Senior Securities.
Item 4. | Mine Safety Disclosures.
|
Item 4. Mine Safety Disclosures.
Item 5. | Other Information.
|
Item 5. Other Information.
Item 6. Exhibits.
| | | |
Exhibit No. | Description |
| 3.1 | Description
| Articles of Amendment and Restatement (filed as Exhibit 3.1 to the Registrant’s Registration Statement on Form S-11/A filed on January 24, 2018 and incorporated herein by reference). |
| |
| 3.2 | | Articles Supplementary (filed as Exhibit 3.1 to the Registrant’s Current Report on Form 8-K filed on January 8, 2019 and incorporated herein by reference). |
| |
| 3.3 | | Bylaws (filed as Exhibit 3.2 to the Registrant’s Registration Statement on Form S-11 filed on December 21, 2017 and incorporated herein by reference). |
| |
| 10.1 | | Amendment No. 1 to First Amended and Restated Advisory Agreement dated October 14, 2019 by and between Nuveen Global Cities REIT, Inc., Nuveen Global Cities REIT OP, LP and Nuveen Real Estate Global Cities Advisors, LLC (filed as Exhibit 10.1 to the Registrant’s Current Report on Form 8-K filed on October 17, 2019 and incorporated herein by reference). |
| |
| 10.2 | | Selected Dealer Agreement dated July 9, 2019 by and among Nuveen Global Cities REIT, Inc., Nuveen Securities, LLC and Ameriprise Financial Services, Inc. (filed as Exhibit 10.1 to the Registrant’s Current Report on Form 8-K filed on July 10, 2019 and incorporated herein by reference). |
| |
| 10.3 | | Cost Reimbursement Agreement dated July 9, 2019 by and among Nuveen Global Cities REIT, Inc., Nuveen Securities, LLC and American Enterprise Investment Services Inc. (filed as Exhibit 10.2 to the Registrant’s Current Report on Form 8-K filed on July 10, 2019 and incorporated herein by reference). |
| |
| 31.1* | | |
| |
| 31.2* | | |
| |
| 32.1* | | |
| |
| 101.INS | | XBRL Instance Document |
| |
| 101.SCH | | XBRL Taxonomy Extension Schema Document |
| |
| 101.CAL | | XBRL Taxonomy Extension Calculation Linkbase Document |
| |
| 101.LAB | | XBRL Taxonomy Extension Label Linkbase Document |
| |
| 101.PRE | | XBRL Taxonomy Extension Presentation Linkbase Document |
| |
| 101.DEF | | XBRL Taxonomy Extension Definition Linkbase Document |
Pursuant to the requirements of the Securities Act of 1934, as amended, the Registrant has duly caused this report to be signed on its behalf by the undersigned thereunto duly authorized.
| | | | | | | | |
| Nuveen Global Cities REIT, Inc. | |
| | |
Nuveen Global Cities REIT, Inc.
|
| |
| By: | | /s/ Michael J.L. Sales |
| | Michael J.L. Sales |
| | Chief Executive Officer and Chairman of the Board |
| | |
| |
By: | | /s/ James E. Sinople |
| | James E. Sinople |
| | Chief Financial Officer and Treasurer |
Date: