| ☒ | QUARTERLY REPORT PURSUANT TO SECTION 13 OR 15 (d) OF THE SECURITIES EXCHANGE ACT OF 1934 |
2020.
| ☐ | TRANSITION REPORT PURSUANT TO SECTION 13 OR 15 (d) OF THE SECURITIES EXCHANGE ACT OF 1934 |
| Large accelerated filer | ☐ | Accelerated filer | ☒ | |||||||
Non-accelerated filer | ☐ | Smaller reporting company | ☐ | |||||||
| Emerging growth company | ☐ | |||||||||
Class A Common Stock, $1.00 par value | ||
Class B Common Stock, $1.00 par value |
Page Number | ||||||
| 3 | |||||
| Item 1. | ||||||
| ||||||
Consolidated Balance Sheets: September 30, | 4 | |||||
Consolidated Statements of Income: Three Months and Nine Months Ended September 30, | 5 | |||||
Consolidated Statements of Comprehensive Income: Three Months and Nine Months Ended September 30, | 6 | |||||
Consolidated Statements of Changes in Stockholders’ Equity: Three Months Ended September 30, | 7 | |||||
Consolidated Statements of Changes in Stockholders’ Equity: Nine Months Ended September 30, | 8 | |||||
Consolidated Statements of Cash Flows: Nine Months Ended September 30, | 9 | |||||
Item 2. | ||||||
Item 3. | ||||||
| ||||||
| ||||||
| 47 | |||||
Item | ||||||
| ||||||
| ||||||
| ||||||
| ||||||
| 47 | |||||
Part II. | ||||||
| Item 1. | ||||||
| Item 1A. | 48-49 | |||||
| Item 2. | 48-49 | |||||
| Item 3. | 48-49 | |||||
| Item 4. | 48-49 | |||||
| Item 5. | 48-49 | |||||
| Item 6. | 48-49 | |||||
| 50 | ||||||
Exhibits | Ex-31.1 | |||||
Ex-31.2 | ||||||
Ex-32.1 | ||||||
Ex-32.2 | ||||||
Ex-101 Instance Document | ||||||
Ex-101 Schema Document | ||||||
Ex-101 Calculation Linkbase Document | ||||||
Ex-101 Labels Linkbase Document | ||||||
Ex-101 Presentation Linkbase Document | ||||||
Ex-101 Definition Linkbase Document | ||||||
| September 30, 2019 | December 31, 2018 | |||||||
| Assets | ||||||||
Cash and due from banks | $ | 85,014 | $ | 89,540 | ||||
Federal funds sold and interest-bearing deposits in other banks | 249,091 | 252,963 | ||||||
|
|
|
| |||||
Total cash and cash equivalents | 334,105 | 342,503 | ||||||
Securitiesavailable-for-sale, amortized cost $261,939 and $336,751, respectively | 261,739 | 336,759 | ||||||
Securitiesheld-to-maturity, fair value $2,188,465 and $1,991,421, respectively | 2,164,135 | 2,046,647 | ||||||
Federal Home Loan Bank of Boston, stock at cost | 14,025 | 17,974 | ||||||
Equity securities, amortized cost $1,635 and $1,635, respectively | 1,672 | 1,596 | ||||||
Loans, net: | ||||||||
Construction and land development | 7,824 | 13,628 | ||||||
Commercial and industrial | 783,950 | 761,625 | ||||||
Municipal | 121,802 | 97,290 | ||||||
Commercial real estate | 765,385 | 750,362 | ||||||
Residential real estate | 364,317 | 348,250 | ||||||
Consumer and overdrafts | 21,748 | 22,083 | ||||||
Home equity | 310,635 | 292,340 | ||||||
|
|
|
| �� | ||||
Total loans, net | 2,375,661 | 2,285,578 | ||||||
Less: allowance for loan losses | 29,097 | 28,543 | ||||||
|
|
|
| |||||
Net loans | 2,346,564 | 2,257,035 | ||||||
Bank premises and equipment | 31,520 | 23,921 | ||||||
Accrued interest receivable | 13,275 | 14,406 | ||||||
Goodwill | 2,714 | 2,714 | ||||||
Other assets | 129,432 | 120,380 | ||||||
|
|
|
| |||||
Total assets | $ | 5,299,181 | $ | 5,163,935 | ||||
|
|
|
| |||||
| Liabilities | ||||||||
Deposits: | ||||||||
Demand deposits | $ | 797,455 | $ | 813,478 | ||||
Savings and NOW deposits | 1,759,401 | 1,707,019 | ||||||
Money market accounts | 1,249,923 | 1,325,888 | ||||||
Time deposits | 533,074 | 560,579 | ||||||
|
|
|
| |||||
Total deposits | 4,339,853 | 4,406,964 | ||||||
Securities sold under agreements to repurchase | 307,235 | 154,240 | ||||||
Other borrowed funds | 209,188 | 202,378 | ||||||
Subordinated debentures | 36,083 | 36,083 | ||||||
Other liabilities | 77,862 | 63,831 | ||||||
|
|
|
| |||||
Total liabilities | 4,970,221 | 4,863,496 | ||||||
| Stockholders’ Equity | ||||||||
Preferred Stock – $1.00 par value; 100,000 shares authorized; no shares issued and outstanding | — | — | ||||||
Common stock, Class A, $1.00 par value per share; authorized 10,000,000 shares; issued 3,650,449 shares and 3,608,329 shares, respectively | 3,650 | 3,608 | ||||||
Common stock, Class B, $1.00 par value per share; authorized 5,000,000 shares; issued 1,917,460 shares and 1,959,580 shares respectively | 1,918 | 1,960 | ||||||
Additionalpaid-in capital | 12,292 | 12,292 | ||||||
Retained earnings | 328,801 | 301,488 | ||||||
|
|
|
| |||||
| 346,661 | 319,348 | |||||||
Unrealized losses on securitiesavailable-for-sale, net of taxes | (150 | ) | 6 | |||||
Unrealized losses on securities transferred toheld-to-maturity, net of taxes | (1,991 | ) | (2,565 | ) | ||||
Pension liability, net of taxes | (15,560 | ) | (16,350 | ) | ||||
|
|
|
| |||||
Total accumulated other comprehensive loss, net of taxes | (17,701 | ) | (18,909 | ) | ||||
|
|
|
| |||||
Total stockholders’ equity | 328,960 | 300,439 | ||||||
|
|
|
| |||||
Total liabilities and stockholders’ equity | $ | 5,299,181 | $ | 5,163,935 | ||||
|
|
|
| |||||
Assets | September 30, 2020 | December 31, 2019 | ||||||
Cash and due from banks | $ | 101,679 | $ | 44,420 | ||||
Federal funds sold and interest-bearing deposits in other banks | 310,901 | 214,273 | ||||||
Total cash and cash equivalents | 412,580 | 258,693 | ||||||
Securities available-for-sale, | 291,632 | 260,502 | ||||||
Securities held-to-maturity, | 2,407,176 | 2,351,120 | ||||||
Federal Home Loan Bank of Boston, stock at cost | 13,361 | 19,471 | ||||||
Equity securities, cost $1,635 and $1,635, respectively | 1,645 | 1,688 | ||||||
Loans, net: | ||||||||
Construction and land development | 9,116 | 8,992 | ||||||
Commercial and industrial | 1,315,407 | 812,417 | ||||||
Municipal | 130,047 | 120,455 | ||||||
Commercial real estate | 784,895 | 786,102 | ||||||
Residential real estate | 443,703 | 371,897 | ||||||
Consumer and overdrafts | 19,866 | 21,893 | ||||||
Home equity | 287,099 | 304,363 | ||||||
Total loans, net | 2,990,133 | 2,426,119 | ||||||
Less: allowance for loan losses | 33,394 | 29,585 | ||||||
Net loans | 2,956,739 | 2,396,534 | ||||||
Bank premises and equipment | 37,340 | 33,952 | ||||||
Accrued interest receivable | 13,223 | 13,110 | ||||||
Goodwill | 2,714 | 2,714 | ||||||
Other assets | 159,016 | 154,640 | ||||||
Total assets | $ | 6,295,426 | $ | 5,492,424 | ||||
Liabilities | ||||||||
Deposits: | ||||||||
Demand deposits | $ | 991,590 | $ | 712,842 | ||||
Savings and NOW deposits | 1,932,339 | 1,678,250 | ||||||
Money market accounts | 1,906,676 | 1,453,572 | ||||||
Time deposits | 581,866 | 555,447 | ||||||
Total deposits | 5,412,471 | 4,400,111 | ||||||
Securities sold under agreements to repurchase | 231,030 | 266,045 | ||||||
Other borrowed funds | 152,248 | 370,955 | ||||||
Subordinated debentures | 36,083 | 36,083 | ||||||
Due to broker | 9,977 | — | ||||||
Other liabilities | 90,183 | 86,649 | ||||||
Total liabilities | 5,931,992 | 5,159,843 | ||||||
Stockholders’ Equity | ||||||||
Preferred Stock – $1.00 par value; 100,000 shares authorized; 0 shares issued and outstanding | — | — | ||||||
Common stock, Class A, $1.00 par value per share; authorized 10,000,000 shares; issued 3,655,469 shares and 3,650,949 shares, respectively | 3,656 | 3,651 | ||||||
Common stock, Class B, $1.00 par value per share; authorized 5,000,000 shares; issued 1,912,440 shares and 1,916,960 shares respectively | 1,912 | 1,917 | ||||||
Additional paid-in capital | 12,292 | 12,292 | ||||||
Retained earnings | 367,836 | 338,980 | ||||||
385,696 | 356,840 | |||||||
Unrealized gains(losses) on securities available-for-sale, | 137 | (308 | ) | |||||
Unrealized losses on securities transferred to held-to-maturity, | (1,341 | ) | (1,812 | ) | ||||
Pension liability, net of taxes | (21,058 | ) | (22,139 | ) | ||||
Total accumulated other comprehensive loss, net of taxes | (22,262 | ) | (24,259 | ) | ||||
Total stockholders’ equity | 363,434 | 332,581 | ||||||
Total liabilities and stockholders’ equity | $ | 6,295,426 | $ | 5,492,424 | ||||
| Three months ended September 30, | Nine months ended September 30, | |||||||||||||||
| 2019 | 2018 | 2019 | 2018 | |||||||||||||
Interest income | ||||||||||||||||
Loans | $ | 22,117 | $ | 20,167 | $ | 65,106 | $ | 57,613 | ||||||||
Securitiesheld-to-maturity | 14,623 | 11,507 | 43,006 | 32,930 | ||||||||||||
Securitiesavailable-for-sale | 2,184 | 2,500 | 7,305 | 6,821 | ||||||||||||
Federal funds sold and interest-bearing deposits in other banks | 928 | 591 | 3,204 | 2,239 | ||||||||||||
|
|
|
|
|
|
|
| |||||||||
Total interest income | 39,852 | 34,765 | 118,621 | 99,603 | ||||||||||||
|
|
|
|
|
|
|
| |||||||||
Interest expense | ||||||||||||||||
Savings and NOW deposits | 5,445 | 2,972 | 16,788 | 7,778 | ||||||||||||
Money market accounts | 5,050 | 3,652 | 15,805 | 9,039 | ||||||||||||
Time deposits | 3,038 | 2,571 | 8,724 | 7,465 | ||||||||||||
Securities sold under agreements to repurchase | 697 | 288 | 1,572 | 657 | ||||||||||||
Other borrowed funds and subordinated debentures | 1,852 | 2,078 | 5,274 | 5,793 | ||||||||||||
|
|
|
|
|
|
|
| |||||||||
Total interest expense | 16,082 | 11,561 | 48,163 | 30,732 | ||||||||||||
|
|
|
|
|
|
|
| |||||||||
Net interest income | 23,770 | 23,204 | 70,458 | 68,871 | ||||||||||||
Provision for loan losses | 75 | — | 700 | 900 | ||||||||||||
|
|
|
|
|
|
|
| |||||||||
Net interest income after provision for loan losses | 23,695 | 23,204 | 69,758 | 67,971 | ||||||||||||
Other operating income | ||||||||||||||||
Service charges on deposit accounts | 2,310 | 2,137 | 6,801 | 6,268 | ||||||||||||
Lockbox fees | 937 | 892 | 3,018 | 2,304 | ||||||||||||
Net gains on sales of securities | 53 | 105 | 61 | 302 | ||||||||||||
Gains on sales of mortgage loans | — | — | 154 | — | ||||||||||||
Other income | 986 | 1,035 | 3,676 | 3,210 | ||||||||||||
|
|
|
|
|
|
|
| |||||||||
Total other operating income | 4,286 | 4,169 | 13,710 | 12,084 | ||||||||||||
|
|
|
|
|
|
|
| |||||||||
Operating expenses | ||||||||||||||||
Salaries and employee benefits | 10,670 | 10,570 | 32,621 | 32,331 | ||||||||||||
Occupancy | 1,463 | 1,481 | 4,686 | 4,579 | ||||||||||||
Equipment | 862 | 781 | 2,440 | 2,355 | ||||||||||||
Other | 4,467 | 4,516 | 14,170 | 13,243 | ||||||||||||
|
|
|
|
|
|
|
| |||||||||
Total operating expenses | 17,462 | 17,348 | 53,917 | 52,508 | ||||||||||||
|
|
|
|
|
|
|
| |||||||||
Income before income taxes | 10,519 | 10,025 | 29,551 | 27,547 | ||||||||||||
Provision for income taxes | 435 | 444 | 584 | 1,259 | ||||||||||||
|
|
|
|
|
|
|
| |||||||||
Net income | $ | 10,084 | $ | 9,581 | $ | 28,967 | $ | 26,288 | ||||||||
|
|
|
|
|
|
|
| |||||||||
Share data: | ||||||||||||||||
Weighted average number of shares outstanding, basic | ||||||||||||||||
Class A | 3,650,449 | 3,608,329 | 3,627,076 | 3,608,129 | ||||||||||||
Class B | 1,917,460 | 1,959,580 | 1,940,833 | 1,959,780 | ||||||||||||
Weighted average number of shares outstanding, diluted | ||||||||||||||||
Class A | 5,567,909 | 5,567,909 | 5,567,909 | 5,567,909 | ||||||||||||
Class B | 1,917,460 | 1,959,580 | 1,940,833 | 1,959,780 | ||||||||||||
Basic earnings per share: | ||||||||||||||||
Class A | $ | 2.19 | $ | 2.09 | $ | 6.30 | $ | 5.73 | ||||||||
Class B | $ | 1.09 | $ | 1.04 | $ | 3.15 | $ | 2.86 | ||||||||
Diluted earnings per share | ||||||||||||||||
Class A | $ | 1.81 | $ | 1.72 | $ | 5.20 | $ | 4.72 | ||||||||
Class B | $ | 1.09 | $ | 1.04 | $ | 3.15 | $ | 2.86 | ||||||||
Three months ended September 30, | Nine months ended September 30, | |||||||||||||||
2020 | 2019 | 2020 | 2019 | |||||||||||||
Interest income | ||||||||||||||||
Loans | $ | 21,431 | $ | 22,117 | $ | 63,478 | $ | 65,106 | ||||||||
Securities held-to-maturity | 14,186 | 14,623 | 44,701 | 43,006 | ||||||||||||
Securities available-for-sale | 818 | 2,184 | 3,493 | 7,305 | ||||||||||||
Federal funds sold and interest-bearing deposits in other banks | 69 | 928 | 747 | 3,204 | ||||||||||||
Total interest income | 36,504 | 39,852 | 112,419 | 118,621 | ||||||||||||
Interest expense | ||||||||||||||||
Savings and NOW deposits | 1,726 | 5,445 | 7,569 | 16,788 | ||||||||||||
Money market accounts | 3,056 | 5,050 | 12,090 | 15,805 | ||||||||||||
Time deposits | 2,858 | 3,038 | 9,141 | 8,724 | ||||||||||||
Securities sold under agreements to repurchase | 241 | 697 | 1,176 | 1,572 | ||||||||||||
Other borrowed funds and subordinated debentures | 1,292 | 1,852 | 4,093 | 5,274 | ||||||||||||
Total interest expense | 9,173 | 16,082 | 34,069 | 48,163 | ||||||||||||
Net interest income | 27,331 | 23,770 | 78,350 | 70,458 | ||||||||||||
Provision for loan losses | 900 | 75 | 3,675 | 700 | ||||||||||||
Net interest income after provision for loan losses | 26,431 | 23,695 | 74,675 | 69,758 | ||||||||||||
Other operating income | ||||||||||||||||
Service charges on deposit accounts | 2,239 | 2,310 | 6,558 | 6,801 | ||||||||||||
Lockbox fees | 996 | 937 | 2,850 | 3,018 | ||||||||||||
Net gains on sales of securities | — | 53 | — | 61 | ||||||||||||
Gains on sales of mortgage loans | — | — | — | 154 | ||||||||||||
Other income | 934 | 986 | 3,112 | 3,676 | ||||||||||||
Total other operating income | 4,169 | 4,286 | 12,520 | 13,710 | ||||||||||||
Operating expenses | ||||||||||||||||
Salaries and employee benefits | 11,362 | 10,670 | 33,020 | 32,621 | ||||||||||||
Occupancy | 1,477 | 1,463 | 4,448 | 4,686 | ||||||||||||
Equipment | 809 | 862 | 2,608 | 2,440 | ||||||||||||
FDIC assessments | 410 | — | 720 | 723 | ||||||||||||
Other | 4,109 | 4,467 | 12,586 | 13,447 | ||||||||||||
Total operating expenses | 18,167 | 17,462 | 53,382 | 53,917 | ||||||||||||
Income before income taxes | 12,433 | 10,519 | 33,813 | 29,551 | ||||||||||||
Provision for income taxes | 1,546 | 435 | 3,204 | 584 | ||||||||||||
Net income | $ | 10,887 | $ | 10,084 | $ | 30,609 | $ | 28,967 | ||||||||
Share data: | ||||||||||||||||
Weighted average number of shares outstanding, basic | ||||||||||||||||
Class A | 3,655,469 | 3,650,449 | 3,653,429 | 3,627,076 | ||||||||||||
Class B | 1,912,440 | 1,917,460 | 1,914,480 | 1,940,833 | ||||||||||||
Weighted average number of shares outstanding, diluted | ||||||||||||||||
Class A | 5,567,909 | 5,567,909 | 5,567,909 | 5,567,909 | ||||||||||||
Class B | 1,912,440 | 1,917,460 | 1,914,480 | 1,940,833 | ||||||||||||
Basic earnings per share: | ||||||||||||||||
Class A | $ | 2.36 | $ | 2.19 | $ | 6.64 | $ | 6.30 | ||||||||
Class B | $ | 1.18 | $ | 1.09 | $ | 3.32 | $ | 3.15 | ||||||||
Diluted earnings per share | ||||||||||||||||
Class A | $ | 1.96 | $ | 1.81 | $ | 5.50 | $ | 5.20 | ||||||||
Class B | $ | 1.18 | $ | 1.09 | $ | 3.32 | $ | 3.15 | ||||||||
| Three months ended September 30, | ||||||||
| 2019 | 2018 | |||||||
Net income | $ | 10,084 | $ | 9,581 | ||||
Other comprehensive income (loss), net of tax: | ||||||||
Unrealized gains (losses) on securities: | ||||||||
Unrealized gains (losses) arising during period | 113 | (88 | ) | |||||
Less: reclassification adjustment for gains included in net income | (39 | ) | (76 | ) | ||||
|
|
|
| |||||
Total unrealized gains (losses) on securities | 74 | (164 | ) | |||||
Accretion of net unrealized losses transferred | 155 | 238 | ||||||
Defined benefit pension plans: | ||||||||
Amortization of prior service cost and loss included in net periodic benefit cost | 263 | 292 | ||||||
|
|
|
| |||||
Other comprehensive income | 492 | 366 | ||||||
|
|
|
| |||||
Comprehensive income | $ | 10,576 | $ | 9,947 | ||||
|
|
|
| |||||
| Nine months ended September 30, | ||||||||
| 2019 | 2018 | |||||||
Net income | $ | 28,967 | $ | 26,288 | ||||
Other comprehensive income (loss), net of tax: | ||||||||
Unrealized gains (losses) on securities: | ||||||||
Unrealized (losses) gains arising during period | (112 | ) | 412 | |||||
Less: reclassification adjustment for gains included in net income | (44 | ) | (217 | ) | ||||
|
|
|
| |||||
Total unrealized (losses) gains on securities | (156 | ) | 195 | |||||
Accretion of net unrealized losses transferred | 574 | 872 | ||||||
Defined benefit pension plans: | ||||||||
Amortization of prior service cost and loss included in net periodic benefit cost | 790 | 877 | ||||||
|
|
|
| |||||
Other comprehensive income | 1,208 | 1,944 | ||||||
|
|
|
| |||||
Comprehensive income | $ | 30,175 | $ | 28,232 | ||||
|
|
|
| |||||
Three months ended September 30, | ||||||||
2020 | 2019 | |||||||
Net income | $ | 10,887 | $ | 10,084 | ||||
Other comprehensive income, net of tax: | ||||||||
Unrealized gains on securities: | ||||||||
Unrealized gains arising during period | 486 | 113 | ||||||
Less: reclassification adjustment for gains included in net income | — | (39 | ) | |||||
Total unrealized gains on securities | 486 | 74 | ||||||
Accretion of net unrealized losses transferred | 145 | 155 | ||||||
Defined benefit pension plans: | ||||||||
Amortization of prior service cost and loss included in net periodic benefit cost | 360 | 263 | ||||||
Other comprehensive income | 991 | 492 | ||||||
Comprehensive income | $ | 11,878 | $ | 10,576 | ||||
Nine months ended September 30, | ||||||||
2020 | 2019 | |||||||
Net income | $ | 30,609 | $ | 28,967 | ||||
Other comprehensive income (loss), net of tax: | ||||||||
Unrealized gains (losses) on securities: | ||||||||
Unrealized gains (losses) arising during period | 445 | (112 | ) | |||||
Less: reclassification adjustment for gains included in net income | — | (44 | ) | |||||
Total unrealized gains (losses) on securities | 445 | (156 | ) | |||||
Accretion of net unrealized losses transferred | 471 | 574 | ||||||
Defined benefit pension plans: | ||||||||
Amortization of prior service cost and loss included in net periodic benefit cost | 1,081 | 790 | ||||||
Other comprehensive income | 1,997 | 1,208 | ||||||
Comprehensive income | $ | 32,606 | $ | 30,175 | ||||
| Class A Common Stock | Class B Common Stock | Additional Paid-In Capital | Retained Earnings | Accumulated Other Comprehensive Income (Loss) | Total Stockholders’ Equity | |||||||||||||||||||
| (In thousands) | ||||||||||||||||||||||||
Balance at June 30, 2018 | $ | 3,608 | $ | 1,960 | $ | 12,292 | $ | 283,084 | $ | (23,463 | ) | $ | 277,481 | |||||||||||
Net income | — | — | — | 9,581 | — | 9,581 | ||||||||||||||||||
Other comprehensive income, net of tax: | — | |||||||||||||||||||||||
Unrealized holding (losses) gains arising during period, net of $30 in taxes | — | — | — | — | (164 | ) | (164 | ) | ||||||||||||||||
Accretion of unrealized losses on securities transferred toheld-to-maturity, net of $85 in taxes | — | — | — | — | 238 | 238 | ||||||||||||||||||
Pension liability adjustment, net of $114 in taxes | — | — | — | — | 292 | 292 | ||||||||||||||||||
Cash dividends paid, Class A common stock, $.12 per share | — | — | — | (432 | ) | — | (432 | ) | ||||||||||||||||
Cash dividends paid, Class B common stock, $.06 per share | — | — | — | (119 | ) | — | (119 | ) | ||||||||||||||||
|
|
|
|
|
|
|
|
|
|
|
| |||||||||||||
Balance at September 30, 2018 | $ | 3,608 | $ | 1,960 | $ | 12,292 | $ | 292,114 | $ | (23,097 | ) | $ | 286,877 | |||||||||||
|
|
|
|
|
|
|
|
|
|
|
| |||||||||||||
Balance at June 30, 2019 | $ | 3,620 | $ | 1,948 | $ | 12,292 | $ | 319,270 | $ | (18,193 | ) | $ | 318,937 | |||||||||||
Net income | — | — | — | 10,084 | — | 10,084 | ||||||||||||||||||
Other comprehensive income, net of tax: | — | |||||||||||||||||||||||
Unrealized holding (losses) gains arising during period, net of $23 in taxes and $53 in realized gains | — | — | — | — | 74 | 74 | ||||||||||||||||||
Accretion of unrealized losses on securities transferred toheld-to-maturity, net of $54 in taxes | — | — | — | — | 155 | 155 | ||||||||||||||||||
Pension liability adjustment, net of $103 in taxes | — | — | — | — | 263 | 263 | ||||||||||||||||||
Conversion of Class B Common Stock to Class A Common Stock, 30,000 shares | 30 | (30 | ) | — | — | — | — | |||||||||||||||||
Cash dividends paid, Class A common stock, $.12 per share | — | — | — | (438 | ) | — | (438 | ) | ||||||||||||||||
Cash dividends paid, Class B common stock, $.06 per share | — | — | — | (115 | ) | — | (115 | ) | ||||||||||||||||
|
|
|
|
|
|
|
|
|
|
|
| |||||||||||||
Balance at September 30, 2019 | $ | 3,650 | $ | 1,918 | $ | 12,292 | $ | 328,801 | $ | (17,701 | ) | $ | 328,960 | |||||||||||
|
|
|
|
|
|
|
|
|
|
|
| |||||||||||||
2019
Class A Common Stock | Class B Common Stock | Additional Paid-In Capital | Retained Earnings | Accumulated Other Comprehensive Income (Loss) | Total Stockholders’ Equity | |||||||||||||||||||
(In thousands) | ||||||||||||||||||||||||
Balance at June 30, 2019 | $ | 3,620 | $ | 1,948 | $ | 12,292 | $ | 319,270 | $ | (18,193 | ) | $ | 318,937 | |||||||||||
Net income | — | — | — | 10,084 | — | 10,084 | ||||||||||||||||||
Other comprehensive income, net of tax: | ||||||||||||||||||||||||
Unrealized holding (losses) gains arising during period, net of $23 in taxes and $53 in realized gains | — | — | — | — | 74 | 74 | ||||||||||||||||||
Accretion of unrealized losses on securities transferred to held-to-maturity, | — | — | — | — | 155 | 155 | ||||||||||||||||||
Pension liability adjustment, net of $103 in taxes | — | — | — | — | 263 | 263 | ||||||||||||||||||
Conversion of Class B Common Stock to Class A Common Stock, 30,000 shares | 30 | (30 | ) | — | — | — | — | |||||||||||||||||
Cash dividends paid, Class A common stock, $.12 per share | — | — | — | (438 | ) | — | (438 | ) | ||||||||||||||||
Cash dividends paid, Class B common stock, $.06 per share | — | — | — | (115 | ) | — | (115 | ) | ||||||||||||||||
Balance at September 30, 2019 | $ | 3,650 | $ | 1,918 | $ | 12,292 | $ | 328,801 | $ | (17,701 | ) | $ | 328,960 | |||||||||||
Balance at June 30, 2020 | $ | 3,653 | $ | 1,915 | $ | 12,292 | $ | 357,595 | $ | (23,253 | ) | $ | 352,202 | |||||||||||
Net income | — | — | — | 10,887 | 10,887 | |||||||||||||||||||
Other comprehensive income, net of tax: | ||||||||||||||||||||||||
Unrealized holding (losses) gains arising during period, net of $181 in taxes | — | — | — | — | 486 | 486 | ||||||||||||||||||
Accretion of unrealized losses on securities transferred to held-to-maturity, | — | — | — | — | 145 | 145 | ||||||||||||||||||
Pension liability adjustment, net of $142 in taxes | — | — | — | — | 360 | 360 | ||||||||||||||||||
Conversion of Class B Common Stock to Class A Common Stock, 3,000 shares | 3 | (3 | ) | — | — | — | — | |||||||||||||||||
Cash dividends paid, Class A common stock, $0.14 per share | — | — | — | (512 | ) | — | (512 | ) | ||||||||||||||||
Cash dividends paid, Class B common stock, $0.07 per share | — | — | — | (134 | ) | — | (134 | ) | ||||||||||||||||
Balance at September 30, 2020 | $ | 3,656 | $ | 1,912 | $ | 12,292 | $ | 367,836 | $ | (22,262 | ) | $ | 363,434 | |||||||||||
| Class A Common Stock | Class B Common Stock | Additional Paid-In Capital | Retained Earnings | Accumulated Other Comprehensive Income (Loss) | Total Stockholders’ Equity | |||||||||||||||||||
| (In thousands) | ||||||||||||||||||||||||
Balance at December 31, 2017 | $ | 3,606 | $ | 1,962 | $ | 12,292 | $ | 263,666 | $ | (21,229 | ) | $ | 260,297 | |||||||||||
Net income | — | — | — | 26,288 | — | 26,288 | ||||||||||||||||||
Other comprehensive income, net of tax: | — | |||||||||||||||||||||||
Unrealized holding (losses) gains arising during period, net of $39 in taxes and $302 in realized gains | — | — | — | — | 195 | 195 | ||||||||||||||||||
Accretion of unrealized losses on securities transferred toheld-to-maturity, net of $314 in taxes | — | — | — | — | 872 | 872 | ||||||||||||||||||
Pension liability adjustment, net of $342 in taxes | — | — | — | — | 877 | 877 | ||||||||||||||||||
Adoption of ASU2018-2, Income Statement-Reporting Comprehensive Income (Topic 220)-Reclassification of Certain Tax Effects from AOCI | — | — | — | 3,783 | (3,783 | ) | — | |||||||||||||||||
Adoption of ASU2016-1, Financial Instruments-Overall (Subtopic825-10) Recognition and Measurement of Financial Assets and Financial Liabilities | — | — | — | 29 | (29 | ) | — | |||||||||||||||||
Conversion of Class B Common Stock to Class A Common Stock, 2,500 shares | 2 | (2 | ) | — | — | — | — | |||||||||||||||||
Cash dividends paid, Class A common stock, $.36 per share | — | — | — | (1,299 | ) | — | (1,299 | ) | ||||||||||||||||
Cash dividends paid, Class B common stock, $.18 per share | — | — | — | (353 | ) | — | (353 | ) | ||||||||||||||||
|
|
|
|
|
|
|
|
|
|
|
| |||||||||||||
Balance at September 30, 2018 | $ | 3,608 | $ | 1,960 | $ | 12,292 | $ | 292,114 | $ | (23,097 | ) | $ | 286,877 | |||||||||||
|
|
|
|
|
|
|
|
|
|
|
| |||||||||||||
Balance at December 31, 2018 | $ | 3,608 | $ | 1,960 | $ | 12,292 | $ | 301,488 | $ | (18,909 | ) | $ | 300,439 | |||||||||||
Net income | — | — | — | 28,967 | — | 28,967 | ||||||||||||||||||
Other comprehensive income, net of tax: | — | |||||||||||||||||||||||
Unrealized holding (losses) gains arising during period, net of $52 in taxes and $61 in realized gains | — | — | — | — | (156 | ) | (156 | ) | ||||||||||||||||
Accretion of unrealized losses on securities transferred toheld-to-maturity, net of $205 in taxes | — | — | — | — | 574 | 574 | ||||||||||||||||||
Pension liability adjustment, net of $309 in taxes | — | — | — | — | 790 | 790 | ||||||||||||||||||
Conversion of Class B Common Stock to Class A Common Stock, 42,120 shares | 42 | (42 | ) | — | — | — | — | |||||||||||||||||
Cash dividends paid, Class A common stock, $.36 per share | — | — | — | (1,304 | ) | — | (1,304 | ) | ||||||||||||||||
Cash dividends paid, Class B common stock, $.18 per share | — | — | — | (350 | ) | — | (350 | ) | ||||||||||||||||
|
|
|
|
|
|
|
|
|
|
|
| |||||||||||||
Balance at September 30, 2019 | $ | 3,650 | $ | 1,918 | $ | 12,292 | $ | 328,801 | $ | (17,701 | ) | $ | 328,960 | |||||||||||
|
|
|
|
|
|
|
|
|
|
|
| |||||||||||||
2019
Class A Common Stock | Class B Common Stock | Additional Paid-In Capital | Retained Earnings | Accumulated Other Comprehensive Income (Loss) | Total Stockholders’ Equity | |||||||||||||||||||
(In thousands) | ||||||||||||||||||||||||
Balance at December 31, 2018 | $ | 3,608 | $ | 1,960 | $ | 12,292 | $ | 301,488 | $ | (18,909 | ) | $ | 300,439 | �� | ||||||||||
Net income | — | — | — | 28,967 | — | 28,967 | ||||||||||||||||||
Other comprehensive income, net of tax: | ||||||||||||||||||||||||
Unrealized holding (losses) gains arising during period, net of $52 in taxes and $61 in realized gains | — | — | — | — | (156 | ) | (156 | ) | ||||||||||||||||
Accretion of unrealized losses on securities transferred to held-to-maturity, | — | — | — | — | 574 | 574 | ||||||||||||||||||
Pension liability adjustment, net of $309 in taxes | — | — | — | — | 790 | 790 | ||||||||||||||||||
Conversion of Class B Common Stock to Class A Common Stock, 42,120 shares | 42 | (42 | ) | — | — | — | — | |||||||||||||||||
Cash dividends paid, Class A common stock, $.36 per share | — | — | — | (1,304 | ) | — | (1,304 | ) | ||||||||||||||||
Cash dividends paid, Class B common stock, $.18 per share | — | — | — | (350 | ) | — | (350 | ) | ||||||||||||||||
Balance at September 30, 2019 | $ | 3,650 | $ | 1,918 | $ | 12,292 | $ | 328,801 | $ | (17,701 | ) | $ | 328,960 | |||||||||||
Balance at December 31, 2019 | $ | 3,651 | $ | 1,917 | $ | 12,292 | $ | 338,980 | $ | (24,259 | ) | $ | 332,581 | |||||||||||
Net income | — | — | — | 30,609 | 30,609 | |||||||||||||||||||
Other comprehensive income, net of tax: | ||||||||||||||||||||||||
Unrealized holding (losses) gains arising during period, net of $169 in taxes | — | — | — | — | 445 | 445 | ||||||||||||||||||
Accretion of unrealized losses on securities transferred to held-to-maturity, | — | — | — | — | 471 | 471 | ||||||||||||||||||
Pension liability adjustment, net of $422 in taxes | — | — | — | — | 1,081 | 1,081 | ||||||||||||||||||
Conversion of Class B Common Stock to Class A Common Stock, 4,520 shares | 5 | (5 | ) | — | — | — | — | |||||||||||||||||
Cash dividends paid, Class A common stock, $0.38 per share | — | — | — | (1,389 | ) | — | (1,389 | ) | ||||||||||||||||
Cash dividends paid, Class B common stock, $0.19 per share | — | — | — | (364 | ) | — | (364 | ) | ||||||||||||||||
Balance at September 30, 2020 | $ | 3,656 | $ | 1,912 | $ | 12,292 | $ | 367,836 | $ | (22,262 | ) | $ | 363,434 | |||||||||||
| Nine months ended September 30, | ||||||||
| 2019 | 2018 | |||||||
CASH FLOWS FROM OPERATING ACTIVITIES: | ||||||||
Net income | $ | 28,967 | $ | 26,288 | ||||
Adjustments to reconcile net income to net cash (used in) provided by operating activities: | ||||||||
Gain on sales of mortgage loans | (154 | ) | — | |||||
Net gains on sales of securities | (61 | ) | (302 | ) | ||||
Net (gain) loss on equity securities | (76 | ) | 47 | |||||
Provision for loan losses | 700 | 900 | ||||||
Deferred income taxes | (593 | ) | (1,270 | ) | ||||
Net depreciation and amortization | (1,693 | ) | 1,116 | |||||
Decrease (increase) in accrued interest receivable | 1,131 | (1,699 | ) | |||||
(Increase) decrease in other assets | (1,037 | ) | 1,542 | |||||
Increase in other liabilities | 2,029 | 4,825 | ||||||
|
|
|
| |||||
Net cash provided by operating activities | 29,213 | 31,447 | ||||||
|
|
|
| |||||
CASH FLOWS FROM INVESTING ACTIVITIES: | ||||||||
Proceeds from redemptions of Federal Home Loan Bank of Boston stock | 13,801 | 13,619 | ||||||
Purchase of Federal Home Loan Bank of Boston stock | (9,852 | ) | (14,583 | ) | ||||
Proceeds from calls/maturities of securitiesavailable-for-sale | 115,574 | 111,922 | ||||||
Proceeds from sales of securitiesavailable-for-sale | 16,285 | 27,517 | ||||||
Purchase of securitiesavailable-for-sale | (57,005 | ) | (108,871 | ) | ||||
Proceeds from calls/maturities of securitiesheld-to-maturity | 313,358 | 187,009 | ||||||
Purchase of securitiesheld-to-maturity | (427,124 | ) | (358,824 | ) | ||||
Proceeds from sales of securitiesheld-to-maturity | 1,194 | — | ||||||
Proceeds from life insurance policies | 5,124 | 375 | ||||||
Net increase in loans | (98,915 | ) | (83,967 | ) | ||||
Proceeds from sales of portfolio loans | 8,871 | — | ||||||
Capital expenditures | (9,962 | ) | (2,900 | ) | ||||
|
|
|
| |||||
Net cash used in investing activities | (128,651 | ) | (228,703 | ) | ||||
|
|
|
| |||||
CASH FLOWS FROM FINANCING ACTIVITIES: | ||||||||
Net decrease in time deposits | (27,505 | ) | (45,475 | ) | ||||
Net decrease (increase) in demand, savings, money market and NOW deposits | (39,606 | ) | 92,915 | |||||
Cash dividends | (1,654 | ) | (1,652 | ) | ||||
Net increase (decrease) in securities sold under agreements to repurchase | 152,995 | (18,500 | ) | |||||
Net increase in other borrowed funds | 6,810 | 24,828 | ||||||
|
|
|
| |||||
Net cash provided by financing activities | 91,040 | 52,116 | ||||||
|
|
|
| |||||
Net decrease in cash and cash equivalents | (8,398 | ) | (145,140 | ) | ||||
Cash and cash equivalents at beginning of period | 342,503 | 356,430 | ||||||
|
|
|
| |||||
Cash and cash equivalents at end of period | $ | 334,105 | $ | 211,290 | ||||
|
|
|
| |||||
SUPPLEMENTAL DISCLOSURES OF CASH FLOW INFORMATION: | ||||||||
Cash paid (received) during the period for: | ||||||||
Interest | $ | 48,127 | $ | 30,680 | ||||
Income taxes | (6,604 | ) | 590 | |||||
Change in unrealized gains (losses) on securitiesavailable-for-sale, net of taxes | (156 | ) | 195 | |||||
Change in unrealized losses on securities transferred toheld-to-maturity, net of taxes | 574 | 872 | ||||||
Pension liability adjustment, net of taxes | 790 | 877 | ||||||
Change in due to (from) to broker | — | 897 | ||||||
2019
Nine months ended September 30, | ||||||||
2020 | 2019 | |||||||
CASH FLOWS FROM OPERATING ACTIVITIES: | ||||||||
Net income | $ | 30,609 | $ | 28,967 | ||||
Adjustments to reconcile net income to net cash provided by operating activities: | ||||||||
Gain on sales of mortgage loans | — | (154 | ) | |||||
Net gains on sales of securities | — | (61 | ) | |||||
Net loss (gain) on equity securities | 43 | (76 | ) | |||||
Provision for loan losses | 3,675 | 700 | ||||||
Deferred income taxes | (1,487 | ) | (593 | ) | ||||
Net depreciation and amortization | (1,167 | ) | (1,693 | ) | ||||
(Increase) decrease in accrued interest receivable | (113 | ) | 1,131 | |||||
Decrease (increase) in other assets | 3,897 | (1,037 | ) | |||||
Increase in other liabilities | 3,396 | 2,029 | ||||||
Net cash provided by operating activities | 38,853 | 29,213 | ||||||
CASH FLOWS FROM INVESTING ACTIVITIES: | ||||||||
Proceeds from redemptions of Federal Home Loan Bank of Boston stock | 10,836 | 13,801 | ||||||
Purchase of Federal Home Loan Bank of Boston stock | (4,726 | ) | (9,852 | ) | ||||
Proceeds from calls/maturities of securities available-for-sale | 57,493 | 115,574 | ||||||
Proceeds from sales of securities available-for-sale | — | 16,285 | ||||||
Purchase of securities available-for-sale | (87,751 | ) | (57,005 | ) | ||||
Proceeds from calls/maturities of securities held-to-maturity | 596,043 | 313,358 | ||||||
Purchase of securities held-to-maturity | (638,023 | ) | (427,124 | ) | ||||
Proceeds from sales of securities held-to-maturity | — | 1,194 | ||||||
(Purchases) proceeds from life insurance policies | (6,000 | ) | 5,124 | |||||
Net increase in loans | (563,850 | ) | (98,915 | ) | ||||
Proceeds from sales of portfolio loans | — | 8,871 | ||||||
Capital expenditures | (5,873 | ) | (9,962 | ) | ||||
Net cash used in investing activities | (641,851 | ) | (128,651 | ) | ||||
CASH FLOWS FROM FINANCING ACTIVITIES: | ||||||||
Net increase (decrease) in time deposits | 26,419 | (27,505 | ) | |||||
Net increase (decrease) in demand, savings, money market and NOW deposits | 985,941 | (39,606 | ) | |||||
Cash dividends | (1,753 | ) | (1,654 | ) | ||||
Net (decrease) increase in securities sold under agreements to repurchase | (35,015 | ) | 152,995 | |||||
Net (decrease) increase in other borrowed funds | (218,707 | ) | 6,810 | |||||
Net cash provided by financing activities | 756,885 | 91,040 | ||||||
Net increase (decrease) in cash and cash equivalents | 153,887 | (8,398 | ) | |||||
Cash and cash equivalents at beginning of period | 258,693 | 342,503 | ||||||
Cash and cash equivalents at end of period | $ | 412,580 | $ | 334,105 | ||||
SUPPLEMENTAL DISCLOSURES OF CASH FLOW INFORMATION: | ||||||||
Cash paid (received) during the period for: | ||||||||
Interest | $ | 34,384 | $ | 48,127 | ||||
Income taxes | 1,750 | (6,604 | ) | |||||
Change in unrealized gains (losses) on securities available-for-sale, | 445 | (156 | ) | |||||
Change in unrealized gains (losses) on securities transferred to held-to-maturity, | 471 | 574 | ||||||
Pension liability adjustment, net of taxes | 1,081 | 790 | ||||||
Change in due to broker | 9,977 | — | ||||||
Commission and which provides a summary of the Company’s significant accounting principles. The interim results of consolidated operations are not necessarily indicative of the results for the entire year. Certain reclassifications are made to prior-year amounts whenever necessary to conform with the current-year presentation.
Note 2. Recent Accounting Developments
Recently Adopted Accounting Standards Updates
In July 2017, FASB issued ASU2017-11, Earnings Per Share (Topic 260), Distinguishing Liabilities from Equity (Topic 480), Derivatives and Hedging (Topic 815): I. Accounting for Certain Financial Instruments with Down Round Features II. Replacement of the Indefinite Deferral for Mandatorily Redeemable Financial Instruments of Certain Nonpublic Entities and Certain Mandatorily Redeemable Noncontrolling Interest with a Scope Exception. For public entities, this ASU is effective for annual reporting periods beginning after December 15, 2018. The effect of this update did not have a material impact on the Company’s consolidated financial position.
In March 2017, the FASB issued ASU2017-08, Receivables — Nonrefundable Fees and Other Costs (Subtopic310-20) Premium Amortization of Purchased Callable Debt. The FASB is issuing this ASU to amend the amortization period for certain purchased callable debt securities held at a premium. The FASB is shortening the amortization period for the premium to the earliest call date. Under current generally accepted accounting principles (GAAP), entities generally amortize the premium as an adjustment of yield over the contractual life of the instrument. For public business entities, the amendments in this ASU are effective for fiscal years, and interim periods within those fiscal years, beginning after December 15, 2018. The effect of this update did not have a material impact on the Company’s consolidated financial position.
In February 2016, the FASB issued ASU2016-02, Leases. This ASU required lessees to put most leases on their balance sheet but recognize expenses on their income statements in a manner similar to today’s accounting. This ASU also eliminated today’s real estate-specific provisions for all companies. For lessors, this ASU modified the classification criteria and the accounting for sales-type and direct financing leases. This ASU is effective for fiscal years beginning after December 15, 2018, including interim periods therein. The Company also reviewed contracts to determine if they contain embedded leases. The Company’s balance sheet impact was $15.1 million asTable of January 1, 2019. This amount was recorded as a right of use asset, included in other assets, with a corresponding lease liability, included in other liabilities.
In July 2018, ASU2018-10, “Codification Improvements to Topic 842, Leases” (“ASU2018-10”) was issued to provide more detailed guidance and additional clarification for implementing ASU2016-02. Also in July 2018, ASU2018-11, “Targeted Improvements” (“ASU2018-11”) was issued and allows for an optional transition method in which the provisions of Topic 842 would be applied upon the adoption date and would not have to be retroactively applied to the earliest reporting period presented in the consolidated financial statements.” The Company used this optional transition method for the adoption of Topic 842.
Accounting Standards Issued but not yet Adopted
The following list identifies ASUs applicable to the Company that have been issued by the FASB but are not yet effective:
In June 2016, the FASB issued ASU2016-13, Financial Instruments-Credit Losses (Topic 326): Measurement of Credit Losses on Financial Instruments. This ASU was issued to provide financial statement users with more decision-useful information about the expected credit losses on financial instruments and other commitments to extend credit held by a reporting entity at each reporting date.
To achieve this objective, the amendments in this ASU replace the incurred loss impairment methodology in current GAAP with a methodology that reflects expected credit losses and requires consideration of a broader range of reasonable and supportable information to inform credit loss estimates. The amendments in this ASU are effective for fiscal years beginning after December 15, 2019, including interim periods within those fiscal years. The Company is in the process of implementing this ASU, has purchased a software solution and is capturing information needed to implement this ASU. As part of the FASB ASC 326 implementation process the company is using two models: a rating migration model and a probability of default model. The probability of default model is based primarily on four components: loss history, product lifecycle, behavioral attributes and the economic environment. The ratings migration model is designed to estimate loss reserves according to the CECL standard for rated loans or similar instruments. The model structure follows a grade migration approach, where the default rate is based on the probability of each grade transition which is modeled using historical data.
The Company has started to input information into the models, and is running the software program and comparing to existing results. In addition, the Company has also begun developing accounting policies, as well as designing and implementing new internal controls relevant to the updated methodologies and models. The Company has not determined the dollar impact as of September 30, 2019.
The securitiesheld-to-maturity include U.S. Treasury, U.S. Government Sponsored Enterprises, BSA BackedContents
Since ASU2016-13, the FASB has issued amendments intended on improving the clarification of the amendment, ASU2018-19 Codification Improvements to Topic 326, Financial Instruments – Credit Losses and ASU2019-04 Codification Improvements to Topic 326, Financial Instruments—Credit Losses, Topic 815, Derivatives and Hedging. The amendment in ASU2018-19 was issued in November 2018 and was intended to clarify that receivables arising from operating leases are not within the scope of Subtopic326-20. Instead, impairment of receivables arising from operating leases should be accounted for in accordance with Topic 842, Leases. The amendment in ASU2019-04 was issued in April 2019 and was intended to clarify stakeholders’ specific issues about certain aspects of the amendments in ASU2016-13. ASU2019-05 Financial Instruments—Credit Losses (Topic 326): Targeted Transition Relief was also issued in May 2019. This ASU provides entities the option to irrevocably elect the fair value option for certain financial assets previously measured at amortized costs basis. The fair value option election does not apply toheld-to-maturity debt securities. An entity that elects the fair value option should subsequently apply the guidance in Subtopics820-10, Fair Value Measurement—Overall. The amendments in this ASU should be applied on a modified-retrospective basis by means of a cumulative-effect adjustment to the opening balance of retained earnings balance in the statement of financial position as of the date that an entity early adopted the amendments in ASU2016-13.
Page 11 of 48
In August 2018, FASB issued ASU2018-15, Intangibles-Goodwill and Other-Internal Use Software (Subtopic350-40): Customer’s Accounting for Implementation Costs Incurred in a Cloud Computing Arrangement That Is a Service Contract (a consensus of the FASB Emerging Issues Task Force) The amendments in this ASU align the requirements for capitalizing implementation costs incurred in a hosting arrangement that is a service contract with the requirements for capitalizing implementation costs incurred to develop or obtaininternal-use software (and hosting arrangements that include an internal use software license). This ASU is effective for annual reporting periods beginning after December 15, 2019. The effect of this update is not expected to have a material impact on the Company’s consolidated financial position.
In August 2018, FASB issued ASU2018-14, Compensation-Retirement Benefits-Defined Benefit Plans-General (Subtopic715-20): Disclosure Framework-Changes to the Disclosure Requirements for Defined Benefit plans. The amendments in this ASU remove disclosures that no longer are considered cost beneficial, clarify the specific requirements of disclosures, and add disclosure requirements identified as relevant. This ASU is effective for annual reporting periods beginning after December 15, 2020. The effect of this update is not expected to have a material impact on the Company’s consolidated financial position.
In August 2018, FASB issued ASU2018-13, Fair Value Measurement (Topic 820), Disclosure Framework-Changes to the Disclosure Requirements for Fair Value. The amendments in this ASU modify the disclosure requirements on fair value measurements in Topic 820, Fair Value Measurement, based on the concepts in the Concepts Statement, including the consideration of costs and benefits. This ASU is effective for annual reporting periods beginning after December 15, 2019. The effect of this update is not expected to have a material impact on the Company’s disclosures.
In January 2017, the FASB issued ASU2017-04, Intangibles — Goodwill and Other (Topic 350). This ASU was issued to simplify the subsequent measurement of goodwill by eliminating Step 2 from the goodwill impairment test. For public entities, this ASU is effective for the fiscal years beginning after December 15, 2019, including interim periods within those fiscal years. Early adoption is permitted and application should be on a prospective basis. The effect of this update is not expected to have a material impact on the Company’s consolidated financial position.
Securities and Exchange Commission (SEC) ruling:
In August 2018, the SEC issued a final rule that amends certain of the Commission’s disclosure requirements “that have become redundant, duplicative, overlapping, outdated, or superseded, in light of other Commission disclosure requirements, U.S. GAAP, or changes in the information environment.” The financial reporting implications of the final rule’s amendments may vary by company, but the changes are generally expected to reduce or eliminate some of an SEC registrant’s disclosure requirements. In limited circumstances, however, the amendments may expand those requirements, including those related to interim disclosures about changes in stockholders’ equity. Under the requirements, registrants must now analyze changes in stockholders’ equity, in the form of a reconciliation, for “the current and comparativeyear-to-date periods, with subtotals for each interim period.” Beginning with its March 31, 2019 filing, the Company included a reconciliation for the current quarter andyear-to-date interim periods as well as the comparative periods of the prior years (i.e., a reconciliation covering each period for which an income statement is presented).
Note 3. SecuritiesAvailable-for-Sale
| September 30, 2019 | December 31, 2018 | |||||||||||||||||||||||||||||||
| Amortized Cost | Gross Unrealized Gains | Gross Unrealized Losses | Fair Value | Amortized Cost | Gross Unrealized Gains | Gross Unrealized Losses | Fair Value | |||||||||||||||||||||||||
| (in thousands) | ||||||||||||||||||||||||||||||||
U.S. Treasury | $ | — | $ | — | $ | — | $ | — | $ | 2,000 | $ | — | $ | 8 | $ | 1,992 | ||||||||||||||||
U.S. Government Sponsored Enterprises | — | — | — | — | 3,946 | — | 31 | 3,915 | ||||||||||||||||||||||||
SBA Backed Securities | 58,714 | 51 | 101 | 58,664 | 70,477 | 1 | 284 | 70,194 | ||||||||||||||||||||||||
U.S. Government Agency and Sponsored Enterprise Mortgage-Backed Securities | 170,532 | 189 | 439 | 170,282 | 162,604 | 536 | 250 | 162,890 | ||||||||||||||||||||||||
Privately Issued Residential Mortgage-Backed Securities | 574 | 6 | 1 | 579 | 679 | 3 | 10 | 672 | ||||||||||||||||||||||||
Obligations Issued by States and Political Subdivisions | 28,519 | 57 | — | 28,576 | 93,445 | 58 | — | 93,503 | ||||||||||||||||||||||||
Other Debt Securities | 3,600 | 64 | 26 | 3,638 | 3,600 | 37 | 44 | 3,593 | ||||||||||||||||||||||||
|
|
|
|
|
|
|
|
|
|
|
|
|
|
|
| |||||||||||||||||
Total | $ | 261,939 | $ | 367 | $ | 567 | $ | 261,739 | $ | 336,751 | $ | 635 | $ | 627 | $ | 336,759 | ||||||||||||||||
|
|
|
|
|
|
|
|
|
|
|
|
|
|
|
| |||||||||||||||||
September 30, 2020 | December 31, 2019 | |||||||||||||||||||||||||||||||
Amortized Cost | Gross Unrealized Gains | Gross Unrealized Losses | Fair Value | Amortized Cost | Gross Unrealized Gains | Gross Unrealized Losses | Fair Value | |||||||||||||||||||||||||
| (in thousands) | ||||||||||||||||||||||||||||||||
SBA Backed Securities | $ | 46,147 | $ | 0 | $ | 282 | $ | 45,865 | $ | 54,331 | $ | 23 | $ | 143 | $ | 54,211 | ||||||||||||||||
U.S. Government Agency and Sponsored Enterprise Mortgage-Backed Securities | 189,531 | 767 | 394 | 189,904 | 184,580 | 139 | 532 | 184,187 | ||||||||||||||||||||||||
Privately Issued Residential Mortgage-Backed Securities | 347 | 1 | 7 | 341 | 397 | 1 | 2 | 396 | ||||||||||||||||||||||||
Obligations Issued by States and Political Subdivisions | 48,815 | 0 | — | 48,815 | 18,016 | 60 | — | 18,076 | ||||||||||||||||||||||||
Other Debt Securities | 6,600 | 113 | 6 | 6,707 | 3,600 | 51 | 19 | 3,632 | ||||||||||||||||||||||||
Total | $ | 291,440 | $ | 881 | $ | 689 | $ | 291,632 | $ | 260,924 | $ | 274 | $ | 696 | $ | 260,502 | ||||||||||||||||
Page 12 of 48
available-for-sale
| Amortized Cost | Fair Value | |||||||
| (in thousands) | ||||||||
Within one year | $ | 26,187 | $ | 26,184 | ||||
After one but within five years | 134,881 | 134,811 | ||||||
After five but within ten years | 85,551 | 85,378 | ||||||
More than 10 years | 15,320 | 15,366 | ||||||
|
|
|
| |||||
Total | $ | 261,939 | $ | 261,739 | ||||
|
|
|
| |||||
2020.
Amortized Cost | Fair Value | |||||||
(in thousands) | ||||||||
Within one year | $ | 52,775 | $ | 52,763 | ||||
After one but within five years | 124,574 | 125,000 | ||||||
After five but within ten years | 97,505 | 97,430 | ||||||
More than 10 years | 16,586 | 16,439 | ||||||
Total | $ | 291,440 | $ | 291,632 | ||||
2019.
Page 13 of 48
The following table shows the temporarily impaired securities of the Company’s
September 30, 2020 | ||||||||||||||||||||||||
Less than 12 months | 12 months or longer | Total | ||||||||||||||||||||||
Temporarily Impaired Investments | Fair Value | Unrealized Losses | Fair Value | Unrealized Losses | Fair Value | Unrealized Losses | ||||||||||||||||||
(in thousands) | ||||||||||||||||||||||||
SBA Backed Securities | $ | 16,625 | $ | 50 | $ | 29,240 | $ | 232 | $ | 45,865 | $ | 282 | ||||||||||||
U.S. Government Agency and Sponsored Enterprise Mortgage-Backed Securities | 29,870 | 156 | 33,686 | 238 | 63,556 | 394 | ||||||||||||||||||
Privately Issued Residential Mortgage-Backed Securities | 219 | 7 | — | — | 219 | 7 | ||||||||||||||||||
Obligations Issued by States and Political Subdivisions | — | — | — | — | — | — | ||||||||||||||||||
Other Debt Securities | — | — | 1,294 | 6 | 1,294 | 6 | ||||||||||||||||||
Total temporarily impaired securities | $ | 46,714 | $ | 213 | $ | 64,220 | $ | 476 | $ | 110,934 | $ | 689 | ||||||||||||
| September 30, 2019 | ||||||||||||||||||||||||
| Less than 12 months | 12 months or longer | Total | ||||||||||||||||||||||
| Temporarily Impaired Investments | Fair Value | Unrealized Losses | Fair Value | Unrealized Losses | Fair Value | Unrealized Losses | ||||||||||||||||||
| (in thousands) | ||||||||||||||||||||||||
U.S. Treasury | $ | — | $ | — | $ | — | $ | — | $ | — | $ | — | ||||||||||||
U.S. Government Sponsored Enterprises | — | — | — | — | — | — | ||||||||||||||||||
SBA Backed Securities | 11,133 | 11 | 24,944 | 90 | 36,077 | 101 | ||||||||||||||||||
U.S. Government Agency and Sponsored Enterprise Mortgage-Backed Securities | 81,305 | 264 | 27,872 | 175 | 109,177 | 439 | ||||||||||||||||||
Privately Issued Residential Mortgage-Backed Securities | — | — | 282 | 1 | 282 | 1 | ||||||||||||||||||
Obligations Issued by States and Political Subdivisions | — | — | — | — | — | — | ||||||||||||||||||
Other Debt Securities | 800 | 1 | 475 | 25 | 1,275 | 26 | ||||||||||||||||||
|
|
|
|
|
|
|
|
|
|
|
| |||||||||||||
Total temporarily impaired securities | $ | 93,238 | $ | 276 | $ | 53,573 | $ | 291 | $ | 146,811 | $ | 567 | ||||||||||||
|
|
|
|
|
|
|
|
|
|
|
| |||||||||||||
The following table shows the temporarily impaired securities of the Company’savailable-for-sale portfolio at December 31, 2018. This table shows the unrealized market loss of securities that have been in a continuous unrealized loss position for less than 12 months and a continuous loss position for 12 months or longer. There are 10 and 30 securities that are temporarily impaired for less than 12 months and for 12 months or longer, respectively, out of a total of 190122 holdings at December 31, 2018.
| December 31, 2018 | ||||||||||||||||||||||||
| Less than 12 months | 12 months or longer | Total | ||||||||||||||||||||||
| Temporarily Impaired Investments | Fair Value | Unrealized Losses | Fair Value | Unrealized Losses | Fair Value | Unrealized Losses | ||||||||||||||||||
| (in thousands) | ||||||||||||||||||||||||
U.S. Treasury | $ | — | $ | — | $ | 1,992 | $ | 8 | $ | 1,992 | $ | 8 | ||||||||||||
U.S. Government Sponsored Enterprises | 3,914 | 31 | — | — | 3,914 | 31 | ||||||||||||||||||
SBA Backed Securities | 17,950 | 28 | 44,323 | 256 | 62,273 | 284 | ||||||||||||||||||
U.S. Government Agency and Sponsored Enterprise Mortgage-Backed Securities | 19,244 | 21 | 45,782 | 229 | 65,026 | 250 | ||||||||||||||||||
Privately Issued Residential Mortgage-Backed Securities | — | — | 495 | 10 | 495 | 10 | ||||||||||||||||||
Obligations Issued by States and Political Subdivisions | — | — | — | — | — | — | ||||||||||||||||||
Other Debt Securities | — | — | 455 | 44 | 455 | 44 | ||||||||||||||||||
|
|
|
|
|
|
|
|
|
|
|
| |||||||||||||
Total temporarily impaired securities | $ | 41,108 | $ | 80 | $ | 93,047 | $ | 547 | $ | 134,155 | $ | 627 | ||||||||||||
|
|
|
|
|
|
|
|
|
|
|
| |||||||||||||
2019.
| December 31, 2019 | ||||||||||||||||||||||||
| Less than 12 months | 12 months or longer | Total | ||||||||||||||||||||||
| Temporarily Impaired Investments | Fair Value | Unrealized Losses | Fair Value | Unrealized Losses | Fair Value | Unrealized Losses | ||||||||||||||||||
| (in thousands) | ||||||||||||||||||||||||
SBA Backed Securities | $ | 14,560 | $ | 30 | $ | 22,092 | $ | 113 | $ | 36,652 | $ | 143 | ||||||||||||
U.S. Government Agency and Sponsored Enterprise Mortgage-Backed Securities | 108,806 | 379 | 29,178 | 153 | 137,984 | 532 | ||||||||||||||||||
Privately Issued Residential Mortgage-Backed Securities | 252 | 2 | — | — | 252 | 2 | ||||||||||||||||||
Obligations Issued by States and Political Subdivisions | — | — | — | — | — | — | ||||||||||||||||||
Other Debt Securities | 800 | 1 | 481 | 18 | 1,281 | 19 | ||||||||||||||||||
Total temporarily impaired securities | $ | 124,418 | $ | 412 | $ | 51,751 | $ | 284 | $ | 176,169 | $ | 696 | ||||||||||||
| September 30, 2019 | December 31, 2018 | |||||||||||||||||||||||||||||||
| Amortized Cost | Gross Unrealized Gains | Gross Unrealized Losses | Estimated Fair Value | Amortized Cost | Gross Unrealized Gains | Gross Unrealized Losses | Estimated Fair Value | |||||||||||||||||||||||||
| (in thousands) | ||||||||||||||||||||||||||||||||
U.S. Treasury | $ | — | $ | — | $ | — | $ | — | $ | 9,960 | $ | — | $ | 2 | $ | 9,958 | ||||||||||||||||
U.S. Government Sponsored Enterprises | 121,516 | 653 | 67 | 122,102 | 234,228 | 336 | 803 | 233,761 | ||||||||||||||||||||||||
SBA Backed Securities | 47,126 | 452 | 66 | 47,512 | 52,051 | — | 2,065 | 49,986 | ||||||||||||||||||||||||
U.S. Government Agency and Sponsored Enterprises Mortgage-Backed Securities | 1,995,493 | 29,911 | 6,553 | 2,018,851 | 1,750,408 | 2,324 | 55,016 | 1,697,716 | ||||||||||||||||||||||||
|
|
|
|
|
|
|
|
|
|
|
|
|
|
|
| |||||||||||||||||
Total | $ | 2,164,135 | $ | 31,016 | $ | 6,686 | $ | 2,188,465 | $ | 2,046,647 | $ | 2,660 | $ | 57,886 | $ | 1,991,421 | ||||||||||||||||
|
|
|
|
|
|
|
|
|
|
|
|
|
|
|
| |||||||||||||||||
Page 14 of 48
September 30, 2020 | December 31, 2019 | |||||||||||||||||||||||||||||||
Amortized Cost | Gross Unrealized Gains | Gross Unrealized Losses | Estimated Fair Value | Amortized Cost | Gross Unrealized Gains | Gross Unrealized Losses | Estimated Fair Value | |||||||||||||||||||||||||
| (in thousands) | ||||||||||||||||||||||||||||||||
U.S. Government Sponsored Enterprises | $ | 248,211 | $ | 594 | $ | 494 | $ | 248,311 | $ | 98,867 | $ | 527 | $ | 96 | $ | 99,298 | ||||||||||||||||
SBA Backed Securities | 39,384 | 2,375 | 0 | 41,759 | 44,379 | 182 | 303 | 44,258 | ||||||||||||||||||||||||
U.S. Government Sponsored Enterprises Mortgage- Backed Securities | 2,119,581 | 76,185 | 889 | 2,194,877 | 2,207,874 | 20,720 | 10,846 | 2,217,748 | ||||||||||||||||||||||||
�� | ||||||||||||||||||||||||||||||||
Total | $ | 2,407,176 | $ | 79,154 | $ | 1,383 | $ | 2,484,947 | $ | 2,351,120 | $ | 21,429 | $ | 11,245 | $ | 2,361,304 | ||||||||||||||||
| Amortized Cost | Fair Value | |||||||
| (in thousands) | ||||||||
Within one year | $ | 70,980 | $ | 71,260 | ||||
After one but within five years | 1,809,564 | 1,829,087 | ||||||
After five but within ten years | 271,068 | 275,192 | ||||||
More than ten years | 12,523 | 12,926 | ||||||
|
|
|
| |||||
Total | $ | 2,164,135 | $ | 2,188,465 | ||||
|
|
|
| |||||
2020.
Amortized Cost | Fair Value | |||||||
(in thousands) | ||||||||
Within one year | $ | 64,436 | $ | 64,929 | ||||
After one but within five years | 1,954,304 | 2,018,674 | ||||||
After five but within ten years | 385,428 | 397,910 | ||||||
More than ten years | 3,008 | 3,434 | ||||||
Total | $ | 2,407,176 | $ | 2,484,947 | ||||
2019. In evaluating the underlying credit quality of a security, management considers several factors such as the credit rating of the obligor and the issuer, if applicable. Internal reviews of issuer financial statements are performed as deemed necessary.
| September 30, 2019 | ||||||||||||||||||||||||
| Less Than 12 Months | 12 Months or Longer | Total | ||||||||||||||||||||||
| Temporarily Impaired Investments | Fair Value | Unrealized Losses | Fair Value | Unrealized Losses | Fair Value | Unrealized Losses | ||||||||||||||||||
| (in thousands) | ||||||||||||||||||||||||
U.S. Treasury | $ | — | $ | — | $ | — | $ | — | $ | — | $ | — | ||||||||||||
U.S. Government Sponsored Enterprises | 9,976 | 22 | 9,954 | 45 | 19,930 | 67 | ||||||||||||||||||
SBA Backed Securities | 13,673 | 66 | — | — | 13,673 | 66 | ||||||||||||||||||
U.S. Government Agency and Sponsored Enterprise Mortgage- Backed Securities | 163,889 | 816 | 430,714 | 5,737 | 594,603 | 6,553 | ||||||||||||||||||
|
|
|
|
|
|
|
|
|
|
|
| |||||||||||||
Total temporarily impaired securities | $ | 187,538 | $ | 904 | $ | 440,668 | $ | 5,782 | $ | 628,206 | $ | 6,686 | ||||||||||||
|
|
|
|
|
|
|
|
|
|
|
| |||||||||||||
Page 15 of 48
September 30, 2020 | ||||||||||||||||||||||||
Less Than 12 Months | 12 Months or Longer | Total | ||||||||||||||||||||||
Temporarily Impaired Investments | Fair Value | Unrealized Losses | Fair Value | Unrealized Losses | Fair Value | Unrealized Losses | ||||||||||||||||||
(in thousands) | ||||||||||||||||||||||||
SBA Backed Securities | $ | 0 | $ | 0 | $ | — | $ | — | $ | 0 | $ | 0 | ||||||||||||
US Government Sponsored Enterprises Mortgage-Backed Securities | 128,240 | 494 | — | — | 128,240 | 494 | ||||||||||||||||||
U.S. Government Agency and Sponsored Enterprise Mortgage-Backed Securities | 129,158 | 840 | 4,176 | 49 | 133,334 | 889 | ||||||||||||||||||
Total temporarily impaired securities | $ | 257,398 | $ | 1,334 | $ | 4,176 | $ | 49 | $ | 261,574 | $ | 1,383 | ||||||||||||
| December 31, 2018 | ||||||||||||||||||||||||
| Less Than 12 Months | 12 Months or Longer | Total | ||||||||||||||||||||||
| Temporarily Impaired Investments | Fair Value | Unrealized Losses | Fair Value | Unrealized Losses | Fair Value | Unrealized Losses | ||||||||||||||||||
| (in thousands) | ||||||||||||||||||||||||
U.S. Treasury | $ | 9,958 | $ | 2 | $ | — | $ | — | $ | 9,958 | $ | 2 | ||||||||||||
U.S. Government Sponsored Enterprises | 9,849 | 42 | 69,499 | 761 | 79,348 | 803 | ||||||||||||||||||
SBA Backed Securities | — | — | 49,987 | 2,065 | 49,987 | 2,065 | ||||||||||||||||||
U.S. Government Agency and Sponsored Enterprise Mortgage-Backed Securities | 188,125 | 2,032 | 1,249,689 | 52,984 | 1,437,814 | 55,016 | ||||||||||||||||||
|
|
|
|
|
|
|
|
|
|
|
| |||||||||||||
Total temporarily impaired securities | $ | 207,932 | $ | 2,076 | $ | 1,369,175 | $ | 55,810 | $ | 1,577,107 | $ | 57,886 | ||||||||||||
|
|
|
|
|
|
|
|
|
|
|
| |||||||||||||
| December 31, 2019 | ||||||||||||||||||||||||
| Less Than 12 Months | 12 Months or Longer | Total | ||||||||||||||||||||||
| Temporarily Impaired Investments | Fair Value | Unrealized Losses | Fair Value | Unrealized Losses | Fair Value | Unrealized Losses | ||||||||||||||||||
| (in thousands) | ||||||||||||||||||||||||
U.S. Treasury | $ | — | $ | — | $ | — | $ | — | $ | — | $ | — | ||||||||||||
U.S. Government Sponsored Enterprises | 24,420 | 72 | 9,976 | 24 | 34,396 | 96 | ||||||||||||||||||
SBA Backed Securities | 25,251 | 303 | — | — | 25,251 | 303 | ||||||||||||||||||
U.S. Government Agency and Sponsored Enterprise Mortgage-Backed Securities | 613,905 | 3,949 | 389,919 | 6,897 | 1,003,824 | 10,846 | ||||||||||||||||||
Total temporarily impaired securities | $ | 663,576 | $ | 4,324 | $ | 399,895 | $ | 6,921 | $ | 1,063,471 | $ | 11,245 | ||||||||||||
5.4. Allowance for Loan Losses
| Three months ended September 30, | Nine months ended September 30, | |||||||||||||||
| 2019 | 2018 | 2019 | 2018 | |||||||||||||
| (in thousands) | ||||||||||||||||
Allowance for loan losses, beginning of period | $ | 29,070 | $ | 27,144 | $ | 28,543 | $ | 26,255 | ||||||||
Loans charged off | (118 | ) | (89 | ) | (336 | ) | (247 | ) | ||||||||
Recoveries on loans previouslycharged-off | 70 | 1,490 | 190 | 1,637 | ||||||||||||
|
|
|
|
|
|
|
| |||||||||
Net recoveries (charge-offs) | (48 | ) | 1,401 | (146 | ) | 1,390 | ||||||||||
Provision charged to expense | 75 | — | 700 | 900 | ||||||||||||
|
|
|
|
|
|
|
| |||||||||
Allowance for loan losses, end of period | $ | 29,097 | $ | 28,545 | $ | 29,097 | $ | 28,545 | ||||||||
|
|
|
|
|
|
|
| |||||||||
| Three months ended | Nine months ended | |||||||||||||||
2020 | 2019 | 2020 | 2019 | |||||||||||||
| (in thousands) | ||||||||||||||||
Allowance for loan losses, beginning of period | $ | 32,516 | $ | 29,070 | $ | 29,585 | $ | 28,543 | ||||||||
Loans charged off | (41 | ) | (118 | ) | (120 | ) | (336 | ) | ||||||||
Recoveries on loans previously charged-off | 19 | 70 | 254 | 190 | ||||||||||||
Net recoveries (charge-offs) | (22 | ) | (48 | ) | 134 | (146 | ) | |||||||||
Provision charged to expense | 900 | 75 | 3,675 | 700 | ||||||||||||
Allowance for loan losses, end of period | $ | 33,394 | $ | 29,097 | $ | 33,394 | $ | 29,097 | ||||||||
Construction and Land Development | Commercial and Industrial | Municipal | Commercial Real Estate | Residential Real Estate | Consumer | Home Equity | Unallocated | Total | ||||||||||||||||||||||||||||
Allowance for loan losses: | (in thousands) | |||||||||||||||||||||||||||||||||||
Balance at June 30, 2020 | $ | 289 | $ | 13,121 | $ | 2,868 | $ | 11,303 | $ | 3,094 | $ | 289 | $ | 1,465 | $ | 87 | $ | 32,516 | ||||||||||||||||||
Charge-offs | — | (20 | ) | — | — | — | (21 | ) | — | — | (41 | ) | ||||||||||||||||||||||||
Recoveries | — | 12 | — | — | — | 7 | 0 | — | 19 | |||||||||||||||||||||||||||
Provision | 76 | 2,731 | (300 | ) | (522 | ) | (958 | ) | 35 | (200 | ) | 38 | 900 | |||||||||||||||||||||||
Ending balance at September 30, 2020 | $ | 365 | $ | 15,844 | $ | 2,568 | $ | 10,781 | $ | 2,136 | $ | 310 | $ | 1,265 | $ | 125 | $ | 33,394 | ||||||||||||||||||
Amount of allowance for loan losses for loans deemed to be impaired | $ | — | $ | 12 | $ | — | $ | 75 | $ | — | $ | — | $ | — | $ | — | $ | 87 | ||||||||||||||||||
Amount of allowance for loan losses for loans not deemed to be impaired | $ | 365 | $ | 15,832 | $ | 2,568 | $ | 10,706 | $ | 2,136 | $ | 310 | $ | 1,265 | $ | 125 | $ | 33,307 | ||||||||||||||||||
Loans: | ||||||||||||||||||||||||||||||||||||
Ending balance | $ | 9,116 | $ | 1,315,407 | $ | 130,047 | $ | 784,895 | $ | 443,703 | $ | 19,866 | $ | 287,099 | $ | — | $ | 2,990,133 | ||||||||||||||||||
Loans deemed to be impaired | $ | — | $ | 160 | $ | — | $ | 2,675 | $ | 236 | $ | — | $ | — | $ | — | $ | 3,071 | ||||||||||||||||||
Loans not deemed to be impaired | $ | 9,116 | $ | 1,315,247 | $ | 130,047 | $ | 782,220 | $ | 443,467 | $ | 19,866 | $ | 287,099 | $ | — | $ | 2,987,062 | ||||||||||||||||||
Further information pertaining to the allowance for loan losses for the nine months ending September 30, 2020 is as follows: | ||||||||||||||||||||||||||||||||||||
Construction and Land Development | Commercial and Industrial | Municipal | Commercial Real Estate | Residential Real Estate | Consumer | Home Equity | Unallocated | Total | ||||||||||||||||||||||||||||
Allowance for loan losses: | (in thousands) | |||||||||||||||||||||||||||||||||||
Balance at December 31, 2019 | $ | 331 | $ | 11,596 | $ | 2,566 | $ | 11,464 | $ | 2,194 | $ | 312 | $ | 1,065 | $ | 57 | $ | 29,585 | ||||||||||||||||||
Charge-offs | — | (31 | ) | — | — | — | (89 | ) | — | — | (120 | ) | ||||||||||||||||||||||||
Recoveries | — | 182 | — | — | — | 67 | 5 | — | 254 | |||||||||||||||||||||||||||
Provision | 34 | 4,097 | 2 | (683 | ) | (58 | ) | 20 | 195 | 68 | 3,675 | |||||||||||||||||||||||||
Ending balance at September 30, 2020 | $ | 365 | $ | 15,844 | $ | 2,568 | $ | 10,781 | $ | 2,136 | $ | 310 | $ | 1,265 | $ | 125 | $ | 33,394 | ||||||||||||||||||
Amount of allowance for loan losses for loans deemed to be impaired | $ | — | $ | 12 | $ | — | $ | 75 | $ | — | $ | — | $ | — | $ | — | $ | 87 | ||||||||||||||||||
Amount of allowance for loan losses for loans not deemed to be impaired | $ | 365 | $ | 15,832 | $ | 2,568 | $ | 10,706 | $ | 2,136 | $ | 310 | $ | 1,265 | $ | 125 | $ | 33,307 | ||||||||||||||||||
Loans: | ||||||||||||||||||||||||||||||||||||
Ending balance | $ | 9,116 | $ | 1,315,407 | $ | 130,047 | $ | 784,895 | $ | 443,703 | $ | 19,866 | $ | 287,099 | $ | — | $ | 2,990,133 | ||||||||||||||||||
Loans deemed to be impaired | $ | — | $ | 160 | $ | — | $ | 2,675 | $ | 236 | $ | — | $ | — | $ | — | $ | 3,071 | ||||||||||||||||||
Loans not deemed to be impaired | $ | 9,116 | $ | 1,315,247 | $ | 130,047 | $ | 782,220 | $ | 443,467 | $ | 19,866 | $ | 287,099 | $ | — | $ | 2,987,062 | ||||||||||||||||||
| Construction and Land Development | Commercial and Industrial | Municipal | Commercial Real Estate | Residential Real Estate | Consumer | Home Equity | Unallocated | Total | ||||||||||||||||||||||||||||
| (in thousands) | ||||||||||||||||||||||||||||||||||||
| Allowance for loan losses: | ||||||||||||||||||||||||||||||||||||
Balance at June 30, 2019 | $ | 1,052 | $ | 11,338 | $ | 1,832 | $ | 10,848 | $ | 2,210 | $ | 380 | $ | 1,120 | $ | 290 | $ | 29,070 | ||||||||||||||||||
Charge-offs | — | (57 | ) | — | — | — | (61 | ) | — | — | (118 | ) | ||||||||||||||||||||||||
Recoveries | — | 23 | — | — | — | 47 | — | — | 70 | |||||||||||||||||||||||||||
Provision | (752 | ) | 9 | 751 | 53 | (24 | ) | (84 | ) | (33 | ) | 155 | 75 | |||||||||||||||||||||||
|
|
|
|
|
|
|
|
|
|
|
|
|
|
|
|
|
| |||||||||||||||||||
Ending balance at September 30, 2019 | $ | 300 | $ | 11,313 | $ | 2,583 | $ | 10,901 | $ | 2,186 | $ | 282 | $ | 1,087 | $ | 445 | $ | 29,097 | ||||||||||||||||||
|
|
|
|
|
|
|
|
|
|
|
|
|
|
|
|
|
| |||||||||||||||||||
Amount of allowance for loan losses for loans deemed to be impaired | $ | — | $ | 2 | $ | — | $ | 86 | $ | — | $ | — | $ | — | $ | — | $ | 88 | ||||||||||||||||||
|
|
|
|
|
|
|
|
|
|
|
|
|
|
|
|
|
| |||||||||||||||||||
Amount of allowance for loan losses for loans not deemed to be impaired | $ | 300 | $ | 11,311 | $ | 2,583 | $ | 10,815 | $ | 2,186 | $ | 282 | $ | 1,087 | $ | 445 | $ | 29,009 | ||||||||||||||||||
|
|
|
|
|
|
|
|
|
|
|
|
|
|
|
|
|
| |||||||||||||||||||
Loans: | ||||||||||||||||||||||||||||||||||||
Ending balance | $ | 7,824 | $ | 783,950 | $ | 121,802 | $ | 765,385 | $ | 364,317 | $ | 21,748 | $ | 310,635 | $ | — | $ | 2,375,661 | ||||||||||||||||||
|
|
|
|
|
|
|
|
|
|
|
|
|
|
|
|
|
| |||||||||||||||||||
Loans deemed to be impaired | $ | — | $ | 203 | $ | — | $ | 2,373 | $ | — | $ | — | $ | — | $ | — | $ | 2,576 | ||||||||||||||||||
|
|
|
|
|
|
|
|
|
|
|
|
|
|
|
|
|
| |||||||||||||||||||
Loans not deemed to be impaired | $ | 7,824 | $ | 783,747 | $ | 121,802 | $ | 763,012 | $ | 364,317 | $ | 21,748 | $ | 310,635 | $ | — | $ | 2,373,085 | ||||||||||||||||||
|
|
|
|
|
|
|
|
|
|
|
|
|
|
|
|
|
| |||||||||||||||||||
Further information pertaining to the allowance for loan losses for the nine months ending September 30, 2019 is as follows:
| Construction and Land Development | Commercial and Industrial | Municipal | Commercial Real Estate | Residential Real Estate | Consumer | Home Equity | Unallocated | Total | ||||||||||||||||||||||||||||
| (in thousands) | ||||||||||||||||||||||||||||||||||||
Allowance for loan losses: | ||||||||||||||||||||||||||||||||||||
Balance at December 31, 2018 | $ | 1,092 | $ | 10,998 | $ | 1,838 | $ | 10,663 | $ | 2,190 | $ | 365 | $ | 1,111 | $ | 286 | $ | 28,543 | ||||||||||||||||||
Charge-offs | — | (108 | ) | — | — | — | (228 | ) | — | — | (336 | ) | ||||||||||||||||||||||||
Recoveries | — | 49 | — | — | — | 141 | — | — | 190 | |||||||||||||||||||||||||||
Provision | (792 | ) | 374 | 745 | 238 | (4 | ) | 4 | (24 | ) | 159 | 700 | ||||||||||||||||||||||||
|
|
|
|
|
|
|
|
|
|
|
|
|
|
|
|
|
| |||||||||||||||||||
Ending balance at September 30, 2019 | $ | 300 | $ | 11,313 | $ | 2,583 | $ | 10,901 | $ | 2,186 | $ | 282 | $ | 1,087 | $ | 445 | $ | 29,097 | ||||||||||||||||||
|
|
|
|
|
|
|
|
|
|
|
|
|
|
|
|
|
| |||||||||||||||||||
Amount of allowance for loan losses for loans deemed to be impaired | $ | — | $ | 2 | $ | — | $ | 86 | $ | — | $ | — | $ | — | $ | — | $ | 88 | ||||||||||||||||||
|
|
|
|
|
|
|
|
|
|
|
|
|
|
|
|
|
| |||||||||||||||||||
Amount of allowance for loan losses for loans not deemed to be impaired | $ | 300 | $ | 11,311 | $ | 2,583 | $ | 10,815 | $ | 2,186 | $ | 282 | $ | 1,087 | $ | 445 | $ | 29,009 | ||||||||||||||||||
|
|
|
|
|
|
|
|
|
|
|
|
|
|
|
|
|
| |||||||||||||||||||
Loans: | ||||||||||||||||||||||||||||||||||||
Ending balance | $ | 7,824 | $ | 783,950 | $ | 121,802 | $ | 765,385 | $ | 364,317 | $ | 21,748 | $ | 310,635 | $ | — | $ | 2,375,661 | ||||||||||||||||||
|
|
|
|
|
|
|
|
|
|
|
|
|
|
|
|
|
| |||||||||||||||||||
Loans deemed to be impaired | $ | — | $ | 203 | $ | — | $ | 2,373 | $ | — | $ | — | $ | — | $ | — | $ | 2,576 | ||||||||||||||||||
|
|
|
|
|
|
|
|
|
|
|
|
|
|
|
|
|
| |||||||||||||||||||
Loans not deemed to be impaired | $ | 7,824 | $ | 783,747 | $ | 121,802 | $ | 763,012 | $ | 364,317 | $ | 21,748 | $ | 310,635 | $ | — | $ | 2,373,085 | ||||||||||||||||||
|
|
|
|
|
|
|
|
|
|
|
|
|
|
|
|
|
| |||||||||||||||||||
| Construction and Land Development | Commercial and Industrial | Municipal | Commercial Real Estate | Residential Real Estate | Consumer | Home Equity | Unallocated | Total | ||||||||||||||||||||||||||||
| Allowance for loan losses: | (in thousands) | |||||||||||||||||||||||||||||||||||
Balance at June 30, 2019 | $ | 1,052 | $ | 11,338 | $ | 1,832 | $ | 10,848 | $ | 2,210 | $ | 380 | $ | 1,120 | $ | 290 | $ | 29,070 | ||||||||||||||||||
Charge-offs | — | (57 | ) | — | — | — | (61 | ) | — | — | (118 | ) | ||||||||||||||||||||||||
Recoveries | — | 23 | — | — | — | 47 | — | — | 70 | |||||||||||||||||||||||||||
Provision | (752 | ) | 9 | 751 | 53 | (24 | ) | (84 | ) | (33 | ) | 155 | 75 | |||||||||||||||||||||||
Ending balance at September 30, 2019 | $ | 300 | $ | 11,313 | $ | 2,583 | $ | 10,901 | $ | 2,186 | $ | 282 | $ | 1,087 | $ | 445 | $ | 29,097 | ||||||||||||||||||
Amount of allowance for loan losses for loans deemed to be impaired | $ | — | $ | 2 | $ | — | $ | 86 | $ | — | $ | — | $ | — | $ | — | $ | 88 | ||||||||||||||||||
Amount of allowance for loan losses for loans not deemed to be impaired | $ | 300 | $ | 11,311 | $ | 2,583 | $ | 10,815 | $ | 2,186 | $ | 282 | $ | 1,087 | $ | 445 | $ | 29,009 | ||||||||||||||||||
Loans: | ||||||||||||||||||||||||||||||||||||
Ending balance | $ | 7,824 | $ | 783,950 | $ | 121,802 | $ | 765,385 | $ | 364,317 | $ | 21,748 | $ | 310,635 | $ | — | $ | 2,375,661 | ||||||||||||||||||
Loans deemed to be impaired | $ | — | $ | 203 | $ | — | $ | 2,373 | $ | — | $ | — | $ | — | $ | — | $ | 2,576 | ||||||||||||||||||
Loans not deemed to be impaired | $ | 7,824 | $ | 783,747 | $ | 121,802 | $ | 763,012 | $ | 364,317 | $ | 21,748 | $ | 310,635 | $ | — | $ | 2,373,085 | ||||||||||||||||||
Further information pertaining to the allowance for loan losses for the nine months ending September 30, 2019 is as follows: | ||||||||||||||||||||||||||||||||||||
| Construction and Land Development | Commercial and Industrial | Municipal | Commercial Real Estate | Residential Real Estate | Consumer | Home Equity | Unallocated | Total | ||||||||||||||||||||||||||||
| Allowance for loan losses: | (in thousands) | |||||||||||||||||||||||||||||||||||
Balance at December 31, 2018 | $ | 1,092 | $ | 10,998 | $ | 1,838 | $ | 10,663 | $ | 2,190 | $ | 365 | $ | 1,111 | $ | 286 | $ | 28,543 | ||||||||||||||||||
Charge-offs | — | (108 | ) | — | — | — | (228 | ) | — | — | (336 | ) | ||||||||||||||||||||||||
Recoveries | — | 49 | — | — | — | 141 | — | — | 190 | |||||||||||||||||||||||||||
Provision | (792 | ) | 374 | 745 | 238 | (4 | ) | 4 | (24 | ) | 159 | 700 | ||||||||||||||||||||||||
Ending balance at September 30, 2019 | $ | 300 | $ | 11,313 | $ | 2,583 | $ | 10,901 | $ | 2,186 | $ | 282 | $ | 1,087 | $ | 445 | $ | 29,097 | ||||||||||||||||||
Amount of allowance for loan losses for loans deemed to be impaired | $ | — | $ | 2 | $ | — | $ | 86 | $ | — | $ | — | $ | — | $ | — | $ | 88 | ||||||||||||||||||
Amount of allowance for loan losses for loans not deemed to be impaired | $ | 300 | $ | 11,311 | $ | 2,583 | $ | 10,815 | $ | 2,186 | $ | 282 | $ | 1,087 | $ | 445 | $ | 29,009 | ||||||||||||||||||
Loans: | ||||||||||||||||||||||||||||||||||||
Ending balance | $ | 7,824 | $ | 783,950 | $ | 121,802 | $ | 765,385 | $ | 364,317 | $ | 21,748 | $ | 310,635 | $ | — | $ | 2,375,661 | ||||||||||||||||||
Loans deemed to be impaired | $ | — | $ | 203 | $ | — | $ | 2,373 | $ | — | $ | — | $ | — | $ | — | $ | 2,576 | ||||||||||||||||||
Loans not deemed to be impaired | $ | 7,824 | $ | 783,747 | $ | 121,802 | $ | 763,012 | $ | 364,317 | $ | 21,748 | $ | 310,635 | $ | — | $ | 2,373,085 | ||||||||||||||||||
Further information pertaining to the allowance for loan losses for the three months ending September 30, 2018 follows:
| Construction and Land Development | Commercial and Industrial | Municipal | Commercial Real Estate | Residential Real Estate | Consumer | Home Equity | Unallocated | Total | ||||||||||||||||||||||||||||
| (in thousands) | ||||||||||||||||||||||||||||||||||||
Allowance for loan losses: | ||||||||||||||||||||||||||||||||||||
Balance at June 30, 2018 | $ | 633 | $ | 10,384 | $ | 1,704 | $ | 10,209 | $ | 2,493 | $ | 336 | $ | 1,078 | $ | 307 | $ | 27,144 | ||||||||||||||||||
Charge-offs | — | (11 | ) | — | — | — | (78 | ) | — | — | (89 | ) | ||||||||||||||||||||||||
Recoveries | 1,432 | 16 | — | — | — | 42 | — | — | 1,490 | |||||||||||||||||||||||||||
Provision | (1,155 | ) | 895 | 84 | 415 | (182 | ) | 32 | (28 | ) | (61 | ) | — | |||||||||||||||||||||||
|
|
|
|
|
|
|
|
|
|
|
|
|
|
|
|
|
| |||||||||||||||||||
Ending balance at September 30, 2018 | $ | 910 | $ | 11,284 | $ | 1,788 | $ | 10,624 | $ | 2,311 | $ | 332 | $ | 1,050 | $ | 246 | $ | 28,545 | ||||||||||||||||||
|
|
|
|
|
|
|
|
|
|
|
|
|
|
|
|
|
| |||||||||||||||||||
Amount of allowance for loan losses for loans deemed to be impaired | $ | — | $ | 93 | $ | — | $ | 95 | $ | 350 | $ | — | $ | — | $ | — | $ | 538 | ||||||||||||||||||
|
|
|
|
|
|
|
|
|
|
|
|
|
|
|
|
|
| |||||||||||||||||||
Amount of allowance for loan losses for loans not deemed to be impaired | $ | 910 | $ | 11,191 | $ | 1,788 | $ | 10,529 | $ | 1,961 | $ | 332 | $ | 1,050 | $ | 246 | $ | 28,007 | ||||||||||||||||||
|
|
|
|
|
|
|
|
|
|
|
|
|
|
|
|
|
| |||||||||||||||||||
Loans: | ||||||||||||||||||||||||||||||||||||
Ending balance | $ | 12,434 | $ | 783,960 | $ | 94,532 | $ | 730,265 | $ | 335,114 | $ | 21,216 | $ | 283,818 | $ | — | $ | 2,261,339 | ||||||||||||||||||
|
|
|
|
|
|
|
|
|
|
|
|
|
|
|
|
|
| |||||||||||||||||||
Loans deemed to be impaired | $ | — | $ | 660 | $ | — | $ | 2,680 | $ | 2,675 | $ | — | $ | — | $ | — | $ | 6,015 | ||||||||||||||||||
|
|
|
|
|
|
|
|
|
|
|
|
|
|
|
|
|
| |||||||||||||||||||
Loans not deemed to be impaired | $ | 12,434 | $ | 783,300 | $ | 94,532 | $ | 727,585 | $ | 332,439 | $ | 21,216 | $ | 283,818 | $ | — | $ | 2,255,324 | ||||||||||||||||||
|
|
|
|
|
|
|
|
|
|
|
|
|
|
|
|
|
| |||||||||||||||||||
Further information pertaining to the allowance for loan losses for the nine months ending September 30, 2018 follows:
| Construction and Land Development | Commercial and Industrial | Municipal | Commercial Real Estate | Residential Real Estate | Consumer | Home Equity | Unallocated | Total | ||||||||||||||||||||||||||||
| (in thousands) | ||||||||||||||||||||||||||||||||||||
Allowance for loan losses: | ||||||||||||||||||||||||||||||||||||
Balance at December 31, 2017 | $ | 1,645 | $ | 9,651 | $ | 1,720 | $ | 9,728 | $ | 1,873 | $ | 373 | $ | 989 | $ | 276 | $ | 26,255 | ||||||||||||||||||
Charge-offs | — | (16 | ) | — | — | — | (231 | ) | — | — | (247 | ) | ||||||||||||||||||||||||
Recoveries | 1,432 | 49 | — | — | — | 156 | — | — | 1,637 | |||||||||||||||||||||||||||
Provision | (2,167 | ) | 1,600 | 68 | 896 | 438 | 34 | 61 | (30 | ) | 900 | |||||||||||||||||||||||||
|
|
|
|
|
|
|
|
|
|
|
|
|
|
|
|
|
| |||||||||||||||||||
Ending balance at September 30, 2018 | $ | 910 | $ | 11,284 | $ | 1,788 | $ | 10,624 | $ | 2,311 | $ | 332 | $ | 1,050 | $ | 246 | $ | 28,545 | ||||||||||||||||||
|
|
|
|
|
|
|
|
|
|
|
|
|
|
|
|
|
| |||||||||||||||||||
Amount of allowance for loan losses for loans deemed to be impaired | $ | — | $ | 93 | $ | — | $ | 95 | $ | 350 | $ | — | $ | — | $ | — | $ | 538 | ||||||||||||||||||
|
|
|
|
|
|
|
|
|
|
|
|
|
|
|
|
|
| |||||||||||||||||||
Amount of allowance for loan losses for loans not deemed to be impaired | $ | 910 | $ | 11,191 | $ | 1,788 | $ | 10,529 | $ | 1,961 | $ | 332 | $ | 1,050 | $ | 246 | $ | 28,007 | ||||||||||||||||||
|
|
|
|
|
|
|
|
|
|
|
|
|
|
|
|
|
| |||||||||||||||||||
Loans: | ||||||||||||||||||||||||||||||||||||
Ending balance | $ | 12,434 | $ | 783,960 | $ | 94,532 | $ | 730,265 | $ | 335,114 | $ | 21,216 | $ | 283,818 | $ | — | $ | 2,261,339 | ||||||||||||||||||
|
|
|
|
|
|
|
|
|
|
|
|
|
|
|
|
|
| |||||||||||||||||||
Loans deemed to be impaired | $ | — | $ | 660 | $ | — | $ | 2,680 | $ | 2,675 | $ | — | $ | — | $ | — | $ | 6,015 | ||||||||||||||||||
|
|
|
|
|
|
|
|
|
|
|
|
|
|
|
|
|
| |||||||||||||||||||
Loans not deemed to be impaired | $ | 12,434 | $ | 783,300 | $ | 94,532 | $ | 727,585 | $ | 332,439 | $ | 21,216 | $ | 283,818 | $ | — | $ | 2,255,324 | ||||||||||||||||||
|
|
|
|
|
|
|
|
|
|
|
|
|
|
|
|
|
| |||||||||||||||||||
During the nine months ending September 30, 2018, the Company’s provision was primarily attributable to an increase in residential real estate balances and increased qualitative allocations for commercial and industrial and commercial real estate loans, offset, somewhat by the recoveryTable of a construction loan previouslycharged-off and a decrease in construction balances. During the three months ending September 30, 2018, the Company did not require a provision mainly as a result of recoveries of a construction loan previouslycharged-off and a decrease in construction loan balances offset by increased qualitative allocations for commercial and industrial and commercial real estate loans. The Company monitors the outlook for the industries in which our borrowers operate. Healthcare and higher education are two of the primary industries. In particular the Company utilizes outlooks and forecasts from various sources. Overall a general weakening in the outlook was noted resulting in a general increase in the general economic factors. The Company also monitors the volatility of the losses within the historical data.
Page 18 of 48
2019.
2019.
| Construction and Land Development | Commercial and Industrial | Municipal | Commercial Real Estate | |||||||||||||
| (in thousands) | ||||||||||||||||
Grade: | ||||||||||||||||
1-3 (Pass) | $ | 7,824 | $ | 779,722 | $ | 121,802 | $ | 738,459 | ||||||||
4 (Monitor) | — | 4,025 | — | 24,553 | ||||||||||||
5 (Substandard) | — | — | — | — | ||||||||||||
6 (Doubtful) | — | — | — | — | ||||||||||||
Impaired | — | 203 | — | 2,373 | ||||||||||||
|
|
|
|
|
|
|
| |||||||||
Total | $ | 7,824 | $ | 783,950 | $ | 121,802 | $ | 765,385 | ||||||||
|
|
|
|
|
|
|
| |||||||||
2020.
Construction and Land Development | Commercial and Industrial | Municipal | Commercial Real Estate | |||||||||||||
Grade: | (in thousands) | |||||||||||||||
1-3 (Pass) | $ | 9,116 | $ | 1,308,693 | $ | 130,047 | $ | 757,953 | ||||||||
4 (Monitor) | — | 6,554 | — | 24,267 | ||||||||||||
5 (Substandard) | — | — | — | — | ||||||||||||
6 (Doubtful) | — | — | — | — | ||||||||||||
Impaired | — | 160 | — | 2,675 | ||||||||||||
Total | $ | 9,116 | $ | 1,315,407 | $ | 130,047 | $ | 784,895 | ||||||||
| Construction and Land Development | Commercial and Industrial | Municipal | Commercial Real Estate | |||||||||||||
| (in thousands) | ||||||||||||||||
Grade: | ||||||||||||||||
1-3 (Pass) | $ | 13,628 | $ | 757,089 | $ | 97,290 | $ | 723,170 | ||||||||
4 (Monitor) | — | 4,135 | — | 24,542 | ||||||||||||
5 (Substandard) | — | — | — | — | ||||||||||||
6 (Doubtful) | — | — | — | — | ||||||||||||
Impaired | — | 401 | — | 2,650 | ||||||||||||
|
|
|
|
|
|
|
| |||||||||
Total | $ | 13,628 | $ | 761,625 | $ | 97,290 | $ | 750,362 | ||||||||
|
|
|
|
|
|
|
| |||||||||
2019.
| Construction and Land Development | Commercial and Industrial | Municipal | Commercial Real Estate | |||||||||||||
| Grade: | (in thousands) | |||||||||||||||
1-3 (Pass) | $ | 8,992 | $ | 807,486 | $ | 120,455 | $ | 759,402 | ||||||||
4 (Monitor) | — | 4,025 | — | 24,354 | ||||||||||||
5 (Substandard) | — | — | — | — | ||||||||||||
6 (Doubtful) | — | — | — | — | ||||||||||||
Impaired | — | 906 | — | 2,346 | ||||||||||||
Total | $ | 8,992 | $ | 812,417 | $ | 120,455 | $ | 786,102 | ||||||||
| Commercial and Industrial | Municipal | Commercial Real Estate | Total | |||||||||||||
| (in thousands) | ||||||||||||||||
Credit Rating: | ||||||||||||||||
Aaa – Aa3 | $ | 497,124 | $ | 54,495 | $ | 40,759 | $ | 592,378 | ||||||||
A1 – A3 | 187,970 | 7,479 | 148,735 | 344,184 | ||||||||||||
Baa1 – Baa3 | — | 51,133 | 122,288 | 173,421 | ||||||||||||
Ba2 | — | 5,895 | — | 5,895 | ||||||||||||
|
|
|
|
|
|
|
| |||||||||
Total | $ | 685,094 | $ | 119,002 | $ | 311,782 | $ | 1,115,878 | ||||||||
|
|
|
|
|
|
|
| |||||||||
Commercial and Industrial | Municipal | Commercial Real Estate | Total | |||||||||||||
Credit Rating: | (in thousands) | |||||||||||||||
Aaa – Aa3 | $ | 647,056 | $ | 64,806 | $ | 38,365 | $ | 750,227 | ||||||||
A1 – A3 | 184,409 | 7,228 | 145,467 | 337,104 | ||||||||||||
Baa1 – Baa3 | 50,000 | 51,133 | 140,486 | 241,619 | ||||||||||||
Ba2 | — | 5,080 | — | 5,080 | ||||||||||||
Total | $ | 881,465 | $ | 128,247 | $ | 324,318 | $ | 1,334,030 | ||||||||
| Commercial and Industrial | Municipal | Commercial Real Estate | Total | |||||||||||||
| (in thousands) | ||||||||||||||||
Credit Rating: | ||||||||||||||||
Aaa – Aa3 | $ | 491,247 | $ | 54,105 | $ | 42,790 | $ | 588,142 | ||||||||
A1 – A3 | 172,472 | 7,605 | 151,381 | 331,458 | ||||||||||||
Baa1 – Baa3 | — | 26,970 | 118,197 | 145,167 | ||||||||||||
Ba2 | — | 6,810 | — | 6,810 | ||||||||||||
|
|
|
|
|
|
|
| |||||||||
Total | $ | 663,719 | $ | 95,490 | $ | 312,368 | $ | 1,071,577 | ||||||||
|
|
|
|
|
|
|
| |||||||||
2019.
| Commercial and Industrial | Municipal | Commercial Real Estate | Total | |||||||||||||
| Credit Rating: | (in thousands) | |||||||||||||||
Aaa – Aa3 | $ | 523,644 | $ | 53,273 | $ | 40,437 | $ | 617,354 | ||||||||
A1 – A3 | 186,044 | 7,354 | 148,346 | 341,744 | ||||||||||||
Baa1 – Baa3 | — | 51,133 | 144,711 | 195,844 | ||||||||||||
Ba2 | — | 5,895 | — | 5,895 | ||||||||||||
Total | $ | 709,688 | $ | 117,655 | $ | 333,494 | $ | 1,160,837 | ||||||||
| Accruing 30-89 Days Past Due | Non Accrual | Accruing Greater than 90 Days | Total Past Due | Current Loans | Total | |||||||||||||||||||
| (in thousands) | ||||||||||||||||||||||||
Construction and land development | $ | — | $ | — | $ | — | $ | — | $ | 7,824 | $ | 7,824 | ||||||||||||
Commercial and industrial | 108 | 19 | — | 127 | 783,823 | 783,950 | ||||||||||||||||||
Municipal | — | — | — | — | 121,802 | 121,802 | ||||||||||||||||||
Commercial real estate | 155 | 167 | — | 322 | 765,063 | 765,385 | ||||||||||||||||||
Residential real estate | 1,129 | 334 | — | 1,463 | 362,854 | 364,317 | ||||||||||||||||||
Consumer and overdrafts | 15 | — | — | 15 | 21,733 | 21,748 | ||||||||||||||||||
Home equity | 1,050 | 546 | — | 1,596 | 309,039 | 310,635 | ||||||||||||||||||
|
|
|
|
|
|
|
|
|
|
|
| |||||||||||||
Total | $ | 2,457 | $ | 1,066 | $ | — | $ | 3,523 | $ | 2,372,138 | $ | 2,375,661 | ||||||||||||
|
|
|
|
|
|
|
|
|
|
|
| |||||||||||||
Accruing 30-89 Days Past Due | Non Accrual | Accruing Greater than 90 Days | Total Past Due | Current Loans | Total | |||||||||||||||||||
(in thousands) | ||||||||||||||||||||||||
Construction and land development | $ | — | $ | — | $ | — | $ | — | $ | 9,116 | $ | 9,116 | ||||||||||||
Commercial and industrial | 623 | 3 | — | 626 | 1,314,781 | 1,315,407 | ||||||||||||||||||
Municipal | — | — | — | — | 130,047 | 130,047 | ||||||||||||||||||
Commercial real estate | 3,596 | 593 | 49 | 4,238 | 780,657 | 784,895 | ||||||||||||||||||
Residential real estate | 569 | 532 | — | 1,101 | 442,602 | 443,703 | ||||||||||||||||||
Consumer and overdrafts | 15 | — | — | 15 | 19,851 | 19,866 | ||||||||||||||||||
Home equity | 1,206 | 291 | — | 1,497 | 285,602 | 287,099 | ||||||||||||||||||
Total | $ | 6,009 | $ | 1,419 | $ | 49 | $ | 7,477 | $ | 2,982,656 | $ | 2,990,133 | ||||||||||||
| Accruing 30-89 Days Past Due | Non Accrual | Accruing Greater than 90 Days | Total Past Due | Current Loans | Total | |||||||||||||||||||
| (in thousands) | ||||||||||||||||||||||||
Construction and land development | $ | — | $ | — | $ | — | $ | — | $ | 13,628 | $ | 13,628 | ||||||||||||
Commercial and industrial | 187 | 115 | — | 302 | 761,323 | 761,625 | ||||||||||||||||||
Municipal | — | — | — | — | 97,290 | 97,290 | ||||||||||||||||||
Commercial real estate | 774 | 190 | — | 964 | 749,398 | 750,362 | ||||||||||||||||||
Residential real estate | 2,554 | 569 | — | 3,123 | 345,127 | 348,250 | ||||||||||||||||||
Consumer and overdrafts | 24 | 14 | — | 38 | 22,045 | 22,083 | ||||||||||||||||||
Home equity | 1,108 | 425 | — | 1,533 | 290,807 | 292,340 | ||||||||||||||||||
|
|
|
|
|
|
|
|
|
|
|
| |||||||||||||
Total | $ | 4,647 | $ | 1,313 | $ | — | $ | 5,960 | $ | 2,279,618 | $ | 2,285,578 | ||||||||||||
|
|
|
|
|
|
|
|
|
|
|
| |||||||||||||
| Accruing 30-89 Days Past Due | Non Accrual | Accruing Greater than 90 Days | Total Past Due | Current Loans | Total | |||||||||||||||||||
| (in thousands) | ||||||||||||||||||||||||
Construction and land development | $ | — | $ | — | $ | — | $ | — | $ | 8,992 | $ | 8,992 | ||||||||||||
Commercial and industrial | 227 | 400 | — | 627 | 811,790 | 812,417 | ||||||||||||||||||
Municipal | — | — | — | — | 120,455 | 120,455 | ||||||||||||||||||
Commercial real estate | 840 | 492 | — | 1,332 | 784,770 | 786,102 | ||||||||||||||||||
Residential real estate | 1,563 | 683 | — | 2,246 | 369,651 | 371,897 | ||||||||||||||||||
Consumer and overdrafts | 18 | 4 | — | 22 | 21,871 | 21,893 | ||||||||||||||||||
Home equity | 603 | 435 | — | 1,038 | 303,325 | 304,363 | ||||||||||||||||||
Total | $ | 3,251 | $ | 2,014 | $ | — | $ | 5,265 | $ | 2,420,854 | $ | 2,426,119 | ||||||||||||
2019.
Carrying Value | Unpaid Principal Balance | Required Reserve | Average Carrying Value for 3 Months Ending 9/30/20 | Interest Income Recognized for 3 Months Ending 9/30/20 | Average Carrying Value for 9 Months Ending 9/30/20 | Interest Income Recognized for 9 Months Ending 9/30/20 | ||||||||||||||||||||||
With no required reserve recorded: | (in thousands) | |||||||||||||||||||||||||||
Construction and land development | $ | — | $ | — | $ | — | $ | — | $ | — | $ | — | $ | — | ||||||||||||||
Commercial and industrial | 67 | 88 | — | 73 | 0 | 288 | 2 | |||||||||||||||||||||
Municipal | — | — | — | — | — | — | — | |||||||||||||||||||||
Commercial real estate | 592 | 624 | — | 601 | — | 365 | — | |||||||||||||||||||||
Residential real estate | 236 | 236 | — | 236 | — | 118 | — | |||||||||||||||||||||
Consumer | — | — | — | — | — | — | — | |||||||||||||||||||||
Home equity | — | — | — | — | — | — | — | |||||||||||||||||||||
Total | $ | 895 | $ | 948 | $ | — | $ | 910 | $ | 0 | $ | 771 | $ | 2 | ||||||||||||||
With required reserve recorded: | ||||||||||||||||||||||||||||
Construction and land development | $ | — | $ | — | $ | — | $ | — | $ | — | $ | — | $ | — | ||||||||||||||
Commercial and industrial | 93 | 93 | 12 | 100 | 1 | 95 | 3 | |||||||||||||||||||||
Municipal | — | — | — | — | — | — | — | |||||||||||||||||||||
Commercial real estate | 2,083 | 2,209 | 75 | 2,094 | 21 | 2,140 | 65 | |||||||||||||||||||||
Residential real estate | — | — | — | — | — | — | — | |||||||||||||||||||||
Consumer | — | — | — | — | — | — | — | |||||||||||||||||||||
Home equity | — | — | — | — | — | — | — | |||||||||||||||||||||
Total | $ | 2,176 | $ | 2,302 | $ | 87 | $ | 2,194 | $ | 22 | $ | 2,235 | $ | 68 | ||||||||||||||
Total: | ||||||||||||||||||||||||||||
Construction and land development | $ | — | $ | — | $ | — | $ | — | $ | — | $ | — | $ | — | ||||||||||||||
Commercial and industrial | 160 | 181 | 12 | 173 | 1 | 383 | 5 | |||||||||||||||||||||
Municipal | — | — | — | — | — | — | — | |||||||||||||||||||||
Commercial real estate | 2,675 | 2,833 | 75 | 2,695 | 21 | 2,505 | 65 | |||||||||||||||||||||
Residential real estate | 236 | 236 | — | 236 | — | 118 | — | |||||||||||||||||||||
Consumer | — | — | — | — | — | — | — | |||||||||||||||||||||
Home equity | — | — | — | — | — | — | — | |||||||||||||||||||||
Total | $ | 3,071 | $ | 3,250 | $ | 87 | $ | 3,104 | $ | 22 | $ | 3,006 | $ | 70 | ||||||||||||||
| Carrying Value | Unpaid Principal Balance | Required Reserve | Average Carrying Value for 3 Months Ending 9/30/19 | Interest Income Recognized for 3 Months Ending 9/30/19 | Average Carrying Value for 9 Months Ending 9/30/19 | Interest Income Recognized for 9 Months Ending 9/30/19 | ||||||||||||||||||||||
| (in thousands) | ||||||||||||||||||||||||||||
With no required reserve recorded: | ||||||||||||||||||||||||||||
Construction and land development | $ | — | $ | — | $ | — | $ | — | $ | — | $ | — | $ | — | ||||||||||||||
Commercial and industrial | 87 | 306 | — | 89 | 2 | 87 | 6 | |||||||||||||||||||||
Municipal | — | — | — | — | — | — | — | |||||||||||||||||||||
Commercial real estate | 167 | 194 | — | 729 | — | 529 | — | |||||||||||||||||||||
Residential real estate | — | — | — | — | — | — | — | |||||||||||||||||||||
Consumer | — | — | — | — | — | — | — | |||||||||||||||||||||
Home equity | — | — | — | — | — | — | — | |||||||||||||||||||||
|
|
|
|
|
|
|
|
|
|
|
|
|
| |||||||||||||||
Total | $ | 254 | $ | 500 | $ | — | $ | 818 | $ | 2 | $ | 616 | $ | 6 | ||||||||||||||
|
|
|
|
|
|
|
|
|
|
|
|
|
| |||||||||||||||
With required reserve recorded: | ||||||||||||||||||||||||||||
Construction and land development | $ | — | $ | — | $ | — | $ | — | $ | — | $ | — | $ | — | ||||||||||||||
Commercial and industrial | 116 | 116 | 2 | 310 | 2 | 299 | 6 | |||||||||||||||||||||
Municipal | — | — | — | — | — | — | — | |||||||||||||||||||||
Commercial real estate | 2,206 | 2,326 | 86 | 2,140 | 23 | 2,350 | 67 | |||||||||||||||||||||
Residential real estate | — | — | — | — | — | — | — | |||||||||||||||||||||
Consumer | — | — | — | — | — | — | — | |||||||||||||||||||||
Home equity | — | — | — | — | — | — | — | |||||||||||||||||||||
|
|
|
|
|
|
|
|
|
|
|
|
|
| |||||||||||||||
Total | $ | 2,322 | $ | 2,442 | $ | 88 | $ | 2,450 | $ | 25 | $ | 2,649 | $ | 73 | ||||||||||||||
|
|
|
|
|
|
|
|
|
|
|
|
|
| |||||||||||||||
Total: | ||||||||||||||||||||||||||||
Construction and land development | $ | — | $ | — | $ | — | $ | — | $ | — | $ | — | $ | — | ||||||||||||||
Commercial and industrial | 203 | 422 | 2 | 399 | 4 | 386 | 12 | |||||||||||||||||||||
Municipal | — | — | — | — | — | — | — | |||||||||||||||||||||
Commercial real estate | 2,373 | 2,520 | 86 | 2,869 | 23 | 2,879 | 67 | |||||||||||||||||||||
Residential real estate | — | — | — | — | — | — | — | |||||||||||||||||||||
Consumer | — | — | — | — | — | — | — | |||||||||||||||||||||
Home equity | — | — | — | — | — | — | — | |||||||||||||||||||||
|
|
|
|
|
|
|
|
|
|
|
|
|
| |||||||||||||||
Total | $ | 2,576 | $ | 2,942 | $ | 88 | $ | 3,268 | $ | 27 | $ | 3,265 | $ | 79 | ||||||||||||||
|
|
|
|
|
|
|
|
|
|
|
|
|
| |||||||||||||||
Page 22 of 48
The following is information pertaining to impaired loans for September 30, 2018:
| Carrying Value | Unpaid Principal Balance | Required Reserve | Average Carrying Value for 3 Months Ending 9/30/18 | Interest Income Recognized for 3 Months Ending 9/30/18 | Average Carrying Value for 9 Months Ending 9/30/18 | Interest Income Recognized for 9 Months Ending 9/30/18 | ||||||||||||||||||||||
| (in thousands) | ||||||||||||||||||||||||||||
With no required reserve recorded: | ||||||||||||||||||||||||||||
Construction and land development | $ | — | $ | — | $ | — | $ | — | $ | — | $ | — | $ | — | ||||||||||||||
Commercial and industrial | 84 | 282 | — | 56 | — | 47 | — | |||||||||||||||||||||
Municipal | — | — | — | — | — | — | — | |||||||||||||||||||||
Commercial real estate | 196 | 219 | — | 280 | — | 267 | — | |||||||||||||||||||||
Residential real estate | — | — | — | — | — | — | — | |||||||||||||||||||||
Consumer | — | — | — | — | — | — | — | |||||||||||||||||||||
Home equity | — | — | — | — | — | — | — | |||||||||||||||||||||
|
|
|
|
|
|
|
|
|
|
|
|
|
| |||||||||||||||
Total | $ | 280 | $ | 501 | $ | — | $ | 336 | $ | — | $ | 314 | $ | — | ||||||||||||||
|
|
|
|
|
|
|
|
|
|
|
|
|
| |||||||||||||||
With required reserve recorded: | ||||||||||||||||||||||||||||
Construction and land development | $ | — | $ | — | $ | — | $ | — | $ | — | $ | — | $ | — | ||||||||||||||
Commercial and industrial | 576 | 593 | 93 | 589 | 5 | 490 | 14 | |||||||||||||||||||||
Municipal | — | — | — | — | — | — | — | |||||||||||||||||||||
Commercial real estate | 2,484 | 2,597 | 95 | 2,262 | 24 | 2,278 | 71 | |||||||||||||||||||||
Residential real estate | 2,675 | 2,675 | 350 | 2,675 | — | 3,136 | 80 | |||||||||||||||||||||
Consumer | — | — | — | — | — | — | — | |||||||||||||||||||||
Home equity | — | — | — | — | — | — | — | |||||||||||||||||||||
|
|
|
|
|
|
|
|
|
|
|
|
|
| |||||||||||||||
Total | $ | 5,735 | $ | 5,865 | $ | 538 | $ | 5,526 | $ | 29 | $ | 5,904 | $ | 165 | ||||||||||||||
|
|
|
|
|
|
|
|
|
|
|
|
|
| |||||||||||||||
Total: | ||||||||||||||||||||||||||||
Construction and land development | $ | — | $ | — | $ | — | $ | — | $ | — | $ | — | $ | — | ||||||||||||||
Commercial and industrial | 660 | 875 | 93 | 645 | 5 | 537 | 14 | |||||||||||||||||||||
Municipal | — | — | — | — | — | — | — | |||||||||||||||||||||
Commercial real estate | 2,680 | 2,816 | 95 | 2,542 | 24 | 2,545 | 71 | |||||||||||||||||||||
Residential real estate | 2,675 | 2,675 | 350 | 2,675 | — | 3,136 | 80 | |||||||||||||||||||||
Consumer | — | — | — | — | — | — | — | |||||||||||||||||||||
Home equity | — | — | — | — | — | — | — | |||||||||||||||||||||
|
|
|
|
|
|
|
|
|
|
|
|
|
| |||||||||||||||
Total | $ | 6,015 | $ | 6,366 | $ | 538 | $ | 5,862 | $ | 29 | $ | 6,218 | $ | 165 | ||||||||||||||
|
|
|
|
|
|
|
|
|
|
|
|
|
| |||||||||||||||
| Carrying Value | Unpaid Principal Balance | Required Reserve | Average Carrying Value for 3 Months Ending 9/30/19 | Interest Income Recognized for 3 Months Ending 9/30/19 | Average Carrying Value for 9 Months Ending 9/30/19 | Interest Income Recognized for 9 Months Ending 9/30/19 | ||||||||||||||||||||||
With no required reserve recorded: | (in thousands) | |||||||||||||||||||||||||||
Construction and land development | $ | — | $ | — | $ | — | $ | — | $ | — | $ | — | $ | — | ||||||||||||||
Commercial and industrial | 87 | 306 | — | 89 | 2 | 87 | 6 | |||||||||||||||||||||
Municipal | — | — | — | — | — | — | — | |||||||||||||||||||||
Commercial real estate | 167 | 194 | — | 729 | 0 | 529 | 0 | |||||||||||||||||||||
Residential real estate | — | — | — | — | — | — | — | |||||||||||||||||||||
Consumer | — | — | — | — | — | — | — | |||||||||||||||||||||
Home equity | — | — | — | — | — | — | — | |||||||||||||||||||||
Total | $ | 254 | $ | 500 | $ | — | $ | 818 | $ | 2 | $ | 616 | $ | 6 | ||||||||||||||
With required reserve recorded: | ||||||||||||||||||||||||||||
Construction and land development | $ | — | $ | — | $ | — | $ | — | $ | — | $ | — | $ | — | ||||||||||||||
Commercial and industrial | 116 | 116 | 2 | 310 | 2 | 299 | 6 | |||||||||||||||||||||
Municipal | — | — | — | — | — | — | — | |||||||||||||||||||||
Commercial real estate | 2,206 | 2,326 | 86 | 2,140 | 23 | 2,350 | 67 | |||||||||||||||||||||
Residential real estate | — | — | — | — | — | — | — | |||||||||||||||||||||
Consumer | — | — | — | — | — | — | — | |||||||||||||||||||||
Home equity | — | — | — | — | — | — | — | |||||||||||||||||||||
Total | $ | 2,322 | $ | 2,442 | $ | 88 | $ | 2,450 | $ | 25 | $ | 2,649 | $ | 73 | ||||||||||||||
Total: | ||||||||||||||||||||||||||||
Construction and land development | $ | — | $ | — | $ | — | $ | — | $ | — | $ | — | $ | — | ||||||||||||||
Commercial and industrial | 203 | 422 | 2 | 399 | 4 | 386 | 12 | |||||||||||||||||||||
Municipal | — | — | — | — | — | — | — | |||||||||||||||||||||
Commercial real estate | 2,373 | 2,520 | 86 | 2,869 | 23 | 2,879 | 67 | |||||||||||||||||||||
Residential real estate | — | — | — | — | — | — | — | |||||||||||||||||||||
Consumer | — | — | — | — | — | — | — | |||||||||||||||||||||
Home equity | — | — | — | — | — | — | — | |||||||||||||||||||||
Total | $ | 2,576 | $ | 2,942 | $ | 88 | $ | 3,268 | $ | 27 | $ | 3,265 | $ | 79 | ||||||||||||||
There was one residential real estate loan and one consumer loan that were modified during the first quarter of 2018. The loans were modified by reducing the interest rates as well as extending the terms on both loans. Thepre-modification and post-modification outstanding recorded investment was $2,675,000 for the residential real estate loan that was not accruing interest and had a specific reserve of $350,000. Thepre-modification and post-modification outstanding recorded investment was $17,000 for the consumer loan that was accruing and had a specific reserve of $1,000. The financial impact for the modifications was not material. There was one troubled debt restructuring, for $2,675,000, which subsequently defaulted during the first nine months of 2018. This troubled debt restructuring became other real estate owned during the fourth quarter of 2018 and subsequently sold during the third quarter of 2019.
Page 23 of 48
6.5. Reclassifications Out of Accumulated Other Comprehensive Income(a)
Details about Accumulated Other Comprehensive Income Components | Three Months Ended September 30, 2019 | Three Months Ended September 30, 2018 | Affected Line Item in the Statement where Net Income is Presented | |||||||
| (in thousands) | ||||||||||
Unrealized gains and losses on available-for-sale securities | $ | 54 | $ | 105 | Net gains on sales of investments | |||||
Tax (expense) or benefit | (15 | ) | (29 | ) | Provision for income taxes | |||||
|
|
|
| |||||||
Net of tax | $ | 39 | $ | 76 | Net income | |||||
|
|
|
| |||||||
Accretion of unrealized losses transferred | $ | (209 | ) | $ | (323 | ) | Interest on securities held-to-maturity | |||
Tax (expense) or benefit | 54 | 85 | Provision for income taxes | |||||||
|
|
|
| |||||||
Net of tax | $ | (155 | ) | $ | (238 | ) | Net income | |||
|
|
|
| |||||||
Amortization of defined benefit pension items | ||||||||||
Prior-service costs | $ | (29 | )(b) | $ | (4 | )(b) | Salaries and employee benefits | |||
Actuarial gains (losses) | (337 | )(b) | (402 | )(b) | Salaries and employee benefits | |||||
|
|
|
| |||||||
Total before tax | (366 | ) | (406 | ) | Income before taxes | |||||
|
|
|
| |||||||
Tax (expense) or benefit | 103 | 114 | Provision for income taxes | |||||||
|
|
|
| |||||||
Net of tax | $ | (263 | ) | $ | (292 | ) | Net income | |||
|
|
|
| |||||||
Details about Accumulated Other Comprehensive Income Components | Nine Months Ended September 30, 2019 | Nine Months Ended September 30, 2018 | Affected Line Item in the Statement where Net Income is Presented | |||||||
| (in thousands) | ||||||||||
Unrealized gains and losses on available-for-sale securities | $ | 61 | $ | 302 | Net gains on sales of investments | |||||
Tax (expense) or benefit | (17 | ) | (85 | ) | Provision for income taxes | |||||
|
|
|
| |||||||
Net of tax | $ | 44 | $ | 217 | Net income | |||||
|
|
|
| |||||||
Accretion of unrealized losses transferred | $ | (779 | ) | $ | (1,186 | ) | Interest on securities held-to-maturity | |||
Tax (expense) or benefit | 205 | 314 | Provision for income taxes | |||||||
|
|
|
| |||||||
Net of tax | $ | (574 | ) | $ | (872 | ) | Net income | |||
|
|
|
| |||||||
Amortization of defined benefit pension items | ||||||||||
Prior-service costs | $ | (86 | )(b) | $ | (12 | )(b) | Salaries and employee benefits | |||
Actuarial gains (losses) | (1,013 | )(b) | (1,207 | )(b) | Salaries and employee benefits | |||||
|
|
|
| |||||||
Total before tax | (1,099 | ) | (1,219 | ) | Income before taxes | |||||
|
|
|
| |||||||
Tax (expense) or benefit | 309 | 342 | Provision for income taxes | |||||||
|
|
|
| |||||||
Net of tax | $ | (790 | ) | $ | (877 | ) | Net income | |||
|
|
|
| |||||||
Details about Accumulated Other Comprehensive Income Components | Three Months Ended September 30, 2020 | Three Months Ended September 30, 2019 | Affected Line Item in the Statement where Net Income is Presented | |||||||||||
| (in thousands) | ||||||||||||||
Unrealized gains and losses on available-for-sale | $ | — | $ | 54 | Net gains on sales of investments | |||||||||
— | (15 | ) | Provision for income taxes | |||||||||||
$ | — | $ | 39 | Net income | ||||||||||
Accretion of unrealized losses transferred | $ | (196 | ) | $ | (209 | ) | Interest on securities held-to-maturity | |||||||
51 | 54 | Provision for income taxes | ||||||||||||
$ | (145 | ) | $ | (155 | ) | Net income | ||||||||
Amortization of defined benefit pension items | ||||||||||||||
Prior-service costs | $ | (29 | ) | (b) | $ | (29 | ) | (b) | Salaries and employee benefits | |||||
Actuarial gains (losses) | (472 | ) | (b) | (337 | ) | (b) | Salaries and employee benefits | |||||||
Total before tax | (501 | ) | (366 | ) | Income before taxes | |||||||||
Tax (expense) or benefit | 141 | 103 | Provision for income taxes | |||||||||||
Net of tax | $ | (360 | ) | $ | (263 | ) | Net income | |||||||
Details about Accumulated Other Comprehensive Income Components | Nine Months Ended September 30, 2020 | Nine Months Ended September 30, 2019 | Affected Line Item in the Statement where Net Income is Presented | |||||||||||
| (in thousands) | ||||||||||||||
Unrealized gains and losses on available-for-sale | $ | — | $ | 61 | Net gains on sales of investments | |||||||||
— | (17 | ) | Provision for income taxes | |||||||||||
$ | — | $ | 44 | Net income | ||||||||||
Accretion of unrealized losses transferred | $ | (637 | ) | $ | (779 | ) | Interest on securities held-to-maturity | |||||||
166 | 205 | Provision for income taxes | ||||||||||||
$ | (471 | ) | $ | (574 | ) | Net income | ||||||||
Amortization of defined benefit pension items | ||||||||||||||
Prior-service costs | $ | (86 | ) | (b) | $ | (86 | ) | (b) | Salaries and employee benefits | |||||
Actuarial gains (losses) | (1,417 | ) | (b) | (1,013 | ) | (b) | Salaries and employee benefits | |||||||
Total before tax | (1,503 | ) | (1,099 | ) | Income before taxes | |||||||||
Tax (expense) or benefit | 422 | 309 | Provision for income taxes | |||||||||||
Net of tax | $ | (1,081 | ) | $ | (790 | ) | Net income | |||||||
| (a) | Amount in parentheses indicates reductions to net income. |
| (b) | These accumulated other comprehensive income components are included in the computation of net periodic pension cost (see Employee Benefits footnote (Note |
2019.
| Three Months Ended September 30, | Nine Months Ended September 30, | |||||||||||||||
| (in thousands except share and per share data) | 2019 | 2018 | 2019 | 2018 | ||||||||||||
Basic EPS Computation: | ||||||||||||||||
Numerator: | ||||||||||||||||
Net income, Class A | $ | 7,986 | $ | 7,535 | $ | 22,849 | $ | 20,674 | ||||||||
Net income, Class B | 2,098 | 2,046 | 6,118 | 5,614 | ||||||||||||
Denominator: | ||||||||||||||||
Weighted average shares outstanding, Class A | 3,650,449 | 3,608,329 | 3,627,076 | 3,608,129 | ||||||||||||
Weighted average shares outstanding, Class B | 1,917,460 | 1,959,580 | 1,940,833 | 1,959,780 | ||||||||||||
Basic EPS, Class A | $ | 2.19 | $ | 2.09 | $ | 6.30 | $ | 5.73 | ||||||||
Basic EPS, Class B | 1.09 | 1.04 | 3.15 | 2.86 | ||||||||||||
|
|
|
|
|
|
|
| |||||||||
Diluted EPS Computation: | ||||||||||||||||
Numerator: | ||||||||||||||||
Net income, Class A | $ | 7,986 | $ | 7,535 | $ | 22,849 | $ | 20,674 | ||||||||
Net income, Class B | 2,098 | 2,046 | 6,118 | 5,614 | ||||||||||||
|
|
|
|
|
|
|
| |||||||||
Total net income, for diluted EPS, Class A computation | 10,084 | 9,581 | 28,967 | 26,288 | ||||||||||||
Denominator: | ||||||||||||||||
Weighted average shares outstanding, basic, Class A | 3,650,449 | 3,608,329 | 3,627,076 | 3,608,129 | ||||||||||||
Weighted average shares outstanding, Class B | 1,917,460 | 1,959,580 | 1,940,833 | 1,959,780 | ||||||||||||
|
|
|
|
|
|
|
| |||||||||
Weighted average shares outstanding diluted, Class A | 5,567,909 | 5,567,909 | 5,567,909 | 5,567,909 | ||||||||||||
Weighted average shares outstanding, Class B | 1,917,460 | 1,959,580 | 1,940,833 | 1,959,780 | ||||||||||||
Diluted EPS, Class A | $ | 1.81 | $ | 1.72 | $ | 5.20 | $ | 4.72 | ||||||||
Diluted EPS, Class B | 1.09 | 1.04 | 3.15 | 2.86 | ||||||||||||
|
|
|
|
|
|
|
| |||||||||
| Three Months Ended September 30, | Nine Months Ended September 30, | |||||||||||||||
| (in thousands except share and per share data) | 2020 | 2019 | 2020 | 2019 | ||||||||||||
Basic EPS Computation: | ||||||||||||||||
Numerator: | ||||||||||||||||
Net income, Class A | $ | 8,630 | $ | 7,986 | $ | 24,254 | $ | 22,853 | ||||||||
Net income, Class B | 2,257 | 2,098 | 6,355 | 6,114 | ||||||||||||
Denominator: | ||||||||||||||||
Weighted average shares outstanding, Class A | 3,655,469 | 3,650,449 | 3,653,429 | 3,627,076 | ||||||||||||
Weighted average shares outstanding, Class B | 1,912,440 | 1,917,460 | 1,914,480 | 1,940,833 | ||||||||||||
Basic EPS, Class A | $ | 2.36 | $ | 2.19 | $ | 6.64 | $ | 6.30 | ||||||||
Basic EPS, Class B | 1.18 | 1.09 | 3.32 | 3.15 | ||||||||||||
Diluted EPS Computation: | ||||||||||||||||
Numerator: | ||||||||||||||||
Net income, Class A | $ | 8,630 | $ | 7,986 | $ | 24,254 | $ | 22,853 | ||||||||
Net income, Class B | 2,257 | 2,098 | 6,355 | 6,114 | ||||||||||||
Total net income, for diluted EPS, Class A computation | 10,887 | 10,084 | 30,609 | 28,967 | ||||||||||||
Denominator: | ||||||||||||||||
Weighted average shares outstanding, basic, Class A | 3,655,469 | 3,650,449 | 3,653,429 | 3,627,076 | ||||||||||||
Weighted average shares outstanding, Class B | 1,912,440 | 1,917,460 | 1,914,480 | 1,940,833 | ||||||||||||
Weighted average shares outstanding diluted, Class A | 5,567,909 | 5,567,909 | 5,567,909 | 5,567,909 | ||||||||||||
Weighted average shares outstanding, Class B | 1,912,440 | 1,917,460 | 1,914,480 | 1,940,833 | ||||||||||||
Diluted EPS, Class A | $ | 1.96 | $ | 1.81 | $ | 5.50 | $ | 5.20 | ||||||||
Diluted EPS, Class B | 1.18 | 1.09 | 3.32 | 3.15 | ||||||||||||
8.7. Employee Benefits
| Pension Benefits | Supplemental Insurance/ Retirement Plan | |||||||||||||||
| 2019 | 2018 | 2019 | 2018 | |||||||||||||
| (in thousands) | ||||||||||||||||
Service cost | $ | 276 | $ | 353 | $ | 256 | $ | 277 | ||||||||
Interest | 473 | 371 | 482 | 346 | ||||||||||||
Expected return on plan assets | (819 | ) | (954 | ) | — | — | ||||||||||
Recognized prior service cost (benefit) | — | (25 | ) | 28 | 29 | |||||||||||
Recognized net actuarial losses | 229 | 226 | 109 | 176 | ||||||||||||
|
|
|
|
|
|
|
| |||||||||
Net periodic benefit cost (credit) | $ | 159 | $ | (29 | ) | $ | 875 | $ | 828 | |||||||
|
|
|
|
|
|
|
| |||||||||
| Pension Benefits | Supplemental Insurance/ Retirement Plan | |||||||||||||||
2020 | 2019 | 2020 | 2019 | |||||||||||||
| (in thousands) | ||||||||||||||||
Service cost | $ | 344 | $ | 276 | $ | 353 | $ | 256 | ||||||||
Interest | 450 | 473 | 466 | 482 | ||||||||||||
Expected return on plan assets | (952 | ) | (819 | ) | — | — | ||||||||||
Recognized prior service cost (benefit) | — | — | 29 | 28 | ||||||||||||
Recognized net actuarial losses | 261 | 229 | 211 | 109 | ||||||||||||
Net periodic benefit (credit) cost | $ | 103 | $ | 159 | $ | 1,059 | $ | 875 | ||||||||
| Pension Benefits | Supplemental Insurance/ Retirement Plan | |||||||||||||||
| 2019 | 2018 | 2019 | 2018 | |||||||||||||
| (in thousands) | ||||||||||||||||
Service cost | $ | 828 | $ | 1,059 | $ | 768 | $ | 831 | ||||||||
Interest | 1,419 | 1,111 | 1,445 | 1,040 | ||||||||||||
Expected return on plan assets | (2,457 | ) | (2,863 | ) | — | — | ||||||||||
Recognized prior service cost (benefit) | — | (75 | ) | 86 | 87 | |||||||||||
Recognized net actuarial losses | 687 | 680 | 326 | 527 | ||||||||||||
|
|
|
|
|
|
|
| |||||||||
Net periodic benefit cost (credit) | $ | 477 | $ | (88 | ) | $ | 2,625 | $ | 2,485 | |||||||
|
|
|
|
|
|
|
| |||||||||
| Pension Benefits | Supplemental Insurance/ Retirement Plan | |||||||||||||||
2020 | 2019 | 2020 | 2019 | |||||||||||||
| (in thousands) | ||||||||||||||||
Service cost | $ | 1,032 | $ | 828 | $ | 1,059 | $ | 768 | ||||||||
Interest | 1,350 | 1,419 | 1,398 | 1,445 | ||||||||||||
Expected return on plan assets | (2,856 | ) | (2,457 | ) | — | — | ||||||||||
Recognized prior service cost (benefit) | — | — | 87 | 86 | ||||||||||||
Recognized net actuarial losses | 783 | 687 | 633 | 326 | ||||||||||||
Net periodic benefit (credit) cost | $ | 309 | $ | 477 | $ | 3,177 | $ | 2,625 | ||||||||
9.8. Fair Value Measurements
Page 26credit ratings is performed to assess the appropriateness of 48
Financial Instruments Measured at Fair Value on a Recurring Basis:
| Securities AFS Fair Value Measurements Using | ||||||||||||||||
| Carrying Value | Quoted Prices In Active Markets for Identical Assets (Level 1) | Significant Observable Inputs (Level 2) | Significant Other Unobservable Inputs (Level 3) | |||||||||||||
| (in thousands) | ||||||||||||||||
SBA Backed Securities | $ | 58,664 | $ | — | $ | 58,664 | $ | — | ||||||||
U.S. Government Agency and Sponsored Mortgage-Backed Securities | 170,282 | — | 170,282 | — | ||||||||||||
Privately Issued Residential Mortgage- Backed Securities | 579 | — | 579 | — | ||||||||||||
Obligations Issued by States and Political Subdivisions | 28,576 | — | 4,775 | 23,801 | ||||||||||||
Other Debt Securities | 3,638 | — | 3,638 | — | ||||||||||||
|
|
|
|
|
|
|
| |||||||||
Total | $ | 261,739 | $ | — | $ | 237,938 | $ | 23,801 | ||||||||
|
|
|
|
|
|
|
| |||||||||
Equity Securities | $ | 1,672 | $ | 324 | $ | 1,348 | $ | — | ||||||||
| Financial Instruments Measured at Fair Value on aNon-recurring Basis: | ||||||||||||||||
Impaired Loans | $ | 173 | $ | — | $ | — | $ | 173 | ||||||||
Fair Value Measurements Using | ||||||||||||||||
Carrying Value | Quoted Prices In Active Markets for Identical Assets (Level 1) | Significant Observable Inputs (Level 2) | Significant Other Unobservable Inputs (Level 3) | |||||||||||||
(in thousands) | ||||||||||||||||
Financial Instruments Measured at Fair Value on a Recurring Basis | ||||||||||||||||
Securities AFS | ||||||||||||||||
SBA Backed Securities | $ | 45,865 | $ | — | $ | 45,865 | $ | — | ||||||||
U.S. Government Agency and Sponsored Mortgage-Backed Securities | 189,904 | — | 189,904 | — | ||||||||||||
Privately Issued Residential Mortgage- Backed Securities | 341 | — | 341 | — | ||||||||||||
Obligations Issued by States and Political Subdivisions | 48,815 | — | — | 48,815 | ||||||||||||
Other Debt Securities | 6,707 | — | 6,707 | — | ||||||||||||
Total | $ | 291,632 | $ | — | $ | 242,817 | $ | 48,815 | ||||||||
Equity Securities | $ | 1,645 | $ | 276 | $ | 1,369 | $ | — | ||||||||
Financial Instruments Measured at Fair Value on a Non-recurring Basis | ||||||||||||||||
Impaired Loans | $ | 828 | $ | — | $ | — | $ | 828 | ||||||||
Asset | Fair Value | Valuation Technique | Unobservable Input | Unobservable Input Value or Range | ||||||
Securities AFS (4) | $ | 23,801 | Discounted cash flow | Discount rate | 1.7%-3.1% (3) | |||||
Impaired Loans | $ | 173 | Appraisal of collateral (1) | Appraisal adjustments (2) | 0%-30% discount | |||||
Asset | Fair Value | Valuation Technique | Unobservable Input | Unobservable Input Value or Range | ||||||
Securities AFS | $ | 48,815 | Discounted cash flow | Discount rate | 0%-1% (3) | |||||
Impaired Loans | $ | 828 | Appraisal of collateral (1) | Appraisal adjustments (2) | 0% | |||||
| (1) | Fair value is generally determined through independent appraisals of the underlying collateral, which generally include various Level 3 inputs which are not identifiable. |
| (2) | Appraisals may be adjusted by management for qualitative factors such as economic conditions and estimated expenses. |
| (3) | Weighted averages. |
|
Obligations Issued by States & Political Subdivisions | ||||
Balance at December 31, 2019 | $ | 13,301 | ||
Purchases | 53,903 | |||
Maturities and calls | (18,357 | ) | ||
Amortization | (32 | ) | ||
Balance at September 30, 2020 | $ | 48,815 | ||
| Obligations Issued by States & Political Subdivisions | ||||
| (in thousands) | ||||
Balance at December 31, 2018 | $ | 88,728 | ||
Purchases | 13,290 | |||
Maturities and calls | (78,196 | ) | ||
Amortization | (21 | ) | ||
|
| |||
Balance at September 30, 2019 | $ | 23,801 | ||
|
| |||
| Obligations Issued by States & Political Subdivisions | ||||
Balance at December 31, 2018 | $ | 88,728 | ||
Purchases | 13,290 | |||
Maturities and calls | (78,196 | ) | ||
Amortization | (21 | ) | ||
Changes in fair value | — | |||
Balance at September 30, 2019 | $ | 23,801 | ||
The changes in Level 3 securities for the nine month period ended September 30, 2018, are shown in the table below:
| Auction Rate Securities | Obligations Issued by States & Political Subdivisions | Total | ||||||||||
| (in thousands) | ||||||||||||
Balance at December 31, 2017 | $ | 4,459 | $ | 78,141 | $ | 82,600 | ||||||
Purchases | — | 105,837 | 105,837 | |||||||||
Maturities and calls | — | (72,640 | ) | (72,640 | ) | |||||||
Transfer to Level 2 | (4,459 | ) | — | (4,459 | ) | |||||||
Amortization | — | (104 | ) | (104 | ) | |||||||
Changes in fair value | — | — | — | |||||||||
|
|
|
|
|
| |||||||
Balance at September 30, 2018 | $ | — | $ | 111,234 | $ | 111,234 | ||||||
|
|
|
|
|
| |||||||
| Financial Instruments Measured at Fair Value on a Recurring Basis: | ||||||||||||||||
| Securities AFS Fair Value Measurements Using | ||||||||||||||||
| Carrying Value | Quoted Prices In Active Markets for Identical Assets (Level 1) | Significant Observable Inputs (Level 2) | Significant Other Unobservable Inputs (Level 3) | |||||||||||||
| (in thousands) | ||||||||||||||||
U.S. Treasury | $ | 1,992 | $ | — | $ | 1,992 | $ | — | ||||||||
U.S. Government Sponsored Enterprises | 3,915 | — | 3,915 | — | ||||||||||||
SBA Backed Securities | 70,194 | — | 70,194 | — | ||||||||||||
U.S. Government Agency and Sponsored Mortgage-Backed Securities | 162,890 | — | 162,890 | — | ||||||||||||
Privately Issued Residential Mortgage- Backed Securities | 672 | — | 672 | — | ||||||||||||
Obligations Issued by States and Political Subdivisions | 93,503 | — | 4,775 | 88,728 | ||||||||||||
Other Debt Securities | 3,593 | 3,593 | ||||||||||||||
|
|
|
|
|
|
|
| |||||||||
Total | $ | 336,759 | $ | — | $ | 248,031 | $ | 88,728 | ||||||||
|
|
|
|
|
|
|
| |||||||||
Equity Securities | $ | 1,596 | $ | 293 | $ | 1,303 | $ | — | ||||||||
| Financial Instruments Measured at Fair Value on aNon-recurring Basis: | ||||||||||||||||
Other Real Estate Owned | $ | 2,225 | $ | — | $ | — | $ | 2,225 | ||||||||
Impaired Loans | $ | 251 | $ | — | $ | — | $ | 251 | ||||||||
| Securities AFS Fair Value Measurements Using | ||||||||||||||||
| Carrying Value | Quoted Prices In Active Markets for Identical Assets (Level 1) | Significant Observable Inputs (Level 2) | Significant Other Unobservable Inputs (Level 3) | |||||||||||||
| (in thousands) | ||||||||||||||||
Financial Instruments Measured at Fair Value on a Recurring Basis: | ||||||||||||||||
SBA Backed Securities | $ | 54,211 | $ | — | $ | 54,211 | $ | — | ||||||||
U.S. Government Agency and Sponsored Mortgage-Backed Securities | 184,187 | — | 184,187 | — | ||||||||||||
Privately Issued Residential Mortgage- Backed Securities | 396 | — | 396 | — | ||||||||||||
Obligations Issued by States and Political Subdivisions | 18,076 | — | 4,775 | 13,301 | ||||||||||||
Other Debt Securities | 3,632 | 3,632 | — | |||||||||||||
Total | $ | 260,502 | $ | — | $ | 247,201 | $ | 13,301 | ||||||||
Financial Instruments Measured at Fair Value on a Recurring Basis Equity Securities | $ | 1,688 | $ | 343 | $ | 1,345 | $ | — | ||||||||
Financial Instruments Measured at Fair Value on a Non-recurring Basis Impaired Loans | $ | 877 | $ | — | $ | — | $ | 877 | ||||||||
There was a transfer of an auction rate security during 2018 from level 3 to level 2. Quoted prices on the auction rate security became available but traded infrequently. $79,000.
Page 29 of 48
Asset | Fair Value | Valuation Technique | Unobservable Input | Unobservable Input Value or Range | ||||||
Securities AFS (4) | $ | 88,728 | Discounted cash flow | Discount rate | 2.1%-4.1% (3) | |||||
Other Real Estate Owned | $ | 2,225 | Appraisal of collateral (1) | Appraisal adjustments (2) | 30% discount | |||||
Impaired Loans | $ | 251 | Appraisal of collateral (1) | Appraisal adjustments (2) | 0%-30% discount | |||||
Asset | Fair Value | Valuation Technique | Unobservable Input | Unobservable Input Value or Range | ||||||
Securities AFS | $ | 13,301 | Discounted cash flow | Discount rate | 1.5%-3.2% (3) | |||||
Impaired Loans | $ | 877 | Appraisal of collateral (1) | Appraisal adjustments (2) | 0%-30% discount | |||||
| (1) | Fair value is generally determined through independent appraisals of the underlying collateral, which generally include various Level 3 inputs which are not identifiable. |
| (2) | Appraisals may be adjusted by management for qualitative factors such as economic conditions and estimated expenses. |
| (3) | Weighted averages. |
|
10.9. Fair Values of Financial Instruments
Page 30 of 48
September 30, 2019 | Carrying Amount | Estimated Fair Value | Fair Value Measurements Level 1 Inputs | Level 2 Inputs | Level 3 Inputs | |||||||||||||||
| (in thousands) | ||||||||||||||||||||
Financial assets: | ||||||||||||||||||||
Securitiesheld-to-maturity | $ | 2,164,135 | $ | 2,188,465 | $ | — | $ | 2,188,465 | $ | — | ||||||||||
Loans (1) | 2,346,564 | 2,398,515 | — | — | 2,398,515 | |||||||||||||||
Financial liabilities: | ||||||||||||||||||||
Time deposits | 533,074 | 532,135 | — | 532,135 | — | |||||||||||||||
Other borrowed funds | 209,188 | 209,263 | — | 209,263 | — | |||||||||||||||
Subordinated debentures | 36,083 | 36,083 | — | 36,083 | — | |||||||||||||||
December 31, 2018 | ||||||||||||||||||||
Financial assets: | ||||||||||||||||||||
Securitiesheld-to-maturity | $ | 2,046,647 | $ | 1,991,421 | $ | — | $ | 1,991,421 | $ | — | ||||||||||
Loans (1) | 2,257,035 | 2,279,712 | — | — | 2,279,712 | |||||||||||||||
Financial liabilities: | ||||||||||||||||||||
Time deposits | 560,579 | 559,988 | — | 559,988 | — | |||||||||||||||
Other borrowed funds | 202,378 | 203,122 | — | 203,122 | — | |||||||||||||||
Subordinated debentures | 36,083 | 36,083 | — | 36,083 | — | |||||||||||||||
September 30, 2020 | Carrying Amount | Estimated Fair Value | Fair Value Measurements Level 1 Inputs | Level 2 Inputs | Level 3 Inputs | |||||||||||||||
(in thousands) | ||||||||||||||||||||
Financial assets: | ||||||||||||||||||||
Securities held-to-maturity | $ | 2,407,176 | $ | 2,484,947 | $ | — | $ | 2,484,947 | $ | — | ||||||||||
Loans (1) | 2,956,739 | 2,885,187 | — | — | 2,885,187 | |||||||||||||||
Financial liabilities: | ||||||||||||||||||||
Time deposits | 581,866 | 596,675 | — | 596,675 | — | |||||||||||||||
Other borrowed funds | 152,248 | 159,690 | — | 159,690 | — | |||||||||||||||
Subordinated debentures | 36,083 | 36,083 | — | 36,083 | — | |||||||||||||||
December 31, 2019 | ||||||||||||||||||||
Financial assets: | ||||||||||||||||||||
Securities held-to-maturity | $ | 2,351,120 | $ | 2,361,304 | $ | — | $ | 2,361,304 | $ | — | ||||||||||
Loans (1) | 2,396,534 | 2,424,770 | — | — | 2,424,770 | |||||||||||||||
Financial liabilities: | ||||||||||||||||||||
Time deposits | 555,447 | 560,746 | — | 560,746 | — | |||||||||||||||
Other borrowed funds | 370,955 | 374,531 | — | 374,531 | — | |||||||||||||||
Subordinated debentures | 36,083 | 36,083 | — | 36,083 | — | |||||||||||||||
| (1) | Comprised of loans (including collateral dependent impaired loans), net of deferred loan costs and the allowance for loan losses. |
11.10. Revenue from Contracts with CustomersPage 31 of 48
A. Change in accounting policy
The Company adopted Topic 606Revenue from Contracts with Customers with a date of initial application of January 1, 2018 through the third quarter of 2019 and has applied the guidance to all contracts within the scope of Topic 606 as of that date. As a result, the Company has changed its accounting policy for revenue recognition as detailed in this footnote.
The Company applied Topic 606 using the cumulative effect method. There was no cumulative effect adjustment as of January 1, 2018, and there were no material changes to the financial statements at or for the nine months ended September 30, 2019 and September 30, 2018, respectively, as a result of adopting Topic 606.
B. Practical Expedients
The Company applies the practical expedient inparagraph 606-10-50-14 and does not disclose information about remaining performance obligations that have original expected durations of one year or less.
The Company applies the practical expedient inparagraph 606-10-32-18 and does not adjust the consideration from customers for the effects of a significant financing component if at contract inception the period between when the entity transfers the goods or services and when the customer pays for that good or service will be one year or less.
C. Nature of goods and services
A. | Nature of goods and services |
| a. | Revenue earned at a point in time – Examples of revenue earned at a point in time are ATM transaction fees, wire transfer fees, NSF fees, credit and debit card interchange fees and foreign exchange transaction fees. Revenue is generally derived from transactional information accumulated by our systems and is recognized as revenue immediately as the transactions occur or upon providing the service to complete the customer’s transaction. The Company is the principal in each of these contracts, with the exception of credit and debit card interchange fees, in which case we are acting as the agent and record revenue net of expenses paid to the principal. |
| b. | Revenue earned over time – The Company earns revenue from contracts with customers in a variety of ways in which the revenue is earned over a period of time – generally monthly or quarterly. Examples of this type of revenue are deposit account service fees, lockbox fees, investment management fees, merchant referral services, and safe deposit box fees. Account service charges, management fees and referral fees are recognized on a monthly basis while any transaction based income is recorded as the activity occurs. Revenue is primarily based on the number and type of transactions or assets managed and is generally derived from transactional information accumulated by our systems. Revenue is recorded in the same period as the related transactions occur or services are rendered to the customer. |
Page 32 of 48
B. | Disaggregation of revenue |
D. Disaggregation of revenue
| Nine Months Ended 9/30/2019 | Revenue from Contracts in Scope of Topic 606 | Nine Months Ended 9/30/2018 | Revenue from Contracts in Scope of Topic 606 | |||||||||||||
| (dollars in thousands) | ||||||||||||||||
Net interest income | $ | 70,458 | $ | — | $ | 68,871 | $ | — | ||||||||
|
|
|
|
|
|
|
| |||||||||
Noninterest income: | ||||||||||||||||
Service charges on deposit accounts | 6,801 | 6,801 | 6,268 | 6,268 | ||||||||||||
Lockbox fees | 3,018 | 3,018 | 2,304 | 2,304 | ||||||||||||
Net gains on sales of securities | 61 | — | 302 | — | ||||||||||||
Gains on sales of mortgage loans | 154 | — | — | — | ||||||||||||
Other income | 3,676 | 2,338 | 3,210 | 2,215 | ||||||||||||
|
|
|
|
|
|
|
| |||||||||
Total noninterest income | 13,710 | 12,157 | 12,084 | 10,787 | ||||||||||||
|
|
|
|
|
|
|
| |||||||||
Total revenues | $ | 84,168 | $ | 12,157 | $ | 80,955 | $ | 10,787 | ||||||||
|
|
|
|
|
|
|
| |||||||||
| Three Months Ended 9/30/2019 | Revenue from Contracts in Scope of Topic 606 | Three Months Ended 9/30/2018 | Revenue from Contracts in Scope of Topic 606 | |||||||||||||
| (dollars in thousands) | ||||||||||||||||
Net interest income | $ | 23,770 | $ | — | $ | 23,204 | $ | — | ||||||||
|
|
|
|
|
|
|
| |||||||||
Noninterest income: | ||||||||||||||||
Service charges on deposit accounts | 2,310 | 2,310 | 2,137 | 2,137 | ||||||||||||
Lockbox fees | 937 | 937 | 892 | 892 | ||||||||||||
Net gains on sales of securities | 53 | — | 105 | — | ||||||||||||
Gains on sales of mortgage loans | — | — | — | — | ||||||||||||
Other income | 986 | 728 | 1,035 | 751 | ||||||||||||
|
|
|
|
|
|
|
| |||||||||
Total noninterest income | 4,286 | 3,975 | 4,169 | 3,780 | ||||||||||||
|
|
|
|
|
|
|
| |||||||||
Total revenues | $ | 28,056 | $ | 3,975 | $ | 27,373 | $ | 3,780 | ||||||||
|
|
|
|
|
|
|
| |||||||||
Nine Months Ended 9/30/2020 | Revenue from Contracts in Scope of Topic 606 | Nine Months Ended 9/30/2019 | Revenue from Contracts in Scope of Topic 606 | |||||||||||||
| (dollars in thousands) | ||||||||||||||||
Total net interest income | $ | 78,350 | $ | — | $ | 70,458 | $ | — | ||||||||
Noninterest income: | ||||||||||||||||
Service charges on deposit accounts | 6,558 | 6,558 | 6,801 | 6,801 | ||||||||||||
Lockbox fees | 2,850 | 2,850 | 3,018 | 3,018 | ||||||||||||
Net gains on sales of securities | — | — | 61 | — | ||||||||||||
Gains on sales of mortgage loans | — | — | 154 | — | ||||||||||||
Other income | 3,112 | 1,738 | 3,676 | 2,338 | ||||||||||||
Total noninterest income | 12,520 | 11,146 | 13,710 | 12,157 | ||||||||||||
Total revenues | $ | 90,870 | $ | 11,146 | $ | 84,168 | $ | 12,157 | ||||||||
Three Months Ended 9/30/2020 | Revenue from Contracts in Scope of Topic 606 | Three Months Ended 9/30/2019 | Revenue from Contracts in Scope of Topic 606 | |||||||||||||
| (dollars in thousands) | ||||||||||||||||
Total interest income | $ | 27,331 | $ | — | $ | 23,770 | $ | — | ||||||||
Noninterest income: | ||||||||||||||||
Service charges on deposit accounts | 2,239 | 2,239 | 2,310 | 2,310 | ||||||||||||
Lockbox fees | 996 | 996 | 937 | 937 | ||||||||||||
Net gains on sales of securities | — | — | 53 | — | ||||||||||||
Gains on sales of mortgage loans | — | — | 0 | — | ||||||||||||
Other income | 934 | 580 | 986 | 728 | ||||||||||||
Total noninterest income | 4,169 | 3,815 | 4,286 | 3,975 | ||||||||||||
Total revenues | $ | 31,500 | $ | 3,815 | $ | 28,056 | $ | 3,975 | ||||||||
| September 30, 2019 | December 31, 2018 | |||||||
| (dollars in thousands) | ||||||||
Receivables, which are included in “Other assets” | $ | 1,142 | $ | 1,205 | ||||
September 30, 2020 | December 31, 2019 | |||||||
| (dollars in thousands) | ||||||||
Receivables, which are included in “Other assets” | $ | 1,362 | $ | 1,200 | ||||
Page 33 of 48
| Three Months Ended 9/30/2019 | Nine Months Ended 9/30/2019 | |||||||
| (in thousands) | ||||||||
Operating lease cost | $ | 550 | $ | 1,676 | ||||
Variable lease cost | 121 | 405 | ||||||
|
|
|
| |||||
Total lease cost | $ | 671 | $ | 2,081 | ||||
|
|
|
| |||||
Three Months Ended 9/30/2020 | Nine Months Ended 9/30/2020 | Three Months Ended 9/30/2019 | Nine Months Ended 9/30/2019 | |||||||||||||
| (in thousands) | ||||||||||||||||
Operating lease cost | $ | 546 | $ | 1,638 | $ | 550 | $ | 1,676 | ||||||||
Variable lease cost | 135 | 441 | 121 | 405 | ||||||||||||
Total lease cost | $ | 681 | $ | 2,079 | $ | 671 | $ | 2,081 | ||||||||
| Three Months Ended 9/30/2019 | Nine Months Ended 9/30/2019 | |||||||
| (in thousands) | ||||||||
Cash paid for amounts included in the measurement of lease liabilities: | ||||||||
Operating cash flows from operating leases | $ | 528 | $ | 1,605 | ||||
|
|
|
| |||||
Right-of-use assets obtained in exchange for lease obligations: | ||||||||
Operating leases | $ | 433 | $ | 1,318 | ||||
|
|
|
| |||||
Three Months Ended 9/30/2020 | Nine Months Ended 9/30/2020 | Three Months Ended 9/30/2019 | Nine Months Ended 9/30/2019 | |||||||||||||
| (in thousands) | ||||||||||||||||
Cash paid for amounts included in the measurement of lease liabilities: | ||||||||||||||||
Operating cash flows from operating leases | $ | 529 | $ | 1,586 | $ | 528 | $ | 1,605 | ||||||||
Right-of-use | ||||||||||||||||
Operating leases | $ | 431 | $ | 1,306 | $ | 433 | $ | 1,318 | ||||||||
| 9/30/2019 | ||||
| (in thousands, except lease term and discount rate) | ||||
Operating Leases: | ||||
Operating leaseright-of-use assets | $ | 12,944 | ||
Operating lease liabilities | $ | 13,101 | ||
Weighted Average Remaining Lease Term: | ||||
Operating Leases | | 11 Years | | |
Weighted Average Discount Rate: | ||||
Operating Leases | 3.5 | % | ||
9/30/2020 | 12/31/2019 | |||||||
| (in thousands, except lease term and discount rate) | ||||||||
Operating Leases: | ||||||||
Operating lease right-of-use | $ | 14,124 | $ | 12,521 | ||||
Operating lease liabilities | $ | 14,332 | $ | 12,690 | ||||
Weighted Average Remaining Lease Term: | ||||||||
Operating Leases | 11 Years | 11 Years | ||||||
Weighted Average Discount Rate: | ||||||||
Operating Leases | 3.1% | 3.5% | ||||||
| Minimum Rental Payments | ||||||||
| September 30, 2019 | December 31, 2018 | |||||||
| (in thousands) | ||||||||
Year Ending December 31, 2019 | $ | 459 | $ | 2,490 | ||||
2020 | 2,038 | 2,170 | ||||||
2021 | 1,759 | 1,694 | ||||||
2022 | 1,603 | 1,331 | ||||||
2023 | 1,541 | 1,104 | ||||||
Thereafter | 8,570 | 1,074 | ||||||
|
|
|
| |||||
Total lease payments | $ | 15,970 | $ | 9,863 | ||||
|
|
|
| |||||
Less imputed interest | (2,869 | ) | ||||||
|
| |||||||
Present value of lease liability | $ | 13,101 | ||||||
|
| |||||||
Page 34
| Minimum Rental Payments | ||||||||
September 30, 2020 | December 31, 2019 | |||||||
| (in thousands) | ||||||||
Year Ending December 31, 2020 | $ | 397 | $ | 2,030 | ||||
2021 | 2,127 | 1,754 | ||||||
2022 | 1,975 | 1,603 | ||||||
2023 | 1,920 | 1,545 | ||||||
2024 | 1,666 | 1,277 | ||||||
Thereafter | 8,565 | 7,312 | ||||||
Total lease payments | $ | 16,650 | $ | 15,521 | ||||
Less imputed interest | (2,318 | ) | (2,831 | ) | ||||
Present value of lease liability | $ | 14,332 | $ | 12,690 | ||||
The Company offers a wide range of services to commercial enterprises, state and local governments and agencies,consumer loans,consumerloans, and accepts savings, time, and demand deposits. In addition, the Company offers its corporate and institutional customers
| Three Months Ended September 30, | ||||||||
| 2019 | 2018 | |||||||
Basic EPS – Class A common | $ | 2.19 | $ | 2.09 | ||||
Basic EPS – Class B common | $ | 1.09 | $ | 1.04 | ||||
Diluted EPS – Class A common | $ | 1.81 | $ | 1.72 | ||||
Diluted EPS – Class B common | $ | 1.09 | $ | 1.04 | ||||
| Nine Months Ended September 30 | ||||||||
| 2019 | 2018 | |||||||
Basic EPS – Class A common | $ | 6.30 | $ | 5.73 | ||||
Basic EPS – Class B common | $ | 3.15 | $ | 2.86 | ||||
Diluted EPS – Class A common | $ | 5.20 | $ | 4.72 | ||||
Diluted EPS – Class B common | $ | 3.15 | $ | 2.86 | ||||
| Three Months Ended September 30, | ||||||||
2020 | 2019 | |||||||
Basic EPS – Class A common | $ | 2.36 | $ | 2.19 | ||||
Basic EPS – Class B common | $ | 1.18 | $ | 1.09 | ||||
Diluted EPS – Class A common | $ | 1.96 | $ | 1.81 | ||||
Diluted EPS – Class B common | $ | 1.18 | $ | 1.09 | ||||
| Nine Months Ended September 30, | ||||||||
2020 | 2019 | |||||||
Basic EPS – Class A common | $ | 6.64 | $ | 6.30 | ||||
Basic EPS – Class B common | $ | 3.32 | $ | 3.15 | ||||
Diluted EPS – Class A common | $ | 5.50 | $ | 5.20 | ||||
Diluted EPS – Class B common | $ | 3.32 | $ | 3.15 | ||||
across the yield curve.
Page 35 of 48
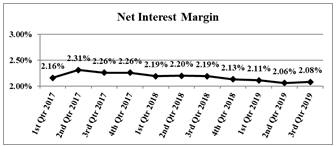
below

2019.
during 2020.
On April 24, 2020, an additional allocation of $310 billion was signed into law. These loans are funded by participating banks and are 100% guaranteed by the U.S. Small Business Administration (SBA). If utilized primarily for payroll, subject to certain other conditions, the loans may be forgiven, in whole or in part, and repaid by the SBA. As of September 30, 2020, Century Bank’s PPP loans totaled approximately 1,324 loans for approximately $232 million. The fees collected, from the SBA, amount to approximately $8.0 million. The fees are being amortized over the lives of the loans utilizing the level-yield method.
Page 36 of 48
proprietary trading, investing in third party hedge or private equity funds or sponsoring new funds unless it qualifies for an exemption from the rule. The Company has little involvement in prohibited proprietary trading or investment activities in covered funds and the Company does not expect that complying with the requirements of the Rule will have any material effect on the Company’s financial condition or results of operation. The federal banking agencies have issued notices of proposed rulemaking to make certain amendments to the Rule to simplyprovide greater clarity and tailorcertainty about what activities are prohibited and to improve the effective allocation of compliance requirementsresources, and to conform the Rule to the EGRRCPA (discussed below).
Federal banking regulators have issued risk-based capital guidelines, Effective October 1, 2020, further amendments to the Rule took effect, which assign risk factors to asset categoriesmodifies existing exemptions from the definition of covered fund, add new exclusions from the definition of covered fund andoff-balance-sheet items. Also, the Basel Committee has issued capital standards entitled “Basel III: A global regulatory framework for more resilient banks provide relief in other areas.
Jobs Act
Page 37 We will closely monitor the concentrations to determine the impact of 48
2020.
| Commercial and Industrial | Municipal | Commercial Real Estate | Total | |||||||||||||
| (in thousands) | ||||||||||||||||
Credit Rating: | ||||||||||||||||
Aaa – Aa3 | $ | 497,124 | $ | 54,495 | $ | 40,759 | $ | 592,378 | ||||||||
A1 – A3 | 187,970 | 7,479 | 148,735 | 344,184 | ||||||||||||
Baa1 – Baa3 | — | 51,133 | 122,288 | 173,421 | ||||||||||||
Ba2 | — | 5,895 | — | 5,895 | ||||||||||||
|
|
|
|
|
|
|
| |||||||||
Total | $ | 685,094 | $ | 119,002 | $ | 311,782 | $ | 1,115,878 | ||||||||
|
|
|
|
|
|
|
| |||||||||
Commercial and Industrial | Municipal | Commercial Real Estate | Total | |||||||||||||
Credit Rating: | (in thousands) | |||||||||||||||
Aaa – Aa3 | $ | 647,056 | $ | 64,806 | $ | 38,365 | $ | 750,227 | ||||||||
A1 – A3 | 184,409 | 7,228 | 145,467 | 337,104 | ||||||||||||
Baa1 – Baa3 | 50,000 | 51,133 | 140,486 | 241,619 | ||||||||||||
Ba2 | — | 5,080 | — | 5,080 | ||||||||||||
Total | $ | 881,465 | $ | 128,247 | $ | 324,318 | $ | 1,334,030 | ||||||||
| Commercial and Industrial | Municipal | Commercial Real Estate | Total | |||||||||||||
| (in thousands) | ||||||||||||||||
Credit Rating: | ||||||||||||||||
Aaa – Aa3 | $ | 491,247 | $ | 54,105 | $ | 42,790 | $ | 588,142 | ||||||||
A1 – A3 | 172,472 | 7,605 | 151,381 | 331,458 | ||||||||||||
Baa1 – Baa3 | — | 26,970 | 118,197 | 145,167 | ||||||||||||
Ba2 | — | 6,810 | — | 6,810 | ||||||||||||
|
|
|
|
|
|
|
| |||||||||
Total | $ | 663,719 | $ | 95,490 | $ | 312,368 | $ | 1,071,577 | ||||||||
|
|
|
|
|
|
|
| |||||||||
2019.
| Commercial and Industrial | Municipal | Commercial Real Estate | Total | |||||||||||||
Credit Rating: | (in thousands) | |||||||||||||||
Aaa – Aa3 | $ | 523,644 | $ | 53,273 | $ | 40,437 | $ | 617,354 | ||||||||
A1 – A3 | 186,044 | 7,354 | 148,346 | 341,744 | ||||||||||||
Baa1 – Baa3 | — | 51,133 | 144,711 | 195,844 | ||||||||||||
Ba2 | — | 5,895 | — | 5,895 | ||||||||||||
Total | $ | 709,688 | $ | 117,655 | $ | 333,494 | $ | 1,160,837 | ||||||||
Page 38 of 48
| Three months ended September 30, | Nine months ended September 30, | |||||||||||||||
| 2019 | 2018 | 2019 | 2018 | |||||||||||||
| (in thousands) | ||||||||||||||||
Allowance for loan losses, beginning of period | $ | 29,070 | $ | 27,144 | $ | 28,543 | $ | 26,255 | ||||||||
Loans charged off | (118 | ) | (89 | ) | (336 | ) | (247 | ) | ||||||||
|
|
|
|
|
|
|
| |||||||||
Recoveries on loans previouslycharged-off | 70 | 1,490 | 190 | 1,637 | ||||||||||||
Net (charge-offs) recoveries | (48 | ) | 1,401 | (146 | ) | 1,390 | ||||||||||
Provision charged to expense | 75 | — | 700 | 900 | ||||||||||||
|
|
|
|
|
|
|
| |||||||||
Allowance for loan losses, end of period | $ | 29,097 | $ | 28,545 | $ | 29,097 | $ | 28,545 | ||||||||
|
|
|
|
|
|
|
| |||||||||
| Three months ended | Nine months ended | |||||||||||||||
2020 | 2019 | 2020 | 2019 | |||||||||||||
| (in thousands) | ||||||||||||||||
Allowance for loan losses, beginning of period | $ | 32,516 | $ | 29,070 | $ | 29,585 | $ | 28,543 | ||||||||
Loans charged off | (41 | ) | (118 | ) | (120 | ) | (336 | ) | ||||||||
Recoveries on loans previously charged-off | 19 | 70 | 254 | 190 | ||||||||||||
Net recoveries (charge-offs) | (22 | ) | (48 | ) | 134 | (146 | ) | |||||||||
Provision charged to expense | 900 | 75 | 3,675 | 700 | ||||||||||||
Allowance for loan losses, end of period | $ | 33,394 | $ | 29,097 | $ | 33,394 | $ | 29,097 | ||||||||
| September 30, 2019 | December 31, 2018 | |||||||
| (dollars in thousands) | ||||||||
Nonaccruing loans | $ | 1,066 | $ | 1,313 | ||||
Total nonperforming assets | $ | 1,066 | $ | 3,538 | ||||
Loans past due 90 days or more and still accruing | $ | — | $ | — | ||||
Nonaccruing loans as a percentage of total loans | 0.04 | % | 0.06 | % | ||||
Nonperforming assets as a percentage of total assets | 0.02 | % | 0.07 | % | ||||
Accruing troubled debt restructures | $ | 2,404 | $ | 2,559 | ||||
The decrease in nonperforming assets was primarily the result
September 30, 2020 | December 31, 2019 | |||||||
| (dollars in thousands) | ||||||||
Nonaccruing loans | $ | 1,419 | $ | 2,014 | ||||
Total nonperforming assets | $ | 1,419 | $ | 2,014 | ||||
Loans past due 90 days or more and still accruing | $ | 49 | $ | — | ||||
Nonaccruing loans as a percentage of total loans | 0.05 | % | 0.08 | % | ||||
Nonperforming assets as a percentage of total assets | 0.02 | % | 0.04 | % | ||||
Accruing troubled debt restructures | $ | 2,240 | $ | 2,361 | ||||
Page 39 of 48
The following table sets forth the fair value of securities
| September 30, 2019 | December 31, 2018 | |||||||
| (in thousands) | ||||||||
U.S. Treasury | $ | — | $ | 1,992 | ||||
U.S. Government Sponsored Enterprises | — | 3,915 | ||||||
Small Business Administration | 58,664 | 70,194 | ||||||
U.S Government Agency and Sponsored Enterprise Mortgage-backed Securities | 170,282 | 162,890 | ||||||
Privately Issued Residential Mortgage-backed Securities | 579 | 672 | ||||||
Obligations issued by States and Political Subdivisions | 28,576 | 93,503 | ||||||
Other Debt Securities | 3,638 | 3,593 | ||||||
|
|
|
| |||||
Total SecuritiesAvailable–for-Sale | $ | 261,739 | $ | 336,759 | ||||
|
|
|
| |||||
The Company realized gross gains of $13,000 from the proceeds of $16,285,000 from the
September 30, | December 31, | |||||||
2020 | 2019 | |||||||
| (in thousands) | ||||||||
Small Business Administration | $ | 45,865 | $ | 54,211 | ||||
U.S Government Agency and Sponsored Enterprise Mortgage-backed Securities | 189,904 | 184,187 | ||||||
Privately Issued Residential Mortgage-backed Securities | 341 | 396 | ||||||
Obligations issued by States and Political Subdivisions | 48,815 | 18,076 | ||||||
Other Debt Securities | 6,707 | 3,632 | ||||||
Total Securities Available–for-Sale | $ | 291,632 | $ | 260,502 | ||||
SecuritiesHeld-to-Maturity (at Amortized Cost)
The securitiesheld-to-maturity portfolio totaled $2,164,135,000 on September 30, 2019, an increase of 5.7% from December 31, 2018. Purchases of securitiesheld-to-maturity totaled $427,124,000 for the nine months ended September 30, 2019.2020. The purchases were offset somewhat, by calls, maturities and scheduled principal payments of $313,358,000.$596,043,000. The portfolio is concentrated in United States Government Sponsored Enterprises and Mortgage-backed Securities and had an estimated weighted average remaining life of 3.6 years. Unrealized losses decreased during the year primarily as a result
50
| September 30, 2019 | December 31, 2018 | |||||||
| (in thousands) | ||||||||
U.S. Treasury | $ | — | $ | 9,960 | ||||
U.S. Government Sponsored Enterprises | 121,516 | 234,228 | ||||||
SBA Backed Securities | 47,126 | 52,051 | ||||||
U.S. Government Agency and Sponsored Enterprise Mortgage-backed Securities | 1,995,493 | 1,750,408 | ||||||
|
|
|
| |||||
Total SecuritiesHeld-to-Maturity | $ | 2,164,135 | $ | 2,046,647 | ||||
|
|
|
| |||||
The Company realized gross gains of $48,000 from the proceeds of $1,199,000 from the sales of securitiesheld-to-maturity for the nine months ended September 30, 2019.
September 30, 2020 | December 31, 2019 | |||||||
| (in thousands) | ||||||||
U.S. Government Sponsored Enterprises | $ | 248,211 | $ | 98,867 | ||||
SBA Backed Securities | 39,384 | 44,379 | ||||||
U.S. Government Agency and Sponsored Enterprise Mortgage-backed Securities | 2,119,581 | 2,207,874 | ||||||
Total Securities Held-to-Maturity | $ | 2,407,176 | $ | 2,351,120 | ||||
2020.
2019.
Page 40 of 48
that would require further consideration of potential impairment.
fair values.
Borrowed funds totaled $516,423,000 at September 30, 2019 compared to $356,618,000 at December 31, 2018. Borrowed funds increased mainly as a result of an increase in repurchase agreements.deposits. Repurchase agreements increaseddecreased primarily as a result of short-term customer activity.
2019.
| Three Months Ended | ||||||||||||||||||||||||
| September 30, 2019 | September 30, 2018 | |||||||||||||||||||||||
| Average Balance | Interest Income/ Expenses (1) | Rate Earned/ Paid (1) | Average Balance | Interest Income/ Expenses (1) | Rate Earned/ Paid (1) | |||||||||||||||||||
| (dollars in thousands) | ||||||||||||||||||||||||
ASSETS | ||||||||||||||||||||||||
Interest-earning assets: | ||||||||||||||||||||||||
Loans (2) | ||||||||||||||||||||||||
Loans taxable | $ | 1,217,324 | $ | 13,665 | 4.45 | % | $ | 1,111,193 | $ | 11,974 | 4.28 | % | ||||||||||||
Loanstax-exempt | 1,145,136 | 10,704 | 3.71 | % | 1,128,742 | 10,375 | 3.65 | % | ||||||||||||||||
Securitiesavailable-for-sale (5): | ||||||||||||||||||||||||
Taxable | 261,312 | 1,969 | 3.01 | % | 296,315 | 1,970 | 2.66 | % | ||||||||||||||||
Tax-exempt | 32,978 | 262 | 3.18 | % | 113,623 | 647 | 2.28 | % | ||||||||||||||||
Securitiesheld-to-maturity: | ||||||||||||||||||||||||
Taxable | 2,141,931 | 14,623 | 2.73 | % | 1,858,695 | 11,507 | 2.48 | % | ||||||||||||||||
Interest-bearing deposits in other banks | 173,150 | 928 | 2.14 | % | 117,312 | 591 | 2.02 | % | ||||||||||||||||
|
|
|
|
|
|
|
|
|
|
|
| |||||||||||||
Total interest-earning assets | 4,971,831 | 42,151 | 3.38 | % | 4,625,880 | 37,064 | 3.19 | % | ||||||||||||||||
Non interest-earning assets | 248,663 | 227,410 | ||||||||||||||||||||||
Allowance for loan losses | (29,079 | ) | (28,204 | ) | ||||||||||||||||||||
|
|
|
| |||||||||||||||||||||
Total assets | $ | 5,191,415 | $ | 4,825,086 | ||||||||||||||||||||
|
|
|
| |||||||||||||||||||||
LIABILITIES AND STOCKHOLDERS’ EQUITY | ||||||||||||||||||||||||
Interest-bearing deposits: | ||||||||||||||||||||||||
NOW accounts | $ | 917,133 | $ | 2,366 | 1.02 | % | $ | 910,975 | $ | 1,741 | 0.76 | % | ||||||||||||
Savings accounts | 868,891 | 3,079 | 1.41 | % | 562,133 | 1,231 | 0.87 | % | ||||||||||||||||
Money market accounts | 1,207,387 | 5,050 | 1.66 | % | 1,231,693 | 3,652 | 1.18 | % | ||||||||||||||||
Time deposits | 517,184 | 3,038 | 2.33 | % | 561,249 | 2,571 | 1.82 | % | ||||||||||||||||
|
|
|
|
|
|
|
|
|
|
|
| |||||||||||||
Total interest-bearing deposits | 3,510,595 | 13,533 | 1.53 | % | 3,266,050 | 9,195 | 1.12 | % | ||||||||||||||||
Securities sold under agreements to repurchase | 252,270 | 697 | 1.10 | % | 151,605 | 288 | 0.75 | % | ||||||||||||||||
Other borrowed funds and subordinated debentures | 250,648 | 1,852 | 2.93 | % | 318,829 | 2,078 | 2.59 | % | ||||||||||||||||
|
|
|
|
|
|
|
|
|
|
|
| |||||||||||||
Total interest-bearing liabilities | 4,013,513 | 16,082 | 1.59 | % | 3,736,484 | 11,561 | 1.23 | % | ||||||||||||||||
|
|
|
|
|
|
|
| |||||||||||||||||
Non-interest-bearing liabilities | ||||||||||||||||||||||||
Demand deposits | 775,080 | 736,622 | ||||||||||||||||||||||
Other liabilities | 79,104 | 69,724 | ||||||||||||||||||||||
|
|
|
| |||||||||||||||||||||
Total liabilities | 4,867,697 | 4,542,830 | ||||||||||||||||||||||
|
|
|
| |||||||||||||||||||||
Stockholders’ equity | 323,718 | 282,256 | ||||||||||||||||||||||
Total liabilities & stockholders’ equity | $ | 5,191,415 | $ | 4,825,086 | ||||||||||||||||||||
|
|
|
| |||||||||||||||||||||
Net interest income on a fully taxable equivalent basis | 26,069 | 25,503 | ||||||||||||||||||||||
Less taxable equivalent adjustment | (2,299 | ) | (2,299 | ) | ||||||||||||||||||||
|
|
|
| |||||||||||||||||||||
Net interest income | $ | 23,770 | $ | 23,204 | ||||||||||||||||||||
|
|
|
|
|
|
|
| |||||||||||||||||
Net interest spread (3) | 1.79 | % | 1.96 | % | ||||||||||||||||||||
|
|
|
| |||||||||||||||||||||
Net interest margin (4) | 2.08 | % | 2.19 | % | ||||||||||||||||||||
|
|
|
| |||||||||||||||||||||
| Three Months Ended | ||||||||||||||||||||||||
September 30, 2020 | September 30, 2019 | |||||||||||||||||||||||
Average Balance | Interest Income/ Expenses (1) | Rate Earned/ Paid (1) | Average Balance | Interest Income/ Expenses (1) | Rate Earned/ Paid (1) | |||||||||||||||||||
ASSETS | (dollars in thousands) | |||||||||||||||||||||||
Interest-earning assets: | ||||||||||||||||||||||||
Loans (2) | ||||||||||||||||||||||||
Loans taxable | $ | 1,681,573 | $ | 15,074 | 3.57 | % | $ | 1,217,324 | $ | 13,665 | 4.45 | % | ||||||||||||
Loans tax-exempt | 1,240,668 | 7,997 | 2.56 | % | 1,145,136 | 10,704 | 3.71 | % | ||||||||||||||||
Securities available-for-sale | ||||||||||||||||||||||||
Taxable | 272,475 | 722 | 1.06 | % | 261,312 | 1,969 | 3.01 | % | ||||||||||||||||
Tax-exempt | 43,000 | 110 | 1.02 | % | 32,978 | 262 | 3.18 | % | ||||||||||||||||
Securities held-to-maturity: | ||||||||||||||||||||||||
Taxable | 2,368,987 | 14,186 | 2.40 | % | 2,141,931 | 14,623 | 2.73 | % | ||||||||||||||||
Interest-bearing deposits in other banks | 275,157 | 69 | 0.10 | % | 173,150 | 928 | 2.14 | % | ||||||||||||||||
Total interest-earning assets | 5,881,860 | 38,158 | 2.59 | % | 4,971,831 | 42,151 | 3.38 | % | ||||||||||||||||
Non interest-earning assets | 306,887 | 248,663 | ||||||||||||||||||||||
Allowance for loan losses | (32,819 | ) | (29,079 | ) | ||||||||||||||||||||
Total assets | $ | 6,155,928 | $ | 5,191,415 | ||||||||||||||||||||
LIABILITIES AND STOCKHOLDERS’ EQUITY | ||||||||||||||||||||||||
Interest-bearing deposits: | ||||||||||||||||||||||||
NOW accounts | $ | 1,170,430 | $ | 1,060 | 0.36 | % | $ | 917,133 | $ | 2,366 | 1.02 | % | ||||||||||||
Savings accounts | 794,806 | 666 | 0.33 | % | 868,891 | 3,079 | 1.41 | % | ||||||||||||||||
Money market accounts | 1,747,629 | 3,056 | 0.70 | % | 1,207,387 | 5,050 | 1.66 | % | ||||||||||||||||
Time deposits | 595,453 | 2,858 | 1.91 | % | 517,184 | 3,038 | 2.33 | % | ||||||||||||||||
Total interest-bearing deposits | 4,308,318 | 7,640 | 0.71 | % | 3,510,595 | 13,533 | 1.53 | % | ||||||||||||||||
Securities sold under agreements to repurchase | 209,477 | 241 | 0.46 | % | 252,270 | 697 | 1.10 | % | ||||||||||||||||
Other borrowed funds and subordinated debentures | 207,467 | 1,292 | 2.48 | % | 250,648 | 1,852 | 2.93 | % | ||||||||||||||||
Total interest-bearing liabilities | 4,725,262 | 9,173 | 0.77 | % | 4,013,513 | 16,082 | 1.59 | % | ||||||||||||||||
Non-interest-bearing liabilities | ||||||||||||||||||||||||
Demand deposits | 983,990 | 775,080 | ||||||||||||||||||||||
Other liabilities | 88,896 | 79,104 | ||||||||||||||||||||||
Total liabilities | 5,798,148 | 4,867,697 | ||||||||||||||||||||||
Stockholders’ equity | 357,780 | 323,718 | ||||||||||||||||||||||
Total liabilities & stockholders’ equity | $ | 6,155,928 | $ | 5,191,415 | ||||||||||||||||||||
Net interest income on a fully taxable equivalent basis | 28,985 | 26,069 | ||||||||||||||||||||||
Less taxable equivalent adjustment | (1,654 | ) | (2,299 | ) | ||||||||||||||||||||
Net interest income | $ | 27,331 | $ | 23,770 | ||||||||||||||||||||
Net interest spread (3) | 1.82 | % | 1.79 | % | ||||||||||||||||||||
Net interest margin (4) | 1.96 | % | 2.08 | % | ||||||||||||||||||||
| (1) | On a fully taxable equivalent basis calculated using a federal tax rate of 21%. Rates are annualized. |
| (2) | Nonaccrual loans are included in average amounts outstanding. |
| (3) | Interest rate spread represents the difference between the weighted average yield on interest-earning assets and the weighted average cost of interest-bearing liabilities. |
| (4) | Net interest margin represents net interest income as a percentage of average interest-earning assets. |
| (5) | Average balances of securities available-for-sale |
| Nine Months Ended | ||||||||||||||||||||||||
| September 30, 2019 | September 30, 2018 | |||||||||||||||||||||||
| Average Balance | Interest Income/ Expenses (1) | Rate Earned/ Paid (1) | Average Balance | Interest Income/ Expenses (1) | Rate Earned/ Paid (1) | |||||||||||||||||||
| (dollars in thousands) | ||||||||||||||||||||||||
ASSETS | ||||||||||||||||||||||||
Interest-earning assets: | ||||||||||||||||||||||||
Loans (2) | ||||||||||||||||||||||||
Loans taxable | $ | 1,200,512 | $ | 40,114 | 4.47 | % | $ | 1,076,781 | $ | 33,902 | 4.21 | % | ||||||||||||
Loanstax-exempt | 1,124,624 | 31,658 | 3.76 | % | 1,129,413 | 30,018 | 3.55 | % | ||||||||||||||||
Securitiesavailable-for-sale (5): | ||||||||||||||||||||||||
Taxable | 271,637 | 6,338 | 3.11 | % | 317,753 | 5,719 | 2.40 | % | ||||||||||||||||
Tax-exempt | 53,399 | 1,176 | 2.94 | % | 88,269 | 1,342 | 2.03 | % | ||||||||||||||||
Securitiesheld-to-maturity: | ||||||||||||||||||||||||
Taxable | 2,128,082 | 43,006 | 2.69 | % | 1,816,745 | 32,930 | 2.42 | % | ||||||||||||||||
Interest-bearing deposits in other banks | 184,035 | 3,204 | 2.32 | % | 171,773 | 2,239 | 1.74 | % | ||||||||||||||||
|
|
|
|
|
|
|
|
|
|
|
| |||||||||||||
Total interest-earning assets | 4,962,289 | 125,496 | 3.38 | % | 4,600,734 | 106,150 | 3.08 | % | ||||||||||||||||
Non interest-earning assets | 247,744 | 227,185 | ||||||||||||||||||||||
Allowance for loan losses | (28,936 | ) | (27,235 | ) | ||||||||||||||||||||
|
|
|
| |||||||||||||||||||||
Total assets | $ | 5,181,097 | $ | 4,800,684 | ||||||||||||||||||||
|
|
|
| |||||||||||||||||||||
LIABILITIES AND STOCKHOLDERS’ EQUITY | ||||||||||||||||||||||||
Interest-bearing deposits: | ||||||||||||||||||||||||
NOW accounts | $ | 932,139 | $ | 7,057 | 1.01 | % | $ | 944,879 | $ | 4,669 | 0.66 | % | ||||||||||||
Savings accounts | 885,878 | 9,731 | 1.47 | % | 550,585 | 3,109 | 0.75 | % | ||||||||||||||||
Money market accounts | 1,249,531 | 15,805 | 1.69 | % | 1,208,547 | 9,039 | 1.00 | % | ||||||||||||||||
Time deposits | 512,228 | 8,724 | 2.28 | % | 587,742 | 7,465 | 1.70 | % | ||||||||||||||||
|
|
|
|
|
|
|
|
|
|
|
| |||||||||||||
Total interest-bearing deposits | 3,579,776 | 41,317 | 1.54 | % | 3,291,753 | 24,282 | 0.99 | % | ||||||||||||||||
Securities sold under agreements to repurchase | 205,185 | 1,572 | 1.02 | % | 149,970 | 657 | 0.59 | % | ||||||||||||||||
Other borrowed funds and subordinated debentures | 237,887 | 5,274 | 2.96 | % | 298,480 | 5,793 | 2.59 | % | ||||||||||||||||
|
|
|
|
|
|
|
|
|
|
|
| |||||||||||||
Total interest-bearing liabilities | 4,022,848 | 48,163 | 1.60 | % | 3,740,203 | 30,732 | 1.10 | % | ||||||||||||||||
|
|
|
|
|
|
|
| |||||||||||||||||
Non-interest-bearing liabilities | ||||||||||||||||||||||||
Demand deposits | 764,852 | 718,215 | ||||||||||||||||||||||
Other liabilities | 79,327 | 69,404 | ||||||||||||||||||||||
|
|
|
| |||||||||||||||||||||
Total liabilities | 4,867,027 | 4,527,822 | ||||||||||||||||||||||
|
|
|
| |||||||||||||||||||||
Stockholders’ equity | 314,070 | 272,862 | ||||||||||||||||||||||
Total liabilities & stockholders’ equity | $ | 5,181,097 | $ | 4,800,684 | ||||||||||||||||||||
|
|
|
| |||||||||||||||||||||
Net interest income on a fully taxable equivalent basis | 77,333 | 75,418 | ||||||||||||||||||||||
Less taxable equivalent adjustment | (6,875 | ) | (6,547 | ) | ||||||||||||||||||||
|
|
|
| |||||||||||||||||||||
Net interest income | $ | 70,458 | $ | 68,871 | ||||||||||||||||||||
|
|
|
|
|
|
|
| |||||||||||||||||
Net interest spread (3) | 1.78 | % | 1.98 | % | ||||||||||||||||||||
|
|
|
| |||||||||||||||||||||
Net interest margin (4) | 2.08 | % | 2.19 | % | ||||||||||||||||||||
|
|
|
| |||||||||||||||||||||
| Nine Months Ended | ||||||||||||||||||||||||
September 30, 2020 | September 30, 2019 | |||||||||||||||||||||||
Average Balance | Interest Income/ Expenses (1) | Rate Earned/ Paid (1) | Average Balance | Interest Income/ Expenses (1) | Rate Earned/ Paid (1) | |||||||||||||||||||
ASSETS | (dollars in thousands) | |||||||||||||||||||||||
Interest-earning assets: | ||||||||||||||||||||||||
Loans (2) | ||||||||||||||||||||||||
Loans taxable | $ | 1,489,641 | $ | 41,884 | 3.76 | % | $ | 1,200,512 | $ | 40,114 | 4.47 | % | ||||||||||||
Loans tax-exempt | 1,203,359 | 27,100 | 3.01 | % | 1,124,624 | 31,658 | 3.76 | % | ||||||||||||||||
Securities available-for-sale | ||||||||||||||||||||||||
Taxable | 271,882 | 3,241 | 1.59 | % | 271,637 | 6,338 | 3.11 | % | ||||||||||||||||
Tax-exempt | 21,419 | 304 | 1.89 | % | 53,399 | 1,176 | 2.94 | % | ||||||||||||||||
Securities held-to-maturity: | ||||||||||||||||||||||||
Taxable | 2,346,502 | 44,701 | 2.54 | % | 2,128,082 | 43,006 | 2.69 | % | ||||||||||||||||
Interest-bearing deposits in other banks | 238,525 | 747 | 0.42 | % | 184,035 | 3,204 | 2.32 | % | ||||||||||||||||
Total interest-earning assets | 5,571,328 | 117,977 | 2.83 | % | 4,962,289 | 125,496 | 3.38 | % | ||||||||||||||||
Non interest-earning assets | 294,226 | 247,744 | ||||||||||||||||||||||
Allowance for loan losses | (31,359 | ) | (28,936 | ) | ||||||||||||||||||||
Total assets | $ | 5,834,195 | $ | 5,181,097 | ||||||||||||||||||||
LIABILITIES AND STOCKHOLDERS’ EQUITY | ||||||||||||||||||||||||
Interest-bearing deposits: | ||||||||||||||||||||||||
NOW accounts | $ | 1,110,309 | $ | 4,633 | 0.56 | % | $ | 932,139 | $ | 7,057 | 1.01 | % | ||||||||||||
Savings accounts | 771,588 | 2,936 | 0.51 | % | 885,878 | 9,731 | 1.47 | % | ||||||||||||||||
Money market accounts | 1,603,367 | 12,090 | 1.01 | % | 1,249,531 | 15,805 | 1.69 | % | ||||||||||||||||
Time deposits | 597,589 | 9,141 | 2.04 | % | 512,228 | 8,724 | 2.28 | % | ||||||||||||||||
Total interest-bearing deposits | 4,082,853 | 28,800 | 0.94 | % | 3,579,776 | 41,317 | 1.54 | % | ||||||||||||||||
Securities sold under agreements to repurchase | 220,796 | 1,176 | 0.71 | % | 205,185 | 1,572 | 1.02 | % | ||||||||||||||||
Other borrowed funds and subordinated debentures | 206,055 | 4,093 | 2.65 | % | 237,887 | 5,274 | 2.96 | % | ||||||||||||||||
Total interest-bearing liabilities | 4,509,704 | 34,069 | 1.01 | % | 4,022,848 | 48,163 | 1.60 | % | ||||||||||||||||
Non-interest-bearing liabilities | ||||||||||||||||||||||||
Demand deposits | 889,237 | 764,852 | ||||||||||||||||||||||
Other liabilities | 88,028 | 79,327 | ||||||||||||||||||||||
Total liabilities | 5,486,969 | 4,867,027 | ||||||||||||||||||||||
Stockholders’ equity | 347,226 | 314,070 | ||||||||||||||||||||||
Total liabilities & stockholders’ equity | $ | 5,834,195 | $ | 5,181,097 | ||||||||||||||||||||
Net interest income on a fully taxable equivalent basis | 83,908 | 77,333 | ||||||||||||||||||||||
Less taxable equivalent adjustment | (5,558 | ) | (6,875 | ) | ||||||||||||||||||||
Net interest income | $ | 78,350 | $ | 70,458 | ||||||||||||||||||||
Net interest spread (3) | 1.82 | % | 1.78 | % | ||||||||||||||||||||
Net interest margin (4) | 2.01 | % | 2.08 | % | ||||||||||||||||||||
| (1) | On a fully taxable equivalent basis calculated using a federal tax rate of 21%. Rates are annualized. |
| (2) | Nonaccrual loans are included in average amounts outstanding. |
| (3) | Interest rate spread represents the difference between the weighted average yield on interest-earning assets and the weighted average cost of interest-bearing liabilities. |
| (4) | Net interest margin represents net interest income as a percentage of average interest-earning assets. |
| (5) | Average balances of securities available-for-sale |
| Three Months Ended September 30, 2019 Compared with Three Months Ended September 30, 2018 | Nine Months Ended September 30, 2019 Compared with Nine Months Ended September 30, 2018 | |||||||||||||||||||||||
Increase/(Decrease) Due to Change in | Increase/(Decrease) Due to Change in | |||||||||||||||||||||||
| Volume | Rate | Total | Volume | Rate | Total | |||||||||||||||||||
| (in thousands) | (in thousands) | |||||||||||||||||||||||
Interest income: | ||||||||||||||||||||||||
Loans | ||||||||||||||||||||||||
Taxable | $ | 1,177 | $ | 514 | $ | 1,691 | $ | 4,051 | $ | 2,161 | $ | 6,212 | ||||||||||||
Tax-exempt | 152 | 177 | 329 | (128 | ) | 1,768 | 1,640 | |||||||||||||||||
Securitiesavailable-for-sale | ||||||||||||||||||||||||
Taxable | (247 | ) | 246 | (1 | ) | (911 | ) | 1,530 | 619 | |||||||||||||||
Tax-exempt | (576 | ) | 191 | (385 | ) | (642 | ) | 476 | (166 | ) | ||||||||||||||
Securitiesheld-to-maturity | ||||||||||||||||||||||||
Taxable | 1,861 | 1,255 | 3,116 | 6,031 | 4,045 | 10,076 | ||||||||||||||||||
Interest-bearing deposits in other banks | 297 | 40 | 337 | 169 | 796 | 965 | ||||||||||||||||||
|
|
|
|
|
|
|
|
|
|
|
| |||||||||||||
Total interest income | 2,664 | 2,423 | 5,087 | 8,570 | 10,776 | 19,346 | ||||||||||||||||||
|
|
|
|
|
|
|
|
|
|
|
| |||||||||||||
Interest expense: | ||||||||||||||||||||||||
Deposits | ||||||||||||||||||||||||
NOW accounts | 12 | 613 | 625 | (64 | ) | 2,452 | 2,388 | |||||||||||||||||
Savings accounts | 866 | 982 | 1,848 | 2,595 | 4,027 | 6,622 | ||||||||||||||||||
Money market accounts | (73 | ) | 1,471 | 1,398 | 316 | 6,450 | 6,766 | |||||||||||||||||
Time deposits | (214 | ) | 681 | 467 | (1,049 | ) | 2,308 | 1,259 | ||||||||||||||||
|
|
|
|
|
|
|
|
|
|
|
| |||||||||||||
Total interest-bearing deposits | 591 | 3,747 | 4,338 | 1,798 | 15,237 | 17,035 | ||||||||||||||||||
Securities sold under agreements to repurchase | 243 | 166 | 409 | 302 | 613 | 915 | ||||||||||||||||||
Other borrowed funds and subordinated debentures | (481 | ) | 255 | (226 | ) | (1,274 | ) | 755 | (519 | ) | ||||||||||||||
|
|
|
|
|
|
|
|
|
|
|
| |||||||||||||
Total interest expense | 353 | 4,168 | 4,521 | 826 | 16,605 | 17,431 | ||||||||||||||||||
|
|
|
|
|
|
|
|
|
|
|
| |||||||||||||
Change in net interest income | $ | 2,311 | $ | (1,745 | ) | $ | 566 | $ | 7,744 | $ | (5,829 | ) | $ | 1,915 | ||||||||||
|
|
|
|
|
|
|
|
|
|
|
| |||||||||||||
| Three Months Ended September 30, 2020 Compared with Three Months Ended September 30, 2019 | Nine Months Ended September 30, 2020 Compared with Nine Months Ended September 30, 2019 | |||||||||||||||||||||||
| Increase/(Decrease) Due to Change in | Increase/(Decrease) Due to Change in | |||||||||||||||||||||||
| Volume | Rate | Total | Volume | Rate | Total | |||||||||||||||||||
Interest income: | (in thousands) | (in thousands) | ||||||||||||||||||||||
Loans | ||||||||||||||||||||||||
Taxable | $ | 4,502 | $ | (3,093 | ) | $ | 1,409 | $ | 8,758 | $ | (6,988 | ) | $ | 1,770 | ||||||||||
Tax-exempt | 829 | (3,536 | ) | (2,707 | ) | 2,108 | (6,666 | ) | (4,558 | ) | ||||||||||||||
Securities available-for-sale | ||||||||||||||||||||||||
Taxable | 81 | (1,328 | ) | (1,247 | ) | 6 | (3,103 | ) | (3,097 | ) | ||||||||||||||
Tax-exempt | 63 | (215 | ) | (152 | ) | (547 | ) | (325 | ) | (872 | ) | |||||||||||||
Securities held-to-maturity | ||||||||||||||||||||||||
Taxable | 1,462 | (1,899 | ) | (437 | ) | 4,252 | (2,557 | ) | 1,695 | |||||||||||||||
Interest-bearing deposits in other banks | 348 | (1,207 | ) | (859 | ) | 742 | (3,199 | ) | (2,457 | ) | ||||||||||||||
Total interest income | 7,285 | (11,278 | ) | (3,993 | ) | 15,319 | (22,838 | ) | (7,519 | ) | ||||||||||||||
Interest expense: | ||||||||||||||||||||||||
Deposits | ||||||||||||||||||||||||
NOW accounts | 526 | (1,832 | ) | (1,306 | ) | 1,170 | (3,593 | ) | (2,423 | ) | ||||||||||||||
Savings accounts | (242 | ) | (2,171 | ) | (2,413 | ) | (1,120 | ) | (5,675 | ) | (6,795 | ) | ||||||||||||
Money market accounts | 1,685 | (3,679 | ) | (1,994 | ) | 3,735 | (7,450 | ) | (3,715 | ) | ||||||||||||||
Time deposits | 418 | (598 | ) | (180 | ) | 1,366 | (950 | ) | 416 | |||||||||||||||
Total interest-bearing deposits | 2,387 | (8,280 | ) | (5,893 | ) | 5,151 | (17,668 | ) | (12,517 | ) | ||||||||||||||
Securities sold under agreements to repurchase | (103 | ) | (353 | ) | (456 | ) | 113 | (509 | ) | (396 | ) | |||||||||||||
Other borrowed funds and subordinated debentures | (295 | ) | (265 | ) | (560 | ) | (662 | ) | (519 | ) | (1,181 | ) | ||||||||||||
Total interest expense | 1,989 | (8,898 | ) | (6,909 | ) | 4,602 | (18,696 | ) | (14,094 | ) | ||||||||||||||
Change in net interest income | $ | 5,296 | $ | (2,380 | ) | $ | 2,916 | $ | 10,717 | $ | (4,142 | ) | $ | 6,575 | ||||||||||
$6,909,000.
$14,094,000.
For the three months ended September 30, 2019, the
loan servicing fees. Lockbox fees increased mainly as a result of increased customer activity. Also, there were no loan sales during the third quarters of 2020 and 2019.
depreciation expense.
in 2020.
Table of ContentsItem3.Quantitative and Qualitative Disclosure about Market Risk
Item 3. | Quantitative and Qualitative Disclosure about Market Risk |
Item 4. | Controls and Procedures |
Item 2 | Unregistered Sales of Equity Securities and Use of Proceeds – |
Item 3 | Defaults Upon Senior Securities – None |
Item 4 | Mine Safety Disclosures – Not applicable |
Item 5 | Other Information – None |
Item 6 | Exhibits |
| Certification of Chief Financial Officer Pursuant to 18 U.S.C. Section 1350, as Adopted Pursuant to Section 906 of the Sarbanes-Oxley Act of 2002. | ||
| ++101. | INS XBRL Instance Document | |
| ++101. | SCH XBRL Taxonomy Extension Schema | |
| ++101. | CAL XBRL Taxonomy Extension Calculation Linkbase | |
| ++101. | LAB XBRL Taxonomy Extension Label Linkbase | |
| ++101. | PRE XBRL Taxonomy Extension Presentation Linkbase | |
| ++101. | DEF XBRL Taxonomy Definition Linkbase | |
| 104 | Cover Page Interactive Data File (formatted as inline XBRL with applicable taxonomy extension information contained in Exhibits 101) | |
| + | This exhibit shall not be deemed “filed” for purposes of Section 18 of the Securities Exchange Act of 1934, or otherwise subject to the liability of that section, and shall not be deemed to be incorporated by reference into any filing under the Securities Act of 1933 or the Securities Exchange Act of 1934. |
| ++ | As provided in Rule 406T of regulation S-T, this information is filed for purposes of Sections 11 and 12 of the Securities Act of 1933 and Section 18 of the Securities Exchange Act of 1934 and consists of the following materials from Century Bancorp Inc.’s Quarterly Report on10-Q for the quarter ended September 30, |
Date: November | Century Bancorp, Inc. | |||
/s/ Barry R. Sloane | ||||
Barry R. Sloane | ||||
Chairman, President and Chief Executive Officer | ||||
/s/ William P. Hornby | ||||
William P. Hornby, CPA | ||||
Chief Financial Officer and Treasurer | ||||
(Principal Accounting Officer) | ||||