i
PART I — FINANCIAL INFORMATION
KANDI TECHNOLOGIES GROUP, INC.
AND SUBSIDIARIES
CONDENSED CONSOLIDATED BALANCE SHEET
| September 30, 2019 | December 31, 2018 | |||||||
| (UNAUDITED) | ||||||||
| Current assets | ||||||||
| Cash and cash equivalents | $ | 14,338,637 | $ | 15,662,201 | ||||
| Restricted cash | 11,713,004 | 6,690,870 | ||||||
| Accounts receivable (net of allowance for doubtful accounts of $130,420 and $120,010 as of September 30, 2019 and December 31, 2018, respectively) | 54,859,801 | 34,274,728 | ||||||
| Inventories | 35,447,383 | 21,997,868 | ||||||
| Notes receivable | 41,549,888 | 72,712 | ||||||
| Notes receivable from the Affiliate Company and related party | - | 3,861,032 | ||||||
| Other receivables | 12,859,304 | 1,264,323 | ||||||
| Prepayments and prepaid expense | 9,497,459 | 11,136,408 | ||||||
| Due from employees | 5,499 | 1,001 | ||||||
| Advances to suppliers | 4,474,104 | 4,705,183 | ||||||
| Amount due from the Affiliate Company, net | 25,335,894 | 67,683,462 | ||||||
| Right - of - use asset | 42,974 | - | ||||||
| TOTAL CURRENT ASSETS | 210,123,947 | 167,349,788 | ||||||
| LONG-TERM ASSETS | ||||||||
| Property, plant and equipment, net | 74,491,204 | 82,045,923 | ||||||
| Land use rights, net | 11,084,717 | 11,749,728 | ||||||
| Construction in progress | 17,781 | - | ||||||
| Deferred taxes assets | - | 8,204 | ||||||
| Investment in the Affiliate Company | 53,837,011 | 128,929,893 | ||||||
| Goodwill | 27,762,120 | 28,552,215 | ||||||
| Intangible assets | 3,723,988 | 4,328,127 | ||||||
| Other long term assets | 4,803,349 | 5,865,386 | ||||||
| TOTAL Long-Term Assets | 175,720,170 | 261,479,476 | ||||||
| TOTAL ASSETS | $ | 385,844,117 | $ | 428,829,264 | ||||
| CURRENT LIABILITIES | ||||||||
| Accounts payable | $ | 79,632,036 | $ | 112,309,683 | ||||
| Other payables and accrued expenses | 4,843,001 | 4,251,487 | ||||||
| Short-term loans | 30,969,731 | 30,539,236 | ||||||
| Customer deposits | 33,535 | 94,408 | ||||||
| Notes payable | 11,463,004 | 12,787,619 | ||||||
| Income tax payable | 1,519,699 | 3,471,366 | ||||||
| Due to employees | 7,105 | 28,473 | ||||||
| Deferred income | 1,237,556 | 1,340,605 | ||||||
| Lease liability | 44,121 | - | ||||||
| Total Current Liabilities | 129,749,788 | 164,822,877 | ||||||
| LONG-TERM LIABILITIES | ||||||||
| Long term bank loans | 27,606,502 | 28,794,136 | ||||||
| Deferred taxes liability | 1,758,643 | 1,711,343 | ||||||
| Contingent consideration liability | 6,562,000 | 7,256,000 | ||||||
| Other long-term liability | - | 622,034 | ||||||
| Total Long-Term Liabilities | 35,927,145 | 38,383,513 | ||||||
| TOTAL LIABILITIES | 165,676,933 | 203,206,390 | ||||||
| STOCKHOLDER’S EQUITY | ||||||||
| Common stock, $0.001 par value; 100,000,000 shares authorized; 56,263,102 and 55,992,002 shares issued and 52,839,441 and 51,484,444 outstanding at September 30, 2019 and December 31, 2018, respectively | 52,839 | 51,484 | ||||||
| Less: Treasury stock (487,155 shares with average price of $5.09 and 0 shares at September 30, 2019 and December 31, 2018, respectively ) | (2,477,965 | ) | - | |||||
| Additional paid-in capital | 259,691,370 | 254,989,657 | ||||||
| Accumulated deficit (the restricted portion is $4,422,033 and $4,422,033 at September 30, 2019 and December 31, 2018, respectively) | (9,135,198 | ) | (9,497,009 | ) | ||||
| Accumulated other comprehensive loss | (27,963,862 | ) | (19,921,258 | ) | ||||
| TOTAL STOCKHOLDERS’ EQUITY | 220,167,184 | 225,622,874 | ||||||
| TOTAL LIABILITIES AND STOCKHOLDERS’ EQUITY | $ | 385,844,117 | $ | 428,829,264 | ||||
See accompanying notes to condensed consolidated financial statements
KANDI TECHNOLOGIES GROUP, INC.
AND SUBSIDIARIES
CONDENSED CONSOLIDATED STATEMENTS OF INCOME (LOSS) AND
COMPREHENSIVE INCOME (LOSS)
(UNAUDITED)
| Three Months Ended | Nine Months Ended | |||||||||||||||
| September 30, 2019 | September 30, 2018 | September 30, 2019 | September 30, 2018 | |||||||||||||
| REVENUES FROM UNRELATED PARTY, NET | $ | 26,968,385 | $ | 14,860,034 | $ | 63,360,044 | $ | 32,211,352 | ||||||||
| REVENUES FROM THE AFFILIATE COMPANY AND RELATED PARTY, NET | 4,720,159 | 23,135,326 | 10,543,190 | 30,479,521 | ||||||||||||
| REVENUES, NET | 31,688,544 | 37,995,360 | 73,903,234 | 62,690,873 | ||||||||||||
| COST OF GOODS SOLD | (26,412,129 | ) | (31,753,311 | ) | (61,288,228 | ) | (53,044,861 | ) | ||||||||
| GROSS PROFIT | 5,276,415 | 6,242,049 | 12,615,006 | 9,646,012 | ||||||||||||
| OPERATING EXPENSES: | ||||||||||||||||
| Research and development | (596,187 | ) | (5,691,649 | ) | (1,766,210 | ) | (7,091,836 | ) | ||||||||
| Selling and marketing | (930,810 | ) | (898,896 | ) | (2,448,291 | ) | (1,875,294 | ) | ||||||||
| General and administrative | (3,432,920 | ) | (2,070,947 | ) | (11,096,246 | ) | (5,534,039 | ) | ||||||||
| Total Operating Expenses | (4,959,917 | ) | (8,661,492 | ) | (15,310,747 | ) | (14,501,169 | ) | ||||||||
| INCOME (LOSS) FROM OPERATIONS | 316,498 | (2,419,443 | ) | (2,695,741 | ) | (4,855,157 | ) | |||||||||
| OTHER INCOME (EXPENSE): | �� | |||||||||||||||
| Interest income | 209,736 | 52,745 | 559,954 | 1,452,522 | ||||||||||||
| Interest expense | (435,524 | ) | (483,376 | ) | (1,304,062 | ) | (1,505,409 | ) | ||||||||
| Change in fair value of contingent consideration | 57,000 | (1,552,686 | ) | 694,000 | 1,814,326 | |||||||||||
| Government grants | 502,146 | 607,008 | 725,189 | 717,821 | ||||||||||||
| Gain from equity dilution in the Affiliate Company | (49,285 | ) | - | 4,291,974 | - | |||||||||||
| Gain from equity sale in the Affiliate Company | 20,574,217 | - | 20,574,217 | - | ||||||||||||
| Share of loss after tax of the Affiliate Company | (8,433,767 | ) | (3,247,343 | ) | (22,883,126 | ) | (79,592 | ) | ||||||||
| Other income , net | 57,833 | 15,735 | 357,626 | 666,294 | ||||||||||||
| Total other income (expense), net | 12,482,356 | (4,607,917 | ) | 3,015,772 | 3,065,962 | |||||||||||
| INCOME (LOSS) BEFORE INCOME TAXES | 12,798,854 | (7,027,360 | ) | 320,031 | (1,789,195 | ) | ||||||||||
| INCOME TAX (EXPENSE) BENEFIT | (709,413 | ) | 505,961 | 41,780 | 370,316 | |||||||||||
| NET INCOME (LOSS) | 12,089,441 | (6,521,399 | ) | 361,811 | (1,418,879 | ) | ||||||||||
| OTHER COMPREHENSIVE INCOME (LOSS) | ||||||||||||||||
| Foreign currency translation | (8,531,043 | ) | (8,108,270 | ) | (8,042,604 | ) | (13,230,652 | ) | ||||||||
| COMPREHENSIVE INCOME (LOSS) | $ | 3,558,398 | $ | (14,629,669 | ) | $ | (7,680,793 | ) | $ | (14,649,531 | ) | |||||
| WEIGHTED AVERAGE SHARES OUTSTANDING BASIC AND DILUTED | 52,613,642 | 51,474,048 | 52,332,260 | 51,089,047 | ||||||||||||
| NET INCOME (LOSS) PER SHARE, BASIC AND DILUTED | $ | 0.23 | $ | (0.13 | ) | $ | 0.01 | $ | (0.03 | ) | ||||||
See accompanying notes to condensed consolidated financial statements
KANDI TECHNOLOGIES GROUP, INC.
AND SUBSIDIARIES
CONDENSED CONSOLIDATED STATEMENTS OF CHANGES IN STOCKHOLDERS’ EQUITY
(UNAUDITED)
| September 30, 2018 | December 31, 2017 | |||||||
| (Unaudited) | ||||||||
| Current assets | ||||||||
| Cash and cash equivalents | $ | 1,342,085 | $ | 4,891,808 | ||||
| Restricted cash | 9,104,584 | 11,218,688 | ||||||
| Accounts receivable (net of allowance for doubtful accounts of $319,421 and $133,930 as of September 30, 2018 and December 31, 2017, respectively) | 40,111,173 | 34,397,858 | ||||||
| Inventories (net of provision for slow moving inventory of $662,769 and $620,919 as of September 30, 2018 and December 31, 2017, respectively) | 15,676,683 | 15,979,794 | ||||||
| Notes receivable | 72,817 | - | ||||||
| Notes receivable from JV Company and related party | 2,184,519 | 1,137,289 | ||||||
| Other receivables | 1,233,460 | 2,650,668 | ||||||
| Prepayments and prepaid expense | 6,662,684 | 6,536,839 | ||||||
| Due from employees | 6,668 | 7,070 | ||||||
| Advances to suppliers | 8,794,653 | 14,908,385 | ||||||
| Amount due from JV Company, net | 77,386,193 | 146,422,440 | ||||||
| Amount due from related party | - | 162,048 | ||||||
| TOTAL CURRENT ASSETS | 162,575,519 | 238,312,887 | ||||||
| LONG-TERM ASSETS | ||||||||
| Property, Plant and Equipment, net | 83,664,992 | 12,000,971 | ||||||
| Land use rights, net | 11,848,966 | 12,666,047 | ||||||
| Construction in progress | - | 53,083,925 | ||||||
| Deferred taxes assets | 3,294,885 | 4,383,425 | ||||||
| Long Term Investment | - | 1,460,034 | ||||||
| Investment in JV Company | 146,272,731 | 70,681,013 | ||||||
| Goodwill | 28,583,528 | 322,591 | ||||||
| Intangible assets | 4,491,080 | 331,116 | ||||||
| Advances to suppliers | - | 21,592,918 | ||||||
| Other long term assets | 6,168,533 | 7,590,734 | ||||||
| Amount due from JV Company, net | - | 15,907,183 | ||||||
| TOTAL Long-Term Assets | 284,324,715 | 200,019,957 | ||||||
| TOTAL ASSETS | $ | 446,900,234 | $ | 438,332,844 | ||||
| CURRENT LIABILITIES | ||||||||
| Accounts payables | $ | 111,376,786 | $ | 111,595,540 | ||||
| Other payables and accrued expenses | 6,065,379 | 6,556,209 | ||||||
| Short-term loans | 30,583,267 | 33,042,864 | ||||||
| Customer deposits | 214,079 | 205,544 | ||||||
| Notes payable | 24,663,846 | 28,075,945 | ||||||
| Income tax payable | 471,184 | 2,902,699 | ||||||
| Due to employees | 34,070 | 35,041 | ||||||
| Deferred income | 1,353,819 | 2,191,143 | ||||||
| Total Current Liabilities | 174,762,430 | 184,604,985 | ||||||
| LONG-TERM LIABILITIES | ||||||||
| Long term bank loans | 28,981,286 | 30,737,547 | ||||||
| Contingent liability | 12,204,964 | - | ||||||
| Other long-term liability | 681,768 | - | ||||||
| Total Long-Term Liabilities | 41,868,018 | 30,737,547 | ||||||
| TOTAL LIABILITIES | 216,630,448 | 215,342,532 | ||||||
| STOCKHOLDER’S EQUITY | ||||||||
| Common stock, $0.001 par value; 100,000,000 shares authorized; 55,989,502 and 48,036,538 shares issued and 51,481,944 and 48,036,538 outstanding at September 30, 2018 and December 31,2017, respectively | 51,482 | 48,037 | ||||||
| Additional paid-in capital | 254,980,909 | 233,055,348 | ||||||
| Retained earnings (the restricted portion is $4,422,033 and $4,422,033 at September 30,2018 and December 31,2017, respectively) | (5,221,190 | ) | (3,802,310 | ) | ||||
| Accumulated other comprehensive loss | (19,541,415 | ) | (6,310,763 | ) | ||||
| TOTAL STOCKHOLDERS’ EQUITY | 230,269,786 | 222,990,312 | ||||||
| TOTAL LIABILITIES AND STOCKHOLDERS’ EQUITY | $ | 446,900,234 | $ | 438,332,844 | ||||
| Number of Outstanding Shares | Common Stock | Treasury Stock | Additional Paid-in Capital | Accumulated Deficit | Accumulated Other Comprehensive Income | Total | ||||||||||||||||||||||
| Balance, December 31, 2018 | 51,484,444 | 51,484 | - | 254,989,657 | (9,497,009 | ) | (19,921,258 | ) | 225,622,874 | |||||||||||||||||||
| Stock issuance and award | 1,096,397 | 1,097 | - | 3,387,379 | - | - | 3,388,476 | |||||||||||||||||||||
| Net income (loss) | - | - | - | - | (4,409,472 | ) | - | (4,409,472 | ) | |||||||||||||||||||
| Foreign currency translation | - | - | - | - | - | 5,404,028 | 5,404,028 | |||||||||||||||||||||
| Balance, March 31, 2019 | 52,580,841 | 52,581 | - | 258,377,036 | (13,906,481 | ) | (14,517,230 | ) | 230,005,906 | |||||||||||||||||||
| Stock issuance and award | 238,600 | 238 | - | 1,259,569 | - | - | 1,259,807 | |||||||||||||||||||||
| Net income (loss) | - | - | - | - | (7,318,158 | ) | - | (7,318,158 | ) | |||||||||||||||||||
| Foreign currency translation | - | - | - | - | - | (4,915,589 | ) | (4,915,589 | ) | |||||||||||||||||||
| Balance, June 30, 2019 | 52,819,441 | 52,819 | - | 259,636,605 | (21,224,639 | ) | (19,432,819 | ) | 219,031,966 | |||||||||||||||||||
| Stock issuance and award | 20,000 | 20 | - | 69,380 | - | - | 69,400 | |||||||||||||||||||||
| Stock buyback | - | - | (2,477,965 | ) | - | - | - | (2,477,965 | ) | |||||||||||||||||||
| Commission in stock buyback | - | - | - | (14,615 | ) | - | - | (14,615 | ) | |||||||||||||||||||
| Net income (loss) | - | - | - | - | 12,089,441 | - | 12,089,441 | |||||||||||||||||||||
| Foreign currency translation | - | - | - | - | - | (8,531,043 | ) | (8,531,043 | ) | |||||||||||||||||||
| Balance, September 30, 2019 | 52,839,441 | 52,839 | (2,477,965 | ) | 259,691,370 | (9,135,198 | ) | (27,963,862 | ) | 220,167,184 | ||||||||||||||||||
| Number of Outstanding Shares | Common Stock | Treasury Stock | Additional Paid-in Capital | Accumulated Deficit | Accumulated Other Comprehensive Income | Total | ||||||||||||||||||||||
| Balance, December 31, 2017 | 48,036,538 | 48,037 | - | 233,055,348 | (3,802,310 | ) | (6,310,763 | ) | 222,990,312 | |||||||||||||||||||
| Stock issuance and award | 2,972,337 | 2,972 | - | 19,099,556 | - | - | 19,102,528 | |||||||||||||||||||||
| Net income (loss) | - | - | - | - | 3,727,995 | - | 3,727,995 | |||||||||||||||||||||
| Foreign currency translation | - | - | - | - | - | 7,465,240 | 7,465,240 | |||||||||||||||||||||
| Balance, March 31, 2018 | 51,008,875 | 51,009 | - | 252,154,904 | (74,315 | ) | 1,154,477 | 253,286,075 | ||||||||||||||||||||
| Stock issuance and award | 288,600 | 289 | - | 2,038,476 | - | - | 2,038,765 | |||||||||||||||||||||
| Net income (loss) | - | - | - | - | 1,374,525 | - | 1,374,525 | |||||||||||||||||||||
| Foreign currency translation | - | - | - | - | - | (12,587,622 | ) | (12,587,622 | ) | |||||||||||||||||||
| Balance, June 30, 2018 | 51,297,475 | 51,298 | - | 254,193,380 | 1,300,210 | (11,433,145 | ) | 244,111,743 | ||||||||||||||||||||
| Stock issuance and award | 184,469 | 184 | - | 787,529 | - | - | 787,713 | |||||||||||||||||||||
| Net income (loss) | - | - | - | - | (6,521,399 | ) | - | (6,521,399 | ) | |||||||||||||||||||
| Foreign currency translation | - | - | - | - | - | (8,108,271 | ) | (8,108,271 | ) | |||||||||||||||||||
| Balance, September 30, 2018 | 51,481,944 | 51,482 | - | 254,980,909 | (5,221,189 | ) | (19,541,416 | ) | 230,269,786 | |||||||||||||||||||
See accompanying notes to condensed consolidated financial statements
statements.
KANDI TECHNOLOGIES GROUP, INC.
AND SUBSIDIARIES
CONDENSED CONSOLIDATED STATEMENTS OF INCOME (LOSS) ANDCASH FLOWSCOMPREHENSIVE INCOME (LOSS)(UNAUDITED)
(UNAUDITED)
| Three Months Ended | Nine Months Ended | |||||||||||||||
| September 30, 2018 | September 30, 2017 | September 30, 2018 | September 30, 2017 | |||||||||||||
| REVENUES FROM UNRELATED PARTY, NET | $ | 14,860,034 | $ | 6,604,109 | $ | 32,211,352 | $ | 10,720,595 | ||||||||
| REVENUES FROM JV COMPANY AND RELATED PARTY, NET | 23,135,326 | 21,749,790 | 30,479,521 | 49,233,156 | ||||||||||||
| REVENUES, NET | 37,995,360 | 28,353,899 | 62,690,873 | 59,953,751 | ||||||||||||
| COST OF GOODS SOLD | (31,753,311 | ) | (23,522,406 | ) | (53,044,861 | ) | (50,697,990 | ) | ||||||||
| GROSS PROFIT | 6,242,049 | 4,831,493 | 9,646,012 | 9,255,761 | ||||||||||||
| OPERATING EXPENSES: | ||||||||||||||||
| Research and development | (5,691,649 | ) | (657,851 | ) | (7,091,836 | ) | (26,569,624 | ) | ||||||||
| Selling and marketing | (898,896 | ) | (216,351 | ) | (1,875,294 | ) | (976,913 | ) | ||||||||
| General and administrative | (2,070,947 | ) | (2,196,201 | ) | (5,534,039 | ) | (12,074,147 | ) | ||||||||
| Total Operating Expenses | (8,661,492 | ) | (3,070,403 | ) | (14,501,169 | ) | (39,620,684 | ) | ||||||||
| (LOSS) INCOME FROM OPERATIONS | (2,419,443 | ) | 1,761,090 | (4,855,157 | ) | (30,364,923 | ) | |||||||||
| OTHER INCOME (EXPENSE): | ||||||||||||||||
| Interest income | 52,745 | 619,923 | 1,452,522 | 1,709,990 | ||||||||||||
| Interest expense | (483,376 | ) | (598,523 | ) | (1,505,409 | ) | (1,761,786 | ) | ||||||||
| Change in fair value of contingent consideration | (1,552,686 | ) | - | 1,814,326 | - | |||||||||||
| Government grants | 607,008 | 474,950 | 717,821 | 5,804,561 | ||||||||||||
| Share of (loss) income after tax of JV | (3,247,343 | ) | 444,181 | (79,592 | ) | (13,455,786 | ) | |||||||||
| Other income (expense), net | 15,735 | (6,560 | ) | 666,294 | 143,617 | |||||||||||
| Total other (expense) income, net | (4,607,917 | ) | 933,971 | 3,065,962 | (7,559,404 | ) | ||||||||||
| (LOSS) INCOME BEFORE INCOME TAXES | (7,027,360 | ) | 2,695,061 | (1,789,195 | ) | (37,924,327 | ) | |||||||||
| INCOME TAX BENEFIT (EXPENSE) | 505,961 | (776,985 | ) | 370,316 | 4,130,951 | |||||||||||
| NET (LOSS) INCOME | (6,521,399 | ) | 1,918,076 | (1,418,879 | ) | (33,793,376 | ) | |||||||||
| OTHER COMPREHENSIVE (LOSS) INCOME | ||||||||||||||||
| Foreign currency translation | (8,108,270 | ) | 4,032,652 | (13,230,652 | ) | 8,942,931 | ||||||||||
| COMPREHENSIVE (LOSS) INCOME | $ | (14,629,669 | ) | $ | 5,950,728 | $ | (14,649,531 | ) | $ | (24,850,445 | ) | |||||
| WEIGHTED AVERAGE SHARES OUTSTANDING BASIC | 51,474,048 | 48,028,467 | 51,089,047 | 47,913,028 | ||||||||||||
| WEIGHTED AVERAGE SHARES OUTSTANDING DILUTED | 51,474,048 | 48,028,467 | 51,089,047 | 47,913,028 | ||||||||||||
| NET (LOSS) INCOME PER SHARE, BASIC | $ | (0.13 | ) | $ | 0.04 | $ | (0.03 | ) | $ | (0.71 | ) | |||||
| NET (LOSS) INCOME PER SHARE, DILUTED | $ | (0.13 | ) | $ | 0.04 | $ | (0.03 | ) | $ | (0.71 | ) | |||||
| Nine Months Ended | ||||||||
| September 30, 2019 | September 30, 2018 | |||||||
| CASH FLOWS FROM OPERATING ACTIVITIES: | ||||||||
| Net income (loss) | $ | 361,811 | $ | (1,418,879 | ) | |||
| Adjustments to reconcile net income to net cash provided by operating activities | ||||||||
| Depreciation and amortization | 6,443,422 | 2,271,599 | ||||||
| Impairments | 44,544 | 24,854 | ||||||
| Allowance for doubtful accounts | 15,366 | (7,093 | ) | |||||
| Deferred taxes | 50,693 | - | ||||||
| Share of loss after tax of the Affiliate Company | 22,883,126 | 79,592 | ||||||
| Gain from equity dilution in the Affiliate Company | (4,291,974 | ) | - | |||||
| Gain from equity sale in the Affiliate Company | (20,574,217 | ) | - | |||||
| Change in fair value of contingent consideration | (694,000 | ) | (1,814,326 | ) | ||||
| Stock compensation cost | 1,337,333 | 253,934 | ||||||
| Changes in operating assets and liabilities: | ||||||||
| (Increase) Decrease In: | ||||||||
| Accounts receivable | (36,822,184 | ) | (52,845,923 | ) | ||||
| Deferred taxes assets | - | (52,126 | ) | |||||
| Notes receivable | 174,881 | 491,272.00 | ||||||
| Notes receivable from the Affiliate Company and related party | 437,203 | 3,196,340 | ||||||
| Inventories | (14,813,147 | ) | 1,555,993 | |||||
| Other receivables and other assets | (17,275,954 | ) | 1,497,230 | |||||
| Due from employee | (25,861 | ) | 945 | |||||
| Advances to supplier and prepayments and prepaid expenses | 1,357,001 | (4,590,404 | ) | |||||
| Amount due from the Affiliate Company | 30,549,072 | (81,549,214 | ) | |||||
| Amount due from Affiliate Company-Long term | - | 15,907,183 | ||||||
| Due from related party | - | 161,874 | ||||||
| Increase (Decrease) In: | ||||||||
| Accounts payable | 11,383,411 | 101,684,965 | ||||||
| Other payables and accrued liabilities | 7,791,028 | 29,845,307 | ||||||
| Notes payable | (11,836,950 | ) | (12,434,813 | ) | ||||
| Customer deposits | (59,734 | ) | 20,350 | |||||
| Income tax payable | (1,803,574 | ) | (2,353,826 | ) | ||||
| Deferred income | (56,448 | ) | (761,643 | ) | ||||
| Net cash used in operating activities | $ | (25,425,152 | ) | $ | (836,809 | ) | ||
| CASH FLOWS FROM INVESTING ACTIVITIES: | ||||||||
| Purchases of property, plant and equipment, net | (955,670 | ) | (304,745 | ) | ||||
| Purchases of land use rights and other intangible assets | - | (105,480 | ) | |||||
| Acquisition of Jinhua An Kao (net of cash received) | - | (3,610,846 | ) | |||||
| Acquisition of SC Autosports | - | 486,954 | ||||||
| Purchases of construction in progress | (18,491 | ) | (425,241 | ) | ||||
| Reimbursement of capitalize interests for construction in progress | - | 1,818,390 | ||||||
| Cash received from equity sale in the Affiliate Company | 32,061,558 | - | ||||||
| Long Term Investment | - | 1,458,464 | ||||||
| Net cash provided by (used in) investing activities | $ | 31,087,397 | $ | (682,504 | ) | |||
| CASH FLOWS FROM FINANCING ACTIVITIES: | ||||||||
| Proceeds from short-term bank loans | 27,864,409 | 25,515,452 | ||||||
| Repayments of short-term bank loans | (26,261,331 | ) | (26,283,065 | ) | ||||
| Repayments of long-term bank loans | (145,734 | ) | (153,523 | ) | ||||
| Proceeds from notes payable | - | 40,313,800 | ||||||
| Repayment of notes payable | - | (43,024,633 | ) | |||||
| Cash used for stock buyback | (2,492,579 | ) | - | |||||
| Net cash used in financing activities | $ | (1,035,235 | ) | $ | (3,631,969 | ) | ||
| NET INCREASE (DECREASE) IN CASH AND CASH EQUIVALENTS AND RESTRICTED CASH | 4,627,010 | (5,151,282 | ) | |||||
| Effect of exchange rate changes on cash | (928,440 | ) | (512,545 | ) | ||||
| CASH AND CASH EQUIVALENTS AND RESTRICTED CASH AT BEGINNING OF YEAR | 22,353,071 | 16,110,496 | ||||||
| CASH AND CASH EQUIVALENTS AND RESTRICTED CASH AT END OF PERIOD | 26,051,641 | 10,446,669 | ||||||
| -CASH AND CASH EQUIVALENTS AT END OF PERIOD | 14,338,637 | 1,342,085 | ||||||
| -RESTRICTED CASH AT END OF PERIOD | 11,713,004 | 9,104,584 | ||||||
| SUPPLEMENTARY CASH FLOW INFORMATION | ||||||||
| Income taxes paid | 1,711,101 | 1,981,072 | ||||||
| Interest paid | 1,304,062 | 1,274,399 | ||||||
| SUPPLEMENTAL NON-CASH DISCLOSURES: | ||||||||
| Acquisition of Jinhua An Kao by stock | - | 20,718,859 | ||||||
| Acquisition of SC Autosports by stock | - | 756,664 | ||||||
| Amount due from the Affiliate Company converted to investment in the Affiliate Company | - | 83,669,804 | ||||||
| Notes receivable from unrelated parties for equity transfer payment | 43,137,369 | - | ||||||
See accompanying notes to condensed consolidated financial statements
KANDI TECHNOLOGIES GROUP, INC.AND SUBSIDIARIES
CONDENSED CONSOLIDATED STATEMENTS OF CASH FLOWS
(UNAUDITED)
| Nine Months Ended | ||||||||
| September 30, 2018 | September 30, 2017 | |||||||
| CASH FLOWS FROM OPERATING ACTIVITIES: | ||||||||
| Net (loss) | $ | (1,418,879 | ) | $ | (33,793,376 | ) | ||
| Adjustments to reconcile net income to net cash provided by operating activities | ||||||||
| Depreciation and amortization | 2,271,599 | 3,556,661 | ||||||
| Assets impairments | 78,415 | 136,936 | ||||||
| Allowance for doubtful accounts | (7,093 | ) | - | |||||
| Deferred taxes | - | (5,596,103 | ) | |||||
| Share of income after tax of JV Company | 79,592 | 13,455,786 | ||||||
| Reserve for fixed assets | (53,561 | ) | - | |||||
| Change in fair value of contingent consideration | (1,814,326 | ) | - | |||||
| Stock compensation cost | 253,934 | 5,498,183 | ||||||
| Changes in operating assets and liabilities, net of effects of acquisition: | ||||||||
| (Increase) Decrease In: | ||||||||
| Accounts receivable | (52,845,923 | ) | (8,926,990 | ) | ||||
| Deferred taxes assets | (52,126 | ) | - | |||||
| Notes receivable | 491,272 | - | ||||||
| Notes receivable from JV Company and related party | 3,196,340 | 4,923,967 | ||||||
| Inventories | 1,555,993 | (2,814,129 | ) | |||||
| Other receivables and other assets | 1,497,230 | 754,661 | ||||||
| Due from employee | 945 | (10,766 | ) | |||||
| Advances to supplier and prepayments and prepaid expenses | (4,590,404 | ) | 23,878,150 | |||||
| Advances to suppliers-long term | - | (4,804,200 | ) | |||||
| Amount due from JV Company | (81,549,214 | ) | (33,071,177 | ) | ||||
| Amount due from JV Company-long-term | 15,907,183 | (15,907,183 | ) | |||||
| Due from related party | 161,874 | 4,406,105 | ||||||
| Increase (Decrease) In: | ||||||||
| Accounts payable | 101,684,965 | 53,102,716 | ||||||
| Other payables and accrued liabilities | 29,845,307 | 2,173,413 | ||||||
| Notes payable | (12,434,813 | ) | (3,933,839 | ) | ||||
| Customer deposits | 20,350 | 80,057 | ||||||
| Income tax payable | (2,353,826 | ) | 732,405 | |||||
| Deferred income | (761,643 | ) | (5,127,455 | ) | ||||
| Loss contingency-litigation | - | 587,579 | ||||||
| Net cash used in operating activities | $ | (836,809 | ) | $ | (698,599 | ) | ||
| CASH FLOWS FROM INVESTING ACTIVITIES: | ||||||||
| Purchases of property, plant and equipment, net | $ | (304,745 | ) | $ | (420,037 | ) | ||
| Purchases of land use rights and other intangible assets | (105,480 | ) | - | |||||
| Acquisition of Jinhua An Kao (net of cash received) | (3,610,846 | ) | - | |||||
| Acquisition of SC Autosports (net of cash received) | 486,954 | - | ||||||
| Purchases of construction in progress | (425,241 | ) | (1,565,244 | ) | ||||
| Reimbursement of capitalize interests for construction in progress | 1,818,390 | - | ||||||
| Long Term Investment | 1,458,464 | - | ||||||
| Short term investment | - | 4,553,734 | ||||||
| Net cash (used in) provided by investing activities | $ | (682,504 | ) | $ | 2,568,453 | |||
| CASH FLOWS FROM FINANCING ACTIVITIES: | ||||||||
| Proceeds from short-term bank loans | $ | 25,515,452 | $ | 24,854,574 | ||||
| Repayments of short-term bank loans | (26,283,065 | ) | (27,939,362 | ) | ||||
| Repayments of long-term bank loans | (153,523 | ) | - | |||||
| Proceeds from notes payable | 40,313,800 | 13,367,413 | ||||||
| Repayment of notes payable | (43,024,633 | ) | (14,060,961 | ) | ||||
| Net cash used in financing activities | $ | (3,631,969 | ) | $ | (3,778,336 | ) | ||
| NET (DECREASE) IN CASH AND CASH EQUIVALENTS AND RESTRICTED CASH | $ | (5,151,282 | ) | $ | (1,908,482 | ) | ||
| Effect of exchange rate changes on cash | $ | (512,545 | ) | $ | 1,011,615 | |||
| CASH AND CASH EQUIVALENTS AND RESTRICTED CASH AT BEGINNING OF YEAR | $ | 16,110,496 | $ | 25,193,298 | ||||
| CASH AND CASH EQUIVALENTS AND RESTRICTED CASH AT END OF PERIOD | $ | 10,446,669 | $ | 24,296,431 | ||||
| SUPPLEMENTARY CASH FLOW INFORMATION | ||||||||
| Income taxes paid | $ | 1,981,072 | $ | 1,072,082 | ||||
| Interest paid | $ | 1,274,399 | $ | 1,164,774 | ||||
| SUPPLEMENTAL NON-CASH DISCLOSURES: | ||||||||
| Construction in progress transferred to property, plant and equipment | $ | 75,266,352 | $ | - | ||||
| Long term and short term advances to suppliers transferred to construction in progress | $ | 31,786,196 | $ | 12,241,736 | ||||
| Settlement of due from JV Company and related parties with notes receivable | $ | 62,549,758 | $ | 39,197,964 | ||||
| Settlement of accounts receivables with notes receivable from unrelated parties | $ | 49,620,953 | $ | 1,150,038 | ||||
| Settlement of other receivables with notes receivable from unrelated parties | $ | 930,347 | $ | - | ||||
| Assignment of notes receivable from unrelated parties to supplier to settle accounts payable | $ | 20,126,196 | $ | 1,150,038 | ||||
| Assignment of notes receivable from JV Company and related parties to supplier to settle accounts payable | $ | 57,956,363 | $ | 33,175,103 | ||||
| Assignment of notes receivable from unrelated parties to supplier to settle other payable | $ | 29,857,070 | $ | - | ||||
| Assignment of notes receivable from JV Company and related parties to supplier to settle other payable | $ | 230,284 | $ | - | ||||
| Settlement of accounts payable with notes payables | $ | 23,846,161 | $ | 15,149,150 | ||||
| Acquisition of Jinhua An Kao by stock | $ | 20,718,859 | $ | - | ||||
| Acquisition of SC by stock | $ | 756,664 | $ | - | ||||
| Cancellation of notes payables | $ | 10,746,580 | $ | - | ||||
| Amount due from JV Company converted to investment in JV Company | $ | 83,669,804 | $ | - | ||||
| Adjustment of construction in progress with accounts payable | $ | 8,153,573 | $ | - | ||||
| Adjustment of advance to supplier with accounts payable | $ | 479,575 | $ | - | ||||
| Deferred tax changed to other comprehensive income | $ | - | $ | 52,266 | ||||
| Adjustment of Construction in progress | $ | - | $ | 1,057,152 | ||||
| Purchase of construction in progress in accounts payable | $ | - | $ | 6,244,120 | ||||
See accompanying notes to condensed consolidated financial statements
NOTE 1 - ORGANIZATION AND PRINCIPAL ACTIVITIES
Kandi Technologies Group, Inc. (“Kandi Technologies”) was incorporated under the laws of the State of Delaware on March 31, 2004 as Stone Mountain Resources, Inc. It changed its name to Kandi Technologies, Corp. on August 13, 2007, and on December 21, 2012, it further changed its name to its current name.2004. As used herein, the term theterms “Company” meansor “Kandi” refer to Kandi Technologies and its operating subsidiaries, as described below.
Headquartered in Jinhua City, Zhejiang Province, People’s Republic of China (“China”), the Company is one of the People’s Republic of China’s (“China”) leading producers and manufacturers of electric vehicle (“EV”) products (through the Affiliate Company, formerly defined as the JV Company), EV parts, and off-road vehicles for sale in ChinaChinese and global markets. The Company conducts its primary business operations through its wholly-owned subsidiaries, Zhejiang Kandi Vehicles Co., Ltd. (“Kandi Vehicles”), Kandi Vehicles’ wholly and Sportsman Country, LLC (“Sportsman Country”) which changed its name to SC Autosports LLC (“SC Autosports”) in August 2018,partially-owned subsidiaries, and the partially and wholly-owned subsidiaries of Kandi Vehicles.
The Company’s organizational chart as of November 6, 2018 is as follows:
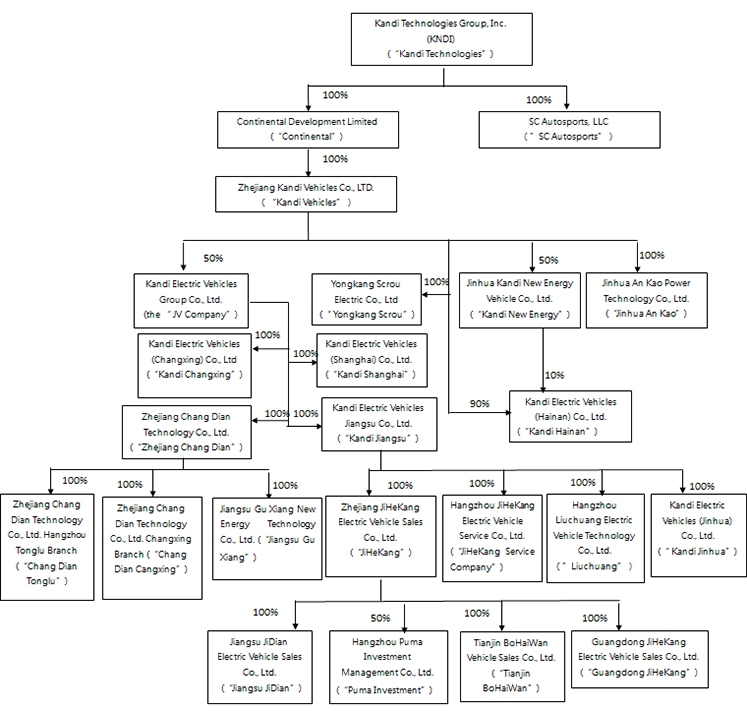
Operating Subsidiaries:
Pursuant to the agreements executed in January 2011, Kandi Vehicles is entitled to 100% of the economic benefits, voting rights and residual interests (100% of profits and losses) of Jinhua Kandi New Energy Vehicles Co., Ltd. (“Kandi New Energy”). Kandi New Energy currently holds battery pack production licensing rights and supplies battery packs to the JV Company (as such term is defined below).
In April 2012, pursuant to an agreement with the shareholders of YongkangScrou Electric Co, Ltd. (“YongkangScrou”), the Company acquired 100% of YongkangScrou, a manufacturer of automobile and EV parts. YongkangScrou currently manufactures and sells EV drive motors, EV controllers, air conditioners and other electric products to the JV Company.
In March 2013, pursuant to a joint venture agreement (the “JV Agreement”) entered into by Kandi Vehicles and Shanghai Maple Guorun Automobile Co., Ltd. (“Shanghai Guorun”), a 99%-owned subsidiary of Geely Automobile Holdings Ltd. (“Geely”), the parties established Zhejiang Kandi Electric Vehicles Co., Ltd. (the “JV Company”) to develop, manufacture and sell EV products and related auto parts. Each of Kandi Vehicles and Shanghai Guorun has 50% ownership interest in the JV Company. In March 2014, the JV Company changed its name to Kandi Electric Vehicles Group Co., Ltd. At present, the JV Company is a holding company and all products are manufactured by its subsidiaries. In an effort to improve the JV Company’s development, Zhejiang Geely Holding Group, the parent company of Geely, became a JV Company shareholder on October 26, 2016, through its purchase of the 50% equity of the JV Company held by Shanghai Guorun at a premium price (a price exceeding the cash amount of the aggregate of the original investment and the shared profits over the years). On May 19, 2017, due to business development, Zhejiang Geely Holding Group, Ltd. (Geely Holding) transferred its equity in the JV Company to Geely Group (Ningbo) Ltd., a company wholly owned by Mr. Li Shufu, Chairman of the Board of Geely Holding. On May 23, 2018, in order to obtain the manufacturing license, according to the recent notice (FGBCY[2018] No.547) from the National Development and Reform Commission in China, the JV Company increased its registered capital by RMB 1.09 billion (approximately $165 million), of which Kandi Vehicle increased its capital contribution to the JV Company by converting its RMB 545 million (approximately $79 million) loans to the JV Company to registered capital in the JV Company. Geely Group, Ltd. (“Geely Group”) became a new shareholder of the JV Company by investing RMB 545 million (approximately $79million). After this restructure, Kandi Vehicles, Geely Group and Geely Group (Ningbo) Ltd., each own 50%, 26.08%, and 23.92% of equity in the JV Company, respectively.
In March 2013, Kandi Vehicles formed Kandi Electric Vehicles (Changxing) Co., Ltd. (“KandiChangxing”) in the Changxing (National) Economic and Technological Development Zone. KandiChangxing is engaged in the production of EV products. In the fourth quarter of 2013, Kandi Vehicles entered into an ownership transfer agreement with the JV Company pursuant to which Kandi Vehicles transferred 100% of its ownership in KandiChangxing to the JV Company. The Company, indirectly through its 50% ownership interest in the JV Company, has a 50% economic interest in KandiChangxing.
In July 2013, Zhejiang ZuoZhongYou Electric Vehicle Service Co., Ltd. (the “Service Company”) was formed. The Service Company is engaged in various pure EV leasing businesses, generally referred to as the Micro Public Transportation (“MPT”) and other EV share programs. Kandi Vehicle had a 9.5% ownership interest in the Service Company. After various tests and thorough assessments in the last five years, the Company determined that a large sum of capital still needs to be invested in order to increase the size of EV share programs. After considering Geely Group’s ability to grow the Service Company’s business to be stronger and more expansive and a successful growth of the Service Company would have positive impact on the development of the JV Company’s business, Kandi Vehicle transferred its 9.5% of ownership interest in the Service Company to Geely Group in June 2018.
In November 2013, Kandi Electric Vehicles Jinhua Co., Ltd. (“Kandi Jinhua”) was formed by the JV Company. The JV Company has a 100% ownership interest in Kandi Jinhua, and the Company, indirectly through its 50% ownership interest in the JV Company, has a 50% economic interest in Kandi Jinhua. In April 2017, Kandi Jinhua was reorganized to be owned directly by Kandi Jiangsu, which is 100% directly owned by the JV Company.
In November 2013, Zhejiang Ji He Kang Electric Vehicle Sales Co., Ltd. (“Ji He Kang”) was formed by the JV Company. JiHeKang is engaged in the car sales business. The JV Company has a 100% ownership interest in JiHeKang, and the Company, indirectly through its 50% ownership interest in the JV Company, has a 50% economic interest in JiHeKang. In April 2017, JiHeKang was reorganized to be owned directly by Kandi Jiangsu, which is 100% directly owned by the JV Company.
In December 2013, the JV Company entered into an ownership transfer agreement with Shanghai Guorun, pursuant to which the JV Company acquired a 100% ownership interest in Kandi Electric Vehicles (Shanghai) Co., Ltd. (“Kandi Shanghai”). As a result, Kandi Shanghai is a wholly-owned subsidiary of the JV Company, and the Company, indirectly through its 50% ownership interest in the JV Company, has a 50% economic interest in Kandi Shanghai.
In January 2014, KandiElectric Vehicles Jiangsu Co., Ltd. (“Kandi Jiangsu”) was formed by the JV Company. The JV Company has a 100% ownership interest in Kandi Jiangsu, and the Company, indirectly through its 50% ownership interest in the JV Company, has a 50% economic interest in Kandi Jiangsu. Kandi Jiangsu is mainly engaged in EV research and development, manufacturing, and sales. As of the date of this report, Kandi Jiangsu directly owns 100% of JiHeKang, JiHeKang Service Company, Liuchuang and KandiJinhua.
In November 2015, Hangzhou Puma Investment Management Co., Ltd. (“Puma Investment”) was formed by the JV Company. Puma Investment provides investment and consulting services. The JV Company has a 50% ownership interest in Puma Investment (the other 50% is owned by Zuozhongyou Electric Vehicles Service (Hangzhou) Co., Ltd., a subsidiary of the Service Company), and the Company, indirectly through the JV Company, has a 25% economic interest in Puma Investment.
In November 2015, Hangzhou JiHeKang Electric Vehicle Service Co., Ltd. (the “JiHeKang Service Company”) was formed by the JV Company. The JiHeKang Service Company focuses on after-market services for EV products. In April 2017, JiHeKang Service Company was reorganized to be owned directly by Kandi Jiangsu, which is 100% directly owned by the JV Company. The JV Company has a 100% ownership interest in the JiHeKang Service Company, and the Company, indirectly through the JV Company, has a 50% economic interest in the JiHeKang Service Company.
In December 2015, Zhejiang JiHeKang Electric Vehicle Sales Co., Ltd. Tianjin Branch (“JiHeKang Tianjin”) was formed by JiHeKang. JiHeKang Tianjin was engaged in the car sales business. JiHeKang Tianjin was dissolved in September 2018.
In January 2016, Kandi Electric Vehicles (Wanning) Co., Ltd. was renamed Kandi Electric Vehicles (Hainan) Co., Ltd. (“Kandi Hainan”). Kandi Hainan was originally formed in Wanning City in Hainan Province by Kandi Vehicles and Kandi New Energy in April 2013, and was transferred to Haikou City in January 2016. Kandi Vehicles has a 90% ownership interest in Kandi Hainan, and Kandi New Energy has the remaining 10% ownership interest. In fact, Kandi Vehicles is, effectively, entitled to 100% of the economic benefits, voting rights and residual interests (100% of the profits and losses) of Kandi Hainan as Kandi Vehicles is entitled to 100% of the economic benefits, voting rights and residual interests of Kandi New Energy.
In August 2016, Jiangsu JiDian Electric Vehicle Sales Co., Ltd. (“Jiangsu JiDian”) was formed by JiHeKang. Jiangsu JiDian is engaged in the car sales business. Since JiHeKang is 100% owned by the JV Company, the JV Company has a 100% ownership interest in Jiangsu JiDian, and the Company, indirectly through its 50% ownership interest in the JV Company, has a 50% economic interest in Jiangsu JiDian.
In October 2016, JiHeKang acquired Tianjin BoHaiWan Vehicle Sales Co., Ltd. (“Tianjin BoHaiWan”), which is engaged in the car sales business. Since JiHeKang is 100% owned by the JV Company, the JV Company has a 100% ownership interest in Tianjin BoHaiWan, and the Company, indirectly through its 50% ownership interest in the JV Company, has a 50% economic interest in Tianjin BoHaiWan.
In November 2016, Changxing Kandi Vehicle Maintenance Co., Ltd. (“Changxing Maintenance”) was formed by Kandi Changxing. Changxing Maintenance is engaged in the car repair and maintenance business. In December 2017, the Service Company entered into an agreement with the JV Company to acquire 100% of Changxing Maintenance for RMB 1,089,887 or approximately $167,501. The transaction was completed in April 2018.
In November 2016, Guangdong JiHeKang Electric Vehicle Sales Co., Ltd. (“Guangdong JiHeKang”) was formed by JiHeKang. Guangdong JiHeKang is engaged in the car sales business. Since JiHeKang is 100% owned by the JV Company, the JV Company has a 100% ownership interest in Guangdong JiHeKang, and the Company, indirectly through its 50% ownership interest in the JV Company, has a 50% economic interest in Guangdong JiHeKang.
In March 2017, Hangzhou Liuchuang Electric Vehicle Technology Co., Ltd. (“Liuchuang”) was formed by Kandi Jiangsu. Since Kandi Jiangsu is 100% owned by the JV Company, the JV Company has a 100% ownership interest in Liuchuang, and the Company, indirectly through its 50% ownership interest in the JV Company, has a 50% economic interest in Liuchuang.
In April 2017, in order to promote business development, KandiJinhua, JiHeKang, and the JiHeKang Service Company were reorganized to become subsidiaries of Kandi Jiangsu. As the JV Company has a 100% ownership interest in Kandi Jiangsu, the JV Company has 100% ownership interests in KandiJinhua, JiHeKang, and the JiHeKang Service Company; the Company, indirectly through its 50% ownership interest in the JV Company, has a 50% economic interest in Kandi Jinhua, JiHeKang, and the JiHeKang Service Company.
In December 2017, Zhejiang Chang Dian Technology Co., Ltd. (“Zhejiang Chang Dian”) was formed by the JV Company. Zhejiang Chang Dian is primarily engaged in the battery replacement business. Since Zhejiang Chang Dian is 100% owned by the JV Company, and the Company, indirectly through its 50% ownership interest in the JV Company, has a 50% economic interest in Zhejiang Chang Dian.
In December 2017, Kandi Vehicles and the sole shareholder of Jinhua An Kao Power Technology Co., Ltd. (“Jinhua An Kao”) entered into a Share Transfer Agreement and a Supplementary Agreement, pursuant to which Kandi Vehicles acquired Jinhua An Kao. The two agreements were signed on December 12, 2017 and the closing took place on January 3, 2018. Kandi Vehicles acquired 100% of the equity interests of Jinhua An Kao for a purchase price of approximately RMB 25.93 million (approximately $3.9 million) in cash. In addition, pursuant to the Supplementary Agreement, the Company issued a total of 2,959,837 shares of restrictive stock, or 6.2% of the Company’s total outstanding shares of the common stock to the shareholder of Jinhua An Kao. An additional 2,959,837 shares were placed as make good shares for the undertaking of Jinhua An Kao to achieve no less than a total of RMB 120,000,000 (approximately $18.1 million) net income over the course of the following three years. The Supplementary Agreement set forth the terms and conditions of the issuance of these shares, including that the Company will have the voting rights of the make good shares until conditions for vesting those shares are satisfied.
In March 2018, Jiangsu Gu Xiang New Energy Technology Co., Ltd. (“Jiangsu Gu Xiang”) was formed by Zhejiang Chang Dian. Jiangsu Gu Xiang is primarily engaged in technical research, development, services and consultation of new energy vehicles, battery replacement and maintenance, and other business.
In April 2018, Zhejiang Chang Dian Technology Co., Ltd. Hangzhou Tonglu Branch (“Chang Dian Tonglu”) was formed by Zhejiang Chang Dian. Chang Dian Tonglu is primarily engaged in the battery replacement business.
In April 2018, Zhejiang Chang Dian Technology Co., Ltd. Changxing Branch (“Chang Dian Changxing”) was formed by Zhejiang Chang Dian. Chang Dian Changxing is primarily engaged in the battery replacement business.
On May 31, 2018, the Company entered into a Membership Interests Transfer Agreement (the “Transfer Agreement”) with the two members of Sportsman Country, LLC (“Sportsman Country”) under which the Company acquired 100% of the ownership of Sportsman Country. Sportsman Country is a Dallas based sales company primarily engaged in the wholesale of off-road vehicle products, with a small percentage of business in off-road vehicle parts wholesale and retail. According to the terms of the Transfer Agreement, the Company transferred $10.0 million worth of restricted shares to acquire 100% membership interests in Sportsman Country, of which the Company was required to issue $1.0 million worth of corresponding restricted shares within 30 days from the signing date of the Transfer Agreement, and the remaining $9.0 million worth of corresponding restricted shares to be released from escrow based on Sportsman Country’s pre-tax profit performance over the course of the following three years. The transaction closed in July 2018.In August 2018, Sportsman Country changed its name to SC Autosports LLC (“SC Autosports”).
The Company’s organizational chart as of September 30, 2019 is as follows:
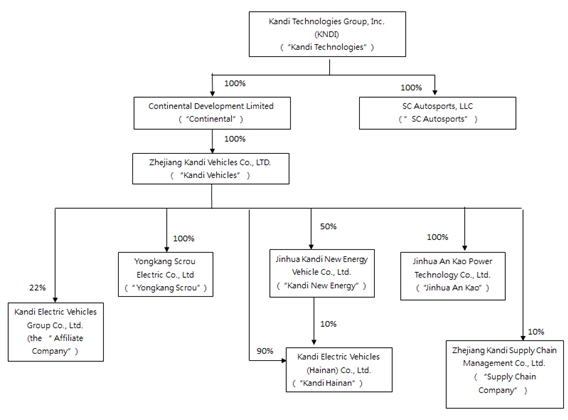
On March 21, 2019, Kandi Vehicle signed an Equity Transfer Agreement (the “Transfer Agreement”) with Geely Technologies Group Co., Ltd. (“Geely”) to transfer certain equity interests in the Kandi Electric Vehicles Group Co., Ltd. (the “Affiliate Company”, formerly defined as the “JV Company”) to Geely. Pursuant to the Transfer Agreement, the Affiliate Company converted a loan of RMB 314 million (approximately $46.7 million) from Geely last year to equity in order to increase its cash flow. As a result, the registered capital of the Affiliate Company became RMB 2.40 billion (approximately $336.3 million), of which Kandi Vehicles then owned 43.47% and Geely owned 56.53%, respectively, upon the conversion of the loan into equity in the Affiliate Company. After that, Kandi Vehicles further agreed to sell 21.47% of its equity interests in the Affiliate Company to Geely for a total amount of RMB 516 million (approximately $72.3 million). As of September 29, 2019, Kandi Vehicles has received payments in cash totaling RMB 220 million (approximately $30.9 million) and certain commercial acceptance notes of RMB 296 million (approximately $41.6 million), of which RMB 140 million (approximately $19.7 million) shall mature on January 20, 2020 and the remaining RMB 156 million (approximately $21.9 million) shall mature on March 29, 2020. As a result of the completion of the equity transfer on September 29, 2019, Kandi Vehicles now owns 22% and Geely and its affiliates own 78% of the equity interests of the Affiliate Company. As now the Company only owns 22% of the JV Company, it was redefined as the Affiliate Company.
The Company’s primary business operations areconsist of designing, developing, manufacturing and commercializing EV products (through Kandi Electric Vehicles (Hainan) Co., Ltd. and the Affiliate Company), EV parts and off-road vehicles. As part of its strategic objective of becoming a leading manufacturer of EV products (through the JVAffiliate Company) and related services, the Company has increased its focus on pure EV-related products, and is actively pursuing expansion in the China marketChinese and international markets, especially the U.S. market.
NOTE 2 - LIQUIDITY
The Company had a working capital deficit of $12,186,911$80,374,159 as of September 30, 2018, a decrease2019, an increase of $65,894,813$77,847,248 from a working capital surplus of $53,707,902$2,526,911 as of December 31, 2017.
2018. As of September 30, 2019 and December 31, 2018, the Company’s cash and cash equivalents was $14,338,637 and $ 15,662,201, respectively, the Company’s restricted cash was $11,713,004 and $6,690,870, respectively.
During the first quarter of 2019, the Company had credit lines availablesigned an agreement to sell 21.47% of its equity interests in the Affiliate Company to Geely for a total amount of RMB 516 million (approximately $72.3 million). As of September 29, 2019, the Company has received payments in cash totaling RMB 220 million (approximately $30.9 million) and certain commercial acceptance notes of RMB 296 million (approximately $41.6 million) from commercial banksGeely, of $30,583,267. which RMB 140 million (approximately $19.7 million) shall mature on January 20, 2020 and the remaining RMB 156 million (approximately $21.9 million) shall mature on March 29, 2020. The Company plans to apply the proceeds from the equity transfer to its ongoing operations. The cash flow and operating capacity of the Company will be greatly improved after receiving the above payments.
Although the Company expects that most of its outstanding trade receivables from customers will be collected in the next twelve months, there are uncertainties aboutwith respect to the timing in collecting these receivables, especially the receivables due from the JVAffiliate Company, because most of them are indirectly impacted by the progress of the receipt of government subsidies. Since the amount due from the JV Company accounts for the majority of the Company’s outstanding receivables, and since the Company cannot control the timing of the receipt of government subsidies, the Company believes that its internally-generated cash flows may not be sufficient to support the growth of future operations and to repay short-term bank loans for the next twelve months. However, the Company believes its access to existing financing sources and its good credit will enable it to meet its obligations and fund its ongoing operations for the next twelve months. The Company expects to approximately maintain the current debt level for the next twelve months given the Company’s current financial position and business development needs.
The Company’s primary need for liquidity isstems from its need to fund working capital requirements of the Company’s businesses, its capital expenditures and forits general operational purposes,operations, including debt repayment. The Company has incurred losses and experienced negative operating cash flows for the past two years, and accordingly, the Company has taken a number of actions to continue to support its operations and meet its obligations. The Company has historically financed its operations through short-term commercial bank loans from Chinese banks. The term of these loans is typically for one year, and upon the payment of all outstanding principal and interest on a particular loan, the banks, have typically rolled over the loan for an additional one-year term, with adjustments made to the interest rate to reflect prevailing market rates. This practice has been ongoing and the Company believes that short-term bank loans will remain available on normal trade terms if needed. For the remainder of 2018, the management will take measures to grow the business and further improve the Company’s liquidity. The Company acknowledges that it continues to face a challenging competitive environment and expects to take actions that will enhance the Company’s liquidity and financial flexibility to support the Company’s operation needs.
We finance ouras well as its ongoing operating activities by using funds from our operations, and external credit or financing arrangements. WeThe Company routinely monitormonitors current and expected operational requirements and financial market conditions to evaluate the use of available financing sources. Considering ourthe existing working capital position and ourthe ability to access debt funding sources, we believethe management believes that ourthe Company’s operations and borrowing resources are sufficient to provide for ourits current and foreseeable capital requirements to support ourits ongoing operations for the next twelve months.
NOTE 3 - BASIS OF PRESENTATION
The Company maintains its general ledger and journals using the accrual method of accounting for financial reporting purposes. The Company’saccompanying unaudited condensed consolidated financial statements and notes are the representations of the Company’s management. Accounting policies adopted by the Company conform tohave been prepared in accordance with accounting principles generally accepted accounting principles in the United States of America (“U.S. GAAP”) for interim information, and havewith the instructions to Form 10-Q and Rule 10-01 of Regulation S-X promulgated by the Securities and Exchange Commission (“SEC”). Accordingly, they do not include all of the information and notes required by U.S. GAAP for annual financial statements. In the management’s opinion, the interim financial statements reflect all normal adjustments that are necessary to provide a fair presentation of the financial results for the interim periods presented. Operating results for interim periods are not necessarily indicative of results that may be expected for an entire fiscal year. The condensed consolidated balance sheet as of December 31, 2018 has been consistently applied inderived from the audited consolidated financial statements as of such date. For a more complete understanding of the Company’s presentation ofbusiness, financial position, operating results, cash flows, risk factors and other matters, please refer to its financial statements.Annual Report on Form 10-K for the fiscal year ended December 31, 2018 (the “2018 Form 10-K”).
NOTE 4 - PRINCIPLES OF CONSOLIDATION
The Company’s consolidated financial statements reflect the accounts of the Company and its ownership interests in the following subsidiaries:
| (1) | Continental Development Limited (“Continental”), a wholly-owned subsidiary of the Company incorporated under the laws of Hong Kong; |
| (2) | Kandi Vehicles, a wholly-owned subsidiary of Continental; |
| (3) | Jinhua Kandi New Energy Vehicles Co., Ltd. (“Kandi New Energy”), a 50%-owned subsidiary of Kandi Vehicles (Mr. Hu Xiaoming owns the other 50%). Pursuant to agreements executed in January 2011, Mr. Hu Xiaoming contracted with Kandi Vehicles for the operation and management of Kandi New Energy and put his shares of Kandi New Energy into escrow. As a result, Kandi Vehicles is entitled to 100% of the economic benefits, voting rights and residual interests of Kandi New Energy; |
| (4) | YongkangScrou Electric Co, Ltd. (“YongkangScrou”), a wholly-owned subsidiary of Kandi |
| (5) | Kandi |
| (6) | Jinhua An Kao Power Technology Co., Ltd. (“Jinhua An Kao”), a wholly-owned subsidiary of Kandi |
| (7) | SC Autosports, a wholly-owned subsidiary of the |
Equity Method Investees
The Company’s consolidated net income also includes the Company’s proportionate share of the net income or loss of its equity method investees as follows:
The Affiliate Company, a 22% owned subsidiary of Kandi Vehicles and its subsidiaries
All intra-entity profits and losses with regard to the Company’s equity method investees have been eliminated.
NOTE 5 - USE OF ESTIMATES
The preparation of financial statements in conformity with generally accepted accounting principles in the United States requires the Company’s management to make estimates and assumptions that affect the reported amounts of assets and liabilities and the disclosure of contingent assets and liabilities at the date of the consolidated financial statements, and the reported amounts of revenue and expenses during the reporting period. Management makes these estimates using the best information available at the time the estimates are made; however actual results when ultimately realized could differ from those estimates.
NOTE 6 - SUMMARY OF SIGNIFICANT ACCOUNTING POLICIES
The Company’s operations are conducted in China. As a result, the Company’s business, financial condition and results of operations may be influenced by the political, economic and legal environments in China, and by the general state of the Chinese economy. In addition, the Company’s earnings are subject to movements in foreign currency exchange rates when transactions are denominated in Renminbi (“RMB”), which is the Company’s functional currency. Accordingly, the Company’s operating results are affected by changes in the exchange rate between the U.S. dollar and the RMB.
The Company’s operationsOur significant accounting policies are detailed in China are subject to special considerations and significant risks not typically associated with companies in North America and Western Europe. These include risks associated with, among others, the political, economic and legal environment and foreign currency exchange restrictions. The Company’s performance may be adversely affected by changes in the political and social conditions in China, and by changes in governmental policies with respect to laws and regulations, anti-inflationary measures, currency conversion, remittances abroad, and rates and methods“Note 2 - Summary of taxation, among other things.
ASC 820 establishes a three-tier fair value hierarchy, which prioritizes the inputs used in measuring fair value. The hierarchy prioritizes the inputs into three levels based on the extent to which inputs used in measuring fair value are observable in the market.
These tiers include:
Level 1—defined as observable inputs such as quoted prices in active markets;
Level 2—defined as inputs other than quoted prices in active markets that are either directly or indirectly observable; and
Level 3—defined as unobservable inputs for which little or no market data exists, therefore requiring an entity to develop its own assumptions.
The Company’s financial instruments primarily consist of cash and cash equivalents, restricted cash, accounts receivable, notes receivable, other receivables, accounts payable, other payables and accrued liabilities, short-term bank loans, notes payable, and warrants.
The carrying value of cash and cash equivalents, restricted cash, accounts receivable, notes receivable, other receivables, accounts payable, other payables and accrued liabilities, and notes payable approximate fair value because of the short-term nature of these items. The estimated fair values of short-term bank loans were not materially different from their carrying value as presented due to the brief maturities and because the interest rates on these borrowings approximate those that would have been available for loans of similar remaining maturities and risk profiles. As the carrying amounts are reasonable estimates of fair value, these financial instruments are classified within Level 1 of the fair value hierarchy. The Company identified notes payable as Level 2 instruments due to the fact that the inputs to valuation are primarily based upon readily observable pricing information. The balance of notes payable, which was measured and disclosed at fair value, was $24,663,846 and $28,075,945 at September 30, 2018 and December 31, 2017, respectively.
Contingent consideration related to the acquisitions of Jinhua An Kao and SC Autosports, which is accounted for as liabilities, are measured at each reporting date for their fair value using Level 3 inputs. The fair value of contingent consideration was $12,204,964 and $0 at September 30, 2018 and December 31, 2017, respectively. Also see Note 26.
The Company considers highly-liquid investments purchased with original maturities of three months or less to be cash equivalents.
As of September 30, 2018, and December 31, 2017, the Company’s restricted cash was $9,104,584 and $11,218,688, respectively.
Inventories are stated at the lower of cost or net realizable value (market value). The cost of raw materials is determined on the basis of weighted average. The cost of finished goods is determined on the basis of weighted average and comprises direct materials, direct labor and an appropriate proportion of overhead.
Net realizable value is based on estimated selling prices less selling expenses and any further costs expected to be incurred for completion. Adjustments to reduce the cost of inventory to net realizable value are made, if required, for estimated excess, obsolescence, or impaired balances.
Accounts receivable are recognized and carried at net realizable value. An allowance for doubtful accounts is recorded for periods in which the Company determines a loss is probable, based on its assessment of specific factors, such as troubled collections, historical experience, accounts aging, ongoing business relations and other factors. Accounts are written off after exhaustive collection efforts. If accounts receivable are to be provided for, or written off, they are recognized in the consolidated statement of operations within the operating expenses line item. If accounts receivable previously written off is recovered in a later period or when facts subsequently become available to indicate that the amount provided as an allowance for doubtful accounts was incorrect, an adjustment is made to restate allowance for doubtful accounts.
As of September 30, 2018 and December 31, 2017, credit terms with the Company’s customers were typically 180 to 360 days after delivery. As of September 30, 2018 and December 31, 2017, the Company had a $319,421and $133,930 allowance for doubtful accounts, as per the Company management’s judgment based on their best knowledge. The Company conducts quarterly assessments of the state of the Company’s outstanding receivables and reserves any allowance for doubtful accounts if it becomes necessary.
Notes receivable represent short-term loans to third parties with maximum terms of six months. Interest income is recognized according to each agreement between a borrower and the Company on an accrual basis. For notes receivable with banks, the interest rates are determined by banks. For notes receivable with other parties, the interest rates are based on agreements between the parties. If notes receivable are paid back, that transaction will be recognized in the relevant year. If notes receivable are not paid back, or are written off, that transaction will be recognized in the relevant year if default is probable, reasonably assured, and the loss can be reasonably estimated. The Company will recognize income if the written-off loan is recovered at a future date. In case of any foreclosure proceedings or legal actions, the Company provides an accrual for the related foreclosure and litigation expenses. The Company also receives notes receivable from the JV Company and other parties to settle accounts receivable. If the Company decides to discount notes receivable for the purpose of receiving immediate cash, the current discount rate is approximately in the range of 4.80% to 5.00% annually. As of September 30, 2018 and December 31, 2017, the Company had notes receivable from unrelated parties of $72,817 and $0, respectively, which notes receivable typically mature within six months. As of September 30, 2018 and December 31, 2017, the Company had notes receivable from JV Company and other related parties of $2,184,519 and $1,137,289, respectively, which notes receivable typically mature within six months.
Advances to suppliers represent cash paid in advance to suppliers, and include advances to raw material suppliers, mold manufacturers, and equipment suppliers.
As of September 30, 2018, the Company had made a total advance payments of RMB 756 million (approximately $110 million) to Nanjing Shangtong Auto Technologies Co., Ltd. (“Nanjing Shangtong”) as an advance to purchase a production line and develop a new EV model for Kandi Hainan. Nanjing Shangtong is a total solutions contractor for Kandi Hainan and provides all the equipment and EV product design and research services used by Kandi Hainan. After a portion of such advances were transferred to construction in progress and expensed for R&D purposes, the Company had $3,924,501 left in Advance to Suppliers in current assets related to the purchases from Nanjing Shangtong as of September 30, 2018.
Advances for raw material purchases are typically settled within two months of the Company’s receipt of the raw materials. Prepayment is offset against the purchase price after the equipment or materials are delivered.
Property, plants and equipment are carried at cost less accumulated depreciation. Depreciation is calculated over the asset’s estimated useful life using the straight-line method. Leasehold improvements are amortized over the life of the asset or the term of the lease, whichever is shorter. Estimated useful lives are as follows:
The costs and related accumulated depreciation of assets sold or otherwise retired are eliminated from the Company’s accounts and any gain or loss is included in the statements of income. The cost of maintenance and repairs is charged to expenses as incurred, whereas significant renewals and betterments are capitalized.
Construction in progress (“CIP”) represents the direct costs of construction, and the acquisition costs of buildings or machinery. Capitalization of these costs ceases, and construction in progress is transferred to plants and equipment, when substantially all the activities necessary to prepare the assets for their intended use are completed. No depreciation is provided for until the assets are completed and ready for their intended use. As of September 30, 2018, $2,854,673 of interest expenses previously capitalized for CIP have been reimbursed by the government.
Land in China is owned by the government and land ownership rights cannot be sold to an individual or to a private company. However, the Chinese government grants the user a “land use right” to use the land. The land use rights granted to the Company are amortized using the straight-line method over a term of fifty years.
The Company periodically evaluates the carrying value of long-lived assets to be held and used, including intangible assets subject to amortization, when events and circumstances warrant such a review, pursuant to the guidelines established in Statement of FinancialSignificant Accounting Standards (“SFAS”) No. 144 (now known as “ASC 360”). The carrying value of a long-lived asset is considered impaired when the anticipated undiscounted cash flow from such asset is separately identifiable and is less than its carrying value. In that event, a loss is recognized based on the amount by which the carrying value exceeds the fair market value of the long-lived asset. Fair market value is determined primarily using the anticipated cash flows discounted at a rate commensurate with the risk involved. Losses on long-lived assets to be disposed of are determined in a similar manner, except that fair market values are reduced for disposal costs.
The Company recognized no impairment loss during the reporting period.
The Company adopted ASC Topic 606 Revenue from Contracts with Customers with a date of the initial application of January 1, 2018 using the modified retrospective method. As a result, the Company has changed its accounting policy for revenue recognition. The impact of the adoption of ASC Topic 606 on the Company’s condensed consolidated financial statements is not material.
The Company recognizes revenue when goods or services are transferred to customers in an amount that reflects the consideration which it expects to receive in exchange for those goods or services. In determining when and how revenue is recognized from contracts with customers, the Company performs the following five-step analysis: (i) identification of contract with customer; (ii) determination of performance obligations; (iii) measurement of the transaction price; (iv) allocation of the transaction price to the performance obligations; and (v) recognition of revenue when (or as) the Company satisfies each performance obligation.
The Company generates revenue through the sale of EV products, EV parts and off-road vehicles. The revenue is recognized at a point in time once the Company has determined that the customer has obtained control over the product. Control is typically deemed to have been transferred to the customer when the performance obligation is fulfilled, usually at the time of delivery, at the net sales price (transaction price). Estimates of variable consideration, such as volume discounts and rebates, are determined, reviewed and revised periodically by management. Revenue is recognized net of any taxes collected from customers, which are subsequently remitted to governmental authorities. Shipping and handling costs for product shipments occur prior to the customer obtaining control of the goods are accounted for as fulfillment costs rather than separate performance obligations and recorded as sales and marketing expenses.
The Company’s contracts are predominantly short-term in nature with a contract term of one year or less. For those contracts, the Company has utilized the practical expedient in ASC Topic 606 exempting the Company from disclosure of the transaction price allocated to remaining performance obligations if the performance obligation is part of a contract that has an original expected duration of one year or less.
Receivables are recorded when the Company has an unconditional right to consideration.
See Note 24 “Segment Reporting” for disaggregation of revenue by reporting segments. The Company believes this disaggregation best depicts how the nature, amount, timing and uncertainty of revenue and cash flows are affected by economic factors.
Expenditures relating to the development of new products and processes, including improvements to existing products, are expensed as incurred. Research and development expenses were $5,691,649 and $657,851for the three months ended September 30, 2018, and September 30, 2017, respectively. Research and development expenses were $7,091,836 and $26,569,624 for the nine months ended September 30, 2018, and September 30, 2017, respectively.
Grants and subsidies received from the Chinese government are recognized when the proceeds are received or collectible and related milestones have been reached and all contingencies have been resolved.
For the three months ended September 30, 2018 and September 30, 2017, $607,008 and $474,950, respectively, were received by the Company’s subsidiaries from the Chinese government. For the nine months ended September 30, 2018 and September 30, 2017, $717,821 and $5,804,561, respectively, were received by the Company’s subsidiaries from the Chinese government.
The Company accounts for income tax using an asset and liability approach, which allows for the recognition of deferred tax benefits in future years. Under the asset and liability approach, deferred taxes are provided for the net tax effects of temporary differences between the carrying amounts of assets and liabilities for financial reporting purposes and the amounts used for income tax purposes. The accounting for deferred tax calculation represents the Company management’s best estimate of the most likely future tax consequences of events that have been recognized in our financial statements or tax returns and related future anticipation. A valuation allowance is provided for deferred tax assets if it is more likely than not these items will either expire before the Company is able to realize their benefits, or that future realization will be uncertain.
The accompanying consolidated financial statements are presented in United States dollars. The functional currencyPolicies” of the Company is the Renminbi (RMB). Capital accounts of the consolidated financial statements are translated into United States dollars from RMB at their historical exchange rates when the capital transactions occurred.
Assets and liabilities are translated at the exchange rates as of balance sheet date. Income and expenditures are translated at the average exchange rate of the reporting period, which rates are obtained from the website: http://www.oanda.com
| September 30, | December 31, | September 30, | ||||||||||
| 2018 | 2017 | 2017 | ||||||||||
| Period end RMB : USD exchange rate | 6.8665 | 6.5067 | 6.6536 | |||||||||
| Average RMB : USD exchange rate | 6.5137 | 6.7568 | 6.807608 | |||||||||
Comprehensive income is defined to include all changes in equity except those resulting from investments by owners and distributions to owners. Among other disclosures, all items that are required to be recognized under current accounting standards as components of comprehensive income are required to be reported in a financial statement that is presented with the same prominence as other financial statements. Comprehensive income includes net income and the foreign currency translation changes.
In accordance with ASC 280-10, Segment Reporting, the Company’s chief operating decision makers rely upon the consolidated results of operations when making decisions about allocating resources and assessing the performance of the Company. As a result of the assessment made by the Company’s chief operating decision makers, the Company has only one operating segment. The Company does not distinguish between markets or segments for the purpose of internal reporting.
The Company’s stock option expenses are recorded in accordance with ASC 718 and ASC 505.
The fair value of stock options is estimated using the Black-Scholes-Merton model. The Company’s expected volatility assumption is based on the historical volatility of the Company’s common stock. The expected life assumption is primarily based on the expiration date of the option. The risk-free interest rate for the expected term of the option is based on the U.S. Treasury yield curve in effect at the time of grant.
The recognition of stock option expenses is based on awards expected to vest. ASC standards require forfeitures to be estimated at the time of grant and revised in subsequent periods, if necessary, if actual forfeitures differ from those estimates.
The stock-based option expenses for the three months ended September 30, 2018 and September 30, 2017, were $0 and $997,496. The stock-based option expenses for the nine months ended September 30, 2018 and September 30, 2017, were $1,586,926 net of a reversal for forfeited stock option of $2,644,877 and $4,126,008, respectively. See Note 19. There were no forfeitures estimated during the reporting period.Form 10-K.
The Company allocates goodwill from business combinations to reporting units based on the expectation that the reporting unit is to benefit from the business combination. The Company evaluates its reporting units on an annual basis and, if necessary, reassigns goodwill using a relative fair value allocation approach. Goodwill is tested for impairment at the reporting unit level on an annual basis and between annual tests if an event occurs or circumstances change that would more likely than not reduce the fair value of a reporting unit below its carrying value. These events or circumstances could include a significant change in the business climate, legal factors, operating performance indicators, competition, or sale or disposition of a significant portion of a reporting unit.
Application of the goodwill impairment test requires judgments, including the identification of reporting units, assignment of assets and liabilities to reporting units, assignment of goodwill to reporting units, and the determination of the fair value of each reporting unit. The Company first assesses qualitative factors to determine whether it is more likely than not that goodwill is impaired. If the more likely than not threshold is met, the Company performs a quantitative impairment test.
As of September 30, 2018 and September 30, 2017, the Company determined that its goodwill was not impaired.
Intangible assets consist of patent, trade names and customer relations associated with the purchase price from the allocation of YongkangScrou and Jinhua An Kao. Such assets are being amortized over their estimated useful lives. Intangible assets are amortized as of September 30, 2018. The amortization expenses for intangible assets were $157,817 and $20,524 for the three months ended September 30, 2018 and September 30, 2017, respectively. The amortization expenses for intangible assets were $493,405 and $61,571 for the nine months ended September 30, 2018 and September 30, 2017, respectively.
Gross proceeds are first allocated according to the initial fair value of the freestanding derivative instruments (i.e. the warrants issued to the Company’s investors in its previous offerings, or the “Investor Warrants”). The remaining proceeds are allocated to common stock. The related issuance expenses, including the placement agent cash fees, legal fees, the initial fair value of the warrants issued to the placement agent and others were allocated between the common stock and the Investor Warrants based on how the proceeds are allocated to these instruments. Expenses related to the issuance of common stock were charged to paid-in capital. Expenses related to the issuance of derivative instruments were expensed upon issuance.
In accordance with accounting standards regarding consolidation of variable interest entities, or VIEs, VIEs are generally entities that lack sufficient equity to finance their activities without additional financial support from other parties or whose equity holders lack adequate decision making ability. All VIEs with which the Company is involved must be evaluated to determine the primary beneficiary of the risks and rewards of the VIE. The primary beneficiary is required to consolidate the VIE for financial reporting purposes.
The Company has concluded, based on the contractual arrangements, that Kandi New Energy is a VIE and that the Company’s wholly-owned subsidiary, Kandi Vehicles, absorbs a majority of the risk of loss from the activities of this company, thereby enabling the Company, through Kandi Vehicles, to receive a majority of its respective expected residual returns.
Additionally, because Kandi New Energy is under common control with other entities, the consolidated financial statements have been prepared as if the transactions had occurred retroactively as to the beginning of the reporting period of these consolidated financial statements.
Control and common control are defined under the accounting standards as “an individual, enterprise, or immediate family members who hold more than 50 percent of the voting ownership interest of each entity.” Because the owners collectively own 100% of Kandi New Energy, and have agreed to vote their interests in concert since the establishment of each of these three companies as memorialized the Voting Rights Proxy Agreement, the Company believes that the owners collectively have control and common control of Kandi New Energy. Accordingly, the Company believes that Kandi New Energy was constructively held under common control by Kandi Vehicles as of the time the contractual agreements were entered into, establishing Kandi Vehicles as their primary beneficiary. Kandi Vehicles, in turn, is owned by Continental, which is owned by the Company.
The Company adopted ASU 2016-18, “Statement of Cash Flows (Topic 230) - Restricted Cash” in the first quarter of 2018. Certain amounts included in the 2017 condensed consolidated statement of cash flows have been reclassified to conform to the 2018 financial statement presentation as follows:
The Company has included restricted cash of $12,957,377 and $20,735,921, respectively, with cash and cash equivalents when reconciling the beginning-of-period and end-of-period total amounts shown on the statement of cash flows for the nine months ended September 30, 2017. As a result, the total amount at the beginning of the period on the statement of cash flows for the nine months ended September 30, 2017 has changed from $12,235,921 to $25,193,298; the total amount at the end of the period on the statement of cash flows for the nine months ended September 30, 2017 has changed from $3,560,510 to $24,296,431; and effect of exchange rate changes on the statement of cash of cash flows for the nine months ended September 30, 2017 has changed from $199,530 to $1,011,615.
The Company has eliminated the line item of restricted cash of $5,875,786 from the section of investing activities on the statement of cash flows for the nine months ended September 30, 2017. As a result, net cash provided by investing activities of $8,444,239 on the statement of cash flows for the nine months ended September 30, 2017 has changed to net cash provided by investing activities of $2,568,453.The Company has eliminated the line item of restricted cash of $(12,922,105) from the section of financing activities on the statement of cash flows for the nine months ended September 30, 2017. As a result, net cash used by financing activities of $16,700,441 on the statement of cash flows for the nine months ended September 30, 2017 has changed to net cash used by financing activities of $3,778,336. Net decrease in cash and cash equivalents and restricted cash of $8,954,801 on the statement of cash flows for the nine months ended September 30, 2017 has changed to net decrease in cash and cash equivalents and restricted cash of $1,908,482.
NOTE 7 - NEW ACCOUNTING PRONOUNCEMENTS
Recent accounting pronouncements that the Company has adopted or may be required to adopt in the future are summarized below:
In May 2014, the FASB issued a new standard on revenue recognition related to contracts with customers. This standard supersedes nearly all existing revenue recognition guidance and involves a five-step principles-based approach to recognizing revenue. The new model requires revenue recognition to depict the transfer of promised goods or services to customers in an amount that reflects the consideration a company expects to receive. The new standard also require additional qualitative and quantitative about the nature, amount, timing and uncertainty of revenue and cash flows arising from customer contracts, including significant judgments made in applying the revenue guidance, and assets recognized from the costs to obtain or fulfill a contract. The Company adopted this standard in the first quarter of 2018 using the modified retrospective approach. The impact of adoption on its Condensed Consolidated Financial Statements for any period presented is not material.
In November 2015, the Financial Accounting Standards Board (“FASB”) issued ASU 2015-17, “Balance Sheet Classification of Deferred Taxes.” This ASU amends existing guidance to require that deferred income tax assets and liabilities be classified as non-current in a classified balance sheet, and eliminates the prior guidance which required an entity to separate deferred tax assets and liabilities into a current amount and a non-current amount in a classified balance sheet. The Company adopted this standard prospectively in the first quarter of 2018. The impact of adoption on its Condensed Consolidated Financial Statements for any period presented is not material.
In October 2016, the FASB issued Accounting Standards Update ASU 2016-16, Income Taxes (Topic 740): Intra-Entity Transfers Other than Inventory, which requires companies to recognize the income-tax consequences of an intra-entity transfer of an asset other than inventory when the transfer occurs, rather than when the asset has been sold to an outside party. The Company adopted this standard prospectively in the first quarter of 2018. The impact of adoption on its Condensed Consolidated Financial Statements for any period presented is not material.
In NovemberFebruary 2016, the FASB issued ASU 2016-18, “Statement of Cash Flows (Topic 230) - Restricted Cash,” (“ASU 2016-18”)2016-02, together with subsequent Accounting Standards Updates collectively known as the “leases standard” or “ASC 842”. This ASUASC 842 requires a statementlessee recognize the assets and liabilities that arise from leases. All leases create an asset and a liability for the lessee in accordance with FASB Concepts Statement No. 6, Elements of cash flowsFinancial Statements. Effective January 1, 2019, the Company adopted the new standard using the effective date approach. The Company elected to explainadopt both the change duringtransition relief provided in ASU 2018-11 and the periodpackage of practical expedients which allowed us, among other things, to retain historical lease classifications and accounting for any leases that existed prior to adoption of the standard. Additionally, the management elected the practical expedients allowing the Company not to separate lease and non-lease components and not record leases with an initial term of twelve months or less (“short-term leases”) on the balance sheet across all existing asset classes.
Adoption of the new standard resulted in the totalrecording of operating lease assets and operating lease liabilities of $140,000 as of January 1, 2019, which primarily relates to the corporate office leases for SC Autosports. The standard did not materially impact the condensed consolidated statements of operations or cash cash equivalents, and amounts generally described as restricted cash or restricted cash equivalents. Amounts generally described as restricted cash and restricted cash equivalents should be included with cash and cash equivalents when reconcilingflows. Adopting the beginning-of-period and end-of-period total amounts shownnew standard did not have a material impact on the statement of cash flows. Theaccounting for leases under which the Company adopted this standard inis the first quarter of 2018. The impact of adoption on its Condensed Consolidated Financial Statements for any period presented is not material.lessee.
In January 2017, the FASB issued Accounting Standards Update ASU 2017-01, Business CombinationsNo. 2017-04 (Topic 805): Clarifying350) Intangibles—Goodwill and Other: Simplifying the DefinitionTest for Goodwill Impairment, which removes Step 2 of the goodwill impairment test, which requires a hypothetical purchase price allocation. Under the amended guidance, a goodwill impairment charge will now be recognized for the amount by which the carrying value of a Business, which revisesreporting unit exceeds its fair value, not to exceed the definitioncarrying amount of goodwill. This ASU will be applied on a businessprospective basis and provides new guidance in evaluating when a set of transferred assetsis effective for interim and activities is a business.annual periods beginning after December 15, 2019, with early adoption permitted for any impairment tests performed after January 1, 2017. The Company adoptedplans to adopt this standard prospectivelyASU in the firstfourth quarter of 2018. The2019 and does not expect the adoption to have a material impact of adoption on its Condensedthe Consolidated Financial Statements for any period presented is not material.Statements.
In February 2018, the FASB released ASU 2018-2, “Reclassification of Certain Tax Effects from Accumulated Other Comprehensive Income.” This standard update addresses a specific consequence of the Tax Cuts and Jobs Act (“U.S. tax reform”) and allows a reclassification from accumulated other comprehensive income to retained earnings for the stranded tax effects resulting from U.S. tax reform. Consequently, the update eliminates the stranded tax effects that were created as a result of the historical U.S. federal corporate income tax rate to the newly enacted U.S. federal corporate income tax rate. The Company is required to adopt this standard in the first quarter of fiscal year 2020, with early adoption permitted. The amendments in this update should be applied either in the period of adoption or retrospectively to each period in which the effect of the change in the U.S. federal corporate income tax rate in the Tax Cuts and Jobs Act is recognized. The Company has finished the evaluation and determined there is currently in the process of evaluating theno impact of adoption on its Condensed Consolidated Financial Statements.
In August 2018, the FASB issued ASU 2018-13 Disclosure Framework — Changes to the Disclosure Requirements for Fair Value Measurement, which eliminates, adds, and modifies certain disclosure requirements for fair value measurements under ASC 820. This ASU is to be applied on a prospective basis for certain modified or new disclosure requirements, and all other amendments in the standard are to be applied on a retrospective basis. The new standard is effective for interim and annual periods beginning after December 15, 2019, with early adoption permitted. The Company is currently evaluating the impact of adoption on the Consolidated Financial Statements.
NOTE 8 - CONCENTRATIONSCONCENTRATIONS
(a) Customers
For the three-month periodsperiod ended September 30, 2018 and September 30, 2017,2019, the Company’s major customers, each of whom accounted for more than 10% of the Company’s consolidated revenue, were as follows:
| Sales | Trade Receivable | |||||||||||||||
| Three Months | Three Months | |||||||||||||||
| Ended | Ended | |||||||||||||||
| September 30, | September 30, | September 30, | December 31, | |||||||||||||
| Major Customers | 2018 | 2017 | 2018 | 2017 | ||||||||||||
| Kandi Electric Vehicles Group Co., Ltd. and its subsidiaries | 61 | % | 77 | % | 66 | % | 74 | % | ||||||||
| JinhuaChaoneng Automobile Sales Co., Ltd. | 24 | % | 19 | % | 18 | % | - | |||||||||
| Sales | Trade Receivable | |||||||||||||||
| Three Months | Three Months | |||||||||||||||
| Ended | Ended | |||||||||||||||
| September 30, | September 30, | September 30, | December 31, | |||||||||||||
| Major Customers | 2019 | 2018 | 2019 | 2018 | ||||||||||||
| Customer A | 30 | % | 24 | % | 27 | % | 22 | % | ||||||||
| Customer B | 30 | % | 4 | % | 12 | % | 2 | % | ||||||||
| Kandi Electric Vehicles Group Co., Ltd. and its subsidiaries (related party) | 15 | % | 61 | % | 30 | % | 66 | % | ||||||||
| Customer D | 10 | % | - | 8 | % | 7 | % | |||||||||
For the nine-month periodsperiod ended September 30, 2018 and September 30, 2017,2019, the Company’s major customers, each of whom accounted for more than 10% of the Company’s consolidated revenue, were as follows:
| Sales | Trade Receivable | |||||||||||||||
| Nine Months | Nine Months | |||||||||||||||
| Ended | Ended | |||||||||||||||
| September 30, | September 30, | September 30, | December 31, | |||||||||||||
| Major Customers | 2018 | 2017 | 2018 | 2017 | ||||||||||||
| Kandi Electric Vehicles Group Co., Ltd. and its subsidiaries | 49 | % | 82 | % | 66 | % | 74 | % | ||||||||
| JinhuaChaoneng Automobile Sales Co. Ltd. | 24 | % | 11 | % | 18 | % | - | |||||||||
| Zhejiang Shikong Energy Technology Co., Ltd. | 13 | % | - | - | - | |||||||||||
| Sales | Trade Receivable | |||||||||||||||
| Nine Months | Nine Months | |||||||||||||||
| Ended | Ended | |||||||||||||||
| September 30, | September 30, | September 30, | December 31, | |||||||||||||
| Major Customers | 2019 | 2018 | 2019 | 2018 | ||||||||||||
| Customer A | 39 | % | 24 | % | 27 | % | 22 | % | ||||||||
| Customer B | 23 | % | 6 | % | 12 | % | 2 | % | ||||||||
| Kandi Electric Vehicles Group Co., Ltd. and its subsidiaries (related party) | 14 | % | 49 | % | 30 | % | 66 | % | ||||||||
(b) Suppliers
For the three-month periodsperiod ended September 30, 2018 and September 30, 2017,2019, the Company’s material suppliers, each of whom accounted for more than 10% of the Company’s total purchases, were as follows:
| Purchases | Accounts Payable | |||||||||||||||
| Three Months | Three Months | |||||||||||||||
| Ended | Ended | |||||||||||||||
| September 30, | September 30, | September 30, | December 31, | |||||||||||||
| Major Suppliers | 2018 | 2017 | 2018 | 2017 | ||||||||||||
| Jiangsu TianPeng power Co., Ltd. | 25 | % | - | 13 | % | - | ||||||||||
| Shenzhen BiKe Power Battery Co., Ltd. | 26 | % | - | 8 | % | - | ||||||||||
| Purchases | Accounts Payable | |||||||||||||||
| Three Months | Three Months | |||||||||||||||
| Ended | Ended | |||||||||||||||
| September 30, | September 30, | September 30, | December 31 | |||||||||||||
| Major Suppliers | 2019 | 2018 | 2019 | 2018 | ||||||||||||
| Supplier E | 93 | % | - | 12 | % | - | ||||||||||
For the nine-month periodsperiod ended September 30, 2018 and September 30, 2017,2019, the Company’s material suppliers, each of whom accounted for more than 10% of the Company’s total purchases, were as follows:
| Purchases | Accounts Payable | |||||||||||||||
| Nine Months | Nine Months | |||||||||||||||
| Ended | Ended | |||||||||||||||
| September 30, | September 30, | September 30, | December 31, | |||||||||||||
| Major Suppliers | 2018 | 2017 | 2018 | 2017 | ||||||||||||
| Jiangsu TianPeng power supply Co., Ltd. | 19 | % | - | 13 | % | - | ||||||||||
| Shenzhen BiKe Power Battery Co., Ltd. | 18 | % | - | 8 | % | - | ||||||||||
| Shanghai de Lang Power Battery Co., Ltd. | 16 | % | - | - | - | |||||||||||
| Purchases | Accounts Payable | |||||||||||||||
| Nine Months | Nine Months | |||||||||||||||
| Ended | Ended | |||||||||||||||
| September 30, | September 30, | September 30, | December 31, | |||||||||||||
| Major Suppliers | 2019 | 2018 | 2019 | 2018 | ||||||||||||
| Supplier E | 67 | % | - | 12 | % | - | ||||||||||
| Supplier F | 13 | % | 3 | % | 6 | % | - | |||||||||
NOTE 9 - EARNINGS (LOSS) PER SHARE
The Company calculates earnings per share in accordance with ASC 260, Earnings Per Share, which requires a dual presentation of basic and diluted earnings per share. Basic earnings per share are computed using the weighted average number of shares outstanding during the reporting period. Diluted earnings per share represents basic earnings per share adjusted to include the potentially dilutive effect of outstanding stock options and warrants (using treasury stock method). ForDue to the average market price of the common stock during the period below the exercise price of the options, approximately 3,900,000 options were excluded from the calculation of diluted net loss per share, for the three months ended September 30, 2018 and September 30, 2017, the average number of potentially dilutive common shares was zero. The potential dilutive common shares as at the nine months ended September 30, 20182019, respectively. Due to the loss from operations, approximately 3,900,000 options were excluded from the calculation of diluted net loss per share, for the three and nine months ended September 30, 2017, were 3,900,000 and 4,400,000 shares2018, respectively.
The following is the calculation of earnings per share for the three-month periods ended September 30, 20182019 and 2017:2018:
| For three months ended | ||||||||
| September 30, | ||||||||
| 2018 | 2017 | |||||||
| Net (loss) income | $ | (6,521,399 | ) | $ | 1,918,076 | |||
| Weighted average shares used in basic computation | 51,474,048 | 48,028,467 | ||||||
| Dilutive shares | - | - | ||||||
| Weighted average shares used in diluted computation | 51,474,048 | 48,028,467 | ||||||
| (Loss) income per share: | ||||||||
| Basic | $ | (0.13 | ) | $ | 0.04 | |||
| Diluted | $ | (0.13 | ) | $ | 0.04 | |||
| For three months ended | ||||||||
| September 30, | ||||||||
| 2019 | 2018 | |||||||
| Net income (loss) | $ | 12,089,441 | $ | (6,521,399 | ) | |||
| Weighted average shares used in basic computation | 52,613,642 | 51,474,048 | ||||||
| Dilutive shares | - | - | ||||||
| Weighted average shares used in diluted computation | 52,613,642 | 51,474,048 | ||||||
| Earnings (Loss) per share: | ||||||||
| Basic and diluted | $ | 0.23 | $ | (0.13 | ) | |||
The following is the calculation of earnings per share for the nine-month periods ended September 30, 20182019 and 2017:2018:
| For Nine months ended | ||||||||
| September 30, | ||||||||
| 2018 | 2017 | |||||||
| Net loss | $ | (1,418,879 | ) | $ | (33,793,376 | ) | ||
| Weighted average shares used in basic computation | 51,089,047 | 47,913,028 | ||||||
| Dilutive shares | - | - | ||||||
| Weighted average shares used in diluted computation | 51,089,047 | 47,913,028 | ||||||
| Loss per share: | ||||||||
| Basic | $ | (0.03 | ) | $ | (0.71 | ) | ||
| Diluted | $ | (0.03 | ) | $ | (0.71 | ) | ||
| For nine months ended | ||||||||
| September 30, | ||||||||
| 2019 | 2018 | |||||||
| Net income (loss) | $ | 361,811 | $ | (1,418,879 | ) | |||
| Weighted average shares used in basic computation | 52,332,260 | 51,089,047 | ||||||
| Dilutive shares | - | - | ||||||
| Weighted average shares used in diluted computation | 52,332,260 | 51,089,047 | ||||||
| Earnings (Loss) per share: | ||||||||
| Basic and diluted | $ | 0.01 | $ | (0.03 | ) | |||
NOTE 10 - ACCOUNTS RECEIVABLE
Accounts receivable are summarized as follows:
| September 30, | December 31, | September 30, | December 31, | |||||||||||||
| 2018 | 2017 | 2019 | 2018 | |||||||||||||
| Accounts receivable | $ | 40,430,594 | $ | 34,531,788 | $ | 54,990,221 | $ | 34,394,738 | ||||||||
| Less: allowance for doubtful accounts | (319,421 | ) | (133,930 | ) | (130,420 | ) | (120,010 | ) | ||||||||
| Accounts receivable, net | $ | 40,111,173 | $ | 34,397,858 | $ | 54,859,801 | $ | 34,274,728 | ||||||||
NOTE 11 - INVENTORIESINVENTORIES
Inventories are summarized as follows:
| September 30, | December 31, | September 30, | December 31, | |||||||||||||
| 2018 | 2017 | 2019 | 2018 | |||||||||||||
| Raw material | $ | 6,881,825 | $ | 7,256,498 | $ | 11,192,506 | $ | 7,040,728 | ||||||||
| Work-in-progress | 5,459,200 | 2,831,678 | 13,778,920 | 1,571,179 | ||||||||||||
| Finished goods | 3,998,427 | 6,512,537 | 10,475,957 | 13,385,961 | ||||||||||||
| Total inventories | 16,339,452 | 16,600,713 | ||||||||||||||
| Less: provision for slowing moving inventories | (662,769 | ) | (620,919 | ) | ||||||||||||
| Inventories, net | $ | 15,676,683 | $ | 15,979,794 | ||||||||||||
| Inventories | $ | 35,447,383 | $ | 21,997,868 | ||||||||||||
10
NOTE 12 - NOTES RECEIVABLE
Notes receivable from unrelated parties as
As of September 30, 2018, and December 31, 2017, are summarized as follows:
| September 30, | December 31, | |||||||
| 2018 | 2017 | |||||||
| Notes receivable as below: | ||||||||
| Bank acceptance notes | 72,817 | - | ||||||
| Notes receivable | $ | 72,817 | $ | - | ||||
Details of2019, there was $41,549,888 notes receivable from unrelated parties, asamong which $70,067 were bank acceptance notes from payments for sales and $41,479,821 were commercial acceptance notes from payments for equity transfer of the Affiliate Company (refer to Note 24-summarized information of equity method investment in the Affiliate Company). As of December 31, 2018, there was $72,712 notes receivable from unrelated parties, among which $72,712 were bank acceptance notes from payments for sales.
As of September 30, 2018, are as set forth below:
| Index | Amount ($) | Counter party | Relationship | Nature | Manner of settlement | |||||||
| 1 | 72,817 | Shaanxi Hua Dao Auto Sales Co., Ltd. | Third Party | Payments for sales | Not due | |||||||
Notes2019, there was $0 notes receivable from the JVAffiliate Company and related parties. As of December 31, 2018. there was $3,861,032 notes receivable from the Affiliate Company and related parties, as of September 30, 2018, and December 31, 2017, areamong which $3,861,032 were bank acceptance notes from payments for sales.
NOTE 13 - Other receivables
Other receivable is summarized as follows:
| September 30, | December 31, | |||||||
| 2018 | 2017 | |||||||
| Notes receivable as below: | ||||||||
| Bank acceptance notes | 2,184,519 | 1,137,289 | ||||||
| Notes receivable | $ | 2,184,519 | $ | 1,137,289 | ||||
| September 30, | December 31, | |||||||
| 2019 | 2018 | |||||||
| Loan to third party | $ | 9,187,863 | $ | - | ||||
| Others | 3,671,441 | 1,264,323 | ||||||
| Total other receivables | $ | 12,859,304 | $ | 1,264,323 | ||||
Details of notes receivable from the JV Company and related parties asAs of September 30, 2018, are as set forth below:
| Index | Amount ($) | Counter party | Relationship | Nature | Manner of settlement | |||||||
| 1 | 2,184,519 | Kandi Electric Vehicles Group Co., Ltd. | Joint Venture of the Company | Payments for sales | Not due | |||||||
Details2019, the Company’s other receivable includes $9.2 million short-term loan lent to an unrelated party with a 6% annual interest rate to maximize the use of notes receivable from the JV Company and related parties as of December 31, 2017, are as set forth below:idled cash. This loan can be redeemed at any time.
| Index | Amount ($) | Counter party | Relationship | Nature | Manner of settlement | |||||||
| 1 | 922,126 | Kandi Electric Vehicles Group Co., Ltd. | Joint Venture of the Company | Payments for sales | Not due | |||||||
| 2 | 153,688 | Kandi Jiangsu | Subsidiary of the JV Company | Payments for sales | Not due | |||||||
| 3 | 61,475 | KandiChangxing | Subsidiary of the JV Company | Payments for sales | Not due | |||||||
NOTE 1314 - PROPERTY, PLANT AND EQUIPMENT, NET
Property, plants and equipment as of September 30, 20182019 and December 31, 2017,2018, consisted of the following:
| September 30, | December 31, | September 30, | December 31, | |||||||||||||
| 2018 | 2017 | 2019 | 2018 | |||||||||||||
| At cost: | ||||||||||||||||
| Buildings | $ | 30,512,866 | $ | 13,853,340 | $ | 29,703,216 | $ | 30,638,417 | ||||||||
| Machinery and equipment | 63,567,339 | 7,916,562 | 61,376,817 | 63,398,627 | ||||||||||||
| Office equipment | 511,999 | 532,774 | 998,625 | 852,172 | ||||||||||||
| Motor vehicles and other transport equipment | 419,080 | 382,866 | 403,253 | 418,476 | ||||||||||||
| Molds and others | 27,279,795 | 28,659,714 | 25,420,383 | 26,849,806 | ||||||||||||
| 122,291,079 | 51,345,256 | 117,902,294 | 122,157,498 | |||||||||||||
| Less : Accumulated depreciation | ||||||||||||||||
| Buildings | $ | (4,769,947 | ) | $ | (4,683,040 | ) | $ | (5,579,392 | ) | $ | (5,019,075 | ) | ||||
| Machinery and equipment | (7,187,655 | ) | (7,216,464 | ) | (12,395,351 | ) | (8,442,940 | ) | ||||||||
| Office equipment | (236,702 | ) | (305,367 | ) | (464,806 | ) | (393,893 | ) | ||||||||
| Motor vehicles and other transport equipment | (317,789 | ) | (310,631 | ) | (344,633 | ) | (325,917 | ) | ||||||||
| Molds and others | (25,669,706 | ) | (26,306,306 | ) | (24,626,908 | ) | (25,486,100 | ) | ||||||||
| (38,181,799 | ) | (38,821,808 | ) | (43,411,090 | ) | (39,667,925 | ) | |||||||||
| Less: provision for impairment for fixed assets | (444,288 | ) | (522,477 | ) | ||||||||||||
| Plant and equipment, net | $ | 83,664,992 | $ | 12,000,971 | ||||||||||||
| Less: impairment | - | (443,650 | ) | |||||||||||||
| Property, plant and equipment, net | $ | 74,491,204 | $ | 82,045,923 | ||||||||||||
As of September 30, 20182019 and December 31, 2017,2018, the net book value of plantsproperty, plant and equipment pledged as collateral for the Company’s bank loans was $8,224,667totaled $7,441,479 and $9,019,993,$8,105,419, respectively. Also see Note 18.
Depreciation expenses for the three months ended September 30, 20182019 and September 30, 20172018 were $239,434$1,832,83 and $1,119,307,$239,434, respectively. Depreciation expenses for the nine months ended September 30, 20182019 and September 30, 20172018 were $1,511,018$5,724,863 and $3,253,653,$1,511,018, respectively
NOTE 1415 - INTANGIBLE ASSETS
Intangible assets include acquired other intangibles of trade name, customer relations and patent recorded at estimated fair values in accordance with purchase accounting guidelines for acquisitions.
The following table provides the gross carrying value and accumulated amortization for each major class of our intangible assets, other than goodwill:
| Remaining | September 30, | December 31, | ||||||||
| useful life | 2019 | 2018 | ||||||||
| Gross carrying amount: | ||||||||||
| Trade name | 2.25 years | $ | 492,235 | $ | 492,235 | |||||
| Customer relations | 2.25 years | 304,086 | 304,086 | |||||||
| Patent | 5.75-7.42 years | 4,456,278 | 4,624,513 | |||||||
| 5,252,599 | 5,420,834 | |||||||||
| Less : Accumulated amortization | ||||||||||
| Trade name | $ | (376,366 | ) | $ | (338,307 | ) | ||||
| Customer relations | (232,505 | ) | (208,993 | ) | ||||||
| Patent | (919,740 | ) | (545,407 | ) | ||||||
| (1,528,611 | ) | (1,092,707 | ) | |||||||
| Intangible assets, net | $ | 3,723,988 | $ | 4,328,127 | ||||||
The aggregate amortization expenses for those intangible assets that continue to be amortized is reflected in amortization of intangible assets in the Consolidated Statements of Income and Comprehensive Income and were $154,027 and $157,817 for the three months ended September 30, 2019 and 2018, respectively. And $471,497 and $493,405 for the nine months ended September 30, 2019 and 2018, respectively.
Amortization expenses for the next five years and thereafter are as follows:
| 2019 (Three Months) | $ | 157,166 | ||
| 2020 | 628,663 | |||
| 2021 | 628,663 | |||
| 2022 | 549,304 | |||
| 2023 | 546,568 | |||
| Thereafter | 1,213,624 | |||
| Total | $ | 3,723,988 |
NOTE 16 - LAND USE RIGHTS, NET
The Company’s land use rights consist of the following:
| September 30, | December 31, | |||||||
| 2018 | 2017 | |||||||
| Cost of land use rights | $ | 14,947,038 | $ | 15,676,450 | ||||
| Less: Accumulated amortization | (3,098,072 | ) | (3,010,403 | ) | ||||
| Land use rights, net | $ | 11,848,966 | $ | 12,666,047 | ||||
| September 30, | December 31, | |||||||
| 2019 | 2018 | |||||||
| Cost of land use rights | $ | 14,382,544 | $ | 14,925,518 | ||||
| Less: Accumulated amortization | (3,297,827 | ) | (3,175,790 | ) | ||||
| Land use rights, net | $ | 11,084,717 | $ | 11,749,728 | ||||
As of September 30, 2018,2019 and December 31, 2017,2018, the net book value of land use rights pledged as collateral for the Company’s bank loans was $7,823,541$7,366,117 and $8,993,913,$7,756,253, respectively. Also see Note 16.18.
The amortization expenses for the three months ended September 30, 20182019 and September 30, 2017,2018, were $82,586$80,462 and $82,054,$82,586, respectively. The amortization expenses for the nine months ended September 30, 20182019 and September 30, 2017,2018, were $267,177$247,061 and $241,437,$267,177, respectively. Amortization expenses for the next five years and thereafter is as follows:
| 2018(Three Months) | $ | 89,059 | ||
| 2019 | 356,236 | |||
| 2020 | 356,236 | |||
| 2021 | 356,236 | |||
| 2022 | 356,236 | |||
| Thereafter | 10,334,963 | |||
| Total | $ | 11,848,966 |
NOTE 15 - CONSTRUCTION-IN-PROGRESS
Hainan Facility
In April 2013, the Company signed an agreement with the Wanning city government in Hainan Province to invest a total of RMB 1 billion to establish a factory in Wanning to manufacture 100,000 EV products annually. In January 2016, the Hainan Province government implemented a development plan to centralize manufacturing in certain designated industry parks. As a result, the Wanning facility was relocated from Wanning city to the Haikou city high-tech zone. Based on the agreement with the government, all the expenses and lost assets resulting from the relocation were compensated for by the local government. As a result of the relocation, the contracts to build the manufacturing facility had to be revised in terms of total contract amount, technical requirements, completion milestones and others for the new construction site in Haikou. Currently, the Hainan facility’s main project including manufacturing plant and office, main manufacturing equipment and facilities has been completed and the Company has transferred associated construction-in-progress to fixed assets in the third quarter of 2018.
No depreciation is provided for CIP until such time as the facility is completed and placed into operation.
As of September 30, 2018, and December 31, 2017, the Company’s CIP were$0 and $53,083,925, respectively.
All interest expenses previously capitalized for CIP were reimbursed by the government. There was no interest expense capitalized for CIP for the three and nine months ended September 30, 2018.
| 2019 (Three Months) | $ | 82,354 | ||
| 2020 | 329,415 | |||
| 2021 | 329,415 | |||
| 2022 | 329,415 | |||
| 2023 | 329,415 | |||
| Thereafter | 9,684,703 | |||
| Total | $ | 11,084,717 |
NOTE 17 - CONSTRUCTION-IN-PROGRESS
In September 2019, in order to further increase the production capacity, YongkangScrou started building a factory of efficient new energy vehicle drive motors with a space of 6,639.9 square meters on the basis of the original plant. The total contract amount was RMB 6.6 million (approximately $0.9 million). The project is expected to be completed by 2020. As of September 30, 2019 and December 31, 2018, the Company’s Construction-in-Progress (“CIP”) were $17,781 and $0, respectively. No depreciation is provided for CIP until such time as the facility is completed and placed into operation. There was no interest expense capitalized for CIP for the three and nine months ended September 30, 2019.
NOTE 1618 - SHORT -TERMSHORT-TERM AND LONG-TERM BANK LOANS
Short-term loans are summarized as follows:
| September 30, | December 31, | |||||||
| 2018 | 2017 | |||||||
| Loans from China Ever-bright Bank | ||||||||
| Interest rate 5.22% per annum, paid off on April 25, 2018, secured by the assets of Kandi Vehicle, guaranteed by Mr. Hu Xiaoming and his wife, also guaranteed by company’s subsidiaries. Also see Note 13 and Note 14. | - | 10,758,141 | ||||||
| Interest rate 5.655% per annum, due on April 25, 2019, secured by the assets of Kandi Vehicle, guaranteed by Mr. Hu Xiaoming and his wife, also guaranteed by company’s subsidiaries. Also see Note 13 and Note 14. | 10,194,423 | - | ||||||
| Loans from Hangzhou Bank | ||||||||
| Interest rate 4.79% per annum, paid off on October 15, 2018, secured by the assets of Kandi Vehicle. Also see Note 13 and Note 14. | 7,106,969 | 7,499,962 | ||||||
| Interest rate 4.79% per annum, paid off on July 4, 2018,secured by the assets of Kandi Vehicle. Also see Note 13 and Note 14. | - | 11,096,255 | ||||||
| Interest rate 5.66% per annum, due on July 1, 2019,secured by the assets of Kandi Vehicle. Also see Note 13 and Note 14. | 5,825,384 | - | ||||||
| Interest rate 5.66% per annum, due on July 4, 2019,secured by the assets of Kandi Vehicle. Also see Note 13 and Note 14. | 4,689,434 | - | ||||||
| Interest rate 4.35% per annum, paid off on March 26, 2018, secured by the assets of Kandi Vehicle. Also see Note 13 and Note 14. | - | 3,688,506 | ||||||
| Interest rate 5.66% per annum, due March 25, 2019, secured by the assets of Kandi Vehicle. Also see Note 13 and Note 14. | 2,767,057 | - | ||||||
| $ | 30,583,267 | $ | 33,042,864 | |||||
| September 30, | December 31, | |||||||
| 2019 | 2018 | |||||||
| Loans from China Ever-bright Bank | ||||||||
| Interest rate 5.655% per annum, paid off on April 18, 2019, secured by the assets of Kandi Vehicle, guaranteed by Mr. Hu Xiaoming and his wife, also guaranteed by company’s subsidiaries. Also see Note 14 and Note 16. | - | 10,179,745 | ||||||
| Loans from Hangzhou Bank | ||||||||
| Interest rate 5.66% per annum, paid off on October 14, 2019, secured by the assets of Kandi Vehicle, also guaranteed by company’s subsidiaries. Also see Note 14 and Note 16. | 6,838,565 | 7,096,737 | ||||||
| Interest rate 5.66% per annum, due on December 31, 2019, secured by the assets of Kandi Vehicle, also guaranteed by company’s subsidiaries. Also see Note 14 and Note 16. | 5,605,381 | 5,816,997 | ||||||
| Interest rate 5.66% per annum, due on July 4, 2020, secured by the assets of Kandi Vehicle, also guaranteed by company’s subsidiaries. Also see Note 14 and Note 16. | 4,512,332 | 4,682,683 | ||||||
| Interest rate 5.66% per annum, paid off on April 24, 2019, secured by the assets of Kandi Vehicle. Also see Note 14 and Note 16. | - | 2,763,074 | ||||||
| Loans from Agricultural Bank of China | ||||||||
| Interest rate 5.22% per annum, due on April 18, 2020, secured by the assets of Kandi Vehicle. Also see Note 14 and Note 16. | 4,204,036 | - | ||||||
| Interest rate 5.22% per annum, due on April 23, 2020, secured by the assets of Kandi Vehicle. Also see Note 14 and Note 16. | 5,605,381 | - | ||||||
| Interest rate 5.22% per annum, due on May 3, 2020, secured by the assets of Kandi Vehicle. Also see Note 14 and Note 16. | 4,204,036 | - | ||||||
| $ | 30,969,731 | $ | 30,539,236 | |||||
Long-term loans are summarized as follows:
| September 30, | December 31, | September 30, | December 31, | |||||||||||||
| 2018 | 2017 | 2019 | 2018 | |||||||||||||
| Loans from Haikou Rural Credit Cooperative | ||||||||||||||||
| Interest rate 7% per annum, due on December 12, 2021, guaranteed by Kandi Vehicle and Kandi New Energy. | 28,981,286 | 30,737,547 | 27,606,502 | 28,794,136 | ||||||||||||
| $ | 28,981,286 | 30,737,547 | $ | 27,606,502 | 28,794,136 | |||||||||||
The interest expenseexpenses of short-term and long-term bank loans for the three months ended September 30, 2019, and 2018 were $435,524 and 2017 was $426,167, and $387,119, respectively. The interest expenseexpenses of short-term and long-term bank loans for the nine months ended September June 30, 2019, and 2018 were $1,304,062 and 2017 was $1,274,399, and $1,123,105, respectively.
As of September 30, 2018,2019, the aggregate amount of short-term and long-term loans guaranteed by various third parties was $0.
NOTE 1719 - NOTES PAYABLE
By issuingNotes payable is presented to certain suppliers as a payment against the outstanding trade payable. Notes payable are mainly bank acceptance notes and commercial acceptance notes which are non-interest bearing and generally mature within one year.
As of September 30, 2019, there was $11,463,004 notes payable, rather than paying cash to suppliers, the Company can defer payments until theamong which $11,463,004 was bank acceptance notes. As of December 31, 2018, there was $12,787,619 notes payable, are due. Depending on bank requirements, the Company may need to deposit restricted cash in banks to back up the bank notes payable, while the restricted cash deposited in the banks will generate interest income.
Aamong which $8,767,670 were bank acceptance note is a promised future payment, or time draft, which is acceptednotes, $2,763,074 were commercial acceptance notes and guaranteed by a bank$1,256,875 were other notes payable. $11,463,004 and drawn on a deposit at the bank. The banker’s acceptance specifies the amount of the funds, the date, and the person to which the payment is due.
After acceptance, the draft becomes an unconditional liability of the bank, but the holder of the draft can sell (exchange) it for cash at a discount to a buyer who is willing to wait until the maturity date for the funds in the deposit. $8,854,584 and $11,218,688$6,440,870 were held as collateral for the notes payable as of September 30, 2018,2019 and December 31, 2017,2018, respectively.
As is common business practice in the PRC, the Company issues notes payable to its suppliers as settlement for accounts payable.
The Company’s notes payable also include the borrowing from the third party.
Notes payable for September 30, 2018 and December 31, 2017 were summarized as follows:
| September 30, | December 31, | |||||||
| Bank acceptance notes: | 2018 | 2017 | ||||||
| Due January 4, 2018 | $ | - | $ | 4,987,167 | ||||
| Due April 19, 2018 | - | 230,532 | ||||||
| Due May 6, 2018 | - | 1,168,027 | ||||||
| Due June 18, 2018 | - | 2,305,316 | ||||||
| Due June 21, 2018 | - | 376,019 | ||||||
| Due June 25, 2018 | - | 153,688 | ||||||
| Due June 27, 2018 | - | 76,844 | ||||||
| Due June 29, 2018 | - | 2,382,160 | ||||||
| Due December 13, 2018 | 6,844,826 | - | ||||||
| Due December 30, 2018 | 10,780,855 | - | ||||||
| Due January 9, 2019 | 873,808 | - | ||||||
| Due January 11, 2019 | 262,142 | - | ||||||
| Due January 12, 2019 | 1,456,346 | - | ||||||
| Due February 21, 2019 | 72,817 | - | ||||||
| Due February 28, 2019 | 873,808 | - | ||||||
| Due March 10, 2019 | 436,904 | - | ||||||
| Due March 20, 2019 | 291,269 | - | ||||||
| Commercial acceptance notes: | ||||||||
| Due March 26, 2018 | - | 10,758,140 | ||||||
| Other Notes Payable: | ||||||||
| Due May 6, 2019 | 2,771,071 | 5,638,052 | ||||||
| Total | $ | 24,663,846 | $ | 28,075,945 | ||||
NOTE 1820 - TAXES
(a) Corporation Income Tax
Pursuant to the tax laws and regulations of the PRC, the Company’s applicable corporate income tax (“CIT”) rate is 25%. However, Kandi Vehicles qualifiesand Jinhua Ankao qualify as a High and New Technology Enterprise (“HNTE”) companycompanies in the PRC, and isare entitled to pay a reduced income tax rate of 15% for the years presented. A HNTE needs to be authenticated everyCertificate is valid for three years. In November 2017An entity may re-apply for an HNTE certificate when the Company renewedprior certificate expires. Historically, Kandi Vehicles has successfully re-applied for such certificates when the its prior certificates expired. Jinhua Ankao has been qualified as HNTE eligibility which will now expire in 2020.since 2018. Therefore no records for renewal are available. The applicable CIT rate of each of the Company’s fourthree other subsidiaries, Kandi New Energy, YongkangScrou,Yongkang Scrou and Kandi Hainan, and Jinhua An Kao, the JVAffiliate Company and its subsidiaries and the Service Company is 25%.
OurThe Company’s tax provision or benefit from income taxes for interim periods is determined using an estimate of our annual effective tax rate, adjusted for discrete items, if any, that are taken into account in the relevant period. Each quarter we update ourthe Company updates its estimate of the annual effective tax rate, and if ourits estimated tax rate changes, we makethe management makes a cumulative adjustment. For 2018, we estimate2019, the management estimates that ourits effective tax rate will be favorably affected by non-taxable income such as the share of income of the JVAffiliate Company and the gain from the change of fair value of contingent liabilities and certain research and development super-deduction and adversely affected by non-deductible expenses such as part of entertainment expenses. We recordThe Company records valuation allowances against the deferred tax assets associated with losses for which we may not realize a related tax benefit. After combining research and development tax credits of 25% on certain qualified research and development expenses, the Company’s effective tax rates for the nine months ended September 30, 2018,2019, and 20172018 were a tax benefit of 20.70%13.05% on a reported lossincome before taxes of approximately $1.8million,$0.3 million, and an effective income tax rate with a tax benefit of 10.89%20.70% for the same period of last year on a reported loss before taxes of approximately $37.9$1.8 million, respectively.
OurThe quarterly tax provision, and ourthe quarterly estimate of our annual effective tax rate, is subject to significant variation due to several factors, including variability in accurately predicting our pre-tax and taxable income and loss, acquisitions (including integrations) and investments, changes in our stock price, changes in our deferred tax assets and liabilities and their valuation, return to provision true-up, foreign currency gains (losses), changes in regulations and interpretations related to tax, accounting, and other areas. Additionally, our effective tax rate can be more or less volatile based on the amount of pre-tax income or loss. OurThe income tax provision for the nine months ended September 30, 20182019 and 20172018 was tax benefitsbenefit of $41,780 and tax benefit of $370,316, and tax benefits of $4,130,951, respectively.
Effective January 1, 2007, the Company adopted the guidance in ASC 740 relatedrelating to uncertain tax positions. The guidance addresses the determination of whether tax benefits claimed or expected to be claimed on a tax return should be recorded in the financial statements. Under ASC 740, the Company may recognize the tax benefit from an uncertain tax position only if it is more likely than not that the tax position will be sustained on examination by the taxing authorities, based on the technical merits of the position. The tax benefits recognized in the financial statements from such a position should be measured based on the largest benefit that has a greater than fifty percent likelihood of being realized upon ultimate settlement. ASC 740 also provides guidance on de-recognition, classification, interest and penalties on income taxes, accounting in interim periods and requires increased disclosures. As of September 30,December 31, 2018, the Company did not have any liability for unrecognized tax benefits. The Company files income tax returns with the U.S. Internal Revenue Services (“IRS”) and those states where the Company has operations. The Company is subject to U.S. federal or state income tax examinations by the IRS and relevant state tax authorities for years after 2006. During the periods open to examination, the Company has net operating loss carry forwards (“NOLs”) for U.S. federal and state tax purposes that have attributes from closed periods. Since these NOLs may be utilized in future periods, they remain subject to examination. The Company also files certain tax returns in the PRC. As of September 30, 2018,2019, the Company was not aware of any pending income tax examinations by U.S. or PRC tax authorities. The Company records interest and penalties on uncertain tax provisions as income tax expense. As of September 30, 20182019 the Company has no accrued interest or penalties related to uncertain tax positions. The Company has not recorded a provision for U.S. federal income tax for nine months ended September 30, 2018 due to a net operating loss for the U.S. companies as a whole in the first three quarters of 2018 and an accumulated net operating loss carry forward from prior years in the United States.
As of September 30, 2018, theThe aggregate NOLs in 2016 through 2017 of $23.602018 was $28.1 million deriving from entities in the PRCand Hong Kong. The aggregate NOLs in 2017 was $22.7 million deriving from entities in the PRC, Hong Kong and U.S. The NOLs will start to expire in varying amount betweenfrom 2021 and 2022.Theif they are not used. The cumulative net operating loss in the PRC can be carried forward for five years, to offset future net profits for income tax purposes. The cumulative net operating loss Pre-2018 in the U.S. can be carried forward for twenty years. The cumulative net operating loss in Hong Kong can be carried forward without an expiration date.
(b) Tax Holiday Effect
For the nine months ended September 30, 20182019 and 2017,2018, the PRC CIT rate was 25%. Certain subsidiaries of the Company are entitled to tax exemptions (tax holidays) for the nine months ended September 30, 20182019 and 2017.2018.
The combined effects of income tax expense exemptions and reductions available to the Company for the nine months ended September 30, 20182019 and 20172018 are as follows:
| Nine Months Ended | Nine Months Ended | |||||||||||||||
| September 30, | September 30, | |||||||||||||||
| 2018 | 2017 | 2019 | 2018 | |||||||||||||
| Tax benefit (holiday) credit | $ | 1,345,541 | $ | 55,439 | $ | 377,303 | $ | 1,345,541 | ||||||||
| Basic net income per share effect | $ | 0.000 | $ | 0.000 | $ | 0.000 | $ | 0.000 | ||||||||
(c) The Tax Cuts and Job Act
On December 22, 2017, the U.S. government enacted comprehensive tax legislation commonly referred to as the Tax Cuts and Jobs Act (“Tax Act”). The Tax Act makes broad and complex changes to the U.S. tax code that will affect our fiscal period ended September 30, 2018 and going-forwarding, including, but not limited to, (1) reducing the U.S. federal corporate tax rate effective January 1, 2018, (2) requiring a one-time transition tax on certain unrepatriated earnings of foreign subsidiaries that is payable over eight years.
The SEC staff issued Staff Accounting Bulletin (“SAB”)(SAB) No. 118, which provides guidance on accounting for the tax effects of the Tax Act. SAB 118 provides a measurement period that should not extend beyond one year from the Tax Act enactment date for companies to complete the accounting under ASC 740. In accordance with SAB 118, a company must reflect the income tax effects of those aspects of the Tax Act for which the accounting under ASC 740 is complete. To the extent that a company’s accounting for certain income tax effects of the Tax Act is incomplete but it is able to determine a reasonable estimate, it must record a provisional estimate in theits financial statements. If a company cannot determine a provisional estimate to be included in theits financial statements, it should continue to apply ASC 740 on the basis of the provisions of the tax laws that were in effect immediately before the enactment of the Tax Act.
For various reasons that are discussed more fully below, we have not fully completedIn connection with our accounting for the income tax effects of certain elements of the Tax Act. If we were able to make reasonable estimates of the effects of elements for which ourinitial analysis is not yet complete, we recorded provisional adjustments. If we were not yet able to make reasonable estimates of the impact of certain elements,the Tax Cuts and Jobs Act of 2017 (the “Tax Act”), the Company recorded provisional estimates related to the re-measurement of deferred taxes and the Deemed Repatriation Transition Tax in our financial statements for the fiscal year ended December 31, 2017. The measurement period ended on December 22, 2018. As of December 22, 2018, we have not recorded any adjustments related to those elements and have continued accounting for them in accordance with ASC 740 oncompleted the basis of the tax laws in effect before the Tax Act.
Our accounting for the following elementsimpact of the Tax Act based on the guidance, interpretations, and data available. No adjustments to these provisional estimates have been recorded.
Under the Tax Act, Global Intangible Low-Taxed Income (“GILTI”) tax rules the Company must make an accounting policy election to either (1) recognize taxes due on future U.S. inclusions in taxable income related to GILTI as a current-period expense when incurred (the “period cost method”) or (2) factor such amount into the Company’s measure of its deferred taxes (the “deferred method”). The Company elected to treat the GILTI as a current-period expense when incurred.
NOTE 21 – LEASES
The Company has corporate office leases for SC Autosports, with a term of 37 months from January 31, 2017 to January 31, 2020. The monthly lease payment is incomplete. However, we$11,000. The Company adopted ASC 842 to record operating lease assets and operating lease liabilities as of January 1, 2019, with a remaining lease term of 13 months and discount rate of 4.75%.
As of September 30, 2019, the Company’s right - of - use asset was $ 42,974 and lease liability was $44,121. For three months and nine months ended September 30, 2019, the Company’s lease expense was $33,000 and $99,000, respectively.
Maturities of lease liabilities as of September 30, 2019 were ableas follow:
| Maturity of Lease Liabilities: | ||||
| 2019 (Three Months) | $ | 32,611 | ||
| 2020 | 11,510 | |||
| Total | $ | 44,121 | ||
NOTE 22 – CONTINGENT CONSIDERATION LIABILITY
On January 3, 2018, the Company completed the acquisition of 100% of the equity of Jinhua An Kao. The Company paid approximately RMB 25.93 million (approximately $4 million) at the closing of the transaction using cash on hand and issued a total of 2,959,837 shares of restrictive stock or 6.2% of the Company’s total outstanding shares of the common stock valued at approximately $20.7 million to make reasonable estimatesthe former shareholder of Jinhua An Kao and his designees (the “An Kao Shareholders”), and may be required to pay future consideration up to an additional 2,959,837 shares of common stock, which are being held in escrow, to be released contingent upon the achievement of certain effectsnet income-based milestones in next three years. Any escrowed shares that are not released from escrow to the An Kao Shareholders for failure to achieve the milestones will be forfeited and therefore, recorded provisional adjustments as follows:
Reduction of U.S. Federal Corporate Tax Rate: The Tax Act reducesreturned to the corporate tax rateCompany for cancellation. While the escrowed shares are held in escrow, the Company will retain all voting rights with respect to 21.0%, effective January 1, 2018.the shares. For certain deferred tax assets and deferred tax liabilities, we have recorded a provisional decrease of $0.3 million, respectively, with a corresponding net adjustment to valuation allowance of $0.3 million for the year ended December 31, 2017. While we are able to make a reasonable estimate of the impact of the reduction in corporate rate, it may be affected by other analyses related2018, Jinhua An Kao achieved its first year net profit target. According to the Tax Act, including, but not limited to, our calculationagreement, the former shareholders of deemed repatriationAn Kao received 739,959 shares of deferred foreign income andKandi’s restrictive common stock or 12.5% of total Kandi stock in the state tax effect of adjustments made to federal temporary differences.
Deemed Repatriation Transition Tax: The Deemed Repatriation Transition Tax (“Transition Tax”) is a tax on previously untaxed accumulated and current earnings and profits (“E&P”) of certain foreign subsidiaries. To determine the amount of the Transition Tax, we must determine, in addition to other factors, the amount of post-1986 E&P of the relevant subsidiaries, as well as the amount of non-U.S. income taxes paid on such earnings. Due to the timing of the enactment and the complexity involved in applying the provisions of the Act, we could not made reasonable estimates of the effects and did not record provisional amounts in our financial statements as of September 30, 2018. However, we are continuing to gather information to precisely compute the amount of the Transition Tax.
NOTE 19 - STOCK OPTIONSpurchase price.
On May 29, 2015,July 1, 2018, the Compensation CommitteeCompany completed the acquisition of 100% of the Boardequity of DirectorsSC Autosports. The Company issued a total of 171,969 shares of restrictive stock or approximately 0.3% of the Company approved the grant of stock options to purchase 4,900,000Company’s total outstanding shares of the Company’s common stock valued at an exercise priceapproximately $0.8 million at the closing of $9.72 per share,transaction to the Company’s directors, officers and senior employees. The stock options will vest ratably over three years and expire onformer members of SC Autosports within 30 days from the tenth anniversarysigning date of the grant date. Transfer Agreement, and may be required to pay future consideration up to an additional 1,547,721 shares of common stock, which are being held in escrow, to be released contingent upon the achievement of certain pre-tax profit based milestones in the next three years. Any escrowed shares that are not released from escrow to the SC Autosports former members for failure to achieve the milestones will be forfeited and returned to the Company for cancellation. While the escrowed shares are held in escrow, the Company will retain all voting rights with respect to the shares. For the year ended December 31, 2018, SC Autosports achieved its first year pre-tax profit target. According to the agreement, the former members of SC Autosports received 343,938 shares of Kandi’s restrictive common stock or 20% of total Kandi stock in the purchase price.
The Company valuedrecorded contingent consideration liability of the stock options at $39,990,540 and will amortize the stock compensation expense using the straight-line method over the service period from May 29, 2015, through May 29, 2018. Theestimated fair value of the stock options was estimated usingcontingent consideration the Black Scholes Model with an expected volatilityCompany currently expects to pay to Jinahua Ankao and SC Autosports’ former members upon the achievement of 90%, an expected life of 10 years, a risk-free interest rate of 2.23% and an expected dividend yield of 0.00%. There were $1,586,926 in stock compensation expenses associated with stock options booked for the nine months ended September 30, 2018. After netting of an expense reversal of $2,644,877 for forfeited stock options for the nine months ended September 30, 2018, the net stock compensation expenses associated with stock options were negative $1,057,951 for the nine months ended September 30, 2018.
The following is a summary of the stock option activities of the Company:
| Outstanding as of January 1, 2017 | 4,566,667 | 9.72 | ||||||
| Granted | - | - | ||||||
| Exercised | - | - | ||||||
| Cancelled | - | - | ||||||
| Forfeited | (333,333 | ) | 9.72 | |||||
| Outstanding as of December 31, 2017 | 4,233,334 | $ | 9.72 | |||||
| Granted | - | - | ||||||
| Exercised | - | - | ||||||
| Cancelled | - | - | ||||||
| Forfeited | (333,334 | ) | 9.72 | |||||
| Outstanding as of September 30, 2018 | 3,900,000 | $ | 9.72 |
certain milestones. The fair value of the contingent consideration liability associated with remaining shares of restrictive common stock was estimated by using the Monte Carlo simulation method, which took into account all possible scenarios. This fair value measurement is classified as Level 3 within the fair value hierarchy prescribed by ASC Topic 820, Fair Value Measurement and Disclosures. In accordance with ASC Topic 805, Business Combinations, the Company will re-measure this liability each reporting period and record changes in the fair value through a separate line item within the Company’s consolidated statements of Income.
As of September 30, 2019 and December 31, 2018, the 4,900,000 options issued to the employeesCompany’s contingent consideration liability was $6,562,000 and directors on May 29, 2015 is $8.1613 per share.$7,256,000, respectively.
NOTE 2023 - STOCK AWARD
In connection with the appointment of Mr. Henry Yu as a member of the Board of Directors (the “Board”), and as compensation, the Board authorized the Company to providecompensate Mr. Henry Yu with 5,000 shares of Company’s restricted common stock every six months as compensation, beginning in July 2011.
As compensation for Mr. Jerry Lewin’s services as a member of the Board, the Board authorized the Company to providecompensate Mr. Jerry Lewin with 5,000 shares of Company’s restricted common stock every six months, beginning in August 2011.
As compensation for Ms. Kewa Luo’s services as the Company’s investor relation officer, the Board authorized the Company to providecompensate Ms. Kewa Luo with 5,000 shares of the Company’s common stock every six months, beginning in September 2013.
In November 2016, the Company entered into a three-year employment agreement with Mr. Mei Bing, who is nowto hire him as the Company’s Chief Financial Officer. Under the agreement, Mr. Mei Bing iswas entitled to receive an aggregate 10,000 shares of common stock each year, vested in four equal quarterly installments of 2,500 shares. On January 29, 2019, Mr. Mei resigned from his position as the Company’s CFO.
On January 29, 2019, the Board appointed Ms. Zhu Xiaoying as interim Chief Financial Officer. Ms. Zhu was entitled to receive 10,000 shares of the common stock annually under the Company’s 2008 Omnibus Long-Term Incentive Plan (the “2008 Plan”) as a year-end equity bonus.
The fair value of stock awards based on service is determined based on the closing price of the common stock on the date the shares are approved by the Board for grant. The compensation costs for awards of common stock are recognized over the requisite service period of three or six months.
On December 30, 2013, the Board approved a proposal (as submitted by the Compensation Committee) of an award (the “Board’s Pre-Approved Award Grant Sub-Plan under the 2008 Plan”) for certain executives and other key employees, comprising a total of 335,000 shares of common stock for each fiscal year, beginning with the 2013 fiscal year, under the Company’s 2008 Omnibus Long-Term Incentive Plan (the “2008 Plan”), if the Company’s “Non-GAAP Net Income” for the current fiscal year increased by 10% comparing to that of the 2013. The specific number of shares of common stock to be issued in respect of such award could proportionally increase or decrease if the actual Non-GAAP Net Income increase is more or less than 10%. “Non-GAAP Net Income” means the Company’s net income for a particular year calculated in accordance with GAAP, excluding option-related expenses, stock award expenses, and the effects caused by the change of fair value of financial derivatives. For example, if Non-GAAP Net Income for the 2014 fiscal year increased by 10% compared to the Non-GAAP Net Income for the 2013 fiscal year, the selected executives and other key employees each would be granted his or her target amount of common stock of the Company. If Non-GAAP Net Income in 2014 is less than Non-GAAP Net Income in 2013, then no common stock would be granted. If Non-GAAP Net Income in 2014 increased compared to Non-GAAP Net Income in 2013 but the increase is less than 10%, then the target amount of the common stock grant would be proportionately decreased. If Non-GAAP Net Income in 2014 increased compared to Non- GAAP Net Income in 2013 but the increase is more than 10%, then the target amount of the common stock grant would be proportionately increased up to 200% of the target amount based on the modification to 2013’s proposal in 2014. Any such increase in the grant would be subject to the total number of shares available under the 2008 Plan, and the Company’s Board and shareholders will need to approve any increase in the number of shares reserved under the 2008 Plan if all the shares originally reserved are granted. On May 20, 2015, the shareholders of the Company approved an increase of 9,000,000 shares under the 2008 Plan at its annual meeting. On September 26, 2016, the Board approved to terminate the previous Board’s Pre-Approved Award Grant Sub-Plan under the 2008 Plan and adopted a new plan to reduce the total number of shares of common stock of the stock award for selected executives and key employees from 335,000 shares of common stock to 250,000 shares of common stock for each fiscal year, with the other terms remaining the same. On February 13, 2017, the Board authorized the Company to grant 246,900 shares of common shares to certain management members and employees as compensation for their past services under the 2008 Plan. On April 18, 2018, the Board authorized the Company to grant 238,600 shares of common shares to certain management members and employees as compensation for their past services under the 2008 Plan.
employees. The fair value of each award granted under the 2008 Plan is determined based on the closing price of the Company’s stock on the date of grant of such award. Stock-based compensation expenses are calculated based onOn September 26, 2016, the Board approved to terminate the previous Board’s Pre-Approved Award Grant Sub-Plan under the 2008 Plan and adopted a new plan to grant date fair value andthe total number of awards expectedshares of common stock of the stock award for selected executives and key employees 250,000 shares of common stock for each fiscal year. On April 18, 2018, the Board authorized the Company to be earned atgrant 238,600 shares of common stock to certain management members and employees as compensation for their past services under the end2008 Plan. On April 30, 2019, the Board authorized the Company to grant 238,600 shares of each quartercommon stock to certain management members and recognized inemployees as compensation for their past services under the quarter. In subsequent periods, stock-based compensation expenses are adjusted based on grant date fair value and the change of number of awards expected to be earned. Final stock-based compensation expenses for the year are calculated based on grant date fair value and number of awards earned for the year and recognized at the end of year.2008 Plan.
For three months ended September 30, 20182019 and 2017,2018, the Company recognized $31,675$22,925 and $31,675 of employee stock award expenses for stock compensation and annual incentive award under the 2008 Plan paid to Board members, management and consultants under General and Administrative Expenses, respectively. For nine months ended September 30, 20182019 and 2017,2018, the Company recognized $1,311,885$1,337,333 and $1,396,350$1,311,885 of employee stock award expenses for stock compensation and annual incentive award under the 2008 Plan paid to Board members, management and consultants under General and Administrative Expenses, respectively.
NOTE 21 - INTANGIBLE ASSETS
Intangible assets include acquired other intangibles of trade name, customer relations and patent recorded at estimated fair values in accordance with purchase accounting guidelines for acquisitions. The Company acquired patents as a result of its acquisition of Jinhua An Kao which were valued in conjunction with the Company’s purchase accounting at approximately $5 million (see Note 26). The patents acquired have estimated economic useful lives of approximately 7.5 to 9.17 years.
The following table provides the gross carrying value and accumulated amortization for each major class of our intangible assets, other than goodwill:
| September 30, | December 31, | |||||||||
| Remaining useful life | 2018 | 2017 | ||||||||
| Gross carrying amount: | ||||||||||
| Trade name | 3.25 years | $ | 492,235 | $ | 492,235 | |||||
| Customer relations | 3.25 years | 304,086 | 304,086 | |||||||
| Patent | 6.75-8.42 years | 4,631,180 | - | |||||||
| 5,427,501 | 796,321 | |||||||||
| Less : Accumulated amortization | ||||||||||
| Trade name | $ | (325,621 | ) | $ | (287,561 | ) | ||||
| Customer relations | (201,156 | ) | (177,644 | ) | ||||||
| Patent | (409,644 | ) | - | |||||||
| (936,421 | ) | (465,205 | ) | |||||||
| Intangible assets, net | $ | 4,491,080 | $ | 331,116 | ||||||
The aggregate amortization expenses for those intangible assets that continue to be amortized is reflected in amortization of intangible assets in the Consolidated Statements of Income and Comprehensive Income and were $157,817 and $20,524 for the three months ended September 30, 2018 and 2017, respectively, and $493,405 and $61,571 for the nine months ended September 30, 2018 and 2017, respectively.
Amortization expenses for the next five years and thereafter are as follows:
| 2018(Three Months) | $ | 164,467 | ||
| 2019 | 657,872 | |||
| 2020 | 657,872 | |||
| 2021 | 657,872 | |||
| 2022 | 578,513 | |||
| Thereafter | 1,774,484 | |||
| Total | $ | 4,491,080 |
NOTE 2224 - SUMMARIZED INFORMATION OF EQUITY METHOD INVESTMENT IN THE JVAFFILIATE COMPANY
The Company’s condensed consolidated net income (loss) includes the Company’s proportionate share of the net income or loss of the Company’s equity method investees. When the Company records its proportionate share of net income (loss) in such investees, it increases equity income (loss) – net in the Company’s consolidated statements of income and the Company’s carrying value in that investment. Conversely, when the Company records its proportionate share of a net loss in such investees, it decreases equity income (loss) – net in the Company’s consolidated statements of income (loss) and the Company’s carrying value in that investment. All intra-entity profits and losses with the Company’s equity method investees have been eliminated.
On March 21, 2019, Kandi Vehicle signed an Equity Transfer Agreement with Geely Technologies Group Co., Ltd. to transfer certain equity interests in the Affiliate Company to Geely. Pursuant to the Transfer Agreement, the Affiliate Company converted a loan of RMB 314 million (approximately $46.7 million) from Geely Group last year to equity in order to increase its cash flow. As a result, the registered capital of the Affiliate Company became RMB 2.40 billion (approximately $336.3 million), of which Kandi Vehicles owned 43.47% and Geely owned 56.53%, respectively, upon the conversion of the loan into equity in the Affiliate Company (the “March Affiliate Loan to Equity Conversion”). Kandi Vehicles further agree to sell 21.47% of its equity interests in the Affiliate Company to Geely for a total amount of RMB 516 million (approximately $72.3 million) (the “Affiliate Equity Transfer”). Kandi Vehicles shall own 22% of the equity interests of the Affiliate Company as a result of the transfer. As of September 29, 2019, the Company has received payments in cash totaling RMB 220 million (approximately $30.9 million) and certain commercial acceptance notes of RMB 296 million (approximately $41.6 million) from Geely, of which RMB 140 million (approximately $19.7 million) shall mature on January 20, 2020 and the remaining RMB 156 million (approximately $21.9 million) shall mature on March 29, 2020. As of September 30, 2018,2019, the JV Company consolidated its interestsequity transfer has been completed. Therefore, in the following entities on its financial statements: (1) its 100% interest in KandiChangxing; (2) its 100% interest in Zhejiang Chang Dian and eachthird quarter of its three direct wholly-owned subsidiaries, i.e., Chang Dian Tonglu, Chang Dian Changxing and JiangsuGu Xiang; (3) its 100% interest in Kandi Shanghai; (4) its 100% interest in Kandi Jiangsu and each2019, the Company has recognized the gain from equity sale of its four direct wholly-owned subsidiaries, i.e., JiHeKang, JiHeKang Service Company, Liuchuang and KandiJinhua; and (5) 100% interest in each of the directly wholly-owned subsidiaries of JiHeKang, i.e., Tianjin BoHaiWan, Jiangsu JiDian, JiHeKang Tianjin and Guangdong JiHeKang. $20,574,217.
The Company accounted for its investments in the JVAffiliate Company under the equity method of accounting becauseaccounting. Since the March Affiliate Loan to Equity Conversion was completed at the very end of the first quarter, the Company has astill recorded 50% ownership interestof the Affiliate Company’s loss for the first quarter of 2019. Starting from the second quarter of the 2019, since the equity interests in the JV Company. As a result,Affiliate Company have been reduced to 43.47% and the Affiliate Equity Transfer was completed at the very end of the third quarter, the Company recorded 43.47% of the Affiliate Company’s consolidated net incomeloss for the nine months ended September 30, 2018,second and 2017, included equity income from the JV Company during such periods.third quarter of 2019.
The combinedconsolidated results of operations and financial position of the JVAffiliate Company are summarized below:
| Three Months ended | ||||||||
| September 30, | ||||||||
| 2018 | 2017 | |||||||
| Condensed income statement information: | ||||||||
| Net sales | $ | 19,880,543 | $ | 86,181,120 | ||||
| Gross profits | 3,133,283 | 5,279,283 | ||||||
| Gross margin | 15.8 | % | 6.1 | % | ||||
| Net loss | (5,860,746 | ) | (480,622 | ) | ||||
| % of net sales | -29.5 | % | -0.6 | % | ||||
| Company’s share in net loss of JV based on 50% ownership | $ | (2,930,373 | ) | $ | (240,311 | ) | ||
| Three Months ended | ||||||||
| September 30, | ||||||||
| 2019 | 2018 | |||||||
| Condensed income statement information: | ||||||||
| Net sales | $ | 520,275 | $ | 19,880,543 | ||||
| Gross loss | (377,700 | ) | 3,133,283 | |||||
| Gross margin | -72.6 | % | 15.8 | % | ||||
| Net(loss) income | (19,435,546 | ) | (5,860,746 | ) | ||||
| Nine Months ended | ||||||||
| September 30, | ||||||||
| 2019 | 2018 | |||||||
| Condensed income statement information: | ||||||||
| Net sales | $ | 4,605,880 | $ | 73,292,774 | ||||
| Gross (loss) profits | (3,006,051 | ) | 4,007,896 | |||||
| Gross margin | -65.3 | % | 5.5 | % | ||||
| Net (loss) income | (49,986,119 | ) | (87,969 | ) | ||||
| Nine Months ended | ||||||||
| September 30, | ||||||||
| 2018 | 2017 | |||||||
| Condensed income statement information: | ||||||||
| Net sales | $ | 73,292,774 | $ | 106,109,272 | ||||
| Gross profits | 4,007,896 | 3,454,547 | ||||||
| Gross margin | 5.5 | % | 3.3 | % | ||||
| Net loss | (87,969 | ) | (25,665,734 | ) | ||||
| % of net sales | -0.1 | % | -24.2 | % | ||||
| Company’s share in net loss of JV based on 50% ownership | $ | (43,985 | ) | $ | (12,832,867 | ) | ||
| September 30, | December 31, | |||||||
| 2018 | 2017 | |||||||
| Condensed balance sheet information: | ||||||||
| Current assets | $ | 696,525,009 | $ | 696,683,086 | ||||
| Noncurrent assets | 170,713,320 | 179,943,752 | ||||||
| Total assets | $ | 867,238,329 | $ | 876,626,838 | ||||
| Current liabilities | 573,013,782 | 703,629,444 | ||||||
| Noncurrent liabilities | 760,751 | 30,737,547 | ||||||
| Equity | 293,463,796 | 142,259,847 | ||||||
| Total liabilities and equity | $ | 867,238,329 | $ | 876,626,838 | ||||
For the nine months ended September 30, 2018, and 2017, the JV Company’s revenues were derived primarily from the sales of EV products and EV parts in China. During the first nine months of 2018, the JV Company sold a total of 6,599 units of EV products in the PRC. Because the Company has a 50% ownership interest in the JV Company and accounted for its investments in the JV Company under the equity method of accounting, the Company did not consolidate the JV Company’s financial results, but rather included equity income from the JV Company during such periods.
| September 30, | December 31, | |||||||
| 2019 | 2018 | |||||||
| Condensed balance sheet information: | ||||||||
| Current assets | $ | 609,002,781 | $ | 751,143,254 | ||||
| Noncurrent assets | 65,386,057 | 140,736,300 | ||||||
| Total assets | $ | 674,388,838 | $ | 891,879,554 | ||||
| Current liabilities | 429,675,791 | 633,711,465 | ||||||
| Noncurrent liabilities | - | - | ||||||
| Equity | 244,713,047 | 258,168,089 | ||||||
| Total liabilities and equity | $ | 674,388,838 | $ | 891,879,554 | ||||
Note: The following table illustrates the captions used in the Company’s Income Statements for its equity based investment in the JVAffiliate Company.
The Company’s equity method investments in the JVAffiliate Company for the nine months ended September 30, 20182019 and 20172018 are as follows:
| September 30, | September 30, | |||||||
| 2018 | 2017 | |||||||
| Investment in JV Company, beginning of the period, | $ | 70,681,013 | $ | 77,453,014 | ||||
| Investment in JV Company in 2018 | 79,370,859 | - | ||||||
| Share of loss | ||||||||
| Company’s share in net loss of JV based on 50% ownership | (43,985 | ) | (12,832,867 | ) | ||||
| Intercompany transaction elimination | (484,037 | ) | (848,200 | ) | ||||
| Year 2017 unrealized profit realized | 448,429 | 225,281 | ||||||
| Subtotal | (79,593 | ) | (13,455,786 | ) | ||||
| Exchange difference | (3,699,548 | ) | 3,090,575 | |||||
| Investment in JV Company, end of the period | $ | 146,272,731 | $ | 67,087,803 | ||||
| Nine Months ended | ||||||||
| September 30, | ||||||||
| 2019 | 2018 | |||||||
| Investment in the Affiliate Company, beginning of the period, | $ | 128,929,893 | $ | 70,681,013 | ||||
| Investment in Affiliate Company in 2018 | - | 79,370,859 | ||||||
| Investment decreased in 2019 | (72,309,417 | ) | ||||||
| Gain from equity dilution | 4,291,974 | - | ||||||
| Gain from equity sale | 20,574,217 | - | ||||||
| Company’s share in net (loss) income of Affiliate based on 50% ownership for three months ended March 31, 2019, 43.47%(1) ownership for six months ended September 30, 2019 and 50% ownership for three months ended September 30, 2018 | (23,025,049 | ) | (43,985 | ) | ||||
| Intercompany transaction elimination | (12,557 | ) | (484,037 | ) | ||||
| Year 2018 unrealized profit realized | 154,480 | 448,429 | ||||||
| Subtotal | (22,883,126 | ) | (79,593 | ) | ||||
| Exchange difference | (4,766,530 | ) | (3,699,548 | ) | ||||
| Investment in Affiliate Company, end of the period | $ | 53,837,011 | $ | 146,272,731 | ||||
| (1) | Represents the rounded result of dividing RMB1,045 million (the Company’s ownership interest in the Affiliate Company) by RMB2,404 million (the Affiliate Company’s total equity interest). We used the actual result and kept full decimals when calculating the Company’s share in net (loss) income of the Affiliate Company. |
The gain from equity dilution for nine months ended September 30, 2019 resulted from the Affiliate Company issuing shares to the Affiliate Company partner, Greely, in exchange for extinguishment of a loan from Greely, resulting in dilution of equity ownership of the Company from 50% to 43.47%. This dilutive transaction was treated as if the Company sold a proportional share of its investment in the Affiliate Company.
Sales to the Company’s customers, the JVAffiliate Company and its subsidiaries, for the three months ended September 30, 2018,2019, were $23,135,326$4,720,159 or 60.9%14.9% of the Company’s total revenue,anincreaseof6.4% a decrease of 79.6% from $21,749,790$23,135,326 of the same quarter last year. Sales to the Company’s customers, the JVAffiliate Company and its subsidiaries, for the nine months ended September 30, 2018,2019, were $30,479,521$10,543,190 or 48.6%14.3% of the Company’s total revenue, a decrease of 38.1%65.4% from $49,233,156$30,479,521 of the same quarter last year. Sales to the JVAffiliate Company and its subsidiaries were primarily of battery packs, body parts, EV drive motors, EV controllers, air conditioning units and other auto parts.
As of September 30, 20182019 and December 31, 2017,2018, the net current and noncurrent net amount due from the JVAffiliate Company and its subsidiaries, was $77,423,493$25,335,894 and $162,329,623,$67,683,462, respectively. The breakdown is as below:
| September 30, | December 31, | |||||||
| 2018 | 2017 | |||||||
| Kandi Shanghai | $ | 40,133,861 | $ | 2,354,195 | ||||
| KandiChangxing | 237,571 | 912,760 | ||||||
| KandiJinhua | - | 15,718 | ||||||
| Kandi Jiangsu | 1,456,095 | 1,506,199 | ||||||
| Liuchuang | 119,851 | - | ||||||
| Zhejiang Chang Dian | 272,444 | - | ||||||
| JV Company | 35,203,671 | 157,540,751 | ||||||
| Consolidated JV | $ | 77,423,493 | $ | 162,329,623 | ||||
On May 23, 2018, in order to obtain the manufacturing license, the JV Company increased its registered capital by RMB 1.09 billion (approximately $159 million), of which Kandi Vehicle contributed its portion by converting the loans lent to the JV company in the amount of RMB 545 million (approximately $79 million) that were previously included in the current and noncurrent amount due from the JV Company and its subsidiaries to the JV Company’s registered capital. Geely Group became a new shareholder of the JV Company by investing RMB 545 million (approximately $79 million) in the JV Company.
As of September 30, 2018 and December 31, 2017, the current and noncurrent amount due to the JV Company and its subsidiaries, was $37,300 and $0, respectively. The breakdown is as below:
| September 30, | December 31, | |||||||
| 2018 | 2017 | |||||||
| KandiJinhua | $ | 37,300 | $ | - | ||||
| Consolidated JV | $ | 37,300 | $ | - | ||||
NOTE 2325 - COMMITMENTS AND CONTINGENCIES
Guarantees and pledged collateral for bank loans to other parties
(1) Guarantees for bank loans
| September 30, | December 31, | September 30, | December 31, | |||||||||||||
| Guarantee provided to | 2018 | 2017 | 2019 | 2018 | ||||||||||||
| Kandi Electric Vehicles Group Co., Ltd. | 7,281,730 | - | - | 7,271,247 | ||||||||||||
| Kandi Electric Vehicles Jiangsu Co., Ltd. | 7,281,730 | - | - | 7,271,247 | ||||||||||||
| Total | $ | 14,563,460 | $ | - | $ | - | $ | 14,542,494 | ||||||||
On March 15, 2013, the Company entered into a guarantee contract to serve as the guarantor of Nanlong Group Co., Ltd. (“NGCL”) for NGCL’s $2,802,691 (RMB 20 million) loan in the amount of $2,912,692 from Shanghai Pudong Development Bank Jinhua Branch, with a related loan period of March 15, 2013, to March 15, 2016. NGCL is not related to the Company. Under this guarantee contract, the Company agreed to assume joint liability as the loan guarantor. In April 2017, Shanghai Pudong Development Bank filed a suitlawsuit against NGCL, the Company and ten other parties in Zhejiang Province People’s Court in Yongkang City, alleging NGCL defaulted on a bank loan borrowed from Shanghai Pudong Development Bank for a principal amount of approximately $2.9 million and demandingdemanded that the guarantor to bear the liability for compensation. On May 27, 2017, a judicial mediation took place in Yongkang City and parties reached a settlement in mediation, settlement reached in court, which the plaintiff agreed NGCL would repay the loan principal and interest plus legal expenses in installments. As of September 30, 2018,So long as NGCL repays the principal and interest according to the enterprise credit report issued byagreement, the Credit Center of People’s Bank of China (PBOC) orplaintiff will not ask the central bankCompany for recovery. As of the People’s Republicdate of China,this report, the Company’s guarantee for NGCL’s loan has been removed. The Company expects the likelihood of incurring losses in connection with this matter to be remote.
On September 29, 2015, the Company entered into a guarantee contract to serve as the guarantor of Zhejiang Shuguang Industrial Co., Ltd. (“ZSICL”) for a bank loan in the amount of $4,223,403$4,063,901 (RMB 29 million) from Ping An Bank, with a related loan period of September 29, 2015, to September 28, 2016. ZSICL is not related to the Company. Under this guarantee contract, the Company agreed to perform all the obligations of ZSICL under the loan contract if ZSICL failsfailed to perform its obligations as set forth therein. In August 2016, Ping An Bank Yiwu Branch (“Ping An Bank”) filed a suitlawsuit against ZSICL, the Company, and three other parties in Zhejiang Province People’s Court in Yiwu City, alleging ZSICL defaulted on a bank loan it had borrowed from Pin An Bank for a principal amount of RMB 29 million or approximately $4.2 million (the “Principal”), for which the Company iswas a guarantor along with other three parties. On December 25, 2016, the court ruled that ZSICL should repay Ping An Bank the Principalprincipal and associated interest remaining on the bank loan within 10 days once the adjudication is effective; andwas effective. Additionally, the court found that the Company and the three other three parties, actedacting as guarantors, have joint liability for this bank loan. On July 31, 2017, the Company and Ping An Bank reached an agreement to settle. According to the agreement, the Company willwas to pay Ping An Bank RMB 20 million or approximately $3.0 million in four installments before October 31, 2017 to release the Company from theits guarantor liability for this default. As of September 30, 2018 and DecemberOctober 31, 2017, the Company has madepaid all four installments in the total oftotaling RMB 20 million or approximately $3.0 million to Ping An Bank and thus the Company has been released from theits guarantor liability for this default. According to the Company’s agreement with ZSICL, ZSICL agreed to reimburse all the Company’s losses due to ZSICL’s default on the loan principal and interests, of which RMB 9.911.9 million has been reimbursed to the Company as of the date of this report and the remaining RMB 10.1 million willremainder is expected to be reimbursed in installments within next threetwo years. The Company expects the likelihood of incurring losses in connection with this matter to be low.
On August29,August 29, 2018, the Company entered into a guarantee contract to serve as the guarantor for the JVAffiliate Company for bank loansacceptance notes in the aggregate amount of $3,058,327$2,942,825 (RMB 21 million) from Bank of China, with a related loan period of August29,August 29, 2018 to February29, 2019. Under this guarantee contract,February 29, 2019, and which were paid off on February 29, 2019 by the Company agreed to perform all the obligations of the JV Company under the loan contract if the JV Company fails to perform its obligations as set forth therein.Affiliate Company.
On August30,August 30, 2018, the Company entered into a guarantee contract to serve as the guarantor for Kandi Jiangsu for bank loans in the aggregate amount of $7,281,730$7,006,726 (RMB 50 million) from China Merchants Bank Nantong branch, with a related loan period of August31,August 31, 2018 to February28,February 28, 2019, and was paid off on February 1, 2019. Under this guarantee contract, the Company agreed to perform all the obligations of the JV Company underOn February 1, 2019, the loan contract if thewas renewed with a term of February 1, 2019 to July 31, 2019 and was paid off on July 31, 2019 by Kandi Jiangsu fails to perform its obligations as set forth therein.Jiangsu.
On September 3, 2018, the Company entered into a guarantee contract to serve as the guarantor for the JVAffiliate Company for bank loansacceptance notes in the aggregate amount of $4,223,403$4,063,901 (RMB 29 million) from Bank of China, with a related loan period of September 3, 2018 to March 3, 2019. Under this guarantee contract,2019 and was paid off on March 3, 2019 by the Company agreed to perform all the obligations of the JV Company under the loan contract if the JV Company fails to perform its obligations as set forth therein.Affiliate Company.
(2) Pledged collateral for bank loans to other parties.
As of September 30, 20182019 and December 31, 2017,2018, none of the Company’s land use rights or plants and equipment were pledged as collateral securing bank loans to other parties.
Construction commitment
In September 2019, in order to further increase the production capacity, YongkangScrou started building a factory of efficient new energy vehicle drive motors with a space of 6,639.9 square meters on the basis of the original plant. The total contract amount was RMB 6.6 million (approximately $0.9 million). The project is expected to be completed by 2020.
Litigation
Beginning in March 2017, putative shareholder class actions were filed against Kandi Technologies Group, Inc. and certain of its current and former directors and officers in the United States District Court for the Central District of California and the United States District Court for the Southern District of New York. The complaints generally allegealleged violations of the federal securities laws based Kandi’s disclosure in March 2017 that its financial statements for the years 2014, 2015and2015 and the first three quarters of 2016 would need to be restated, and seeksought damages on behalf of putative classes of shareholders who purchased or acquired Kandi’s securities prior to March 13, 2017. AllKandi moved to dismiss the remaining cases, areall of which were pending in the New York federal court, and lead plaintiffthat motion was granted by an order entered on September 30, 2019, and lead counsel have been appointed.the time to appeal has run.
Beginning in May 2017, purported shareholder derivative actions based on the same underlying events described above were filed against certain current and former directors of Kandi in the United States District Court for the Southern District of New York. Lead plaintiff and lead counsel have been appointed.The New York federal court confirmed the voluntary dismissal of these actions in April 2019.
In October 2017, a shareholder filed a books and records action against the Company in the Delaware Court of Chancery pursuant to 8 Del. C. Section 220 seeking the production of certain documents generally relating to the same underlying items described above as well as attorney’s fees (the “Section 220 Litigation”). On September 28, 2018, the parties, through their respective counsel, agreed to dismiss the Section 220 Litigation with prejudice and with each party bearing its own attorney’s fees, costs, and expenses, thereby concluding the action. In February 2019, this same shareholder commenced a derivative action against certain current and former directors of Kandi in the Delaware Court of Chancery. A motion to dismiss this derivative action was filed in May 2019 and remains pending.
Separately, in connection with allegations of misconduct identified in pre-suit demands made by putative shareholders of Kandi, Kandi formed a Special Litigation Committee (“SLC”) and retained Delaware law firm as independent counsel to the SLC to aid in the SLC’s investigation of, and to ultimately report on, the allegations of misconduct set forth in the pre-suit demands. The Company believes that although its financial statements forinvestigation remains ongoing.
While the years 2014, 2015 and the first three quarters of 2016 were restated, the restatements had no effect on its net income. The Company further believes that the claims referenced abovein these litigations are without merit and it intends towill defend againstitself vigorously, the lawsuits vigorously. The Company is unable to estimate the possible loss, if any, associated with this lawsuit.these litigations. The ultimate outcome of any litigation is uncertain and the outcome of these matters, whether favorable or unfavorable, could have a negative impact on itsthe Company’s financial condition or results of operations due to defense costs, diversion of management resources and other factors. LitigationDefending litigation can be costly, and adverse results in the caseslitigations could result in substantial monetary judgments. No assurance can be made that litigation will not have a material adverse effect on itsthe Company’s future financial position.
NOTE 2426 - SEGMENT REPORTING
The Company has one operating segment. The Company’s revenue and long-lived assets are primarily derived from and located in China. The Company does not have manufacturing operations outside of China.
The following table sets forth disaggregation of revenue:
| Three Months Ended September 30, | Three Months Ended September 30, | |||||||||||||||
| 2018 | 2017 | 2019 | 2018 | |||||||||||||
| Sales Revenue | Sales Revenue | Sales Revenue | Sales Revenue | |||||||||||||
| Primary geographical markets | ||||||||||||||||
| Overseas | $ | 5,849,353 | $ | 1,218,901 | $ | 5,703,050 | $ | 5,849,353 | ||||||||
| China | 32,146,007 | 27,134,998 | 25,985,494 | 32,146,007 | ||||||||||||
| Total | $ | 37,995,360 | $ | 28,353,899 | $ | 31,688,544 | $ | 37,995,360 | ||||||||
| Major products | ||||||||||||||||
| EV parts | $ | 32,065,497 | $ | 27,008,051 | $ | 25,847,506 | $ | 32,065,497 | ||||||||
| Off-road vehicles | 5,929,863 | 1,345,848 | 5,841,038 | 5,929,863 | ||||||||||||
| Total | $ | 37,995,360 | $ | 28,353,899 | $ | 31,688,544 | $ | 37,995,360 | ||||||||
| Timing of revenue recognition | ||||||||||||||||
| Products transferred at a point in time | $ | 37,995,360 | $ | 28,353,899 | $ | 31,688,544 | $ | 37,995,360 | ||||||||
| Total | $ | 37,995,360 | $ | 28,353,899 | ||||||||||||
| Nine Months Ended September 30, | Nine Months Ended September 30, | |||||||||||||||
| 2018 | 2017 | 2019 | 2018 | |||||||||||||
| Sales Revenue | Sales Revenue | Sales Revenue | Sales Revenue | |||||||||||||
| Primary geographical markets | ||||||||||||||||
| Overseas | $ | 8,337,793 | $ | 3,621,439 | $ | 15,975,711 | $ | 8,337,793 | ||||||||
| China | 54,353,080 | 56,332,312 | 57,927,523 | 54,353,080 | ||||||||||||
| Total | $ | 62,690,873 | $ | 59,953,751 | $ | 73,903,234 | $ | 62,690,873 | ||||||||
| Major products | ||||||||||||||||
| EV parts | $ | 53,947,874 | $ | 55,875,765 | $ | 57,607,687 | $ | 53,947,874 | ||||||||
| Off-road vehicles | 8,742,999 | 4,077,986 | 16,295,547 | 8,742,999 | ||||||||||||
| Total | $ | 62,690,873 | $ | 59,953,751 | $ | 73,903,234 | $ | 62,690,873 | ||||||||
| Timing of revenue recognition | ||||||||||||||||
| Products transferred at a point in time | $ | 62,690,873 | $ | 59,953,751 | $ | 73,903,234 | $ | 62,690,873 | ||||||||
| Total | $ | 62,690,873 | $ | 59,953,751 | ||||||||||||
23
NOTE 25 - Related Party Transactions
The Board must approve all related party transactions. All material related party transactions will be made or entered into on terms that are no less favorable to the Company than can be obtained from unaffiliated third parties.
There were no sales to related parties (other than the JV Company and its subsidiaries) for the three months and nine months ended September 30, 2018 and 2017.
The details for amounts due from related parties (other than the JV Company) as of September 30, 2018 and December 31, 2017 were as below:
| September 30, | December 31, | |||||||
| 2018 | 2017 | |||||||
| Service Company | - | 162,048 | ||||||
| Total due from related party | $ | - | $ | 162,048 | ||||
The Company had a 9.5% ownership interest in the Service Company and Mr. Hu, Chairman and CEO of the Company, has a 13% ownership interest in the Service Company. In June 2018, Kandi Vehicles transferred its 9.5% ownership interest in the Service Company to Geely Group. As a result of this transaction, the amounts due from related party in connection with the Service Company were transferred to accounts receivable. The main transactions between the Company and the Service Company are purchases by the Service Company of batteries and EV parts.
For transactions with the JV Company, please refer to Note 22.
NOTE 26 - Acquisitions
Jinhua An Kao
On January 3, 2018, Kandi Vehicles completed the acquisition of 100% of the equity of Jinhua An Kao Power Technology Co., Ltd., located in Jinhua City, Zhejiang Province, China. Jinhua An Kao manufactures and markets a unique system of pure electric car battery replacement technologies including an intelligent constant-temperature charging station, a 50-100 channel intelligent battery charging system, a car battery replacement tool, and a car washing machine. Jinhua An Kao also owns plug-in and soft-connection PACK technology. The acquisition is intended to strengthen Kandi’s EV battery exchange offerings in order to be the best available in the market. The Company paid approximately RMB 25.93 million (approximately $4 million) at the closing of the transaction using cash on hand and issued a total of 2,959,837 shares of restrictive stock or 6.2% of the Company’s total outstanding shares of the common stock valued at approximately $20.7 million to the former shareholder of Jinhua An Kao and his designees (the “An Kao Shareholders”), and may be required to pay future consideration up to an additional 2,959,837 shares of common stock, which are being held in escrow, to be released contingent upon the achievement of certain net income-based milestones in next three years. Any escrowed shares that are not released from escrow to the An Kao Shareholders for failure to achieve the milestones will be forfeited and returned to the Company for cancellation. While the escrowed shares are held in escrow, the Company will retain all voting rights with respect to the shares.
As of the acquisition date, the Company recorded a contingent liability of approximately $8.71 million, representing the estimated fair value of the contingent consideration the Company currently expects to pay to the An Kao Shareholders upon the achievement of certain net income-based milestones. The Supplementary Agreement sets forth the terms and conditions of the issuance of these shares. The fair value of the contingent consideration liability associated with additional 2,959,837 shares of restrictive common stock was estimated by using Monte Carlo simulation method, which took into account all possible scenarios. This fair value measurement is classified as Level 3 within the fair value hierarchy prescribed by ASC Topic 820, Fair Value Measurement and Disclosures. In accordance with ASC Topic 805, Business Combinations, the Company will re-measure this liability each reporting period and record changes in the fair value through a separate line item within the Company’s consolidated statements of Income. During the first nine months of 2018, the Company recorded a gain of approximately $2.60 million in the accompanying statements of income representing the decrease in fair value of this obligation between the acquisition date and September 30, 2018, which was largely due to the decline of the Company’s stock price during the period.
The components of the preliminary purchase price as of the acquisition date for Jinhua An Kao are as follows:
| Cash | $ | 3,988,765 | ||
| Stock awards | 20,718,859 | |||
| Fair value of contingent consideration | 8,712,996 | |||
| Total | $ | 33,420,620 |
The Company accounted for the acquisition as business combinations and, in accordance with ASC Topic 805. The Company has recorded the assets acquired and liabilities assumed at their respective fair values as of the acquisition date. The following summarizes the preliminary purchase price allocations:
| Jinhua An Kao | ||||
| Goodwill | $ | 24,216,559 | ||
| Amortizable intangible assets | 4,892,165 | |||
| Other net assets | 5,552,986 | |||
| Deferred income taxes | (1,241,090 | ) | ||
| Total | $ | 33,420,620 | ||
Transaction costs of $33,295 associated with the acquisition were expensed as incurred through general and administrative expenses in the statement of income in 2018.
The Company allocated the preliminary purchase price to specific intangible asset categories as of the acquisition date for Jinhua An Kao as follows:
| Amount Assigned | Estimated useful life (in years) | |||||
| Amortizable intangible assets: | ||||||
| Patents | $ | 4,892,165 | 7.5 – 9.17 | |||
The Company allocated the preliminary purchase price to specific intangible assets for patents that the Company acquired. The Company believes that the estimated intangible asset value so determined represent the fair value at the date of acquisition and do not exceed the amount a third party would pay for the assets. The Company used the asset based approach to derive the fair value of the amortizable intangible assets. These fair value measurements are based on significant unobservable inputs, including estimates and assumptions and, accordingly, are classified as Level 3 within the fair value hierarchy prescribed by the ASC Topic 820.
The Company recorded the excess of the purchase price over the estimated fair values of the identified assets as goodwill, which is non-deductible for tax purposes. Goodwill was established due to primarily to revenue and earnings projections associated with Jinhua An Kao’s future operations, as well as synergies expected to be gained from the integration of the business into the Company’s existed operations.
The Company’s condensed consolidated financial statements included approximately $9 million of revenue and approximately $0.1 million of operating income related to the operating results for Jinhua An Kao from its date of acquisition.
The following unaudited pro forma financial information presents the combined results of operations of Kandi and the Acquired Business as if the acquisition had occurred as of January 1, 2017. The pro forma information is not necessarily indicative of what the financial position or results of operations actually would have been had the acquisition been completed as of January 1, 2017. In addition, the unaudited pro forma financial information is not indicative of, nor does it purport to project, the future financial position or operation results of Kandi. The unaudited pro forma financial information excludes acquisition and integration costs and does not give effect to any estimated and potential cost savings or other operating efficiencies that could result from acquisition.
Unaudited Pro Forma Condensed Combined Statements of Operations Information
| Nine Months Ended September 30, | ||||||||
| 2018 | 2017 | |||||||
| Revenue | $ | 62,690,873 | $ | 68,646,884 | ||||
| INCOME(LOSS) FROM OPERATIONS | $ | (4,855,157 | ) | $ | (29,634,671 | ) | ||
| NET INCOME(LOSS) | $ | (1,418,879 | ) | $ | (33,080,736 | ) | ||
| WEIGHTED AVERAGE SHARES OUTSTANDING BASIC | $ | (0.03 | ) | $ | (0.65 | ) | ||
| WEIGHTED AVERAGE SHARES OUTSTANDING DILUTED | $ | (0.03 | ) | $ | (0.65 | ) | ||
SC Autosports
On July 1, 2018, Kandi Vehicles completed the acquisition of 100% of the equity of SC Autosports (formerly Sportsman Country). SC Autosports is a Dallas TX based sales company primarily engaged in the wholesale of off-road vehicle products, with a small percentage of business in off-road vehicle parts wholesale and retail. The acquisition is an entry point to gain a compelling opportunity for business integration and market expansion in America which will provide Kandi a solid foundation for future strategic business development. The Company issued a total of 171,969 shares of restrictive stock or approximately 0.3% of the Company’s total outstanding shares of the common stock valued at approximately $0.8 million at the closing of transaction to the former members of SC Autosportswithin30 days from the signing date of the Transfer Agreement, and may be required to pay future consideration up to an additional 1,547,721 shares of common stock, which are being held in escrow, to be released contingent upon the achievement of certain pre-tax profit based milestones in next three years. Any escrowed shares that are not released from escrow to the SC Autosports former members for failure to achieve the milestones will be forfeited and returned to the Company for cancellation. While the escrowed shares are held in escrow, the Company will retain all voting rights with respect to the shares.
As of the acquisition date, the Company recorded a contingent liability of approximately $5.3 million, representing the estimated fair value of the contingent consideration the Company currently expects to pay to SC Autosports’ former members upon the achievement of certain net income-based milestones. The Transfer Agreement sets forth the terms and conditions of the issuance of these shares. The fair value of the contingent consideration liability associated with additional 1,547,721 shares of restrictive common stock was estimated by using Monte Carlo simulation method, which took into account all possible scenarios. This fair value measurement is classified as Level 3 within the fair value hierarchy prescribed by ASC Topic 820, Fair Value Measurement and Disclosures. In accordance with ASC Topic 805, Business Combinations, the Company will re-measure this liability each reporting period and record changes in the fair value through a separate line item within the Company’s consolidated statements of Income. During the third quarter of 2018, the Company recorded a loss of approximately $0.78 million in the accompanying statements of income representing the increase in fair value of this obligation between the acquisition date and September 30, 2018, which was largely due to the increase of the Company’s stock price during the period.
The components of the preliminary purchase price as of the acquisition date for SC Autosports are as follows:
| SC Autosports | ||||
| Stock awards | $ | 756,664 | ||
| Fair value of contingent consideration | 5,306,293 | |||
| Total | $ | 6,062,957 | ||
The Company accounted for the acquisition as business combinations and, in accordance with ASC Topic 805. The Company has recorded the assets acquired and liabilities assumed at their respective fair values as of the acquisition date. The following summarizes the preliminary purchase price allocations:
SC Autosports | ||||
| Goodwill | $ | 5,240,359 | ||
| Other net assets | 822,598 | |||
| Total | $ | 6,062,957 | ||
Transaction costs of $8,256 associated with the acquisition were expensed as incurred through general and administrative expenses in the statement of income in 2018.
The Company recorded the excess of the purchase price over the estimated fair values of the identified assets as goodwill, which is non-deductible for tax purposes. Goodwill was established due to primarily to revenue and earnings projections associated with SC Autosports’ future operations, as well as synergies expected to be gained from the integration of the business into the Company’s existed operations.
The Company’s condensed consolidated financial statements included approximately $4.4 million of revenue and approximately $0.3 million of operating income related to the operating results for SC Autosports from its date of acquisition.
The following unaudited pro forma financial information presents the combined results of operations of Kandi and the Acquired Business as if the acquisition had occurred as of January 1, 2017. The pro forma information is not necessarily indicative of what the financial position or results of operations actually would have been had the acquisition been completed as of January 1, 2017. In addition, the unaudited pro forma financial information is not indicative of, nor does it purport to project, the future financial position or operation results of Kandi. The unaudited pro forma financial information excludes acquisition and integration costs and does not give effect to any estimated and potential cost savings or other operating efficiencies that could result from acquisition.
Unaudited Pro Forma Condensed Combined Statements of Operations Information
| Nine Months Ended September 30, | ||||||||
| 2018 | 2017 | |||||||
| Revenue | $ | 70,789,131 | $ | 71,123,168 | ||||
| INCOME(LOSS) FROM OPERATIONS | $ | (4,736,390 | ) | $ | (29,406,007 | ) | ||
| NET INCOME(LOSS) | $ | (1,300,112 | ) | $ | (32,834,460 | ) | ||
| WEIGHTED AVERAGE SHARES OUTSTANDING BASIC | $ | (0.03 | ) | $ | (0.68 | ) | ||
| WEIGHTED AVERAGE SHARES OUTSTANDING DILUTED | $ | (0.03 | ) | $ | (0.68 | ) | ||
Item 2.Management’s Discussion and Analysis of Financial Condition and Results of Operations.
This report contains forward-looking statements within the meaning of the federal securities laws that relate to future events or our future financial performance. In some cases, you can identify forward-looking statements by terminology, such as “may,” “will,” “should,” “could,” “expect,” “plan,” “anticipate,” “believe,” “estimate,” “project,” “predict,” “intend,” “potential” or “continue” or the negative of such terms or other comparable terminology, although not all forward-looking statements contain such terms.
In addition, these forward-looking statements include, but are not limited to, statements regarding implementing our business strategy; development and marketing of our products; our estimates of future revenue and profitability; our expectations regarding future expenses, including research and development, sales and marketing, manufacturing and general and administrative expenses; difficulty or inability to raise additional financing, if needed, on terms acceptable to us; our estimates regarding our capital requirements and our needs for additional financing; attracting and retaining customers and employees; sources of revenue and anticipated revenue; and competition in our market.
Forward-looking statements are only predictions. Although we believe that the expectations reflected in these forward-looking statements are reasonable, we cannot guarantee future results, levels of activity, performance or achievements. All of our forward-looking information is subject to risks and uncertainties that could cause actual results to differ materially from the results expected. Although it is not possible to identify all factors, these risks and uncertainties include the risk factors and the timing of any of those risk factors described in our Annual Report onthe 2018 Form 10-K for the year ended December 31, 2017 and those set forth from time to time in our other filings with the Securities and Exchange Commission (“SEC”).SEC. These documents are available on the SEC’s Electronic Data Gathering and Analysis Retrieval System at http://www.sec.gov.
Critical Accounting Policies and Estimates
This section should be read together with the SummaryThe preparation of Significant Accounting Policies in the attachedcondensed consolidated financial statements included in this report.
Estimates affecting accounts receivable and inventories
The preparation of our consolidated financial statementsconformity with U.S. GAAP requires managementus to make estimates and assumptions that affect our reportingthe reported amounts of assets and liabilities (andand disclosure of contingent assets and liabilities). These estimates are particularly significant where they affect the reported net realizable value of our accounts receivable and inventories.
Accounts receivable are recognized and carried at net realizable value. An allowance for doubtful accounts is recorded in the period when a loss is probable based on an assessment of specific factors, such as troubled collection, historical experience, accounts aging, ongoing business relations and other factors. Accounts are written off after exhaustive efforts at collection. If accounts receivable are to be provided for, or written off, they would be recognized in the consolidated statement of operations within operating expenses. We had an allowance for doubtful accounts of $319,421 and $133,930liabilities, as of September 30, 2018 and December 31, 2017, in accordance with our management’s judgment based on their best knowledge.
Inventory is stated at the lower of cost, determined on a weighted average basis, or net realizable value. Net realizable value is the estimated selling price in the ordinary course of business less the estimated cost of completion and the estimated costs necessary to make the sale. Adjustments to reduce the cost of inventory to its net realizable value are made, if required, for estimated excess, obsolescence, or impaired balances. When inventories are sold, their carrying amount is charged to expense in the year in which the revenue is recognized. Write-downs for declines in net realizable value or for losses of inventories are recognized as an expense in the year the impairment or loss occurs. There was a $662,769 and $620,919 of decline in net realizable value of inventory as of September 30, 2018 and December 31, 2017, respectively, due to our provision for slow moving inventory.
Although we believe that there is little likelihood that actual results will differ materially from our current estimates, if customer demand for our products decreases significantly in the near future, or if the financial condition of our customers deteriorates in the near future, we could realize significant write downs for slow-moving inventories or uncollectible accounts receivable.
Policy affecting recognition of revenue
Our revenue recognition policy plays a key role in our consolidated financial statements.
We recognize revenue when goods or services are transferred to customers in an amount that reflects the consideration which it expects to receive in exchange for those goods or services. In determining when and how revenue is recognized from contracts with customers, we perform the following five-step analysis: (i) identification of contract with customer; (ii) determination of performance obligations; (iii) measurement of the transaction price; (iv) allocation of the transaction price to the performance obligations; and (v) recognition of revenue when (or as) we satisfy each performance obligation.
We generate revenue through the sale of EV products, EV parts and off-road vehicles and our revenue recognition policies for our EV products, EV parts and off-road vehicles are the same. The revenue is recognized at a point in time once we have determined that the customer has obtained control over the product. Control is typically deemed to have been transferred to the customer when the performance obligation is fulfilled, usually at the time of delivery, at the net sales price (transaction price). Estimates of variable consideration, such as volume discounts and rebates, are determined, reviewed and revised periodically by management. Revenue is recognized net of any taxes collected from customers, which are subsequently remitted to governmental authorities. Shipping and handling costs for product shipments occur prior to the customer obtaining control of the goods are accounted for as fulfillment costs rather than separate performance obligations and recorded as sales and marketing expenses.
Policy affecting options, warrants and convertible notes
Our stock option cost is recorded in accordance with ASC 718 and ASC 505. The fair value of stock options is estimated using the Black-Scholes-Merton model. Our expected volatility assumption is based on the historical volatility of our stock. The expected life assumption is primarily based on the expiration date of the option. The risk-free interest rate forfinancial statements, and the expected termreported amounts of revenue and expenses during the option is basedreported period. If these estimates differ significantly from actual results, the impact to the condensed consolidated financial statements may be material. There have been no material changes in our critical accounting policies and estimates from those disclosed in on the U.S. Treasury yield curve in effect at the time2018 Form 10-K. Please refer to Part II, Item 7 of grant. Stock option expense recognition is based on awards expected to vest. There were no estimated forfeitures. ASC standards require forfeitures to be estimated at the time of grant and revised in subsequent periods, if necessary, if actual forfeitures differ from those estimates.
Our warrant costs are recorded in liabilities and equities, respectively, in accordance with ASC 480, ASC 505 and ASC 815. The fair value ofsuch a warrant, which is classified asreport for a liability, is estimated using the Binomial Tree model and the lattice valuation model. Our expected volatility assumption is based on the historical volatilitydiscussion of our common stock. The expected life assumption is primarily based on the expiration date of the warrant. The risk-free interest rate for the expected term of the warrant is based on the U.S. Treasury yield curve in effect at the time of measurement. Our warrants, which are freestanding derivatives classified as liabilities on the balance sheet, are measured at fair value on each reporting date, with decreases in fair value recognized in earnings and increases in fair values recognized in expenses.
The fair value of equity-based warrants, which are not considered derivatives under ASC 815, is estimated using the Black-Scholes -Merton model. Our expected volatility assumption is based on the historical volatility of our common stock. The expected life assumption is primarily based on the expiration date of the warrant. The risk-free interest rate for the expected term of the option is based on the U.S. Treasury yield curve in effect at the time of grant.
In accordance with ASC 815, the conversion feature of the convertible notes is separated from the debt instrument and accounted for separately as a derivative instrument. On the date the convertible notes are issued, the conversion feature is recorded as a liability at its fair value, and future decreases in fair value are recognized in earnings while increases in fair values are recognized in expenses. We used the Black-Scholes -Merton option-pricing model to obtain the fair value of the conversion feature. The expected volatility assumption is based on the historical volatility of our common stock. The expected life assumption is primarily based on the expiration date of the conversion features. The risk-free interest rate for the expected term of the conversion features is based on the U.S. Treasury yield curve in effect at the time of measurement.
Warranty Liability
Most of our non-EV products (“Legacy Products”) are exported out of China to foreign countries that have legal and regulatory requirements with which we are not familiar. The development of warranty policies for our Legacy Products in each of these countries would be virtually impossible and prohibitively expensive. Therefore, we provide price incentives and free parts to our customers and in exchange, our customers establish appropriate warrantycritical accounting policies and assume warranty responsibilities.
Consequently, warranty issues are taken into consideration during price negotiations for our products. Free parts are delivered along with the products, and when products are sold, the related parts are recorded as cost of goods sold. Due to the reliability of our products, we have been able to maintain this warranty policy and we have not had any product liability attributed to our products.
For the EV products that we sell in China, we provide a three year or 50,000 kilometer manufacturer warranty. This warranty affects the Company through our participation and investment in the JV Company, which manufactures the EV products.estimates.
Results of Operations
Overview
We are one of the leading manufacturers of EV products (through the JVAffiliate Company), EV parts and off-road vehicles in China. For thethree months ended September 30, 2019, we recognized total revenue of $31,688,544 as compared to $37,995,360 for the three months ended September 30, 2018, a decrease of $6,306,816, or 16.6%. For the three months ended September 30, 2019, we recorded $5,276,415 of gross profits, a decrease of $965,634 or 15.5% from the same period of 2018. Gross margin for the three months ended September 30, 2019 was 16.7%, an increase compared to 16.4% for the three months ended September 30, 2018. We recorded a net income of $12,089,441 for the three months ended September 30, 2019, compared to net loss of $6,521,399 in the same period of 2018, primarily attributable to the gain from equity sale in the Affiliate Company and the decreased research and development expense. For the nine months ended September 30, 2018,2019, we recognized total revenue of $62,690,873$73,903,234 as compared to $59,953,751$62,690,873 for the nine months ended September 30, 2017,2018, an increase of $2,737,122,$11,212,361, or 4.6%17.9%. During the third quarter, the JV Company’s new EV models obtained all required approvals from MIIT for both Directory of Recommended Models for New Energy Vehicles and the Tax Exemption, and are now available for sale on the market, which laid a solid foundation for Kandi’s growth going forward. For the nine months ended September 30, 2018,2019, we recorded $9,646,012$12,615,006 of gross profits, an increase of $390,251$2,968,994 or 4.2%30.8% from the same period of 2017.Gross2018. Gross margin for the nine months ended September 30, 2018, and September 30, 2017 remained the same, at2019 was 17.1%, an increase compared to 15.4% for both periods. We recorded a net loss of $1,418,879 for the nine months ended September 30, 2018,2018. We recorded a net income of $361,811 for the nine months ended September 30, 2019, compared to net loss of $33,793,376$1,418,879 in the same period of 2017,2018, largely due to reduced lossesthe increased revenue, decreased research and development expense and the gain from equity sale in the JV CompanyAffiliate Company.
The current subsidy standard is provided for in the Circular on Further Improving the Subsidy Policies for the Promotion and R&D expenses this periodApplication of New Energy Vehicles, which was jointly promulgated by the Ministry of Finance, the Ministry of Science and Technology, the Ministry of Industry and Information Technology and the National Development and Reform Commission in 2019. The current subsidy standard reduces the amount of national subsidies and cancels local subsidies, resulting in a significant reduction in the total subsidy amount as compared to 2018. We believe the new subsidy standard presents both challenges and opportunities to the Company. In the past few years, although the government had a strong support policy for new energy vehicles, the unstable subsidy policy and the unpredictable timing of receiving such subsidies have exerted tremendous pressure on the Company’s cash flow. Currently, in order to adapt to the new subsidy standard, the Affiliate Company is making full use of Geely’s resources and developing new models with goals to be independent of the government’s subsidies and have strong competitiveness at the same periodtime. The new model are expected to be placed to market by the end of last year.
this year or at the beginning of 2020. We believe the Company will have greater opportunities for development at that time.
Comparison of the Three Months Ended September 30, 20182019 and 20172018
The following table sets forth the amounts and percentage relationship to revenue of certain items in our condensed consolidated statements of income (loss) and comprehensive income (loss) for the three months ended September 30, 20182019 and 2017.2018.
| Three Months Ended | ||||||||||||||||||||||||
| September 30, 2018 | % of Revenue | September 30, 2017 | % of Revenue | Change in Amount | Change in % | |||||||||||||||||||
| REVENUES FROM UNRELATED PARTY, NET | 14,860,034 | 39.1 | % | 6,604,109 | 23.3 | % | 8,255,925 | 125.0 | % | |||||||||||||||
| REVENUES FROM JV COMPANY AND RELATED PARTY, NET | 23,135,326 | 60.9 | % | 21,749,790 | 76.7 | % | 1,385,536 | 6.4 | % | |||||||||||||||
| REVENUES, NET | 37,995,360 | 28,353,899 | 9,641,461 | 34.0 | % | |||||||||||||||||||
| COST OF GOODS SOLD | (31,753,311 | ) | (83.6 | )% | (23,522,406 | ) | (83.0 | )% | (8,230,905 | ) | 35.0 | % | ||||||||||||
| GROSS PROFIT | 6,242,049 | 16.4 | % | 4,831,493 | 17.0 | % | 1,410,556 | 29.2 | % | |||||||||||||||
| OPERATING EXPENSES: | ||||||||||||||||||||||||
| Research and development | (5,691,649 | ) | (15.0 | )% | (657,851 | ) | (2.3 | )% | (5,033,798 | ) | 765.2 | % | ||||||||||||
| Selling and marketing | (898,896 | ) | (2.4 | )% | (216,351 | ) | (0.8 | )% | (682,545 | ) | 315.5 | % | ||||||||||||
| General and administrative | (2,070,947 | ) | (5.5 | )% | (2,196,201 | ) | (7.7 | )% | 125,254 | (5.7 | )% | |||||||||||||
| Total Operating Expenses | (8,661,492 | ) | (22.8 | )% | (3,070,403 | ) | (10.8 | )% | (5,591,089 | ) | 182.1 | % | ||||||||||||
| (LOSS) INCOME FROM OPERATIONS | (2,419,443 | ) | (6.4 | )% | 1,761,090 | 6.2 | % | (4,180,533 | ) | (237.4 | )% | |||||||||||||
| OTHER INCOME(EXPENSE): | ||||||||||||||||||||||||
| Interest income | 52,745 | 0.1 | % | 619,923 | 2.2 | % | (567,178 | ) | (91.5 | )% | ||||||||||||||
| Interest expense | (483,376 | ) | (1.3 | )% | (598,523 | ) | (2.1 | )% | 115,147 | (19.2 | )% | |||||||||||||
| Change in fair value of contingent consideration | (1,552,686 | ) | (4.1 | )% | - | 0.0 | % | (1,552,686 | ) | - | ||||||||||||||
| Government grants | 607,008 | 1.6 | % | 474,950 | 1.7 | % | 132,058 | 27.8 | % | |||||||||||||||
| Share of (loss) income after tax of JV | (3,247,343 | ) | (8.5 | )% | 444,181 | 1.6 | % | (3,691,524 | ) | (831.1 | )% | |||||||||||||
| Other income (expense), net | 15,735 | 0.0 | % | (6,560 | ) | (0.0 | )% | 22,295 | (339.9 | )% | ||||||||||||||
| Total other (expense) income, net | (4,607,917 | ) | (12.1 | )% | 933,971 | 3.3 | % | (5,541,888 | ) | (593.4 | )% | |||||||||||||
| (LOSS) INCOME BEFORE INCOME TAXES | (7,027,360 | ) | (18.5 | )% | 2,695,061 | 9.5 | % | (9,722,421 | ) | (360.7 | )% | |||||||||||||
| INCOME TAX BENEFIT (EXPENSE) | 505,961 | 1.3 | % | (776,985 | ) | (2.7 | )% | 1,282,946 | (165.1 | )% | ||||||||||||||
| NET (LOSS) INCOME | (6,521,399 | ) | (17.2 | )% | 1,918,076 | 6.8 | % | (8,439,475 | ) | (440.0 | )% | |||||||||||||
| Three Months Ended | ||||||||||||||||||||||||
| September 30, 2019 | % of Revenue | September 30, 2018 | % of Revenue | Change in Amount | Change in % | |||||||||||||||||||
| REVENUES FROM UNRELATED PARTY, NET | $ | 26,968,385 | 85.1 | % | $ | 14,860,034 | 39.1 | % | 12,108,351 | 81.5 | % | |||||||||||||
| REVENUES FROM THE AFFILIATE COMPANY AND RELATED PARTY, NET | 4,720,159 | 14.9 | % | 23,135,326 | 60.9 | % | (18,415,167 | ) | (79.6 | )% | ||||||||||||||
| REVENUES, NET | 31,688,544 | 37,995,360 | (6,306,816 | ) | (16.6 | )% | ||||||||||||||||||
| COST OF GOODS SOLD | (26,412,129 | ) | (83.3 | )% | (31,753,311 | ) | (83.6 | )% | 5,341,182 | (16.8 | )% | |||||||||||||
| GROSS PROFIT | 5,276,415 | 16.7 | % | 6,242,049 | 16.4 | % | (965,634 | ) | (15.5 | )% | ||||||||||||||
| OPERATING EXPENSES: | ||||||||||||||||||||||||
| Research and development | (596,187 | ) | (1.9 | )% | (5,691,649 | ) | (15.0 | )% | 5,095,462 | (89.5 | )% | |||||||||||||
| Selling and marketing | (930,810 | ) | (2.9 | )% | (898,896 | ) | (2.4 | )% | (31,914 | ) | 3.6 | % | ||||||||||||
| General and administrative | (3,432,920 | ) | (10.8 | )% | (2,070,947 | ) | (5.5 | )% | (1,361,973 | ) | 65.8 | % | ||||||||||||
| Total Operating Expenses | (4,959,917 | ) | (15.7 | )% | (8,661,492 | ) | (22.8 | )% | 3,701,575 | (42.7 | )% | |||||||||||||
| LOSS FROM OPERATIONS | 316,498 | 1.0 | % | (2,419,443 | ) | (6.4 | )% | 2,735,941 | (113.1 | )% | ||||||||||||||
| OTHER INCOME (EXPENSE): | ||||||||||||||||||||||||
| Interest income | 209,736 | 0.7 | % | 52,745 | 0.1 | % | 156,991 | 297.6 | % | |||||||||||||||
| Interest expense | (435,524 | ) | (1.4 | )% | (483,376 | ) | (1.3 | )% | 47,852 | (9.9 | )% | |||||||||||||
| Change in fair value of contingent consideration | 57,000 | 0.2 | % | (1,552,686 | ) | (4.1 | )% | 1,609,686 | (103.7 | )% | ||||||||||||||
| Government grants | 502,146 | 1.6 | % | 607,008 | 1.6 | % | (104,862 | ) | (17.3 | )% | ||||||||||||||
| Gain from equity dilution in the Affiliate Company | (49,285 | ) | (0.2 | )% | - | 0.0 | % | (49,285 | ) | - | ||||||||||||||
| Gain from equity sale in the Affiliate Company | 20,574,217 | 64.9 | % | - | 0.0 | % | 20,574,217 | - | ||||||||||||||||
| Share of loss after tax of the Affiliate Company | (8,433,767 | ) | (26.6 | )% | (3,247,343 | ) | (8.5 | )% | (5,186,424 | ) | 159.7 | % | ||||||||||||
| Other income , net | 57,833 | 0.2 | % | 15,735 | 0.0 | % | 42,098 | 267.5 | % | |||||||||||||||
| Total other income (expense), net | 12,482,356 | 39.4 | % | (4,607,917 | ) | (12.1 | )% | 17,090,273 | (370.9 | )% | ||||||||||||||
| INCOME(LOSS) BEFORE INCOME TAXES | 12,798,854 | 40.4 | % | (7,027,360 | ) | (18.5 | )% | 19,826,214 | (282.1 | )% | ||||||||||||||
| INCOME TAX (EXPENSE) BENEFIT | (709,413 | ) | (2.2 | )% | 505,961 | 1.3 | % | (1,215,374 | ) | (240.2 | )% | |||||||||||||
| NET INCOME (LOSS) | 12,089,441 | 38.2 | % | (6,521,399 | ) | (17.2 | )% | 18,610,840 | (285.4 | )% | ||||||||||||||
(a) Revenue
For the three months ended September 30, 2018,2019, our revenue was $37,995,360$31,688,544 compared to $28,353,899$37,995,360 for the same period of 2017, an increase2018, representing a decrease of $9,641,461$6,306,816 or 34.0%16.6%. The increasedecrease in revenue was mainly due to the increasedecrease in EV parts and off-road vehicles sales during this quarter. The selling prices of our products for the three months ended September 30, 2018 decreased on average from the same period last year. The increasedecrease in revenueEV parts sales was primarily due to the increase ofAffiliate Company’s temporary declining sales, volume.which was caused by its product adjustments.
The following table summarizes our revenues by product types for the three months ended September 30, 20182019 and 2017:2018:
| Three Months Ended September 30, | ||||||||
| 2018 | 2017 | |||||||
| Sales | Sales | |||||||
| EV parts | $ | 32,065,497 | $ | 27,008,051 | ||||
| Off-road vehicles | 5,929,863 | 1,345,848 | ||||||
| Total | $ | 37,995,360 | $ | 28,353,899 | ||||
| Three Months Ended September 30, | ||||||||
| 2019 | 2018 | |||||||
| Sales | Sales | |||||||
| EV parts | $ | 25,847,506 | $ | 32,065,497 | ||||
| Off-road vehicles | 5,841,038 | 5,929,863 | ||||||
| Total | $ | 31,688,544 | $ | 37,995,360 | ||||
EV Parts
During the three months ended September 30, 2018,2019, our revenues from the salesales of EV parts were $32,065,497,$25,847,506, representing an increasea decrease of $5,057,446$6,217,991 or 18.7%19.4% from $27,008,051$32,065,497 for the same quarter of 2017, which was largely due to the increased orders from the JV Company.2018.
Our revenue for the three months ended September 30, 20182019 primarily consisted of revenue from the sales of battery packs, body parts, EV controllers, air conditioning units and other auto parts for use in the manufacturing of EV products, whichproducts. These sales accounted for 84.4%81.6% of total sales. Among total sales for the three months ended September 30, 2018, approximately 67.3% were related to the sale of battery packs. In compliance with the regulation of the Chinese auto industry, we hold the necessary production licenses to manufacture the battery packs exclusively used in EV products manufactured by the JV Company. Besides the sale of battery packs, approximately 7.0% of total sales were related to sales of EV controllers, approximately 4.2% of the total sales were related to sales of air conditioning units, approximately 5.2% of total sales were related to sales of EV drive motors and approximately 0.7% of total sales were related to sales of body parts and other auto parts.
During the three months ended September 30, 2019 and 2018, and 2017, our revenuesrevenue from the sale of EV parts to the JVAffiliate Company and its subsidiaries accounted for approximately 61%15% and 77%61% of our total net revenue for the quarter, respectively. The decrease is mainly due to the Affiliate Company’s temporary declining sales, which was caused by its product adjustments. In this year, the EV parts we soldprovided to the JVAffiliate Company were primarily used in manufacturing purefor battery upgrade and market maintenance for the EV products bythat were previously put into the JV Company’s subsidiaries.leasing market.
Off-Road Vehicles
During the three months ended September 30, 2018,2019, our revenuesrevenue from the salesales of off-road vehicles, including go karts, all-terrain vehicles (“ATVs”), and others, were $5,929,863,$5,841,038, representing an increasea decrease of $4,584,015$88,825 or 340.6%1.5% from $1,345,848$5,929,863, for the same quarter of 2017. The increase in revenue of off-road vehicles was largely due to the additional sales from SC Autosports that was acquired in July 2018.
Our off-road vehicles business line accounted for approximately 15.6%18.4% of our total net revenue for the three months ended September 30, 2018. Of our off-road vehicle revenue, our ATV business accounted for approximately 12.9% of our total net revenue, our go-kart business accounted for approximately 2.6% of our total net revenue.2019.
The following table shows the breakdown of our net revenues:
| Three Months Ended September 30, | Three Months Ended September 30, | |||||||||||||||
| 2018 | 2017 | 2019 | 2018 | |||||||||||||
| Sales Revenue | Sales Revenue | Sales Revenue | Sales Revenue | |||||||||||||
| Primary geographical markets | ||||||||||||||||
| Overseas | $ | 5,849,353 | $ | 1,218,901 | $ | 5,703,050 | $ | 5,849,353 | ||||||||
| China | 32,146,007 | 27,134,998 | 25,985,494 | 32,146,007 | ||||||||||||
| Total | $ | 37,995,360 | $ | 28,353,899 | $ | 31,688,544 | $ | 37,995,360 | ||||||||
| Major products | ||||||||||||||||
| EV parts | $ | 32,065,497 | $ | 27,008,051 | $ | 25,847,506 | $ | 32,065,497 | ||||||||
| Off-road vehicles | 5,929,863 | 1,345,848 | 5,841,038 | 5,929,863 | ||||||||||||
| Total | $ | 37,995,360 | $ | 28,353,899 | $ | 31,688,544 | $ | 37,995,360 | ||||||||
| Timing of revenue recognition | ||||||||||||||||
| Products transferred at a point in time | $ | 37,995,360 | $ | 28,353,899 | $ | 31,688,544 | $ | 37,995,360 | ||||||||
| Total | $ | 37,995,360 | $ | 28,353,899 | ||||||||||||
(b) Cost of goods sold
Cost of goods sold was $31,753,311$26,412,129 during the three months ended September 30, 2018,2019, representing an increasea decrease of $8,230,905,$5,341,182, or 35.0%16.8%, compared to $23,522,406$31,753,311 for the same period of 2017.2018. The increasedecrease was primarily due to the corresponding increasedecrease in sales. Please refer to the Gross Profit section below for product margin analysis.
(c) Gross profit
Our margins by product for the three months ended September 30, 20182019 and 20172018 are as set forth below:
| Three Months Ended September 30, | Three Months Ended September 30, | |||||||||||||||||||||||||||||||||||||||||||||||||||||||||||||||
| 2018 | 2017 | 2019 | 2018 | |||||||||||||||||||||||||||||||||||||||||||||||||||||||||||||
| Sales | Cost | Gross Profit | Margin % | Sales | Cost | Gross Profit | Margin % | Sales | Cost | Gross Profit | Margin % | Sales | Cost | Gross Profit | Margin % | |||||||||||||||||||||||||||||||||||||||||||||||||
| EV parts | $ | 32,065,497 | 27,268,332 | 4,797,165 | 15.0 | % | $ | 27,008,051 | 22,349,887 | 4,658,164 | 17.2 | % | $ | 25,847,506 | 21,929,420 | 3,918,086 | 15.2 | % | $ | 32,065,497 | 27,268,332 | 4,797,165 | 15.0 | % | ||||||||||||||||||||||||||||||||||||||||
| Off-road vehicles | 5,929,863 | 4,484,979 | 1,444,884 | 24.4 | % | 1,345,848 | 1,172,519 | 173,329 | 12.9 | % | 5,841,038 | 4,482,709 | 1,358,329 | 23.3 | % | 5,929,863 | 4,484,979 | 1,444,884 | 24.4 | % | ||||||||||||||||||||||||||||||||||||||||||||
| Total | $ | 37,995,360 | 31,753,311 | 6,242,049 | 16.4 | % | $ | 28,353,899 | 23,522,406 | 4,831,493 | 17.0 | % | $ | 31,688,544 | 26,412,129 | 5,276,415 | 16.7 | % | $ | 37,995,360 | 31,753,311 | 6,242,049 | 16.4 | % | ||||||||||||||||||||||||||||||||||||||||
Gross profit for the third quarter of 2018 increased 29.2%2019 decreased 15.5% to $6,242,049,$5,276,415, compared to $4,831,493$6,242,049 for the same period last year. This was primarily attributable to the sales increase. Although ourdecrease. Our gross margin for EV parts decreasedincreased to 15.0% in the third quarter because of the decrease in selling prices on average, the gross margin for off-road vehicles increased significantly to 24.4% in the third quarter16.7% compared to the same quarter of last year. Overall, our gross margin decreased to 16.4% compared to 17.0% for the same period of 2017, which2018. The increase in our gross margin was mainly due to the vast majorityincreased selling price of gross profits came from less profitable EV partsthe charging and exchanging equipment and the increased proportion of the high-margin battery processing business in the three months ended September 30, 2018.
this year.
(d) Research and development
Research and development expenses, including materials, labor, equipment depreciation, design, testing, inspection, and other related expenses, totaled $5,691,649$596,187 for the third quarter of 2018, an increase2019, a decrease of $5,033,798$5,095,462 or 765.2%89.5% compared to $657,851$5,691,649 for the same period of last year. This increaseThe decrease was primarilymainly due to the R&D worksexpense related to the development of EV Model K23 at Hainan facility expensed in the three months ended September 30, 2018. Currently, the mostthird quarter of development works of EV Model K23last year. Such R&D work has been completed. For the three months ended September 30, 2018 and 2017, approximately 76.2% and 0% of our research and development expenses were spent on the research and development of EV Model K23 at Hainan facility, respectively, and the rest was spent on other various EV and off-road vehicles research and development projects.completed in year 2018.
(e) Sales and marketing
Selling and distribution expenses were $898,896$930,810 for the third quarter of 2018,2019, compared to $216,351$898,896 for the same period last year, representing an increase of $682,545$31,914 or 315.5%3.6%. ThisThe increase was primarily attributable to the additional sales and marketing expenses related to our newly acquiredincreased freight expense incurred by SC Autosports’ operations and the increase in product maintenance expenses for batteries and shipping costs during this period because of increased sales this quarter as compared to the same quarter of last year.
Autosports.
(f) General and administrative expenses
General and administrative expenses were $2,070,947$3,432,920 for the third quarter of 2018,2019, compared to $2,196,201$2,070,947 for the same period of last year, a decrease in expensesrepresenting an increase of $125,254$1,361,973 or 5.7%65.8%. For the three months ended September 30, 2018,2019, general and administrative expenses included $31,675 in$22,925 as expenses for common stock awards and stock options to employees and Board members, compared to $1,029,171of$31,675 of common stock awards and stock options expenses for the same period in 2017. Excluding2018. Besides stock compensation expense, our net general and administrative expenses for the three months ended September 30, 20182019 were $2,039,272,$3,409,995, representing an increase of $872,242,$1,370,723, from $1,167,030$2,039,272 for the same period of 2017,2018, which was largely due to the increased amortization expenses for intangible assets and additional G&A expenses from our newly acquired SC Autosports’ operations,operation cost of which the majority were salaries.Company since Hainan facility has been put into operation.
(g) Interest income
Interest income was $52,745$209,736 for the third quarter of 2018, a decrease2019, representing an increase of $567,178$156,991 or 91.5%297.6% compared to $619,923$52,745 for the same period of last year. This decreaseThe increase was primarily attributable to decreased interestsincreased interest earned on the loans lent to the JV Company as the loans were converted to the JV Company’s registered capital.
a third party.
(h) Interest expenses
Interest expenses were $483,376$435,524 in the third quarter of 2018,2019, representing a decrease of $115,147$47,852 or 19.2%9.9% compared to $598,523$483,376 for the same period of last year. ThisThe decrease was primarily due to lessdecreased interest expenses incurred associated with the note payable to a third party.party, as well as decreased discounts associated with the settlement of bank acceptance notes. Of the interest expenses, $24,930$0 and $608$24,930 were discounts associated with the settlement of bank acceptance notes for the three months ended September 30, 2019 and 2018, and 2017, respectively.
(i) Change in fair value of contingent consideration
For the third quarter of 2018,2019, the gain related to changes in the fair value of contingent consideration was $57,000, an increase of $1,609,686 or 103.7% compared to loss related to changes in the fair value of contingent consideration wasof $1,552,686 for the same period of last year, which was mainly due to the result of the increasedecrease in fair value of contingent consideration liability duringbetween December 31, 2018 and September 30, 2019 while there was an increase in the third quarter for the acquisitions.
same period of last year.
(j) Government grants
Government grants were $607,008$502,146 for the third quarter of 2018,2019, compared to $474,950$607,008 for the same quarter last year, representing an increasea decrease of $132,058,$104,862, or 27.8%17.3%, which was largely dueattributable to the technical projectfact that Kandi Vehicles received the subsidies received by KandiHainan and the refunds of 2017 land use taxestax in the third quarter of last year while the same kind of subsidies were received by Kandi Vehicles duringin the second quarter of 2019, instead of in the third quarter.
(k) Gain from equity dilution in the Affiliate Company
Gain from equity dilution was a negative $49,285 for the third quarter of 2019, which was due to exchange rate difference. There was no equity dilution in the third quarter of 2019.
(l) Gain from equity sale in the Affiliate Company
Gain from equity sale was $20,574,217 for the third quarter of 2019, which was due to the Affiliate Equity Transfer. In March 2019, Kandi Vehicles agreed to sell 21.47% of its equity interests in the Affiliate Company to Geely for a total amount of RMB 516 million (approximately $72.3 million). As of September 30, 2019, the equity transfer had been completed. Therefore, in the third quarter of 2019, the Company recognized the gain from equity sale.
(m) Share of income (loss) after tax of the Affiliate Company
For the third quarter of 2018, the JV Company’s net sales were $19,880,543, gross profit was $3,133,283, and net loss was $5,860,746. We accounted for our investments in the JV Company under the equity method of accounting because we have a 50% ownership interest in the JV Company. As a result, we recorded 50% of the JV Company’s loss for $2,930,373 for the third quarter of 2018. After eliminating intra-entity profits and losses,2019, our share of loss after tax of the JVAffiliate Company was $3,247,343 for the third quarter of 2018, a decrease of $3,691,524$8,433,767 as compared to $444,181 of share of income after taxloss of the JV Company in$3,247,343 for the same period of last year. The increase oflosses incurred by the JV Company’s loss wasAffiliate Company were largely dueattributable to the JVAffiliate Company’s new EV models awaiting MIIT’s approval to be included in the Directory of Recommended Models for Energy Saving and New Energy Vehicle Demonstration and Promotion, as well as approval of purchase tax exemption in the third quarter.
temporary declining sales, which was caused by its product adjustments.
During the third quarter of 2018, the JV Company sold a total of 1,502 units of EV products in the PRC.(n) Other income (loss), net
Net other income was $15,735$57,833 for the third quarter of 2018,2019, representing an increase of $22,295$42,098 or 339.9%267.5% compared to net other expenseincome of $6,560$15,735 for the same period of last year.year, which was largely due to the disposal of certain waste materials during the third quarter.
(o) Income Taxes
In accordance with the relevant Chinese tax laws and regulations, our applicable corporate income tax rate is 25%. However, Kandi Vehicles isVehicle and Jinhua An Kao are qualified as a high technology enterprisecompanies in China and isare therefore entitled to use a reduced corporate income tax rate of 15%.
Each of our wholly-owned or partially-owned subsidiaries, Kandi New Energy, YongkangScrou,Yongkang Scrou and Kandi Hainan, and Jinhua An Kao, has an applicable corporate income tax rate of 25%.SC Autosports is a Dallas TX based company, which has an applicable corporate income tax rate of 21%.
We have a 50%22% ownership interest in the JVAffiliate Company, which has an applicable corporate income tax rate of 25%. Each of the JVAffiliate Company’s subsidiaries has an applicable corporate income tax rate of 25% as well..
Our actual effective income tax rate for the third quarter of 20182019 was a tax expense of 5.54% on a reported income before taxes of approximately $12.8 million, compared to a tax benefit of 7.20% on a reported loss before taxes of approximately $7.0 million compared to an effective income tax rate with a tax expense of 28.82% on a reported income before taxes of approximately $2.7 million for the same period of last year.
(p) Net income (loss)
Net lossincome was $6,521,399$12,089,441 for the third quarter of 2018, a decrease2019, representing an increase of $8,439,475$18,610,840 compared to net income $1,918,076loss $6,521,399 for the same period of last year. The increase of loss was primarily attributable to the lossgain from equity sale in the JVAffiliate Company and increased R&D expenses this period as compared to the same period of last year.
decreased research and development expense.
Excluding (i) the effects of stock compensation expenses, which were $31,675$22,925 and $1,029,171$31,675 for the third quarter of 20182019 and 2017,2018, respectively, and (ii) the change in fair value of contingent consideration which was a gain of $57,000 and a loss of $1,552,686 and $0 for the three months ended September 30, 20182019 and 2017,2018, respectively, our non-GAAP net lossincome was $4,937,038$12,055,366 for the three months ended September 30, 20182019 as compared to non-GAAP net income $2,947,247loss $4,937,038 for the same period of 2017, a decrease2018, an increase of $7,884,285,$16,992,404, or 267.5%344.2%. The increase in net lossincome (non-GAAP) was primarily attributable to lossthe gain from equity sale in the JVAffiliate Company and increased R&D expenses this period as compared to the same period of last year.
decreased research and development expense.
We make reference to certain non-GAAP financial measures, i.e., adjusted net income. Management believes that such adjusted financial results are useful for investors in evaluating our operating performance because they present a meaningful measure of corporate performance. See the non-GAAP reconciliation table below. Any non-GAAP measures should not be considered as a substitute for, and should only be read in conjunction with, measures of financial performance prepared in accordance with the GAAPGAAP.
The following table summarizes our non-GAAP net income for the three months ended September 30, 20182019 and 2017:2018:
| Three Months Ended | ||||||||
| September 30, | ||||||||
| 2018 | 2017 | |||||||
| GAAP net (loss) income | $ | (6,521,399 | ) | $ | 1,918,076 | |||
| Stock compensation expenses | 31,675 | 1,029,171 | ||||||
| Change in fair value of contingent consideration | 1,552,686 | - | ||||||
| Non-GAAP net (loss) income | $ | (4,937,038 | ) | $ | 2,947,247 | |||
| Three Months Ended | ||||||||
| September 30, | ||||||||
| 2019 | 2018 | |||||||
| GAAP net income (loss) | $ | 12,089,441 | $ | (6,521,399 | ) | |||
| Stock compensation expenses | 22,925 | 31,675 | ||||||
| Change in fair value of contingent consideration | (57,000 | ) | 1,552,686 | |||||
| Non-GAAP net income (loss) | $ | 12,055,366 | $ | (4,937,038 | ) | |||
Comparison of the Nine Months Ended September 30, 20182019 and 20172018
The following table sets forth the amounts and percentage relationship to revenue of certain items in our condensed consolidated statements of income (loss) and comprehensive income (loss) for the nine months ended September 30, 20182019 and 2017.2018.
| Nine Months Ended | ||||||||||||||||||||||||
| September 30, 2018 | % of Revenue | September 30, 2017 | % of Revenue | Change in Amount | Change in % | |||||||||||||||||||
| REVENUES FROM UNRELATED PARTY, NET | $ | 32,211,352 | 51.4 | % | $ | 10,720,595 | 17.9 | % | 21,490,757 | 200.5 | % | |||||||||||||
| REVENUES FROM JV COMPANY AND RELATED PARTY, NET | 30,479,521 | 48.6 | % | 49,233,156 | 82.1 | % | (18,753,635 | ) | (38.1 | )% | ||||||||||||||
| REVENUES, NET | 62,690,873 | 100.0 | % | 59,953,751 | 100.0 | % | 2,737,122 | 4.6 | % | |||||||||||||||
| COST OF GOODS SOLD | (53,044,861 | ) | (84.6 | )% | (50,697,990 | ) | (84.6 | )% | (2,346,871 | ) | 4.6 | % | ||||||||||||
| GROSS PROFIT | 9,646,012 | 15.4 | % | 9,255,761 | 15.4 | % | 390,251 | 4.2 | % | |||||||||||||||
| OPERATING EXPENSES: | ||||||||||||||||||||||||
| Research and development | (7,091,836 | ) | (11.3 | )% | (26,569,624 | ) | (44.3 | )% | 19,477,788 | (73.3 | )% | |||||||||||||
| Selling and marketing | (1,875,294 | ) | (3.0 | )% | (976,913 | ) | (1.6 | )% | (898,381 | ) | 92.0 | % | ||||||||||||
| General and administrative | (5,534,039 | ) | (8.8 | )% | (12,074,147 | ) | (20.1 | )% | 6,540,108 | (54.2 | )% | |||||||||||||
| Total Operating Expenses | (14,501,169 | ) | (23.1 | )% | (39,620,684 | ) | (66.1 | )% | 25,119,515 | (63.4 | )% | |||||||||||||
| LOSS FROM OPERATIONS | (4,855,157 | ) | (7.7 | )% | (30,364,923 | ) | (50.6 | )% | 25,509,766 | (84.0 | )% | |||||||||||||
| OTHER INCOME(EXPENSE): | ||||||||||||||||||||||||
| Interest income | 1,452,522 | 2.3 | % | 1,709,990 | 2.9 | % | (257,468 | ) | (15.1 | )% | ||||||||||||||
| Interest expense | (1,505,409 | ) | (2.4 | )% | (1,761,786 | ) | (2.9 | )% | 256,377 | (14.6 | )% | |||||||||||||
| Change in fair value of contingent consideration | 1,814,326 | 2.9 | % | - | 0.0 | % | 1,814,326 | - | ||||||||||||||||
| Government grants | 717,821 | 1.1 | % | 5,804,561 | 9.7 | % | (5,086,740 | ) | (87.6 | )% | ||||||||||||||
| Share of (loss) after tax of JV | (79,592 | ) | (0.1 | )% | (13,455,786 | ) | (22.4 | )% | 13,376,194 | (99.4 | )% | |||||||||||||
| Other income, net | 666,294 | 1.1 | % | 143,617 | 0.2 | % | 522,677 | 363.9 | % | |||||||||||||||
| Total other income (expense), net | 3,065,962 | 4.9 | % | (7,559,404 | ) | (12.6 | )% | 10,625,366 | (140.6 | )% | ||||||||||||||
| LOSS BEFORE INCOME TAXES | (1,789,195 | ) | (2.9 | )% | (37,924,327 | ) | (63.3 | )% | 36,135,132 | (95.3 | )% | |||||||||||||
| INCOME TAX BENEFIT | 370,316 | 0.6 | % | 4,130,951 | 6.9 | % | (3,760,635 | ) | (91.0 | )% | ||||||||||||||
| NET LOSS | (1,418,879 | ) | (2.3 | )% | (33,793,376 | ) | (56.4 | )% | 32,374,497 | (95.8 | )% | |||||||||||||
| Nine Months Ended | ||||||||||||||||||||||||
| September 30, 2019 | % of Revenue | September 30, 2018 | % of Revenue | Change in Amount | Change in % | |||||||||||||||||||
| REVENUES FROM UNRELATED PARTY, NET | $ | 63,360,044 | 85.7 | % | $ | 32,211,352 | 51.4 | % | 31,148,692 | 96.7 | % | |||||||||||||
| REVENUES FROM THE AFFILIATE COMPANY AND RELATED PARTY, NET | 10,543,190 | 14.3 | % | 30,479,521 | 48.6 | % | (19,936,331 | ) | (65.4 | )% | ||||||||||||||
| REVENUES, NET | 73,903,234 | 100.0 | % | 62,690,873 | 100.0 | % | 11,212,361 | 17.9 | % | |||||||||||||||
| COST OF GOODS SOLD | (61,288,228 | ) | (82.9 | )% | (53,044,861 | ) | (84.6 | )% | (8,243,367 | ) | 15.5 | % | ||||||||||||
| GROSS PROFIT | 12,615,006 | 17.1 | % | 9,646,012 | 15.4 | % | 2,968,994 | 30.8 | % | |||||||||||||||
| OPERATING EXPENSES: | ||||||||||||||||||||||||
| Research and development | (1,766,210 | ) | (2.4 | )% | (7,091,836 | ) | (11.3 | )% | 5,325,626 | (75.1 | )% | |||||||||||||
| Selling and marketing | (2,448,291 | ) | (3.3 | )% | (1,875,294 | ) | (3.0 | )% | (572,997 | ) | 30.6 | % | ||||||||||||
| General and administrative | (11,096,246 | ) | (15.0 | )% | (5,534,039 | ) | (8.8 | )% | (5,562,207 | ) | 100.5 | % | ||||||||||||
| Total Operating Expenses | (15,310,747 | ) | (20.7 | )% | (14,501,169 | ) | (23.1 | )% | (809,578 | ) | 5.6 | % | ||||||||||||
| LOSS FROM OPERATIONS | (2,695,741 | ) | (3.6 | )% | (4,855,157 | ) | (7.7 | )% | 2,159,416 | (44.5 | )% | |||||||||||||
| OTHER INCOME (EXPENSE): | ||||||||||||||||||||||||
| Interest income | 559,954 | 0.8 | % | 1,452,522 | 2.3 | % | (892,568 | ) | (61.4 | )% | ||||||||||||||
| Interest expense | (1,304,062 | ) | (1.8 | )% | (1,505,409 | ) | (2.4 | )% | 201,347 | (13.4 | )% | |||||||||||||
| Change in fair value of contingent consideration | 694,000 | 0.9 | % | 1,814,326 | 2.9 | % | (1,120,326 | ) | (61.7 | )% | ||||||||||||||
| Government grants | 725,189 | 1.0 | % | 717,821 | 1.1 | % | 7,368 | 1.0 | % | |||||||||||||||
| Gain from equity dilution in the Affiliate Company | 4,291,974 | 5.8 | % | - | 0.0 | % | 4,291,974 | - | ||||||||||||||||
| Gain from equity sale in the Affiliate Company | 20,574,217 | 27.8 | % | - | 0.0 | % | 20,574,217 | - | ||||||||||||||||
| Share of loss after tax of the Affiliate Company | (22,883,126 | ) | (31.0 | )% | (79,592 | ) | (0.1 | )% | (22,803,534 | ) | 28650.5 | % | ||||||||||||
| Other income , net | 357,626 | 0.5 | % | 666,294 | 1.1 | % | (308,668 | ) | (46.3 | )% | ||||||||||||||
| Total other income, net | 3,015,772 | 4.1 | % | 3,065,962 | 4.9 | % | (50,190 | ) | (1.6 | )% | ||||||||||||||
| INCOME (LOSS) BEFORE INCOME TAXES | 320,031 | 0.4 | % | (1,789,195 | ) | (2.9 | )% | 2,109,226 | (117.9 | )% | ||||||||||||||
| INCOME TAX BENEFIT | 41,780 | 0.1 | % | 370,316 | 0.6 | % | (328,536 | ) | (88.7 | )% | ||||||||||||||
| NET INCOME (LOSS) | 361,811 | 0.5 | % | (1,418,879 | ) | (2.3 | )% | 1,780,690 | (125.5 | )% | ||||||||||||||
30
(a) Revenue
For the nine months ended September 30, 2018,2019, our revenue was $62,690,873$73,903,234 compared to 59,953,751$62,690,873 for the same period of 2017,2018, representing an increase of $2,737,122$11,212,361 or 4.6%17.9%. The increase in revenue was mainly due to the increase in both EV parts and off-road vehicles sales during this period. The selling prices of our products for the nine months ended September 30, 2018 decreased on average from the same period last year.quarter. The increase in revenueEV parts sales was primarily due to the increaseincreased sales volume of sales volume.battery packs.
The following table summarizes our revenues by product types for the nine months ended September 30, 20182019 and 2017:2018:
| Nine Months Ended September 30 | ||||||||
| 2018 | 2017 | |||||||
| Sales Revenue | Sales Revenue | |||||||
| Primary geographical markets | $ | 62,690,873 | $ | 59,953,751 | ||||
| Overseas | $ | 8,337,793 | $ | 3,621,439 | ||||
| China | 54,353,080 | 56,332,312 | ||||||
| Total | $ | 62,690,873 | $ | 59,953,751 | ||||
| Major products | ||||||||
| EV parts | $ | 53,947,874 | $ | 55,875,765 | ||||
| Off-road vehicles | 8,742,999 | 4,077,986 | ||||||
| Total | $ | 62,690,873 | $ | 59,953,751 | ||||
| Timing of revenue recognition | ||||||||
| Products transferred at a point in time | $ | 62,690,873 | $ | 59,953,751 | ||||
| Total | $ | 62,690,873 | $ | 59,953,751 | ||||
| Nine Months Ended September 30, | ||||||||
| 2019 | 2018 | |||||||
| Sales | Sales | |||||||
| EV parts | $ | 57,607,687 | $ | 53,947,874 | ||||
| Off-road vehicles | 16,295,547 | 8,742,999 | ||||||
| Total | $ | 73,903,234 | $ | 62,690,873 | ||||
EV Parts
During the nine months ended September 30, 2018,2019, our revenuesrevenue from the sale of EV parts werewas $57,607,687, representing an increase of $3,659,813 or 6.8% from $53,947,874 representing a decrease of $1,927,891 or 3.5% from $55,875,765 for the same period of 2017.2018.
Our revenue for the nine months ended September 30, 2018 primarily consisted of revenue from the sales of battery packs, body parts, EV controllers, air conditioning units and other auto parts for use in the manufacturing of EV products, whichproducts. These sales accounted for 86.1% of total sales. Among total sales for the nine months ended September 30, 2018, approximately 71.1% were related to the sale of battery packs. Besides the sale of battery packs, approximately 5.1% of total sales were related to sales of EV controllers, approximately 4.1%78.0% of the total sales were related to sales of air conditioning units, approximately 4.4% of total sales were related to sales of EV drive motors and approximately 1.4% of total sales were related to sales of body parts and other auto parts.sales.
During the nine months ended September 30, 2019 and 2018, and 2017, our revenuesrevenue from the sale of EV parts to the JVAffiliate Company and its subsidiaries accounted for approximately 49%14% and 82%49% of our total net revenue for the period, respectively. The decrease largely attributable to the Affiliate Company’s temporary declining sales, which was caused by its product adjustments. In this year, the EV parts we soldprovided to the JVAffiliate Company were primarily used in manufacturing purefor battery upgrade and market maintenance for the EV products bythat were previously put into the JV Company’s subsidiaries.leasing market.
Off-Road Vehicles
During the nine months ended September 30, 2018,2019, our revenuesrevenue from the salesales of off-road vehicles, including go karts, all-terrain vehicles (“ATVs”), and others, were $8,742,999,$16,295,547, representing an increase of $4,665,013$7,552,548 or 114.4%86.4% from $4,077,986$8,742,999 for the same periodquarter of 2017, which2018. The increase in revenue of the off-road vehicles was largely due to the additional sales from SC Autosports.Autosports, which became our wholly-owned U.S. subsidiary in July 2018.
Our off-road vehicles business line accounted for approximately 13.9%22.0% of our total net revenue for the nine months ended September 30, 2018. Of our off-road vehicle revenue, our go-kart business accounted for approximately 4.7% of our total net revenue, and our ATV business accounted for approximately 9.2% of our total net revenue.2019.
The following table shows the breakdown of our net revenues:
| Nine Months Ended September 30, | ||||||||
| 2019 | 2018 | |||||||
| Sales Revenue | Sales Revenue | |||||||
| Primary geographical markets | ||||||||
| Overseas | $ | 15,975,711 | $ | 8,337,793 | ||||
| China | 57,927,523 | 54,353,080 | ||||||
| Total | $ | 73,903,234 | $ | 62,690,873 | ||||
| Major products | ||||||||
| EV parts | $ | 57,607,687 | $ | 53,947,874 | ||||
| Off-road vehicles | 16,295,547 | 8,742,999 | ||||||
| Total | $ | 73,903,234 | $ | 62,690,873 | ||||
| Timing of revenue recognition | ||||||||
| Products transferred at a point in time | $ | 73,903,234 | $ | 62,690,873 | ||||
(b) Cost of goods sold
Cost of goods sold was $53,044,861$61,288,228 during the nine months ended September 30, 2018,2019, representing an increase of $2,346,871,$8,243,367, or 4.6%15.5%, compared to $50,697,990$53,044,861 for the same period of 2017.2018. The increase was primarily due to the corresponding increase in sales. Please refer to the below Gross Profit section for product margin analysis.
(c) Gross profit
Our margins by product for the nine months ended September 30, 20182019 and 20172018 are as set forth below:
| Nine Months Ended September 30, | Nine Months Ended September 30, | |||||||||||||||||||||||||||||||||||||||||||||||||||||||||||||||
| 2018 | 2017 | 2019 | 2018 | |||||||||||||||||||||||||||||||||||||||||||||||||||||||||||||
| Sales | Cost | Gross Profit | Margin % | Sales | Cost | Gross Profit | Margin % | Sales | Cost | Gross Profit | Margin % | Sales | Cost | Gross Profit | Margin % | |||||||||||||||||||||||||||||||||||||||||||||||||
| EV parts | $ | 53,947,874 | 46,093,092 | 7,854,782 | 14.6 | % | $ | 55,875,765 | 47,147,335 | 8,728,430 | 15.6 | % | $ | 57,607,687 | 48,565,387 | 9,042,300 | 15.7 | % | $ | 53,947,874 | 46,093,092 | 7,854,782 | 14.6 | % | ||||||||||||||||||||||||||||||||||||||||
| Off-road vehicles | 8,742,999 | 6,951,769 | 1,791,230 | 20.5 | % | 4,077,986 | 3,550,655 | 527,331 | 12.9 | % | 16,295,547 | 12,722,841 | 3,572,706 | 21.9 | % | 8,742,999 | 6,951,769 | 1,791,230 | 20.5 | % | ||||||||||||||||||||||||||||||||||||||||||||
| Total | $ | 62,690,873 | 53,044,861 | 9,646,012 | 15.4 | % | $ | 59,953,751 | 50,697,990 | 9,255,761 | 15.4 | % | $ | 73,903,234 | 61,288,228 | 12,615,006 | 17.1 | % | $ | 62,690,873 | 53,044,861 | 9,646,012 | 15.4 | % | ||||||||||||||||||||||||||||||||||||||||
Gross profit for the first three quarters of 2018 increased4.2%2019 increased 30.8% to $9,646,012,$12,615,006, compared to $9,255,761$9,646,012 for the same period last year. This was primarily attributable to the sales increase in off-road vehicles.increase. Our gross margin remained at15.4%increased to 17.1% compared to 15.4% for the same period of 2017.Although2018. The increase in our gross margin was mainly due to increased selling price of the vast majoritycharging and exchanging equipment and the increased proportion of the high-margin battery processing business this year. The higher gross profits camemargin from less profitable EV parts business in the nine months ended September 30, 2018, the off-road vehicles businessvehicle sales of SC Autosports, which became more profitable this period and contributed more gross profits compared to that for the same period of last year, which was largely dueour wholly-owned U.S. subsidiary in July 2018, also contribute to the addition of SC Autosports’ business.increased gross margin.
(d) Research and development
Research and development expenses, including materials, labor, equipment depreciation, design, testing, inspection, and other related expenses totaled $7,091,836$1,766,210 for the first three quarters of 2018,2019, representing a decrease of $19,477,788$5,325,626 or 73.3%75.1% compared to $26,569,624$7,091,836 for the same period of last year. ThisThe decrease was primarily due to the completion of most R&D works and the significant decrease in research and development expensesexpense related to the development of EV Model K23 at Hainan facility forin the nine months ended September 30,third quarter of last year. Such R&D work has been completed in year 2018. For the nine months ended September 30, 2018
(e) Sales and 2017, approximately 61.2%marketing
Selling and 96.5% of our research and developmentdistribution expenses were spent on the research and development of EV Model K23 at Hainan facility, respectively, and the rest was spent on other various EV and off-road vehicles research and development projects.
Sales and marketing expenses were $1,875,294$2,448,291 for the first three quarters of 2018,2019, compared to $976,913$1,875,294 for the same period last year, representing an increase of $898,381$572,997 or 92.0%.This30.6%. The increase was primarily attributable to inclusion of the increase in shipping costs and sales labor as compared to last year. The additional sales and marketing expenses from newly acquired SC Autosports, also contributed this increase.
which became our wholly-owned U.S. subsidiary in July 2018.
(f) General and administrative expenses
General and administrative expenses were $5,534,039$11,096,246 for the first three quarters of 2018,2019, compared to $12,074,147$5,534,039 for the same period of last year, a decrease inrepresenting an increase of expenses of $6,540,108or 54.2%$5,562,207 or 100.5%. For the nine months ended September 30, 2018,2019, general and administrative expenses included $1,337,333 as expenses for common stock awards and stock options to employees and Board members, compared to $253,934 for the same period of 2018, representing the result of $2,898,811 inas expenses for common stock awards and stock options to employees and Board members net of $2,644,877 of reversal of previously accrued stock option expenses for forfeited stock option compared to $5,522,358 of common stock awards and stock options expenses for the same period in 2017.nine months ended September 30, 2018. Excluding stock compensation expense,expenses, our net general and administrative expenses for the nine months ended September 30, 20182019 were $5,280,105, a decrease$9,758,913, representing an increase of $1,271,684,$4,478,808, or 19.4%84.8%, from $6,551,789$5,280,105 for the same period of 2017,2018, which was largely because we accrued contingent loss of approximately $2.9 million in connection with litigation last year. However,due to the increased laboroperation costs and amortization expenses for intangible assets this period partially offset this impact.of the Company since Hainan facility has been put into production.
(g) Interest income
Interest income was $1,452,522$559,954 for the first three quarters of 2018,2019, representing a decrease of $257,468$892,568 or 15.1%61.4% compared to $1,709,990$1,452,522 for the same period of last year. ThisThe decrease was primarily attributable to the decreased interestsinterest earned on loans to the JVAffiliate Company and bank deposits.since Kandi Vehicles’ loan to Affiliate converted to equity in the second quarter of 2018.
(h) Interest expenses
Interest expenses were $1,505,409$1,304,062 in the first three quarters of 2018,2019, representing a decrease of $256,377$201,347 or 14.6%13.4% compared to $1,761,786$1,505,409 for the same period of last year. ThisThe decrease was primarily due to lessdecreased interest expenses incurred associated with the note payable to a third party.party, as well as decreased discounts associated with the settlement of bank acceptance notes. Of the interest expenses, $78,272,$0, and $62,191$78,272 were discounts associated with the settlement of bank acceptance notes for the nine months ended September 30, 2019 and 2018, and 2017, respectively.
(i) Change in fair value of contingent consideration
For the first three quarters of 2018,2019, the gain related to changes in the fair value of contingent consideration was $694,000, representing a decrease of $1,120,326 or 61.7% compared to gain related to changes in the fair value of contingent consideration of $1,814,326 for the same period of last year, which was mainly the result ofdue to the decrease in fair value of contingent consideration liability between the acquisition dateDecember 31, 2018 and September 30, 2018 for2019 was less than the acquisitiondecrease in the same period of JinhuaAn Kao.last year.
(j) Government grants
Government grants were $717,821$725,189 for the first three quarters of 2018,2019, compared to $5,804,561for$717,821 for the same periodquarter last year, representing a decreasean increase of $5,086,740,$7,368, or 87.6%.This decrease1.0%. This increase in government grants was because of the government’s implementation of a new policy with the purpose of supporting companies that have no or less layoff of their employees.
(k) Gain from equity dilution in the Affiliate Company
Gain from equity dilution was $4,291,974 for the first three quarters of 2019 which was primarily because there were significantdue to gain from the March Affiliate Loan to Equity Conversion. Pursuant to the Transfer Agreement, the Affiliate Company converted a loan of RMB 314 million (approximately $45.7 million) from Geely Group last year to equity in order to increase its cash flow. As a result, our equity interests in the Affiliate Company decreased to 43.47% in March, 2019.
(l) Gain from equity sale in the Affiliate Company
Gain from equity sale was $20,574,217 for first three quarters of 2019, which was due to the Affiliate Equity Transfer. In March, 2019, Kandi Vehicles agreed to sell 21.47% of its equity interests in the Affiliate Company to Geely for a total amount of government subsidies we receivedRMB 516 million (approximately $72.3 million). As of September 30, 2019, the equity transfer had been completed. Therefore, in the third quarter of 2019, the Company has recognized the gain from Hainan provincial government to assist our development of new EV model last year.equity sale.
(m) Share of income (loss) after tax of the Affiliate Company
For the first three quarters of 2018, the JV Company’s net sales were $73,292,774, gross profit was $4,007,896, and net loss was $87,969. We accounted for our investments in the JV Company under the equity method of accounting because we have a 50% ownership interest in the JV Company. As a result, we recorded 50% of the JV Company’s loss for $43,985 for the first three quarters of 2018. After eliminating intra-entity profits and losses,2019, our share of loss after tax of the JVAffiliate Company was $79,592$22,883,126 for the first three quarters of 2018, a decrease loss of $13,376,1942019 as compared to $13,455,786 of share of loss after tax of the JV Company$79,592 in the same period of last year. The decrease oflosses incurred by the JVAffiliate Company were largely attributable to the Affiliate Company’s losstemporary declining sales decline, which was largely due to realized local government grants for operations this period.caused by its product adjustments.
During the first three quarters of 2018, the JV Company sold a total of 6,599 units of EV products in the PRC.(n) Other income, net
Net other income was $666,294$357,626 for the first three quarters of 2018, an increase2019, representing a decrease of $522,677$308,668 or 363.9%46.3% compared to net other income of $143,617$666,294 for the same period of last year, which was largely due to the fees earned on technology development services duringin the second quarter.same period of last year.
(o) Income Taxes
In accordance with the relevant Chinese tax laws and regulations, our applicable corporate income tax rate is 25%. However, Kandi Vehicles isVehicle and Jinhua An Kao are qualified as a high technology enterprisecompanies in China and isare therefore entitled to use a reduced corporate income tax rate of 15%.
Each of our wholly-owned or partially-owned subsidiaries, Kandi New Energy, YongkangScrou,Yongkang Scrou and Kandi Hainan, and JinhuaAn Kao, has an applicable corporate income tax rate of 25%.SC Autosports is a Dallas TX based company, which has an applicable corporate income tax rate of 21%.
We have a 50%22% ownership interest in the JVAffiliate Company, which has an applicable corporate income tax rate of 25%. Each of the JVAffiliate Company’s subsidiaries has an applicable corporate income tax rate of 25% as well.
Our actual effective income tax rate for the first three quarters of 20182019 was a tax benefit of 13.05% on a reported income before taxes of approximately $0.3 million, compared to a tax benefit of 20.70% on a reported loss before taxes of approximately $1.8million, compared to an effective income tax rate with a tax benefit of 10.89% for the same period of last year on a reported loss before taxes of approximately $37.9$1.8 million.
(p) Net income (loss)
Net lossincome was $1,418,879$361,811 for the first three quarters of 2018, a decrease loss2019, representing an increase of $32,374,497$1,780,690 compared to net loss $33,793,376$1,418,879 for the same period of last year. The decreaseincrease was primarily attributable to the increased revenue, decreased lossresearch and development expense and the gain from equity sale in the JV Company, decreased stock option expenses and decreased R&D expenses this period.
Affiliate Company.
Excluding (i) the effects of stock compensation expenses, which were $1,337,333 and $2,898,811 net of a reversal for forfeited stock option of $2,644,877 and $5,522,358 for the first three quarters of 20182019 and 2017,2018, respectively, and (ii) the change in fair value of contingent consideration which was a gain of $1,814,326$694,000 and $0$1,814,326 for the nine months ended September 30, 20182019 and 2017,2018, respectively, our non-GAAP net lossincome was $2,979,271for$1,005,144 for the nine months ended September 30, 20182019 as compared to non-GAAP net loss $28,271,018$2,979,271 for the same period of 2017, a decrease loss2018, an increase of $25,291,747,$3,984,415, or 89.5%133.7%. The decreaseincrease in net lossincome (non-GAAP) was primarily attributable to the increased revenue, decreased lossresearch and development expense and the gain from equity sale in the JV Company and decreased R&D expenses this period.
Affiliate Company.
We make reference to certain non-GAAP financial measures, i.e., adjusted net income. Management believes that such adjusted financial results are useful for investors in evaluating our operating performance because they present a meaningful measure of corporate performance. See the non-GAAP reconciliation table below. Any non-GAAP measures should not be considered as a substitute for, and should only be read in conjunction with, measures of financial performance prepared in accordance with the GAAP.
The following table summarizes our non-GAAP net income for the nine months ended September 30, 20182019 and 2017:2018:
| Nine Months Ended | ||||||||
| September 30, | ||||||||
| 2018 | 2017 | |||||||
| GAAP net loss | $ | (1,418,879 | ) | $ | (33,793,376 | ) | ||
| Stock compensation expenses | 253,934 | 5,522,358 | ||||||
| Change in fair value of contingent consideration | (1,814,326 | ) | - | |||||
| Non-GAAP net loss | $ | (2,979,271 | ) | $ | (28,271,018 | ) | ||
| Nine Months Ended | ||||||||
| September 30, | ||||||||
| 2019 | 2018 | |||||||
| GAAP net income (loss) | $ | 361,811 | $ | (1,418,879 | ) | |||
| Stock compensation expenses | 1,337,333 | 253,934 | ||||||
| Change in fair value of contingent consideration | (694,000 | ) | (1,814,326 | ) | ||||
| Non-GAAP net income (loss) | $ | 1,005,144 | $ | (2,979,271 | ) | |||
LIQUIDITY AND CAPITAL RESOURCES
Cash Flow
For the first three quarters of 2018,2019, cash used in operating activities was $836,809,$25,425,152, as compared to cash used in operating activities of $698,599$836,809 for the same period of last year. Our operating cash inflows include cash received primarily from sales of our EV parts and off-road vehicles. These cash inflows are offset largely by cash paid primarily to our suppliers for production materials and parts used in our manufacturing process, operation expenses, employee compensation, and interest expenses onof our financings. The major operating activities that provided cash for the first three quarters of 20182019 were an increasea decrease of accounts payableamount due from the Affiliate Company of $101,684,965 net of assignment of notes receivable from unrelated parties to supplier to settle accounts payable of $20,126,196, assignment of notes receivable from JV Company and related parties to supplier to settle accounts payable of $57,956,363, settlement of accounts payable with notes payables of $23,846,161, adjustment of construction in progress to reduce accounts payable of $8,153,573, adjustment of advance to supplier to increase accounts payable of $479,575 and cancellation of notes payables to increase accounts payable of $10,746,580 and an increase of other payables and accrued liabilities of $29,845,307.$30,549,072. The major operating activity that used cash for first three quarters of 20182019 was an increase in receivables from the JV Company of $81,549,214 net of settlement of due from JV Company and related parties with notes receivable of $62,549,758 and due from JV Company converted to investment in JV Company of $83,669,804, and an increase of accounts receivable of $52,845,923 net of settlement of accounts receivables with notes receivable from unrelated parties of $49,620,953.
For the first three quarters of 2018, cash used in investing activities was $682,504, as compared to cash provided by investing activities of $2,568,453 for the same period of last year. During the first three quarters of 2018, the major investing activity that used cash was the acquisition of Jinhua An Kao net of cash received in the amount of $3,610,846.
$36,822,184.
For the first three quarters of 2018,2019, cash derived from investing activities was $31,087,397, as compared to cash used in investing activities of $682,504 for the same period of last year. The major investing activities that provided cash for the first three quarters of 2019 were an increase of cash received from equity sale in Affiliate Company of $32,061,558. The major investing activities that used cash for first three quarters of 2019 were $955,670 used for the purchases of property, plant and equipment.
For the first three quarters of 2019, cash used from financing activities was $3,631,969,$1,035,235, as compared to cash used in financing activities of $3,778,336$3,631,969 for the same period of last year. The major financing activities that provided cash for the first three quarters of 20182019 were proceeds from notes payable of $40,313,800 and proceeds from short-term bank loans of $25,515,452.$27,864,409. The major financing activities that used cash for first three quarters of 20182019 were $43,024,633$26,261,331 of repayment of notes payable and $26,283,065 of repayments of short-term bank loans.
Working Capital
We had a working capital deficit of $12,186,911$80,374,159 at September 30, 2018 as Kandi Vehicle increased its capital contribution to the JV Company by converting its RMB 545 million (approximately $79 million)2019, which reflects an increase of loans lent to the JV Company to the JV Company’s registered capital, which reflected a decrease of $65,894,813$77,847,248 from a working capital surplus of $53,707,902$2,526,911 as of December 31, 2017.2018.
During the first quarter of 2019, the Company signed an agreement to sell 21.47% of its equity interests in the Affiliate Company to Geely for a total amount of RMB 516 million (approximately $72.3 million). As of September 29, 2019, the Company had received payments in cash totaling RMB 220 million (approximately $30.9 million) and certain commercial acceptance notes of RMB 296 million (approximately $41.6 million) from Geely, of which RMB 140 million (approximately $19.7 million) shall mature on January 20, 2020 and the remaining RMB 156 million (approximately $21.9 million) shall mature on March 29, 2020. The Company plans to apply the proceeds from the equity transfer to its ongoing operations.
We have historically financed our operations through short-term commercial bank loans from Chinese banks. The termbelieve the working capital of these loans is typically for one year, and upon the payment of all outstanding principal and interest in a particular loan, the banks have typically rolled over the loan for an additional one-year term, with adjustments made to the interest rate to reflect prevailing market rates. We believe this practice has been ongoing year after year and that short-term bank loansCompany will be available with normal trade terms if needed.greatly improved after we receive the above payments.
Capital Requirements and Capital Provided
Capital requirements and capital provided for the nine months ended September 30, 20182019 were as follows:
| Nine Months Ended | Nine Months Ended | |||||||
| September 30, 2018 | September 30, 2019 | |||||||
| (In Thousands) | (In Thousands) | |||||||
| Capital requirements | ||||||||
| Purchase of plant and equipment | $ | 305 | $ | 956 | ||||
| Purchases of land use rights and other intangible assets | 105 | |||||||
| Acquisition of Jinhua An Kao | 3,611 | |||||||
| Purchase of construction in progress | 425 | 18 | ||||||
| Repayments of short-term bank loans | 26,283 | 26,261 | ||||||
| Repayments of long-term bank loans | 154 | 146 | ||||||
| Repayments of notes payable | 43,025 | |||||||
| Cash used for stock buyback | 2,493 | |||||||
| Internal cash used in operations | 837 | 25,425 | ||||||
| Increase in cash | 3,699 | |||||||
| Total capital Requirements | $ | 74,745 | $ | 58,998 | ||||
| Capital provided | ||||||||
| Acquisition of SC | 487 | |||||||
| Proceeds from short-term bank loan | 25,515 | 27,864 | ||||||
| Proceeds from notes payable | 40,314 | |||||||
| Decrease in cash | 5,664 | |||||||
| Long term investment | 1,458 | |||||||
| Reimbursement of capitalize interests for construction in progress | 1,818 | |||||||
| Cash received from equity sale in the Affiliate Company | 32,062 | |||||||
| Total capital provided | $ | 75,256 | $ | 59,926 | ||||
The difference between capital provided and capital required is caused by the effect of exchange rate changes over the past threenine months.
Contractual Obligations and Off-balance Sheet Arrangements
Contractual Obligations
The following table summarizes our contractual obligations:
| Contractual obligations | Payments due by period | |||||||||||||||||||
| Total | Less than 1 year | 1-3 years | 3-5 years | More than 5 years | ||||||||||||||||
| R&D Obligations | $ | 8,738,076 | 8,738,076 | - | - | - | ||||||||||||||
| Hainan Obligations | 13,980,922 | 13,980,922 | - | - | - | |||||||||||||||
| Loans from Haikou Rural Credit Cooperative | $ | 28,981,286 | - | - | 28,981,286 | - | ||||||||||||||
| Total | $ | 51,700,284 | 22,718,998 | - | 28,981,286 | - | ||||||||||||||
To build the Hainan facility, the Company signed contracts with Nanjing Shangtong Auto Technologies Co., Ltd. (“Nanjing Shangtong”) to purchase a production line and develop a new EV model. As of September 30, 2018, the total contractual amount with Nanjing Shangtong was RMB 912,000,000 or approximately $133 million, of which RMB 756,000,000 or approximately $110 million has been paid and RMB 156,000,000 or approximately $23 million of remaining payments are outstanding as contractual obligations.
Short-term and long-term Loans:Loans:
For the discussion of short-term and long-term loans, please refer to Note 1618 - Short-term and Long-term Loans under Notes to Condensed Consolidated Financial Statements.
Notes payable:
For the discussion of notes payable, please refer to Note 1719 - Notes Payable under Notes to Condensed Consolidated Financial Statements.
Guarantees and pledged collateral for third party bank loans
For the discussion of guarantees and pledged collateral for third party bank loans, please refer to Note 23 –Commitments25 – Commitments and Contingencies under Notes to Condensed Consolidated Financial Statements.
Recent Development Activities:
On August 27, 2018,weSeptember 23, 2019, the Company announced that SC Autosports unveiled Kandi’s two new American Pure Electric Vehicle (“EV”Kandi Vehicles and DGL Group signed a Purchase Framework Agreement (the “Agreement”) Models in Dallas, Texas —on behalf of Kandi Vehicles and DGL Group regarding an initial batch order of 300,000 electric scooters and 500,000 electric self-balancing scooters. The total value of the SUV model EX3Agreement is expected to be about RMB 500 million (approximately $70.5 million).The purchased products are expected to be completed and the two-seater model K22. Distinguished guests including state and local government officials attended the unveiling event, along with a number of media representatives and automobile dealers. The two American EV Models—the model EX3 and the model K22 — have undergone several driving performance upgradesdelivered within one year from the original models, to specifically accommodate the needsdate of the U.S. market. The newer models’ performance, battery life, and driving experience have been upgraded to strengthen their presence in the U.S. market. The participating government officials, media attendees, and dealers were very satisfied with the new models which exceeded expectations. Attendees were confident of the Company and these vehicles entering the American EV market.signing this Agreement.
On September 20, 2018,we30, 2019, the Company announced that accordingit has completed the transfer of 21.74% of equity interests in the Affiliate Company to Public Notice No. 45 issued by China’s Ministry of Industry and Information Technology (“MIIT”) and State Administration of Taxation (“SAT”) promulgatedGeely on September 17, 2018, Geely Brand Electric Vehicle (“EV”) SMA7001BEV49 (Model EX3) and SMA7001BEV47 (Model K23), developed by the JV Company was listed in the twentieth approved directory of New Energy Vehicles. As a result, the Model EX3 and K23 are now qualified for purchase tax exemption. These two EV models met all the sale requirements after obtaining approvals from MIIT for Directory of New Products, Recommended Models for New Energy Vehicles and the Tax Exemption Directory. We believe the Model EX3 and K23 will be the engine that propels Kandi’s growth going forward.29, 2019.
On September 26, 2018,we announced that the JV Company hosted a ceremony for the launch of the first batch of Kandi model EX3 pure electric vehicles at Shanghai facility on September 25, 2018.Geely Global Hawk EX3, developed by the JV Company is a model that has excited mass consumers since its release. Furthermore, a great amount of dealers have expressed their interest and confidence in the EX3. Following the receipt of approvals from MIIT (China’s Ministry of Industry and Information Technology) for Directory of New Products, Recommended Models for New Energy Vehicles, and the Tax Exemption Directory, the JV Company has officially begun the sale of model EX3. After repeated testing and polishing, the EX3 is finally ready to be introduced to the market. We believe this model will live up to the efforts of Company staff and meet the expectations of shareholders by generating a greater improvement in Kandi’s forthcoming sales performance.
On October 1, 2018,we announced that Zhejiang Geely Auto Limited - Shanghai Subsidiary, a business partner of2, 2019, the JV Company received a total of RMB 305 million (approximately $44.3 million) in tax credits. The refund of the Value Added Tax (“VAT”) remaining tax credit is made by the State Administration of Taxation (the “SAT”) through a new policy intended to promote sustainable economic development. A select number of advanced equipment manufacturers were given tax refunds on the VAT remaining tax credit at the end of 2018’s tax season. The amount refunded to Zhejiang Geely corresponds to the production and sale of Kandi products by the JV Company in the years of 2015, 2016, and 2017. As a result, the JV Company expects to receive such a payment from Zhejiang Geely. The refunded tax credits demonstrate that the State’s focus is on supporting the advanced manufacturing industry. This additional cash flow will further improve the JV Company’s competitiveness.
On October 3, 2018,we announced that Kandi Purebrand EV Models EX3 and K22 continue to make significant progress in the American marketplace. Both models havemodel K23, manufactured by Kandi Hainan, received the written acknowledgement of eligibility for credit and the amount of the qualifying credit from Internal Revenue Service of Department of the Treasury forup to $7,500 in tax credits under the New Qualified Plug-in Electric Drive Motor Vehicle Credit effective immediately. According to(the “Credit”) from the Internal Revenue Code Section 30D, manufacturers must provide appropriate information to be eligibleService. Therefore, new U.S. buyers who purchase model K23 will qualify for the Credit. Kandi has completedSC Autosports hosted EV model K23 Launch Conference in Garland, Texas during September 21-23, 2019, with over 120 distributors from all over the entire application process.U.S. as attendants. After an on-site test drive, the distributors were enthusiastic about K23’s market potential in the U.S. and showed their high interests in distributing model K23. As a result, Kandi Hainan signed a purchasersupply contract (the “Contract”) for the initial 2000 model K23 with SC Autosports on October 1, 2019. The value of the Contract is about $32 million. According to the Contract, the first 200 vehicles are expected to be delivered by the end of 2019.
On October 14, 2019, the Company announced that according to the executed Purchase Framework Agreement dated September 22, 2019 between its wholly-owned subsidiary, Kandi Models EX3Vehicles and K22DGL Group, Kandi Vehicles started delivering the initial batch of 1,232 electric scooters and 37,755 electric self-balancing scooters on October 11, 2019.
On November 4, 2019, the Company announced that it has newly developed two new mini pure EV models. The first model is a four-wheeled mini pure EV. The second model is a three-wheeled mini pure EV. These vehicles are intended for use in America may claimresidential settings to meet U.S. market demand according to DGL Group Inc. (USA) (“DGL Group”)’s market analysis research. After Kandi has undergone several rounds of technical and performance tests on the Creditmini EVs, five of upeach mini EV model prototypes are completed and ready to $7,500.00 duringbe shipped to DGL Group for further tests in the tax year under Internal Revenue Code Section 30D. Followingbeginning of this month.
On November 11, 2019, the approval of federal tax credit, Kandi’s EV products have become more competitive in both priceCompany announced that its first automatic intelligent battery exchange system passed the inspection on November 10, 2019. The system features automatic functions which perform an intelligent charging and quality.battery exchange. The battery exchanging time for each vehicle is only 90 seconds, which ranks among the current top battery exchange equipment.
Item 3. Quantitative and Qualitative Disclosures about Market Risk
This item is not applicable to us.
Item 4. Controls and Procedures.
Evaluation of Disclosure Controls and Procedures
We have evaluated, under the supervision of our Chief Executive Officer (“CEO”) and our interim Chief Financial Officer (“Interim CFO”), the effectiveness of disclosure controls and procedures (as such term is defined in Rules 13a-15(e) and 15d-15(e) under the Securities Exchange Act of 1934 (the “Exchange Act”) as of September 30, 2018.2019. Based on this evaluation, our CEO and Interim CFO concluded that as of the end of the period covered by this report, our disclosure controls and procedures were effective.
Disclosure controls and procedures are controls and procedures that are designed to ensure that information required to be disclosed in our reports filed or submitted under the Exchange Act (a) is recorded, processed, summarized and reported within the time periods specified in the SEC’s rules and forms and (b) is accumulated and communicated to management, including our CEO and Interim CFO, as appropriate, to allow timely decisions regarding required disclosure. Our management recognizes that any controls and procedures, no matter how well designed and operated, can provide only reasonable assurance of achieving their objectives and management necessarily applies its judgment in evaluating the cost-benefit relationship of possible controls and procedures. Our disclosure controls and procedures are designed to provide reasonable assurance of achieving their objectives as described aboabove.
Changes in Internal Control over Financial Reporting
There was no change to our internal control over financial reporting (as defined in Rules 13a-15(f) and 15d-15(f) under the Exchange Act) that occurred during the period covered by this report that have materially affected, or are reasonably likely to materially affect, our internal control over financial reporting.
PART II – OTHER INFORMATION
From time to time, the Company is involved in legal matters arising in the ordinary course of business. Except as set forth in Note 2325 - COMMITMENTS AND CONTINGENCIES under Notes to Condensed Consolidated Financial Statements, our management is currently not aware of any legal matters or pending litigation that would have a significant effect on the Company’s results of operation of financial statements. Furthermore, the Company is not aware of any other legal matters in which any director, officer, or any owner of record or beneficial owner of more than five percent of any class of voting securities of the Company, or any affiliate of any such director, officer, affiliate of the Company, or security holder, is a party adverse to the Company or has a material adverse interest to the Company. For the detailed discussion of our legal proceedings, please refer to Note 2325 - COMMITMENTS AND CONTINGENCIES under Notes to Condensed Consolidated Financial Statements, which is incorporated by reference herein.
Item 1A. Risk Factors.2.Unregistered Sales of Equity Securities and Use of Proceeds
Changes and further delays in subsidy payments may have negative impacts on our operations.Issuer Purchases of Equity Securities
On May 14, 2019, we announced that our board of directors had authorized the repurchase of up to $20 million worth of our common stock in open market transactions or in privately negotiated transactions. The change in subsidy payment methods in 2017 from paid in advance to paid post-sale and any further delay in releasing subsidy payments forfollowing table sets forth information regarding shares of our common stock that we repurchased during the EVs manufactured and sold inthree months ended September 30, 2019.
| Period | (a) Total number of shares purchased | (b) Average price paid per share | (c) Total number of shares purchased as part of publicly announced plans or programs | (d) Maximum number (or approximate dollar value) of shares that may yet be purchased under the plans or programs | ||||||||||||
| July 1 to July 30, 2019 | - | $ | - | - | $ | 20,000,000 | ||||||||||
| August 1 to August 31, 2019 | 487,155 | $ | 5.09 | 487,155 | $ | 17,520,381 | ||||||||||
| September 1 to September 30, 2019 | - | $ | - | - | $ | - | ||||||||||
| Total | 487,155 | $ | 5.09 | 487,155 | $ | 17,520,381 | ||||||||||
In summary, the prior years might cause delays in collectionCompany had repurchased a total of accounts receivable from our business partners, which will temporarily increase the pressure on our working capital for continuing operations. The unavailability, reduction or elimination487,155 common shares at an average stock price of government and economic incentives could have a material adverse effect on our business, financial condition, operating results and prospects.$5.09 per share as of September 30, 2019.
| Exhibit Number | Description | |
| 31.1 | Certification of Principal Executive Officer pursuant to Rule 13a-14(a)/15d-14(a) under the Securities Exchange Act of 1934 | |
| 31.2 | Certification of Principal Financial Officer pursuant to Rule 13a-14(a)/15d-14(a) under the Securities Exchange Act of 1934 | |
| 32.1 | Certification of Principal Executive Officer and Principal Financial Officer pursuant to 18 U.S.C. § 1350, as Adopted Pursuant to § 906 of the Sarbanes-Oxley Act of 2002 | |
| 101.INS | XBRL Instance Document. | |
| 101.SCH | XBRL Taxonomy Extension Schema Document. | |
| 101.CAL | XBRL Taxonomy Extension Calculation | |
| 101.LAB | XBRL Taxonomy Extension Label | |
| 101.PRE | XBRL Taxonomy Extension Presentation | |
| 101.DEF | XBRL Taxonomy Definitions |
39
SIGNATURES
Pursuant to the requirements of the Securities Exchange Act of 1934, as amended, the registrant caused this report to be signed on its behalf by the undersigned, thereunto duly authorized.
| Date: November | By: | /s/ Hu Xiaoming |
| Hu Xiaoming | ||
| President and Chief Executive Officer | ||
| (Principal Executive Officer) | ||
| Date: November | By: | /s/ |
| Interim Chief Financial Officer | ||
| (Principal Financial Officer and | ||
40