Fair Value of Financial Instruments
Fair value is defined as the exchange price that would be received for an asset or paid to transfer a liability (an exit price) in the principal or most advantageous market for the asset or liability in an orderly transaction between market participants as of the measurement date. Applicable accounting guidance provides an established hierarchy for inputs used in measuring fair value that maximizes the use of observable inputs and minimizes the use of unobservable inputs by requiring that the most observable inputs be used when available. Observable inputs are inputs that market participants would use in valuing the asset or liability and are developed based on market data obtained from sources independent of the Company. Unobservable inputs are inputs that reflect the Company’s assumptions about the factors that market participants would use in valuing the asset or liability. There are three levels of inputs that may be used to measure fair value:
| Level 1 | - Observable inputs that reflect quoted prices (unadjusted) for identical assets or liabilities in active markets. |
| Level 2 | - Include other inputs that are directly or indirectly observable in the marketplace. |
| Level 3 | - Unobservable inputs which are supported by little or no market activity. |
Level 1 - Observable inputs that reflect quoted prices (unadjusted) for identical assets or liabilities in active markets.
Level 2 - Include other inputs that are directly or indirectly observable in the marketplace.
Level 3 - Unobservable inputs which are supported by little or no market activity.
The fair value hierarchy also requires an entity to maximize the use of observable inputs and minimize the use of unobservable inputs when measuring fair value.
Fair-value estimates discussed herein are based upon certain market assumptions and pertinent information available to management as of September 30, 20192020 and December 31, 2018.2019. The respective carrying value of certain on-balance-sheet financial instruments approximated their fair values. These financial instruments include cash and cash equivalents, accounts payable, and accrued liabilities. Fair values for these items were assumed to approximate carrying values because of their short-term nature or they are payable on demand.
HYRECAR INC.
NOTES TO UNAUDITED FINANCIAL STATEMENTS
(Unaudited)
Cash and Cash Equivalents
For purpose of the consolidated statement of cash flows, the Company considers institutional money market funds and all highly liquid debt instruments purchased with an original maturity of three months or less to be cash equivalents.
Insurance Reserve
The Company records a loss reserve for insurance deductible orphysical damage that the Company paysand other liability coverage caused to car owners based on the Company’s policy in relationowner vehicles up to the Company's insurance policy in effect at the time.deductibles, which vary by state. This reserve represents an estimate for both reported accidents claims not yet paid, and claims incurred but not yet reported and are recorded on a non-discounted basis. The lag time in reported claims is minimal and as such represents a low risk of unreported claims being excluded from the loss reserve assessment. The adequacy of the reserve is monitored quarterly and is subject to adjustment in the future based upon changes in claims experience, including the number of incidents for which the Company is ultimately responsible and changes in the cost per claim, or changes to the Company’s policy as to what amounts of the deductible or claim will be paid by the Company. As of September 30, 2019, and December 31, 2018, $640,637 and $348,442 was included in the accompanying balance sheets related to the loss reserve, respectively, where the expense is reflected in the general and administrative within the statements of operations.
LiabilityWhile certain liability insurance claims may take several years to completely settle, and the Company has limited historical loss experience. Because ofCompany's liability exposure limit is generally met in the near term. Due to our limited operational history, the Company makes certain assumptions based on both currently available information to estimate the insurance reserves as well as third party claims adjuster data provided on existing claims. A number of factors can affect the actual cost of a claim, including the length of time the claim remains open, economic and healthcare cost trends and the results of related litigation. Furthermore, claims may emerge in future periods for events that occurred in a prior period that differs from expectations. Accordingly, actual losses may vary significantly from the estimated amounts reported in the consolidated financial statements. Reserves are continually reviewed quarterly and adjusted as necessary as experience develops or new information becomes known. However, ultimate results may differ from the Company’s estimates, which could result in losses over the Company’s reserved amounts. Such adjustments are recorded in general and administrative expenses.costs of revenues.
Offering Costs
The Company accounts for offering costs in accordance with Accounting Standards Codification (“ASC”) 340, Other Assets and Deferred Costs. Prior to the completion of an offering, offering costs were capitalized as deferred offering costs on the balance sheet. The deferred offering costs are netted against the proceeds of the offering in stockholders’ equity or the related debt, as applicable.
Convertible Debt and Warrant
Convertible debt is accounted for under the guidelines established by ASC 470-20, Debt with Conversion and Other Options. ASC 470-20 governs the calculation of an embedded beneficial conversion and/or debt issued with warrants, which is treated as a discount to the instruments where derivative accounting does not apply. The discounts are accreted over the term of the debt.
The Company calculates the fair value of warrants and conversion features issued with convertible instruments using the Black-Scholes valuation method, using the same assumptions used for valuing employee options for purposes of ASC 718, Compensation – Stock Compensation, except the contractual life of the warrant or conversion feature is used. Under these guidelines, the Company allocates the value of the proceeds received from a convertible debt transaction between the conversion feature and any other detachable instruments (such as warrants) on a relative fair value basis. The allocated fair value is recorded as a debt discount or premium and is amortized over the expected term of the convertible debt to interest expense.
Preferred Stock
ASC 480, Distinguishing Liabilities from Equity, includes standards for how an issuer of equity classifies and measures on its balance sheet certain financial instruments with characteristics of both liabilities and equity.
Management is required to determine the presentation for the preferred stock because of the redemption and conversion provisions, among other provisions. Specifically, management is required to determine whether the embedded conversion feature in the preferred stock is clearly and closely related to the host instrument, and whether the bifurcation of the conversion feature is required and whether the conversion feature should be accounted for as a derivative instrument. If the host instrument and conversion feature are determined to be clearly and closely related (both more akin to equity), derivative liability accounting under ASC 815, Derivatives and Hedging, is not required. Management determined the host contract of the preferred stock is more akin to equity, and accordingly, derivative liability accounting is not required by the Company. The Company has presented preferred stock within stockholders’ equity (deficit) section of the balance sheet.
Costs incurred directly for the issuance of the preferred stock were recorded as a reduction of gross proceeds received by the Company, resulting in a discount to the preferred stock.
HYRECAR INC.
NOTES TO UNAUDITEDCONSOLIDATED FINANCIAL STATEMENTS
(Unaudited)
In connection with the closing of the Company’s IPO, all outstanding shares of convertible preferred stock were converted into 2,429,638 shares of common stock.
Revenue Recognition
The Company generates the majority of its revenue from its ridesharing marketplace that connects vehicle owners and drivers and the related insurance issued for each rental.
The Company also recognizes revenue from other sources such as referrals, motor vehicle record fees (application fees), late rental fees, dealership subscription fees, and other fees charged to drivers in specific situations.
The Company has adopted Accounting Standards Codification Topic 606 (“ASC 606”) – Revenue from Contracts with Customers, as of January 1, 2019 using the modified retrospective method. The adoption of ASC 606 did not materially impact the way the Company recognizes revenue.
In applying the guidance of ASC 606, the Company 1) identifies the contract with the customer 2) identifies the performance obligations in the contract 3) determines the transaction price, 4) determines if an allocation of that transaction price is required to the performance obligations in the contract, and 5) recognizes revenue when or as the companies satisfies a performance obligation.
Refunds may occur when the driver returns the owner vehicle early based on the terms of the original contract or cancels the rental prior to completing the exchange. In limited circumstances, the Company provides contingent consideration in the form of a rebate that is redeemable only if the customer completes a specific level of transaction over a specific time period. In such cases, the rebate or refund obligation is recognized as a reduction of revenues. The Company defers revenue in all instances when the earnings process is not yet complete.
The following is a breakout of revenue components by subcategory for the three and nine months ended September 30, 20192020 and 2018:2019.
| | | Three Months
Ended
September 30, | | | Nine Months
Ended
September 30, | | |
| | | 2019 | | 2018 | | 2019 | | 2018 | | | Three Months ended
September 30,2020 |
| Three Months ended
September 30, 2019 |
| Nine Months ended
September 30, 2020 | | Nine Months ended
September 30, 2019 | |
| Insurance and administration fees | | $ | 1,848,524 | | | $ | 1,307,094 | | | $ | 5,390,289 | | | $ | 3,501,704 | | | $ | 3,422,809 |
| $ | 1,848,524 |
| $ | 9,346,517 | | $ | 5,390,289 | |
| Transaction fees | | | 1,614,001 | | | | 866,144 | | | | 4,385,885 | | | | 2,395,245 | | |
| 3,019,518 |
| 1,614,001 |
| | 8,077,555 | | 4,385,885 | |
| Other fees | | | 382,361 | | | | 581,469 | | | | 1,640,232 | | | | 1,025,974 | | |
| 428,886 |
| 382,361 |
| | 1,055,444 | | 1,640,232 | |
| Incentives and rebates | | | (134,614 | ) | | | (68,755 | ) | | | (394,317 | ) | | | (249,289 | ) | |
| (57,388 | ) |
|
| (134,614 | ) |
| | (301,890 | ) | | | (394,317 | ) |
| Net revenue | | $ | 3,710,272 | | | $ | 2,685,952 | | | $ | 11,022,089 | | | $ | 6,673,634 | | | $ | 6,813,825 |
| $ | 3,710,272 |
| $ | 18,177,626 | | $ | 11,022,089 | |
Insurance and transaction fees are charged to a driver in a single transaction. Drivers currently do not have an option to decline insurance at any point during the transaction.HYRECAR INC.
NOTES TO CONSOLIDATED FINANCIAL STATEMENTS
Principal-Agent(Unaudited)
Principal Agent Considerations
The Company evaluates our service offerings to determine if we are acting as the principal or as an agent, which we consider in determining if revenue should be reported gross or net. One of our primary revenue sources is a transaction fee made from a confirmed booking of a vehicle onon our platform. Key indicators that we evaluate to reach this determination include:
| ● | the terms and conditions of our contracts; |
| ● | whether we are paid a fixed percentage of the arrangement’s consideration or a fixed fee for each transaction; |
| ● | the party which sets the pricing with the end-user, has the credit risk and provides customer support; and |
| ● | the party responsible for delivery/fulfillment of the product or service to the end consumer. |
HYRECAR INC.
NOTES TO UNAUDITED FINANCIAL STATEMENTS
(Unaudited)
We have determined we act as the agent in the transaction for vehicle bookings, as we are not the primary obligor of the arrangement and receive a fixed percentage of the transaction fee.transaction. Therefore, revenue is recognized on a net basis and included in the above table as transaction fees.basis.
For other fees such as insurance, referrals, and motor vehicle records (application fees), and dealer subscription we have determined revenue should be recorded on a gross basis. In such arrangements, the Company sets pricing, has risk of economic loss, has certain credit risk, provides support services related to these transactions, and has decision making ability about service providers used.
Cost of Revenues
Cost of revenues primarily include direct fees paid for insurance to cover the vehicle driver and owner, insurance claim payments and estimated liabilities based on the policy in effect at the time of loss, merchant processing fees, technology and hosting costs, and motor vehicle record fees incurred for paid driver applications as well as hostingapplications. General liability insurance that covers corporate risk from activity on our platform is included in general and platform-related technology cost.administrative costs.
Advertising
Advertising
The Company expenses the cost of advertising and promotions as incurred. Advertising expense was $1,888,931$1,696,452 and $1,338,714$1,888,931 for the nine months ended September 30, 2020 and 2019, and 2018, respectively.
Research and Development
We incur research and development costs during the process of researching and developing our technologies and future offerings. Our research and development costs consist primarily of non-capitalized development and maintenance costs. We expense these costs as incurred unless such costs qualify for capitalization under applicable guidance.
Stock-Based Compensation
The Company accounts for stock optionsawards issued under ASC 718, Compensation – Stock Compensation. Under ASC 718, stock-based compensation cost is measured at the grant date, based on the estimated fair value of the award. Stock-based compensation is recognized as expense over the employee’s requisite vesting period and over the nonemployee’s period of providing goods or services. The fair value of each stock option or warrant award is estimated on the date of grant using the Black-Scholes option valuation model. Restricted shares are measured based on the fair market value of the underlying stock on the grant date.
HYRECAR INC.
NOTES TO UNAUDITEDCONSOLIDATED FINANCIAL STATEMENTS
(Unaudited)
Stock-based compensation is included in the consolidated statements of operations as follows. See Note 5 for equity transactions:follows:
| | | Three Months Ended
September 30, | | | Nine Months Ended
September 30, | | |
| | | 2019 | | 2018 | | 2019 | | 2018 | | | Three Months ended
September 30, 2020
|
|
| Three Months ended
September 30, 2019
|
| Nine months ended
September 30, 2020 | | Nine months ended
September 30, 2019 | |
| General and administrative | | $ | 479,308 | | | $ | 60,861 | | | $ | 1,155,482 | | | $ | 1,951,849 | | | $ | 77,101 | |
| $ | 479,308 |
| $ | 2,149,160 | | $ | 1,155,482 | |
| Sales and marketing | | | 71,233 | | | | 37,259 | | | | 241,346 | | | | 164,004 | | |
| 27,605 |
| 71,233 |
| | 287,680 | | 241,346 | |
| Research and development | | $ | 24,092 | | | $ | (11,397 | ) | | $ | 88,353 | | | $ | 36,591 | | | $ | 39,394 |
| $ | 24,092 |
| $ | 173,572 | | $ | 88,353 | |
Loss per Common Share
The Company presents basic loss per share (“EPS”) and diluted EPS on the face of the consolidated statements of operations. Basic loss per share is computed as net loss divided by the weighted average number of common shares outstanding for the period. For periods in which we incur a net loss, the effects of potentially dilutive securities would be antidilutive and would be excluded from diluted EPS calculations. As ofFor the nine months ended September 30, 2020 and 2019, there were 1,179,464 and2,754,945 options or warrants excluded, 301,700 and 2018, the securities summarized below, which entitle the holders thereof to acquire351,900 restricted stock units excluded, and 100,000 and 100,000 forfeitable restricted stock shares of common stock, were excluded, from the calculation of earnings per share, as their effect would be anti-dilutive.respectively.
| | | September 30, | |
| | | 2019 | | | 2018 | |
| Stock options and warrants | | | 2,754,945 | | | | 2,792,356 | |
| Restricted stock units | | | 351,900 | | | | - | |
| Forfeitable restricted common stock | | | 100,000 | | | | 825,000 | |
| Total | | | 3,206,845 | | | | 3,617,356 | |
Concentration of Credit Risk
The Company maintains its cash with a major financial institution located in the United States of America which it believes to be credit worthy. Balances are insured by the Federal Deposit Insurance Corporation up to $250,000. At times, the Company maintains balances in excess of the federally insured limits.
Other Concentrations
The Company relieshas historically relied on onea two primary insurance agencybrokers and underwriters to provide allautomobile insurance on vehicles in service. There are multiple brokers and carriers who issue this type of insurance coverage, and the Company is regularly making reviewing leading insurers in the transportation and mobility sectors as this is an important part of our operations. The company does not believe the loss of this insurance carrierour current broker or underwriter would have a negativematerial effect on our operations.
New Accounting Standards
In June 2018,February 2016, the Financial Accounting Standards Board (“FASB”) issued Accounting Standards Update (“ASU”) 2018-07, Compensation – Stock Compensation: Improvements to Nonemployee Share-Based Payment Accounting, which expands the scope of current stock compensation recognition standards to include share-based payment transactions for acquiring goods or services from nonemployees. The Company adopted ASU 2018-07 on January 1, 2019 and the adoption did not have a material impact on its consolidated financial statements.
In January 2017, the FASB issued ASU No. 2017-04, Goodwill and Other (Topic 350): Simplifying the Test for Goodwill Impairment, which simplifies the subsequent measurement of goodwill by eliminating Step 2 from the goodwill impairment test. The amendments also eliminate the requirements for any reporting unit with a zero or negative carrying amount to perform a qualitative assessment and, if it fails that qualitative test, to perform Step 2 of the goodwill impairment test. An entity still has the option to perform the qualitative assessment for a reporting unit to determine if the quantitative impairment test is necessary. This guidance is effective for the annual or any interim goodwill impairment tests in fiscal years beginning after December 15, 2019. Early adoption is permitted for interim or annual goodwill impairment tests performed on testing dates after January 1, 2017. The Company reviewed the provisions of the new standard, but believes it is not applicable to the Company.
HYRECAR INC.
NOTES TO UNAUDITED FINANCIAL STATEMENTS
(Unaudited)
In February 2016, the FASB issued ASU No. 2016-02, Leases (Topic 842), specifying the accounting for leases, which supersedes the leases requirements in Topic 840, Leases. The objective of Topic 842 is to establish the principles that lessees and lessors shall apply to report useful information to users of consolidated financial statements about the amount, timing, and uncertainty of cash flows arising from a lease. Lessees are permitted to make an accounting policy election to not recognize the asset and liability for leases with a term of twelve months or less. Lessors’ accounting is largely unchanged from the previous accounting standard. In addition, Topic 842 expands the disclosure requirements of lease arrangements. Lessees and lessors will use a modified retrospective transition approach, which includes several practical expedients. This guidance is effective for fiscal years, and interim periods within those fiscal years, beginning after December 15, 2019,2021 for emerging growth companies, with early adoption permitted. The Company has reviewed the provisions of the new standard, but it is not expected to have a significant impact on the Company.
HYRECAR INC.
NOTES TO CONSOLIDATED FINANCIAL STATEMENTS
(Unaudited)
In May 2014,December 2019, the FASB issued ASU No. 2014-09, Revenue from Contracts with Customers (Topic 606)guidance that simplifies the accounting for income taxes by removing certain exceptions in existing guidance and has issued subsequent amendments to thisimproves consistency in application by clarifying and amending existing guidance. This new standard replaces all current guidance on this topic and eliminate all industry-specific guidance. The new revenue recognition standard provides a unified model to determine when and how revenue is recognized. The core principle is that a company should recognize revenue to depict the transfer of promised goods or services to customers in an amount that reflects the consideration for which the entity expects to be entitled in exchange for those goods or services. The guidance is effective for interim and annual periods beginning after December 15, 2017 for public business entities2020, and December 15, 2018 for all other entities. The standard could have been applied either retrospectivelyinterim periods within those annual periods, where the transition method varies depending upon the specific amendment. Early adoption is permitted, including adoption in any interim period. An entity that elects to eachearly adopt the amendments in an interim period presented or as a cumulative-effect adjustmentshould reflect any adjustments as of the datebeginning of adoption.the annual period that includes that interim period, and all amendments must be adopted in the same period. The Company has adopted ASC 606reviewed the provisions of the new standard, but it is not expected to have a significant impact on the Company.
In January 2020, the FASB issued ASU No. 2020-01, "Investments-Equity Securities (Topic 321), Investments-Equity Method and Joint Ventures (Topic 323), and Derivatives and Hedging (Topic 815): Clarifying the Interactions between Topic 321, Topic 323, and Topic 815", which clarifies the interaction of the accounting for equity securities under Topic 321 and investments accounted for under the equity method of accounting under Topic 323, and the accounting for certain forward contracts and purchased options accounted for under Topic 815. This guidance is effective for the Company for fiscal years beginning after December 15, 2020, including interim periods within those fiscal years. Early adoption is permitted. The Company has reviewed the provisions of the new standard, but it is not expected to have a significant impact on the Company.
In August 2020, the FASB issued ASU No. 2020-06, “Debt - Debt with Conversion and Other Options (Subtopic 470-20) and Derivatives and Hedging - Contracts in Entity’s Own Equity (Subtopic 815-40): Accounting for Convertible Instruments and Contracts in an Entity’s Own Equity”, which simplifies the accounting for convertible instruments by eliminating the requirement to separate embedded conversion features from the host contract when the conversion features are not required to be accounted for as of January 1, 2019 usingderivatives under Topic 815, Derivatives and Hedging, or that do not result in substantial premiums accounted for as paid-in capital. By removing the modified retrospectiveseparation model, a convertible debt instrument will be reported as a single liability instrument with no separate accounting for embedded conversion features. This new standard also removes certain settlement conditions that are required for contracts to qualify for equity classification and simplifies the diluted earnings per share calculations by requiring that an entity use the if-converted method and based on our analysis didthat the effect of potential share settlement be included in diluted earnings per share calculations. This new standard will be effective for the Company for fiscal years beginning after December 15, 2021, including interim periods within those fiscal years. Early adoption is permitted, but no earlier than fiscal years beginning after December 15, 2020. The Company has reviewed the provisions of the new standard, but it is not expected to have a material effectsignificant impact on revenue recognition.the Company.
In October 2020, the FASB issued ASU No. 2020-08, “Receivables - Nonrefundable Fees and Other Costs (Subtopic 310-20): Accounting for Premium Amortization on Purchased Callable Debt Securities", which clarifies amortized cost basis of an individual callable debt security exceeds the amount repayable by the issuer at the next call date, the excess shall be amortized to the next call date. This new standard will be effective for the Company for fiscal years beginning after December 15, 2021, including interim periods within those fiscal years. Early adoption is permitted, but no earlier than fiscal years beginning after December 15, 2020. The Company has reviewed the provisions of the new standard, but it is not expected to have a significant impact on the Company.
The FASB issues ASUs to amend the authoritative literature in ASC. There have been several ASUs to date, including those above, that amend the original text of ASC. Management believes that those issued to date either (i) provide supplemental guidance, (ii) are technical corrections, (iii) are not applicable to us or (iv) are not expected to have a significant impact our consolidated financial statements.
NOTE 3 – COMMITMENTS AND CONTINGENCIES
Settlement and Legal Proceedings
On November 13, 2018, two founders of the Company (the “Claimant Founders”), initiated two lawsuits in the Superior Court of California, County of San Francisco, entitled Nathaniel Farber v. HyreCar Inc., Case No. CGC-18-571257 and Josiah Larkin v. HyreCar Inc., Case No. CGC-18-571258. The complaints for the lawsuits, which were largely duplicative, allege that the Company breached the Settlement Agreement by and between the Company and the Claimant Founders byWe are not allowing the Claimant Founders to sell stock in the initial public offering (“IPO”) of the Company, failing to offer to buyback Claimant Founders’ stock at the time of the IPO, allowing the issuance of certain stock without proportionately increasing the stock ownership of Claimant Founders, and not providing certain required information to the Claimant Founders. The Company strongly disagrees with all of the allegations and intends to vigorously contest both lawsuits. The Company believes that, at all times, its actions have been consistent with the terms, conditions, and context of the Settlement Agreement, as well as applicable law. Pursuant to a motion brought by the Company, the two lawsuits have been joined for pretrial and trial purposes. The joined litigation is in the discovery phase. At this time, the Company is unable to estimate potential damage exposure, if any, related to the litigation.
The Company iscurrently involved in any significant legal arbitration or governmental proceedings, and we are not aware of any claims and litigation fromor actions pending or threatened against us. From time to time, as an operating business, we are involved in the normal coursedisputes (both formal and informal) with customer, partners and employees. The resolution of business. At September 30, 2019, the Company believes there are no pending matters, except as noted above, that could be expected towhich we do not anticipate would have a material adverse effect onimpact to the business of the Company, its financial condition, results of operations or cash flows.statements.
HYRECAR INC.
NOTES TO UNAUDITEDCONSOLIDATED FINANCIAL STATEMENTS
(Unaudited)
NOTE 4 – DEBT AND LIABILITIES
Accrued Liabilities
A summary of accrued liabilities for the periods endingas of September 30, 20192020 and December 31, 20182019 is as follows:
| | | September 30,
2019 | | | December 31,
2018 | | | 2020 | | 2019 | |
| Accrued payables | | $ | 246,368 | | | $ | 452,307 | | | $ | 1,669,736 | | $ | 394,896 | |
| Driver deposit | | | 176,675 | | | | 192,769 | | | 210,401 | | 161,601 | |
| Deferred rent | | | 9,938 | | | | 73,886 | | | 67,591 | | 98,000 | |
| Payroll liabilities | | | - | | | | 3,154 | | | — | | 161,113 | |
| Accrued interest expense | |
|
| 22,781 |
|
| — |
|
| Other accrued liabilities | | | 57,588 | | | | 53,741 | | | | — | | | 88,302 | |
| Accrued liabilities | | $ | 490,569 | | | $ | 775,857 | | | $ | 1,970,509 | | $ | 903,912 | |
Note Payable
2018 Convertible Notes and Warrants
During the first and second quarter of 2018, pursuant to a securities purchase agreement,On April 13, 2020, the Company issued and sold senior secured convertible promissory notes (the “2018 Convertible Notes”entered into a loan with JPMorgan Chase Bank, N.A. as the lender (“Lender”) to accredited investors in thean aggregate principal amount of $3,046,281. Gross principal amounts were net of $267,702 withheld, resulting in for net proceeds$2,004,175 pursuant to the CompanyPaycheck Protection Program ("PPP") under the Coronavirus Aid, Relief, and Economic Security (CARES) Act. The PPP Loan is evidenced by a promissory note (“Note”). Subject to the terms of $2,778,579.the Note, the PPP Loan bears interest at a fixed rate of one percent (1%) per annum, with the first six months of interest deferred, has an initial term of two years, and is unsecured and guaranteed by the Small Business Administration. The Company incurred additional offering costsmay apply to the Lender for forgiveness of $67,882 for a total debt discount of $335,584,the PPP Loan, with the amount which was fully amortized by the IPO date. The 2018 Convertible Notes bore interest at the rate of 13% per annum and were due eight months from the original issue date, which ranged from September to December 2018 (the “Maturity Dates”). The 2018 Convertible Notes provided that the principal and all accrued and unpaid interest on the 2018 Convertible Notes were convertible into shares of common stock at a conversion ratemay be forgiven equal to the lessersum of $2.5480 per share or seventy percent (70%)payroll costs, covered rent, and covered utility payments incurred by the Company during the 24-week period beginning on April 13, 2020, calculated in accordance with the terms of the IPO price per share. Upon pricingCARES Act. The Note provides for customary events of default including, among other things, cross-defaults on any other loan with the IPO, atLender. The PPP Loan may be accelerated upon the optionoccurrence of an event of default.
As of September 30, 2020, the PPP amount payable under the Note is $1,999,175. The PPP Loan proceeds were used for payroll, covered rent and other covered payments and is expected to be forgiven based on current information available. Further, the Company is in the process of applying to the Lender for forgiveness of the holders, all outstanding principal plus accrued interest underlying the 2018 Convertible Notes was converted into 1,231,165 shares of common stock at a conversion rate of $2.5480.
In connection with the issuance of the 2018 Convertible Notes, each holder also received contingent five-year warrants to purchase common stock in an amount equal to 50% of the shares of common stock that the holder was entitled to in connection with the conversion of the holder’s 2018 Convertible Note when such note first became convertible, which was at the time the IPO was priced. Prior to the 2018 Convertible Note being convertible, the holder did not have a right to exercise these warrants. At the IPO pricing date, 615,585 warrants to purchase common stock became exercisable upon the conversion of the outstanding balance of the 2018 Convertible Notes, including accrued interest. The warrants have an exercise price of 125% of the conversion price, or $3.185. The Company calculated the fair value of the warrants at $1,741,334 using a Black-Scholes pricing model. The Company valued the warrants at $2.8288 per warrant using a common stock fair value of $5.00, a term of five years, a volatility of 45% and a risk-free interest rate of 2.75%. The Company allocated the debt proceeds on a relative fair value basis between the note and warrant, in which the Company recognized a note discount for $1,107,982. This was immediately recognized in interest expensePPP Loan as of the note conversion date.date of this report.
HYRECAR INC.
NOTES TO UNAUDITED FINANCIAL STATEMENTS
(Unaudited)
NOTE 5 – STOCKHOLDERS’ EQUITYDEFICIT
Preferred Stock
The Company is authorized to issue 15,000,000 shares of preferred stock, $0.00001 par value per share. Of these, the Company designated 4,471,489 shares as Series Seed 1 Convertible Preferred Stock (“Series Seed 1”). Each share of Series Seed 1 shall be entitled to cast the number of votes equal to the number of whole shares of common stock into which the shares of Series Seed 1 held are convertible as of the record date. Series Seed 1 and common stock vote together as a single class, except as provided by law or by other provisions of the certificate of incorporation.
As described in Note 1, on June 29, 2018, at the closing of the IPO, 2,429,638 shares of outstanding Series Seed 1 Convertible Preferred Stock automatically converted into 2,429,638 shares of common stock.
There are currently no shares of preferred stock issued and outstanding.
Common Stock
The Company is authorized to issue 50,000,000 shares of common stock, $0.00001 par value per share.
Stock Options
In 2016, the Boardboard of Directorsdirectors adopted the HyreCar Inc. 2016 Incentive Plan (the “2016 Plan”). The 2016 Plan provides for the grant of equity awards to highly qualified personnel, including stock options, restricted stock, stock appreciation rights, and restricted stock units to purchase shares of common stock. Up to 2,227,777 shares of common stock may be issued pursuant to awards granted under the 2016 Plan. The 2016 Plan is administered by the Board of Directors, and expires ten years after adoption, unless terminated earlier by the Board.
In 2018, the Board of Directors adopted the HyreCar Inc. 2018 Incentive Plan (the “2018 Plan”). The 2018 Plan provides for the grant of equity awards to purchase shares of common stock. Up to 3,000,000 shares of common stock may be issued pursuant to awards granted under the 2018 Plan, subject to increases that occur starting in 2021. The 2018 Plan is administered by the Board of Directors, and expires ten years after adoption, unless terminated earlier by the Board.
HYRECAR INC.
NOTES TO CONSOLIDATED FINANCIAL STATEMENTS
(Unaudited)
No stock options were granted during the nine months ended September 30, 2020. During the nine months ended September 30, 2019, and 2018, the boardBoard of directorsDirectors approved the grant of 1,125,000 and 557,500 stock options to various contractors and employees, respectively. employees. The 2019 granted options had exercise prices ranging from $3.20 to $5.53,$5.53, expire in ten years, and generally vest between two (2) and four (4) years.years. The total grant date fair value of these options was $2,077,801. The Company used the Black-Scholes option pricing model to value of stock options duringoption awards using the following input assumptions for the three and nine months ended September 30, 2019 and 2018 was approximately $2,077,801 and $972,681, respectively. The Company used the Black-Scholes option mode to value stock option awards with inputs noted below during each of the periods presented..
| | | Three Months Ended | | Nine Months Ended | | |
| | | September 30, | | September 30, | | |
| | | 2019 | | 2018 | | 2019 | | 2018 | |
| Three Month Ended
September 30, 2019 | | Nine Months Ended
September 30, 2019 | |
| | | | | | | | | | |
| | | |
| Expected volatility | | 45 | % | | 45 | % | | 45 | % | | 45 | % |
| 45% | | 45% | |
| Risk-free interest rate | | 1.73 | % | | 2.47 | % | | 1.73 – 2.61 | % | | 2.60 | % |
| 1.73% | | 1.73% - 2.61% | |
| Expected life in years | | 5.56 | | 6.25 | | 5.56 – 6.25 | | 5.39 – 6.25 | |
| 5.56 | | 5.56 - 6.25 | |
| Expected dividend yield | | 0 | % | | 0 | % | | 0 | % | | 0 | % |
| 0% | | 0% | |
Stock-basedStock -based compensation expense for stock options for the three months ended September 30, 2020 and 2019 was $24,227 and 2018 was $272,074, respectively, and $86,722, respectively,$302,510 and $789,106 and $318,018$789,106 for the nine months ended September 30, 2020 and 2019, and 2018, respectively.
As of September 30, 2019, 2020, the total estimated remaining stock-based compensation expense for unvested stock options is $2,043,704approximately $23,181 which is expected to be recognized over a weighted average period of 2.50.5 years.
HYRECAR INC.
NOTES TO UNAUDITED FINANCIAL STATEMENTS
(Unaudited)
On April 29, 2020, the Compensation Committee of the Board of Directors approved an exchange (the “Exchange”) of grants under the HyreCar Inc. 2018 Equity Incentive Plan (the “2018 Plan”) previously made to executive officers and directors of the Company (the “Grantees”). The Company recognizes stock option forfeitures as they occur as there is insufficient historical dataBoard of Directors, upon recommendation from the Committee, approved the Exchange on April 29, 2020. Pursuant to accurately determine future forfeitures rates.
Management estimated the fair valueExchange, the Grantees agreed to the cancellation of options to purchase an aggregate of 1,487,500 shares of the Company’s common stock prior tounder the IPO date by looking at2018 Plan in exchange for the issuance of an aggregate of 822,500 shares of fully-vested restricted stock under the 2018 Plan.
The Exchange was a market approach which takes into consideration past salescancellation of our commonstock options with a concurrent replacement award and preferred stock,was accounted for as well Company developments to date.
Duringa modification. For the ninethree and six months ended SeptemberJune 30, 2019,2020, the Company issued 70,703 sharesrecognized additional compensation expense of common stock for stock options that were exercised for cash and 2,188 shares of common stock for stock options that were exercised in cashless transactions. Proceeds from these exercises totaled $81,459. There were$1,434,132 pertaining to this modification. As there was no such exercisesfuture service or performance conditions associated with the replacement award, this compensation cost was fully recognized during the nine-months ended September 30, 2018. second quarter of 2020.
Restricted Stock Units and Shares Issued for Services Restricted Shares and Restricted Stock UnitsOther
During the nine months ended September 30, 2019, the Company granted 105,000360,000 restricted stock units to employees of the Company that generally vest between one and four years.
Stock-based compensation related to restricted stock units for the three months ended September 30, 2020 and 2019 was $99,303 and $102,734, respectively. Stock-based compensation related to restricted stock units for the nine months ended September 30, 2020 and 2019 was $384,200 and $204,925, respectively. As of September 30, 2020, unrecognized compensation expense related to the unvested restricted stock units is $520,454 and is expected to be recognized over approximately 1.6 years.
During the nine months ended September 30, 2020, the Company granted a contractor 100,000 restricted stock units that vest upon achieving specified milestones and business objectives. None of these milestones or objectives have been achieved to date and none are expected to vest under current circumstances.
During the nine months ended September 30, 2020, the Company granted 314,535 shares of common stock in exchange for legal and consulting services and the Company recognized stock-based compensation of $255,717 based on the closing price of the Company’s common stock on the date of grant. During the nine months ended September 30, 2020, the Company also issued 78,431shares of common stock as legal settlement to Nathaniel Farber, a founder of the Company pursuant to Case No. CGC-18-571257 pertaining to the buyback of the Claimant Founders’ stock at the time of the IPO. Stock-based compensation of $213,332 was recognized during the nine months ended September 30, 2020 based on the closing price of the Company’s common stock on the date of issue.
During the nine months ended September 30, 2019, the Company granted 105,000 shares of common stock in exchange for legal and consulting services provided by two2 service providers. The Company valued the grants at $527,650$527,650 based on the closing price of the Company’s common stock on the grant date. As of September 30, 2019 there was $64,000 recognized as a prepaid as a retainer for legal services and the remainder portion was recognized as stock-based compensation.
During the nine months ended September 30, 2019, the Company issuedgranted 10,000 shares of common stock to one1 consultant for services based on agreement entered into in January 2019. The Company valued the shares based on the closing price of the Company’s common stock on the date of the agreement and recognized $27,500 in stock-based compensation. Included in the agreement were 400,000 forfeitable restricted stock shares that vest upon achieving specific performance and strategic milestones. Currently, it is not probable the performance and strategic targets will be achieved. During the nine months ended September 30, 2019, 300,000 of the performance restricted stock shares were forfeited.
During the nine months ended September 30, 2019, the company granted 360,000 restricted stock units to employees and two members of our board of directors that generally vest between one and four years.
During the nine months ended September 30, 2018, the Company granted 264,285 shares of restricted stock to three consultants for services which fully vested upon the IPO.
During the nine months ended September 30, 2018 the Company also granted 10,000 shares of restricted common stock to a consultant for services which fully vested upon the IPO. In addition, the Company also agreed to issue the consultant an aggregate of 825,000 shares of restricted common stock with the issuance of 275,000 shares of restricted common stock upon each of three milestones. Each of the three milestones has a specific target in which the Company must meet or exceed which include i) gross bookings of rentals, ii) average daily active rentals, or iii) market capitalization. As of September 30, 2019, it is not probable the performance metrics will be met and therefore no compensation expense has been recognized as no shares of restricted common stock have been issued.
Stock-based compensation related to restricted shares and restricted stock units noted above was $102,734 and $0 during the three months ended September, 2019 and 2018, respectively. Stock-based compensation related to restricted shares and restricted stock units was $204,925 and $1,371,425 during the nine months ended September 30, 2019 and 2018, respectively.
Unrecognized compensation expense related to the unvested restricted stock units described above is approximately $1,090,142 as of September 30, 2019 and is expected to be recognized over approximately 2.2 years. During the nine months ended September 30, 2019, 8,100 restricted stock units were forfeited.
Warrants
During March 2019 several warrant holders exercised 274,224 warrants received with the 2018 Convertible Notes (Note 4). Total proceeds from the exercise of warrants was $873,403.
During the nine months ended September 30, 2019 several warrant holders exercised an aggregate of 470,062 warrants in cashless exercises, which resulted in the issuance of 174,502 shares of common stock.
HYRECAR INC.
NOTES TO UNAUDITEDCONSOLIDATED FINANCIAL STATEMENTS
(Unaudited)
Item 2. Management’s Discussion and Analysis of Financial Condition and Results of Operations
The following discussion and analysis of our financial condition and results of operations should be read together with our unaudited financial statements and related notes appearing elsewhere in this Quarterly Report on Form 10-Q and our audited financial statements and related notes for the year ended December 31, 20182019 included in our most recent Annual Report on Form 10-K. In addition to historical information, this discussion and analysis contains forward-looking statements that involve risks, uncertainties and assumptions. Our actual results may differ materially from those anticipated in these forward-looking statements as a result of certain factors. We discuss factors that we believe could cause or contribute to these differences below and elsewhere in this Quarterly Report on Form 10-Q.
Our Company
We operate in the car sharing marketplace for ride sharing through our proprietary platform. The Company has established a leading presence in MobilityTransportation as a Service (MaaS)(TaaS) through vehicle owners and institutions, such as franchise car dealerships, independent car dealerships and rental car companies, who have been disrupted by automotive asset sharing. We are based in Los Angeles, California and car owners and drivers currently use the platform in all 50 states plus Washington, D.C.nationwide. Our unique revenue opportunity for both owners and drivers isare providing a safe, secure, and reliable marketplace. We categorize our operations into one reportable business segment: Rental, consisting primarily of our vehicle rental operations in the United States.
Business and Trends
We primarily generate revenue by taking fees froma fee out of each rental processed on our platform. Each rental transaction represents a Driver renting a car from an Owner. Drivers pay a daily rental rate set by the Car Owner, plus a 10% HyreCar feeDriver Fee and direct daily insurance costs. During the three months ended September 30, 2019 we provided three service levels (“Standard” and “Premium” tiers in addition to the original “Basic” tier, with higher revenue shares for the Company associated with higher liability coverage for entities) in response to car owner requests. As a result, car ownersOwners receive their daily rental rateminusa 15-25% HyreCar fee depending on the service tier selected by the car owner.Owner Fee. For example, ifas of September 30, 2020, the average daily rental rate of a HyreCar vehicle during 2019 was $30.00 per day or $210.00 per week (a “Weekly Rental”nationally is approximately $36.00 (“Daily Rental Rate”), plus a 10% HyreCar Driver fee ($21.00)3.60) and daily direct insurance costs, thefee of $13.00, totaling $52.60 in total daily gross billings would be $322.00. This gross billing amount is charged toin paid by the Driver via a Driver’s account in one lump sum. Assuming the Standard service tier (80/20 split) $168.00 orcredit card transaction. On average approximately 80% of the daily rental rateor $28.80 is subsequently transferred to the Owner.Owner via our merchant processing partner. HyreCar earns revenues from the balance oftwo revenue share fees and the $322.00 marketplace transaction, or $154.00, and accordingly this isinsurance totaling approximately $24.16 per day. Accordingly, the U.S. GAAP reportable revenue recognized by usHyreCar is approximately $24.16 in this example transaction (asas detailed in the table below).following table:
| Weekly rental | | $ | 210.00 | | | |
| HyreCar Driver fee | | | 21.00 | | | (10% of weekly rental) |
| Direct Insurance | | | 91.00 | | | |
| HyreCar gross billings | | | 322.00 | | | |
| Owner payment | | | 168.00 | | | (80% of weekly rental) |
| HyreCar revenue | | $ | 154.00 | | | |
| * | Rounded and approximate numbers for ease of example. Actuals vary across geography. |
Daily Gross Revenue Example | | Daily Net (GAAP) Revenue Example |
| | | | | | | | |
National Average Daily Rental Rate | | $ | 36.00 | | | HyreCar Owner Fee (~21% average) | | $ | 7.56 | |
| | | | | | | | | | |
Driver Fee | | $ | 3.60 | | | HyreCar Driver Fee (10% rate) | | $ | 3.60 | |
| | | | | | | | | | |
Daily Insurance Fee | | $ | 13.00 | | | Insurance Fee (100% of fee) | | $ | 13.00 | |
| | | | | | | | | | |
Daily Gross Billing Paid by Driver | | $ | 52.60 | | | Daily Average Net Revenue | | $ | 24.16 | |
Non-U.S. GAAP Financial Measure – Gross Billings and Adjusted Earnings
Gross billings arebilling is an important measure by which we evaluate and manage our business. We define gross billings as the amount billed to Drivers, without any adjustments for amounts paid to Owners refunds or rebates.and all other revenue streams. It is important to note that gross billing is a non-GAAP measure and as such, is not recorded in our consolidated financial statements as revenue. However, we use gross billings to assess our business growth, scale of operations and our ability to generate gross billings is strongly correlated to our ability to generate revenues. Gross billings may also be used to calculate net revenue margin, defined as the company’s GAAP reportable revenue over gross billings. Using the definition of net revenue margin and the example above, HyreCar’s net revenue margin is equal to approximately 45% ($18,177,626 HyreCar’s GAAP revenue over $40,553,085 Total Gross Billings). A breakout of revenue components is provided in the section of this Annual Report on Form 10-K titled “Management’s Discussion and Analysis of Financial Condition and Results of Operations” and the footnotes to our audited consolidated financial statements.
Non-GAAP Financial Measures
Gross Billings
Gross billing is an important measure by which we evaluate and manage our business. We define gross billings as the amount billed to Drivers, without any adjustments for amounts paid to Owners and all other revenue streams. Gross billings include transactions from both our revenues recorded on a net and a gross basis. It is important to note that gross billingsbilling is a non-U.S. GAAPnon-GAAP measure and as such, is not recorded in our consolidated financial statements as revenue. However, we use gross billings to assesassess our business growth, scale of operations and our ability to generate gross billings is strongly correlated to our ability to generate revenues.
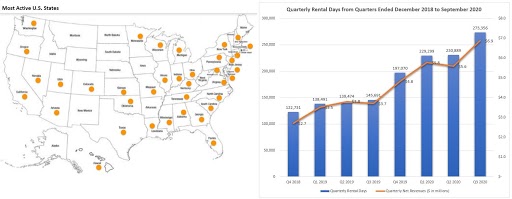
Quarterly Rental Days
($ in millions)

Gross billings may also be used to calculate net revenue margin, defined as the Company’s U.S.company’s GAAP reportable revenue over gross billings. Using the definition of net revenue margin and the example above, HyreCar’s net revenue margin is approximately 45-48% (Taking the example above: $154.00 HyreCar’s U.S. GAAP revenue over $322.00 Total Gross Billings). A breakout of revenue components is provided in MD&A and the financial footnotes.
The following table below sets forthprovides a reconciliation of our U.S. GAAP reported revenues to gross billings for the three and nine months ended September 30, 2020 and 2019:
|
| Three Months ended
September 30,
2020
|
|
| Three Months ended
September 30,
2019
|
| | Nine Months ended
September 30,
2020 | | | Nine Months ended
September 30,
2019 | |
Revenues (U.S. GAAP reported revenues) |
| $ | 6,813,825 |
|
| $ | 3,710,272 |
| | $ | 18,177,626 | | | $ | 11,022,089 | |
Add: Refunds and rebates |
|
| 389,539 |
|
|
| 330,574 |
| | | 1,124,017 | | | | 852,357 | |
Add: Owner payments (not recorded in financial statements) |
|
| 7,950,090 |
|
|
| 4,263,545 |
| | | 21,251,442 | | | | 12,779,095 | |
Gross billings (non-U.S. GAAP measure not recorded in financial statements) |
| $ | 15,153,454 |
|
| $ | 8,304,391 |
| | $ | 40,553,085 | | | $ | 24,653,541 | |
Adjusted EBITDA
Adjusted EBITDA is a key performance measure that our management uses to assess our operating performance and the operating leverage in our business. Because Adjusted EBITDA facilitate internal comparisons of our historical operating performance on a more consistent basis, we use these measures for business planning purposes. We expect Adjusted EBITDA will increase over the long term as we continue to scale our business and achieve greater efficiencies in our operating expenses.
We calculate Adjusted EBITDA as net loss, adjusted to exclude:
| ● | other income (expense), net; |
| ● | provision for income taxes; |
| ● | depreciation and amortization; |
| ● | stock-based compensation expense; and |
| ● | prior expenses expected to be settled in stock included in liabilities. |
For more information regarding the limitations of Adjusted EBITDA and a reconciliation of net loss to Adjusted EBITDA, see the section titled “Reconciliation of Non-GAAP Financial Measures.”
Reconciliation of Non-GAAP Financial Measures
We use Adjusted EBITDA in conjunction with GAAP measures as part of our overall assessment of our performance, including the preparation of our annual operating budget and quarterly forecasts, to evaluate the effectiveness of our business strategies, and to communicate with our board of directors concerning our financial performance. Our definitions may differ from the definitions used by other companies and therefore comparability may be limited. In addition, other companies may not publish these or similar metrics. Furthermore, these measures have certain limitations in that they do not include the impact of certain expenses that are reflected in our consolidated statements of operations that are necessary to run our business. Thus, our Adjusted EBITDA should be considered in addition to, not as substitutes for, or in isolation from, measures prepared in accordance with GAAP.
We compensate for these limitations by providing a reconciliation of Adjusted EBITDA to the related GAAP financial measures, revenue and net loss, respectively. We encourage investors and others to review our financial information in its entirety, not to rely on any single financial measure and to view Adjusted EBITDA in conjunction with their respective related GAAP financial measures.
The following table provides a reconciliation of net loss to Adjusted EBITDA for the three and nine months ended September 30, 20192020 and 2018:2019:
| | | Three Months ended
September 30,
2019 | | | Three Months ended
September 30,
2018 | | | Nine Months ended
September 30,
2019 | | | Nine Months ended
September 30,
2018 | |
| Revenues (U.S. GAAP reported revenues) | | $ | 3,710,272 | | | $ | 2,685,952 | | | $ | 11,022,089 | | | $ | 6,673,634 | |
| Add: Refunds, rebates and deferred revenue | | | 330,574 | | | | 166,985 | | | | 852,357 | | | | 697,983 | |
| Add: Owner payments (not recorded in financial statements) | | | 4,263,545 | | | | 3,059,177 | | | | 12,779,095 | | | | 8,180,394 | |
| Gross billings (non-U.S. GAAP measure not recorded in financial statements) | | $ | 8,304,391 | | | $ | 5,912,114 | | | $ | 24,653,541 | | | $ | 15,552,011 | |
|
| Three Months ended
September 30,
2020 |
|
| Three Months ended
September 30,
2019 |
| | Nine Months ended
September 30,
2020 | | | Nine Months ended
September 30,
2019 | |
Net loss |
| $ | (1,839,620 | ) |
| $ | (3,622,665 | ) | | $ | (9,751,311 | ) | | $ | (7,368,952 | ) |
Adjusted to exclude the following: |
|
|
|
|
|
|
|
| | | | | | | | |
Other expense (income), net |
|
| 71,419 | |
|
| (60,575 | ) | | | 35,297 | | | | (121,717 | ) |
Provision for income taxes |
|
| — |
|
|
| — |
| | | 800 | | | | — | |
Depreciation and amortization |
|
| 17,003 |
|
|
| 19,157 |
| | | 55,319 | | | | 51,243 | |
Stock-based compensation expense |
|
| 144,100 |
|
|
| 574,633 |
| | | 2,610,412 | | | | 1,485,181 | |
Prior expenses settled in issuance of stocks |
|
| — |
|
|
| — |
| | | 192,871 | | | | — | |
Adjusted EBITDA |
| $ | (1,607,098 | ) |
| $ | (3,089,450 | ) | | $ | (6,856,612 | ) | | $ | (5,954,245 | ) |
Adjusted Earnings (or Loss) is another important measure by which we evaluate and manage our business. We define Adjusted Earnings as the Earnings without any adjustments for non-cash consideration paid for stock-based compensation to employees or vendors.
Our operating results are subject to variability due to seasonality, macroeconomic conditions such as the recent novel coronavirus outbreak (“COVID-19”) and other factors. Car rental volumes tend to be associated with travel and driving holidays, where there is an influx of Uber and Lyft demand. Thus far in 2019,2020, we have continued to operate in an uncertain and uneven economic environment marked by heightened economic and geopolitical risks. Nonetheless, we continuerisks due to anticipate that demand for vehicle rental and car sharing services will increase in 2019, most likely against a backdrop of modest and uneven global economic growth.the COVID-19 situation.
Our objective is to focus on strategically accelerating our growth, strengthening our position as a leading provider of vehicle rental services to Uberridesharing (Lyft and LyftUber) and delivery (Door Dash, Instacart and Postmates) drivers, continuing to enhance our customers’ rental experience, and controlling costs and driving efficiency throughout the organization. We operate in a high growth industry and we expect to continue to face challenges and risks. We seek to mitigate our exposure to risks in numerous ways, including delivering upon our core strategic initiatives, continued growth of fleet levels to match changes in demand for vehicle rentals, and appropriate investments in technology.
DuringSome highlights for the periodthree months ended September 30, 2019:2020 include:
| ● | Net revenues increased 38.2%, or $1.0 million, to $3.7 millionrental days totaled approximately 273,000 rental days for the three months ended September 30, 2019, as compared to $2.7 million for the same period in the prior year, but decreased 2.4% sequentially from $3.8 million in the prior quarter. While booking revenue increased 4.3% during the quarter as net2020, an increase of approximately 133,000 rental days increased to approximately 146,000 inor 95.0% over the third quarter from approximately 140,000 in the second quarter, a reduction in referral revenue from the rideshare network companies (including Uber and Lyft) caused in part by reduced driver incentive commissions offered by such companies after their initial public offerings, reduced the Company’s net revenue. |
| ● | Gross Profit increased 61.2%, or $0.9 million, to $2.3 million for the three months ended September 30, 2019, as compared to $1.5 million for the same period in the prior year, and 1.3% sequentially from $2.3 million in the prior quarter. Operating efficiencies due to increasing scale continued to favorably impact our direct costs and as a result, Gross Profit Margin increased to 63.0% for the three months ended September 30, 2019, as compared to 54.0% for the same period the prior year, and 60.7% sequentially from the prior quarter. |
| ● | Operating Expenses increased 87.0% to $6.0 millionrental days recognized during the three months ended September 30, 2019, as comparedthe Company continued to $3.2 million for the same periodexpand its presence in the prior year, due to increased staffing expenses, marketing and insurance claims payments. This does include $0.6 million in non-cash stock-based compensation this quarter, up from $0.1 million the prior year. This is a 37.3% or $1.6 million sequential increase in operating expenses from $4.4 million the prior quarter.key markets. |
| ● | Our Net loss increased by $1.8 million, or 103.6%, to $3.6 million, or ($0.24), per sharerevenues totaled $6,813,825 for the three months ended September 30, 2020, an increase of $3,103,553 or 83.6% over the $3,710,272 recognized during the three months ended September 30, 2019, primarily as compared to $1.8 million or ($0.15) per share fora result of the same period in the prior year and $2.1 million or ($0.17) per share for the prior quarter.higher net rental days. |
| ●
| Our Adjusted Loss was $3.0 million or ($0.20) per share
|
| ● | Cost of Sales totaled $3,917,365 for the three months ended September 30, 2019 after excluding $0.6 million2020, an increase of $1,698,090 or 76.5% over $2,219,275 recognized during the three months ended September 30, 2019. The increase was primarily attributed to increase in non-cash charges, as compared to $1.7 million or ($0.14) per sharenet rental days revenues and technology costs. |
| ● | Gross profit totaled $2,896,460 for the same periodthree months ended September 30, 2020, an increase of $1,405,463 or 94.3% over the $1,490,997 recognized during the three months ended September 30, 2019. The increase in revenues and gross profit were primarily attributed to higher rental days and net revenues. |
| ● | Operating expenses, consisting of general and administrative, sales and marketing, and research and development expenses totaled $4,664,661 for the three months ended September 30, 2020, a decrease of $509,576 or 9.8% over $5,174,237 recognized during the three months ended September 30, 2019. The decrease in operating expenses were related to reduced planned expenses in response to COVID-19 situation. |
| ● | Net loss totaled $1,839,620 for the three months ended September 30, 2020, a decrease of $1,783,045 or 49.2% over $3,622,665 recognized during the three months ended September 30, 2019. The decrease in net loss was driven by the operating expenses described above and increase net revenues recognized during the three months ended September 30, 2020. |
|
|
|
| ● | Adjusted EBITDA (which is a non-GAAP financial measure as described above) totaled ($1,604,050) for the three months ended September 30, 2020, an increase of $1,485,400 or 48.1% from ($3,089,450) recognized for the prior year. |
| ● | Cash and cash equivalents on the balance sheet of $13.1 million atyear quarter ended September 30, 2019, represented anprimarily as a result of increase in net revenues and reduced operating expenses. However, adjusted EBITDA of ($1,604,050) for the three months ended September 30, 2020 was a sequential increase of $8.0 million$91,677 or 5.4% from $5.1 million at the prior quarter end June 30, 2019 and an increase of $6.4 million($1,695,727) recognized during the first half of the fiscal year from $6.8 million at December 31, 2018,three months ended June 30, 2020, as the Company completed a follow-on public offering in July 2019.well controlled operating expenses dramatically improved operating income. |
Management’s Plan
We have incurred operating losses since inceptionInception and historically relied on debt and equity financing for working capital. Going forward the Company intends to fund its operations through increased revenue and cash flow from operations, the PPP Loan received in April 2020, and the funds raised through prior public securities offerings. Our annualized rental day run rate increased to over 1,100,000 as we set a new all-time high three-month average with over 91,000 days in the third quarter of 2020. Our weekly rental days are consistently over 20,000. Our business model and platform allowed us to leverage new opportunities within this crisis and create a larger market with ridesharing and delivery. As states continue to reopen, we expect to see steady revenue growth in the fourth quarter of 2020.
On August 25, 2020, the Company announced a partnership with Midway Car Rental, Inc. The Company's innovative platform will increase utilization of Midway’s inventory to take advantage of growing opportunities in commercial vehicle rentals. Midway Rental Car, Inc. is the largest privately held rental car agency in Los Angeles and a part of the Hankey Group, with eight rental locations in Southern California. We have seen substantial growth in interest from its initialrental agencies that are considering HyreCar’s platform to increase fleet utilization. Further, on November 4, 2020, California voters passed Proposition 22 which protects the ability of app-based ridesharing and follow-on public offerings,delivery drivers to continue working as independent contractors, while adding important new benefits and protections. Final certification of the election is expected in the coming weeks. We believe that significant opportunities will continue for vehicle rentals from food and package delivery drivers. For HyreCar, this will be incremental business as ridesharing and delivery continues to recover.
Further, much of our cost structure is variable in nature so that our costs for driver screening, insurance, merchant processing, and more has decreased towards the end of the current quarter in line with our current activity levels. Based on generally increasing revenues through the normal course of business and a resulthigh relative amount of variable costs as well as capital currently on hand, we believe the CompanyCompany’s has sufficient resources to continue to operate its business for at least the foreseeable future.next 12 months.
Below is our nationwide footprint with expanding volumes of quarterly rental days and net revenues from the quarter ended December 31, 2018 through September 30, 2020.
Components of Our Results of Operations
The following describes the various components that make up our results of operations, discussed below.below:
Revenue is earned from fees associated with matching Drivers to Owners of idle cars that meet the strict requirements imposed by ride-sharingridesharing services such as Uber(Lyft and Lyft onUber) and delivery (Door Dash, Instacart and Postmates) with Drivers. A Driver will typically rent a car through one transaction via our on-line marketplace. TheWe recognize GAAP reportable revenue primarily from a transaction fee and an insurance fee when a car is rented on our platform when the Company also1) identifies the contract with the customer 2) identifies the performance obligations in the contract 3) determines the transaction price, 4) determines if an allocation of that transaction price is required to the performance obligations in the contract, and 5) recognizes revenue from other sources suchwhen or as referrals, motor vehicle record fees (application fees), late rental fees, and other fees charged to drivers in specific situations.the companies satisfies a performance obligation.
Cost of revenues primarily includesinclude direct fees paid for insurance to cover the vehicle driver and owner, insurance claim payments and estimated liabilities based on the policy in effect at the time of loss, merchant processing fees, technology and hosting costs, and motor vehicle record fees incurred for paid driver applications as well as hostingapplications. General liability insurance that covers corporate risk from activity on our platform is included in general and platform-related technology cost.administrative costs.
Sales and marketing costs include advertising (both on-line and off-line channels), brand awareness activities, conference attendance, conference sponsorship, business development, and wages to sales and marketing staff.
General and administrative costs include all corporate and administrative functions that support our business. These costs also include payroll for officers and operational staff, stock-based compensation expenses,expense, consulting costs, professional fees, insurance costs to cover corporate risks, and other costs that are not included in cost of revenues.
Research and development costs are related to activities such as user experience and user interphaseinterface development, database development and maintenance, and any technology related expense that improvesexpenses to research, improve, implement, or maintain technology and maintains the functionality ofsystems utilized throughout our existing platform.enterprise.
Other income/expense includes non-operating income and expenses including interest income and expense.
Results of Operations
Three Months Ended September 30, 20192020 compared to Three Months Ended September 30, 20182019
Revenues and Gross Profit. Net revenues totaling $3,710,272Profit. Revenues totaled $6,813,825 for the three months ended September 30, 2019 were generated compared to revenues totaling $2,685,9522020, an increase of $3,103,553 or 83.6% over the $3,710,272 recognized during the three months ended September 30, 2019. Gross profit totaled $2,896,460 for the three months ended September 30, 2018, and gross profit2020, an increase of $2,337,934,$1,405,463 or approximately 63.0%, was realized for94.3% over the $1,490,997 recognized during the three months ended September 30, 2019 compared to $1,450,250, or approximately 54.0% for the three months ended September 30, 2018.2019. The increase in revenues of $1,024,320, or approximately 38.2%, was dueand gross profit were primarily attributed to the growth of our business resulting from significantly higher rental days.days and net revenues.
Operating Expenses. Operating expenses, consisting of sales and marketing, general and administrative, and research and development expenses, increased by approximately $2,801,409, or approximately 87.0%, to $6,021,174 for the three months ended September 30, 2019, as compared to operating expenses of $3,219,765 for the three months ended September 30, 2018. General and administrative expenses increased by $1,978,604, or 163.5%, to $3,189,040 due primarily to higher non-cash stock-based compensation costs. Sales and marketing expenses increased by $850,529 or 59.8% to $2,271,892 due to an increase in digital advertising and sales employee compensation, which both helped drive higher revenue levels. The difference is attributable to technology research and development which decreased by $27,724, or 4.7%, to $560,242 associated with the development and maintenance of our technology platform. Stock-based compensation included in the three months ended September 30, 2019 and 2018 was $574,633 and $86,722, respectively, an increase of $487,911, or 563%.
Loss from Operations. Our loss from operations for the three months ended September 30, 2019 was ($3,683,240) as compared to a loss from operations of ($1,769,515) for the three months ended September 30, 2018.
Other (Income) Expense. For the three months ended September 30, 2019, net other income totaled $60,575 as compared to net other expense of $9,939 for the three months ended September 30, 2018. The improvement was the result of higher cash deposits at financial institutions.
Net Loss. Primarily as a result of the increased operating expenses noted above, together with the interest income earned during 2019, our net loss for the three months ended September 30, 2019 was $3,622,665 as compared to a net loss for the three months ended September 30, 2018 of $1,787,685.
Nine Months Ended September 30, 2019 compared to Nine Months Ended September 30, 2018
Revenues and Gross Profit. Net Revenue totaling $11,022,089 was generated for the nine months ended September 30, 2019 compared to $6,673,634 for the same period the prior year. The increase in revenues of $4,348,455, or approximately 65.2%, was due to the growth of our business, which resulted from increased brand awareness resulting from increased marketing expenditures and the expansion of our sales team. Gross profit of $6,596,489, or approximately 59.8%, was generated for the nine months ended September 30, 2019 as compared to gross profit of $2,950,513, or approximately 44.2%, for the nine months ended September 30, 2018. The increase in gross profit of $3,645,976, or approximately 123.6%, was due to the growth of our business resulted from increased brand awareness as well as a higher contribution margin from the new revenue tiers added during 2019.
Operating Expenses. Expenses.Operating expenses, consisting of general and administrative, sales and marketing, and research and development expenses totaled $4,664,661 for the three months ended September 30, 2020, an decrease of $509,576 or 9.8% over $5,174,237 recognized during the three months ended September 30, 2019. The decrease in operating expenses were related to reduced planned expenses in response to COVID-19 situation. General and administrative totaled $2,080,037 for the three months ended September 30, 2020, a decrease of $262,066 or 11.2% over $2,342,103 recognized during the three months ended September 30, 2019. The decrease was primarily attributed to decrease in stock-based compensation expense, operations and support functions. Sales and marketing totaled $1,824,938 for the three months ended September 30, 2020, a decrease of $446,954 or 19.7% over $2,271,892 recognized during the three months ended September 30, 2019. The decrease was primarily attributed to decrease in digital advertising partially offset by increase in commissions expense. Research and development totaled $759,686 for the three months ended September 30, 2020, an increase of $199,444 or 35.6% over $560,242 recognized during the three months ended September 30, 2019. The increase was primarily attributed to the growth in the technology team related to the enhancement and maintenance of our digital marketplace technology platform.
Loss from Operations. Loss from operations totaled $1,768,201 for the three months ended September 30, 2020, a decrease of $1,915,039 or 52.0% over 3,683,240 for the three months ended September 30, 2019. The decrease in loss from operations was driven by the lower operating costsdescribed above, partially offset by the higher net revenues recognized during the year.
Other (Income) Expense. Other (Income) Expense totaled $71,419 in net expense for the three months ended September 30, 2020, a decrease of $131,994 or 217.9% over 60,575 of net income for the three months ended September 30, 2019. The decrease was primarily due to decrease in interest income and increase in non-operational expenses increasedand loan interest expense.
Net Loss. Net loss totaled $1,839,620 for the three months ended September 30, 2020, a decrease in net loss of $1,783,045 or 49.2% over $3,622,665 recognized during the three months ended September 30, 2019. The decrease in net loss was driven by 48.9% or $4,623,392the lower operating expensesdescribed above, partially offset by the higher net revenues recognized during the three months ended September 30, 2020.
Nine Months Ended September 30, 2020 compared to $14,087,158Nine Months Ended September 30, 2019
Revenues and Gross Profit. Revenues totaled $18,177,626 for the nine months ended September 30, 2019 from $9,463,7662020, an increase of $7,155,537 or 64.9% over the $11,022,089 recognized during the nine months ended September 30, 2019. Gross profit totaled$7,609,234 for the nine months ended September 30, 2018. The increase in operating expenses related to the expansion of our sales and marketing spends which, in turn, resulted in our increase in sales. Our sales and marketing expenses increased by $1,611,933 or 52.0% to $4,709,519 in the period which is primarily attributable to2020, an increase in digital marketing and sales compensation. Our general and administrative expenses increased by $2,512,575 of $2,931,661or 47.8% to $7,768,744 in62.7%over the period representing an increase in infrastructure, employee benefit and insurance costs. The increase in cost for research and development is associated with an expanded in-house team to expand on our core technology platform, with costs increasing by $498,884 or 44.9% to $1,608,895 in the period. Stock-based compensation included in$4,677,573 recognized during the nine months ended September 30, 20192019. The increase in revenues and 2018 was $1,485,181gross profit were primarily attributed to higher rental days and $2,152,443, respectively, a decreasenet revenues.
Operating Expenses.Operating expenses, consisting of $667,262.
Loss from Operations. Our loss from operationsgeneral and administrative, sales and marketing, and research and development expenses totaled $17,324,448 for the nine months ended September 30, 20192020, an increase of $5,156,206 or 42.4% over $12,168,242 recognized during the nine months ended September 30, 2019. The increase in operating expenses was $7,490,669 as comparedrelated to $6,513,253the scaling of our business across all functional areas and stock-based compensation expense. General and administrative totaled $9,219,274 for the nine months ended September 30, 2018. The increased loss2020, an increase of $3,369,446 or 57.6% over $5,849,828 recognized during 2019 is a result of increased marketing expenses associated with expanding car supply.
Other (Income) Expense. For the nine months ended September 30, 2019, net other income2019. The increase was primarily attributed to increase in stock-based compensation expense, headcount and salaries, legal, operations and support functions. Sales and marketing totaled $121,717 as compared to net other expense of $2,083,748$5,986,209 for the nine months ended September 30, 2018.2020, an increase of $1,276,690 or 27.1% over $4,709,519 recognized during the nine months ended September 30, 2019. The decreaseincrease was a result of the elimination of debtprimarily attributed to increase in digital advertising, commissions expense and the interest charges on convertible debtsales personnel. Research and the amortization of debt discounts for the 2018 IPO.
Net Loss. Primarily as a result of the increased operating expenses noted above our net lossdevelopment totaled $2,118,965 for the nine months ended September 30, 20192020, an increase of $510,070 or 31.7% over $1,608,895 recognized during the nine months ended September 30, 2019. The increase was $7,368,952 as comparedprimarily attributed to a net lossthe growth in the technology team related to the enhancement and maintenance of our digital marketplace technology platform.
Loss from Operations. Loss from operations totaled $9,715,214 for the nine months ended September 30, 20182020, an increase of $8,597,001, a year$2,224,545 or 29.7% over year improvement7,490,669 for the nine months ended September 30, 2019. The increase in loss from operations was driven by the higher operating costs and non-cash stock-based compensation expense described above, partially offset by the higher net revenues recognized during the year.
Other (Income) Expense.Other (Income) Expense totaled $35,297 in net expense for the nine months ended September 30, 2020, an increase of $1,228,049,$157,014 or 14.3%.129.0% over121,717 in net income for the nine months ended September 30, 2019. The increasewas primarily due todecrease in interest income and increase in business tax and loan interest expense.
Net Loss. Net loss totaled $9,751,311 for the nine months ended September 30, 2020, an increase in net loss of $2,382,359 or 32.3% over $7,368,952 recognized during the nine months ended September 30, 2019. The increase in net loss was driven by the higher operating expenses and stock-based compensation expense described above, partially offset by the higher net revenues recognized during the nine months ended September 30, 2020.
Liquidity and Capital Resources
AtAs of September 30, 2019,2020, our principal sources of liquidity were cash balance totaled $13,143,893and cash equivalents of $6,788,335 compared to $6,764,870 at$10,657,140 as of December 31, 2018. This increase was primarily2019. Cash and cash equivalents include money market deposit accounts denominated in U.S. dollars.
In July 2019, we received net proceeds of $11,321,250 upon the result of completion of our follow-on public offering. Since our IPO, we have financed our operations primarily through our IPO, secondary public offering and payments received through our platform. We believe our existing cash and cash equivalents and proceeds from revenue generating activities and PPP loan funds will be sufficient to meet our working capital and capital expenditures needs over at least the follow-on offeringnext 12 months more fully described in July 2019.Managements Plan above.
AtOur future capital requirements will depend on many factors, including, but not limited to our growth, our ability to attract and retain drivers and car owners on our platform, the continuing market acceptance of our offerings, the timing and extent of spending to support our efforts to improve our customer experience, actual insurance payments for which we have made reserves, the timing and extent of investment we are making in policy, government relations, and the expansion of sales and marketing activities. Further, we may in the future enter into arrangements to acquire or invest in businesses, products, services and technologies. We may decide to, or be required to, seek additional equity or debt financing for any of these reasons, or others that may arise. If we are unable to raise capital in the future, we may need to curtail expenditures by scaling back certain sales and marketing expenses.
Cash Flows
Net cash used in operating activities was $5,940,140 for the nine months ended September 30, 2019, our current assets totaled $13,551,9382020. This consisted primarily of a net loss of $9,751,311 offset by non-cash stock-based compensation expense of $2,610,412 largely driven by the recognition of costs related to stock options and our currentRSUs. Additionally, there was an increase in accounts payable of $596,840 and accrued liabilities totaled $2,246,241 resultingof $1,159,323 and increase in working capitalinsurance deposit of $11,305,697 compared to $5,030,694 at December 31, 2018.$749,454.
OperatingNet cash used in operating activities was for the nine months ended September 30, 2019 resulted in cash outflows of $5,664,508 which were due$5,664,508. This consisted primarily to theof a net loss for the period of $7,368,952 offset by non-cash stock-based compensation expense of $1,485,181 and non-cash depreciation and amortization of $51,243. Additionally, there was an increase in accounts payable of $202,744 and insurance reserve of $292,195 partially offset by $1,485,181decrease in stock-based compensation, compared toaccrued liabilities of $285,288.
Net cash used in operatinginvesting activities of $4,770,149, which was due primarily to the loss for the period of $8,597,001 partially offset by $2,152,443 in stock-based compensation and $1,515,191 in amortization of a debt discount for the same period the prior year.
Investing activities$6,208 for the nine months ended September 30, 2019, resulted in a net cash outflowwhich primarily consists of $6,208 compared to a cash outflowpurchases of $36,423 for the same period the prior year. We do not have any contractual obligations for ongoing capital expenditures at this time.property and equipment and deposits.
Net cash provided by financing activities was $2,071,335 for the nine months ended September 30, 2020, which primarily consists of net proceeds received from the PPP loan and proceeds from the exercise of options.
Net cash provided by financing activities was $12,049,739 for the nine months ended September 30, 2019, totaled $12,049,739which primarily consists of proceeds from exercise of warrants and primarily includedstock options.
Capital Management
We aim to manage capital so that we will maintain optimal returns to shareholders and benefits for other stakeholders. We also aim to maintain a capital structure that ensures the $12,075,000 secondary public equity offering in Julylowest cost of capital available to the Company. We regularly review the Company’s capital structure and seek to take advantage of available opportunities to improve outcomes for the Company and its shareholders.
For the nine months ended September 30, 2020 and 2019, comparedthere were no dividends paid and we have no plans to net cash providedcommence the payment of $13,263,727 primarily fromdividends. We have no current plans to issue further shares on the $12,600,000 initial public offering in June 2018market but will continue to assess market conditions and the $2,778,579 convertible debt offering in incompany’s cash flow requirements to ensure the same periodCompany is appropriately funded.
There is no significant external borrowing at the prior year.reporting date and the Company is not subject to any externally imposed capital requirement.
Critical Accounting Policies, Judgments, and Estimates
A descriptionOur consolidated financial statements and the related notes thereto are prepared in accordance with GAAP. The preparation of condensed consolidated financial statements also requires us to make estimates and assumptions that affect the reported amounts of assets, liabilities, revenue, costs and expenses and related disclosures. We base our estimates on historical experience and on various other assumptions that we believe to be reasonable under the circumstances. Actual results could differ significantly from our estimates. To the extent that there are differences between our estimates and actual results, our future financial statement presentation, financial condition, results of operations and cash flows will be affected. There have been no material changes to our critical accounting policies and estimates is disclosed in Note 2 to our financial statements appearing in this Quarterly Report on Form 10-Q.as of September 30, 2020.
Off-Balance Sheet Arrangements
We did not have during the periods presented, and we do not currently have, any off-balance sheet arrangements as(as defined under applicable SEC rules.in the rules and regulations of the SEC) that have or are reasonably likely to have a current or future effect on our financial condition, changes in financial condition, revenues or expenses, results of operations, liquidity, capital expenditures or capital resources that is material investors.
Recently Issued Accounting Pronouncements
A description of recently issued accounting pronouncements that may potentially impact our financial position and results of operations is disclosed in Note 2 to our financial statements appearing in this Quarterly Report on Form 10-Q.
Emerging Growth Company Status
Section 107 of the JOBS Act provides that an emerging growth company can take advantage of the extended transition period provided in Section 7(a)(2)(B) of the Securities Act for complying with new or revised accounting standards. In other words, an emerging growth company can delay the adoption of certain accounting standards until those standards would otherwise apply to private companies. We have elected to take advantage of the benefits of this extended transition period. Our financial statements may, therefore, not be comparable to those of companies that .comply with such new or revised accounting standards.
Item 3. Quantitative and Qualitative Disclosures about Market Risk
The Company is not required to provide the information required by this Item as it is a “smaller reporting company,” as defined in Rule 229.10(f)(1).
Item 4. Controls and Procedures
Limitations on Effectiveness of Controls and Procedures
The term “disclosure controls and procedures,” as defined in Rules 13a-15(e) and 15d-15(e) under the Exchange Act, refers to controls and procedures that are designed to ensure that information required to be disclosed by a company in the reports that it files or submits under the Exchange Act is recorded, processed, summarized and reported, within the time periods specified in the SEC’s rules and forms. Disclosure controls and procedures include, without limitation, controls and procedures designed to ensure that information required to be disclosed by a company in the reports that it files or submits under the Exchange Act is accumulated and communicated to the Company’s management, including its principal executive and principal financial officers, or persons performing similar functions, as appropriate to allow timely decisions regarding required disclosure.
In designing and evaluating our disclosure controls and procedures, management recognizes that any controls and procedures, no matter how well designed and operated, can provide only reasonable assurance of achieving the desired control objectives. In addition, the design of disclosure controls and procedures must reflect the fact there are resource constraints and management isare required to apply judgment in evaluating the benefits of possible controls and procedures relative to their costs.
Evaluation of Disclosure Controls and Procedures
Our management, with the participation of our Principal Executive Officer and Principal Financial Officer, evaluated, as of the end of the period covered by this Quarterly Report on Form 10-Q, the effectiveness of our disclosure controls and procedures (as defined in Rules 13a-15(e) and 15d-15(e) under the Exchange Act of 1934). Based on that evaluation, our Principal Executive Officer and Principal Financial Officer concluded our disclosure controls and procedures were effective at the reasonable assurance level as of September 30, 2019.2020.
Changes in Internal Control Over Financial Reporting
No change in our internal control over financial reporting (as defined in Rules 13a-15(f) and 15d-15(f) under the Exchange Act) has occurred during the three and nine months ended September 30, 20192020 that has materially affected, or is reasonably likely to materially affect, our internal control over financial reporting.