UNITED STATES
SECURITIES AND EXCHANGE COMMISSION
Washington, D.C. 20549
FORM 10-Q
☒ Quarterly Report Pursuant to Section 13 or 15(d) of the Securities Exchange Act of 1934
For the quarterly period ended SeptemberJune 30, 20192020
or
☐ Transition Report Pursuant to Section 13 or 15(d) of the Securities Exchange Act of 1934
For the transition period from ______to______
Commission file number 001-33997
KANDI TECHNOLOGIES GROUP, INC.
(Exact name of registrant as specified in charter)
| Delaware | 90-0363723 | |
| (State or other jurisdiction of | (I.R.S. Employer | |
| incorporation or organization) | Identification No.) | |
| Jinhua City Industrial Zone Jinhua, Zhejiang Province People’s Republic of China | 321016 | |
| (Address of principal executive offices) | (Zip Code) |
(86 - 579) 82239856
(Registrant’s telephone number, including area code)
Securities registered pursuant to Section 12(b) of the Act:
| Title of each class | Trading Symbol(s) | Name of each exchange on which registered | ||
| Common Stock | KNDI | NASDAQ Global Select Market |
Indicate by check mark whether the registrant (1) has filed all reports required to be filed by Section 13 or 15(d) of the Securities Exchange Act of 1934 during the preceding 12 months (or for such shorter period that the registrant was required to file such reports), and (2) has been subject to such filing requirements for the past 90 days. Yes ☒ No ☐
Indicate by check mark whether the registrant has submitted electronically every Interactive Data File required to be submitted pursuant to Rule 405 of Regulation S-T during the preceding 12 months (or for such shorter period that the registrant was required to submit and post such files) Yes ☒ No ☐
Indicate by check mark whether the registrant is a large accelerated filer, an accelerated filer, a non-accelerated filer, a smaller reporting company or an emerging growth company. See definitions of “large accelerated filer,” “accelerated filer” “smaller reporting company” and “emerging growth company” in Rule 12b-2 of the Exchange Act.
| Large accelerated filer | ☐ | Accelerated filer | ☒ |
| Non-accelerated filer | ☐ | Smaller reporting company | ☒ |
| Emerging growth company | ☐ |
If an emerging growth company, indicate by check mark if the registrant has elected not to use the extended transition period for complying with any new or revised financial accounting standards provided pursuant to Section 13(a) of the Exchange Act. ☐
Indicate by check mark whether the registrant is a shell company (as defined in Rule 12b-2 of the Exchange Act). Yes ☐ No ☒
As of NovemberAugust 5, 2019,2020, the registrant had 56,243,10256,521,702 shares of common stock issued and 52,819,44154,600,758 shares of common stock outstanding, par value $0.001 per share.
TABLE OF CONTENTS
i
PART I — FINANCIAL INFORMATION
KANDI TECHNOLOGIES GROUP, INC.
AND SUBSIDIARIES
CONDENSED CONSOLIDATED BALANCE SHEETSHEETS
| September 30, 2019 | December 31, 2018 | June 30, 2020 | December 31, 2019 | |||||||||||||
| (UNAUDITED) | (UNAUDITED) | |||||||||||||||
| Current assets | ||||||||||||||||
| Cash and cash equivalents | $ | 14,338,637 | $ | 15,662,201 | $ | 3,457,498 | $ | 5,490,557 | ||||||||
| Restricted cash | 11,713,004 | 6,690,870 | 3,221,053 | 11,022,078 | ||||||||||||
| Accounts receivable (net of allowance for doubtful accounts of $130,420 and $120,010 as of September 30, 2019 and December 31, 2018, respectively) | 54,859,801 | 34,274,728 | ||||||||||||||
| Accounts receivable (net of allowance for doubtful accounts of $251,012 and $254,665 as of June 30, 2020 and December 31, 2019, respectively) | 60,020,455 | 61,181,849 | ||||||||||||||
| Inventories | 35,447,383 | 21,997,868 | 28,245,267 | 27,736,566 | ||||||||||||
| Notes receivable | 41,549,888 | 72,712 | - | 42,487,225 | ||||||||||||
| Notes receivable from the Affiliate Company and related party | - | 3,861,032 | ||||||||||||||
| Other receivables | 12,859,304 | 1,264,323 | 42,661,342 | 5,019,971 | ||||||||||||
| Prepayments and prepaid expense | 9,497,459 | 11,136,408 | 10,407,572 | 10,615,063 | ||||||||||||
| Due from employees | 5,499 | 1,001 | ||||||||||||||
| Advances to suppliers | 4,474,104 | 4,705,183 | ||||||||||||||
| Amount due from the Affiliate Company, net | 25,335,894 | 67,683,462 | 20,107,347 | 31,330,763 | ||||||||||||
| Right - of - use asset | 42,974 | - | ||||||||||||||
| Other current assets | 13,283,400 | 688,364 | ||||||||||||||
| TOTAL CURRENT ASSETS | 210,123,947 | 167,349,788 | 181,403,934 | 195,572,436 | ||||||||||||
| LONG-TERM ASSETS | ||||||||||||||||
| Property, plant and equipment, net | 74,491,204 | 82,045,923 | 69,907,964 | 74,407,858 | ||||||||||||
| Intangible assets | 3,298,384 | 3,654,772 | ||||||||||||||
| Land use rights, net | 11,084,717 | 11,749,728 | 8,765,196 | 11,272,815 | ||||||||||||
| Construction in progress | 17,781 | - | ||||||||||||||
| Deferred taxes assets | - | 8,204 | ||||||||||||||
| Investment in the Affiliate Company | 53,837,011 | 128,929,893 | 42,490,448 | 47,228,614 | ||||||||||||
| Goodwill | 27,762,120 | 28,552,215 | 27,962,871 | 28,270,400 | ||||||||||||
| Intangible assets | 3,723,988 | 4,328,127 | ||||||||||||||
| Other long term assets | 4,803,349 | 5,865,386 | 10,529,348 | 10,811,501 | ||||||||||||
| TOTAL Long-Term Assets | 175,720,170 | 261,479,476 | 162,954,211 | 175,645,960 | ||||||||||||
| TOTAL ASSETS | $ | 385,844,117 | $ | 428,829,264 | $ | 344,358,145 | $ | 371,218,396 | ||||||||
| CURRENT LIABILITIES | ||||||||||||||||
| Accounts payable | $ | 79,632,036 | $ | 112,309,683 | $ | 59,656,133 | $ | 72,093,940 | ||||||||
| Other payables and accrued expenses | 4,843,001 | 4,251,487 | 4,239,760 | 6,078,041 | ||||||||||||
| Short-term loans | 30,969,731 | 30,539,236 | - | 25,980,364 | ||||||||||||
| Customer deposits | 33,535 | 94,408 | ||||||||||||||
| Notes payable | 11,463,004 | 12,787,619 | 2,971,053 | 10,765,344 | ||||||||||||
| Income tax payable | 1,519,699 | 3,471,366 | 2,901,610 | 1,796,601 | ||||||||||||
| Due to employees | 7,105 | 28,473 | ||||||||||||||
| Deferred income | 1,237,556 | 1,340,605 | ||||||||||||||
| Lease liability | 44,121 | - | ||||||||||||||
| Advance receipts | 18,497,676 | - | ||||||||||||||
| Long term loans - current portion | 16,128,576 | 13,779,641 | ||||||||||||||
| Other current liability | 1,421,364 | 1,379,808 | ||||||||||||||
| Total Current Liabilities | 129,749,788 | 164,822,877 | 105,816,172 | 131,873,739 | ||||||||||||
| LONG-TERM LIABILITIES | ||||||||||||||||
| Long term bank loans | 27,606,502 | 28,794,136 | ||||||||||||||
| Long term loans | 11,712,415 | 14,353,792 | ||||||||||||||
| Deferred taxes liability | 1,758,643 | 1,711,343 | 3,448,922 | 1,362,786 | ||||||||||||
| Contingent consideration liability | 6,562,000 | 7,256,000 | 2,334,000 | 5,197,000 | ||||||||||||
| Other long-term liability | - | 622,034 | 565,915 | 574,152 | ||||||||||||
| Total Long-Term Liabilities | 35,927,145 | 38,383,513 | 18,061,252 | 21,487,730 | ||||||||||||
| TOTAL LIABILITIES | 165,676,933 | 203,206,390 | 123,877,424 | 153,361,469 | ||||||||||||
| STOCKHOLDER’S EQUITY | ||||||||||||||||
| Common stock, $0.001 par value; 100,000,000 shares authorized; 56,263,102 and 55,992,002 shares issued and 52,839,441 and 51,484,444 outstanding at September 30, 2019 and December 31, 2018, respectively | 52,839 | 51,484 | ||||||||||||||
| Less: Treasury stock (487,155 shares with average price of $5.09 and 0 shares at September 30, 2019 and December 31, 2018, respectively ) | (2,477,965 | ) | - | |||||||||||||
| Common stock, $0.001 par value; 100,000,000 shares authorized; 56,273,102 and 56,263,102 shares issued and 54,352,158 and 52,839,441 outstanding at June 30,2020 and December 31,2019, respectively | 54,352 | 52,839 | ||||||||||||||
| Less: Treasury stock (487,155 shares with average price of $5.09 at June 30,2020 and December 31,2019, respectively ) | (2,477,965 | ) | (2,477,965 | ) | ||||||||||||
| Additional paid-in capital | 259,691,370 | 254,989,657 | 262,878,585 | 259,691,370 | ||||||||||||
| Accumulated deficit (the restricted portion is $4,422,033 and $4,422,033 at September 30, 2019 and December 31, 2018, respectively) | (9,135,198 | ) | (9,497,009 | ) | ||||||||||||
| Accumulated deficit (the restricted portion is $4,422,033 and $4,422,033 at June 30,2020 and December 31,2019, respectively) | (14,205,339 | ) | (16,685,736 | ) | ||||||||||||
| Accumulated other comprehensive loss | (27,963,862 | ) | (19,921,258 | ) | (25,768,912 | ) | (22,723,581 | ) | ||||||||
| TOTAL STOCKHOLDERS’ EQUITY | 220,167,184 | 225,622,874 | 220,480,721 | 217,856,927 | ||||||||||||
| TOTAL LIABILITIES AND STOCKHOLDERS’ EQUITY | $ | 385,844,117 | $ | 428,829,264 | $ | 344,358,145 | $ | 371,218,396 | ||||||||
See accompanying notes to condensed consolidated financial statements
1
KANDI TECHNOLOGIES GROUP, INC.
AND SUBSIDIARIES
CONDENSED CONSOLIDATED STATEMENTS OF INCOME (LOSS)OPERATIONS AND
COMPREHENSIVE INCOME (LOSS)
(UNAUDITED)
| Three Months Ended | Nine Months Ended | Three Months Ended | Six Months Ended | |||||||||||||||||||||||||||||
| September 30, 2019 | September 30, 2018 | September 30, 2019 | September 30, 2018 | June 30, 2020 | June 30, 2019 | June 30, 2020 | June 30, 2019 | |||||||||||||||||||||||||
| REVENUES FROM UNRELATED PARTY, NET | $ | 26,968,385 | $ | 14,860,034 | $ | 63,360,044 | $ | 32,211,352 | $ | 19,436,120 | $ | 20,056,696 | $ | 25,808,544 | $ | 36,391,659 | ||||||||||||||||
| REVENUES FROM THE AFFILIATE COMPANY AND RELATED PARTY, NET | 4,720,159 | 23,135,326 | 10,543,190 | 30,479,521 | 956 | 4,089,534 | 956 | 5,823,031 | ||||||||||||||||||||||||
| REVENUES, NET | 31,688,544 | 37,995,360 | 73,903,234 | 62,690,873 | 19,437,076 | 24,146,230 | 25,809,500 | 42,214,690 | ||||||||||||||||||||||||
| COST OF GOODS SOLD | (26,412,129 | ) | (31,753,311 | ) | (61,288,228 | ) | (53,044,861 | ) | (15,900,298 | ) | (19,944,076 | ) | (21,105,463 | ) | (34,876,099 | ) | ||||||||||||||||
| GROSS PROFIT | 5,276,415 | 6,242,049 | 12,615,006 | 9,646,012 | 3,536,778 | 4,202,154 | 4,704,037 | 7,338,591 | ||||||||||||||||||||||||
| OPERATING EXPENSES: | ||||||||||||||||||||||||||||||||
| OPERATING INCOME (EXPENSES): | ||||||||||||||||||||||||||||||||
| Research and development | (596,187 | ) | (5,691,649 | ) | (1,766,210 | ) | (7,091,836 | ) | (1,149,901 | ) | (632,590 | ) | (1,790,141 | ) | (1,170,023 | ) | ||||||||||||||||
| Selling and marketing | (930,810 | ) | (898,896 | ) | (2,448,291 | ) | (1,875,294 | ) | (763,666 | ) | (899,478 | ) | (1,641,972 | ) | (1,517,481 | ) | ||||||||||||||||
| General and administrative | (3,432,920 | ) | (2,070,947 | ) | (11,096,246 | ) | (5,534,039 | ) | (3,907,191 | ) | (5,623,798 | ) | (6,973,926 | ) | (7,663,326 | ) | ||||||||||||||||
| Total Operating Expenses | (4,959,917 | ) | (8,661,492 | ) | (15,310,747 | ) | (14,501,169 | ) | ||||||||||||||||||||||||
| Gain on disposal of long-live asset | 13,907,574 | - | 13,907,574 | - | ||||||||||||||||||||||||||||
| Total Operating Income (Expenses) | 8,086,816 | (7,155,866 | ) | 3,501,535 | (10,350,830 | ) | ||||||||||||||||||||||||||
| INCOME (LOSS) FROM OPERATIONS | 316,498 | (2,419,443 | ) | (2,695,741 | ) | (4,855,157 | ) | 11,623,594 | (2,953,712 | ) | 8,205,572 | (3,012,239 | ) | |||||||||||||||||||
| OTHER INCOME (EXPENSE): | �� | |||||||||||||||||||||||||||||||
| OTHER INCOME (EXPENSES): | ||||||||||||||||||||||||||||||||
| Interest income | 209,736 | 52,745 | 559,954 | 1,452,522 | 221,792 | 97,814 | 560,736 | 350,218 | ||||||||||||||||||||||||
| Interest expense | (435,524 | ) | (483,376 | ) | (1,304,062 | ) | (1,505,409 | ) | (1,123,056 | ) | (429,355 | ) | (2,105,990 | ) | (868,538 | ) | ||||||||||||||||
| Change in fair value of contingent consideration | 57,000 | (1,552,686 | ) | 694,000 | 1,814,326 | (929,000 | ) | 548,000 | 2,863,000 | 637,000 | ||||||||||||||||||||||
| Government grants | 502,146 | 607,008 | 725,189 | 717,821 | 86,799 | 175,319 | 97,898 | 223,043 | ||||||||||||||||||||||||
| Gain from equity dilution in the Affiliate Company | (49,285 | ) | - | 4,291,974 | - | - | (24,131 | ) | - | 4,341,259 | ||||||||||||||||||||||
| Gain from equity sale in the Affiliate Company | 20,574,217 | - | 20,574,217 | - | ||||||||||||||||||||||||||||
| Share of loss after tax of the Affiliate Company | (8,433,767 | ) | (3,247,343 | ) | (22,883,126 | ) | (79,592 | ) | (2,978,529 | ) | (4,500,201 | ) | (4,081,299 | ) | (14,449,359 | ) | ||||||||||||||||
| Other income , net | 57,833 | 15,735 | 357,626 | 666,294 | ||||||||||||||||||||||||||||
| Total other income (expense), net | 12,482,356 | (4,607,917 | ) | 3,015,772 | 3,065,962 | |||||||||||||||||||||||||||
| Other income (expenses), net | 1,043,335 | (174,597 | ) | 1,062,985 | 299,793 | |||||||||||||||||||||||||||
| Total other expenses, net | (3,678,659 | ) | (4,307,151 | ) | (1,602,670 | ) | (9,466,584 | ) | ||||||||||||||||||||||||
| INCOME (LOSS) BEFORE INCOME TAXES | 12,798,854 | (7,027,360 | ) | 320,031 | (1,789,195 | ) | 7,944,935 | (7,260,863 | ) | 6,602,902 | (12,478,823 | ) | ||||||||||||||||||||
| INCOME TAX (EXPENSE) BENEFIT | (709,413 | ) | 505,961 | 41,780 | 370,316 | (3,889,889 | ) | (57,295 | ) | (4,122,502 | ) | 751,193 | ||||||||||||||||||||
| NET INCOME (LOSS) | 12,089,441 | (6,521,399 | ) | 361,811 | (1,418,879 | ) | 4,055,046 | (7,318,158 | ) | 2,480,400 | (11,727,630 | ) | ||||||||||||||||||||
| OTHER COMPREHENSIVE INCOME (LOSS) | ||||||||||||||||||||||||||||||||
| Foreign currency translation | (8,531,043 | ) | (8,108,270 | ) | (8,042,604 | ) | (13,230,652 | ) | 477,734 | (4,915,589 | ) | (3,045,331 | ) | 488,439 | ||||||||||||||||||
| COMPREHENSIVE INCOME (LOSS) | $ | 3,558,398 | $ | (14,629,669 | ) | $ | (7,680,793 | ) | $ | (14,649,531 | ) | $ | 4,532,780 | $ | (12,233,747 | ) | $ | (564,931 | ) | $ | (11,239,191 | ) | ||||||||||
| WEIGHTED AVERAGE SHARES OUTSTANDING BASIC AND DILUTED | 52,613,642 | 51,474,048 | 52,332,260 | 51,089,047 | ||||||||||||||||||||||||||||
| WEIGHTED AVERAGE SHARES OUTSTANDING BASIC | 53,369,602 | 52,806,331 | 52,862,043 | 52,189,237 | ||||||||||||||||||||||||||||
| WEIGHTED AVERAGE SHARES OUTSTANDING DILUTED | 53,369,602 | 52,806,331 | 52,862,043 | 52,189,237 | ||||||||||||||||||||||||||||
| NET INCOME (LOSS) PER SHARE, BASIC AND DILUTED | $ | 0.23 | $ | (0.13 | ) | $ | 0.01 | $ | (0.03 | ) | ||||||||||||||||||||||
| NET INCOME (LOSS) PER SHARE, BASIC | $ | 0.08 | $ | (0.14 | ) | $ | 0.05 | $ | (0.22 | ) | ||||||||||||||||||||||
| NET INCOME (LOSS) PER SHARE, DILUTED | $ | 0.08 | $ | (0.14 | ) | $ | 0.05 | $ | (0.22 | ) | ||||||||||||||||||||||
See accompanying notes to condensed consolidated financial statements
2
KANDI TECHNOLOGIES GROUP, INC.
AND SUBSIDIARIES
CONDENSED CONSOLIDATED STATEMENTS OF CHANGES IN STOCKHOLDERS’ EQUITY
(UNAUDITED)
| Number of Outstanding Shares | Common Stock | Treasury Stock | Additional Paid-in Capital | Accumulated Deficit | Accumulated Other Comprehensive Income | Total | Number of Outstanding Shares | Common Stock | Treasury Stock | Additional Paid-in Capital | Accumulated Deficit | Accumulated Other Comprehensive Income | Total | |||||||||||||||||||||||||||||||||||||||||||
| Balance, December 31, 2018 | 51,484,444 | 51,484 | - | 254,989,657 | (9,497,009 | ) | (19,921,258 | ) | 225,622,874 | 51,484,444 | $ | 51,484 | $ | - | $ | 254,989,657 | $ | (9,497,009 | ) | $ | (19,921,258 | ) | $ | 225,622,874 | ||||||||||||||||||||||||||||||||
| Stock issuance and award | 1,096,397 | 1,097 | - | 3,387,379 | - | - | 3,388,476 | 1,096,397 | 1,097 | - | 3,387,379 | - | - | 3,388,476 | ||||||||||||||||||||||||||||||||||||||||||
| Net income (loss) | - | - | - | - | (4,409,472 | ) | - | (4,409,472 | ) | - | - | - | - | (4,409,472 | ) | - | (4,409,472 | ) | ||||||||||||||||||||||||||||||||||||||
| Foreign currency translation | - | - | - | - | - | 5,404,028 | 5,404,028 | - | - | - | - | - | 5,404,028 | 5,404,028 | ||||||||||||||||||||||||||||||||||||||||||
| Balance, March 31, 2019 | 52,580,841 | 52,581 | - | 258,377,036 | (13,906,481 | ) | (14,517,230 | ) | 230,005,906 | 52,580,841 | $ | 52,581 | $ | - | $ | 258,377,036 | $ | (13,906,481 | ) | $ | (14,517,230 | ) | $ | 230,005,906 | ||||||||||||||||||||||||||||||||
| Stock issuance and award | 238,600 | 238 | - | 1,259,569 | - | - | 1,259,807 | 238,600 | 238 | 1,259,569 | 1,259,807 | |||||||||||||||||||||||||||||||||||||||||||||
| Net income (loss) | - | - | - | - | (7,318,158 | ) | - | (7,318,158 | ) | (7,318,158 | ) | (7,318,158 | ) | |||||||||||||||||||||||||||||||||||||||||||
| Foreign currency translation | - | - | - | - | - | (4,915,589 | ) | (4,915,589 | ) | (4,915,589 | ) | (4,915,589 | ) | |||||||||||||||||||||||||||||||||||||||||||
| Balance, June 30, 2019 | 52,819,441 | 52,819 | - | 259,636,605 | (21,224,639 | ) | (19,432,819 | ) | 219,031,966 | 52,819,441 | 52,819 | - | 259,636,605 | (21,224,639 | ) | (19,432,819 | ) | 219,031,966 | ||||||||||||||||||||||||||||||||||||||
| Stock issuance and award | 20,000 | 20 | - | 69,380 | - | - | 69,400 | |||||||||||||||||||||||||||||||||||||||||||||||||
| Stock buyback | - | - | (2,477,965 | ) | - | - | - | (2,477,965 | ) | |||||||||||||||||||||||||||||||||||||||||||||||
| Commission in stock buyback | - | - | - | (14,615 | ) | - | - | (14,615 | ) | |||||||||||||||||||||||||||||||||||||||||||||||
| Net income (loss) | - | - | - | - | 12,089,441 | - | 12,089,441 | |||||||||||||||||||||||||||||||||||||||||||||||||
| Foreign currency translation | - | - | - | - | - | (8,531,043 | ) | (8,531,043 | ) | |||||||||||||||||||||||||||||||||||||||||||||||
| Balance, September 30, 2019 | 52,839,441 | 52,839 | (2,477,965 | ) | 259,691,370 | (9,135,198 | ) | (27,963,862 | ) | 220,167,184 | ||||||||||||||||||||||||||||||||||||||||||||||
| Number of Outstanding Shares | Common Stock | Treasury Stock | Additional Paid-in Capital | Accumulated Deficit | Accumulated Other Comprehensive Income | Total | ||||||||||||||||||||||||||||||||||||||||||||||||||
| Balance, December 31, 2017 | 48,036,538 | 48,037 | - | 233,055,348 | (3,802,310 | ) | (6,310,763 | ) | 222,990,312 | |||||||||||||||||||||||||||||||||||||||||||||||
| Stock issuance and award | 2,972,337 | 2,972 | - | 19,099,556 | - | - | 19,102,528 | |||||||||||||||||||||||||||||||||||||||||||||||||
| Net income (loss) | - | - | - | - | 3,727,995 | - | 3,727,995 | |||||||||||||||||||||||||||||||||||||||||||||||||
| Foreign currency translation | - | - | - | - | - | 7,465,240 | 7,465,240 | |||||||||||||||||||||||||||||||||||||||||||||||||
| Balance, March 31, 2018 | 51,008,875 | 51,009 | - | 252,154,904 | (74,315 | ) | 1,154,477 | 253,286,075 | ||||||||||||||||||||||||||||||||||||||||||||||||
| Stock issuance and award | 288,600 | 289 | - | 2,038,476 | - | - | 2,038,765 | |||||||||||||||||||||||||||||||||||||||||||||||||
| Net income (loss) | - | - | - | - | 1,374,525 | - | 1,374,525 | |||||||||||||||||||||||||||||||||||||||||||||||||
| Foreign currency translation | - | - | - | - | - | (12,587,622 | ) | (12,587,622 | ) | |||||||||||||||||||||||||||||||||||||||||||||||
| Balance, June 30, 2018 | 51,297,475 | 51,298 | - | 254,193,380 | 1,300,210 | (11,433,145 | ) | 244,111,743 | ||||||||||||||||||||||||||||||||||||||||||||||||
| Stock issuance and award | 184,469 | 184 | - | 787,529 | - | - | 787,713 | |||||||||||||||||||||||||||||||||||||||||||||||||
| Net income (loss) | - | - | - | - | (6,521,399 | ) | - | (6,521,399 | ) | |||||||||||||||||||||||||||||||||||||||||||||||
| Foreign currency translation | - | - | - | - | - | (8,108,271 | ) | (8,108,271 | ) | |||||||||||||||||||||||||||||||||||||||||||||||
| Balance, September 30, 2018 | 51,481,944 | 51,482 | - | 254,980,909 | (5,221,189 | ) | (19,541,416 | ) | 230,269,786 | |||||||||||||||||||||||||||||||||||||||||||||||
| Number of Outstanding Shares | Common Stock | Treasury Stock | Additional Paid-in Capital | Accumulated Deficit | Accumulated Other Comprehensive Income | Total | ||||||||||||||||||||||
| Balance, December 31, 2019 | 52,839,441 | $ | 52,839 | $ | (2,477,965 | ) | $ | 259,691,370 | $ | (16,685,736 | ) | $ | (22,723,581 | ) | $ | 217,856,927 | ||||||||||||
| Stock issuance and award | 10,000 | 10 | - | 22,290 | - | - | 22,300 | |||||||||||||||||||||
| Net income (loss) | - | - | - | - | (1,574,646 | ) | - | (1,574,646 | ) | |||||||||||||||||||
| Foreign currency translation | - | - | - | - | - | (3,523,065 | ) | (3,523,065 | ) | |||||||||||||||||||
| Balance, March 31, 2020 | 52,849,441 | $ | 52,849 | $ | (2,477,965 | ) | $ | 259,713,660 | $ | (18,260,382 | ) | $ | (26,246,646 | ) | $ | 212,781,516 | ||||||||||||
| Stock issuance and award | 1,502,717 | 1,503 | - | 3,164,925 | - | - | 3,166,428 | |||||||||||||||||||||
| Net income (loss) | - | - | - | - | 4,055,043 | - | 4,055,043 | |||||||||||||||||||||
| Foreign currency translation | - | - | - | - | - | 477,734 | 477,734 | |||||||||||||||||||||
| Balance, June 30, 2020 | 54,352,158 | 54,352 | (2,477,965 | ) | 262,878,585 | (14,205,339 | ) | (25,768,912 | ) | 220,480,721 | ||||||||||||||||||
See accompanying notes to condensed consolidated financial statements.
3
KANDI TECHNOLOGIES GROUP, INC.
AND SUBSIDIARIES
CONDENSED CONSOLIDATED STATEMENTS OF CASH FLOWS
(UNAUDITED)
| Nine Months Ended | ||||||||||||||||
| September 30, 2019 | September 30, 2018 | June 30, 2020 | June 30, 2019 | |||||||||||||
| CASH FLOWS FROM OPERATING ACTIVITIES: | ||||||||||||||||
| Net income (loss) | $ | 361,811 | $ | (1,418,879 | ) | $ | 2,480,400 | $ | (11,727,630 | ) | ||||||
| Adjustments to reconcile net income to net cash provided by operating activities | ||||||||||||||||
| Depreciation and amortization | 6,443,422 | 2,271,599 | 4,022,676 | 4,376,097 | ||||||||||||
| Impairments | 44,544 | 24,854 | (148,054 | ) | 59,799 | |||||||||||
| Allowance for doubtful accounts | 15,366 | (7,093 | ) | - | 15,543 | |||||||||||
| Deferred taxes | 50,693 | - | 2,089,505 | 51,275 | ||||||||||||
| Share of loss after tax of the Affiliate Company | 22,883,126 | 79,592 | 4,081,299 | 14,449,359 | ||||||||||||
| Gain from equity dilution in the Affiliate Company | (4,291,974 | ) | - | - | (4,341,259 | ) | ||||||||||
| Gain from equity sale in the Affiliate Company | (20,574,217 | ) | - | |||||||||||||
| Gain on disposal of long-live asset | (13,907,574 | ) | - | |||||||||||||
| Change in fair value of contingent consideration | (694,000 | ) | (1,814,326 | ) | (2,863,000 | ) | (637,000 | ) | ||||||||
| Stock compensation cost | 1,337,333 | 253,934 | 847,546 | 1,314,408 | ||||||||||||
| Changes in operating assets and liabilities: | ||||||||||||||||
| (Increase) Decrease In: | ||||||||||||||||
| Accounts receivable | (36,822,184 | ) | (52,845,923 | ) | (1,431,388 | ) | (16,560,338 | ) | ||||||||
| Deferred taxes assets | - | (52,126 | ) | |||||||||||||
| Notes receivable | 174,881 | 491,272.00 | - | 250,593 | ||||||||||||
| Notes receivable from the Affiliate Company and related party | 437,203 | 3,196,340 | - | 442,223 | ||||||||||||
| Inventories | (14,813,147 | ) | 1,555,993 | (743,483 | ) | (7,093,904 | ) | |||||||||
| Other receivables and other assets | (17,275,954 | ) | 1,497,230 | (11,248,701 | ) | (6,258,341 | ) | |||||||||
| Due from employee | (25,861 | ) | 945 | |||||||||||||
| Advances to supplier and prepayments and prepaid expenses | 1,357,001 | (4,590,404 | ) | (12,586,777 | ) | 708,825 | ||||||||||
| Amount due from the Affiliate Company | 30,549,072 | (81,549,214 | ) | 4,129,516 | (4,128,506 | ) | ||||||||||
| Amount due from Affiliate Company-Long term | - | 15,907,183 | ||||||||||||||
| Due from related party | - | 161,874 | ||||||||||||||
| Increase (Decrease) In: | ||||||||||||||||
| Accounts payable | 11,383,411 | 101,684,965 | (282,560 | ) | 387,505 | |||||||||||
| Other payables and accrued liabilities | 7,791,028 | 29,845,307 | 736,715 | 7,868,402 | ||||||||||||
| Notes payable | (11,836,950 | ) | (12,434,813 | ) | (10,664,922 | ) | (10,161,233 | ) | ||||||||
| Customer deposits | (59,734 | ) | 20,350 | |||||||||||||
| Income tax payable | (1,803,574 | ) | (2,353,826 | ) | 1,161,312 | (2,134,722 | ) | |||||||||
| Deferred income | (56,448 | ) | (761,643 | ) | ||||||||||||
| Net cash used in operating activities | $ | (25,425,152 | ) | $ | (836,809 | ) | ||||||||||
| Net cash used in by operating activities | $ | (34,327,490 | ) | $ | (33,118,904 | ) | ||||||||||
| CASH FLOWS FROM INVESTING ACTIVITIES: | ||||||||||||||||
| Purchases of property, plant and equipment, net | (955,670 | ) | (304,745 | ) | (59,670 | ) | (512,707 | ) | ||||||||
| Purchases of land use rights and other intangible assets | - | (105,480 | ) | |||||||||||||
| Acquisition of Jinhua An Kao (net of cash received) | - | (3,610,846 | ) | |||||||||||||
| Acquisition of SC Autosports | - | 486,954 | ||||||||||||||
| Purchases of construction in progress | (18,491 | ) | (425,241 | ) | ||||||||||||
| Reimbursement of capitalize interests for construction in progress | - | 1,818,390 | ||||||||||||||
Proceeds from disposal of long-live asset | 34,696,547 | - | ||||||||||||||
| Cash received from equity sale in the Affiliate Company | 32,061,558 | - | 15,641,886 | - | ||||||||||||
| Long Term Investment | - | 1,458,464 | ||||||||||||||
| Net cash provided by (used in) investing activities | $ | 31,087,397 | $ | (682,504 | ) | |||||||||||
| Advance receipts of equity transfer | - | 14,740,783 | ||||||||||||||
| Net cash provided by investing activities | $ | 50,278,763 | $ | 14,228,076 | ||||||||||||
| CASH FLOWS FROM FINANCING ACTIVITIES: | ||||||||||||||||
| Proceeds from short-term bank loans | 27,864,409 | 25,515,452 | ||||||||||||||
| Repayments of short-term bank loans | (26,261,331 | ) | (26,283,065 | ) | ||||||||||||
| Repayments of long-term bank loans | (145,734 | ) | (153,523 | ) | ||||||||||||
| Proceeds from notes payable | - | 40,313,800 | ||||||||||||||
| Repayment of notes payable | - | (43,024,633 | ) | |||||||||||||
| Cash used for stock buyback | (2,492,579 | ) | - | |||||||||||||
| Net cash used in financing activities | $ | (1,035,235 | ) | $ | (3,631,969 | ) | ||||||||||
| Proceeds from short-term loans | 24,031,625 | 17,541,532 | ||||||||||||||
| Repayments of short-term loans | (49,769,638 | ) | (15,920,046 | ) | ||||||||||||
| Proceeds from long-term loans | 394,116 | - | ||||||||||||||
| Repayments of long-term loans | (284,398 | ) | (147,408 | ) | ||||||||||||
| Net cash (used in) provided by financing activities | $ | (25,628,295 | ) | $ | 1,474,078 | |||||||||||
| NET INCREASE (DECREASE) IN CASH AND CASH EQUIVALENTS AND RESTRICTED CASH | 4,627,010 | (5,151,282 | ) | |||||||||||||
| NET DECREASE IN CASH AND CASH EQUIVALENTS AND RESTRICTED CASH | (9,677,022 | ) | (17,416,750 | ) | ||||||||||||
| Effect of exchange rate changes on cash | (928,440 | ) | (512,545 | ) | (157,062 | ) | 246,604 | |||||||||
| CASH AND CASH EQUIVALENTS AND RESTRICTED CASH AT BEGINNING OF YEAR | 22,353,071 | 16,110,496 | 16,512,635 | 22,353,071 | ||||||||||||
| CASH AND CASH EQUIVALENTS AND RESTRICTED CASH AT END OF PERIOD | 26,051,641 | 10,446,669 | 6,678,551 | 5,182,925 | ||||||||||||
| -CASH AND CASH EQUIVALENTS AT END OF PERIOD | 14,338,637 | 1,342,085 | 3,457,498 | 3,608,933 | ||||||||||||
| -RESTRICTED CASH AT END OF PERIOD | 11,713,004 | 9,104,584 | 3,221,053 | 1,573,992 | ||||||||||||
| SUPPLEMENTARY CASH FLOW INFORMATION | ||||||||||||||||
| Income taxes paid | 1,711,101 | 1,981,072 | 870,082 | 1,199,807 | ||||||||||||
| Interest paid | 1,304,062 | 1,274,399 | 641,213 | 868,538 | ||||||||||||
| SUPPLEMENTAL NON-CASH DISCLOSURES: | ||||||||||||||||
| Acquisition of Jinhua An Kao by stock | - | 20,718,859 | ||||||||||||||
| Acquisition of SC Autosports by stock | - | 756,664 | ||||||||||||||
| Amount due from the Affiliate Company converted to investment in the Affiliate Company | - | 83,669,804 | ||||||||||||||
| Notes receivable from unrelated parties for equity transfer payment | 43,137,369 | - | ||||||||||||||
See accompanying notes to condensed consolidated financial statements
4
NOTE 1 - ORGANIZATION AND PRINCIPAL ACTIVITIES
Kandi Technologies Group, Inc. (“Kandi Technologies”) was incorporated under the laws of the State of Delaware on March 31, 2004. As used herein, the terms “Company” or “Kandi” refer to Kandi Technologies and its operating subsidiaries, as described below.
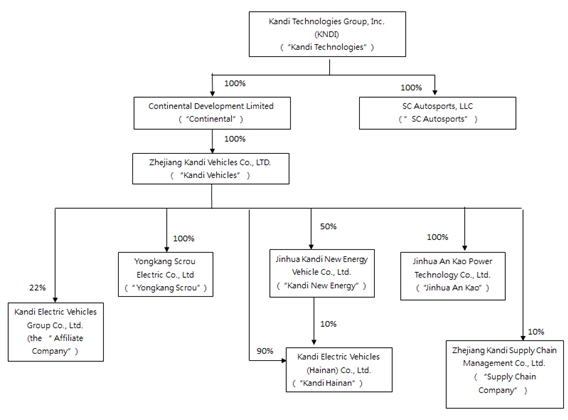
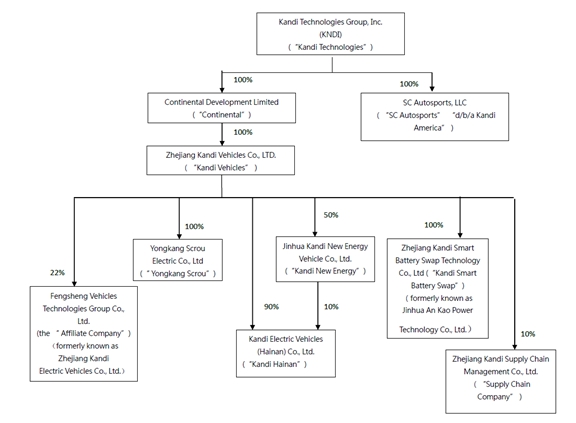
Headquartered in Jinhua City, Zhejiang Province, People’s Republic of China (“China” or “PRC”), the Company is one of China’s leading producers and manufacturers of electric vehicle (“EV”) products (through the Affiliate Company, formerly defined as the JV Company), EV parts, and off-road vehicles for sale in the Chinese and the global markets. The Company conducts its primary business operations through its wholly-owned subsidiaries, Zhejiang Kandi Vehicles Co., Ltd. (“Kandi Vehicles”), Kandi Vehicles’ wholly and partially-owned subsidiaries, and SC Autosports LLC (“SC Autosports”), d/b/a Kandi America).
The Company’s organizational chart as of September 30, 2019the date of this report is as follows:
5
On March 21, 2019, Kandi Vehicle signed an Equity Transfer Agreement (the “Transfer Agreement”) with Geely Technologies Group
In June 2020, Jinhua An Kao Power Technology Co., Ltd. (“Geely”)changed its name to transfer certain equity interests in theZhejiang Kandi Electric Vehicles GroupSmart Battery Swap Technology Co., Ltd. (the “Affiliate Company”, formerly defined as the “JV Company”) to Geely. Pursuant to the Transfer Agreement, the Affiliate Company converted a loan of RMB 314 million (approximately $46.7 million) from Geely last year to equity in order to increase its cash flow. As a result, the registered capital of the Affiliate Company became RMB 2.40 billion (approximately $336.3 million), of which Ltd (“Kandi Vehicles then owned 43.47% and Geely owned 56.53%, respectively, upon the conversion of the loan into equity in the Affiliate Company. After that, Kandi Vehicles further agreed to sell 21.47% of its equity interests in the Affiliate Company to Geely for a total amount of RMB 516 million (approximately $72.3 million)Smart Battery Swap”). As of September 29, 2019, Kandi Vehicles has received payments in cash totaling RMB 220 million (approximately $30.9 million) and certain commercial acceptance notes of RMB 296 million (approximately $41.6 million), of which RMB 140 million (approximately $19.7 million) shall mature on January 20, 2020 and the remaining RMB 156 million (approximately $21.9 million) shall mature on March 29, 2020. As a result of the completion of the equity transfer on September 29, 2019, Kandi Vehicles now owns 22% and Geely and its affiliates own 78% of the equity interests of the Affiliate Company. As now the Company only owns 22% of the JV Company, it was redefined as the Affiliate Company.
The Company’s original primary business operations consist of designing, developing, manufacturing and commercializing EV products (through Kandi Electric Vehicles (Hainan) Co., Ltd. and the Affiliate Company), EV parts and off-road vehicles. The COVID-19 outbreak has seriously impacted the EV market in 2020. As a result, the Company plans to manufacture and sell a number of ancillary products aimed at the dynamic power train system of intelligent transportation. For example, the dynamic power train system of Electric Scooters and Electric Self-Balancing Vehicles. The Company is pursuing these opportunities by expanding production of intelligent transportation products that exploit its advantages in the Yongkang Scrou Electric Co, Ltd.’s power electric motor and Kandi Smart Battery Swap’s power battery pack. The products aimed at this market combine the Company’s motors and battery packs into a dynamic power train system. As part of its strategic objective of becoming a leading manufacturer of EV products (through the Affiliate Company) and related services, in the future, the Company has increasedwill increase its focus on pure EV-related products and intelligent transportation dynamic power train system, and is actively pursuing expansion in the Chinesedomestic and international markets, especially the U.S. market.foreign markets.
NOTE 2 - LIQUIDITY
The Company had a working capital of $80,374,159$75,587,762 as of SeptemberJune 30, 2019,2020, an increase of $77,847,248$11,889,065 from athe working capital of $2,526,911$63,698,697 as of December 31, 2018.2019. As of SeptemberJune 30, 20192020 and December 31, 2018,2019, the Company’s cash and cash equivalents was $14,338,637were $3,457,498 and $ 15,662,201, respectively, the$5,490,557, respectively. The Company’s restricted cash was $11,713,004$3,221,053 and $6,690,870,$11,022,078, respectively.
DuringAfter two years of negotiations, on March 10, 2020, a real estate repurchase agreement (the “Repurchase Agreement”) was entered into by and between Kandi Vehicles and Jinhua Economic and Technological Development Zone pursuant to which the local government shall purchase the land use right over the land of 66 acres (400 mu, 265,029 square meters) that is owned by Kandi Vehicles for RMB 525 million ($74 million). Payments to Kandi Vehicles shall be made in three installments as the Company disclosed in a Current Report on Form 8-K filed with the SEC on March 9, 2020. In addition, if Kandi Vehicles achieves certain milestones that contribute to local economic development, the Company will be eligible for tax rebates totaling up to RMB 500 million ($71 million) over the next eight years. On May 22, 2020, the Company received the first quarterpayment of 2019,RMB 244 million (approximately $35 million) under the Repurchase Agreement. On July 9, 2020, the Company signed an agreement to sell 21.47% of its equity interests inreceived the Affiliate Company to Geely for a total amountsecond payment of RMB 516119 million (approximately $72.3$17 million). As under the Repurchase Agreement. The final payment of September 29, 2019,RMB 162 million ($22.9 million) will be received when the Company has received payments in cash totaling RMB 220 million (approximately $30.9 million)vacates the land, factory buildings, and certain commercial acceptance notesother real estate and moved to the new facility. Kandi Vehicles intends to use a portion of RMB 296 million (approximately $41.6 million) from Geely, of which RMB 140 million (approximately $19.7 million) shall mature on January 20, 2020 and the remaining RMB 156 million (approximately $21.9 million) shall mature on March 29, 2020. The Company plans to apply the proceeds from the equity transferland repurchase (approximately RMB 130 million, or $18.4 million) to its ongoing operations. The cash flowfund the land use acquisition and operating capacity offactory construction in the Company will be greatly improved after receivingNew Energy Automotive Zone, and use the above payments.
rest portion to fund growth initiatives and for general corporate purposes. Although the Company expects that most of its outstanding trade receivables from customers will be collected in the next twelve months, there are uncertainties with respect to the timing in collecting these receivables, especially the receivables due from the Affiliate Company, because most of them are indirectly impacted by the progress of the receipt of government subsidies.
6
The Company’s primary need for liquidity stems from its need to fund working capital requirements of the Company’s businesses, its capital expenditures and its general operations, including debt repayment. The Company has historically financed its operations through short-term commercial bank loans from Chinese banks, as well as its ongoing operating activities by using funds from operations, external credit or financing arrangements. TheAlthough the Company routinely monitors current and expected operational requirements and financial market conditions to evaluatehas paid off all the useshort-term bank loans as of available financing sources. ConsideringJune 30, 2020, it still retains the existing working capital position andcredit line, which can be used at any time when the ability to access debt funding sources,Company has special needs. In addition, the Company received the remaining RMB186 million (approximately $26.3 million) equity transfer payment from Geely in July, 2020. The management believes that the Company’s operations and borrowing resources areCompany currently has sufficient to provide for its current and foreseeableworking capital requirements to support its ongoing operations for the next twelve months.
NOTE 3 - BASIS OF PRESENTATION
The accompanying unaudited condensed consolidated financial statements have been prepared in accordance with accounting principles generally accepted in the United States of America (“U.S. GAAP”) for interim information, and with the instructions to Form 10-Q and Rule 10-01 of Regulation S-X promulgated by the Securities and Exchange Commission (“SEC”). Accordingly, they do not include all of the information and notes required by U.S. GAAP for annual financial statements. In the management’s opinion, the interim financial statements reflect all normal adjustments that are necessary to provide a fair presentation of the financial results for the interim periods presented. Operating results for interim periods are not necessarily indicative of results that may be expected for an entire fiscal year. The condensed consolidated balance sheet as of December 31, 20182019 has been derived from the audited consolidated financial statements as of such date. For a more complete understanding of the Company’s business, financial position, operating results, cash flows, risk factors and other matters, please refer to its Annual Report on Form 10-K for the fiscal year ended December 31, 20182019 (the “2018“2019 Form 10-K”).
Beginning in 2020, a strain of new coronavirus (“COVID-19”) has spread globally and at this point, the extent to which the COVID-19 may impact operations of the Company is uncertain. The extent of the impact of the COVID-19 on the Company's business and operations will depend on several factors, such as the duration, severity, and geographic spread of the pandemic, development of the testing and treatment and stimulus measures of the government. The Company is monitoring and assessing the evolving situation closely and evaluating its potential exposure. The operating results for the six months ended June 30, 2020 may not be indicative of the future operating results for the fiscal year ending December 31, 2020 or other future periods, particularly in light of the uncertain impact COVID-19 could have on the Company's business.
NOTE 4 - PRINCIPLES OF CONSOLIDATION
The Company’s consolidated financial statements reflect the accounts of the Company and its ownership interests in the following subsidiaries:
| (1) | Continental Development Limited (“Continental”), a wholly-owned subsidiary of the Company, incorporated under the laws of Hong Kong; |
| (2) | Kandi Vehicles, a wholly-owned subsidiary of |
| (3) |
7
| (4) |
| (5) | Kandi Electric Vehicles (Hainan) Co., Ltd. (“Kandi Hainan”), a subsidiary, |
| (6) |
| (7) | SC Autosports, a wholly-owned subsidiary of the Company |
Equity Method Investees
The Company’s consolidated net income also includes the Company’s proportionate share of the net income or loss of its equity method investees as follows:
The Affiliate Company, a 22% owned subsidiary of Kandi Vehicles and its subsidiaries
All intra-entity profits and losses with regard to the Company’s equity method investees have been eliminated.
NOTE 5 - USE OF ESTIMATES
The preparation of financial statements in conformity with generally accepted accounting principles in the United StatesU.S. GAAP requires the Company’s management to make estimates and assumptions that affect the reported amounts of assets and liabilities and the disclosure of contingent assets and liabilities at the date of the consolidated financial statements, and the reported amounts of revenue and expenses during the reporting period. Management makes these estimates using the best information available at the time the estimates are made; however actual results when ultimately realized could differ from those estimates.
NOTE 6 - SUMMARY OF SIGNIFICANT ACCOUNTING POLICIES
Our significant accounting policies are detailed in “Note 26 - Summary of Significant Accounting Policies” of the Company 20182019 Form 10-K.10-K, excepting the following.
(v) Reclassification
Certain reclassifications have been made to the condensed consolidated statements of cash flows for six months ended June 30, 2019 to conform to the presentation of consolidated financial statement for six months ended June 30, 2020. The Company reclassified the following 1) grouping due from employees into other receivables and other assets; 2) grouping customer deposits and deferred income into other payables and accrued liabilities.
8
NOTE 7 - NEW ACCOUNTING PRONOUNCEMENTS
In February 2016, the FASB issued ASU 2016-02, together with subsequent Accounting Standards Updates collectively known as the “leases standard” or “ASC 842”. ASC 842 requires a lessee recognize the assets and liabilities that arise from leases. All leases create an asset and a liability for the lessee in accordance with FASB Concepts Statement No. 6, Elements of Financial Statements. Effective January 1, 2019, the Company adopted the new standard using the effective date approach. The Company elected to adopt both the transition relief provided in ASU 2018-11 and the package of practical expedients which allowed us, among other things, to retain historical lease classifications and accounting for any leases that existed prior to adoption of the standard. Additionally, the management elected the practical expedients allowing the Company not to separate lease and non-lease components and not record leases with an initial term of twelve months or less (“short-term leases”) on the balance sheet across all existing asset classes.
Adoption of the new standard resulted in the recording of operating lease assets and operating lease liabilities of $140,000 as of January 1, 2019, which primarily relates to the corporate office leases for SC Autosports. The standard did not materially impact the condensed consolidated statements of operations or cash flows. Adopting the new standard did not have a material impact on the accounting for leases under which the Company is the lessee.
In January 2017, the FASB issued ASU No. 2017-04 (Topic 350) Intangibles—Goodwill and Other: Simplifying the Test for Goodwill Impairment, which removes Step 2 of the goodwill impairment test, which requires a hypothetical purchase price allocation. Under the amended guidance, a goodwill impairment charge will now be recognized for the amount by which the carrying value of a reporting unit exceeds its fair value, not to exceed the carrying amount of goodwill. This ASU will be applied on a prospective basis and is effective for interim and annual periods beginning after December 15, 2019, with early adoption permitted for any impairment tests performed after January 1, 2017. The Company plans to adopt this ASU in the fourth quarter of 2019 and does not expect the adoption to have a material impact on the Consolidated Financial Statements.
In February 2018, the FASB released ASU 2018-2, “Reclassification of Certain Tax Effects from Accumulated Other Comprehensive Income.” This standard update addresses a specific consequence of the Tax Cuts and Jobs Act (“U.S. tax reform”(the “Tax Act”) and allows a reclassification from accumulated other comprehensive income to retained earnings for the stranded tax effects resulting from U.S. tax reform.the Tax Act. Consequently, the update eliminates the stranded tax effects that were created as a result of the historical U.S. federal corporate income tax rate to the newly enacted U.S. federal corporate income tax rate. The Company is required to adopt this standard in the first quarter of fiscal year 2020, with early adoption permitted. The amendments in this update should be applied either in the period of adoption or retrospectively to each period in which the effect of the change in the U.S. federal corporate income tax rate in the Tax Cuts and Jobs Act is recognized. The Company has finishedadopted this ASU in the evaluationfirst quarter of 2020 and determined there is nothe new standard did not have a material impact of on its Condensed Consolidated Financial Statements.the consolidated financial statements.
In August 2018, the FASB issued ASU 2018-13 Disclosure Framework — Changes to the Disclosure Requirements for Fair Value Measurement, which eliminates, adds, and modifies certain disclosure requirements for fair value measurements under ASC 820. This ASU is to be applied on a prospective basis for certain modified or new disclosure requirements, and all other amendments in the standard are to be applied on a retrospective basis. The new standard is effective for interim and annual periods beginning after December 15, 2019, with early adoption permitted. The Company adopted this ASU in the first quarter of 2020 and the new standard did not have a material impact on the consolidated financial statements.
In January 2020, the FASB issued ASU 2020-01, Investments—Equity Securities, Investments—Equity Method and Joint Ventures, and Derivatives and Hedging, which clarifies the interaction of the accounting for equity securities under Topic 321, the accounting for equity method investments in Topic 323, and the accounting for certain forward contracts and purchased options in Topic 815. This guidance will be effective in the first quarter of 2021 on a prospective basis, with early adoption permitted. The Company is currently evaluating the impact of the new guidance and do not expect the adoption of this guidance will have a material impact on the Consolidated Financial Statements.consolidated financial statements.
9
NOTE 8 - CONCENTRATIONS
(a) Customers
For the three-month period ended SeptemberJune 30, 2019,2020, the Company’s major customers, each of whom accounted for more than 10% of the Company’s consolidated revenue, were as follows:
| Sales | Trade Receivable | |||||||||||||||||||||||||||||||
| Three Months | Three Months | |||||||||||||||||||||||||||||||
| Ended | Ended | |||||||||||||||||||||||||||||||
| September 30, | September 30, | September 30, | December 31, | Sales | Trade Receivable | |||||||||||||||||||||||||||
| Major Customers | 2019 | 2018 | 2019 | 2018 | | Three Months Ended June 30, 2020 | | Three Months Ended June 30, 2019 | | June 30, 2020 | | | December 31, 2019 | | ||||||||||||||||||
| Customer A | 30 | % | 24 | % | 27 | % | 22 | % | 57 | % | 36 | % | 66 | % | 55 | % | ||||||||||||||||
| Customer B | 30 | % | 4 | % | 12 | % | 2 | % | 15 | % | 27 | % | 6 | % | 5 | % | ||||||||||||||||
| Kandi Electric Vehicles Group Co., Ltd. and its subsidiaries (related party) | 15 | % | 61 | % | 30 | % | 66 | % | ||||||||||||||||||||||||
| Customer D | 10 | % | - | 8 | % | 7 | % | |||||||||||||||||||||||||
For the nine-monthsix-month period ended SeptemberJune 30, 2019,2020, the Company’s major customers, each of whom accounted for more than 10% of the Company’s consolidated revenue, were as follows:
| Sales | Trade Receivable | |||||||||||||||||||||||||||||||
| Nine Months | Nine Months | |||||||||||||||||||||||||||||||
| Ended | Ended | |||||||||||||||||||||||||||||||
| September 30, | September 30, | September 30, | December 31, | Sales | Trade Receivable | |||||||||||||||||||||||||||
| Major Customers | 2019 | 2018 | 2019 | 2018 | Six Months Ended June 30, 2020 | Six Months Ended June 30, 2019 | June 30, 2020 | December 31, 2019 | ||||||||||||||||||||||||
| Customer A | 39 | % | 24 | % | 27 | % | 22 | % | 51 | % | 47 | % | 66 | % | 55 | % | ||||||||||||||||
| Customer B | 23 | % | 6 | % | 12 | % | 2 | % | 15 | % | 18 | % | 6 | % | 5 | % | ||||||||||||||||
| Kandi Electric Vehicles Group Co., Ltd. and its subsidiaries (related party) | 14 | % | 49 | % | 30 | % | 66 | % | ||||||||||||||||||||||||
(b) Suppliers
For the three-month period ended SeptemberJune 30, 2019,2020, the Company’s material suppliers, each of whom accounted for more than 10% of the Company’s total purchases, were as follows:
| Purchases | Accounts Payable | |||||||||||||||
| Major Suppliers | Three Months Ended June 30, 2020 | Three Months Ended June 30, 2019 | June 30, 2020 | December 31, 2019 | ||||||||||||
| Zhejiang Kandi Supply Chain Management Co., Ltd. | 59 | % | 69 | % | 13 | % | 8 | % | ||||||||
| Supplier C | 24 | % | 13 | % | - | - | ||||||||||
��
10
| Purchases | Accounts Payable | |||||||||||||||
| Three Months | Three Months | |||||||||||||||
| Ended | Ended | |||||||||||||||
| September 30, | September 30, | September 30, | December 31 | |||||||||||||
| Major Suppliers | 2019 | 2018 | 2019 | 2018 | ||||||||||||
| Supplier E | 93 | % | - | 12 | % | - | ||||||||||
For the nine-monthsix-month period ended SeptemberJune 30, 2019,2020, the Company’s material suppliers, each of whom accounted for more than 10% of the Company’s total purchases, were as follows:
| Purchases | Accounts Payable | |||||||||||||||
| Nine Months | Nine Months | |||||||||||||||
| Ended | Ended | |||||||||||||||
| September 30, | September 30, | September 30, | December 31, | |||||||||||||
| Major Suppliers | 2019 | 2018 | 2019 | 2018 | ||||||||||||
| Supplier E | 67 | % | - | 12 | % | - | ||||||||||
| Supplier F | 13 | % | 3 | % | 6 | % | - | |||||||||
| Purchases | Accounts Payable | |||||||||||||||
| Major Suppliers | Six Months Ended June 30, 2020 | Six Months Ended June 30, 2019 | June 30, 2020 | December 31, 2019 | ||||||||||||
| Zhejiang Kandi Supply Chain Management Co., Ltd. | 59 | % | 48 | % | 13 | % | 8 | % | ||||||||
| Supplier C | 25 | % | 15 | % | - | - | ||||||||||
NOTE 9 - EARNINGS (LOSS) PER SHARE
The Company calculates earnings per share in accordance with ASC 260, Earnings Per Share, which requires a dual presentation of basic and diluted earnings per share. Basic earnings per share are computed using the weighted average number of shares outstanding during the reporting period. Diluted earnings per share represents basic earnings per share adjusted to include the potentially dilutive effect of outstanding stock options and warrants (using treasury stock method). Due to the average market price of the common stock during the period below the exercise price of the options approximately 3,900,000 options were excluded from the calculation of diluted net loss per share, for the three and nine months ended September 30, 2019, respectively. Duedue to the loss from operations, approximately 3,900,000 options were excluded from the calculation of diluted net loss per share, for the threethree-month and nine monthssix-month period ended SeptemberJune 30, 2018, respectively.2020.
The following is the calculation of earnings per share for the three-month and six-month periods ended SeptemberJune 30, 20192020 and 2018:2019:
| For three months ended | ||||||||
| June 30, | ||||||||
| 2020 | 2019 | |||||||
| Net income (loss) | $ | 4,055,046 | $ | (7,318,158 | ) | |||
| Weighted average shares used in basic computation | 53,369,602 | 52,806,331 | ||||||
| Dilutive shares | - | - | ||||||
| Weighted average shares used in diluted computation | 53,369,602 | 52,806,331 | ||||||
| Income (loss) per share: | ||||||||
| Basic | $ | 0.08 | $ | (0.14 | ) | |||
| Diluted | $ | 0.08 | $ | (0.14 | ) | |||
11
| For three months ended | ||||||||
| September 30, | ||||||||
| 2019 | 2018 | |||||||
| Net income (loss) | $ | 12,089,441 | $ | (6,521,399 | ) | |||
| Weighted average shares used in basic computation | 52,613,642 | 51,474,048 | ||||||
| Dilutive shares | - | - | ||||||
| Weighted average shares used in diluted computation | 52,613,642 | 51,474,048 | ||||||
| Earnings (Loss) per share: | ||||||||
| Basic and diluted | $ | 0.23 | $ | (0.13 | ) | |||
The following is the calculation of earnings per share for the nine-month periods ended September 30, 2019 and 2018:
| For nine months ended | For six months ended | |||||||||||||||
| September 30, | June 30, | |||||||||||||||
| 2019 | 2018 | 2020 | 2019 | |||||||||||||
| Net income (loss) | $ | 361,811 | $ | (1,418,879 | ) | $ | 2,480,400 | $ | (11,727,630 | ) | ||||||
| Weighted average shares used in basic computation | 52,332,260 | 51,089,047 | 52,862,043 | 52,189,237 | ||||||||||||
| Dilutive shares | - | - | - | - | ||||||||||||
| Weighted average shares used in diluted computation | 52,332,260 | 51,089,047 | 52,862,043 | 52,189,237 | ||||||||||||
| Earnings (Loss) per share: | ||||||||||||||||
| Basic and diluted | $ | 0.01 | $ | (0.03 | ) | |||||||||||
| Income (loss) per share: | ||||||||||||||||
| Basic | $ | 0.05 | $ | (0.22 | ) | |||||||||||
| Diluted | $ | 0.05 | $ | (0.22 | ) | |||||||||||
NOTE 10 - ACCOUNTS RECEIVABLE
Accounts receivable are summarized as follows:
| September 30, | December 31, | June 30, | December 31, | |||||||||||||
| 2019 | 2018 | 2020 | 2019 | |||||||||||||
| Accounts receivable | $ | 54,990,221 | $ | 34,394,738 | $ | 60,271,467 | $ | 61,436,514 | ||||||||
| Less: allowance for doubtful accounts | (130,420 | ) | (120,010 | ) | (251,012 | ) | (254,665 | ) | ||||||||
| Accounts receivable, net | $ | 54,859,801 | $ | 34,274,728 | $ | 60,020,455 | $ | 61,181,849 | ||||||||
NOTE 11 - INVENTORIES
Inventories are summarized as follows:
| September 30, | December 31, | June 30, | December 31, | |||||||||||||
| 2019 | 2018 | 2020 | 2019 | |||||||||||||
| Raw material | $ | 11,192,506 | $ | 7,040,728 | $ | 10,022,590 | $ | 12,127,957 | ||||||||
| Work-in-progress | 13,778,920 | 1,571,179 | 11,369,771 | 4,545,736 | ||||||||||||
| Finished goods | 10,475,957 | 13,385,961 | 6,852,906 | 11,062,873 | ||||||||||||
| Inventories | $ | 35,447,383 | $ | 21,997,868 | $ | 28,245,267 | $ | 27,736,566 | ||||||||
1012
NOTE 12 - NOTES RECEIVABLE
As of SeptemberJune 30, 2020, there was $0 notes receivable from unrelated parties. As of December 31, 2019, there was $41,549,888$42,487,225 notes receivable from unrelated parties, among which $70,067 were bank acceptance notes from payments for sales and $41,479,821 werewas commercial acceptance notes from payments for equity transfer of the Affiliate Company , among which $15,562,661 had been collected during first half of 2020 and the rest were considered as other receivables (refer to Note 24-summarized22-summarized information of equity method investment in the Affiliate Company). As of December 31, 2018, there was $72,712 notes receivable from unrelated parties, among which $72,712 were bank acceptance notes from payments for sales.
As of September 30, 2019, there was $0 notes receivable from the Affiliate Company and related parties. As of December 31, 2018. there was $3,861,032 notes receivable from the Affiliate Company and related parties, among which $3,861,032 were bank acceptance notes from payments for sales.
NOTE 13 - OTHER RECEIVABLES
Other receivables consist of the following:
| June 30, | December 31, | |||||||
| 2020 | 2019 | |||||||
| Amount due from unrelated party for equity transfer of the Affiliate company | $ | 26,315,045 | $ | - | ||||
| Loan to third party | 13,726,757 | 3,577,145 | ||||||
| Others | 2,619,540 | 1,442,826 | ||||||
| Total other receivables | $ | 42,661,342 | $ | 5,019,971 | ||||
Other receivable is summarized as follows:
| September 30, | December 31, | |||||||
| 2019 | 2018 | |||||||
| Loan to third party | $ | 9,187,863 | $ | - | ||||
| Others | 3,671,441 | 1,264,323 | ||||||
| Total other receivables | $ | 12,859,304 | $ | 1,264,323 | ||||
As of SeptemberJune 30, 2020, the Company’s other receivable includes $26,315,045 amount due from unrelated party for equity transfer of the Affiliate Company (refer to Note 22-summarized information of equity method investment in the Affiliate Company). As of June 30, 2020 and December 31, 2019, the Company’s other receivable includes $9.2 million$13,726,757 and $3,577,145 short-term loan lent to an unrelated party with a 6% annual interest rate to maximize the use of idled cash. This loan can be redeemed at any time.
13
NOTE 14 - PROPERTY, PLANT AND EQUIPMENT, NET
Property, plants and equipment as of SeptemberJune 30, 20192020 and December 31, 2018,2019, consisted of the following:
| September 30, | December 31, | |||||||
| 2019 | 2018 | |||||||
| At cost: | ||||||||
| Buildings | $ | 29,703,216 | $ | 30,638,417 | ||||
| Machinery and equipment | 61,376,817 | 63,398,627 | ||||||
| Office equipment | 998,625 | 852,172 | ||||||
| Motor vehicles and other transport equipment | 403,253 | 418,476 | ||||||
| Molds and others | 25,420,383 | 26,849,806 | ||||||
| 117,902,294 | 122,157,498 | |||||||
| Less : Accumulated depreciation | ||||||||
| Buildings | $ | (5,579,392 | ) | $ | (5,019,075 | ) | ||
| Machinery and equipment | (12,395,351 | ) | (8,442,940 | ) | ||||
| Office equipment | (464,806 | ) | (393,893 | ) | ||||
| Motor vehicles and other transport equipment | (344,633 | ) | (325,917 | ) | ||||
| Molds and others | (24,626,908 | ) | (25,486,100 | ) | ||||
| (43,411,090 | ) | (39,667,925 | ) | |||||
| Less: impairment | - | (443,650 | ) | |||||
| Property, plant and equipment, net | $ | 74,491,204 | $ | 82,045,923 | ||||
| June 30, | December 31, | |||||||
| 2020 | 2019 | |||||||
| At cost: | ||||||||
| Buildings | $ | 30,017,395 | $ | 30,447,480 | ||||
| Machinery and equipment | 62,128,182 | 62,973,794 | ||||||
| Office equipment | 1,041,911 | 1,048,651 | ||||||
| Motor vehicles and other transport equipment | 412,260 | 413,046 | ||||||
| Molds and others | 25,467,098 | 25,836,241 | ||||||
| 119,066,846 | 120,719,212 | |||||||
| Less : Accumulated depreciation | ||||||||
| Buildings | $ | (6,396,987 | ) | $ | (5,975,030 | ) | ||
| Machinery and equipment | (16,735,598 | ) | (14,127,506 | ) | ||||
| Office equipment | (611,384 | ) | (537,829 | ) | ||||
| Motor vehicles and other transport equipment | (369,453 | ) | (360,098 | ) | ||||
| Molds and others | (25,045,460 | ) | (25,310,891 | ) | ||||
| (49,158,882 | ) | (46,311,354 | ) | |||||
| Property, plant and equipment, net | $ | 69,907,964 | $ | 74,407,858 | ||||
As of SeptemberJune 30, 20192020 and December 31, 2018,2019, the net book value of property, plant and equipment pledged as collateral for the Company’s bank loans totaled $7,441,479$0 and $8,105,419,$6,484,497, respectively. Also see Note 18.17.
Depreciation expenses for the three months ended SeptemberJune 30, 2020 and 2019 were $1,750,013 and September 30, 2018 were $1,832,83 and $239,434,$1,876,569, respectively. Depreciation expenses for the ninesix months ended SeptemberJune 30, 2020 and 2019 were $3,530,165 and September 30, 2018 were $5,724,863 and $1,511,018, respectively$3,892,028, respectively.
NOTE 15 - INTANGIBLE ASSETS
Intangible assets include acquired other intangibles of trade name, customer relations and patent recorded at estimated fair values in accordance with purchase accounting guidelines for acquisitions.
14
The following table provides the gross carrying value and accumulated amortization for each major class of our intangible assets, other than goodwill:
| Remaining | September 30, | December 31, | Remaining | June 30, | December 31, | |||||||||||||||
| useful life | 2019 | 2018 | useful life | 2020 | 2019 | |||||||||||||||
| Gross carrying amount: | ||||||||||||||||||||
| Trade name | 2.25 years | $ | 492,235 | $ | 492,235 | 1.5 years | $ | 492,235 | $ | 492,235 | ||||||||||
| Customer relations | 2.25 years | 304,086 | 304,086 | 1.5 years | 304,086 | 304,086 | ||||||||||||||
| Patent | 5.75-7.42 years | 4,456,278 | 4,624,513 | 5-6.67 years | 4,499,024 | 4,564,506.00 | ||||||||||||||
| 5,252,599 | 5,420,834 | 5,295,345 | 5,360,827 | |||||||||||||||||
| Less : Accumulated amortization | ||||||||||||||||||||
| Trade name | $ | (376,366 | ) | $ | (338,307 | ) | $ | (414,426 | ) | $ | (389,053 | ) | ||||||||
| Customer relations | (232,505 | ) | (208,993 | ) | (256,017 | ) | (240,342 | ) | ||||||||||||
| Patent | (919,740 | ) | (545,407 | ) | (1,326,518 | ) | (1,076,660 | ) | ||||||||||||
| (1,528,611 | ) | (1,092,707 | ) | (1,996,961 | ) | (1,706,055 | ) | |||||||||||||
| Intangible assets, net | $ | 3,723,988 | $ | 4,328,127 | $ | 3,298,384 | $ | 3,654,772 | ||||||||||||
The aggregate amortization expenses for those intangible assets that continue to be amortized is reflected in amortization of intangible assets in the Consolidated Statements of Incomewere $ 152,846 and Comprehensive Income and were $154,027 and $157,817$157,967 for the three months ended SeptemberJune 30, 2020 and 2019, respectively. The aggregate amortization expenses for those intangible assets were $307,702 and 2018, respectively. And $471,497 and $493,405$317,470 for the ninesix months ended SeptemberJune 30, 2020 and 2019, and 2018, respectively.
Amortization expenses for the next five years and thereafter are as follows:
| 2019 (Three Months) | $ | 157,166 | ||||||
| 2020 | 628,663 | |||||||
| 2020 (Six months) | $ | 307,702 | ||||||
| 2021 | 628,663 | 615,403 | ||||||
| 2022 | 549,304 | 536,044 | ||||||
| 2023 | 546,568 | 533,308 | ||||||
| 2024 | 533,308 | |||||||
| Thereafter | 1,213,624 | 772,619 | ||||||
| Total | $ | 3,723,988 | $ | 3,298,384 | ||||
NOTE 16 - LAND USE RIGHTS, NET
The Company’s land use rights consist of the following:
| June 30, | December 31, | |||||||
| 2020 | 2019 | |||||||
| Cost of land use rights | $ | 11,531,218 | $ | 14,731,847 | ||||
| Less: Accumulated amortization | (2,766,022 | ) | (3,459,032 | ) | ||||
| Land use rights, net | $ | 8,765,196 | $ | 11,272,815 | ||||
During June 2020, $2.2 million of land use rights was returned to the government as the Company began to perform its obligations under the Repurchase Agreement.
15
| September 30, | December 31, | |||||||
| 2019 | 2018 | |||||||
| Cost of land use rights | $ | 14,382,544 | $ | 14,925,518 | ||||
| Less: Accumulated amortization | (3,297,827 | ) | (3,175,790 | ) | ||||
| Land use rights, net | $ | 11,084,717 | $ | 11,749,728 | ||||
As of SeptemberJune 30, 20192020 and December 31, 2018,2019, the net book value of land use rights pledged as collateral for the Company’s bank loans was $7,366,117$0 and $7,756,253,$4,937,138, respectively. Also see Note 18.17.
The amortization expenses for the three months ended SeptemberJune 30, 2020 and 2019, were $79,751 and September 30, 2018, were $80,462 and $82,586,$82,837, respectively. The amortization expenses for the ninesix months ended SeptemberJune 30, 2020 and 2019, were $160,712 and September 30, 2018, were $247,061 and $267,177,$166,599, respectively. Amortization expenses for the next five years and thereafter is as follows:
| 2019 (Three Months) | $ | 82,354 | ||||||
| 2020 | 329,415 | |||||||
| 2020 (Six months) | $ | 160,712 | ||||||
| 2021 | 329,415 | 321,424 | ||||||
| 2022 | 329,415 | 321,424 | ||||||
| 2023 | 329,415 | 321,424 | ||||||
| 2024 | 321,424 | |||||||
| Thereafter | 9,684,703 | 7,318,788 | ||||||
| Total | $ | 11,084,717 | $ | 8,765,196 | ||||
NOTE 17 - CONSTRUCTION-IN-PROGRESS
In September 2019, in order to further increase the production capacity, YongkangScrou started building a factory of efficient new energy vehicle drive motors with a space of 6,639.9 square meters on the basis of the original plant. The total contract amount was RMB 6.6 million (approximately $0.9 million). The project is expected to be completed by 2020. As of September 30, 2019 and December 31, 2018, the Company’s Construction-in-Progress (“CIP”) were $17,781 and $0, respectively. No depreciation is provided for CIP until such time as the facility is completed and placed into operation. There was no interest expense capitalized for CIP for the three and nine months ended September 30, 2019.
NOTE 18 - SHORT-TERM AND LONG-TERM BANK LOANS
Short-term loans are summarized as follows:
| June 30, | December 31, | |||||||
| 2020 | 2019 | |||||||
| Bank A | ||||||||
| Interest rate 5.66% per annum, paid off on May 22, 2020, secured by the assets of Kandi Vehicle, also guaranteed by company’s subsidiaries. Also see Note 14 and Note 16. | - | 7,004,650 | ||||||
| Interest rate 5.66% per annum, paid off on May 22, 2020,secured by the assets of Kandi Vehicle, also guaranteed by company’s subsidiaries. Also see Note 14 and Note 16. | - | 4,621,921 | ||||||
| Bank B | ||||||||
| Interest rate 5.22% per annum, paid off on April 22, 2020, secured by the assets of Kandi Vehicle. Also see Note 14 and Note 16. | - | 5,741,517 | ||||||
| Interest rate 5.22% per annum, paid off on April 24, 2020, secured by the assets of Kandi Vehicle. Also see Note 14 and Note 16. | - | 4,306,138 | ||||||
| Interest rate 5.22% per annum, paid off on April 26, 2020, secured by the assets of Kandi Vehicle. Also see Note 14 and Note 16. | - | 4,306,138 | ||||||
| $ | - | $ | 25,980,364 | |||||
16
| September 30, | December 31, | |||||||
| 2019 | 2018 | |||||||
| Loans from China Ever-bright Bank | ||||||||
| Interest rate 5.655% per annum, paid off on April 18, 2019, secured by the assets of Kandi Vehicle, guaranteed by Mr. Hu Xiaoming and his wife, also guaranteed by company’s subsidiaries. Also see Note 14 and Note 16. | - | 10,179,745 | ||||||
| Loans from Hangzhou Bank | ||||||||
| Interest rate 5.66% per annum, paid off on October 14, 2019, secured by the assets of Kandi Vehicle, also guaranteed by company’s subsidiaries. Also see Note 14 and Note 16. | 6,838,565 | 7,096,737 | ||||||
| Interest rate 5.66% per annum, due on December 31, 2019, secured by the assets of Kandi Vehicle, also guaranteed by company’s subsidiaries. Also see Note 14 and Note 16. | 5,605,381 | 5,816,997 | ||||||
| Interest rate 5.66% per annum, due on July 4, 2020, secured by the assets of Kandi Vehicle, also guaranteed by company’s subsidiaries. Also see Note 14 and Note 16. | 4,512,332 | 4,682,683 | ||||||
| Interest rate 5.66% per annum, paid off on April 24, 2019, secured by the assets of Kandi Vehicle. Also see Note 14 and Note 16. | - | 2,763,074 | ||||||
| Loans from Agricultural Bank of China | ||||||||
| Interest rate 5.22% per annum, due on April 18, 2020, secured by the assets of Kandi Vehicle. Also see Note 14 and Note 16. | 4,204,036 | - | ||||||
| Interest rate 5.22% per annum, due on April 23, 2020, secured by the assets of Kandi Vehicle. Also see Note 14 and Note 16. | 5,605,381 | - | ||||||
| Interest rate 5.22% per annum, due on May 3, 2020, secured by the assets of Kandi Vehicle. Also see Note 14 and Note 16. | 4,204,036 | - | ||||||
| $ | 30,969,731 | $ | 30,539,236 | |||||
Long-term loans are summarized as follows:
| June 30, | December 31, | |||||||
| 2020 | 2019 | |||||||
| Long term bank loans: | $ | |||||||
| Bank C | ||||||||
| Interest rate 7% per annum, due on December 12, 2021, guaranteed by the Company’s subsidiaries. | 27,446,875 | 28,133,433 | ||||||
| Other long term loans: | ||||||||
| Loan under Paycheck Protection Program① | 244,116 | - | ||||||
| Economic Injury Disaster Loan ② | 150,000 | - | ||||||
| Long term loans - current and noncurrent portion | $ | 27,840,991 | 28,133,433 | |||||
| ① | The Coronavirus Aid, Relief, and Economic Security Act, or CARES Act, was signed into law on March 27, 2020, and provides over $2.0 trillion in emergency economic relief to individuals and businesses impacted by the COVID-19 pandemic. The CARES Act authorized the Small Business Administration (“SBA”) to temporarily guarantee loans under a new 7(a) loan program called the Paycheck Protection Program (“PPP”). An eligible business can apply for a PPP loan up to the greater of: (1) 2.5 times its average monthly “payroll costs;” or (2) $10.0 million. PPP loans will have: (a) an interest rate of 1.0%, (b) a two-year loan term to maturity; and (c) principal and interest payments deferred for six months from the date of disbursement. The SBA will guarantee 100% of the PPP loans made to eligible borrowers. The entire principal amount of the borrower’s PPP loan, including any accrued interest, is eligible to be reduced by the loan forgiveness amount under the PPP so long as employee and compensation levels of the business are maintained and 75% of the loan proceeds are used for payroll expenses, with the remaining 25% of the loan proceeds used for other qualifying expenses. As of June 30, 2020, we had received $244,116 under the PPP. |
| ② | In addition, Economic Injury Disaster Loans (“EIDL”) through the SBA was also made available under the CARES Act passed by Congress in response to the COVID-19 pandemic. During June 2020, $150,000 of EIDL loan was approved with the term of a 3.75% rate over 30 years, and a 12-month deferment on the first repayment of principal with interest accrued during deferment. |
| September 30, | December 31, | |||||||
| 2019 | 2018 | |||||||
| Loans from Haikou Rural Credit Cooperative | ||||||||
| Interest rate 7% per annum, due on December 12, 2021, guaranteed by Kandi Vehicle and Kandi New Energy. | 27,606,502 | 28,794,136 | ||||||
| $ | 27,606,502 | 28,794,136 | ||||||
17
The interest expenses of short-term and long-term bank loans for the three months ended SeptemberJune 30, 2020 and 2019 were $748,269 and 2018 were $435,524 and $426,167,$429,355, respectively. The interest expenses of short-term and long-term bank loans for the ninesix months ended SeptemberJune 30, 2020 and 2019 were $1,590,317 and 2018 were $1,304,062 and $1,274,399,$868,538, respectively.
As of SeptemberJune 30, 2019,2020, the aggregate amount of short-term and long-term loans guaranteed by various third parties was $0.
NOTE 19 - NOTES PAYABLE
Notes payable is presented to certain suppliers as a payment against the outstanding trade payable. Notes payable are mainly bank acceptance notes and commercial acceptance notes which are non-interest bearing and generally mature within one year.
As of September 30, 2019, there was $11,463,004 notes payable, among which $11,463,004 was bank acceptance notes. As of December 31, 2018, there was $12,787,619 notes payable, among which $8,767,670 were bank acceptance notes, $2,763,074 were commercial acceptance notes and $1,256,875 were other notes payable. $11,463,004 and $6,440,870 were held as collateral for the notes payable as of September 30, 2019 and December 31, 2018, respectively.
NOTE 2018 - TAXES
(a) Corporation Income Tax
Pursuant to the tax laws and regulations of the PRC, the Company’s applicable corporate income tax (“CIT”) rate is 25%. However, Kandi Vehicles and Jinhua AnkaoKandi Smart Battery Swap qualify as High and New Technology Enterprise (“HNTE”) companies in the PRC, and are entitled to pay a reduced income tax rate of 15% for the years presented. A HNTE Certificate is valid for three years. An entity may re-apply for an HNTE certificate when the prior certificate expires. Historically, Kandi Vehicles has successfully re-applied for such certificates when the its prior certificates expired. Jinhua AnkaoKandi Smart Battery Swap has been qualified as HNTE since 2018. Therefore no records for renewal are available. The applicable CIT rate of each of the Company’s three other subsidiaries, Kandi New Energy, Yongkang Scrou and Kandi Hainan, the Affiliate Company and its subsidiaries is 25%.
The Company’s tax provision or benefit from income taxes for interim periods is determined using an estimate of ourits annual effective tax rate, adjusted for discrete items, if any, that are taken into account in the relevant period. Each quarter the Company updates its estimate of the annual effective tax rate, and if its estimated tax rate changes, the management makes a cumulative adjustment. For 2019, the management estimates that its effective tax rate will be favorably affected by non-taxable income such as the share of income of the Affiliate Company and the gain from the change of fair value of contingent liabilities and certain research and development super-deduction and adversely affected by non-deductible expenses such as part of entertainment expenses. The Company records valuation allowances against the deferred tax assets associated with losses for which weit may not realize a related tax benefit. After combining research and development tax credits of 25% on certain qualified research and development expenses, the Company’s effective tax ratesrate for the ninesix months ended SeptemberJune 30, 2019,2020 and 20182019 were a tax benefitexpense of 13.05%62.43% on a reported income before taxes of approximately $0.3$6.6 million, and an effective income tax rate with a tax benefit of 20.70% for the same period of last year6.02% on a reported loss before taxes of approximately $1.8$12.5 million, respectively.
The quarterly tax provision, and the quarterly estimate of ourthe Company’s annual effective tax rate, is subject to significant variation due to several factors, including variability in accurately predicting ourthe Company’s pre-tax and taxable income and loss, acquisitions (including integrations) and investments, changes in ourits stock price, changes in ourits deferred tax assets and liabilities and their valuation, return to provision true-up, foreign currency gains (losses), changes in regulations and interpretations related to tax, accounting, and other areas. Additionally, ourthe Company’s effective tax rate can be more or less volatile based on the amount of pre-tax income or loss. The income tax provision for the ninesix months ended SeptemberJune 30, 20192020 and 20182019 was tax benefitexpense of $41,780$4,122,502 and tax benefit of $370,316,$751,193, respectively.
18
Effective January 1, 2007, the Company adopted the guidance in
Under ASC 740 guidance relating to uncertain tax positions. The guidancepositions, which addresses the determination of whether tax benefits claimed or expected to be claimed on a tax return should be recorded in the financial statements. Under ASC 740,statements, the Company may recognize the tax benefit from an uncertain tax position only if it is more likely than not that the tax position will be sustained on examination by the taxing authorities, based on the technical merits of the position. The tax benefits recognized in the financial statements from such a position should be measured based on the largest benefit that has a greater than fifty percent likelihood of being realized upon ultimate settlement. ASC 740 also provides guidance on de-recognition, classification, interest and penalties on income taxes, accounting in interim periods and requires increased disclosures. As of December 31, 2018,June 30, 2020, the Company did not have any liability for unrecognized tax benefits. The Company files income tax returns with the U.S. Internal Revenue Services (“IRS”) and those states where the Company has operations. The Company is subject to U.S. federal or state income tax examinations by the IRS and relevant state tax authorities for years after 2006. During the periods open to examination, the Company has net operating loss carry forwards (“NOLs”) for U.S. federal and state tax purposes that have attributes from closed periods. Since these NOLs may be utilized in future periods, they remain subject to examination. The Company also files certain tax returns in the PRC. As of SeptemberJune 30, 2019,2020, the Company was not aware of any pending income tax examinations by U.S. or PRC tax authorities. The Company records interest and penalties on uncertain tax provisions as income tax expense. As of SeptemberJune 30, 20192020, the Company has no accrued interest or penalties related to uncertain tax positions.
The aggregate NOLs in 2019 was $9.6 million deriving from entities in the PRC and Hong Kong. The aggregate NOLs in 2018 was $28.1 million deriving from entities in the PRCand Hong Kong. The aggregate NOLs in 2017 was $22.7 million deriving from entities in the PRC, Hong Kong and U.S. The NOLs will start to expire from 2021 if they are not used. The cumulative net operating loss in the PRC can be carried forward for five years, to offset future net profits for income tax purposes. The Company has $0 cumulative net operating loss Pre-2018 in the U.S. can be carriedto carry forward for twenty years.as of June 30, 2020. The cumulative net operating loss in Hong Kong can be carried forward without an expiration date.
(b) Tax Holiday Effect
For the ninesix months ended SeptemberJune 30, 20192020 and 2018,2019, the PRC CIT rate was 25%. Certain subsidiaries of the Company are entitled to tax exemptions (tax holidays) for the ninesix months ended SeptemberJune 30, 20192020 and 2018.2019.
The combined effects of income tax expense exemptions and reductions available to the Company for the ninesix months ended SeptemberJune 30, 20192020 and 20182019 are as follows:
| Nine Months Ended | Six Months Ended | |||||||||||||||
| September 30, | June 30, | |||||||||||||||
| 2019 | 2018 | 2020 | 2019 | |||||||||||||
| Tax benefit (holiday) credit | $ | 377,303 | $ | 1,345,541 | $ | 164,163 | $ | 169,810 | ||||||||
| Basic net income per share effect | $ | 0.000 | $ | 0.000 | $ | 0.000 | $ | 0.000 | ||||||||
(c) The Tax Cuts and JobCARES Act
On December 22, 2017,March 27, 2020, the SEC staff issued Staff Accounting Bulletin (SAB) No. 118, which provides guidance on accounting“Coronavirus Aid, Relief and Economic Security (CARES) Act” was signed into law. The CARES Act, among other things, includes provisions relating to refundable payroll tax credits, deferment of employer side social security payments, net operating loss carryback periods, alternative minimum tax credit refunds, modifications to the net interest deduction limitations and technical corrections to tax depreciation methods for the tax effects of the Tax Act. SAB 118 provides a measurement period that shouldqualified improvement property. The Company does not extend beyond one year from the Tax Act enactment date for companies to complete the accounting under ASC 740. In accordance with SAB 118, a company must reflect theanticipate significant income tax effects of those aspects of the Tax Act for which the accounting under ASC 740 is complete. To the extent that a company’s accounting for certain income tax effects of the Tax Act is incomplete but it is able to determine a reasonable estimate, it must record a provisional estimate inimpact on its financial statements. If a company cannot determine a provisional estimate to be included in its financial statements, it shouldand continue to apply ASC 740examine the impacts this CARES Act may have on the basis of the provisions of the tax laws that were in effect immediately before the enactment of the Tax Act.its business.
19
In connection with our initial analysis of the impact of the Tax Cuts and Jobs Act of 2017 (the “Tax Act”), the Company recorded provisional estimates related to the re-measurement of deferred taxes and the Deemed Repatriation Transition Tax in our financial statements for the fiscal year ended December 31, 2017. The measurement period ended on December 22, 2018. As of December 22, 2018, we have completed the accounting for the impact of the Tax Act based on the guidance, interpretations, and data available. No adjustments to these provisional estimates have been recorded.
NOTE 19 - LEASES
Under the Tax Act, Global Intangible Low-Taxed Income (“GILTI”) tax rules the Company must make an accounting policy election to either (1) recognize taxes due on future U.S. inclusions in taxable income related to GILTI as a current-period expense when incurred (the “period cost method”) or (2) factor such amount into the Company’s measure of its deferred taxes (the “deferred method”). The Company elected to treat the GILTI as a current-period expense when incurred.
NOTE 21 – LEASES
The Company has renewed its corporate office leases for SC Autosports, with a term of 3715 months from January 31, 20172020 to January 31, 2020.April 30, 2021. The monthly lease payment is $11,000.$11,000 from February 2020 to April 2020 and $12,000 from May 2020 to April 2021. The Company adopted ASC 842 to recordrecorded operating lease assets and operating lease liabilities as ofat January 1, 2019,31, 2020, with a remaining lease term of 1315 months and discount rate of 4.75%4.25%.
As of SeptemberJune 30, 2019,2020, the Company’s right - of - use asset (grouped in other long term assets on the balance sheet) was $ 42,974$115,087 and lease liability (grouped in other current liability on the balance sheet) was $44,121.$117,695. For the three months and nineended June 30, 2020, the Company’s operating lease cost was $35,000. For the six months ended SeptemberJune 30, 2019,2020, the Company’s operating lease expensecost was $33,000 and $99,000, respectively.$68,000.
Supplemental information related to operating leases was as follows:
| Six months ended June 30, 2020 | ||||
| Cash payments for operating leases | $ | 68,000 | ||
Maturities of lease liabilities as of SeptemberJune 30, 20192020, were as follow:
| Maturity of Lease Liabilities: | Lease payable | |||
| 2020 | $ | 70,117 | ||
| 2021 | 47,578 | |||
| Total | $ | 117,695 | ||
20
| Maturity of Lease Liabilities: | ||||
| 2019 (Three Months) | $ | 32,611 | ||
| 2020 | 11,510 | |||
| Total | $ | 44,121 | ||
NOTE 22 –20 - CONTINGENT CONSIDERATION LIABILITY
On January 3, 2018, the Company completed the acquisition of 100% of the equity of Jinhua An Kao.Kao, currently known as Kandi Smart Battery Swap Co., Ltd. (“Kandi Smart Battery Swap”). The Company paid approximately RMB 25.93 million (approximately $4 million) at the closing of the transaction using cash on hand and issued a total of 2,959,837 shares of restrictive stock or 6.2% of the Company’s total outstanding shares of the common stock immediately prior to the closing of the acquisition valued at approximately $20.7 million to the former shareholdershareholders of Jinhua An KaoKandi Smart Battery Swap and his designees (the “An Kao“KSBS Shareholders”), and may be required to pay future consideration of up to an additional 2,959,837 shares of common stock, which are being held in escrow and to be released contingent upon the achievement of certain net income-based milestones in the next three years. Any escrowed shares that are not released from escrow to the An KaoKSBS Shareholders foras a result of the failure to achieve the milestones will be forfeited and returned to the Company for cancellation. While the escrowed shares are held in escrow, the Company will retain all voting rights with respect to thesuch shares. For the year ended December 31, 2018, Jinhua An KaoKandi Smart Battery Swap achieved its first year net profit target. According toAccordingly, the agreement, the former shareholders of An KaoKSBS Shareholders received 739,959 shares of Kandi’s restrictive common stock or 12.5% of the total equity consideration (i.e., 5,919,674 total shares) as part of the purchase price. For the year ended December 31, 2019, Kandi Smart Battery Swap achieved its second year net profit target. Accordingly, the KSBS Shareholders received 986,810 shares of Kandi’s restrictive common stock or 16.67% of the total equity consideration (i.e., 5,919,674 total shares) as part of the purchase price. All the escrowed shares have been included in the purchase price.Company’s registration statement on Form S-3 declared effective by the SEC on April 5, 2019.
As the outbreak of COVID-19 in 2020 affected Kandi Smart Battery Swap’s operation and business, on July 7, 2020, the Company and the KSBS Shareholders made following supplements to Condition III of the original Supplementary Agreement: The transferor has the right to receive a total of 20.83% of total equity consideration (i.e., 5,919,674 total shares), provided that Kandi Smart Battery Swap realizes a net profit of RMB50,000,000 or more for the period from January 1, 2020 to June 30, 2021 (as opposed to be the originally stated “December 31, 2020”), and such profit is audited or reviewed and Kandi Smart Battery Swap gets annual or quarterly financial report issued subject to US GAAP.
On July 1, 2018, the Company completed the acquisition of 100% of the equity of SC Autosports.Autosports (d/b/a Kandi America). The Company issued a total of 171,969 shares of restrictive stock or approximately 0.3% of the Company’s total outstanding shares of the common stock immediately prior to the closing of the acquisition valued at approximately $0.8 million at the closing of transaction to the former members of SC Autosports within 30 days from the signing date of the Transfer Agreement, and may be required to pay future consideration of up to an additional 1,547,721 shares of common stock of the Company, which are being held in escrow and to be released contingent upon the achievement of certain pre-tax profit based milestones in the next three years. Any escrowed shares that are not released from escrow to the SC Autosports former members fordue to the failure to achieve the milestones will be forfeited and returned to the Company for cancellation. While the escrowed shares are held in escrow, the Company will retain all voting rights with respect to the shares. For the year ended December 31, 2018, SC Autosports achieved its first year pre-tax profit target. According to the agreement,Accordingly, the former members of SC Autosports received 343,938 shares of Kandi’s restrictive common stock or 20% of the total Kandi stockequity consideration in the purchase price. For the year ended December 31, 2019, SC Autosports achieved its second year pre-tax profit target. Accordingly, the former members of SC Autosports received 515,907 shares of Kandi’s restrictive common stock or 30% of the total equity consideration in the purchase price. All the escrowed shares have been included in the Company’s registration statement on Form S-3 declared effective by the SEC on April 5, 2019.
21
The Company recorded contingent consideration liability of the estimated fair value of the contingent consideration the Company currently expects to pay to Jinahua Ankaothe KSBS Shareholders and SC Autosports’ former members upon the achievement of certain milestones. The fair value of the contingent consideration liability associated with remaining shares of restrictive common stock was estimated by using the Monte Carlo simulation method, which took into account all possible scenarios. This fair value measurement is classified as Level 3 within the fair value hierarchy prescribed by ASC Topic 820, Fair Value Measurement and Disclosures. In accordance with ASC Topic 805, Business Combinations, the Company will re-measure this liability each reporting period and record changes in the fair value through a separate line item within the Company’s consolidated statements of Income.income.
As of SeptemberJune 30, 20192020 and December 31, 2018,2019, the Company’s contingent consideration liability was $6,562,000$2,334,000 and $7,256,000,$5,197,000, respectively. The decrease in contingent consideration liability was mainly due to the decrease of the forecast of SC Autosports’ third year net income as of June 30, 2020.
NOTE 2321 - STOCK AWARD
In connection with the appointment of Mr. Henry Yu as a member of the Board of Directors (the “Board”), the Board authorized the Company to compensate Mr. Henry Yu with 5,000 shares of Company’s restricted common stock every six months as compensation, beginning in July 2011.
As compensation for Mr. Jerry Lewin’s services as a member of the Board, the Board authorized the Company to compensate Mr. Jerry Lewin with 5,000 shares of Company’s restricted common stock every six months, beginning in August 2011.
As compensation for Ms. Kewa Luo’s services as the Company’s investor relation officer, the Board authorized the Company to compensate Ms. Kewa Luo with 5,000 shares of the Company’s common stock every six months, beginning in September 2013.
In November 2016, the Company entered into a three-year employment agreement with Mr. Mei Bing, to hire him as the Company’s Chief Financial Officer. Under the agreement, Mr. Mei Bing was entitled to receive an aggregate 10,000 shares of common stock each year, vested in four equal quarterly installments of 2,500 shares. On January 29, 2019, Mr. Mei resigned from his position as the Company’s CFO.
On January 29, 2019, the Board appointed Ms. Zhu Xiaoying as interim Chief Financial Officer. Ms. Zhu was entitled to receive 10,000 shares of the common stock annually under the Company’s 2008 Omnibus Long-Term Incentive Plan (the “2008 Plan”) as a year-end equity bonus. Effective May 15, 2020, Ms. Zhu resigned from her position as interim Chief Financial Officer of the Company.
On May 15, 2020, the Board appointed Mr. Jehn Ming Lim as the Chief Financial Officer. Mr. Lim was entitled to receive 6,000 shares of the common stock annually, which shall be issuable evenly on each six-month anniversary hereof.
22
The fair value of stock awards based on service is determined based on the closing price of the common stock on the date the shares are approved by the Board for grant. The compensation costs for awards of common stock are recognized over the requisite service period of three or six months.
On December 30, 2013, the Board approved a proposal (as submitted by the Compensation Committee) of an award (the “Board’s Pre-Approved Award Grant Sub-Plan under the 2008 Plan”) for certain executives and other key employees. The fair value of each award granted under the 2008 Plan is determined based on the closing price of the Company’s stock on the date of grant of such award. On September 26, 2016, the Board approved to terminate the previous Board’s Pre-Approved Award Grant Sub-Plan under the 2008 Plan and adopted a new plan to grant the total number of shares of common stock of the stock award for selected executives and key employees 250,000 shares of common stock for each fiscal year. On April 18, 2018, the Board authorized the Company to grantgranted 238,600 shares of common stock to certain management members and employees as compensation for their past services under the 2008 Plan. On April 30, 2019, the Board authorized the Company to grantgranted 238,600 shares of common stock to certain management members and employees as compensation for their past services under the 2008 Plan. On May 9, 2020, the Company granted 238,600 shares of common stock to certain management members and employees as compensation for their past services under the 2008 Plan.
For the three months ended SeptemberJune 30, 20192020 and 2018,2019, the Company recognized $22,925$824,621 and $31,675$1,282,733 of employee stock award expenses for stock compensation and annual incentive award under the 2008 Plan paid to Board members, management and consultants under General and Administrative Expenses, respectively. For ninethe six months ended SeptemberJune 30, 20192020 and 2018,2019, the Company recognized $1,337,333$847,546 and $1,311,885$1,314,408 of employee stock award expenses for stock compensation and annual incentive award under the 2008 Plan paid to Board members, management and consultants under General and Administrative Expenses, respectively.
NOTE 2422 - SUMMARIZED INFORMATION OF EQUITY METHOD INVESTMENT IN THE AFFILIATE COMPANY
The Company’s condensed consolidated net income (loss) includes the Company’s proportionate share of the net income or loss of the Company’s equity method investees. When the Company records its proportionate share of net income (loss) in such investees, it increases equity income (loss) – net in the Company’s consolidated statements of income and the Company’s carrying value in that investment. Conversely, when the Company records its proportionate share of a net loss in such investees, it decreases equity income (loss) – net in the Company’s consolidated statements of income (loss) and the Company’s carrying value in that investment. All intra-entity profits and losses with the Company’s equity method investees have been eliminated.
23
On March 21, 2019, Kandi VehicleVehicles signed an Equity Transfer Agreement with Geely Technologies Group Co., Ltd. (“Geely”) to transfer certain equity interests in the Affiliate Company to Geely. Pursuant to the Transfer Agreement, the Affiliate Company converted a loan of RMB 314 million (approximately $46.7$44.4 million) from Geely Group last year to equity in order to increase its cash flow. As a result, the registered capital of the Affiliate Company became RMB 2.40 billion (approximately $336.3$339.5 million), of which Kandi Vehicles owned 43.47% and Geely owned 56.53%, respectively, upon the conversion of the loan into equity in the Affiliate Company (the “March Affiliate Loan to Equity Conversion”).Company. Kandi Vehicles further agree to sell 21.47% of its equity interests in the Affiliate Company to Geely for a total amount of RMB 516 million (approximately $72.3$73.0 million) (the “Affiliate Equity Transfer”). Kandi Vehicles shall own 22% of the equity interests of the Affiliate Company as a result of the transfer. As of September 29, 2019, the Company hashad received payments in cash totaling RMB 220 million (approximately $30.9$31.1 million) and certain commercial acceptance notes of RMB 296 million (approximately $41.6$41.9 million) from Geely, of which RMB 140 million (approximately $19.7$19.8 million) shall mature on January 20, 2020 and the remaining RMB 156 million (approximately $21.9$22.1 million) shall mature on March 29, 2020. As of September 30, 2019, the equity transfer hashad been completed. Therefore, in the third quarter of 2019, the Company has recognized the gain from equity sale of $20,574,217.$20,438,986. As of June 30, 2020, RMB 110 million (approximately $15.6 million) of the commercial acceptance notes has been collected. And the remaining RMB186 million (approximately $26.3 million) has been collected on July 27, 2020.
The Company accounted for its investments in the Affiliate Company under the equity method of accounting. Since the March Affiliate Loan to Equity Conversion was completed at the very end of the first quarter, theThe Company still recorded 50%22% of the Affiliate Company’s loss for the first quarterhalf of 2019. Starting from the second quarter of the 2019, since the equity interests in the Affiliate Company have been reduced to 43.47% and the Affiliate Equity Transfer was completed at the very end of the third quarter, the Company recorded 43.47% of the Affiliate Company’s loss for the second and third quarter of 2019.2020.
The consolidated results of operations and financial position of the Affiliate Company are summarized below:
| Three Months ended | ||||||||
| June 30, | ||||||||
| 2020 | 2019 | |||||||
| Condensed income statement information: | ||||||||
| Net sales | $ | 16,456,551 | $ | 2,828,732 | ||||
| Gross loss | (2,304,516 | ) | (2,606,809 | ) | ||||
| Gross margin | -14.0 | % | -92.2 | % | ||||
| Net loss | (13,535,506 | ) | (10,359,258 | ) | ||||
| Six Months ended | ||||||||
| June 30, | ||||||||
| 2020 | 2019 | |||||||
| Condensed income statement information: | ||||||||
| Net sales | $ | 23,083,813 | $ | 4,085,605 | ||||
| Gross loss | (2,642,287 | ) | (2,628,351 | ) | ||||
| Gross margin | -11.4 | % | -64.3 | % | ||||
| Net loss | (18,572,368 | ) | (30,550,572 | ) | ||||
| June 30, | December 31, | |||||||
| 2020 | 2019 | |||||||
| Condensed balance sheet information: | ||||||||
| Current assets | $ | 561,723,436 | $ | 640,688,401 | ||||
| Noncurrent assets | 52,287,099 | 64,589,516 | ||||||
| Total assets | $ | 614,010,535 | $ | 705,277,917 | ||||
| Current liabilities | 420,915,948 | 490,625,640 | ||||||
| Equity | 193,094,587 | 214,652,277 | ||||||
| Total liabilities and equity | $ | 614,010,535 | $ | 705,277,917 | ||||
24
| Three Months ended | ||||||||
| September 30, | ||||||||
| 2019 | 2018 | |||||||
| Condensed income statement information: | ||||||||
| Net sales | $ | 520,275 | $ | 19,880,543 | ||||
| Gross loss | (377,700 | ) | 3,133,283 | |||||
| Gross margin | -72.6 | % | 15.8 | % | ||||
| Net(loss) income | (19,435,546 | ) | (5,860,746 | ) | ||||
| Nine Months ended | ||||||||
| September 30, | ||||||||
| 2019 | 2018 | |||||||
| Condensed income statement information: | ||||||||
| Net sales | $ | 4,605,880 | $ | 73,292,774 | ||||
| Gross (loss) profits | (3,006,051 | ) | 4,007,896 | |||||
| Gross margin | -65.3 | % | 5.5 | % | ||||
| Net (loss) income | (49,986,119 | ) | (87,969 | ) | ||||
| September 30, | December 31, | |||||||
| 2019 | 2018 | |||||||
| Condensed balance sheet information: | ||||||||
| Current assets | $ | 609,002,781 | $ | 751,143,254 | ||||
| Noncurrent assets | 65,386,057 | 140,736,300 | ||||||
| Total assets | $ | 674,388,838 | $ | 891,879,554 | ||||
| Current liabilities | 429,675,791 | 633,711,465 | ||||||
| Noncurrent liabilities | - | - | ||||||
| Equity | 244,713,047 | 258,168,089 | ||||||
| Total liabilities and equity | $ | 674,388,838 | $ | 891,879,554 | ||||
Note: The following table illustrates the captions used in the Company’s Income Statements for its equity based investment in the Affiliate Company.
The Company’s equity method investments in the Affiliate Company for the ninesix months ended SeptemberJune 30, 20192020 and 20182019 are as follows:
| Nine Months ended | Six Months ended | |||||||||||||||
| September 30, | June 30, | |||||||||||||||
| 2019 | 2018 | 2020 | 2019 | |||||||||||||
| Investment in the Affiliate Company, beginning of the period, | $ | 128,929,893 | $ | 70,681,013 | $ | 47,228,614 | $ | 128,929,893 | ||||||||
| Investment in Affiliate Company in 2018 | - | 79,370,859 | ||||||||||||||
| Investment decreased in 2019 | (72,309,417 | ) | ||||||||||||||
| Gain from equity dilution | 4,291,974 | - | - | 4,341,259.00 | ||||||||||||
| Gain from equity sale | 20,574,217 | - | ||||||||||||||
| Company’s share in net (loss) income of Affiliate based on 50% ownership for three months ended March 31, 2019, 43.47%(1) ownership for six months ended September 30, 2019 and 50% ownership for three months ended September 30, 2018 | (23,025,049 | ) | (43,985 | ) | ||||||||||||
| Company’s share in net (loss) income of Affiliate based on 22% ownership for six months ended June 30, 2020 and 50% ownership for three months ended March 31, 2019, 43.47% ownership for three months ended June 30, 2019 | (4,086,848 | ) | (14,591,456 | ) | ||||||||||||
| Intercompany transaction elimination | (12,557 | ) | (484,037 | ) | - | (14,157 | ) | |||||||||
| Year 2018 unrealized profit realized | 154,480 | 448,429 | ||||||||||||||
| Prior year unrealized profit realized | 5,549 | 156,254 | ||||||||||||||
| Subtotal | (22,883,126 | ) | (79,593 | ) | (4,081,299 | ) | (14,449,359 | ) | ||||||||
| Exchange difference | (4,766,530 | ) | (3,699,548 | ) | (656,867 | ) | �� | 323,099 | ||||||||
| Investment in Affiliate Company, end of the period | $ | 53,837,011 | $ | 146,272,731 | $ | 42,490,448 | $ | 119,144,892 | ||||||||
The gain from equity dilution for ninethree months ended September 30,March 31, 2019 resulted from the Affiliate Company issuing shares to the major shareholder of the Affiliate Company, partner, Greely, in exchange for extinguishment of a loan from Greely, resulting in dilution of equity ownership of the Company from 50% to 43.47%. This dilutive transaction was treated as if the Company sold a proportional share of its investment in the Affiliate Company.
Sales to the Company’s customers, the Affiliate Company and its subsidiaries, for the three months ended SeptemberJune 30, 2019,2020, were $4,720,159$ 956 or 14.9%0% of the Company’s total revenue, a decrease of 79.6%100% from $23,135,326$4,089,534 of the same quarter last year. Sales to the Company’s customers, the Affiliate Company and its subsidiaries, for the ninesix months ended SeptemberJune 30, 2019,2020, were $10,543,190$ 956 or 14.3%0% of the Company’s total revenue, a decrease of 65.4%100% from $30,479,521$5,823,031 of the same quarter last year. Sales to the Affiliate Company and its subsidiaries were primarily of battery packs, body parts, EV drive motors, EV controllers, air conditioning units and other auto parts.
25
As of SeptemberJune 30, 20192020 and December 31, 2018,2019, the net current and noncurrent net amount due from the Affiliate Company and its subsidiaries, was $25,335,894$20,107,347 and $67,683,462,$31,330,763, respectively. As of June 30, 2020 and December 31, 2019 the net amount due from the Affiliate Company and its subsidiaries included $2,053,131 and $2,056,564 interest receivable related to the loan lent to the Affiliate Company, but didn’t include any outstanding loan principal.
NOTE 2523 - COMMITMENTS AND CONTINGENCIES
Guarantees and pledged collateral for bank loans to other parties
(1) Guarantees for bank loans
| September 30, | December 31, | |||||||
| Guarantee provided to | 2019 | 2018 | ||||||
| Kandi Electric Vehicles Group Co., Ltd. | - | 7,271,247 | ||||||
| Kandi Electric Vehicles Jiangsu Co., Ltd. | - | 7,271,247 | ||||||
| Total | $ | - | $ | 14,542,494 | ||||
On March 15, 2013, the Company entered into a guarantee contract to serve as the guarantor of Nanlong Group Co., Ltd. (“NGCL”) for NGCL’s $2,802,691$ 2,829,575 (RMB 20 million) loan from Shanghai Pudong Development Bank Jinhua Branch, with a related loan period offrom March 15, 2013 to March 15, 2016. NGCL is not related to the Company. Under this guarantee contract, the Company agreed to assume joint liability as the loan guarantor. In April 2017, Shanghai Pudong Development Bank filed a lawsuit against NGCL, the Company and ten other parties in Zhejiang Province People’s Court in Yongkang City, alleging NGCL defaulted on a bank loan borrowed from Shanghai Pudong Development Bank for a principal amount of approximately $2.9 million and demanded that the guarantor bear the liability for compensation. On May 27, 2017, a judicial mediation took place in Yongkang City and parties reached a settlement in mediation, in which the plaintiff agreed NGCL would repay the loan principal and interest in installments. So long asIf there were an event of default that NGCL repayscould not repay the principal and interest according to the agreement, the plaintiff will not askloan, the Company for recovery. Asmay be obligated to bear the liability of the date of this report, thedefaulted amount. The Company expects the likelihood of incurring losses in connection with this matter to be remote.
On September 29, 2015, the Company entered into a guarantee contract to serve as the guarantor of Zhejiang Shuguang Industrial Co., Ltd. (“ZSICL”) for a bank loan in the amount of $4,063,901$4,102,883 (RMB 29 million) from Ping An Bank, with a related loan period of September 29, 2015, to September 28, 2016. ZSICL is not related to the Company. Under this guarantee contract, the Company agreed to perform all the obligations of ZSICL under the loan contract if ZSICL failed to perform its obligations as set forth therein. In August 2016, Ping An Bank Yiwu Branch (“Ping An Bank”) filed a lawsuit against ZSICL, the Company, and three other parties in Zhejiang Province People’s Court in Yiwu City, alleging ZSICL defaulted on a bank loan it had borrowed from Pin An Bank for a principal amount of RMB 29 million or approximately $4.2 million (the “Principal”), for which the Company was a guarantor along with other three parties. On December 25, 2016, the court ruled that ZSICL should repay Ping An Bank the principal and associated interest remaining on the bank loan within 10 days once the adjudication was effective. Additionally, the court found that the Company and the three other parties, acting as guarantors, have joint liability for this bank loan. On July 31, 2017, the Company and Ping An Bank reached an agreement to settle. According to the agreement, the Company was to pay Ping An Bank RMB 20 million or approximately $3.0 million in four installments before October 31, 2017 to release the Company from its guarantor liability for this default. As of October 31, 2017, the Company has paid all four installments totaling RMB 20 million or approximately $3.0 million to Ping An Bank and thus the Company has been released from its guarantor liability for this default. According to the Company’s agreement with ZSICL, ZSICL agreed to reimburse all the Company’s losses due to ZSICL’s default on the loan principal and interests, of which RMB 11.913.9 million has been reimbursed to the Company as of the date of this report and the remainder is expected to be reimbursed in installments within next two years.installments. The Company expects the likelihood of incurring losses in connection with this matter to be low.
26
On August 29, 2018, the Company entered into a guarantee contract to serve as the guarantor for the Affiliate Company for bank acceptance notes in the aggregate amount of $2,942,825 (RMB 21 million) from Bank of China, with a related period of August 29, 2018 to February 29, 2019, and which were paid off on February 29, 2019 by the Affiliate Company.
On August 30, 2018, the Company entered into a guarantee contract to serve as the guarantor for Kandi Jiangsu for bank loans in the aggregate amount of $7,006,726 (RMB 50 million) from China Merchants Bank Nantong branch, with a related loan period of August 31, 2018 to February 28, 2019, and was paid off on February 1, 2019. On February 1, 2019, the loan was renewed with a term of February 1, 2019 to July 31, 2019 and was paid off on July 31, 2019 by Kandi Jiangsu.
On September 3, 2018, the Company entered into a guarantee contract to serve as the guarantor for the Affiliate Company for bank acceptance notes in the aggregate amount of $4,063,901 (RMB 29 million) from Bank of China, with a related period of September 3, 2018 to March 3, 2019 and was paid off on March 3, 2019 by the Affiliate Company.
(2) Pledged collateral for bank loans tofor which the parties other parties.than the Company are the borrowers.
As of SeptemberJune 30, 20192020 and December 31, 2018,2019, none of the Company’s land use rights or plants and equipment were pledged as collateral securing bank loans tofor which the parties other parties.than the Company are the borrowers.
Construction commitmentLitigation
In September 2019, in order to further increase the production capacity, YongkangScrou started building a factory of efficient new energy vehicle drive motors with a space of 6,639.9 square meters on the basis of the original plant. The total contract amount was RMB 6.6 million (approximately $0.9 million). The project is expected to be completed by 2020.
Litigation
Beginning in March 2017, putative shareholder class actions were filed against Kandi Technologies Group, Inc. (“Kandi”) and certain of its current and former directors and officers in the United States District Court for the Central District of California and the United States District Court for the Southern District of New York. The complaints generally alleged violations of the federal securities laws based Kandi’s disclosure in March 2017 that its financial statements for the years 2014, 2015 and the first three quarters of 2016 would need to be restated, and soughtseek damages on behalf of putative classes of shareholders who purchased or acquired Kandi’s securities prior to March 13, 2017. Kandi moved to dismiss the remaining cases, all of which were pending in the New York federal court, and that motion was granted by an order entered on September 30, 2019, and the time to appeal has run. In June 2020, a similar but separate putative securities class action was filed against Kandi and certain of its current and former directors and officers in California federal court and remains pending.
Beginning in May 2017, purported shareholder derivative actions based on the same underlying events described above were filed against certain current and former directors of Kandi in the United States District Court for the Southern District of New York. The New York federal court confirmed the voluntary dismissal of these actions in April 2019.
In October 2017, a shareholder filed a books and records action against the Company in the Delaware Court of Chancery pursuant to 8 Del. C. Section 220 seeking the production of certain documents generally relating to the same underlying items described above as well as attorney’s fees (the “Section 220 Litigation”). On September 28, 2018, the parties, through their respective counsel, agreed to dismiss the Section 220 Litigation with prejudice and with each party bearing its own attorney’s fees, costs, and expenses, thereby concluding the action. In February 2019, this same shareholder commenced a derivative action against certain current and former directors of Kandi in the Delaware Court of Chancery. A motion to dismiss this derivative action was filed in May 2019 and remains pending.that motion was denied on April 27, 2020.
Separately, in connection with allegations of misconduct identified in pre-suit demands made by putative shareholders of Kandi, Kandi formed a Special Litigation Committee (“SLC”) and retained a Delaware law firm as independent counsel to the SLC to aid in the SLC’s investigation of, and to ultimately report on, the allegations of misconduct set forth in the pre-suit demands. The investigation remains ongoing.In June 2020, the SLC recommended that it be dissolved in light of the ongoing derivative action pending in the Delaware Court of Chancery as referenced in the immediate above paragraph.
27
While the Company believes that the claims in these litigations are without merit and will defend itself vigorously, the Company is unable to estimate the possible loss, if any, associated with these litigations. The ultimate outcome of any litigation is uncertain and the outcome of these matters, whether favorable or unfavorable, could have a negative impact on the Company’s financial condition or results of operations due to defense costs, diversion of management resources and other factors. Defending litigation can be costly, and adverse results in the litigations could result in substantial monetary judgments. No assurance can be made that litigation will not have a material adverse effect on the Company’s future financial position.
NOTE 2624 - SEGMENT REPORTING
The Company has one1 operating segment. The Company’s revenue and long-lived assets are primarily derived from and located in China.China and US. The Company does not have manufacturing operations outside of China.
The following table sets forth disaggregation of revenue:
| Three Months Ended September 30, | Three Months Ended June 30, | |||||||||||||||
| 2019 | 2018 | 2020 | 2019 | |||||||||||||
| Sales Revenue | Sales Revenue | Sales Revenue | Sales Revenue | |||||||||||||
| Primary geographical markets | ||||||||||||||||
| Overseas | $ | 5,703,050 | $ | 5,849,353 | $ | 8,571,281 | $ | 5,050,136 | ||||||||
| China | 25,985,494 | 32,146,007 | 10,865,795 | 19,096,094 | ||||||||||||
| Total | $ | 31,688,544 | $ | 37,995,360 | $ | 19,437,076 | $ | 24,146,230 | ||||||||
| Major products | ||||||||||||||||
| EV parts | $ | 25,847,506 | $ | 32,065,497 | $ | 12,514,548 | $ | 18,988,741 | ||||||||
| EV products | (1,913 | ) | - | |||||||||||||
| Off-road vehicles | 5,841,038 | 5,929,863 | 6,564,415 | 5,157,489 | ||||||||||||
| Electric Scooters and Electric Self-Balancing Scooters | 360,026 | - | ||||||||||||||
| Total | $ | 31,688,544 | $ | 37,995,360 | $ | 19,437,076 | $ | 24,146,230 | ||||||||
| Timing of revenue recognition | ||||||||||||||||
| Products transferred at a point in time | $ | 31,688,544 | $ | 37,995,360 | $ | 19,437,076 | $ | 24,146,230 | ||||||||
| Total | $ | 19,437,076 | $ | 24,146,230 | ||||||||||||
| Nine Months Ended September 30, | ||||||||
| 2019 | 2018 | |||||||
| Sales Revenue | Sales Revenue | |||||||
| Primary geographical markets | ||||||||
| Overseas | $ | 15,975,711 | $ | 8,337,793 | ||||
| China | 57,927,523 | 54,353,080 | ||||||
| Total | $ | 73,903,234 | $ | 62,690,873 | ||||
| Major products | ||||||||
| EV parts | $ | 57,607,687 | $ | 53,947,874 | ||||
| Off-road vehicles | 16,295,547 | 8,742,999 | ||||||
| Total | $ | 73,903,234 | $ | 62,690,873 | ||||
| Timing of revenue recognition | ||||||||
| Products transferred at a point in time | $ | 73,903,234 | $ | 62,690,873 | ||||
2328
The negative amount is due to exchange rate difference.
| Six Months Ended June 30, | ||||||||
| 2020 | 2019 | |||||||
| Sales Revenue | Sales Revenue | |||||||
| Primary geographical markets | ||||||||
| Overseas | $ | 10,702,105 | $ | 10,272,661 | ||||
| China | 15,107,395 | 31,942,029 | ||||||
| Total | $ | 25,809,500 | $ | 42,214,690 | ||||
| Major products | ||||||||
| EV parts | $ | 14,595,883 | $ | 31,760,181 | ||||
| EV products | 253,906 | - | ||||||
| Off-road vehicles | 10,599,685 | 10,454,509 | ||||||
| Electric Scooters and Electric Self-Balancing Scooters | 360,026 | - | ||||||
| Total | $ | 25,809,500 | $ | 42,214,690 | ||||
| Timing of revenue recognition | ||||||||
| Products transferred at a point in time | $ | 25,809,500 | $ | 42,214,690 | ||||
| Total | $ | 25,809,500 | $ | 42,214,690 | ||||
NOTE 25 - SUBSEQUENT EVENTS
On July 9, 2020, the Company received the second payment of RMB 119 million (approximately $17 million) under the Repurchase Agreement.
In order to construct a new facility in the Jinhua New Energy Automotive Zone, on July 7, 2020, Kandi Vehicles entered in to a construction contract. The total contract amount was RMB 138.2 million (approximately $19.6 million).
On July 27, 2020, the Company received the remaining RMB186 million (approximately $26.3 million) equity transfer payment from Geely.
29
Item 2. Management’s Discussion and Analysis of Financial Condition and Results of Operations.
This report contains forward-looking statements within the meaning of the federal securities laws that relate to future events or our future financial performance. In some cases, you can identify forward-looking statements by terminology,terminologies, such as “may,” “will,” “should,” “could,” “expect,” “plan,” “anticipate,” “believe,” “estimate,” “project,” “predict,” “intend,” “potential” or “continue” or the negative of such terms or other comparable terminology,terminologies, although not all forward-looking statements contain such terms.
In addition, these forward-looking statements include, but are not limited to, statements regarding implementing our business strategy; development and marketing of our products; our estimates of future revenue and profitability; our expectations regarding future expenses, including research and development, sales and marketing, manufacturing and general and administrative expenses; difficulty or inability to raise additional financing, if needed, on terms acceptable to us; our estimates regarding our capital requirements and our needs for additional financing; attracting and retaining customers and employees; sources of revenue and anticipated revenue; and competition in our market.
Forward-looking statements are only predictions. Although we believe that the expectations reflected in these forward-looking statements are reasonable, we cannot guarantee future results, levels of activity, performance or achievements. All of our forward-looking information is subject to risks and uncertainties that could cause actual results to differ materially from the results expected. Although it is not possible to identify all factors, these risks and uncertainties include the risk factors and the timing of any of those risk factors described in the 20182019 Form 10-K and those set forth from time to time in our other filings with the SEC. These documents are available on the SEC’s Electronic Data Gathering and Analysis Retrieval System at http://www.sec.gov.
Critical Accounting Policies and Estimates
The preparation of the condensed consolidated financial statements in conformity with U.S. GAAP requires us to make estimates and assumptions that affect the reported amounts of assets and liabilities and disclosure of contingent assets and liabilities, as of the date of the financial statements, and the reported amounts of revenue and expenses during the reported period. If these estimates differ significantly from actual results, the impact to the condensed consolidated financial statements may be material. There have been no material changes in our critical accounting policies and estimates from those disclosed in on the 20182019 Form 10-K. Please refer to Part II, Item 7 of such a report for a discussion of our critical accounting policies and estimates.
Results of OperationsOverview
Overview
We are one of the leading manufacturers of EV products (through Kandi Hainan and the Affiliate Company), EV parts and off-road vehicles in China. For thethree six months ended SeptemberJune 30, 2019,2020, we recognized total revenue of $31,688,544$25,809,500 as compared to $37,995,360$42,214,690 for the three months ended September 30, 2018,same period of 2019, a decrease of $6,306,816,$16,405,190 or 16.6%38.9%. For the threesix months ended SeptemberJune 30, 2019,2020, we recorded $5,276,415$4,704,037 of gross profits,profit, a decrease of $965,634 or 15.5%35.9% from the same period of 2018.2019. Gross margin for the threesix months ended SeptemberJune 30, 20192020 was 16.7%18.2%, an increase compared to 16.4%17.4% for the three months ended September 30, 2018.same period of 2019. We recorded a net income of $12,089,441$2,480,400 for the threesix months ended SeptemberJune 30, 2019,2020, compared to a net loss of $6,521,399$11,727,630 in the same period of 2018, primarily attributable2019, a positive change from net loss to net income by gaining $14,208,030 or 121.2%.
The spread of COVID-19 around China and other parts of the world has caused significant volatility in the markets of China, U.S., and the rest of the world. The pandemic has resulted in quarantines, travel restrictions, and the temporary closure of stores and facilities in China and elsewhere. Although the Company’s operations in China has fully resumed in early March 2020, the COVID-19 will affect the Company’s business performance in 2020. However, the extent to which the COVID-19 impacts our operations will depend on its future developments, which are highly uncertain and cannot be predicted with confidence, including the duration of the outbreak, new information which may emerge concerning the severity of the coronavirus and the actions to contain the coronavirus or minimize its harm, among others.
30
The COVID outbreak has seriously impacted the EV market in 2020, leading us to explore how to augment our business. As we looked at other market opportunities that leverage our expertise, the management of the Company found potential in a number of ancillary products aimed at intelligent transportation. For example, Electric Scooters and Electric Self-Balancing Vehicles have distinct potential, with tens of millions of units sold each year around the world. The Company is pursuing these opportunities by expanding production of intelligent transportation products that exploit our advantages in the Yongkang Scrou’s power electric motor and Kandi Smart Battery Swap’s power battery pack. Our products aimed at this market combines our motors and battery packs into a dynamic power train system. Through extensive product trials, we are able to meet a leading standard in China, and thus went into production in the second quarter. As this business is developing quickly and progressing, the Company will consider to merge Yongkang Scrou and Kandi Smart Battery Swap into a single company that specialized in both smart battery swap system and powertrain technology.
The Company originally planned to export 2,000 to 5,000 units electric vehicles to the gain from equity saleU.S. in the Affiliate Company and the decreased research and development expense. For the nine months ended September 30, 2019, we recognized total revenue of $73,903,234 as compared to $62,690,873 for the nine months ended September 30, 2018, an increase of $11,212,361, or 17.9%. For the nine months ended September 30, 2019, we recorded $12,615,006 of gross profits, an increase of $2,968,994 or 30.8% from the same period of 2018. Gross margin for the nine months ended September 30, 2019 was 17.1%, an increase compared to 15.4% for the nine months ended September 30, 2018. We recorded a net income of $361,811 for the nine months ended September 30, 2019, compared to net loss of $1,418,879 in the same period of 2018, largely2020, but due to the increased revenue, decreased research and development expense and the gain from equity saleCOVID-19 pandemic in the Affiliate Company.
The current subsidy standard is provided forfirst half of 2020, the plan are being adjusted according to the situation of COVID-19 control in the CircularU.S, as well as the virtual pre-sales event on Further ImprovingAugust 18.
During the Subsidy Policiessecond quarter of 2020, the Company’s revenue increased to $19.4 million from $6.4 million during the first quarter of 2020. However, COVID-19 may eventually affect the Company's 2020 overall business performance. The operating results for the Promotionthree and Applicationsix months ended June 30, 2020 may not be indicative of New Energy Vehicles, which was jointly promulgated by the Ministryfuture operating results for the fiscal year ending December 31, 2020 or other future periods, particularly in light of Finance, the Ministry of Science and Technology, the Ministry of Industry and Information Technology and the National Development and Reform Commission in 2019. The current subsidy standard reduces the amount of national subsidies and cancels local subsidies, resulting in a significant reduction in the total subsidy amount as compared to 2018. We believe the new subsidy standard presents both challenges and opportunities to the Company. In the past few years, although the government had a strong support policy for new energy vehicles, the unstable subsidy policy and the unpredictable timing of receiving such subsidiesuncertain impact COVID-19 could have exerted tremendous pressure on the Company’s cash flow. Currently, in order to adapt to the new subsidy standard, the Affiliate Company is making full useCompany's business.
Results of Geely’s resources and developing new models with goals to be independent of the government’s subsidies and have strong competitiveness at the same time. The new model are expected to be placed to market by the end of this year or at the beginning of 2020. We believe the Company will have greater opportunities for development at that time.Operations
Comparison of the Three Months Ended SeptemberJune 30, 20192020 and 20182019
The following table sets forth the amounts and percentage to revenue of certain items in our condensed consolidated statements of income (loss)operations and comprehensive income (loss) for the three months ended SeptemberJune 30, 20192020 and 2018.2019.
| Three Months Ended | ||||||||||||||||||||||||
| June 30, 2020 | % of Revenue | June 30, 2019 | % of Revenue | Change in Amount | Change in % | |||||||||||||||||||
| REVENUES FROM UNRELATED PARTY, NET | $ | 19,436,120 | 100.0 | % | $ | 20,056,696 | 83.1 | % | (620,576 | ) | (3.1 | %) | ||||||||||||
| REVENUES FROM THE AFFILIATE COMPANY AND RELATED PARTY, NET | 956 | 0.0 | % | 4,089,534 | 16.9 | % | (4,088,578 | ) | (100.0 | %) | ||||||||||||||
| REVENUES, NET | 19,437,076 | 24,146,230 | (4,709,154 | ) | (19.5 | %) | ||||||||||||||||||
| COST OF GOODS SOLD | (15,900,298 | ) | (81.8 | %) | (19,944,076 | ) | (82.6 | %) | 4,043,778 | (20.3 | %) | |||||||||||||
| GROSS PROFIT | 3,536,778 | 18.2 | % | 4,202,154 | 17.4 | % | (665,376 | ) | (15.8 | %) | ||||||||||||||
| OPERATING INCOME (EXPENSES): | ||||||||||||||||||||||||
| Research and development | (1,149,901 | ) | (5.9 | %) | (632,590 | ) | (2.6 | %) | (517,311 | ) | 81.8 | % | ||||||||||||
| Selling and marketing | (763,666 | ) | (3.9 | %) | (899,478 | ) | (3.7 | %) | 135,812 | (15.1 | %) | |||||||||||||
| General and administrative | (3,907,191 | ) | (20.1 | %) | (5,623,798 | ) | (23.3 | %) | 1,716,607 | (30.5 | %) | |||||||||||||
| Gain on disposal of long-live asset | 13,907,574 | 71.6 | % | - | 0.0 | % | 13,907,574 | - | ||||||||||||||||
| Total Operating Income (Expenses) | 8,086,816 | 41.6 | % | (7,155,866 | ) | (29.6 | %) | 15,242,682 | (213.0 | %) | ||||||||||||||
| INCOME (LOSS) FROM OPERATIONS | 11,623,594 | 59.8 | % | (2,953,712 | ) | (12.2 | %) | 14,577,306 | (493.5 | %) | ||||||||||||||
| OTHER INCOME (EXPENSE): | ||||||||||||||||||||||||
| Interest income | 221,792 | 1.1 | % | 97,814 | 0.4 | % | 123,978 | 126.7 | % | |||||||||||||||
| Interest expense | (1,123,056 | ) | (5.8 | %) | (429,355 | ) | (1.8 | %) | (693,701 | ) | 161.6 | % | ||||||||||||
| Change in fair value of contingent consideration | (929,000 | ) | (4.8 | %) | 548,000 | 2.3 | % | (1,477,000 | ) | (269.5 | %) | |||||||||||||
| Government grants | 86,799 | 0.4 | % | 175,319 | 0.7 | % | (88,520 | ) | (50.5 | %) | ||||||||||||||
| Gain from equity dilution in the Affiliate Company | - | 0.0 | % | (24,131 | ) | (0.1 | %) | 24,131 | (100.0 | %) | ||||||||||||||
| Share of loss after tax of the Affiliate Company | (2,978,529 | ) | (15.3 | %) | (4,500,201 | ) | (18.6 | %) | 1,521,672 | (33.8 | %) | |||||||||||||
| Other income (expenses), net | 1,043,335 | 5.4 | % | (174,597 | ) | (0.7 | %) | 1,217,932 | (697.6 | %) | ||||||||||||||
| Total other expenses, net | (3,678,659 | ) | (18.9 | %) | (4,307,151 | ) | (17.8 | %) | 628,492 | (14.6 | %) | |||||||||||||
| INCOME (LOSS) BEFORE INCOME TAXES | 7,944,935 | 40.9 | % | (7,260,863 | ) | (30.1 | %) | 15,205,798 | (209.4 | %) | ||||||||||||||
| INCOME TAX (EXPENSE) BENEFIT | (3,889,889 | ) | (20.0 | %) | (57,295 | ) | (0.2 | %) | (3,832,594 | ) | 6689.2 | % | ||||||||||||
| NET INCOME (LOSS) | 4,055,046 | 20.9 | % | (7,318,158 | ) | (30.3 | %) | 11,373,204 | (155.4 | %) | ||||||||||||||
31
| Three Months Ended | ||||||||||||||||||||||||
| September 30, 2019 | % of Revenue | September 30, 2018 | % of Revenue | Change in Amount | Change in % | |||||||||||||||||||
| REVENUES FROM UNRELATED PARTY, NET | $ | 26,968,385 | 85.1 | % | $ | 14,860,034 | 39.1 | % | 12,108,351 | 81.5 | % | |||||||||||||
| REVENUES FROM THE AFFILIATE COMPANY AND RELATED PARTY, NET | 4,720,159 | 14.9 | % | 23,135,326 | 60.9 | % | (18,415,167 | ) | (79.6 | )% | ||||||||||||||
| REVENUES, NET | 31,688,544 | 37,995,360 | (6,306,816 | ) | (16.6 | )% | ||||||||||||||||||
| COST OF GOODS SOLD | (26,412,129 | ) | (83.3 | )% | (31,753,311 | ) | (83.6 | )% | 5,341,182 | (16.8 | )% | |||||||||||||
| GROSS PROFIT | 5,276,415 | 16.7 | % | 6,242,049 | 16.4 | % | (965,634 | ) | (15.5 | )% | ||||||||||||||
| OPERATING EXPENSES: | ||||||||||||||||||||||||
| Research and development | (596,187 | ) | (1.9 | )% | (5,691,649 | ) | (15.0 | )% | 5,095,462 | (89.5 | )% | |||||||||||||
| Selling and marketing | (930,810 | ) | (2.9 | )% | (898,896 | ) | (2.4 | )% | (31,914 | ) | 3.6 | % | ||||||||||||
| General and administrative | (3,432,920 | ) | (10.8 | )% | (2,070,947 | ) | (5.5 | )% | (1,361,973 | ) | 65.8 | % | ||||||||||||
| Total Operating Expenses | (4,959,917 | ) | (15.7 | )% | (8,661,492 | ) | (22.8 | )% | 3,701,575 | (42.7 | )% | |||||||||||||
| LOSS FROM OPERATIONS | 316,498 | 1.0 | % | (2,419,443 | ) | (6.4 | )% | 2,735,941 | (113.1 | )% | ||||||||||||||
| OTHER INCOME (EXPENSE): | ||||||||||||||||||||||||
| Interest income | 209,736 | 0.7 | % | 52,745 | 0.1 | % | 156,991 | 297.6 | % | |||||||||||||||
| Interest expense | (435,524 | ) | (1.4 | )% | (483,376 | ) | (1.3 | )% | 47,852 | (9.9 | )% | |||||||||||||
| Change in fair value of contingent consideration | 57,000 | 0.2 | % | (1,552,686 | ) | (4.1 | )% | 1,609,686 | (103.7 | )% | ||||||||||||||
| Government grants | 502,146 | 1.6 | % | 607,008 | 1.6 | % | (104,862 | ) | (17.3 | )% | ||||||||||||||
| Gain from equity dilution in the Affiliate Company | (49,285 | ) | (0.2 | )% | - | 0.0 | % | (49,285 | ) | - | ||||||||||||||
| Gain from equity sale in the Affiliate Company | 20,574,217 | 64.9 | % | - | 0.0 | % | 20,574,217 | - | ||||||||||||||||
| Share of loss after tax of the Affiliate Company | (8,433,767 | ) | (26.6 | )% | (3,247,343 | ) | (8.5 | )% | (5,186,424 | ) | 159.7 | % | ||||||||||||
| Other income , net | 57,833 | 0.2 | % | 15,735 | 0.0 | % | 42,098 | 267.5 | % | |||||||||||||||
| Total other income (expense), net | 12,482,356 | 39.4 | % | (4,607,917 | ) | (12.1 | )% | 17,090,273 | (370.9 | )% | ||||||||||||||
| INCOME(LOSS) BEFORE INCOME TAXES | 12,798,854 | 40.4 | % | (7,027,360 | ) | (18.5 | )% | 19,826,214 | (282.1 | )% | ||||||||||||||
| INCOME TAX (EXPENSE) BENEFIT | (709,413 | ) | (2.2 | )% | 505,961 | 1.3 | % | (1,215,374 | ) | (240.2 | )% | |||||||||||||
| NET INCOME (LOSS) | 12,089,441 | 38.2 | % | (6,521,399 | ) | (17.2 | )% | 18,610,840 | (285.4 | )% | ||||||||||||||
(a) Revenue
For the three months ended SeptemberJune 30, 2019,2020, our revenue was $31,688,544$19,437,076 compared to $37,995,360$24,146,230 for the same period of 2018,2019, representing a decrease of $6,306,816$4,709,154 or 16.6%19.5%. The decrease in revenue was mainly due to the decrease in EV parts sales during this quarter. The decreasesales. Due to the outbreak of COVID-19 in China, the demand of EV parts salesfrom customers was primarily due tosignificantly affected during the Affiliate Company’s temporary declining sales, which was caused by its product adjustments.first half of 2020.
The following table summarizes our revenues by product types for the three months ended SeptemberJune 30, 20192020 and 2018:2019:
| Three Months Ended September 30, | Three Months Ended June 30, | |||||||||||||||
| 2019 | 2018 | 2020 | 2019 | |||||||||||||
| Sales | Sales | Sales | Sales | |||||||||||||
| EV parts | $ | 25,847,506 | $ | 32,065,497 | $ | 12,514,548 | $ | 18,988,741 | ||||||||
| EV products | (1,913 | ) | - | |||||||||||||
| Off-road vehicles | 5,841,038 | 5,929,863 | 6,564,415 | 5,157,489 | ||||||||||||
| Electric Scooters and Electric Self-Balancing Scooters | 360,026 | - | ||||||||||||||
| Total | $ | 31,688,544 | $ | 37,995,360 | $ | 19,437,076 | $ | 24,146,230 | ||||||||
The negative amount is due to exchange rate difference.
EV Parts
During the three months ended SeptemberJune 30, 2019,2020, our revenues from the sales of EV parts were $25,847,506,$12,514,548, representing a decrease of $6,217,991$6,474,193 or 19.4%34.1% from $32,065,497$18,988,741 for the same quarter of 2018.2019.
Our revenue for the three months ended SeptemberJune 30, 20192020 primarily consisted of revenue from the sales of battery packs, body parts, EV controllers, air conditioning units and other auto parts for use in the manufacturing of EV products. These sales accounted for 81.6%64.4% of total sales.
During the three months ended SeptemberJune 30, 20192020 and 2018,2019, our revenue from the sale of EV parts to the Affiliate Company and its subsidiaries accounted for approximately 15%0% and 61%17% of our total net revenue for the quarter, respectively. The decrease is mainly due to the Affiliate Company’s temporary declining sales, which was caused by its product adjustments. In this year, the
EV parts we provided to the Affiliate Company were primarily used for battery upgrade and market maintenance for the EV products that were previously put into the leasing market.Products
Off-Road Vehicles
During the three months ended SeptemberJune 30, 2019,2020, our revenue from the sale of EV Products was negative $1,913, which was due to exchange rate difference. There were no EV Products sales in the same period of 2020.
Off-Road Vehicles
During the three months ended June 30, 2020, our revenue from the sales of off-road vehicles, including go karts, all-terrain vehicles (“ATVs”) and others, were $5,841,038,$6,564,415, representing a decreasean increase of $88,825$1,406,926 or 1.5%27.3% from $5,929,863,$5,157,489, for the same quarter of 2018.2019. The increase was mainly due to the increased sales from SC Autosports because of increased demand due to the power sports’ unique form of “socially distant” recreation.
Our off-road vehicles business line accounted for approximately 18.4%33.8% of our total net revenue for the three months ended SeptemberJune 30, 2020.
Electric Scooters and Electric Self-Balancing Scooters
During the three months ended June 30, 2020, our revenue from the sale of Electric Scooters and Electric Self-Balancing Scooters was $360,026. There were no Electric Scooters and Electric Self-Balancing Scooters sales in the same quarter of 2019.
32
The following table shows the breakdown of our net revenues:
| Three Months Ended September 30, | Three Months Ended June 30, | |||||||||||||||
| 2019 | 2018 | 2020 | 2019 | |||||||||||||
| Sales Revenue | Sales Revenue | Sales Revenue | Sales Revenue | |||||||||||||
| Primary geographical markets | ||||||||||||||||
| Overseas | $ | 5,703,050 | $ | 5,849,353 | $ | 8,571,281 | $ | 5,050,136 | ||||||||
| China | 25,985,494 | 32,146,007 | 10,865,795 | 19,096,094 | ||||||||||||
| Total | $ | 31,688,544 | $ | 37,995,360 | $ | 19,437,076 | $ | 24,146,230 | ||||||||
| Major products | ||||||||||||||||
| EV parts | $ | 25,847,506 | $ | 32,065,497 | $ | 12,514,548 | $ | 18,988,741 | ||||||||
| EV products | (1,913 | ) | - | |||||||||||||
| Off-road vehicles | 5,841,038 | 5,929,863 | 6,564,415 | 5,157,489 | ||||||||||||
| Electric Scooters and Electric Self-Balancing Scooters | 360,026 | - | ||||||||||||||
| Total | $ | 31,688,544 | $ | 37,995,360 | $ | 19,437,076 | $ | 24,146,230 | ||||||||
| Timing of revenue recognition | ||||||||||||||||
| Products transferred at a point in time | $ | 31,688,544 | $ | 37,995,360 | $ | 19,437,076 | $ | 24,146,230 | ||||||||
| Total | $ | 19,437,076 | $ | 24,146,230 | ||||||||||||
The negative amount is due to exchange rate difference.
(b) Cost of goods sold
Cost of goods sold was $26,412,129$15,900,298 during the three months ended SeptemberJune 30, 2019,2020, representing a decrease of $5,341,182,$4,043,778, or 16.8%20.3%, compared to $31,753,311$19,944,076 for the same period of 2018.2019. The decrease was primarily due to the corresponding decrease in sales. Please refer to the Gross Profit section below for product margin analysis.
(c) Gross profit
Our margins by product for the three months ended SeptemberJune 30, 20192020 and 20182019 are as set forth below:
| Three Months Ended June 30, | ||||||||||||||||||||||||||||||||
| 2020 | 2019 | |||||||||||||||||||||||||||||||
| Sales | Cost | Gross Profit | Margin % | Sales | Cost | Gross Profit | Margin % | |||||||||||||||||||||||||
| EV parts | $ | 12,514,548 | 10,745,020 | 1,769,528 | 14.1 | % | $ | 18,988,741 | 15,826,401 | 3,162,340 | 16.7 | % | ||||||||||||||||||||
| EV products | (1,913 | ) | (4,793 | ) | 2,880 | - | - | - | - | - | ||||||||||||||||||||||
| Off-road vehicles | 6,564,415 | 4,827,659 | 1,736,756 | 26.5 | % | 5,157,489 | 4,117,675 | 1,039,814 | 20.2 | % | ||||||||||||||||||||||
| Electric Scooters and Electric Self-Balancing Scooters | 360,026 | 332,412 | 27,614 | 7.7 | % | - | - | - | - | |||||||||||||||||||||||
| Total | $ | 19,437,076 | 15,900,298 | 3,536,778 | 18.2 | % | $ | 24,146,230 | 19,944,076 | 4,202,154 | 17.4 | % | ||||||||||||||||||||
| Three Months Ended September 30, | ||||||||||||||||||||||||||||||||
| 2019 | 2018 | |||||||||||||||||||||||||||||||
| Sales | Cost | Gross Profit | Margin % | Sales | Cost | Gross Profit | Margin % | |||||||||||||||||||||||||
| EV parts | $ | 25,847,506 | 21,929,420 | 3,918,086 | 15.2 | % | $ | 32,065,497 | 27,268,332 | 4,797,165 | 15.0 | % | ||||||||||||||||||||
| Off-road vehicles | 5,841,038 | 4,482,709 | 1,358,329 | 23.3 | % | 5,929,863 | 4,484,979 | 1,444,884 | 24.4 | % | ||||||||||||||||||||||
| Total | $ | 31,688,544 | 26,412,129 | 5,276,415 | 16.7 | % | $ | 37,995,360 | 31,753,311 | 6,242,049 | 16.4 | % | ||||||||||||||||||||
The negative amount is due to exchange rate difference.
Gross profit for the thirdsecond quarter of 20192020 decreased 15.5%15.8% to $5,276,415,$3,536,778, compared to $6,242,049$4,202,154 for the same period last year. This was primarily attributable to the sales decrease.decrease of EV Parts, which was primarily due to the outbreak of COVID-19 in 2020. Our gross margin increased to 16.7%18.2% compared to 16.4%17.4% for the same period of 2018.2019. The increase in our gross margin was mainly due to the sales under SC Autosports which has increased sellingthe unit price for the parts since the end of 2019 as well as introducing the charging and exchanging equipment and the increased proportionsales of the high-margin battery processing business this year.ATVs that brought higher margin than other off-road vehicles such as UTVs since May 2019.
(d) Research and development
Research and development expenses, including materials, labor, equipment depreciation, design, testing, inspection, and other related expenses, totaled $596,187$1,149,901 for the thirdsecond quarter of 2019, a decrease2020, an increase of $5,095,462$517,311 or 89.5%81.8% compared to $5,691,649$632,590 for the same period of last year. The decreaseincrease was mainly due to the R&D expense related to the developmenttechnology upgrading of EV Model K23 at Hainan facility in the third quarter of last year. Such R&D work has been completed in year 2018.Company’s products.
(e) Sales and marketing
Selling and distribution expenses were $930,810$763,666 for the thirdsecond quarter of 2019,2020, compared to $898,896$899,478 for the same period last year, representing an increasea decrease of $31,914$135,812 or 3.6%15.1%. The increasedecrease was primarily attributable to the increased freightreclassification of sales related financial charges to interest expense incurred by SC Autosports.since the end of 2019.
(f) General and administrative expenses
General and administrative expenses were $3,432,920$3,907,191 for the thirdsecond quarter of 2019,2020, compared to $2,070,947$5,623,798 for the same period last year, representing an increasea decrease of $1,361,973$1,716,607 or 65.8%30.5%. For the three months ended SeptemberJune 30, 2019,2020, general and administrative expenses included $22,925$824,621 as expenses for common stock awards and stock options to employees and Board members, compared to $31,675$1,282,733 of common stock awards and stock options expenses for the same period in 2018.2019. Besides stock compensation expense, our net general and administrative expenses for the three months ended SeptemberJune 30, 20192020 were $3,409,995,$3,082,570, representing an increasea decrease of $1,370,723,$1,258,495, from $2,039,272$4,341,065 for the same period of 2018,2019, which was largely due to the increased operationimplementation of cost cutting strategy and tighter budget control by the management.
(g) Gain on disposal of the Company since Hainan facility has been put into operation.long-live asset
(g)Gain on disposal of long-live asset was $13,907,574 for the second quarter of 2020, which was related to the real estate repurchase agreement of our Jinhua Facility’s relocation. In June 2020, 73,333 square meters of land use right was transferred to the local government, and the related gain was recognized.
34
(h) Interest income
Interest income was $209,736$221,792 for the thirdsecond quarter of 2019,2020, representing an increase of $156,991$123,978 or 297.6%126.7% compared to $52,745$97,814 for the same period of last year. The increase was primarily attributable to increased interest earned on loansthe loan to a third party.
(h)(i) Interest expenses
Interest expenses were $435,524$1,123,056 in the thirdsecond quarter of 2019,2020, representing a decreasean increase of $47,852$693,701 or 9.9%161.6% compared to $483,376$429,355 for the same period of last year. The decreaseincrease was primarily due to decreased interest expenses incurred associated with the note payable to a third party, as well as decreased discounts associated with the settlement of bank acceptance notes. Of the interest expenses, $0 and $24,930 were discounts associated with the settlementexpense of bank acceptance notes for the three months ended September 30, 2019 and 2018, respectively.Hainan factory’s long-term debt.
(i)(j) Change in fair value of contingent consideration
For the thirdsecond quarter of 2019,2020, the loss related to changes in the fair value of contingent consideration was $929,000, a decrease of $1,477,000 or 269.5% compared to gain related to changes in the fair value of contingent consideration was $57,000, an increase of $1,609,686 or 103.7% compared to loss related to changes in the fair value of contingent consideration of $1,552,686$548,000 for the same period of last year, which was mainly due to the decrease inadjustment of the fair value of the contingent consideration liability between December 31, 2018 and September 30, 2019 while thereassociated with the remaining shares of restrictive common stock (Please refer to NOTE 20 – CONTINGENT CONSIDERATION LIABILITY). The fair value of the contingent consideration liability was an increase inestimated at each reporting date by using the same period of last year.Monte Carlo simulation method, which took into account all possible scenarios.
(j)(k) Government grants
Government grants were $502,146$86,799 for the thirdsecond quarter of 2019,2020, compared to $607,008$175,319 for the same quarter last year, representing a decrease of $104,862,$88,520, or 17.3%50.5%, which was largely attributable to the fact that Kandi Vehicles received the subsidiesrefund of 2018 social security and land use tax in the third quarter of last year while the same kind of subsidies wereKandi Vehicles received in the second quarter of 2019, instead of in the third quarter.2019.
(k)(l) Gain from equity dilution in the Affiliate Company
Gain from equity dilution was a negative $49,285$0 for the thirdsecond quarter of 2019,2020, compared to negative $24,131 for the same quarter last year which was due to exchange rate difference. There was no equity dilution in the third quarter of 2019.
(l) Gain from equity sale in the Affiliate Company
Gain from equity sale was $20,574,217 for the third quarter of 2019, which was due to the Affiliate Equity Transfer. In March 2019, Kandi Vehicles agreed to sell 21.47% of its equity interests in the Affiliate Company to Geely for a total amount of RMB 516 million (approximately $72.3 million). As of September 30, 2019, the equity transfer had been completed. Therefore, in the third quarter of 2019, the Company recognized the gain from equity sale.
(m) Share of income (loss)loss after tax of the Affiliate Company
For the thirdsecond quarter of 2019,2020, our share of loss of the Affiliate Company was $8,433,767$2,978,529 as compared to share of loss of $3,247,343$4,500,201 for the same period of last year. The losses incurred by the Affiliate Company wereyear, representing a decrease of share of loss of $1,521,672, which was largely attributable to the fact that our equity interests of the Affiliate Company’s temporary declining sales, which was caused by its product adjustments.Company has been decreased to 22% from 43.47% after the equity dilution and equity transfer in 2019.
35
(n) Other income (loss)(expenses), net
Net other income was $57,833$1,043,335 for the thirdsecond quarter of 2019, representing an increase of $42,098 or 267.5%2020, compared to net other incomeexpenses of $15,735$174,597 for the same period of last year, which was largely due to the disposaldiscount of certain waste materials during the third quarter.accounts payable after negotiation with supplier.
(o) Income Taxes
In accordance with the relevant Chinese tax laws and regulations, our applicable corporate income tax rate is 25%. However, Kandi Vehicle and Jinhua An KaoKandi Smart Battery Swap are qualified as high technology companies in China and are therefore entitled to a reduced corporate income tax rate of 15%.
Each of our wholly-owned subsidiaries, Kandi New Energy, Yongkang Scrou and Kandi Hainan, has an applicable corporate income tax rate of 25%.
We have a 22% ownership interest in the Affiliate Company, which has an applicable corporate income tax rate of 25%. Each of the Affiliate Company’s subsidiaries has an applicable corporate income tax rate of 25%.
Our actual effective income tax rate for the thirdsecond quarter of 20192020 was a tax expense of 5.54%48.96% on a reported income before taxes of approximately $12.8$7.9 million, compared to a tax benefitexpense of 7.20%0.79% on a reported loss before taxes of approximately $7.0$7.3 million for the same period of last year.
(p) Net income (loss)
Net income was $12,089,441$4,055,046 for the thirdsecond quarter of 2019,2020, representing an increase of $18,610,840a decrease in net loss by $11,373,204 compared to net loss $6,521,399$7,318,158 for the same period of last year. The increasedecrease in loss was primarily attributable to the gain from equity sale in the Affiliate Company and the decreased research and development expense.
Excluding (i) the effectson disposal of stock compensation expenses, which were $22,925 and $31,675 for the third quarter of 2019 and 2018, respectively, and (ii) the change in fair value of contingent considerationlong-live asset which was a gain of $57,000 and a loss of $1,552,686 for the three months ended September 30, 2019 and 2018, respectively, our non-GAAP net income was $12,055,366 for the three months ended September 30, 2019 as compared to non-GAAP net loss $4,937,038 for the same period of 2018, an increase of $16,992,404, or 344.2%. The increase in net income (non-GAAP) was primarily attributablerelated to the gain from equity sale in the Affiliate Company and the decreased research and development expense.real estate repurchase agreement of our Jinhua Facility’s relocation.
36
We make reference to certain non-GAAP financial measures, i.e., adjusted net income. Management believes that such adjusted financial results are useful for investors in evaluating our operating performance because they present a meaningful measure of corporate performance. See the non-GAAP reconciliation table below. Any non-GAAP measures should not be considered as a substitute for, and should only be read in conjunction with, measures of financial performance prepared in accordance with GAAP.
The following table summarizes our non-GAAP net income for the three months ended September 30, 2019 and 2018:
| Three Months Ended | ||||||||
| September 30, | ||||||||
| 2019 | 2018 | |||||||
| GAAP net income (loss) | $ | 12,089,441 | $ | (6,521,399 | ) | |||
| Stock compensation expenses | 22,925 | 31,675 | ||||||
| Change in fair value of contingent consideration | (57,000 | ) | 1,552,686 | |||||
| Non-GAAP net income (loss) | $ | 12,055,366 | $ | (4,937,038 | ) | |||
Comparison of the NineSix Months Ended SeptemberJune 30, 20192020 and 20182019
The following table sets forth the amounts and percentage to revenue of certain items in our condensed consolidated statements of income (loss)operations and comprehensive income (loss) for the ninesix months ended SeptemberJune 30, 20192020 and 2018.2019.
| Nine Months Ended | ||||||||||||||||||||||||
| September 30, 2019 | % of Revenue | September 30, 2018 | % of Revenue | Change in Amount | Change in % | |||||||||||||||||||
| REVENUES FROM UNRELATED PARTY, NET | $ | 63,360,044 | 85.7 | % | $ | 32,211,352 | 51.4 | % | 31,148,692 | 96.7 | % | |||||||||||||
| REVENUES FROM THE AFFILIATE COMPANY AND RELATED PARTY, NET | 10,543,190 | 14.3 | % | 30,479,521 | 48.6 | % | (19,936,331 | ) | (65.4 | )% | ||||||||||||||
| REVENUES, NET | 73,903,234 | 100.0 | % | 62,690,873 | 100.0 | % | 11,212,361 | 17.9 | % | |||||||||||||||
| COST OF GOODS SOLD | (61,288,228 | ) | (82.9 | )% | (53,044,861 | ) | (84.6 | )% | (8,243,367 | ) | 15.5 | % | ||||||||||||
| GROSS PROFIT | 12,615,006 | 17.1 | % | 9,646,012 | 15.4 | % | 2,968,994 | 30.8 | % | |||||||||||||||
| OPERATING EXPENSES: | ||||||||||||||||||||||||
| Research and development | (1,766,210 | ) | (2.4 | )% | (7,091,836 | ) | (11.3 | )% | 5,325,626 | (75.1 | )% | |||||||||||||
| Selling and marketing | (2,448,291 | ) | (3.3 | )% | (1,875,294 | ) | (3.0 | )% | (572,997 | ) | 30.6 | % | ||||||||||||
| General and administrative | (11,096,246 | ) | (15.0 | )% | (5,534,039 | ) | (8.8 | )% | (5,562,207 | ) | 100.5 | % | ||||||||||||
| Total Operating Expenses | (15,310,747 | ) | (20.7 | )% | (14,501,169 | ) | (23.1 | )% | (809,578 | ) | 5.6 | % | ||||||||||||
| LOSS FROM OPERATIONS | (2,695,741 | ) | (3.6 | )% | (4,855,157 | ) | (7.7 | )% | 2,159,416 | (44.5 | )% | |||||||||||||
| OTHER INCOME (EXPENSE): | ||||||||||||||||||||||||
| Interest income | 559,954 | 0.8 | % | 1,452,522 | 2.3 | % | (892,568 | ) | (61.4 | )% | ||||||||||||||
| Interest expense | (1,304,062 | ) | (1.8 | )% | (1,505,409 | ) | (2.4 | )% | 201,347 | (13.4 | )% | |||||||||||||
| Change in fair value of contingent consideration | 694,000 | 0.9 | % | 1,814,326 | 2.9 | % | (1,120,326 | ) | (61.7 | )% | ||||||||||||||
| Government grants | 725,189 | 1.0 | % | 717,821 | 1.1 | % | 7,368 | 1.0 | % | |||||||||||||||
| Gain from equity dilution in the Affiliate Company | 4,291,974 | 5.8 | % | - | 0.0 | % | 4,291,974 | - | ||||||||||||||||
| Gain from equity sale in the Affiliate Company | 20,574,217 | 27.8 | % | - | 0.0 | % | 20,574,217 | - | ||||||||||||||||
| Share of loss after tax of the Affiliate Company | (22,883,126 | ) | (31.0 | )% | (79,592 | ) | (0.1 | )% | (22,803,534 | ) | 28650.5 | % | ||||||||||||
| Other income , net | 357,626 | 0.5 | % | 666,294 | 1.1 | % | (308,668 | ) | (46.3 | )% | ||||||||||||||
| Total other income, net | 3,015,772 | 4.1 | % | 3,065,962 | 4.9 | % | (50,190 | ) | (1.6 | )% | ||||||||||||||
| INCOME (LOSS) BEFORE INCOME TAXES | 320,031 | 0.4 | % | (1,789,195 | ) | (2.9 | )% | 2,109,226 | (117.9 | )% | ||||||||||||||
| INCOME TAX BENEFIT | 41,780 | 0.1 | % | 370,316 | 0.6 | % | (328,536 | ) | (88.7 | )% | ||||||||||||||
| NET INCOME (LOSS) | 361,811 | 0.5 | % | (1,418,879 | ) | (2.3 | )% | 1,780,690 | (125.5 | )% | ||||||||||||||
| Six Months Ended | ||||||||||||||||||||||||
| June 30, 2020 | % of Revenue | June 30, 2019 | % of Revenue | Change in Amount | Change in % | |||||||||||||||||||
| REVENUES FROM UNRELATED PARTY, NET | $ | 25,808,544 | 100.0 | % | $ | 36,391,659 | 86.2 | % | (10,583,115 | ) | (29.1 | %) | ||||||||||||
| REVENUES FROM THE AFFILIATE COMPANY AND RELATED PARTY, NET | 956 | 0.0 | % | 5,823,031 | 13.8 | % | (5,822,075 | ) | (100.0 | %) | ||||||||||||||
| REVENUES, NET | 25,809,500 | 100.0 | % | 42,214,690 | 100.0 | % | (16,405,190 | ) | (38.9 | %) | ||||||||||||||
| COST OF GOODS SOLD | (21,105,463 | ) | (81.8 | %) | (34,876,099 | ) | (82.6 | %) | 13,770,636 | (39.5 | %) | |||||||||||||
| GROSS PROFIT | 4,704,037 | 18.2 | % | 7,338,591 | 17.4 | % | (2,634,554 | ) | (35.9 | %) | ||||||||||||||
| OPERATING INCOME (EXPENSES): | ||||||||||||||||||||||||
| Research and development | (1,790,141 | ) | (6.9 | %) | (1,170,023 | ) | (2.8 | %) | (620,118 | ) | 53.0 | % | ||||||||||||
| Selling and marketing | (1,641,972 | ) | (6.4 | %) | (1,517,481 | ) | (3.6 | %) | (124,491 | ) | 8.2 | % | ||||||||||||
| General and administrative | (6,973,926 | ) | (27.0 | %) | (7,663,326 | ) | (18.2 | %) | 689,400 | (9.0 | %) | |||||||||||||
| Gain on disposal of long-live asset | 13,907,574 | 53.9 | % | - | 0.0 | % | 13,907,574 | - | ||||||||||||||||
| Total Operating Income (Expenses) | 3,501,535 | 13.6 | % | (10,350,830 | ) | (24.5 | %) | 13,852,365 | (133.8 | %) | ||||||||||||||
| INCOME (LOSS) FROM OPERATIONS | 8,205,572 | 31.8 | % | (3,012,239 | ) | (7.1 | %) | 11,217,811 | (372.4 | %) | ||||||||||||||
| OTHER INCOME (EXPENSE): | ||||||||||||||||||||||||
| Interest income | 560,736 | 2.2 | % | 350,218 | 0.8 | % | 210,518 | 60.1 | % | |||||||||||||||
| Interest expense | (2,105,990 | ) | (8.2 | %) | (868,538 | ) | (2.1 | %) | (1,237,452 | ) | 142.5 | % | ||||||||||||
| Change in fair value of contingent consideration | 2,863,000 | 11.1 | % | 637,000 | 1.5 | % | 2,226,000 | 349.5 | % | |||||||||||||||
| Government grants | 97,898 | 0.4 | % | 223,043 | 0.5 | % | (125,145 | ) | (56.1 | %) | ||||||||||||||
| Gain from equity dilution in the Affiliate Company | - | 0.0 | % | 4,341,259 | 10.3 | % | (4,341,259 | ) | (100.0 | %) | ||||||||||||||
| Share of loss after tax of the Affiliate Company | (4,081,299 | ) | (15.8 | %) | (14,449,359 | ) | (34.2 | %) | 10,368,060 | (71.8 | %) | |||||||||||||
| Other income, net | 1,062,985 | 4.1 | % | 299,793 | 0.7 | % | 763,192 | 254.6 | % | |||||||||||||||
| Total other expenses, net | (1,602,670 | ) | (6.2 | %) | (9,466,584 | ) | (22.4 | %) | 7,863,914 | (83.1 | %) | |||||||||||||
| INCOME (LOSS) BEFORE INCOME TAXES | 6,602,902 | 25.6 | % | (12,478,823 | ) | (29.6 | %) | 19,081,725 | (152.9 | %) | ||||||||||||||
| INCOME TAX (EXPENSE) BENEFIT | (4,122,502 | ) | (16.0 | %) | 751,193 | 1.8 | % | (4,873,695 | ) | (648.8 | %) | |||||||||||||
| NET INCOME (LOSS) | 2,480,400 | 9.6 | % | (11,727,630 | ) | (27.8 | %) | 14,208,030 | (121.2 | %) | ||||||||||||||
3037
(a) Revenue
For the ninesix months ended SeptemberJune 30, 2019,2020, our revenue was $73,903,234$25,809,500 compared to $62,690,873$42,214,690 for the same period of 2018,2019, representing an increasea decrease of $11,212,361$16,405,190 or 17.9%38.9%. The increasedecrease in revenue was mainly due to the increase in both EV parts and off-road vehicles sales during this quarter. The increasedecrease in EV parts sales was primarily duesales. Due to the increased sales volumeoutbreak of battery packs.COVID-19 in China, the production of EV parts was interrupted during the first quarter of 2020, and the overall demand of EV parts from customers was significantly affected during the first half of 2020.
The following table summarizes our revenues by product types for the ninesix months ended SeptemberJune 30, 20192020 and 2018:2019:
| Nine Months Ended September 30, | Six Months Ended June 30 | |||||||||||||||
| 2019 | 2018 | 2020 | 2019 | |||||||||||||
| Sales | Sales | Sales | Sales | |||||||||||||
| EV parts | $ | 57,607,687 | $ | 53,947,874 | $ | 14,595,883 | $ | 31,760,181 | ||||||||
| EV products | 253,906 | - | ||||||||||||||
| Off-road vehicles | 16,295,547 | 8,742,999 | 10,599,685 | 10,454,509 | ||||||||||||
| Electric Scooters and Electric Self-Balancing Scooters | 360,026 | - | ||||||||||||||
| Total | $ | 73,903,234 | $ | 62,690,873 | $ | 25,809,500 | $ | 42,214,690 | ||||||||
EV Parts
During the ninesix months ended SeptemberJune 30, 2019,2020, our revenuerevenues from the salesales of EV parts was $57,607,687,were $14,595,883, representing an increasea decrease of $3,659,813$17,164,298 or 6.8%54.0% from $53,947,874$31,760,181 for the same period of 2018.2019.
Our revenue for the ninesix months ended SeptemberJune 30, 20182020 primarily consisted of revenue from the sales of battery packs, body parts, EV controllers, air conditioning units and other auto parts for use in the manufacturing of EV products. These sales accounted for 78.0%56.6% of the total sales.
During the ninesix months ended SeptemberJune 30, 20192020 and 2018,2019, our revenue from the sale of EV parts to the Affiliate Company and its subsidiaries accounted for approximately 14%0% and 49%14% of our total net revenue for the period,quarter, respectively. The decrease largely attributable
38
EV Products
During the six months ended June 30, 2020, our revenue from the sale of EV Products was $253,906, which was due to the Affiliate Company’s temporary decliningexport sales which was caused by its product adjustments. In this year, the EV parts we provided to the Affiliate Company were primarily used for battery upgrade and market maintenance for theof Hainan factories’ products. There weren’t any EV products that were previously put intosales in the leasing market.same period of 2019.
Off-Road Vehicles
During the ninesix months ended SeptemberJune 30, 2019,2020, our revenue from the sales of off-road vehicles, including go karts, all-terrain vehicles (“ATVs”) and others, were $16,295,547,$10,599,685, representing an increase of $7,552,548$145,176 or 86.4%1.4% from $8,742,999$10,454,509, for the same quarterperiod of 2018. The increase in revenue of the off-road vehicles was largely due to the additional sales from SC Autosports, which became our wholly-owned U.S. subsidiary in July 2018.2019.
Our off-road vehicles business line accounted for approximately 22.0%41.1% of our total net revenue for the ninesix months ended SeptemberJune 30, 2019.2020.
Electric Scooters and Electric Self-Balancing Scooters
During the six months ended June 30, 2020, our revenue from the sale of Electric Scooters and Electric Self-Balancing Scooters was $360,026. There were no Electric Scooters and Electric Self-Balancing Scooters sales in the same period of 2019.
The following table shows the breakdown of our net revenues:
| Six Months Ended June 30, | ||||||||
| 2020 | 2019 | |||||||
| Sales Revenue | Sales Revenue | |||||||
| Primary geographical markets | ||||||||
| Overseas | $ | 10,702,105 | $ | 10,272,661 | ||||
| China | 15,107,395 | 31,942,029 | ||||||
| Total | $ | 25,809,500 | $ | 42,214,690 | ||||
| Major products | ||||||||
| EV parts | $ | 14,595,883 | $ | 31,760,181 | ||||
| EV products | 253,906 | - | ||||||
| Off-road vehicles | 10,599,685 | 10,454,509 | ||||||
| Electric Scooters and Electric Self-Balancing Scooters | 360,026 | - | ||||||
| Total | $ | 25,809,500 | $ | 42,214,690 | ||||
| Timing of revenue recognition | ||||||||
| Products transferred at a point in time | $ | 25,809,500 | $ | 42,214,690 | ||||
| Total | $ | 25,809,500 | $ | 42,214,690 | ||||
39
| Nine Months Ended September 30, | ||||||||
| 2019 | 2018 | |||||||
| Sales Revenue | Sales Revenue | |||||||
| Primary geographical markets | ||||||||
| Overseas | $ | 15,975,711 | $ | 8,337,793 | ||||
| China | 57,927,523 | 54,353,080 | ||||||
| Total | $ | 73,903,234 | $ | 62,690,873 | ||||
| Major products | ||||||||
| EV parts | $ | 57,607,687 | $ | 53,947,874 | ||||
| Off-road vehicles | 16,295,547 | 8,742,999 | ||||||
| Total | $ | 73,903,234 | $ | 62,690,873 | ||||
| Timing of revenue recognition | ||||||||
| Products transferred at a point in time | $ | 73,903,234 | $ | 62,690,873 | ||||
(b) Cost of goods sold
Cost of goods sold was $61,288,228$21,105,463 during the ninesix months ended SeptemberJune 30, 2019,2020, representing an increasea decrease of $8,243,367,$13,770,636, or 15.5%39.5%, compared to $53,044,861$34,876,099 for the same period of 2018.2019. The increasedecrease was primarily due to the corresponding increasedecrease in sales. Please refer to the below Gross Profit section below for product margin analysis.
(c) Gross profit
Our margins by product for the ninesix months ended SeptemberJune 30, 20192020 and 20182019 are as set forth below:
| Six Months Ended June 30, | ||||||||||||||||||||||||||||||||
| 2020 | 2019 | |||||||||||||||||||||||||||||||
| Sales | Cost | Gross Profit | Margin % | Sales | Cost | Gross Profit | Margin % | |||||||||||||||||||||||||
| EV parts | $ | 14,595,883 | 12,603,150 | 1,992,733 | 13.7 | % | $ | 31,760,181 | 26,635,967 | 5,124,214 | 16.1 | % | ||||||||||||||||||||
| EV products | 253,906 | 236,594 | 17,312 | 6.8 | % | - | - | - | - | |||||||||||||||||||||||
| Off-road vehicles | 10,599,685 | 7,933,307 | 2,666,378 | 25.2 | % | 10,454,509 | 8,240,132 | 2,214,377 | 21.2 | % | ||||||||||||||||||||||
| Electric Scooters and Electric Self-Balancing Scooters | 360,026 | 332,412 | 27,614 | 7.7 | % | - | - | - | - | |||||||||||||||||||||||
| Total | $ | 25,809,500 | 21,105,463 | 4,704,037 | 18.2 | % | $ | 42,214,690 | 34,876,099 | 7,338,591 | 17.4 | % | ||||||||||||||||||||
40
| Nine Months Ended September 30, | ||||||||||||||||||||||||||||||||
| 2019 | 2018 | |||||||||||||||||||||||||||||||
| Sales | Cost | Gross Profit | Margin % | Sales | Cost | Gross Profit | Margin % | |||||||||||||||||||||||||
| EV parts | $ | 57,607,687 | 48,565,387 | 9,042,300 | 15.7 | % | $ | 53,947,874 | 46,093,092 | 7,854,782 | 14.6 | % | ||||||||||||||||||||
| Off-road vehicles | 16,295,547 | 12,722,841 | 3,572,706 | 21.9 | % | 8,742,999 | 6,951,769 | 1,791,230 | 20.5 | % | ||||||||||||||||||||||
| Total | $ | 73,903,234 | 61,288,228 | 12,615,006 | 17.1 | % | $ | 62,690,873 | 53,044,861 | 9,646,012 | 15.4 | % | ||||||||||||||||||||
Gross profit for the first three quartershalf of 2019 increased 30.8%2020 decreased 35.9% to $12,615,006,$ 4,704,037, compared to $9,646,012$7,338,591 for the same period last year. This was primarily attributable to the sales increase.decrease, which was primarily due to the outbreak of COVID-19 in 2020. Our gross margin increased to 17.1%18.2% compared to 15.4%17.4% for the same period of 2018.2019. The increase in our gross margin was mainly due to the sales under SC which has increased sellingthe unit price for the parts since end of 2019 as well as introducing the charging and exchanging equipment and the increased proportion of the high-margin battery processing business this year. The higher gross margin from the off-road vehicle sales of SC Autosports, which became our wholly-owned U.S. subsidiary in July 2018, also contribute to the increased gross margin.ATVs that brought higher margin than other off-road vehicles such as UTVs since May 2019.
(d) Research and development
Research and development expenses, including materials, labor, equipment depreciation, design, testing, inspection, and other related expenses, totaled $1,766,210$1,790,141 for the first three quartershalf of 2019, representing a decrease2020, an increase of $5,325,626$620,118 or 75.1%53.0% compared to $7,091,836$1,170,023 for the same period of last year. The decreaseincrease was primarilymainly due to the R&D expense related to the developmenttechnology upgrading of EV Model K23 at Hainan facility in the third quarter of last year. Such R&D work has been completed in year 2018.Company’s products.
(e) Sales and marketing
Selling and distribution expenses were $2,448,291$1,641,972 for the first three quartershalf of 2019,2020, compared to $1,875,294$1,517,481 for the same period last year, representing an increase of $572,997$124,491 or 30.6%8.2%. The increase was primarily attributable to inclusion of the salesincreasing labor and marketingadvertising expenses from SC Autosports, which became our wholly-ownedin connection with the expansion the U.S. subsidiary in July 2018.electric vehicle market.
(f) General and administrative expenses
General and administrative expenses were $11,096,246$6,973,926 for the first three quartershalf of 2019,2020, compared to $5,534,039$7,663,326 for the same period of last year, representing an increasea decrease of expenses of $5,562,207$689,400 or 100.5%9.0%. For the ninesix months ended SeptemberJune 30, 2019,2020, general and administrative expenses included $1,337,333$847,546 as expenses for common stock awards and stock options to employees and Board members, compared to $253,934 for the same period$1,314,408 of 2018, representing the result of $2,898,811 as expenses for common stock awards and stock options to employees and Board members net of $2,644,877 of reversal of previously accrued stock option expenses for forfeited stock option for the nine months ended September 30, 2018. Excludingsame period in 2019. Besides stock compensation expenses,expense, our net general and administrative expenses for the ninesix months ended SeptemberJune 30, 20192020 were $9,758,913, representing an increase of $4,478,808, or 84.8%, from $5,280,105$6,126,380 which was comparable to $6,348,918 for the same period of 2018,2019.
(g) Gain on disposal of long-live asset
Gain on disposal of long-live asset was $13,907,574 for the first half of 2020, which was largely duerelated to the increased operation costsreal estate repurchase agreement of our Jinhua Facility’s relocation. In June 2020, 73,333 square meters of land use right was transferred to the Company since Hainan facility has been put into production.local government, and the related gain was recognized.
(g)(h) Interest income
Interest income was $559,954$560,736 for the first three quartershalf of 2019,2020, representing a decreasean increase of $892,568$210,518 or 61.4%60.1% compared to $1,452,522$350,218 for the same period of last year. The decreaseincrease was primarily attributable to the decreased interest earned on loans tocollateral for bank acceptance notes and increased interest earned on the Affiliate Company since Kandi Vehicles’ loan to Affiliate converted to equity in the second quarter of 2018.third party.
(h)(i) Interest expenses
Interest expenses were $1,304,062$2,105,990 in the first three quartershalf of 2019,2020, representing a decreasean increase of $201,347$1,237,452 or 13.4%142.5% compared to $1,505,409$868,538 for the same period of last year. The decreaseincrease was primarily due to decreased interest expenses incurred associated with the note payable to a third party, as well as decreased discounts associated with the settlement of bank acceptance notes. Of the interest expenses, $0, and $78,272 were discounts associated with the settlementexpense of bank acceptance notes for the nine months ended September 30, 2019 and 2018, respectively.Hainan factory’s long-term debt.
41
(i)
(j) Change in fair value of contingent consideration
For the first three quartershalf of 2019,2020, the gain related to changes in the fair value of contingent consideration was $694,000, representing a decrease$2,863,000, an increase of $1,120,326$2,226,000 or 61.7%349.5% compared to gain related to changes in the fair value of contingent consideration of $1,814,326$637,000 for the same period of last year, which was mainly due to the decrease inadjustment of the fair value of the contingent consideration liability between December 31, 2018 and September 30, 2019associated with the remaining shares of restrictive common stock (Please refer to NOTE 20 – CONTINGENT CONSIDERATION LIABILITY). The fair value of the contingent consideration liability was less thanestimated at each reporting date by using the decrease in the same period of last year.Monte Carlo simulation method, which took into account all possible scenarios.
(j)(k) Government grants
Government grants were $725,189$97,898 for the first three quartershalf of 2019,2020, compared to $717,821$223,043 for the same quarter last year, representing an increasea decrease of $7,368,$125,145, or 1.0%. This increase56.1%, which was largely attributable to the refund of 2018 social security and land use tax Kandi Vehicles received in government grants was becausethe second quarter of the government’s implementation of a new policy with the purpose of supporting companies that have no or less layoff of their employees.2019.
(k)(l) Gain from equity dilution in the Affiliate Company
Gain from equity dilution was $4,291,974$0 for the first three quartershalf of 20192020, compared to $4,341,259 for the same period of last year, which was primarily due to gain from the conversion of the loan into equity in the Affiliate Company in March Affiliate Loan to Equity Conversion.2019. Pursuant to the Equity Transfer Agreement, the Affiliate Company converted a loan of RMB 314 million (approximately $45.7$44.3 million) from Geely Group last year to equity in order to increase its cash flow. As a result, our equity interests in the Affiliate Company decreasedflow (for details please refer to 43.47% in March, 2019.Note 22 - SUMMARIZED INFORMATION OF EQUITY METHOD INVESTMENT IN THE AFFILIATE COMPANY).
(l) Gain from equity sale in the Affiliate Company
Gain from equity sale was $20,574,217 for first three quarters of 2019, which was due to the Affiliate Equity Transfer. In March, 2019, Kandi Vehicles agreed to sell 21.47% of its equity interests in the Affiliate Company to Geely for a total amount of RMB 516 million (approximately $72.3 million). As of September 30, 2019, the equity transfer had been completed. Therefore, in the third quarter of 2019, the Company has recognized the gain from equity sale.
(m) Share of income (loss) after tax of the Affiliate Company
For the first three quarters of 2019, our share of loss after tax of the Affiliate Company was $22,883,126 for
For the first three quartershalf of 20192020, our share of loss of the Affiliate Company was $4,081,299 as compared to share of loss of $79,592 in$14,449,359 for the same period of last year. The losses incurred by the Affiliate Company wereyear, representing a decrease of share of loss of $10,368,060, which was largely attributable to the decreased operating expenses of the Affiliate Company’s temporary declining sales decline, which was caused by its product adjustments.Company, as well as the fact that our equity interests of the Affiliate Company has been decreased to 22% from 43.47% after the equity dilution and equity transfer in 2019.
(n) Other income, net
Net other income was $357,626$1,062,985 for the first three quartershalf of 2019,2020, representing a decreasean increase of $308,668$763,192 or 46.3%254.6% compared to net other income of $666,294$299,793 for the same period of last year, which was largely due to the fees earned on technology development services in the same perioddiscount of last year.accounts payable after negotiation with supplier.
42
(o) Income Taxes
In accordance with the relevant Chinese tax laws and regulations, our applicable corporate income tax rate is 25%. However, Kandi Vehicle and Jinhua An KaoKandi Smart Battery Swap are qualified as high technology companies in China and are therefore entitled to a reduced corporate income tax rate of 15%.
Each of our wholly-owned subsidiaries, Kandi New Energy, Yongkang Scrou and Kandi Hainan, has an applicable corporate income tax rate of 25%.
We have a 22% ownership interest in the Affiliate Company, which has an applicable corporate income tax rate of 25%. Each of the Affiliate Company’s subsidiaries has an applicable corporate income tax rate of 25% as well..
Our actual effective income tax rate for the first three quartershalf of 20192020 was a tax benefitexpense of 13.05%62.43% on a reported income before taxes of approximately $0.3$6.6 million, compared to a tax benefit of 20.70%6.02% on a reported loss before taxes of approximately $1.8 million.$12.5 million for the same period of last year.
(p) Net income (loss)
Net income was $361,811$2,480,400 for the first three quartershalf of 2019,2020, representing an increase of $1,780,690a decrease in net loss by $14,208,030 compared to net loss $1,418,879$11,727,630 for the same period of last year. The increasedecrease in loss was primarily attributable to the increased revenue, decreased research and development expense and the gain from equity sale in the Affiliate Company.
Excluding (i) the effectsGain on disposal of stock compensation expenses, which were $1,337,333 and $2,898,811 net of a reversal for forfeited stock option of $2,644,877 for the first three quarters of 2019 and 2018, respectively, and (ii) the change in fair value of contingent considerationlong-live asset which was a gain of $694,000 and $1,814,326 for the nine months ended September 30, 2019 and 2018, respectively, our non-GAAP net income was $1,005,144 for the nine months ended September 30, 2019 as compared to non-GAAP net loss $2,979,271 for the same period of 2018, an increase of $3,984,415, or 133.7%. The increase in net income (non-GAAP) was primarily attributablerelated to the increased revenue, decreased research and development expense and the gain from equity sale in the Affiliate Company.real estate repurchase agreement of our Jinhua Facility’ relocation.
We make reference to certain non-GAAP financial measures, i.e., adjusted net income. Management believes that such adjusted financial results are useful for investors in evaluating our operating performance because they present a meaningful measure of corporate performance. See the non-GAAP reconciliation table below. Any non-GAAP measures should not be considered as a substitute for, and should only be read in conjunction with, measures of financial performance prepared in accordance with the GAAP.
The following table summarizes our non-GAAP net income for the nine months ended September 30, 2019 and 2018:
| Nine Months Ended | ||||||||
| September 30, | ||||||||
| 2019 | 2018 | |||||||
| GAAP net income (loss) | $ | 361,811 | $ | (1,418,879 | ) | |||
| Stock compensation expenses | 1,337,333 | 253,934 | ||||||
| Change in fair value of contingent consideration | (694,000 | ) | (1,814,326 | ) | ||||
| Non-GAAP net income (loss) | $ | 1,005,144 | $ | (2,979,271 | ) | |||
LIQUIDITY AND CAPITAL RESOURCES
Cash Flow
| Six Months Ended | ||||||||
| June 30, 2020 | June 30, 2019 | |||||||
| Net cash used in by operating activities | $ | (34,327,490 | ) | $ | (33,118,904 | ) | ||
| Net cash provided by investing activities | 50,278,763 | 14,228,076 | ||||||
| Net cash (used in) provided by financing activities | (25,628,295 | ) | 1,474,078 | |||||
| NET DECREASE IN CASH AND CASH EQUIVALENTS AND RESTRICTED CASH | (9,677,022 | ) | (17,416,750 | ) | ||||
| Effect of exchange rate changes on cash | (157,062 | ) | 246,604 | |||||
| CASH AND CASH EQUIVALENTS AND RESTRICTED CASH AT BEGINNING OF YEAR | 16,512,635 | 22,353,071 | ||||||
| CASH AND CASH EQUIVALENTS AND RESTRICTED CASH AT END OF PERIOD | 6,678,551 | 5,182,925 | ||||||
For the first three quartershalf of 2019,2020, cash used in operating activities was $25,425,152,$34,327,490, as compared to cash used in operating activities of $836,809$33,118,904 for the same period last year. Our operating cash inflows include cash received primarily from sales of our EV parts and off-road vehicles. These cash inflows are offset largely by cash paid primarily to our suppliers for production materials and parts used in our manufacturing process, operation expenses, employee compensation, and interest expenses of our financings. The major operating activities that provided cash for the first three quartershalf of 20192020 were a decrease of amount due from the Affiliate Company of $30,549,072.$4,129,516. The major operating activity that used cash for first three quartershalf of 20192020 was an increase of accounts receivableadvances to supplier and prepayments and prepaid expenses of $36,822,184.$12,586,777.
43
For the first three quartershalf of 2019,2020, cash derived from investing activities was $31,087,397,$50,278,763, as compared to cash used inderived from investing activities of $682,504$14,228,076 for the same period of last year. The major investing activities that provided cash for the first three quartershalf of 20192020 were an increase of cash receivedproceeds from equity sale in Affiliate Companydisposal of $32,061,558.long-lived assets of $34,696,547. The major investing activities that used cash for first three quartershalf of 20192020 were $955,670$59,670 used for the purchases of property, plant and equipment.
For the first three quartershalf of 2019, cash used from financing activities was $1,035,235, as compared to2020, cash used in financing activities was $ 25,628,295, as compared to cash derived from financing activities of $3,631,969$1,474,078 for the same period of last year. The major financing activities that provided cash for the first three quartershalf of 20192020 were proceeds from short-term bank loans of $27,864,409.$24,031,625. The major financing activities that used cash for the first three quartershalf of 20192020 were $26,261,331 of repaymentrepayments of short-term bank loans.loans of $49,769,638.
Working Capital
We had a working capital of $80,374,159$75,587,762 at SeptemberJune 30, 2019,2020, which reflects an increase of $77,847,248$11,889,065 from a working capital of $2,526,911$63,698,697 as of December 31, 2018.2019.
DuringAfter two years of negotiations, on March 10, 2020, a real estate repurchase agreement (the “Repurchase Agreement”) was entered into by and between Kandi Vehicles and Jinhua Economic and Technological Development Zone pursuant to which the first quarterlocal government shall purchase the land use right over the land of 2019,66 acres (400 mu, 265,029 square meters) that is owned by Kandi Vehicles for RMB 525 million ($74 million). Payments to Kandi Vehicles shall be made in three installments as the Company signed an agreement to sell 21.47% of its equity interestsdisclosed in a Current Report on Form 8-K filed with the Affiliate Company to Geely for a total amount of RMB 516 million (approximately $72.3 million). As of September 29, 2019, the Company had received payments in cash totaling RMB 220 million (approximately $30.9 million) and certain commercial acceptance notes of RMB 296 million (approximately $41.6 million) from Geely, of which RMB 140 million (approximately $19.7 million) shall mature on January 20, 2020 and the remaining RMB 156 million (approximately $21.9 million) shall matureSEC on March 29,9, 2020. The Company plansIn addition, if Kandi Vehicles achieves certain milestones that contribute to apply the proceeds from the equity transfer to its ongoing operations.
We believe the working capital oflocal economic development, the Company will be greatly improved after we receive the above payments.
Capital Requirements and Capital Provided
Capital requirements and capital providedeligible for the nine months ended September 30, 2019 were as follows:
| Nine Months Ended | ||||
| September 30, 2019 | ||||
| (In Thousands) | ||||
| Capital requirements | ||||
| Purchase of plant and equipment | $ | 956 | ||
| Purchase of construction in progress | 18 | |||
| Repayments of short-term bank loans | 26,261 | |||
| Repayments of long-term bank loans | 146 | |||
| Cash used for stock buyback | 2,493 | |||
| Internal cash used in operations | 25,425 | |||
| Increase in cash | 3,699 | |||
| Total capital Requirements | $ | 58,998 | ||
| Capital provided | ||||
| Proceeds from short-term bank loan | 27,864 | |||
| Cash received from equity sale in the Affiliate Company | 32,062 | |||
| Total capital provided | $ | 59,926 | ||
The difference between capital provided and capital required is caused by the effect of exchange rate changestax rebates that could total up to RMB 500 million ($71 million) over the past nine months.next eight years. On May 22, 2020, the Company received the first payment of RMB 244 million (approximately $35 million) under the Repurchase Agreement. On July 9, 2020, the Company received the second payment of RMB 119 million (approximately $17 million) under the Repurchase Agreement.
Contractual Obligations and Off-balance Sheet Arrangements
Short-term and long-term Loans:
For the discussion of short-term and long-term loans, please refer to Note 1817 - Short-term and Long-term Loans under Notes to Condensed Consolidated Financial Statements.
44
Notes payable:
For the discussion of notes payable, please refer to Note 19 - Notes Payable under Notes to Condensed Consolidated Financial Statements.
Guarantees and pledged collateral for third party bank loans
For the discussion of guarantees and pledged collateral for third party bank loans, please refer to Note 2523 – Commitments and Contingencies under Notes to Condensed Consolidated Financial Statements.
Recent Development Activities:Activities
On September 23, 2019, the CompanyJuly 13, 2020, we announced that Kandi Vehicles and DGL Group signed a Purchase Framework Agreement (the “Agreement”) on behalf of Kandi Vehicles and DGL Group regarding an initial batch order of 300,000 electric scooters and 500,000 electric self-balancing scooters. The total value of the Agreement is expected to be about RMB 500 million (approximately $70.5 million).The purchased products are expected to be completed and delivered within one year from the date of signing this Agreement.
On September 30, 2019, the Company announced that it has completed the transfer of 21.74% of equity interests in the Affiliate Company launched sales of its first pure electric SUV, the Maple 30x. The Maple 30x comes in five styles and five different colors. In addition to Geely on September 29, 2019.the four styles offered in pre-sales earlier this year, the Affiliate Company also launched its “mobility version” customized for the urban mobility market.
On October 2, 2019, the CompanyJuly 22, 2020, we announced that Kandi brand EV model K23, manufacturedthe Maple 60V all-electric MPV (Multi-purpose Vehicle) produced by Kandi Hainan, received eligibilitythe Affiliate Company was approved for uppurchase subsidies by China’s Ministry of Industry and Information Technology (“MIIT”). Subsidy approval is a key milestone as the Affiliate Company brings the 60V to $7,500market in tax credits under the New Qualified Plug-in Electric Drive Motor Vehicle Credit (the “Credit”) fromnear future.
On July 30, 2020, we announced the Internal Revenue Service. Therefore, new U.S. buyers who purchase model K23 will qualify forformal launch of the Credit. SC Autosports hosted EV model K23 Launch Conference in Garland, Texas during September 21-23, 2019, with over 120 distributors from all over the U.S. as attendants. After an on-site test drive, the distributors were enthusiastic about K23’s market potentialmost affordable pure electric automobiles in the U.S. market, the Kandi K27 and showed their high interests in distributing model K23. As a result,K23 models. The cars will be sold by Kandi Hainan signed a supply contract (the “Contract”) forAmerica, the initial 2000 model K23 withtrade name of Kandi’s wholly owned subsidiary SC Autosports, on October 1, 2019. The value of the Contract is about $32 million. According to the Contract, the first 200 vehicles are expected to be delivered by the end of 2019.
On October 14, 2019, the Company announced that according to the executed Purchase Framework Agreement dated September 22, 2019 between its wholly-owned subsidiary, Kandi Vehicles and DGL Group, Kandi Vehicles started delivering the initial batch of 1,232 electric scooters and 37,755 electric self-balancing scooters on October 11, 2019.
On November 4, 2019, the Company announced that it has newly developed two new mini pure EV models. The first model is a four-wheeled mini pure EV. The second model is a three-wheeled mini pure EV. These vehicles are intended for use in residential settings to meet U.S. market demand according to DGL Group Inc. (USA) (“DGL Group”)’s market analysis research. After Kandi has undergone several rounds of technical and performance testsLLC. Sales will initially focus on the mini EVs, fiveDallas-Fort Worth metroplex.
On August 3, 2020, we announced the achievement of each mini EV model prototypes are completed and ready to be shipped to DGL Groupa key milestone in our commercialization plan for further tests in the beginning of this month.
our proprietary battery swap technology. On November 11, 2019, the Company announced that its firstAugust 2, 2020, we delivered our fully automatic intelligent battery exchange system passedto the inspection on November 10, 2019.rideshare operator in Haikou City, Hainan Province. The system features automatic functionswas developed and is produced by Kandi’s wholly-owned subsidiary, Kandi Smart Battery Swap. Installation is expected to be completed shortly, after which perform an intelligent charging andthe rideshare operator will use the K23 model’s battery exchange. The battery exchanging timeswap service for each vehicle is only 90 seconds, which ranks among the current top battery exchange equipment.its online car-hailing business in Hainan.
Item 3. Quantitative and Qualitative Disclosures about Market Risk
This item is not applicable to us.
Item 4. Controls and Procedures.
Evaluation of Disclosure Controls and Procedures
We have evaluated, under the supervision of our Chief Executive Officer (“CEO”) and our interim Chief Financial Officer (“Interim CFO”), the effectiveness of disclosure controls and procedures (as such term is defined in Rules 13a-15(e) and 15d-15(e) under the Securities Exchange Act of 1934 (the “Exchange Act”) as of SeptemberJune 30, 2019.2020. Based on this evaluation, our CEO and Interim CFO concluded that as of the end of the period covered by this report, our disclosure controls and procedures were effective.
Disclosure controls and procedures are controls and procedures that are designed to ensure that information required to be disclosed in our reports filed or submitted under the Exchange Act (a) is recorded, processed, summarized and reported within the time periods specified in the SEC’s rules and forms and (b) is accumulated and communicated to management, including our CEO and Interim CFO, as appropriate, to allow timely decisions regarding required disclosure. Our management recognizes that any controls and procedures, no matter how well designed and operated, can provide only reasonable assurance of achieving their objectives and management necessarily applies its judgment in evaluating the cost-benefit relationship of possible controls and procedures. Our disclosure controls and procedures are designed to provide reasonable assurance of achieving their objectives as described above.
Changes in Internal Control over Financial Reporting
There was no change to our internal control over financial reporting (as defined in Rules 13a-15(f) and 15d-15(f) under the Exchange Act) that occurred during the period covered by this report that have materially affected, or are reasonably likely to materially affect, our internal control over financial reporting.
45
PART II – OTHER INFORMATION
From time to time, the Company is involved in legal matters arising in the ordinary course of business. Except as set forth in Note 2523 - COMMITMENTS AND CONTINGENCIES under Notes to Condensed Consolidated Financial Statements, our management is currently not aware of any legal matters or pending litigation that would have a significant effect on the Company’s results of operation of financial statements. Furthermore,statements, nor is the Company is not aware of any other legal matters in which any director, officer, or any owner of record or beneficial owner of more than five percent of any class of voting securities of the Company, or any affiliate of any such director, officer, affiliate of the Company, or security holder, is a party adverse to the Company or has a material adverse interest to the Company. For the detailed discussion of our legal proceedings, please refer to Note 2523 - COMMITMENTS AND CONTINGENCIES under Notes to Condensed Consolidated Financial Statements, which is incorporated by reference herein.
Issuer Purchases of Equity Securities
On May 14, 2019, we announced that our board of directors had authorized the repurchase of up to $20 million worth of our common stock in open market transactions or in privately negotiated transactions. The following table sets forth information regarding shares of our common stock that we repurchased during the three months ended September 30, 2019.
| Period | (a) Total number of shares purchased | (b) Average price paid per share | (c) Total number of shares purchased as part of publicly announced plans or programs | (d) Maximum number (or approximate dollar value) of shares that may yet be purchased under the plans or programs | ||||||||||||
| July 1 to July 30, 2019 | - | $ | - | - | $ | 20,000,000 | ||||||||||
| August 1 to August 31, 2019 | 487,155 | $ | 5.09 | 487,155 | $ | 17,520,381 | ||||||||||
| September 1 to September 30, 2019 | - | $ | - | - | $ | - | ||||||||||
| Total | 487,155 | $ | 5.09 | 487,155 | $ | 17,520,381 | ||||||||||
In summary, the Company had repurchased a total of 487,155 common shares at an average stock price of $5.09 per share as of September 30, 2019.
| Exhibit Number | Description | |
| English Translation of the Supplementary Agreement II to the Share Transfer Agreement of Jinhua An Kao Power Technology Co., Ltd. dated July 7, 2020 | ||
| 31.1 | Certification of Principal Executive Officer pursuant to Rule 13a-14(a)/15d-14(a) under the Securities Exchange Act of 1934 | |
| 31.2 | Certification of Principal Financial Officer pursuant to Rule 13a-14(a)/15d-14(a) under the Securities Exchange Act of 1934 | |
| 32.1 | Certification of Principal Executive Officer and Principal Financial Officer pursuant to 18 U.S.C. § 1350, as Adopted Pursuant to § 906 of the Sarbanes-Oxley Act of 2002 | |
| 101.INS | XBRL Instance Document. | |
| 101.SCH | XBRL Taxonomy Extension Schema Document. | |
| 101.CAL | XBRL Taxonomy Extension Calculation Linkbase Document. | |
| 101.LAB | XBRL Taxonomy Extension Label Linkbase Document. | |
| 101.PRE | XBRL Taxonomy Extension Presentation Linkbase Document. | |
| 101.DEF | XBRL Taxonomy Definitions Linkbase Document. |
3946
SIGNATURES
Pursuant to the requirements of the Securities Exchange Act of 1934, as amended, the registrant caused this report to be signed on its behalf by the undersigned, thereunto duly authorized.
| Date: | By: | /s/ Hu Xiaoming |
| Hu Xiaoming | ||
| President and Chief Executive Officer | ||
| (Principal Executive Officer) | ||
| Date: | By: | /s/ |
| (Principal Financial Officer and | ||
| Accounting Officer) |
40 47