U.S. SECURITIES AND EXCHANGE COMMISSION
WASHINGTON, DC 20549
FORM 10-Q10-Q/A
Amendment No. 1
☒ Quarterly report pursuant to Section 13 or 15(d) of the Securities Exchange Act of 1934
For the period ended March 31, 2020
☐ Transition report pursuant to Section 13 or 15(d) of the Securities Exchange Act of 1934
For the transition period from ___________ to ___________.
Commission File Number 001-34024
Sino-Global Shipping America, Ltd.
(Exact name of registrant as specified in its charter)
| Virginia | 11-3588546 | |
| (State or other jurisdiction of | (I.R.S. employer | |
| Incorporation or organization) | identification number) |
1044 Northern Boulevard, Suite 305 Roslyn, New York | 11576-1514 | |
| (Address of principal executive offices) | (Zip Code) |
+ 1 (718) 888-1814
(Registrant’s telephone number, including area code)
Securities Registered Pursuant to Section 12(b) of the Act:
| Title of each class | Trading Symbol(s) | Name of each exchange on which registered | ||
| Common Stock | SINO | NASDAQ Capital Market |
Indicate by check mark whether the registrant (1) has filed all reports required to be filed by Section 13 or 15(d) of the Securities Exchange Act of 1934 during the preceding 12 months (or for such shorter period that the registrant was required to file such reports) and (2) has been subject to such filing requirements for the past 90 days. Yes ☒ No ☐
Indicate by check mark whether the registrant has submitted electronically every Interactive Data File required to be submitted pursuant to Rule 405 of Regulation S-T (§232.405 of this chapter) during the preceding 12 months (or for such shorter period that the registrant was required to submit such files). Yes ☒ No ☐
Indicate by check mark whether the registrant is a large accelerated filer, an accelerated filer, a non-accelerated filer, smaller reporting company, or an emerging growth company. See the definitions of “large accelerated filer,” “accelerated filer,” “smaller reporting company,” and “emerging growth company” in Rule 12b-2 of the Exchange Act.
| Large accelerated filer ☐ | Accelerated filer ☐ |
| Non-accelerated filer ☒ | Smaller reporting company ☒ |
| Emerging Growth Company ☐ |
If an emerging growth company, indicate by check mark if the registrant has elected not to use the extended transition period for complying with any new or revised financial accounting standards provided pursuant to Section 13(a) of the Exchange Act. ☐
Indicate by check mark whether the registrant is a shell company (as defined in Rule 12b-2 of the Exchange Act). Yes ☐ No ☒
As of July 2, 2020, the Company has 18,589,037 shares of common stock issued and outstanding.
SINO-GLOBAL SHIPPING AMERICA, LTD.
FORM 10-Q
INDEX
i
SPECIALEXPLANATORY NOTE REGARDING FORWARD-LOOKING STATEMENTS
This document contains certain statements of a forward-looking nature. Such forward-looking statements, including but not limitedAmendment No. 1 to projected growth, trends and strategies, future operating and financial results, financial expectations and current business indicators are based upon current information and expectations and are subject to change based on factors beyond the control of the Company. Forward-looking statements typically are identified by the use of terms such as “look”, “may”, “will”, “should”, “might”, “believe”, “plan”, “expect”, “anticipate”, “estimate” and similar words, although some forward-looking statements are expressed differently. The accuracy of such statements may be impacted by a number of business risks and uncertainties that could cause actual results to differ materially from those projected or anticipated, including but not limited to the following:
Readers are cautioned not to place undue reliance on these forward-looking statements, which speak only as of the date hereof. The Company undertakes no obligation to update this forward-looking information unless required by applicable law or regulations.
ii
SINO-GLOBAL SHIPPING AMERICA, LTD. AND AFFILIATES
CONDENSED CONSOLIDATED BALANCE SHEETS
(UNAUDITED)
| March 31, | June 30, | |||||||
| 2020 | 2019 | |||||||
| Assets | ||||||||
| Current assets | ||||||||
| Cash | $ | 143,112 | $ | 3,142,650 | ||||
| Notes receivable | - | 383,792 | ||||||
| Accounts receivable, net | 1,745,672 | 7,045,846 | ||||||
| Other receivables | 6,486,140 | 4,335,715 | ||||||
| Advances to suppliers - third parties | 112,037 | 124,140 | ||||||
| Prepaid expenses and other current assets | 239,830 | 105,054 | ||||||
| Due from related party, net | 435,898 | 807,965 | ||||||
| Total Current Assets | 9,162,689 | 15,945,162 | ||||||
| Property and equipment, net | 588,514 | 989,910 | ||||||
| Right-of-use assets | 337,899 | - | ||||||
| Intangible assets, net | 42,222 | 89,722 | ||||||
| Prepaid expenses | - | 519,503 | ||||||
| Other receivables - noncurrent | 3,549,958 | - | ||||||
| Other long-term assets - deposits | 2,956,802 | 3,054,706 | ||||||
| Total Assets | $ | 16,638,084 | $ | 20,599,003 | ||||
| Liabilities and Equity | ||||||||
| Current Liabilities | ||||||||
| Advances from customers | $ | 66,987 | $ | 68,590 | ||||
| Accounts payable | 637,489 | 567,619 | ||||||
| Lease liabilities - current | 156,190 | - | ||||||
| Taxes payable | 3,290,812 | 3,184,895 | ||||||
| Accrued expenses and other current liabilities | 1,485,743 | 1,418,129 | ||||||
| Total current liabilities | 5,637,221 | 5,239,233 | ||||||
| Lease liabilities - noncurrent | 177,495 | - | ||||||
| Total liabilities | 5,814,716 | 5,239,233 | ||||||
| Commitments and Contingencies | ||||||||
| Equity | ||||||||
| Preferred stock, 2,000,000 shares authorized, no par value, none issued | - | - | ||||||
| Common stock, 50,000,000 shares authorized, no par value; 18,139,037 and 16,054,534 shares issued as of March 31, 2020 and June 30, 2019, respectively; 18,139,037 and 15,879,037 shares outstanding as of March 31, 2020 and June 30, 2019, respectively | 28,090,992 | 26,523,830 | ||||||
| Additional paid-in capital | 2,334,962 | 2,066,906 | ||||||
| Subscription receivable | (114,054 | ) | - | |||||
| Treasury stock, at cost, 0 and 175,497 shares as of March 31, 2020 and June 30, 2019 | - | (417,538 | ) | |||||
| Accumulated deficit | (12,821,480 | ) | (6,968,700 | ) | ||||
| Accumulated other comprehensive loss | (1,142,737 | ) | (671,106 | ) | ||||
| Total Sino-Global Shipping America Ltd. Stockholders’ Equity | 16,347,683 | 20,533,392 | ||||||
| Non-controlling Interest | (5,524,315 | ) | (5,173,622 | ) | ||||
| Total Equity | 10,823,368 | 15,359,770 | ||||||
| Total Liabilities and Equity | $ | 16,638,084 | $ | 20,599,003 | ||||
The accompanying notes are an integral part of these unaudited condensed consolidated financial statements.
SINO-GLOBAL SHIPPING AMERICA, LTD. AND AFFILIATES
CONDENSED CONSOLIDATED STATEMENTS OF OPERATIONS AND COMPREHENSIVE LOSS
(UNAUDITED)
| For the Three Months Ended | For the Nine Months Ended | |||||||||||||||
| March 31, | March 31, | |||||||||||||||
| 2020 | 2019 | 2020 | 2019 | |||||||||||||
| Net revenues - third parties | $ | 1,353,979 | $ | 22,736,759 | $ | 5,161,329 | $ | 39,354,579 | ||||||||
| Net revenues - related party | - | 36,380 | - | 433,380 | ||||||||||||
| Total revenues | 1,353,979 | 22,773,139 | 5,161,329 | 39,787,959 | ||||||||||||
| Cost of revenues | (889,107 | ) | (21,075,195 | ) | (2,328,156 | ) | (34,715,624 | ) | ||||||||
| Gross profit | 464,872 | 1,697,944 | 2,833,173 | 5,072,335 | ||||||||||||
| Selling expenses | (79,099 | ) | (140,601 | ) | (335,253 | ) | (507,199 | ) | ||||||||
| General and administrative expenses | (952,661 | ) | (1,053,903 | ) | (2,746,180 | ) | (3,442,695 | ) | ||||||||
| Impairment loss of fixed assets and intangible asset | - | - | (327,632 | ) | - | |||||||||||
| Provision for doubtful accounts | (3,121,416 | ) | (1,583,965 | ) | (4,289,170 | ) | (2,871,752 | ) | ||||||||
| Stock-based compensation | (346,439 | ) | (148,708 | ) | (1,252,756 | ) | (2,013,292 | ) | ||||||||
| Total operating expenses | (4,499,615 | ) | (2,927,177 | ) | (8,950,991 | ) | (8,834,938 | ) | ||||||||
| Operating loss | (4,034,743 | ) | (1,229,233 | ) | (6,117,818 | ) | (3,762,603 | ) | ||||||||
| Other income, net | 21,260 | 2,499 | 7,103 | 3,993 | ||||||||||||
| Net loss before provision for income taxes | (4,013,483 | ) | (1,226,734 | ) | (6,110,715 | ) | (3,758,610 | ) | ||||||||
| Income tax expense | (189,510 | ) | (248,820 | ) | (204,257 | ) | (427,333 | ) | ||||||||
| Net loss | (4,202,993 | ) | (1,475,554 | ) | (6,314,972 | ) | (4,185,943 | ) | ||||||||
| Net loss attributable to non-controlling interest | (384,899 | ) | (86,764 | ) | (462,192 | ) | (6,419 | ) | ||||||||
| Net loss attributable to Sino-Global Shipping America, Ltd. | $ | (3,818,094 | ) | $ | (1,388,790 | ) | $ | (5,852,780 | ) | $ | (4,179,524 | ) | ||||
| Comprehensive loss | ||||||||||||||||
| Net loss | $ | (4,202,993 | ) | $ | (1,475,554 | ) | $ | (6,314,972 | ) | $ | (4,185,943 | ) | ||||
| Other comprehensive income (loss) - foreign currency | (112,671 | ) | 262,467 | (360,132 | ) | (306,457 | ) | |||||||||
| Comprehensive loss | (4,315,664 | ) | (1,213,087 | ) | (6,675,104 | ) | (4,492,400 | ) | ||||||||
| Less: Comprehensive (loss) income attributable to non-controlling interest | (322,135 | ) | (96,210 | (350,693 | ) | 37,445 | ||||||||||
| Comprehensive loss attributable to Sino-Global Shipping America, Ltd. | $ | (3,993,529 | ) | $ | (1,116,877 | ) | $ | (6,324,411 | ) | $ | (4,529,845 | ) | ||||
| Loss per share | ||||||||||||||||
| Basic and diluted | $ | (0.22 | ) | $ | (0.09 | ) | $ | (0.35 | ) | $ | (0.30 | ) | ||||
| Weighted average number of common shares used in computation | ||||||||||||||||
| Basic and diluted | 17,738,157 | 15,245,703 | 16,875,173 | 14,045,018 | ||||||||||||
The accompanying notes are an integral part of these unaudited condensed consolidated financial statements.
SINO-GLOBAL SHIPPING AMERICA, LTD. AND AFFILIATES
CONDENSED CONSOLIDATED STATEMENTS OF CHANGES IN EQUITY
(UNAUDITED)
| Preferred Stock | Common Stock | Additional paid-in | Treasury Stock | Subscription | Accumulated | Accumulated other comprehensive | Noncontrolling | |||||||||||||||||||||||||||||||||||||||||
| Shares | Amount | Shares | Amount | capital | Shares | Amount | receivable | deficit | loss | interest | Total | |||||||||||||||||||||||||||||||||||||
| BALANCE, June 30, 2018 | - | $ | - | 13,271,032 | $ | 23,717,330 | $ | 1,755,573 | (175,497 | ) | $ | (417,538 | ) | $ | - | $ | (434,856 | ) | $ | (272,407 | ) | $ | (4,812,828 | ) | $ | 19,535,274 | ||||||||||||||||||||||
| Stock based compensation to employee | - | - | 430,000 | 473,000 | - | - | - | - | - | - | - | 473,000 | ||||||||||||||||||||||||||||||||||||
| Stock based compensation to consultants | - | - | 50,000 | 63,500 | - | - | - | - | - | - | - | 63,500 | ||||||||||||||||||||||||||||||||||||
| Amortization of shares to management and employees | - | - | - | - | 91,000 | - | - | - | - | - | - | 91,000 | ||||||||||||||||||||||||||||||||||||
| Amortization of shares issued to consultants | - | - | - | - | 189,708 | - | - | - | - | - | - | 189,708 | ||||||||||||||||||||||||||||||||||||
| Foreign currency translation | - | - | - | - | - | - | - | - | - | (539,656 | ) | 77,494 | (462,162 | ) | ||||||||||||||||||||||||||||||||||
| Net income (loss) | - | - | - | - | - | - | - | - | (1,316,762 | ) | - | 29,231 | (1,287,531 | ) | ||||||||||||||||||||||||||||||||||
| BALANCE, September 30, 2018 | - | - | 13,751,032 | 24,253,830 | 2,036,281 | (175,497 | ) | (417,538 | ) | - | (1,751,618 | ) | (812,063 | ) | (4,706,103 | ) | 18,602,789 | |||||||||||||||||||||||||||||||
| Stock based compensation to employee | - | - | 1,150,000 | 909,500 | - | - | - | - | - | - | - | 909,500 | ||||||||||||||||||||||||||||||||||||
| Stock based compensation to consultants | - | - | 100,000 | 128,500 | (43,333 | ) | - | - | - | - | - | - | 85,167 | |||||||||||||||||||||||||||||||||||
| Issuance of common stock to private investor | - | - | 420,168 | 500,000 | - | - | - | - | - | - | - | 500,000 | ||||||||||||||||||||||||||||||||||||
| Amortization of shares issued to consultants | - | - | - | - | 52,709 | - | - | - | - | - | - | 52,709 | ||||||||||||||||||||||||||||||||||||
| Foreign currency translation | - | - | - | - | - | - | - | - | - | (82,578 | ) | (24,184 | ) | (106,762 | ) | |||||||||||||||||||||||||||||||||
| Net income (loss) | - | - | - | - | - | - | - | - | (1,473,972 | ) | - | 51,114 | (1,422,858 | ) | ||||||||||||||||||||||||||||||||||
| BALANCE, December 31, 2018 | - | - | 15,421,200 | 25,791,830 | 2,045,657 | (175,497 | ) | (417,538 | ) | (3,225,590 | ) | (894,641 | ) | (4,679,173 | ) | 18,620,545 | ||||||||||||||||||||||||||||||||
| Stock based compensation to consultants | - | - | 50,000 | 63,500 | 32,500 | - | - | - | - | - | - | 96,000 | ||||||||||||||||||||||||||||||||||||
| Amortization of shares issued to consultants | - | - | - | - | 52,708 | - | - | - | - | - | - | 52,708 | ||||||||||||||||||||||||||||||||||||
| Foreign currency translation | - | - | - | - | - | - | - | - | - | 271,913 | (9,446 | ) | 262,467 | |||||||||||||||||||||||||||||||||||
| Net loss | - | - | - | - | - | - | - | - | (1,388,790 | ) | - | (86,764 | ) | (1,475,554 | ) | |||||||||||||||||||||||||||||||||
| BALANCE, March 31, 2019 | - | $ | - | 15,471,200 | $ | 25,855,330 | $ | 2,130,865 | (175,497 | ) | $ | (417,538 | ) | $ | - | $ | (4,614,380 | ) | $ | (622,728 | ) | $ | (4,775,383 | ) | $ | 17,556,166 | ||||||||||||||||||||||
| Preferred Stock | Common Stock | Additional paid-in | Treasury Stock | Subscription | Accumulated | Accumulated other comprehensive | Noncontrolling | |||||||||||||||||||||||||||||||||||||||||
| Shares | Amount | Shares | Amount | capital | Shares | Amount | receivable | deficit | loss | interest | Total | |||||||||||||||||||||||||||||||||||||
| BALANCE, June 30, 2019 | - | $ | - | 16,054,534 | $ | 26,523,830 | $ | 2,066,906 | (175,497 | ) | $ | (417,538 | ) | $ | - | $ | (6,968,700 | ) | $ | (671,106 | ) | $ | (5,173,622 | ) | $ | 15,359,770 | ||||||||||||||||||||||
| Stock based compensation to employees | - | - | 90,000 | 63,000 | - | - | - | - | - | - | - | 63,000 | ||||||||||||||||||||||||||||||||||||
| Stock based compensation to consultants | - | - | 240,000 | 200,300 | - | - | - | - | - | - | - | 200,300 | ||||||||||||||||||||||||||||||||||||
| Amortization of shares issued to consultants | - | - | - | - | 180,209 | - | - | - | - | - | - | 180,209 | ||||||||||||||||||||||||||||||||||||
| Foreign currency translation | - | - | - | - | - | - | - | - | - | (646,211 | ) | 142,544 | (503,667 | ) | ||||||||||||||||||||||||||||||||||
| Net loss | - | - | - | - | - | - | - | - | (1,627,353 | ) | - | (121,271 | ) | (1,748,624 | ) | |||||||||||||||||||||||||||||||||
| BALANCE, September 30, 2019 | - | - | 16,384,534 | 26,787,130 | 2,247,115 | (175,497 | ) | (417,538 | ) | - | (8,596,053 | ) | (1,317,317 | ) | (5,152,349 | ) | 13,550,988 | |||||||||||||||||||||||||||||||
| Stock based compensation to employees | - | - | 230,000 | 156,400 | - | - | - | - | - | - | - | 156,400 | ||||||||||||||||||||||||||||||||||||
| Stock based compensation to consultants | - | - | 350,000 | 282,500 | - | - | - | - | - | - | - | 282,500 | ||||||||||||||||||||||||||||||||||||
| Amortization of shares issued to consultants | - | - | - | - | 52,708 | - | - | - | - | - | - | 52,708 | ||||||||||||||||||||||||||||||||||||
| Issuance of common stock to private investor | - | - | 500,500 | 500,500 | - | - | - | - | - | - | - | 500,500 | ||||||||||||||||||||||||||||||||||||
| Cancellation of treasury stock | - | - | (175,497 | ) | (417,538 | ) | - | 175,497 | 417,538 | - | - | - | - | - | ||||||||||||||||||||||||||||||||||
| Foreign currency translation | - | - | - | - | - | - | - | - | - | 350,015 | (93,809 | ) | 256,206 | |||||||||||||||||||||||||||||||||||
| Net loss | - | - | - | - | - | - | - | - | (407,333 | ) | - | 43,978 | (363,355 | ) | ||||||||||||||||||||||||||||||||||
| BALANCE, December 31, 2019 | - | - | 17,289,537 | 27,308,992 | 2,299,823 | - | - | - | (9,003,386 | ) | (967,302 | ) | (5,202,180 | ) | 14,435,947 | |||||||||||||||||||||||||||||||||
| Stock based compensation to consultants | - | - | 350,000 | 282,500 | - | - | - | - | - | - | - | 282,500 | ||||||||||||||||||||||||||||||||||||
| Amortization of shares issued to consultants | - | - | - | - | 35,139 | - | - | - | - | - | - | 35,139 | ||||||||||||||||||||||||||||||||||||
| Issuance of common stock to private investor | - | - | 499,500 | 499,500 | - | - | - | (114,054 | ) | - | - | - | 385,446 | |||||||||||||||||||||||||||||||||||
| Foreign currency translation | - | - | - | - | - | - | - | - | - | (175,435 | ) | 62,764 | (112,671 | ) | ||||||||||||||||||||||||||||||||||
| Net loss | - | - | - | - | - | - | - | - | (3,818,094 | ) | - | (384,899 | ) | (4,202,993 | ) | |||||||||||||||||||||||||||||||||
| BALANCE, March 31, 2020 | - | $ | - | 18,139,037 | $ | 28,090,992 | $ | 2,334,962 | - | $ | - | $ | (114,054 | ) | $ | (12,821,480 | ) | $ | (1,142,737 | ) | $ | (5,524,315 | ) | $ | 10,823,368 | |||||||||||||||||||||||
The accompanying notes are an integral part of these unaudited condensed consolidated financial statements.
4
SINO-GLOBAL SHIPPING AMERICA, LTD. AND AFFILIATES
CONDENSED CONSOLIDATED STATEMENTS OF CASH FLOWS
(UNAUDITED)
| For the Nine Months Ended | ||||||||
| March 31, | ||||||||
| 2020 | 2019 | |||||||
| Operating Activities | ||||||||
| Net loss | $ | (6,314,972 | ) | $ | (4,185,943 | ) | ||
| Adjustments to reconcile net loss to net cash used in operating activities: | ||||||||
| Stock-based compensation | 1,252,756 | 2,013,292 | ||||||
| Depreciation and amortization | 320,272 | 95,313 | ||||||
| Non-cash lease expense | 113,985 | - | ||||||
| Provision for doubtful accounts | 4,289,170 | 2,871,752 | ||||||
| Impairment loss of fixed assets and intangible asset | 327,632 | - | ||||||
| Deferred tax benefit | - | (208,047 | ) | |||||
| Changes in assets and liabilities | ||||||||
| Notes receivable | 386,233 | (732,826 | ) | |||||
| Accounts receivable | 1,051,299 | (8,341,650 | ) | |||||
| Other receivables | (5,882,569 | ) | 36,014 | |||||
| Advances to suppliers - third parties | 11,820 | (410,886 | ) | |||||
| Advances to suppliers - related party | - | 3,312,375 | ||||||
| Prepaid expenses and other current assets | 165,939 | 821,662 | ||||||
| Other long-term assets - deposits | 89,274 | (2,502,946 | ) | |||||
| Due from related parties | 413,408 | 1,552,918 | ||||||
| Advances from customers | (1,496 | ) | (353,696 | ) | ||||
| Accounts payable | 72,772 | 1,336,453 | ||||||
| Taxes payable | 116,520 | 837,641 | ||||||
| Lease liabilities | (118,256 | ) | - | |||||
| Accrued expenses and other current liabilities | 65,094 | 535,921 | ||||||
| Net cash used in operating activities | (3,641,119 | ) | (3,322,653 | ) | ||||
| Investing Activities | ||||||||
| Acquisition of property and equipment | (6,979 | ) | (143,480 | ) | ||||
| Net cash used in investing activities | (6,979 | ) | (143,480 | ) | ||||
| Financing Activities | ||||||||
| Proceeds from issuance of common stock | 885,946 | 500,000 | ||||||
| Net cash provided by financing activities | 885,946 | 500,000 | ||||||
| Effect of exchange rate fluctuations on cash | (237,386 | ) | (608,219 | ) | ||||
| Net decrease in cash | (2,999,538 | ) | (3,574,352 | ) | ||||
| Cash at beginning of period | 3,142,650 | 7,098,259 | ||||||
| Cash at end of period | $ | 143,112 | $ | 3,523,907 | ||||
| Supplemental information | ||||||||
| Income taxes paid | $ | 38,557 | $ | 144,018 | ||||
| Non-cash transactions of operating and investing activities | ||||||||
| Transfer of prepayment to intangible asset | $ | 218,678 | $ | - | ||||
| Initial recognition of right-of-use assets and lease liabilities | $ | 452,119 | $ | - | ||||
The accompanying notes are an integral part of these unaudited condensed consolidated financial statements.
SINO-GLOBAL SHIPPING AMERICA, LTD. AND AFFILIATES
NOTES TO THE CONDENSED CONSOLIDATED FINANCIAL STATEMENTS
(UNAUDITED)
Note 1. ORGANIZATION AND NATURE OF BUSINESS
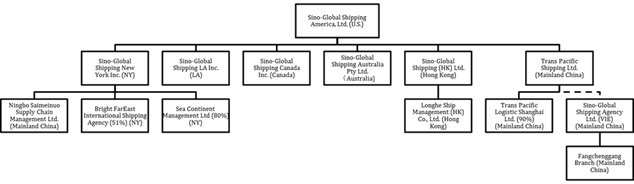
Founded in the United States (the “U.S.”) in 2001, Sino-Global Shipping America, Ltd., a Virginia corporation (“Sino-Global” or the “Company”), is a global shipping and freight logistics integrated solution provider. The Company provides tailored solutions and value-added services to its customers to drive efficiency and control in related steps throughout the entire shipping and freight logistics chain. The Company conducts its business primarily through its wholly-owned subsidiaries in the People’s Republic of China (the “PRC”) (including Hong Kong) and the U.S. where a majority of the Company’s clients are located.
The Company operates in four operating segments including (1) shipping agency and management services, which are operated by its subsidiary in Hong Kong and the U.S.; (2) inland transportation management services, which are operated by its subsidiaries in the U.S.; (3) freight logistics services, which are operated by its subsidiaries in the PRC and the U.S.; (4) container trucking services, which are operated by its subsidiaries in the PRC and the U.S.
The Company developed a mobile application which provides a full-service logistics platform for shipping operations between the U.S. and the PRC for short-haul trucking in the U.S. and in December, 2016, it signed a significant agreement with Sino-Trans Guangxi Logistics Co. Ltd. with a service period from July 1, 2017 to December 31, 2020. The Company has increased its business in the U.S. since the launch of the short haul container truck services web-based platform. The board of the directors (the “Board”) of the Company subsequently authorized the Company to upgrade its enterprise resource planning system (“ERP”) in order to manage its operations in real time throughout its multiple locations and to integrate with web applications.
On September 11, 2017, the Company set up a wholly-owned subsidiary, Ningbo Saimeinuo Supply Chain Management Ltd. (“Sino Ningbo”), via its wholly-owned entity, Sino-Global Shipping New York Inc. This subsidiary primarily engages in transportation management and freight logistics services.
Starting with fiscal year 2019, current trade dynamics make it more expensive for shipping carrier clients to cost-effectively move cargo into U.S. ports, and as a result, the Company realized lower shipping volumes and less utilization of its online platform, which has caused the Company to shift its focus back to shipping agency business. The shipping agency industry in China has improved and the number of shipping agencies in overall in the country has decreased, due to both price and the inability of competitors to embrace technology as a resource in serving client needs.
On September 3, 2018, the Company entered into a cooperation agreement with Ningbo Far-East Universal Shipping Agency Co., Ltd. to set up a joint venture in Hong Kong named Bright Far East International Shipping Agency Co., Ltd., to engage in worldwide shipping agency operations. The Company has a 51% equity interest in the joint venture. On May 23, 2019, Bright Far East International Shipping Agency Co., Ltd. incorporated in New York and terminated its registration in Hong Kong. There has been no major operation of the joint venture for the three and nine months ended March 31, 2020. Currently the Company is conducting the shipping agency business through its wholly-owned Hong Kong subsidiary.
On April 10, 2019, the Company entered into a cooperation agreement with Mr. Weijun Qin, the Chief Executive Officer of a shipping management company in China, to set up a joint venture in New York named State Priests Management Ltd. (“State Priests”), in which the Company will hold a 20% equity interest. On July 26, 2019, the Company signed a revised cooperation agreement with Mr. Weijun Qin which changed the Company’s equity interest in State Priests from 20% to 90%. The Company has not provided any cash contribution to the joint venture and there has been no operation of the joint venture pending the International Ship Safety Management Certificate from the China Classification Society (the “Certificate”). Sino-Global Shipping New York Inc. started providing shipping management related services that do not require certification which includes arranging and coordinating for ship maintenance and inspection this quarter.
On November 6, 2019, the Company signed a revised cooperation agreement with Mr. Weijun Qin to restructure their equity interest in State Priests. Given that State Priests failed to timely obtain the necessary approval from related authorities, Mr. Weijun Qin agreed to exchange 80% equity interest in Sea Continent Management Ltd. (“Sea Continent”), another New York entity Mr. Qin owns for the Company’s 90% equity interest in State Priests. The equity transfer has been consummated. Sea Continent already has the Certificate but has no operations as of March 31, 2020. There has been no capital injection nor operations of State Priests and Sea Continent as of March 31, 2020, therefore no gain or loss has been recognized in the transaction.
On January 10, 2020, the Company entered into a cooperation agreement with Mr. Shanming Liang, a shareholder of the Company, to set up a joint venture in New York named LSM Trading Ltd., in which the Company will hold a 40% equity interest. No investment has been made by the Company as of the date of this report. The new joint venture will facilitate the purchase agricultural related commodities in the U.S. for customers in China and the Company will provide comprehensive supply chain and logistics solutions.
The outbreak of the novel coronavirus (COVID-19) starting from late January 2020 in the PRC has spread rapidly to many parts of the world. In March 2020, the World Health Organization declared the COVID-19 as a pandemic and has resulted in quarantines, travel restrictions, and the temporary closure of stores and business facilities in China and the U.S. for the past few months. Given the rapidly expanding nature of the COVID-19 pandemic, and because substantially all of the Company’s business operations and its workforce are concentrated in China and the U.S., the Company’s business, results of operations, and financial condition have been adversely affected for the three and nine months ended March 31, 2020.
Note 2. SUMMARY OF SIGNIFICANT ACCOUNTING POLICIES
(a) Basis of Presentation
The accompanying unaudited condensed consolidated financial statements have been prepared in accordance with generally accepted accounting principles in the United States of America (“US GAAP”) for interim financial information pursuant to the rules and regulations of the Securities and Exchange Commission (“SEC”). The unaudited condensed consolidated financial statements include the accounts of the Company and include the assets, liabilities, revenues and expenses of the subsidiaries and VIEs. All intercompany transactions and balances have been eliminated in consolidation. Interim results are not necessarily indicative of results to be expected for the full year. The information included in this Form 10-Q should be read in conjunction with(this “Amendment”) is being filed to amend the information included in the annualquarterly report on Form 10-K10-Q for the fiscal year ended June 30,December 31, 2019 (the “Quarterly Report”) filed on September 30, 2019.
All significant intercompany transactions and balances are eliminated in consolidation.by Sino-Global Shipping AgencyAmerica, Ltd., a PRC corporation (“Sino-China”), is considered a variable interest entity (“VIE”), with the (the “Company as the primary beneficiary. The Company, through Trans Pacific Shipping Ltd., entered into certain agreements with Sino-China, pursuant to which the Company receives 90% of Sino-China’s net income.
As a VIE, Sino-China’s revenues are included in the Company’s total revenues, and any income/loss from operations is consolidated with that of the Company. Because of contractual arrangements between the Company and Sino-China, the Company has a pecuniary interest in Sino-China that requires consolidation of the financial statements of the Company and Sino-China.
The Company has consolidated Sino-China’s operating results because the entities are under common control in accordance with Accounting Standards Codification (“ASC””) 805-10, “Business Combinations”. The agency relationship between the Company and Sino-China and its branches is governed by a series of contractual arrangements pursuant to which the Company has substantial control over Sino-China. Management makes ongoing reassessments of whether the Company remains the primary beneficiary of Sino-China.
The carrying amount and classification of Sino-China’s assets and liabilities included in the Company’s unaudited condensed consolidated balance sheets were as follows:
| March 31, | June 30, | |||||||
| 2020 | 2019 | |||||||
| Current assets: | ||||||||
| Cash | $ | 5,072 | $ | 11,691 | ||||
| Other receivables | 299 | 309 | ||||||
| Prepaid expenses and other current assets | - | 4,474 | ||||||
| Total current assets | 5,371 | 16,474 | ||||||
| Deposits | 1,605 | 1,655 | ||||||
| Property and equipment, net | 44,459 | 95,765 | ||||||
| Total assets | $ | 51,435 | $ | 113,894 | ||||
| Current liabilities: | ||||||||
| Other payables and accrued liabilities | $ | 39,835 | $ | 30,175 | ||||
| Total liabilities | $ | 39,835 | $ | 30,175 | ||||
(b) Fair Value of Financial Instruments
The Company follows the provisions of ASC 820, Fair Value Measurements and Disclosures, which clarifies the definition of fair value, prescribes methods for measuring fair value, and establishes a fair value hierarchy to classify the inputs used in measuring fair value as follows:
Level 1 — Observable inputs such as unadjusted quoted prices in active markets for identical assets or liabilities available at the measurement date.
Level 2 — Inputs other than quoted prices that are observable for the asset or liability in active markets, quoted prices for identical or similar assets and liabilities in markets that are not active, inputs other than quoted prices that are observable, and inputs derived from or corroborated by observable market data.
Level 3 — Unobservable inputs that reflect management’s assumptions based on the best available information.
The carrying value of accounts receivable, other receivables, other current assets, and current liabilities approximate their fair values because of the short-term nature of these instruments.
(c) Use of Estimates and Assumptions
The preparation of the Company’s unaudited condensed consolidated financial statements in conformity with US GAAP requires management to make estimates and assumptions that affect the reported amounts of assets and liabilities and disclosure of contingent assets and liabilities at the dates of the financial statements and the reported amounts of revenues and expenses during the reporting periods. Estimates are adjusted to reflect actual experience when necessary. Significant accounting estimates reflected in the Company’s unaudited condensed consolidated financial statements include revenue recognition, fair value of stock based compensation, cost of revenues, allowance for doubtful accounts, impairment loss, deferred income taxes, income tax expense and the useful lives of property and equipment. The inputs into the Company’s judgments and estimates consider the economic implications of COVID-19 on the Company’s critical and significant accounting estimates. Since the use of estimates is an integral component of the financial reporting process, actual results could differ from those estimates.
(d) Translation of Foreign Currency
The accounts of the Company and its subsidiaries are measured using the currency of the primary economic environment in which the entity operates (the “functional currency”). The Company’s functional currency is the U.S. dollar (“USD”) while its subsidiaries in the PRC, including Sino-China, Trans Pacific Shipping Ltd. and Trans Pacific Logistic Shanghai Ltd. report their financial positions and results of operations in Renminbi (“RMB”), its subsidiary Sino-Global Shipping Australia Pty Ltd., reports its financial positions and results of operations in Australian dollar (“AUD”), its subsidiary Sino-Global Shipping Hong Kong reports its financial positions and results of operations in Hong Kong dollar (“HKD”) and its subsidiary Sino-Global Shipping Canada, Inc. reports its financial positions and results of operations in Canadian Dollar (“CAD”). The accompanying unaudited condensed consolidated financial statements are presented in USD. Foreign currency transactions are translated into USD using the fixed exchange rates in effect at the time of the transaction. Generally, foreign exchange gains and losses resulting from the settlement of such transactions are recognized in the consolidated statements of operations. The Company translates the foreign currency financial statements in accordance with ASC 830-10, “Foreign Currency Matters”. Assets and liabilities are translated at current exchange rates quoted by the People’s Bank of China at the balance sheets’ dates and revenues and expenses are translated at average exchange rates in effect during the year. The resulting translation adjustments are recorded as other comprehensive loss and accumulated other comprehensive loss as a separate component of equity of the Company, and also included in non-controlling interests.
The exchange rates as of March 31, 2020 and June 30, 2019 and for the three and nine months ended March 31, 2020 and 2019 are as follows:
| March 31, 2020 | June 30, 2019 | Three months ended March 31, | Nine months ended March 31, | |||||||||||||||||||||
| Foreign currency | Balance | Balance Sheet | 2020 Profits/Loss | 2019 Profits/Loss | 2020 Profits/Loss | 2019 Profits/Loss | ||||||||||||||||||
| RMB:1USD | 7.0799 | 6.8657 | 6.9798 | 6.7499 | 7.0130 | 6.8229 | ||||||||||||||||||
| AUD:1USD | 1.6285 | 1.4238 | 1.5209 | 1.4031 | 1.4810 | 1.3885 | ||||||||||||||||||
| HKD:1USD | 7.7509 | 7.8130 | 7.7716 | 7.8461 | 7.8091 | 7.8402 | ||||||||||||||||||
| CAD:1USD | 1.4118 | 1.3092 | 1.3417 | 1.3291 | 1.3272 | 1.3192 | ||||||||||||||||||
(e) Cash
Cash consists of cash on hand and cash in bank which are unrestricted as to withdrawal or use. The Company maintains cash with various financial institutions mainly in the PRC, Australia, Hong Kong, Canada and the U.S. As of March 31, 2020 and June 30, 2019, cash balances of $131,676 and $2,993,913, respectively, were maintained at financial institutions in the PRC. $42,189 and $2,923,972 of these balances are not covered by insurance as the deposit insurance system in China only insured each depositor at one bank for a maximum of approximately $70,000 (RMB 500,000). As of March 31, 2020 and June 30, 2019, cash balances of $4,705 and $122,017, respectively, were maintained at U.S. financial institutions, and were insured by the Federal Deposit Insurance Corporation or other programs subject to certain limitations. The Hong Kong Deposit Protection Board pays compensation up to a limit of HKD $500,000 (approximately $64,000) if the bank with which an individual/a company holds its eligible deposit fails. As of March 31, 2020 and June 30, 2019, cash balances of $865 and $4,386, respectively, were maintained at financial institutions in Hong Kong and were insured by the Hong Kong Deposit Protection Board. As of March 31, 2020 and June 30, 2019, amount of deposits the Company had covered by insurance amounted to $96,313 and $198,165, respectively.
(f) Notes receivable
Notes receivable represents trade accounts receivable due from various customers where the customers’ banks have guaranteed the payment. The notes are non-interest bearing and normally paid within three to six months. The Company has the ability to submit request for payment to the customer’s bank earlier than the scheduled payment date, but will incur an interest charge and a processing fee.
(g) Receivables and Allowance for Doubtful Accounts
Accounts receivable are presented at net realizable value. The Company maintains allowances for doubtful accounts and for estimated losses. The Company reviews the accounts receivable on a periodic basis and makes general and specific allowances when there is doubt as to the collectability of individual receivable balances. In evaluating the collectability of individual receivable balances, the Company considers many factors, including the age of the balances, customers’ historical payment history, their current credit-worthiness and current economic trends. Receivables are generally considered past due after 180 days. The Company reserves 25%-50% of the customers balance aged between 181 days to 1 year, 50%-100% of the customers balance over 1 year and 100% of the customers balance over 2 years. Accounts receivable are written off against the allowances only after exhaustive collection efforts. As the Company has focused its development in the shipping management segment, its customer base will be more from smaller privately owned companies that will pay more timely than state owned companies. The Company also considers the economic implications of COVID-19 on its estimates of the allowance and made additional $3,121,416 and $4,428,108 of allowance for doubtful accounts and wrote off $3,255,938 of accounts receivable for the three and nine months ended March 31,July 6, 2020. There was no write off for three and nine months ended March 31, 2019. The Company recovered nil and $99,366 of accounts receivable for the three and nine months ended March 31, 2020. There was no recovery for three and nine months ended March 31, 2019.
Other receivables represent mainly customer advances, prepaid employee insurance and welfare benefits, which will be subsequently deducted from the employee payroll, guarantee deposits on behalf of ship owners as well as office lease deposits. Management reviews its receivables on a regular basis to determine if the bad debt allowance is adequate, and adjusts the allowance when necessary. Delinquent account balances are written-off against allowance for doubtful accounts after management has determined that the likelihood of collection is not probable. Other receivables are written off against the allowances only after exhaustive collection efforts. For the three and nine months ended March 31, 2020, nil and $1,763 was written off against other receivables, respectively. There was no write off for the three and nine months ended March 31, 2019.
(h) Property and Equipment, net
Property and equipment are stated at historical cost less accumulated depreciation. Historical cost comprises its purchase price and any directly attributable costs of bringing the assets to its working condition and location for its intended use. Depreciation is calculated on a straight-line basis over the following estimated useful lives:
The carrying value of a long-lived asset is considered impaired by the Company when the anticipated undiscounted cash flows from such asset is less than its carrying value. If impairment is identified, a loss is recognized based on the amount by which the carrying value exceeds the fair value of the long-lived asset. Fair value is determined primarily using the anticipated cash flows discounted at a rate commensurate with the risk involved or based on independent appraisals. There was no impairment for the three months ended March 31, 2020 and 2019. For the nine months ended March 31, 2020 and 2019, an impairment of $127,177 and nil were recorded, respectively.
(i) Intangible Assets, net
Intangible assets are recorded at cost less accumulated amortization. Amortization is calculated on a straight-line basis over the following estimated useful lives:
The Company evaluates intangible assets for impairment whenever events or changes in circumstances indicate that the assets might be impaired. There was no impairment for the three months ended March 31, 2020 and 2019. For the nine months ended March 31, 2020 and 2019, an impairment of $200,455 and nil were recorded, respectively.
(j) Revenue Recognition
The Company recognizes revenue which represents the transfer of goods and services to customers in an amount that reflects the consideration to which the Company expects to be entitled in such exchange. The Company identifies contractual performance obligations and determines whether revenue should be recognized at a point in time or over time, based on when control of goods and services transfers to a customer. The Company’s revenue streams are recognized at a point in time.
The Company uses a five-step model to recognize revenue from customer contracts. The five-step model requires that the Company (i) identify the contract with the customer, (ii) identify the performance obligations in the contract, (iii) determine the transaction price, including variable consideration to the extent that it is probable that a significant future reversal will not occur, (iv) allocate the transaction price to the respective performance obligations in the contract, and (v) recognize revenue when (or as) the Company satisfies the performance obligation.
The Company continues to derive its revenues from sales contracts with its customers with revenues being recognized upon performance of services. Persuasive evidence of an arrangement is demonstrated via sales contract and invoice; and the sales price to the customer is fixed upon acceptance of the sales contract and there is no separate sales rebate, discount, or other incentive. The Company’s revenues are recognized at a point in time after all performance obligations are satisfied.
As of March 31, 2020, the Company had outstanding contracts amounting to approximately $1.4 million, all of which is expected to be completed within 3 months from March 31, 2020.
Revenues by segments:
| For the Three Months Ended | For the Nine Months Ended | |||||||||||||||
| March 31, | March 31, | March 31, | March 31, | |||||||||||||
| 2020 | 2019 | 2020 | 2019 | |||||||||||||
| Shipping and management agency services | $ | 500,000 | $ | 956,583 | $ | 1,500,000 | $ | 1,845,653 | ||||||||
| Inland transportation management services | - | 129,787 | - | 1,469,787 | ||||||||||||
| Freight logistics services | 853,979 | 21,599,675 | 3,599,620 | 36,066,151 | ||||||||||||
| Container trucking services | - | 87,094 | 61,709 | 406,368 | ||||||||||||
| Total | $ | 1,353,979 | $ | 22,773,139 | $ | 5,161,329 | $ | 39,787,959 | ||||||||
| ||
|
(k) Taxation
Because the Company and its subsidiaries and Sino-China were incorporated in different jurisdictions, they file separate income tax returns. The Company uses the asset and liability method of accounting for income taxes in accordance with U.S. GAAP. Deferred taxes, if any, are recognized for the future tax consequences of temporary differences between the tax basis of assets and liabilities and their reported amounts in the consolidated financial statements. A valuation allowance is provided against deferred tax assets if it is more likely than not that the asset will not be utilized in the future.
The Company recognizes the tax benefit from an uncertain tax position only if it is more likely than not that the tax position will be sustained on examination by the taxing authorities, based on the technical merits of the position. The Company recognizes interest and penalties, if any, related to unrecognized tax benefits as income tax expense. The Company had no uncertain tax positions as of March 31, 2020 and June 30, 2019.
Income tax returns for the years prior to 2016 are no longer subject to examination by U.S. tax authorities.
PRC Enterprise Income Tax
PRC enterprise income tax is calculated based on taxable income determined under the PRC Generally Accepted Accounting Principles (“PRC GAAP”) at 25%. Sino-China and Trans Pacific are registered in PRC and governed by the Enterprise Income Tax Laws of the PRC.
PRC Value Added Taxes and Surcharges
The Company is subjectfiling this Amendment solely to value added tax (“VAT”). Revenue from services provided byadd disclosure that, in originally filing the Company’s PRC subsidiaries and affiliates, including Sino-China and Trans Pacific are subject to VAT at rates ranging from 9% to 13%. Entities that are VAT general taxpayers are allowed to offset qualified VAT paid to suppliers against their VAT liability. Net VAT liability is recorded in taxes payableQuarterly Report, the Company relied on the unaudited condensed consolidated balance sheets.
In addition, under the PRC regulations, the Company’s PRC subsidiaries and affiliates are required to pay the city construction tax (7%) and education surcharges (3%) based on the net VAT payments.
(l) Earnings (loss) per Share
Basic earnings (loss) per share is computed by dividing net income (loss) attributable to holders of common stockorder of the Company by the weighted average number of shares of common stock of the Company outstanding during the applicable period. Diluted earnings (loss) per share reflect the potential dilution that could occur if securities or other contracts to issue common stock of the Company were exercised or converted into common stock of the Company. Common stock equivalents are excluded from the computation of diluted earnings per share if their effects would be anti-dilutive.
For the three and nine months ended March 31, 2020 and 2019, there was no dilutive effect of potential shares of common stock of the Company because the Company generated a net loss.
(m) Comprehensive Income (Loss)
The Company reports comprehensive income (loss) in accordance with the authoritative guidance issued by Financial Accounting Standards Board (the “FASB”) which establishes standards for reporting comprehensive income (loss) and its component in financial statements. Other comprehensive income (loss) refers to revenue, expenses, gains and losses that under US GAAP are recorded as an element of Stockholders’ equity but are excluded from net income. Other comprehensive income (loss) consists of a foreign currency translation adjustment resulting from the Company not using the U.S. dollar as its functional currencies.
(n) Stock-based Compensation
The Company accounts for stock-based compensation awards to employees in accordance with FASB ASC Topic 718, “Compensation – Stock Compensation”, which requires that stock-based payment transactions with employees be measured based on the grant-date fair value of the equity instrument issued and recognized as compensation expense over the requisite service period. The Company records stock-based compensation expense at fair value on the grant date and recognizes the expense over the employee’s requisite service period.
The Company accounts for stock-based compensation awards to non-employees in accordance with FASB ASC Topic 718 amended by ASU 2018-07. Under FASB ASC Topic 718, stock compensation granted to non-employees has been determined as the fair value of the consideration received or the fair value of equity instrument issued, whichever is more reliably measured and is recognized as an expense as the goods or services are received.
Valuations of stock based compensation are based upon highly subjective assumptions about the future, including stock price volatility and exercise patterns. The fair value of share-based payment awards was estimated using the Black-Scholes option pricing model. Expected volatilities are based on the historical volatility of the Company’s stock. The Company uses historical data to estimate option exercise and employee terminations. The expected term of options granted represents the period of time that options granted are expected to be outstanding. The risk-free rate for periods within the expected life of the option is based on the U.S. Treasury yield curve in effect at the time of the grant.
12
(o) Risks and Uncertainties
The Company’s business, financial position and results of operations may be influenced by the political, economic, health and legal environments in the PRC, as well as by the general state of the PRC economy. The Company’s operations in the PRC are subject to special considerations and significant risks not typically associated with companies in North America and Western Europe. These include risks associated with, among others, the political, economic, health and legal environments and foreign currency exchange. The Company’s results may be adversely affected by changes in the political, regulatory and social conditions in the PRC, and by changes in governmental policies or interpretations with respect to laws and regulations, anti-inflationary measures, currency conversion, remittances abroad, and rates and methods of taxation, among other things.
In March 2020, the World Health Organization declared the COVID-19 as a pandemic. Given the rapidly expanding nature of the COVID-19 pandemic, and because substantially all of the Company’s business operations and our workforce are concentrated in China and United States, the Company’s business, results of operations, and financial condition could be adversely affected for the rest of fiscal year 2020 and beyond.
(p) Liquidity
In assessing the Company’s liquidity, the Company monitors and analyzes its cash on-hand and its operating and capital expenditure commitments. The Company’s liquidity needs are to meet its working capital requirements, operating expenses and capital expenditure obligations. As of March 31, 2020, the Company’s working capital was approximately $3.5 million and the Company had cash of approximately $0.1 million. The Company plans to fund continuing operations through identifying new prospective joint venture partners and strategic alliance opportunities for new revenue sources, and by reducing costs to improve profitability and replenish working capital. The Company’s ability to fulfill its current obligations will depend on the future realization of its current assets and the future revenues generated from its operations.
The Company expects to realize the balance of its current assets within the normal operating cycle of a twelve month period. If the Company is unable to realize its current assets within the normal operating cycle of a twelve month period, the Company may have to consider supplementing its available sources of funds through the following sources:
Based on the above considerations, the Company’s management is of the opinion that it may not have sufficient funds to meet the Company’s working capital requirements and current liabilities as they become due one year from issuance of these financial statements. There is no assurance that management will be successful in their plans. There are a number of factors that could potentially arise that could undermine the Company’s plans, such as changes in the PRC government policy, economic conditions, and competitive pricing in the industries that the Company operates in. In addition, the recent outbreak of new coronavirus pandemic posed disruption and restrictions on its operations and those of the Company’s customers which not only negatively impact the Company’s financial conditions but also slowed down the macro-economic development worldwide. If management is unable to execute this plan, there would likely be a material adverse effect on the Company’s business.
The management has considered whether there is substantial doubt about its ability to continue as a going concern due to 1) the Company’s recurring losses from operations, including approximately $5.9 million net loss attributable to the Company’s stockholders for the nine months ended March 31, 2020, 2) accumulated deficit of approximately $12.8 million as of March 31, 2020, and 3) has negative operating cash flows of approximately $3.6 million for the nine months ended March 31, 2020. All of these factors raise substantial doubt about the ability of the Company to continue as a going concern.
(q) Recent Accounting Pronouncements
Pronouncements adopted
In February 2016, the FASB issued Accounting Standards Update (“ASU”) No. 2016-02, Leases (Topic 842), to increase the transparency and comparability about leases among entities. The new guidance requires lessees to recognize a lease liability and a corresponding lease asset for virtually all lease contracts. It also requires additional disclosures about leasing arrangements. ASU 2016-02 is effective for interim and annual periods beginning after December 15, 2018, and requires a modified retrospective approach to adoption assuming the Company will remain an emerging growth company at that date. Early adoption is permitted. In September 2017, the FASB issued ASU No. 2017-13, which to clarify effective dates that public business entities and other entities were required to adopt ASC Topic 842 for annual reporting. A public business entity that otherwise would not meet the definition of a public business entity except for a requirement to include or the inclusion of its financial statements or financial information in another entity’s filing with the SEC adopting ASC Topic 842 for annual reporting periods beginning after December 15, 2019, and interim reporting periods within annual reporting periods beginning after December 15, 2020. ASU No. 2017-13 also amended that all components of a leveraged lease be recalculated from inception of the lease based on the revised after tax cash flows arising from the change in the tax law, including revised tax rates. The difference between the amounts originally recorded and the recalculated amounts must be included in income of the year in which the tax law is enacted. The Company adopted this ASU in the first quarter of fiscal year 2020 using modified retrospective transition approach at the beginning of the period of adoption. The Company recognized lease labilities of approximately $0.3 million, with corresponding right-of use (“ROU”) assets of approximately the same amount based on the present value of the future minimum rental payments of leases, using a weighted average discount rate of approximately 9.12%.
On July 1, 2019, the Company adopted ASU 2018-07 where awards to nonemployees are measured by estimating the fair value of the equity instruments to be issued. The amendments specify that Topic 718 applies to all share-based payment transactions in which a grantor acquires goods or services to be used or consumed in a grantor’s own operations by issuing share-based payment awards which superseded ASU 505-50. The ASU is required to be applied on a prospective basis to all new awards granted after the date of adoption. The Company adopted this ASU on July 1, 2019 and the adoption has no significant impact to the Company’s unaudited condensed consolidated financial statements as a whole.
On July 13, 2017, the FASB issued ASU 2017-11, Earnings Per Share (Topic 260), Distinguishing Liabilities from Equity (Topic 480), Derivatives and Hedging (Topic 815): I. Accounting for Certain Financial Instruments with Down Round Features and II. Replacement of the Indefinite Deferral for Mandatorily Redeemable Financial Instruments of Certain Nonpublic Entities and Certain Mandatorily Redeemable Noncontrolling Interests with a Scope Exception. Part I applies to entities that issue financial instruments such as warrants, convertible debt or convertible preferred stock that contain down round features. Part II does not have accounting impact. The ASU is effective for the Company for annual and interim reporting periods beginning July 1, 2019. The Company adopted this ASU on July 1, 2019 and determined the adoption of this ASU did not have a material effect on the Company’s unaudited condensed consolidated financial statements.
Pronouncements not yet adopted
In August 2018, the FASB issued ASU 2018-13, “Fair Value Measurement (Topic 820): Disclosure Framework—Changes to the Disclosure Requirements for Fair Value Measurement” (“ASU 2018-13”). ASU 2018-13 removes, modifies and adds certain disclosure requirements in Topic 820 “Fair Value Measurement”. ASU 2018-13 eliminates certain disclosures related to transfers and the valuations process, modifies disclosures for investments that are valued based on net asset value, clarifies the measurement uncertainty disclosure, and requires additional disclosures for Level 3 fair value measurements. ASU 2018-13 is effective for the Company for annual and interim reporting periods beginning July 1, 2020. The Company does not believe the adoption of this ASU will have a material effect on the Company’s unaudited condensed consolidated financial statements.
In May 2019, the FASB issued ASU 2019-05, which is an update to ASU Update No. 2016-13, Financial Instruments—Credit Losses (Topic 326): Measurement of Credit Losses on Financial Instruments, which introduced the expected credit losses methodology for the measurement of credit losses on financial assets measured at amortized cost basis, replacing the previous incurred loss methodology. The amendments in Update 2016-13 added Topic 326, Financial Instruments—Credit Losses, and made several consequential amendments to the Codification. Update 2016-13 also modified the accounting for available-for-sale debt securities, which must be individually assessed for credit losses when fair value is less than the amortized cost basis, in accordance with Subtopic 326-30, Financial Instruments— Credit Losses—Available-for-Sale Debt Securities. The amendments in this ASU address those stakeholders’ concerns by providing an option to irrevocably elect the fair value option for certain financial assets previously measured at amortized cost basis. For those entities, the targeted transition relief will increase comparability of financial statement information by providing an option to align measurement methodologies for similar financial assets. Furthermore, the targeted transition relief also may reduce the costs for some entities to comply with the amendments in Update 2016-13 while still providing financial statement users with decision-useful information. In November 2019, the FASB issued ASU No. 2019-10, which to update the effective date of ASU No. 2016-13 for private companies, not-for-profit organizations and certain smaller reporting companies applying for credit losses standard. The new effective date for these preparers is for fiscal years beginning after July 1, 2023, including interim periods within those fiscal years. The Company has not early adopted this update and it will become effective on July 1, 2023 assuming the Company will remain eligible to be smaller reporting company. The Company is currently evaluating the impact of this new standard on Company's consolidated financial statements and related disclosures. The Company is currently evaluating the impact of this new standard on its unaudited condensed consolidated financial statements and related disclosures.
In December 2019, the FASB issued ASU 2019-12, “Income Taxes (Topic 740): Simplifying the Accounting for Income Taxes”. The amendments in this Update simplify the accounting for income taxes by removing certain exceptions to the general principles in Topic 740. The amendments also improve consistent application of and simplify GAAP for other areas of Topic 740 by clarifying and amending existing guidance. ASU 2019-12 is effective for the Company for annual and interim reporting periods beginning July 1, 2021. Early adoption of the amendments is permitted, including adoption in any interim period for public business entities for periods for which financial statements have not yet been issued. An entity that elects to early adopt the amendments in an interim period should reflect any adjustments as of the beginning of the annual period that includes that interim period. Additionally, an entity that elects early adoption must adopt all the amendments in the same period. The Company is currently evaluating the impact of this new standard on Company’s unaudited condensed consolidated financial statements and related disclosures.
The Company does not believe other recently issued but not yet effective accounting standards, if currently adopted, would have a material effect on the Company’s unaudited condensed consolidated financial statements.
(r) Reclassification
Certain prior year amounts have been reclassified to conform to the current year presentation mainly reclassifying advances to suppliers to other receivables (see Note 4 and 5). These reclassifications have no effect on the reported revenues, net loss or total assets.
Note 3. ACCOUNTS RECEIVABLE, NET
The Company’s net accounts receivable are as follows:
| March 31, | June 30, | |||||||
| 2020 | 2019 | |||||||
| Trade accounts receivable | $ | 8,405,601 | $ | 12,716,120 | ||||
| Less: allowances for doubtful accounts | (6,659,929 | ) | (5,670,274 | ) | ||||
| Accounts receivable, net | $ | 1,745,672 | $ | 7,045,846 | ||||
Movement of allowance for doubtful accounts are as follows:
| March 31, 2020 | June 30, 2019 | |||||||
| Beginning balance | $ | 5,670,274 | $ | 1,682,228 | ||||
| Provision for doubtful accounts | 4,428,108 | 4,091,056 | ||||||
| Less: write-off/recovery | (3,355,304 | ) | (88,882 | ) | ||||
| Exchange rate effect | (83,149 | ) | (14,128 | ) | ||||
| Ending balance | $ | 6,659,929 | $ | 5,670,274 | ||||
For the three months ended March 31, 2020 and 2019, the provision for doubtful accounts was $3,121,416 and $1,608,454, respectively. For the nine months ended March 31, 2020 and 2019, the provision for doubtful accounts was $4,428,108 and $3,005,405, respectively. The Company recovered nil and $99,366 of accounts receivable for the three and nine months ended March 31, 2020. There was no recovery for three and nine months ended March 31, 2019. The Company wrote off $3,255,938 of accounts receivable for the three and nine months ended March 31, 2020. There was no write off for three and nine months ended March 31, 2019.
Note 4. OTHER RECEIVABLES
The Company’s other receivables are as follows:
| March 31, | June 30, | |||||||
| 2020 | 2019 | |||||||
| Advances to customers* | $ | 9,983,979 | $ | 4,237,270 | ||||
| Employee business advances | 52,119 | 54,953 | ||||||
| Security deposit | - | 43,492 | ||||||
| Total | 10,036,098 | 4,335,715 | ||||||
| Less: current portion | (6,486,140 | ) | (4,335,715 | ) | ||||
| Total noncurrent portion | $ | 3,549,958 | $ | - | ||||
Note 5. ADVANCES TO SUPPLIERS
The Company’s advances to suppliers – third parties are as follows:
| March 31, | June 30, | |||||||
| 2020 | 2019 | |||||||
| Freight fees (1) | $ | 112,037 | $ | 123,767 | ||||
| Port fees | - | 373 | ||||||
| Total advances to suppliers-third parties | $ | 112,037 | $ | 124,140 | ||||
Note 6. PREPAID EXPENSES AND OTHER CURRENT ASSETS
The Company’s prepaid expenses and other assets are as follows:
| March 31, | June 30, | |||||||
| 2020 | 2019 | |||||||
| Prepaid income taxes | $ | 48,924 | $ | 35,129 | ||||
| Other (including prepaid insurance, rent, listing fees) | 115,700 | 69,925 | ||||||
| Deposit for ERP (1) | - | 218,678 | ||||||
| Prepaid leasing and service fees (2) | 75,206 | 300,825 | ||||||
| Total | 239,830 | 624,557 | ||||||
| Less: current portion | (239,830 | ) | (105,054 | ) | ||||
| Total noncurrent portion | $ | - | $ | 519,503 | ||||
Note 7. OTHER LONG-TERM ASSETS - DEPOSITS
The Company’s other long-term assets – deposits are as follows:
| March 31, | June 30, | |||||||
| 2020 | 2019 | |||||||
| Rental and utilities deposits | $ | 52,517 | $ | 60,435 | ||||
| Freight logistics deposits (1) | 2,904,285 | 2,994,271 | ||||||
| Total other long-term assets - deposits | $ | 2,956,802 | $ | 3,054,706 | ||||
17
Note 8. PROPERTY AND EQUIPMENT, NET
The Company’s net property and equipment as follows:
| March 31, | June 30, | |||||||
| 2020 | 2019 | |||||||
| Buildings | $ | 190,121 | $ | 196,050 | ||||
| Motor vehicles* | 515,870 | 700,724 | ||||||
| Computer equipment* | 96,677 | 162,865 | ||||||
| Office equipment* | 43,496 | 69,278 | ||||||
| Furniture and fixtures* | 71,548 | 167,143 | ||||||
| System software* | 107,686 | 116,339 | ||||||
| Leasehold improvements | 785,103 | 807,078 | ||||||
| Total | 1,810,501 | 2,219,477 | ||||||
| Less: Accumulated depreciation and amortization | (1,221,987 | ) | (1,229,567 | ) | ||||
| Property and equipment, net | $ | 588,514 | $ | 989,910 | ||||
Depreciation and amortization expenses for the three months ended March 31, 2020 and 2019 were $67,320 and $28,200, respectively. Depreciation and amortization expenses for the nine months ended March 31, 2020 and 2019 were $254,549 and $47,813, respectively.
Note 9. INTANGIBLE ASSETS, NET
Net intangible assets consisted of the following:
| March 31, | June 30, | |||||||
| 2020 | 2019 | |||||||
| Full service logistics platforms | $ | 190,000 | $ | 190,000 | ||||
| Less: Accumulated amortization | (147,778 | ) | (100,278 | ) | ||||
| Intangible assets, net | $ | 42,222 | $ | 89,722 | ||||
The full service logistics platform was placed in services in December 2017. The platforms are being amortized over three years. Amortization expenses amounted to $15,833 and $15,833 for the three months ended March 31, 2020 and 2019, respectively. Amortization expenses amounted to $65,723 and $47,500 for the nine months ended March 31, 2020 and 2019, respectively.
In addition, first phase of the ERP system (see more details in Note 6) was placed in use in July 2019 and is being amortized over three years. However, due to the continued decrease in revenues from the inland transportation management segment, the Company recorded an impairment of nil and $200,455 for the three and nine months ended March 31, 2020, no impairment was recorded for same period 2019.
Note 10. LEASES
The Company determines if a contract contains a lease at inception. US GAAP requires that the Company’s leases be evaluated and classified as operating or finance leases for financial reporting purposes. The classification evaluation begins at the commencement date and the lease term used in the evaluation includes the non-cancellable period for which the Company has the right to use the underlying asset, together with renewal option periods when the exercise of the renewal option is reasonably certain and failure to exercise such option which result in an economic penalty. All of the Company’s leases are classified as operating leases.
The Company has several vehicle lease agreements and office lease agreements with lease terms ranging from two to three years. Upon adoption of ASU 2016-02, the Company recognized lease labilities of approximately $0.3 million, with corresponding ROU assets of approximately the same amount based on the present value of the future minimum rental payments of leases, using a weighted average discount rate of approximately 9.12%. As of March 31, 2020, ROU assets and lease labilities amounted to $337,899 and $333,685 (including $156,190 from lease liabilities current portion and $177,495 from lease liabilities noncurrent portion), respectively.
The Company’s lease agreements do not contain any material residual value guarantees or material restrictive covenants. The leases generally do not contain options to extend at the time of expiration and the weighted average remaining lease terms are 2.17 years.
For the three months ended March 31, 2020 and 2019, rent expense amounted to approximately $65,000 and $58,000, respectively. For the nine months ended March 31, 2020 and 2019, rent expense amounted to approximately $223,000 and $171,000, respectively.
The three-year maturity of the Company’s lease obligations is presented below:
| Twelve Months Ending March 31, | Operating Lease Amount | |||
| 2021 | $ | 180,912 | ||
| 2022 | 153,185 | |||
| 2023 | 36,764 | |||
| Total lease payments | 370,861 | |||
| Less: Interest | (37,176 | ) | ||
| Present value of lease liabilities | $ | 333,685 | ||
Note 11. EQUITY
Stock issuance:
The Company’s outstanding warrants are classified as equity since they qualify for exception from derivative accounting as they are considered to be indexed to the Company’s own stock and require net share settlement. The fair value of the warrants of $881,750 is valued based on the Black-Scholes-Merton model and is recorded as additional paid-in capital from common stock based on the relative fair value of proceeds received using the following assumptions:
Following is a summary of the status of warrants outstanding and exercisable as of March 31, 2020:
| Shares | Weighted Average Exercise Price | |||||||
| Warrants outstanding, as of June 30, 2019 | 2,000,000 | $ | 1.75 | |||||
| Issued | - | - | ||||||
| Exercised | - | - | ||||||
| Expired | - | - | ||||||
| Warrants outstanding, as of March 31, 2020 | 2,000,000 | $ | 1.75 | |||||
| Warrants exercisable, as of March 31, 2020 | 2,000,000 | $ | 1.75 | |||||
| Warrants Outstanding | Warrants Exercisable | Weighted Average Exercise Price | Average Remaining Contractual Life | |||||||
| 2018 Series A, 2,000,000 | 2,000,000 | $ | 1.75 | 3.45 years | ||||||
On November 13, 2019, the Company entered into a cooperation agreement with Shanming Liang, a director of Guangxi Jinqiao Industrial Group Co., Ltd., to cooperate and expand the bulk cargo container services business. Shanming Liang agreed to purchase 1,000,000 shares of the Company’s common stock at a purchase price of $1.00 per share for aggregate proceeds of $1 million. The Company and Mr. Liang further entered into a Share Purchase Agreement on November 14, 2019 to memorialize the transaction aforementioned. Pursuant to the aforementioned agreement, the Company received proceeds of $885,946 in the second and third quarters of fiscal year 2020. On April 23, 2020, the Company received proceeds of $50,000. The rest of the payment is expected to receive by the end of the last quarter of fiscal year 2020.
On December 9, 2019, the Company authorized the cancellation of the 175,497 of the Company’s treasury shares. The shares were cancelled as of March 31, 2020. The cancellation has no effect on the Company's total shareholders' equity and earnings per share.
Stock based compensation:
In March 2017, the Company entered into a consulting and advisory services agreement with a consulting entity, which provides management consulting services that include marketing program design and implementation and cooperative partner selection and management. The service period began in March 2017 and will end in February 2020. The Company issued 250,000 shares of common stock as remuneration for the services, which were issued as restricted shares at $2.53 per share on March 22, 2017 to the consultant. These shares were valued at $632,500 and the consulting expense was $35,139 and $140,556 for the three and nine months ended March 31, 2020, respectively. $52,708 and $158,125 were recorded as compensation expense for the three and nine months ended March 31, 2019, respectively.
On October 23, 2017, the Company issued to its employees 130,000 shares of its restricted common stock valued at $2.80 per share. One quarter of the total number of common stock became vested on each of November 16, 2017, February 16, 2018, May 16, 2018 and August 16, 2018. $0 and $91,000 were recorded as compensation expense for the three and nine months ended March 31, 2019, respectively.
On October 27, 2017, the Company issued 200,000 shares of restricted common stock on the grant date with an aggregated fair value of $548,000 to a consulting company pursuant to a consulting agreement. The scope of services primarily covered advising on business development, strategic planning and compliance during the one-year service period from October 17, 2017 to October 16, 2018. $0 and $137,000 were recorded as compensation expense for the three and nine months ended March 31, 2019, respectively.
On June 7, 2018, the Company issued 400,000 shares of common stock with a fair value of $508,000 to a consulting entity pursuant to a service agreement. The scope of services primarily covers legal consultation in PRC during the two-year service period from July 2018 to June 2020. The consulting entity is entitled to be granted the common stock on a quarterly basis in eight equal instalments. The Company recorded compensation expense of $63,500 and $190,500 for the three and nine months ended March 31, 2020 and 2019, respectively. The rest of shares were subsequently issued in the last quarter of fiscal year 2020.
On September 21, 2018, the Company issued 430,000 shares of common stock valued at $1.10 per share on the grant date with an aggregated fair value of $473,000 under the 2014 Stock Incentive Plan (the “Plan”) to three employees, vesting immediately. The Company recorded compensation expense of $0 and $473,000 for the three and nine months ended March 31, 2019, respectively.
On December 11, 2018, the Company issued 200,000 shares of common stock valued at $0.89 per share on the grant date with a fair value of $178,000 under the 2014 Stock Incentive Plan to three employees, vesting immediately. The Company recorded compensation expense of $0 and $178,000 for the three and nine months ended March 31, 2019.
On November 7, 2018, the Board of the Company approved the issuance of 50,000 shares of restricted common stock to a consultant pursuant to an existing consulting agreement. The scope of services primarily covers advising on business development, strategic planning and corporate finance. The grant’s fair value of approximately $65,000 was amortized during the remaining service period from November 3, 2018 to May 2, 2019. The Company recorded compensation expense of $32,500 and $54,167 for the three and nine months ended March 31, 2019.
On December 31, 2018, the Board of the Company and the Compensation Committee of the Board (the “Committee”) approved (i) an increase in the annual salaries of Lei Cao, Chief Executive Officer, Tuo Pan, acting Chief Financial Officer, and Zhikang Huang, Chief Operating Officer (the “C-Level Executives”), effective January 1, 2019, and (ii) a one-time award of a total of 950,000 of the common stock from the shares reserved under the Company’s 2014 Stock Incentive Plan (the “Plan”) to the C-Level Executives, Chief Technology Officer, Yafei Li and the following members of the Board, effective December 31, 2018, for their valuable contributions to the Company in fiscal 2018: Jing Wang, Tieliang Liu and Bradley A. Haneberg. The Committee recommended and the Board determined to make the following stock grants under the Plan: (i) Chief Executive Officer, Lei Cao, is entitled to a one-time stock award grant of 400,000 shares, (ii) acting Chief Financial Officer, Tuo Pan, is entitled to a one-time stock award grant of 140,000 shares, (iii) Chief Operating Officer, Zhikang Huang, is entitled to a one-time stock award grant of 180,000 shares, (iv) Chief Technology Officer, Yafei Li is entitled to a one-time stock award grant of 80,000 shares, (v) Board member Jing Wang is entitled to a one-time stock award grant of 50,000 shares, (vi) Board member Tieliang Liu is entitled to a one-time stock award grant of 50,000 shares and (vii) Board member Bradley A. Haneberg is entitled to a one-time stock award grant of 50,000 shares. The Company recorded compensation expense of $0 and $731,500 for the three and nine months ended March 31, 2019.
On April 8, 2019, the Company entered into a consulting services agreement with a consulting entity, which provides management consulting and advisory services. The scope of services primarily covered advising on business development, strategic planning and compliance during the six months service period from April 8, 2019 to October 7, 2019. The Company issued 300,000 shares of common stock as remuneration for the services, which were issued as restricted shares at $0.85 per share on April 16, 2019 to the consulting entity. These shares were valued at $255,000. The Company recorded compensation expense of $0 and $127,500 for the three and nine months ended March 31, 2020, respectively.
On July 1, 2019, the Company issued 600,000 restricted shares of common stock with a fair value of $432,000 to a China-based company that specializes in the port agency business and/or its designees pursuant to a consulting service agreement. The scope of services primarily covers business consultation for one year from July 1, 2019 to June 30, 2020. The Company can terminate the agreement if they are not satisfy with the performance of the consulting firm and the consulting firm should return all the issued shares. The Company recorded compensation expense of $108,000 and $324,000 for the three and nine months ended March 31, 2020, respectively. The rest of shares were subsequently vested in the last quarter of fiscal year 2020.
Included in a Board resolution dated January 30, 2016, the Company’s CEO is authorized to grant to the employees up to one million shares under the Plan. On July 22, 2019, the Company granted 90,000 shares of restricted common stock valued at $0.70 per share on the grant date with an aggregated fair value of $63,000 under the Plan to one employee, vesting immediately. The Company recorded compensation expense of $0 and $63,000 for the three and nine months ended March 31, 2020, respectively.
On August 26, 2019, the Company issued 40,000 shares of common stock valued at $0.72 per share on the grant date with an aggregated fair value of $28,800 to Chineseinvestors.com as settlement of a breach of service contract lawsuit. The Company recorded compensation expense of $28,800 for the three and nine months ended March 31, 2020, respectively.
On October 3, 2019, the Company issued 230,000 shares of common stock valued at $0.68 per share on the grant date with an aggregated fair value of $156,400 under the Plan to one employee, vesting immediately. The Company recorded compensation expense of $0 and $156,400 for the three and nine months ended March 31, 2020, respectively.
On October 14, 2019, the Company entered into a consulting services agreement with a consulting entity, which provides management consulting and advisory services. The scope of services primarily covered advising on business development, strategic planning and compliance during the six months service period from October 14, 2019 to April 13, 2020. The Company issued 300,000 shares of common stock valued at $222,000 as remuneration for the services. The shares bear a standard restrictive legend under the Securities Act of 1933, as amended. The Company recorded compensation expense of $111,000 and $222,000 for the three and nine months ended March 31, 2020, respectively.
During the three months ended March 31, 2020 and 2019, $346,439 and $148,708 were recorded as stock-based compensation expense, respectively. During the nine months ended March 31, 2020 and 2019, $1,252,756 and $2,013,292 were recorded as stock-based compensation expense, respectively.
Stock Options:
A summary of the outstanding options is presented in the table below:
| Options | Weighted Average Exercise Price | |||||||
| Options outstanding, as of June 30, 2019 | 85,000 | $ | 1.21 | |||||
| Granted | - | - | ||||||
| Exercised | - | - | ||||||
| Cancelled, forfeited or expired | - | - | ||||||
| Options outstanding, as of March 31, 2020 | 85,000 | $ | 1.21 | |||||
| Options exercisable, as of March 31, 2020 | 85,000 | $ | 1.21 | |||||
Following is a summary of the status of options outstanding and exercisable at March 31, 2020:
| Outstanding Options | Exercisable Options | |||||||||||||||||
| Exercise Price | Number | Average Remaining Contractual Life | Average Exercise Price | Number | Average Remaining Contractual Life | |||||||||||||
| $ | 2.01 | 10,000 | 2.84 years | $ | 2.01 | 10,000 | 2.84 years | |||||||||||
| $ | 1.10 | 75,000 | 1.32 years | $ | 1.10 | 75,000 | 1.32 years | |||||||||||
| 85,000 | 85,000 | |||||||||||||||||
Note 12. NON-CONTROLLING INTEREST
The Company’s non-controlling interest consists of the following:
| March 31, | June 30, | |||||||
| 2020 | 2019 | |||||||
| Sino-China: | ||||||||
| Original paid-in capital | $ | 356,400 | $ | 356,400 | ||||
| Additional paid-in capital | 1,044 | 1,044 | ||||||
| Accumulated other comprehensive income | 384,725 | 268,297 | ||||||
| Accumulated deficit | (6,195,826 | ) | (6,066,145 | ) | ||||
| (5,453,657 | ) | (5,440,404 | ) | |||||
| Trans Pacific Logistics Shanghai Ltd. | (70,658 | ) | 266,782 | |||||
| Total | $ | (5,524,315 | ) | $ | (5,173,622 | ) | ||
Note 13. COMMITMENTS AND CONTINGENCIES
Contractual Obligations:
Contingencies
The Labor Contract Law of the PRC requires employers to insure the liability of the severance payments for terminated employees that have worked for the employers for at least two years prior to January 1, 2008. The employers will be liable for one month for severance pay for each year of the service provided by the employees. As of March 31, 2020 and June 30, 2019, the Company has estimated its severance payments of approximately $80,000 and $94,000, respectively, which have not been reflected in its unaudited condensed consolidated financial statements, because management cannot predict what the actual payment, if any, will be in the future.
Sino-Global has employment agreements with each of Mr. Lei Cao, Ms. Tuo Pan and Mr. Zhikang Huang. These employment agreements provide for five-year terms that extend automatically in the absence of termination notice provided at least 60 days prior to the anniversary date of the agreement. If the Company fails to provide this notice or if the Company wishes to terminate an employment agreement in the absence of cause, then the Company is obligated to provide at least 30 days’ prior notice. In such case during the initial term of the agreement, the Company would need to pay such executive (i) the remaining salary through the date of December 31, 2023, (ii) two times of the then applicable annual salary if there has been no Change in Control, as defined in the employment agreements or three-and-half times of the then applicable annual salary if there is a Change in Control.
From time to time, the Company is involved in routine litigation that arises in the ordinary course of business. The Company was named as a defendant in a breach of service contract lawsuit in the amount of $225,000 filed with the California Superior Court on January 19, 2018. The Company filed a motion with the court to force the plaintiff into arbitration rather than to litigate the dispute in court based on the arbitration provision in the contract. The California Superior Court approved its motion to stay the case pending the resolution of the arbitration. In Indianapolis, this matter was settled in exchange for 40,000 restrictive shares of common stock of the Company to the plaintiff, by the execution of a settlement agreement by both parties on August 23, 2019 and the issuance of 40,000 restricted shares on August 26, 2019. As a result, the arbitration in Indianapolis and the litigation in California has been dismissed respectively.
On January 22, 2019, Nasdaq notified the Company that it did not comply with the minimum bid price of $1.00 per share (the “Minimum Bid Price”) requirement in Listing Rule 5550(a)(2), and in accordance with Listing Rule 5810(c)(3)(A), was granted 180 calendar days, until July 22, 2019, to regain compliance. Subsequently, on July 23, 2019, the Company was provided an additional 180 calendar day compliance period, or until January 20, 2020, to demonstrate compliance. On January 21, 2020, the Company was notified of Nasdaq’s delist determination as it had not regained compliance. On January 28, 2020, the Company requested a hearing, which was held on February 27, 2020. On March 10, 2020, the Company received a letter from Nasdaq stating that the Nasdaq Hearings Panel (the “Panel”) granted an exception to permit the Company to demonstrate compliance on or before May 8, 2020.
In response to current volatile stock market conditions and decreases in the stock price of many companies, Nasdaq announced on April 17, 2020 that it has temporarily provided relief from certain of its continued listing requirements for common stock and other securities. Among other things, Nasdaq is tolling until June 30, 2020, the period for any non-compliant company to regain compliance with the requirement to maintain a minimum closing bid price of $1 for at least 30 consecutive business days. As a result, the Company automatically received an extension to demonstrate its compliance with the Nasdaq Minimum Bid Price requirement on or before July 23, 2020. The shares of the Company continue to be listed on the Nasdaq Capital Market, subject to the condition listed above. The temporary relief the Company received was based on Nasdaq Issuer Notification 2020-2, which provides additional time to issuers to return to compliance with pricing related listing rules, including the Minimum Bid Price requirement.
Note 14. INCOME TAXES
On March 27, 2020, the Coronavirus Aid, Relief and Economic Security Act (“CARES Act”) was enacted and signed into law and includes, among other things, refundable payroll tax credits, deferment of employer side social security payments, net operating loss carryback periods and alternative minimum tax credit refunds. The Company does not at present expect the provisions of the CARES Act to have a material impact on its tax provision given the amount of net operating losses currently available.
The Company’s income tax benefit (expenses) for the three and nine months ended March 31, 2020 and 2019 are as follows:
| For the three months Ended March 31 | For the nine months Ended March 31 | |||||||||||||||
| 2020 | 2019 | 2020 | 2019 | |||||||||||||
| Current | ||||||||||||||||
| U.S. | $ | - | $ | 1,191 | $ | - | $ | (29,124 | ) | |||||||
| Hong Kong | - | (9,395 | ) | - | (10,276 | ) | ||||||||||
| PRC | (189,510 | ) | (328,163 | ) | (204,257 | ) | (595,980 | ) | ||||||||
| (189,510 | ) | (336,367 | ) | (204,257 | ) | (635,380 | ) | |||||||||
| Deferred | ||||||||||||||||
| U.S. | - | (220,700 | ) | - | (100,200 | ) | ||||||||||
| PRC | - | 308,247 | - | 308,247 | ||||||||||||
| Total income tax benefit (expense) | $ | (189,510 | ) | $ | (248,820 | ) | $ | (204,257 | ) | $ | (427,333 | ) | ||||
The Company’s deferred tax assets are comprised of the following:
| March 31, 2020 | June 30, 2019 | |||||||
| Allowance for doubtful accounts | $ | 1,185,000 | $ | 1,121,000 | ||||
| Net operating loss | 1,565,000 | 1,024,000 | ||||||
| Total deferred tax assets | 2,750,000 | 2,145,000 | ||||||
| Valuation allowance | (2,750,000 | ) | (2,145,000 | ) | ||||
| Deferred tax assets, net - long-term | $ | - | $ | - | ||||
The Company’s operations in the U.S. incurred a cumulative NOL of approximately $3,781,000 as of June 30, 2019 which may reduce future federal taxable income. During the three and nine months ended March 31, 2020, approximately $512,000 and $1,977,000 of additional NOL was generated and the tax benefit derived from such NOL was approximately $107,000 and $415,000, respectively. As of March 31, 2020, the Company’s cumulative NOL amounted to approximately $5,758,000 which may reduce future federal taxable income, of which approximately $1,400,000 will expire in 2037 and the remaining balance carried forward indefinitely.
The Company periodically evaluates the likelihood of the realization of deferred tax assets, and reduces the carrying amount of the deferred tax assets by a valuation allowance to the extent it believes a portion will not be realized. Management considers new evidence, both positive and negative, that could affect the Company’s future realization of deferred tax assets including its recent cumulative earnings experience, expectation of future income, the carry forward periods available for tax reporting purposes and other relevant factors. The Company determined that it is more likely than not its deferred tax assets could not be realized due to uncertainty on future earnings as a result of the deterioration of trade negotiation between US and China in 2019. The Company provided a 100% allowance for its DTA as of March 31, 2020. The net increase in valuation for the three and nine months ended March 31, 2020 amounted to approximately $150,000 and $605,000, respectively based on management’s reassessment of the amount of the Company’s deferred tax assets that are more likely than not to be realized.
The Company’s taxes payable consists of the following:
| March 31, | June 30, | |||||||
| 2020 | 2019 | |||||||
| VAT tax payable | $ | 1,032,755 | $ | 1,045,513 | ||||
| Corporate income tax payable | 2,193,923 | 2,075,248 | ||||||
| Others | 64,134 | 64,134 | ||||||
| Total | $ | 3,290,812 | $ | 3,184,895 | ||||
Note 15. CONCENTRATIONS
Major Customers
For the three months ended March 31, 2020, two customers accounted for approximately 62.2% and 36.9% of the Company’s revenues, respectively. For the three months ended March 31, 2019, three customers accounted for 61.9%, 14.7% and 11.6% of the Company’s revenues, respectively.
For the nine months ended March 31, 2020, three customers accounted for approximately 40.0%, 29.1% and 28.3% of the Company’s revenues, respectively. For the nine months ended March 31, 2019, three customers accounted for approximately 35.4%, 16.4% and 13.3% of the Company’s revenues, respectively.
As of March 31, 2020, one customer accounted for approximately 85.9% of the Company’s accounts receivable. As of March 31, 2019, three customers accounted for approximately 41.2% of the Company’s accounts receivable.
Major Suppliers
For the three months ended March 31, 2020, two suppliers accounted for approximately 48.3% and 28.0% of the total cost of revenues, respectively. For the three months ended March 31, 2019, four suppliers accounted for approximately 40%, 15.3%, 14.8%, and 10.5% of the total costs of revenue, respectively.
For the nine months ended March 31, 2020, four suppliers accounted for approximately 27.2%, 24.7%, 18.2% and 10.0% of the total cost of revenues, respectively. For the nine months ended March 31, 2019, three suppliers accounted for approximately 24.3%, 12.5% and 10.4% of the total costs of revenue, respectively.
Note 16. SEGMENT REPORTING
ASC 280, “Segment Reporting”, establishes standards for reporting information about operating segments on a basis consistent with the Company’s internal organizational structure as well as information about geographical areas, business segments and major customers in unaudited condensed consolidated financial statements for detailing the Company’s business segments.
The Company’s chief operating decision maker is the Chief Executive Officer, who reviews the financial information of the separate operating segments when making decisions about allocating resources and assessing the performance of the group. The Company has determined that it has four operating segments: (1) shipping agency and management services; (2) inland transportation management services; (3) freight logistics services and (4) container trucking services.
The following tables present summary information by segment for the three and nine months ended March 31, 2020 and 2019, respectively:
| For the Three Months Ended March 31, 2020 | ||||||||||||||||||||
| Shipping Agency and Management Services | Inland Transportation Management Services | Freight Logistics Services | Container Trucking Services | Total | ||||||||||||||||
| Revenues | ||||||||||||||||||||
| - Related party | $ | - | $ | - | $ | - | $ | - | $ | - | ||||||||||
| - Third parties | $ | 500,000 | $ | - | $ | 853,979 | * | $ | - | $ | 1,353,979 | |||||||||
| Total revenues | $ | 500,000 | $ | - | $ | 853,979 | $ | - | $ | 1,353,979 | ||||||||||
| Cost of revenues | $ | 67,841 | $ | - | $ | 821,266 | * | $ | - | $ | 889,107 | |||||||||
| Gross profit | $ | 432,159 | $ | - | $ | 32,713 | $ | - | $ | 464,872 | ||||||||||
| Depreciation and amortization | $ | 79,732 | $ | - | $ | 3,421 | $ | - | $ | 83,153 | ||||||||||
| Total capital expenditures | $ | - | $ | - | $ | - | $ | - | $ | - | ||||||||||
| Gross margin% | 86.4 | % | - | % | 3.8 | % | - | % | 34.3 | % | ||||||||||
| For the Three Months Ended March 31, 2019 | ||||||||||||||||||||
| Shipping Agency and Management Services | Inland Transportation Management Services | Freight Logistic Services | Container Trucking Services | Total | ||||||||||||||||
| Revenues | ||||||||||||||||||||
| - Related party | $ | - | $ | 36,380 | $ | - | $ | - | $ | 36,380 | ||||||||||
| - Third parties | $ | 956,583 | $ | 93,407 | $ | 21,599,675 | $ | 87,094 | $ | 22,736,759 | ||||||||||
| Total revenues | $ | 956,583 | $ | 129,787 | $ | 21,599,675 | $ | 87,094 | $ | 22,773,139 | ||||||||||
| Cost of revenues | $ | 862,970 | $ | 48,750 | $ | 20,098,417 | $ | 65,058 | $ | 21,075,195 | ||||||||||
| Gross profit | $ | 93,613 | $ | 81,037 | $ | 1,501,258 | $ | 22,036 | $ | 1,697,944 | ||||||||||
| Depreciation and amortization | $ | - | $ | 39,109 | $ | 476 | $ | 4,448 | $ | 44,033 | ||||||||||
| Total capital expenditures | $ | - | $ | - | $ | 125,806 | $ | 8,317 | $ | 134,123 | ||||||||||
| Gross margin% | 9.8 | % | 62.4 | % | 7.0 | % | 25.3 | % | 7.5 | % | ||||||||||
| For the Nine Months Ended March 31, 2020 | ||||||||||||||||||||
| Shipping Agency and Management Services | Inland Transportation Management Services | Freight Logistics Services | Container Trucking Services | Total | ||||||||||||||||
| Revenues | ||||||||||||||||||||
| - Related party | $ | - | $ | - | $ | - | $ | - | $ | - | ||||||||||
| - Third parties | $ | 1,500,000 | $ | - | $ | 3,599,620 | * | $ | 61,709 | $ | 5,161,329 | |||||||||
| Total revenues | $ | 1,500,000 | $ | - | $ | 3,599,620 | $ | 61,709 | $ | 5,161,329 | ||||||||||
| Cost of revenues | $ | 230,248 | $ | - | $ | 2,042,595 | * | $ | 55,313 | $ | 2,328,156 | |||||||||
| Gross profit | $ | 1,269,752 | $ | - | $ | 1,557,025 | $ | 6,396 | $ | 2,833,173 | ||||||||||
| Depreciation and amortization | $ | 261,648 | $ | - | $ | 7,704 | $ | 50,920 | $ | 320,272 | ||||||||||
| Total capital expenditures | $ | 6,979 | $ | - | $ | - | $ | - | $ | 6,979 | ||||||||||
| Gross margin% | 84.7 | % | - | % | 43.3 | % | 10.4 | % | 54.9 | % | ||||||||||
| For the Nine Months Ended March 31, 2019 | ||||||||||||||||||||
| Shipping Agency and Management Services | Inland Transportation Management Services | Freight Logistic Services | Container Trucking Services | Total | ||||||||||||||||
| Revenues | ||||||||||||||||||||
| - Related party | $ | - | $ | 433,380 | $ | - | $ | - | $ | 433,380 | ||||||||||
| - Third parties | $ | 1,845,653 | $ | 1,036,407 | $ | 36,066,151 | $ | 406,368 | $ | 39,354,579 | ||||||||||
| Total revenues | $ | 1,845,653 | $ | 1,469,787 | $ | 36,066,151 | $ | 406,368 | $ | 39,787,959 | ||||||||||
| Cost of revenues | $ | 1,672,010 | $ | 128,624 | $ | 32,562,075 | $ | 352,915 | $ | 34,715,624 | ||||||||||
| Gross profit | $ | 173,643 | $ | 1,341,163 | $ | 3,504,076 | $ | 53,453 | $ | 5,072,335 | ||||||||||
| Depreciation and amortization | $ | - | $ | 79,935 | $ | 1,427 | $ | 13,951 | $ | 95,313 | ||||||||||
| Total capital expenditures | $ | - | $ | - | $ | 125,806 | $ | 17,674 | $ | 143,480 | ||||||||||
| Gross margin% | 9.4 | % | 91.2 | % | 9.7 | % | 13.2 | % | 12.7 | % | ||||||||||
Total assets as of:
| March 31, | June 30, | |||||||
| 2020 | 2019 | |||||||
| Shipping Agency and Management Services | $ | 3,301,686 | $ | 3,549,093 | ||||
| Freight Logistic Services | 13,311,173 | 17,017,695 | ||||||
| Container Trucking Services | 25,225 | 32,215 | ||||||
| Total Assets | $ | 16,638,084 | $ | 20,599,003 | ||||
Note 17. RELATED PARTY TRANSACTIONS
As of March 31, 2020 and June 30, 2019, the outstanding amounts due from a related party consist of the following:
| March 31, | June 30, | |||||||
| 2020 | 2019 | |||||||
| Tianjin Zhiyuan Investment Group Co., Ltd. | $ | 484,331 | $ | 897,739 | ||||
| Less: allowance for doubtful accounts | (48,433 | ) | (89,774 | ) | ||||
| Total | $ | 435,898 | $ | 807,965 | ||||
In June 2013, the Company signed a five-year global logistic service agreement with Tianjin Zhiyuan Investment Group Co., Ltd. (the “Zhiyuan Investment Group”) and TEWOO Chemical & Light Industry Zhiyuan Trade Co., Ltd. (together with Zhiyuan Investment Group, “Zhiyuan”). Zhiyuan Investment Group is owned by Mr. Zhang, the largest shareholder of the Company. In September 2013, the Company executed an inland transportation management service contract with the Zhiyuan Investment Group whereby it would provide certain advisory services and help control potential commodities loss during the transportation process. The amount due from Zhiyuan Investment Group as of March 31, 2020 was $484,331 and the Company provided a 10% allowance for doubtful accounts of the amount due from Zhiyuan. For the three months ended March 31, 2020, the Company recovered $0 of allowance for doubtful accounts of the amount due from Zhiyuan. For the nine months ended March 31, 2020, the Company recovered $41,341 of allowance for doubtful accounts of the amount due from Zhiyuan.
Note 18. SUBSEQUENT EVENTS
On April 6, 2020, the Company entered into a share purchase agreement (the “Agreement”) with Mr. Kelin Wu (the “Seller”) and Mandarine Ocean Ltd, a shipping company registered in the Marshall Islands (“Hanyang Shipping”), to acquire 75% of the capital stock of Hanyang Shipping held by the Seller for an aggregate consideration of up to $3.75 million to be paid in cash and the Company’s restricted shares of common stock. The payments consist of the following: (a) the Company will issue an aggregate of 800,000 shares to the Seller within 30 days after this Agreement is signed and becomes effective. The exchange price of the 800,000 shares will be equal to the 2 times the volume weighted average price during the 10 consecutive trading days prior to and ending on the date agreement signed; (b) Up to $1.125 million in cash equivalent or restricted shares equivalent if Hanyang Shipping’s audited net income before taxes reaches $1.5 million for the fiscal year ending June 30, 2021; and (c) Up to $2.625 million in cash equivalent or restricted shares equivalent (including 800,000 shares already paid in the previous period) if Hanyang Shipping’s audited net income before taxes reaches $3.5 million for the fiscal year ending June 30, 2022. Pursuant to the agreement, if Hanyang Shipping could not achieve the results stated in (b) and (c), the Company shall withdraw and cancel the 800,000 restricted shares that have been issued to the Seller or not pay the Seller any additional cash or restricted shares.
On June 17, 2020, the parties entered into the First Amended and Restated Share Purchase Agreement (the “Amendment”) to amend the purchase price to an aggregate consideration of up to $1.5 million and the Company’s restricted shares. The amended purchase price consists of the following: (a) the Company will issue an aggregate of 800,000 shares to the Seller within 30 days after this Amendment is signed and becomes effective. The exchange price of the 800,000 shares will be equal to the 2 times the volume weighted average price during the 10 consecutive trading days prior to and ending on the date the agreement was signed; (b) Up to $0.5 million in cash equivalent or restricted shares equivalent if Hanyang Shipping’s audited net income before taxes reaches $1.0 million for the fiscal year ending June 30, 2021; The specific payment schedule is as follows;
and (c) Up to $1.0 million in cash equivalent or restricted shares equivalent (including 800,000 shares already paid in the previous period) if Hanyang Shipping’s audited net income before taxes reaches $2.0 million for the fiscal year ending June 30, 2022. The specific payment schedule is as follows:
Pursuant to the Amendment, if Hanyang Shipping could not achieve the results stated in (b) and (c), the Company will withdraw and cancel the 800,000 restricted shares that have been issued to the Seller or not pay the Seller any additional cash or restricted shares.
On April 23, 2020, the Company received a gross proceeds of $50,000 related to the 1,000,000 shares of the Company’s common stock issuance to Mr. Shanming Liang (see Note 11). The remaining the payment is expected to be received by the end of the first quarter of fiscal year 2021.
On May 11, 2020, the Company received loan proceeds in the amount of approximately $124,570 under the U.S. Small Business Administration (“SBA”) Paycheck Protection Program (“PPP”). The PPP, established as part of the Coronavirus Aid, Relief and Economic Security Act (“CARES Act”), provides for loans to qualifying businesses for amounts up to 2.5 times of the average monthly payroll expenses of the qualifying business. The loans and accrued interest are forgivable after eight weeks as long as the borrower uses the loan proceeds for eligible purposes, including payroll, benefits, rent and utilities, and maintains its payroll levels. The loan forgiveness amount will be reduced for any Economic Injury Disaster Loan (“EIDL”) advance that the Company receives. The amount of loan forgiveness will be further reduced if the borrower terminates employees or reduces salaries during the eight-week period. The Company intends to use the proceeds for purposes consistent with the PPP. While the Company currently believes that its use of the loan proceeds will meet the conditions for forgiveness of the loan and intends to file for loan forgiveness after eight weeks after receipt of loan proceeds, there can be no assurance that the full amount of the loan will be forgiven.
On May 26, 2020, the Company received an advance in the amount of $156,000 from under the SBA EIDL program administered by the SBA pursuant to the CARES Act. Such advance amount will reduce the Company’s PPP loan forgiveness amount described above. In accordance with the requirements of the CARES Act, the Company will use proceeds from the SBA loans primarily for working capital to alleviate economic injury caused by disaster occurring in the month of January 31, 2020 and continuing thereafter. The SBA loans are scheduled to mature on May 22, 2050 and have a 3.75% interest rate and are subject to the terms and conditions applicable to loans administered by the SBA under the CARES Act. The monthly payable including principal and interest, of $731 commencing on May 22, 2021. The balance of principal and interest will be payable 30 years from the date of May 22, 2020.
On June 1, 2020, the Company entered into a general shipping agency service agreement (“service agreement”) with Mr. Kelin Wu, the controller of Mandarine Bulk Ltd (“Mandarine Bulk”) and Seller of Hanyang Shipping. Pursuance to the service agreement, Mandarine Bulk has appointed the Company as the sole general shipping agency for all its owned and operated ships with services including ship management services, shipping agency services, ship brokerage services and other services required for ship operation.
On June 30, 2020, the Company issued 250,000 shares of common stock valued at $0.61 per share on the grant date with a fair value of $152,500 under the 2014 Stock Incentive Plan to two employees, vesting immediately.
Item 2. Management’s Discussion and Analysis of Financial Condition and Results of Operations.
The following discussion and analysis of our company’s financial condition and results of operations should be read in conjunction with our unaudited condensed consolidated financial statements and the related notes included elsewhere in the report. This discussion contains forward-looking statements that involve risks and uncertainties. Actual results and the timing of selected events could differ materially from those anticipated in these forward-looking statements as a result of various factors.
Overview
Sino-Global has focused on providing customers with customized shipping agency and freight logistic services but has since begun looking aggressively at diversifying its revenue and service mix by seeking new growth opportunities to expand its business due to increased margin compression. These opportunities have ranged from complementary businesses to other service and product initiatives.
With the hope of bringing us back to the shipping management business, on April 10, 2019, the Company entered into a cooperation agreement with Mr. Weijun Qin, CEO of a shipping management company in China, to set up a joint venture in New York named State Priests Management Ltd. (“State Priests”), of which we hold 90% equity interest. On November 6, 2019, we signed a revised cooperation agreement with Mr. Qin to restructure our equity interest in State Priests. Due to State Priests’ failure to timely obtain the necessary approval from related authorities, Mr. Qin agreed to exchange 80% equity interest in Sea Continent Management Ltd. (“Sea Continent”), another entity he owns, for our 90% equity interest in State Priests. Sea Continent already has the International Ship Safety Management certificate from the China Classification Society for its operations.
To adapt to the changing China market, which has a high demand for agricultural products and agricultural by-products, one of the Company’s business strategies is to provide services in connection with the purchase of the U.S agricultural products and the shipment of these products to China using its overall supply chain logistics. On January 10, 2020, the Company entered into a cooperation agreement with Mr. Shanming Liang, a director of Guangxi Jinqiao Industrial Group Co., Ltd., to set up a joint venture in New York named LSM Trading Ltd. (“LSM Trading”) to engage in trading business, of which we hold 40% equity interest. No investment has been made by the Company as of the date of this report. LSM Trading will facilitate the purchase of the agricultural commodities and agricultural by-products in the U.S. for customers in China and the Company will provide comprehensive supply chain and logistics solutions.
Due to uncertainty in current trade environment and the impact of novel coronavirus, the Company has not made any investment in the aforementioned joint ventures and no significant operations has commenced.
The outbreak of the novel coronavirus (COVID-19) starting from late January 2020 in the PRC has spread rapidly to many parts of the world. The pandemic has resulted in quarantines, travel restrictions, and the temporary closure of stores and business facilities in China and United States for the past few months. In March 2020, the World Health Organization declared the COVID-19 as a pandemic. Given the rapidly expanding nature of the COVID-19 pandemic, and because substantially all of our business operations and our workforce are concentrated in China and United States, our business, results of operations, and financial condition have been materially and adversely affected. Potential impact to our results of operations will also depend on future developments and new information that may emerge regarding the duration and severity of the COVID-19 and the actions taken by government authorities and other entities to contain the COVID-19 or mitigate its impact, almost all of which are beyond our control.
The impacts of COVID-19 on our business, financial condition, and results of operations include, but are not limited to, the following:
Recent Developments
On April 6, 2020, the Company entered into a Share Purchase Agreement (the “Original SPA”) with Mr. Kelin Wu, a PRC investor (the “Seller”) and Mandarine Ocean Ltd (“Hanyang Shipping”), a shipping company registered in the Marshall Islands, pursuant to which the Company agreed to purchase 75% of the equity of Hanyang Shipping from the Seller for a purchase price of up to $3,750,000, payable in cash equivalent and/or restricted shares of common stock of the Company, subject to completion of a third-party valuation of Hanyang Shipping. Pursuant to the Original SPA, the parties agreed to renegotiate the terms of the acquisition in the event the valuation of Hanyang Shipping showed an enterprise value of less than $4.0 million or greater than $6.0 million. Because the third party valuation determined that the value of Hanyang Shipping was approximately $2.0 million, the parties desired to amend the terms of the Original SPA.
On June 17, 2020, the Company entered into an amended share purchase agreement (the “Amended SPA”) with the Seller to acquire 75% of the capital stock of Hanyang Shipping held by the Seller for an aggregate consideration of up to $1.5 million to be paid in cash and the Company’s restricted shares. The payments consist of the following: (a) the Company will issue an aggregate of 800,000 shares to the Seller within 30 days after this Amended SPA is signed and becomes effective.; (b) Up to $0.5 million in cash equivalent or restricted shares equivalent if Hanyang Shipping’s audited net income before taxes reaches $1.0 million for the fiscal year ending June 30, 2021; and (c) Up to $1.0 million in cash equivalent or restricted shares equivalent (including 800,000 shares already paid in the previous period) if Hanyang Shipping’s audited net income before taxes reaches $2.0 million for the fiscal year ending June 30, 2022. Pursuant to the agreement, if Hanyang Shipping could not achieve the results stated in (b) and (c), the Company will withdraw and cancel the 800,000 restricted shares that have been issued to the Seller or not pay the Seller any additional cash or restricted shares.
On June 1, 2020, the Company entered into a general shipping agency service agreement (“service agreement”) with Mr. Kelin Wu, the controller of Mandarine Bulk Ltd (“Mandarine Bulk”) and Seller of Hanyang Shipping. Pursuance to the service agreement, Mandarine Bulk has appointed the Company as the sole general shipping agency for all its owned and operated ships with services including ship management services, shipping agency services, ship brokerage services and other services required for ship operation.
Company Structure
The Company, founded in 2001, is a non-asset based global shipping and freight logistics integrated solutions provider. We provide tailored solutions and value-added services for our customers to drive efficiency and control in related steps throughout the entire shipping and freight logistics chain. We conduct our business primarily through our wholly-owned subsidiaries in the People’s Republic of China (the “PRC”) (including Hong Kong) and the U.S., where a majority of our clients are located.
We operate in four operating segments, including (1) shipping agency and management services, operated by our subsidiary in Hong Kong and the U.S.; (2) inland transportation management services, operated by our subsidiaries in the U.S.; (3) freight logistics services, operated by our subsidiaries in the PRC and the U.S.; and (4) container trucking services, operated by our subsidiaries in the PRC and the U.S.
Our corporate structure diagram as of the date of this report is as below:
Results of Operations
Comparison of the Three Months Ended March 31, 2020 and 2019
Revenues
Revenues decreased by $21,419,160, or approximately 94.1%, from $22,773,139 for the three months ended March 31, 2019 to $1,353,979 for the same period in 2020. The decrease was primarily due to the fact that in certain freight logistics contracts that we entered into with customers starting from the first quarter of fiscal year 2020, we only acted as an agent and did not control the services rendered to the customers in order to reduce possible risks as a result of the uncertainties in current trade environments. As such our revenues on these contracts are accounted for on a net basis. The decrease was also due to the decrease in revenues from inland transportation management services as our service contracts with customers have expired and there have been no new customers for this business segment.
The following tables present summary information by segments mainly regarding the top-line financial results for the three months ended March 31, 2020 and 2019:
| For the Three Months Ended March 31, 2020 | ||||||||||||||||||||
| Shipping Agency and Management Services | Inland Transportation Management Services | Freight Logistics Services | Container Trucking Services | Total | ||||||||||||||||
| Revenues | ||||||||||||||||||||
| - Related party | $ | - | $ | - | $ | - | $ | - | $ | - | ||||||||||
| - Third parties | $ | 500,000 | $ | - | $ | 853,979 | * | $ | - | $ | 1,353,979 | |||||||||
| Total revenues | $ | 500,000 | $ | - | $ | 853,979 | $ | - | $ | 1,353,979 | ||||||||||
| Cost of revenues | $ | 67,841 | $ | - | $ | 821,266 | * | $ | - | $ | 889,107 | |||||||||
| Gross profit | $ | 432,159 | $ | - | $ | 32,713 | $ | - | $ | 464,872 | ||||||||||
| Depreciation and amortization | $ | 79,732 | $ | - | $ | 3,421 | $ | - | $ | 83,153 | ||||||||||
| Total capital expenditures | $ | - | $ | - | $ | - | $ | - | $ | - | ||||||||||
| Gross margin% | 86.4 | % | - | % | 3.8 | % | - | % | 34.3 | % | ||||||||||
| For the Three Months Ended March 31, 2019 | ||||||||||||||||||||
| Shipping Agency Services | Inland Transportation Management Services | Freight Logistic Services | Container Trucking Services | Total | ||||||||||||||||
| Revenues | ||||||||||||||||||||
| - Related party | $ | - | $ | 36,380 | $ | - | $ | - | $ | 36,380 | ||||||||||
| - Third parties | $ | 956,583 | $ | 93,407 | $ | 21,599,675 | $ | 87,094 | $ | 22,736,759 | ||||||||||
| Total revenues | $ | 956,583 | $ | 129,787 | $ | 21,599,675 | $ | 87,094 | $ | 22,773,139 | ||||||||||
| Cost of revenues | $ | 862,970 | $ | 48,750 | $ | 20,098,417 | $ | 65,058 | $ | 21,075,195 | ||||||||||
| Gross profit | $ | 93,613 | $ | 81,037 | $ | 1,501,258 | $ | 22,036 | $ | 1,697,944 | ||||||||||
| Depreciation and amortization | $ | - | $ | 39,109 | $ | 476 | $ | 4,448 | $ | 44,033 | ||||||||||
| Total capital expenditures | $ | - | $ | - | $ | 125,806 | $ | 8,317 | $ | 134,123 | ||||||||||
| Gross margin% | 9.8 | % | 62.4 | % | 7.0 | % | 25.3 | % | 7.5 | % | ||||||||||
| % Changes For the Three Months Ended March 31, 2020 to 2019 | ||||||||||||||||||||
| Shipping Agency and Management Services | Inland Transportation Management Services | Freight Logistics Services | Container Trucking Services | Total | ||||||||||||||||
| Revenues | ||||||||||||||||||||
| - Related party | - | (100.0 | )% | - | - | (100.0 | )% | |||||||||||||
| - Third parties | (47.7 | )% | (100.0 | )% | (96.0 | )% | (100.0 | )% | (94.0 | )% | ||||||||||
| Total revenues | (47.7 | )% | (100.0 | )% | (96.0 | )% | (100.0 | )% | (94.1 | )% | ||||||||||
| Cost of revenues | (92.1 | )% | (100.0 | )% | (95.9 | )% | (100.0 | )% | (95.8 | )% | ||||||||||
| Gross profit | 361.6 | % | (100.0 | )% | (97.8 | )% | (100.0 | )% | (72.6 | )% | ||||||||||
| Depreciation and amortization | 100.0 | % | (100.0 | )% | 618.7 | % | (100.0 | )% | 88.8 | % | ||||||||||
| Total capital expenditures | - | - | (100.0 | )% | (100.0 | )% | (100.0 | )% | ||||||||||||
| Gross margin% | 76.6 | % | (62.4 | )% | (3.2 | )% | (25.3 | )% | 26.8 | % | ||||||||||
Revenues
(1) Shipping Agency and Management Services
For the three months ended March 31, 2020 and 2019, shipping agency and management services generated revenues of $500,000 and $956,583, respectively, representing an approximately 47.7% decrease in revenues. The decrease in this segment was due to the decrease in the shipping agency services provided, where we focused more on shipping management services for the three months ended March 31, 2020. Our integrated shipping management services included arranging and coordinating ship maintenance and inspection, repairs, and other services. With the required certification obtained by our 90% owned joint venture, Sea Continent, we expect to perform more services such as ship insurance, crew recruitment, training and supply and ship spare parts sales.
(2) Revenues from Inland Transportation Management Services
For the three months ended March 31, 2020 and 2019, inland transportation management services generated related-party revenue of $0 and $36,380, respectively. Revenue generated from Tengda Northwest for the three months ended March 31, 2020 and 2019 amounted to $0 and $93,407, respectively. The overall decrease in revenues generated from this segment amounted to $129,787 or 100.0% due to the expiration of our inland transportation management service contracts with the aforementioned customers. We are not actively developing business in this segment and will only provide such services on an as needed basis on short term contracts.
(3) Revenues from Freight Logistics Services
Freight logistics services primarily consist of cargo forwarding, brokerage and other freight services. During the three months ended March 31, 2020, revenues from this segment decreased by $20,745,696 or approximately 96.0%. The decrease was primarily due to the fact that in certain freight logistics contracts that we entered into with customers starting from the first quarter of fiscal year 2020, we acted as an agent in arranging the relationship between the customer and the third-party service provider and did not control the services rendered to the customer as we are not the primary responsible party to fulfill the services. For the three months ended March 31, 2020, gross revenue and gross cost of revenue related to these contracts amounted to approximately $2.0 million and $2.0 million, respectively. However, due to the aforementioned reason, our revenues on these contracts were only accounted for on a net basis.
Our gross profit margin decreased by approximately 3.2% from approximately 7.0% for three months ended March 31, 2019 to approximately 3.8% for the same period in 2020. The decrease in gross margin was due to the change in the mix of services provided. Even with the same customer, every transaction has a unique gross margin due to different service scopes. Generally, an engagement where we provide a broader set of services generates a higher gross margin, and an engagement of a more limited scope of services has a lower gross margin. In addition, our contracts with customer where we provide services as agents usually have lower margins than those where we control the services provided.
(4) Revenues from Container Trucking Services
For the three months ended March 31, 2020 and 2019, revenues generated from container trucking services were $0 and $87,094, respectively. Overall revenues from this segment decreased by $87,094 or 100.0%. The decrease in revenues from this segment was primarily due to current trade dynamic between the U.S. and China, which resulted in the decreased container shipments from China to the U.S. The decrease in revenues from this segment was also due to the coronavirus outbreak which affected the Company’s business operations. There was no container trucking services order has been placed during the three months ended March 31, 2020. The related gross profit decreased by $22,036 from $22,036 gross profit for the three months ended March 31, 2019 to $0 gross profit for the same period in 2020.
Operating Costs and Expenses
Operating costs and expenses decreased by $18,613,650, or approximately 77.5%, from $24,002,372 for the three months ended March 31, 2019 to $5,388,722 for the three months ended March 31, 2020. This decrease was mainly due to the decrease in cost of revenue, selling expenses, general and administrative expenses, partially offset by the increase in provision for doubtful accounts and stock-based compensation as discussed below.
The following table sets forth the components of the Company’s costs and expenses for the periods indicated:
| For the Three Months Ended March 31, | ||||||||||||||||||||||||
| 2020 | 2019 | Change | ||||||||||||||||||||||
| US$ | % | US$ | % | US$ | % | |||||||||||||||||||
| Revenues | 1,353,979 | 100.0 | % | 22,773,139 | 100.0 | % | (21,419,160 | ) | (94.1 | )% | ||||||||||||||
| Cost of revenues | 889,107 | 65.7 | % | 21,075,195 | 92.5 | % | (20,186,088 | ) | (95.8 | )% | ||||||||||||||
| Gross margin | 34.3 | % | N/A | 7.5 | % | N/A | 26.8 | % | N/A | |||||||||||||||
| Selling expenses | 79,099 | 5.8 | % | 140,601 | 0.6 | % | (61,502 | ) | (43.7 | )% | ||||||||||||||
| General and administrative expenses | 952,661 | 70.4 | % | 1,053,903 | 4.6 | % | (101,242 | ) | (9.6 | )% | ||||||||||||||
| Provision for doubtful accounts | 3,121,416 | 230.5 | % | 1,583,965 | 7.0 | % | 1,537,451 | 97.1 | % | |||||||||||||||
| Stock-based compensation | 346,439 | 25.6 | % | 148,708 | 0.7 | % | 197,731 | 113.0 | % | |||||||||||||||
| Total Costs and Expenses | 5,388,722 | 398.0 | % | 24,002,372 | 105.4 | % | (18,613,650 | ) | (77.5 | )% | ||||||||||||||
Cost of Revenues
Cost of revenues consisted primarily of freight costs to various freight carriers, cost of labor, overhead and sundry costs. Cost of revenues was $889,107 for the three months ended March 31, 2020, a decrease of $20,186,088, or approximately 95.8%, as compared to $21,075,195 for the same period in 2019. The overall cost of revenues as a percentage of our revenues decreased from approximately 92.5% for the three months ended March 31, 2019, to approximately 65.7% for the same period in 2020. Cost of revenues for freight logistics and container trucking services consists primarily of freight costs to various freight carriers. The decrease of costs was mainly due to the aforementioned certain freight logistic contracts in which we only acted as an agent and did not control the services rendered to the customers for the three months ended March 31, 2020.
Selling Expenses
Our selling expenses consisted primarily of salaries and travel expenses for our sales representatives. For the three months ended March 31, 2020, we had $79,099 of selling expenses, as compared to $140,601 for the same period in 2019, which represents a decrease of $61,502 or approximately 43.7%. The decrease was mainly due to a decrease of approximately $74,000 in business development expenses as an effort to reduce expenses due to decrease in revenues. This decrease was offset by approximately $13,000 increase in salaries expenses.
General and Administrative Expenses
The Company’s general and administrative expenses consist primarily of salaries and benefits, travel expenses, software development expenses, office expenses, regulatory filing and professional service fees including audit, legal and IT consulting. For the three months ended March 31, 2020, we had $952,661 of general and administrative expenses, as compared to $1,053,903 for the same period in 2019, representing a decrease of $101,242, or approximately 9.6%. The decrease was mainly due to the decrease in professional service fees as we incurred less expenses on management consulting and advisory services.
Provision for Doubtful Accounts
The Company’s provision for doubtful accounts was $3,121,416 for the three months ended March 31, 2020 compared to $1,583,965 for the same period in 2019, an increase of $1,537,451, or approximately 97.1%. This increase of provision for doubtful accounts was mainly due to we made more reserve to our allowance for accounts receivable as the recent outbreak of COVID-19 has adversely affected some of our customers’ business operations, which in turn adversely affected their ability to timely remit payment to us.
Stock-based Compensation
Stock-based compensation was $346,439 for the three months ended March 31, 2020, an increase of $197,731 or approximately 133.0%, as compared to $148,708 for the same period in 2019. The increase in stock-based compensation was due to additional shares of common stock issued to consultants in exchange for professional services mainly in the area of legal and business consulting services.
Operating Loss.
We had an operating loss of $4,034,743 for the three months ended March 31, 2020, compared to an operating loss of $1,229,233 for the same period in 2019. Such change was the result of the combination of the changes discussed above.
Taxation
We recorded an income tax expense of $189,510 for the three months ended March 31, 2020, compared to income tax expense of $248,820 for the same period in 2019. For the three months ended March 31, 2020, Income tax decreased by $59,310 or approximately 23.8%, as compare to the same period in 2019 due to decrease in taxable income mainly in the Company’s PRC entity conducting freight logistic services.
We have incurred net operating loss (“NOL”) of approximately $0.5 million for the three months ended March 31, 2020, compared to $0.8 million in the same period 2019 for the Company’s U.S. entities..
We periodically evaluates the likelihood of the realization of deferred tax assets, and reduces the carrying amount of the deferred tax assets by a valuation allowance to the extent we believe a portion will not be realized. Management considers new evidence, both positive and negative, that could affect our future realization of deferred tax assets including its recent cumulative earnings experience, expectation of future income, the carry forward periods available for tax reporting purposes and other relevant factors. We determined that it is more likely than not our deferred tax assets could not be realized due to uncertainty on future earnings as a result of the current trade dynamic between the U.S. and China and current impact under COVID-19. We provided a 100% allowance for the deferred tax assets as of March 31, 2020.
Net Loss
As a result of the foregoing, we had a net loss of $4,202,993 for the three months ended March 31, 2020, compared $1,475,554 for the same period in 2019. After the deduction of non-controlling interest, net loss attributable to the Company was $3,818,094 for the three months ended March 31, 2020, compared to $1,388,790 for the same period in 2019. Comprehensive loss attributable to the Company was $3,993,529 for the three months ended March 31, 2020, compared to $1,116,877 for the same period in 2019.
Comparison of the Nine Months Ended March 31, 2020 and 2019
Revenues
Revenues decreased by $34,626,630 or 87.0%, from $39,787,959 for the nine months ended March 31, 2019 to $5,161,329 for the same period in 2020. The decrease was primarily due to the fact that in certain freight logistics contracts that we entered into with customers starting from the first quarter of fiscal year 2020, we only acted as an agent and did not control the services rendered to the customers as we are not the primary responsible party to fulfill the services in order to reduce possible risks as a result of the uncertainties in current trade environments. As such our revenues on these contracts are accounted for on a net basis. The decrease was also due to the decrease in revenues from inland transportation management services as our service contracts with customers have expired and there was no new business for this segment.
The following tables present summary information by segments mainly regarding the top-line financial results for the nine months ended March 31, 2020 and 2019:
| For the Nine Months Ended March 31, 2020 | ||||||||||||||||||||
| Shipping Agency and Management Services | Inland Transportation Management Services | Freight Logistics Services | Container Trucking Services | Total | ||||||||||||||||
| Revenues | ||||||||||||||||||||
| - Related party | $ | - | $ | - | $ | - | $ | - | $ | - | ||||||||||
| - Third parties | $ | 1,500,000 | $ | - | $ | 3,599,620 | * | $ | 61,709 | $ | 5,161,329 | |||||||||
| Total revenues | $ | 1,500,000 | $ | - | $ | 3,599,620 | $ | 61,709 | $ | 5,161,329 | ||||||||||
| Cost of revenues | $ | 230,248 | $ | - | $ | 2,042,595 | * | $ | 55,313 | $ | 2,328,156 | |||||||||
| Gross profit | $ | 1,269,752 | $ | - | $ | 1,557,025 | $ | 6,396 | $ | 2,833,173 | ||||||||||
| Depreciation and amortization | $ | 261,648 | $ | - | $ | 7,704 | $ | 50,920 | $ | 320,272 | ||||||||||
| Total capital expenditures | $ | 6,979 | $ | - | $ | - | $ | - | $ | 6,979 | ||||||||||
| Gross margin% | 84.7 | % | - | 43.3 | % | 10.4 | % | 54.9 | % | |||||||||||
| For the Nine Months Ended March 31, 2019 | ||||||||||||||||||||
| Shipping Agency Services | Inland Transportation Management Services | Freight Logistic Services | Container Trucking Services | Total | ||||||||||||||||
| Revenues | ||||||||||||||||||||
| - Related party | $ | - | $ | 433,380 | $ | - | $ | - | $ | 433,380 | ||||||||||
| - Third parties | $ | 1,845,653 | $ | 1,036,407 | $ | 36,066,151 | $ | 406,368 | $ | 39,354,579 | ||||||||||
| Total revenues | $ | 1,845,653 | $ | 1,469,787 | $ | 36,066,151 | $ | 406,368 | $ | 39,787,959 | ||||||||||
| Cost of revenues | $ | 1,672,010 | $ | 128,624 | $ | 32,562,075 | $ | 352,915 | $ | 34,715,624 | ||||||||||
| Gross profit | $ | 173,643 | $ | 1,341,163 | $ | 3,504,076 | $ | 53,453 | $ | 5,072,335 | ||||||||||
| Depreciation and amortization | $ | - | $ | 79,935 | $ | 1,427 | $ | 13,951 | $ | 95,313 | ||||||||||
| Total capital expenditures | $ | - | $ | - | $ | 125,806 | $ | 17,674 | $ | 143,480 | ||||||||||
| Gross margin% | 9.4 | % | 91.2 | % | 9.7 | % | 13.2 | % | 12.7 | % | ||||||||||
| % Changes For the Nine Months Ended March 31, 2020 to 2019 | ||||||||||||||||||||
| Shipping Agency and Management Services | Inland Transportation Management Services | Freight Logistics Services | Container Trucking Services | Total | ||||||||||||||||
| Revenues | ||||||||||||||||||||
| - Related party | - | (100.0 | )% | - | - | (100.0 | )% | |||||||||||||
| - Third parties | (18.7 | )% | (100.0 | )% | (90.0 | )% | (84.8 | )% | (86.9 | )% | ||||||||||
| Total revenues | (18.7 | )% | (100.0 | )% | (90.0 | )% | (84.8 | )% | (87.0 | )% | ||||||||||
| Cost of revenues | (86.2 | )% | (100.0 | )% | (93.7 | )% | (84.3 | )% | (93.3 | )% | ||||||||||
| Gross profit | 631.2 | % | (100.0 | )% | (55.6 | )% | (88.0 | )% | (44.1 | )% | ||||||||||
| Depreciation and amortization | 100.0 | % | (100.0 | )% | 439.9 | % | 265.0 | % | 236.0 | % | ||||||||||
| Total capital expenditures | 100.0 | % | - | (100.0 | )% | (100.0 | )% | (95.1 | )% | |||||||||||
| Gross margin% | 75.3 | % | (91.2 | )% | 33.6 | % | (2.8 | )% | 42.2 | % | ||||||||||
Revenues
(1) Shipping Agency and Management Services
For the nine months ended March 31, 2020 and 2019, shipping agency and management services generated revenues of $1,500,000 and $1,845,653, respectively, representing an approximately 18.7% decrease in revenues. The decrease in this segment was due to the decrease in the shipping agency services provided, where we focused more on shipping management services for the nine months ended March 31, 2020. Our integrated services included arranging and coordinating ship maintenance and inspection, repairs, and other services. With Sea Continent, our 90% owned joint venture, we expect to perform more services such as ship insurance, crew recruitment, training and supply; ship spare parts sales, etc.
(2) Revenues from Inland Transportation Management Services
For the nine months ended March 31, 2020 and 2019, inland transportation management services generated related-party revenue of $0 and $433,380, respectively. Revenue generated from Tengda Northwest for the nine months ended March 31, 2020 and 2019 amounted to $0 and $1,036,407, respectively. The overall decrease in revenues generated from this segment amounted to $1,469,787 or 100.0% due to the expiration of our inland transportation management service contracts with the aforementioned customers. We expect revenue from this segment will continue to decrease in the coming years due to the current trade dynamics. However, we will continue to provide services on an as needed basis on short term contracts.
(3) Revenues from Freight Logistics Services
Freight logistics services primarily consist of cargo forwarding, brokerage and other freight services. During the nine months ended March 31, 2020, revenues decreased by $32,466,531 or approximately 90.0%. The decrease was primarily due to the fact that in certain freight logistic contracts that we entered into with customers starting from the first quarter of fiscal year 2020, we acted as an agent in arranging the relationship between the customer and the third-party service provider and did not control the services rendered to the customer. For the nine months ended March 31, 2020, gross revenue and gross cost of revenue related to these contracts amounted to approximately $24.0 million and $22.5 million, respectively. However, as we only acted as an agent, our revenues on these contacts were accounted for on a net basis.
Our gross profit margin increased by approximately 33.6% from approximately 9.7% for nine months ended March 31, 2019 to approximately 43.3% for the same period in 2020. The increase in gross margin was due to the following factors: 1) the aforementioned freight logistic contracts where we acted as agents usually have lower margins than those where we control the services provided; 2) change in the mix of services provided. Even with the same customer, every transaction has a unique gross margin due to differing service scopes. Generally, an engagement where we provide a broader set of services generates a higher gross margin, and an engagement of a more limited scope of services has a lower gross margin.
(4) Revenues from Container Trucking Services
For the nine months ended March 31, 2020 and 2019, revenues generated from container trucking services were $61,709 and $406,368, respectively. Overall revenues from this segment decreased by $344,659 or approximately 84.8%. The decrease in revenues from this segment was primarily due to the pending trade negotiations between the U.S. and China, which decreased container shipments from China to the U.S. The related gross profit decreased by $47,058 from $53,453 gross profit for the nine months ended March 31, 2019 to $6,395 for the same period in 2020. Gross profit margin for both periods remained relatively consistent.
Operating Costs and Expenses
Operating costs and expenses decreased by $32,271,415 or approximately 74.1%, from $43,550,562 for the nine months ended March 31, 2019 to $11,279,147 for the nine months ended March 31, 2020. This decrease was mainly due to the decrease in cost of revenue, selling expenses, general and administrative expenses and stock-based compensation as discussed below.
The following table sets forth the components of the Company’s costs and expenses for the periods indicated:
| For the Nine Months Ended March 31, | ||||||||||||||||||||||||
| 2020 | 2019 | Change | ||||||||||||||||||||||
| US$ | % | US$ | % | US$ | % | |||||||||||||||||||
| Revenues | 5,161,329 | 100.0 | % | 39,787,959 | 100.0 | % | (34,626,630 | ) | (87.0 | )% | ||||||||||||||
| Cost of revenues | 2,328,156 | 45.1 | % | 34,715,624 | 87.3 | % | (32,387,468 | ) | (93.3 | )% | ||||||||||||||
| Gross margin | 54.9 | % | N/A | 12.7 | % | N/A | 42.1 | % | N/A | |||||||||||||||
| Selling expenses | 335,253 | 6.5 | % | 507,199 | 1.3 | % | (171,946 | ) | (33.9 | )% | ||||||||||||||
| General and administrative expenses | 2,746,180 | 53.2 | % | 3,442,695 | 8.7 | % | (696,515 | ) | (20.2 | )% | ||||||||||||||
| Impairment loss of fixed assets and intangible asset | 327,632 | 6.3 | % | - | - | 327,632 | 100.0 | % | ||||||||||||||||
| Provision for doubtful accounts | 4,289,170 | 83.1 | % | 2,871,752 | 7.2 | % | 1,417,418 | 49.4 | % | |||||||||||||||
| Stock-based compensation | 1,252,756 | 24.3 | % | 2,013,292 | 5.1 | % | (760,536 | ) | (37.8 | )% | ||||||||||||||
| Total Costs and Expenses | 11,279,147 | 218.5 | % | 43,550,562 | 109.6 | % | (32,271,415 | ) | (74.1 | )% | ||||||||||||||
Cost of Revenues
Cost of revenues consisted primarily of freight costs to various freight carriers, cost of labor, other overhead and sundry costs. Cost of revenues was $2,328,156 for the nine months ended March 31, 2020, a decrease of $32,387,468, or approximately 93.3%, as compared to $34,715,624 for the same period in 2019. The overall cost of revenues as a percentage of our revenues decreased from approximately 87.3% for the nine months ended March 31, 2019, to approximately 45.1% for the same period in 2020. Cost of revenues for freight logistics and container trucking services consists primarily of freight costs to various freight carriers. The decrease of costs was mainly due to the aforementioned certain freight logistic contracts in which only acted as an agent and did not control the services rendered to the customers for the nine months ended March 31, 2020.
Selling Expenses
Our selling expenses consisted primarily of salaries and travel expenses for our sales representatives. For the nine months ended March 31, 2020, we had $335,253 of selling expenses, as compared to $507,199 for the same period in 2019, which represents a decrease of $171,946 or approximately 33.9%. The decrease was mainly due to approximately $241,000 decrease in business development expenses offset by the approximately $71,000 increase in travel expenses.
General and Administrative Expenses
The Company’s general and administrative expenses consist primarily of salaries and benefits, travel expenses for administration department, software development expenses, office expenses, regulatory filing and professional service fees including audit, legal and IT consulting. For the nine months ended March 31, 2020, we had $2,746,180 of general and administrative expenses, as compared to $3,442,695 for the same period in 2019, representing a decrease of $696,515, or approximately 20.2%. The decrease was mainly due to the decrease in IT expenses of approximately $496,000 and the decrease in professional service fees of approximately $193,000 as we incurred less expenses on management consulting and advisory services.
Impairment loss of fixed assets and intangible asset
For the nine months ended March 31, 2020, the Company recorded $327,632 of impairment loss of fixed assets and intangible asset due to the continued decrease in revenues generated from the inland transportation management segment.
Provision for Doubtful Accounts
The Company’s provision for doubtful accounts was $4,289,170 for the nine months ended March 31, 2020 compared to $2,871,752 for the same period in 2019, an increase of $1,417,418, or approximately 49.4%. This increase of provision for doubtful accounts was mainly because the recent outbreak of COVID-19 has adversely affected our customers’ business operations, which in turn adversely affected our ability to collect accounts receivable from our customers.
Stock-based Compensation
Stock-based compensation was $1,252,756 for the nine months ended March 31, 2020, a decrease of $760,536 or approximately 37.8%, as compared to $2,013,292 for the same period in 2019. Stock-based compensation decreased significantly from the nine months ended March 31, 2019 to the same period in 2020 due to less stock award was granted as a result of the decline in revenue as well as lower average stock prices in the nine months ended March 31, 2020 compared to the same period of the prior year.
Operating Loss
We had an operating loss of $6,117,818 for the nine months ended March 31, 2020, compared to an operating loss of $3,762,603 for the same period in 2019. Such change was the result of the combination of the changes discussed above.
Taxation
We recorded an income tax expense of $204,257 for the nine months ended March 31, 2020, compared to income tax expense of $427,333 for the same period in 2019. For the nine months ended March 31, 2020, income tax decreased by $223,076 or approximately 52.2%, as compare to the same period in 2019 due to the decrease in taxable income, mainly in the Company’s PRC entity conducting freight logistic services.
We have incurred a cumulative net operating loss (“NOL”) of approximately $3,781,000 as of June 30, 2019 which may reduce future federal taxable income. The NOL generated prior to the year ended June 30, 2017 amounted to approximately $1,400,000 will expire in 2037 and the remaining balance carried forward indefinitely. During the nine months ended March 31, 2020, approximately $1,977,000 of additional NOL was generated and the tax benefit derived from such NOL was approximately $415,000.
We periodically evaluates the likelihood of the realization of deferred tax assets, and reduces the carrying amount of the deferred tax assets by a valuation allowance to the extent it believes a portion will not be realized. Management considers new evidence, both positive and negative, that could affect our future realization of deferred tax assets including its recent cumulative earnings experience, expectation of future income, the carry forward periods available for tax reporting purposes and other relevant factors. We determined that it is more likely than not our deferred tax assets could not be realized due to uncertainty on future earnings as a result of the deterioration of trade negotiation between the U.S. and China in 2019. We provided a 100% allowance for its deferred tax assets as of March 31, 2020. The net increase in valuation for the nine months ended March 31, 2020 amounted to approximately $605,000 based on management’s reassessment of the amount of our deferred tax assets that are more likely than not to be realized.
Net Loss
As a result of the foregoing, we had a net loss of $6,314,972 for the nine months ended March 31, 2020, compared to $4,185,943 for the same period in 2019. After the deduction of non-controlling interest, net loss attributable to the Company was $5,852,780 for the nine months ended March 31, 2020, compared to $4,179,524 for the same period in 2019. Comprehensive loss attributable to the Company was $6,324,411 for the nine months ended March 31, 2020, compared to $4,529,845 for the same period in 2019.
Liquidity and Capital Resources
Cash Flows and Working Capital
As of March 31, 2020, we had $143,112 in cash. We held approximately 4.9% of our cash in banks located in US, Australia and Hong Kong and held approximately 95.1% of our cash in banks located in the PRC.
The following table sets forth a summary of our cash flows for the periods as indicated:
| For the Nine Months Ended March 31, | ||||||||
| 2020 | 2019 | |||||||
| Net cash used in operating activities | $ | (3,641,119 | ) | $ | (3,322,653 | ) | ||
| Net cash used in investing activities | $ | (6,979 | ) | $ | (143,480 | ) | ||
| Net cash provided by financing activities | $ | 885,946 | $ | 500,000 | ||||
| Effect of exchange rate fluctuations on cash | $ | (237,386 | ) | $ | (608,219 | ) | ||
| Net decrease in cash | $ | (2,999,538 | ) | $ | (3,574,352 | ) | ||
| Cash at the beginning of period | $ | 3,142,650 | $ | 7,098,259 | ||||
| Cash at the end of period | $ | 143,112 | $ | 3,523,907 | ||||
The following table sets forth a summary of our working capital:
| March 31, | June 30, | |||||||||||||||
| 2020 | 2019 | Variation | % | |||||||||||||
| (Unaudited) | ||||||||||||||||
| Total Current Assets | $ | 9,162,689 | $ | 15,945,162 | $ | (6,782,473 | ) | (42.5 | )% | |||||||
| Total Current Liabilities | $ | 5,637,221 | $ | 5,239,233 | $ | 397,988 | 7.6 | % | ||||||||
| Working Capital | $ | 3,525,468 | $ | 10,705,929 | $ | (7,180,461 | ) | (67.1 | )% | |||||||
| Current Ratio | 1.63 | 3.04 | (1.41 | ) | (46.6 | )% | ||||||||||
In assessing the liquidity, we monitor and analyze our cash on-hand and our operating and capital expenditure commitments. Our liquidity needs are to meet our working capital requirements, operating expenses and capital expenditure obligations. As of March 31, 2020, our working capital was approximately $3.5 million and we had cash of approximately $0.1 million. We plan to fund continuing operations through identifying new prospective joint venture partners and strategic alliance opportunities for new revenue sources, and by reducing costs to improve profitability and replenish working capital. We believe our ability to repay our current obligations will depend on the future realization of our current assets and the future operating revenues generated from our operations.
We expect to realize the balance of our current assets within the normal operating cycle of a twelve month period. If we are unable to realize our current assets within the normal operating cycle of a twelve month period, we may have to consider supplementing our available sources of funds through the following sources:
Based on the above considerations, we are of the opinion that we may not have sufficient funds to meet our working capital requirements and current liabilities as they become due one year from the date of this report. However, there is no assurance we will be successful in our plans. There are a number of factors that could potentially arise that could undermine our plans, such as changes in PRC government policy, economic conditions, and competitive pricing in the industries that we operate in.
The Company’s management has considered whether there is substantial doubt about its ability to continue as a going concern due to 1) the Company’s recurring losses from operations, including approximately $5.9 million net loss attributable to the Company’s stockholders for the nine months ended March 31, 2020, 2) accumulated deficit of approximately $12.8 million as of March 31, 2020 and 3) has negative operating cash flows of approximately $3.6 million for the nine months ended March 31, 2020. All of these factors raised substantial doubt about the ability of the Company to continue as a going concern.
Operating Activities
Our net cash used in operating activities was approximately $3.6 million for the nine months ended March 31, 2020 compared to net cash used in operating activities of approximately $3.3 million for the same period in 2019. The operating cash outflow for the nine months ended March 31, 2020 was primarily attributable to our net loss of approximately $6.3 million, of which approximately $1.3 million of stock compensation expense, approximately $0.3 million of impairment loss of fixed assets, approximately $0.3 million of depreciation and amortization expenses and intangible asset and approximately $4.3 million for provision of doubtful accounts were non-cash expenses. We had an increase in other receivables of approximately $5.9 million as we prepaid certain costs of commodities on behalf of our customers offset by a decrease of approximately $1.1 million in accounts receivable, approximately $0.4 million of notes receivable and approximately $0.4 million of due from related parties as a result of collections made during the nine months.
Our net cash used in operating activities was approximately $3.3 million for the nine months ended March 31, 2019. The increase in operating cash outflow is primarily attributable to our net loss of approximately $4.2 million, in which approximately $2.0 million was non-cash stock compensation expense. We had an increase of approximately $8.3 million in accounts receivable due to slower collections from customers with increased credit sales offset by approximately $2.9 million of provisions for doubtful accounts, an increase of approximately $2.5 million in long-term deposits, an increase in advances to third party suppliers of approximately $0.4 million offset by the decrease in advances to related party supplier as we collected a reimbursement of approximately $3.3 million from Zhiyuan Hong Kong, and a decrease in prepaid expenses and other current assets of approximately $0.8 million, which mainly consisted of software development costs for ERP system, various fees, including fees for leasing system hardware and other related consulting fees, incurred during the nine months ended March 31, 2019, a decrease of approximately $1.6 million due from related parties and an increase of approximately $1.3 million in accounts payable.
Investing Activities
Net cash used in investing activities was $6,979 for the nine months ended March 31, 2020, mainly for the purchase of computer equipment and making office leasehold improvement.
Net cash used in investing activities was approximately $0.1 million for the nine months ended March 31, 2019, for the purchase of a motor vehicle.
Financing Activities
Net cash provided by financing activities was $885,946 for the nine months ended March 31, 2020 due to cash proceeds received from issuance of common stock to a private investor.
Net cash provided by financing activities was $500,000 for the nine months ended March 31, 2019 due to cash proceeds received from issuance of common stock to a private investor.
Critical Accounting Policies
We prepare our unaudited condensed consolidated financial statements in accordance with U.S. GAAP. These accounting principles require us to make judgments, estimates and assumptions on the reported amounts of assets and liabilities at the end of each fiscal period, and the reported amounts of revenues and expenses during each fiscal period. We continually evaluate these judgments and estimates based on our own historical experience, knowledge and assessment of current business and other conditions, our expectations regarding the future based on available information and assumptions that we believe to be reasonable.
Effective July 1, 2019, we adopted ASU 2016-02, “Leases” (Topic 842), and elected the practical expedients that does not require us to reassess: (1) whether any expired or existing contracts are, or contain, leases, (2) lease classification for any expired or existing leases and (3) initial direct costs for any expired or existing leases. For lease terms of twelve months or fewer, a lessee is permitted to make an accounting policy election not to recognize lease assets and liabilities. We also adopted the practical expedient that allows lessees to treat the lease and non-lease components of a lease as a single lease component. We recognized lease labilities of approximately $0.3 million, with corresponding ROU assets of approximately the same amount based on the present value of the future minimum rental payments of leases, using a weighted average discount rate of 9.12%.
There have been no other material changes during the nine months ended March 31, 2020 in our significant accounting policies from those previously disclosed in the Company’s annual report for the fiscal year ended June 30, 2019. The discussion of our critical accounting policies are contained in Note 2 to our unaudited condensed consolidated financial statements in this report, “Summary of our Significant Accounting Policies”.
Item 3. Quantitative and Qualitative Disclosures about Market Risk
This Item is not applicable because we are a smaller reporting company.
Item 4. Controls and Procedures
Evaluation of Disclosure Controls and Procedures
The Company maintains controls and procedures designed to ensure that information required to be disclosed by the issuer in the reports that it files or submits under the Act (15 U.S.C. 78a et seq.) is recorded, processed, summarized and reported, within the time periods specified in the Securities and Exchange Commission’s rules and forms. Disclosure controls and procedures include, without limitation, controls and procedures designed to ensure that information required to be disclosed by an issuer in the reports that it files or submitsCommission (the “SEC”) issued under the Act is accumulated and communicated to the issuer’s management, including its principal executive and principal financial officers, or persons performing similar functions, as appropriate to allow timely decisions regarding required disclosure.
AsSection 36 of March 31, 2019, the Company carried out an evaluation, under the supervision of and with the participation of its management, including the Company’s Chief Executive Officer and Acting Chief Financial Officer, of the effectiveness of the design and operation of the Company’s disclosure controls and procedures. Based on the foregoing evaluation, Chief Executive Officer and Acting Chief Financial Officer concluded that the Company’s disclosure controls and procedures (as defined in Rules 13a-15(e) and 15d-15(e) under the Securities Exchange Act of 1934, as amended (the “Exchange Act”“Exchange Act”)) were not effective, dated March 4, 2020 (Release No. 34-88318), as modified and adequately designed to ensure that the information required to be disclosedsuperseded by the SEC order issued on March 25, 2020 (Release No. 34-88465) (collectively, the “Order”), for an extension of the original due date May 15, 2020 for the Quarterly Report. The Company inmade the reports it files or submitsoriginal filing on July 6, 2020, within 45 days, plus an additional 5 days (based on the Company’s Notification of Late Filing on Form 12b-25, filed on June 29, 2020), after the original due date, as permitted under the Order. The disclosure under the heading “Reliance on SEC Order” below is hereby added as an explanatory note at the beginning of Part I.
In addition, as required by Rule 12b-15 under the Exchange Act, is recorded, processed, summarized and reported within the time periods specified in the applicable rules and forms, and that such information was accumulated and communicated to the management, including Chief Executive Officer and Acting Chief Financial Officer, in a manner that allowed for timely decisions regarding required disclosure. The assessment stemmed from the following material weaknesses –
Changes in Internal Control over Financial Reporting.
There were no changes innew certifications by the Company’s internal control overprincipal executive officer and principal financial reporting (as defined inofficer are filed herewith as exhibits to this Amendment, under Item 19 hereof, pursuant to Rule 13a-15(f)13a-14(a) or 15d-14(a) of the Exchange Act) duringAct. Since no financial statements have been included in this Amendment and this Amendment does not contain or amend any disclosure with respect to Item 15 (Controls and Procedures), paragraphs 3, 4 and 5 of the three months ended March 31, 2019certifications have been omitted. The Company is also not including the certifications required under Section 1350 of Chapter 63 of Title 18 of the United States Code (18 U.S.C. 1350) (Section 906 of the Sarbanes-Oxley Act of 2002), as no financial statements are being filed with this Amendment.
Other than as expressly set forth herein, this Amendment does not, and does not purport to, amend, update or restate the information in the original filing of the Quarterly Report or reflect any events that have materiallyoccurred after the original filing was made. Information not affected or are reasonably likelyby this Amendment remains unchanged and reflects the disclosures made at the time as of which the original filing was made. No changes have been made to materially affect,the financial statements of the Company as contained in the original filing of the Quarterly Report. Accordingly, this Amendment should be read together with the original filing of the Quarterly Report and the Company’s internal control over financial reporting.
PART II. OTHER INFORMATIONother filings with the SEC.
Item 1. Legal ProceedingsRELIANCE ON SEC ORDER
From timeThe Company hereby notes that it has relied on the Order in delaying the filing of its Quarterly Report until July 6, 2020. On May 14, 2020, the Company filed a Current Report on Form 8-K (the “Form 8-K) to time, we have been involved in legal proceedings that ariseindicate its intention to rely on the order issued by the United States Securities and Exchange Commission (the “SEC”) on March 25, 2020 (the “Order”) to delay the filing of its Quarterly Report on Form 10-Q due to circumstances related to the COVID-19 pandemic. As described in the ordinary course of our business. We are not currently a party to any material legal or administrative proceedings. We may be involved from time to time in legal proceedings or commercial disputes, which could have a material adverse effect on our business, results of operations and financial condition.
The COVID-19 outbreak had a material impact on our operations in the third fiscal quarter of 2020 and could materially adversely affect our financial condition and results of operations for the fiscal year ending June 30, 2020.
Our business could be adversely affected by the effects of a widespread outbreak of contagious disease, including the recent outbreak of respiratory illness caused by a novel coronavirus first identified in Wuhan, Hubei Province, China. In December 2019, COVID-19 emerged in China, in which a significant portion of our business operations and management is located. AsForm 8-K, as a result of the outbreak and spread of COVID-19, and government and business continuity measures adopted in response to the pandemic, wethe Company closed ourits offices in China and had limited business operations from the Chinese New Year holiday until March 2020. OurThe Company’s operations were further disrupted by the closing of ourits U.S. offices implemented starting in late March 2020. The COVID-19 outbreak had a material adverse impact on our business and operations during the third quarter of fiscal 2020. Additionally,In addition, COVID-19 has caused severe disruptions in transportation, limited access to the facilities and limited support from workforce employed in the operations of our customers, suppliers, and logistics service providers, and as a result, we may experience a slower than expected recoveryCompany’s operations. Restrictions on access to the Company’s facilities have resulted in our services to our customers. Although we have taken all possible measures to overcomedelays by the adverse impact derived from the COVID-19 outbreak and resumed part of our normal business activities in March 2020, we expect a lower amount of revenue and profitCompany in the fourth quarterpreparation of fiscal 2020 thanits financial statements. This has hampered the same periodability of the prior year. The extentCompany to which COVID-19 may impact our resultscomplete its financial statements and prepare the Quarterly Report in time. On June 29, 2020, the Company filed a “Notification of Late Filing” on Form 12b-25 pursuant to Rule 12b-25 of the Exchange Act to further delay the filing of the Company’s Quarterly Report on Form 10-Q for the 2020 fiscal year will depend on a number of factors, including a possible second outbreak, emerging information concerning the severity of the coronavirus and the actions taken by governments and private businesses to attempt to contain the coronavirus.
Item 2. Unregistered Sales of Equity Securities and Use of Proceeds.
Except as previously reported in our Current Reports on Form 8-K, we have not sold any equity securities during the quarter ended MarchDecember 31, 2020 that were not registered under the Securities Act of 1933, as amended.2019.
Item 3. Defaults Upon Senior Securities.
None.
Item 4. Mine Safety Disclosures
Not applicable.
None.
| Item 19. | Exhibits |
The following exhibits are filed herewith:as part of this annual report:
| * | Filed herewith. |
In accordance with the requirements of the Exchange Act, the registrant caused this report to be signed on its behalf by the undersigned, thereunto duly authorized.
| SINO-GLOBAL SHIPPING AMERICA, LTD. | ||
| July | By: | /s/ Lei Cao |
| Lei Cao | ||
| Chief Executive Officer | ||
| (Principal Executive Officer) | ||
| July | By: | /s/ Tuo Pan |
| Tuo Pan | ||
| Acting Chief Financial Officer | ||
| (Principal Financial Officer and Principal Accounting Officer) | ||
453