16
| Three months ended | Nine months ended | ||||||||||||||
| September 30, | September 30, | ||||||||||||||
| 2017 | 2016 | 2017 | 2016 | ||||||||||||
| Credit losses on fixed maturity securities, available for sale, beginning of period | $ | (4.9 | ) | $ | (2.6 | ) | $ | (5.5 | ) | $ | (2.6 | ) | |||
| Add: credit losses on other-than-temporary impairments not previously recognized | — | — | — | — | |||||||||||
| Less: credit losses on securities sold | — | .1 | 1.6 | .1 | |||||||||||
| Less: credit losses on securities impaired due to intent to sell (a) | — | — | — | — | |||||||||||
| Add: credit losses on previously impaired securities | — | — | (1.0 | ) | — | ||||||||||
| Less: increases in cash flows expected on previously impaired securities | — | — | — | — | |||||||||||
| Credit losses on fixed maturity securities, available for sale, end of period | $ | (4.9 | ) | $ | (2.5 | ) | $ | (4.9 | ) | $ | (2.5 | ) | |||
CNO FINANCIAL GROUP, INC. AND SUBSIDIARIES
Notes to Consolidated Financial Statements
(unaudited)
___________________
If we intend to sell an impaired fixed maturity security, available for sale, or identify an impaired fixed maturity security, available for sale, for which it is more likely than not we will be required to sell before anticipated recovery, the difference between the fair value and the amortized cost is included in other investment gains (losses) and the fair value becomes the new amortized cost. The new cost basis is not adjusted for any subsequent recoveries in fair value.
The Company reports accrued investment income separately from fixed maturities, available for sale, and has elected not to measure an allowance for credit losses for accrued investment income. Accrued investment income is written off through net investment income at the time the issuer of the bond defaults or is expected to default on payments.
Accumulated other comprehensive income (loss), included in shareholders' equity as of March 31, 2023 and December 31, 2022, is comprised of the following (dollars in millions):
| March 31, 2023 | December 31, 2022 | ||||||||||
| Net unrealized losses on investments having no allowance for credit losses | $ | (937.1) | $ | (1,247.0) | |||||||
| Unrealized losses on investments with an allowance for credit losses | (1,453.6) | (1,780.7) | |||||||||
| Change in discount rates for liability for future policy benefits | 237.4 | 500.7 | |||||||||
| Change in instrument-specific credit risk for market risk benefits | 13.1 | 12.2 | |||||||||
| Deferred income tax assets | 475.8 | 557.5 | |||||||||
| Accumulated other comprehensive loss | $ | (1,664.4) | $ | (1,957.3) | |||||||
At March 31, 2023, the amortized cost, gross unrealized gains, gross unrealized losses, allowance for credit losses and estimated fair value of fixed maturities, available for sale, were as follows (dollars in millions):
| Amortized cost | Gross unrealized gains | Gross unrealized losses | Allowance for credit losses | Estimated fair value | |||||||||||||||||||||||||
| Corporate securities | $ | 13,497.0 | $ | 66.3 | $ | (1,529.7) | $ | (57.2) | $ | 11,976.4 | |||||||||||||||||||
| United States Treasury securities and obligations of United States government corporations and agencies | 174.7 | .1 | (4.7) | — | 170.1 | ||||||||||||||||||||||||
| States and political subdivisions | 2,789.4 | 34.1 | (360.1) | (.8) | 2,462.6 | ||||||||||||||||||||||||
| Foreign governments | 88.8 | .2 | (9.9) | (.5) | 78.6 | ||||||||||||||||||||||||
| Asset-backed securities | 1,458.6 | 2.4 | (120.2) | (.6) | 1,340.2 | ||||||||||||||||||||||||
| Agency residential mortgage-backed securities | 213.3 | 2.8 | (.2) | — | 215.9 | ||||||||||||||||||||||||
| Non-agency residential mortgage-backed securities | 1,778.2 | 37.2 | (174.9) | — | 1,640.5 | ||||||||||||||||||||||||
| Collateralized loan obligations | 954.3 | .5 | (35.9) | — | 918.9 | ||||||||||||||||||||||||
| Commercial mortgage-backed securities | 2,563.6 | .1 | (259.8) | — | 2,303.9 | ||||||||||||||||||||||||
| Total fixed maturities, available for sale | $ | 23,517.9 | $ | 143.7 | $ | (2,495.4) | $ | (59.1) | $ | 21,107.1 | |||||||||||||||||||
17
CNO FINANCIAL GROUP, INC. AND SUBSIDIARIES
Notes to Consolidated Financial Statements
(unaudited)
___________________
At December 31, 2022, the amortized cost, gross unrealized gains, gross unrealized losses, allowance for credit losses and estimated fair value of fixed maturities, available for sale, were as follows (dollars in millions):
| Amortized cost | Gross unrealized gains | Gross unrealized losses | Allowance for credit losses | Estimated fair value | |||||||||||||||||||||||||
| Corporate securities | $ | 13,649.1 | $ | 29.9 | $ | (1,911.9) | $ | (54.4) | $ | 11,712.7 | |||||||||||||||||||
| United States Treasury securities and obligations of United States government corporations and agencies | 171.7 | — | (13.0) | — | 158.7 | ||||||||||||||||||||||||
| States and political subdivisions | 2,846.9 | 19.3 | (476.8) | (.9) | 2,388.5 | ||||||||||||||||||||||||
| Foreign governments | 86.3 | .1 | (11.3) | (.4) | 74.7 | ||||||||||||||||||||||||
| Asset-backed securities | 1,435.7 | 1.0 | (149.4) | (.3) | 1,287.0 | ||||||||||||||||||||||||
| Agency residential mortgage-backed securities | 174.3 | 1.4 | (.7) | — | 175.0 | ||||||||||||||||||||||||
| Non-agency residential mortgage-backed securities | 1,700.4 | 40.0 | (191.9) | — | 1,548.5 | ||||||||||||||||||||||||
| Collateralized loan obligations | 825.2 | .3 | (39.6) | — | 785.9 | ||||||||||||||||||||||||
| Commercial mortgage-backed securities | 2,494.6 | .1 | (272.3) | — | 2,222.4 | ||||||||||||||||||||||||
| Total fixed maturities, available for sale | $ | 23,384.2 | $ | 92.1 | $ | (3,066.9) | $ | (56.0) | $ | 20,353.4 | |||||||||||||||||||
The following table sets forth the amortized cost and estimated fair value of fixed maturities, available for sale, at March 31, 2023, by contractual maturity. Actual maturities will differ from contractual maturities because borrowers may have the right to call or prepay obligations with or without penalties. Structured securities (such as asset-backed securities, agency residential mortgage-backed securities, non-agency residential mortgage-backed securities, collateralized loan obligations and commercial mortgage-backed securities, collectively referred to as "structured securities") frequently include provisions for periodic principal payments and permit periodic unscheduled payments.
| Amortized cost | Estimated fair value | ||||||||||
| (Dollars in millions) | |||||||||||
| Due in one year or less | $ | 140.1 | $ | 138.7 | |||||||
| Due after one year through five years | 2,209.3 | 2,080.0 | |||||||||
| Due after five years through ten years | 1,871.8 | 1,742.8 | |||||||||
| Due after ten years | 12,328.7 | 10,726.2 | |||||||||
| Subtotal | 16,549.9 | 14,687.7 | |||||||||
| Structured securities | 6,968.0 | 6,419.4 | |||||||||
| Total fixed maturities, available for sale | $ | 23,517.9 | $ | 21,107.1 | |||||||
18
CNO FINANCIAL GROUP, INC. AND SUBSIDIARIES
Notes to Consolidated Financial Statements
(unaudited)
___________________
The following table sets forth the amortized cost and estimated fair value of fixed maturities, available for sale, at December 31, 2022, by contractual maturity.
| Amortized cost | Estimated fair value | ||||||||||
| (Dollars in millions) | |||||||||||
| Due in one year or less | $ | 112.0 | $ | 110.8 | |||||||
| Due after one year through five years | 1,913.7 | 1,790.2 | |||||||||
| Due after five years through ten years | 2,098.9 | 1,910.4 | |||||||||
| Due after ten years | 12,629.4 | 10,523.2 | |||||||||
| Subtotal | 16,754.0 | 14,334.6 | |||||||||
| Structured securities | 6,630.2 | 6,018.8 | |||||||||
| Total fixed maturities, available for sale | $ | 23,384.2 | $ | 20,353.4 | |||||||
Gross Unrealized Investment Losses
Our investment strategy is to maximize, over a sustained period and within acceptable parameters of quality and risk, investment income and total investment return through active strategic asset allocation and investment management. Accordingly, we may sell securities at a gain or a loss to enhance the projected total return of the portfolio as market opportunities change, to reflect changing perceptions of risk, or to better match certain characteristics of our investment portfolio with the corresponding characteristics of our insurance liabilities.
The following table summarizes the gross unrealized losses and fair values of our investments with unrealized losses that arefor which an allowance for credit losses has not deemed to be other-than-temporarily impaired,been recorded, aggregated by investment category and length of time that such securities have been in a continuous unrealized loss position, at September 30, 2017March 31, 2023 (dollars in millions):
| Less than 12 months | 12 months or greater | Total | ||||||||||||||||||||||||||||||||||||
| Description of securities | Fair value | Unrealized losses | Fair value | Unrealized losses | Fair value | Unrealized losses | ||||||||||||||||||||||||||||||||
| Corporate securities | $ | 973.1 | $ | (35.5) | $ | 1,979.4 | $ | (322.6) | $ | 2,952.5 | $ | (358.1) | ||||||||||||||||||||||||||
| United States Treasury securities and obligations of United States government corporations and agencies | 106.8 | (1.2) | 33.7 | (3.5) | 140.5 | (4.7) | ||||||||||||||||||||||||||||||||
| States and political subdivisions | 207.5 | (11.2) | 397.4 | (97.1) | 604.9 | (108.3) | ||||||||||||||||||||||||||||||||
| Foreign governments | 15.2 | (.3) | 13.3 | (1.2) | 28.5 | (1.5) | ||||||||||||||||||||||||||||||||
| Asset-backed securities | 388.9 | (12.9) | 775.0 | (103.2) | 1,163.9 | (116.1) | ||||||||||||||||||||||||||||||||
| Agency residential mortgage-backed securities | 33.4 | (.2) | .6 | — | 34.0 | (.2) | ||||||||||||||||||||||||||||||||
| Non-agency residential mortgage-backed securities | 560.9 | (27.1) | 718.0 | (147.8) | 1,278.9 | (174.9) | ||||||||||||||||||||||||||||||||
| Collateralized loan obligations | 282.6 | (6.5) | 551.7 | (29.4) | 834.3 | (35.9) | ||||||||||||||||||||||||||||||||
| Commercial mortgage-backed securities | 520.3 | (13.7) | 1,738.3 | (246.1) | 2,258.6 | (259.8) | ||||||||||||||||||||||||||||||||
| Total fixed maturities, available for sale | $ | 3,088.7 | $ | (108.6) | $ | 6,207.4 | $ | (950.9) | $ | 9,296.1 | $ | (1,059.5) | ||||||||||||||||||||||||||
19
| Less than 12 months | 12 months or greater | Total | ||||||||||||||||||||||
| Description of securities | Fair value | Unrealized losses | Fair value | Unrealized losses | Fair value | Unrealized losses | ||||||||||||||||||
| United States Treasury securities and obligations of United States government corporations and agencies | $ | 20.3 | $ | — | $ | .6 | $ | — | $ | 20.9 | $ | — | ||||||||||||
| States and political subdivisions | 35.1 | (.6 | ) | 19.3 | (.3 | ) | 54.4 | (.9 | ) | |||||||||||||||
| Debt securities issued by foreign governments | 10.5 | (.1 | ) | — | — | 10.5 | (.1 | ) | ||||||||||||||||
| Corporate securities | 666.9 | (7.8 | ) | 400.4 | (25.2 | ) | 1,067.3 | (33.0 | ) | |||||||||||||||
| Asset-backed securities | 276.7 | (1.3 | ) | 79.6 | (1.8 | ) | 356.3 | (3.1 | ) | |||||||||||||||
| Collateralized debt obligations | 24.0 | — | — | — | 24.0 | — | ||||||||||||||||||
| Commercial mortgage-backed securities | 226.2 | (1.3 | ) | 221.9 | (8.8 | ) | 448.1 | (10.1 | ) | |||||||||||||||
| Collateralized mortgage obligations | 72.8 | (.5 | ) | 11.6 | (.1 | ) | 84.4 | (.6 | ) | |||||||||||||||
| Total fixed maturities, available for sale | $ | 1,332.5 | $ | (11.6 | ) | $ | 733.4 | $ | (36.2 | ) | $ | 2,065.9 | $ | (47.8 | ) | |||||||||
| Equity securities | $ | 37.4 | $ | (.8 | ) | $ | 89.7 | $ | (1.8 | ) | $ | 127.1 | $ | (2.6 | ) | |||||||||
CNO FINANCIAL GROUP, INC. AND SUBSIDIARIES
Notes to Consolidated Financial Statements
(unaudited)
___________________
The following table summarizes the gross unrealized losses and fair values of our investments with unrealized losses that arefor which an allowance for credit losses has not deemed to be other-than-temporarily impaired,been recorded, aggregated by investment category and length of time that such securities have been in a continuous unrealized loss position, at December 31, 20162022 (dollars in millions):
| Less than 12 months | 12 months or greater | Total | ||||||||||||||||||||||||||||||||||||
| Description of securities | Fair value | Unrealized losses | Fair value | Unrealized losses | Fair value | Unrealized losses | ||||||||||||||||||||||||||||||||
| Corporate securities | $ | 2,830.8 | $ | (329.4) | $ | 370.4 | $ | (129.3) | $ | 3,201.2 | $ | (458.7) | ||||||||||||||||||||||||||
| United States Treasury securities and obligations of United States government corporations and agencies | 134.4 | (9.6) | 21.9 | (3.4) | 156.3 | (13.0) | ||||||||||||||||||||||||||||||||
| States and political subdivisions | 667.0 | (124.8) | 132.1 | (58.5) | 799.1 | (183.3) | ||||||||||||||||||||||||||||||||
| Foreign governments | 35.0 | (3.5) | 2.1 | (.3) | 37.1 | (3.8) | ||||||||||||||||||||||||||||||||
| Asset-backed securities | 914.0 | (90.1) | 258.1 | (53.4) | 1,172.1 | (143.5) | ||||||||||||||||||||||||||||||||
| Agency residential mortgage-backed securities | 59.7 | (.7) | — | — | 59.7 | (.7) | ||||||||||||||||||||||||||||||||
| Non-agency residential mortgage-backed securities | 861.6 | (89.7) | 335.4 | (102.2) | 1,197.0 | (191.9) | ||||||||||||||||||||||||||||||||
| Collateralized loan obligations | 553.0 | (27.4) | 184.2 | (12.2) | 737.2 | (39.6) | ||||||||||||||||||||||||||||||||
| Commercial mortgage-backed securities | 1,581.4 | (160.0) | 593.3 | (112.3) | 2,174.7 | (272.3) | ||||||||||||||||||||||||||||||||
| Total fixed maturities, available for sale | $ | 7,636.9 | $ | (835.2) | $ | 1,897.5 | $ | (471.6) | $ | 9,534.4 | $ | (1,306.8) | ||||||||||||||||||||||||||
| Less than 12 months | 12 months or greater | Total | ||||||||||||||||||||||
| Description of securities | Fair value | Unrealized losses | Fair value | Unrealized losses | Fair value | Unrealized losses | ||||||||||||||||||
| United States Treasury securities and obligations of United States government corporations and agencies | $ | 8.0 | $ | — | $ | — | $ | — | $ | 8.0 | $ | — | ||||||||||||
| States and political subdivisions | 176.3 | (7.8 | ) | 18.3 | (1.8 | ) | 194.6 | (9.6 | ) | |||||||||||||||
| Debt securities issued by foreign governments | 18.9 | (.4 | ) | — | — | 18.9 | (.4 | ) | ||||||||||||||||
| Corporate securities | 1,907.6 | (75.5 | ) | 559.6 | (63.5 | ) | 2,467.2 | (139.0 | ) | |||||||||||||||
| Asset-backed securities | 692.9 | (8.5 | ) | 262.5 | (7.0 | ) | 955.4 | (15.5 | ) | |||||||||||||||
| Collateralized debt obligations | 38.3 | (.1 | ) | 30.8 | (.2 | ) | 69.1 | (.3 | ) | |||||||||||||||
| Commercial mortgage-backed securities | 525.2 | (16.6 | ) | 154.0 | (11.3 | ) | 679.2 | (27.9 | ) | |||||||||||||||
| Collateralized mortgage obligations | 73.6 | (.6 | ) | 34.6 | (1.0 | ) | 108.2 | (1.6 | ) | |||||||||||||||
| Total fixed maturities, available for sale | $ | 3,440.8 | $ | (109.5 | ) | $ | 1,059.8 | $ | (84.8 | ) | $ | 4,500.6 | $ | (194.3 | ) | |||||||||
| Equity securities | $ | 239.4 | $ | (8.0 | ) | $ | — | $ | — | $ | 239.4 | $ | (8.0 | ) | ||||||||||
Based on management's current assessment of investments with unrealized losses at September 30, 2017,March 31, 2023, the Company believes the issuers of the securities will continue to meet their obligations (or with respect to equity-type securities, the investment value will recover to its cost basis).obligations. While we do not have the intent to sell securities with unrealized losses and it is not more likely than not that we will be required to sell securities with unrealized losses prior to their anticipated recovery, our intent on an individual security may change, based upon market or other unforeseen developments. In such instances, if a loss is recognized from a sale subsequent to a balance sheet date due to these unexpected developments, the loss is recognized in the period in which we had the intent to sell the security before its anticipated recovery.
20
CNO FINANCIAL GROUP, INC. AND SUBSIDIARIES
Notes to Consolidated Financial Statements
(unaudited)
___________________
The following table summarizes changes in the allowance for credit losses related to fixed maturities, available for sale, for the three months ended March 31, 2023 (dollars in millions):
| Corporate securities | States and political subdivisions | Foreign governments | Asset-backed securities | Total | |||||||||||||||||||||||||||||||
| Allowance at December 31, 2022 | $ | 54.4 | $ | .9 | $ | .4 | $ | .3 | $ | 56.0 | |||||||||||||||||||||||||
| Additions for securities for which credit losses were not previously recorded | 3.0 | — | — | — | 3.0 | ||||||||||||||||||||||||||||||
| Additions for purchased securities with deteriorated credit | — | — | — | — | — | ||||||||||||||||||||||||||||||
| Additions (reductions) for securities where an allowance was previously recorded | .5 | (.1) | .1 | .3 | .8 | ||||||||||||||||||||||||||||||
| Reduction for securities sold during the period | (.7) | — | — | — | (.7) | ||||||||||||||||||||||||||||||
| Reduction for securities for which the Company made the decision to sell where an allowance was previously recorded | — | — | — | — | — | ||||||||||||||||||||||||||||||
| Write-offs | — | — | — | — | — | ||||||||||||||||||||||||||||||
| Recoveries of previously written-off amount | — | — | — | — | — | ||||||||||||||||||||||||||||||
| Allowance at March 31, 2023 | $ | 57.2 | $ | .8 | $ | .5 | $ | .6 | $ | 59.1 | |||||||||||||||||||||||||
The following table summarizes changes in the allowance for credit losses related to fixed maturities, available for sale, for the three months ended March 31, 2022 (dollars in millions):
| Corporate securities | States and political subdivisions | Foreign governments | Asset-backed securities | Total | |||||||||||||||||||||||||||||||
| Allowance at December 31, 2021 | $ | 7.4 | $ | — | $ | .2 | $ | — | $ | 7.6 | |||||||||||||||||||||||||
| Additions for securities for which credit losses were not previously recorded | 14.0 | .3 | .1 | — | 14.4 | ||||||||||||||||||||||||||||||
| Additions for purchased securities with deteriorated credit | — | — | — | — | — | ||||||||||||||||||||||||||||||
| Additions (reductions) for securities where an allowance was previously recorded | 14.6 | .5 | (.2) | .1 | 15.0 | ||||||||||||||||||||||||||||||
| Reduction for securities sold during the period | (.4) | — | — | — | (.4) | ||||||||||||||||||||||||||||||
| Reduction for securities for which the Company made the decision to sell where an allowance was previously recorded | — | — | — | — | — | ||||||||||||||||||||||||||||||
| Write-offs | — | — | — | — | — | ||||||||||||||||||||||||||||||
| Recoveries of previously written-off amount | — | — | — | — | — | ||||||||||||||||||||||||||||||
| Allowance at March 31, 2022 | $ | 35.6 | $ | .8 | $ | .1 | $ | .1 | $ | 36.6 | |||||||||||||||||||||||||
21
CNO FINANCIAL GROUP, INC. AND SUBSIDIARIES
Notes to Consolidated Financial Statements
(unaudited)
___________________
Mortgage Loans
Mortgage loans are carried at amortized unpaid balance, net of allowance for estimated credit losses. Interest income is accrued on the principal amount of the loan based on the loan's contractual interest rate. Payment terms specified for mortgage loans may include a prepayment penalty for unscheduled payoff of the investment. Prepayment penalties are recognized as investment income when received.
The allowance for estimated credit losses is measured using a loss-rate method on an individual asset basis. Inputs used include asset-specific characteristics, current economic conditions, historical loss information and reasonable and supportable forecasts about future economic conditions.
At March 31, 2023, the mortgage loan balance was primarily comprised of commercial mortgage loans and there were no commercial mortgage loans in process of foreclosure. At March 31, 2023, we held residential mortgage loan investments with an amortized cost and fair value of $409.4 million and $407.2 million, respectively. At March 31, 2023, there were four residential mortgage loans that were noncurrent with a carrying value of $1.1 million (of which, two loans with a carrying value of $0.5 million were in foreclosure).
The following table provides the amortized cost by year of origination and estimated fair value of our outstanding commercial mortgage loans and the underlying collateral as of March 31, 2023 (dollars in millions):
| Estimated fair value | ||||||||||||||||||||||||||||||||||||||||||||||||||||||||
| Loan-to-value ratio (a) | 2023 | 2022 | 2021 | 2020 | 2019 | Prior | Total amortized cost | Mortgage loans | Collateral | |||||||||||||||||||||||||||||||||||||||||||||||
| Less than 60% | $ | 73.6 | $ | 178.7 | $ | 114.4 | $ | 37.4 | $ | 75.1 | $ | 494.2 | $ | 973.4 | $ | 884.3 | $ | 3,553.3 | ||||||||||||||||||||||||||||||||||||||
| 60% to less than 70% | — | 87.3 | 26.2 | 5.7 | — | 56.8 | 176.0 | 159.7 | 269.3 | |||||||||||||||||||||||||||||||||||||||||||||||
| 70% to less than 80% | — | 47.8 | 10.1 | — | — | 43.2 | 101.1 | 86.8 | 138.4 | |||||||||||||||||||||||||||||||||||||||||||||||
| 80% to less than 90% | — | — | — | — | — | — | — | — | — | |||||||||||||||||||||||||||||||||||||||||||||||
| 90% or greater | — | — | — | — | — | 24.6 | 24.6 | 19.5 | 26.1 | |||||||||||||||||||||||||||||||||||||||||||||||
| Total | $ | 73.6 | $ | 313.8 | $ | 150.7 | $ | 43.1 | $ | 75.1 | $ | 618.8 | $ | 1,275.1 | $ | 1,150.3 | $ | 3,987.1 | ||||||||||||||||||||||||||||||||||||||
________________
(a)Loan-to-value ratios are calculated as the ratio of: (i) the amortized cost of the commercial mortgage loans; to (ii) the estimated fair value of the underlying collateral.
The following table summarizes changes in the allowance for credit losses related to mortgage loans for the three months ended March 31, 2023 and 2022 (dollars in millions):
| Three months ended | ||||||||||||||
| March 31, | ||||||||||||||
| 2023 | 2022 | |||||||||||||
| Allowance at the beginning of the period | $ | 8.0 | $ | 5.6 | ||||||||||
| Current period provision for expected credit losses | .4 | (.5) | ||||||||||||
| Initial allowance recognized for purchased financial assets with credit deterioration | — | — | ||||||||||||
| Write-offs charged against the allowance | — | — | ||||||||||||
| Recoveries of amounts previously written off | — | — | ||||||||||||
| Allowance at the end of the period | $ | 8.4 | $ | 5.1 | ||||||||||
22
CNO FINANCIAL GROUP, INC. AND SUBSIDIARIES
Notes to Consolidated Financial Statements
(unaudited)
___________________
Total Investment Gains (Losses)
The following table sets forth the total investment gains (losses) for the periods indicated (dollars in millions):
| Three months ended | |||||||||||||||||||||||
| March 31, | |||||||||||||||||||||||
| 2023 | 2022 | ||||||||||||||||||||||
| Realized investment gains (losses): | |||||||||||||||||||||||
| Gross realized gains on sales of fixed maturities, available for sale | $ | 7.3 | $ | 54.8 | |||||||||||||||||||
| Gross realized losses on sales of fixed maturities, available for sale | (14.4) | (30.6) | |||||||||||||||||||||
| Equity securities, net | (.2) | (4.7) | |||||||||||||||||||||
| Other, net | (7.3) | (.7) | |||||||||||||||||||||
| Total realized investment gains (losses) | (14.6) | 18.8 | |||||||||||||||||||||
| Change in allowance for credit losses (a) | (1.5) | (30.7) | |||||||||||||||||||||
| Change in fair value of equity securities (b) | .4 | (1.2) | |||||||||||||||||||||
| Other changes in fair value (c) | 1.1 | (19.6) | |||||||||||||||||||||
| Other investment losses | — | (51.5) | |||||||||||||||||||||
| Total investment losses | $ | (14.6) | $ | (32.7) | |||||||||||||||||||
_________________
(a) Changes in the allowance for credit losses includes $2.0 million and $(2.2) million in the three months ended March 31, 2023 and 2022, respectively, related to investments held by variable interest entities ("VIEs").
(b) Changes in the estimated fair value of equity securities (that are still held as of the end of the respective periods) were $0.3 million and $(5.2) million for the three months ended March 31, 2023 and 2022, respectively.
(c) Changes in the estimated fair value of trading securities that we have elected the fair value option (that are still held as of the end of the respective periods) were $(2.5) million and $(12.8) million in the three months ended March 31, 2023 and 2022, respectively.
During the first three months of 2023, we recognized net investment losses of $14.6 million, which were comprised of: (i) $10.8 million of net losses from the sales of investments; (ii) $0.3 million of gains related to equity securities, including the change in fair value; (iii) $4.0 million of losses related to certain fixed maturity investments with embedded derivatives, including the change in fair value; (iv) the increase in fair value of embedded derivatives related to a modified coinsurance agreement of $1.4 million; and (v) an increase in the allowance for credit losses of $1.5 million.
During the first three months of 2022, we recognized net investment losses of $32.7 million, which were comprised of: (i) $23.5 million of net gains from the sales of investments; (ii) $5.9 million of losses related to equity securities, including the change in fair value; (iii) the decrease in fair value of certain fixed maturity investments with embedded derivatives of $13.1 million; (iv) the decrease in fair value of embedded derivatives related to a modified coinsurance agreement of $6.5 million; and (v) an increase in the allowance for credit losses of $30.7 million.
Our fixed maturity investments are generally purchased in the context of various long-term strategies, including funding insurance liabilities, so we do not generally seek to generate short-term realized gains through the purchase and sale of such securities. In certain circumstances, including those in which securities are selling at prices which exceed our view of their underlying economic value, or when it is possible to reinvest the proceeds to better meet our long-term asset-liability objectives, we may sell certain securities.
At March 31, 2023, there were no fixed maturity investments in default.
During the first three months of 2023, the $14.4 million of gross realized losses on sales of $288.5 million of fixed maturity securities, available for sale, included: (i) $11.1 million related to various corporate securities; (ii) $2.2 million related to commercial mortgage-backed securities; and (iii) $1.1 million related to various other investments. Securities are generally sold at a loss following unforeseen issuer-specific events or conditions or shifts in perceived relative values. These reasons
23
CNO FINANCIAL GROUP, INC. AND SUBSIDIARIES
Notes to Consolidated Financial Statements
(unaudited)
___________________
include but are not limited to: (i) changes in the investment environment; (ii) expectation that the market value could deteriorate; (iii) our desire to reduce our exposure to an asset class, an issuer or an industry; (iv) prospective or actual changes in credit quality; (v) better match certain characteristics of our investment portfolio with the corresponding characteristics of our insurance liabilities; or (vi) changes in expected portfolio cash flows.
During the first three months of 2022, the $30.6 million of gross realized losses on sales of $786.6 million of fixed maturity securities, available for sale, included: (i) $14.6 million related to various corporate securities; (ii) $9.8 million related to non-agency residential mortgage-backed securities; (iii) $4.2 million related to states and political subdivisions; and (iv) $2.0 million related to various other investments.
Future events may occur, or additional information may become available, which may necessitate future realized losses in our portfolio. Significant losses could have a material adverse effect on our consolidated financial statements in future periods.
24
CNO FINANCIAL GROUP, INC. AND SUBSIDIARIES
Notes to Consolidated Financial Statements
(unaudited)
___________________
LIABILITIES FOR INSURANCE PRODUCTS
The liability for future policy benefits is determined based on numerous assumptions. The most significant assumptions for our life and annuity business are mortality and lapse/withdrawal rates which are based on our experience and, in cases of limited experience, industry experience. Mortality and lapse/withdrawal rates also take into consideration future expectations in policyholder behavior that may vary from past experience. For our health business, mortality rates, lapse rates, morbidity assumptions and future rate increases are based on our experience and, in cases of limited experience, industry experience. Such assumptions also consider future expectations in policyholder behavior that may vary from past experience.
In the first quarter of 2023, we reviewed the actual mortality, lapse, and morbidity experience for the quarter and determined that no changes to assumptions for future cash flows were necessary. This is consistent with the impact in the "Effect of actual variances from expected experience" line items in the tables below, which indicate our actual experience did not deviate significantly from our expectations.
The following tables summarize balances and changes in the liability for future policy benefits for traditional and limited-payment contracts for the three months ended March 31, 2023 (dollars in millions):
| Three months ended | ||||||||||||||||||||||||||||||||
| March 31, 2023 | ||||||||||||||||||||||||||||||||
| Supplemental health | Medicare supplement | Long-term care | Traditional life | Other annuities | ||||||||||||||||||||||||||||
| Present value of expected net premiums ("PVENP"), beginning of period | $ | 2,781.3 | $ | 2,800.6 | $ | 1,034.1 | $ | 2,175.0 | $ | — | ||||||||||||||||||||||
| Effect of changes in discount rate assumptions, beginning of period | 188.4 | 196.4 | 23.2 | 137.1 | — | |||||||||||||||||||||||||||
| Beginning PVENP at original discount rate | 2,969.7 | 2,997.0 | 1,057.3 | 2,312.1 | — | |||||||||||||||||||||||||||
| Effect of changes in cash flow assumptions | — | — | — | — | — | |||||||||||||||||||||||||||
| Effect of actual variances from expected experience | (17.2) | 27.0 | (3.4) | (14.1) | — | |||||||||||||||||||||||||||
| Adjusted beginning of period PVENP | 2,952.5 | 3,024.0 | 1,053.9 | 2,298.0 | — | |||||||||||||||||||||||||||
| Issuances | 63.7 | 101.6 | 15.7 | 108.3 | 1.1 | |||||||||||||||||||||||||||
| Interest accrual | 32.0 | 30.5 | 12.3 | 23.0 | — | |||||||||||||||||||||||||||
| Net premiums collected | (90.3) | (113.4) | (40.6) | (101.4) | (1.1) | |||||||||||||||||||||||||||
| Ending PVENP at original discount rate | 2,957.9 | 3,042.7 | 1,041.3 | 2,327.9 | — | |||||||||||||||||||||||||||
| Effect of changes in discount rate assumptions, end of period | (120.4) | (139.2) | (4.6) | (92.5) | — | |||||||||||||||||||||||||||
| PVENP, end of period | $ | 2,837.5 | $ | 2,903.5 | $ | 1,036.7 | $ | 2,235.4 | $ | — | ||||||||||||||||||||||
| Present value of expected future policy benefits ("PVEFPB"), beginning of period | $ | 5,886.8 | $ | 3,033.1 | $ | 4,158.1 | $ | 4,417.9 | $ | 310.9 | ||||||||||||||||||||||
| Effect of changes in discount rate assumptions, beginning of period | 483.3 | 212.0 | 28.5 | 336.6 | 15.4 | |||||||||||||||||||||||||||
| Beginning PVEFPB at original discount rate | 6,370.1 | 3,245.1 | 4,186.6 | 4,754.5 | 326.3 | |||||||||||||||||||||||||||
| Effect of changes in cash flow assumptions | — | — | — | — | — | |||||||||||||||||||||||||||
| Effect of actual variances from expected experience | (20.5) | 32.2 | (6.3) | (15.2) | .7 | |||||||||||||||||||||||||||
| Adjusted beginning of period PVEFPB | 6,349.6 | 3,277.3 | 4,180.3 | 4,739.3 | 327.0 | |||||||||||||||||||||||||||
| Issuances | 63.7 | 101.6 | 15.7 | 108.3 | 1.1 | |||||||||||||||||||||||||||
| Interest accrual | 73.8 | 33.2 | 55.5 | 51.0 | 3.7 | |||||||||||||||||||||||||||
| Benefit payments | (99.5) | (125.6) | (71.3) | (115.0) | (8.6) | |||||||||||||||||||||||||||
| Ending PVEFPB at original discount rate | 6,387.6 | 3,286.5 | 4,180.2 | 4,783.6 | 323.2 | |||||||||||||||||||||||||||
| Effect of changes in discount rate assumptions, end of period | (306.8) | (150.0) | 86.4 | (223.0) | (6.9) | |||||||||||||||||||||||||||
| PVEFPB, end of period | $ | 6,080.8 | $ | 3,136.5 | $ | 4,266.6 | $ | 4,560.6 | $ | 316.3 | ||||||||||||||||||||||
| Net liability for future policy benefits | $ | 3,243.3 | $ | 233.0 | $ | 3,229.9 | $ | 2,325.2 | $ | 316.3 | ||||||||||||||||||||||
| Flooring impact | — | .4 | — | — | — | |||||||||||||||||||||||||||
| Adjusted net liability for future policy benefits | 3,243.3 | 233.4 | 3,229.9 | 2,325.2 | 316.3 | |||||||||||||||||||||||||||
| Related reinsurance recoverable | (2.4) | — | (357.5) | (201.1) | — | |||||||||||||||||||||||||||
| Net liability for future policy benefits, net of reinsurance recoverable | $ | 3,240.9 | $ | 233.4 | $ | 2,872.4 | $ | 2,124.1 | $ | 316.3 | ||||||||||||||||||||||
25
CNO FINANCIAL GROUP, INC. AND SUBSIDIARIES
Notes to Consolidated Financial Statements
(unaudited)
___________________
The following tables summarize balances and changes in the liability for future policy benefits for traditional and limited-payment contracts for the three months ended March 31, 2022 (dollars in millions):
| Three months ended | ||||||||||||||||||||||||||||||||
| March 31, 2022 | ||||||||||||||||||||||||||||||||
| Supplemental health | Medicare supplement | Long-term care | Traditional life | Other annuities | ||||||||||||||||||||||||||||
| PVENP, beginning of period | $ | 3,496.8 | $ | 3,454.0 | $ | 1,313.4 | $ | 2,483.7 | $ | — | ||||||||||||||||||||||
| Effect of changes in discount rate assumptions, beginning of period | (525.6) | (341.8) | (183.2) | (239.4) | — | |||||||||||||||||||||||||||
| Beginning PVENP at original discount rate | 2,971.2 | 3,112.2 | 1,130.2 | 2,244.3 | — | |||||||||||||||||||||||||||
| Effect of changes in cash flow assumptions | — | — | — | — | — | |||||||||||||||||||||||||||
| Effect of actual variances from expected experience | 6.3 | 21.2 | (8.9) | (11.8) | — | |||||||||||||||||||||||||||
| Adjusted beginning of period PVENP | 2,977.5 | 3,133.4 | 1,121.3 | 2,232.5 | — | |||||||||||||||||||||||||||
| Issuances | 80.6 | 68.0 | 25.7 | 149.3 | 1.6 | |||||||||||||||||||||||||||
| Interest accrual | 31.3 | 30.4 | 13.1 | 20.9 | — | |||||||||||||||||||||||||||
| Net premiums collected | (89.5) | (119.0) | (42.7) | (99.9) | (1.6) | |||||||||||||||||||||||||||
| Ending PVENP at original discount rate | 2,999.9 | 3,112.8 | 1,117.4 | 2,302.8 | — | |||||||||||||||||||||||||||
| Effect of changes in discount rate assumptions, end of period | 213.4 | 112.1 | 94.2 | 72.5 | — | |||||||||||||||||||||||||||
| PVENP, end of period | $ | 3,213.3 | $ | 3,224.9 | $ | 1,211.6 | $ | 2,375.3 | $ | — | ||||||||||||||||||||||
| PVEFPB, beginning of period | $ | 7,688.0 | $ | 3,750.5 | $ | 5,501.6 | $ | 5,395.7 | $ | 431.9 | ||||||||||||||||||||||
| Effect of changes in discount rate assumptions, beginning of period | (1,414.8) | (373.8) | (1,291.2) | (767.3) | (88.4) | |||||||||||||||||||||||||||
| Beginning PVEFPB at original discount rate | 6,273.2 | 3,376.7 | 4,210.4 | 4,628.4 | 343.5 | |||||||||||||||||||||||||||
| Effect of changes in cash flow assumptions | — | — | — | — | — | |||||||||||||||||||||||||||
| Effect of actual variances from expected experience | 5.6 | 21.5 | (9.2) | (8.5) | (1.3) | |||||||||||||||||||||||||||
| Adjusted beginning of period PVEFPB | 6,278.8 | 3,398.2 | 4,201.2 | 4,619.9 | 342.2 | |||||||||||||||||||||||||||
| Issuances | 80.8 | 67.3 | 25.7 | 149.4 | 1.9 | |||||||||||||||||||||||||||
| Interest accrual | 72.5 | 33.2 | 56.1 | 48.8 | 3.9 | |||||||||||||||||||||||||||
| Benefit payments | (99.5) | (123.3) | (64.2) | (128.8) | (9.3) | |||||||||||||||||||||||||||
| Ending PVEFPB at original discount rate | 6,332.6 | 3,375.4 | 4,218.8 | 4,689.3 | 338.7 | |||||||||||||||||||||||||||
| Effect of changes in discount rate assumptions, end of period | 622.3 | 123.9 | 747.4 | 296.2 | 44.6 | |||||||||||||||||||||||||||
| PVEFPB, end of period | $ | 6,954.9 | $ | 3,499.3 | $ | 4,966.2 | $ | 4,985.5 | $ | 383.3 | ||||||||||||||||||||||
| Net liability for future policy benefits | $ | 3,741.6 | $ | 274.4 | $ | 3,754.6 | $ | 2,610.2 | $ | 383.3 | ||||||||||||||||||||||
| Flooring impact | 1.5 | .2 | .6 | .4 | — | |||||||||||||||||||||||||||
| Adjusted net liability for future policy benefits | 3,743.1 | 274.6 | 3,755.2 | 2,610.6 | 383.3 | |||||||||||||||||||||||||||
| Related reinsurance recoverable | (3.2) | — | (407.0) | (242.1) | — | |||||||||||||||||||||||||||
| Net liability for future policy benefits, net of reinsurance recoverable | $ | 3,739.9 | $ | 274.6 | $ | 3,348.2 | $ | 2,368.5 | $ | 383.3 | ||||||||||||||||||||||
26
CNO FINANCIAL GROUP, INC. AND SUBSIDIARIES
Notes to Consolidated Financial Statements
(unaudited)
___________________
The following table reconciles the net liability for future policy benefits to the amount presented in the consolidated balance sheet (dollars in millions):
| March 31, 2023 | March 31, 2022 | |||||||||||||
| Balances included in the future policy benefits rollforwards: | ||||||||||||||
| Supplemental health | $ | 3,243.3 | $ | 3,743.1 | ||||||||||
| Medicare supplement | 233.4 | 274.6 | ||||||||||||
| Long-term care | 3,229.9 | 3,755.2 | ||||||||||||
| Traditional life | 2,325.2 | 2,610.6 | ||||||||||||
| Other annuities | 316.3 | 383.3 | ||||||||||||
| Reserves excluded from rollforward (1) | 2,593.3 | 2,626.5 | ||||||||||||
| Deferred profit liability | 57.7 | 51.3 | ||||||||||||
| Amount of reserves above (below) policyholder account balances (2) | (410.5) | (273.1) | ||||||||||||
| Future loss reserves (3) | 34.7 | 34.6 | ||||||||||||
| Future policy benefits | $ | 11,623.3 | $ | 13,206.1 | ||||||||||
_______________
(1) Primarily comprised of blocks of business that are 100% ceded.
(2) Such amount represents the difference between: (i) the total insurance liabilities for our fixed indexed annuities (including the host contract and the related embedded derivative); and (ii) the policyholder account balances for these products. The accounting requirement to bifurcate the embedded derivative and value it at the current estimated fair value results in this amount.
(3) In certain instances, the total insurance liabilities for a particular line of business may not be deficient in the aggregate to trigger loss recognition, but the pattern of earnings may be such that profits are expected to be recognized in earlier years followed by losses in later years. In these situations, accounting standards require that an additional liability (the "future loss reserve") be recognized by an amount necessary to sufficiently offset the losses that would be recognized in later years.
27
CNO FINANCIAL GROUP, INC. AND SUBSIDIARIES
Notes to Consolidated Financial Statements
(unaudited)
___________________
Many of our fixed indexed annuity products include a GLWB that is considered a MRB. The calculation of MRBs includes market assumptions (interest rate, equity returns, volatility and dividend yields) and nonmarket assumptions (mortality rates, surrender and withdrawal rates, GLWB utilization and spreads). Market assumptions are updated quarterly to reflect current market conditions. During the first quarter of 2023, we reviewed the nonmarket assumptions used to calculate MRBs and determined that such assumptions were appropriate.
The following table presents the balance of and changes in market risk benefits associated with our fixed indexed annuities (dollars in millions):
| March 31, 2023 | March 31, 2022 | |||||||||||||
| Net liability (asset), beginning of period | $ | (54.0) | $ | 86.2 | ||||||||||
| Effect of changes in the instrument-specific credit risk, beginning of period | 12.2 | 12.1 | ||||||||||||
| Balance, beginning of period, before effect of changes in the instrument-specific credit risk | (41.8) | 98.3 | ||||||||||||
| Issuances | .1 | (.8) | ||||||||||||
| Interest accrual | 5.2 | 3.4 | ||||||||||||
| Attributed fees collected | — | — | ||||||||||||
| Benefit payments | — | — | ||||||||||||
| Effect of changes in interest rates | 12.3 | (35.3) | ||||||||||||
| Effect of changes in equity markets | 5.3 | (6.8) | ||||||||||||
| Effect of changes in equity index volatility | (7.4) | 4.4 | ||||||||||||
| Actual policyholder behavior different from expected behavior | .6 | .3 | ||||||||||||
| Effect of changes in future expected policyholder behavior - other | — | — | ||||||||||||
| Effect of changes in future expected policyholder behavior - risk margin | — | — | ||||||||||||
| Effect of changes in assumptions | (1.4) | 2.1 | ||||||||||||
| Net liability (asset), end of period, before effect of changes in the instrument-specific credit risk | (27.1) | 65.6 | ||||||||||||
| Effect of changes in the instrument-specific credit risk, end of period | (13.1) | (18.7) | ||||||||||||
| Net liability (asset), end of period | (40.2) | 46.9 | ||||||||||||
| Reinsurance recoverable, end of period | — | — | ||||||||||||
| Net liability (asset), end of period, net of reinsurance | $ | (40.2) | $ | 46.9 | ||||||||||
| Balance reported as an asset | $ | 57.8 | $ | 16.9 | ||||||||||
| Balance reported as a liability | 17.6 | 63.8 | ||||||||||||
| Net liability (asset) | $ | (40.2) | $ | 46.9 | ||||||||||
| Net amount at risk | $ | 58.9 | $ | 107.4 | ||||||||||
| Weighted average attained age of contract holders | 68 | 68 | ||||||||||||
28
CNO FINANCIAL GROUP, INC. AND SUBSIDIARIES
Notes to Consolidated Financial Statements
(unaudited)
___________________
The following table summarizes the amount of revenue and interest related to traditional and limited-payment contracts recognized in the consolidated statement of operations (dollars in millions):
| Gross premiums (a) | Interest accretion (b) | |||||||||||||||||||||||||
| Three months ended | Three months ended | |||||||||||||||||||||||||
| March 31, | March 31, | |||||||||||||||||||||||||
| 2023 | 2022 | 2023 | 2022 | |||||||||||||||||||||||
| Other annuity | $ | 1.3 | $ | 2.2 | $ | 3.7 | $ | 3.9 | ||||||||||||||||||
| Supplemental health | 179.4 | 175.7 | 41.8 | 41.2 | ||||||||||||||||||||||
| Medicare supplement | 159.2 | 167.6 | 2.7 | 2.8 | ||||||||||||||||||||||
| Long-term care | 82.7 | 82.4 | 43.2 | 43.0 | ||||||||||||||||||||||
| Traditional life | 178.8 | 172.4 | 28.0 | 27.9 | ||||||||||||||||||||||
| Total | $ | 601.4 | $ | 600.3 | $ | 119.4 | $ | 118.8 | ||||||||||||||||||
_____________________
(a) Such amounts are included in insurance policy income in the consolidated statement of operations.
(b) Such amounts are included in insurance policy benefits in the consolidated statement of operations.
The following table provides the amount of undiscounted and discounted expected gross premiums and expected future benefits and expenses for traditional and limited-payment contracts (dollars in millions):
| March 31, 2023 | March 31, 2022 | |||||||||||||||||||||||||
| Undiscounted | Discounted (a) | Undiscounted | Discounted (a) | |||||||||||||||||||||||
| Other annuity | ||||||||||||||||||||||||||
| Expected future gross premiums | $ | — | $ | — | $ | — | $ | — | ||||||||||||||||||
| Expected future benefits and expenses | 396.9 | 316.3 | 426.0 | 383.3 | ||||||||||||||||||||||
| Supplemental health | ||||||||||||||||||||||||||
| Expected future gross premiums | 8,964.4 | 5,605.7 | 8,862.2 | 6,222.2 | ||||||||||||||||||||||
| Expected future benefits and expenses | 11,040.9 | 6,080.8 | 10,940.4 | 6,954.9 | ||||||||||||||||||||||
| Medicare supplement | ||||||||||||||||||||||||||
| Expected future gross premiums | 5,645.2 | 4,031.9 | 5,680.8 | 4,490.0 | ||||||||||||||||||||||
| Expected future benefits and expenses | 4,417.8 | 3,136.5 | 4,446.9 | 3,499.3 | ||||||||||||||||||||||
| Long-term care | ||||||||||||||||||||||||||
| Expected future gross premiums | 2,954.3 | 2,152.7 | 3,012.5 | 2,389.4 | ||||||||||||||||||||||
| Expected future benefits and expenses | 7,445.7 | 4,266.6 | 7,606.7 | 4,966.2 | ||||||||||||||||||||||
| Traditional life | ||||||||||||||||||||||||||
| Expected future gross premiums | 5,435.0 | 3,953.3 | 5,384.4 | 4,260.8 | ||||||||||||||||||||||
| Expected future benefits and expenses | 7,382.8 | 4,560.6 | 7,180.2 | 4,985.5 | ||||||||||||||||||||||
_____________________
(a) Calculated at the discount rates at period end.
Loss expense as a result of net premium ratio capping was not material in both the three months ended March 31, 2023 and 2022.
29
CNO FINANCIAL GROUP, INC. AND SUBSIDIARIES
Notes to Consolidated Financial Statements
(unaudited)
___________________
The following table provides the weighted average durations (under locked-in rates) of the liability for future policy benefits in years:
| March 31, 2023 | March 31, 2022 | |||||||||||||
| Other annuity | 9.7 | 9.7 | ||||||||||||
| Supplemental health | 11.8 | 12.0 | ||||||||||||
| Medicare supplement | 6.1 | 5.9 | ||||||||||||
| Long-term care | 10.5 | 10.8 | ||||||||||||
| Traditional life | 10.1 | 10.4 | ||||||||||||
The following table provides the weighted average interest rates for the liability for future policy benefits:
| March 31, 2023 | March 31, 2022 | |||||||||||||
| Other annuity | ||||||||||||||
| Interest accretion rate | 4.76 | % | 4.72 | % | ||||||||||
| Current discount rate | 5.17 | % | 3.68 | % | ||||||||||
| Supplemental health | ||||||||||||||
| Interest accretion rate | 5.04 | % | 5.09 | % | ||||||||||
| Current discount rate | 5.14 | % | 3.66 | % | ||||||||||
| Medicare supplement | ||||||||||||||
| Interest accretion rate | 4.26 | % | 4.23 | % | ||||||||||
| Current discount rate | 4.94 | % | 3.41 | % | ||||||||||
| Long-term care | ||||||||||||||
| Interest accretion rate | 5.67 | % | 5.71 | % | ||||||||||
| Current discount rate | 5.18 | % | 3.71 | % | ||||||||||
| Traditional life | ||||||||||||||
| Interest accretion rate | 4.77 | % | 4.82 | % | ||||||||||
| Current discount rate | 5.15 | % | 3.66 | % | ||||||||||
30
CNO FINANCIAL GROUP, INC. AND SUBSIDIARIES
Notes to Consolidated Financial Statements
(unaudited)
___________________
The following tables present the balances of and changes in the liability for policyholder account balances (dollars in millions):
| March 31, 2023 | ||||||||||||||||||||||||||||||||||||||
| Fixed indexed annuities | Fixed interest annuities | Other annuities | Interest-sensitive life | Funding agreements | Other (a) | |||||||||||||||||||||||||||||||||
| Balance, beginning of period excluding contracts 100% ceded | $ | 9,490.4 | $ | 1,663.1 | $ | 127.1 | $ | 1,209.6 | $ | 1,410.8 | $ | 395.5 | ||||||||||||||||||||||||||
| Issuances | 323.3 | 45.3 | — | 9.5 | — | — | ||||||||||||||||||||||||||||||||
| Premiums received | .4 | .7 | 7.5 | 50.3 | — | 63.0 | ||||||||||||||||||||||||||||||||
| Policy charges | (4.0) | (.2) | — | (46.1) | — | — | ||||||||||||||||||||||||||||||||
| Surrenders and withdrawals | (178.2) | (43.3) | (10.5) | (8.2) | (9.9) | (72.6) | ||||||||||||||||||||||||||||||||
| Benefit payments | (59.2) | (27.7) | (1.7) | (6.0) | — | — | ||||||||||||||||||||||||||||||||
| Interest credited | 6.1 | 11.3 | .6 | 8.1 | 7.2 | .7 | ||||||||||||||||||||||||||||||||
| Other | 5.5 | .1 | (.2) | — | — | — | ||||||||||||||||||||||||||||||||
| Balance, end of period excluding contracts 100% ceded | 9,584.3 | 1,649.3 | 122.8 | 1,217.2 | 1,408.1 | 386.6 | ||||||||||||||||||||||||||||||||
| Balance, end of period for contracts 100% ceded | 154.4 | 632.6 | 26.3 | 110.7 | — | 10.6 | ||||||||||||||||||||||||||||||||
| Balance, end of period | $ | 9,738.7 | $ | 2,281.9 | $ | 149.1 | $ | 1,327.9 | $ | 1,408.1 | $ | 397.2 | ||||||||||||||||||||||||||
| Balance, end of period, reinsurance ceded | (154.4) | (632.6) | (26.3) | (130.5) | — | (24.8) | ||||||||||||||||||||||||||||||||
| Balance, end of period, net of reinsurance | $ | 9,584.3 | $ | 1,649.3 | $ | 122.8 | $ | 1,197.4 | $ | 1,408.1 | $ | 372.4 | ||||||||||||||||||||||||||
| Weighted average crediting rate | 1.6 | % | 2.7 | % | 1.9 | % | 3.1 | % | 2.0 | % | 0.6 | % | ||||||||||||||||||||||||||
| Net amount at risk (b) | $ | — | $ | — | $ | — | $ | 26,865.3 | $ | — | $ | — | ||||||||||||||||||||||||||
| Cash surrender value, net of reinsurance | $ | 8,932.4 | $ | 1,631.5 | $ | 122.8 | $ | 977.1 | $ | — | $ | 372.4 | ||||||||||||||||||||||||||
_________________
(a) Predominantly consists of retained asset accounts associated with our traditional life and supplemental health blocks.
(b) Represents the amount of insurance policy benefit expense that we would incur if death claims were filed on all annuity and interest-sensitive life contracts at the balance sheet date.
31
CNO FINANCIAL GROUP, INC. AND SUBSIDIARIES
Notes to Consolidated Financial Statements
(unaudited)
___________________
| March 31, 2022 | ||||||||||||||||||||||||||||||||||||||
| Fixed indexed annuities | Fixed interest annuities | Other annuities | Interest-sensitive life | Funding agreements | Other (a) | |||||||||||||||||||||||||||||||||
| Balance, beginning of period excluding contracts 100% ceded | $ | 8,681.0 | $ | 1,806.1 | $ | 131.2 | $ | 1,163.9 | $ | 502.0 | $ | 368.0 | ||||||||||||||||||||||||||
| Issuances | 354.6 | 10.5 | — | 10.6 | 899.0 | — | ||||||||||||||||||||||||||||||||
| Premiums received | .1 | 1.1 | 9.1 | 47.6 | — | 61.7 | ||||||||||||||||||||||||||||||||
| Policy charges | (3.0) | (.1) | — | (44.5) | — | — | ||||||||||||||||||||||||||||||||
| Surrenders and withdrawals | (133.7) | (37.9) | (10.2) | (5.7) | — | (56.8) | ||||||||||||||||||||||||||||||||
| Benefit payments | (67.3) | (39.6) | (1.4) | (7.8) | — | (.1) | ||||||||||||||||||||||||||||||||
| Interest credited | 65.7 | 11.5 | .6 | 15.7 | 7.0 | .7 | ||||||||||||||||||||||||||||||||
| Other | 4.6 | .2 | — | — | — | — | ||||||||||||||||||||||||||||||||
| Balance, end of period excluding contracts 100% ceded | 8,902.0 | 1,751.8 | 129.3 | 1,179.8 | 1,408.0 | 373.5 | ||||||||||||||||||||||||||||||||
| Balance, end of period for contracts 100% ceded | 166.6 | 658.8 | 28.2 | 115.7 | — | 11.9 | ||||||||||||||||||||||||||||||||
| Balance, end of period | $ | 9,068.6 | $ | 2,410.6 | $ | 157.5 | $ | 1,295.5 | $ | 1,408.0 | $ | 385.4 | ||||||||||||||||||||||||||
| Balance, end of period, reinsurance ceded | (166.6) | (658.8) | (28.2) | (136.5) | — | (26.7) | ||||||||||||||||||||||||||||||||
| Balance, end of period, net of reinsurance | $ | 8,902.0 | $ | 1,751.8 | $ | 129.3 | $ | 1,159.0 | $ | 1,408.0 | $ | 358.7 | ||||||||||||||||||||||||||
| Weighted average crediting rate | 1.4 | % | 2.6 | % | 1.8 | % | 5.9 | % | 2.0 | % | 0.7 | % | ||||||||||||||||||||||||||
| Net amount at risk (b) | $ | — | $ | — | $ | — | $ | 26,436.6 | $ | — | $ | — | ||||||||||||||||||||||||||
| Cash surrender value, net of reinsurance | $ | 8,295.5 | $ | 1,743.3 | $ | 129.3 | $ | 938.6 | $ | — | $ | 358.7 | ||||||||||||||||||||||||||
_________________
(a) Predominantly consists of retained asset accounts associated with our traditional life and supplemental health blocks.
(b) Represents the amount of insurance policy benefit expense that we would incur if death claims were filed on all annuity and interest-sensitive life contracts at the balance sheet date.
The following table reconciles the liability for policyholder account balances to the amount presented in the consolidated balance sheet (dollars in millions):
| March 31, 2023 | March 31, 2022 | |||||||||||||
| Amounts included in the liability for policyholder account balances rollforwards: | ||||||||||||||
| Fixed indexed annuities | $ | 9,738.7 | $ | 9,068.6 | ||||||||||
| Fixed interest annuities | 2,281.9 | 2,410.6 | ||||||||||||
| Other annuities | 149.1 | 157.5 | ||||||||||||
| Interest-sensitive life | 1,327.9 | 1,295.5 | ||||||||||||
| Funding agreements | 1,408.1 | 1,408.0 | ||||||||||||
| Other | 397.2 | 385.4 | ||||||||||||
| Total | $ | 15,302.9 | $ | 14,725.6 | ||||||||||
32
CNO FINANCIAL GROUP, INC. AND SUBSIDIARIES
Notes to Consolidated Financial Statements
(unaudited)
___________________
The following tables present the account values by range of guaranteed minimum crediting rates and the related range of difference, in basis points, between rates being credited to policyholders and the respective guaranteed minimums (dollars in millions):
| March 31, 2023 | ||||||||||||||||||||||||||||||||
| Range of guaranteed minimum crediting rates (a) | At guaranteed minimum | 1-50 basis points above | 51-150 basis points above | Greater than 150 basis points above | Total | |||||||||||||||||||||||||||
| Fixed interest annuity | ||||||||||||||||||||||||||||||||
| 0.00%-2.99% | $ | 144.9 | $ | 291.7 | $ | 78.3 | $ | 76.9 | $ | 591.8 | ||||||||||||||||||||||
| 3.00%-4.99% | 1,572.0 | 27.7 | .1 | — | 1,599.8 | |||||||||||||||||||||||||||
| 5.00% and greater | 90.3 | — | — | — | 90.3 | |||||||||||||||||||||||||||
| Subtotal | 1,807.2 | 319.4 | 78.4 | 76.9 | 2,281.9 | |||||||||||||||||||||||||||
| Other annuity | ||||||||||||||||||||||||||||||||
| 0.00%-2.99% | 43.6 | 29.5 | — | — | 73.1 | |||||||||||||||||||||||||||
| 3.00%-4.99% | 65.3 | — | — | — | 65.3 | |||||||||||||||||||||||||||
| 5.00% and greater | 10.7 | — | — | — | 10.7 | |||||||||||||||||||||||||||
| Subtotal | 119.6 | 29.5 | — | — | 149.1 | |||||||||||||||||||||||||||
| Interest-sensitive life | ||||||||||||||||||||||||||||||||
| 0.00%-2.99% | 66.5 | 225.8 | 225.4 | — | 517.7 | |||||||||||||||||||||||||||
| 3.00%-4.99% | 461.5 | 51.7 | 146.6 | 125.0 | 784.8 | |||||||||||||||||||||||||||
| 5.00% and greater | 21.9 | .5 | 2.7 | .3 | 25.4 | |||||||||||||||||||||||||||
| Subtotal | 549.9 | 278.0 | 374.7 | 125.3 | 1,327.9 | |||||||||||||||||||||||||||
| Funding agreements | ||||||||||||||||||||||||||||||||
| 0.00%-2.99% | 1,408.1 | — | — | — | 1,408.1 | |||||||||||||||||||||||||||
| 3.00%-4.99% | — | — | — | — | — | |||||||||||||||||||||||||||
| 5.00% and greater | — | — | — | — | — | |||||||||||||||||||||||||||
| Subtotal | 1,408.1 | — | — | — | 1,408.1 | |||||||||||||||||||||||||||
| Other | ||||||||||||||||||||||||||||||||
| 0.00%-2.99% | 17.8 | 355.4 | — | — | 373.2 | |||||||||||||||||||||||||||
| 3.00%-4.99% | 23.6 | — | — | — | 23.6 | |||||||||||||||||||||||||||
| 5.00% and greater | .4 | — | — | — | .4 | |||||||||||||||||||||||||||
| Subtotal | 41.8 | 355.4 | — | — | 397.2 | |||||||||||||||||||||||||||
| Total | ||||||||||||||||||||||||||||||||
| 0.00%-2.99% | 1,680.9 | 902.4 | 303.7 | 76.9 | 2,963.9 | |||||||||||||||||||||||||||
| 3.00%-4.99% | 2,122.4 | 79.4 | 146.7 | 125.0 | 2,473.5 | |||||||||||||||||||||||||||
| 5.00% and greater | 123.3 | .5 | 2.7 | .3 | 126.8 | |||||||||||||||||||||||||||
| Total policyholder account balances, excluding fixed indexed annuities | $ | 3,926.6 | $ | 982.3 | $ | 453.1 | $ | 202.2 | 5,564.2 | |||||||||||||||||||||||
| Fixed indexed annuity account balances | 9,738.7 | |||||||||||||||||||||||||||||||
| Total policyholder account balances | $ | 15,302.9 | ||||||||||||||||||||||||||||||
____________________
(a) Excludes the account balances related to our fixed indexed annuity contracts which do not have a minimum crediting rate since returns are based on an index.
33
CNO FINANCIAL GROUP, INC. AND SUBSIDIARIES
Notes to Consolidated Financial Statements
(unaudited)
___________________
| March 31, 2022 | ||||||||||||||||||||||||||||||||
| Range of guaranteed minimum crediting rates (a) | At guaranteed minimum | 1-50 basis points above | 51-150 basis points above | Greater than 150 basis points above | Total | |||||||||||||||||||||||||||
| Fixed interest annuity | ||||||||||||||||||||||||||||||||
| 0.00%-2.99% | $ | 171.7 | $ | 332.2 | $ | 42.9 | $ | 11.5 | $ | 558.3 | ||||||||||||||||||||||
| 3.00%-4.99% | 1,734.3 | 23.5 | 0.1 | — | 1,757.9 | |||||||||||||||||||||||||||
| 5.00% and greater | 94.4 | — | — | — | 94.4 | |||||||||||||||||||||||||||
| Subtotal | 2,000.4 | 355.7 | 43.0 | 11.5 | 2,410.6 | |||||||||||||||||||||||||||
| Other annuity | ||||||||||||||||||||||||||||||||
| 0.00%-2.99% | 53.1 | 30.3 | — | — | 83.4 | |||||||||||||||||||||||||||
| 3.00%-4.99% | 62.4 | — | — | — | 62.4 | |||||||||||||||||||||||||||
| 5.00% and greater | 11.7 | — | — | — | 11.7 | |||||||||||||||||||||||||||
| Subtotal | 127.2 | 30.3 | — | — | 157.5 | |||||||||||||||||||||||||||
| Interest-sensitive life | ||||||||||||||||||||||||||||||||
| 0.00%-2.99% | 7.5 | — | — | — | 7.5 | |||||||||||||||||||||||||||
| 3.00%-4.99% | 409.3 | 56.5 | 178.0 | 146.4 | 790.2 | |||||||||||||||||||||||||||
| 5.00% and greater | 22.7 | 0.4 | — | 474.7 | 497.8 | |||||||||||||||||||||||||||
| Subtotal | 439.5 | 56.9 | 178.0 | 621.1 | 1,295.5 | |||||||||||||||||||||||||||
| Funding agreements | ||||||||||||||||||||||||||||||||
| 0.00%-2.99% | 1,408.0 | — | — | — | 1,408.0 | |||||||||||||||||||||||||||
| 3.00%-4.99% | — | — | — | — | — | |||||||||||||||||||||||||||
| 5.00% and greater | — | — | — | — | — | |||||||||||||||||||||||||||
| Subtotal | 1,408.0 | — | — | — | 1,408.0 | |||||||||||||||||||||||||||
| Other | ||||||||||||||||||||||||||||||||
| 0.00%-2.99% | 18.5 | 341.1 | — | — | 359.6 | |||||||||||||||||||||||||||
| 3.00%-4.99% | 24.8 | — | — | — | 24.8 | |||||||||||||||||||||||||||
| 5.00% and greater | 1.0 | — | — | — | 1.0 | |||||||||||||||||||||||||||
| Subtotal | 44.3 | 341.1 | — | — | 385.4 | |||||||||||||||||||||||||||
| Total | ||||||||||||||||||||||||||||||||
| 0.00%-2.99% | 1,658.8 | 703.6 | 42.9 | 11.5 | 2,416.8 | |||||||||||||||||||||||||||
| 3.00%-4.99% | 2,230.8 | 80.0 | 178.1 | 146.4 | 2,635.3 | |||||||||||||||||||||||||||
| 5.00% and greater | 129.8 | 0.4 | — | 474.7 | 604.9 | |||||||||||||||||||||||||||
| Total policyholder account balances, excluding fixed indexed annuities | $ | 4,019.4 | $ | 784.0 | $ | 221.0 | $ | 632.6 | 5,657.0 | |||||||||||||||||||||||
| Fixed indexed annuity account balances | 9,068.6 | |||||||||||||||||||||||||||||||
| Total policyholder account balances | $ | 14,725.6 | ||||||||||||||||||||||||||||||
____________________
(a) Excludes the account balances related to our fixed indexed annuity contracts which do not have a minimum crediting rate since returns are based on an index.
34
CNO FINANCIAL GROUP, INC. AND SUBSIDIARIES
Notes to Consolidated Financial Statements
(unaudited)
___________________
DEFERRED ACQUISITION COSTS, PRESENT VALUE OF FUTURE PROFITS AND SALES INDUCEMENTS
Changes in deferred acquisition costs were as follows (dollars in millions):
| March 31, 2023 | ||||||||||||||||||||||||||||||||||||||||||||||||||||||||
| Fixed indexed annuities | Fixed interest annuities | Supplemental health | Medicare supplement | Long-term care | Interest-sensitive life | Traditional life | Funding agreements | Total | ||||||||||||||||||||||||||||||||||||||||||||||||
| Beginning of period | $ | 365.6 | $ | 19.6 | $ | 378.8 | $ | 161.2 | $ | 137.9 | $ | 212.2 | $ | 409.1 | $ | 6.0 | $ | 1,690.4 | ||||||||||||||||||||||||||||||||||||||
| Capitalizations | 21.6 | 2.5 | 14.4 | 5.8 | 3.4 | 8.3 | 28.2 | — | 84.2 | |||||||||||||||||||||||||||||||||||||||||||||||
| Amortization expense | (11.1) | (.9) | (7.6) | (7.2) | (3.8) | (3.5) | (12.2) | (.3) | (46.6) | |||||||||||||||||||||||||||||||||||||||||||||||
| End of period | $ | 376.1 | $ | 21.2 | $ | 385.6 | $ | 159.8 | $ | 137.5 | $ | 217.0 | $ | 425.1 | $ | 5.7 | $ | 1,728.0 | ||||||||||||||||||||||||||||||||||||||
| March 31, 2022 | ||||||||||||||||||||||||||||||||||||||||||||||||||||||||
| Fixed indexed annuities | Fixed interest annuities | Supplemental health | Medicare supplement | Long-term care | Interest-sensitive life | Traditional life | Funding agreements | Total | ||||||||||||||||||||||||||||||||||||||||||||||||
| Beginning of period | $ | 313.0 | $ | 19.0 | $ | 357.5 | $ | 170.2 | $ | 136.4 | $ | 196.3 | $ | 357.6 | $ | 3.3 | $ | 1,553.3 | ||||||||||||||||||||||||||||||||||||||
| Capitalizations | 22.5 | .5 | 12.0 | 5.5 | 4.8 | 7.8 | 21.7 | 4.2 | 79.0 | |||||||||||||||||||||||||||||||||||||||||||||||
| Amortization expense | (9.7) | (.9) | (7.0) | (7.6) | (3.9) | (3.4) | (10.2) | (.3) | (43.0) | |||||||||||||||||||||||||||||||||||||||||||||||
| End of period | $ | 325.8 | $ | 18.6 | $ | 362.5 | $ | 168.1 | $ | 137.3 | $ | 200.7 | $ | 369.1 | $ | 7.2 | $ | 1,589.3 | ||||||||||||||||||||||||||||||||||||||
Changes in the present value of future profits were as follows (dollars in millions):
| March 31, 2023 | ||||||||||||||||||||||||||||||||||||||||||||
| Supplemental health | Medicare supplement | Long-term care | Traditional life | Fixed indexed annuities | Fixed interest annuities | Total | ||||||||||||||||||||||||||||||||||||||
| Beginning of period | $ | 154.0 | $ | 27.5 | $ | 6.2 | $ | 14.8 | $ | .8 | $ | .4 | $ | 203.7 | ||||||||||||||||||||||||||||||
| Amortization expense | (3.3) | (1.9) | (.3) | (.5) | (.1) | — | (6.1) | |||||||||||||||||||||||||||||||||||||
| End of period | $ | 150.7 | $ | 25.6 | $ | 5.9 | $ | 14.3 | $ | .7 | $ | .4 | $ | 197.6 | ||||||||||||||||||||||||||||||
| March 31, 2022 | ||||||||||||||||||||||||||||||||||||||||||||
| Supplemental health | Medicare supplement | Long-term care | Traditional life | Fixed indexed annuities | Fixed interest annuities | Total | ||||||||||||||||||||||||||||||||||||||
| Beginning of period | $ | 168.1 | $ | 36.5 | $ | 7.3 | $ | 16.9 | $ | .9 | $ | .4 | $ | 230.1 | ||||||||||||||||||||||||||||||
| Amortization expense | (3.6) | (2.5) | (.3) | (.5) | — | — | (6.9) | |||||||||||||||||||||||||||||||||||||
| End of period | $ | 164.5 | $ | 34.0 | $ | 7.0 | $ | 16.4 | $ | .9 | $ | .4 | $ | 223.2 | ||||||||||||||||||||||||||||||
35
CNO FINANCIAL GROUP, INC. AND SUBSIDIARIES
Notes to Consolidated Financial Statements
(unaudited)
___________________
Changes in sales inducements were as follows (dollars in millions):
| March 31, 2023 | ||||||||||||||||||||
| Fixed indexed annuities | Fixed interest annuities | Total | ||||||||||||||||||
| Beginning of period | $ | 76.0 | $ | 4.5 | $ | 80.5 | ||||||||||||||
| Capitalizations | 5.4 | .2 | 5.6 | |||||||||||||||||
| Amortization expense | (2.6) | (.2) | (2.8) | |||||||||||||||||
| End of period | $ | 78.8 | $ | 4.5 | $ | 83.3 | ||||||||||||||
| March 31, 2022 | ||||||||||||||||||||
| Fixed indexed annuities | Fixed interest annuities | Total | ||||||||||||||||||
| Beginning of period | $ | 63.0 | $ | 5.0 | $ | 68.0 | ||||||||||||||
| Capitalizations | 4.6 | .1 | 4.7 | |||||||||||||||||
| Amortization expense | (2.1) | (.3) | (2.4) | |||||||||||||||||
| End of period | $ | 65.5 | $ | 4.8 | $ | 70.3 | ||||||||||||||
36
CNO FINANCIAL GROUP, INC. AND SUBSIDIARIES
Notes to Consolidated Financial Statements
(unaudited)
___________________
EARNINGS PER SHARE
A reconciliation of net income (loss) and shares used to calculate basic and diluted earnings per share is as follows (dollars in millions and shares in thousands):
| Three months ended | |||||||||||||||||||||||
| March 31, | |||||||||||||||||||||||
| 2023 | 2022 | ||||||||||||||||||||||
| Net income (loss) for basic and diluted earnings per share | $ | (.8) | $ | 183.4 | |||||||||||||||||||
| Shares: | |||||||||||||||||||||||
| Weighted average shares outstanding for basic earnings per share | 114,545 | 118,622 | |||||||||||||||||||||
| Effect of dilutive securities on weighted average shares: | |||||||||||||||||||||||
| Amounts related to employee benefit plans | — | 2,380 | |||||||||||||||||||||
| Weighted average shares outstanding for diluted earnings per share | 114,545 | 121,002 | |||||||||||||||||||||
| Three months ended | Nine months ended | ||||||||||||||
| September 30, | September 30, | ||||||||||||||
| 2017 | 2016 | 2017 | 2016 | ||||||||||||
| Net income for basic and diluted earnings per share | $ | 100.8 | $ | 18.6 | $ | 246.5 | $ | 124.0 | |||||||
| Shares: | |||||||||||||||
| Weighted average shares outstanding for basic earnings per share | 168,684 | 174,247 | 170,890 | 177,640 | |||||||||||
| Effect of dilutive securities on weighted average shares: | |||||||||||||||
| Stock options, restricted stock and performance units | 2,298 | 1,476 | 1,910 | 1,733 | |||||||||||
| Weighted average shares outstanding for diluted earnings per share | 170,982 | 175,723 | 172,800 | 179,373 | |||||||||||
Basic earnings per common share is computed by dividing net income (loss) by the weighted average number of common shares outstanding for the period. Restricted shares (including our performance units) are not included in basic earnings per share until vested. Diluted earnings per share reflect the potential dilution that could occur if outstanding stock options were exercised and restricted stock was vested. The dilution from options and restricted shares is calculated using the treasury stock method. Under this method, we assume the proceeds from the exercise of the options (or the unrecognized compensation expense with respect to restricted stock and performance units) will be used to purchase shares of our common stock at the average market price during the period, reducing the dilutive effect of the exercise of the options (or the vesting of the restricted stock and performance units).
37
CNO FINANCIAL GROUP, INC. AND SUBSIDIARIES
Notes to Consolidated Financial Statements
(unaudited)
___________________
BUSINESS SEGMENTS
We view our operations as three insurance product lines (annuity, health and life) and the investment and fee income segments. Our segments are aligned based on their common characteristics, comparability of profit margins and the way management makes operating decisions and assesses the performance of the business.
Our insurance product line segments (annuity, health and life) include marketing, underwriting and administration of the policies our insurance subsidiaries sell. The business written in each of the three product categories through all of our insurance subsidiaries is aggregated allowing management and investors to assess the performance of each product category. When analyzing profitability of these segments, we use insurance product margin as the measure of profitability, which is: (i) insurance policy income; and (ii) net investment income allocated to the insurance product lines; less (i) insurance policy benefits and interest credited to policyholders; and (ii) amortization, non-deferred commissions and advertising expense. Net investment income is allocated to the product lines using the book yield of investments backing the block of business, which is applied to the average net insurance liabilities for the block in each period. Net insurance liabilities for the purpose of allocating investment income to product lines are equal to: (i) policyholder account balances for annuity products; (ii) total reserves before the fair value adjustments reflected in accumulated other comprehensive income (loss), if applicable, for all other products; less (iii) amounts related to reinsurance business; (iv) deferred acquisition costs; (v) the present value of future profits; and (vi) the value of unexpired options credited to insurance liabilities.
Income from insurance products is the sum of the insurance product margins of the annuity, health and life product lines, less expenses allocated to the insurance lines. It excludes the income from our fee income business, investment income not allocated to product lines, net expenses not allocated to product lines (primarily holding company expenses) and income taxes. Management believes insurance product margin and income from insurance products help provide a better understanding of the business and a more meaningful analysis of the results of our insurance product lines.
We market our products through the Consumer and Worksite Divisions that reflect the customers served by the Company.
The Company manages itsConsumer Division serves individual consumers, engaging with them on the phone, virtually, online, face-to-face with agents, or through a combination of sales channels. This structure unifies consumer capabilities into a single division and integrates the strength of our agent sales forces with one of the largest direct-to-consumer insurance businesses with proven experience in advertising, web/digital and call center support.
The Worksite Division focuses on worksite and group sales for businesses, associations, and other membership groups, interacting with customers at their place of employment and virtually. With a separate Worksite Division, we are bringing a sharper focus to this high-growth business throughwhile further capitalizing on the following operating segments: Bankers Life, Washington Nationalstrength of our wholly-owned subsidiary, Optavise, LLC ("Optavise"), a national provider of year-round technology-driven employee benefits management services.
The Consumer and Colonial Penn,Worksite Divisions are primarily focused on marketing insurance products, several types of which are definedsold in both divisions and underwritten in the same manner. Sales of group underwritten policies are currently not significant, but are expected to increase within the Worksite Division.
The investment segment involves the management of our capital resources, including investments and the management of corporate debt and liquidity. Our measure of profitability of this segment is the total net investment income not allocated to the insurance products. Investment income not allocated to product lines represents net investment income less: (i) equity returns credited to policyholder account balances; (ii) the investment income allocated to our product lines; (iii) interest expense on notes payable and investment borrowings; (iv) expenses related to the FABN program; and (v) certain expenses related to benefit plans that are offset by special-purpose investment income; plus (vi) the impact of annual option forfeitures related to fixed indexed annuity surrenders. Investment income not allocated to product lines includes investment income on investments in excess of amounts allocated to product lines, investments held by our holding companies, the spread we earn from our Federal Home Loan Bank ("FHLB") investment borrowing and FABN programs and variable components of investment income (including call and prepayment income, adjustments to returns on structured securities due to cash flow changes, income (loss) from company-owned life insurance ("COLI") and alternative investments income not allocated to product lines), net of interest expense on corporate debt. The spread earned from our FHLB investment borrowing and FABN programs includes the investment income on the basismatched assets less: (i) interest on investment borrowings related to the FHLB
38
CNO FINANCIAL GROUP, INC. AND SUBSIDIARIES
Notes to Consolidated Financial Statements
(unaudited)
___________________
investment borrowing program; (ii) interest credited on funding agreements; and (iii) amortization of deferred acquisition costs related to the FABN program.
Our fee income segment includes the earnings generated from sales of third-party insurance products, services provided by Optavise and the operations of our broker/dealer and registered investment advisor.
Expenses not allocated to product distribution; andlines include the expenses of our corporate operations, comprised of holding company activities and certain noninsurance company businesses. In the fourth quarter of 2016, we began reporting the long-term care block recaptured from Beechwood Re Ltd ("BRe") effective September 30, 2016, as an additional business segment.excluding interest expense on debt.
We measure segment performance by excluding net realizedtotal investment gains (losses), changes in fair value of embedded derivative liabilities and market risk benefits, fair value changes in embedded derivative liabilities (net of related amortization), fair value changes and an amendment to the agent deferred compensation plan, loss on reinsurance transaction, income taxes and other non-operating items consisting primarily of earnings attributable to VIEs ("pre-tax operating earnings") because we believe that this performance measure is a better indicator of the ongoing business and trends in our business. Our primary investment focus is on investment income to support our liabilities for insurance products as opposed to the generation of net realized investment gains (losses), and a long-term focus is necessary to maintain profitability over the life of the business.
Operating information by segment is as follows (dollars in millions):
| Three months ended | |||||||||||||||||||||||
| March 31, | |||||||||||||||||||||||
| 2023 | 2022 | ||||||||||||||||||||||
| Revenues: | |||||||||||||||||||||||
| Annuity: | |||||||||||||||||||||||
| Insurance policy income | $ | 5.1 | $ | 5.0 | |||||||||||||||||||
| Net investment income | 125.4 | 117.5 | |||||||||||||||||||||
| Total annuity revenues | 130.5 | 122.5 | |||||||||||||||||||||
| Health: | |||||||||||||||||||||||
| Insurance policy income | 401.4 | 406.7 | |||||||||||||||||||||
| Net investment income | 74.0 | 73.3 | |||||||||||||||||||||
| Total health revenues | 475.4 | 480.0 | |||||||||||||||||||||
| Life: | |||||||||||||||||||||||
| Insurance policy income | 219.0 | 213.3 | |||||||||||||||||||||
| Net investment income | 36.3 | 35.5 | |||||||||||||||||||||
| Total life revenues | 255.3 | 248.8 | |||||||||||||||||||||
| Change in market values of the underlying options supporting the fixed indexed annuity and life products (offset by market value changes credited to policyholder balances) | 18.6 | (71.9) | |||||||||||||||||||||
| Investment income not allocated to product lines | 67.8 | 46.6 | |||||||||||||||||||||
| Fee revenue and other income: | |||||||||||||||||||||||
| Fee income | 51.3 | 40.3 | |||||||||||||||||||||
| Amounts netted in expenses not allocated to product lines | 1.6 | 2.8 | |||||||||||||||||||||
| Total segment revenues | $ | 1,000.5 | $ | 869.1 | |||||||||||||||||||
(continued on next page)
39
CNO FINANCIAL GROUP, INC. AND SUBSIDIARIES
Notes to Consolidated Financial Statements
(unaudited)
___________________
| Three months ended | Nine months ended | ||||||||||||||
| September 30, | September 30, | ||||||||||||||
| 2017 | 2016 | 2017 | 2016 | ||||||||||||
| Revenues: | |||||||||||||||
| Bankers Life: | |||||||||||||||
| Insurance policy income: | |||||||||||||||
| Annuities | $ | 3.7 | $ | 6.8 | $ | 15.5 | $ | 17.4 | |||||||
| Health | 307.2 | 310.3 | 926.9 | 933.3 | |||||||||||
| Life | 103.7 | 96.6 | 310.4 | 295.8 | |||||||||||
| Net investment income (a) | 270.6 | 244.7 | 800.4 | 686.8 | |||||||||||
| Fee revenue and other income (a) | 11.3 | 9.6 | 32.5 | 23.5 | |||||||||||
| Total Bankers Life revenues | 696.5 | 668.0 | 2,085.7 | 1,956.8 | |||||||||||
| Washington National: | |||||||||||||||
| Insurance policy income: | |||||||||||||||
| Annuities | .5 | 1.2 | 1.6 | 2.3 | |||||||||||
| Health | 160.4 | 156.9 | 480.3 | 469.1 | |||||||||||
| Life | 6.5 | 6.3 | 20.1 | 18.6 | |||||||||||
| Net investment income (a) | 68.0 | 67.1 | 201.9 | 191.3 | |||||||||||
| Fee revenue and other income (a) | .3 | .4 | .8 | 1.0 | |||||||||||
| Total Washington National revenues | 235.7 | 231.9 | 704.7 | 682.3 | |||||||||||
| Colonial Penn: | |||||||||||||||
| Insurance policy income: | |||||||||||||||
| Health | .5 | .6 | 1.6 | 2.0 | |||||||||||
| Life | 72.6 | 70.3 | 217.5 | 208.5 | |||||||||||
| Net investment income (a) | 11.0 | 11.1 | 33.1 | 33.0 | |||||||||||
| Fee revenue and other income (a) | .3 | .2 | .9 | .8 | |||||||||||
| Total Colonial Penn revenues | 84.4 | 82.2 | 253.1 | 244.3 | |||||||||||
| Long-term care in run-off: | |||||||||||||||
| Insurance policy income - health | 4.2 | — | 13.3 | — | |||||||||||
| Net investment income (a) | 6.8 | — | 26.5 | — | |||||||||||
| Total Long-term care in run-off revenues | 11.0 | — | 39.8 | — | |||||||||||
| Corporate operations: | |||||||||||||||
| Net investment income | 7.0 | 6.7 | 24.8 | 16.6 | |||||||||||
| Fee and other income | 1.8 | 2.5 | 6.5 | 7.6 | |||||||||||
| Total corporate revenues | 8.8 | 9.2 | 31.3 | 24.2 | |||||||||||
| Total revenues | $ | 1,036.4 | $ | 991.3 | $ | 3,114.6 | $ | 2,907.6 | |||||||
(continued on nextfrom previous page)
| Three months ended | |||||||||||||||||||||||
| March 31, | |||||||||||||||||||||||
| 2023 | 2022 | ||||||||||||||||||||||
| Expenses: | |||||||||||||||||||||||
| Annuity: | |||||||||||||||||||||||
| Insurance policy benefits | $ | 8.7 | $ | 9.5 | |||||||||||||||||||
| Interest credited | 48.1 | 42.5 | |||||||||||||||||||||
| Amortization and non-deferred commissions | 16.4 | 14.6 | |||||||||||||||||||||
| Total annuity expenses | 73.2 | 66.6 | |||||||||||||||||||||
| Health: | |||||||||||||||||||||||
| Insurance policy benefits | 318.1 | 323.1 | |||||||||||||||||||||
| Amortization and non-deferred commissions | 40.8 | 41.6 | |||||||||||||||||||||
| Total health expenses | 358.9 | 364.7 | |||||||||||||||||||||
| Life: | |||||||||||||||||||||||
| Insurance policy benefits | 147.2 | 153.1 | |||||||||||||||||||||
| Interest credited | 12.1 | 12.0 | |||||||||||||||||||||
| Amortization, non-deferred commissions and advertising expense | 48.6 | 47.7 | |||||||||||||||||||||
| Total life expenses | 207.9 | 212.8 | |||||||||||||||||||||
| Allocated expenses | 157.5 | 144.8 | |||||||||||||||||||||
| Expenses not allocated to product lines | 19.9 | 17.6 | |||||||||||||||||||||
| Market value changes of options credited to fixed indexed annuity and life policyholders | 18.6 | (71.9) | |||||||||||||||||||||
| Amounts netted in investment income not allocated to product lines: | |||||||||||||||||||||||
| Interest expense | 37.4 | 18.1 | |||||||||||||||||||||
| Interest credited | 7.2 | 6.9 | |||||||||||||||||||||
| Impact of annual option forfeitures related to fixed indexed annuity surrenders | — | (1.6) | |||||||||||||||||||||
| Amortization | .4 | .4 | |||||||||||||||||||||
| Other expenses | 7.3 | (4.2) | |||||||||||||||||||||
| Expenses netted in fee revenue: | |||||||||||||||||||||||
| Commissions and other operating expenses | 35.8 | 30.4 | |||||||||||||||||||||
| Total segment expenses | 924.1 | 784.6 | |||||||||||||||||||||
| Pre-tax measure of profitability: | |||||||||||||||||||||||
| Annuity margin | 57.3 | 55.9 | |||||||||||||||||||||
| Health margin | 116.5 | 115.3 | |||||||||||||||||||||
| Life margin | 47.4 | 36.0 | |||||||||||||||||||||
| Total insurance product margin | 221.2 | 207.2 | |||||||||||||||||||||
| Allocated expenses | (157.5) | (144.8) | |||||||||||||||||||||
| Income from insurance products | 63.7 | 62.4 | |||||||||||||||||||||
| Fee income | 15.5 | 9.9 | |||||||||||||||||||||
| Investment income not allocated to product lines | 15.5 | 27.0 | |||||||||||||||||||||
| Expenses not allocated to product lines | (18.3) | (14.8) | |||||||||||||||||||||
| Operating earnings before taxes | 76.4 | 84.5 | |||||||||||||||||||||
| Income tax expense on operating income | 17.8 | 20.0 | |||||||||||||||||||||
| Net operating income | $ | 58.6 | $ | 64.5 | |||||||||||||||||||
40
CNO FINANCIAL GROUP, INC. AND SUBSIDIARIES
Notes to Consolidated Financial Statements
(unaudited)
___________________
| Three months ended | |||||||||||||||||||||||
| March 31, | |||||||||||||||||||||||
| 2023 | 2022 | ||||||||||||||||||||||
| Total segment revenues | $ | 1,000.5 | $ | 869.1 | |||||||||||||||||||
| Total investment losses | (14.6) | (32.7) | |||||||||||||||||||||
| Revenues related to earnings attributable to VIEs | 20.1 | 6.5 | |||||||||||||||||||||
| Consolidated revenues | 1,006.0 | 842.9 | |||||||||||||||||||||
| Total segment expenses | 924.1 | 784.6 | |||||||||||||||||||||
| Insurance policy benefits - changes in fair value of embedded derivative liabilities and market risk benefits | 65.1 | (165.4) | |||||||||||||||||||||
| Expenses attributable to VIEs | 17.8 | 6.1 | |||||||||||||||||||||
| Fair value changes related to agent deferred compensation plan | — | (22.7) | |||||||||||||||||||||
| Consolidated expenses | 1,007.0 | 602.6 | |||||||||||||||||||||
| Income (loss) before tax | (1.0) | 240.3 | |||||||||||||||||||||
| Income tax expense (benefit) on period income (loss) | (.2) | 56.9 | |||||||||||||||||||||
| Net income (loss) | (.8) | $ | 183.4 | ||||||||||||||||||||
41
| Three months ended | Nine months ended | ||||||||||||||
| September 30, | September 30, | ||||||||||||||
| 2017 | 2016 | 2017 | 2016 | ||||||||||||
| Expenses: | |||||||||||||||
| Bankers Life: | |||||||||||||||
| Insurance policy benefits | $ | 437.2 | $ | 427.1 | $ | 1,307.7 | $ | 1,240.9 | |||||||
| Amortization | 38.7 | 43.8 | 126.3 | 135.3 | |||||||||||
| Interest expense on investment borrowings | 5.3 | 3.5 | 14.3 | 9.4 | |||||||||||
| Other operating costs and expenses | 108.4 | 105.5 | 328.2 | 312.2 | |||||||||||
| Total Bankers Life expenses | 589.6 | 579.9 | 1,776.5 | 1,697.8 | |||||||||||
| Washington National: | |||||||||||||||
| Insurance policy benefits | 144.7 | 144.5 | 436.7 | 422.0 | |||||||||||
| Amortization | 14.3 | 14.3 | 43.9 | 44.5 | |||||||||||
| Interest expense on investment borrowings | 1.7 | .9 | 4.5 | 2.5 | |||||||||||
| Other operating costs and expenses | 47.5 | 47.0 | 145.0 | 140.3 | |||||||||||
| Total Washington National expenses | 208.2 | 206.7 | 630.1 | 609.3 | |||||||||||
| Colonial Penn: | |||||||||||||||
| Insurance policy benefits | 47.7 | 50.3 | 150.8 | 151.3 | |||||||||||
| Amortization | 3.9 | 3.7 | 11.9 | 11.3 | |||||||||||
| Interest expense on investment borrowings | .3 | .1 | .7 | .4 | |||||||||||
| Other operating costs and expenses | 23.5 | 27.2 | 73.0 | 84.2 | |||||||||||
| Total Colonial Penn expenses | 75.4 | 81.3 | 236.4 | 247.2 | |||||||||||
| Long-term care in run-off: | |||||||||||||||
| Insurance policy benefits | 11.4 | — | 36.6 | — | |||||||||||
| Other operating costs and expenses | .6 | — | 2.1 | — | |||||||||||
| Total Long-term care in run-off expenses | 12.0 | — | 38.7 | — | |||||||||||
| Corporate operations: | |||||||||||||||
| Interest expense on corporate debt | 11.7 | 11.5 | 34.8 | 34.3 | |||||||||||
| Other operating costs and expenses | 23.7 | 13.6 | 68.3 | 43.7 | |||||||||||
| Total corporate expenses | 35.4 | 25.1 | 103.1 | 78.0 | |||||||||||
| Total expenses | 920.6 | 893.0 | 2,784.8 | 2,632.3 | |||||||||||
| Pre-tax operating earnings by segment: | |||||||||||||||
| Bankers Life | 106.9 | 88.1 | 309.2 | 259.0 | |||||||||||
| Washington National | 27.5 | 25.2 | 74.6 | 73.0 | |||||||||||
| Colonial Penn | 9.0 | .9 | 16.7 | (2.9 | ) | ||||||||||
| Long-term care in run-off | (1.0 | ) | — | 1.1 | — | ||||||||||
| Corporate operations | (26.6 | ) | (15.9 | ) | (71.8 | ) | (53.8 | ) | |||||||
| Pre-tax operating earnings | $ | 115.8 | $ | 98.3 | $ | 329.8 | $ | 275.3 | |||||||
CNO FINANCIAL GROUP, INC. AND SUBSIDIARIES
Notes to Consolidated Financial Statements
(unaudited)
___________________
| Three months ended | Nine months ended | ||||||||||||||
| September 30, | September 30, | ||||||||||||||
| 2017 | 2016 | 2017 | 2016 | ||||||||||||
| Total segment revenues | $ | 1,036.4 | $ | 991.3 | $ | 3,114.6 | $ | 2,907.6 | |||||||
| Net realized investment gains | 29.2 | 11.6 | 52.3 | 23.3 | |||||||||||
| Revenues related to VIEs | 13.7 | 13.0 | 40.2 | 39.3 | |||||||||||
| Fee revenue related to transition and support services agreements | — | — | — | 10.0 | |||||||||||
| Consolidated revenues | 1,079.3 | 1,015.9 | 3,207.1 | 2,980.2 | |||||||||||
| Total segment expenses | 920.6 | 893.0 | 2,784.8 | 2,632.3 | |||||||||||
| Insurance policy benefits - fair value changes in embedded derivative liabilities | (2.9 | ) | (12.1 | ) | 9.8 | 47.0 | |||||||||
| Amortization related to fair value changes in embedded derivative liabilities | .6 | 2.7 | (1.8 | ) | (10.4 | ) | |||||||||
| Amortization related to net realized investment gains | .7 | .2 | 1.0 | .9 | |||||||||||
| Expenses related to VIEs | 17.0 | 13.7 | 44.8 | 40.5 | |||||||||||
| Fair value changes and amendment related to agent deferred compensation plan | 13.4 | (6.3 | ) | 13.4 | 12.0 | ||||||||||
| Loss on reinsurance transaction | — | 75.4 | — | 75.4 | |||||||||||
| Expenses related to transition and support services agreements | — | — | — | 10.0 | |||||||||||
| Consolidated expenses | 949.4 | 966.6 | 2,852.0 | 2,807.7 | |||||||||||
| Income before tax | 129.9 | 49.3 | 355.1 | 172.5 | |||||||||||
| Income tax expense (benefit): | |||||||||||||||
| Tax expense on period income | 44.1 | 16.9 | 123.6 | 61.7 | |||||||||||
| Valuation allowance for deferred tax assets and other tax items | (15.0 | ) | 13.8 | (15.0 | ) | (13.2 | ) | ||||||||
| Net income | $ | 100.8 | $ | 18.6 | $ | 246.5 | $ | 124.0 | |||||||
ACCOUNTING FOR DERIVATIVES
Our freestanding and embedded derivatives, which are not designated as hedging instruments, are held at fair value and are summarized as follows (dollars in millions):
| Fair value | ||||||||||||||
| March 31, 2023 | December 31, 2022 | |||||||||||||
| Assets: | ||||||||||||||
| Other invested assets: | ||||||||||||||
| Fixed indexed call options | $ | 108.2 | $ | 56.7 | ||||||||||
| Reinsurance receivables | (16.4) | (17.8) | ||||||||||||
| Total assets | $ | 91.8 | $ | 38.9 | ||||||||||
| Liabilities: | ||||||||||||||
| Future policy benefits: | ||||||||||||||
| Fixed indexed products | $ | 1,347.9 | $ | 1,297.0 | ||||||||||
| Total liabilities | $ | 1,347.9 | $ | 1,297.0 | ||||||||||
| Fair value | ||||||||
| September 30, 2017 | December 31, 2016 | |||||||
| Assets: | ||||||||
| Other invested assets: | ||||||||
| Fixed index call options | $ | 142.2 | $ | 111.9 | ||||
| Reinsurance receivables | (1.8 | ) | (4.2 | ) | ||||
| Total assets | $ | 140.4 | $ | 107.7 | ||||
| Liabilities: | ||||||||
| Future policy benefits: | ||||||||
| Fixed index products | $ | 1,249.3 | $ | 1,092.3 | ||||
| Total liabilities | $ | 1,249.3 | $ | 1,092.3 | ||||
Our fixed indexindexed annuity products provide a guaranteed minimum rate of return and a higher potential return that is based on a percentage (the "participation rate") of the amount of increase in the value of a particular index, such as the Standard & Poor's 500 Index, over a specified period. Typically, on each policy anniversary date, a new index period begins. We are generally able to change the participation rate at the beginning of each index period during a(typically on each policy year,anniversary date), subject to contractual minimums. The Company accounts for the options attributed to the policyholder for the estimated life of the contract as embedded derivatives. These accounting requirements often create volatility in the earnings from these products. We typically buy call options (including call spreads) referenced to the applicable indices in an effort to offset or hedge potential increases to policyholder benefits resulting from increases in the particular index to which the policy's return is linked. The notional amount of these options was $2.9$2.7 billion and $2.5$2.8 billion at September 30, 2017March 31, 2023 and December 31, 2016,2022, respectively.
We purchase certain fixed maturity securities that contain embedded derivatives that are required to be held at fair value on the consolidated balance sheet. We have elected the fair value option to carry the entire security at fair value with changes in fair value recognized in net income.
42
CNO FINANCIAL GROUP, INC. AND SUBSIDIARIES
Notes to Consolidated Financial Statements
(unaudited)
___________________
The following table provides the pre-tax gains (losses) recognized in net incomerevenues for derivative instruments, which are not designated as hedges for the periods indicated (dollars in millions):
| Three months ended | ||||||||||||||||||||||||||
| March 31, | ||||||||||||||||||||||||||
| 2023 | 2022 | |||||||||||||||||||||||||
| Net investment income (loss) from policyholder and other special-purpose portfolios: | ||||||||||||||||||||||||||
| Fixed indexed call options | $ | 18.6 | $ | (72.9) | ||||||||||||||||||||||
| Total investment gains (losses): | ||||||||||||||||||||||||||
| Embedded derivative related to modified coinsurance agreement | 1.4 | (6.5) | ||||||||||||||||||||||||
| Total revenues from derivative instruments, not designated as hedges | $ | 20.0 | $ | (79.4) | ||||||||||||||||||||||
| Three months ended | Nine months ended | |||||||||||||||
| September 30, | September 30, | |||||||||||||||
| 2017 | 2016 | 2017 | 2016 | |||||||||||||
| Net investment income from policyholder and other special-purpose portfolios: | ||||||||||||||||
| Fixed index call options | $ | 30.6 | $ | 17.0 | $ | 95.4 | $ | 10.9 | ||||||||
| Net realized gains (losses): | ||||||||||||||||
| Interest rate futures | — | — | — | (1.1 | ) | |||||||||||
| Embedded derivative related to modified coinsurance agreement | .3 | .1 | 2.4 | 6.7 | ||||||||||||
| Total | .3 | .1 | 2.4 | 5.6 | ||||||||||||
| Insurance policy benefits: | ||||||||||||||||
| Embedded derivative related to fixed index annuities | — | 18.3 | — | (33.3 | ) | |||||||||||
| Total | $ | 30.9 | $ | 35.4 | $ | 97.8 | $ | (16.8 | ) | |||||||
Derivative Counterparty Risk
If the counterparties to the call options fail to meet their obligations, we may recognize a loss. We limit our exposure to such a loss by diversifying among several counterparties believed to be strong and creditworthy. At September 30, 2017,March 31, 2023, all of our counterparties were rated "A-" or higher by S&P Global Ratings ("S&P").
The Company and its subsidiaries are parties to master netting arrangements with its counterparties related to entering into various derivative contracts. Exchange-traded derivatives require margin accounts which we offset.
The following table summarizes information related to derivatives with master netting arrangements or collateral as of September 30, 2017March 31, 2023 and December 31, 20162022 (dollars in millions):
| Gross amounts not offset in the balance sheet | |||||||||||||||||||||||||||||||||||||||||
| Gross amounts recognized | Gross amounts offset in the balance sheet | Net amounts of assets presented in the balance sheet | Financial instruments | Cash collateral received | Net amount | ||||||||||||||||||||||||||||||||||||
| March 31, 2023: | |||||||||||||||||||||||||||||||||||||||||
| Fixed indexed call options | $ | 108.2 | $ | — | $ | 108.2 | $ | — | $ | — | $ | 108.2 | |||||||||||||||||||||||||||||
| December 31, 2022: | |||||||||||||||||||||||||||||||||||||||||
| Fixed indexed call options | 56.7 | — | 56.7 | — | — | 56.7 | |||||||||||||||||||||||||||||||||||
| Gross amounts not offset in the balance sheet | |||||||||||||||||||||||||
| Gross amounts recognized | Gross amounts offset in the balance sheet | Net amounts of assets presented in the balance sheet | Financial instruments | Cash collateral received | Net amount | ||||||||||||||||||||
| September 30, 2017: | |||||||||||||||||||||||||
| Fixed index call options | $ | 142.2 | $ | — | $ | 142.2 | $ | — | $ | — | $ | 142.2 | |||||||||||||
| December 31, 2016: | |||||||||||||||||||||||||
| Fixed index call options | 111.9 | — | 111.9 | — | — | 111.9 | |||||||||||||||||||
REINSURANCE
The cost of reinsurance ceded totaled $27.1 million and $32.2 million in the third quarters of 2017 and 2016, respectively, and $79.9$48.3 million and $97.3$52.0 million in the first nine monthsquarters of 20172023 and 2016,2022, respectively. We deduct this cost from insurance policy income. Reinsurance recoveries netted against insurance policy benefits totaled $22.6 million and $31.7 million in the third quarters of 2017 and 2016, respectively, and $69.1$134.9 million and $113.3$93.9 million in the first nine monthsquarters of 20172023 and 2016,2022, respectively.
From time to time, we assume insurance from other companies. Any costs associated with the assumption of insurance are amortized consistent with the method used to amortize deferred acquisition costs. Reinsurance premiums assumed totaled $7.4 million and $8.3 million in the third quarters of 2017 and 2016, respectively, and $23.1$4.1 million and $25.8$4.9 million in the first nine monthsquarters of 20172023 and 2016,2022, respectively. Insurance policy benefits related to reinsurance assumed totaled $4.7 million and $6.1 million in the first quarters of 2023 and 2022, respectively.
43
Notes to Consolidated Financial Statements
(unaudited)
___________________
INCOME TAXES
The Company's interim tax expense is based upon the estimated annual effective tax rate for the respective period. Under authoritative guidance, certain items are required to be excluded from the estimated annual effective tax rate calculation. Such items include changes in judgment about the realizability of deferred tax assets resulting from changes in projections of income expected to be available in future years, and items deemed to be unusual, infrequent, or that can notcannot be reliably estimated. In these cases, the actual tax expense or benefit applicable to that item is treated discretely and is reported in the same period as the related item. The components of income tax expense are as follows (dollars in millions):
| Three months ended | |||||||||||||||||||||||
| March 31, | |||||||||||||||||||||||
| 2023 | 2022 | ||||||||||||||||||||||
| Current tax expense | $ | 14.0 | $ | 4.4 | |||||||||||||||||||
| Deferred tax expense (benefit) | (14.2) | 52.5 | |||||||||||||||||||||
| Total income tax expense (benefit) | $ | (.2) | $ | 56.9 | |||||||||||||||||||
| Three months ended | Nine months ended | ||||||||||||||
| September 30, | September 30, | ||||||||||||||
| 2017 | 2016 | 2017 | 2016 | ||||||||||||
| Current tax expense | $ | 25.9 | $ | 46.8 | $ | 68.5 | $ | 51.6 | |||||||
| Deferred tax expense (benefit) | 18.2 | (29.9 | ) | 55.1 | 10.1 | ||||||||||
| Valuation allowance applicable to current year income | (2.2 | ) | (10.5 | ) | (2.2 | ) | (10.5 | ) | |||||||
| Income tax expense calculated based on estimated annual effective tax rate | 41.9 | 6.4 | 121.4 | 51.2 | |||||||||||
| Income tax expense on discrete items: | |||||||||||||||
| Change in valuation allowance | (12.8 | ) | 16.0 | (12.8 | ) | (11.0 | ) | ||||||||
| Other items | — | 8.3 | — | 8.3 | |||||||||||
| Total income tax expense | $ | 29.1 | $ | 30.7 | $ | 108.6 | $ | 48.5 | |||||||
A reconciliation of the U.S. statutory corporate tax rate to the estimated annual effective rate, before discrete items, reflected in the consolidated statement of operations is as follows:
| Three months ended | |||||||||||
| March 31, | |||||||||||
| 2023 | 2022 | ||||||||||
| U.S. statutory corporate rate | 21.0 | % | 21.0 | % | |||||||
| Non-taxable income and nondeductible benefits, net | (.4) | — | |||||||||
| State taxes | 2.7 | 2.7 | |||||||||
| Effective tax rate | 23.3 | % | 23.7 | % | |||||||
44
| Nine months ended | |||||
| September 30, | |||||
| 2017 | 2016 | ||||
| U.S. statutory corporate rate | 35.0 | % | 35.0 | % | |
| Valuation allowance | (.6 | ) | (6.1 | ) | |
| Non-taxable income and nondeductible benefits, net | (1.5 | ) | (1.0 | ) | |
| State taxes | 1.3 | 1.8 | |||
| Estimated annual effective tax rate | 34.2 | % | 29.7 | % | |
CNO FINANCIAL GROUP, INC. AND SUBSIDIARIES
Notes to Consolidated Financial Statements
(unaudited)
___________________
The components of the Company's income tax assets and liabilities are summarized below (dollars in millions):
| March 31, 2023 | December 31, 2022 | ||||||||||
| Deferred tax assets: | |||||||||||
| Net federal operating loss carryforwards | $ | 149.9 | $ | 166.0 | |||||||
| Net state operating loss carryforwards | 2.5 | 2.5 | |||||||||
| Insurance liabilities | 329.4 | 298.5 | |||||||||
| Indirect costs allocable to self-constructed real estate assets | 224.4 | 214.8 | |||||||||
| Accumulated other comprehensive loss | 470.1 | 552.4 | |||||||||
| Other | — | 7.3 | |||||||||
| Gross deferred tax assets | 1,176.3 | 1,241.5 | |||||||||
| Deferred tax liabilities: | |||||||||||
| Investments | (34.8) | (37.2) | |||||||||
| Present value of future profits and deferred acquisition costs | (152.1) | (148.9) | |||||||||
| Other | (1.5) | — | |||||||||
| Gross deferred tax liabilities | (188.4) | (186.1) | |||||||||
| Net deferred tax assets | 987.9 | 1,055.4 | |||||||||
| Current income taxes prepaid | .2 | 8.0 | |||||||||
| Income tax assets, net | $ | 988.1 | $ | 1,063.4 | |||||||
| September 30, 2017 | December 31, 2016 | ||||||
| Deferred tax assets: | |||||||
| Net federal operating loss carryforwards | $ | 841.8 | $ | 882.9 | |||
| Net state operating loss carryforwards | 12.2 | 12.3 | |||||
| Investments | 13.7 | 17.8 | |||||
| Insurance liabilities | 678.9 | 668.4 | |||||
| Other | 60.1 | 66.3 | |||||
| Gross deferred tax assets | 1,606.7 | 1,647.7 | |||||
| Deferred tax liabilities: | |||||||
| Present value of future profits and deferred acquisition costs | (275.0 | ) | (277.8 | ) | |||
| Accumulated other comprehensive income | (516.9 | ) | (344.1 | ) | |||
| Gross deferred tax liabilities | (791.9 | ) | (621.9 | ) | |||
| Net deferred tax assets before valuation allowance | 814.8 | 1,025.8 | |||||
| Valuation allowance | (240.9 | ) | (240.2 | ) | |||
| Net deferred tax assets | 573.9 | 785.6 | |||||
| Current income taxes prepaid (accrued) | (6.5 | ) | 4.1 | ||||
| Income tax assets, net | $ | 567.4 | $ | 789.7 | |||
Our income tax expense includes deferred income taxes arising from temporary differences between the financial reporting and tax bases of assets and liabilities and net operating loss carryforwards ("NOLs"). Deferred tax assets and liabilities are measured using enacted tax rates expected to apply in the years in which temporary differences are expected to be recovered or paid. The effect of a change in tax rates on deferred tax assets and liabilities is recognized in earnings in the period when the changes are enacted.
A reduction of the net carrying amount of deferred tax assets by establishing a valuation allowance is required if, based on the available evidence, it is more likely than not that such assets will not be realized. In assessing the need for a valuation allowance, all available evidence, both positive and negative, shall beare considered to determine whether, based on the weight of
that evidence, a valuation allowance for deferred tax assets is needed. This assessment requires significant judgment and considers, among other matters, the nature, frequency and severity of current and cumulative losses, forecasts of future profitability, the duration of carryforward periods, our experience with operating loss and tax credit carryforwards expiring unused, and tax planning strategies.
We evaluate the need to establish a valuation allowance for our deferred income tax assets on an ongoing basis. The realization of our deferred tax assets depends upon generating sufficient future taxable income of the appropriate type during the periods in which our temporary differences become deductible and before our NOLs expire.
Recovery of our deferred tax asset is dependent on achieving the level of future taxable income projected in our deferred tax valuation model and failure to do so could result in an increase in the valuation allowance in a future period. Any future increase in the valuation allowance may result in additional income tax expense and reduce shareholders' equity, and such an increase could have a significant impact upon our earnings in the future.
The Internal Revenue Code (the "Code") limits the extent to which losses realized by a non-life entity (or entities) may offset income from a life insurance company (or companies) to the lesser of: (i) 35 percent of the income of the life insurance company; or (ii) 35 percent of the total loss of the non-life entities (including NOLs of the non-life entities). There is no similar
45
CNO FINANCIAL GROUP, INC. AND SUBSIDIARIES
Notes to Consolidated Financial Statements
(unaudited)
___________________
limitation on the extent to which losses realized by a life insurance entity (or entities) may offset income from a non-life entity (or entities). This limitation is the primary reason a valuation allowance for NOLs is required.
Section 382 of the Code imposes limitations on a corporation's ability to use its NOLs when the company undergoes ana 50 percent ownership change.change over a three-year period. Future transactions and the timing of such transactions could cause an ownership change for Section 382 income tax purposes. Such transactions may include, but are not limited to, additional repurchases under our securities repurchase program, issuances of common stock and acquisitions or sales of shares of CNO stock by certain holders of our shares, including persons who have held, currently hold or may accumulate in the future five percent or more of our outstanding common stock for their own account. Many of these transactions are beyond our control. If an additional ownership change were to occur for purposes of Section 382, we would be required to calculate an annual restriction on the use of our NOLs to offset future taxable income. The annual restriction would be calculated based upon the value of CNO's equity at the time of such ownership change, multiplied by a federal long-term tax exempt rate (1.93(2.92 percent at September 30, 2017)March 31, 2023), and the annual restriction could limit our ability to use a substantial portion of our NOLs to offset future taxable income. We regularly monitor ownership change (as calculated for purposes of Section 382) and, as of September 30, 2017,March 31, 2023, we were below the 50 percent ownership change level that would trigger further impairment ofcould limit our ability to utilize our NOLs.
| Net operating loss | ||||||||
| Year of expiration | carryforwards | |||||||
| 2023 | $ | 127.4 | ||||||
| 2025 | 85.2 | |||||||
| 2026 | 149.9 | |||||||
| 2027 | 10.8 | |||||||
| 2028 | 80.3 | |||||||
| 2029 | 213.2 | |||||||
| 2030 | .3 | |||||||
| 2031 | .2 | |||||||
| 2032 | 44.4 | |||||||
| 2033 | .6 | |||||||
| 2034 | .9 | |||||||
| 2035 | .8 | |||||||
| Total federal non-life NOLs | $ | 714.0 | ||||||
| Net operating loss | ||||
| Year of expiration | carryforwards | |||
| 2023 | $ | 1,818.5 | ||
| 2025 | 85.2 | |||
| 2026 | 149.9 | |||
| 2027 | 10.8 | |||
| 2028 | 80.3 | |||
| 2029 | 213.2 | |||
| 2030 | .3 | |||
| 2031 | .2 | |||
| 2032 | 44.4 | |||
| 2033 | .6 | |||
| 2034 | .9 | |||
| 2035 | .8 | |||
| Total federal NOLs | $ | 2,405.1 | ||
We also had deferred tax assets related to NOLs for state income taxes of $12.2$2.5 million and $12.3$2.5 million at September 30, 2017March 31, 2023 and December 31, 2016,2022, respectively. The related state NOLs are available to offset future state taxable income in certain states through 2025.and are expected to be fully utilized prior to expiration.
The Internal Revenue Service ("IRS") is conducting an examination of 2013our 2016 through 2014. In connection with this exam, we have agreed to extend the2018 tax returns. The federal statute of limitation for 2013limitations remains open with respect to tax years 2016 through September 30, 2018.2022. The Company’s various state income tax returns are generally open for tax years beginning in 2014, based on individual state statutes of limitation. Generally, for tax years which generate NOLs, capital losses or tax credit carryforwards, the statute remains open until the expiration of the statute of limitations for the tax year in which such carryforwards are utilized. The outcome of the tax auditaudits cannot be predicted with certainty. If the Company’s tax audit isaudits are not resolved in a manner consistent with management’s expectations, the Company may be required to adjust its provision for income taxes.
46
CNO FINANCIAL GROUP, INC. AND SUBSIDIARIES
Notes to Consolidated Financial Statements
(unaudited)
___________________
NOTES PAYABLE - DIRECT CORPORATE OBLIGATIONS
The following notes payable were direct corporate obligations of the Company as of September 30, 2017March 31, 2023 and December 31, 20162022 (dollars in millions):
| March 31, 2023 | December 31, 2022 | ||||||||||
| 5.250% Senior Notes due May 2025 | $ | 500.0 | $ | 500.0 | |||||||
| 5.250% Senior Notes due May 2029 | 500.0 | 500.0 | |||||||||
| 5.125% Subordinated Debentures due November 2060 | 150.0 | 150.0 | |||||||||
| Revolving Credit Agreement (as defined below) | — | — | |||||||||
| Unamortized debt issue costs | (10.8) | (11.2) | |||||||||
| Direct corporate obligations | $ | 1,139.2 | $ | 1,138.8 | |||||||
| September 30, 2017 | December 31, 2016 | ||||||
| 4.500% Senior Notes due May 2020 | $ | 325.0 | $ | 325.0 | |||
| 5.250% Senior Notes due May 2025 | 500.0 | 500.0 | |||||
| Revolving Credit Agreement (as defined below) | 100.0 | 100.0 | |||||
| Unamortized debt issue costs | (10.6 | ) | (12.1 | ) | |||
| Direct corporate obligations | $ | 914.4 | $ | 912.9 | |||
Revolving Credit Agreement
| Year ending September 30, | |||
| 2018 | $ | — | |
| 2019 | 100.0 | ||
| 2020 | 325.0 | ||
| 2021 | — | ||
| 2022 | — | ||
| Thereafter | 500.0 | ||
| $ | 925.0 | ||
INVESTMENT BORROWINGS
Three of the Company's insurance subsidiaries (Washington National Insurance Company ("Washington National"), Bankers(Bankers Life and Casualty Company ("Bankers Life"), Washington National Insurance Company ("Washington National") and Colonial Penn Life Insurance Company ("Colonial Penn")) are members of the Federal Home Loan Bank ("FHLB").FHLB. As members of the FHLB, our insurance subsidiaries have the ability to borrow on a collateralized basis from the FHLB. We are required to hold certain minimum amounts of FHLB common stock as a condition of membership in the FHLB, and additional amounts based on the amount of the borrowings. At September 30, 2017,March 31, 2023, the carrying value of the FHLB common stock was $71.2 million.$79.6 million. As of September 30, 2017,March 31, 2023, collateralized borrowings from the FHLB totaled $1.6$1.8 billion and the proceeds were used to purchase matched variable rate fixed maturity securities. The borrowings are classified as investment borrowings in the accompanying consolidated balance sheet. The borrowings are collateralized by investments with an estimated fair value of $2.0$2.4 billion at September 30, 2017,March 31, 2023, which are maintained in a custodial account for the benefit of the FHLB. Substantially all of such investments are classified as fixed maturities, available for sale, in our consolidated balance sheet.
47
CNO FINANCIAL GROUP, INC. AND SUBSIDIARIES
Notes to Consolidated Financial Statements
(unaudited)
___________________
The following summarizes the terms of the borrowings from the FHLB by our insurance subsidiaries (dollars in millions):
| Amount | Maturity | Interest rate at | ||||||||||||
| borrowed | date | March 31, 2023 | ||||||||||||
| 100.0 | April 2024 | Variable rate – 4.973% | ||||||||||||
| 22.0 | May 2024 | Variable rate – 5.202% | ||||||||||||
| 15.5 | July 2024 | Fixed rate – 1.990% | ||||||||||||
| 27.0 | August 2024 | Fixed rate – .640% | ||||||||||||
| 25.0 | September 2024 | Variable rate – 5.439% | ||||||||||||
| 21.7 | May 2025 | Variable rate – 5.114% | ||||||||||||
| 18.4 | June 2025 | Fixed rate – 2.940% | ||||||||||||
| 125.0 | September 2025 | Variable rate – 5.170% | ||||||||||||
| 100.0 | October 2025 | Variable rate – 5.246% | ||||||||||||
| 100.0 | October 2025 | Variable rate – 5.223% | ||||||||||||
| 57.7 | October 2025 | Variable rate – 5.185% | ||||||||||||
| 50.0 | November 2025 | Variable rate – 5.226% | ||||||||||||
| 50.0 | January 2026 | Variable rate – 5.168% | ||||||||||||
| 50.0 | January 2026 | Variable rate – 5.195% | ||||||||||||
| 100.0 | January 2026 | Variable rate – 5.064% | ||||||||||||
| 15.0 | January 2026 | Variable rate – 5.487% | ||||||||||||
| 21.8 | May 2026 | Variable rate – 4.954% | ||||||||||||
| 50.0 | May 2026 | Variable rate – 5.090% | ||||||||||||
| 75.0 | December 2026 | Variable rate – 5.169% | ||||||||||||
| 75.0 | January 2027 | Variable rate – 5.060% | ||||||||||||
| 50.0 | January 2027 | Variable rate – 5.077% | ||||||||||||
| 50.0 | January 2027 | Variable rate – 5.204% | ||||||||||||
| 100.0 | February 2027 | Variable rate – 5.133% | ||||||||||||
| 50.0 | April 2027 | Variable rate – 5.135% | ||||||||||||
| 50.0 | May 2027 | Variable rate – 5.145% | ||||||||||||
| 100.0 | June 2027 | Variable rate – 5.190% | ||||||||||||
| 10.0 | June 2027 | Variable rate – 5.413% | ||||||||||||
| 75.0 | January 2028 | Variable rate – 5.174% | ||||||||||||
| 50.0 | January 2028 | Variable rate – 5.382% | ||||||||||||
| 50.0 | January 2028 | Variable rate – 5.236% | ||||||||||||
| 34.5 | February 2028 | Variable rate – 5.294% | ||||||||||||
| 21.0 | February 2028 | Variable rate – 5.156% | ||||||||||||
| 100.0 | February 2028 | Variable rate – 5.153% | ||||||||||||
| $ | 1,839.6 | |||||||||||||
| Amount | Maturity | Interest rate at | ||||
| borrowed | date | September 30, 2017 | ||||
| $ | 50.0 | February 2018 | Variable rate – 1.404% | |||
| 50.0 | August 2018 | Variable rate – 1.435% | ||||
| 50.0 | January 2019 | Variable rate – 1.724% | ||||
| 50.0 | February 2019 | Variable rate – 1.404% | ||||
| 100.0 | March 2019 | Variable rate – 1.714% | ||||
| 21.8 | July 2019 | Variable rate – 1.727% | ||||
| 15.0 | October 2019 | Variable rate – 1.830% | ||||
| 50.0 | May 2020 | Variable rate – 1.754% | ||||
| 21.8 | June 2020 | Fixed rate – 1.960% | ||||
| 25.0 | September 2020 | Variable rate – 1.953% | ||||
| 100.0 | September 2020 | Variable rate – 1.897% | ||||
| 50.0 | September 2020 | Variable rate – 1.894% | ||||
| 75.0 | September 2020 | Variable rate – 1.453% | ||||
| 100.0 | October 2020 | Variable rate – 1.409% | ||||
| 50.0 | December 2020 | Variable rate – 1.932% | ||||
| 100.0 | July 2021 | Variable rate – 1.854% | ||||
| 100.0 | July 2021 | Variable rate – 1.824% | ||||
| 28.2 | August 2021 | Fixed rate – 2.550% | ||||
| 57.7 | August 2021 | Variable rate - 1.842% | ||||
| 125.0 | August 2021 | Variable rate – 1.717% | ||||
| 50.0 | September 2021 | Variable rate – 1.857% | ||||
| 22.0 | May 2022 | Variable rate – 1.668% | ||||
| 100.0 | May 2022 | Variable rate – 1.666% | ||||
| 10.0 | June 2022 | Variable rate – 1.931% | ||||
| 50.0 | July 2022 | Variable rate – 1.675% | ||||
| 50.0 | July 2022 | Variable rate – 1.693% | ||||
| 50.0 | July 2022 | Variable rate – 1.694% | ||||
| 50.0 | August 2022 | Variable rate – 1.702% | ||||
| 24.9 | March 2023 | Fixed rate – 2.160% | ||||
| 20.5 | June 2025 | Fixed rate – 2.940% | ||||
| $ | 1,646.9 | |||||
Interest expense of $19.5$21.7 million and $12.3$2.4 million in the first ninethree months of 20172023 and 2016,2022, respectively, was recognized related to total borrowings from the FHLB.
FHLB, reflecting higher interest rates on the variable rate investment borrowings in the 2023 period.
48
CNO FINANCIAL GROUP, INC. AND SUBSIDIARIES
Notes to Consolidated Financial Statements
(unaudited)
___________________
CHANGES IN COMMON STOCK
In the first ninethree months of 2017,2023, we repurchased 6.70.6 million shares of common stock for $140.1$15.1 million under our securities repurchase program. In May 2017, the Company announced that its Board of Directors approved an additional $300.0 million to repurchase the Company's outstanding common stock. The Company had remaining repurchase authority of $412.6$171.8 million as of September 30, 2017.March 31, 2023. In May 2023, the Company's Board of Directors approved an additional $500.0 million to repurchase the Company's outstanding shares of common stock.
In the first ninethree months of 2017,2023, we issued 1.2 million shares of common stock, net of shares withheld to pay tax withholdings, pursuant to employee benefit plans.
In the first three months of 2023, dividends declared on common stock totaled $44.7$16.4 million ($0.26($0.14 per common share). In May 2017,2023, the Company increased its quarterly common stock dividend to $0.09$0.15 per share from $0.08$0.14 per share.
| January 1, 2017 | |||||||||||||||
| Effect of Adoption of Authoritative Guidance | |||||||||||||||
| Amounts prior to effect of adoption of authoritative guidance | Election to account for forfeitures as they occur | Recognition of excess tax benefits | As adjusted | ||||||||||||
| Income tax assets | $ | 1,029.9 | $ | .3 | $ | 15.7 | $ | 1,045.9 | |||||||
| Valuation allowance for deferred income tax assets | (240.2 | ) | — | (15.7 | ) | (255.9 | ) | ||||||||
| Income tax assets, net | 789.7 | .3 | — | 790.0 | |||||||||||
| Total assets | 31,975.2 | .3 | — | 31,975.5 | |||||||||||
| Additional paid-in capital | 3,212.1 | .9 | — | 3,213.0 | |||||||||||
| Retained earnings | 650.7 | (.6 | ) | — | 650.1 | ||||||||||
| Total shareholders' equity | 4,486.9 | .3 | — | 4,487.2 | |||||||||||
| Total liabilities and shareholders' equity | 31,975.2 | .3 | — | 31,975.5 | |||||||||||
| Nine months ended | |||||||||||
| September 30, 2016 | |||||||||||
| Amounts prior to effect of adoption of authoritative guidance | Effect of adoption of authoritative guidance | As adjusted | |||||||||
| Cash flows from operating activities: | |||||||||||
| Other operating costs | $ | (555.4 | ) | $ | 3.3 | $ | (552.1 | ) | |||
| Net cash flow from operating activities | 581.5 | 3.3 | 584.8 | ||||||||
| Cash flows from financing activities: | |||||||||||
| Payments to repurchase common stock | (206.7 | ) | (3.3 | ) | (210.0 | ) | |||||
| Net cash used by financing activities | (34.2 | ) | (3.3 | ) | (37.5 | ) | |||||
| Net increase in cash and cash equivalents | 273.7 | — | 273.7 | ||||||||
LITIGATION AND OTHER LEGAL PROCEEDINGS
Legal Proceedings
The Company and its subsidiaries are involved in various legal actions in the normal course of business, in which claims for compensatory and punitive damages are asserted, some for substantial amounts. We recognize an estimated loss from these loss contingencies when we believe it is probable that a loss has been incurred and the amount of the loss can be reasonably estimated. Some of the pending matters have been filed as purported class actions and some actions have been filed in certain jurisdictions that permit punitive damage awards that are disproportionate to the actual damages incurred. The amounts sought in certain of these actions are often large or indeterminate and the ultimate outcome of certain actions is difficult to predict. In the event of an adverse outcome in one or more of these matters, there is a possibility that the ultimate liability may be in excess of the liabilities we have established and could have a material adverse effect on our business, financial condition, results of operations and cash flows. In addition, the resolution of pending or future litigation may involve modifications to the terms of outstanding insurance policies or could impact the timing and amount of rate increases, which could adversely affect the future profitability of the related insurance policies. Based upon information presently available, and in light of legal, factual and other defenses available to the Company and its subsidiaries, the Company does not believe that it is probable that the ultimate liability from either pending or threatened legal actions, after consideration of existing loss provisions, will have a material adverse effect on the Company's consolidated financial condition, operating results or cash flows. However, given the inherent difficulty in predicting the outcome of legal proceedings, there exists the possibility that such legal actions could have a material adverse effect on the Company's consolidated financial condition, operating results or cash flows.
In addition to the inherent difficulty of predicting litigation outcomes, particularly those that will be decided by a jury, some matters purport to seek substantial or an unspecified amount of damages for unsubstantiated conduct spanning several years based on complex legal theories and damages models. The alleged damages typically are indeterminate or not factually supported in the complaint, and, in any event, the Company's experience indicates that monetary demands for damages often bear little relation to the ultimate loss. In some cases, plaintiffs are seeking to certify classes in the litigation and class certification either has been denied or is pending and we have filed oppositions to class certification or sought to decertify a prior class certification. In addition, for many of these cases: (i) there is uncertainty as to the outcome of pending appeals or motions; (ii) there are significant factual issues to be resolved; and/or (iii) there are novel legal issues presented. Accordingly, the Company cannot reasonably estimate the possible loss or range of loss in excess of amounts accrued, if any, or predict the timing of the eventual resolution of these matters. The Company reviews these matters on an ongoing basis. When assessing reasonably possible and probable outcomes, the Company bases its assessment on the expected ultimate outcome following all appeals.
On September 29, 2016, Washington National andApril 9, 2019, Bankers Conseco Life Insurance Company ("BCLIC") commenced an arbitration proceeding seeking compensatory, consequential and punitive damages against BRe based upon BRe’s incurable material breaches of the long-term care reinsurance agreements, conversion, fraud, and breaches of fiduciary duties and the obligation to deal honestly and in good faith. BRe filed a counterclaim against Washington National and BCLIC in the arbitration alleging damages relating to the reinsurance agreements and their termination. In addition, on September 29, 2016, a complaint was filed by BCLIC and Washington National in the United States District Court for the Southern District of New York,commenced an action entitled Bankers Conseco Life Insurance Company and Washington National Insurance Company v. Moshe M. Feuer, Scott Taylor and David Levy, Case No. 16-cv-7646, alleging, among other claims, fraud/fraudulent concealment, and violationWilmington Trust, National Association, in the Supreme Court of the Racketeer Influenced and Corrupt Organizations Act. These allegations relate to the long-term care reinsurance agreements between BReState of New York, County of New York, Commercial Division (the "Wilmington Action"). BCLIC and Washington National seek an unspecified amount of damages, costs, attorney's fees, and other relief as the court deems appropriate. In the Wilmington Action, BCLIC respectively, and emanate from the undisclosed relationships between and among the defendants (who were the principal owners and officers of BRe) and Platinum Partners, LP ("Platinum") and its affiliates. On April 27, 2017, an amended complaint was filed adding Beechwood Capital Group, LLC as a defendant. Feuer, Taylor and Levy have moved to compel arbitration of Washington National's and BCLIC's claims. Washington National assert claims against Wilmington Trust, National Association ("Wilmington") for breaching its express contractual obligations under four trust agreements pursuant to which Wilmington was the trustee in regard to trust assets ceded as part of reinsurance agreements with Beechwood Re Ltd. ("BRe"), as well as for breaching its fiduciary duties to BCLIC and BCLIC intend to vigorously pursue their claims for damages and other remedies in the arbitration and the litigation described above.
Washington National. The Court
49
CNO FINANCIAL GROUP, INC. AND SUBSIDIARIES
Notes to Consolidated Financial Statements
(unaudited)
___________________
On June 7, 2019, the Joint Official Liquidators of Platinum Partners Value Arbitrage Fund L.P. (in Official Liquidation) and Principal Growth Strategies, LLC, commenced suit against, among others, CNO Financial Group, Inc., BCLIC, Washington National and 40|86 Advisors, Inc. (collectively, the "CNO Parties") in Delaware Chancery Court. Plaintiffs seek an unspecified amount of damages, costs, attorney's fees, and other relief as the court deems appropriate. Plaintiffs allege that the CNO Parties were unjustly enriched when they terminated BCLIC and Washington National's reinsurance agreements with BRe and recaptured assets from reinsurance trusts, in particular, Agera securities. Plaintiffs contend that the Agera securities were fraudulently transferred to the public notice, effective with their appointment,reinsurance trusts by other Platinum-related entities and they are seeking to claw back those Agera securities, or the Controllers assumed immediate controlvalue of those assets, from the affairs of BRe and have allCNO Parties. The CNO Parties are vigorously contesting the powers necessary to administerplaintiff's claims. The CNO Parties had removed the affairs of BRe including power to terminate its insurance business. The Controllers are responsible for assessing the financial position of BRe and submitting a reportcase to the Cayman Islands Monetary Authority by a dateUnited States District Court for the District of Delaware but on April 6, 2020, the District Court granted the plaintiff's motion to be specified. We are inremand the process of assessingcase back to the potential impact of this actionDelaware Chancery Court. Plaintiffs have filed an Amended Complaint and the CNO Parties have moved to dismiss the Amended Complaint. The Delaware Chancery Court denied the CNO Parties’ motions to dismiss the Amended Complaint on the proceedings described inbasis of forum non conveniens, but granted the foregoing paragraph.CNO Parties’ motion to stay the case pending the conclusion of a related matter. After the stay is lifted, the court will address the CNO Parties’ and other defendants’ motions to dismiss the Amended Complaint on numerous other grounds.
On July 20, 2007, a complaint was filed in the Hamilton County, Indiana Circuit Court, Signature Estates of Indiana, Inc. d/b/a Gordon Marketing, Stephens-Matthews Marketing, Inc., Shields Brokerage, Inc.June 28, 2019, BCLIC and Edwin A. Hildebrand d/b/a Hildebrand Insurance Services v. Conseco Medical Insurance Company, Conseco Medical Insurance Company a/k/a Washington National commenced an action entitled Bankers Conseco Life Insurance Company and Washington National Insurance Company Cause No. 29D02- 0707-PL-790. v. KPMG LLP, in the Supreme Court of the State of New York, County of New York, Commercial Division (the "KPMG Action"). BCLIC and Washington National seek an unspecified amount of damages, costs, attorney's fees, and other relief as the court deems appropriate. In the KPMG Action, BCLIC and Washington National assert claims against KPMG LLP ("KPMG") for aiding and abetting fraud, constructive fraud and negligent misrepresentation arising from KPMG's alleged role in the Platinum Partners' scheme to defraud BCLIC and Washington National into reinsuring its long-term care business with BRe. The PlaintiffsCourt granted KPMG’s motion to dismiss this litigation. BCLIC and Washington National appealed the Court's decision. On December 1, 2020, the New York Appellate Division of the Supreme Court, First Judicial Department unanimously reversed the trial court and reinstated the aiding and abetting claim against KPMG. The KPMG Action is currently pending in the Supreme Court of the State of New York, County of New York, Commercial Division.
On October 5, 2012, plaintiffs William Jeffrey Burnett and Joe H. Camp commenced an action entitled Burnett v. Conseco Life Ins. Co. against, among others, CNO Financial Group, Inc. and CNO Services, LLC (collectively, the "CNO Entities") in the United States District Court for the Central District of California on behalf of a putative class of former interest-sensitive whole life insurance policyholders who surrendered their policies or let them lapse. Plaintiffs' first amended complaint alleges that the CNO Entities are independentliable under an alter ego theory for Conseco Life Insurance Company's purported breach of the optional premium payment provision (the "Optional Premium Payment") of plaintiffs' insurance marketing organizations which previously marketedpolicies. In January 2018, the case was transferred to the United States District Court for the Southern District of Indiana (the "Court"). On August 17, 2020, the Court denied the CNO Entities' motions to dismiss. On January 13, 2021, the Court granted final approval of a class action settlement between plaintiffs and co-defendant Conseco MedicalLife Insurance Company ("CMIC") individual major medical products(n/k/a Wilco Life Insurance Company). The case remains pending against the CNO Entities. On March 25, 2022, the Court certified a Rule 23(b)(3) class of under 2,000 policyholders who invoked the policy's Optional Premium Payment prior to October 2008 and who surrendered their policies between October 7, 2008 and September 1, 2011. The Court's certification order acknowledged the existence of individualized issues of causation and damages, which are claiming damages for allegedly fraudulent conduct by CMICthe Court stated could be addressed in withdrawing from this business in 2002. The Plaintiffs contend that they relied on CMIC’s alleged representations that its major medical business was profitable and that CMIC was committed to it. The Plaintiffs further allege that when CMIC exited the market, it caused agents that were previously writing business through their organizations to cease doing business with them, thereby causing irreparable damage. CMIC merged into Washington National, effective July 1, 2003. On December 16, 2016,individualized proceedings following a juryclass trial verdicts were entered in favoron the alter ego allegations and the meaning of the plaintiffs, and compensatory damages aggregating $4.7 million and punitive damages aggregating $6.0 million were awardedsubject insurance policy language. The CNO Entities continue to vigorously defend the plaintiffs. Washington National filed post-trial motions requesting the court correct errors, grant a new trial, find that punitive damages were improper, and reduce both compensatory and punitive damages. Plaintiffs filed motions requesting pre-judgment interest and attorney fees. On June 19, 2017, the court reduced punitive damages by $1.5 million and denied plaintiffs' motions for pre-judgment interest and attorney fees. Both sides have filed a Notice of Appeal. We believe the case is without merit and intend to defend it vigorously.case.
Regulatory Examinations and Fines
Insurance companies face significant risks related to regulatory investigations and actions. Regulatory investigations generally result from matters related to sales or underwriting practices, payment of contingent or other sales commissions, claim payments and procedures, product design, product disclosure, additional premium charges for premiums paid on a periodic basis, denial or delay of benefits, charging excessive or impermissible fees on products, procedures related to canceling policies, changing the way cost of insurance charges are calculated for certain life insurance products or recommending
50
CNO FINANCIAL GROUP, INC. AND SUBSIDIARIES
Notes to Consolidated Financial Statements
(unaudited)
___________________
unsuitable products to customers. We are, in the ordinary course of our business, subject to various examinations, inquiries and information requests from state, federal and other authorities. The ultimate outcome of these regulatory actions (including the costs of complying with information requests and policy reviews) cannot be predicted with certainty. In the event of an unfavorable outcome in one or more of these matters, the ultimate liability may be in excess of liabilities we have established and we could suffer significant reputational harm as a result of these matters, which could also have a material adverse effect on our business, financial condition, results of operations or cash flows.
CONSOLIDATED STATEMENT OF CASH FLOWS
The following reconciles net income (loss) to net cash from operating activities (dollars in millions):
| Three months ended | |||||||||||
| March 31, | |||||||||||
| 2023 | 2022 | ||||||||||
| Cash flows from operating activities: | |||||||||||
| Net income (loss) | $ | (.8) | $ | 183.4 | |||||||
| Adjustments to reconcile net income (loss) to net cash from operating activities: | |||||||||||
| Amortization and depreciation | 65.7 | 61.1 | |||||||||
| Income taxes | (6.4) | 42.3 | |||||||||
| Insurance liabilities | 173.3 | (152.4) | |||||||||
| Accrual, amortization and fair value changes included in investment income | (27.9) | 52.2 | |||||||||
| Deferral of policy acquisition costs | (89.8) | (83.7) | |||||||||
| Net investment losses | 14.6 | 32.7 | |||||||||
| Other (a) | (46.8) | (79.2) | |||||||||
| Net cash from operating activities | $ | 81.9 | $ | 56.4 | |||||||
| Nine months ended | |||||||
| September 30, | |||||||
| 2017 | 2016 | ||||||
| Cash flows from operating activities: | |||||||
| Net income | $ | 246.5 | $ | 124.0 | |||
| Adjustments to reconcile net income to net cash from operating activities: | |||||||
| Amortization and depreciation | 200.8 | 199.1 | |||||
| Income taxes | 50.6 | 43.0 | |||||
| Insurance liabilities | 321.5 | 310.2 | |||||
| Accrual and amortization of investment income | (233.2 | ) | (93.4 | ) | |||
| Deferral of policy acquisition costs | (183.4 | ) | (179.4 | ) | |||
| Net realized investment gains | (52.3 | ) | (23.3 | ) | |||
| Loss on reinsurance transaction | — | 75.4 | |||||
| Cash and cash equivalents received upon recapture of reinsurance | — | 73.6 | |||||
| Loss on extinguishment of borrowings related to a variable interest entity | 5.5 | — | |||||
| Other | 77.7 | 55.6 | |||||
| Net cash from operating activities | $ | 433.7 | $ | 584.8 | |||
(a) Primarily relates to: (i) changes in other assets and liabilities related to the timing of payments and receipts; and (ii) the change in fair value of the deferred compensation plan liability.
Other non-cash items not reflected in the investing and financing activities sections of the consolidated statement of cash flows (dollars in millions):
| Three months ended | |||||||||||
| March 31, | |||||||||||
| 2023 | 2022 | ||||||||||
| Amounts related to employee benefit plans | $ | 6.5 | $ | 7.2 | |||||||
51
| Nine months ended | |||||||
| September 30, | |||||||
| 2017 | 2016 | ||||||
| Stock options, restricted stock and performance units | $ | 17.8 | $ | 18.9 | |||
| Market value of investments recaptured in connection with the termination of reinsurance agreements with BRe | — | 431.1 | |||||
CNO FINANCIAL GROUP, INC. AND SUBSIDIARIES
Notes to Consolidated Financial Statements
(unaudited)
___________________
INVESTMENTS IN VARIABLE INTEREST ENTITIES
We have concluded that we are the primary beneficiary with respect to certain VIEs, which are consolidated in our financial statements. In consolidating the VIEs, we consistently use the financial information most recently distributed to investors in the VIE.
All of the VIEs are collateralized loan trusts that were established to issue securities to finance the purchase of corporate loans and other permitted investments. The assets held by the trusts are legally isolated and not available to the Company. The liabilities of the VIEs are expected to be satisfied from the cash flows generated by the underlying loans held by the trusts, not from the assets of the Company. The Company has no financial obligation to the VIEs beyond its investment in each VIE.
Certain of our insurance subsidiaries are noteholders of the VIEs. Another subsidiary of the Company is the investment manager for the VIEs. As such, it has the power to direct the most significant activities of the VIEs which materially impacts the economic performance of the VIEs.
The following tables provide supplemental information about the assets and liabilities of the VIEs which have been consolidated in accordance with authoritative guidance (dollars in millions):
| September 30, 2017 | March 31, 2023 | |||||||||||||||||||||||||||
| VIEs | Eliminations | Net effect on consolidated balance sheet | VIEs | Eliminations | Net effect on consolidated balance sheet | |||||||||||||||||||||||
| Assets: | Assets: | |||||||||||||||||||||||||||
| Investments held by variable interest entities | $ | 1,382.5 | $ | — | $ | 1,382.5 | Investments held by variable interest entities | $ | 1,017.9 | $ | — | $ | 1,017.9 | |||||||||||||||
| Notes receivable of VIEs held by insurance subsidiaries | — | (159.9 | ) | (159.9 | ) | |||||||||||||||||||||||
| Notes receivable of VIEs held by subsidiaries | Notes receivable of VIEs held by subsidiaries | — | (113.8) | (113.8) | ||||||||||||||||||||||||
| Cash and cash equivalents held by variable interest entities | 105.9 | — | 105.9 | Cash and cash equivalents held by variable interest entities | 97.1 | — | 97.1 | |||||||||||||||||||||
| Accrued investment income | 2.0 | (.1 | ) | 1.9 | Accrued investment income | 4.0 | — | 4.0 | ||||||||||||||||||||
| Income tax assets, net | (.6 | ) | — | (.6 | ) | Income tax assets, net | 16.6 | — | 16.6 | |||||||||||||||||||
| Other assets | 13.3 | (1.4 | ) | 11.9 | Other assets | 4.5 | (.8) | 3.7 | ||||||||||||||||||||
| Total assets | $ | 1,503.1 | $ | (161.4 | ) | $ | 1,341.7 | Total assets | $ | 1,140.1 | $ | (114.6) | $ | 1,025.5 | ||||||||||||||
| Liabilities: | Liabilities: | |||||||||||||||||||||||||||
| Other liabilities | $ | 145.9 | $ | (3.5 | ) | $ | 142.4 | Other liabilities | $ | 26.8 | $ | (3.9) | $ | 22.9 | ||||||||||||||
| Borrowings related to variable interest entities | 1,198.2 | — | 1,198.2 | Borrowings related to variable interest entities | 1,065.4 | — | 1,065.4 | |||||||||||||||||||||
| Notes payable of VIEs held by insurance subsidiaries | 172.9 | (172.9 | ) | — | ||||||||||||||||||||||||
| Notes payable of VIEs held by subsidiaries | Notes payable of VIEs held by subsidiaries | 126.1 | (126.1) | — | ||||||||||||||||||||||||
| Total liabilities | $ | 1,517.0 | $ | (176.4 | ) | $ | 1,340.6 | Total liabilities | $ | 1,218.3 | $ | (130.0) | $ | 1,088.3 | ||||||||||||||
52
CNO FINANCIAL GROUP, INC. AND SUBSIDIARIES
Notes to Consolidated Financial Statements
(unaudited)
___________________
| December 31, 2022 | |||||||||||||||||
| VIEs | Eliminations | Net effect on consolidated balance sheet | |||||||||||||||
| Assets: | |||||||||||||||||
| Investments held by variable interest entities | $ | 1,077.6 | $ | — | $ | 1,077.6 | |||||||||||
| Notes receivable of VIEs held by subsidiaries | — | (113.8) | (113.8) | ||||||||||||||
| Cash and cash equivalents held by variable interest entities | 69.2 | — | 69.2 | ||||||||||||||
| Accrued investment income | 3.5 | — | 3.5 | ||||||||||||||
| Income tax assets, net | 19.6 | — | 19.6 | ||||||||||||||
| Other assets | 2.5 | (.8) | 1.7 | ||||||||||||||
| Total assets | $ | 1,172.4 | $ | (114.6) | $ | 1,057.8 | |||||||||||
| Liabilities: | |||||||||||||||||
| Other liabilities | $ | 29.3 | $ | (2.4) | $ | 26.9 | |||||||||||
| Borrowings related to variable interest entities | 1,104.6 | — | 1,104.6 | ||||||||||||||
| Notes payable of VIEs held by subsidiaries | 126.1 | (126.1) | — | ||||||||||||||
| Total liabilities | $ | 1,260.0 | $ | (128.5) | $ | 1,131.5 | |||||||||||
| December 31, 2016 | |||||||||||
| VIEs | Eliminations | Net effect on consolidated balance sheet | |||||||||
| Assets: | |||||||||||
| Investments held by variable interest entities | $ | 1,724.3 | $ | — | $ | 1,724.3 | |||||
| Notes receivable of VIEs held by insurance subsidiaries | — | (204.2 | ) | (204.2 | ) | ||||||
| Cash and cash equivalents held by variable interest entities | 189.3 | — | 189.3 | ||||||||
| Accrued investment income | 3.0 | (.1 | ) | 2.9 | |||||||
| Income tax assets, net | 6.4 | (1.3 | ) | 5.1 | |||||||
| Other assets | 13.1 | (1.8 | ) | 11.3 | |||||||
| Total assets | $ | 1,936.1 | $ | (207.4 | ) | $ | 1,728.7 | ||||
| Liabilities: | |||||||||||
| Other liabilities | $ | 81.8 | $ | (6.4 | ) | $ | 75.4 | ||||
| Borrowings related to variable interest entities | 1,662.8 | — | 1,662.8 | ||||||||
| Notes payable of VIEs held by insurance subsidiaries | 203.3 | (203.3 | ) | — | |||||||
| Total liabilities | $ | 1,947.9 | $ | (209.7 | ) | $ | 1,738.2 | ||||
The investment portfolios held by the VIEs are primarily comprised of commercial bank loans to corporate obligors which are almost entirely rated below-investment grade. At September 30, 2017,March 31, 2023, such loans had an amortized cost of $1,381.7 million;$1,060.3 million; gross unrealized gains of $8.4 million;$1.4 million; gross unrealized losses of $7.6 million;$40.3 million; allowance for credit losses of $3.5 million; and an estimated fair value of $1,382.5 million.$1,017.9 million.
The following table summarizes changes in the allowance for credit losses related to corporate securities held by VIEs for the three months ended March 31, 2023 and 2022 (dollars in millions):
| Three months ended | ||||||||||||||
| March 31, | ||||||||||||||
| 2023 | 2022 | |||||||||||||
| Allowance at the beginning of the period | $ | 5.5 | $ | 3.7 | ||||||||||
| Additions for securities for which credit losses were not previously recorded | .3 | 1.5 | ||||||||||||
| Additions for purchased securities with deteriorated credit | — | — | ||||||||||||
| Additions (reductions) for securities where an allowance was previously recorded | (.7) | 1.3 | ||||||||||||
| Reduction for securities sold during the period | (1.6) | (.6) | ||||||||||||
| Reduction for securities for which the Company made the decision to sell where an allowance was previously recorded | — | — | ||||||||||||
| Write-offs | — | — | ||||||||||||
| Recoveries of previously written-off amount | — | — | ||||||||||||
| Allowance at the end of the period | $ | 3.5 | $ | 5.9 | ||||||||||
53
CNO FINANCIAL GROUP, INC. AND SUBSIDIARIES
Notes to Consolidated Financial Statements
(unaudited)
___________________
The following table sets forth the amortized cost and estimated fair value of the investments held by the VIEs at September 30, 2017,March 31, 2023, by contractual maturity. Actual maturities will differ from contractual maturities because borrowers may have the right to call or prepay obligations with or without penalties.
| Amortized cost | Estimated fair value | ||||||||||
| (Dollars in millions) | |||||||||||
| Due in one year or less | $ | 5.4 | $ | 4.7 | |||||||
| Due after one year through five years | 782.3 | 752.8 | |||||||||
| Due after five years through ten years | 272.6 | 260.4 | |||||||||
| Total | $ | 1,060.3 | $ | 1,017.9 | |||||||
Amortized cost | Estimated fair value | ||||||
| (Dollars in millions) | |||||||
| Due in one year or less | $ | 5.9 | $ | 5.9 | |||
| Due after one year through five years | 499.4 | 500.1 | |||||
| Due after five years through ten years | 876.4 | 876.5 | |||||
| Total | $ | 1,381.7 | $ | 1,382.5 | |||
During the first ninethree months of 2017,2023, the VIEs recognized net realized investment losses of $2.5$0.6 million, which were comprised of: (i) $2.2$2.6 million of net gainslosses from the sales of investments;fixed maturities; and (ii) $4.3a decrease in the allowance for credit losses of $2.0 million. Such net realized losses included gross realized losses of $2.6 million from the sale of $5.6 million of losses on the dissolution of VIEs; and (iii) $.4 million of writedowns of investments for other than temporary declines in fair value recognized through net income.investments. During the first ninethree months of 2016,2022, the VIEs recognized net realized investment losses of $20.6$3.2 million, which were comprised of: (i) $12.1$0.8 million of net losses from the sales of fixed maturities; (ii) a $7.3 million loss on the dissolutionchange in market value of a VIE;other investments of $(0.2) million; and (iii) $1.2an increase in the allowance for credit losses of $2.2 million. Such net realized losses included gross realized losses of $0.8 million from the sale of $11.7 million of writedowns of investments for other than temporary declines in fair value recognized through net income.investments.
At September 30, 2017,March 31, 2023, there were no fixed maturity investments held by the VIEs that were in default or considered nonperforming.default.
At September 30, 2017,March 31, 2023, the VIEs held: (i) investments (for which an allowance for credit losses has not been recorded) with a fair value of $382.5$214.9 million and gross unrealized losses not deemed to have credit losses of $7.1$3.3 million that had been in an unrealized loss position for less than twelve months; and (ii) investments (for which an allowance for credit losses has not been recorded) with a fair value of $11.0$571.3 million and gross unrealized losses not deemed to have credit losses of $.5$19.4 million that had been in an unrealized loss position for greater than twelve months.months or greater.
At December 31, 2016,2022, the VIEs held: (i) investments (for which an allowance for credit losses has not been recorded) with a fair value of $93.8$392.2 million and gross unrealized losses of $.9$14.2 million that had been in an unrealized loss position for less than twelve months; and (ii) investments (for which an allowance for credit losses has not been recorded) with a fair value of $143.9$477.9 million and gross unrealized losses of $2.9$17.3 million that had been in an unrealized loss position for greater than twelve months.months or greater.
The investments held by the VIEs are evaluated for other-than-temporary declines in fair valueimpairment in a manner that is consistent with the Company's fixed maturities, available for sale.
In addition, the Company, in the normal course of business, makes passive investments in structured securities issued by VIEs for which the Company is not the investment manager. These structured securities include asset-backed securities, collateralized debtloan obligations, commercial mortgage-backed securities, agency residential mortgage-backed securities and collateralized mortgage obligations.
non-agency residential mortgage-backed securities. Our maximum exposure to loss on these securities is limited to our cost basis in the investment. We have determined that we are not the primary beneficiary of these structured securities due to the relative size of our investment in comparison to the total principal amount of the individual structured securities and the level of credit subordination which reduces our obligation to absorb gains or losses.
At September 30, 2017,March 31, 2023, we held investments in various limited partnerships and hedge funds, in which we are not the primary beneficiary, totaling $315.1$578.5 million (classified as other invested assets). At September 30, 2017,March 31, 2023, we had unfunded commitments to these partnerships and other investments of $266.2 million.totaling $431.0 million. Our maximum exposure to loss on these investments is limited to the amount of our investment.
54
CNO FINANCIAL GROUP, INC. AND SUBSIDIARIES
Notes to Consolidated Financial Statements
(unaudited)
___________________
FAIR VALUE MEASUREMENTS
Fair value is the price that would be received to sell an asset or paid to transfer a liability in an orderly transaction between market participants at the measurement date and, therefore, represents an exit price, not an entry price. We carry certain assets and liabilities at fair value on a recurring basis, including fixed maturities, equity securities, trading securities, investments held by VIEs, derivatives, separate account assets and embedded derivatives. We carry our company-owned life insurance policy,COLI, which is invested in a series of mutual funds, at its cash surrender value which approximates fair value. In addition, we disclose fair value for certain financial instruments, including mortgage loans, policy loans, cash and cash equivalents, insurance liabilities for interest-sensitive products and funding agreements, investment borrowings, notes payable and borrowings related to VIEs.
The degree of judgment utilized in measuring the fair value of financial instruments is largely dependent on the level to which pricing is based on observable inputs. Observable inputs reflect market data obtained from independent sources, while unobservable inputs reflect our view of market assumptions in the absence of observable market information. Financial instruments with readily available active quoted prices would be considered to have fair values based on the highest level of observable inputs, and little judgment would be utilized in measuring fair value. Financial instruments that rarely trade would often have fair value based on a lower level of observable inputs, and more judgment would be utilized in measuring fair value.
Valuation Hierarchy
There is a three-level hierarchy for valuing assets or liabilities at fair value based on whether inputs are observable or unobservable.
•Level 1 – includes assets and liabilities valued using inputs that are unadjusted quoted prices in active markets for identical assets or liabilities. Our Level 1 assets primarily include cash and cash equivalents and exchange tradedexchange-traded securities.
•Level 2 – includes assets and liabilities valued using inputs that are quoted prices for similar assets in an active market, quoted prices for identical or similar assets in a market that is not active, observable inputs, or observable inputs that can be corroborated by market data. Level 2 assets and liabilities include those financial instruments that are valued by independent pricing services using models or other valuation methodologies. These models consider various inputs such as credit rating, maturity, corporate credit spreads, reported trades and other inputs that are observable or derived from observable information in the marketplace or are supported by transactions executed in the marketplace. Financial assets in this category primarily include: certain publicly registered and privately placed corporate fixed maturity securities; certain government or agency securities; certain mortgage and asset-backed securities; certain equity securities; most investments held by our consolidated VIEs; certain mutual fund investments; most short-term investments; and non-exchange-traded derivatives such as call options. Financial liabilities in this category include investment borrowings, notes payable and borrowings related to VIEs.
•Level 3 – includes assets and liabilities valued using unobservable inputs that are used in model-based valuations that contain management assumptions. Level 3 assets and liabilities include those financial instruments whose fair value is estimated based on broker/dealer quotes, pricing services or internally developed models or methodologies utilizing significant inputs not based on, or corroborated by, readily available market information. Financial assets in this category include certain corporate securities, (primarily certain below-investment grade privately placed securities), certain structured securities, mortgage loans, and other less liquid securities. Financial liabilities in this category include our insurance liabilities for interest-sensitive products, which includes embedded derivatives (including embedded derivatives related to our fixed indexindexed annuity products and to a modified coinsurance arrangement), and funding agreements since their values include significant unobservable inputs including actuarial assumptions.
At each reporting date, we classify assets and liabilities into the three input levels based on the lowest level of input that is significant to the measurement of fair value for each asset and liability reported at fair value. This classification is impacted by a number of factors, including the type of financial instrument, whether the financial instrument is new to the market and not yet established, the characteristics specific to the transaction and overall market conditions. Our assessment
55
CNO FINANCIAL GROUP, INC. AND SUBSIDIARIES
Notes to Consolidated Financial Statements
(unaudited)
___________________
of the significance of a particular input to the fair value measurement and the ultimate classification of each asset and liability requires judgment and is subject to change from period to period based on the observability of the valuation inputs. Any transfers between levels
The vast majority of our fixed maturity and equity securities, including those held in trading portfolios and those held by consolidated VIEs, short-term and separate account assets carried at fair value use Level 2 inputs for the determination of fair value. These fair values are obtained primarily from independent pricing services, which use Level 2 inputs for the determination of fair value. Our Level 2 assets are valued as follows:
•Fixed maturities available for sale, equity securities and trading securities
Corporate securities are generally priced using market and income approaches.approaches using independent pricing services. Inputs generally consist of trades of identical or similar securities, quoted prices in inactive markets, issuer rating, benchmark yields, maturity and credit spreads.
U.S. Treasuries and obligations of U.S. Government corporations and agencies are generally priced using the market approach. Inputs generally consist of trades of identical or similar securities, quoted prices in inactive markets and maturity.
States and political subdivisions are generally priced using the market approach.approach using independent pricing services. Inputs generally consist of trades of identical or similar securities, quoted prices in inactive markets, new issuances and credit spreads.
Foreign governments are generally priced using the market approach using independent pricing services. Inputs generally consist of trades of identical or similar securities, quoted prices in inactive markets, new issuances, benchmark yields, credit spreads and issuer rating.
Asset-backed securities, agency and non-agency residential mortgage-backed securities, collateralized debtloan obligations and commercial mortgage-backed securities mortgage pass-through securities and collateralized mortgage obligations are generally priced using market and income approaches.approaches using independent pricing services. Inputs generally consist of quoted prices in inactive markets, spreads on actively traded securities, expected prepayments, expected default rates, expected recovery rates and issue specific information including, but not limited to, collateral type, seniority and vintage.
Equity securities (primarily comprised of non-redeemable preferred stock) are generally priced using the market approach. Inputs generally consist of trades of identical or similar securities, quoted prices in inactive markets, issuer rating, benchmark yields, maturity and credit spreads.
•Investments held by VIEs
Corporate securities are generally priced using market and income approaches using pricing vendors. Inputs generally consist of issuer rating, benchmark yields, maturity, and credit spreads.
•Other invested assets - derivatives
The fair value measurements for derivative instruments, including embedded derivatives requiring bifurcation, are determined based on the consideration of several inputs including closing exchange or over-the-counter market price quotes;quotes, time value and volatility factors underlying options;options, market interest rates;rates and non-performance risk.
As the Company is responsible for the determination of fair value, we have control processes designed to ensure that the fair values received from third-party pricing sources are reasonable and the valuation techniques and assumptions used
56
CNO FINANCIAL GROUP, INC. AND SUBSIDIARIES
Notes to Consolidated Financial Statements
(unaudited)
___________________
appear reasonable and consistent with prevailing market conditions. Additionally, when inputs are provided by third-party pricing sources, we have controls in place to review those inputs for reasonableness. As part of these controls, we perform monthly quantitative and qualitative analysis on the prices received from third parties to determine whether the prices are reasonable estimates of fair value. The Company's analysis includes: (i) a review of the methodology used by third partythird-party pricing services;
(ii) where available, a comparison of multiple pricing services' valuations for the same security; (iii) a review of month to month price fluctuations; (iv) a review to ensure valuations are not unreasonably dated; and (v) back testing to compare actual purchase and sale transactions with valuations received from third parties. As a result of such procedures, the Company may conclude the pricesa particular price received from a third parties areparty is not reflective of current market conditions. In those instances, we may request additional pricing quotes or apply internally developed valuations. However, the number of such instances is insignificant and the aggregate change in value of such investments is not materially different from the original prices received.
The categorization of the fair value measurements of our investments priced by independent pricing services was based upon the Company's judgment of the inputs or methodologies used by the independent pricing services to value different asset classes. Such inputs typically include: benchmark yields, reported trades, broker broker/dealer quotes, issuer spreads, benchmark securities, bids, offers and other relevant data. The Company categorizes such fair value measurements based upon asset classes and the underlying observable or unobservable inputs used to value such investments.
For securities that are not priced by pricing services and may not be reliably priced using pricing models, we obtain broker quotes. These broker quotes are non-binding andrepresent an exit price, but assumptions used to establish the fair value may not be observable and therefore represent Level 3 inputs. Approximately 4586 percent of our Level 3 fixed maturity securities and trading securities were valued using unadjusted broker quotes or broker-provided valuation inputs. The remaining Level 3 fixed maturity investments do not have readily determinable market prices and/or observable inputs. For these securities, we use internally developed valuations. Key assumptions used to determine fair value for these securities may include risk premiums, projected performance of underlying collateral and other factors involving significant assumptions which may not be reflective of an active market. For certain investments, we use a matrix or model process to develop a security price where future cash flow expectations are discounted at an estimated market rate. The pricing matrix incorporates term interest rates as well as a spread level based on the issuer's credit rating, other factors relating to the issuer, and the security's maturity. In some instances issuer-specific spread adjustments, which can be positive or negative, are made based upon internal analysis of security specifics such as liquidity, deal size, and time to maturity.
57
CNO FINANCIAL GROUP, INC. AND SUBSIDIARIES
Notes to Consolidated Financial Statements
(unaudited)
___________________
The categorization of fair value measurements, by input level, for our financial instruments carried at fair value on a recurring basis at September 30, 2017March 31, 2023 is as follows (dollars in millions):
| Quoted prices in active markets for identical assets or liabilities (Level 1) | Significant other observable inputs (Level 2) | Significant unobservable inputs (Level 3) | Total | ||||||||||||||||||||
| Assets: | |||||||||||||||||||||||
| Fixed maturities, available for sale: | |||||||||||||||||||||||
| Corporate securities | $ | — | $ | 11,848.6 | $ | 127.8 | $ | 11,976.4 | |||||||||||||||
| United States Treasury securities and obligations of United States government corporations and agencies | — | 170.1 | — | 170.1 | |||||||||||||||||||
| States and political subdivisions | — | 2,462.6 | — | 2,462.6 | |||||||||||||||||||
| Foreign governments | — | 78.6 | — | 78.6 | |||||||||||||||||||
| Asset-backed securities | — | 1,299.1 | 41.1 | 1,340.2 | |||||||||||||||||||
| Agency residential mortgage-backed securities | — | 215.9 | — | 215.9 | |||||||||||||||||||
| Non-agency residential mortgage-backed securities | — | 1,606.7 | 33.8 | 1,640.5 | |||||||||||||||||||
| Collateralized loan obligations | — | 918.9 | — | 918.9 | |||||||||||||||||||
| Commercial mortgage-backed securities | — | 2,290.1 | 13.8 | 2,303.9 | |||||||||||||||||||
| Total fixed maturities, available for sale | — | 20,890.6 | 216.5 | 21,107.1 | |||||||||||||||||||
| Equity securities - corporate securities | 31.1 | — | 75.0 | 106.1 | |||||||||||||||||||
| Trading securities: | |||||||||||||||||||||||
| Asset-backed securities | — | 25.5 | — | 25.5 | |||||||||||||||||||
| Agency residential mortgage-backed securities | — | .3 | — | .3 | |||||||||||||||||||
| Non-agency residential mortgage-backed securities | — | 58.3 | .5 | 58.8 | |||||||||||||||||||
| Commercial mortgage-backed securities | — | 123.5 | — | 123.5 | |||||||||||||||||||
| Total trading securities | — | 207.6 | .5 | 208.1 | |||||||||||||||||||
| Investments held by variable interest entities - corporate securities | — | 1,017.9 | — | 1,017.9 | |||||||||||||||||||
| Other invested assets: | |||||||||||||||||||||||
| Derivatives | — | 108.2 | — | 108.2 | |||||||||||||||||||
| Residual tranches | — | .9 | 19.2 | 20.1 | |||||||||||||||||||
| Total other invested assets | — | 109.1 | 19.2 | 128.3 | |||||||||||||||||||
| Market risk benefit asset | — | — | 57.8 | 57.8 | |||||||||||||||||||
| Assets held in separate accounts | — | 2.8 | — | 2.8 | |||||||||||||||||||
| Total assets carried at fair value by category | $ | 31.1 | $ | 22,228.0 | $ | 369.0 | $ | 22,628.1 | |||||||||||||||
| Liabilities: | |||||||||||||||||||||||
| Market risk benefit liability | $ | — | $ | — | $ | 17.6 | $ | 17.6 | |||||||||||||||
| Embedded derivatives associated with fixed indexed annuity products (classified as policyholder account liabilities) | — | — | 1,347.9 | 1,347.9 | |||||||||||||||||||
| Total liabilities carried at fair value by category | $ | — | $ | — | $ | 1,365.5 | $ | 1,365.5 | |||||||||||||||
58
| Quoted prices in active markets for identical assets or liabilities (Level 1) | Significant other observable inputs (Level 2) | Significant unobservable inputs (Level 3) | Total | ||||||||||||
| Assets: | |||||||||||||||
| Fixed maturities, available for sale: | |||||||||||||||
| Corporate securities | $ | — | $ | 14,394.3 | $ | 255.7 | $ | 14,650.0 | |||||||
| United States Treasury securities and obligations of United States government corporations and agencies | — | 172.3 | — | 172.3 | |||||||||||
| States and political subdivisions | — | 2,077.0 | — | 2,077.0 | |||||||||||
| Debt securities issued by foreign governments | — | 57.1 | 4.0 | 61.1 | |||||||||||
| Asset-backed securities | — | 2,726.2 | 59.9 | 2,786.1 | |||||||||||
| Collateralized debt obligations | — | 237.9 | — | 237.9 | |||||||||||
| Commercial mortgage-backed securities | — | 1,338.9 | — | 1,338.9 | |||||||||||
| Mortgage pass-through securities | — | 2.2 | — | 2.2 | |||||||||||
| Collateralized mortgage obligations | — | 804.4 | — | 804.4 | |||||||||||
| Total fixed maturities, available for sale | — | 21,810.3 | 319.6 | 22,129.9 | |||||||||||
| Equity securities - corporate securities | 477.8 | 213.9 | 21.6 | 713.3 | |||||||||||
| Trading securities: | |||||||||||||||
| Corporate securities | — | 21.1 | — | 21.1 | |||||||||||
| United States Treasury securities and obligations of United States government corporations and agencies | — | .5 | — | .5 | |||||||||||
| Asset-backed securities | — | 101.2 | — | 101.2 | |||||||||||
| Collateralized debt obligations | — | 2.7 | — | 2.7 | |||||||||||
| Commercial mortgage-backed securities | — | 93.3 | — | 93.3 | |||||||||||
| Collateralized mortgage obligations | — | 72.5 | — | 72.5 | |||||||||||
| Equity securities | 3.1 | — | — | 3.1 | |||||||||||
| Total trading securities | 3.1 | 291.3 | — | 294.4 | |||||||||||
| Investments held by variable interest entities - corporate securities | — | 1,377.5 | 5.0 | 1,382.5 | |||||||||||
| Other invested assets - derivatives | — | 142.2 | — | 142.2 | |||||||||||
| Assets held in separate accounts | — | 4.8 | — | 4.8 | |||||||||||
| Total assets carried at fair value by category | $ | 480.9 | $ | 23,840.0 | $ | 346.2 | $ | 24,667.1 | |||||||
| Liabilities: | |||||||||||||||
| Future policy benefits - embedded derivatives associated with fixed index annuity products | $ | — | $ | — | $ | 1,249.3 | $ | 1,249.3 | |||||||
CNO FINANCIAL GROUP, INC. AND SUBSIDIARIES
Notes to Consolidated Financial Statements
(unaudited)
___________________
The categorization of fair value measurements, by input level, for our financial instruments carried at fair value on a recurring basis at December 31, 20162022 is as follows (dollars in millions):
| Quoted prices in active markets for identical assets or liabilities (Level 1) | Significant other observable inputs (Level 2) | Significant unobservable inputs (Level 3) | Total | ||||||||||||||||||||
| Assets: | |||||||||||||||||||||||
| Fixed maturities, available for sale: | |||||||||||||||||||||||
| Corporate securities | $ | — | $ | 11,584.9 | $ | 127.8 | $ | 11,712.7 | |||||||||||||||
| United States Treasury securities and obligations of United States government corporations and agencies | — | 158.7 | — | 158.7 | |||||||||||||||||||
| States and political subdivisions | — | 2,388.5 | — | 2,388.5 | |||||||||||||||||||
| Foreign governments | — | 74.7 | — | 74.7 | |||||||||||||||||||
| Asset-backed securities | — | 1,230.0 | 57.0 | 1,287.0 | |||||||||||||||||||
| Agency residential mortgage-backed securities | — | 175.0 | — | 175.0 | |||||||||||||||||||
| Non-agency residential mortgage-backed securities | — | 1,492.3 | 56.2 | 1,548.5 | |||||||||||||||||||
| Collateralized loan obligations | — | 782.5 | 3.4 | 785.9 | |||||||||||||||||||
| Commercial mortgage-backed securities | — | 2,207.9 | 14.5 | 2,222.4 | |||||||||||||||||||
| Total fixed maturities, available for sale | — | 20,094.5 | 258.9 | 20,353.4 | |||||||||||||||||||
| Equity securities - corporate securities | 59.6 | — | 75.7 | 135.3 | |||||||||||||||||||
| Trading securities: | |||||||||||||||||||||||
| Asset-backed securities | — | 15.1 | — | 15.1 | |||||||||||||||||||
| Agency residential mortgage-backed securities | — | .3 | — | .3 | |||||||||||||||||||
| Non-agency residential mortgage-backed securities | — | 60.2 | .5 | 60.7 | |||||||||||||||||||
| Commercial mortgage-backed securities | — | 131.8 | — | 131.8 | |||||||||||||||||||
| Total trading securities | — | 207.4 | .5 | 207.9 | |||||||||||||||||||
| Investments held by variable interest entities - corporate securities | — | 1,077.6 | — | 1,077.6 | |||||||||||||||||||
| Other invested assets: | |||||||||||||||||||||||
| Derivatives | — | 56.7 | — | 56.7 | |||||||||||||||||||
| Residual tranches | — | — | 18.3 | 18.3 | |||||||||||||||||||
| Total other invested assets | — | 56.7 | 18.3 | 75.0 | |||||||||||||||||||
| Market risk benefit asset | — | — | 65.3 | 65.3 | |||||||||||||||||||
| Assets held in separate accounts | — | 2.7 | — | 2.7 | |||||||||||||||||||
| Total assets carried at fair value by category | $ | 59.6 | $ | 21,438.9 | $ | 418.7 | $ | 21,917.2 | |||||||||||||||
| Liabilities: | |||||||||||||||||||||||
| Market risk benefit liability | $ | — | $ | — | $ | 11.3 | $ | 11.3 | |||||||||||||||
| Embedded derivatives associated with fixed indexed annuity products (classified as policyholder account liabilities) | — | — | 1,297.0 | 1,297.0 | |||||||||||||||||||
| Total liabilities carried at fair value by category | $ | — | $ | — | $ | 1,308.3 | $ | 1,308.3 | |||||||||||||||
59
Quoted prices in active markets for identical assets or liabilities (Level 1) | Significant other observable inputs (Level 2) | Significant unobservable inputs (Level 3) | Total | ||||||||||||
| Assets: | |||||||||||||||
| Fixed maturities, available for sale: | |||||||||||||||
| Corporate securities | $ | — | $ | 13,252.4 | $ | 258.5 | $ | 13,510.9 | |||||||
| United States Treasury securities and obligations of United States government corporations and agencies | — | 164.3 | — | 164.3 | |||||||||||
| States and political subdivisions | — | 1,988.9 | — | 1,988.9 | |||||||||||
| Debt securities issued by foreign governments | — | 33.0 | 3.9 | 36.9 | |||||||||||
| Asset-backed securities | — | 2,649.9 | 60.4 | 2,710.3 | |||||||||||
| Collateralized debt obligations | — | 225.3 | 5.4 | 230.7 | |||||||||||
| Commercial mortgage-backed securities | — | 1,504.2 | 32.0 | 1,536.2 | |||||||||||
| Mortgage pass-through securities | — | 2.5 | — | 2.5 | |||||||||||
| Collateralized mortgage obligations | — | 915.5 | — | 915.5 | |||||||||||
| Total fixed maturities, available for sale | — | 20,736.0 | 360.2 | 21,096.2 | |||||||||||
| Equity securities - corporate securities | 359.9 | 199.1 | 25.2 | 584.2 | |||||||||||
| Trading securities: | |||||||||||||||
| Corporate securities | — | 19.0 | — | 19.0 | |||||||||||
| United States Treasury securities and obligations of United States government corporations and agencies | — | .5 | — | .5 | |||||||||||
| Asset-backed securities | — | 94.3 | — | 94.3 | |||||||||||
| Collateralized debt obligations | — | 2.4 | — | 2.4 | |||||||||||
| Commercial mortgage-backed securities | — | 163.9 | — | 163.9 | |||||||||||
| Collateralized mortgage obligations | — | 78.4 | — | 78.4 | |||||||||||
| Equity securities | 4.9 | — | — | 4.9 | |||||||||||
| Total trading securities | 4.9 | 358.5 | — | 363.4 | |||||||||||
| Investments held by variable interest entities - corporate securities | — | 1,724.3 | — | 1,724.3 | |||||||||||
| Other invested assets - derivatives | — | 111.9 | — | 111.9 | |||||||||||
| Assets held in separate accounts | — | 4.7 | — | 4.7 | |||||||||||
| Total assets carried at fair value by category | $ | 364.8 | $ | 23,134.5 | $ | 385.4 | $ | 23,884.7 | |||||||
| Liabilities: | |||||||||||||||
| Future policy benefits - embedded derivatives associated with fixed index annuity products | $ | — | $ | — | $ | 1,092.3 | $ | 1,092.3 | |||||||
CNO FINANCIAL GROUP, INC. AND SUBSIDIARIES
Notes to Consolidated Financial Statements
(unaudited)
___________________
The fair value measurements forof our financial instruments disclosed at fair value on a recurring basis are as follows (dollars in millions):
| March 31, 2023 | |||||||||||||||||||||||||||||
| Quoted prices in active markets for identical assets or liabilities (Level 1) | Significant other observable inputs (Level 2) | Significant unobservable inputs (Level 3) | Total estimated fair value | Total carrying amount | |||||||||||||||||||||||||
| Assets: | |||||||||||||||||||||||||||||
| Mortgage loans | $ | — | $ | — | $ | 1,557.5 | $ | 1,557.5 | $ | 1,676.1 | |||||||||||||||||||
| Policy loans | — | — | 123.0 | 123.0 | 123.0 | ||||||||||||||||||||||||
| Other invested assets: | |||||||||||||||||||||||||||||
| Company-owned life insurance | — | 201.3 | — | 201.3 | 201.3 | ||||||||||||||||||||||||
| Cash and cash equivalents: | |||||||||||||||||||||||||||||
| Unrestricted | 425.0 | — | — | 425.0 | 425.0 | ||||||||||||||||||||||||
| Held by variable interest entities | 97.1 | — | — | 97.1 | 97.1 | ||||||||||||||||||||||||
| Liabilities: | |||||||||||||||||||||||||||||
| Policyholder account liabilities | — | — | 15,302.9 | 15,302.9 | 15,302.9 | ||||||||||||||||||||||||
| Investment borrowings | — | 1,840.6 | — | 1,840.6 | 1,839.6 | ||||||||||||||||||||||||
| Borrowings related to variable interest entities | — | 1,034.8 | — | 1,034.8 | 1,065.4 | ||||||||||||||||||||||||
| Notes payable – direct corporate obligations | — | 1,079.5 | — | 1,079.5 | 1,139.2 | ||||||||||||||||||||||||
| September 30, 2017 | |||||||||||||||||||
Quoted prices in active markets for identical assets or liabilities (Level 1) | Significant other observable inputs (Level 2) | Significant unobservable inputs (Level 3) | Total estimated fair value | Total carrying amount | |||||||||||||||
| Assets: | |||||||||||||||||||
| Mortgage loans | $ | — | $ | — | $ | 1,705.8 | $ | 1,705.8 | $ | 1,667.8 | |||||||||
| Policy loans | — | — | 114.6 | 114.6 | 114.6 | ||||||||||||||
| Other invested assets: | |||||||||||||||||||
| Company-owned life insurance | — | 178.8 | — | 178.8 | 178.8 | ||||||||||||||
| Cash and cash equivalents: | |||||||||||||||||||
| Unrestricted | 765.9 | — | — | 765.9 | 765.9 | ||||||||||||||
| Held by variable interest entities | 105.9 | — | — | 105.9 | 105.9 | ||||||||||||||
| Liabilities: | |||||||||||||||||||
| Policyholder account balances | — | — | 11,113.5 | 11,113.5 | 11,113.5 | ||||||||||||||
| Investment borrowings | — | 1,650.1 | — | 1,650.1 | 1,646.9 | ||||||||||||||
| Borrowings related to variable interest entities | — | 1,215.1 | — | 1,215.1 | 1,198.2 | ||||||||||||||
| Notes payable – direct corporate obligations | — | 970.5 | — | 970.5 | 914.4 | ||||||||||||||
| December 31, 2022 | |||||||||||||||||||||||||||||
| Quoted prices in active markets for identical assets or liabilities (Level 1) | Significant other observable inputs (Level 2) | Significant unobservable inputs (Level 3) | Total estimated fair value | Total carrying amount | |||||||||||||||||||||||||
| Assets: | |||||||||||||||||||||||||||||
| Mortgage loans | $ | — | $ | — | $ | 1,273.6 | $ | 1,273.6 | $ | 1,411.9 | |||||||||||||||||||
| Policy loans | — | — | 121.6 | 121.6 | 121.6 | ||||||||||||||||||||||||
| Other invested assets: | |||||||||||||||||||||||||||||
| Company-owned life insurance | — | 199.1 | — | 199.1 | 199.1 | ||||||||||||||||||||||||
| Cash and cash equivalents: | |||||||||||||||||||||||||||||
| Unrestricted | 575.7 | — | — | 575.7 | 575.7 | ||||||||||||||||||||||||
| Held by variable interest entities | 69.2 | — | — | 69.2 | 69.2 | ||||||||||||||||||||||||
| Liabilities: | |||||||||||||||||||||||||||||
| Policyholder account liabilities | — | — | 15,234.2 | 15,234.2 | 15,234.2 | ||||||||||||||||||||||||
| Investment borrowings | — | 1,640.5 | — | 1,640.5 | 1,639.5 | ||||||||||||||||||||||||
| Borrowings related to variable interest entities | — | 1,066.3 | — | 1,066.3 | 1,104.6 | ||||||||||||||||||||||||
| Notes payable – direct corporate obligations | — | 1,077.0 | — | 1,077.0 | 1,138.8 | ||||||||||||||||||||||||
60
CNO FINANCIAL GROUP, INC. AND SUBSIDIARIES
Notes to Consolidated Financial Statements
(unaudited)
___________________
| December 31, 2016 | |||||||||||||||||||
Quoted prices in active markets for identical assets or liabilities (Level 1) | Significant other observable inputs (Level 2) | Significant unobservable inputs (Level 3) | Total estimated fair value | Total carrying amount | |||||||||||||||
| Assets: | |||||||||||||||||||
| Mortgage loans | $ | — | $ | — | $ | 1,800.1 | $ | 1,800.1 | $ | 1,768.0 | |||||||||
| Policy loans | — | — | 112.0 | 112.0 | 112.0 | ||||||||||||||
| Other invested assets: | |||||||||||||||||||
| Company-owned life insurance | — | 165.0 | — | 165.0 | 165.0 | ||||||||||||||
| Cash and cash equivalents: | |||||||||||||||||||
| Unrestricted | 473.6 | 5.3 | — | 478.9 | 478.9 | ||||||||||||||
| Held by variable interest entities | 189.3 | — | — | 189.3 | 189.3 | ||||||||||||||
| Liabilities: | |||||||||||||||||||
| Policyholder account balances | — | — | 10,912.7 | 10,912.7 | 10,912.7 | ||||||||||||||
| Investment borrowings | — | 1,650.0 | — | 1,650.0 | 1,647.4 | ||||||||||||||
| Borrowings related to variable interest entities | — | 1,675.2 | — | 1,675.2 | 1,662.8 | ||||||||||||||
| Notes payable – direct corporate obligations | — | 931.9 | — | 931.9 | 912.9 | ||||||||||||||
The following table presents additional information about assets and liabilities measured at fair value on a recurring basis and for which we have utilized significant unobservable (Level 3) inputs to determine fair value for the three months ended September 30, 2017March 31, 2023 (dollars in millions):
| September 30, 2017 | March 31, 2023 | |||||||||||||||||||||||||||||||||||||||||||||||||||||||||||||||||||||||||||||||||||||||
| Beginning balance as of June 30, 2017 | Purchases, sales, issuances and settlements, net (b) | Total realized and unrealized gains (losses) included in net income | Total realized and unrealized gains (losses) included in accumulated other comprehensive income (loss) | Transfers into Level 3 (a) | Transfers out of Level 3 (a) | Ending balance as of September 30, 2017 | Amount of total gains (losses) for the three months ended September 30, 2017 included in our net income relating to assets and liabilities still held as of the reporting date | Beginning balance as of December 31, 2022 | Purchases, sales, issuances and settlements, net (b) | Total realized and unrealized gains (losses) included in net income | Total realized and unrealized gains (losses) included in accumulated other comprehensive income (loss) | Transfers into Level 3 (a) | Transfers out of Level 3 (a) | Ending balance as of March 31, 2023 | Amount of total gains (losses) for the three months ended March 31, 2023 included in our net income relating to assets still held as of the reporting date | Amount of total gains (losses) for the three months ended March 31, 2023 included in accumulated other comprehensive income (loss) relating to assets still held as of the reporting date | ||||||||||||||||||||||||||||||||||||||||||||||||||||||||||||||||||||||||
| Assets: | Assets: | |||||||||||||||||||||||||||||||||||||||||||||||||||||||||||||||||||||||||||||||||||||||
| Fixed maturities, available for sale: | Fixed maturities, available for sale: | |||||||||||||||||||||||||||||||||||||||||||||||||||||||||||||||||||||||||||||||||||||||
| Corporate securities | $ | 263.3 | $ | (44.8 | ) | $ | 1.7 | $ | 1.3 | $ | 34.2 | $ | — | $ | 255.7 | $ | (3.2 | ) | Corporate securities | $ | 127.8 | $ | (.5) | $ | .1 | $ | .9 | $ | 5.9 | $ | (6.4) | $ | 127.8 | $ | .1 | $ | .1 | |||||||||||||||||||||||||||||||||||||||||||||||||||
| Debt securities issued by foreign governments | 3.9 | — | — | .1 | — | — | 4.0 | — | ||||||||||||||||||||||||||||||||||||||||||||||||||||||||||||||||||||||||||||||||
| Asset-backed securities | 59.6 | (1.3 | ) | — | .7 | 7.1 | (6.2 | ) | 59.9 | — | Asset-backed securities | 57.0 | (5.1) | (.2) | (.2) | — | (10.4) | 41.1 | — | (.5) | ||||||||||||||||||||||||||||||||||||||||||||||||||||||||||||||||||||
| Collateralized debt obligations | 2.5 | (2.5 | ) | — | — | — | — | — | — | |||||||||||||||||||||||||||||||||||||||||||||||||||||||||||||||||||||||||||||||
| Collateralized mortgage obligations | .2 | — | — | (.2 | ) | — | — | — | — | |||||||||||||||||||||||||||||||||||||||||||||||||||||||||||||||||||||||||||||||
| Non-agency residential mortgage-backed securities | Non-agency residential mortgage-backed securities | 56.2 | (.2) | — | 2.3 | — | (24.5) | 33.8 | — | 2.4 | ||||||||||||||||||||||||||||||||||||||||||||||||||||||||||||||||||||||||||||||
| Collateralized loan obligations | Collateralized loan obligations | 3.4 | — | — | — | — | (3.4) | — | — | — | ||||||||||||||||||||||||||||||||||||||||||||||||||||||||||||||||||||||||||||||
| Commercial mortgage-backed securities | Commercial mortgage-backed securities | 14.5 | — | — | (.7) | — | — | 13.8 | — | (.7) | ||||||||||||||||||||||||||||||||||||||||||||||||||||||||||||||||||||||||||||||
| Total fixed maturities, available for sale | 329.5 | (48.6 | ) | 1.7 | 1.9 | 41.3 | (6.2 | ) | 319.6 | (3.2 | ) | Total fixed maturities, available for sale | 258.9 | (5.8) | (.1) | 2.3 | 5.9 | (44.7) | 216.5 | .1 | 1.3 | |||||||||||||||||||||||||||||||||||||||||||||||||||||||||||||||||||
| Equity securities - corporate securities | 24.6 | (8.3 | ) | 6.4 | (1.1 | ) | — | — | 21.6 | (.5 | ) | Equity securities - corporate securities | 75.7 | — | (.7) | — | — | — | 75.0 | (.7) | — | |||||||||||||||||||||||||||||||||||||||||||||||||||||||||||||||||||
| Investments held by variable interest entities - corporate securities | — | — | — | — | 5.0 | — | 5.0 | — | ||||||||||||||||||||||||||||||||||||||||||||||||||||||||||||||||||||||||||||||||
| Liabilities: | ||||||||||||||||||||||||||||||||||||||||||||||||||||||||||||||||||||||||||||||||||||||||
| Future policy benefits - embedded derivatives associated with fixed index annuity products | (1,205.4 | ) | (56.3 | ) | 12.4 | — | — | — | (1,249.3 | ) | 12.4 | |||||||||||||||||||||||||||||||||||||||||||||||||||||||||||||||||||||||||||||
| Trading securities - non-agency residential mortgage-backed securities | Trading securities - non-agency residential mortgage-backed securities | .5 | — | — | — | — | — | .5 | — | — | ||||||||||||||||||||||||||||||||||||||||||||||||||||||||||||||||||||||||||||||
| Other invested assets - residual tranches | Other invested assets - residual tranches | 18.3 | .5 | .4 | — | — | — | 19.2 | .4 | — | ||||||||||||||||||||||||||||||||||||||||||||||||||||||||||||||||||||||||||||||
61
CNO FINANCIAL GROUP, INC. AND SUBSIDIARIES
Notes to Consolidated Financial Statements
(unaudited)
___________________
_________
(a)Transfers into Level 3 are the result of unobservable inputs utilized within valuation methodologies for assets that were previously valued using observable inputs. Transfers out of Level 3 are due to the use of observable inputs in valuation methodologies as well as the utilization of pricing service information for certain assets that the Company is able to validate.
(b)Purchases, sales, issuances and settlements, net, represent the activity that occurred during the period that results in a change of the asset but does not represent changes in fair value for the instruments held at the beginning of the period. Such activity primarily consists of purchases and sales of fixed maturity and equity securities. The following summarizes such activity for the three months ended March 31, 2023 (dollars in millions):
| Purchases | Sales | Issuances | Settlements | Purchases, sales, issuances and settlements, net | |||||||||||||||||||||||||
| Assets: | |||||||||||||||||||||||||||||
| Fixed maturities, available for sale: | |||||||||||||||||||||||||||||
| Corporate securities | $ | .9 | $ | (1.4) | $ | — | $ | — | $ | (.5) | |||||||||||||||||||
| Asset-backed securities | 2.3 | (7.4) | — | — | (5.1) | ||||||||||||||||||||||||
| Non-agency residential mortgage-backed securities | — | (.2) | — | — | (.2) | ||||||||||||||||||||||||
| Total fixed maturities, available for sale | 3.2 | (9.0) | — | — | (5.8) | ||||||||||||||||||||||||
| Other invested assets - residual tranches | .7 | (.2) | — | — | .5 | ||||||||||||||||||||||||
62
| Purchases | Sales | Issuances | Settlements | Purchases, sales, issuances and settlements, net | |||||||||||||||
| Assets: | |||||||||||||||||||
| Fixed maturities, available for sale: | |||||||||||||||||||
| Corporate securities | $ | 15.3 | $ | (60.1 | ) | $ | — | $ | — | $ | (44.8 | ) | |||||||
| Asset-backed securities | 9.9 | (11.2 | ) | — | — | (1.3 | ) | ||||||||||||
| Collateralized debt obligations | — | (2.5 | ) | — | — | (2.5 | ) | ||||||||||||
| Total fixed maturities, available for sale | 25.2 | (73.8 | ) | — | — | (48.6 | ) | ||||||||||||
| Equity securities - corporate securities | — | (8.3 | ) | — | — | (8.3 | ) | ||||||||||||
| Liabilities: | |||||||||||||||||||
| Future policy benefits - embedded derivatives associated with fixed index annuity products | (41.0 | ) | 1.8 | (31.4 | ) | 14.3 | (56.3 | ) | |||||||||||
CNO FINANCIAL GROUP, INC. AND SUBSIDIARIES
Notes to Consolidated Financial Statements
(unaudited)
___________________
The following table presents additional information about assets and liabilities measured at fair value on a recurring basis and for which we have utilized significant unobservable (Level 3) inputs to determine fair value for the nine months ended September 30, 2017 (dollars in millions):
| September 30, 2017 | ||||||||||||||||||||||||||||||||
| Beginning balance as of December 31, 2016 | Purchases, sales, issuances and settlements, net (b) | Total realized and unrealized gains (losses) included in net income | Total realized and unrealized gains (losses) included in accumulated other comprehensive income (loss) | Transfers into Level 3 (a) | Transfers out of Level 3 (a) | Ending balance as of September 30, 2017 | Amount of total gains (losses) for the nine months ended September 30, 2017 included in our net income relating to assets and liabilities still held as of the reporting date | |||||||||||||||||||||||||
| Assets: | ||||||||||||||||||||||||||||||||
| Fixed maturities, available for sale: | ||||||||||||||||||||||||||||||||
| Corporate securities | $ | 258.5 | $ | (44.1 | ) | $ | 9.5 | $ | .6 | $ | 31.2 | $ | — | $ | 255.7 | $ | (6.5 | ) | ||||||||||||||
| Debt securities issued by foreign governments | 3.9 | — | — | .1 | — | — | 4.0 | — | ||||||||||||||||||||||||
| Asset-backed securities | 60.4 | 3.8 | — | 2.3 | 4.2 | (10.8 | ) | 59.9 | — | |||||||||||||||||||||||
| Collateralized debt obligations | 5.4 | (2.5 | ) | — | — | — | (2.9 | ) | — | — | ||||||||||||||||||||||
| Commercial mortgage-backed securities | 32.0 | — | — | — | — | (32.0 | ) | — | — | |||||||||||||||||||||||
| Total fixed maturities, available for sale | 360.2 | (42.8 | ) | 9.5 | 3.0 | 35.4 | (45.7 | ) | 319.6 | (6.5 | ) | |||||||||||||||||||||
| Equity securities - corporate securities | 25.2 | (8.5 | ) | 6.3 | (1.4 | ) | — | — | 21.6 | (.5 | ) | |||||||||||||||||||||
| Investments held by variable interest entities - corporate securities | — | 5.0 | — | — | — | — | 5.0 | — | ||||||||||||||||||||||||
| Liabilities: | ||||||||||||||||||||||||||||||||
| Future policy benefits - embedded derivatives associated with fixed index annuity products | (1,092.3 | ) | (174.2 | ) | 17.2 | — | — | — | (1,249.3 | ) | 17.2 | |||||||||||||||||||||
| Purchases | Sales | Issuances | Settlements | Purchases, sales, issuances and settlements, net | |||||||||||||||
| Assets: | |||||||||||||||||||
| Fixed maturities, available for sale: | |||||||||||||||||||
| Corporate securities | $ | 64.3 | $ | (108.4 | ) | $ | — | $ | — | $ | (44.1 | ) | |||||||
| Asset-backed securities | 21.9 | (18.1 | ) | — | — | 3.8 | |||||||||||||
| Collateralized debt obligations | — | (2.5 | ) | — | — | (2.5 | ) | ||||||||||||
| Total fixed maturities, available for sale | 86.2 | (129.0 | ) | — | — | (42.8 | ) | ||||||||||||
| Equity securities - corporate securities | — | (8.5 | ) | — | — | (8.5 | ) | ||||||||||||
| Investments held by variable interest entities - corporate securities | 5.0 | — | — | — | 5.0 | ||||||||||||||
| Liabilities: | |||||||||||||||||||
| Future policy benefits - embedded derivatives associated with fixed index annuity products | (130.1 | ) | 5.3 | (95.7 | ) | 46.3 | (174.2 | ) | |||||||||||
| March 31, 2022 | |||||||||||||||||||||||||||||||||||||||||||||||||||||
| Beginning balance as of December 31, 2021 | Purchases, sales, issuances and settlements, net (b) | Total realized and unrealized gains (losses) included in net income | Total realized and unrealized gains (losses) included in accumulated other comprehensive income (loss) | Transfers into Level 3 (a) | Transfers out of Level 3 (a) | Ending balance as of March 31, 2022 | Amount of total gains (losses) for the three months ended March 31, 2022 included in our net income relating to assets still held as of the reporting date | Amount of total gains (losses) for the three months ended March 31, 2022 included in accumulated other comprehensive income (loss) relating to assets still held as of the reporting date | |||||||||||||||||||||||||||||||||||||||||||||
| Assets: | |||||||||||||||||||||||||||||||||||||||||||||||||||||
| Fixed maturities, available for sale: | |||||||||||||||||||||||||||||||||||||||||||||||||||||
| Corporate securities | $ | 89.7 | $ | — | $ | (1.4) | $ | (6.5) | $ | 36.2 | $ | — | $ | 118.0 | $ | (2.1) | $ | (6.5) | |||||||||||||||||||||||||||||||||||
| Asset-backed securities | 26.6 | 15.9 | — | (1.3) | — | — | 41.2 | — | (1.3) | ||||||||||||||||||||||||||||||||||||||||||||
| Non-agency residential mortgage-backed securities | — | — | — | (.6) | 5.0 | — | 4.4 | — | (.6) | ||||||||||||||||||||||||||||||||||||||||||||
| Collateralized loan obligations | 5.0 | 10.0 | — | (.2) | — | (5.0) | 9.8 | — | (.2) | ||||||||||||||||||||||||||||||||||||||||||||
| Commercial mortgage-backed securities | 19.0 | — | — | (1.5) | — | — | 17.5 | — | (1.5) | ||||||||||||||||||||||||||||||||||||||||||||
| Total fixed maturities, available for sale | 140.3 | 25.9 | (1.4) | (10.1) | 41.2 | (5.0) | 190.9 | (2.1) | (10.1) | ||||||||||||||||||||||||||||||||||||||||||||
| Equity securities - corporate securities | 11.5 | (2.9) | (.2) | — | — | — | 8.4 | (.2) | — | ||||||||||||||||||||||||||||||||||||||||||||
| Trading securities: | |||||||||||||||||||||||||||||||||||||||||||||||||||||
| Non-agency residential mortgage-backed securities | 3.5 | — | — | — | — | (3.5) | — | — | — | ||||||||||||||||||||||||||||||||||||||||||||
| Commercial mortgage-backed securities | 12.9 | — | (.4) | .2 | — | — | 12.7 | (.4) | — | ||||||||||||||||||||||||||||||||||||||||||||
| Total trading securities | 16.4 | — | (.4) | .2 | — | (3.5) | 12.7 | (.4) | — | ||||||||||||||||||||||||||||||||||||||||||||
| Investments held by variable interest entities - corporate securities | 2.2 | (2.1) | (.1) | — | — | — | — | — | — | ||||||||||||||||||||||||||||||||||||||||||||
63
| September 30, 2016 | |||||||||||||||||||||||||||||||
| Beginning balance as of June 30, 2016 | Purchases, sales, issuances and settlements, net (b) | Total realized and unrealized gains (losses) included in net income | Total realized and unrealized gains (losses) included in accumulated other comprehensive income (loss) | Transfers into Level 3 (a) | Transfers out of Level 3 (a) | Ending balance as of September 30, 2016 | Amount of total gains (losses) for the three months ended September 30, 2016 included in our net income relating to assets and liabilities still held as of the reporting date | ||||||||||||||||||||||||
| Assets: | |||||||||||||||||||||||||||||||
| Fixed maturities, available for sale: | |||||||||||||||||||||||||||||||
| Corporate securities | $ | 174.6 | $ | 118.8 | $ | — | $ | (4.9 | ) | $ | — | $ | — | $ | 288.5 | $ | — | ||||||||||||||
| Debt securities issued by foreign governments | 4.1 | — | — | — | — | — | 4.1 | — | |||||||||||||||||||||||
| Asset-backed securities | 39.1 | 5.7 | — | 2.1 | 24.6 | (15.0 | ) | 56.5 | — | ||||||||||||||||||||||
| Collateralized debt obligations | — | 2.5 | — | — | — | — | 2.5 | — | |||||||||||||||||||||||
| Commercial mortgage-backed securities | 1.1 | 17.0 | — | (.1 | ) | 14.4 | — | 32.4 | — | ||||||||||||||||||||||
| Collateralized mortgage obligations | — | 12.0 | — | — | — | — | 12.0 | — | |||||||||||||||||||||||
| Total fixed maturities, available for sale | 218.9 | 156.0 | — | (2.9 | ) | 39.0 | (15.0 | ) | 396.0 | — | |||||||||||||||||||||
| Equity securities - corporate securities | 21.4 | 3.3 | — | (.8 | ) | — | — | 23.9 | — | ||||||||||||||||||||||
| Trading securities - commercial mortgage-backed securities | — | — | — | (1.7 | ) | 10.0 | — | 8.3 | (1.7 | ) | |||||||||||||||||||||
| Liabilities: | |||||||||||||||||||||||||||||||
| Future policy benefits - embedded derivatives associated with fixed index annuity products | (1,127.0 | ) | (37.0 | ) | 18.3 | — | — | — | (1,145.7 | ) | 18.3 | ||||||||||||||||||||
CNO FINANCIAL GROUP, INC. AND SUBSIDIARIES
Notes to Consolidated Financial Statements
(unaudited)
___________________
____________
(a)Transfers into Level 3 are the result of unobservable inputs utilized within valuation methodologies for assets that were previously valued using observable inputs. Transfers out of Level 3 are due to the use of observable inputs in valuation methodologies as well as the utilization of pricing service information for certain assets that the Company is able to validate. (b)Purchases, sales, issuances and settlements, net, represent the activity that occurred during the period that results in a change of the asset |
| Purchases | Received in reinsurance recapture | Sales | Issuances | Settlements | Purchases, sales, issuances and settlements, net | ||||||||||||||||||
| Assets: | |||||||||||||||||||||||
| Fixed maturities, available for sale: | |||||||||||||||||||||||
| Corporate securities | $ | 1.1 | $ | 118.6 | $ | (.9 | ) | $ | — | $ | — | $ | 118.8 | ||||||||||
| Asset-backed securities | 7.0 | — | (1.3 | ) | — | — | 5.7 | ||||||||||||||||
| Collateralized debt obligations | 2.5 | — | — | — | — | 2.5 | |||||||||||||||||
| Commercial mortgage-backed securities | 17.0 | — | — | — | — | 17.0 | |||||||||||||||||
| Collateralized mortgage obligations | — | 12.0 | — | — | — | 12.0 | |||||||||||||||||
| Total fixed maturities, available for sale | 27.6 | 130.6 | (2.2 | ) | — | — | 156.0 | ||||||||||||||||
| Equity securities - corporate securities | 1.1 | 2.2 | — | — | — | 3.3 | |||||||||||||||||
| Liabilities: | |||||||||||||||||||||||
| Future policy benefits - embedded derivatives associated with fixed index annuity products | (38.5 | ) | — | 3.1 | (14.6 | ) | 13.0 | (37.0 | ) | ||||||||||||||
| Purchases | Sales | Issuances | Settlements | Purchases, sales, issuances and settlements, net | |||||||||||||||||||||||||
| Assets: | |||||||||||||||||||||||||||||
| Fixed maturities, available for sale: | |||||||||||||||||||||||||||||
| Corporate securities | $ | 9.4 | $ | (9.4) | $ | — | $ | — | $ | — | |||||||||||||||||||
| Asset-backed securities | 16.0 | (.1) | — | — | 15.9 | ||||||||||||||||||||||||
| Collateralized loan obligations | 10.0 | — | — | — | 10.0 | ||||||||||||||||||||||||
| Total fixed maturities, available for sale | 35.4 | (9.5) | — | — | 25.9 | ||||||||||||||||||||||||
| Equity securities - corporate securities | .3 | (3.2) | — | — | (2.9) | ||||||||||||||||||||||||
| Investments held by variable interest entities - corporate securities | — | (2.1) | — | — | (2.1) | ||||||||||||||||||||||||
| September 30, 2016 | |||||||||||||||||||||||||||||||
| Beginning balance as of December 31, 2015 | Purchases, sales, issuances and settlements, net (b) | Total realized and unrealized gains (losses) included in net income | Total realized and unrealized gains (losses) included in accumulated other comprehensive income (loss) | Transfers into Level 3 (a) | Transfers out of Level 3 (a) | Ending balance as of September 30, 2016 | Amount of total gains (losses) for the nine months ended September 30, 2016 included in our net income relating to assets and liabilities still held as of the reporting date | ||||||||||||||||||||||||
| Assets: | |||||||||||||||||||||||||||||||
| Fixed maturities, available for sale: | |||||||||||||||||||||||||||||||
| Corporate securities | $ | 170.4 | $ | 104.4 | $ | (7.0 | ) | $ | 7.4 | $ | 20.3 | $ | (7.0 | ) | $ | 288.5 | $ | (5.6 | ) | ||||||||||||
| Debt securities issued by foreign governments | — | 4.0 | — | .1 | — | — | 4.1 | — | |||||||||||||||||||||||
| Asset-backed securities | 35.9 | 1.7 | — | 4.0 | 28.6 | (13.7 | ) | 56.5 | — | ||||||||||||||||||||||
| Collateralized debt obligations | — | 2.5 | — | — | — | — | 2.5 | — | |||||||||||||||||||||||
| Commercial mortgage-backed securities | 1.1 | 17.0 | — | .4 | 13.9 | — | 32.4 | — | |||||||||||||||||||||||
| Mortgage pass-through securities | .1 | (.1 | ) | — | — | — | — | — | — | ||||||||||||||||||||||
| Collateralized mortgage obligations | — | 12.0 | — | — | — | — | 12.0 | — | |||||||||||||||||||||||
| Total fixed maturities, available for sale | 207.5 | 141.5 | (7.0 | ) | 11.9 | 62.8 | (20.7 | ) | 396.0 | (5.6 | ) | ||||||||||||||||||||
| Equity securities - corporate securities | 32.0 | 5.5 | (12.8 | ) | (.8 | ) | — | — | 23.9 | (12.8 | ) | ||||||||||||||||||||
| Trading securities - commercial mortgage-backed securities | 39.9 | — | — | (1.4 | ) | — | (30.2 | ) | 8.3 | (1.4 | ) | ||||||||||||||||||||
| Liabilities: | |||||||||||||||||||||||||||||||
| Future policy benefits - embedded derivatives associated with fixed index annuity products | (1,057.1 | ) | (55.3 | ) | (33.3 | ) | — | — | — | (1,145.7 | ) | (33.3 | ) | ||||||||||||||||||
| Purchases | Received in reinsurance recapture | Sales | Issuances | Settlements | Purchases, sales, issuances and settlements, net | ||||||||||||||||||
| Assets: | |||||||||||||||||||||||
| Fixed maturities, available for sale: | |||||||||||||||||||||||
| Corporate securities | $ | 1.1 | $ | 118.6 | $ | (15.3 | ) | $ | — | $ | — | $ | 104.4 | ||||||||||
| Debt securities issued by foreign governments | 4.0 | — | — | — | — | 4.0 | |||||||||||||||||
| Asset-backed securities | 7.0 | — | (5.3 | ) | — | — | 1.7 | ||||||||||||||||
| Collateralized debt obligations | 2.5 | — | — | — | — | 2.5 | |||||||||||||||||
| Commercial mortgage-backed securities | 17.0 | — | — | — | — | 17.0 | |||||||||||||||||
| Mortgage pass-through securities | — | — | (.1 | ) | — | — | (.1 | ) | |||||||||||||||
| Collateralized mortgage obligations | — | 12.0 | — | — | — | 12.0 | |||||||||||||||||
| Total fixed maturities, available for sale | 31.6 | 130.6 | (20.7 | ) | — | — | 141.5 | ||||||||||||||||
| Equity securities - corporate securities | 3.3 | 2.2 | — | — | — | 5.5 | |||||||||||||||||
| Liabilities: | |||||||||||||||||||||||
| Future policy benefits - embedded derivatives associated with fixed index annuity products | (101.9 | ) | — | 19.2 | (17.5 | ) | 44.9 | (55.3 | ) | ||||||||||||||
Realized and unrealized investment gains and losses presented in the preceding tables represent gains and losses during the time the applicable financial instruments were classified as Level 3.
Realized and unrealized gains (losses) on Level 3 assets are primarily reported in either net investment income for policyholder and other special-purpose portfolios net realizedor investment gains (losses) or insurance policy benefits within the consolidated statement of operationsoperations; or accumulated other comprehensive income (loss) within shareholders' equity based on the appropriate accounting treatment for the instrument. The amount presented for gains (losses) included in our net income for assets still held as of the reporting date primarily represents: (i) the change in allowance for credit losses for fixed maturities, available for sale; and (ii) changes in fair value of equity securities and trading securities that are held as of the reporting date. The amount presented for gains (losses) included in accumulated other comprehensive income (loss) for assets still held as of the reporting date primarily represents changes in the fair value of fixed maturities, available for sale, that are held as of the reporting date.
At March 31, 2023, 87 percent of our Level 3 fixed maturities, available for sale, were investment grade and 59 percent of our Level 3 fixed maturities, available for sale, consisted of corporate securities.
64
CNO FINANCIAL GROUP, INC. AND SUBSIDIARIES
Notes to Consolidated Financial Statements
(unaudited)
___________________
The amount presentedfollowing table summarizes changes in the value of our embedded derivatives associated with fixed indexed annuity products (classified as policyholder account liabilities) which are measured at fair value on a recurring basis and for gains (losses) includedwhich we have utilized significant unobservable (Level 3) inputs to determine fair value (dollars in our net loss for assets and liabilities still held as of the reporting date primarily represents impairments for fixed maturities, available for sale, changesmillions):
| Three months ended | |||||||||||||||||||||||
| March 31, | |||||||||||||||||||||||
| 2023 | 2022 | ||||||||||||||||||||||
| Balance at beginning of the period | $ | 1,297.0 | $ | 1,724.1 | |||||||||||||||||||
| Premiums less benefits | (14.0) | 21.1 | |||||||||||||||||||||
| Change in fair value, net | 64.9 | (201.7) | |||||||||||||||||||||
| Balance at end of the period | $ | 1,347.9 | $ | 1,543.5 | |||||||||||||||||||
The change in fair value, of trading securities and certainnet for each period in our embedded derivatives and changes in fair value of embedded derivative instrumentsis included in liabilities for insurance products that exist asthe consolidated statement of the reporting date.operations.
65
CNO FINANCIAL GROUP, INC. AND SUBSIDIARIES
Notes to Consolidated Financial Statements
(unaudited)
___________________
The following table provides additional information about the significant unobservable (Level 3) inputs developed internally by the Company to determine fair value for certain assets and liabilities carried at fair value at September 30, 2017March 31, 2023 (dollars in millions):
| Fair value at March 31, 2023 | Valuation techniques | Unobservable inputs | Range (weighted average) (a) | ||||||||||||||||||||
| Assets: | |||||||||||||||||||||||
| Corporate securities (b) | $ | 2.9 | Discounted cash flow analysis | Discount margins | 2.41% | ||||||||||||||||||
| Corporate securities (c) | 3.5 | Recovery method | Percent of recovery expected | 0.00% - 35.00% (35.00%) | |||||||||||||||||||
| Corporate securities (d) | .5 | Unadjusted purchase price | Not applicable | Not applicable | |||||||||||||||||||
| Asset-backed securities (e) | 23.1 | Discounted cash flow analysis | Discount margins | 1.99% - 4.02% (3.20%) | |||||||||||||||||||
| Equity securities (f) | 63.6 | Market comparables | EBITDA multiples | 8.8X | |||||||||||||||||||
| Equity securities (g) | .1 | Recovery method | Percent of recovery expected | 0.00% - 100.00% (100.00%) | |||||||||||||||||||
| Equity securities (h) | 11.4 | Unadjusted purchase price | Not applicable | Not applicable | |||||||||||||||||||
| Other assets categorized as Level 3 (i) | 206.1 | Unadjusted third-party price source | Not applicable | Not applicable | |||||||||||||||||||
| Market risk benefit asset (k) | 57.8 | Discounted cash flow analysis | Surrender rates | 1.28% - 11.05% (3.45%) | |||||||||||||||||||
| Utilization rates | 5.92% - 47.62% (22.54%) | ||||||||||||||||||||||
| Total | 369.0 | ||||||||||||||||||||||
| Liabilities: | |||||||||||||||||||||||
| Market risk benefit liability (k) | 17.6 | Discounted cash flow analysis | Surrender rates | 1.28% - 11.05% (3.45%) | |||||||||||||||||||
| Utilization rates | 5.92% - 47.62% (22.54%) | ||||||||||||||||||||||
| Embedded derivatives related to fixed indexed annuity products (classified as policyholder account liabilities) (j) | 1,347.9 | Discounted projected embedded derivatives | Projected portfolio yields | 4.30% - 4.63% (4.31%) | |||||||||||||||||||
| Discount rates | 3.47% - 5.33% (4.13%) | ||||||||||||||||||||||
| Surrender rates | 1.90% - 27.70% (9.20%) | ||||||||||||||||||||||
(a) The weighted average is based on the relative fair value of the related assets or liabilities.
(b) Corporate securities - The significant unobservable input used in the fair value measurement of our corporate securities is discount margin added to a riskless market yield. Significant increases (decreases) in discount margin in isolation would have resulted in a significantly lower (higher) fair value measurement.
(c) Corporate securities - The significant unobservable input used in the fair value measurement of these corporate securities is percentage of recovery expected. Significant increases (decreases) in percentage of recovery expected in isolation would have resulted in a significantly higher (lower) fair value measurement.
(d) Corporate securities - For these assets, there were no adjustments to the purchase price.
(e) Asset-backed securities - The significant unobservable input used in the fair value measurement of these asset-backed securities is discount margin added to a riskless market yield. Significant increases (decreases) in discount margin in isolation would have resulted in a significantly lower (higher) fair value measurement.
(f) Equity securities - The significant unobservable input used in the fair value measurement of these equity securities is multiples of earnings before interest, taxes, depreciation and amortization ("EBITDA"). Generally, increases (decreases) in the EBITDA multiples would result in higher (lower) fair value measurements.
(g) Equity securities - The significant unobservable input used in the fair value measurement of these equity securities is percentage of recovery expected. Significant increases (decreases) in percentage of recovery expected in isolation would have resulted in a significantly higher (lower) fair value measurement.
66
| Fair value at September 30, 2017 | Valuation techniques | Unobservable inputs | Range (weighted average) | ||||||
| Assets: | |||||||||
| Corporate securities (a) | $ | 138.4 | Discounted cash flow analysis | Discount margins | 1.50% - 61.70% (9.10%) | ||||
| Corporate securities (b) | 3.1 | Recovery method | Percent of recovery expected | 5% - 38% (17.76%) | |||||
| Asset-backed securities (c) | 24.9 | Discounted cash flow analysis | Discount margins | 1.77% - 3.36% (2.54%) | |||||
| Equity securities (d) | 21.6 | Market comparables | EBITDA multiples | 0.5X - 6.2X (5.9X) | |||||
| Other assets categorized as Level 3 (e) | 158.2 | Unadjusted third-party price source | Not applicable | Not applicable | |||||
| Total | 346.2 | ||||||||
| Liabilities: | |||||||||
| Future policy benefits (f) | 1,249.3 | Discounted projected embedded derivatives | Projected portfolio yields | 5.15% - 5.61% (5.59%) | |||||
| Discount rates | 0.44% - 2.80% (1.94%) | ||||||||
| Surrender rates | 0.94% - 46.48% (13.52%) | ||||||||
CNO FINANCIAL GROUP, INC. AND SUBSIDIARIES
Notes to Consolidated Financial Statements
(unaudited)
___________________
(h) Equity securities - For these assets, there were no adjustments to the purchase price.
(i) Other assets categorized as Level 3 - For these assets, there were no adjustments to non-binding quoted market prices obtained from third-party pricing sources.
(j) Embedded derivatives related to fixed indexed annuity products (classified as policyholder account liabilities) - The significant unobservable inputs used in the fair value measurement of our embedded derivatives associated with fixed indexed annuity products are projected portfolio yields, discount rates and surrender rates. Increases (decreases) in projected portfolio yields in isolation would have resulted in a higher (lower) fair value measurement. The discount rate is based on risk free rates (U.S. Treasury rates for similar durations) adjusted for our non-performance risk and risk margins for non-capital market inputs. Increases (decreases) in the discount rates would have resulted in a lower (higher) fair value measurement. Assumed surrender rates are used to project how long the contracts remain in force. Generally, the longer the contracts are assumed to be in force the higher the fair value of the embedded derivative.
(k) Market risk benefits – Many of our fixed indexed annuity products include a GLWB that is considered a MRB. The calculation of the value of MRBs are based on significant unobservable inputs including assumptions related to surrenders and utilization of policy benefits. These assumptions are based on actuarial estimates and past experience. Increases in assumed surrender rates would generally increase the value of a MRB asset or decrease the value of a MRB liability (with decreases in assumed surrender rates having the opposite impacts). Increases in utilization rates would generally decrease the value of a MRB asset or increase the value of a MRB liability (with decreases in utilization rates having the opposite impacts).
67
CNO FINANCIAL GROUP, INC. AND SUBSIDIARIES
Notes to Consolidated Financial Statements
(unaudited)
___________________
The following table provides additional information about the significant unobservable (Level 3) inputs developed internally by the Company to determine fair value for certain assets and liabilities carried at fair value at December 31, 20162022 (dollars in millions):
| Fair value at December 31, 2016 | Valuation techniques | Unobservable inputs | Range (weighted average) | ||||||
| Assets: | |||||||||
| Corporate securities (a) | $ | 148.5 | Discounted cash flow analysis | Discount margins | 1.35% - 27.71% (13.52%) | ||||
| Corporate securities (b) | 14.8 | Recovery method | Percent of recovery expected | 5% - 69% (55%) | |||||
| Asset-backed securities (c) | 24.0 | Discounted cash flow analysis | Discount margins | 2.06% - 3.64% (2.76%) | |||||
| Equity securities (d) | 25.2 | Market comparables | EBITDA multiples | 0.4X - 6.2X (5.9X) | |||||
| Other assets categorized as Level 3 (e) | 172.9 | Unadjusted third-party price source | Not applicable | Not applicable | |||||
| Total | 385.4 | ||||||||
| Liabilities: | |||||||||
| Future policy benefits (f) | 1,092.3 | Discounted projected embedded derivatives | Projected portfolio yields | 5.15% - 5.61% (5.59%) | |||||
| Discount rates | 0.18% - 3.06% (2.07%) | ||||||||
| Surrender rates | 0.94% - 46.48% (13.52%) | ||||||||
| Valuation techniques | Unobservable inputs | Range (weighted average) (a) | |||||||||||||||||||||
| Assets: | ||||||||||||||||||||||||
| Corporate securities (b) | $ | 2.9 | Discounted cash flow analysis | Discount margins | 2.23% - | |||||||||||||||||||
| Corporate securities | 3.5 | Recovery method | Percent of recovery expected | 0.00% - 35.00% (35.00%) | ||||||||||||||||||||
| Corporate securities (d) | .5 | Unadjusted purchase price | Not applicable | Not applicable | |||||||||||||||||||
| Asset-backed securities (e) | 21.8 | Discounted cash flow analysis | Discount margins | 2.50% - 3.86% (3.30%) | |||||||||||||||||||
| Equity securities (f) | 63.9 | Market comparables | EBITDA multiples | 8.5X | |||||||||||||||||||
| Equity securities (g) | .1 | Recovery method | Percent of recovery expected | 0.00% - 100.00% (100.00%) | |||||||||||||||||||
| Equity securities (h) | 11.7 | Unadjusted purchase price | Not applicable | Not applicable | |||||||||||||||||||
| Other assets categorized as Level 3 (i) | 249.0 | Unadjusted third-party price source | Not applicable | Not applicable | |||||||||||||||||||
| Market risk benefit asset (k) | 65.3 | Discounted cash flow analysis | Surrender rates | 1.28% - | |||||||||||||||||||
| Utilization rates | 6.78% - 63.16% (20.09%) | ||||||||||||||||||||||
| Total | 418.7 | ||||||||||||||||||||||
| Market risk benefit liability (k) | 11.3 | Discounted cash flow analysis | Surrender rates | 1.28% - | |||||||||||||||||||
| Utilization rates | 6.78% - 63.16% (20.09%) | ||||||||||||||||||||||
| Embedded derivatives related to fixed indexed annuity products (classified as policyholder account liabilities) (j) | 1,297.0 | Discounted projected embedded derivatives | Projected portfolio yields | 4.30% - 4.63% (4.31%) | |||||||||||||||||||
| Discount rates | 3.77% - 5.48% (4.47%) | ||||||||||||||||||||||
| Surrender rates | 1.90% - 27.70% (9.20%) | ||||||||||||||||||||||
(a) The weighted average is based on the relative fair value of the related assets or liabilities.
(b) Corporate securities - The significant unobservable input used in the fair value measurement of our corporate securities is discount margin added to a riskless market yield. Significant increases (decreases) in discount margin in isolation would have resulted in a significantly lower (higher) fair value measurement.
(c) Corporate securities - The significant unobservable input used in the fair value measurement of these corporate securities is percentage of recovery expected. Significant increases (decreases) in percentage of recovery expected in isolation would have resulted in a significantly higher (lower) fair value measurement.
(d) Corporate securities - For these assets, there were no adjustments to the purchase price.
(e) Asset-backed securities - The significant unobservable input used in the fair value measurement of these asset-backed securities is discount margin added to a riskless market yield. Significant increases (decreases) in discount margin in isolation would have resulted in a significantly lower (higher) fair value measurement.
(f) Equity securities - The significant unobservable input used in the fair value measurement of these equity securities is multiples of earnings before EBITDA. Generally, increases (decreases) in the EBITDA multiples would result in higher (lower) fair value measurements.
68
CNO FINANCIAL GROUP, INC. AND SUBSIDIARIES
Notes to Consolidated Financial Statements
(unaudited)
___________________
(g) Equity securities - The significant unobservable input used in the fair value measurement of these equity securities is percentage of recovery expected. Significant increases (decreases) in percentage of recovery expected in isolation would have resulted in a significantly higher (lower) fair value measurement.
(i) Other assets categorized as Level 3 - For these assets, there were no adjustments to non-binding quoted market prices obtained from third-party pricing sources.
(k) Market risk benefits – Many of October 13, 2022 and the dateour fixed indexed annuity products include a GLWB that is six months prior to the maturity dateconsidered a MRB. The calculation of the Company’s 4.50% senior notes due 2020, which is November 30, 2019. The amount drawn under the Amended Credit Agreement continues to be $100.0 million.
value of a MRB liability (with decreases in utilization rates having the opposite impacts).
69
CNO FINANCIAL GROUP, INC. AND SUBSIDIARIES
___________________
ITEM 2.MANAGEMENT'S DISCUSSION AND ANALYSIS OF CONSOLIDATED FINANCIAL CONDITION AND RESULTS OF OPERATIONS.
In this section, we review the consolidated financial condition of CNO at September 30, 2017,March 31, 2023, and its consolidated results of operations for the ninethree months ended September 30, 2017March 31, 2023 and 2016,2022, and, where appropriate, factors that may affect future financial performance. Please read this discussion in conjunction with the accompanying consolidated financial statements and notes. Results for interim periods are not necessarily indicative of the results that may be expected for a full year.
CAUTIONARY STATEMENT REGARDING FORWARD-LOOKING STATEMENTS
Our statements, trend analyses and other information contained in this report and elsewhere (such as in filings by CNO with the SEC, press releases, presentations by CNO or its management or oral statements) relative to markets for CNO's products and trends in CNO's operations or financial results, as well as other statements, contain forward-looking statements within the meaning of the federal securities laws and the Private Securities Litigation Reform Act of 1995. Forward-looking statements typically are identified by the use of terms such as "anticipate," "believe," "plan," "estimate," "expect," "project," "intend," "may," "will," "would," "contemplate," "possible," "attempt," "seek," "should," "could," "goal," "target," "on track," "comfortable with," "optimistic," "guidance," "outlook" and similar words, although some forward-looking statements are expressed differently. You should consider statements that contain these words carefully because they describe our expectations, plans, strategies and goals and our beliefs concerning future business conditions, our results of operations, financial position, and our business outlook or they state other "forward-looking" information based on currently available information. The "Risk Factors" section of our 20162022 Annual Report on Form 10-K and the changes set forth in the Risk Factors section of this Form 10-Q provideprovides examples of risks, uncertainties and events that could cause our actual results to differ materially from the expectations expressed in our forward-looking statements. Assumptions and other important factors that could cause our actual results to differ materially from those anticipated in our forward-looking statements include, among other things:
•general economic, market and political conditions and uncertainties, including the performance and fluctuations of the financial markets which may affect the value of our investments as well as our ability to raise capital or refinance existing indebtedness and the cost of doing so;
•the impact of pandemics and major public health issues, including the novel coronavirus ("COVID-19") pandemic and the resulting financial market, economic and other impacts;
•exposure to interest rate risk, including interest rate volatility, may negatively impact our results of operations, financial position or cash flow;
•future investment results, including the impact of realized losses (including other-than-temporary impairment charges) may diminish the value of our invested assets and negatively impact our profitability, our financial condition and our liquidity;
•the ultimate outcome of lawsuits filed against us and other legal and regulatory proceedings to which we are subject;
•our ability to make anticipated changes to certain non-guaranteed elements of our life insurance products;
•our ability to obtain adequate and timely rate increases on our health products, including our long-term care business;
•the receipt of any required regulatory approvals for dividend and surplus debenture interest payments from our insurance subsidiaries;
•mortality, morbidity, the increased cost and usage of health care services, persistency, the adequacy of our previous reserve estimates, changes in the health care market and other factors which may affect the profitability of our insurance products;
•changes in our assumptions related to deferred acquisition costs or the present value of future profits;
70
CNO FINANCIAL GROUP, INC. AND SUBSIDIARIES
___________________
•the recoverability of our deferred tax assets and the effect of potential ownership changes and tax rate changes on their value;
•our assumption that the positions we take on our tax return filings will not be successfully challenged by the IRS;Internal Revenue Service;
•changes in accounting principles and the interpretation thereof;
•our ability to continue to satisfy the financial ratio and balance requirements and other covenants of our debt agreements;
•performance and valuation of our investments, including the impact of realized losses (including other-than-temporary impairment charges);investments;
•our ability to identify products and markets in which we can compete effectively against competitors with greater market share, higher ratings, greater financial resources and stronger brand recognition;
•our ability to generate sufficient liquidity to meet our debt service obligations and other cash needs;
•changes in capital deployment opportunities;
•our ability to maintain effective controls over financial reporting;reporting and modeling;
•our ability to continue to recruit and retain productive agents and distribution partners;
•customer response to new products, distribution channels and marketing initiatives;
•inflation or other unfavorable economic or business conditions may impact the sales and persistency of insurance products, a portion of our insurance policy benefits affected by increased medical coverage costs and various selling, general and administrative expenses;
•our ability to achieve additional upgrades ofmaintain the financial strength ratings of CNO and our insurance company subsidiaries as well as the impact of our ratings on our business, our ability to access capital, and the cost of capital;
•regulatory changes or actions, including: those relating to regulation of the financial affairs of our insurance companies, such as the calculation of risk-based capital and minimum capital requirements, and payment of dividends and surplus debenture interest to us; regulation of the sale, underwriting and pricing of products; and health care regulation affecting health insurance products; and privacy laws and regulations;
•changes in the Federal income tax laws and regulations which may affect or eliminate the relative tax advantages of some of our products or affect the value of our deferred tax assets;
•availability and effectiveness of reinsurance arrangements, as well as the impact of any defaults or failure of reinsurers to perform;
•the performance of third party service providers (both domestic and international) and potential difficulties arising from outsourcing arrangements;
•expectations for the growth rate of sales, collected premiums, annuity deposits and assets;
•interruption in telecommunication, information technology or other operational systems or failure to maintain the security, confidentiality or privacy of sensitive data on such systems;
•events of terrorism, cyber attacks,cyber-attacks, natural disasters or other catastrophic events, including lossespotential adverse impacts from a disease pandemic;climate change which may increase the frequency or severity of weather-related disasters;
71
CNO FINANCIAL GROUP, INC. AND SUBSIDIARIES
___________________
•ineffectiveness of risk management policies and procedures in identifying, monitoring and managing risks; and
•the risk factors or uncertainties listed from time to time in our filings with the SEC.
Other factors and assumptions not identified above are also relevant to the forward-looking statements, and if they prove incorrect, could also cause actual results to differ materially from those projected.
All written or oral forward-looking statements attributable to us are expressly qualified in their entirety by the foregoing cautionary statement. Our forward-looking statements speak only as of the date made. We assume no obligation to update or to publicly announce the results of any revisions to any of the forward-looking statements to reflect actual results, future events or developments, changes in assumptions or changes in other factors affecting the forward-looking statements.
The reporting of risk-based capital ("RBC") measures is not intended for the purpose of ranking any insurance company or for use in connection with any marketing, advertising or promotional activities.
OVERVIEW
We are a holding company for a group of insurance companies operating throughout the United States that develop, market and administer health insurance, annuity, individual life insurance and other insurance and financial services products. We focus on serving the seniormiddle-income pre-retiree and middle-income markets,retired Americans, which we believe are attractive, underserved, high growth markets. We sell our products through three distribution channels: careerexclusive agents, independent producers (some of whom sell one or more of our product lines exclusively) and direct marketing. In
We view our operations as three insurance product lines (annuity, health and life) and the fourth quarterinvestment and fee income segments. Our segments are aligned based on their common characteristics, comparability of 2016,profit margins and the way management makes operating decisions and assesses the performance of the business.
Our insurance product line segments (annuity, health and life) include marketing, underwriting and administration of the policies our insurance subsidiaries sell. The business written in each of the three product categories through all of our insurance subsidiaries is aggregated allowing management and investors to assess the performance of each product category. When analyzing profitability of these segments, we began reportinguse insurance product margin as the long-term caremeasure of profitability, which is: (i) insurance policy income; and (ii) net investment income allocated to the insurance product lines; less (i) insurance policy benefits and interest credited to policyholders; and (ii) amortization, non-deferred commissions and advertising expense. Net investment income is allocated to the product lines using the book yield of investments backing the block recapturedof business, which is applied to the average insurance liabilities, net of insurance intangibles, for the block in each period.
Income from BRe as an additionalinsurance products is the sum of the insurance product margins of the annuity, health and life product lines, less expenses allocated to the insurance lines. It excludes the income from our fee income business, segment.investment income not allocated to product lines, net expenses not allocated to product lines (primarily holding company expenses) and income taxes. Management believes insurance product margin and income from insurance products help provide a better understanding of the business and a more meaningful analysis of the results of our insurance product lines.
We market our products through the Consumer and Worksite Divisions that reflect the customers served by the Company.
The Company’s insurance segments are described below:
The Worksite Division focuses on worksite and group sales for businesses, associations, and other membership groups, interacting with customers at their place of employment and virtually. With a separate Worksite Division, we are bringing a sharper focus to this high-growth business thatwhile further capitalizing on the strength of our wholly-owned subsidiary, Optavise, a national provider of year-round technology-driven employee benefits management services. The Worksite Division is increasing its recruiting efforts to rebuild its agent force which was recaptured due toadversely impacted by the termination of certain reinsurance agreements effective September 30, 2016. This business is not actively marketed and was issued or acquired by Washington National and BCLIC.
COVID-19 pandemic.
72
CNO FINANCIAL GROUP, INC. AND SUBSIDIARIES
___________________
The following summarizesConsumer and Worksite Divisions are primarily focused on marketing insurance products, several types of which are sold in both divisions and underwritten in the same manner. Sales of group underwritten policies are currently not significant, but are expected to increase within the Worksite Division.
The investment segment involves the management of our capital resources, including investments and the management of corporate debt and liquidity. Our measure of profitability of this segment is the total net investment income not allocated to the insurance products. Investment income not allocated to product lines represents net investment income less: (i) equity returns credited to policyholder account balances; (ii) the investment income allocated to our product lines; (iii) interest expense on notes payable and investment borrowings; (iv) expenses related to the FABN program; and (v) certain expenses related to benefit plans that are offset by special-purpose investment income; plus (vi) the impact of annual option forfeitures related to fixed indexed annuity surrenders. Investment income not allocated to product lines includes investment income on investments in excess of amounts allocated to product lines, investments held by our holding companies, the spread we earn from our FHLB investment borrowing and FABN programs and variable components of investment income (including call and prepayment income, adjustments to returns on structured securities due to cash flow changes, income (loss) from COLI and alternative investment income not allocated to product lines), net of interest expense on corporate debt. The spread earned from our FHLB investment borrowing and FABN programs includes the investment income on the matched assets less: (i) interest on investment borrowings related to the FHLB investment borrowing program; (ii) interest credited on funding agreements; and (iii) amortization of deferred acquisition costs related to the FABN program.
Our fee income segment includes the earnings forgenerated from sales of third-party insurance products, services provided by Optavise and the threeoperations of our broker/dealer and nine months ending September 30, 2017 and 2016 (dollars in millions, except per share data):registered investment advisor.
Expenses not allocated to product lines include the expenses of our corporate operations, excluding interest expense on debt.
73
| Three months ended | Nine months ended | ||||||||||||||
| September 30, | September 30, | ||||||||||||||
| 2017 | 2016 | 2017 | 2016 | ||||||||||||
| Adjusted EBIT (a non-GAAP measure) (a): | |||||||||||||||
| Bankers Life | $ | 106.9 | $ | 88.1 | $ | 309.2 | $ | 259.0 | |||||||
| Washington National | 27.5 | 25.2 | 74.6 | 73.0 | |||||||||||
| Colonial Penn | 9.0 | .9 | 16.7 | (2.9 | ) | ||||||||||
| Long-term care in run-off | (1.0 | ) | — | 1.1 | — | ||||||||||
| Adjusted EBIT from business segments | 142.4 | 114.2 | 401.6 | 329.1 | |||||||||||
| Corporate operations, excluding corporate interest expense | (14.9 | ) | (4.4 | ) | (37.0 | ) | (19.5 | ) | |||||||
| Adjusted EBIT | 127.5 | 109.8 | 364.6 | 309.6 | |||||||||||
| Corporate interest expense | (11.7 | ) | (11.5 | ) | (34.8 | ) | (34.3 | ) | |||||||
| Operating earnings before taxes | 115.8 | 98.3 | 329.8 | 275.3 | |||||||||||
| Tax expense on operating income | 39.1 | 34.0 | 114.7 | 97.7 | |||||||||||
| Net operating income (a) | 76.7 | 64.3 | 215.1 | 177.6 | |||||||||||
| Net realized investment gains (losses) (net of related amortization) | 28.5 | 11.4 | 51.3 | 22.4 | |||||||||||
| Fair value changes in embedded derivative liabilities (net of related amortization) | 2.3 | 9.4 | (8.0 | ) | (36.6 | ) | |||||||||
| Fair value changes and amendment related to agent deferred compensation plan | (13.4 | ) | 6.3 | (13.4 | ) | (12.0 | ) | ||||||||
| Loss on reinsurance transaction | — | (75.4 | ) | — | (75.4 | ) | |||||||||
| Other | (3.3 | ) | (.7 | ) | (4.6 | ) | (1.2 | ) | |||||||
| Non-operating income (loss) before taxes | 14.1 | (49.0 | ) | 25.3 | (102.8 | ) | |||||||||
| Income tax expense (benefit): | |||||||||||||||
| On non-operating income (loss) | 5.0 | (17.1 | ) | 8.9 | (36.0 | ) | |||||||||
| Valuation allowance for deferred tax assets and other tax items | (15.0 | ) | 13.8 | (15.0 | ) | (13.2 | ) | ||||||||
| Net non-operating income (loss) | 24.1 | (45.7 | ) | 31.4 | (53.6 | ) | |||||||||
| Net income | $ | 100.8 | $ | 18.6 | $ | 246.5 | $ | 124.0 | |||||||
| Per diluted share: | |||||||||||||||
| Net operating income | $ | .45 | $ | .37 | $ | 1.25 | $ | .99 | |||||||
| Net realized investment gains (losses) (net of related amortization and taxes) | .11 | .04 | .19 | .08 | |||||||||||
| Fair value changes in embedded derivative liabilities (net of related amortization and taxes) | .01 | .04 | (.03 | ) | (.13 | ) | |||||||||
| Fair value changes and amendment related to agent deferred compensation plan (net of taxes) | (.05 | ) | .02 | (.05 | ) | (.05 | ) | ||||||||
| Loss on reinsurance transaction (net of taxes) | — | (.28 | ) | — | (.27 | ) | |||||||||
| Valuation allowance for deferred tax assets and other tax items | .09 | (.08 | ) | .09 | .07 | ||||||||||
| Other | (.02 | ) | — | (.02 | ) | — | |||||||||
| Net income | $ | .59 | $ | .11 | $ | 1.43 | $ | .69 | |||||||
CNO FINANCIAL GROUP, INC. AND SUBSIDIARIES
___________________
The following summarizes our earnings for the three months ending March 31, 2023 and 2022 (dollars in millions, except per share data):
| Three months ended | |||||||||||||||||||||||
| March 31, | |||||||||||||||||||||||
| 2023 | 2022 | ||||||||||||||||||||||
| Insurance product margin | |||||||||||||||||||||||
| Annuity margin | $ | 57.3 | $ | 55.9 | |||||||||||||||||||
| Health margin | 116.5 | 115.3 | |||||||||||||||||||||
| Life margin | 47.4 | 36.0 | |||||||||||||||||||||
| Total insurance product margin | 221.2 | 207.2 | |||||||||||||||||||||
| Allocated expenses | (157.5) | (144.8) | |||||||||||||||||||||
| Income from insurance products | 63.7 | 62.4 | |||||||||||||||||||||
| Fee income | 15.5 | 9.9 | |||||||||||||||||||||
| Investment income not allocated to product lines | 15.5 | 27.0 | |||||||||||||||||||||
| Expenses not allocated to product lines | (18.3) | (14.8) | |||||||||||||||||||||
| Operating earnings before taxes | 76.4 | 84.5 | |||||||||||||||||||||
| Income tax expense on operating income | (17.8) | (20.0) | |||||||||||||||||||||
| Net operating income (a) | 58.6 | 64.5 | |||||||||||||||||||||
| Net realized investment losses from sales and change in allowance for credit losses | (12.7) | (7.2) | |||||||||||||||||||||
| Net change in market value of investments recognized in earnings | (1.9) | (25.5) | |||||||||||||||||||||
| Fair value changes related to agent deferred compensation plan | — | 22.7 | |||||||||||||||||||||
| Changes in fair value of embedded derivative liabilities and market risk benefits | (65.1) | 165.4 | |||||||||||||||||||||
| Other | 2.3 | .4 | |||||||||||||||||||||
| Net non-operating income (loss) before taxes | (77.4) | 155.8 | |||||||||||||||||||||
| Income tax (expense) benefit on non-operating income (loss) | 18.0 | (36.9) | |||||||||||||||||||||
| Net non-operating income (loss) | (59.4) | 118.9 | |||||||||||||||||||||
| Net income (loss) | $ | (.8) | $ | 183.4 | |||||||||||||||||||
| Per diluted share | |||||||||||||||||||||||
| Net operating income | $ | .51 | $ | .54 | |||||||||||||||||||
| Net non-operating income (loss) | (.52) | .98 | |||||||||||||||||||||
| Net income (loss) | $ | (.01) | $ | 1.52 | |||||||||||||||||||
74
CNO FINANCIAL GROUP, INC. AND SUBSIDIARIES
___________________
____________
| Three months ended | Nine months ended | ||||||||||||||
| September 30, | September 30, | ||||||||||||||
| 2017 | 2016 | 2017 | 2016 | ||||||||||||
| Pre-tax operating earnings (a non-GAAP measure) (a): | |||||||||||||||
| Bankers Life | $ | 106.9 | $ | 88.1 | $ | 309.2 | $ | 259.0 | |||||||
| Washington National | 27.5 | 25.2 | 74.6 | 73.0 | |||||||||||
| Colonial Penn | 9.0 | .9 | 16.7 | (2.9 | ) | ||||||||||
| Long-term care in run-off | (1.0 | ) | — | 1.1 | — | ||||||||||
| Corporate operations | (26.6 | ) | (15.9 | ) | (71.8 | ) | (53.8 | ) | |||||||
| 115.8 | 98.3 | 329.8 | 275.3 | ||||||||||||
| Net realized investment gains (losses), net of related amortization: | |||||||||||||||
| Bankers Life | 14.9 | .7 | 30.1 | (1.3 | ) | ||||||||||
| Washington National | 6.5 | .1 | 12.6 | 26.9 | |||||||||||
| Colonial Penn | 1.0 | .3 | .8 | (.2 | ) | ||||||||||
| Long-term care in run-off | 6.7 | — | 7.8 | — | |||||||||||
| Corporate operations | (.6 | ) | 10.3 | — | (3.0 | ) | |||||||||
| 28.5 | 11.4 | 51.3 | 22.4 | ||||||||||||
| Fair value changes in embedded derivative liabilities, net of related amortization: | |||||||||||||||
| Bankers Life | 2.3 | 9.3 | (8.0 | ) | (36.2 | ) | |||||||||
| Washington National | — | .1 | — | (.4 | ) | ||||||||||
| 2.3 | 9.4 | (8.0 | ) | (36.6 | ) | ||||||||||
| Earnings attributable to VIEs: | |||||||||||||||
| Corporate operations | (3.3 | ) | (.7 | ) | (4.6 | ) | (1.2 | ) | |||||||
| Fair value changes and amendment related to agent deferred compensation plan: | |||||||||||||||
| Corporate operations | (13.4 | ) | 6.3 | (13.4 | ) | (12.0 | ) | ||||||||
| Loss on reinsurance transaction: | |||||||||||||||
| Corporate operations | — | (75.4 | ) | — | (75.4 | ) | |||||||||
| Income (loss) before income taxes: | |||||||||||||||
| Bankers Life | 124.1 | 98.1 | 331.3 | 221.5 | |||||||||||
| Washington National | 34.0 | 25.4 | 87.2 | 99.5 | |||||||||||
| Colonial Penn | 10.0 | 1.2 | 17.5 | (3.1 | ) | ||||||||||
| Long-term care in run-off | 5.7 | — | 8.9 | — | |||||||||||
| Corporate operations | (43.9 | ) | (75.4 | ) | (89.8 | ) | (145.4 | ) | |||||||
| Income before income taxes | $ | 129.9 | $ | 49.3 | $ | 355.1 | $ | 172.5 | |||||||
CRITICAL ACCOUNTING ESTIMATES
The preparation of financial statements in accordance with GAAP measure.requires management to make estimates and assumptions that affect the reported amounts of various assets and liabilities and disclosure of contingent assets and liabilities at the date of the financial statements and revenues and expenses during the reporting period. Management has made estimates in the past that we believed to be appropriate but were subsequently revised to reflect actual experience. If our future experience differs materially from these estimates and assumptions, our results of operations and financial condition could be materially affected.
The critical accounting estimates that were not impacted as a result of the adoption of ASU 2018-12 are described in "Critical Accounting Estimates" in our 2022 Annual Report on Form 10-K. Below is a discussion of our updated critical accounting estimates.
Present Value of Future Profits and Deferred Acquisition Costs
Amortization of the present value of future profits and deferred acquisition costs is calculated using the same contract groupings (or cohorts), mortality and lapse assumptions that are used in calculating the liability for future policy benefits, and these assumptions are reviewed and updated at least annually.
75
CNO FINANCIAL GROUP, INC. AND SUBSIDIARIES
___________________
As a result of the adoption of ASU 2018-12, the amortization methodology related to these account balances is no longer subject to the same degree of variability and does not require a high degree of judgment. However, these accounts remain sensitive to unexpected lapses, due to higher mortality and lapse experience than expected. Such changes are recognized in the current period as a reduction of the capitalized balances. The effect of changes in assumptions related to future mortality and lapses are recognized prospectively over the remaining contract term. The carrying value of deferred acquisition costs is not subject to recovery testing upon the adoption of ASU 2018-12.
Liabilities for Insurance Products
The adoption of ASU 2018-12 significantly changes how we account for the liabilities for insurance products for long-duration contracts and amends existing recognition, measurement, presentation and disclosure requirements. As part of this adoption, we measure all payments under an insurance contract including future expected claims and unpaid policy claims (with the exception of life insurance policy and contract claims, which are classified in the "liability for life insurance policy claims") and related expenses as an integrated reserve. This resulted in unpaid claims on long-duration health insurance contracts that were previously in the "liability for policy and contract claims" pre-adoption to be now presented as part of the liability for future policy benefits.
Our liabilities for future policy benefits are measured using the net premium ratio approach as described in the note to the consolidated financial statements entitled "Summary of Significant Accounting Policies".
The liability for future policy benefits is determined based on numerous assumptions. The most significant assumptions for our life and annuity business are mortality and lapse/withdrawal rates which are based on our experience and, in cases of limited experience, industry experience. Mortality and lapse/withdrawal rates also take into consideration future expectations in policyholder behavior that may vary from past experience. For our health business, mortality rates, lapse rates, morbidity assumptions and future rate increases are based on our experience and, in cases of limited experience, industry experience. Such assumptions also consider future expectations in policyholder behavior that may vary from past experience. In addition, the liability for future policy benefits is measured using estimated discount rates. The assumptions and estimates that we use often depend on judgment regarding the likelihood of future events and are inherently uncertain.
Cash flow assumptions related to our insurance contracts are established when a policy is issued and are evaluated each quarter to determine if assumption updates are required. A more detailed review of assumptions is performed annually during the fourth quarter. Changes to our assumptions for future benefits are recognized in the liability for future policy benefits remeasurement (gain) loss in the consolidated statement of operations. Actual experience is reflected in the calculation of future policy benefits each quarter, and changes in the liability due to actual experience are also recognized in the liability for future policy benefits remeasurement (gain) loss in the consolidated statement of operations.
Discount rates used to calculate net premiums are locked in at policy inception and provide the basis to recognize interest expense in the consolidated statement of operations. Discount rates used to measure the carrying value of the liability for future policy benefits in the consolidated balance sheet are updated each reporting period, and differences between the liability balances calculated using the locked-in rate and the updated discount rates are recognized in accumulated other comprehensive income (loss). For additional discussion on the determination of discount rates, see the note to the consolidated financial statements entitled "Summary of Significant Accounting Policies".
76
CNO FINANCIAL GROUP, INC. AND SUBSIDIARIES
___________________
Market risk benefits
MRBs are contracts or contract features that both provide protection to the contract holder from other-than-nominal capital market risk and expose the Company to other-than-nominal capital market risk. Many of our fixed indexed annuity products include a GLWB that is considered a MRB. MRBs are measured at fair value using an option-based valuation model based on amount of exposure, market data, Company experience and other factors. Changes in fair value are recognized in earnings each period with the exception of the portion of the change in fair value due to a change in the instrument-specific credit risk, which is recognized in accumulated other comprehensive income (loss). MRBs in an asset position are presented separately from those in a liability position as there is no legal right of offset between contracts.
The cost of MRBs may rise in volatile or declining equity markets or in a low interest rate environment. Market conditions including, but not limited to, changes in interest rates, equity indices, market volatility, variations in actuarial assumptions regarding policyholder behavior, mortality and risk margins related to non-capital market inputs, may result in significant fluctuations in the estimated fair value of the guarantees that could affect net income and changes in our nonperformance risk could materially affect other comprehensive income.
77
CNO FINANCIAL GROUP, INC. AND SUBSIDIARIES
___________________
RESULTS OF OPERATIONS
The following tables and narratives summarize the operating results of our segments (dollars in millions):
| Three months ended | |||||||||||||||||||||||
| March 31, | |||||||||||||||||||||||
| 2023 | 2022 | ||||||||||||||||||||||
| Insurance product margin | |||||||||||||||||||||||
| Annuity: | |||||||||||||||||||||||
| Insurance policy income | $ | 5.1 | $ | 5.0 | |||||||||||||||||||
| Net investment income | 125.4 | 117.5 | |||||||||||||||||||||
| Insurance policy benefits | (8.7) | (9.5) | |||||||||||||||||||||
| Interest credited | (48.1) | (42.5) | |||||||||||||||||||||
| Amortization and non-deferred commissions | (16.4) | (14.6) | |||||||||||||||||||||
| Annuity margin | 57.3 | 55.9 | |||||||||||||||||||||
| Health: | |||||||||||||||||||||||
| Insurance policy income | 401.4 | 406.7 | |||||||||||||||||||||
| Net investment income | 74.0 | 73.3 | |||||||||||||||||||||
| Insurance policy benefits | (318.1) | (323.1) | |||||||||||||||||||||
| Amortization and non-deferred commissions | (40.8) | (41.6) | |||||||||||||||||||||
| Health margin | 116.5 | 115.3 | |||||||||||||||||||||
| Life: | |||||||||||||||||||||||
| Insurance policy income | 219.0 | 213.3 | |||||||||||||||||||||
| Net investment income | 36.3 | 35.5 | |||||||||||||||||||||
| Insurance policy benefits | (147.2) | (153.1) | |||||||||||||||||||||
| Interest credited | (12.1) | (12.0) | |||||||||||||||||||||
| Amortization and non-deferred commissions | (19.9) | (18.4) | |||||||||||||||||||||
| Advertising expense | (28.7) | (29.3) | |||||||||||||||||||||
| Life margin | 47.4 | 36.0 | |||||||||||||||||||||
| Total insurance product margin | 221.2 | 207.2 | |||||||||||||||||||||
| Allocated expenses: | |||||||||||||||||||||||
| Branch office expenses | (19.8) | (18.1) | |||||||||||||||||||||
| Other allocated expenses | (137.7) | (126.7) | |||||||||||||||||||||
| Income from insurance products | 63.7 | 62.4 | |||||||||||||||||||||
| Fee income | 15.5 | 9.9 | |||||||||||||||||||||
| Investment income not allocated to product lines | 15.5 | 27.0 | |||||||||||||||||||||
| Expenses not allocated to product lines | (18.3) | (14.8) | |||||||||||||||||||||
| Operating earnings before taxes | 76.4 | 84.5 | |||||||||||||||||||||
| Income tax expense on operating income | (17.8) | (20.0) | |||||||||||||||||||||
| Net operating income | $ | 58.6 | $ | 64.5 | |||||||||||||||||||
CNO is the top tier holding company for a group of insurance companies operating throughout the United States that develop, market and administer health insurance, annuity, individual life insurance and other insurance and financial services products. We distribute theseview our operations by segments, which consist of insurance product lines. These products are distributed by our two divisions. The Consumer Division serves individual consumers, engaging with them on the phone, virtually, online, face-to-face with agents, or through our Bankers Life segment, which utilizes a career agency force, through our Washington National segment, which utilizes independent producerscombination of sales channels. The Worksite Division focuses on worksite and through our Colonial Penn segment, which utilizes direct response marketing. In the fourth quartergroup sales for businesses, associations, and other membership groups, interacting with customers at their place of 2016, we began reporting as an additional business segment, the long-term care block that was recaptured in September 2016.employment and virtually.
78
CNO FINANCIAL GROUP, INC. AND SUBSIDIARIES
___________________
Insurance product margin is management’s measure of the profitability of its annuity, health and life product lines' performance and consists of insurance policy income plus allocated investment income less insurance policy benefits, interest credited, commissions, advertising expense and amortization of acquisition costs. Income from insurance products is the sum of the insurance margins of the annuity, health and life product lines, less expenses allocated to the insurance lines. It excludes the income from our fee income business, investment income not allocated to product lines, net expenses not allocated to product lines (primarily holding company expenses) and income taxes. Management believes insurance product margin and income from insurance products help provide a better understanding of the business and a more meaningful analysis of the results of our insurance product lines.
Net investment income is allocated to the product lines using the book yield of investments backing the block of business, which is applied to the average net insurance liabilities for the block in each period. Net insurance liabilities for the purpose of allocating investment income to product lines are equal to: (i) policyholder account balances for annuity products; (ii) total reserves before the fair value adjustments reflected in accumulated other comprehensive income (loss), if applicable, for all other products; less (iii) amounts related to reinsurance business; (iv) deferred acquisition costs; (v) the present value of future profits; and (vi) the value of unexpired options credited to insurance liabilities. Investment income not allocated to product lines represents net investment income less: (i) equity returns credited to policyholder account balances; (ii) the investment income allocated to our product lines; (iii) interest expense on notes payable and investment borrowings; (iv) expenses related to the FABN program; and (v) certain expenses related to benefit plans that are offset by special-purpose investment income; plus (vi) the impact of annual option forfeitures related to fixed indexed annuity surrenders. Investment income not allocated to product lines includes investment income on investments in excess of amounts allocated to product lines, investments held by our holding companies, the spread we earn from our FHLB investment borrowing and FABN programs and variable components of investment income (including call and prepayment income, adjustments to returns on structured securities due to cash flow changes, income (loss) from COLI and alternative investment income not allocated to product lines), net of interest expense on corporate debt.
Summary of Operating Results: Net operating income was $58.6 million in the first quarter of 2023, down from $64.5 million in the first quarter of 2022.
Insurance product margin was $221.2 million in the first quarter of 2023 compared to $207.2 million in the first quarter of 2022. Insurance product margin was favorably impacted by an $11.4 million increase in our life margin primarily driven by growth in the block and favorable mortality.
Total allocated and unallocated expenses were $175.8 million in the first quarter of 2023, up 10 percent from the first quarter of 2022. Though expenses were elevated in the first quarter of 2023, our projected expense ratio for the full year of between 19.0 percent to 19.4 percent remains unchanged. The expense ratio is defined as total allocated and unallocated expenses divided by the sum of insurance policy income and net investment income allocated to products.
The fee income segment is summarized below (dollars in millions):
| Three months ended | |||||||||||||||||||||||
| March 31, | |||||||||||||||||||||||
| 2023 | 2022 | ||||||||||||||||||||||
| Fee revenue | $ | 51.3 | $ | 40.3 | |||||||||||||||||||
| Operating costs and expenses | (35.8) | (30.4) | |||||||||||||||||||||
| Net fee income | $ | 15.5 | $ | 9.9 | |||||||||||||||||||
The increase in net fee income in the 2023 period is due to growth in the sales of third party products in recent periods and changes to our revenue recognition assumptions reflecting favorable policy persistency, partially offset by lower net fee income related to our businesses that provide benefits administration and employee benefits management services.
Investment income not allocated to product lines generally fluctuates from period to period based on the level of prepayment income (including call premiums) and trading account income; the performance of our alternative investments (which are typically reported a quarter in arrears); the earnings related to the investments underlying our COLI; and the spread we earn from our FHLB investment borrowing and FABN programs.
79
| Three months ended | Nine months ended | ||||||||||||||
| September 30, | September 30, | ||||||||||||||
| 2017 | 2016 | 2017 | 2016 | ||||||||||||
| Premium collections: | |||||||||||||||
| Annuities | $ | 236.5 | $ | 245.1 | $ | 758.3 | $ | 685.1 | |||||||
| Medicare supplement and other supplemental health | 291.5 | 305.4 | 906.4 | 922.4 | |||||||||||
| Life | 113.7 | 115.4 | 345.4 | 347.3 | |||||||||||
| Total collections | $ | 641.7 | $ | 665.9 | $ | 2,010.1 | $ | 1,954.8 | |||||||
| Average liabilities for insurance products: | |||||||||||||||
| Fixed index annuities | $ | 5,222.5 | $ | 4,597.1 | $ | 5,048.2 | $ | 4,461.9 | |||||||
| Fixed interest annuities | 2,860.5 | 3,149.7 | 2,935.9 | 3,222.7 | |||||||||||
| SPIAs and supplemental contracts: | |||||||||||||||
| Mortality based | 159.2 | 172.7 | 162.1 | 177.1 | |||||||||||
| Deposit based | 148.1 | 152.9 | 149.8 | 154.0 | |||||||||||
| Health: | |||||||||||||||
| Long-term care | 5,038.4 | 5,161.2 | 4,950.4 | 4,985.4 | |||||||||||
| Medicare supplement | 329.8 | 333.0 | 336.7 | 335.9 | |||||||||||
| Other health | 56.5 | 50.8 | 55.3 | 49.7 | |||||||||||
| Life: | |||||||||||||||
| Interest sensitive | 785.6 | 722.7 | 771.7 | 706.2 | |||||||||||
| Non-interest sensitive | 1,099.1 | 1,027.9 | 1,080.8 | 1,009.1 | |||||||||||
| Total average liabilities for insurance products, net of reinsurance ceded | $ | 15,699.7 | $ | 15,368.0 | $ | 15,490.9 | $ | 15,102.0 | |||||||
| Revenues: | |||||||||||||||
| Insurance policy income | $ | 414.6 | $ | 413.7 | $ | 1,252.8 | $ | 1,246.5 | |||||||
| Net investment income: | |||||||||||||||
| General account invested assets | 242.1 | 229.1 | 710.9 | 676.2 | |||||||||||
| Fixed index products | 28.5 | 15.6 | 89.5 | 10.6 | |||||||||||
| Fee revenue and other income | 11.3 | 9.6 | 32.5 | 23.5 | |||||||||||
| Total revenues | 696.5 | 668.0 | 2,085.7 | 1,956.8 | |||||||||||
| Expenses: | |||||||||||||||
| Insurance policy benefits | 364.7 | 368.4 | 1,089.9 | 1,098.7 | |||||||||||
| Amounts added to policyholder account balances: | |||||||||||||||
| Cost of interest credited to policyholders | 26.3 | 27.7 | 79.3 | 83.3 | |||||||||||
| Cost of options to fund index credits, net of forfeitures | 16.0 | 15.7 | 47.1 | 49.2 | |||||||||||
| Market value changes credited to policyholders | 30.2 | 15.3 | 91.4 | 9.7 | |||||||||||
| Amortization related to operations | 38.7 | 43.8 | 126.3 | 135.3 | |||||||||||
| Interest expense on investment borrowings | 5.3 | 3.5 | 14.3 | 9.4 | |||||||||||
| Other operating costs and expenses | 108.4 | 105.5 | 328.2 | 312.2 | |||||||||||
| Total benefits and expenses | 589.6 | 579.9 | 1,776.5 | 1,697.8 | |||||||||||
| Income before net realized investment gains (losses), net of related amortization, and fair value changes in embedded derivative liabilities, net of related amortization, and income taxes | 106.9 | 88.1 | 309.2 | 259.0 | |||||||||||
| Net realized investment gains (losses) | 15.6 | .9 | 31.1 | (.7 | ) | ||||||||||
| Amortization related to net realized investment gains (losses) | (.7 | ) | (.2 | ) | (1.0 | ) | (.6 | ) | |||||||
| Net realized investment gains (losses), net of related amortization | 14.9 | .7 | 30.1 | (1.3 | ) | ||||||||||
| Insurance policy benefits - fair value changes in embedded derivative liabilities | 2.8 | 11.6 | (9.8 | ) | (45.7 | ) | |||||||||
| Amortization related to fair value changes in embedded derivative liabilities | (.5 | ) | (2.3 | ) | 1.8 | 9.5 | |||||||||
| Fair value changes in embedded derivative liabilities, net of related amortization | 2.3 | 9.3 | (8.0 | ) | (36.2 | ) | |||||||||
| Income before income taxes | $ | 124.1 | $ | 98.1 | $ | 331.3 | $ | 221.5 | |||||||
CNO FINANCIAL GROUP, INC. AND SUBSIDIARIES
___________________
| Three months ended | Nine months ended | ||||||||||||||
| September 30, | September 30, | ||||||||||||||
| 2017 | 2016 | 2017 | 2016 | ||||||||||||
| Health benefit ratios: | |||||||||||||||
| All health lines: | |||||||||||||||
| Insurance policy benefits | $ | 291.3 | $ | 301.2 | $ | 863.0 | $ | 896.2 | |||||||
| Benefit ratio (a) | 94.8 | % | 97.0 | % | 93.1 | % | 96.0 | % | |||||||
| Medicare supplement: | |||||||||||||||
| Insurance policy benefits | $ | 140.0 | $ | 140.5 | $ | 414.1 | $ | 418.7 | |||||||
| Benefit ratio (a) | 72.0 | % | 72.5 | % | 70.8 | % | 72.2 | % | |||||||
| Long-term care: | |||||||||||||||
| Insurance policy benefits | $ | 151.3 | $ | 160.7 | $ | 448.9 | $ | 477.5 | |||||||
| Benefit ratio (a) | 134.2 | % | 137.7 | % | 131.2 | % | 135.1 | % | |||||||
| Interest-adjusted benefit ratio (b) | 72.9 | % | 77.7 | % | 70.5 | % | 76.9 | % | |||||||
Margin from 2016, and were $2,010.1Annuity Products (dollars in millions):
| Three months ended | |||||||||||||||||||||||
| March 31, | |||||||||||||||||||||||
| 2023 | 2022 | ||||||||||||||||||||||
| Annuity margin: | |||||||||||||||||||||||
| Fixed indexed annuities | |||||||||||||||||||||||
| Insurance policy income | $ | 3.6 | $ | 3.0 | |||||||||||||||||||
| Net investment income | 98.8 | 90.1 | |||||||||||||||||||||
| Insurance policy benefits | (4.1) | (4.6) | |||||||||||||||||||||
| Interest credited | (36.4) | (30.4) | |||||||||||||||||||||
| Amortization and non-deferred commissions | (15.4) | (13.3) | |||||||||||||||||||||
| Margin from fixed indexed annuities | $ | 46.5 | $ | 44.8 | |||||||||||||||||||
| Average net insurance liabilities | $ | 9,183.8 | $ | 8,486.3 | |||||||||||||||||||
| Margin/average net insurance liabilities | 2.03 | % | 2.11 | % | |||||||||||||||||||
| Fixed interest annuities | |||||||||||||||||||||||
| Insurance policy income | $ | .3 | $ | .1 | |||||||||||||||||||
| Net investment income | 20.9 | 21.5 | |||||||||||||||||||||
| Insurance policy benefits | (.1) | (.4) | |||||||||||||||||||||
| Interest credited | (11.1) | (11.5) | |||||||||||||||||||||
| Amortization and non-deferred commissions | (.9) | (1.2) | |||||||||||||||||||||
| Margin from fixed interest annuities | $ | 9.1 | $ | 8.5 | |||||||||||||||||||
| Average net insurance liabilities | $ | 1,630.9 | $ | 1,761.2 | |||||||||||||||||||
| Margin/average net insurance liabilities | 2.23 | % | 1.93 | % | |||||||||||||||||||
| Other annuities | |||||||||||||||||||||||
| Insurance policy income | $ | 1.2 | $ | 1.9 | |||||||||||||||||||
| Net investment income | 5.7 | 5.9 | |||||||||||||||||||||
| Insurance policy benefits | (4.5) | (4.5) | |||||||||||||||||||||
| Interest credited | (.6) | (.6) | |||||||||||||||||||||
| Amortization and non-deferred commissions | (.1) | (.1) | |||||||||||||||||||||
| Margin from other annuities | $ | 1.7 | $ | 2.6 | |||||||||||||||||||
| Average net insurance liabilities | $ | 469.5 | $ | 490.2 | |||||||||||||||||||
| Margin/average net insurance liabilities | 1.45 | % | 2.12 | % | |||||||||||||||||||
| Total annuity margin | $ | 57.3 | $ | 55.9 | |||||||||||||||||||
| Average net insurance liabilities | $ | 11,284.2 | $ | 10,737.7 | |||||||||||||||||||
| Margin/average net insurance liabilities | 2.03 | % | 2.08 | % | |||||||||||||||||||
Margin from fixed indexed annuities was $46.5 million in the first nine months of 2017, up 2.8 percent from 2016. See "Premium Collections" for further analysis of Bankers Life's premium collections.
2022, respectively, driven by deposits and reinvested returns in excess of withdrawals. The increase in net insurance liabilities results in higher net investment income allocated. The earned yield was 4.30 percent in the first quarter of 2023, up from 4.25 percent in the first quarter of 2022, reflecting higher portfolio yields.
80
CNO FINANCIAL GROUP, INC. AND SUBSIDIARIES
___________________
Margin from the sales of such assets were invested at then current yields. Such increase is reflected as a reduction of accumulated other comprehensive income. Excluding the impact of the aforementioned item, the increase in average liabilities for insurance products fixed interest annuities was primarily due to new sales and the amounts added to policyholder account balances on interest-sensitive products.
Margin from other annuities was $1.7 million in the first quarter of 2023 compared to $2.6 million in the first quarter of 2022. The interest-adjusted benefit ratiomargin on this relatively small block of business is sensitive to annuitant mortality related to contracts with life contingencies. An increase in mortality in this block will result in a decrease in insurance liabilities and insurance policy benefits. Such mortality was lower in the 2023 period compared to the same period in 2022.
Margin from Health Products (dollars in millions):
| Three months ended | |||||||||||||||||||||||
| March 31, | |||||||||||||||||||||||
| 2023 | 2022 | ||||||||||||||||||||||
| Health margin: | |||||||||||||||||||||||
| Supplemental health | |||||||||||||||||||||||
| Insurance policy income | $ | 179.0 | $ | 173.5 | |||||||||||||||||||
| Net investment income | 38.6 | 37.4 | |||||||||||||||||||||
| Insurance policy benefits | (128.2) | (129.3) | |||||||||||||||||||||
| Amortization and non-deferred commissions | (26.1) | (25.5) | |||||||||||||||||||||
| Margin from supplemental health | $ | 63.3 | $ | 56.1 | |||||||||||||||||||
| Margin/insurance policy income | 35 | % | 32 | % | |||||||||||||||||||
| Medicare supplement | |||||||||||||||||||||||
| Insurance policy income | $ | 156.5 | $ | 166.8 | |||||||||||||||||||
| Net investment income | 1.3 | 1.3 | |||||||||||||||||||||
| Insurance policy benefits | (120.5) | (120.5) | |||||||||||||||||||||
| Amortization and non-deferred commissions | (11.2) | (13.0) | |||||||||||||||||||||
| Margin from Medicare supplement | $ | 26.1 | $ | 34.6 | |||||||||||||||||||
| Margin/insurance policy income | 17 | % | 21 | % | |||||||||||||||||||
| Long-term care | |||||||||||||||||||||||
| Insurance policy income | $ | 65.9 | $ | 66.4 | |||||||||||||||||||
| Net investment income | 34.1 | 34.6 | |||||||||||||||||||||
| Insurance policy benefits | (69.4) | (73.3) | |||||||||||||||||||||
| Amortization and non-deferred commissions | (3.5) | (3.1) | |||||||||||||||||||||
| Margin from long-term care | $ | 27.1 | $ | 24.6 | |||||||||||||||||||
| Margin/insurance policy income | 41 | % | 37 | % | |||||||||||||||||||
| Total health margin | $ | 116.5 | $ | 115.3 | |||||||||||||||||||
| Margin/insurance policy income | 29 | % | 28 | % | |||||||||||||||||||
Margin from supplemental health business was 72.9 percent and 77.7 percent$63.3 million in the third quartersfirst quarter of 2017 and 2016, respectively, and2023, up 13 percent from the first quarter of 2022, reflecting growth in the block. The margin as a percentage of insurance policy income was 70.5 percent and 76.935 percent in the first nine monthsquarter of 2017 and 2016, respectively. The interest-adjusted benefit ratio2023 compared to 32 percent in the first nine months of 2017 wasprior year period.
81
CNO FINANCIAL GROUP, INC. AND SUBSIDIARIES
___________________
| Three months ended | Nine months ended | ||||||||||||||
| September 30, | September 30, | ||||||||||||||
| 2017 | 2016 | 2017 | 2016 | ||||||||||||
| Commission expense and agent manager benefits | $ | 17.3 | $ | 19.8 | $ | 53.5 | $ | 52.3 | |||||||
| Other operating expenses | 91.1 | 85.7 | 274.7 | 259.9 | |||||||||||
| Total | $ | 108.4 | $ | 105.5 | $ | 328.2 | $ | 312.2 | |||||||
| Three months ended | Nine months ended | ||||||||||||||
| September 30, | September 30, | ||||||||||||||
| 2017 | 2016 | 2017 | 2016 | ||||||||||||
| Premium collections: | |||||||||||||||
| Supplemental health and other health | $ | 145.2 | $ | 141.5 | $ | 443.2 | $ | 425.3 | |||||||
| Medicare supplement | 11.7 | 14.6 | 38.7 | 46.1 | |||||||||||
| Life | 7.1 | 7.1 | 22.3 | 21.7 | |||||||||||
| Annuity | .2 | .2 | .6 | 1.0 | |||||||||||
| Total collections | $ | 164.2 | $ | 163.4 | $ | 504.8 | $ | 494.1 | |||||||
| Average liabilities for insurance products: | |||||||||||||||
| Fixed index annuities | $ | 309.9 | $ | 346.0 | $ | 317.9 | $ | 355.1 | |||||||
| Fixed interest annuities | 96.6 | 105.6 | 98.9 | 108.4 | |||||||||||
| SPIAs and supplemental contracts: | |||||||||||||||
| Mortality based | 231.8 | 251.9 | 232.5 | 250.4 | |||||||||||
| Deposit based | 267.8 | 267.1 | 269.7 | 266.5 | |||||||||||
| Separate Accounts | 4.8 | 4.7 | 4.7 | 4.7 | |||||||||||
| Health: | |||||||||||||||
| Supplemental health | 2,749.9 | 2,621.7 | 2,715.3 | 2,589.1 | |||||||||||
| Medicare supplement | 23.9 | 27.8 | 25.4 | 28.5 | |||||||||||
| Other health | 13.4 | 14.1 | 13.7 | 14.2 | |||||||||||
| Life: | |||||||||||||||
| Interest sensitive | 148.9 | 150.3 | 149.0 | 150.5 | |||||||||||
| Non-interest sensitive | 174.1 | 178.9 | 174.2 | 180.6 | |||||||||||
| Total average liabilities for insurance products, net of reinsurance ceded | $ | 4,021.1 | $ | 3,968.1 | $ | 4,001.3 | $ | 3,948.0 | |||||||
| Revenues: | |||||||||||||||
| Insurance policy income | $ | 167.4 | $ | 164.4 | $ | 502.0 | $ | 490.0 | |||||||
| Net investment income: | |||||||||||||||
| General account invested assets | 65.5 | 66.0 | 193.7 | 190.3 | |||||||||||
| Fixed index products | 2.0 | 1.5 | 5.8 | .3 | |||||||||||
| Trading account income (loss) related to policyholder accounts | .5 | (.4 | ) | 2.4 | .7 | ||||||||||
| Fee revenue and other income | .3 | .4 | .8 | 1.0 | |||||||||||
| Total revenues | 235.7 | 231.9 | 704.7 | 682.3 | |||||||||||
| Expenses: | |||||||||||||||
| Insurance policy benefits | 138.0 | 138.7 | 415.7 | 405.6 | |||||||||||
| Amounts added to policyholder account balances: | |||||||||||||||
| Cost of interest credited to policyholders | 3.2 | 3.3 | 9.7 | 10.3 | |||||||||||
| Cost of options to fund index credits, net of forfeitures | 1.2 | 1.2 | 3.2 | 4.4 | |||||||||||
| Market value changes credited to policyholders | 2.3 | 1.3 | 8.1 | 1.7 | |||||||||||
| Amortization related to operations | 14.3 | 14.3 | 43.9 | 44.5 | |||||||||||
| Interest expense on investment borrowings | 1.7 | .9 | 4.5 | 2.5 | |||||||||||
| Other operating costs and expenses | 47.5 | 47.0 | 145.0 | 140.3 | |||||||||||
| Total benefits and expenses | 208.2 | 206.7 | 630.1 | 609.3 | |||||||||||
| Income before net realized investment gains and fair value changes in embedded derivative liabilities, net of related amortization, and income taxes | 27.5 | 25.2 | 74.6 | 73.0 | |||||||||||
| Net realized investment gains | 6.5 | .1 | 12.6 | 27.2 | |||||||||||
| Amortization related to net realized investment gains | — | — | — | (.3 | ) | ||||||||||
| Net realized investment gains, net of related amortization | 6.5 | .1 | 12.6 | 26.9 | |||||||||||
| Insurance policy benefits - fair value changes in embedded derivative liabilities | .1 | .5 | — | (1.3 | ) | ||||||||||
| Amortization related to fair value changes in embedded derivative liabilities | (.1 | ) | (.4 | ) | — | .9 | |||||||||
| Fair value changes in embedded derivative liabilities, net of related amortization | — | .1 | — | (.4 | ) | ||||||||||
| Income before income taxes | $ | 34.0 | $ | 25.4 | $ | 87.2 | $ | 99.5 | |||||||
| Three months ended | Nine months ended | ||||||||||||||
| September 30, | September 30, | ||||||||||||||
| 2017 | 2016 | 2017 | 2016 | ||||||||||||
| Health benefit ratios: | |||||||||||||||
| Medicare supplement: | |||||||||||||||
| Insurance policy benefits | $ | 9.1 | $ | 10.7 | $ | 28.3 | $ | 33.0 | |||||||
| Benefit ratio (a) | 68.1 | % | 69.5 | % | 68.4 | % | 69.5 | % | |||||||
| Supplemental health and other: | |||||||||||||||
| Insurance policy benefits | $ | 122.4 | $ | 118.8 | $ | 369.2 | $ | 352.6 | |||||||
| Benefit ratio (a) | 83.2 | % | 84.0 | % | 84.1 | % | 83.6 | % | |||||||
| Interest-adjusted benefit ratio (b) | 59.0 | % | 59.8 | % | 60.0 | % | 59.7 | % | |||||||
Margin from Long-term care products was $27.1 million in the first quarter of 2023, up 10 percent from the first quarter of 2022. The margin as a percentage of insurance policy income was 41 percent in the first quarter of 2023 compared to 37 percent in the first quarter of 2022. The margin in the 2023 period reflected lower insurance policy benefits than the prior year period.
82
CNO FINANCIAL GROUP, INC. AND SUBSIDIARIES
___________________
Margin from Life Products (dollars in millions):
| Three months ended | |||||||||||||||||||||||
| March 31, | |||||||||||||||||||||||
| 2023 | 2022 | ||||||||||||||||||||||
| Life margin: | |||||||||||||||||||||||
| Interest-sensitive life | |||||||||||||||||||||||
| Insurance policy income | $ | 44.5 | $ | 43.1 | |||||||||||||||||||
| Net investment income | 13.1 | 13.0 | |||||||||||||||||||||
| Insurance policy benefits | (18.2) | (21.2) | |||||||||||||||||||||
| Interest credited | (12.0) | (11.9) | |||||||||||||||||||||
| Amortization and non-deferred commissions | (4.6) | (5.7) | |||||||||||||||||||||
| Margin from interest-sensitive life | $ | 22.8 | $ | 17.3 | |||||||||||||||||||
| Average net insurance liabilities | $ | 1,032.0 | $ | 1,009.4 | |||||||||||||||||||
| Interest margin | $ | 1.1 | $ | 1.1 | |||||||||||||||||||
| Interest margin/average net insurance liabilities | .43 | % | .44 | % | |||||||||||||||||||
| Underwriting margin | $ | 21.7 | $ | 16.2 | |||||||||||||||||||
| Underwriting margin/insurance policy income | 49 | % | 38 | % | |||||||||||||||||||
| Traditional life | |||||||||||||||||||||||
| Insurance policy income | $ | 174.5 | $ | 170.2 | |||||||||||||||||||
| Net investment income | 23.2 | 22.5 | |||||||||||||||||||||
| Insurance policy benefits | (129.0) | (131.9) | |||||||||||||||||||||
| Interest credited | (.1) | (.1) | |||||||||||||||||||||
| Amortization and non-deferred commissions | (15.3) | (12.7) | |||||||||||||||||||||
| Advertising expense | (28.7) | (29.3) | |||||||||||||||||||||
| Margin from traditional life | $ | 24.6 | $ | 18.7 | |||||||||||||||||||
| Margin/insurance policy income | 14 | % | 11 | % | |||||||||||||||||||
| Margin excluding advertising expense/insurance policy income | 31 | % | 28 | % | |||||||||||||||||||
| Total life margin | $ | 47.4 | $ | 36.0 | |||||||||||||||||||
Margin from the original issuance of the policy and over the lifetime of the policy, of not less than 65 percent on these products, as determined in accordance with statutory accounting principles. Insurance margins (insurance policy income less insurance policy benefits) on these products were $4.2 million and $4.7 million in the third quarters of 2017 and 2016, respectively, and were $13.0 million and $14.5interest-sensitive life business was $22.8 million in the first nine monthsquarter of 20172023, up 32 percent from the first quarter of 2022, reflecting favorable mortality, as compared to the 2022 period, and 2016,growth in the block due to sales in recent periods.
The interest margin was $1.1 million in both the first quarters of 2023 and 2022. Net investment income in the 2023 period was comparable to the 2022 period. The increase in average net insurance liabilities results in higher net investment income allocated, which is partially offset by lower earned yields. The earned yield was 5.08 percent and 5.15 percent in the first quarters of 2023 and 2022, respectively. Such decrease reflectsInterest credited to policyholders may be changed annually but is subject to minimum guaranteed rates and, as a result, any reduction in our earned rate may not be fully reflected in the run-offrate credited to policyholders.
Net investment income and interest credited exclude the change in market values of this block of business.
Margin from traditional life business was $43.9$24.6 million and $44.5$18.7 million in the first nine monthsquarters of 20172023 and 2016,2022, respectively.
83
CNO FINANCIAL GROUP, INC. AND SUBSIDIARIES
___________________
Advertising expense was $28.7 million in the first nine months of 2016.
| Three months ended | Nine months ended | ||||||||||||||
| September 30, | September 30, | ||||||||||||||
| 2017 | 2016 | 2017 | 2016 | ||||||||||||
| Premium collections: | |||||||||||||||
| Life | $ | 72.2 | $ | 70.1 | $ | 218.1 | $ | 208.6 | |||||||
| Supplemental health | .4 | .6 | 1.5 | 1.8 | |||||||||||
| Total collections | $ | 72.6 | $ | 70.7 | $ | 219.6 | $ | 210.4 | |||||||
| Average liabilities for insurance products: | |||||||||||||||
| SPIAs - mortality based | $ | 73.6 | $ | 76.1 | $ | 73.0 | $ | 73.8 | |||||||
| Health: | |||||||||||||||
| Medicare supplement | 5.6 | 6.4 | 5.8 | 6.6 | |||||||||||
| Other health | 4.1 | 4.2 | 4.1 | 4.3 | |||||||||||
| Life: | |||||||||||||||
| Interest sensitive | 15.4 | 16.3 | 15.6 | 16.2 | |||||||||||
| Non-interest sensitive | 720.1 | 691.9 | 714.3 | 685.8 | |||||||||||
| Total average liabilities for insurance products, net of reinsurance ceded | $ | 818.8 | $ | 794.9 | $ | 812.8 | $ | 786.7 | |||||||
| Revenues: | |||||||||||||||
| Insurance policy income | $ | 73.1 | $ | 70.9 | $ | 219.1 | $ | 210.5 | |||||||
| Net investment income on general account invested assets | 11.0 | 11.1 | 33.1 | 33.0 | |||||||||||
| Fee revenue and other income | .3 | .2 | .9 | .8 | |||||||||||
| Total revenues | 84.4 | 82.2 | 253.1 | 244.3 | |||||||||||
| Expenses: | |||||||||||||||
| Insurance policy benefits | 47.5 | 50.1 | 150.3 | 150.8 | |||||||||||
| Amounts added to annuity and interest-sensitive life product account balances | .2 | .2 | .5 | .5 | |||||||||||
| Amortization related to operations | 3.9 | 3.7 | 11.9 | 11.3 | |||||||||||
| Interest expense on investment borrowings | .3 | .1 | .7 | .4 | |||||||||||
| Other operating costs and expenses | 23.5 | 27.2 | 73.0 | 84.2 | |||||||||||
| Total benefits and expenses | 75.4 | 81.3 | 236.4 | 247.2 | |||||||||||
| Income (loss) before net realized investment gains (losses) and income taxes | 9.0 | .9 | 16.7 | (2.9 | ) | ||||||||||
| Net realized investment gains (losses) | 1.0 | .3 | .8 | (.2 | ) | ||||||||||
| Income (loss) before income taxes | $ | 10.0 | $ | 1.2 | $ | 17.5 | $ | (3.1 | ) | ||||||
Collected Premiums From Annuity and Interest-Sensitive Life Products (dollars in millions):
| Three months ended | |||||||||||||||||||||||
| March 31, | |||||||||||||||||||||||
| 2023 | 2022 | ||||||||||||||||||||||
| Collected premiums from annuity and interest-sensitive life products: | |||||||||||||||||||||||
| Annuities | $ | 370.9 | $ | 368.6 | |||||||||||||||||||
| Interest-sensitive life | 58.2 | 56.6 | |||||||||||||||||||||
| Total collected premiums from annuity and interest-sensitive life products | $ | 429.1 | $ | 425.2 | |||||||||||||||||||
Collected premiums from annuity and interest-sensitive products increased .9 percent in the first nine monthsquarter of 2017, we recognized net realized investment gains of $.8 million, which were comprised of: (i) $.9 million of net gains from the sales of investments; (ii) the increase in fair value of certain fixed maturity investments with embedded derivatives of $.4 million; and (iii) $.5 million of writedowns of investments for other than temporary declines in fair value which were recorded in earnings. During2023 compared to the first nine monthsquarter of 2016, we recognized net realized investment losses of $.22022. Premium collections from fixed indexed annuities decreased 8.8 percent to $323.3 million which were comprised of: (i) $.7 million of net gains from the sales of investments; (ii) the decrease in fair value of certain fixed maturity investments with embedded derivatives of $.1 million; and (iii) $.8 million of writedowns of investments for other than temporary declines in fair value recognized through net income.
Investment Income Not Allocated to Product Lines (dollars in millions):
| Three months ended | |||||||||||||||||||||||
| March 31, | |||||||||||||||||||||||
| 2023 | 2022 | ||||||||||||||||||||||
| Net investment income | $ | 343.0 | $ | 208.2 | |||||||||||||||||||
| Allocated to product lines: | |||||||||||||||||||||||
| Annuity | (125.4) | (117.5) | |||||||||||||||||||||
| Health | (74.0) | (73.3) | |||||||||||||||||||||
| Life | (36.3) | (35.5) | |||||||||||||||||||||
| Equity returns credited to policyholder account balances | (18.6) | 71.9 | |||||||||||||||||||||
| Amounts allocated to product lines and credited to policyholder account balances | (254.3) | (154.4) | |||||||||||||||||||||
| Impact of annual option forfeitures related to fixed indexed annuity surrenders | — | 1.6 | |||||||||||||||||||||
| Amount related to variable interest entities and other non-operating items | (20.9) | (7.2) | |||||||||||||||||||||
| Interest expense on debt | (15.7) | (15.7) | |||||||||||||||||||||
| Interest expense on investment borrowings from FHLB | (21.7) | (2.4) | |||||||||||||||||||||
| Expenses related to FABN program | (7.6) | (7.3) | |||||||||||||||||||||
| Less amounts credited to deferred compensation plans (offsetting investment income) | (7.3) | 4.2 | |||||||||||||||||||||
| Total adjustments | (73.2) | (26.8) | |||||||||||||||||||||
| Investment income not allocated to product lines | $ | 15.5 | $ | 27.0 | |||||||||||||||||||
84
CNO FINANCIAL GROUP, INC. AND SUBSIDIARIES
___________________
Net Non-Operating Income:
The following summarizes our earnings, separated between in-forcenet non-operating income for the three months ending March 31, 2023 and new business for Colonial Penn2022 (dollars in millions):
| Three months ended | |||||||||||||||||||||||
| March 31, | |||||||||||||||||||||||
| 2023 | 2022 | ||||||||||||||||||||||
| Net realized investment losses from sales and change in allowance for credit losses | $ | (12.7) | $ | (7.2) | |||||||||||||||||||
| Net change in market value of investments recognized in earnings | (1.9) | (25.5) | |||||||||||||||||||||
| Fair value changes related to agent deferred compensation plan | — | 22.7 | |||||||||||||||||||||
| Changes in fair value of embedded derivative liabilities and market risk benefits | (65.1) | 165.4 | |||||||||||||||||||||
| Other | 2.3 | .4 | |||||||||||||||||||||
| Net non-operating income (loss) before taxes | $ | (77.4) | $ | 155.8 | |||||||||||||||||||
| Three months ended | Nine months ended | ||||||||||||||
| September 30, | September 30, | ||||||||||||||
| 2017 | 2016 | 2017 | 2016 | ||||||||||||
| Adjusted EBIT from In-Force Business | |||||||||||||||
| Revenues: | |||||||||||||||
| Insurance policy income | $ | 61.0 | $ | 57.2 | $ | 180.8 | $ | 169.0 | |||||||
| Net investment income and other | 11.3 | 11.3 | 34.0 | 33.8 | |||||||||||
| Total revenues | 72.3 | 68.5 | 214.8 | 202.8 | |||||||||||
| Benefits and expenses: | |||||||||||||||
| Insurance policy benefits | 40.3 | 41.9 | 127.5 | 126.0 | |||||||||||
| Amortization | 3.7 | 3.5 | 11.3 | 10.7 | |||||||||||
| Other expenses | 8.5 | 8.9 | 24.7 | 25.1 | |||||||||||
| Total benefits and expenses | 52.5 | 54.3 | 163.5 | 161.8 | |||||||||||
| Adjusted EBIT from In-Force Business | $ | 19.8 | $ | 14.2 | $ | 51.3 | $ | 41.0 | |||||||
| Adjusted EBIT from New Business | |||||||||||||||
| Revenues: | |||||||||||||||
| Insurance policy income | $ | 12.1 | $ | 13.7 | $ | 38.3 | $ | 41.5 | |||||||
| Net investment income and other | — | — | — | — | |||||||||||
| Total revenues | 12.1 | 13.7 | 38.3 | 41.5 | |||||||||||
| Benefits and expenses: | |||||||||||||||
| Insurance policy benefits | 7.4 | 8.4 | 23.3 | 25.3 | |||||||||||
| Amortization | .2 | .2 | .6 | .6 | |||||||||||
| Other expenses | 15.3 | 18.4 | 49.0 | 59.5 | |||||||||||
| Total benefits and expenses | 22.9 | 27.0 | 72.9 | 85.4 | |||||||||||
| Adjusted EBIT from New Business | $ | (10.8 | ) | $ | (13.3 | ) | $ | (34.6 | ) | $ | (43.9 | ) | |||
| Adjusted EBIT from In-Force and New Business | |||||||||||||||
| Revenues: | |||||||||||||||
| Insurance policy income | $ | 73.1 | $ | 70.9 | $ | 219.1 | $ | 210.5 | |||||||
| Net investment income and other | 11.3 | 11.3 | 34.0 | 33.8 | |||||||||||
| Total revenues | 84.4 | 82.2 | 253.1 | 244.3 | |||||||||||
| Benefits and expenses: | |||||||||||||||
| Insurance policy benefits | 47.7 | 50.3 | 150.8 | 151.3 | |||||||||||
| Amortization | 3.9 | 3.7 | 11.9 | 11.3 | |||||||||||
| Other expenses | 23.8 | 27.3 | 73.7 | 84.6 | |||||||||||
| Total benefits and expenses | 75.4 | 81.3 | 236.4 | 247.2 | |||||||||||
| Adjusted EBIT from In-Force and New Business | $ | 9.0 | $ | .9 | $ | 16.7 | $ | (2.9 | ) | ||||||
During the 2017 periods primarily reflects lower marketing costs. The vast majorityfirst three months of the costs to generate new business2023 and 2022, we recognized a decrease in this segment are
| Three months ended | Nine months ended | ||||||
| September 30, 2017 | September 30, 2017 | ||||||
| Premium collections: | |||||||
| Long-term care (all renewal) | $ | 3.9 | $ | 12.9 | |||
| Average liabilities for insurance products: | |||||||
| Average liabilities for long-term care products | $ | 579.6 | $ | 571.2 | |||
| Revenues: | |||||||
| Insurance policy income | $ | 4.2 | $ | 13.3 | |||
| Net investment income on general account invested assets | 6.8 | 26.5 | |||||
| Total revenues | 11.0 | 39.8 | |||||
| Expenses: | |||||||
| Insurance policy benefits | 11.4 | 36.6 | |||||
| Other operating costs and expenses | .6 | 2.1 | |||||
| Total benefits and expenses | 12.0 | 38.7 | |||||
| Income (loss) before net realized investment gains and income taxes | (1.0 | ) | 1.1 | ||||
| Net realized investment gains | 6.7 | 7.8 | |||||
| Income before income taxes | $ | 5.7 | $ | 8.9 | |||
| Three months ended | Nine months ended | ||||||
| September 30, 2017 | September 30, 2017 | ||||||
| Health benefit ratios: | |||||||
| Long-term care: | |||||||
| Insurance policy benefits | $ | 11.4 | $ | 36.6 | |||
| Benefit ratio (a) | 274.3 | % | 276.5 | % | |||
| Interest-adjusted benefit ratio (b) | 99.4 | % | 111.2 | % | |||
During the first three months of 2022, we recognized an increase in earnings of $22.7 million for the mark-to-market change in the agent deferred compensation plan liability which was impacted by changes in the underlying actuarial assumptions used to value the liability. We recognize the mark-to-market change in the estimated value of this liability through earnings as assumptions change.
We recognized an increase (decrease) in earnings of $(65.1) million and $165.4 million in the first three months of 2023 and 2022, respectively, resulting from changes in the fair value of embedded derivative liabilities and market risk benefits related to our fixed indexed annuities. Such amounts include the impacts of changes in market interest income on the accumulated assets backing the insurance liabilities from the product's insurance policy benefitsrates and equity impacts used to determine the ratio. Interest income is an important factor in measuring the performance of health products that are expected to be inforce for a longer duration of time, are not subject to unilateral changes in provisions (such as non-cancelable or guaranteed renewable contracts) and require the performance of various functions and services (including insurance protection) for an extended period of time. The net cash flows from long-term care
| Three months ended | Nine months ended | ||||||||||||||
| September 30, | September 30, | ||||||||||||||
| 2017 | 2016 | 2017 | 2016 | ||||||||||||
| Corporate operations: | |||||||||||||||
| Interest expense on corporate debt | $ | (11.7 | ) | $ | (11.5 | ) | $ | (34.8 | ) | $ | (34.3 | ) | |||
| Net investment income (loss): | |||||||||||||||
| General investment portfolio | 1.4 | 1.5 | 3.7 | 4.4 | |||||||||||
| Other special-purpose portfolios: | |||||||||||||||
| COLI | 2.3 | 2.3 | 11.6 | 2.0 | |||||||||||
| Investments held in a rabbi trust | .9 | .6 | 2.4 | 1.0 | |||||||||||
| Other trading account activities | 2.4 | 2.3 | 7.1 | 9.2 | |||||||||||
| Fee revenue and other income | 1.8 | 2.5 | 6.5 | 7.6 | |||||||||||
| Other operating costs and expenses | (23.7 | ) | (13.6 | ) | (68.3 | ) | (43.7 | ) | |||||||
| Loss before net realized investment gains (losses), earnings attributable to VIEs, fair value changes and amendment related to agent deferred compensation plan, loss on reinsurance transaction and income taxes | (26.6 | ) | (15.9 | ) | (71.8 | ) | (53.8 | ) | |||||||
| Net realized investment gains (losses) | (.6 | ) | 10.3 | — | (3.0 | ) | |||||||||
| Earnings attributable to VIEs | (3.3 | ) | (.7 | ) | (4.6 | ) | (1.2 | ) | |||||||
| Fair value changes and amendment related to agent deferred compensation plan | (13.4 | ) | 6.3 | (13.4 | ) | (12.0 | ) | ||||||||
| Loss on reinsurance transaction | — | (75.4 | ) | — | (75.4 | ) | |||||||||
| Loss before income taxes | $ | (43.9 | ) | $ | (75.4 | ) | $ | (89.8 | ) | $ | (145.4 | ) | |||
85
CNO FINANCIAL GROUP, INC. AND SUBSIDIARIES
___________________
| Three months ended | Nine months ended | ||||||||||||||
| September 30, | September 30, | ||||||||||||||
| 2017 | 2016 | 2017 | 2016 | ||||||||||||
| First year: | |||||||||||||||
| Bankers Life | $ | 288.2 | $ | 304.8 | $ | 919.2 | $ | 869.7 | |||||||
| Washington National | 18.9 | 19.0 | 59.1 | 58.9 | |||||||||||
| Colonial Penn | 12.1 | 13.8 | 38.5 | 41.6 | |||||||||||
| Total first year | 319.2 | 337.6 | 1,016.8 | 970.2 | |||||||||||
| Renewal: | |||||||||||||||
| Bankers Life | 353.5 | 361.1 | 1,090.9 | 1,085.1 | |||||||||||
| Washington National | 145.3 | 144.4 | 445.7 | 435.2 | |||||||||||
| Colonial Penn | 60.5 | 56.9 | 181.1 | 168.8 | |||||||||||
| Long-term care in run-off | 3.9 | — | 12.9 | — | |||||||||||
| Total renewal | 563.2 | 562.4 | 1,730.6 | 1,689.1 | |||||||||||
| Total premiums collected | $ | 882.4 | $ | 900.0 | $ | 2,747.4 | $ | 2,659.3 | |||||||
| Three months ended | Nine months ended | ||||||||||||||
| September 30, | September 30, | ||||||||||||||
| 2017 | 2016 | 2017 | 2016 | ||||||||||||
| Premiums collected by product: | |||||||||||||||
| Annuities: | |||||||||||||||
| Fixed index (first-year) | $ | 222.6 | $ | 218.1 | $ | 705.1 | $ | 597.6 | |||||||
| Other fixed interest (first-year) | 12.9 | 25.4 | 48.6 | 82.8 | |||||||||||
| Other fixed interest (renewal) | 1.0 | 1.6 | 4.6 | 4.7 | |||||||||||
| Subtotal - other fixed interest annuities | 13.9 | 27.0 | 53.2 | 87.5 | |||||||||||
| Total annuities | 236.5 | 245.1 | 758.3 | 685.1 | |||||||||||
| Health: | |||||||||||||||
| Medicare supplement (first-year) | 16.8 | 18.8 | 51.9 | 56.3 | |||||||||||
| Medicare supplement (renewal) | 160.4 | 163.4 | 496.7 | 491.8 | |||||||||||
| Subtotal - Medicare supplement | 177.2 | 182.2 | 548.6 | 548.1 | |||||||||||
| Long-term care (first-year) | 3.8 | 4.4 | 12.1 | 13.2 | |||||||||||
| Long-term care (renewal) | 103.5 | 111.9 | 324.3 | 340.7 | |||||||||||
| Subtotal - long-term care | 107.3 | 116.3 | 336.4 | 353.9 | |||||||||||
| Supplemental health (first-year) | 1.1 | 1.4 | 3.8 | 4.1 | |||||||||||
| Supplemental health (renewal) | 4.4 | 4.0 | 13.0 | 11.6 | |||||||||||
| Subtotal – supplemental health | 5.5 | 5.4 | 16.8 | 15.7 | |||||||||||
| Other health (first-year) | .2 | — | .6 | — | |||||||||||
| Other health (renewal) | 1.3 | 1.5 | 4.0 | 4.7 | |||||||||||
| Subtotal - other health | 1.5 | 1.5 | 4.6 | 4.7 | |||||||||||
| Total health | 291.5 | 305.4 | 906.4 | 922.4 | |||||||||||
| Life insurance: | |||||||||||||||
| Traditional (first-year) | 19.8 | 18.8 | 62.1 | 61.8 | |||||||||||
| Traditional (renewal) | 53.9 | 52.3 | 162.3 | 154.5 | |||||||||||
| Subtotal - traditional | 73.7 | 71.1 | 224.4 | 216.3 | |||||||||||
| Interest-sensitive (first-year) | 11.0 | 17.9 | 35.0 | 53.9 | |||||||||||
| Interest-sensitive (renewal) | 29.0 | 26.4 | 86.0 | 77.1 | |||||||||||
| Subtotal - interest-sensitive | 40.0 | 44.3 | 121.0 | 131.0 | |||||||||||
| Total life insurance | 113.7 | 115.4 | 345.4 | 347.3 | |||||||||||
| Collections on insurance products: | |||||||||||||||
| Total first-year premium collections on insurance products | 288.2 | 304.8 | 919.2 | 869.7 | |||||||||||
| Total renewal premium collections on insurance products | 353.5 | 361.1 | 1,090.9 | 1,085.1 | |||||||||||
| Total collections on insurance products | $ | 641.7 | $ | 665.9 | $ | 2,010.1 | $ | 1,954.8 | |||||||
| Three months ended | Nine months ended | ||||||||||||||
| September 30, | September 30, | ||||||||||||||
| 2017 | 2016 | 2017 | 2016 | ||||||||||||
| Premiums collected by product: | |||||||||||||||
| Health: | |||||||||||||||
| Medicare supplement (renewal) | $ | 11.7 | $ | 14.6 | $ | 38.7 | $ | 46.1 | |||||||
| Supplemental health (first-year) | 17.8 | 17.7 | 55.2 | 54.5 | |||||||||||
| Supplemental health (renewal) | 127.0 | 123.3 | 386.7 | 369.4 | |||||||||||
| Subtotal – supplemental health | 144.8 | 141.0 | 441.9 | 423.9 | |||||||||||
| Other health (first-year) | .1 | .1 | .2 | .2 | |||||||||||
| Other health (renewal) | .3 | .4 | 1.1 | 1.2 | |||||||||||
| Subtotal - other health | .4 | .5 | 1.3 | 1.4 | |||||||||||
| Total health | 156.9 | 156.1 | 481.9 | 471.4 | |||||||||||
| Life insurance: | |||||||||||||||
| Traditional (first-year) | .1 | .2 | .5 | .6 | |||||||||||
| Traditional (renewal) | 2.5 | 2.6 | 7.7 | 8.0 | |||||||||||
| Subtotal - traditional | 2.6 | 2.8 | 8.2 | 8.6 | |||||||||||
| Interest-sensitive (first-year) | .9 | 1.0 | 3.2 | 3.6 | |||||||||||
| Interest-sensitive (renewal) | 3.6 | 3.3 | 10.9 | 9.5 | |||||||||||
| Subtotal - interest-sensitive | 4.5 | 4.3 | 14.1 | 13.1 | |||||||||||
| Total life insurance | 7.1 | 7.1 | 22.3 | 21.7 | |||||||||||
| Annuities: | |||||||||||||||
| Fixed index (renewal) | .1 | .2 | .4 | .8 | |||||||||||
| Other fixed interest (renewal) | .1 | — | .2 | .2 | |||||||||||
| Total annuities | .2 | .2 | .6 | 1.0 | |||||||||||
| Collections on insurance products: | |||||||||||||||
| Total first-year premium collections on insurance products | 18.9 | 19.0 | 59.1 | 58.9 | |||||||||||
| Total renewal premium collections on insurance products | 145.3 | 144.4 | 445.7 | 435.2 | |||||||||||
| Total collections on insurance products | $ | 164.2 | $ | 163.4 | $ | 504.8 | $ | 494.1 | |||||||
| Three months ended | Nine months ended | ||||||||||||||
| September 30, | September 30, | ||||||||||||||
| 2017 | 2016 | 2017 | 2016 | ||||||||||||
| Premiums collected by product: | |||||||||||||||
| Life insurance: | |||||||||||||||
| Traditional (first-year) | $ | 12.1 | $ | 13.8 | $ | 38.5 | $ | 41.6 | |||||||
| Traditional (renewal) | 60.0 | 56.2 | 179.4 | 166.7 | |||||||||||
| Subtotal - traditional | 72.1 | 70.0 | 217.9 | 208.3 | |||||||||||
| Interest-sensitive (all renewal) | .1 | .1 | .2 | .3 | |||||||||||
| Total life insurance | 72.2 | 70.1 | 218.1 | 208.6 | |||||||||||
| Health (all renewal): | |||||||||||||||
| Medicare supplement | .4 | .6 | 1.4 | 1.7 | |||||||||||
| Other health | — | — | .1 | .1 | |||||||||||
| Total health | .4 | .6 | 1.5 | 1.8 | |||||||||||
| Collections on insurance products: | |||||||||||||||
| Total first-year premium collections on insurance products | 12.1 | 13.8 | 38.5 | 41.6 | |||||||||||
| Total renewal premium collections on insurance products | 60.5 | 56.9 | 181.1 | 168.8 | |||||||||||
| Total collections on insurance products | $ | 72.6 | $ | 70.7 | $ | 219.6 | $ | 210.4 | |||||||
| Three months ended | Nine months ended | ||||||
| September 30, 2017 | September 30, 2017 | ||||||
| Premiums collected by product: | |||||||
| Health: | |||||||
| Long-term care (renewal) | $ | 3.9 | $ | 12.9 | |||
LIQUIDITY AND CAPITAL RESOURCES
2023 Outlook
Prior to the sharp rise in interest rates in the United States in 2022, interest rates had been at or near historically low levels. We expect that a continued level of higher interest rates will benefit our operating results over time. We continuously monitor current market conditions and the impact to our business from potential changes in overall economic growth. We are also subject to financial impacts associated with changes in the equity markets and the credit cycle.
We are in the process of seeking approval for the formation of a wholly-owned Bermuda captive reinsurance company for the purpose of ceding a portion of our inforce fixed indexed annuity business and all of the new fixed indexed annuity business written after the inception of the reinsurance agreement. This arrangement would allow us to increase the capital efficiency of the business while retaining all of the economic benefits of the block. In addition, it would allow us to realize the same benefits as a number of peer companies who have adopted similar arrangements. We do not anticipate assuming any unaffiliated business or seeking any third party capital for our wholly-owned Bermuda captive reinsurance company. Under our current plan, if approved by our regulators, we would expect to initiate a reinsurance treaty in the third quarter of 2023. We also currently expect excess cash flow to the holding company to increase in the range of $150 million to $200 million at the inception of the initial treaty. The deployment of such excess capital will be consistent with our historical approach (see "-Liquidity of the Holding Companies" below).
For 2023, we continue to expect operating earnings per diluted share to be in the range of $2.80 to $3.00, excluding any significant items in the year.
With respect to excess cash flow in 2023, we continue to expect cash flow to the holding company to be in the range of $170 million to $200 million, excluding any potential impact from the reinsurance transaction discussed above.
86
CNO FINANCIAL GROUP, INC. AND SUBSIDIARIES
___________________
Our capital structure as of September 30, 2017March 31, 2023 and December 31, 20162022 was as follows (dollars in millions):
| March 31, 2023 | December 31, 2022 | ||||||||||
| Total capital: | |||||||||||
| Corporate notes payable | $ | 1,139.2 | $ | 1,138.8 | |||||||
| Shareholders’ equity: | |||||||||||
| Common stock | 1.1 | 1.1 | |||||||||
| Additional paid-in capital | 2,021.1 | 2,033.8 | |||||||||
| Accumulated other comprehensive loss | (1,664.4) | (1,957.3) | |||||||||
| Retained earnings | 1,674.0 | 1,691.2 | |||||||||
| Total shareholders’ equity | 2,031.8 | 1,768.8 | |||||||||
| Total capital | $ | 3,171.0 | $ | 2,907.6 | |||||||
| September 30, 2017 | December 31, 2016 | ||||||
| Total capital: | |||||||
| Corporate notes payable | $ | 914.4 | $ | 912.9 | |||
| Shareholders’ equity: | |||||||
| Common stock | 1.7 | 1.7 | |||||
| Additional paid-in capital | 3,094.5 | 3,212.1 | |||||
| Accumulated other comprehensive income | 933.6 | 622.4 | |||||
| Retained earnings | 851.9 | 650.7 | |||||
| Total shareholders’ equity | 4,881.7 | 4,486.9 | |||||
| Total capital | $ | 5,796.1 | $ | 5,399.8 | |||
The following table summarizes certain financial ratios as of and for the ninethree months ended September 30, 2017March 31, 2023 and as of and for the year ended December 31, 2016:2022:
| September 30, 2017 | December 31, 2016 | March 31, 2023 | December 31, 2022 | |||||||||||||||
| Book value per common share | $ | 29.10 | $ | 25.82 | Book value per common share | $ | 17.68 | $ | 15.47 | |||||||||
| Book value per common share, excluding accumulated other comprehensive income (a) | 23.53 | 22.24 | ||||||||||||||||
| Ratio of earnings to fixed charges | 2.92X | 2.43X | ||||||||||||||||
| Book value per common share, excluding accumulated other comprehensive income (loss) (a) | Book value per common share, excluding accumulated other comprehensive income (loss) (a) | 32.17 | 32.59 | |||||||||||||||
| Debt to total capital ratios: | Debt to total capital ratios: | |||||||||||||||||
| Corporate debt to total capital | 15.8 | % | 16.9 | % | Corporate debt to total capital | 35.9 | % | 39.2 | % | |||||||||
| Corporate debt to total capital, excluding accumulated other comprehensive income (a) | 18.8 | % | 19.1 | % | ||||||||||||||
| Corporate debt to total capital, excluding accumulated other comprehensive income (loss) (a) (b) | Corporate debt to total capital, excluding accumulated other comprehensive income (loss) (a) (b) | 23.6 | % | 23.4 | % | |||||||||||||
_____________________
(a)This non-GAAP measure differs from the corresponding GAAP measure presented immediately above, because accumulated other comprehensive income (loss) has been excluded from the value of capital used to determine this measure. Management believes this non-GAAP measure is useful because it removes the volatility that arises from changes in accumulated other comprehensive income (loss). Such volatility is often caused by changes in the |
(b)Our targeted corporate debt to include additional investments for which we estimated the fair value to be approximately $63 million as of September 30, 2016.
| Investments not included in scope of audit | ||||||||||||||||
| Investments included in initial scope of audit | Investments included in additional scope of audit | Cash, fixed maturities and other invested assets | Total investments | |||||||||||||
| September 30, 2016 values | $ | 62.2 | $ | 62.6 | $ | 379.8 | $ | 504.6 | ||||||||
| Net cash flows (1) | (13.5 | ) | (11.6 | ) | (359.5 | ) | (384.6 | ) | ||||||||
| Realized gains (losses) and impairments (2) | .4 | (1.7 | ) | (4.0 | ) | (5.3 | ) | |||||||||
| Other activity (6) | 3.9 | 1.9 | .6 | 6.4 | ||||||||||||
| December 31, 2016 values | 53.0 | 51.2 | 16.9 | 121.1 | ||||||||||||
| Net cash flows (1) | (16.7 | ) | (5.5 | ) | (8.7 | ) | (30.9 | ) | ||||||||
| Realized gains (losses) and impairments (3) | 3.2 | (4.5 | ) | 1.0 | (.3 | ) | ||||||||||
| Other activity (6) | (1.8 | ) | 1.3 | (1.4 | ) | (1.9 | ) | |||||||||
| March 31, 2017 values | 37.7 | 42.5 | 7.8 | 88.0 | ||||||||||||
| Net cash flows (1) | .5 | (14.4 | ) | — | (13.9 | ) | ||||||||||
| Realized gains (losses) and impairments (4) | (3.1 | ) | 4.5 | — | 1.4 | |||||||||||
| Other activity (6) | (.6 | ) | (.4 | ) | .3 | (.7 | ) | |||||||||
| June 30, 2017 values | 34.5 | 32.2 | 8.1 | 74.8 | ||||||||||||
| Net cash flows (1) | (33.5 | ) | (9.1 | ) | (1.3 | ) | (43.9 | ) | ||||||||
| Realized gains (losses) and impairments (5) | 7.0 | (.6 | ) | .3 | 6.7 | |||||||||||
| Other activity (6) | (.9 | ) | (.3 | ) | (3.0 | ) | (4.2 | ) | ||||||||
| September 30, 2017 values | $ | 7.1 | $ | 22.2 | $ | 4.1 | $ | 33.4 | ||||||||
| Investments included in initial scope of audit | Investments included in additional scope of audit | Total investments included in the scope of audit | ||||||||||
| Lease related investments | $ | — | $ | 11.1 | $ | 11.1 | ||||||
| Mortgage loans secured by real estate | — | 10.6 | 10.6 | |||||||||
| Senior secured loans to companies in the energy sector (7) | 2.1 | — | 2.1 | |||||||||
| Senior secured loans to other companies | — | .5 | .5 | |||||||||
| Secured term loan issued by Platinum Partners Credit Opportunity Master Fund L.P. | 5.0 | — | 5.0 | |||||||||
| Total investments | $ | 7.1 | $ | 22.2 | $ | 29.3 | ||||||
Liquidity for Insurance Operations
Our insurance companies generally receive adequate cash flows from premium collections and investment income to meet their obligations. Life insurance, long-term care and supplemental health insurance and annuity liabilities are generally long-term in nature. Life and annuity policyholders may, however, withdraw funds or surrender their policies, subject to any applicable penalty provisions; there are generally no withdrawal or surrender benefits for long-term care insurance. We actively manage the relationship between the duration of our invested assets and the estimated duration of benefit payments arising from contract liabilities.
Three of the Company's insurance subsidiaries (Washington(Bankers Life, Washington National Bankers Life and Colonial Penn) are members of the FHLB. As members of the FHLB, our insurance subsidiaries have the ability to borrow on a collateralized basis from the FHLB. We are required to hold certain minimum amounts of FHLB common stock as a condition of membership in the FHLB, and additional amounts based on the amount of the borrowings. At September 30, 2017,March 31, 2023, the carrying value of the FHLB common stock was $71.2 million.$79.6 million. As of September 30, 2017,March 31, 2023, collateralized borrowings from the FHLB totaled $1.6$1.8 billion and the proceeds were used to purchase matched variable rate fixed maturity securities. The borrowings are classified as investment borrowings in the accompanying consolidated balance sheet. The borrowings are collateralized by investments with an estimated fair value of $2.0$2.4 billion at September 30, 2017,March 31, 2023, which are maintained in custodial accounts for the benefit of the FHLB.
87
CNO FINANCIAL GROUP, INC. AND SUBSIDIARIES
___________________
| Amount | Maturity | Interest rate at | ||||
| borrowed | date | September 30, 2017 | ||||
| $ | 50.0 | February 2018 | Variable rate – 1.404% | |||
| 50.0 | August 2018 | Variable rate – 1.435% | ||||
| 50.0 | January 2019 | Variable rate – 1.724% | ||||
| 50.0 | February 2019 | Variable rate – 1.404% | ||||
| 100.0 | March 2019 | Variable rate – 1.714% | ||||
| 21.8 | July 2019 | Variable rate – 1.727% | ||||
| 15.0 | October 2019 | Variable rate – 1.830% | ||||
| 50.0 | May 2020 | Variable rate – 1.754% | ||||
| 21.8 | June 2020 | Fixed rate – 1.960% | ||||
| 25.0 | September 2020 | Variable rate – 1.953% | ||||
| 100.0 | September 2020 | Variable rate – 1.897% | ||||
| 50.0 | September 2020 | Variable rate – 1.894% | ||||
| 75.0 | September 2020 | Variable rate – 1.453% | ||||
| 100.0 | October 2020 | Variable rate – 1.409% | ||||
| 50.0 | December 2020 | Variable rate – 1.932% | ||||
| 100.0 | July 2021 | Variable rate – 1.854% | ||||
| 100.0 | July 2021 | Variable rate – 1.824% | ||||
| 28.2 | August 2021 | Fixed rate – 2.550% | ||||
| 57.7 | August 2021 | Variable rate - 1.842% | ||||
| 125.0 | August 2021 | Variable rate – 1.717% | ||||
| 50.0 | September 2021 | Variable rate – 1.857% | ||||
| 22.0 | May 2022 | Variable rate – 1.668% | ||||
| 100.0 | May 2022 | Variable rate – 1.666% | ||||
| 10.0 | June 2022 | Variable rate – 1.931% | ||||
| 50.0 | July 2022 | Variable rate – 1.675% | ||||
| 50.0 | July 2022 | Variable rate – 1.693% | ||||
| 50.0 | July 2022 | Variable rate – 1.694% | ||||
| 50.0 | August 2022 | Variable rate – 1.702% | ||||
| 24.9 | March 2023 | Fixed rate – 2.160% | ||||
| 20.5 | June 2025 | Fixed rate – 2.940% | ||||
| $ | 1,646.9 | |||||
State laws generally give state insurance regulatory agencies broad authority to protect policyholders in their jurisdictions. Regulators have used this authority in the past to restrict the ability of our insurance subsidiaries to pay any dividends or other amounts without prior approval. We cannot be assured that the regulators will not seek to assert greater supervision and control over our insurance subsidiaries' businesses and financial affairs.
Our estimated consolidated statutory RBC ratio was 380 percent at March 31, 2023, compared to 384 percent at December 31, 2022. In the first three months of 450 percent at September 30, 2017, reflects2023, the RBC ratio reflected our estimated consolidated statutory operating earnings of $257$38 million and insurance company dividends of $34.2 million that were paid to the holding companycompany. Our RBC ratio at March 31, 2023, exceeded our targeted statutory RBC ratio of $286.8 million during375 percent and the first nine months of 2017. Statutory earnings will often fluctuate on a quarterly basis dueminimum 350 percent that is reflected in our risk appetite statement that we share and discuss with rating agencies and insurance regulators. We believe that the 375 percent RBC ratio target continues to the application of statutory accounting principles.adequately support our financial strength and credit ratings.
Our insurance subsidiaries transfer exposure to certain risk to others through reinsurance arrangements. When we obtain reinsurance, we are still liable for those transferred risks in the event the reinsurer defaults on its obligations. The failure, insolvency, inability or unwillingness of one or more of the Company's reinsurers to perform in accordance with the terms of its reinsurance agreement could negatively impact our earnings or financial position and our consolidated statutory RBC ratio.
Financial Strength Ratings of our Insurance Subsidiaries
Financial strength ratings provided by AM Best Company ("AM Best"), Fitch Ratings ("Fitch"), Moody's Investor Services, Inc. ("Moody's") and S&P A.M. Best and Moody's are the rating agency's opinions of the ability of our insurance subsidiaries to pay policyholder claims and obligations when due.
On August 15, 2017,February 1, 2023, AM Best affirmed its "A" financial strength ratings of our primary insurance subsidiaries and the outlook for these ratings is stable. The "A" rating is assigned to companies that have an excellent ability, in AM Best's opinion, to meet their ongoing obligations to policyholders. AM Best ratings for the industry currently range from "A++ (Superior)" to "F (In Liquidation)" and some companies are not rated. An "A++" rating indicates a superior ability to meet ongoing obligations to policyholders. AM Best has sixteen possible ratings. There are two ratings above the "A" rating of our primary insurance subsidiaries and thirteen ratings that are below that rating.
On November 21, 2022, Fitch affirmed its "BBB+"A-" financial strength ratings of our primary insurance subsidiaries. Thesubsidiaries and revised the outlook for these ratings isto positive from stable. A "BBB" rating,An insurer rated "A", in Fitch's opinion, indicates that there is currently a low expectation of ceased or interrupted payments. Thepayments and indicates strong capacity to meet policyholder and contract obligations on a timely basis is considered adequate, but adverseobligations. This capacity may, nonetheless, be more vulnerable to changes in circumstances andor in economic conditions are more likely to impact this capacity.than is the case for higher ratings. Fitch ratings for the industry range from "AAA Exceptionally Strong" to "C Distressed" and some companies are not rated. Pluses and minuses show the relative standing within a category. Fitch has nineteen possible ratings. There are seven ratings above the "BBB+" rating of our primary insurance subsidiaries and eleven ratings that are below that rating.
S&P most recently reviewed its "A-" financial strength ratings of our primary insurance subsidiaries on July 15, 2022. The outlook for these ratings is stable. S&P financial strength ratings range from "AAA" to "R" and some companies are not rated. An insurer rated "A", in S&P's opinion, has strong financial security characteristics, but is somewhat more likely to be affected by adverse business conditions than are insurers with higher ratings. Pluses and minuses show the relative standing within a category. S&P has twenty-one possible ratings. There are six ratings above the "A-" rating of our primary insurance subsidiaries and fourteen ratings that are below that rating.
Rating agencies have increased the frequency and scope of their credit reviews and requested additional information from the companies that they rate, including us. They may also adjust upward the capital and other requirements employed in the
88
CNO FINANCIAL GROUP, INC. AND SUBSIDIARIES
___________________
their rating agency models for maintenance of certain ratings levels. We cannot predict what actions rating agencies may take, or what actions we may take in response. Accordingly, downgrades and outlook revisions related to us or the life insurance industry may occur in the future at any time and without notice by any rating agency. These could increase policy surrenders and withdrawals, adversely affect relationships with our distribution channels, reduce new sales, reduce our ability to borrow and increase our future borrowing costs.
Liquidity of the Holding Companies
Availability and Sources and Uses of Holding Company Liquidity; Limitations on Ability of Insurance Subsidiaries to Make Dividend and Surplus Debenture Interest Payments to the Holding Companies; Limitations on Holding Company Activities
At September 30, 2017,March 31, 2023, CNO, CDOC, Inc. ("CDOC", our wholly owned subsidiary and the immediate parent of Washington National and Conseco Life Insurance Company of Texas ("CLTX")) and our other non-insurance subsidiaries held:held $157.5 million of cash and investments which was comprised of: (i) unrestricted cash and cash equivalents of $180.5$150.3 million; and (ii) exchange-traded funds that invest in fixed income investments of $96.1 million; and (iii) equity securities of $103.2$7.2 million. Our holding company liquidity of $157.5 million was above our minimum target level of $150 million.
CNO and CDOC are holding companies with no business operations of their own; they depend on their operating subsidiaries for cash to make principal and interest payments on debt, and to pay administrative expenses and income taxes. CNO and CDOC receive cash from insurance subsidiaries, consisting of dividends and distributions, interest payments on surplus debentures and tax-sharing payments, as well as cash from non-insurance subsidiaries consisting of dividends, distributions, loans and advances. The principal non-insurance subsidiaries that provide cash to CNO and CDOC are 40|86 Advisors, Inc. ("40|86 Advisors"), which receives fees from the insurance subsidiaries for investment services, and CNO Services, LLC which receives fees from the insurance subsidiaries for providing administrative services. The agreements between our insurance subsidiaries and CNO Services, LLC and 40|86 Advisors, Inc., respectively, were previously approved by the domestic insurance regulator for each insurance company, and any payments thereunder do not require further regulatory approval.
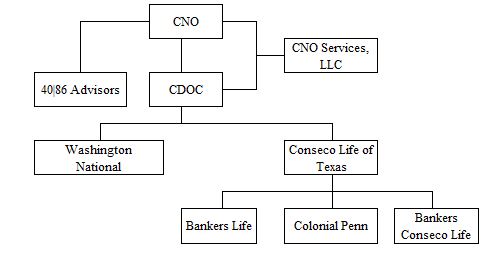
The ability of our insurance subsidiaries to pay dividends is subject to state insurance department regulations and is based on the financial statements of our insurance subsidiaries prepared in accordance with statutory accounting practices prescribed or permitted by regulatory authorities, which differ from GAAP. These regulations generally permit dividends to be paid from statutory earned surplus of the insurance company without regulatory approval for any 12-month period in amounts equal to the greater of (or in some states, the lesser of): (i) statutory net gain from operations or net income for the prior year; or (ii) 10 percent of statutory capital and surplus as of the end of the preceding year. However, as each of the immediate insurance subsidiaries of CDOC has significant negative earned surplus, any dividend payments from the insurance subsidiaries require the prior approval of the director or commissioner of the applicable state insurance department. In the first ninethree months of 2017,2023, our insurance subsidiaries paid dividends to CDOC totaling $286.8$34.2 million. We expect to receive regulatory approval for future dividends from our subsidiaries, but there can be no assurance that such payments will be approved or that the financial condition of our insurance subsidiaries will not change, making future approvals less likely.
CDOC holds surplus debentures from CLTX with an aggregate principal amount of $749.6 million. Interest payments on those surplus debentures do not require additional approval provided the RBC ratio of CLTX exceeds 100 percent (but do require prior written notice to the Texas state insurance department)Department of Insurance). The estimated RBC ratio of CLTX was 390334 percent at September 30, 2017.March 31, 2023. CDOC also holds a surplus debenture from Colonial Penn with a principal balance of $160.0 million. Interest payments on that surplus debenture require prior approval by the Pennsylvania state insurance department.Insurance Department. Dividends and other payments from our non-insurance subsidiaries, including 40|86 Advisors, Inc. and CNO Services, LLC, to CNO or CDOC do not require approval by any regulatory authority or other third party. However, insurance regulators may prohibit payments
by our insurance subsidiaries to parent companies if they determine that such payments could be adverse to our policyholders or contractholders.
89
CNO FINANCIAL GROUP, INC. AND SUBSIDIARIES
___________________
The insurance subsidiaries of CDOC receive funds to pay dividends primarily from: (i) the earnings of their direct businesses; (ii) tax sharing payments received from subsidiaries (if applicable); and (iii) with respect to CLTX, dividends received from subsidiaries. At September 30, 2017,March 31, 2023, the subsidiaries of CLTX had earned surplus (deficit) as summarized below (dollars in millions):
| Subsidiaries of CLTX | Earned surplus (deficit) | Additional information | ||||
| Bankers Life | $ | 567.4 | (a) | |||
| Colonial Penn | (306.8 | ) | (b) | |||
| Earned surplus (deficit) | Additional information | |||||||||||||
| Bankers Life | ||||||||||||||
| $ | 344.4 | (a) | ||||||||||||
| (472.9) | (b) | |||||||||||||
____________________
(a)Bankers Life paid dividends of $55.0 million to CLTX in the first three months of 2023. Bankers Life may pay dividends without regulatory approval or prior notice for any 12-month period if such dividends are less than the greater of: (i) statutory net income for the prior year; or (ii) 10 percent of statutory capital and surplus as of the end of the preceding year. Dividends in excess of these levels require 30 days prior notice.
(b)The deficit is primarily due to transactions which occurred several years ago, including a tax planning transaction and the fee paid to recapture a block of business previously ceded to an unaffiliated insurer.
A significant deterioration in the financial condition, earnings or cash flow of the material subsidiaries of CNO or CDOC for any reason could hinder such subsidiaries' ability to pay cash dividends or other disbursements to CNO and/or CDOC, which, in turn, could limit CNO's ability to meet debt service requirements and satisfy other financial obligations. In addition, we may choose to retain capital in our insurance subsidiaries or to contribute additional capital to our insurance subsidiaries to maintain or strengthen their surplus or fund reinsurance transactions, and these decisions could limit the amount available at our top tier insurance subsidiaries to pay dividends to the holding companies.
Free cash flow is a measure of holding company liquidity and is calculated as: (i) dividends, management fees and surplus debenture interest payments received from $150.0 million to $250.0 million, increases the aggregate amount of additional incremental loans the Company may incur from $50.0 million to $100.0 millionour subsidiaries; plus (ii) earnings on corporate investments; less (iii) interest expense, corporate expenses and extends the maturity date of the revolving credit facility from May 19, 2019 to the earlier of October 13, 2022 and the date that is six months prior to the maturity date of the Company’s 4.50% senior notes due 2020, which is November 30, 2019. The amount drawn under the Amended Credit Agreement continues to be $100.0 million.
net tax payments. In the first ninethree months of 2017,2023, we repurchased 6.7generated $22 million shares of such free cash flow. The Company expects to deploy its free cash flow into investments to accelerate profitable growth, common stock for $140.1 million under our securities repurchase program. In May 2017, the Company announced that its Board of Directors approved an additional $300.0 million to repurchase the Company's outstanding common stock. The Company has remaining repurchase authority of $412.6 million as of September 30, 2017. We currently anticipate repurchasing a total of approximately $175 million to $225 million of our common stock during 2017.dividends and share repurchases. The amount and timing of the securitiesfuture share repurchases (if any) will be based on business and market conditions and other factors including, but not limited to, available free cash flow, the current price of our common stock opportunitiesand investment opportunities. In the first three months of 2023, we repurchased 0.6 million shares of common stock for $15.1 million under our securities repurchase program. The Company had remaining repurchase authority of $171.8 million as of March 31, 2023. In May 2023, the Company's Board of Directors approved an additional $500.0 million to invest in our business, acquisition transactions or ceding commissions related to reinsurance transactions.repurchase the Company's outstanding shares of common stock.
In the first ninethree months of 2017,2023, dividends declared on common stock totaled $44.7$16.4 million ($0.260.14 per common share). In May 2017,2023, the Company increased its quarterly common stock dividend to $0.09$0.15 per share from $0.08$0.14 per share.
On August 15, 2017, FitchFebruary 1, 2023, AM Best affirmed its “BB+”"bbb" rating on our issuer credit and senior unsecured debt. Thedebt and the outlook for these ratings is stable. In AM Best's view, a company rated "bbb" has an adequate ability to meet the terms of its obligations; however, the issuer is more susceptible to changes in economic or other conditions. Pluses and minuses show the relative standing within a category. AM Best has a total of 22 possible ratings ranging from "aaa (Exceptional)" to "d (In default)". There are eight ratings above CNO's "bbb" rating and thirteen ratings that are below its rating.
On November 21, 2022, Fitch affirmed its "BBB-" rating on our senior unsecured debt. Fitch also affirmed CNO's long term issue default rating of "BBB" and revised the outlook for this rating to positive from stable. In Fitch's view, an obligation rated "BB""BBB" indicates an elevated vulnerability tothat expectations of default risk particularly in the eventare currently low. The capacity for payment of financial commitments is considered adequate but adverse changes in business or economic conditions over time; however, business or financial flexibility exists which supports the servicing of financial commitments.are more likely to impair this capacity. Pluses and minuses show the relative standing within a category. Fitch has a total of 21 possible ratings ranging from "AAA" to "D". There are tennine ratings above CNO's "BB+"BBB-" rating and teneleven ratings that are below its rating.
90
CNO FINANCIAL GROUP, INC. AND SUBSIDIARIES
___________________
Moody's most recently reviewed its "Baa3" rating on our issuer credit andsenior unsecured debt ratings of "BB+" and revised theon May 5, 2022. The outlook for these ratings remains stable. In Moody's view, obligations rated "Baa" are subject to stablemoderate credit risk and may possess certain speculative characteristics. A rating is supplemented with numerical modifiers "1", "2" or "3" to show the relative standing within a category. Moody's has a total of 21 possible ratings ranging from negative."Aaa" to "C". There are nine ratings above CNO's "Baa3" rating and eleven ratings that are below its rating.
S&P most recently reviewed its "BBB-" rating on our senior unsecured debt on July 15, 2022. The outlook for these ratings is stable. In S&P's view, an obligation rated "BB" is less vulnerable to nonpayment than other speculative issues; however, it faces major ongoing uncertainties or exposure to"BBB" exhibits adequate protection parameters. However, adverse business, financial or economic conditions which couldor changing circumstances are more likely to lead to a weakened capacity of the obligor's inadequate capacityobligor to meet its financial commitment on the obligation. Pluses and minuses show the relative standing within a category. S&P has a total of 22 possible ratings ranging from "AAA (Extremely Strong)" to "D (Payment Default)". There are ten ratings above CNO's "BB+" rating and eleven ratings that are below its rating.
We believe that the existing cash available to the holding company, the cash flows to be generated from operations and other transactions will be sufficient to allow us to meet our debt service obligations, pay corporate expenses and satisfy other financial obligations. However, our cash flow is affected by a variety of factors, many of which are outside of our control, including insurance regulatory issues, competition, financial markets and other general business conditions. We cannot provide assurance that we will possess sufficient income and liquidity to meet all of our debt service requirements and other holding company obligations.
91
CNO FINANCIAL GROUP, INC. AND SUBSIDIARIES
___________________
INVESTMENTS
At September 30, 2017,March 31, 2023, the amortized cost, gross unrealized gains, andgross unrealized losses, allowance for credit losses and estimated fair value of fixed maturities, available for sale, were as follows (dollars in millions):
Amortized cost | Gross unrealized gains | Gross unrealized losses | Estimated fair value | Amortized cost | Gross unrealized gains | Gross unrealized losses | Allowance for credit losses | Estimated fair value | ||||||||||||||||||||||||||||||||||||
| Investment grade (a): | Investment grade (a): | |||||||||||||||||||||||||||||||||||||||||||
| Corporate securities | $ | 12,356.1 | $ | 1,509.8 | $ | (20.3 | ) | $ | 13,845.6 | Corporate securities | $ | 12,874.0 | $ | 63.9 | $ | (1,476.3) | $ | (36.6) | $ | 11,425.0 | ||||||||||||||||||||||||
| United States Treasury securities and obligations of United States government corporations and agencies | 145.4 | 26.9 | — | 172.3 | United States Treasury securities and obligations of United States government corporations and agencies | 174.7 | .1 | (4.7) | — | 170.1 | ||||||||||||||||||||||||||||||||||
| States and political subdivisions | 1,854.2 | 220.7 | (.6 | ) | 2,074.3 | States and political subdivisions | 2,778.8 | 34.1 | (359.5) | (.7) | 2,452.7 | |||||||||||||||||||||||||||||||||
| Debt securities issued by foreign governments | 58.1 | 3.1 | (.1 | ) | 61.1 | |||||||||||||||||||||||||||||||||||||||
| Foreign governments | Foreign governments | 88.8 | .2 | (9.9) | (.5) | 78.6 | ||||||||||||||||||||||||||||||||||||||
| Asset-backed securities | 1,203.2 | 43.8 | (1.9 | ) | 1,245.1 | Asset-backed securities | 1,335.6 | 2.4 | (101.0) | (.6) | 1,236.4 | |||||||||||||||||||||||||||||||||
| Collateralized debt obligations | 236.5 | 1.4 | — | 237.9 | ||||||||||||||||||||||||||||||||||||||||
| Agency residential mortgage-backed securities | Agency residential mortgage-backed securities | 213.3 | 2.8 | (.2) | — | 215.9 | ||||||||||||||||||||||||||||||||||||||
| Non-agency residential mortgage-backed securities | Non-agency residential mortgage-backed securities | 1,212.4 | 6.6 | (154.5) | — | 1,064.5 | ||||||||||||||||||||||||||||||||||||||
| Collateralized loan obligations | Collateralized loan obligations | 954.3 | .5 | (35.9) | — | 918.9 | ||||||||||||||||||||||||||||||||||||||
| Commercial mortgage-backed securities | 1,261.0 | 36.6 | (9.2 | ) | 1,288.4 | Commercial mortgage-backed securities | 2,480.1 | .1 | (242.6) | — | 2,237.6 | |||||||||||||||||||||||||||||||||
| Mortgage pass-through securities | 2.0 | .2 | — | 2.2 | ||||||||||||||||||||||||||||||||||||||||
| Collateralized mortgage obligations | 310.6 | 17.6 | (.5 | ) | 327.7 | |||||||||||||||||||||||||||||||||||||||
| Total investment grade fixed maturities, available for sale | 17,427.1 | 1,860.1 | (32.6 | ) | 19,254.6 | Total investment grade fixed maturities, available for sale | 22,112.0 | 110.7 | (2,384.6) | (38.4) | 19,799.7 | |||||||||||||||||||||||||||||||||
| Below-investment grade (a) (b): | Below-investment grade (a) (b): | |||||||||||||||||||||||||||||||||||||||||||
| Corporate securities | 789.3 | 27.8 | (12.7 | ) | 804.4 | Corporate securities | 623.0 | 2.4 | (53.4) | (20.6) | 551.4 | |||||||||||||||||||||||||||||||||
| States and political subdivisions | 3.0 | — | (.3 | ) | 2.7 | States and political subdivisions | 10.6 | — | (.6) | (.1) | 9.9 | |||||||||||||||||||||||||||||||||
| Asset-backed securities | 1,405.4 | 136.8 | (1.2 | ) | 1,541.0 | Asset-backed securities | 123.0 | — | (19.2) | — | 103.8 | |||||||||||||||||||||||||||||||||
| Non-agency residential mortgage-backed securities | Non-agency residential mortgage-backed securities | 565.8 | 30.6 | (20.4) | — | 576.0 | ||||||||||||||||||||||||||||||||||||||
| Commercial mortgage-backed securities | 50.6 | .8 | (.9 | ) | 50.5 | Commercial mortgage-backed securities | 83.5 | — | (17.2) | — | 66.3 | |||||||||||||||||||||||||||||||||
| Collateralized mortgage obligations | 417.1 | 59.7 | (.1 | ) | 476.7 | |||||||||||||||||||||||||||||||||||||||
| Total below-investment grade fixed maturities, available for sale | 2,665.4 | 225.1 | (15.2 | ) | 2,875.3 | Total below-investment grade fixed maturities, available for sale | 1,405.9 | 33.0 | (110.8) | (20.7) | 1,307.4 | |||||||||||||||||||||||||||||||||
| Total fixed maturities, available for sale | $ | 20,092.5 | $ | 2,085.2 | $ | (47.8 | ) | $ | 22,129.9 | Total fixed maturities, available for sale | $ | 23,517.9 | $ | 143.7 | $ | (2,495.4) | $ | (59.1) | $ | 21,107.1 | ||||||||||||||||||||||||
_______________
(a)Investment ratings are assigned the second lowest rating by Nationally Recognized Statistical Rating Organizations ("NRSROs") (Moody's, S&P or Fitch), or if not rated by such firms, the rating assigned by the National Association of Insurance Commissioners (the "NAIC"). NAIC designations of "1" or "2" include fixed maturities generally rated investment grade (rated "Baa3" or higher by Moody's or rated "BBB-" or higher by S&P and Fitch). NAIC designations of "3" through "6" are referred to as below-investment grade (which generally are rated "Ba1" or lower by Moody's or rated "BB+" or lower by S&P and Fitch). References to investment grade or below-investment grade throughout our consolidated financial statements are determined as described above. (b) Certain structured securities rated below-investment grade by NRSROs may be assigned a NAIC 1 or NAIC 2 designation based on the cost basis of the security relative to estimated recoverable amounts as determined by the NAIC. Refer to the table below for a summary of our fixed maturity securities, available for sale, by NAIC designations. |
92
CNO FINANCIAL GROUP, INC. AND SUBSIDIARIES
___________________
The NAIC evaluates the fixed maturity investments of insurers for regulatory and capital assessment purposes and assigns securities to one of six credit quality categories called NAIC designations, which are used by insurers when preparing their annual statements based on statutory accounting principles. The NAIC designations are generally similar to the credit quality designations of the NRSROs for marketable fixed maturity securities, except for certain structured securities. However, certain structured securities rated below investment grade by the NRSROs can be assigned NAIC 1 or NAIC 2 designations depending on the cost basis of the holding relative to estimated recoverable amounts as determined by the NAIC. The following summarizes the NAIC designations and NRSRO equivalent ratings:
| NAIC Designation | NRSRO Equivalent Rating | |||||||
| 1 | AAA/AA/A | |||||||
| 2 | BBB | |||||||
| 3 | BB | |||||||
| 4 | B | |||||||
| 5 | CCC and lower | |||||||
| 6 | In or near default | |||||||
A summary of our fixed maturity securities, available for sale, by NAIC designations (or for fixed maturity securities held by non-regulated entities, based on NRSRO ratings) as of September 30, 2017March 31, 2023 is as follows (dollars in millions):
| NAIC designation | Amortized cost | Estimated fair value | Percentage of total estimated fair value | |||||||||||||||||
| 1 | $ | 14,511.4 | $ | 13,048.5 | 61.8 | % | ||||||||||||||
| 2 | 8,225.1 | 7,378.1 | 35.0 | |||||||||||||||||
| Total NAIC 1 and 2 (investment grade) | 22,736.5 | 20,426.6 | 96.8 | |||||||||||||||||
| 3 | 585.9 | 524.8 | 2.5 | |||||||||||||||||
| 4 | 177.5 | 146.1 | .7 | |||||||||||||||||
| 5 | 17.0 | 9.6 | — | |||||||||||||||||
| 6 | 1.0 | — | — | |||||||||||||||||
| Total NAIC 3, 4, 5 and 6 (below-investment grade) | 781.4 | 680.5 | 3.2 | |||||||||||||||||
| Total | $ | 23,517.9 | $ | 21,107.1 | 100.0 | % | ||||||||||||||
93
| NAIC designation | Amortized cost | Estimated fair value | Percentage of total estimated fair value | ||||||||
| 1 | $ | 9,395.4 | $ | 10,440.6 | 47.2 | % | |||||
| 2 | 9,779.5 | 10,751.6 | 48.6 | ||||||||
| Total NAIC 1 and 2 (investment grade) | 19,174.9 | 21,192.2 | 95.8 | ||||||||
| 3 | 606.5 | 625.2 | 2.8 | ||||||||
| 4 | 249.3 | 252.1 | 1.1 | ||||||||
| 5 | 41.4 | 40.4 | .2 | ||||||||
| 6 | 20.4 | 20.0 | .1 | ||||||||
| Total NAIC 3, 4, 5 and 6 (below-investment grade) | 917.6 | 937.7 | 4.2 | ||||||||
| $ | 20,092.5 | $ | 22,129.9 | 100.0 | % | ||||||
CNO FINANCIAL GROUP, INC. AND SUBSIDIARIES
___________________
The following table summarizes the carrying values and gross unrealized losses of our fixed maturity securities, available for sale, by category as of September 30, 2017March 31, 2023 (dollars in millions):
| Carrying value | Percent of fixed maturities | Gross unrealized losses | Percent of gross unrealized losses | ||||||||||||||||||||
| States and political subdivisions | $ | 2,462.6 | 11.7 | % | $ | 360.1 | 14.4 | % | |||||||||||||||
| Commercial mortgage-backed securities | 2,303.9 | 10.9 | 259.8 | 10.4 | |||||||||||||||||||
| Banks | 1,832.6 | 8.7 | 230.1 | 9.2 | |||||||||||||||||||
| Non-agency residential mortgage-backed securities | 1,640.5 | 7.8 | 174.9 | 7.0 | |||||||||||||||||||
| Asset-backed securities | 1,340.2 | 6.3 | 120.2 | 4.8 | |||||||||||||||||||
| Insurance | 1,137.7 | 5.4 | 178.9 | 7.2 | |||||||||||||||||||
| Utilities | 1,129.3 | 5.3 | 143.6 | 5.8 | |||||||||||||||||||
| Healthcare/pharmaceuticals | 1,067.8 | 5.1 | 168.2 | 6.7 | |||||||||||||||||||
| Brokerage | 944.6 | 4.5 | 129.6 | 5.2 | |||||||||||||||||||
| Collateralized loan obligations | 918.9 | 4.4 | 35.9 | 1.4 | |||||||||||||||||||
| Technology | 810.4 | 3.8 | 126.4 | 5.1 | |||||||||||||||||||
| Food/beverage | 710.6 | 3.4 | 63.3 | 2.5 | |||||||||||||||||||
| Energy | 523.7 | 2.5 | 39.4 | 1.6 | |||||||||||||||||||
| Cable/media | 450.7 | 2.1 | 68.1 | 2.7 | |||||||||||||||||||
| Real estate/REITs | 422.2 | 2.0 | 46.6 | 1.9 | |||||||||||||||||||
| Transportation | 347.9 | 1.6 | 35.0 | 1.4 | |||||||||||||||||||
| Telecom | 331.2 | 1.6 | 22.5 | .9 | |||||||||||||||||||
| Capital goods | 279.9 | 1.3 | 27.2 | 1.1 | |||||||||||||||||||
| Chemicals | 266.5 | 1.3 | 32.1 | 1.3 | |||||||||||||||||||
| Agency residential mortgage-backed securities | 215.9 | 1.0 | .2 | — | |||||||||||||||||||
| Other | 1,970.0 | 9.3 | 233.3 | 9.4 | |||||||||||||||||||
| Total fixed maturities, available for sale | $ | 21,107.1 | 100.0 | % | $ | 2,495.4 | 100.0 | % | |||||||||||||||
| Carrying value | Percent of fixed maturities | Gross unrealized losses | Percent of gross unrealized losses | ||||||||||
| Asset-backed securities | $ | 2,786.1 | 12.6 | % | $ | 3.1 | 6.2 | % | |||||
| States and political subdivisions | 2,077.0 | 9.4 | .9 | 1.9 | |||||||||
| Utilities | 1,649.2 | 7.5 | .3 | .5 | |||||||||
| Healthcare/pharmaceuticals | 1,636.9 | 7.4 | 1.7 | 3.5 | |||||||||
| Insurance | 1,494.4 | 6.8 | 1.1 | 2.3 | |||||||||
| Energy | 1,445.6 | 6.5 | 7.8 | 16.3 | |||||||||
| Commercial mortgage-backed securities | 1,338.9 | 6.0 | 10.1 | 21.5 | |||||||||
| Banks | 1,179.9 | 5.3 | .2 | .4 | |||||||||
| Food/beverage | 982.4 | 4.4 | .2 | .4 | |||||||||
| Cable/media | 811.0 | 3.7 | 5.6 | 11.8 | |||||||||
| Collateralized mortgage obligations | 804.4 | 3.6 | .6 | 1.2 | |||||||||
| Real estate/REITs | 550.1 | 2.5 | — | — | |||||||||
| Capital goods | 550.0 | 2.5 | .3 | .5 | |||||||||
| Chemicals | 520.4 | 2.4 | 2.9 | 6.0 | |||||||||
| Transportation | 475.9 | 2.2 | .3 | .7 | |||||||||
| Brokerage | 441.6 | 2.0 | 1.2 | 2.6 | |||||||||
| Telecom | 342.7 | 1.5 | .4 | .8 | |||||||||
| Technology | 320.1 | 1.4 | 1.0 | 2.1 | |||||||||
| Aerospace/defense | 295.9 | 1.3 | .2 | .3 | |||||||||
| Autos | 287.2 | 1.3 | .5 | 1.1 | |||||||||
| Business services | 267.1 | 1.2 | 2.0 | 4.2 | |||||||||
| Paper | 261.3 | 1.2 | .1 | .2 | |||||||||
| Collateralized debt obligations | 237.9 | 1.1 | — | — | |||||||||
| Retail | 227.9 | 1.0 | .5 | 1.1 | |||||||||
| Other | 1,146.0 | 5.2 | 6.8 | 14.4 | |||||||||
| Total fixed maturities, available for sale | $ | 22,129.9 | 100.0 | % | $ | 47.8 | 100.0 | % | |||||
Below-Investment Grade Securities
At September 30, 2017,March 31, 2023, the amortized cost of the Company's below-investment grade fixed maturity securities, available for sale, was $2,665.4$1,405.9 million,, or 136.0 percent of the Company's fixed maturity portfolio.portfolio (or $781.4 million, or 3.3 percent, of the Company's fixed maturity portfolio measured on credit quality ratings assigned by the NAIC). The estimated fair value of the below-investment grade portfolio was $2,875.3$1,307.4 million,, or 10893 percent of the amortized cost (refer to the table on page 96 for composition of the below-investment grade portfolio).cost.
Below-investment grade corporate debt securities typically have different characteristics than investment grade corporate debt securities. Based on historical performance, probability of default by the borrower is significantly greater for below-investment grade corporate debt securities and in many cases severity of loss is relatively greater as such securities are generally unsecured and often subordinated to other indebtedness of the issuer. Also, issuers of below-investment grade corporate debt securities frequently have higher levels of debt relative to investment-grade issuers, hence, all other things being equal, are generally more sensitive to adverse economic conditions. The Company attempts to reduce the overall risk related to
its investment in below-investment grade securities, as in all investments, through careful credit analysis, strict investment policy guidelines, and diversification by issuer and/or guarantor and by industry.
94
CNO FINANCIAL GROUP, INC. AND SUBSIDIARIES
___________________
Net Realized and Unrealized Investment Gains (Losses)Losses
| Three months ended | Nine months ended | ||||||||||||||
| September 30, | September 30, | ||||||||||||||
| 2017 | 2016 | 2017 | 2016 | ||||||||||||
| Fixed maturity securities, available for sale: | |||||||||||||||
| Gross realized gains on sale | $ | 32.3 | $ | 7.3 | $ | 60.4 | $ | 127.1 | |||||||
| Gross realized losses on sale | (8.5 | ) | (2.8 | ) | (16.4 | ) | (84.4 | ) | |||||||
| Impairments: | |||||||||||||||
| Total other-than-temporary impairment losses | (3.2 | ) | — | (10.0 | ) | (6.3 | ) | ||||||||
| Other-than-temporary impairment losses recognized in accumulated other comprehensive income | — | — | (.9 | ) | — | ||||||||||
| Net impairment losses recognized | (3.2 | ) | — | (10.9 | ) | (6.3 | ) | ||||||||
| Net realized investment gains from fixed maturities | 20.6 | 4.5 | 33.1 | 36.4 | |||||||||||
| Equity securities | 7.7 | 17.2 | 9.6 | 21.3 | |||||||||||
| Commercial mortgage loans | — | — | 1.0 | — | |||||||||||
| Impairments of other investments | (1.5 | ) | (1.2 | ) | (7.3 | ) | (18.5 | ) | |||||||
| Loss on dissolution of variable interest entities | (.6 | ) | — | (4.3 | ) | (7.3 | ) | ||||||||
| Other (a) | 3.0 | (8.9 | ) | 20.2 | (8.6 | ) | |||||||||
| Net realized investment gains | $ | 29.2 | $ | 11.6 | $ | 52.3 | $ | 23.3 | |||||||
During the first ninethree months of 2017,2023, we recognized net realized investment gains of $52.3 million, which were comprised of: (i) $60.1$14.4 million of net gains from the sales of investments; (ii) $4.3 million of losses on the dissolution of VIEs; (iii) the increase in fair value of certain fixed maturity investments with embedded derivatives of $12.3 million; (iv) the increase in fair value of embedded derivatives related to a modified coinsurance agreement of $2.4 million; and (v) $18.2 million of writedowns of investments for other than temporary declines in fair value recognized through net income.
include but are not limited to: (i) changes in the investment environment; (ii) expectation that the market value could deteriorate; (iii) our desire to reduce our exposure to an asset class, an issuer or an industry; (iv) prospective or actual changes in credit quality; (v) better match certain characteristics of our investment portfolio with the corresponding characteristics of our insurance liabilities; or (v)(vi) changes in expected portfolio cash flows.
During the first ninethree months of 2016, the $84.42022, we recognized $30.6 million of gross realized losses on sales of $477.2$786.6 million of fixed maturity securities, available for sale, included: (i) $77.8 millionprimarily related to various corporate securities (including $62.7 million related to sales of investments in the energy sector); (ii) $5.3 million related to commercial mortgage-backed securities; and (iii) $1.3 million related to various other investments.
The following summarizes the investments sold at a loss during the first ninethree months of 20172023 which had been
continuously in an unrealized loss position exceeding 20 percent of the amortized cost basis prior to the sale for the period
indicated (dollars in millions):
| At date of sale | |||||||||||||||||
| Number of issuers | Amortized cost | Fair value | |||||||||||||||
| Less than 6 months prior to sale | 1 | $ | 24.6 | $ | 18.2 | ||||||||||||
| At date of sale | |||||||||
| Number of issuers | Amortized cost | Fair value | |||||||
| Less than 6 months prior to sale | 4 | $ | 17.8 | $ | 13.0 | ||||
| Greater than or equal to 6 months and less than 12 months prior to sale | 1 | 2.7 | 1.9 | ||||||
| Greater than 12 months prior to sale | 1 | .7 | .5 | ||||||
| 6 | $ | 21.2 | $ | 15.4 | |||||
Future events may occur, or additional information may become available, which may necessitate future realized losses in our portfolio. Significant losses could have a material adverse effect on our consolidated financial statements in future periods.
The following table sets forth the amortized cost and estimated fair value of those fixed maturities, available for sale, with unrealized losses at September 30, 2017,March 31, 2023, by contractual maturity. Actual maturities will differ from contractual maturities because borrowers may have the right to call or prepay obligations with or without penalties. Structured securities frequently include provisions for periodic principal payments and permit periodic unscheduled payments.
| Amortized cost | Estimated fair value | ||||||||||
| (Dollars in millions) | |||||||||||
| Due in one year or less | $ | 111.2 | $ | 109.6 | |||||||
| Due after one year through five years | 1,942.0 | 1,808.1 | |||||||||
| Due after five years through ten years | 1,494.5 | 1,351.7 | |||||||||
| Due after ten years | 10,590.4 | 8,905.8 | |||||||||
| Subtotal | 14,138.1 | 12,175.2 | |||||||||
| Structured securities | 6,207.0 | 5,615.4 | |||||||||
| Total | $ | 20,345.1 | $ | 17,790.6 | |||||||
95
CNO FINANCIAL GROUP, INC. AND SUBSIDIARIES
___________________
Amortized cost | Estimated fair value | ||||||
| (Dollars in millions) | |||||||
| Due in one year or less | $ | 37.1 | $ | 37.1 | |||
| Due after one year through five years | 136.5 | 135.4 | |||||
| Due after five years through ten years | 135.1 | 132.0 | |||||
| Due after ten years | 878.4 | 848.6 | |||||
| Subtotal | 1,187.1 | 1,153.1 | |||||
| Structured securities | 926.6 | 912.8 | |||||
| Total | $ | 2,113.7 | $ | 2,065.9 | |||
| Number of issuers | Cost basis | Unrealized loss | Estimated fair value | |||||||||||||||||||||||
| Less than 6 months | 6 | $ | 47.2 | $ | (11.1) | $ | 36.1 | |||||||||||||||||||
| Greater than or equal to 6 months and less than 12 months | 5 | 41.0 | (11.7) | 29.3 | ||||||||||||||||||||||
| Total | $ | 88.2 | $ | (22.8) | $ | 65.4 | ||||||||||||||||||||
96
CNO FINANCIAL GROUP, INC. AND SUBSIDIARIES
___________________
The following table summarizes the gross unrealized losses of our fixed maturity securities, available for sale, by category and ratings category as of September 30, 2017March 31, 2023 (dollars in millions):
| Investment grade | Below-investment grade | ||||||||||||||||||||||||||||
| AAA/AA/A | BBB | BB | B+ and below | Total gross unrealized losses | |||||||||||||||||||||||||
| States and political subdivisions | $ | 352.8 | $ | 6.7 | $ | — | $ | .6 | $ | 360.1 | |||||||||||||||||||
| Commercial mortgage-backed securities | 198.3 | 44.3 | 15.4 | 1.8 | 259.8 | ||||||||||||||||||||||||
| Banks | 116.2 | 102.7 | .7 | 10.5 | 230.1 | ||||||||||||||||||||||||
| Insurance | 88.5 | 86.3 | 3.6 | .5 | 178.9 | ||||||||||||||||||||||||
| Non-agency residential mortgage-backed securities | 96.7 | 57.8 | 1.6 | 18.8 | 174.9 | ||||||||||||||||||||||||
| Healthcare/pharmaceuticals | 120.9 | 44.3 | 2.2 | .8 | 168.2 | ||||||||||||||||||||||||
| Utilities | 77.7 | 64.0 | 1.8 | .1 | 143.6 | ||||||||||||||||||||||||
| Brokerage | 60.9 | 66.2 | 1.5 | 1.0 | 129.6 | ||||||||||||||||||||||||
| Technology | 77.5 | 44.5 | 3.9 | .5 | 126.4 | ||||||||||||||||||||||||
| Asset-backed securities | 36.8 | 64.2 | 18.1 | 1.1 | 120.2 | ||||||||||||||||||||||||
| Cable/media | 7.9 | 55.5 | 2.1 | 2.6 | 68.1 | ||||||||||||||||||||||||
| Food/beverage | 16.5 | 45.5 | 1.0 | .3 | 63.3 | ||||||||||||||||||||||||
| Real estate/REITs | 26.4 | 18.6 | 1.6 | — | 46.6 | ||||||||||||||||||||||||
| Energy | 5.2 | 31.3 | 2.9 | — | 39.4 | ||||||||||||||||||||||||
| Collateralized loan obligations | 30.4 | 5.5 | — | — | 35.9 | ||||||||||||||||||||||||
| Transportation | 12.9 | 21.8 | .1 | .2 | 35.0 | ||||||||||||||||||||||||
| Consumer products | 18.1 | 10.9 | 2.2 | 1.3 | 32.5 | ||||||||||||||||||||||||
| Chemicals | 2.4 | 28.8 | .5 | .4 | 32.1 | ||||||||||||||||||||||||
| Retail | 18.6 | 9.0 | 1.4 | 2.3 | 31.3 | ||||||||||||||||||||||||
| Capital goods | 13.5 | 11.8 | 1.8 | .1 | 27.2 | ||||||||||||||||||||||||
| Telecom | .1 | 22.4 | — | — | 22.5 | ||||||||||||||||||||||||
| Autos | 4.0 | 17.0 | 1.2 | .2 | 22.4 | ||||||||||||||||||||||||
| Building materials | 4.6 | 14.9 | .6 | .2 | 20.3 | ||||||||||||||||||||||||
| Aerospace/defense | 4.5 | 14.8 | — | — | 19.3 | ||||||||||||||||||||||||
| Metals and mining | 3.5 | 8.6 | .6 | — | 12.7 | ||||||||||||||||||||||||
| Foreign governments | 4.2 | 5.7 | — | — | 9.9 | ||||||||||||||||||||||||
| Paper | .6 | 8.3 | .1 | .4 | 9.4 | ||||||||||||||||||||||||
| Entertainment/hotels | 4.9 | 3.6 | .1 | .7 | 9.3 | ||||||||||||||||||||||||
| United States Treasury securities and obligations of United States government corporations and agencies | 4.7 | — | — | — | 4.7 | ||||||||||||||||||||||||
| Business services | — | .7 | .5 | .3 | 1.5 | ||||||||||||||||||||||||
| Other | 54.0 | 5.6 | .3 | .3 | 60.2 | ||||||||||||||||||||||||
| Total fixed maturities, available for sale | $ | 1,463.3 | $ | 921.3 | $ | 65.8 | $ | 45.0 | $ | 2,495.4 | |||||||||||||||||||
| Investment grade | Below-investment grade | ||||||||||||||||||
| AAA/AA/A | BBB | BB | B+ and below | Total gross unrealized losses | |||||||||||||||
| Commercial mortgage-backed securities | $ | 8.7 | $ | .5 | $ | .9 | $ | — | $ | 10.1 | |||||||||
| Energy | .1 | 4.1 | 1.9 | 1.7 | 7.8 | ||||||||||||||
| Cable/media | — | 5.4 | .1 | .1 | 5.6 | ||||||||||||||
| Asset-backed securities | 1.2 | .7 | .2 | 1.0 | 3.1 | ||||||||||||||
| Chemicals | — | .7 | 2.2 | — | 2.9 | ||||||||||||||
| Building materials | — | 1.4 | .9 | — | 2.3 | ||||||||||||||
| Business services | — | — | 2.0 | — | 2.0 | ||||||||||||||
| Healthcare/pharmaceuticals | .1 | .8 | — | .8 | 1.7 | ||||||||||||||
| Brokerage | .1 | .5 | — | .6 | 1.2 | ||||||||||||||
| Insurance | — | 1.1 | — | — | 1.1 | ||||||||||||||
| Technology | — | 1.0 | — | — | 1.0 | ||||||||||||||
| States and political subdivisions | .3 | .3 | — | .3 | .9 | ||||||||||||||
| Entertainment/hotels | — | .6 | — | .1 | .7 | ||||||||||||||
| Collateralized mortgage obligations | .5 | — | — | .1 | .6 | ||||||||||||||
| Autos | — | .2 | .3 | — | .5 | ||||||||||||||
| Metals and mining | — | — | .5 | — | .5 | ||||||||||||||
| Retail | — | .2 | — | .3 | .5 | ||||||||||||||
| Telecom | — | .4 | — | — | .4 | ||||||||||||||
| Transportation | — | .3 | — | — | .3 | ||||||||||||||
| Capital goods | — | .2 | .1 | — | .3 | ||||||||||||||
| Utilities | .2 | — | — | .1 | .3 | ||||||||||||||
| Food/beverage | — | .1 | — | .1 | .2 | ||||||||||||||
| Banks | .1 | .1 | — | — | .2 | ||||||||||||||
| Aerospace/defense | .2 | — | — | — | .2 | ||||||||||||||
| Paper | — | .1 | — | — | .1 | ||||||||||||||
| Consumer products | — | — | — | .1 | .1 | ||||||||||||||
| Debt securities issued by foreign governments | — | .1 | — | — | .1 | ||||||||||||||
| Other | 2.2 | .1 | .7 | .1 | 3.1 | ||||||||||||||
| Total fixed maturities, available for sale | $ | 13.7 | $ | 18.9 | $ | 9.8 | $ | 5.4 | $ | 47.8 | |||||||||
Our investment strategy is to maximize, over a sustained period and within acceptable parameters of quality and risk, investment income and total investment return through active strategic asset allocation and investment management. Accordingly, we may sell securities at a gain or a loss to enhance the projected total return of the portfolio as market opportunities change, to reflect changing perceptions of risk, or to better match certain characteristics of our investment portfolio with the corresponding characteristics of our insurance liabilities.
CNO FINANCIAL GROUP, INC. AND SUBSIDIARIES
___________________
| Less than 12 months | 12 months or greater | Total | ||||||||||||||||||||||
| Description of securities | Fair value | Unrealized losses | Fair value | Unrealized losses | Fair value | Unrealized losses | ||||||||||||||||||
| United States Treasury securities and obligations of United States government corporations and agencies | $ | 20.3 | $ | — | $ | .6 | $ | — | $ | 20.9 | $ | — | ||||||||||||
| States and political subdivisions | 35.1 | (.6 | ) | 19.3 | (.3 | ) | 54.4 | (.9 | ) | |||||||||||||||
| Debt securities issued by foreign governments | 10.5 | (.1 | ) | — | — | 10.5 | (.1 | ) | ||||||||||||||||
| Corporate securities | 666.9 | (7.8 | ) | 400.4 | (25.2 | ) | 1,067.3 | (33.0 | ) | |||||||||||||||
| Asset-backed securities | 276.7 | (1.3 | ) | 79.6 | (1.8 | ) | 356.3 | (3.1 | ) | |||||||||||||||
| Collateralized debt obligations | 24.0 | — | — | — | 24.0 | — | ||||||||||||||||||
| Commercial mortgage-backed securities | 226.2 | (1.3 | ) | 221.9 | (8.8 | ) | 448.1 | (10.1 | ) | |||||||||||||||
| Collateralized mortgage obligations | 72.8 | (.5 | ) | 11.6 | (.1 | ) | 84.4 | (.6 | ) | |||||||||||||||
| Total fixed maturities, available for sale | $ | 1,332.5 | $ | (11.6 | ) | $ | 733.4 | $ | (36.2 | ) | $ | 2,065.9 | $ | (47.8 | ) | |||||||||
| Equity securities | $ | 37.4 | $ | (.8 | ) | $ | 89.7 | $ | (1.8 | ) | $ | 127.1 | $ | (2.6 | ) | |||||||||
Structured Securities
At September 30, 2017,March 31, 2023, fixed maturity investments included structured securities with an estimated fair value of $5.2$6.4 billion (or 2330.4 percent of all fixed maturity securities). The yield characteristics of structured securities generally differ in some respects from those of traditional corporate fixed-income securities or government securities. For example, interest and principal payments on structured securities may occur more frequently, often monthly. In many instances, we are subject to variability in the amount and timing of principal and interest payments. For example, in many cases, partial prepayments may occur at the option of the issuer and prepayment rates are influenced by a number of factors that cannot be predicted with certainty, including: the relative sensitivity of prepayments on the underlying assets backing the security to changes in interest rates and asset values; the availability of alternative financing; a variety of economic, geographic and other factors; the timing, pace and proceeds of liquidations of defaulted collateral; and various security-specific structural considerations (for example, the repayment priority of a given security in a securitization structure). In addition, the total amount of payments for non-agency structured securities may be affected by changes to cumulative default rates or loss severities of the related collateral.
Par value | Amortized cost | Estimated fair value | |||||||||
| Below 4 percent | $ | 1,755.8 | $ | 1,591.9 | $ | 1,669.1 | |||||
| 4 percent – 5 percent | 1,697.1 | 1,552.6 | 1,634.7 | ||||||||
| 5 percent – 6 percent | 1,419.5 | 1,278.4 | 1,372.6 | ||||||||
| 6 percent – 7 percent | 261.5 | 233.9 | 251.4 | ||||||||
| 7 percent – 8 percent | 58.9 | 59.7 | 69.3 | ||||||||
| 8 percent and above | 170.2 | 169.9 | 172.4 | ||||||||
| Total structured securities | $ | 5,363.0 | $ | 4,886.4 | $ | 5,169.5 | |||||
The amortized cost and estimated fair value of structured securities at September 30, 2017,March 31, 2023, summarized by type of security, were as follows (dollars in millions):
| Estimated fair value | |||||||||||||||||
| Type | Amortized cost | Amount | Percent of fixed maturities | ||||||||||||||
| Asset-backed securities | $ | 1,458.6 | $ | 1,340.2 | 6.3 | % | |||||||||||
| Agency residential mortgage-backed securities | 213.3 | 215.9 | 1.0 | ||||||||||||||
| Non-agency residential mortgage-backed securities | 1,778.2 | 1,640.5 | 7.8 | ||||||||||||||
| Collateralized loan obligations | 954.3 | 918.9 | 4.4 | ||||||||||||||
| Commercial mortgage-backed securities | 2,563.6 | 2,303.9 | 10.9 | ||||||||||||||
| Total structured securities | $ | 6,968.0 | $ | 6,419.4 | 30.4 | % | |||||||||||
| Estimated fair value | ||||||||||
| Type | Amortized cost | Amount | Percent of fixed maturities | |||||||
| Pass-throughs, sequential and equivalent securities | $ | 585.9 | $ | 647.1 | 2.9 | % | ||||
| Planned amortization classes, target amortization classes and accretion-directed bonds | 100.5 | 114.8 | .5 | |||||||
| Commercial mortgage-backed securities | 1,311.6 | 1,338.9 | 6.1 | |||||||
| Asset-backed securities | 2,608.6 | 2,786.1 | 12.6 | |||||||
| Collateralized debt obligations | 236.5 | 237.9 | 1.1 | |||||||
| Other | 43.3 | 44.7 | .2 | |||||||
| Total structured securities | $ | 4,886.4 | $ | 5,169.5 | 23.4 | % | ||||
Commercial mortgage-backed securities ("CMBS") are secured by commercial real estate mortgages, generally income producing properties that are managed for profit. Property types include, but are not limited to, multi-family dwellings including apartments, retail centers, hotels, restaurants, hospitals, nursing homes, warehouses, and office buildings. While most commercial mortgage-backed securitiesCMBS have call protection features whereby underlying borrowers may not prepay their mortgages for stated periods of time without incurring prepayment penalties, recoveries on defaulted collateral may result in involuntary prepayments.
98
CNO FINANCIAL GROUP, INC. AND SUBSIDIARIES
___________________
Estimated fair value | |||||||||||
| Loan-to-value ratio (a) | Carrying value | Mortgage loans | Collateral | ||||||||
| Less than 60% | $ | 983.5 | $ | 1,007.0 | $ | 2,463.3 | |||||
| 60% to 70% | 406.8 | 409.5 | 621.4 | ||||||||
| Greater than 70% to 80% | 186.1 | 195.8 | 254.4 | ||||||||
| Greater than 80% to 90% | 37.4 | 38.5 | 43.3 | ||||||||
| Greater than 90% | 54.0 | 55.0 | 57.4 | ||||||||
| Total | $ | 1,667.8 | $ | 1,705.8 | $ | 3,439.8 | |||||
INVESTMENTS IN VARIABLE INTEREST ENTITIES
The following table provides supplemental information about the revenues and expenses of the VIEs which have been consolidated in accordance with authoritative guidance, after giving effect to the elimination of our investment in the VIEs and investment management fees earned by a subsidiary of the Company (dollars in millions):
| Three months ended | |||||||||||||||||||||||
| March 31, | |||||||||||||||||||||||
| 2023 | 2022 | ||||||||||||||||||||||
| Revenues: | |||||||||||||||||||||||
| Net investment income – policyholder and other special-purpose portfolios | $ | 22.4 | $ | 10.8 | |||||||||||||||||||
| Fee revenue and other income | 1.3 | 1.4 | |||||||||||||||||||||
| Total revenues | 23.7 | 12.2 | |||||||||||||||||||||
| Expenses: | |||||||||||||||||||||||
| Interest expense | 17.3 | 5.7 | |||||||||||||||||||||
| Other operating expenses | .5 | .4 | |||||||||||||||||||||
| Total expenses | 17.8 | 6.1 | |||||||||||||||||||||
| Income before net investment losses and income taxes | 5.9 | 6.1 | |||||||||||||||||||||
| Net investment losses | (.6) | (3.2) | |||||||||||||||||||||
| Income before income taxes | $ | 5.3 | $ | 2.9 | |||||||||||||||||||
99
| Three months ended | Nine months ended | ||||||||||||||
| September 30, | September 30, | ||||||||||||||
| 2017 | 2016 | 2017 | 2016 | ||||||||||||
| Revenues: | |||||||||||||||
| Net investment income – policyholder and other special-purpose portfolios | $ | 16.1 | $ | 21.2 | $ | 53.0 | $ | 58.9 | |||||||
| Fee revenue and other income | 1.2 | 1.8 | 4.0 | 4.8 | |||||||||||
| Total revenues | 17.3 | 23.0 | 57.0 | 63.7 | |||||||||||
| Expenses: | |||||||||||||||
| Interest expense | 11.1 | 13.4 | 38.0 | 39.4 | |||||||||||
| Other operating expenses | .4 | .3 | 1.3 | 1.1 | |||||||||||
| Total expenses | 11.5 | 13.7 | 39.3 | 40.5 | |||||||||||
| Income before net realized investment losses, loss on extinguishment of borrowings and income taxes | 5.8 | 9.3 | 17.7 | 23.2 | |||||||||||
| Net realized investment losses | (.7 | ) | (6.9 | ) | (2.5 | ) | (20.6 | ) | |||||||
| Loss on extinguishment of borrowings | (5.5 | ) | — | (5.5 | ) | — | |||||||||
| Income before income taxes | $ | (.4 | ) | $ | 2.4 | $ | 9.7 | $ | 2.6 | ||||||
CNO FINANCIAL GROUP, INC. AND SUBSIDIARIES
___________________
Supplemental Information on Investments Held by VIEs
The following table summarizes the carrying values and gross unrealized losses of the investments held by the VIEs by category as of September 30, 2017March 31, 2023 (dollars in millions):
| Carrying value | Percent of fixed maturities | Gross unrealized losses | Percent of gross unrealized losses | ||||||||||||||||||||||||||
| Technology | $ | 125.6 | 12.3 | % | $ | 8.8 | 21.9 | % | |||||||||||||||||||||
| Cable/media | 120.8 | 11.9 | 4.7 | 11.6 | |||||||||||||||||||||||||
| Healthcare/pharmaceuticals | 108.0 | 10.6 | 6.7 | 16.6 | |||||||||||||||||||||||||
| Food/beverage | 70.9 | 7.0 | 2.7 | 6.8 | |||||||||||||||||||||||||
| Brokerage | 59.4 | 5.8 | 1.2 | 2.9 | |||||||||||||||||||||||||
| Building materials | 53.9 | 5.3 | 1.3 | 3.3 | |||||||||||||||||||||||||
| Chemicals | 53.7 | 5.3 | .8 | 1.9 | |||||||||||||||||||||||||
| Capital goods | 50.8 | 5.0 | 1.7 | 4.1 | |||||||||||||||||||||||||
| Paper | 43.3 | 4.3 | .9 | 2.4 | |||||||||||||||||||||||||
| Consumer products | 43.2 | 4.2 | 3.9 | 9.6 | |||||||||||||||||||||||||
| Transportation | 41.6 | 4.1 | .5 | 1.2 | |||||||||||||||||||||||||
| Utilities | 40.9 | 4.0 | 1.0 | 2.6 | |||||||||||||||||||||||||
| Autos | 32.9 | 3.2 | .7 | 1.7 | |||||||||||||||||||||||||
| Insurance | 27.5 | 2.7 | .4 | 1.0 | |||||||||||||||||||||||||
| Business services | 26.4 | 2.6 | .6 | 1.5 | |||||||||||||||||||||||||
| Aerospace/defense | 25.3 | 2.5 | 1.6 | 4.0 | |||||||||||||||||||||||||
| Banks | 16.4 | 1.6 | .3 | .7 | |||||||||||||||||||||||||
| Retail | 14.2 | 1.4 | .3 | .8 | |||||||||||||||||||||||||
| Other | 63.1 | 6.2 | 2.2 | 5.4 | |||||||||||||||||||||||||
| Total | $ | 1,017.9 | 100.0 | % | $ | 40.3 | 100.0 | % | |||||||||||||||||||||
| Carrying value | Percent of fixed maturities | Gross unrealized losses | Percent of gross unrealized losses | ||||||||||
| Healthcare/pharmaceuticals | $ | 169.0 | 12.2 | % | $ | .1 | 1.8 | % | |||||
| Cable/media | 155.0 | 11.2 | 1.7 | 21.6 | |||||||||
| Technology | 147.3 | 10.6 | .6 | 8.3 | |||||||||
| Food/beverage | 96.2 | 6.9 | .8 | 10.8 | |||||||||
| Capital goods | 83.3 | 6.0 | .3 | 3.3 | |||||||||
| Consumer products | 67.4 | 4.9 | .5 | 6.8 | |||||||||
| Paper | 64.7 | 4.7 | .1 | 1.3 | |||||||||
| Aerospace/defense | 62.1 | 4.5 | .3 | 4.0 | |||||||||
| Brokerage | 61.0 | 4.4 | .1 | .7 | |||||||||
| Building materials | 56.5 | 4.1 | .1 | .9 | |||||||||
| Retail | 53.3 | 3.9 | 2.4 | 31.6 | |||||||||
| Chemicals | 46.5 | 3.4 | .1 | .9 | |||||||||
| Utilities | 39.5 | 2.9 | — | .3 | |||||||||
| Autos | 31.1 | 2.3 | — | .1 | |||||||||
| Gaming | 29.5 | 2.1 | — | .5 | |||||||||
| Entertainment/hotels | 27.9 | 2.0 | .1 | .6 | |||||||||
| Transportation | 27.6 | 2.0 | .1 | 1.8 | |||||||||
| Insurance | 21.1 | 1.5 | — | — | |||||||||
| Banks | 17.1 | 1.2 | — | .3 | |||||||||
| Real estate/REITs | 15.9 | 1.2 | — | .1 | |||||||||
| Metals and mining | 12.2 | .9 | — | — | |||||||||
| Business services | 8.5 | .6 | — | .3 | |||||||||
| Telecom | 7.6 | .5 | — | .2 | |||||||||
| Energy | 2.9 | .2 | — | — | |||||||||
| Textiles | .8 | .1 | — | — | |||||||||
| Other | 78.5 | 5.7 | .3 | 3.8 | |||||||||
| Total | $ | 1,382.5 | 100.0 | % | $ | 7.6 | 100.0 | % | |||||
The following table sets forth the amortized cost and estimated fair value of those investments held by the VIEs with unrealized losses at September 30, 2017,March 31, 2023, by contractual maturity. Actual maturities will differ from contractual maturities because borrowers may have the right to call or prepay obligations with or without penalties.
| Amortized cost | Estimated fair value | ||||||||||
| (Dollars in millions) | |||||||||||
| Due in one year or less | $ | 4.4 | $ | 3.7 | |||||||
| Due after one year through five years | 689.1 | 658.5 | |||||||||
| Due after five years through ten years | 246.9 | 234.4 | |||||||||
| Total | $ | 940.4 | $ | 896.6 | |||||||
100
Amortized cost | Estimated fair value | ||||||
| (Dollars in millions) | |||||||
| Due in one year or less | $ | 1.7 | $ | 1.7 | |||
| Due after one year through five years | 154.7 | 151.6 | |||||
| Due after five years through ten years | 244.7 | 240.2 | |||||
| Total | $ | 401.1 | $ | 393.5 | |||
CNO FINANCIAL GROUP, INC. AND SUBSIDIARIES
___________________
The following summarizes the investments held by the VIEs sold at a loss during the first ninethree months of 20172023 which had been continuously in an unrealized loss position exceeding 20 percent of the amortized cost basis prior to the sale for the period indicated (dollars in millions):
| At date of sale | |||||||||||||||||
| Number of issuers | Amortized cost | Fair value | |||||||||||||||
| Less than 6 months prior to sale | 1 | $ | 1.7 | $ | 1.2 | ||||||||||||
| Greater than or equal to 6 months and less than 12 months prior to sale | 1 | 2.7 | .8 | ||||||||||||||
| $ | 4.4 | $ | 2.0 | ||||||||||||||
| At date of sale | |||||||||
| Number of issuers | Amortized cost | Fair value | |||||||
| Less than 6 months prior to sale | 2 | $ | 2.8 | $ | 1.8 | ||||
The following summarizes the investments in our portfolioheld by the VIEs rated below-investment grade not deemed to have credit losses which have been continuously in an unrealized loss position exceeding 20 percent of the cost basis for the period indicated as of September 30, 2017March 31, 2023 (dollars in millions):
| Number of issuers | Cost basis | Unrealized loss | Estimated fair value | |||||||||||||||||||||||
| Greater than or equal to 6 months and less than 12 months | 3 | $ | 9.4 | $ | (3.1) | $ | 6.3 | |||||||||||||||||||
101
| Number of issuers | Cost basis | Unrealized loss | Estimated fair value | ||||||||||
| Less than 6 months | 1 | $ | 5.4 | $ | (1.2 | ) | $ | 4.2 | |||||
CNO FINANCIAL GROUP, INC. AND SUBSIDIARIES
___________________
NEW ACCOUNTING STANDARDS
See "Recently IssuedAdopted Accounting Standards" in the notes to consolidated financial statements for a discussion of recently issuedadopted accounting standards.
ITEM 3. QUANTITATIVE AND QUALITATIVE DISCLOSURES ABOUT MARKET RISK.
Our market risks, and the ways we manage them, are summarized in "Management's Discussion and Analysis of Financial Condition and Results of Operations", included in our Annual Report on Form 10-K for the year ended December 31, 2016.2022. There have been no material changes in the first ninethree months of 20172023 to such risks or our management of such risks.
ITEM 4. CONTROLS AND PROCEDURES.
Evaluation of Disclosure Controls and Procedures. CNO's management, under the supervision and with the participation of the Chief Executive Officer and the Chief Financial Officer, evaluated the effectiveness of CNO's disclosure controls and procedures (as defined in Rules 13a-15(e) and 15d-15(e) under the Securities Exchange Act of 1934, as amended). Based on its evaluation, the Chief Executive Officer and Chief Financial Officer concluded that, as of September 30, 2017,March 31, 2023, CNO's disclosure controls and procedures were effective to ensure that information required to be disclosed by CNO in reports that it files or submits under the Securities Exchange Act of 1934 is recorded, processed, summarized and reported within the time periods specified in the SEC's rules and forms. Disclosure controls and procedures are also designed to reasonably assure that such information is accumulated and communicated to our management, including our Chief Executive Officer and Chief Financial Officer, as appropriate, to allow timely decisions regarding required disclosure.
Changes to Internal Control Over Financial Reporting. There were no changes in the Company's internal control over financial reporting (as defined in Rule 13a-15(f) under the Securities Exchange Act of 1934) during the three months ended September 30, 2017,March 31, 2023, that have materially affected, or are reasonably likely to materially affect, our internal control over financial reporting.
102
CNO FINANCIAL GROUP, INC. AND SUBSIDIARIES
___________________
PART II - OTHER INFORMATION
ITEM 1. LEGAL PROCEEDINGS.
Information required for Part II, Item 1 is incorporated by reference to the discussion under the heading "Litigation and Other Legal Proceedings" in the footnotes to our consolidated financial statements included in Part I, Item 1 of this Form 10-Q.
ITEM 1A. RISK FACTORS.
CNO and its businesses are subject to a number of risks including general business and financial risk factors.risk. Any or all of such factorsrisks could have a material adverse effect on the business, financial condition or results of operations of CNO. Refer to "Risk Factors" in our Annual Report on Form 10-K for the year ended December 31, 2016,2022, for further discussion of such risk factors. On September 27, 2017, President Trump announced a framework for tax reform including a reduction in the Federal corporate income tax rate from 35% to 20%. The following risk factor has been updated to summarize the impact the proposed rate reduction would have to CNO. If tax reform is enacted, there are likely to be other changes to the Code that would impact CNO. There have been no other material changes from such previously disclosed risk factors.
ITEM 2. UNREGISTERED SALES OF EQUITY SECURITIES AND USE OF PROCEEDS.
Issuer Purchases of Equity Securities
| Period | Total number of shares (or units) | Average price paid per share (or unit) | Total number of shares (or units) purchased as part of publicly announced plans or programs | Maximum number (or approximate dollar value) of shares (or units) that may yet be purchased under the plans or programs (a) | ||||||||||
| (dollars in millions) | ||||||||||||||
| July 1 through July 31 | 1,137 | $ | 22.69 | — | $ | 440.8 | ||||||||
| August 1 through August 31 | 391,512 | 22.36 | 391,400 | 432.0 | ||||||||||
| September 1 through September 30 | 880,895 | 22.12 | 880,589 | 412.6 | ||||||||||
| Total | 1,273,544 | 22.19 | 1,271,989 | 412.6 | ||||||||||
| Period (in 2023) | Total number of shares (or units) purchased | Average price paid per share (or unit) | Total number of shares (or units) purchased as part of publicly announced plans or programs | Maximum number (or approximate dollar value) of shares (or units) that may yet be purchased under the plans or programs (a) | ||||||||||||||||||||||
| (dollars in millions) | ||||||||||||||||||||||||||
| January 1 through January 31 | 186,217 | $ | 24.30 | 131,189 | $ | 183.8 | ||||||||||||||||||||
| February 1 through February 28 | 531,523 | 25.54 | 212,357 | 178.4 | ||||||||||||||||||||||
| March 1 through March 31 | 421,908 | 22.18 | 289,231 | 171.8 | ||||||||||||||||||||||
| Total | 1,139,648 | 24.09 | 632,777 | 171.8 | ||||||||||||||||||||||
_________________
(a) In May 2011, the Company announced a securities repurchase program. Since that date, the Company's Board of Directors has authorized additional repurchases from time to time, most recently in May 2023 when it authorized the repurchase of an additional $500.0 million |
103
CNO FINANCIAL GROUP, INC. AND SUBSIDIARIES
___________________
ITEM 6. EXHIBITS.
| 3.1 | ||||||||
| 31.2 | ||||||||
| 32.1 | ||||||||
| 32.2 | ||||||||
| 101.INS | XBRL Instance | |||||||
| 101.SCH | XBRL Taxonomy Extension Schema Document. | |||||||
| 101.CAL | XBRL Taxonomy Extension Calculation Linkbase Document. | |||||||
| 101.DEF | XBRL Taxonomy Extension Definition Linkbase Document. | |||||||
| 101.LAB | XBRL Taxonomy Extension Label Linkbase Document. | |||||||
| 101.PRE | XBRL Taxonomy Extension Presentation Linkbase Document. | |||||||
| 104 | Cover Page Interactive Data File (embedded within the Inline XBRL document). | |||||||
104
SIGNATURE
Pursuant to the requirements of the Securities Exchange Act of 1934, the Registrant has duly caused this report to be signed on its behalf by the undersigned thereunto duly authorized.
CNO FINANCIAL GROUP, INC.
Dated: November 1, 2017
May 10, 2023
| By: | /s/ John R. Kline | |||||||
| John R. Kline | ||||||||
| Senior Vice President and Chief Accounting Officer | ||||||||
| (authorized officer and principal accounting officer) | ||||||||
105