UNITED STATES
SECURITIES AND EXCHANGE COMMISSION
Washington, D.C. 20549
FORM 10-Q
☑ QUARTERLY REPORT PURSUANT TO SECTION 13 OR 15(d) OF THE SECURITIES EXCHANGE ACT OF 1934
For the quarterly period ended December 31, 20222023
or
☐ TRANSITION REPORT PURSUANT TO SECTION 13 OR 15(d) OF THE SECURITIES EXCHANGE ACT OF 1934
For the transition period from _______________________ to __________________________
Commission File Number 001-31921
Compass Minerals International, Inc.
(Exact name of registrant as specified in its charter)
| | | | | |
| Delaware | 36-3972986 |
(State or other jurisdiction of incorporation or organization) | (I.R.S. Employer
Identification Number) |
9900 West 109th Street
Suite 100
Overland Park, KS 66210
(913) 344-9200
(Address of principal executive offices, zip code and telephone number, including area code)
Securities registered pursuant to Section 12(b) of the Act:
| | | | | | | | | | | | | | |
| Title of each class | | Trading Symbol | | Name of each exchange on which registered |
| Common stock, $0.01 par value | | CMP | | The New York Stock Exchange |
| | | | | | | | | | | | | | |
| Indicate by check mark whether the registrant (1) has filed all reports required to be filed by Section 13 or 15(d) of the Securities Exchange Act of 1934 during the preceding 12 months (or for such shorter period that the registrant was required to file such |
| reports), and (2) has been subject to such filing requirements for the past 90 days. | Yes | ☑ | No | ☐ |
| | | | | | | | | | | | | | |
| Indicate by check mark whether the registrant has submitted electronically every Interactive Data File required to be submitted pursuant to Rule 405 of Regulation S-T (§232.405 of this chapter) during the preceding 12 months (or for such shorter period that |
| the registrant was required to submit such files). | Yes | ☑ | No | ☐ |
| | | | | | | | | | | | | | | | | | | | | | | |
| Indicate by check mark whether the registrant is a large accelerated filer, an accelerated filer, a non-accelerated filer, a smaller reporting company, or an emerging growth company. See the definitions of “large accelerated filer,” “accelerated filer,” “smaller reporting company,” and “emerging growth company” in Rule 12b-2 of the Exchange Act. |
| Large accelerated filer | ☑ | Accelerated filer | ☐ | Non-accelerated filer | ☐ | Smaller reporting company | ☐ |
| | | | | | Emerging growth company | ☐ |
| | | | | | | | | | | | | | |
| If an emerging growth company, indicate by check mark if the registrant has elected not to use the extended transition period for complying with any new or revised financial accounting standards provided pursuant to Section 13(a) of the Exchange Act. | ☐ |
| | | | |
| | | | | | | | | | | | | | |
| Indicate by check mark whether the registrant is a shell company (as defined in Rule 12b-2 of the Exchange Act). | Yes | ☐ | No | ☑ |
The number of shares outstanding of the registrant’s common stock, $0.01 par value per share, as of February 3, 2023,2, 2024, was 41,098,58541,311,296 shares.
| | | | | | | | |
| | COMPASS MINERALS INTERNATIONAL, INC. |
TABLE OF CONTENTS
| | | | | | | | |
| PART I. FINANCIAL INFORMATION | Page |
| | |
| | |
| | |
| | |
| | |
| | |
| | |
| | |
| | |
| | |
| | |
| | |
| | |
| | |
| | |
| | |
| | |
| | |
| | |
| | |
| | |
| PART II. OTHER INFORMATION | |
| | |
| | |
| | |
| | |
| | |
| | |
| | |
| | |
| | |
| | |
| | |
| | |
| | |
| | |
| | |
| |
| | | | | | | | |
| | COMPASS MINERALS INTERNATIONAL, INC. |
PART I. FINANCIAL INFORMATION
Item 1. Financial Statements
CONSOLIDATED BALANCE SHEETS
(in millions, except share data)
| | (Unaudited) | |
| | | (Unaudited) | |
| | | December 31,
2022 | | September 30,
2022 | December 31,
2023 | | September 30,
2023 |
| ASSETS | ASSETS | ASSETS |
| Current assets: | Current assets: | |
| Cash and cash equivalents | Cash and cash equivalents | $ | 146.1 | | | $ | 46.1 | |
| Receivables, less allowance for doubtful accounts of $3.8 at December 31, 2022 and $3.4 at September 30, 2022 | 202.2 | | | 167.2 | |
| Cash and cash equivalents | |
| Cash and cash equivalents | |
| Receivables, less allowance for doubtful accounts of $2.6 at December 31, 2023 and $2.3 at September 30, 2023 | |
| Inventories | Inventories | 301.0 | | | 304.4 | |
| | Other | |
| Other | |
| Other | Other | 35.4 | | | 44.3 | |
| Total current assets | Total current assets | 684.7 | | | 562.0 | |
| Property, plant and equipment, net | Property, plant and equipment, net | 774.8 | | | 776.6 | |
| Intangible assets, net | Intangible assets, net | 45.3 | | | 45.4 | |
| Goodwill | Goodwill | 56.8 | | | 56.4 | |
| Equity method investments | 45.7 | | | 46.6 | |
| | Other | |
| Other | |
| Other | Other | 157.4 | | | 156.5 | |
| Total assets | Total assets | $ | 1,764.7 | | | $ | 1,643.5 | |
| LIABILITIES AND STOCKHOLDERS’ EQUITY | | LIABILITIES AND STOCKHOLDERS’ EQUITY | |
| LIABILITIES AND STOCKHOLDERS’ EQUITY | |
| Current liabilities: | Current liabilities: | |
| Current portion of long-term debt | |
| Current portion of long-term debt | |
| Current portion of long-term debt | Current portion of long-term debt | $ | — | | | $ | — | |
| Accounts payable | Accounts payable | 113.4 | | | 114.7 | |
| Accrued salaries and wages | Accrued salaries and wages | 15.4 | | | 22.2 | |
| Income taxes payable | Income taxes payable | 6.6 | | | 1.0 | |
| Accrued interest | Accrued interest | 8.5 | | | 14.1 | |
| | Accrued expenses and other current liabilities | Accrued expenses and other current liabilities | 74.8 | | | 81.1 | |
| Accrued expenses and other current liabilities | |
| Accrued expenses and other current liabilities | |
| Total current liabilities | Total current liabilities | 218.7 | | | 233.1 | |
| Long-term debt, net of current portion | Long-term debt, net of current portion | 832.1 | | | 947.6 | |
| Deferred income taxes, net | Deferred income taxes, net | 59.2 | | | 63.4 | |
| Other noncurrent liabilities | Other noncurrent liabilities | 144.9 | | | 143.0 | |
Commitments and contingencies (Note 10) | |
Commitments and contingencies (Note 9) | | Commitments and contingencies (Note 9) | | | |
| Stockholders’ equity: | Stockholders’ equity: | |
| Common stock: $0.01 par value, 200,000,000 authorized shares; 42,197,964 issued shares at December 31, 2022 and 35,367,264 issued shares at September 30, 2022 | 0.4 | | | 0.4 | |
| Common stock: $0.01 par value, 200,000,000 authorized shares; 42,197,964 issued shares at December 31, 2023 and September 30, 2023 | |
| Common stock: $0.01 par value, 200,000,000 authorized shares; 42,197,964 issued shares at December 31, 2023 and September 30, 2023 | |
| Common stock: $0.01 par value, 200,000,000 authorized shares; 42,197,964 issued shares at December 31, 2023 and September 30, 2023 | |
| Additional paid-in capital | Additional paid-in capital | 403.4 | | | 152.1 | |
| Treasury stock, at cost — 1,174,077 shares at December 31, 2022 and 1,196,300 shares at September 30, 2022 | (7.6) | | | (7.3) | |
| Treasury stock, at cost — 976,106 shares at December 31, 2023 and 1,038,168 shares at September 30, 2023 | |
| Retained earnings | Retained earnings | 219.9 | | | 226.5 | |
| Accumulated other comprehensive loss | Accumulated other comprehensive loss | (106.3) | | | (115.3) | |
| Total stockholders’ equity | Total stockholders’ equity | 509.8 | | | 256.4 | |
| Total liabilities and stockholders’ equity | Total liabilities and stockholders’ equity | $ | 1,764.7 | | | $ | 1,643.5 | |
The accompanying notes are an integral part of the consolidated financial statements.
| | | | | | | | |
| | COMPASS MINERALS INTERNATIONAL, INC. |
CONSOLIDATED STATEMENTS OF OPERATIONS
(Unaudited, in millions, except share and per share data)
| | | |
| | |
| | |
| | | | Three Months Ended
December 31, | |
| | | 2022 | | 2021 | |
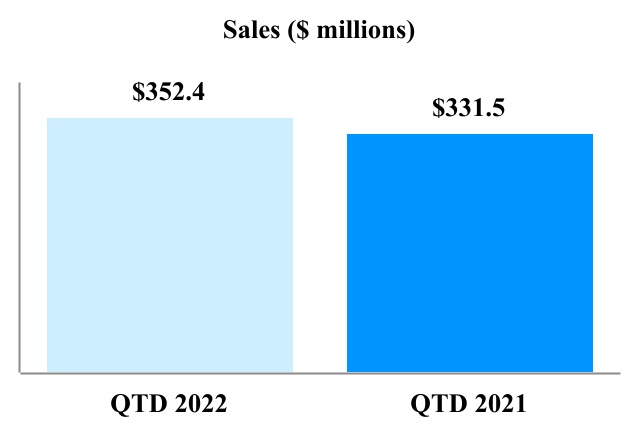
| Sales | Sales | $ | 352.4 | | | $ | 331.5 | | |
| Sales | |
| Sales | |
| Shipping and handling cost | |
| Shipping and handling cost | |
| Shipping and handling cost | Shipping and handling cost | 107.4 | | | 95.7 | | |
| Product cost | Product cost | 175.0 | | | 175.9 | | |
| Product cost | |
| Product cost | |
| Gross profit | |
| Gross profit | |
| Gross profit | Gross profit | 70.0 | | | 59.9 | | |
| Selling, general and administrative expenses | Selling, general and administrative expenses | 42.1 | | | 39.5 | | |
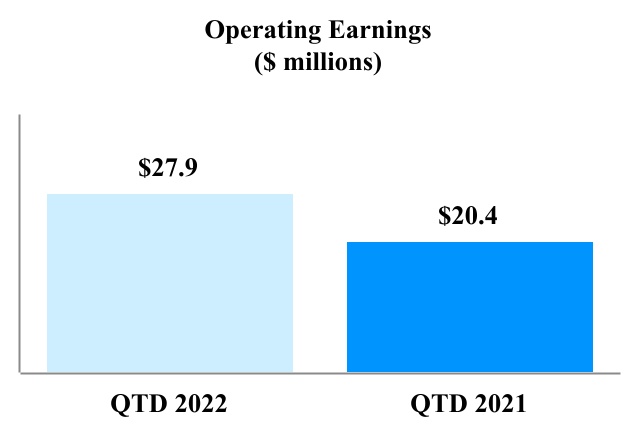
| Operating earnings | 27.9 | | | 20.4 | | |
| Selling, general and administrative expenses | |
| Selling, general and administrative expenses | |
| Loss on impairment of long-lived assets, net | |
| Loss on impairment of long-lived assets, net | |
| Loss on impairment of long-lived assets, net | |
| Other operating expense | |
| Other operating expense | |
| Other operating expense | |
| Operating (loss) earnings | |
| Operating (loss) earnings | |
| Operating (loss) earnings | |
| | Other (income) expense: | |
| | Other (income) expense: | |
| | Other (income) expense: | Other (income) expense: | | |
| Interest income | Interest income | (1.1) | | | (0.3) | | |
| Interest income | |
| Interest income | |
| Interest expense | Interest expense | 13.9 | | | 13.9 | | |
| Loss (gain) on foreign exchange | 2.5 | | | (0.4) | | |
| Interest expense | |
| Interest expense | |
| Loss on foreign exchange | |
| Loss on foreign exchange | |
| Loss on foreign exchange | |
| Net loss in equity investee | Net loss in equity investee | 0.9 | | | 0.4 | | |
| Net loss in equity investee | |
| Net loss in equity investee | |
| | Other expense, net | Other expense, net | 0.1 | | | 0.1 | | |
| Earnings from continuing operations before income taxes | 11.6 | | | 6.7 | | |
| Income tax expense (benefit) from continuing operations | 11.9 | | | (1.2) | | |
| Net (loss) earnings from continuing operations | (0.3) | | | 7.9 | | |
| Net loss from discontinued operations | — | | | (5.5) | | |
| Net (loss) earnings | $ | (0.3) | | | $ | 2.4 | | |
| | Basic net (loss) earnings from continuing operations per common share | $ | (0.01) | | | $ | 0.23 | | |
| Basic net loss from discontinued operations per common share | — | | | (0.16) | | |
| Basic net (loss) earnings per common share | $ | (0.01) | | | $ | 0.07 | | |
| Other expense, net | |
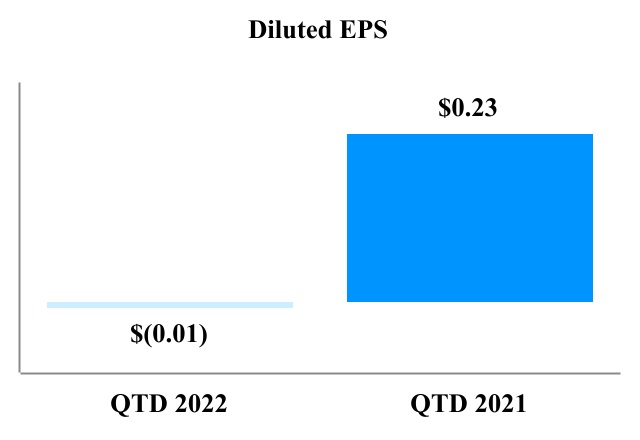
| | Diluted net (loss) earnings from continuing operations per common share | $ | (0.01) | | | $ | 0.23 | | |
| Diluted net loss from discontinued operations per common share | — | | | (0.16) | | |
| Diluted net (loss) earnings per common share | $ | (0.01) | | | $ | 0.07 | | |
| Other expense, net | |
| (Loss) earnings before income taxes | |
| (Loss) earnings before income taxes | |
| (Loss) earnings before income taxes | |
| Income tax expense | |
| Income tax expense | |
| Income tax expense | |
| Net loss | |
| Net loss | |
| Net loss | |
| | Basic net loss per common share | |
| | Basic net loss per common share | |
| | Basic net loss per common share | |
| | Diluted net loss per common share | |
| | Diluted net loss per common share | |
| | Diluted net loss per common share | |
| | Weighted-average common shares outstanding (in thousands): | |
| | Weighted-average common shares outstanding (in thousands): | |
| | Weighted-average common shares outstanding (in thousands): | Weighted-average common shares outstanding (in thousands): | | |
| Basic | Basic | 39,751 | | | 34,060 | | |
| Basic | |
| Basic | |
| Diluted | Diluted | 39,751 | | | 34,089 | | |
| Diluted | |
| Diluted | |
The accompanying notes are an integral part of the consolidated financial statements.
| | | | | | | | |
| | COMPASS MINERALS INTERNATIONAL, INC. |
CONSOLIDATED STATEMENTS OF COMPREHENSIVE (LOSS) INCOME (LOSS)
(Unaudited, in millions)
| | | | | | | | | | | | | | | |
| | Three Months Ended
December 31, | | |
| | 2022 | | 2021 | | | | |
| Net (loss) earnings | $ | (0.3) | | | $ | 2.4 | | | | | |
| Other comprehensive income (loss): | | | | | | | |
| Unrealized gain from change in pension obligations, net of tax of $0.0 for the three months ended December 31, 2022 and 2021 | 0.1 | | | 0.1 | | | | | |
| Unrealized loss on cash flow hedges, net of tax of $0.4 and $0.7 for the three months ended December 31, 2022 and 2021, respectively | (2.8) | | | (2.0) | | | | | |
| Cumulative translation adjustment | 11.7 | | | (3.8) | | | | | |
| Comprehensive income (loss) | $ | 8.7 | | | $ | (3.3) | | | | | |
| | | | | | | | | | | | | | | |
| | Three Months Ended
December 31, | | |
| | 2023 | | 2022 | | | | |
| Net loss | $ | (75.1) | | | $ | (0.3) | | | | | |
| Other comprehensive income (loss): | | | | | | | |
| Unrealized gain from change in pension obligations, net of tax of $(0.1) and $0.0 for the three months ended December 31, 2023 and 2022, respectively | 0.2 | | | 0.1 | | | | | |
| Unrealized loss on cash flow hedges, net of tax of $0.0 and $0.4 for the three months ended December 31, 2023 and 2022, respectively | (1.8) | | | (2.8) | | | | | |
| Cumulative translation adjustment | 14.6 | | | 11.7 | | | | | |
| Comprehensive (loss) income | $ | (62.1) | | | $ | 8.7 | | | | | |
The accompanying notes are an integral part of the consolidated financial statements.
| | | | | | | | |
| | COMPASS MINERALS INTERNATIONAL, INC. |
CONSOLIDATED STATEMENTS OF STOCKHOLDERS’ EQUITY
For the three months ended December 31, 20222023 and 20212022
(Unaudited, in millions)
| | | | Common
Stock | | Additional
Paid-In
Capital | | Treasury
Stock | | Retained
Earnings | | Accumulated
Other
Comprehensive
(Loss) Income | | Total | | Common
Stock | | Additional
Paid-In
Capital | | Treasury
Stock | | Retained
Earnings | | Accumulated
Other
Comprehensive
Loss | | Total |
| Balance, September 30, 2022 | $ | 0.4 | | | $ | 152.1 | | | $ | (7.3) | | | $ | 226.5 | | | $ | (115.3) | | | $ | 256.4 | |
| Balance, September 30, 2023 | |
| Comprehensive (loss) income | Comprehensive (loss) income | — | | | — | | | — | | | (0.3) | | | 9.0 | | | 8.7 | |
| Dividends on common stock ($0.15 per share) | Dividends on common stock ($0.15 per share) | — | | | — | | | — | | | (6.3) | | | — | | | (6.3) | |
| Private placement of common stock | — | | | 240.7 | | | — | | | — | | | — | | | 240.7 | |
| Shares issued for stock units, net of shares withheld for taxes | Shares issued for stock units, net of shares withheld for taxes | — | | | — | | | (0.3) | | | — | | | — | | | (0.3) | |
| | Stock-based compensation | Stock-based compensation | — | | | 10.6 | | | — | | | — | | | — | | | 10.6 | |
| Balance, December 31, 2022 | $ | 0.4 | | | $ | 403.4 | | | $ | (7.6) | | | $ | 219.9 | | | $ | (106.3) | | | $ | 509.8 | |
| Stock-based compensation | |
| Stock-based compensation | |
| Balance, December 31, 2023 | |
|
| | | | | | | | | | | | | | | | | | | | | | | | | | | | | | | | | | | |
| | Common
Stock | | Additional
Paid-In
Capital | | Treasury
Stock | | Retained
Earnings | | Accumulated
Other
Comprehensive
Loss | | Total |
| Balance, September 30, 2021 | $ | 0.4 | | | $ | 136.3 | | | $ | (5.5) | | | $ | 272.4 | | | $ | (110.5) | | | $ | 293.1 | |
| Comprehensive income (loss) | — | | | — | | | — | | | 2.4 | | | (5.7) | | | (3.3) | |
| Dividends on common stock ($0.15 per share) | — | | | (0.1) | | | — | | | (5.2) | | | — | | | (5.3) | |
| | | | | | | | | | | |
| Stock options exercised, net of shares withheld for taxes | — | | | 0.2 | | | — | | | — | | | — | | | 0.2 | |
| Stock-based compensation | — | | | 3.3 | | | — | | | — | | | — | | | 3.3 | |
| Balance, December 31, 2021 | $ | 0.4 | | | $ | 139.7 | | | $ | (5.5) | | | $ | 269.6 | | | $ | (116.2) | | | $ | 288.0 | |
| | | | | | | | | | | |
| | | | | | | | | | | |
| | | | | | | | | | | |
| | | | | | | | | | | |
| | | | | | | | | | | |
| | | | | | | | | | | |
| | | | | | | | | | | |
| | | | | | | | | | | |
| | | | | | | | | | | |
| | | | | | | | | | | |
| | | | | | | | | | | |
| | | | | | | | | | | | | | | | | | | | | | | | | | | | | | | | | | | |
| | Common
Stock | | Additional
Paid-In
Capital | | Treasury
Stock | | Retained
Earnings | | Accumulated
Other
Comprehensive
Loss | | Total |
| Balance, September 30, 2022 | $ | 0.4 | | | $ | 152.1 | | | $ | (7.3) | | | $ | 226.5 | | | $ | (115.3) | | | $ | 256.4 | |
| Comprehensive (loss) income | — | | | — | | | — | | | (0.3) | | | 9.0 | | | 8.7 | |
| Dividends on common stock ($0.15 per share) | — | | | — | | | — | | | (6.3) | | | — | | | (6.3) | |
| Private placement of common stock | — | | | 240.7 | | | — | | | — | | | — | | | 240.7 | |
| Shares issued for stock units, net of shares withheld for taxes | — | | | — | | | (0.3) | | | — | | | — | | | (0.3) | |
| Stock-based compensation | — | | | 10.6 | | | — | | | — | | | — | | | 10.6 | |
| Balance, December 31, 2022 | $ | 0.4 | | | $ | 403.4 | | | $ | (7.6) | | | $ | 219.9 | | | $ | (106.3) | | | $ | 509.8 | |
| | | | | | | | | | | |
| | | | | | | | | | | |
| | | | | | | | | | | |
| | | | | | | | | | | |
| | | | | | | | | | | |
| | | | | | | | | | | |
| | | | | | | | | | | |
| | | | | | | | | | | |
| | | | | | | | | | | |
The accompanying notes are an integral part of the consolidated financial statements.
| | | | | | | | |
| | COMPASS MINERALS INTERNATIONAL, INC. |
CONSOLIDATED STATEMENTS OF CASH FLOWS
(Unaudited, in millions)
| | | | Three Months Ended
December 31, | | Three Months Ended
December 31, |
| | | 2022 | | 2021 | | 2023 | | 2022 |
| Cash flows from operating activities: | Cash flows from operating activities: | |
| Net (loss) earnings | $ | (0.3) | | | $ | 2.4 | |
| Adjustments to reconcile net (loss) earnings to net cash flows provided by operating activities: | |
| Net loss | |
| Net loss | |
| Net loss | |
| Adjustments to reconcile net loss to net cash flows provided by operating activities: | |
| Depreciation, depletion and amortization | |
| Depreciation, depletion and amortization | |
| Depreciation, depletion and amortization | Depreciation, depletion and amortization | 23.9 | | | 28.3 | |
| Amortization of deferred financing costs | Amortization of deferred financing costs | 0.7 | | | 0.7 | |
| | Stock-based compensation | Stock-based compensation | 10.6 | | | 3.3 | |
| Stock-based compensation | |
| Stock-based compensation | |
| Deferred income taxes | Deferred income taxes | (5.4) | | | (1.4) | |
| Unrealized foreign exchange loss | Unrealized foreign exchange loss | 2.0 | | | 2.2 | |
| Loss on impairment of long-lived assets | — | | | 8.4 | |
| Loss on impairment of long-lived assets, net | |
| Net loss in equity investees | Net loss in equity investees | 0.9 | | | 0.4 | |
| | Other, net | Other, net | 1.0 | | | 0.1 | |
| Other, net | |
| Other, net | |
| Changes in operating assets and liabilities: | Changes in operating assets and liabilities: | |
| Receivables | |
| Receivables | |
| Receivables | Receivables | (34.0) | | | (68.8) | |
| Inventories | Inventories | 5.1 | | | 12.6 | |
| Other assets | Other assets | 10.4 | | | (1.2) | |
| Accounts payable and accrued expenses and other current liabilities | Accounts payable and accrued expenses and other current liabilities | (13.1) | | | 2.7 | |
| Other liabilities | Other liabilities | 0.3 | | | (4.0) | |
| Net cash provided by (used in) operating activities | 2.1 | | | (14.3) | |
| Net cash (used in) provided by operating activities | |
| Cash flows from investing activities: | Cash flows from investing activities: | |
| Capital expenditures | Capital expenditures | (19.9) | | | (14.5) | |
| Capital expenditures | |
| Capital expenditures | |
| | Investments in equity method investees | — | | | (28.2) | |
| | Other, net | |
| | Other, net | |
| | Other, net | Other, net | (0.2) | | | 1.5 | |
| Net cash used in investing activities | Net cash used in investing activities | (20.1) | | | (41.2) | |
| Cash flows from financing activities: | Cash flows from financing activities: | |
| Proceeds from revolving credit facility borrowings | |
| Proceeds from revolving credit facility borrowings | |
| Proceeds from revolving credit facility borrowings | Proceeds from revolving credit facility borrowings | 16.7 | | | 162.4 | |
| Principal payments on revolving credit facility borrowings | Principal payments on revolving credit facility borrowings | (168.2) | | | (122.8) | |
| Proceeds from issuance of long-term debt | Proceeds from issuance of long-term debt | 35.4 | | | 32.5 | |
| Principal payments on long-term debt | Principal payments on long-term debt | — | | | (3.3) | |
| Net proceeds from private placement of common stock | Net proceeds from private placement of common stock | 240.7 | | | — | |
| Dividends paid | Dividends paid | (6.3) | | | (5.3) | |
| | Proceeds from stock options exercised | — | | | 0.2 | |
| | Shares withheld to satisfy employee tax obligations | |
| | Shares withheld to satisfy employee tax obligations | |
| | Shares withheld to satisfy employee tax obligations | Shares withheld to satisfy employee tax obligations | (0.3) | | | — | |
| Other, net | Other, net | (0.3) | | | (0.4) | |
| Net cash provided by financing activities | Net cash provided by financing activities | 117.7 | | | 63.3 | |
| Effect of exchange rate changes on cash and cash equivalents | Effect of exchange rate changes on cash and cash equivalents | 0.3 | | | 0.1 | |
| Net change in cash and cash equivalents | Net change in cash and cash equivalents | 100.0 | | | 7.9 | |
| Cash and cash equivalents, beginning of the year | Cash and cash equivalents, beginning of the year | 46.1 | | | 21.0 | |
| Cash and cash equivalents, end of period | Cash and cash equivalents, end of period | 146.1 | | | 28.9 | |
| Less: cash and cash equivalents included in current assets held for sale | — | | | (8.6) | |
| Cash and cash equivalents of continuing operations, end of period | $ | 146.1 | | | $ | 20.3 | |
| |
| | Supplemental cash flow information: | Supplemental cash flow information: | | | | Supplemental cash flow information: | | | |
| Interest paid, net of amounts capitalized | Interest paid, net of amounts capitalized | $ | 18.8 | | | $ | 18.6 | |
| Income taxes paid, net of refunds | Income taxes paid, net of refunds | $ | 2.0 | | | $ | 5.5 | |
The accompanying notes are an integral part of the consolidated financial statements.
| | | | | | | | |
| | COMPASS MINERALS INTERNATIONAL, INC. |
NOTES TO CONSOLIDATED FINANCIAL STATEMENTS
(Unaudited)
1. Accounting Policies and Basis of Presentation:
Compass Minerals International, Inc. (“CMI”), through its subsidiaries (collectively, the “Company”), is a leading global provider of essential minerals focused on safely delivering where and when it matters to help solve nature’s challenges for customers and communities. The Company��sCompany’s salt products help keep roadways safe during winter weather and are used in numerous other consumer, industrial, chemical and agricultural applications. Its plant nutrition business is the leading North American producer of sulfate of potash (“SOP”), which is used in the production of specialty fertilizers for high-value crops and turf and helps improve the quality and yield of crops, while supporting sustainable agriculture. The Company’s principal products are salt, consisting of sodium chloride and magnesium chloride, and SOP. The Company’s next-generation fire retardants help to slow, stop and prevent wildfires through the use of high-performing and environmentally-friendly products. Additionally, the Company ishad been pursuing the development of a sustainable lithium brinesalt resource to support the North American battery market and is a minority ownermarket. However, as described in Note 5, the Company has terminated its pursuit of Fortress North America, LLC (“Fortress”), a next-generation fire retardant company.the lithium development. The Company’s production sites are located in the United States (“U.S.”), Canada and the United Kingdom (“U.K.”). The Company also provides records management services to businesses located in the U.K. Except where otherwise noted, references to North America include only the continental U.S. and Canada, and references to the U.K. include only England, Scotland and Wales. References to “Compass Minerals,” “our,” “us” and “we” refer to CMI and its consolidated subsidiaries.
CMI is a holding company with no significant operations other than those of its wholly-owned subsidiaries. The consolidated financial statements include the accounts of CMI and its wholly-owned domestic and foreign subsidiaries. All significant intercompany balances and transactions have been eliminated in consolidation.
The accompanying unaudited consolidated financial statements have been prepared in accordance with U.S. generally accepted accounting principles (“U.S. GAAP”) for interim financial information and with the instructions to Form 10-Q and Article 10 of Regulation S-X. Accordingly, they do not include all of the information and footnotes required by U.S. GAAP for complete consolidated financial statements. These unaudited consolidated financial statements should be read in conjunction with the consolidated financial statements of the Company for the annual period ended September 30, 2022,2023, as filed with the Securities and Exchange Commission (the “SEC”) in its Annual Report on Form 10-K on December 14, 2022.November 29, 2023 (“2023 Form 10-K”). In the opinion of management, all adjustments, consisting of normal recurring adjustments considered necessary for a fair presentation, have been included.
The Company experiences a substantial amount of seasonality in its sales, including its salt deicing salt product sales. As a result,Consequently, Salt segment sales and operating income are generally higher in the first and second fiscal quarters (ending December 31 and March 31) and lower during the third and fourth fiscal quarters (ending June 30 and September 30) of each year.. In particular, sales of highway and consumer deicing salt and magnesium chloride products vary based on the severity of the winter conditions in areas where the products are used. Following industry practice in North America and the U.K., the Company seeks to stockpile sufficient quantities of deicing salt throughout the first, third and fourth fiscal quarters (ending December 31, June 30 and September 30) to meet the estimated requirements for the winter season. Production of deicing salt can also vary based on the severity or mildness of the preceding winter season. Due to the seasonal nature of the deicing product lines, operating results for the interim periods are not necessarily indicative of the results that may be expected for the full fiscal year. The Company’s plant nutrition business is also seasonal. As a result, the Company and its customers generally build inventories during the plant nutrition business’ low demand periods of the year (which are typically winter and summer, but can vary due to weather and other factors) to ensure timely product availability during the peak sales seasons (which are typically spring and autumn, but can also vary due to weather and other factors). Lastly, the results of the Company’s fire retardant business are also seasonal with peak demand for fire retardant products and services occurring from June through September.
Significant Accounting Policies
The Company’s significant accounting policies are detailed in “Note 2 – Summary of Significant Accounting Policies” within Part II, Item 8 of its Annual Report on2023 Form 10-K for the annual period ended September 30, 2022. The Company reports its financial results10-K. There were no material changes in our significant accounting policies from discontinued operations and continuing operations separately to recognize the financial impact of disposal transactions apart from ongoing operations. Discontinued operations reporting occurs when a component or a group of components of an entity has been disposed or classified as held for sale and represents a strategic shift that has a major effect on the entity’s operations and financial results. In the Company’s Consolidated Statements of Cash Flows, the cash flows from discontinued operations are not separately classified. Unless otherwise indicated, amounts providedthose described in these Notes pertain to continuing operations. See Note 2 for information on discontinued operations and Note 11 for information on the Company’s reportable segments.our 2023 Form 10-K.
Recent Accounting Pronouncements
In November 2023, the Financial Accounting Standards Board (“FASB”) issued Accounting Standards Update (“ASU”) 2023-07, “Segment Reporting (Topic 280): Improvements to Reportable Segment Disclosures”, which updates reportable
| | | | | | | | |
| | COMPASS MINERALS INTERNATIONAL, INC. |
Recent Accounting Pronouncementssegment disclosure requirements primarily to include enhanced disclosures about significant segment expenses. The amendments are effective for fiscal years beginning after December 15, 2023, and for interim periods within fiscal years beginning after December 15, 2024. Early adoption is permitted. The amendments should be applied retrospectively to all prior periods presented in the financial statements. Management is currently evaluating this ASU to determine its impact on the Company's disclosures.
In December 2023, the FASB issued ASU 2023-09, “Income Taxes (Topic 740): Improvements to Income Tax Disclosures”, which updates income tax disclosures by requiring consistent categories and additional disaggregation of information in the rate reconciliation and income taxes paid by jurisdiction. The Company has evaluated all of the recently issued, but not yetamendments are effective accounting standards that have been issued or proposed by the Financial Accounting Standards Board or other standards-setting bodies through the filing date of these unaudited consolidated financial statements and does not believe the futurefor fiscal years beginning after December 15, 2024. Early adoption of any such pronouncements will have a materialis permitted. The amendments should be applied prospectively; however, retrospective application is permitted. Management is currently evaluating this ASU to determine its impact on its consolidated financial statements.
Strategic Evaluation and Plan to Sell Businesses
Following an evaluation of the strategic fit of certain of the Company’s businesses and subsequent restructuring of its former South American Plant Nutrition segment to enable separate sales processes for its chemicals and specialty plant nutrition businesses and equity investment in Fermavi Eletroquímica Ltda. (“Fermavi”), in fiscal 2021 the Company’s Board of Directors approved the plan to sell each of these businesses and the North America micronutrient business (the “Specialty Businesses”) with a goal of reducing the Company’s leverage and enabling increased focus on optimizing the Company’s core businesses.
The Company concluded that the sale of the Specialty Businesses represented a strategic shift for the Company that would have a material effect on its operations and financial results. Consequently, the Specialty businesses were reclassified as discontinued operations on the Consolidated Statements of Operations. See Note 2 for further discussion of the sales of these businesses.
Unless otherwise indicated, amounts provided in these Notes pertain to continuing operations.disclosures.
2. Discontinued Operations:Business Acquisition:
During fiscal 2021Beginning in 2020, the Company sold its South America specialty plant nutrition business andbegan a series of equity investmentinvestments in Fermavi and itsFortress North America, micronutrient business. In connection with the saleLLC (“Fortress”), a next-generation fire retardant business dedicated to developing and producing a portfolio of its South America specialty plant nutrition businessmagnesium chloride-based fire retardant products to help combat wildfires. On May 5, 2023, the Company received netacquired the remaining 55% interest in Fortress not previously owned in exchange for an initial cash payment of approximately $318.4$18.9 million with an(net of cash held by Fortress of $6.5 million), and additional earnout paymentcontingent consideration of up to R$88$28 million Brazilian reais. On April 7, 2022,to be paid in cash and/or Compass Minerals common stock upon the achievement of certain performance measures over the next five years, and a cash earn-out based on volumes of certain Fortress fire retardant products sold over a 10-year period. Building upon the previous 45% minority ownership stake in Fortress, the transaction provided the Company received the maximum earnout possible under the termsfull ownership of the sale, or $18.5 million based on exchange rates at the time of receipt.
all Fortress assets, contracts, and intellectual property. See
Also in fiscal 2021, the Company completed the sale of its North America micronutrient business for approximately $56.7 million and its investment in Fermavi for R$45 million Brazilian reais (including R$30 million Brazilian reais of deferred purchase price). The Company received gross proceeds of approximately $2.9 million and recorded a discounted deferred proceeds receivable of approximately $4.8 million (based on exchange rates at the time of closing). As of December 31, 2022 approximately R$22.5 million Brazilian reais of deferred proceeds remains outstanding.
On April 20, 2022, the Company completed the sale of its South America chemicals business to a subsidiary of Cape Acquisitions LLC. Upon closing of the all-cash sale, the Company received gross proceeds of approximately $51.5 million based on exchange rates at the time of receipt, including a post-closing adjustment and compensation of $6.4 million for cash on hand that transferred to the buyer. The Company also paid fees of $2.4 million related to this sale. The Company recognized a loss recovery of $1.6 million during the three months ended June 30, 2022, an incremental loss from the sale of $23.1 million during the nine months ended June 30, 2022 and released $49.5 million from accumulated currency translation adjustment (“CTA”). The sale included all of the Company’s remaining operations in Brazil, concluding its previously announced plan to exit the South American market.
In measuring the assets and liabilities held for sale at fair value less estimated costs to sell, the Company completed an impairment analysis when its Board of Directors committed to a plan to sell the Specialty Businesses and the Company updated the analysis each quarter until each of the Specialty Businesses were sold.
The information below sets forth selected financial information related to the operating resultscontingent consideration as of the Specialty Businesses classified as discontinued operations. The Specialty Businesses’ revenue and expenses have been reclassified to net earnings from discontinued operations in prior periods. The Consolidated Statements of Operations present the revenue and expenses that were reclassified from the specified line items to discontinued operations.
| | | | | | | | |
| | COMPASS MINERALS INTERNATIONAL, INC. |
The following table represents summarized Consolidated Statements of Operations information of discontinued operations (in millions):
| | | | | | | | | | | |
| | | Three Months Ended
December 31, | | |
| | | 2021 | | | | |
Sales | | | $ | 22.4 | | | | | |
Shipping and handling cost | | | 1.2 | | | | | |
Product cost | | | 10.9 | | | | | |
Gross profit | | | 10.3 | | | | | |
Selling, general and administrative expenses | | | 1.6 | | | | | |
Operating earnings | | | 8.7 | | | | | |
| | | | | | | |
Loss on foreign exchange | | | 3.1 | | | | | |
Net loss on adjustment to fair value less estimated costs to sell | | | 8.4 | | | | | |
| | | | | | | |
Other income, net | | | (0.2) | | | | | |
Loss from discontinued operations before income taxes | | | (2.6) | | | | | |
Income tax expense | | | 2.9 | | | | | |
Net loss from discontinued operations | | | $ | (5.5) | | | | | |
The significant components included in the Company’s Consolidated Statements of Cash Flows for discontinued operations are as follows (in millions):
| | | | | | | |
| | | Three Months Ended
December 31, |
| | | 2021 |
| | | |
| | | |
| | | |
Loss on impairment of long-lived assets | | | $ | 8.4 | |
| | | |
Capital expenditures | | | (0.7) | |
| | | |
| | | |
| | | |
| | | |
| | | |
| | | |
| | | |
3. Revenues:
Nature of Products and ServicesDeferred Revenue
The Company’s Salt segment products include salt and magnesium chloride for use in road deicing and dust control, food processing, water softening, and agricultural and industrial applications. The Company’s Plant Nutrition segment produces and markets SOP in various grades worldwide to distributors and retailers of crop inputs, as well as growers and for industrial uses. In the U.K., the Company operates a records management business utilizing excavated areas of its Winsford salt mine with one other location in London, England.
Identifying the Contract
The Company accounts for a customer contract when there is approval and commitment from both parties, the rights of the parties and payment terms are identified, the contract has commercial substance and collectability of consideration is probable.
Identifying the Performance Obligations
At contract inception, the Company assesses the goods and services it has promised to its customers and identifies a performance obligation for each promise to transfer to the customer a distinct good or service (or bundle of goods or services). Determining whether products and services are considered distinct performance obligations that should be accounted for separately or aggregated together may require significant judgment.
| | | | | | | | |
| | COMPASS MINERALS INTERNATIONAL, INC. |
Identifying and Allocating the Transaction Price
The Company’s revenues are measured based on consideration specified in the customer contract, net of any sales incentives and amounts collected on behalf of third parties such as sales taxes. In certain cases, the Company’s customerDeferred revenue represents billings under non-cancellable contracts may include promises to transfer multiple products and services to a customer. For multiple-element arrangements, the Company generally allocates the transaction price to each performance obligation in proportion to its stand-alone selling price.
When Performance Obligations Are Satisfied
The vast majority of the Company’s revenues are recognized at a point in time when the performance obligations are satisfied based upon transfer of control of the product or service to a customer. To determine when the control of goods is transferred, the Company typically assesses, among other things, the shipping terms of the contract, as shipping is an indicator of transfer of control. Some of the Company’s products are sold when the control of the goods transfers to the customer at the time of shipment. There are also instances when the Company provides shipping services to deliver its products. Shipping and handling costs that occur before the customer obtains control of the goods are deemed to be fulfillment activities and are accounted for as fulfillment costs. The Company has made an accounting policy election to recognize any shipping and handling costs that are incurred after the customer obtains control of the goods as fulfillment costs which are accrued at the time of revenue recognition.
Significant Payment Terms
The customer contract states the final terms of the sale, including the description, quantity and price of eachrelated product or service purchased. Payment is typically due in full within 30 days of delivery. The Company does not adjust the consideration for the effects of a significant financing component if the Company expects, at contract inception, that the period between when the good or service is transferred to the customercustomer. The portion of deferred revenue that is anticipated to be recognized as revenue during the succeeding twelve-month period is recorded in accrued expenses and when the customer pays for that good or service will be one year or less.
Refunds, Returns and Warranties
The Company’s products are generally not sold with a right of returnother current liabilities and the Company does not generally provide credits or incentives, which may be required to be accounted forremaining portion is recorded in other non-current liabilities on the Consolidated Balance Sheets. Deferred revenue as variable consideration when estimating the amount of revenue to be recognized. The Company uses historical experience to estimate accruals for refunds due to manufacturing or other defects.December 31, 2023 and September 30, 2023 was approximately $3.5 million and $8.5 million, respectively.
See Note 1110 for disaggregation of sales by segment, type and geographical region.
4. Inventories:
Inventories consist of the following (in millions):
| | | | December 31,
2022 | | September 30,
2022 | | December 31,
2023 | | September 30,
2023 |
| Finished goods | Finished goods | $ | 242.3 | | | $ | 251.6 | |
| Raw materials and supplies | Raw materials and supplies | 58.7 | | | 52.8 | |
| Total inventories | Total inventories | $ | 301.0 | | | $ | 304.4 | |
| | | | | | | | |
| | COMPASS MINERALS INTERNATIONAL, INC. |
5. Property, Plant and Equipment, Net:
Property, plant and equipment, net, consists of the following (in millions):
| | | | December 31,
2022 | | September 30,
2022 | | December 31,
2023 | | September 30,
2023 |
| Land, buildings and structures, and leasehold improvements | Land, buildings and structures, and leasehold improvements | $ | 543.0 | | | $ | 534.8 | |
| Machinery and equipment | Machinery and equipment | 1,058.2 | | | 1,026.3 | |
| Office furniture and equipment | Office furniture and equipment | 56.9 | | | 56.8 | |
| Mineral interests | Mineral interests | 168.7 | | | 167.1 | |
| Construction in progress | Construction in progress | 48.0 | | | 64.3 | |
| | | 1,874.8 | | | 1,849.3 | |
| Less: accumulated depreciation and depletion | Less: accumulated depreciation and depletion | (1,100.0) | | | (1,072.7) | |
| Property, plant and equipment, net | Property, plant and equipment, net | $ | 774.8 | | | $ | 776.6 | |
The Company had been pursuing the development of a sustainable lithium salt resource to support the North American battery market. The passage of Utah House Bill 513 in March 2023 and the subsequent rulemaking process altered certain aspects of the regulatory landscape that will govern the development of lithium at the Great Salt Lake, introducing uncertainty into how development would proceed. As previously disclosed in the Company’s 2023 Form 10-K, the Company indefinitely paused new investment in its lithium development project pending greater clarity on the evolving regulatory environment in Utah. In December of 2023, a revised draft of the aforementioned rulemaking was published that continued to be, in the Company's assessment, adverse to its lithium development project. In addition, in December of 2023, the Company further refined its engineering estimates that, taken together with the proposed rules and decline in market price for lithium products, would result in inadequate risk-adjusted returns on capital.
On January 23, 2024, the Company severed certain members of its lithium development team and terminated its pursuit of the lithium development. Consequently, the Company evaluated the capitalized assets, including site preparation, project engineering, equipment and materials and capitalized labor and interest. As a result, the Company recorded an impairment charge of $74.8 million, including $7.6 million associated with future commitments, as of December 31, 2023 to reflect the assets at their estimated fair value, considering equipment expected to be used by the on-going business and amounts estimated to be recoverable through returns or salvage value. Prior to recognizing an impairment, the Company had capitalized $72.7 million to its property, plant and equipment on its Consolidated Balance Sheet with approximately $5.5 million remaining as of December 31, 2023. The Company engaged a valuation specialist to assist in determining the appropriate fair value of the lithium assets and the resulting impairment charge. Given the assets are likely to either be used in other operations or liquidated at a later date, the Company utilized a market-based approach that relied on Level 3 inputs (see Note 13 for a discussion of the levels in the fair value hierarchy).
6. Goodwill and Intangible Assets, Net:Goodwill:
Amounts related toChanges in the Company’s amortizationcarrying amount of intangible assetsgoodwill are summarized as follows (in millions):
| | | | | | | | | | | | | | | |
| Three Months Ended
December 31, | | |
| 2022 | | 2021 | | | | |
| Aggregate amortization expense | $ | 0.4 | | | $ | 0.4 | | | | | |
| | | | | | | | | | | | | | | | | | | | |
| | Plant Nutrition | | Corporate & Other(a) | | Consolidated |
| Balance as of September 30, 2023 | | $ | 51.1 | | | $ | 45.7 | | | $ | 96.8 | |
| Foreign currency translation adjustment | | 0.2 | | | 0.2 | | | 0.4 | |
| Balance as of December 31, 2023 | | $ | 51.3 | | | $ | 45.9 | | | $ | 97.2 | |
Amounts(a)Includes approximately $40.0 million of goodwill related to the Company’s goodwill areacquisition of Fortress, as follows (in millions):
| | | | | | | | | | | |
| December 31,
2022 | | September 30,
2022 |
| Plant Nutrition | $ | 51.0 | | | $ | 50.9 | |
| Other | 5.8 | | | 5.5 | |
| Total | $ | 56.8 | | | $ | 56.4 | |
The change in goodwill between September 30, 2022,2023, and December 31, 20222023 was due to the impact from translating foreign-denominated amounts to U.S. dollars. As of December 31, 2022,2023, there were no indicators necessitating an interim impairment test of the Company’s reporting unitsgoodwill based on the Company’s review of operating performance, among other factors, for the relevant reporting units.
7. Equity Method Investments:
The Company uses the equity method of accounting for equity securities when it has significant influence or when it has more than a minor ownership interest or more than minor influence over an investee’s operations but does not have a controlling financial interest. Initial investments are recorded at cost (including certain transaction costs) and are adjusted by the Company’s share of the investees’ undistributed earnings and losses. The Company may recognize its share of an investee’s earnings on a lag, if an investee’s financial results are not available in a timely manner.
For certain of the Company's equity method investments, such as investments where the capital structure of the equity investment results in different liquidation rights and priorities than what is reflected by the underlying percentage ownership interests, the Company's proportionate share of net earnings is accounted for using the Hypothetical Liquidation at Book Value ("HLBV") methodology available under the equity method of accounting. When applying HLBV, the Company determines the amount that would be received if the investee were to liquidate all of its assets and distribute the resulting cash to the investors based on contractually defined liquidation priorities, assuming the net assets were liquidated at their net book value.
The Company evaluates its equity method investments for impairment whenever events or changes in circumstances indicate that the carrying amounts of such investments may not be recoverable.
| | | | | | | | |
| | COMPASS MINERALS INTERNATIONAL, INC. |
On November 2, 2021, the Company announced an investment in Fortress, a next-generation fire retardant business dedicated to developing and producing a portfolio of magnesium chloride-based fire retardant products to help combat wildfires. As of December 31, 2022, the Company has invested $50 million in Fortress in exchange for an ownership interest of approximately 45%. Under the HLBV methodology available under the equity method of accounting, the Company reflects its share of the income or loss of Fortress, net of tax, in its results each period on a one quarter reporting lag. The Company recorded $0.5 million and $0.1 million for its share of Fortress’ net losses in the three months ended December 31, 2022 and 2021, respectively.
The carrying value of the Company’s equity investment in Fortress is in excess of its share of Fortress’s net book value by approximately $27 million as of December 31, 2022. The basis difference primarily represents incremental value attributable to intangible assets and goodwill that has not been recognized in the financial statements of Fortress. The Company has liquidation preference under the terms of Fortress’ LLC agreement. Additionally, the Company has the right to purchase units from other Fortress unit holders and the right of first refusal to purchase all or any portion of any available Fortress units, both subject to certain conditions.
The balance of the Company’s net investment in Fortress of $45.3 million and $45.8 million as of December 31, 2022 and September 30, 2022, respectively is recorded in equity method investments in the Consolidated Balance Sheets. The Company also has other immaterial equity investments of $0.4 million and $0.8 million as of December 31, 2022 and September 30, 2022, respectively, for which it has recorded $0.4 million and $0.3 million for its share of losses in the three months ended December 31, 2022 and 2021, respectively.
8.7. Income Taxes:
The Company’s effective income tax rate differs from the U.S. statutory federal income tax rate primarily due to U.S. statutory depletion, state income taxes (net of federal tax benefit), nondeductible executive compensation over $1 million, foreign income, mining and withholding taxes, base erosion and anti-abuse tax, and for the period ended December 31, 2022, valuation allowances recorded on deferred tax assets. For the period ended December 31, 2021, there were also interest expense recognition differences for book and tax purposes.
Management assesses the available positive and negative evidence to estimate whether sufficient future taxable income will be generated to permit use of the existing deferred tax assets. A significant piece of objective negative evidence evaluated was the cumulative loss incurred in the U.S. over the three-year period ended December 31, 2022.2023. Such objective evidence limits the ability to consider other subjective evidence, such as the Company’s projections for future income. On the basis of this evaluation, during the three months ended December 31, 2022, a2023, an additional valuation allowance of $6.1$19.6 million has been recorded to recognize only the portion of the U.S. deferred tax assets that is more likely than not to be realized. The amount of the deferred tax assets considered realizable, however, could be adjusted if estimates of future taxable income during the carryforward period are increased or reduced or if objective negative evidence in the form of cumulative losses is no longer present and additional weight is given to subjective evidence such as the Company’s projections for income.
As of December 31, 2022,2023, and September 30, 2022,2023, the Company had $87.2 $63.1 million and $94.1$65.4 million, respectively of gross foreign federal NOL carryforwards that have no expiration date and $3.2$2.9 million at both December 31, 20222023 and September 30, 20222023 of net operating tax-effected state NOL carryforwards which expire beginning in 2035.
Canadian provincial tax authorities have challenged tax positions claimed by one of the Company’s Canadian subsidiaries and have issued tax reassessments for fiscal years 2002-2017.2002-2018. The reassessments are a result of ongoing audits and total $170.2total $189.8 million, including interest, through December 31, 2022.2023. The Company disputes these reassessments and will continue to work with thethe appropriate authorities in Canada to resolve the dispute. There is a reasonable possibility that the ultimate resolution of this dispute, and any related disputes for other open tax years, may be materially higher or lower than the amounts the Company has reserved for such disputes.disputes. In connection with this dispute, local regulations require the Company to post security with the tax authority until the dispute is resolved. The Company has posted collateral in the form of a $143.4$166.1 million performance bond and has paid $36.7$37.7 million to the Canadian tax authorities (most of which is recorded in other assets inin the Consolidated Balance Sheets at December 31, 2022,2023, and September 30, 2022)2023), which is necessary to proceed with future appeals or litigation.
The Company expects that it will be required by local regulations to provide security for additional interest on the above unresolved disputed amounts and for any future reassessments issued by these Canadian tax authorities in the form of cash, letters of credit, performance bonds, asset liens or other arrangements agreeable with the tax authorities until the disputes are resolved.
| | | | | | | | |
| | COMPASS MINERALS INTERNATIONAL, INC. |
The Company expects that the ultimate outcome of these matters will not have a material impact on its results of operations or financial condition. However, the Company can provide no assurance as to the ultimate outcome of these matters, and the impact could be material if they are not resolved in the Company’s favor. As of December 31, 2022,2023, the Company believes it has adequately reserved for these reassessments.
Additionally, the Company has other uncertain tax positions as well as assessments and disputed positions with taxing authorities in its various jurisdictions, which are consistent with those matters disclosed in the Company’s Annual Report on Form 10-K for the annual period ended September 30, 2022.2023 Form10-K.
9.
| | | | | | | | |
| | COMPASS MINERALS INTERNATIONAL, INC. |
8. Long-Term Debt:
Long-term debt consists of the following (in millions):
| | | | December 31,
2022 | | September 30,
2022 | | December 31,
2023 | | September 30,
2023 |
| 4.875% Senior Notes due July 2024 | $ | 250.0 | | | $ | 250.0 | |
| Term Loan due January 2025 | 16.9 | | | 16.9 | |
| Revolving Credit Facility due January 2025 | — | | | 151.5 | |
| 6.75% Senior Notes due December 2027 | 6.75% Senior Notes due December 2027 | 500.0 | | | 500.0 | |
| Term Loan due May 2028 | |
| Revolving Credit Facility due May 2028 | |
| AR Securitization Facility expires June 2025 | AR Securitization Facility expires June 2025 | 72.9 | | | 37.5 | |
| 839.8 | | | 955.9 | |
| 919.2 | |
| Less unamortized debt issuance costs | Less unamortized debt issuance costs | (7.7) | | | (8.3) | |
| Total debt | Total debt | 832.1 | | | 947.6 | |
| Less current portion | Less current portion | — | | | — | |
| Long-term debt | Long-term debt | $ | 832.1 | | | $ | 947.6 | |
|
As of December 31, 2022,2023, the term loan and revolving credit facility under the Company’s credit agreement entered into on November 26, 2019 (as amended, the “Credit Agreement”)2023 Credit Agreement were secured by substantially all existing and future U.S. assets of the Company, the Goderich mine in Ontario, Canada and capital stock of certain subsidiaries. As of December 31, 2022, the2023 and September 30, 2023, the weighted average interest rate on all borrowings outstanding under the term loan under the Credit Agreement was approximately 6.4%.7.9% and 7.8%, respectively. Depending on the type, borrowings under the 2023 Credit Agreement accrue interest at a rate per annum equal to the Adjusted Term SOFR Rate, the Adjusted EURIBO Rate, Prime Rate or the CDO Rate (as defined in the credit agreement), as applicable, plus Applicable Margins (as defined in the credit agreement) which resulted in interest rates between 7.7% and 9.8% as of both December 31, 2023 and September 30, 2023.
As of December 31, 2023, the Company had $207.5 million of availability under its $375 million revolving credit facility. The term loan requires the Company to maintain certain financial ratios, including a minimum interest coverage ratio and a maximum total net leverage ratio. The Company is in compliance as of December 31, 20222023 with its debt covenants under the 2023 Credit Agreement and its AR Securitization Facility. Pursuant to the terms of the second amendment to the2023 Credit Agreement, the maximum allowed consolidated total net leverage ratio (as defined and calculated under the terms of the Credit Agreement and discussed further below) was 5.0x for the quarter ended December 31, 2022,2023, which steps down to 4.75x in the quarter ending March 31, 2024, and to 4.5x for the fiscal quarter ended June 30, 2024 and thereafter. The consolidated total net leverage ratio represents the ratio of (a) consolidated total net debt to (b) consolidated adjusted earnings before interest, taxes, depreciation and amortization (“EBITDA”).amortization. Consolidated total net debt includes the aggregate principal amount of total debt, net of unrestricted cash not to exceed $50.0$75.0 million.
In November 2022, the Company entered into the third amendment to the 2019 Credit Agreement, principally to affect a transition from the London Inter-Bank Offered Rate to the Secured Overnight Financing Rate pricing benchmark provisions.
During the quarter ended December 31, 2022, the Company paid off the outstanding revolving credit facility balance utilizing proceeds from a private placement of common stock. Refer to Note 12 for additional details of the private placement transaction.
In January 2023, certain of the Company’s U.S. subsidiaries entered into the second amendment to the AR Securitization Facility with PNC Bank, which temporarily eases the restrictions of certain covenants contained in the agreement through March 2023. The amendment made certain adjustments to the financial tests including: (i) the default ratio and (ii) the delinquency ratio to make compliance with such tests more likely.
| | | | | | | | |
| | COMPASS MINERALS INTERNATIONAL, INC. |
10.9. Commitments and Contingencies:
As previously disclosed, the Company was the subject of an investigation by the Division of Enforcement of the SEC regarding the Company’s disclosures primarily concerning the operation of the Goderich mine, the former South American businesses, and related accounting and internal control matters including Salt interim inventory valuation methodology issues that were disclosed in the Company’s Form 10-K/A for the year ended December 31, 2020, and Form 10-Q/A for the quarter ended March 31, 2021, each filed with the SEC on September 3, 2021.
On September 23, 2022, the Company reached a settlement with the SEC, concluding and resolving the SEC investigation in its entirety. Under the terms of the settlement, the Company, without admitting or denying the findings in the administrative order issued by the SEC, agreed to pay a civil penalty of $12 million and to cease and desist from violations of specified provisions of the federal securities laws and rules promulgated thereunder, and to retain an independent compliance consultant for a period of approximately one year to review certain accounting practices and procedures. As set forth in the administrative order, the $12 million civil penalty is to bewas paid in installments: $2 million, which was paid on September 29, 2022, andinstallments with $10 million to be paid no later than September 30, 2023. The Company previously recorded an accrual for the full amount of the penalty in the third quarter of fiscal 2022, which is reflected in accrued expenses and other current liabilities on the Company’s Consolidated Balance Sheets.Sheets as of September 30, 2023 and subsequently paid in during the first quarter of fiscal 2024.
The Company is also involved in legal and administrative proceedings and claims of various types from the ordinary course of the Company’s business.
| | | | | | | | |
| | COMPASS MINERALS INTERNATIONAL, INC. |
Management cannot predict the outcome of legal claims and proceedings with certainty. Nevertheless, management believes that the outcome of legal proceedingproceedings and claims, which are pending or known to be threatened, even if determined adversely, will not, individually or in the aggregate, have a material adverse effect on the Company’s results of operations, cash flows or financial position, except as otherwise described in Note 87 and this Note 10.9.
11.10. Operating Segments:
The Company’s reportable segments are strategic business units that offer different products and services, and each business requires different technology and marketing strategies. In connection with the executed business disposals discussed in Note 1 and Note 2, the Company has identified two reportable segments. The Specialty Businesses that comprised the Company’s former Plant Nutrition South America reportable segment and the North America micronutrient product business previously reported within the former Plant Nutrition North America reportable segment were classified as discontinued operations for all periods presented in its consolidated financial statements in this Quarterly Report on Form 10-Q.
For the three months ended December 31,
20222023 and
2021,2022, the Company has presented two reportable segments in its Consolidated Financial Statements: Salt and Plant Nutrition. The Salt segment produces and markets salt, consisting of sodium chloride and magnesium chloride, for use in road deicing for winter roadway safety and for dust control, food processing, water softening and other consumer, agricultural and industrial applications. The Plant Nutrition segment produces and markets various grades of SOP.
The results of operations for the Company’s fire retardant and records management businesses are included in Corporate and Other in the tables below. Refer to Note 2 for a discussion of the acquisition of the fire retardant business.
Segment information is as follows (in millions):
| | Three Months Ended December 31, 2022 | | Salt | | Plant
Nutrition | | Corporate & Other(a)(b) | | Total |
| Three Months Ended December 31, 2023 | | Three Months Ended December 31, 2023 | | Salt | | Plant
Nutrition | | Corporate & Other(a) | | Total |
| Sales to external customers | Sales to external customers | | $ | 308.1 | | | $ | 41.6 | | | $ | 2.7 | | | $ | 352.4 | |
| Intersegment sales | Intersegment sales | | — | | | 2.9 | | | (2.9) | | | — | |
| Shipping and handling cost | Shipping and handling cost | | 102.7 | | | 4.7 | | | — | | | 107.4 | |
Operating earnings (loss)(b) | Operating earnings (loss)(b) | | 47.1 | | | 11.0 | | | (30.2) | | | 27.9 | |
| Depreciation, depletion and amortization | Depreciation, depletion and amortization | | 13.9 | | | 8.3 | | | 1.7 | | | 23.9 | |
| Total assets (as of end of period) | Total assets (as of end of period) | | 985.2 | | | 456.5 | | | 323.0 | | | 1,764.7 | |
| | | | | | | | |
| | COMPASS MINERALS INTERNATIONAL, INC. |
| | Three Months Ended December 31, 2021 | | Salt | | Plant
Nutrition | | Corporate & Other(a)(b) | | Total |
| Three Months Ended December 31, 2022 | | Three Months Ended December 31, 2022 | | Salt | | Plant
Nutrition | | Corporate & Other(a) | | Total |
| Sales to external customers | Sales to external customers | | $ | 273.9 | | | $ | 54.6 | | | $ | 3.0 | | | $ | 331.5 | |
| Intersegment sales | Intersegment sales | | — | | | 2.4 | | | (2.4) | | | — | |
| Shipping and handling cost | Shipping and handling cost | | 88.4 | | | 7.3 | | | — | | | 95.7 | |
Operating earnings (loss)(b) | | 39.4 | | | 9.5 | | | (28.5) | | | 20.4 | |
Operating earnings (loss)(c) | |
| Depreciation, depletion and amortization | Depreciation, depletion and amortization | | 16.2 | | | 8.8 | | | 3.3 | | | 28.3 | |
| Total assets (as of end of period) | Total assets (as of end of period) | | 1,035.4 | | | 445.3 | | | 206.7 | | | 1,687.4 | |
Disaggregated revenue by product type is as follows (in millions):
| | Three Months Ended December 31, 2022 | | Salt | | Plant
Nutrition | | Corporate & Other(a)(b) | | Total |
| Three Months Ended December 31, 2023 | | Three Months Ended December 31, 2023 | | Salt | | Plant
Nutrition | | Corporate & Other(a) | | Total |
| Highway Deicing Salt | Highway Deicing Salt | | $ | 190.3 | | | $ | — | | | $ | — | | | $ | 190.3 | |
| Consumer & Industrial Salt | Consumer & Industrial Salt | | 117.8 | | | — | | | — | | | 117.8 | |
| | SOP | SOP | | — | | | 44.5 | | | — | | | 44.5 | |
| | SOP | |
| | SOP | |
| Fire Retardant | |
| Revenue from Services | |
| Eliminations & Other | Eliminations & Other | | — | | | (2.9) | | | 2.7 | | | (0.2) | |
| Sales to external customers | Sales to external customers | | $ | 308.1 | | | $ | 41.6 | | | $ | 2.7 | | | $ | 352.4 | |
| | | | | | | | | | | | | | | | | | | | | | | | | | |
| Three Months Ended December 31, 2021 | | Salt | | Plant
Nutrition | | Corporate & Other(a)(b) | | Total |
| Highway Deicing Salt | | $ | 163.7 | | | $ | — | | | $ | — | | | $ | 163.7 | |
| Consumer & Industrial Salt | | 110.2 | | | — | | | — | | | 110.2 | |
| | | | | | | | |
| | | | | | | | |
| SOP | | — | | | 57.0 | | | — | | | 57.0 | |
| Eliminations & Other | | — | | | (2.4) | | | 3.0 | | | 0.6 | |
| Sales to external customers | | $ | 273.9 | | | $ | 54.6 | | | $ | 3.0 | | | $ | 331.5 | |
| | | | | | | | |
| | COMPASS MINERALS INTERNATIONAL, INC. |
| | | | | | | | | | | | | | | | | | | | | | | | | | |
| Three Months Ended December 31, 2022 | | Salt | | Plant
Nutrition | | Corporate & Other(a) | | Total |
| Highway Deicing Salt | | $ | 190.3 | | | $ | — | | | $ | — | | | $ | 190.3 | |
| Consumer & Industrial Salt | | 117.8 | | | — | | | — | | | 117.8 | |
| | | | | | | | |
| | | | | | | | |
| SOP | | — | | | 44.5 | | | — | | | 44.5 | |
| Eliminations & Other | | — | | | (2.9) | | | 2.7 | | | (0.2) | |
| Sales to external customers | | $ | 308.1 | | | $ | 41.6 | | | $ | 2.7 | | | $ | 352.4 | |
(a)Corporate and Other includes corporate entities, records management operations, the Fortress fire retardant business, equity method investments, lithium development costs and other incidental operations and eliminations. Operating earnings (loss) for corporate and other includes indirect corporate overhead, including costs for general corporate governance and oversight, lithium-related expenses, as well as costs for the human resources, information technology, legal and finance functions.
(b)As a result of the Company’s decision to cease the pursuit of the lithium development, the Company recognized an impairment of long-lived assets of $74.8 million and severance of $2.5 million, which impacted operating results for the three months ended December 31, 2023. Refer to Note 5 for additional information about the impairment of lithium development assets. (c)Corporate operating results include costs related to the settled SEC investigation of $0.3 million for the three months ended December 31, 2022. Corporate operating results for the three months ended December 31, 2021 include executive transition costs of $3.3 million and costs, net of reimbursements, related to the settled SEC investigation of $3.1 million. Refer to Note 109 for more information regarding the SEC investigation.investigation and settlement.
The Company’s revenue by geographic area is as follows (in millions):
| | Three Months Ended
December 31, | |
| Three Months Ended
December 31, | |
| Three Months Ended
December 31, | |
| Three Months Ended
December 31, | |
| Revenue | |
| Revenue | |
| Revenue | Revenue | | 2022 | | 2021 | |
United States(a) | United States(a) | | $ | 248.2 | | | $ | 221.3 | | |
United States(a) | |
United States(a) | |
| Canada | |
| Canada | |
| Canada | Canada | | 87.6 | | | 89.4 | | |
| United Kingdom | United Kingdom | | 14.1 | | | 19.8 | | |
| United Kingdom | |
| United Kingdom | |
| Other | |
| Other | |
| Other | Other | | 2.5 | | | 1.0 | | |
| Total revenue | Total revenue | | $ | 352.4 | | | $ | 331.5 | | |
| Total revenue | |
| Total revenue | |
(a)United States sales exclude product sold to foreign customers at U.S. ports.
| | | | | | | | |
| | COMPASS MINERALS INTERNATIONAL, INC. |
12.11. Stockholders’ Equity and Equity Instruments:
Equity Compensation Awards
In May 2020, the Company’s stockholders approved the 2020 Incentive Award Plan (as amended, the “2020 Plan”), which authorized the issuance of 2,977,933 shares of Company common stock. In February 2022, the Company’s stockholders approved an amendment to the 2020 Plan authorizing an additional 750,000 shares of Company stock. Since the date the 2020 Plan was approved, the Company ceased issuing equity awards under the 2015 Incentive Award Plan (as amended, the “2015 Plan”). Since the approval of the 2015 Plan in May 2015, the Company ceased issuing equity awards under the 2005 Incentive Award Plan (as amended, the “2005 Plan”). The 2005 Plan, the 2015 Plan and the 2020 Plan allow for grants of equity awards to executive officers, other employees and directors, including restricted stock units (“RSUs”), performance stock units (“PSUs”), stock options and deferred stock units.
Koch For additional information regarding equity awards issued under the Company’s incentive plans refer to “Note 16 – Stockholder’s Equity Investment
On September 14, 2022, the Company entered into a Stock Purchase Agreement with Koch Minerals & Trading, LLC (“KM&T”), a subsidiary of Koch Industries, Inc. (“KII”), pursuant to which the Company agreed to issue and sell 6,830,700 sharesEquity Instruments” within Part II, Item 8 of its common stock at a purchase price of $36.87 for aggregate net proceeds of approximately $240.7 million, net of transaction costs. On October 18, 2022, the Company closed the direct private placement with KM&T, through its affiliate KM&T Investment Holdings, LLC, resulting in their ownership of approximately 17% of the Company’s outstanding common stock. The Company expects to use approximately $200 million of the proceeds from the private placement to advance the first development phase of its sustainable lithium development project at its Ogden site. The Company used the remaining approximately $40.7 million of proceeds to reduce debt.
Options
Substantially all of the stock options granted vest ratably, in tranches, over a four-year service period. Unexercised options expire after seven years. Options do not have dividend or voting rights. Upon vesting, each option can be exercised to purchase one share of the Company’s common stock. The exercise price of options is equal to the closing stock price on the grant date.
To estimate the fair value of options on the grant date, the Company uses the Black-Scholes option valuation model. Award recipients are grouped according to expected exercise behavior. Unless better information is available to estimate the expected term of the options, the estimate is based on historical exercise experience. The risk-free rate, using U.S. Treasury yield curves in effect at the time of grant, is selected based on the expected term of each group. The Company’s historical stock price is used to estimate expected volatility.
RSUs
Typically, the RSUs granted under the 2015 Plan and the 2020 Plan vest after one to three years of service. RSUs entitle the holders to one share of common stock for each vested RSU. Unvested RSUs do not have voting rights but are entitled to receive non-forfeitable dividends (generally after a performance hurdle has been satisfied for the year of the grant) or other distributions equal to those declared on the Company’s common stock for RSUs that are earned as a result of the satisfaction of the performance hurdle. The closing stock price on the grant date is used to determine the fair value of RSUs.
PSUs
Substantially all of the PSUs outstanding under the 2015 Plan and the 2020 Plan are either total stockholder return PSUs (“TSR PSUs”) or adjusted EBITDA growth PSUs (“EBITDA Growth PSUs”). The actual number of shares of the Company’s common stock that may be earned with respect to TSR PSUs is calculated by comparing the Company’s total stockholder return to the total stockholder return for each company comprising the Company’s peer group or a total return percentage target over a two- or three-year performance period and may range from 0% to 300% of the target number of shares based upon the attainment of these performance conditions. The actual number of shares of common stock that may be earned with respect to EBITDA Growth PSUs is calculated based on the attainment of adjusted EBITDA growth during the performance period and may range from 0% to 300% of the target number of shares based upon the attainment of these performance conditions.
PSUs represent a target number of shares of the Company’s common stock that may be earned before adjustment based upon the attainment of certain performance conditions. Holders of PSUs do not have voting rights but are entitled to receive non-forfeitable dividends or other distributions equal to those declared on the Company’s common stock for PSUs that are earned, which are paid when the shares underlying the PSUs are issued.
| | | | | | | | |
| | COMPASS MINERALS INTERNATIONAL, INC. |
To estimate the fair value of the TSR PSUs on the grant date for accounting purposes, the Company uses a Monte-Carlo simulation model, which simulates future stock prices of the Company as well as the Company’s peer group. This model uses historical stock prices to estimate expected volatility and the Company’s correlation to the peer group. The risk-free rate was determined using the same methodology as the option valuations as discussed above. The Company’s closing stock price on the grant date was used to estimate the fair value of the EBITDA Growth PSUs. The Company will adjust the expense of the EBITDA Growth PSUs based upon its estimate of the number of shares that will ultimately vest at each interim date during the vesting period.2023 Form 10-K.
During the three months ended December 31, 2022,2023, the Company reissued the following number of shares from treasury stock: 31,14086,597 shares related to the release of RSUs which vestedand 9365,556 shares related to stock payments. In fiscal 2022,2023, the Company issued 117,390158,132 net shares from treasury stock. The Company withheld a total of 9,85330,091 shares with a fair value of $0.4$0.8 million related to the vesting of RSUs PSUs, and stock payments during the three months ended December 31, 2022.2023. The fair value of the shares werewas valued at the closing price at the vesting date and represent the employee tax withholding for the employee’s compensation. The Company recognized tax expense of $0.1$0.4 million from its equity compensation awards as an increase to income tax expense during the three months ended December 31, 2022.2023. During the three months ended December 31, 20222023 and 2021,2022, the Company recorded $10.6$11.9 million and $4.7$10.6 million, (includes $1.4 million paid in cash), respectively, of compensation expense pursuant to its stock-based compensation plans. No amounts have been capitalized.
| | | | | | | | |
| | COMPASS MINERALS INTERNATIONAL, INC. |
PSUs
During the three months ended, December 31, 2023, the Company issued new PSUs based upon several operational performance measures (“Scorecard PSUs”). The actual number of shares of common stock that may be earned with respect to Scorecard PSUs is calculated based upon the attainment of free cash flow, cash unit costs, cash unit cost reduction, capital expenditures and safety measures during the performance period and may range from 0% to 300% for each measure.
The following table summarizes stock-based compensation activity during the three months ended December 31, 2022:2023:
| | | | | Stock Options | | RSUs | | PSUs(a) | | | Stock Options | | RSUs | | PSUs(a) |
| | | | Number | | Weighted-average
exercise price | | Number | | Weighted-average
fair value | | Number | | Weighted-average
fair value | | | Number | | Weighted-average
exercise price | | Number | | Weighted-average
fair value | | Number | | Weighted-average
fair value |
| Outstanding at September 30, 2022 | | 774,580 | | | $ | 60.68 | | | 208,735 | | | $ | 63.02 | | | 331,359 | | | $ | 71.51 | |
| Outstanding at September 30, 2023 | |
| Granted | Granted | | — | | | — | | | 221,151 | | | 38.14 | | | 182,422 | | | 68.29 | |
Exercised(b) | Exercised(b) | | — | | | — | | | — | | | — | | | — | | | — | |
Released from restriction(b) | Released from restriction(b) | | — | | | — | | | (31,755) | | | 67.61 | | | — | | | — | |
| Cancelled/expired | Cancelled/expired | | (13,241) | | | 62.57 | | | (4,496) | | | 46.27 | | | — | | | — | |
| Outstanding at December 31, 2022 | | 761,339 | | | $ | 60.64 | | | 393,635 | | | $ | 48.86 | | | 513,781 | | | $ | 70.37 | |
| Outstanding at December 31, 2023 | |
(a)Until the performance period is completed, PSUs are included in the table at the target level at their grant date and at that level represent one share of common stock per PSU.
(b)Common stock issued for exercised options and for vested and earned RSUs and PSUs was issued from treasury stock.
Accumulated Other Comprehensive Loss (“AOCL”)
The Company’s comprehensive income (loss) is comprised of net earnings (loss), net amortization of the unrealized loss of the pension obligation, the change in the unrealized gain in other postretirement benefits, the change in the unrealized gain (loss) on natural gas and foreign currency cash flow hedges and CTA. The components of and changes in AOCL are as follows (in millions):
| Three Months Ended December 31, 2022(a) | Losses on Cash Flow Hedges | | Defined Benefit Pension | | Other Post-Employment Benefits | | Foreign
Currency | | Total |
Three Months Ended December 31, 2023(a) | |
Three Months Ended December 31, 2023(a) | |
Three Months Ended December 31, 2023(a) | | Gains and (Losses) on Cash Flow Hedges | | Defined Benefit Pension | | Other Post-Employment Benefits | | | | Foreign Currency | | Total |
| Beginning balance | Beginning balance | $ | (1.6) | | | $ | (2.7) | | | $ | 1.3 | | | $ | (112.3) | | | $ | (115.3) | |
Other comprehensive (loss) income before reclassifications(b) | Other comprehensive (loss) income before reclassifications(b) | (2.4) | | | — | | | — | | | 11.7 | | | 9.3 | |
| Amounts reclassified from AOCL | Amounts reclassified from AOCL | (0.4) | | | 0.1 | | | — | | | — | | | (0.3) | |
| Net current period other comprehensive (loss) income | Net current period other comprehensive (loss) income | (2.8) | | | 0.1 | | | — | | | 11.7 | | | 9.0 | |
| Ending balance | Ending balance | $ | (4.4) | | | $ | (2.6) | | | $ | 1.3 | | | $ | (100.6) | | | $ | (106.3) | |
| | | | | | | | |
| | COMPASS MINERALS INTERNATIONAL, INC. |
| Three Months Ended December 31, 2021(a) | Gains and (Losses) on Cash Flow Hedges | | Defined Benefit Pension | | | Foreign
Currency | | Total |
Three Months Ended December 31, 2022(a) | | Three Months Ended December 31, 2022(a) | Losses on Cash Flow Hedges | | Defined Benefit Pension | | Other Post-Employment Benefits | | Foreign Currency | | Total |
| Beginning balance | Beginning balance | $ | 3.1 | | | $ | (5.4) | | | | $ | (108.2) | | | $ | (110.5) | |
Other comprehensive loss before reclassifications(b) | (0.9) | | | — | | | | (3.8) | | | (4.7) | |
Other comprehensive (loss) income before reclassifications(b) | |
| Amounts reclassified from AOCL | Amounts reclassified from AOCL | (1.1) | | | 0.1 | | | | — | | | (1.0) | |
| Net current period other comprehensive (loss) income | Net current period other comprehensive (loss) income | (2.0) | | | 0.1 | | | | (3.8) | | | (5.7) | |
| Ending balance | Ending balance | $ | 1.1 | | | $ | (5.3) | | | | $ | (112.0) | | | $ | (116.2) | |
(a)With the exception of the CTA, for which no tax effect is recorded, the changes in the components of AOCL presented in the tables above are reflected net of applicable income taxes.
(b)The Company recorded foreign exchange (loss) gainlosses of $(1.3)$2.3 million and $1.3 million in the three months ended December 31, 2023 and 2022, and $1.2 million in the three months ended December 31, 2021,respectively, in AOCL related to intercompany notes which were deemed to be of a long-term investment nature.
| | | | | | | | |
| | COMPASS MINERALS INTERNATIONAL, INC. |
The amounts reclassified from AOCL to expense (income) for the three months ended December 31, 20222023 and 2021,2022, are shown below (in millions):
| | Amount Reclassified from AOCL | |
| Amount Reclassified from AOCL | |
| Amount Reclassified from AOCL | |
| | | Amount Reclassified from AOCL | |
| | | Three Months Ended
December 31, | | | Line Item Impacted in the
Consolidated Statements of Operations | Three Months Ended
December 31, | | | | Line Item Impacted in the
Consolidated Statements of Operations |
| 2022 | | 2021 | | |
| Losses on cash flow hedges: | | | |
| 2023 | |
| Loss (gain) on cash flow hedges: | |
| Loss (gain) on cash flow hedges: | |
| Loss (gain) on cash flow hedges: | |
| Natural gas instruments | |
| Natural gas instruments | |
| Natural gas instruments | Natural gas instruments | $ | (0.5) | | | $ | (1.5) | | | | Product cost | $ | 0.8 | | | $ | | $ | (0.5) | | | | | | | Product cost | | | | | | Product cost |
| | Income tax expense | Income tax expense | 0.1 | | | 0.4 | | | |
| Income tax expense | |
| Income tax expense | |
| Reclassifications, net of income taxes | |
| Reclassifications, net of income taxes | |
| Reclassifications, net of income taxes | Reclassifications, net of income taxes | (0.4) | | | (1.1) | | | |
| Amortization of defined benefit pension: | Amortization of defined benefit pension: | | | | |
| Amortization of defined benefit pension: | |
| Amortization of defined benefit pension: | |
| Amortization of loss | |
| Amortization of loss | |
| Amortization of loss | Amortization of loss | 0.1 | | | 0.1 | | | | Product cost | 0.3 | | | 0.1 | | 0.1 | | | | | | | Product cost | | | | | | Product cost |
| Income tax benefit | Income tax benefit | — | | | — | | | |
| Reclassifications, net of income taxes | Reclassifications, net of income taxes | 0.1 | | | 0.1 | | | | |
| Reclassifications, net of income taxes | |
| Reclassifications, net of income taxes | | 0.2 | | | 0.1 | | | | | | | |
| Amortization of other post-employment benefits: | Amortization of other post-employment benefits: | | | |
| Amortization of loss | |
| Amortization of loss | |
| Amortization of loss | Amortization of loss | — | | | — | | | | Product cost | — | | | — | | — | | | | | | | Product cost | | | | | | Product cost |
| Income tax benefit | Income tax benefit | — | | | — | | | |
| Reclassifications, net of income taxes | Reclassifications, net of income taxes | — | | | — | | | |
| Reclassifications, net of income taxes | |
| Reclassifications, net of income taxes | |
| | Total reclassifications, net of income taxes | Total reclassifications, net of income taxes | $ | (0.3) | | | $ | (1.0) | | | | |
| | Total reclassifications, net of income taxes | |
| | Total reclassifications, net of income taxes | | $ | 1.0 | | | $ | (0.3) | | | | | | | |
13.12. Derivative Financial Instruments:
The Company is subject to various types of market risks, including interest rate risk, foreign currency exchange rate transaction and translation risk and commodity pricing risk. Management may take actions to mitigate the exposure to these types of risks, including entering into forward purchase contracts and other financial instruments. The Company manages a portion of its commodity pricing risks and foreign currency exchange rate risks by using derivative instruments. From time to time, the Company may enter into foreign exchange contracts to mitigate foreign exchange risk. The Company does not seek to engage in trading activities or take speculative positions with any financial instrument arrangement. The Company has enteredenters into natural gas derivative instruments and foreign currency derivative instruments with counterparties it views as creditworthy. However, the Company does attempt to mitigate its counterparty credit risk exposures by, among other things, entering into master netting agreements with some of these counterparties. The Company records derivative financial instruments as either assets or liabilities at fair value in its Consolidated Balance Sheets. The assets and liabilities recorded as of December 31, 20222023 and September 30, 20222023 were not material.
Derivatives qualify for treatment as hedges when there is a high correlation between the change in fair value of the derivative instrument and the related change in value of the underlying hedged item. Depending on the exposure being hedged, the Company must designate the hedging instrument as a fair value hedge, a cash flow hedge or a net investment in foreign operations hedge. For the qualifying derivative instruments that have been designated as cash flow hedges, the effective portion of the change in fair value is recognized through earnings when the underlying transaction being hedged affects earnings, allowing a derivative’s gains and losses to offset related results from the hedged item in the Consolidated Statements of Operations. Any
| | | | | | | | |
| | COMPASS MINERALS INTERNATIONAL, INC. |
ineffectiveness related to these instruments accounted for as hedges was not material for any of the periods presented. For derivative instruments that have not been designated as hedges, the entire change in fair value is recorded through earnings in the period of change.
Natural Gas Derivative Instruments
Natural gas is consumed at several of the Company’s production facilities, and changes in natural gas prices impact the Company’s operating margin. The Company seeks to reduce the earnings and cash flow impacts of changes in market prices of natural gas by fixing the purchase price of up to 90% of its forecasted natural gas usage. It is the Company’s policy to consider hedging portions of its natural gas usage up to 36 months in advance of the forecasted purchase. As of December 31, 2022,2023, the Company had entered into natural gas derivative instruments to hedge a portion of its natural gas purchase requirements through September 2024.2025. As of December 31, 20222023 and September 30, 2022,2023, the Company had agreements in place to hedge forecasted natural gas purchases of 3.13.2 millionand 3.82.3 million MMBtus, respectively. All
| | | | | | | | |
| | COMPASS MINERALS INTERNATIONAL, INC. |
On March 1, 2023, the Company de-designated its natural gas cash flow hedges related to its Ogden, Utah production facility as the Company did not believe these hedges were probable of being highly effective in the second fiscal quarter of 2023. Beginning March 1, 2023, the change in the derivative was and will be recorded in other expense, net in the Consolidated Statements of Operations. Since the transactions are still probable of occurring, previously recognized amounts in AOCL as of March 1, 2023, of $0.5 million will remain in AOCL until the underlying forecasted transaction occurs. The Company recognized $0.7 million of expense in other expense, net on the Consolidated Statements of Operations during the three months ended December 31, 2023. Following the de-designation, these natural gas economic hedging instruments will be recorded at fair value through earnings unless re-designated or until settlement. Substantially all other natural gas derivative instruments held by the Company as of December 31, 20222023 and September 30, 20222023 qualified and were designated as cash flow hedges. As of December 31, 2022,2023, the Company expects to reclassify from AOCL to earnings during the next twelve months $3.7$3.2 million of net losses on derivative instruments related to its natural gas hedges. Refer to Note 1413 for the estimated fair value of the Company’s natural gas derivative instruments as of December 31, 20222023 and September 30, 2022.2023.
The following tables present the fair value of the Company’s derivatives (in millions):
| | | | | Asset Derivatives | | Liability Derivatives | | | Asset Derivatives | | Liability Derivatives |
| | Consolidated Balance Sheet Location | | | | Consolidated Balance Sheet Location | | December 31, 2023 | | Consolidated Balance Sheet Location | | December 31, 2023 |
| Derivatives designated as hedging instruments: | Derivatives designated as hedging instruments: | | Consolidated Balance Sheet Location | | December 31, 2022 | | Consolidated Balance Sheet Location | | December 31, 2022 |
| Commodity contracts | Commodity contracts | | Other current assets | | $ | 1.6 | | | Accrued expenses and other current liabilities | | $ | 5.2 | |
| Commodity contracts | Commodity contracts | | Other assets | | 0.1 | | | Other noncurrent liabilities | | 0.8 | |
| Commodity contracts | |
| Commodity contracts | |
| Total derivatives designated as hedging instruments(a) | | | $ | 1.7 | | | | $ | 6.0 | |
| Total derivatives designated as hedging instruments | |
| Total derivatives designated as hedging instruments | |
| Total derivatives designated as hedging instruments | |
| | Derivatives not designated as hedging instruments: | |
| Derivatives not designated as hedging instruments: | |
| Derivatives not designated as hedging instruments: | |
| Commodity contracts | |
| Commodity contracts | |
| Commodity contracts | |
| | Total derivatives not designated as hedging instruments | |
| Total derivatives not designated as hedging instruments | |
| Total derivatives not designated as hedging instruments | |
Total derivatives(a) | |
(a)The Company has master netting agreements with its commodity hedge counterparties and accordingly has netted in its Consolidated Balance Sheets $1.7$0.6 million of its commodity contracts that are in receivable positions against its contracts in payable positions.
| | | | | Asset Derivatives | | Liability Derivatives | | | Asset Derivatives | | Liability Derivatives |
| | Consolidated Balance Sheet Location | | | | Consolidated Balance Sheet Location | | September 30, 2023 | | Consolidated Balance Sheet Location | | September 30, 2023 |
| Derivatives designated as hedging instruments: | Derivatives designated as hedging instruments: | | Consolidated Balance Sheet Location | | September 30, 2022 | | Consolidated Balance Sheet Location | | September 30, 2022 |
| Commodity contracts | Commodity contracts | | Other current assets | | $ | 2.7 | | | Accrued expenses and other current liabilities | | $ | 3.3 | |
| Commodity contracts | Commodity contracts | | Other assets | | 0.2 | | | Other noncurrent liabilities | | 0.7 | |
| Commodity contracts | |
| Total derivatives designated as hedging instruments(a) | | | $ | 2.9 | | | | $ | 4.0 | |
| Total derivatives designated as hedging instruments | |
| Total derivatives designated as hedging instruments | |
| Total derivatives designated as hedging instruments | |
| | Derivatives not designated as hedging instruments: | |
| Derivatives not designated as hedging instruments: | |
| Derivatives not designated as hedging instruments: | |
| Commodity contracts | |
| Commodity contracts | |
| Commodity contracts | |
| | Total derivatives not designated as hedging instruments | |
| Total derivatives not designated as hedging instruments | |
| Total derivatives not designated as hedging instruments | |
Total derivatives(a) | |
(a)The Company has master netting agreements with its commodity hedge counterparties and accordingly has netted in its Consolidated Balance Sheets $2.9$1.0 million of its commodity contracts that are in receivable positions against its contracts in payable positions.
14.
| | | | | | | | |
| | COMPASS MINERALS INTERNATIONAL, INC. |
13. Fair Value Measurements:
The Company’s financial instruments are measured and reported at their estimated fair values. Fair value is the price that would be received to sell an asset or paid to transfer a liability in an orderly transaction. When available, the Company uses quoted prices in active markets to determine the fair values for its financial instruments (Level 1 inputs) or, absent quoted market prices, observable market-corroborated inputs over the term of the financial instruments (Level 2 inputs). The Company does not have any unobservable inputs that are not corroborated by market inputs (Level 3 inputs), except as stated below and in Note 2.
The Company holds marketable securities associated with its defined contribution and pre-tax savings plans, which are valued based on readily available quoted market prices. The Company utilizes derivative instruments to manage its risk of changes in natural gas prices and foreign exchange rates (see Note 1312). The fair values of the natural gas and foreign currency derivative instruments are determined using market data of forward prices for all of the Company’s contracts.
| | | | | | | | |
| | COMPASS MINERALS INTERNATIONAL, INC. |
The estimated fair values for each type of instrument are presented below (in millions):
| | | | December 31,
2022 | | Level One | | Level Two | | Level Three | | December 31,
2023 | | Level One | | Level Two | | Level Three |
| Asset Class: | Asset Class: | |
Mutual fund investments in a non-qualified savings plan(a) | Mutual fund investments in a non-qualified savings plan(a) | $ | 2.5 | | | $ | 2.5 | | | $ | — | | | $ | — | |
Mutual fund investments in a non-qualified savings plan(a) | |
Mutual fund investments in a non-qualified savings plan(a) | |
| | Total Assets | Total Assets | $ | 2.5 | | | $ | 2.5 | | | $ | — | | | $ | — | |
| Total Assets | |
| Total Assets | |
| Liability Class: | Liability Class: | | | | | | | | Liability Class: | | | |
| Derivatives - natural gas instruments, net | $ | (4.3) | | | $ | — | | | $ | (4.3) | | | $ | — | |
| Derivatives designated as hedging instruments - natural gas instruments, net | |
| Derivatives not designated as hedging instruments - natural gas instruments, net | |
| Liabilities related to non-qualified savings plan | Liabilities related to non-qualified savings plan | (2.5) | | | (2.5) | | | — | | | — | |
| | Total Liabilities | Total Liabilities | $ | (6.8) | | | $ | (2.5) | | | $ | (4.3) | | | $ | — | |
| Total Liabilities | |
| Total Liabilities | |
(a)Includes mutual fund investments of approximately 25% in common stock of large-cap U.S. companies, 5% in common stock of small to mid-cap U.S. companies, 10%5% in international companies, 15%10% in bond funds, 5% in short-term investments and 40%50% in blended funds.
| | | | September 30,
2022 | |
Level One | |
Level Two | |
Level Three | | September 30,
2023 | |
Level One | |
Level Two | |
Level Three |
| Asset Class: | Asset Class: | |
Mutual fund investments in a non-qualified savings plan(a) | Mutual fund investments in a non-qualified savings plan(a) | $ | 1.8 | | | $ | 1.8 | | | $ | — | | | $ | — | |
| Mutual fund investments in a non-qualified savings plan(a) | |
Mutual fund investments in a non-qualified savings plan(a) | |
| Derivatives not designated as hedging instruments - natural gas instruments, net | |
| Total Assets | Total Assets | $ | 1.8 | | | $ | 1.8 | | | $ | — | | | $ | — | |
| Liability Class: | Liability Class: | | | | | | | | Liability Class: | | | |
| Derivatives – natural gas instruments, net | $ | (1.1) | | | $ | — | | | $ | (1.1) | | | $ | — | |
| Derivatives designated as hedging instruments - natural gas instruments, net | |
| Liabilities related to non-qualified savings plan | Liabilities related to non-qualified savings plan | (1.8) | | | (1.8) | | | — | | | — | |
| Total Liabilities | Total Liabilities | $ | (2.9) | | | $ | (1.8) | | | $ | (1.1) | | | $ | — | |
(a)Includes mutual fund investments of approximately 30%25% in the common stock of large-cap U.S. companies, 5% in the common stock of small to mid-cap U.S. companies, 10% in the common stock of international companies, 15%10% in bond funds, 5% in short-term investments and 35%45% in blended funds.
Cash and cash equivalents, receivables (net of allowance for doubtful accounts) and accounts payable are carried at cost, which approximates fair value due to their liquid and short-term nature. The Company’s investments related to its nonqualifiednon-qualified retirement plan of $2.53.0 million at December 31, 20222023 and $1.8$2.6 million at September 30, 2022,2023, are stated at fair value based on quoted market prices. As of December 31, 20222023 and September 30, 2022, the estimated fair value of the Company’s fixed-rate 4.875% Senior Notes due July 2024, based on available trading information (Level 2), totaled $239.9 million and $235.9 million, respectively, compared with the aggregate principal amount at maturity of $250.0 million. As of December 31, 2022 and September 30, 2022,2023, the estimated fair value of the Company’s fixed-rate 6.75% Senior Notes due December 2027, based on available trading information (Level 2), totaled $479.4$495.0 million and $468.9$472.5 million, respectively, compared with the aggregate principal amount at maturity of $500.0 million. The fair value at December 31, 20222023 and September 30, 20222023 of amounts outstanding under the Company’s term loans and revolving credit facility, based upon available bid information received from the Company’s lender (Level 2), totaled approximately $16.8$345.6 million and $158.5$277.1 million, respectively, compared with the aggregate principal amount at maturity of $16.9$349.9 million and $168.4$280.3 million, respectively.
| | | | | | | | |
| | COMPASS MINERALS INTERNATIONAL, INC. |
15.
In connection with the acquisition of Fortress, the Company entered into a contingent consideration arrangement (milestone and earnout payments). The fair value of the milestone contingent consideration is estimated using a probability-weighted discounted cash flow model with significant inputs not observable in the market and is therefore considered a Level 3 measurement while the earn-out is valued using a Monte Carlo simulation, also a Level 3 measurement. In the first quarter of fiscal 2024, the Company recorded $2.9 million of expense (substantially reflective of a change in discount rates and the passage of time) reflected in other operating expense in the Consolidated Statement of Operations to record the contingent consideration liability at its fair value as of December 31, 2023. The Company will continue to recognize remeasurement changes in the estimated fair value of contingent consideration in earnings at each reporting date until all contingencies are resolved. Refer to Note 2 for a discussion of the milestone and earnout payments.
The following table presents the fair value of the Company’s total contingent consideration arrangement (in millions):
| | | | | | | | | | | | | | |
| Consolidated Balance Sheet Location | | December 31, 2023 | | September 30, 2023 |
| Accrued expenses and other current liabilities | | $ | 9.0 | | | $ | 8.4 | |
| Other noncurrent liabilities | | 37.6 | | | 35.3 | |
| Total contingent consideration | | $ | 46.6 | | | $ | 43.7 | |
The Company has certain assets, including goodwill and other intangible assets, which are measured at fair value on a non-recurring basis and are adjusted to fair value only if an impairment charge is recognized. The categorization of the framework used to measure fair value of the assets is considered to be within the Level 3 valuation hierarchy due to the subjective nature of the unobservable inputs used. Refer to Note 5 for details of the Company’s impairment of long-lived assets related the termination of its lithium development.
14. Earnings per Share:
The Company calculates earnings per share using the two-class method. The two-class method requires allocating the Company’s net earnings to both common shares and participating securities. The following table sets forth the computation of basic and diluted earnings per common share (in millions, except for share and per-share data):
| | | | | | | | | | | | | | | |
| | Three Months Ended
December 31, | | |
| | 2022 | | 2021 | | | | |
| Numerator: | | | | | | | |
| Net (loss) earnings from continuing operations | $ | (0.3) | | | $ | 7.9 | | | | | |
Less: net earnings allocated to participating securities(a) | (0.1) | | | (0.1) | | | | | |
| Net (loss) earnings from continuing operations available to common stockholders | (0.4) | | | 7.8 | | | | | |
| Net loss from discontinued operations available to common stockholders | — | | | (5.5) | | | | | |
| Net (loss) earnings available to common stockholders | $ | (0.4) | | | $ | 2.3 | | | | | |
| | | | | | | |
| Denominator (in thousands): | | | | | | | |
| Weighted-average common shares outstanding, shares for basic earnings per share | 39,751 | | | 34,060 | | | | | |
Weighted-average awards outstanding(b) | — | | | 29 | | | | | |
| Shares for diluted earnings per share | 39,751 | | | 34,089 | | | | | |
| | | | | | | |
| Basic net (loss) earnings from continuing operations per common share | $ | (0.01) | | | $ | 0.23 | | | | | |
| Basic net loss from discontinued operations per common share | — | | | (0.16) | | | | | |
| Basic net (loss) earnings per common share | $ | (0.01) | | | $ | 0.07 | | | | | |
| | | | | | | |
| Diluted net (loss) earnings from continuing operations per common share | $ | (0.01) | | | $ | 0.23 | | | | | |
| Diluted net loss from discontinued operations per common share | — | | | (0.16) | | | | | |
| Diluted net (loss) earnings per common share | $ | (0.01) | | | $ | 0.07 | | | | | |
| | | | | | | | | | | | | | | |
| | Three Months Ended
December 31, | | |
| | 2023 | | 2022 | | | | |
| Numerator: | | | | | | | |
| Net loss from continuing operations | $ | (75.1) | | | $ | (0.3) | | | | | |
Less: net earnings allocated to participating securities(a) | (0.2) | | | (0.1) | | | | | |
| | | | | | | |
| | | | | | | |
| Net loss available to common stockholders | $ | (75.3) | | | $ | (0.4) | | | | | |
| | | | | | | |
| Denominator (in thousands): | | | | | | | |
| Weighted-average common shares outstanding, shares for basic earnings per share | 41,205 | | | 39,751 | | | | | |
Weighted-average awards outstanding(b) | — | | | — | | | | | |
| Shares for diluted earnings per share | 41,205 | | | 39,751 | | | | | |
| | | | | | | |
| | | | | | | |
| | | | | | | |
| Basic net loss per common share | $ | (1.83) | | | $ | (0.01) | | | | | |
| | | | | | | |
| | | | | | | |
| | | | | | | |
| Diluted net loss per common share | $ | (1.83) | | | $ | (0.01) | | | | | |
(a)Weighted participating securities include RSUs and PSUs that receive non-forfeitable dividends and consist of 777,000 weighted participating securities for the three months ended December 31, 2023 and 514,000 weighted participating securities for the three months ended December 31, 2022, and 430,000 weighted participating securities for the three months ended December 31, 2021.2022.
(b)For the calculation of diluted net earnings (loss) per share, the Company uses the more dilutive of either the treasury stock method or the two-class method to determine the weighted-average number of outstanding common shares. In addition, the Company had 1,572,000 weighted-average equity awards outstanding for the three months ended December 31, 2023, and 1,272,000 weighted-average equity awards outstanding for the three months ended December 31, 2022, and 1,097,000 weighted-average equity awards outstanding for the three months ended December 31, 2021, that were anti-dilutive.
16.
| | | | | | | | |
| | COMPASS MINERALS INTERNATIONAL, INC. |
15. Related Party Transactions:
As discussed in Note 12, on October 18, 2022, KII, through its KM&T subsidiary, purchased common stock representing an ownership interest of approximately 17% of the outstanding common stock of the Company. As part of the Stock Purchase Agreement, KM&T appointed two members to the Company’s board of directors, effective November 13, 2022. In addition, the companies are currently exploring value creation opportunities by leveraging the capabilities of select KII operating subsidiaries.
During the three months ended December 31, 2022 and 2021,2023, the Company recorded SOP sales of approximately $0.9$0.8 million and $0.7 million, respectively, to certain subsidiaries of KII.Koch Industries, Inc., compared to $0.9 million during the three months ended December 31, 2022. As of December 31, 20222023 and September 30, 2022,2023, the Company had approximately $0.5$0.6 million and $0.4 million, respectively, of Receivablesreceivables from related parties on its Consolidated Balance Sheets. Additionally, the Company has recently engaged a subsidiary of KII to provide engineering services for the Company’s lithium development project for which it capitalized approximately $0.5 million into Property, Plant and Equipment, net during the quarter ended December 31, 2022 of which $0.3 million was included in Accounts PayableThere were no amounts payable outstanding as of December 31, 2022.2023.
On December 20, 2022,2023, the Company paid a cash dividend to its stockholders of record at the close of business on December 9, 202211, 2023, in the amount of $0.15 per share, or $6.3 million in the aggregate. KM&Tshare. Koch Minerals & Trading, LLC received approximately $1.0$1.1 million in respect to its common shares.shares for the three months ended December 31, 2023.
16. Subsequent Events:
Departure of President, Chief Executive Officer and Board Member
On January 15, 2024, the Compensation Committee of the Board of Directors of the Company approved, and the Company entered into, a separation and consulting agreement (the “Separation and Consulting Agreement”) with Kevin Crutchfield. Under the Separation and Consulting Agreement, Mr. Crutchfield ceased to serve as President, Chief Executive Officer and as a member of the Board, effective January 17, 2024. The Separation and Consulting Agreement provides that Mr. Crutchfield will serve as a consultant to the Company through September 30, 2024, at a rate of $22,500 per month (pro-rated for any partial months), and receive the severance payments and benefits that he is entitled to pursuant to his previously disclosed Amended and Restated Employment Agreement, dated August 5, 2022, subject to his execution of a release of claims. The Separation and Consulting Agreement also provides that Mr. Crutchfield will remain bound by certain restrictive covenants, including post-employment non-solicitation and confidentiality covenants. The Company expects to pay approximately $6.3 million of cash and to vest 104,597 RSUs (57,476 net RSUs after tax withholding), within 60 days following the effective date in the form of Severance Payments and Benefits, as defined in the Separation and Consulting Agreement.
Appointment of New President, Chief Executive Officer
On January 15, 2024, the Board appointed Edward C. Dowling, Jr. as the Company’s President and Chief Executive Officer, effective January 18, 2024. Mr. Dowling will continue to serve as a member of the Board of Directors, but will no longer serve as a member of the Compensation Committee of the Board of Directors.
Departure of Chief Commercial Officer
Effective January 16, 2024, James D. Standen ceased to serve as Chief Commercial Officer of the Company. Mr. Standen is entitled to receive severance payments under the Company’s previously disclosed Executive Severance Plan, subject to his execution of a release and waiver of claims, of approximately $1.6 million of cash within 60 days of the effective date.
| | | | | | | | |
| | COMPASS MINERALS INTERNATIONAL, INC. |
Item 2. Management’s Discussion and Analysis of Financial Condition and Results of Operations
All statements, other than statements of historical fact, contained in this Quarterly Report on Form 10-Q constitute “forward-looking statements” within the meaning of the Private Securities Litigation Reform Act of 1995.
Forward-looking statements relate to future events or our future financial performance, and involve known and unknown risks, uncertainties, and other factors that may cause our actual results, levels of activity, performance or achievements to be materially different from future results, levels of activity, performance or achievements expressed or implied by these forward-looking statements. Factors that could cause actual results to differ materially from those expressed or implied by the forward-looking statements include, but are not limited to, the following: our mining and industrial operations; our continued ability to access ambient lake brine in the Great Salt Lake; the termination of our lithium development project; geological conditions; dependency on a limited number of key production and distribution facilities and critical equipment; weather conditions; uncertainties in estimating our economically recoverable reserves and resources; the inability to fund necessary capital expenditures or successfully complete capital projects; uncertainties in estimating our economically recoverable reserves and resources; the useful life of our mine properties; our expectation of extending the Goderich mine mineral lease; conversion of mineral resources into mineral reserves; strikes, other forms of work stoppage or slowdown or other union activities; supply constraints or price increases for energy and raw materials used in our production processes; our indebtedness and inability to pay our indebtedness; restrictions in our debt agreements that may limit our ability to operate our business or require accelerated debt payments; tax liabilities; the inability of our customers to access credit or a default by our customers of trade credit extended by us; our payment of any dividends; financial assurance requirements; the seasonal demand for our products; the impact of anticipated changes in potash product prices and customer application rates; the impact of competition on the sales of our products; inflation risks; increasing costs or a lack of availability of transportation services; the seasonal demand for our products; risks associated with our international operations and sales, including changes in currency exchange rates; the impact of anticipated changes in potash product prices and customer application rates; conditions in the sectors where we sell products and supply and demand imbalances for competing products; our rights and governmental authorizations to mine and operate our properties; risks related to unanticipated litigation or investigations or pending litigation or investigations or other contingencies; compliance with environmental, health and safety laws and regulations; environmental liabilities; compliance with foreign and United States (“U.S.”) laws and regulations related to import and export requirements and anti-corruption laws; changes in laws, industry standards and regulatory requirements; product liability claims and product recalls; misappropriation or infringement claims relating to intellectual property; inability to obtain required product registrations or increased regulatory requirements; our ability to successfully implement our strategies; plans to develop our lithium resource, including market entry and market changes from potential competing technologies; the useful life of our mine properties; our expectation of extending the Goderich mineral lease; conversion of mineral resources into mineral reserves; risks related to labor shortages and the loss of key personnel; a compromise of our computer systems, information technology or operations technology or the inability to protect confidential or proprietary data; climate change and related laws and regulations; our ability to expand our business through acquisitions and investments, realize anticipated benefits from acquisitions and investments and integrate acquired businesses; outbreaks of contagious disease or similar public health threats; domestic and international general business and economic conditions; and other risks referenced from time to time in this report and our other filings with the Securities and Exchange Commission (the “SEC”), including Part I, Item 1A, “Risk Factors” of our Annual Report on Form 10-K for the annual period ended September 30, 2022.2023 (“2023 Form 10-K”).
In some cases, you can identify forward-looking statements by terminology such as “may,” “might,” “will,” “should,” “could,” “expects,” “intends,” “plans,” “anticipates,” “believes,” “estimates,” “predicts,” “potential,” “continue,” the negative of these terms or other comparable terminology. Forward-looking statements include without limitation statements about our outlook, including expected sales volumes and costs; existing or potential capital expenditures; capital projects and investments; the industry and our competition; projected sources of cash flow; potential legal liability; proposed or recently enacted legislation and regulatory action; the seasonal distribution of working capital requirements; our reinvestment of foreign earnings outside the U.S.; payment of future dividends and ability to reinvest in our business; our ability to optimize cash accessibility, minimize tax expense and meet debt service requirements; future tax payments, tax refunds and valuation allowances; leverage ratios; ability to obtain a waiver or amendment torealization of potential savings from our credit agreement;restructuring activities; outcomes of matters with taxing authorities; the effects of currency fluctuations and inflation, including our ability to recover inflation-based cost increases; the seasonality of our business; and the effects of climate change; and the impact of the global economy, COVID-19 pandemic and the war in Ukraine on us.change. These forward-looking statements are only predictions. Actual events or results may differ materially.
Although we believe that the expectations reflected in the forward-looking statements are reasonable, we cannot guarantee future results, levels of activity, performance or achievements. We undertake no duty to update any of the forward-looking statements after the date hereof or to reflect the occurrence of unanticipated events.
Unless the context requires otherwise, references to the “Company,” “Compass Minerals,” “our,” “us” and “we” refer to Compass Minerals International, Inc. (“CMI,” the parent holding company) and its consolidated subsidiaries. Except where otherwise noted, references to North America include only the continental U.S. and Canada, and references to the United Kingdom (“U.K.”) include only England, Scotland and Wales. Except for lithium quantities which are stated in metric tons or
| | | | | | | | |
| | COMPASS MINERALS INTERNATIONAL, INC. |
where otherwise noted, all references to tons refer to “short
| | | | | | | | |
| | COMPASS MINERALS INTERNATIONAL, INC. |
“short tons” and all amounts are in U.S. dollars. One short ton equals 2,000 pounds and one metric ton equals 2,204.6 pounds. Compass Minerals and Protassium+ and combinations thereof, are trademarks of CMI or its subsidiaries in the U.S. and other countries.
Discontinued Operations
On March 16, 2021, the Board of the Directors approved a plan to sell our South America chemicals and specialty plant nutrition businesses, our investment in Fermavi and our North America micronutrient product business (collectively, the “Specialty Businesses”) with the goal of reducing our leverage and enabling increased focus on optimizing our core businesses.
As described further in Item 1, Note 2 to our Consolidated Financial Statements, we sold our South America specialty plant nutrition business, a component of our North America micronutrient business, our Fermavi investment and our South America chemicals business, respectively.
We believe these dispositions were conducted through a single disposal plan representing a strategic shift that has had a material effect on our operations and financial results. Consequently, the Specialty Businesses qualify for presentation as discontinued operations in accordance with U.S. generally accepted accounting principles (“U.S. GAAP”).The dispositions were completed during fiscal 2022; accordingly, the results of operations of the Specialty Businesses are presented as discontinued operations in the Consolidated Statements of Operations for the three months ended December 31, 2021.
Unless otherwise indicated, the information and amounts provided in this “Management’s Discussion and Analysis of Financial Condition and Results of Operations” pertain to continuing operations.
Critical Accounting Estimates
Preparation of our consolidated financial statements in accordance with U.S. GAAPGenerally Accepted Accounting Principles (“GAAP”) requires management to make estimates and assumptions that affect the reported amounts of assets, liabilities, revenues and expenses. Management believes the most complex and sensitive judgments result primarily from the need to make estimates about matters that are inherently uncertain. Part II, Item 7, “Management’s Discussion and Analysis of Financial Condition and Results of Operations” and Part II, Item 8, Note 2 to the Consolidated Financial Statements included in our Annual Report on2023 Form 10-K, for the annual period ended September 30, 2022, describe the significant accounting estimates and policies used in preparation of our consolidated financial statements.
As previously disclosed in the 2023 Form 10-K and as discussed in Item 1, Note 5 of our Consolidated Financial Statements included in this Quarterly Report on Form 10-Q, the Company indefinitely paused new investment in its lithium salt project pending greater clarity on the evolving regulatory environment in Utah. In December of 2023, a revised draft of rules was proposed, project engineering estimates were refined and, taken together with the decline in market price of lithium products, the Company determined to terminate the lithium development. Consequently, the Company evaluated the capitalized assets and recorded an impairment charge of $74.8 million, including $7.6 million associated with future commitments, for the three months ended December 31, 2023 to value the assets at estimated fair value, considering equipment expected to be used by the on-going business and amounts estimated to be recoverable through returns or salvage value. The determination of fair value of these assets requires us to make estimates and assumptions that include, but are not limited to, estimated proceeds to be received upon sale or return of the equipment, assumptions about the ability to redeploy equipment and materials to other parts of the business and estimates regarding the utility value and replacement cost of the equipment redeployed. Actual proceeds received from asset sales or returns and our ability to utilize the assets may vary from the Company’s estimates resulting in further impairment.
For a further description of our critical accounting policies, see Item 1, Note 1 of our Consolidated Financial Statements included in this Quarterly Report on Form 10-Q. Actual results in these areas could differ from management’s estimates.
Company Overview
Compass Minerals is a leading producer of essential minerals, including salt, sulfate of potash (“SOP”) specialty fertilizer and magnesium chloride. As of December 31, 2022,2023, we operated 12 production and packaging facilities, including:
•The largest rock salt mine in the world in Goderich, Ontario, Canada;
•The largest dedicated rock salt mine in the U.K. in Winsford, Cheshire;
•A solar evaporation facility located near Ogden, Utah, which is both the largest sulfate of potash specialty fertilizer production site and the largest solar salt production site in the Western Hemisphere; and
•Several mechanical evaporation facilities producing consumer and industrial salt.
Our Salt segment provides highway deicing salt to customers in North America and the U.K. as well as consumer deicing and water conditioning products, ingredients used in consumer and commercial food preparation, and other salt-based products for consumer, industrial, chemical and agricultural applications in North America. In the U.K., we operate a records management business utilizing excavated areas of our Winsford salt mine with one other location in London, England.
Our Plant Nutrition segment produces and markets SOP products in various grades worldwide to distributors and retailers of crop inputs, as well as growers and for industrial uses. We market our SOP under the trade name Protassium+®.
In May 2023, we completed the purchase of Fortress North America, LLC (“Fortress”), a next-generation fire retardant company dedicated to developing and producing a portfolio of magnesium chloride-based aerial and ground fire retardant products to help combat wildfires (see Item 1, Note 2 of our Consolidated Financial Statements). Magnesium chloride is an existing product stream out of our Ogden, Utah, solar evaporation facility. December 31, 2023 marked the end of Fortress's first commercially operating fire season with the U.S. Forest Service (“USFS”).
Additionally, we arehad been pursuing development of a sustainable lithium brinesalt resource innear Ogden, UT to support the North American battery marketmarket. However, as discussed above in Critical Accounting Policies and in Item 1, Note 5of our Consolidated Financial Statements, we arehave terminated our pursuit of the lithium development and recognized a minority owner of Fortress North America, LLC, a next-generation fire retardant company.
| | | | | | | | |
| | COMPASS MINERALS INTERNATIONAL, INC. |
loss on impairment of long-lived assets, including $7.6 million associated with future commitments, during the three months ended December 31, 2023.
Consolidated Results of Continuing Operations
The following is a summary of our consolidated results of continuing operations for the three months ended December 31, 20222023 and 2021,2022, respectively. The following discussion should be read in conjunction with the information contained in our consolidated financial statements and the notes thereto included in this Quarterly Report on Form 10-Q.
THREE MONTHS ENDED DECEMBER 31
Commentary: Three Months Ended December 31, 20222023 Compared to Three Months Ended December 31, 20212022
•Total sales increased 6%decreased 3%, or $20.9$10.7 million, due to higherlower Salt segment sales, partially offset by a decrease insales by the Fortress fire retardant business and higher Plant Nutrition segment sales. The decrease in sales for Salt reflected lower sales volumes. Plant Nutrition sales increased from the prior year due to an increase in sale volumes, partially offset by lower average sales prices. In addition, we recognized $14.5 million in sales related to the completion of our 2023 contract with the USFS.
•Operating loss of $55.3 million decreased $83.2 million from operating income of $27.9 million in the prior-year period, reflecting the lithium asset impairment, lower Plant Nutrition operating earnings, partially offset by Fortress earnings (as a result of our acquisition and subsequent consolidation in May 2023) and higher Salt sales reflected higheroperating earnings. Plant Nutrition operating earnings decreased due primarily to lower average sales prices and higher per-unit product costs, which were partially offset by higher sales volumes whiledue to a combination of lingering weather impacts in key markets in the decreasefirst quarter of 2023 and uncertainty about future fertilizer prices in Plant Nutrition sales was attributablethat same quarter causing users to lower sales volumes.
•Operating earnings increased 37%,cancel or $7.5 million, to $27.9 million, reflecting higherdelay purchases. Salt and Plant Nutrition operating earnings. Both Salt and Plant Nutrition operating earnings increased due primarily to higher average sales prices, which were partially offset by lower sales volumes and higher highway per-unit product costs. Corporate and distribution costs.Other segment operating loss decreased from the prior year quarter primarily reflecting the acquisition of the Fortress business, which was partially offset by higher lithium and corporate SG&A.
| | | | | | | | |
| | COMPASS MINERALS INTERNATIONAL, INC. |
•Earnings before interest, taxes, depreciation and amortization (“EBITDA”)* adjusted for items management believes are not indicative of our ongoing operating performance (“Adjusted EBITDA”)* increased 6%decreased 3.9%, or $3.4$2.4 million.
•Diluted net earningsloss per common share of $1.83 declined $0.24by $1.82 due to a loss of $0.01 per share.the lithium asset impairment recognized in the current year.
| | | | | | | | |
| | COMPASS MINERALS INTERNATIONAL, INC. |
THREE MONTHS ENDED DECEMBER 31
Commentary: Three Months Ended December 31, 20222023 Compared to Three Months Ended December 31, 20212022
Gross Profit: Increased 17%1%, or $10.1$0.6 million; Gross Margin increased 21 percentage pointspoint to 20%21%
•Salt segment gross profit increased $9.1$2.0 million primarily due to higher average sales prices, which waswere partially offset by lower sales volumes and higher per-unit logistics and product costs (see Salt operating results).
•The gross profit of the Plant Nutrition segment increased $1.0decreased $13.5 million due to higher per-unit product costs and lower average sales prices, which were partially offset by higherlower per-unit product costs, lower sales volumes and higher per-unit logisticsdistribution costs (see Plant Nutrition operating results).
•Gross profit was also favorably impacted by the acquisition of the Fortress fire retardant business in May 2023.
OTHER EXPENSES AND INCOME
Commentary: Three Months Ended December 31, 20222023 Compared to Three Months Ended December 31, 20212022
SG&A: Increased $2.6$3.9 million; 11.9%increased 1.5 percentage points as a percentage of sales in both periodsfrom 11.9% to 13.4%
•The increase in SG&A expense was primarily due to an increaseexpenses related to our Fortress fire retardant business that was acquired in corporateMay 2023 and Salthigher corporate incentive compensation which was partially offset by lower legal expenses due to higher costs in the prior period related to the recently completed SEC investigation.expense.
Interest Income:Loss on Impairment of Long-Lived Assets, net: $74.8 million in the current-year period
•We recognized an impairment loss of $74.8 million for the three months ended December 31, 2023 related to the termination of the lithium development (see Item 1, Note 5).
Other Operating Expense: Increased $0.8 million from $0.3$5.1 million to $1.1$5.4 million
•The increase in other operating expense was due to an increase in the contingent consideration related to the Fortress acquisition and severance costs resulting from the decision to discontinue the pursuit of the lithium development in the current period.
Interest Income: Decreased $0.7 million to $0.4 million
•The decrease in interest income during the current period is primarily due to athe higher cash balance duringin the current periodprior year resulting from proceeds received from thea private placement of our common stock.
Interest Expense: Unchanged at $13.9Increased $1.9 million to $15.8 million
•Interest expense was $13.9increased $1.9 million in both periods as lowerdue to higher interest rates and debt levels in the current period were offset by higher interest rates.period.
| | | | | | | | |
| | COMPASS MINERALS INTERNATIONAL, INC. |
Loss on Foreign Exchange: Changed $2.9Decreased $0.6 million from a gain of $0.4$2.5 million to a loss of $2.5$1.9 million
•We realized loss on foreign exchange losses of $2.5$1.9 million in the first quarter of fiscal 20232024 compared to gains of $0.4$2.5 million in the same quarter of the prior fiscal year,prior-year period, primarily reflecting changes in translating our intercompany loans from Canadian dollarsBritish Pounds to U.S. dollars.Dollars.
Net Loss in Equity Investees: Increased $0.5$0.9 million to $0.9 millionin the prior-year period
•We realized a net loss in equity investees of $0.9 million for the three months ended December 31, 2022 compared to $0.4 million in the prior-year period due toreflecting our share of losses related to our equity investments as these development stage businesses positionpositioned themselves for commercialization.
Income Tax (Benefit) Expense: Changed $13.1 million from a benefit of $1.2 millionOther Expense, net: Increased to an expense of $11.9$0.7 million
•The increase is due primarily to losses recorded for derivatives not accounted for as hedges during the current quarter.
Income Tax Expense: Decreased $10.1 million from $11.9 million to $1.8 million
•The decrease in income tax expense increasedwas due primarily due to valuation allowance expense recordedlower pretax book income, excluding the impairment of lithium assets, in the three months ended December 31, 2022, higher pretax book income in the three months ended December 31, 20222023 as compared to the three months ended December 31, 2021 and an income2022. The net tax benefit recorded in the three months ended December 31, 2021 on the releaseimpairment of the lithium assets impairment was offset entirely by tax expense for a domesticvaluation allowance on the related deferred tax reserve.asset.
| | | | | | | | |
| | COMPASS MINERALS INTERNATIONAL, INC. |
•Our effective tax rate increased from a negative 18% in the prior fiscal year to a positive 103% in the first quarter of fiscal 2023 primarily reflecting valuation allowance expense inwas (2.5)% for the three months ended December 31, 2022. See Item 1, Note 8 to2023, which is primarily driven by the Consolidated Financial Statements.income mix by country with income recognized in foreign jurisdictions offset by losses recognized in the U.S. for which a valuation allowance has been recorded against the U.S. tax benefit carryforward. •Our income tax provision for the three months ended December 31, 20222023 and 20212022 differs from the U.S. statutory rate primarily due to U.S. statutory depletion, state income taxes, base erosion and anti-abuse tax, nondeductible executive compensation, and foreign income, mining and withholding taxes. Additionally, the income tax provision for the three months ended December 31, 2022 includedtaxes and valuation allowance expense and the income tax provision for the three months ended December 31, 2021 included interest expense recognition differences for tax and financial reporting purposes.
Net Loss from Discontinued Operations: $5.5 million in the first quarter of fiscal 2022
•The net loss from discontinued operations for the prior period includes the results from our chemicals business in South America and impairment loss recognized prior to the April 20, 2022 sale date.
•The prior period loss of the South America chemicals business included a $3.1 million foreign currency exchange loss and an impairment loss to record the net assets of the South America chemical business at fair value less cost to sell which reflected the foreign currency translation adjustment. Refer to Item 1, Note 2 to the Consolidated Financial Statements for additional details.expense.
Operating Segment Performance
The following financial results represent consolidated financial information with respect to the operations of our Salt and Plant Nutrition segments. Sales primarily include revenue from the sales of our products, or “product sales,” and the impact of shipping and handling costs incurred to deliver our salt and plant nutrition products to our customers.
The results of operations of the Fortress business include sales of $14.5 million for the three months ended December 31, 2023. The results of operations of the consolidated records management business and other incidental revenues include sales of $2.7$3.2 million and $3.0$2.7 million for the three months ended December 31, 20222023 and 2021,2022, respectively. These revenuessales are not material to our consolidated financial results and are not included in the following operating segment financial data.
Salt Results
THREE MONTHS ENDED DECEMBER | | | | | | | | | | | | | | | |
| QTD 2023 | | QTD 2022 | | | | |
Salt Sales (in millions) | $ | 274.3 | | | $ | 308.1 | | | | | |
Salt Operating Earnings (in millions) | $ | 50.5 | | | $ | 47.1 | | | | | |
Salt Sales Volumes (thousands of tons) | | | | | | | |
| Highway deicing | 2,266 | | | 2,901 | | | | | |
| Consumer and industrial | 589 | | | 620 | | | | | |
| Total tons sold | 2,855 | | | 3,521 | | | | | |
Average Salt Sales Price (per ton) | | | | | | | |
| Highway deicing | $ | 70.36 | | | $ | 65.60 | | | | | |
| Consumer and industrial | $ | 194.94 | | | $ | 190.04 | | | | | |
| Combined | $ | 96.08 | | | $ | 87.51 | | | | | |
Commentary: Three Months Ended December 31, 2023 Compared to Three Months Ended December 31, 2022
| | | | | | | | | | | | | | | |
| QTD 2022 | | QTD 2021 | | | | |
Salt Sales (in millions) | $ | 308.1 | | | $ | 273.9 | | | | | |
Salt Operating Earnings (in millions) | $ | 47.1 | | | $ | 39.4 | | | | | |
Salt Sales Volumes (thousands of tons) | | | | | | | |
| Highway deicing | 2,901 | | | 2,807 | | | | | |
| Consumer and industrial | 620 | | | 633 | | | | | |
| Total tons sold | 3,521 | | | 3,440 | | | | | |
Average Salt Sales Price (per ton) | | | | | | | |
| Highway deicing | $ | 65.60 | | | $ | 58.34 | | | | | |
| Consumer and industrial | $ | 190.04 | | | $ | 174.00 | | | | | |
| Combined | $ | 87.51 | | | $ | 79.63 | | | | | |
| | | | | | | | |
| | COMPASS MINERALS INTERNATIONAL, INC. |
Commentary: Three Months Ended December 31, 2022 Comparedlower total committed bid volumes year over year compared to Three Months Ended December 31, 2021
•the prior-year bid season. SaltConsumer and industrial sales increased 12%, or $34.2 million,volumes decreased 5% primarily due to higher Salt average sales prices and highwaylower consumer deicing sales volumes.
•Average sales prices increased 10% partially offsetting the volume decline by approximately $13.7 million with increases in both highway and contributed $31.0 million to the increase in Salt sales.consumer and industrial average sales prices.
•Highway deicing average sales pricesprice increased 12% primarily due7% across all product categories as we have sought to higher highway deicing contracted sales prices forrestore profitability and offset the fiscal 2023 winter season while consumerimpact of prior year inflation on costs by executing a commercial bidding strategy emphasizing pricing over volume. Consumer and industrial average sales pricesprice increased 9%. We have sought3% due to increaseprice increases taken to offset inflation realized in prior years. The higher average sales prices to offset the impactare also reflective of inflation on costs.
•Salt sales volumes increased 2%, or 81,000 tons, which contributed $3.2 million to the sales increase. Highway deicing sales volumes increased 3%, primarily as higher sales volumes in North America were partially offset by lower U.K. sales volumes in the first quarter of 2023. Consumer and industrial sales volumes decreased 2%.mix.
•Salt operating earnings increased 20%7%, or $7.7$3.4 million, primarily due to higher average sales prices, which was partially offset by higher highway per-unit logistics and product costs. Higher fuel costs and inflationary pressures for energy and certain materials and supplies were only partially recovered through increased sales prices during the period.
Plant Nutrition Results
THREE MONTHS ENDED DECEMBER 31
| | QTD 2022 | | QTD 2021 | |
| QTD 2023 | |
| QTD 2023 | |
| QTD 2023 | |
Plant Nutrition Sales (in millions) | Plant Nutrition Sales (in millions) | $ | 41.6 | | | $ | 54.6 | | |
Plant Nutrition Operating Earnings (in millions) | $ | 11.0 | | | $ | 9.5 | | |
Plant Nutrition Sales (in millions) | |
Plant Nutrition Sales (in millions) | |
Plant Nutrition Operating (Loss) Earnings (in millions) | |
Plant Nutrition Operating (Loss) Earnings (in millions) | |
Plant Nutrition Operating (Loss) Earnings (in millions) | |
Plant Nutrition Sales Volumes (thousands of tons) | |
Plant Nutrition Sales Volumes (thousands of tons) | |
Plant Nutrition Sales Volumes (thousands of tons) | Plant Nutrition Sales Volumes (thousands of tons) | 45 | | | 83 | | |
Plant Nutrition Average Sales Price (per ton) | Plant Nutrition Average Sales Price (per ton) | $ | 924 | | | $ | 660 | | |
Plant Nutrition Average Sales Price (per ton) | |
Plant Nutrition Average Sales Price (per ton) | |
Commentary: Three Months Ended December 31, 20222023 Compared to Three Months Ended December 31, 20212022
•Plant Nutrition sales decreased 24%increased 19%, or $13.0$8.1 million due to lowerhigher sales volumes, which were partially offset by higherlower average sales prices.
•Plant Nutrition sales volumes were lowerincreased 67% year over year due todriven by normalization of demand levels in fiscal 2024 following lower demand due to a combinationin fiscal 2023 reflective of drought conditionsimpacts from weather events in Californiakey markets and uncertainty about future fertilizer prices causing userscustomers to cancel or delay purchases. The decline inhigher sales volumes contributed $25.1 million to the decrease in sales.increased sales by approximately $27.9 million.
•Plant Nutrition average sales prices increased 40%decreased 29%, which partially offsetoffsetting the decreaseincrease in sales by $12.1approximately $19.8 million. Average sales prices increased from the prior perioddecreased throughout fiscal 2023 due to global supply and demand dynamics for fertilizer products which resultedresulting in weakening pricing year over year following a strong, steadily increasing pricesprice trend throughout fiscal 2022.
•Plant Nutrition operating earnings increased $1.5decreased $13.3 million to $11.0a $2.3 million operating loss primarily due to significantlylower averages sales prices and higher average sales prices,per-unit product costs driven by higher cost carryover inventory reflective of lower production volume and higher energy and other input costs in fiscal 2023, which were partially offset by higher per-unit product costs primarily due to lower production volumes at our Ogden facility as well as higher energy and other input costs, and higher per-unit logistics costs.sales volumes.
| | | | | | | | |
| | COMPASS MINERALS INTERNATIONAL, INC. |
Outlook
•The North American highway deicing season is off to a weak start due to mild winter weather across our core service markets. However, with an estimated 70% of the deicing season yet to be completed, we are maintaining our expectations for the Salt segment in fiscal year 2024. In the event of a normal winter season, we expect sales volumes for the fiscal year is expectedand adjusted EBITDA to range from 11.3511.3 million to 12.2 million tons. EBITDA is expected to range from $215tons and $230 million to $255$270 million, although higher energy costsrespectively, in fiscal year 2024. In the event of a relatively strong winter season we expect sales volumes and unplanned downtime, among other causes,adjusted EBITDA ranging from 12.2 million to 13.2 million tons and $270 million to $290 million, respectively, and sales volumes and adjusted EBITDA ranging from 10.0 million to 11.3 million tons and $205 million to $230 million, respectively, in the event of a relatively mild winter season.
•There are several factors adversely impacting the outlook for our North American highway deicing operations mayPlant Nutrition segment. First, muriate of potash prices continue to be under pressure EBITDAin the market, which as a potential substitute impacts our SOP pricing. Second, continuing weakness in fertilizer pricing is resulting in buyers deferring purchases in anticipation of lower prices, which adds risk to our sales outlook. Lastly, first-quarter pond-based production tracked toward the lower end of the range.
•Plant Nutrition segment product demand was adversely impacted during the first fiscal quarter by drought conditions in California, our largest market for SOP. Recent significant rainfall and flooding in California may impact fertilizer application rates. Additionally, in January 2023 our Ogden facility experiencedinitial projections. As a temporary increase in natural gas costs due to pipeline supply and demand issues. Accordingly,result, we now expect Plant Nutrition segment sales volumes and adjusted EBITDA are now expected to be within a range from 205,000of 280,000 to 270,000310,000 tons and $30$15 million to $60$35 million, respectively, in fiscal year 2023.2024.
•Fiscal year 20232024 capital expenditures arewere expected to range from a total of $165be in the $120 million to $220 million.$130 million range. This amount includes $75approximately $80 million to $120$90 million in connection with advancing phase-onesustaining capital for the core Salt and Plant Nutrition businesses. In the fire retardant business, approximately $10 million of ourgrowth capital is anticipated to be spent in fiscal year 2024. Finally, we expect capital expenditures of roughly $30 million related to the now-terminated lithium development.project for items that had been committed to prior to the project’s suspension in November 2023. As a result of the termination of the
| | | | | | | | |
| | COMPASS MINERALS INTERNATIONAL, INC. |
lithium project and the related impairment in the first quarter of fiscal 2024, a portion of the expenditures related to committed items that had not been received by quarter-end and will not be classified as capital expenditures within the Consolidated Statements of Cash Flows when paid.
Liquidity and Capital Resources
Historically, our cash flows from operating activities have generally been adequate to fund our basic operating requirements, ongoing debt service and sustaining investment in our property, plant and equipment. We have also used cash generated from operations to fund capital expenditures, pay dividends, fund smaller acquisitions and repay our debt. To a certain extent, our ability to meet our short- and long-term liquidity and capital needs is subject to general economic, financial, competitive and weather conditions, effects of climate change, geological variations in our mine deposits and other factors that are beyond our control. Historically, our working capital requirements have been the highest in the first fiscal quarter (ending December 31) and lowest in the third fiscal quarter (ending June 30). When needed, we may fund short-term working capital requirements by accessing our $300$375 million revolving credit facility and our $100 million revolving accounts receivable financing facility (our “AR Facility”).AR Securitization Facility. As of December 31, 2023, we had liquidity of approximately $245.8 million, comprised of $38.3 million of cash and cash equivalents and $207.5 million of availability under our $375 million revolving credit facility.
We have been able to manage our cash flows generated and used across Compass Minerals to permanentlyindefinitely reinvest earnings in our foreign jurisdictions or efficiently repatriate those funds to the U.S. As of December 31, 2022, we2023, we had $15.4$5.5 million of cash and cash equivalents that was either held directly or indirectly by foreign subsidiaries. As a result of U.S. tax reform, we revised our permanently reinvested assertion, expecting to repatriate approximately $150 million of unremitted foreign earnings from Canada. InThroughout fiscal years 2022 and 2023, we revisedincreased our permanently reinvested assertion, expectingrepatriation expectation to repatriateinclude an additional approximately $10$16 million of unremitted foreign earnings from our U.K. operations. During the first quarter of fiscal 2023, $89.2 million was repatriated from Canada.Canada and in the third quarter of fiscal 2023, $15.6 million was repatriated from the U.K. Net income tax expense of $3.8 million has been recorded for foreign withholding tax, state income tax and foreign exchange losses on these changes in assertion as of December 31, 2022,2023, consisting of a tax benefit of $0.7 million recorded in the first quarter of fiscal year 2023 a $0.2 million tax benefit recorded in fiscal 2022 and tax expense of $4.7$4.5 million, most of which was recorded in years prior to fiscal 2022.2021. Due to our ability to generate adequate levels of U.S. cash flow on an annual basis, it is our current intention to continue to reinvest the remaining undistributed earnings of our foreign subsidiaries indefinitely. We review our tax circumstances on a regular basis with the intent of optimizing cash accessibilityaccessibility and minimizing tax expense.
In addition, the amountamount of permanently reinvested earnings is influenced by, among other things, the profits generated by our foreign subsidiaries and the amount of investment in those same subsidiaries. The profits generated by our U.S. and foreign subsidiaries are impacted by the transfer price charged on the transfer of our products between them. Canadian provincial taxing authorities continue to challenge our transfer prices of certain items. The final resolution of these challenges may not occur for several years. We currently expect the outcome of these matters will not have a material impact on our results of operations. However, it is possible the resolution could materially impact the amount of earnings attributable to our foreign subsidiaries, which could impact the amount of permanently reinvested foreign earnings. See Item 1, Note 87 of our Consolidated Financial Statements for a discussion regarding our Canadian tax reassessments.
Management assesses the available positive and negative evidence to estimate whether sufficient future taxable income will be generated to permit use of the existing deferred tax assets. A significant piece of objective negative evidence evaluated was the cumulative loss incurred in the U.S. over the three-year period ended December 31, 2022.2023. Such objective evidence limits the ability to consider other subjective evidence, such as our projections for future income. On the basis of this evaluation, during the three months ended December 31, 2022, a2023, an additional valuation allowance of $6.1$19.6 million has been recorded to recognize only the portion of the U.S. deferred tax assets that are more likely than not to be realized. The amount of the deferred tax assets considered realizable, however, could be adjusted if estimates of future taxable income during the carryforward period are increased or reduced or if objective negative evidence in the form of cumulative losses is no longer present and additional weight is given to subjective evidence such as our projections for income. We expect additional valuation allowances will be required through the remainder of the fiscal year assuming our earnings are in line with our current expectations.
| | | | | | | | |
| | COMPASS MINERALS INTERNATIONAL, INC. |
Cash and cash equivalents as of December 31, 2022 was $146.1 million. We generated $2.1 million of operating cash flows during the three months ended December 31, 2022, net of increases in our working capital. During the period ended December 31, 2022, we used cash on hand, cash flows from operations and cash proceeds from the private placement to fund capital expenditures of $19.9 million, pay down net debt of $116.1 million and pay dividends on our common stock of $6.3 million. Cash and cash equivalents of $146.1 million increased $100.0 million from September 30, 2022. Cash flows from operating activities totaled $2.1 million during the three months ended December 31, 2022, including net loss from continuing operations of $0.3 million, depreciation, depletion and amortization of $23.9 million, and a net working capital increase of $31.3 million driven primarily by the seasonality of our Salt business. Our working capital increase primarily reflects higher accounts receivable balances as the winter season begins in the latter half of the first quarter and sales that occurred late in the quarter have not been collected.
Indebtedness
As of December 31, 2022,2023, we had $839.8$919.2 million of outstanding indebtedness, consisting of $250.0 million outstanding under our 4.875% Senior Notes due 2024, $500.0 million outstanding under our 6.75% Senior Notes due 2027, $16.9$349.9 million of borrowings outstanding under our senior secured credit facilities under the Credit Agreement, consisting entirelyof $197.5 million of term loans and $72.9$152.4 million borrowed against our revolving credit facility, and $69.3 million of outstanding loans under the accounts receivable financing facility (see Item 1, Note 98 of our Consolidated
| | | | | | | | |
| | COMPASS MINERALS INTERNATIONAL, INC. |
Financial Statements for more detail regarding our debt). Outstanding letters of credit totaling
$13.5$15.1 million as of December 31,
2022,2023 further reduced available borrowing capacity under our revolving credit facility to
$286.5$207.5 million.
During the quarter ended December 31, 2022, we paid off the outstanding revolving credit facility balance utilizing proceeds from a private placement of common stock. Refer to Item 1, Note 12 of our Consolidated Financial Statements for additional details of the private placement transaction.
In November 2022, we entered into the third amendment to the Credit Agreement, principally to affect a transition from the London Inter-Bank Offered Rate to the Secured Overnight Financing Rate pricing benchmark provisions.
In January 2023, certain of our U.S. subsidiaries entered into the second amendment to the AR Securitization Facility with PNC Bank, which temporarily eases the restrictions of certain covenants contained in the agreement through March 2023. The amendment made certain adjustments to the financial tests including: (i) the default ratio and (ii) the delinquency ratio to make compliance with such tests more likely.
In the future, including during fiscal 2023, weWe may borrow amounts under the revolving credit facility or enter into additional financing to fund our working capital requirements, potential acquisitions and capital expenditures and for other general corporate purposes.
Our ability to make scheduled interest and principal payments on our indebtedness, to refinance our indebtedness, to fund planned capital expenditures and to fund acquisitions will depend on our ability to generate cash in the future. This, to a certain extent, is subject to general economic, financial, competitive, legislative, climate-related, regulatory and other factors that are beyond our control. Based on our current level of operations, we believe that cash flow from operations and available cash, together with available borrowings under our revolving credit facility, will be adequate to meet our liquidity needs over the next 12 months.
Our debt service obligations could, under certain circumstances, materially affect our financial condition and prevent us from fulfilling our debt obligations. As a holding company, CMI’s investments in its operating subsidiaries constitute substantially all of its assets. Consequently, our subsidiaries conduct substantially all of our consolidated operating activities and own substantially all of our operating assets. The principal source of the cash needed to pay our obligations is the cash generated from our subsidiaries’ operations and their borrowings. Furthermore, we must remain in compliance with the terms of the 2023 Credit Agreement governing our credit facilities, including the consolidated total net leverage ratio and interest coverage ratio, in order to pay dividends to our stockholders. We must also comply with the terms of our indenture governing our 4.875% Senior Notes due July 2024 and our 6.75% Senior Notes due December 2027, which limit the amount of dividends we can pay to our stockholders.
Pursuant to the terms of the second amendment to its2023 Credit Agreement, the maximum allowed consolidated total net leverage ratio (as defined and calculated under the terms of the 2023 Credit Agreement and discussed further below) was 5.0x for the quarter ended December 31, 2022,2023, which steps down to 4.75x in the quarter ending March 31, 2024, and to 4.5x for the fiscal quarter ended June 30, 2024 and thereafter. The consolidated total net leverage ratio represents the ratio of (a) consolidated total net debt to (b) consolidated adjusted EBITDA. Consolidated total net debt includes the aggregate principal amount of total debt, net
| | | | | | | | |
| | COMPASS MINERALS INTERNATIONAL, INC. |
of unrestricted cash not to exceed $50.0$75.0 million. As of December 31, 2022,2023, our consolidated total net leverage ratio was approximately 3.8x.4.33x.
Although we are in compliance with our debt covenants as of December 31, 2022,2023, we can make no assurance that we will remain in compliance with these ratios. Furthermore, we may need to refinance all or a portion of our indebtedness on or before maturity; however, we cannot provide assurance that we will be able to refinance any of our indebtedness on commercially reasonable terms or at all.
Capital AllocationsAllocation
Principally due to the nature of our deicing business, our cash flows from operations have historically been seasonal, with the majority of our cash flows from operations generated during the first half of the calendar year. When we have not been able to meet our short-term liquidity or capital needs with cash from operations, whether as a result of the seasonality of our business or other causes, we have met those needs with borrowings under our revolving credit facility. We expect to meet the ongoing requirements for debt service, any declared dividends and capital expenditures from these sources. This, to a certain extent, is subject to general economic, financial, competitive, legislative, regulatory and other factors that are beyond our control.
We manage our capital allocation considering our long-term strategic objectives, and required spending to sustain our business.business and focus on generating adequate returns on capital. During the first quarter of fiscal 2021, we reduced our dividend by approximately 80% to provide additional liquidity and align our capital allocation policy with our corporate strategy. While our equipment and facilities are generally not impacted by rapid technology changes, our operations require refurbishments and replacements to maintain structural integrity and reliable production and shipping capabilities. When possible, we incorporate efficiency, environmental and safety improvement capabilities into our routine capital projects and we plan the timing of larger projects to balance with our liquidity and capital resources. Changes in our operating cash flows may affect our future capital allocation and spending.
During fiscal 2023,2024, we expect to spend between $90$80 million and $100$90 million of sustaining capital in our Salt and Plant Nutrition businesses.businesses, including approximately $7 million to $12 million towards replacing the existing underground mill at Goderich mine over multiple years, which will be located in a built-for-purpose area of the mine and is expected to improve operating efficiencies. We also expect to spend approximately $10 million of growth capital on our fire retardant business. Additionally, we continued to develop our recently identified lithium resource at our Ogden facilityincurred approximately $20.0 million, including amounts accrued and have spent approximately $2.4unpaid, of previously committed capital in the first quarter of fiscal 2024 (approximately $71.3 million of capital thus far in fiscal 2023cumulatively) towards the development phase of thisour sustainable lithium development project. ForHowever, during the full yearfirst quarter of fiscal 2023,2024, we have allocated between $75 million and $120 million forceased further development. We expect to achieve market entry with adevelopment of the lithium product by 2025 and expect significant capital and other expenditures would be required to achieve this market entry; however, the full amount of this expenditure is currently unknown and will depend on a number of factors, including the outcome of further engineering and design plans.project. For
| | | | | | | | |
| | COMPASS MINERALS INTERNATIONAL, INC. |
more information, refer toItem 1, Note 5of our Consolidated Financial Statements and Part I, Item 1A, “Risk Factors” in our 2023 Form 10-K for the for the annual period ended September 30, 2022.10-K.
On October 18, 2022, we received aggregate net proceeds of approximately $240.7 million, net of transaction costs, from Koch Minerals & Trading, LLC (“KM&T”) as part of a strategic equity partnership. We expect to use approximately $200 million of the proceeds from the private placement to advance the first development phase of the lithium project. We used the remaining $40.7 million of proceeds to reduce debt.
In connection with our strategy to strengthen and grow its essential minerals businesses, during the first and second quarters of fiscal 2022, we made $45 million equity investments in Fortress North America, LLC (“Fortress”), building upon a previous $5 million investment. As of December 31, 2022, we have invested $50 million in Fortress in exchange for an ownership interest of approximately 45%. Fortress is a development stage company that intends to achieve commercialization of its magnesium chloride-based fire-retardant products to help combat wildfires. We may make further investments or make other acquisitions to grow our business.
| | | | | | | | |
| | COMPASS MINERALS INTERNATIONAL, INC. |
The table below provides a summary of our cash flows by category, including cash flows from discontinued operations:category:
| | | | | |
THREE MONTHS ENDED DECEMBER 31, 20222023 | THREE MONTHS ENDED DECEMBER 31, 20212022 |
| Operating Activities: |
| Net cash used in operating activities were $65.6 million | Net cash provided by operating activities were $2.1 million | Net cash used in operating activities were $14.3 million |
» Net loss was $0.3$75.1 million. | » Net earnings were $2.4loss was $0.3 million. |
» Non-cash depreciation and amortization expense was $23.9$25.5 million. | » Non-cash depreciation and amortization expense was $28.3$23.9 million. |
| » Non-cash stock-based compensation expense was $11.9 million. | » Non-cash stock-based compensation expense was $10.6 million. |
| » Non-cash loss on impairment of lithium assets was $74.8 million. | » Working capital items were a use of operating cash flows of $31.3 million. |
» Working capital items were a use of operating cash flows of $31.3$107.1 million. | » Working capital items were a use of operating cash flows of $58.7 million. |
| » Non-cash net loss in equity investees was $0.9 million. | » Non-cash net loss in equity investees was $0.4 million. |
Investing Activities: |
Net cash flows used in investing activities were $20.1$36.0 million | Net cash flows used in investing activities were $41.2$20.1 million |
| » Net cash flows used in investing activities included $35.3 million of capital expenditures. | » Net cash flows used in investing activities included $19.9 million of capital expenditures. | » Net cash flows used in investing activities included equity method investments of $28.2 million. |
| » Included $14.5 million of capital expenditures. |
Financing Activities: |
Net cash flows provided by financing activities were $117.7$100.9 million | Net cash flows provided by financing activities were $63.3$117.7 million |
» Included net payments on our debt of $116.1 million. | » Included net proceeds from the issuance of debt of $68.8$108.1 million. | » Included net payments on our debt of $116.1 million. |
| » Included the payment of dividends of $6.4 million. | » Included net proceeds from private placement of common stock of $240.7 million. | » Net cash flows provided by financing activities were partially offset by the payment of dividends of $5.3 million. |
| » Included the payment of dividends of $6.3 million. | |
As mentioned above, our Salt segment’s business is seasonal and our Salt segment results and working capital needs are heavily impacted by the severity and timing of the winter weather, which generally occurs from December through March of each year. Customers tend to replenish their inventory prior to the start of the winter season and following snow events,events; consequently, the number and timing of snow events during the winter season will impact the amount of our accounts receivable and inventory at the end of each quarter. Our operating cash flows during the three months ended December 31, of each year2023, reflect the seasonal increase in accounts receivable due to the beginning of the winter season. During the first quarter of fiscal 2024, the Company also paid liabilities accrued as of September 30, 2023, including the remaining $10 million settlement payment to the SEC, accrued incentive compensation, interest on our debt, income taxes and other liabilities. Additionally, at the end of Fortress’ contract term with the USFS, the Company recognized revenue previously deferred in accrued liabilities.
Other Matters
See Item 1, Notes 87 and 109 of our Consolidated Financial Statements for a discussion regarding labor, environmental and litigation matters.
| | | | | | | | |
| | COMPASS MINERALS INTERNATIONAL, INC. |
Reconciliation of Net Earnings (Loss) Earnings from Continuing Operations to EBITDA and Adjusted EBITDA
Management uses a variety of measures to evaluate our performance. While our consolidated financial statements, taken as a whole, provide an understanding of our overall results of operations, financial condition and cash flows, we analyze components of the consolidated financial statements to identify certain trends and evaluate specific performance areas. In addition to using U.S. GAAP financial measures, such as gross profit, net earnings and cash flows generated by operating activities, management uses EBITDA and Adjusted EBITDA. We have presented Adjusted EBITDA for both continuing operations and consolidated including discontinued operations for comparability purposes (see Item 1, Note 2 to our Consolidated Financial Statements for a discussion of discontinued operations). Both EBITDA and Adjusted EBITDA are non-GAAP financial measures used to evaluate the operating performance of our core business operations because our resource allocation, financing methods, cost of capital and income tax positions are managed at a corporate level, apart from the activities of the operating segments, and our operating facilities are located in different taxing jurisdictions, which can cause considerable variation in net earnings. We also use EBITDA and Adjusted EBITDA to assess our operating performance and return on capital against other companies, and to evaluate potential acquisitions or other capital projects. EBITDA and Adjusted EBITDA are not calculated under U.S. GAAP and should not be considered in isolation or as a substitute for net earnings, cash flows or other financial data prepared in accordance with U.S. GAAP or as a measure of our overall profitability or liquidity.
EBITDA and Adjusted EBITDA exclude interest expense, income taxes and depreciation and amortization, each of which are an essential element of our cost structure and cannot be eliminated. Furthermore, Adjusted EBITDA excludes other cash and
| | | | | | | | |
| | COMPASS MINERALS INTERNATIONAL, INC. |
non-cash items, including stock-based compensation, interest income, (gain) loss on foreign exchange, other (income) expense, net and other infrequent items that management does not consider indicative of normal operations. Other infrequent items, such as executive transition costs, restructuring charges, asset impairment charges and severance associated with the cessation of the lithium development and gain from remeasurement of equity method investment involve distinct initiatives that are not reflective of future operations and affect the comparability of our operational results across reporting periods. Our borrowings are a significant component of our capital structure and interest expense is a continuing cost of debt. We are also required to pay income taxes, a required and ongoing consequence of our operations. We have a significant investment in capital assets and depreciation and amortization reflect the utilization of those assets in order to generate revenues. Our employees are vital to our operations and we utilize various stock-based awards to compensate and incentivize our employees. Consequently, any measure that excludes these elements has material limitations. While EBITDA and Adjusted EBITDA are frequently used as measures of operating performance, these terms are not necessarily comparable to similarly titled measures of other companies due to the potential inconsistencies in the method of calculation.
The calculation of EBITDA and Adjusted EBITDA as used by management is set forth in the table below (in millions):
| | | | | | | | | | | | | | | |
| | Three Months Ended
December 31, | | |
| | 2022 | | 2021 | | | | |
| Net (loss) earnings from continuing operations | $ | (0.3) | | | $ | 7.9 | | | | | |
| Interest expense | 13.9 | | | 13.9 | | | | | |
| Income tax expense (benefit) | 11.9 | | | (1.2) | | | | | |
| Depreciation, depletion and amortization | 23.9 | | | 28.3 | | | | | |
| EBITDA from continuing operations | 49.4 | | | 48.9 | | | | | |
| Adjustments to EBITDA from continuing operations: | | | | | | | |
| Stock-based compensation - non cash | 10.6 | | | 3.2 | | | | | |
| Interest income | (1.1) | | | (0.3) | | | | | |
| Loss (gain) on foreign exchange | 2.5 | | | (0.4) | | | | | |
Executive transition costs(a) | — | | | 3.8 | | | | | |
Accrued loss and legal costs related to SEC investigation(b) | 0.3 | | | 3.1 | | | | | |
| Other expense, net | 0.1 | | | 0.1 | | | | | |
| Adjusted EBITDA from continuing operations | 61.8 | | | 58.4 | | | | | |
| Adjusted EBITDA from discontinued operations | — | | | 8.6 | | | | | |
| Adjusted EBITDA including discontinued operations | $ | 61.8 | | | $ | 67.0 | | | | | |
| | | | | | | | | | | | | | | |
| | Three Months Ended
December 31, | | |
| | 2023 | | 2022 | | | | |
| Net loss | $ | (75.1) | | | $ | (0.3) | | | | | |
| Interest expense | 15.8 | | | 13.9 | | | | | |
| Income tax expense | 1.8 | | | 11.9 | | | | | |
| Depreciation, depletion and amortization | 25.5 | | | 23.9 | | | | | |
| EBITDA | (32.0) | | | 49.4 | | | | | |
| Adjustments to EBITDA: | | | | | | | |
| Stock-based compensation - non cash | 11.9 | | | 10.6 | | | | | |
| Interest income | (0.4) | | | (1.1) | | | | | |
| Loss on foreign exchange | 1.9 | | | 2.5 | | | | | |
| | | | | | | |
| | | | | | | |
Restructuring charges(a) | 2.5 | | | — | | | | | |
Loss on impairment of long-lived assets, net(a) | 74.8 | | | — | | | | | |
Accrued loss and legal costs related to SEC investigation(b) | — | | | 0.3 | | | | | |
| Other expense, net | 0.7 | | | 0.1 | | | | | |
| Adjusted EBITDA | $ | 59.4 | | | $ | 61.8 | | | | | |
| | | | | | | |
| | | | | | | |
(a)WeIn connection with the termination of our pursuit of the lithium development project, we incurred severance and other costs related charges for a reduction of workforce and a loss on impairment of long-lived assets, which were determined to executive transition.be no longer probable of recovery.
(b)We recognized costs, net of reimbursements, related to the settled SEC investigation during the three months ended December 31, 2022 and 2021.
Recent Accounting Pronouncements
See Part 1, Note 1 of our Consolidated Financial Statements for a discussion of recent accounting pronouncements.
| | | | | | | | |
| | COMPASS MINERALS INTERNATIONAL, INC. |
Effects of Currency Fluctuations and Inflation
Our operations outside of the U.S. are conducted primarily in Canada and the U.K. Therefore, our results of operations are subject to both currency transaction risk and currency translation risk. We incur currency transaction risk whenever we or one of our subsidiaries enters into either a purchase or sales transaction using a currency other than the local currency of the transacting entity. With respect to currency translation risk, our financial condition and results of operations are measured and recorded in the relevant local currency and then translated into U.S. dollars for inclusion in our historical consolidated financial statements. Exchange rates between these currencies and the U.S. dollar have fluctuated significantly from time to time and may do so in the future. The majority of revenues and costs are denominated in U.S. dollars, with Canadian dollars and British pounds sterling also being significant. Significant changes in the value of the Canadian dollar or British pound sterling relative to the U.S. dollar could have a material adverse effect on our financial condition and our ability to meet interest and principal payments on U.S. dollar-denominated debt, including borrowings under our senior secured credit facilities.
We are experiencing increasesAlthough inflation has not had a significant impact on our operations in logistics costs, prices for energy and other costs that have only been partially recovered through price increases forthe current period, our products. During the three months ended December 31, 2022, we estimate that the impact of inflation increased logistics costs by approximately $6 million to $8 million for the three months ended December 31, 2022) and product costs by approximately $3 million to $5 million for the three months ended December 31, 2022). Our efforts to recover inflation-based cost increases from our customers may be hampered as a result of the structure of our contracts and the
| | | | | | | | |
| | COMPASS MINERALS INTERNATIONAL, INC. |
contract bidding process as well as the competitive industries, economic conditions and countries in which we operate. For more information, see Part I, Item 1A, “Risk Factors” in our Annual Report on2023 Form 10-K for the annual period ended September 30, 2022.10-K.
Seasonality
We experience a substantial amount of seasonality in our sales, including our salt deicing product sales. Consequently, our Salt segment sales and operating income are generally higher in the first and second fiscal quarters (ending December 31 and March 31) and lower during the third and fourth fiscal quarters of each year (ending June 30 and September 30). In particular, sales of highway and consumer deicing salt and magnesium chloride products vary based on the severity of the winter conditions in areas where the product is used. Following industry practice in North America and the U.K., we seek to stockpile sufficient quantities of deicing salt throughout the first, third and fourth fiscal quarters (ending December 31, June 30 and September 30) to meet the estimated requirements for the winter season. Our plant nutrition business is also seasonal. As a result, we and our customers generally build inventories during the plant nutrition business’ low demand periods of the year (which are typically winter and summer, but can vary due to weather and other factors) to ensure timely product availability during the peak sales seasons (which are typically spring and autumn, but can also vary due to weather and other factors). Lastly, the results of our fire retardant business are also seasonal with peak demand for fire retardant products and services occurring from June through September.
Climate Change
The potential impact of climate change on our operations, product demand and the needs of our customers remains uncertain. Significant changes to weather patterns, a reduction in average snowfall or regional drought within our served markets or at our Ogden facility could negatively impact customer demand for our products and our costs, as well as our ability to produce our products. For example, prolonged periods of mild winter weather could reduce the demand for our deicing products. Drought or flood conditionsexcessive precipitation could similarly impact demand for our SOP products, as well as continue to impact the amount and quality of feedstock used to produce SOP at our Ogden facility due to changes in brine levels, mineral concentrations or other factors, which could have a material impact on our Plant Nutrition results of operations. Climate change could also lead to disruptions in the production or distribution of our products due to major storm events or prolonged adverse conditions, changing temperature levels, lake level fluctuations or flooding from sea level changes. Climate change or governmental initiatives to address climate change may affect our operations and necessitate capital expenditures in the future, although capital expenditures for climate-related projects are not expected to be material in fiscal 2023.2024. For more information, see Part I, Item 1A, “Risk Factors” and Part I, Item 1 “Business—Environmental, Health and Safety and Other Regulatory Matters” in our Annual Report on2023 Form 10-K for the annual period ended September 30, 2022.
Global Economy
The COVID-19 pandemic has negatively impacted the global economy, disrupted global supply chains and created significant volatility and disruption of financial markets. We have continued producing and delivering essential products that support critical industries such as transportation, agriculture, chemical, food, pharmaceutical and animal nutrition. We have instituted several measures in response to the COVID-19 pandemic and have experienced negative impacts to our business from COVID-19, but our results of operations for the three months ended December 31, 2022, and 2021, were not materially affected by COVID-19, although the recent supply chain shortages and cost increases may be linked to COVID-19. Also, while we have no operations in Russia or Ukraine, we are continuing to monitor any broader impact from the current war in Ukraine, particularly with respect to energy costs and implications on global fertilizer market supply and demand conditions. The ultimate impact that any infectious outbreak or the war in Ukraine will have on our future results is unknown at this time. For more information, see Part I, Item 1A, “Risk Factors” in our Annual Report on Form 10-K for the annual period ended September 30, 2022.10-K.
Item 3. Quantitative and Qualitative Disclosures About Market Risk
Our business is subject to various types of market risks that include interest rate risk, foreign currency exchange rate risk and commodity pricing risk. Management has taken actions to mitigate our exposure to commodity pricing and foreign currency exchange rate risk by entering into natural gas derivative instruments and foreign currency contracts. We may take further actions to mitigate our exposure to interest rates, exchange rates and changes in the cost of fuel consumed at our production locations or the cost of transporting our products due to variations in our contracted carriers’ cost of fuel, which is typically diesel fuel. However, there can be no assurance that our hedging activities will eliminate or substantially reduce these risks. We
| | | | | | | | |
| | COMPASS MINERALS INTERNATIONAL, INC. |
do not enter into any financial instrument arrangements for speculative purposes. Our market risk exposure related to these items has not changed materially since September 30, 2022.2023.
| | | | | | | | |
| | COMPASS MINERALS INTERNATIONAL, INC. |
Item 4. Controls and Procedures
Disclosure Controls and Procedures
The Company maintainsWe maintain disclosure controls and procedures that are designed to provide reasonable assurance that information required to be disclosed in our reports under the Securities Exchange Act of 1934, as amended (the “Exchange Act”), is recorded, processed, summarized and reported within the time periods specified in the SEC’s rules and forms, and that such information is accumulated and communicated to management, including our President and Chief Executive Officer, Chief Financial Officer and Chief Accounting Officer, as appropriate, to allow timely decisions regarding required disclosure. In designing and evaluating the disclosure controls and procedures, management recognizes that any controls and procedures, no matter how well designed and operated, can provide only reasonable assurance of achieving the desired control objectives. Due to the inherent limitations in all control systems, no evaluation of controls can provide absolute assurance that misstatements due to error or fraud will not occur or that all control issues and instances of fraud, if any, within the Company have been detected.
In connection with the preparation of this Quarterly Report on Form 10-Q, an evaluation of the effectiveness of the design and operation of our disclosure controls and procedures (as defined in Rule 13a-15(e) under the Exchange Act) was performed under the supervision and with the participation of the Company’s management, including the Chief Executive Officer and Chief Financial Officer. Based on that evaluation, the Chief Executive Officer and Chief Financial Officer concluded that our disclosure controls and procedures were ineffectiveeffective as of December 31, 2022, due to2023, at the material weaknesses described below.
1.During the fourth quarter ended September 30, 2022, the Company identified a material weakness in the design and operating effectiveness of information technology general controls (“ITGCs”) related to certain systems that support the Company’s internal controls over financial reporting. Specifically, the Company did not maintain effective controls over privileged user access to certain systems. Automated and manual business process controls were therefore also deemed ineffective because they could have been adversely impacted by the ineffective ITGCs.
2. During the fourth quarter ended September 30, 2022, the Company identified a material weakness in the design and operating effectiveness of controls related to the sales process. Specifically, the Company did not maintain effective controls over pricing and order entry.
3. During the fourth quarter ended September 30, 2022, a material weakness was identified in the design and operating effectiveness of controls related to the existence of inventory held at certain locations.
A material weakness, as defined in Rule 12b-2 under the Exchange Act, is a deficiency, or a combination of deficiencies, in internal control over financial reporting, such that there is a reasonable possibility that a material misstatement of the Company’s annual or interim consolidated financial statements will not be prevented or detected on a timely basis. Notwithstanding such material weaknesses in internal control over financial reporting, our Chief Executive Officer and Chief Financial Officer have concluded that the Company’s consolidated financial statements included in this Quarterly Report on Form 10-Q present fairly, in all material respects, our financial position, results of operations and cash flows for the periods presented in conformity with U.S. GAAP.
Remediation of Material Weaknesses
The Company is continuing to assess and is in the process of enhancing the design of certain internal controls over the sales and inventory processes and ITGCs related to privileged access in accordance with the remediation plans for the material weaknesses. The Company has increased the frequency of its privileged access reviews and improved management review attributes. Further enhancement of review control attributes and ITGC considerations related to key inventory and sales systems are underway. These enhanced controls continue to be implemented and will be tested for effectiveness in future periods.assurance level.
Changes in Internal Control Over Financial Reporting
Other than the matters noted above, thereThere were no changes in the Company’s internal control over financial reporting during the most recently completed fiscal quarter that have materially affected, or are reasonably likely to materially affect, the Company’s internal control over financial reporting. The Company is in the process of integrating Fortress’ operations, including integration of financial reporting processes and procedures and internal controls over financial reporting.
| | | | | | | | |
| | COMPASS MINERALS INTERNATIONAL, INC. |
PART II. OTHER INFORMATION
Item 1. Legal Proceedings
We are involved in the legal proceedings described in Part I, Item 1, Note 87 and Part I, Item 1, Note 109 of our Consolidated Financial Statements and, from time to time, various routine legal proceedings and claims arising from the ordinary course of our business. These primarily involve tax assessments, disputes with former employees and contract labor, commercial claims, product liability claims, personal injury claims and workers’ compensation claims. Management cannot predict the outcome of legal proceedings and claims with certainty. Nevertheless, management believes that the outcome of legal proceedings and claims, which are pending or known to be threatened, even if determined adversely, will not, either individually or in the aggregate, have a material adverse effect on our results of operations, cash flows or financial condition, except as otherwise described in Part I, Item 1, Note 87 and Part I, Item 1, Note 109 of our Consolidated Financial Statements. There have been no material developments since September 30, 20222023 with respect to our legal proceedings, except as described in Part I, Item 1, Note 87 and Part I, Item 1, Note 109 of our Consolidated Financial Statements.
Item 1A. Risk Factors
For a discussion of the risk factors applicable to Compass Minerals, please refer to Part I, Item 1A, “Risk Factors” in our Annual Report on Form 10-K for the annual period ended September 30, 2022, as updated and supplemented by the discussion below.
Operations at our Ogden, Utah, facility are dependent on ambient brine from the Great Salt Lake, and changes in lake brine levels or any limitations on our continued ability to access ambient lake brine in the Great Salt Lake could adversely affect us.
Our Ogden facility produces SOP, salt and magnesium chloride products from the high mineral concentrations within the ambient lake brine in the Great Salt Lake. In addition, we are developing our identified lithium resource at our Ogden facility and the Great Salt Lake. Our ability to produce SOP, salt and magnesium chloride, as well as any future production of lithium, at our Ogden facility, is dependent upon, among other matters, sufficient lake elevations in the Great Salt Lake and our continued ability to maintain, renew or acquire the permits, licenses and approvals required to access ambient lake brine in the Great Salt Lake.
In recent years, sustained drought (as a result of climate change or otherwise) has lowered lake levels and increased mineral concentrations in the Great Salt Lake. If this continues, lower lake levels could impact mineral composition and our mineral harvesting process, amount and timing. Lake level fluctuations and other factors, including state or federal actions to manage the salinity of the Great Salt Lake, could alter north arm lake levels and may disrupt our evaporation production cycle, impact our access to ambient lake brine in the Great Salt Lake or increase our related capital expenditures and production costs.
The expansion of existing operations or production capacity at our Ogden facility, or preservation of existing rights in some cases, is also predicated upon securing any necessary permits, licenses and approvals. For example, we may require additional permits, licenses and approvals to continue diverting water from the Great Salt Lake to further expand our production capacity at our Ogden facility and continue the development of our identified lithium resource.2023.
Item 2. Unregistered Sales of Equity Securities and Use of Proceeds
On September 14, 2022, we entered into a Stock Purchase Agreement with Koch Minerals & Trading, LLC (“KM&T”), a subsidiary of Koch Industries, Inc., pursuant to which we agreed to issue and sell 6,830,700 shares of our common stock at a purchase price of $36.87 for aggregate net proceeds of approximately $240.7 million, net of transaction costs. On October 18, 2022, we closed the direct private placement with KM&T, through its affiliate KM&T Investment Holdings, LLC, resulting in their ownership of approximately 17% of our outstanding common stock. We expect to use approximately $200 million of the proceeds from the private placement to advance the first development phase of our sustainable lithium development project at our Ogden site. We used the remaining $40.7 million of proceeds to reduce debt. As part of the Stock Purchase Agreement, KM&T has appointed two members to our board of directors, effective November 13, 2022. Refer to (a)Part I, Item 1, Note 16 for additional details.None.
The issuance of the shares was exempt from registration pursuant to the exemption for transactions by an issuer not involving any public offering under Section 4(a)(2) of the Securities Act of 1933, as amended (the “Securities Act”). The Investor
| | | | | | | | |
| | COMPASS MINERALS INTERNATIONAL, INC. |
represented to the Company that it is an “accredited investor” as defined in Rule 501 of the Securities Act and that the shares are being acquired solely for investment and with no intention to distribute, and appropriate legends will be affixed to any certificates evidencing any shares.
Perella Weinberg Partners LP acted as sole financial advisor to Compass Minerals in the transaction and Cleary Gottlieb Steen & Hamilton LLP acted as our legal advisor. Jones Day acted as legal advisor for KM&T.(c)None.
Item 3. Defaults Upon Senior Securities
None.
Item 4. Mine Safety Disclosures
Information concerning mine safety violations or other regulatory matters required by Section 1503(a) of the Dodd-Frank Wall Street Reform and Consumer Protection Act and Item 104 of Regulation S-K is included in Exhibit 95 to this Quarterly Report on Form 10-Q.
Item 5. Other Information
None.Rule 10b5-1 Trading Plans
During the three months ended December 31, 2023, none of our directors or officers (as defined in Rule 16a-1(f) under the Exchange Act) adopted or terminated any contract, instruction or written plan for the purchase or sale of our securities that was intended to satisfy the affirmative defense conditions of Rule 10b5-1(c) under the Exchange Act or any “non-Rule 10b5-1 trading arrangement” as defined in Item 408(c) of Regulation S-K.
| | | | | | | | |
| | COMPASS MINERALS INTERNATIONAL, INC. |
Item 6. Exhibits
| | | | | | | | |
Exhibit
No. | | Exhibit Description |
| | |
| | |
| | |
| | |
| | Letter from Ernst & Young LLP to the Receivables Financing Agreement,Securities and Exchange Commission dated June 30, 2020, amongDecember 7, 2023 (incorporated herein by reference to Exhibit 16.1 to Compass Minerals Receivables LLC, Compass Minerals AmericaInternational, Inc., PNC Bank, National Association, the lenders party thereto and PNC Capital Markets, LLC.’s Current Report on Form 8-K filed on December 7, 2023). |
| | |
| | |
| | |
| | |
| 101** | | The following financial statements from the Company’s Quarterly Report on Form 10-Q for the quarter ended December 31, 2022,2023, formatted in Inline Extensible Business Reporting Language (iXBRL): (i) Consolidated Balance Sheets, (ii) Consolidated Statements of Operations, (iii) Consolidated Statements of Comprehensive (Loss) Income, (Loss), (iv) Consolidated Statements of Stockholders’ Equity, (v) Consolidated Statements of Cash Flows, and (vi) the Notes to the Consolidated Financial Statements. |
| 104 | | Cover Page Interactive Data File (contained in Exhibit 101). |
| * Filed herewith |
| ** Furnished herewith |
| | | | | | | | |
| | COMPASS MINERALS INTERNATIONAL, INC. |
SIGNATURES
Pursuant to the requirements of the Securities Exchange Act of 1934, the registrant has duly caused this report to be signed on its behalf by the undersigned, thereunto duly authorized.
| | | | | | | | | | | |
| | COMPASS MINERALS INTERNATIONAL, INC. | |
| | | | |
Date: February 7, 20232024 | By: | /s/ Lorin Crenshaw | |
| | | Lorin Crenshaw | |
| | | Chief Financial Officer | |
| | | (Principal Financial Officer) | |