| NSLT 2017-1 | NSLT 2017-2 | Total | ||||||||
| Date securities issued | 5/24/17 | 7/26/17 | ||||||||
| Total original principal amount | $ | 535,000 | 399,390 | 934,390 | ||||||
| Bond discount | — | (2,002 | ) | (2,002 | ) | |||||
| Issue price | $ | 535,000 | 397,388 | 932,388 | ||||||
| Cost of funds | 1-month LIBOR plus 0.78% | 1-month LIBOR plus 0.77% | ||||||||
| Final maturity date | 6/25/65 | 9/25/65 | ||||||||
FFELP Warehouse Facilities
The Company funds a portionthe majority of its FFELP loan acquisitions using its FFELP warehouse facilities. Student loan warehousing allows the Company to buy and manage student loans prior to transferring them into more permanent financing arrangements.
As of September 30, 2017,March 31, 2021, the Company had threetwo FFELP warehouse facilities as summarized below.
| NFSLW-I | NHELP-II (a) | Total | ||||||||||||||||||
| Maximum financing amount | $ | 260,000 | 50,000 | 310,000 | ||||||||||||||||
| Amount outstanding | 247,018 | 0 | 247,018 | |||||||||||||||||
| Amount available | $ | 12,982 | 50,000 | 62,982 | ||||||||||||||||
| Expiration of liquidity provisions | May 20, 2021 | February 26, 2022 | ||||||||||||||||||
| Final maturity date | May 20, 2022 | February 26, 2024 | ||||||||||||||||||
| Advanced as equity support | $ | 20,529 | 0 | 20,529 | ||||||||||||||||
| NFSLW-I (a) | NHELP-II | NHELP-III (b) | Total | ||||||||||
| Maximum financing amount | $ | 500,000 | 500,000 | 200,000 | 1,200,000 | ||||||||
| Amount outstanding | 307,425 | 288,969 | 148,713 | 745,107 | |||||||||
| Amount available | $ | 192,575 | 211,031 | 51,287 | 454,893 | ||||||||
| Expiration of liquidity provisions | September 20, 2019 | December 15, 2017 | April 27, 2018 | ||||||||||
| Final maturity date | November 19, 2019 | December 13, 2019 | April 27, 2020 | ||||||||||
| Maximum advance rates | 92.0 - 98.0% | 85.0 - 95.0% | 92.2 - 95.0% | ||||||||||
| Minimum advance rates | 84.0 - 90.0% | 85.0 - 95.0% | 92.2 - 95.0% | ||||||||||
| Advanced as equity support | $ | 4,747 | 20,531 | 3,163 | 28,441 | ||||||||
(a) On February 26, 2021, the Company extended the expiration of liquidity provisions and the maturity date for this warehouse facility an additional year to February 26, 2022 and February 26, 2024, respectively.
Private Education Loan Warehouse Facility
During 2020, the Company obtained a private education loan warehouse facility that had an aggregate maximum financing amount available of $200.0 million. On February 12, 2021, the Company decreased the maximum financing amount available for this facility to $175.0 million and extended the liquidity provisions and final maturity date to February 13, 2022 and February 13, 2023, respectively. As of March 31, 2021, $158.2 million was outstanding under this warehouse facility and $16.8 million was available for future funding. The facility has an advance rate of 80 to 90 percent and, as of March 31, 2021, the Company had $17.0 million advanced as equity support under this facility.
Consumer Loan Warehouse Facility
The Company had a $100.0 million consumer loan warehouse facility. On March 31, 2021, the Company terminated this facility.
Unsecured Line of Credit
The Company has a $350.0$455.0 million unsecured line of credit that has a maturity date of December 12, 2021.16, 2024. As of September 30, 2017, $210.0 millionMarch 31, 2021, 0 amount was outstanding on the line of credit and $140.0$455.0 million was available for future use. The line of credit provides that the Company may increase the aggregate financing commitments, through the existing lenders and/or through new lenders, up to a total of $550.0 million, subject to certain conditions.
Other Borrowings
The following table summarizesCompany has an agreement with Union Bank and Trust Company ("Union Bank"), a related party, as trustee for various grantor trusts, under which Union Bank has agreed to purchase from the Company's repurchasesCompany participation interests in student loan asset-backed securities. As of its own debt. Gains recordedMarch 31, 2021, $113.5 million of student loan asset-backed securities were subject to outstanding participation interests held by Union Bank, as trustee, under this agreement. The agreement automatically renews annually and is terminable by either party upon five business days' notice. The Company can participate student loan asset-backed securities to Union Bank to the extent of availability under the grantor trusts, up to $100.0 million or an amount in excess of $100.0 million if mutually agreed to by both parties. Student loan asset-backed securities under this agreement have been accounted for by the Company fromas a secured borrowing.
Accrued Interest Liability
During the repurchasefirst quarter of debt are included2021, the Company reversed a historical accrued interest liability of $23.8 million on certain bonds, which liability the Company determined is no longer probable of being required to be paid. The liability was initially recorded when certain asset-backed securitizations were acquired in "gain from debt repurchases"2011 and 2013. The reduction of this liability is reflected in (a reduction of) "interest on bonds and notes payable and bank deposits" in the Company's consolidated statements of income.operations.
14
| Par value | Purchase price | Gain | Par value | Purchase price | Gain | |||||||||||||
| Three months ended | ||||||||||||||||||
| September 30, 2017 | September 30, 2016 | |||||||||||||||||
| Asset-backed securities | $ | 14,702 | 14,586 | 116 | 10,965 | 8,805 | 2,160 | |||||||||||
| Nine months ended | ||||||||||||||||||
| September 30, 2017 | September 30, 2016 | |||||||||||||||||
| Unsecured debt - Hybrid Securities (a) | $ | 29,658 | 25,241 | 4,417 | — | — | — | |||||||||||
| Asset-backed securities | 18,790 | 17,670 | 1,120 | 11,362 | 9,102 | 2,260 | ||||||||||||
| $ | 48,448 | 42,911 | 5,537 | 11,362 | 9,102 | 2,260 | ||||||||||||
4. Derivative Financial Instruments
The Company uses derivative financial instruments primarily to manage interest rate risk and foreign currency exchange risk. Derivative instruments used as part of the Company's risk management strategy are further described in note 56 of the notes to consolidated financial statements included in the 20162020 Annual Report. A tabular presentation of such derivatives outstanding as of September 30, 2017March 31, 2021 and December 31, 20162020 is presented below.
Basis Swaps
The following table summarizes the Company’s outstanding basis swaps as of March 31, 2021 and December 31, 2020, in which the Company receives three-month LIBOR set discretely in advance and pays one-month LIBOR plus or minus a spread as defined in the agreements (the "1:3 Basis Swaps").
| Maturity | Notional amount | |||||||||||||
| 2021 | $ | 250,000 | ||||||||||||
| 2022 | 2,000,000 | |||||||||||||
| 2023 | 750,000 | |||||||||||||
| 2024 | 1,750,000 | |||||||||||||
| 2026 | 1,150,000 | |||||||||||||
| 2027 | 250,000 | |||||||||||||
| $ | 6,150,000 | |||||||||||||
| As of September 30, | As of December 31, | |||||||
| 2017 | 2016 | |||||||
| Maturity | Notional amount | Notional amount | ||||||
| 2018 | $ | 4,000,000 | $ | — | ||||
| 2019 | 3,000,000 | — | ||||||
| 2024 | 250,000 | — | ||||||
| 2026 | 1,150,000 | 1,150,000 | ||||||
| 2027 | 375,000 | — | ||||||
| 2028 | 325,000 | 325,000 | ||||||
| 2029 | 100,000 | — | ||||||
| 2031 | 300,000 | 300,000 | ||||||
| $ | 9,500,000 | $ | 1,775,000 | |||||
The weighted average rate paid by the Company on the 1:3 Basis Swaps as of September 30, 2017March 31, 2021 and December 31, 20162020 was one-month LIBOR plus 13.49.1 basis points and 10.1 basis points, respectively.
points.
Interest Rate Swaps – Floor Income Hedges
The following table summarizes the outstanding derivative instruments used by the Company to economically hedge loans earning fixed rate floor income.
| As of March 31, 2021 | As of December 31, 2020 | |||||||||||||||||||||||||
| Maturity | Notional amount | Weighted average fixed rate paid by the Company (a) | Notional amount | Weighted average fixed rate paid by the Company (a) | ||||||||||||||||||||||
| 2021 | $ | 600,000 | 2.15 | % | $ | 600,000 | 2.15 | % | ||||||||||||||||||
| 2022 (b) | 500,000 | 0.94 | 500,000 | 0.94 | ||||||||||||||||||||||
| 2023 | 900,000 | 0.62 | 900,000 | 0.62 | ||||||||||||||||||||||
| 2024 (c) | 2,500,000 | 0.35 | 2,000,000 | 0.32 | ||||||||||||||||||||||
| 2025 | 500,000 | 0.35 | 500,000 | 0.35 | ||||||||||||||||||||||
| $ | 5,000,000 | 0.67 | % | $ | 4,500,000 | 0.70 | % | |||||||||||||||||||
| As of September 30, 2017 | As of December 31, 2016 | |||||||||||||
| Maturity | Notional amount | Weighted average fixed rate paid by the Company (a) | Notional amount | Weighted average fixed rate paid by the Company (a) | ||||||||||
| 2017 | $ | — | — | % | $ | 750,000 | 0.99 | % | ||||||
| 2018 | 1,350,000 | 1.07 | 1,350,000 | 1.07 | ||||||||||
| 2019 | 3,250,000 | 0.97 | 3,250,000 | 0.97 | ||||||||||
| 2020 | 1,500,000 | 1.01 | 1,500,000 | 1.01 | ||||||||||
| 2025 | 100,000 | 2.32 | 100,000 | 2.32 | ||||||||||
| $ | 6,200,000 | 1.02 | % | $ | 6,950,000 | 1.02 | % | |||||||
| (a) For all interest rate derivatives, |
(b) $250.0 million notional interest rate swap in whichof the Company would pay a fixed amount of 3.30% and receive discrete one-month LIBOR. If the interest rate swap option is exercised, the swap would become effective in 2019 and mature in 2024.
(c) $500.0 million of the Company had $20.5 million and $50.2 million, respectively, of unsecured Hybrid Securities outstanding. The interest rate on the Hybrid Securities through September 29, 2036 is equal to three-month LIBOR plus 3.375%, payable quarterly. The Company had the following derivatives outstanding as of September 30, 2017at March 31, 2021 and December 31, 2016 that are used to effectively convert the variable interest rate on a designated notional amount with respect to the Hybrid Securities to a fixed rate of 7.66%.2020 have forward effective start dates in June 2021.
15
| Maturity | Notional amount | Weighted average fixed rate paid by the Company (a) | |||||
| 2036 | $ | 25,000 | 4.28 | % | |||
| Three months ended September 30, | Nine months ended September 30, | |||||||||||
| 2017 | 2016 | 2017 | 2016 | |||||||||
| Re-measurement of Euro Notes | $ | (13,683 | ) | (4,831 | ) | (45,635 | ) | (13,543 | ) | |||
| Change in fair value of cross-currency interest rate swap | 16,257 | 5,501 | 44,831 | 26,194 | ||||||||
| Total impact to consolidated statements of income - income (expense) (a) | $ | 2,574 | 670 | (804 | ) | 12,651 | ||||||
Consolidated Financial Statement Impact Related to Derivatives
| Fair value of asset derivatives | Fair value of liability derivatives | |||||||||||
| As of | As of | As of | As of | |||||||||
| September 30, 2017 | December 31, 2016 | September 30, 2017 | December 31, 2016 | |||||||||
| 1:3 basis swaps | $ | — | — | — | 2,624 | |||||||
| Interest rate swaps - floor income hedges | — | 81,159 | — | 256 | ||||||||
| Interest rate swap option - floor income hedge | 765 | 2,977 | — | — | ||||||||
| Interest rate caps | 231 | 1,152 | — | — | ||||||||
| Interest rate swaps - hybrid debt hedges | — | — | 7,332 | 7,341 | ||||||||
| Cross-currency interest rate swap | — | — | 22,773 | 67,605 | ||||||||
| Other | — | 2,243 | — | — | ||||||||
| Total | $ | 996 | 87,531 | 30,105 | 77,826 | |||||||
| Gross amounts not offset in the consolidated balance sheets | |||||||||||||
| Derivative assets | Gross amounts of recognized assets presented in the consolidated balance sheets | Derivatives subject to enforceable master netting arrangement | Cash collateral pledged | Net asset | |||||||||
Balance as of September 30, 2017 | $ | 996 | — | — | 996 | ||||||||
Balance as of December 31, 2016 | 87,531 | (2,880 | ) | 475 | 85,126 | ||||||||
| Gross amounts not offset in the consolidated balance sheets | |||||||||||||
| Derivative liabilities | Gross amounts of recognized liabilities presented in the consolidated balance sheets | Derivatives subject to enforceable master netting arrangement | Cash collateral pledged | Net liability | |||||||||
| Balance as of September 30, 2017 | $ | (30,105 | ) | — | 8,470 | (21,635 | ) | ||||||
| Balance as of December 31, 2016 | (77,826 | ) | 2,880 | 7,292 | (67,654 | ) | |||||||
Operations
The following table summarizes the components of "derivative market value and foreign currency transaction adjustments and derivative settlements, net" included in the consolidated statements of income.operations.
| Three months ended March 31, | |||||||||||||||||||||||
| 2021 | 2020 | ||||||||||||||||||||||
| Settlements: | |||||||||||||||||||||||
| 1:3 basis swaps | $ | (19) | 2,112 | ||||||||||||||||||||
| Interest rate swaps - floor income hedges | (4,285) | 2,125 | |||||||||||||||||||||
| Total settlements - (expense) income | (4,304) | 4,237 | |||||||||||||||||||||
| Change in fair value: | |||||||||||||||||||||||
| 1:3 basis swaps | 2,799 | 1,558 | |||||||||||||||||||||
| Interest rate swaps - floor income hedges | 36,010 | (22,160) | |||||||||||||||||||||
| Total change in fair value - income (expense) | 38,809 | (20,602) | |||||||||||||||||||||
| Derivative market value adjustments and derivative settlements, net - income (expense) | $ | 34,505 | (16,365) | ||||||||||||||||||||
16
| Three months ended September 30, | Nine months ended September 30, | |||||||||||
| 2017 | 2016 | 2017 | 2016 | |||||||||
| Settlements: | ||||||||||||
| 1:3 basis swaps | $ | (2,172 | ) | 523 | (1,836 | ) | 938 | |||||
| Interest rate swaps - floor income hedges | 3,883 | (5,157 | ) | 5,877 | (15,241 | ) | ||||||
| Interest rate swaps - hybrid debt hedges | (191 | ) | (233 | ) | (593 | ) | (696 | ) | ||||
| Cross-currency interest rate swap | (2,093 | ) | (1,394 | ) | (5,762 | ) | (3,293 | ) | ||||
| Total settlements - (expense) income | (573 | ) | (6,261 | ) | (2,314 | ) | (18,292 | ) | ||||
| Change in fair value: | ||||||||||||
| 1:3 basis swaps | 5,916 | 140 | (5,499 | ) | 323 | |||||||
| Interest rate swaps - floor income hedges | (185 | ) | 42,073 | (13,670 | ) | (17,913 | ) | |||||
| Interest rate swap option - floor income hedge | (500 | ) | (269 | ) | (2,212 | ) | (2,541 | ) | ||||
| Interest rate caps | (103 | ) | (68 | ) | (936 | ) | (1,283 | ) | ||||
| Interest rate swaps - hybrid debt hedges | 44 | 13 | 10 | (4,000 | ) | |||||||
| Cross-currency interest rate swap | 16,257 | 5,501 | 44,831 | 26,194 | ||||||||
| Other | — | (297 | ) | (143 | ) | (2,336 | ) | |||||
| Total change in fair value - income (expense) | 21,429 | 47,093 | 22,381 | (1,556 | ) | |||||||
| Re-measurement of Euro Notes (foreign currency transaction adjustment) - (expense) income | (13,683 | ) | (4,831 | ) | (45,635 | ) | (13,543 | ) | ||||
| Derivative market value and foreign currency transaction adjustments and derivative settlements, net - income (expense) | $ | 7,173 | 36,001 | (25,568 | ) | (33,391 | ) | |||||
5. Investments and Other Receivables
A summary of the Company's investments follows:
| As of March 31, 2021 | As of December 31, 2020 | ||||||||||||||||||||||||||||||||||||||||||||||
| Amortized cost | Gross unrealized gains | Gross unrealized losses | Fair value | Amortized cost | Gross unrealized gains | Gross unrealized losses | Fair value | ||||||||||||||||||||||||||||||||||||||||
| Investments (at fair value): | |||||||||||||||||||||||||||||||||||||||||||||||
| Student loan asset-backed and other debt securities - available-for-sale (a) | $ | 367,343 | 11,879 | (9) | 379,213 | 340,578 | 8,042 | (13) | 348,607 | ||||||||||||||||||||||||||||||||||||||
| Equity securities | 53,044 | 10,430 | (3,621) | 59,853 | 36,227 | 8,768 | (2,954) | 42,041 | |||||||||||||||||||||||||||||||||||||||
| Total investments (at fair value) | $ | 420,387 | 22,309 | (3,630) | 439,066 | 376,805 | 16,810 | (2,967) | 390,648 | ||||||||||||||||||||||||||||||||||||||
| Other Investments (not measured at fair value): | |||||||||||||||||||||||||||||||||||||||||||||||
| Venture capital and funds: | |||||||||||||||||||||||||||||||||||||||||||||||
| Measurement alternative | 145,440 | 144,795 | |||||||||||||||||||||||||||||||||||||||||||||
| Equity method (b) | 59,583 | 14,018 | |||||||||||||||||||||||||||||||||||||||||||||
| Other | 1,328 | 894 | |||||||||||||||||||||||||||||||||||||||||||||
| Total venture capital and funds | 206,351 | 159,707 | |||||||||||||||||||||||||||||||||||||||||||||
| Real estate | |||||||||||||||||||||||||||||||||||||||||||||||
| Equity method | 49,527 | 50,291 | |||||||||||||||||||||||||||||||||||||||||||||
| Notes receivable (c) | 17,344 | 847 | |||||||||||||||||||||||||||||||||||||||||||||
| Total real estate | 66,871 | 51,138 | |||||||||||||||||||||||||||||||||||||||||||||
| Investment in ALLO: | |||||||||||||||||||||||||||||||||||||||||||||||
| Voting interest/equity method (d) | 107,177 | 129,396 | |||||||||||||||||||||||||||||||||||||||||||||
| Preferred membership interest and accrued and unpaid preferred return (e) | 131,237 | 228,916 | |||||||||||||||||||||||||||||||||||||||||||||
| Total investment in ALLO | 238,414 | 358,312 | |||||||||||||||||||||||||||||||||||||||||||||
| Solar (f) | (34,091) | (30,373) | |||||||||||||||||||||||||||||||||||||||||||||
| Beneficial interest in federally insured loan securitizations (g) | 29,228 | 30,377 | |||||||||||||||||||||||||||||||||||||||||||||
| Beneficial interest in consumer loan securitizations, net of allowance for credit losses of $4,449 as of December 31, 2020 (g) | 22,936 | 27,954 | |||||||||||||||||||||||||||||||||||||||||||||
| Tax liens and affordable housing | 4,324 | 5,177 | |||||||||||||||||||||||||||||||||||||||||||||
| Total investments (not measured at fair value) | 534,033 | 602,292 | |||||||||||||||||||||||||||||||||||||||||||||
| Total investments | $ | 973,099 | $ | 992,940 | |||||||||||||||||||||||||||||||||||||||||||
(a) As of March 31, 2021, $113.5 million (par value) of student loan asset-backed securities were subject to participation interests held by Union Bank, as discussed in note 3 under "Other Borrowings."
(b) In December of 2020, Wells Fargo announced the sale of its approximately $10.0 billion portfolio of private education student loans representing approximately 445,000 borrowers. The Company has entered into agreements to participate in a joint venture to acquire the portfolio. As of March 31, 2021, the Company has invested $44.7 million in the joint venture and is accounting for this investment under the equity method of accounting.
(c) On February 26, 2021, the Company received a $13.0 million promissory note from Telegraph Flats, LLC ("Telegraph Flats"). The Company owns 50% of Telegraph Flats. Telegraph Flats is an entity that was established for the sole purpose of acquiring, developing, and owning a multi-family and commercial real estate property in Lincoln, Nebraska. The promissory note carries an interest rate of one-month LIBOR plus 1.75% and has a maturity date of August 26, 2021.
(d) The Company accounts for its voting membership interests in ALLO Communications LLC ("ALLO") under the Hypothetical Liquidation at Book Value ("HLBV") method of accounting. The HLBV method of accounting is used by the Company for equity method investments when the liquidation rights and priorities as defined by an equity investment agreement differ from what is reflected by the underlying percentage ownership or voting interests. The Company applies
17
the HLBV method using a balance sheet approach. A calculation is prepared at each balance sheet date to determine the amount that the Company would receive if an equity investment entity were to liquidate its net assets and distribute that cash to the investors based on the contractually defined liquidation priorities. The difference between the calculated liquidation distribution amounts at the beginning and the end of the reporting period, after adjusting for capital contributions and distributions, is the Company’s share of the earnings or losses from the equity investment for the period. Because the Company will be able to utilize certain tax losses related to ALLO’s operations, the equity investment agreements for the Company have liquidation rights and priorities that are sufficiently different from the voting membership interests percentages such that the HLBV method of accounting was deemed appropriate. Accordingly, the recognition of earnings or losses during any reporting period related to the Company’s equity investment in ALLO may or may not reflect its voting membership interests percentage and could vary substantially from those calculated based on the Company’s voting membership interests in ALLO.
During the three month period ended March 31, 2021, the Company recognized a loss of $22.2 million under the HLBV method of accounting on its ALLO voting membership interests investment. Assuming ALLO continues its planned growth in existing and new communities, it will continue to invest substantial amounts in property and equipment to build the network and connect customers. The resulting recognition of depreciation and development costs could result in continuing net operating losses by ALLO under generally accepted accounting principles. Applying the HLBV method of accounting, the Company will continue to recognize a significant portion of ALLO’s anticipated losses over the next several years.
(e) The preferred membership interests of ALLO held by the Company earn a preferred annual return of 6.25 percent. During the three months ended March 31, 2021, the Company recognized income on its ALLO preferred membership interests of $2.3 million.
On January 19, 2021, ALLO closed on certain private debt financing facilities from unrelated third-party lenders providing for aggregate financing of up to $230.0 million. With proceeds from this transaction, ALLO redeemed a portion of its non-voting preferred membership interests held by the Company in exchange for an aggregate redemption price payment to the Company of $100.0 million.
Under the October 2020 recapitalization agreements for ALLO, the parties have agreed to use commercially reasonable efforts (which expressly excludes requiring ALLO to raise any additional equity financing or sell any assets) to cause ALLO to redeem, on or before April 2024, the remaining preferred membership interests of ALLO held by the Company, plus the amount of accrued and unpaid preferred return on such interests.
(f) The Company makes investments in entities that promote renewable energy sources (solar). The Company's investments in these entities generate a return primarily through the realization of federal income tax credits, operating cash flows, and other receivables follows:tax benefits, such as tax deductions from operating losses of the investments, over specified time periods which range from 5 to 6 years. As of March 31, 2021, the Company has funded $151.8 million in solar investments. The carrying value of the Company's solar investments are reduced by tax credits earned when the solar project is placed in service. The solar investment balance at March 31, 2021 represents total tax credits earned on solar projects placed in service through March 31, 2021 being larger than total payments made by the Company on such projects. The Company is committed to fund an additional $42.8 million on these projects.
The Company accounts for its solar investments using the HLBV method of accounting. For the majority of the Company's solar investments, the HLBV method of accounting results in accelerated losses in the initial years of investment. During the three months ended March 31, 2021 and 2020, the Company recognized pre-tax losses of $1.7 million and $2.8 million, respectively, on its solar investments. These losses are included in "other" in "other income/expense" on the consolidated statements of operations.
(g) The Company has purchased partial ownership in certain federally insured and consumer loan securitizations. As of the latest remittance reports filed by the various trusts prior to March 31, 2021, the Company's ownership correlates to approximately $500 million and $230 million of federally insured and consumer loans, respectively, included in these securitizations.
During the first quarter of 2020, the Company recorded a $26.3 million provision charge related to the Company's beneficial interest in consumer loan securitizations due to distressed economic conditions resulting from the COVID-19 pandemic. Due to improved economic conditions, the Company has reduced the allowance for credit losses related to the consumer loan beneficial interests, including reducing such allowance by $2.4 million during the first quarter of 2021. As of March 31, 2021, the Company no longer has an allowance for credit losses associated with the consumer loan beneficial interests. The activity related to the allowance for credit losses related to the consumer loan beneficial interests is included in “impairment expense and provision for beneficial interests, net” on the consolidated statements of operations.
18
| As of September 30, 2017 | As of December 31, 2016 | ||||||||||||||||||||||||
| Amortized cost | Gross unrealized gains | Gross unrealized losses (a) | Fair value | Amortized cost | Gross unrealized gains | Gross unrealized losses | Fair value | ||||||||||||||||||
| Investments (at fair value): | |||||||||||||||||||||||||
| Available-for-sale investments: | |||||||||||||||||||||||||
| Student loan asset-backed and other debt securities (b) | $ | 68,010 | 4,768 | (240 | ) | 72,538 | 98,260 | 6,280 | (641 | ) | 103,899 | ||||||||||||||
| Equity securities | 756 | 2,140 | (21 | ) | 2,875 | 720 | 1,930 | (61 | ) | 2,589 | |||||||||||||||
| Total available-for-sale investments | $ | 68,766 | 6,908 | (261 | ) | 75,413 | 98,980 | 8,210 | (702 | ) | 106,488 | ||||||||||||||
| Trading investments - equity securities | — | 105 | |||||||||||||||||||||||
| Total available-for-sale and trading investments | 75,413 | 106,593 | |||||||||||||||||||||||
| Other Investments and Other Receivables (not measured at fair value): | |||||||||||||||||||||||||
| Venture capital and funds | 84,903 | 69,789 | |||||||||||||||||||||||
| Notes and loans receivable | 56,732 | 17,031 | |||||||||||||||||||||||
| Real estate | 49,567 | 48,379 | |||||||||||||||||||||||
| Tax liens and affordable housing | 9,921 | 12,352 | |||||||||||||||||||||||
| Total investments and other receivables | $ | 276,536 | 254,144 | ||||||||||||||||||||||
6. Intangible Assets net
Intangible assets consistconsisted of the following:
Weighted average remaining useful life as of March 31, 2021 (months) | |||||||||||||||||
| As of | As of | ||||||||||||||||
| March 31, 2021 | December 31, 2020 | ||||||||||||||||
| Amortizable intangible assets, net: | |||||||||||||||||
| Customer relationships (net of accumulated amortization of $90,282 and $83,419, respectively) | 102 | $ | 60,110 | 66,974 | |||||||||||||
| Computer software (net of accumulated amortization of $2,082 and $4,127, respectively) | 33 | 5,775 | 6,430 | ||||||||||||||
| Trade names (net of accumulated amortization of $4,288 and $3,455, respectively) | 3 | 833 | 1,666 | ||||||||||||||
| Total - amortizable intangible assets, net | 95 | $ | 66,718 | 75,070 | |||||||||||||
| Weighted average remaining useful life as of September 30, 2017 (months) | As of September 30, 2017 | As of December 31, 2016 | |||||||
| Amortizable intangible assets, net: | |||||||||
| Customer relationships (net of accumulated amortization of $11,704 and $8,548, respectively) | 162 | $ | 25,179 | 28,335 | |||||
| Trade names (net of accumulated amortization of $2,287 and $1,653, respectively) | 180 | 9,285 | 9,919 | ||||||
| Computer software (net of accumulated amortization of $8,929 and $5,675, respectively) | 17 | 6,042 | 9,296 | ||||||
| Covenants not to compete (net of accumulated amortization of $118 and $91, respectively) | 80 | 236 | 263 | ||||||
| Total - amortizable intangible assets, net | 144 | $ | 40,742 | 47,813 | |||||
The Company recorded amortization expense on its intangible assets of $2.3$8.4 million and $3.2$7.4 million during the three months ended September 30, 2017March 31, 2021 and 2016, respectively, and $7.1 million and $8.4 million during the nine months ended September 30, 2017 and 2016,2020, respectively. The Company will continue to amortize intangible assets over their remaining useful lives. As of September 30, 2017,March 31, 2021, the Company estimates it will record amortization expense as follows:
| 2021 (April 1 - December 31) | $ | 14,690 | |||
| 2022 | 9,939 | ||||
| 2023 | 9,830 | ||||
| 2024 | 7,457 | ||||
| 2025 | 4,644 | ||||
| 2026 and thereafter | 20,158 | ||||
| $ | 66,718 | ||||
| 2017 (October 1 - December 31) | $ | 2,315 | |
| 2018 | 8,605 | ||
| 2019 | 5,147 | ||
| 2020 | 4,231 | ||
| 2021 | 3,480 | ||
| 2022 and thereafter | 16,964 | ||
| $ | 40,742 | ||
7. Goodwill
The carrying amount of goodwill as of December 31, 20162020 and September 30, 2017March 31, 2021 by reportable operating segment was as follows:
| Loan Servicing and Systems | Education Technology, Services, and Payment Processing | Asset Generation and Management | Nelnet Bank | Corporate and Other Activities | Total | ||||||||||||||||||||||||||||||
| Goodwill balance | $ | 23,639 | 76,570 | 41,883 | 0 | 0 | 142,092 | ||||||||||||||||||||||||||||
| Loan Systems and Servicing | Tuition Payment Processing and Campus Commerce | Communications | Asset Generation and Management | Corporate and Other Activities | Total | |||||||||||||
| Goodwill balance | $ | 8,596 | 67,168 | 21,112 | 41,883 | 8,553 | 147,312 | |||||||||||
8. Property and Equipment
Property and equipment consisted of the following:
| As of | As of | ||||||||||||||||||||||||
As of September 30, 2017 | As of December 31, 2016 | Useful life | March 31, 2021 | December 31, 2020 | |||||||||||||||||||||
| Useful life | |||||||||||||||||||||||||
| Non-communications: | |||||||||||||||||||||||||
| Computer equipment and software | 1-5 years | $ | 108,430 | 97,317 | Computer equipment and software | 1-5 years | $ | 188,378 | 172,664 | ||||||||||||||||
| Building and building improvements | 5-39 years | 25,283 | 13,363 | Building and building improvements | 5-48 years | 52,806 | 52,444 | ||||||||||||||||||
| Office furniture and equipment | 3-7 years | 14,357 | 12,344 | Office furniture and equipment | 1-10 years | 22,502 | 21,899 | ||||||||||||||||||
| Leasehold improvements | 5-20 years | 6,496 | 3,579 | Leasehold improvements | 1-15 years | 9,167 | 9,168 | ||||||||||||||||||
| Transportation equipment | 4-10 years | 3,813 | 3,809 | Transportation equipment | 5-10 years | 4,857 | 4,857 | ||||||||||||||||||
| Land | — | 2,605 | 1,682 | Land | — | 3,642 | 3,642 | ||||||||||||||||||
| Construction in progress | — | 14,025 | 16,346 | Construction in progress | — | 20,549 | 18,478 | ||||||||||||||||||
| 175,009 | 148,440 | 301,901 | 283,152 | ||||||||||||||||||||||
| Accumulated depreciation - non-communications | 104,430 | 91,285 | |||||||||||||||||||||||
| Non-communications, net property and equipment | 70,579 | 57,155 | |||||||||||||||||||||||
| Accumulated depreciation | Accumulated depreciation | (171,451) | (159,625) | ||||||||||||||||||||||
| Total property and equipment, net | Total property and equipment, net | $ | 130,450 | 123,527 | |||||||||||||||||||||
| Communications: | |||||||||||||||||||||||||
| Network plant and fiber | 5-15 years | 83,870 | 40,844 | ||||||||||||||||||||||
| Customer located property | 5-10 years | 10,987 | 5,138 | ||||||||||||||||||||||
| Central office | 5-15 years | 8,476 | 6,448 | ||||||||||||||||||||||
| Transportation equipment | 4-10 years | 5,011 | 2,966 | ||||||||||||||||||||||
| Computer equipment and software | 1-5 years | 3,318 | 2,026 | ||||||||||||||||||||||
| Other | 1-39 years | 2,285 | 1,268 | ||||||||||||||||||||||
| Land | — | 70 | 70 | ||||||||||||||||||||||
| Construction in progress | — | 35,709 | 12,537 | ||||||||||||||||||||||
| 149,726 | 71,297 | ||||||||||||||||||||||||
| Accumulated depreciation - communications | 11,864 | 4,666 | |||||||||||||||||||||||
| Communications, net property and equipment | 137,862 | 66,631 | |||||||||||||||||||||||
| Total property and equipment, net | $ | 208,441 | 123,786 | ||||||||||||||||||||||
The Company recorded depreciation expense on its property and equipment of $7.7$11.8 million and $5.8$20.3 million during the three months ended September 30, 2017March 31, 2021 and 2016, respectively, and $20.6 million and $16.4 million during the nine months ended September 30, 2017 and 2016,2020, respectively.
19
9. Earnings per Common Share
Presented below is a summary of the components used to calculate basic and diluted earnings per share. The Company applies the two-class method in computing both basic and diluted earnings per share, which requires the calculation of separate earnings per share amounts for common stock and unvested share-based awards. Unvested share-based awards that contain nonforfeitable rights to dividends are considered securities which participate in undistributed earnings with common stock.
| Three months ended March 31, | |||||||||||||||||||||||||||||||||||
| 2021 | 2020 | ||||||||||||||||||||||||||||||||||
| Common shareholders | Unvested restricted stock shareholders | Total | Common shareholders | Unvested restricted stock shareholders | Total | ||||||||||||||||||||||||||||||
| Numerator: | |||||||||||||||||||||||||||||||||||
| Net income (loss) attributable to Nelnet, Inc. | $ | 121,766 | 1,832 | 123,598 | (39,974) | (558) | (40,532) | ||||||||||||||||||||||||||||
| Denominator: | |||||||||||||||||||||||||||||||||||
| Weighted-average common shares outstanding - basic and diluted | 38,031,267 | 572,288 | 38,603,555 | 39,405,454 | 550,060 | 39,955,514 | |||||||||||||||||||||||||||||
| Earnings per share - basic and diluted | $ | 3.20 | 3.20 | 3.20 | (1.01) | (1.01) | (1.01) | ||||||||||||||||||||||||||||
20
| Three months ended September 30, | ||||||||||||||||||
| 2017 | 2016 | |||||||||||||||||
| Common shareholders | Unvested restricted stock shareholders | Total | Common shareholders | Unvested restricted stock shareholders | Total | |||||||||||||
| Numerator: | ||||||||||||||||||
| Net income attributable to Nelnet, Inc. | $ | 45,850 | 453 | 46,303 | 83,419 | 875 | 84,294 | |||||||||||
| Denominator: | ||||||||||||||||||
| Weighted-average common shares outstanding - basic and diluted | 41,146,424 | 406,892 | 41,553,316 | 42,199,580 | 442,633 | 42,642,213 | ||||||||||||
| Earnings per share - basic and diluted | $ | 1.11 | 1.11 | 1.11 | 1.98 | 1.98 | 1.98 | |||||||||||
| Nine months ended September 30, | ||||||||||||||||||
| 2017 | 2016 | |||||||||||||||||
| Common shareholders | Unvested restricted stock shareholders | Total | Common shareholders | Unvested restricted stock shareholders | Total | |||||||||||||
| Numerator: | ||||||||||||||||||
| Net income attributable to Nelnet, Inc. | $ | 123,816 | 1,249 | 125,065 | 156,749 | 1,656 | 158,405 | |||||||||||
| Denominator: | ||||||||||||||||||
| Weighted-average common shares outstanding - basic and diluted | 41,634,578 | 419,954 | 42,054,532 | 42,340,867 | 447,266 | 42,788,133 | ||||||||||||
| Earnings per share - basic and diluted | $ | 2.97 | 2.97 | 2.97 | 3.70 | 3.70 | 3.70 | |||||||||||
10. Segment Reporting
See note 1415 of the notes to consolidated financial statements included in the 20162020 Annual Report for a description of the Company's operating segments. The following tables include the results of each of the Company's operating segments reconciled to the consolidated financial statements.
| Three months ended March 31, 2021 | |||||||||||||||||||||||||||||||||||||||||||||||
| Loan Servicing and Systems | Education Technology, Services, and Payment Processing | Communications (a) | Asset Generation and Management | Nelnet Bank | Corporate and Other Activities | Eliminations | Total | ||||||||||||||||||||||||||||||||||||||||
| Total interest income | $ | 34 | 263 | 0 | 126,402 | 1,376 | 1,246 | (218) | 129,103 | ||||||||||||||||||||||||||||||||||||||
| Interest expense | 23 | 0 | 0 | 26,950 | 194 | 824 | (218) | 27,773 | |||||||||||||||||||||||||||||||||||||||
| Net interest income (expense) | 11 | 263 | 0 | 99,452 | 1,182 | 422 | 0 | 101,330 | |||||||||||||||||||||||||||||||||||||||
| Less (negative provision) provision for loan losses | 0 | 0 | 0 | (17,470) | 422 | 0 | 0 | (17,048) | |||||||||||||||||||||||||||||||||||||||
| Net interest income after provision for loan losses | 11 | 263 | 0 | 116,922 | 760 | 422 | 0 | 118,378 | |||||||||||||||||||||||||||||||||||||||
| Other income/expense: | |||||||||||||||||||||||||||||||||||||||||||||||
| Loan servicing and systems revenue | 111,517 | 0 | 0 | 0 | 0 | 0 | 0 | 111,517 | |||||||||||||||||||||||||||||||||||||||
| Intersegment revenue | 8,268 | 3 | 0 | 0 | 0 | 0 | (8,271) | 0 | |||||||||||||||||||||||||||||||||||||||
| Education technology, services, and payment processing revenue | 0 | 95,258 | 0 | 0 | 0 | 0 | 0 | 95,258 | |||||||||||||||||||||||||||||||||||||||
| Communications revenue | 0 | 0 | 0 | 0 | 0 | 0 | 0 | 0 | |||||||||||||||||||||||||||||||||||||||
| Other | 1,113 | 0 | 0 | 445 | 22 | (6,184) | 0 | (4,604) | |||||||||||||||||||||||||||||||||||||||
| Gain on sale of loans | 0 | 0 | 0 | 0 | 0 | 0 | 0 | 0 | |||||||||||||||||||||||||||||||||||||||
| Impairment expense and provision for beneficial interests, net | 0 | 0 | 0 | 2,436 | 0 | 0 | 0 | 2,436 | |||||||||||||||||||||||||||||||||||||||
| Derivative settlements, net | 0 | 0 | 0 | (4,304) | 0 | 0 | 0 | (4,304) | |||||||||||||||||||||||||||||||||||||||
| Derivative market value adjustments, net | 0 | 0 | 0 | 38,809 | 0 | 0 | 0 | 38,809 | |||||||||||||||||||||||||||||||||||||||
| Total other income/expense | 120,898 | 95,261 | 0 | 37,386 | 22 | (6,184) | (8,271) | 239,112 | |||||||||||||||||||||||||||||||||||||||
| Cost of services: | |||||||||||||||||||||||||||||||||||||||||||||||
| Cost to provide education technology, services, and payment processing services | 0 | 27,052 | 0 | 0 | 0 | 0 | 0 | 27,052 | |||||||||||||||||||||||||||||||||||||||
| Cost to provide communications services | 0 | 0 | 0 | 0 | 0 | 0 | 0 | 0 | |||||||||||||||||||||||||||||||||||||||
| Total cost of services | 0 | 27,052 | 0 | 0 | 0 | 0 | 0 | 27,052 | |||||||||||||||||||||||||||||||||||||||
| Operating expenses: | |||||||||||||||||||||||||||||||||||||||||||||||
| Salaries and benefits | 66,458 | 25,941 | 0 | 495 | 1,488 | 21,409 | 0 | 115,791 | |||||||||||||||||||||||||||||||||||||||
| Depreciation and amortization | 8,192 | 3,071 | 0 | 0 | 0 | 8,920 | 0 | 20,184 | |||||||||||||||||||||||||||||||||||||||
| Other expenses | 13,285 | 4,822 | 0 | 3,777 | 545 | 14,272 | 0 | 36,698 | |||||||||||||||||||||||||||||||||||||||
| Intersegment expenses, net | 16,890 | 3,664 | 0 | 8,427 | 3 | (20,713) | (8,271) | 0 | |||||||||||||||||||||||||||||||||||||||
| Total operating expenses | 104,825 | 37,498 | 0 | 12,699 | 2,036 | 23,888 | (8,271) | 172,673 | |||||||||||||||||||||||||||||||||||||||
| Income (loss) before income taxes | 16,084 | 30,974 | 0 | 141,609 | (1,254) | (29,650) | 0 | 157,765 | |||||||||||||||||||||||||||||||||||||||
| Income tax (expense) benefit (b) | (3,860) | (7,434) | 0 | (33,987) | 286 | 10,133 | 0 | (34,861) | |||||||||||||||||||||||||||||||||||||||
| Net income (loss) | 12,224 | 23,540 | 0 | 107,622 | (968) | (19,517) | 0 | 122,904 | |||||||||||||||||||||||||||||||||||||||
| Net loss (income) attributable to noncontrolling interests | 0 | 0 | 0 | 0 | 0 | (17) | 711 | 694 | |||||||||||||||||||||||||||||||||||||||
| Net income (loss) attributable to Nelnet, Inc. | $ | 12,224 | 23,540 | 0 | 107,622 | (968) | (19,534) | 711 | 123,598 | ||||||||||||||||||||||||||||||||||||||
| Total assets as of March 31, 2021 | $ | 191,910 | 372,315 | 0 | 20,367,532 | 296,908 | 1,148,560 | (210,017) | 22,167,208 | ||||||||||||||||||||||||||||||||||||||
(a) On December 21, 2020, the Company deconsolidated ALLO from the Company’s consolidated financial statements. See note 2 of the notes to consolidated financial statements included in the 2020 Annual Report for a description of the transaction and a summary of the deconsolidation impact. Accordingly, there are no operating results for the (former) Communications operating segment in 2021.
(b) Income taxes for the Nelnet Bank operating segment reflect Nelnet Bank's actual tax expense/benefit as allocated and reflected in its Call Report filed with the Federal Deposit Insurance Corporation. Income taxes for all other operating segments are allocated based on 24% of that segment's income before taxes. The difference between the consolidated income tax expense and the sum of taxes calculated for each operating segment is included in income taxes in Corporate and Other Activities.
21
| Three months ended September 30, 2017 | Three months ended March 31, 2020 | |||||||||||||||||||||||||||||||||||||||||||||||||||||||||||||||||||
| Loan Systems and Servicing | Tuition Payment Processing and Campus Commerce | Communications | Asset Generation and Management | Corporate and Other Activities | Eliminations | Total | Loan Servicing and Systems | Education Technology, Services, and Payment Processing | Communications | Asset Generation and Management | Nelnet Bank (a) | Corporate and Other Activities | Eliminations | Total | ||||||||||||||||||||||||||||||||||||||||||||||||||||||
| Total interest income | $ | 147 | 5 | 1 | 194,968 | 3,903 | (2,139 | ) | 196,884 | Total interest income | $ | 317 | 1,991 | 0 | 185,926 | 0 | 1,555 | (598) | 189,191 | |||||||||||||||||||||||||||||||||||||||||||||||||
| Interest expense | — | — | 1,551 | 121,074 | 1,165 | (2,139 | ) | 121,650 | Interest expense | 44 | 17 | 0 | 133,249 | 0 | 1,407 | (598) | 134,118 | |||||||||||||||||||||||||||||||||||||||||||||||||||
| Net interest income | 147 | 5 | (1,550 | ) | 73,894 | 2,738 | — | 75,234 | ||||||||||||||||||||||||||||||||||||||||||||||||||||||||||||
| Less provision for loan losses | — | — | — | 6,000 | — | — | 6,000 | |||||||||||||||||||||||||||||||||||||||||||||||||||||||||||||
| Net interest income (loss) after provision for loan losses | 147 | 5 | (1,550 | ) | 67,894 | 2,738 | — | 69,234 | ||||||||||||||||||||||||||||||||||||||||||||||||||||||||||||
| Other income: | ||||||||||||||||||||||||||||||||||||||||||||||||||||||||||||||||||||
| Loan systems and servicing revenue | 55,950 | — | — | — | — | — | 55,950 | |||||||||||||||||||||||||||||||||||||||||||||||||||||||||||||
| Intersegment servicing revenue | 10,563 | — | — | — | — | (10,563 | ) | — | ||||||||||||||||||||||||||||||||||||||||||||||||||||||||||||
| Tuition payment processing, school information, and campus commerce revenue | — | 35,450 | — | — | — | — | 35,450 | |||||||||||||||||||||||||||||||||||||||||||||||||||||||||||||
| Net interest income (expense) | Net interest income (expense) | 273 | 1,974 | 0 | 52,677 | 0 | 148 | 0 | 55,073 | |||||||||||||||||||||||||||||||||||||||||||||||||||||||||||
| Less (negative provision) provision for loan losses | Less (negative provision) provision for loan losses | 0 | 0 | 0 | 76,299 | 0 | 0 | 0 | 76,299 | |||||||||||||||||||||||||||||||||||||||||||||||||||||||||||
| Net interest income after provision for loan losses | Net interest income after provision for loan losses | 273 | 1,974 | 0 | (23,622) | 0 | 148 | 0 | (21,226) | |||||||||||||||||||||||||||||||||||||||||||||||||||||||||||
| Other income/expense: | Other income/expense: | |||||||||||||||||||||||||||||||||||||||||||||||||||||||||||||||||||
| Loan servicing and systems revenue | Loan servicing and systems revenue | 112,735 | 0 | 0 | 0 | 0 | 0 | 0 | 112,735 | |||||||||||||||||||||||||||||||||||||||||||||||||||||||||||
| Intersegment revenue | Intersegment revenue | 11,054 | 11 | 0 | 0 | 0 | 0 | (11,065) | 0 | |||||||||||||||||||||||||||||||||||||||||||||||||||||||||||
| Education technology, services, and payment processing revenue | Education technology, services, and payment processing revenue | 0 | 83,675 | 0 | 0 | 0 | 0 | 0 | 83,675 | |||||||||||||||||||||||||||||||||||||||||||||||||||||||||||
| Communications revenue | — | — | 6,751 | — | — | — | 6,751 | Communications revenue | 0 | 0 | 18,181 | 0 | 0 | 0 | 0 | 18,181 | ||||||||||||||||||||||||||||||||||||||||||||||||||||
| Other income | — | — | — | 2,753 | 17,003 | — | 19,756 | |||||||||||||||||||||||||||||||||||||||||||||||||||||||||||||
| Gain from debt repurchases | — | — | — | 116 | — | — | 116 | |||||||||||||||||||||||||||||||||||||||||||||||||||||||||||||
| Other | Other | 2,630 | 0 | 353 | 3,215 | 0 | 2,083 | 0 | 8,281 | |||||||||||||||||||||||||||||||||||||||||||||||||||||||||||
| Gain on sale of loans | Gain on sale of loans | 0 | 0 | 0 | 18,206 | 0 | 0 | 0 | 18,206 | |||||||||||||||||||||||||||||||||||||||||||||||||||||||||||
| Impairment expense and provision for beneficial interests, net | Impairment expense and provision for beneficial interests, net | 0 | 0 | 0 | (26,303) | 0 | (7,783) | 0 | (34,087) | |||||||||||||||||||||||||||||||||||||||||||||||||||||||||||
| Derivative settlements, net | — | — | — | (382 | ) | (191 | ) | — | (573 | ) | Derivative settlements, net | 0 | 0 | 0 | 4,237 | 0 | 0 | 0 | 4,237 | |||||||||||||||||||||||||||||||||||||||||||||||||
| Derivative market value and foreign currency transaction adjustments, net | — | — | — | 7,702 | 44 | — | 7,746 | |||||||||||||||||||||||||||||||||||||||||||||||||||||||||||||
| Total other income | 66,513 | 35,450 | 6,751 | 10,189 | 16,856 | (10,563 | ) | 125,196 | ||||||||||||||||||||||||||||||||||||||||||||||||||||||||||||
| Derivative market value adjustments, net | Derivative market value adjustments, net | 0 | 0 | 0 | (20,602) | 0 | 0 | 0 | (20,602) | |||||||||||||||||||||||||||||||||||||||||||||||||||||||||||
| Total other income/expense | Total other income/expense | 126,419 | 83,686 | 18,534 | (21,247) | 0 | (5,700) | (11,065) | 190,626 | |||||||||||||||||||||||||||||||||||||||||||||||||||||||||||
| Cost of services: | Cost of services: | |||||||||||||||||||||||||||||||||||||||||||||||||||||||||||||||||||
| Cost to provide education technology, services, and payment processing services | Cost to provide education technology, services, and payment processing services | 0 | 22,806 | 0 | 0 | 0 | 0 | 0 | 22,806 | |||||||||||||||||||||||||||||||||||||||||||||||||||||||||||
| Cost to provide communications services | Cost to provide communications services | 0 | 0 | 5,582 | 0 | 0 | 0 | 0 | 5,582 | |||||||||||||||||||||||||||||||||||||||||||||||||||||||||||
| Total cost of services | Total cost of services | 0 | 22,806 | 5,582 | 0 | 0 | 0 | 0 | 28,388 | |||||||||||||||||||||||||||||||||||||||||||||||||||||||||||
| Operating expenses: | Operating expenses: | |||||||||||||||||||||||||||||||||||||||||||||||||||||||||||||||||||
| Salaries and benefits | 38,435 | 17,432 | 4,099 | 392 | 13,834 | — | 74,193 | Salaries and benefits | 70,493 | 23,696 | 5,416 | 443 | 0 | 19,830 | 0 | 119,878 | ||||||||||||||||||||||||||||||||||||||||||||||||||||
| Depreciation and amortization | 549 | 2,316 | 3,145 | — | 4,040 | — | 10,051 | Depreciation and amortization | 8,848 | 2,387 | 10,507 | 0 | 0 | 5,907 | 0 | 27,648 | ||||||||||||||||||||||||||||||||||||||||||||||||||||
| Loan servicing fees | — | — | — | 7,939 | — | — | 7,939 | |||||||||||||||||||||||||||||||||||||||||||||||||||||||||||||
| Cost to provide communications services | — | — | 2,632 | — | — | — | 2,632 | |||||||||||||||||||||||||||||||||||||||||||||||||||||||||||||
| Other expenses | 10,317 | 4,224 | 2,278 | 1,451 | 12,248 | — | 30,518 | Other expenses | 17,489 | 6,092 | 3,689 | 3,717 | 0 | 12,398 | 0 | 43,384 | ||||||||||||||||||||||||||||||||||||||||||||||||||||
| Intersegment expenses, net | 7,774 | 2,219 | 470 | 10,659 | (10,559 | ) | (10,563 | ) | — | Intersegment expenses, net | 16,239 | 3,327 | 624 | 11,916 | 0 | (21,041) | (11,065) | 0 | ||||||||||||||||||||||||||||||||||||||||||||||||||
| Total operating expenses | 57,075 | 26,191 | 12,624 | 20,441 | 19,563 | (10,563 | ) | 125,333 | Total operating expenses | 113,069 | 35,502 | 20,236 | 16,076 | 0 | 17,094 | (11,065) | 190,910 | |||||||||||||||||||||||||||||||||||||||||||||||||||
| Income (loss) before income taxes | 9,585 | 9,264 | (7,423 | ) | 57,642 | 31 | — | 69,097 | Income (loss) before income taxes | 13,623 | 27,352 | (7,284) | (60,945) | 0 | (22,646) | 0 | (49,898) | |||||||||||||||||||||||||||||||||||||||||||||||||||
| Income tax (expense) benefit | (4,937 | ) | (3,520 | ) | 2,821 | (21,904 | ) | 1,978 | — | (25,562 | ) | Income tax (expense) benefit | (3,269) | (6,565) | 1,748 | 14,627 | 0 | 3,592 | 0 | 10,133 | ||||||||||||||||||||||||||||||||||||||||||||||||
| Net income (loss) | 4,648 | 5,744 | (4,602 | ) | 35,738 | 2,009 | — | 43,535 | Net income (loss) | 10,354 | 20,787 | (5,536) | (46,318) | 0 | (19,054) | 0 | (39,765) | |||||||||||||||||||||||||||||||||||||||||||||||||||
| Net loss (income) attributable to noncontrolling interests | 3,408 | — | — | — | (640 | ) | — | 2,768 | Net loss (income) attributable to noncontrolling interests | 0 | 0 | 0 | 0 | 0 | (767) | 0 | (767) | |||||||||||||||||||||||||||||||||||||||||||||||||||
| Net income (loss) attributable to Nelnet, Inc. | $ | 8,056 | 5,744 | (4,602 | ) | 35,738 | 1,369 | — | 46,303 | Net income (loss) attributable to Nelnet, Inc. | $ | 10,354 | 20,787 | (5,536) | (46,318) | 0 | (19,821) | 0 | (40,532) | |||||||||||||||||||||||||||||||||||||||||||||||||
| Total assets as of September 30, 2017 | $ | 98,555 | 208,290 | 179,206 | 23,724,413 | 863,700 | (305,454 | ) | 24,768,710 | |||||||||||||||||||||||||||||||||||||||||||||||||||||||||||
| Total assets as of March 31, 2020 | Total assets as of March 31, 2020 | $ | 223,021 | 302,631 | 301,440 | 21,905,150 | 0 | 679,390 | (131,004) | 23,280,628 | ||||||||||||||||||||||||||||||||||||||||||||||||||||||||||
(a) Nelnet Bank launched operations on November 2, 2020. Accordingly, there are no operating results for the Nelnet Bank operating segment in the three months ended March 31, 2020.
22
| Three months ended September 30, 2016 | |||||||||||||||||||||
| Loan Systems and Servicing | Tuition Payment Processing and Campus Commerce | Communications | Asset Generation and Management | Corporate and Other Activities | Eliminations | Total | |||||||||||||||
| Total interest income | $ | 37 | 2 | — | 194,701 | 2,370 | (930 | ) | 196,181 | ||||||||||||
| Interest expense | — | — | 318 | 95,383 | 1,615 | (930 | ) | 96,386 | |||||||||||||
| Net interest income | 37 | 2 | (318 | ) | 99,318 | 755 | — | 99,795 | |||||||||||||
| Less provision for loan losses | — | — | — | 6,000 | — | — | 6,000 | ||||||||||||||
| Net interest income (loss) after provision for loan losses | 37 | 2 | (318 | ) | 93,318 | 755 | — | 93,795 | |||||||||||||
| Other income: | |||||||||||||||||||||
| Loan systems and servicing revenue | 54,350 | — | — | — | — | — | 54,350 | ||||||||||||||
| Intersegment servicing revenue | 11,021 | — | — | — | — | (11,021 | ) | — | |||||||||||||
| Tuition payment processing, school information, and campus commerce revenue | — | 33,071 | — | — | — | — | 33,071 | ||||||||||||||
| Communications revenue | — | — | 4,343 | — | — | — | 4,343 | ||||||||||||||
| Enrollment services revenue | — | — | — | — | — | — | — | ||||||||||||||
| Other income | — | — | — | 4,265 | 10,886 | — | 15,150 | ||||||||||||||
| Gain from debt repurchases | — | — | — | 2,160 | — | — | 2,160 | ||||||||||||||
| Derivative settlements, net | — | — | — | (6,028 | ) | (233 | ) | — | (6,261 | ) | |||||||||||
| Derivative market value and foreign currency transaction adjustments, net | — | — | — | 42,546 | (284 | ) | — | 42,262 | |||||||||||||
| Total other income | 65,371 | 33,071 | 4,343 | 42,943 | 10,369 | (11,021 | ) | 145,075 | |||||||||||||
| Operating expenses: | . | ||||||||||||||||||||
| Salaries and benefits | 32,505 | 15,979 | 2,325 | 486 | 12,448 | — | 63,743 | ||||||||||||||
| Depreciation and amortization | 557 | 2,929 | 1,630 | — | 3,878 | — | 8,994 | ||||||||||||||
| Loan servicing fees | — | — | — | 5,880 | — | — | 5,880 | ||||||||||||||
| Cost to provide communications services | — | — | 1,784 | — | — | — | 1,784 | ||||||||||||||
| Cost to provide enrollment services | — | — | — | — | — | — | — | ||||||||||||||
| Other expenses | 8,784 | 4,149 | 1,545 | 1,769 | 10,143 | — | 26,391 | ||||||||||||||
| Intersegment expenses, net | 5,825 | 1,616 | 279 | 11,146 | (7,845 | ) | (11,021 | ) | — | ||||||||||||
| Total operating expenses | 47,671 | 24,673 | 7,563 | 19,281 | 18,624 | (11,021 | ) | 106,792 | |||||||||||||
| Income (loss) before income taxes | 17,737 | 8,400 | (3,538 | ) | 116,980 | (7,500 | ) | — | 132,078 | ||||||||||||
| Income tax (expense) benefit | (6,740 | ) | (3,192 | ) | 1,344 | (44,571 | ) | 5,443 | — | (47,715 | ) | ||||||||||
| Net income (loss) | 10,997 | 5,208 | (2,194 | ) | 72,409 | (2,057 | ) | — | 84,363 | ||||||||||||
| Net loss (income) attributable to noncontrolling interests | — | — | — | — | (69 | ) | — | (69 | ) | ||||||||||||
| Net income (loss) attributable to Nelnet, Inc. | $ | 10,997 | 5,208 | (2,194 | ) | 72,409 | (2,126 | ) | — | 84,294 | |||||||||||
| Total assets as of September 30, 2016 | $ | 79,418 | 190,682 | 90,361 | 26,888,950 | 687,347 | (267,147 | ) | 27,669,611 | ||||||||||||
11. Disaggregated Revenue
The following tables provide disaggregated revenue by service offering and/or customer type for the Company's fee-based reportable operating segments (except ALLO).
Loan Servicing and Systems
| Three months ended March 31, | |||||||||||||||||||||||
| 2021 | 2020 | ||||||||||||||||||||||
| Government servicing - Nelnet | $ | 34,872 | 38,650 | ||||||||||||||||||||
| Government servicing - Great Lakes | 43,302 | 46,446 | |||||||||||||||||||||
| Private education and consumer loan servicing | 8,548 | 8,609 | |||||||||||||||||||||
| FFELP servicing | 4,670 | 5,614 | |||||||||||||||||||||
| Software services | 8,454 | 11,318 | |||||||||||||||||||||
| Outsourced services | 11,671 | 2,098 | |||||||||||||||||||||
| Loan servicing and systems revenue | $ | 111,517 | 112,735 | ||||||||||||||||||||
Education Technology, Services, and Payment Processing
| Three months ended March 31, | |||||||||||||||||||||||
| 2021 | 2020 | ||||||||||||||||||||||
| Tuition payment plan services | $ | 29,550 | 31,587 | ||||||||||||||||||||
| Payment processing | 33,038 | 31,742 | |||||||||||||||||||||
| Education technology and services | 32,322 | 20,054 | |||||||||||||||||||||
| Other | 348 | 292 | |||||||||||||||||||||
| Education technology, services, and payment processing revenue | $ | 95,258 | 83,675 | ||||||||||||||||||||
Other Income/Expense
The following table provides the components of "other" in "other income/expense" on the consolidated statements of operations:
| Three months ended March 31, | |||||||||||||||||||||||
| 2021 | 2020 | ||||||||||||||||||||||
| Income/gains from investments, net | $ | 8,498 | (1,025) | ||||||||||||||||||||
| Investment advisory services | 2,697 | 2,802 | |||||||||||||||||||||
| ALLO preferred return | 2,321 | 0 | |||||||||||||||||||||
| Management fee revenue | 1,113 | 2,630 | |||||||||||||||||||||
| Borrower late fee income | 442 | 3,188 | |||||||||||||||||||||
| Loss from ALLO voting membership interests investment | (22,219) | 0 | |||||||||||||||||||||
| Loss from solar investments | (1,679) | (2,839) | |||||||||||||||||||||
| Other | 4,223 | 3,525 | |||||||||||||||||||||
| $ | (4,604) | 8,281 | |||||||||||||||||||||
23
| Nine months ended September 30, 2017 | |||||||||||||||||||||
| Loan Systems and Servicing | Tuition Payment Processing and Campus Commerce | Communications | Asset Generation and Management | Corporate and Other Activities | Eliminations | Total | |||||||||||||||
| Total interest income | $ | 361 | 10 | 2 | 568,661 | 10,026 | (5,274 | ) | 573,786 | ||||||||||||
| Interest expense | — | — | 3,367 | 340,898 | 2,794 | (5,274 | ) | 341,787 | |||||||||||||
| Net interest income | 361 | 10 | (3,365 | ) | 227,763 | 7,232 | — | 231,999 | |||||||||||||
| Less provision for loan losses | — | — | — | 9,000 | — | — | 9,000 | ||||||||||||||
| Net interest income (loss) after provision for loan losses | 361 | 10 | (3,365 | ) | 218,763 | 7,232 | — | 222,999 | |||||||||||||
| Other income: | |||||||||||||||||||||
| Loan systems and servicing revenue | 167,079 | — | — | — | — | — | 167,079 | ||||||||||||||
| Intersegment servicing revenue | 30,839 | — | — | — | — | (30,839 | ) | — | |||||||||||||
| Tuition payment processing, school information, and campus commerce revenue | — | 113,293 | — | — | — | — | 113,293 | ||||||||||||||
| Communications revenue | — | — | 17,577 | — | — | — | 17,577 | ||||||||||||||
| Other income | — | — | — | 9,152 | 35,722 | — | 44,874 | ||||||||||||||
| Gain from debt repurchases | — | — | — | 1,097 | 4,440 | — | 5,537 | ||||||||||||||
| Derivative settlements, net | — | — | — | (1,721 | ) | (593 | ) | — | (2,314 | ) | |||||||||||
| Derivative market value and foreign currency transaction adjustments, net | — | — | — | (23,121 | ) | (133 | ) | — | (23,254 | ) | |||||||||||
| Total other income | 197,918 | 113,293 | 17,577 | (14,593 | ) | 39,436 | (30,839 | ) | 322,792 | ||||||||||||
| Operating expenses: | |||||||||||||||||||||
| Salaries and benefits | 116,932 | 50,986 | 10,489 | 1,156 | 41,121 | — | 220,684 | ||||||||||||||
| Depreciation and amortization | 1,644 | 7,053 | 7,880 | — | 11,109 | — | 27,687 | ||||||||||||||
| Loan servicing fees | — | — | — | 19,584 | — | — | 19,584 | ||||||||||||||
| Cost to provide communications services | — | — | 6,789 | — | — | — | 6,789 | ||||||||||||||
| Other expenses | 28,333 | 14,072 | 5,422 | 4,269 | 32,497 | — | 84,593 | ||||||||||||||
| Intersegment expenses, net | 23,496 | 6,430 | 1,472 | 31,114 | (31,673 | ) | (30,839 | ) | — | ||||||||||||
| Total operating expenses | 170,405 | 78,541 | 32,052 | 56,123 | 53,054 | (30,839 | ) | 359,337 | |||||||||||||
| Income (loss) before income taxes | 27,874 | 34,762 | (17,840 | ) | 148,047 | (6,386 | ) | — | 186,454 | ||||||||||||
| Income tax (expense) benefit | (14,410 | ) | (13,210 | ) | 6,779 | (56,258 | ) | 6,749 | — | (70,349 | ) | ||||||||||
| Net income (loss) | 13,464 | 21,552 | (11,061 | ) | 91,789 | 363 | — | 116,105 | |||||||||||||
| Net loss (income) attributable to noncontrolling interests | 10,050 | — | — | — | (1,090 | ) | — | 8,960 | |||||||||||||
| Net income (loss) attributable to Nelnet, Inc. | $ | 23,514 | 21,552 | (11,061 | ) | 91,789 | (727 | ) | — | 125,065 | |||||||||||
| Total assets as of September 30, 2017 | $ | 98,555 | 208,290 | 179,206 | 23,724,413 | 863,700 | (305,454 | ) | 24,768,710 | ||||||||||||
| Nine months ended September 30, 2016 | |||||||||||||||||||||
| Loan Systems and Servicing | Tuition Payment Processing and Campus Commerce | Communications | Asset Generation and Management | Corporate and Other Activities | Eliminations | Total | |||||||||||||||
| Total interest income | $ | 80 | 7 | 1 | 570,390 | 6,527 | (2,556 | ) | 574,449 | ||||||||||||
| Interest expense | — | — | 671 | 278,029 | 4,702 | (2,556 | ) | 280,847 | |||||||||||||
| Net interest income | 80 | 7 | (670 | ) | 292,361 | 1,825 | — | 293,602 | |||||||||||||
| Less provision for loan losses | — | — | — | 10,500 | — | — | 10,500 | ||||||||||||||
| Net interest income (loss) after provision for loan losses | 80 | 7 | (670 | ) | 281,861 | 1,825 | — | 283,102 | |||||||||||||
| Other income: | |||||||||||||||||||||
| Loan systems and servicing revenue | 161,082 | — | — | — | — | — | 161,082 | ||||||||||||||
| Intersegment servicing revenue | 34,436 | — | — | — | — | (34,436 | ) | — | |||||||||||||
| Tuition payment processing, school information, and campus commerce revenue | — | 102,211 | — | — | — | — | 102,211 | ||||||||||||||
| Communications revenue | — | — | 13,167 | — | — | — | 13,167 | ||||||||||||||
| Enrollment services revenue | — | — | — | — | 4,326 | — | 4,326 | ||||||||||||||
| Other income | — | — | — | 12,362 | 26,349 | — | 38,711 | ||||||||||||||
| Gain from debt repurchases | — | — | — | 2,260 | — | — | 2,260 | ||||||||||||||
| Derivative settlements, net | — | — | — | (17,596 | ) | (696 | ) | — | (18,292 | ) | |||||||||||
| Derivative market value and foreign currency transaction adjustments, net | — | — | — | (8,763 | ) | (6,336 | ) | — | (15,099 | ) | |||||||||||
| Total other income | 195,518 | 102,211 | 13,167 | (11,737 | ) | 23,643 | (34,436 | ) | 288,366 | ||||||||||||
| Operating expenses: | |||||||||||||||||||||
| Salaries and benefits | 96,851 | 45,859 | 4,792 | 1,504 | 38,902 | — | 187,907 | ||||||||||||||
| Depreciation and amortization | 1,440 | 7,711 | 4,137 | — | 11,528 | — | 24,817 | ||||||||||||||
| Loan servicing fees | — | — | — | 20,024 | — | — | 20,024 | ||||||||||||||
| Cost to provide communications services | — | — | 5,169 | — | — | — | 5,169 | ||||||||||||||
| Cost to provide enrollment services | — | — | — | — | 3,623 | — | 3,623 | ||||||||||||||
| Other expenses | 31,635 | 13,122 | 3,110 | 4,766 | 31,540 | — | 84,174 | ||||||||||||||
| Intersegment expenses, net | 18,168 | 4,690 | 610 | 34,791 | (23,823 | ) | (34,436 | ) | — | ||||||||||||
| Total operating expenses | 148,094 | 71,382 | 17,818 | 61,085 | 61,770 | (34,436 | ) | 325,714 | |||||||||||||
| Income (loss) before income taxes | 47,504 | 30,836 | (5,321 | ) | 209,039 | (36,302 | ) | — | 245,754 | ||||||||||||
| Income tax (expense) benefit | (18,052 | ) | (11,718 | ) | 2,022 | (79,434 | ) | 19,998 | — | (87,184 | ) | ||||||||||
| Net income (loss) | 29,452 | 19,118 | (3,299 | ) | 129,605 | (16,304 | ) | — | 158,570 | ||||||||||||
| Net loss (income) attributable to noncontrolling interests | — | — | — | — | (165 | ) | — | (165 | ) | ||||||||||||
| Net income (loss) attributable to Nelnet, Inc. | $ | 29,452 | 19,118 | (3,299 | ) | 129,605 | (16,469 | ) | — | 158,405 | |||||||||||
| Total assets as of September 30, 2016 | $ | 79,418 | 190,682 | 90,361 | 26,888,950 | 687,347 | (267,147 | ) | 27,669,611 | ||||||||||||
The current servicing contracts with the Department announcedare currently scheduled to expire on June 14, 2021, but provide the potential for an additional six-month extension at the Department’s discretion through December 14, 2021. The Consolidated Appropriations Act, 2021, signed into law on December 27, 2020, provides that the Department may extend the period of performance for the servicing contracts scheduled to expire on December 14, 2021 for up to two additional years to December 14, 2023.
The Department is conducting a new contract procurement process entitled Next Generation Financial Services Environment (“NextGen”) for a new framework for the Department to acquire a single servicing platform to manageof all student loans owned by the Department. On January 15, 2019, the Department issued solicitations for certain NextGen components, including the NextGen Enhanced Processing Solution (“EPS”), which was for a technology servicing system and certain processing functions the Department planned to use under NextGen to service the Department's student loan customers, and the NextGen Business Processing Operations (“BPO”), which is for the back office and call center operational functions for servicing the Department's student loan customers.
On June 24, 2020, the Department awarded and signed contracts with five other companies in connection with the BPO solicitation. On July 10, 2020, the Department cancelled the solicitation for the EPS component. In May 2016, Nelnet Servicing, a subsidiarythe Department's description of its cancellation of the Company, and Great Lakes submitted a joint responseEPS solicitation component, the Department indicated that it continues to be committed to the procurement as partgoals and vision of NextGen, and that it would be introducing a newly created joint venturenew solicitation to respondcontinue the NextGen strategy in the future. On October 28, 2020, the Department issued a new federal loan servicing solicitation for an Interim Servicing Solution ("ISS"). ISS was a follow-on to the existing contracts, which would award a full system and servicing solution to two providers. Under ISS, the selected providers would have provided the technology platform to host the Department's student loan portfolio; customer service (including contact centers) and back-office processing; digital engagement layer including borrower-facing website and mobile-applications; intake, imaging, and fulfillment; and portfolio-level operations. As the companies awarded BPO contracts are onboarded, contact center and back-office operations would have shifted from the ISS contract solicitation process and to provide services under a new contract in the event that the Department selects it for a contract award.BPO providers. The joint venture operates as a new legal entity called GreatNet. Nelnet Servicing and Great Lakes each own 50 percentConsolidated Appropriations Act, 2021 contains provisions directing certain aspects of the ownership interests of GreatNet. In addition to Nelnet Servicing, Great Lakes is currently one of four large private sector companies (referred to as Title IV Additional Servicers, or "TIVAS")NextGen process, including that has aany new federal student loan servicing environment shall provide for the participation of multiple student loan servicers and the allocation of borrower accounts to eligible student loan servicers based on performance, and directed the suspension of awarding any ISS contract withfor at least 90 days. On January 9, 2021, the Department to provide servicing for loans owned bysuspended the Department. On May 19, 2017,ISS solicitation. In the Department announcedDepartment’s description of the suspension, it had amended the contract procurement process, which required another response by the participants, and on July 7, 2017, GreatNet submitted its response to the Department.
24
13. Fair Value
The following tables present the Company’s financial assets and liabilities that are measured at fair value on a recurring basis. There
| As of March 31, 2021 | As of December 31, 2020 | ||||||||||||||||||||||||||||||||||||||||||||||
| Level 1 | Level 2 | Total | Level 1 | Level 2 | Total | ||||||||||||||||||||||||||||||||||||||||||
| Assets: | |||||||||||||||||||||||||||||||||||||||||||||||
| Investments: | |||||||||||||||||||||||||||||||||||||||||||||||
| Student loan asset-backed debt securities - available-for-sale | $ | 0 | 379,110 | 379,110 | 0 | 348,504 | 348,504 | ||||||||||||||||||||||||||||||||||||||||
| Equity securities (a) | 28,296 | 0 | 28,296 | 10,114 | 0 | 10,114 | |||||||||||||||||||||||||||||||||||||||||
| Equity securities measured at net asset value (b) | 31,557 | 31,927 | |||||||||||||||||||||||||||||||||||||||||||||
| Debt securities - available-for-sale | 103 | 0 | 103 | 103 | 0 | 103 | |||||||||||||||||||||||||||||||||||||||||
| Total investments | 28,399 | 379,110 | 439,066 | 10,217 | 348,504 | 390,648 | |||||||||||||||||||||||||||||||||||||||||
| Total assets | $ | 28,399 | 379,110 | 439,066 | 10,217 | 348,504 | 390,648 | ||||||||||||||||||||||||||||||||||||||||
(a) As of March 31, 2021, $13.5 million and $14.8 million of equity securities were no transfers into or outclassified as trading and available-for-sale, respectively. All equity securities as of level 1, level 2, or level 3 forDecember 31, 2020 were classified as available-for-sale.
(b) In accordance with the nine months ended September 30, 2017.
| As of September 30, 2017 | As of December 31, 2016 | |||||||||||||||||
| Level 1 | Level 2 | Total | Level 1 | Level 2 | Total | |||||||||||||
| Assets: | ||||||||||||||||||
| Investments (available-for-sale and trading): | ||||||||||||||||||
| Student loan and other asset-backed securities | $ | — | 72,427 | 72,427 | — | 103,780 | 103,780 | |||||||||||
| Equity securities | 2,875 | — | 2,875 | 2,694 | — | 2,694 | ||||||||||||
| Debt securities | 111 | — | 111 | 119 | — | 119 | ||||||||||||
| Total investments (available-for-sale and trading) | 2,986 | 72,427 | 75,413 | 2,813 | 103,780 | 106,593 | ||||||||||||
| Derivative instruments | — | 996 | 996 | — | 87,531 | 87,531 | ||||||||||||
| Total assets | $ | 2,986 | 73,423 | 76,409 | 2,813 | 191,311 | 194,124 | |||||||||||
| Liabilities: | ||||||||||||||||||
| Derivative instruments | $ | — | 30,105 | 30,105 | — | 77,826 | 77,826 | |||||||||||
| Total liabilities | $ | — | 30,105 | 30,105 | — | 77,826 | 77,826 | |||||||||||
Fair Value Measurements Topic of the FASB Accounting Standards Codification, certain investments that are measured at fair value using the net asset value per share (or its equivalent) practical expedient have not been classified in the fair value hierarchy.
The following table summarizes the fair values of all of the Company’s financial instruments on the consolidated balance sheets:
| As of March 31, 2021 | |||||||||||||||||||||||||||||
| Fair value | Carrying value | Level 1 | Level 2 | Level 3 | |||||||||||||||||||||||||
| Financial assets: | |||||||||||||||||||||||||||||
| Loans receivable | $ | 20,247,318 | 18,942,969 | 0 | 0 | 20,247,318 | |||||||||||||||||||||||
| Accrued loan interest receivable | 794,561 | 794,561 | 0 | 794,561 | 0 | ||||||||||||||||||||||||
| Cash and cash equivalents | 144,229 | 144,229 | 144,229 | 0 | 0 | ||||||||||||||||||||||||
| Investments (at fair value) | 439,066 | 439,066 | 28,399 | 379,110 | 0 | ||||||||||||||||||||||||
| Beneficial interest in loan securitizations | 71,514 | 52,164 | 0 | 0 | 71,514 | ||||||||||||||||||||||||
| Restricted cash | 609,881 | 609,881 | 609,881 | 0 | 0 | ||||||||||||||||||||||||
| Restricted cash – due to customers | 193,081 | 193,081 | 193,081 | 0 | 0 | ||||||||||||||||||||||||
| Financial liabilities: | |||||||||||||||||||||||||||||
| Bonds and notes payable | 18,968,284 | 18,754,715 | 0 | 18,968,284 | 0 | ||||||||||||||||||||||||
| Accrued interest payable | 5,527 | 5,527 | 0 | 5,527 | 0 | ||||||||||||||||||||||||
| Bank deposits | 111,398 | 111,830 | 45,147 | 66,251 | 0 | ||||||||||||||||||||||||
| Due to customers | 230,581 | 230,581 | 230,581 | 0 | 0 | ||||||||||||||||||||||||
| As of September 30, 2017 | |||||||||||||||
| Fair value | Carrying value | Level 1 | Level 2 | Level 3 | |||||||||||
| Financial assets: | |||||||||||||||
| Student loans receivable | $ | 23,635,887 | 22,528,845 | — | — | 23,635,887 | |||||||||
| Cash and cash equivalents | 254,391 | 254,391 | 254,391 | — | — | ||||||||||
| Investments (available-for-sale) | 75,413 | 75,413 | 2,986 | 72,427 | — | ||||||||||
| Notes receivable | 16,393 | 16,393 | — | 16,393 | — | ||||||||||
| Loans receivable | 42,006 | 40,339 | — | — | 42,006 | ||||||||||
| Restricted cash | 725,463 | 725,463 | 725,463 | — | — | ||||||||||
| Restricted cash – due to customers | 105,299 | 105,299 | 105,299 | — | — | ||||||||||
| Accrued interest receivable | 396,827 | 396,827 | — | 396,827 | — | ||||||||||
| Derivative instruments | 996 | 996 | — | 996 | — | ||||||||||
| Financial liabilities: | |||||||||||||||
| Bonds and notes payable | 22,319,439 | 22,240,279 | — | 22,319,439 | — | ||||||||||
| Accrued interest payable | 47,824 | 47,824 | — | 47,824 | — | ||||||||||
| Due to customers | 105,299 | 105,299 | 105,299 | — | — | ||||||||||
| Derivative instruments | 30,105 | 30,105 | — | 30,105 | — | ||||||||||
| As of December 31, 2020 | |||||||||||||||||||||||||||||
| Fair value | Carrying value | Level 1 | Level 2 | Level 3 | |||||||||||||||||||||||||
| Financial assets: | |||||||||||||||||||||||||||||
| Loans receivable | $ | 20,454,132 | 19,391,045 | 0 | 0 | 20,454,132 | |||||||||||||||||||||||
| Accrued loan interest receivable | 794,611 | 794,611 | 0 | 794,611 | 0 | ||||||||||||||||||||||||
| Cash and cash equivalents | 121,249 | 121,249 | 121,249 | 0 | 0 | ||||||||||||||||||||||||
| Investments (at fair value) | 390,648 | 390,648 | 10,217 | 348,504 | 0 | ||||||||||||||||||||||||
| Beneficial interest in loan securitizations | 58,709 | 58,331 | 0 | 0 | 58,709 | ||||||||||||||||||||||||
| Restricted cash | 553,175 | 553,175 | 553,175 | 0 | 0 | ||||||||||||||||||||||||
| Restricted cash – due to customers | 283,971 | 283,971 | 283,971 | 0 | 0 | ||||||||||||||||||||||||
| Financial liabilities: | |||||||||||||||||||||||||||||
| Bonds and notes payable | 19,270,810 | 19,320,726 | 0 | 19,270,810 | 0 | ||||||||||||||||||||||||
| Accrued interest payable | 28,701 | 28,701 | 0 | 28,701 | 0 | ||||||||||||||||||||||||
| Bank deposits | 54,599 | 54,633 | 48,422 | 6,177 | 0 | ||||||||||||||||||||||||
| Due to customers | 301,471 | 301,471 | 301,471 | 0 | 0 | ||||||||||||||||||||||||
| As of December 31, 2016 | |||||||||||||||
| Fair value | Carrying value | Level 1 | Level 2 | Level 3 | |||||||||||
| Financial assets: | |||||||||||||||
| Student loans receivable | $ | 25,653,581 | 24,903,724 | — | — | 25,653,581 | |||||||||
| Cash and cash equivalents | 69,654 | 69,654 | 69,654 | — | — | ||||||||||
| Investments (available-for-sale and trading) | 106,593 | 106,593 | 2,813 | 103,780 | — | ||||||||||
| Notes receivable | 17,031 | 17,031 | — | 17,031 | — | ||||||||||
| Restricted cash | 980,961 | 980,961 | 980,961 | — | — | ||||||||||
| Restricted cash – due to customers | 119,702 | 119,702 | 119,702 | — | — | ||||||||||
| Accrued interest receivable | 391,264 | 391,264 | — | 391,264 | — | ||||||||||
| Derivative instruments | 87,531 | 87,531 | — | 87,531 | — | ||||||||||
| Financial liabilities: | |||||||||||||||
| Bonds and notes payable | 24,220,996 | 24,668,490 | — | 24,220,996 | — | ||||||||||
| Accrued interest payable | 45,677 | 45,677 | — | 45,677 | — | ||||||||||
| Due to customers | 119,702 | 119,702 | 119,702 | — | — | ||||||||||
| Derivative instruments | 77,826 | 77,826 | — | 77,826 | — | ||||||||||
The methodologies for estimating the fair value of financial assets and liabilities are described in note 2022 of the notes to consolidated financial statements included in the 20162020 Annual Report.
ITEM 2. MANAGEMENT’S DISCUSSION AND ANALYSIS OF FINANCIAL CONDITION AND RESULTS OF OPERATIONS
(Management’s Discussion and Analysis of Financial Condition and Results of Operations is for the three and nine months ended September 30, 2017March 31, 2021 and 2016.2020. All dollars are in thousands, except per share amounts, unless otherwise noted.)
The following discussion and analysis provides information that the Company’s management believes is relevant to an assessment and understanding of the consolidated results of operations and financial condition of the Company. The discussion should be read in conjunction with the Company’s consolidated financial statements included in the 20162020 Annual Report.
Forward-looking and cautionary statements
This report contains forward-looking statements and information that are based on management's current expectations as of the date of this document. Statements that are not historical facts, including statements about the Company's plans and expectations for future financial condition, results of operations or economic performance, or that address management's plans and objectives for future operations, and statements that assume or are dependent upon future events, are forward-looking statements. The words “may,“anticipate,” “should,“assume,” “believe,” “continue,” “could,” “would,” “predict,” “potential,” “continue,“estimate,” “expect,” “anticipate,“forecast,” “future,” “intend,” “scheduled,“may,” “plan,” “believe,“potential,” “estimate,“predict,” “assume,“scheduled,” “forecast,“should,” “will,” “would,” and similar expressions, as well as statements in future tense, are intended to identify forward-looking statements.
The forward-looking statements are based on assumptions and analyses made by management in light of management's experience and its perception of historical trends, current conditions, expected future developments, and other factors that management believes are appropriate under the circumstances. These statements are subject to known and unknown risks, uncertainties, assumptions, and other factors that may cause the actual results and performance to be materially different from any future results or performance expressed or implied by such forward-looking statements. These factors include, among others, the risks and uncertainties set forth in the “Risk Factors” section of the 20162020 Annual Report and elsewhere in this report, and include such risks and uncertainties as:
•risks and uncertainties related to the severity, magnitude, and duration of the coronavirus disease 2019 (“COVID-19”) pandemic, including changes in the macroeconomic environment and consumer behavior, restrictions on business, educational, individual, or travel activities intended to slow the spread of the pandemic, and volatility in market conditions resulting from the pandemic, including interest rates, the value of equities, and other financial assets;
•risks related to the ability to successfully maintain and increase allocated volumes of student loans serviced by the Company under existing and any future servicing contracts with the U.S. Department of Education (the "Department"), which current contracts accounted for 27 percent of the Company's revenue in 2020, risks to the Company related to the Department's initiatives to procure new contracts for federal student loan servicing, including the pending and uncertain nature of the Department's NextGen and ISS procurement processes (under which awards of new NextGen contracts have been made to other service providers), the possibility that awards or evaluations of proposals may be challenged by various interested parties and may not be finalized or implemented for an extended period of time or at all, risks that the Company may not be successful in obtaining any of such potential new contracts, and risks related to the Company's ability to comply with agreements with third-party customers for the servicing of Federal Direct Loan Program, Federal Family Education Loan Program (the "FFEL Program" or "FFELP"), and private education and consumer loans;
•loan portfolio risks such as interest rate basis and repricing risk resulting from the fact that the interest rate characteristics of the student loan assets do not match the interest rate characteristics of the funding for those assets, the risk of loss of floor income on certain student loans originated under the Federal Family Education LoanFFEL Program, (the "FFEL Program" or "FFELP"), risks related to the use of derivatives to manage exposure to interest rate fluctuations, uncertainties regarding the expected benefits from purchased securitized and unsecuritized FFELP, private education, and consumer loans, or investment interests therein, and initiatives to purchase additional FFELP, private education, and consumer loans, and risks from changes in levels of student loan prepayment or default rates;
•financing and liquidity risks, including risks of changes in the general interest rate environment, including the availability of any relevant money market index rate such as LIBOR or the relationship between the relevant money market index rate and the rate at which the Company's assets and liabilities are priced, and changes in the securitization and other financing markets for student loans, including adverse changes resulting from slower than expected paymentsunanticipated repayment trends on student loans in FFELPthe Company's securitization trusts that could accelerate or delay repayment of the associated bonds, which may increase the costs or limit the availability of financings necessary to purchase, refinance, or continue to hold student loans;
26
•risks from changes in the terms of education loans and in the educational credit and services markets resulting from changes in applicable laws, regulations, and government programs and budgets, such as changes resulting from the Coronavirus Aid, Relief, and Economic Security Act (the "CARES Act") and the expected decline over time in FFELP loan interest income and fee-based revenues due to the discontinuation of new FFELP loan originations in 2010 and potential government initiatives or legislative proposals to consolidate existing FFELP loans to the Federal Direct Loan Program, or otherwise allow FFELP loans to be refinanced with Federal Direct Loan Program loans;loans, or create additional loan forgiveness or broad debt cancellation programs;
•risks related to a breach of or failure in the Company's operational or information systems or infrastructure, or those of third-party vendors, including cybersecurity risks related to the potential disclosure of confidential student loan borrower and other customer information;information, the potential disruption of the Company's systems or those of third-party vendors or customers, and/or the potential damage to the Company's reputation resulting from cyber-breaches;
•uncertainties inherent in forecasting future cash flows from student loan assets and related asset-backed securitizations;
•risks related to the expected benefits to the Company and to ALLO Communications LLC (“ALLO”) from the recapitalization and additional communitiesfunding for ALLO and managethe Company’s continuing investment in ALLO, and risks related construction risks;to investments in solar projects, including risks of not being able to realize tax credits which remain subject to recapture by taxing authorities;
•risks and uncertainties related to other initiatives to pursue additional strategic investments, acquisitions, and other activities, such as the completed and additional planned transactions associated with the sale by Wells Fargo of its private education loan portfolio (including potential errors in converting loan servicing portfolio acquisitions to the Company's servicing platform), including investments and acquisitionsactivities that are intended to diversify the Company both within and outside of its historical core education-related businesses; and
•risks and uncertainties associated with litigation matters and with maintaining compliance with the extensive regulatory requirements applicable to the Company's businesses, reputational and other risks, including the risk of increased regulatory costs resulting from the recent politicization of student loan servicing, and uncertainties inherent in the estimates and assumptions about future events that management is required to make in the preparation of the Company's consolidated financial statements.
All forward-looking statements contained in this report are qualified by these cautionary statements and are made only as of the date of this document. Although the Company may from time to time voluntarily update or revise its prior forward-looking statements to reflect actual results or changes in the Company's expectations, the Company disclaims any commitment to do so except as required by securities laws.law.
OVERVIEW
The Company is a diverse company with a focus onpurpose to serve others and a vision to make customers' dreams possible by delivering education-relatedcustomer focused products and services and student loan asset management.services. The largest operating businesses engage in student loan servicing tuitionand education technology, services, and payment processing, and school information systems, andthe Company also has a significant investment in communications. A significant portion of the Company's revenue is net interest income earned on a portfolio of federally insured student loans. The Company also makes investments to further diversify the Company both within and outside of its historical core education-related businesses, including, but not limited to, investments in real estate, early-stage and start-up ventures.emerging growth companies, and renewable energy.
27
GAAP Net Income and Non-GAAP Net Income, Excluding Adjustments
The Company prepares its financial statements and presents its financial results in accordance with U.S. GAAP. However, it also provides additional non-GAAP financial information related to specific items management believes to be important in the evaluation of its operating results and performance. A reconciliation of the Company's GAAP net income (loss) to net income (loss), excluding derivative market value and foreign currency transaction adjustments, and a discussion of why the Company believes providing this additional information is useful to investors, is provided below.
| Three months ended March 31, | |||||||||||||||||||||||
| 2021 | 2020 | ||||||||||||||||||||||
| GAAP net income (loss) attributable to Nelnet, Inc. | $ | 123,598 | (40,532) | ||||||||||||||||||||
| Realized and unrealized derivative market value adjustments | (38,809) | 20,602 | |||||||||||||||||||||
| Tax effect (a) | 9,314 | (4,944) | |||||||||||||||||||||
| Net income (loss) attributable to Nelnet, Inc., excluding derivative market value adjustments (b) | $ | 94,103 | (24,874) | ||||||||||||||||||||
| Earnings per share: | |||||||||||||||||||||||
| GAAP net income (loss) attributable to Nelnet, Inc. | $ | 3.20 | (1.01) | ||||||||||||||||||||
| Realized and unrealized derivative market value adjustments | (1.01) | 0.52 | |||||||||||||||||||||
| Tax effect (a) | 0.25 | (0.13) | |||||||||||||||||||||
| Net income (loss) attributable to Nelnet, Inc., excluding derivative market value adjustments (b) | $ | 2.44 | (0.62) | ||||||||||||||||||||
| Three months ended September 30, | Nine months ended September 30, | |||||||||||
| 2017 | 2016 | 2017 | 2016 | |||||||||
| GAAP net income attributable to Nelnet, Inc. | $ | 46,303 | 84,294 | 125,065 | 158,405 | |||||||
| Realized and unrealized derivative market value adjustments | (21,429 | ) | (47,093 | ) | (22,381 | ) | 1,556 | |||||
| Unrealized foreign currency transaction adjustments | 13,683 | 4,831 | 45,635 | 13,543 | ||||||||
| Net tax effect (a) | 2,943 | 16,060 | (8,837 | ) | (5,737 | ) | ||||||
| Net income, excluding derivative market value and foreign currency transaction adjustments (b) | $ | 41,500 | 58,092 | 139,482 | 167,767 | |||||||
| Earnings per share: | ||||||||||||
| GAAP net income attributable to Nelnet, Inc. | $ | 1.11 | 1.98 | 2.97 | 3.70 | |||||||
| Realized and unrealized derivative market value adjustments | (0.51 | ) | (1.10 | ) | (0.53 | ) | 0.03 | |||||
| Unrealized foreign currency transaction adjustments | 0.33 | 0.11 | 1.09 | 0.32 | ||||||||
| Net tax effect (a) | 0.07 | 0.37 | (0.21 | ) | (0.13 | ) | ||||||
| Net income, excluding derivative market value and foreign currency transaction adjustments (b) | $ | 1.00 | 1.36 | 3.32 | 3.92 | |||||||
The accounting for derivatives requires that changes in the fair value of derivative instruments be recognized currently in earnings, with no fair value adjustment of the hedged item, unless specific hedge accounting criteria is met. Management has structured all of the Company’s derivative transactions with the intent that each is economically effective; however, the Company’s derivative instruments do not qualify for hedge accounting. As a result, the change in fair value of derivative instruments is reported in current period earnings with no consideration for the corresponding change in fair value of the hedged item. Under GAAP, the cumulative net realized and unrealized gain or loss caused by changes in fair values of derivatives in which the Company plans to hold to maturity will equal zero over the life of the contract. However, the net realized and unrealized gain or loss during any given reporting period fluctuates significantly from period to period. In addition, the Company has incurred unrealized foreign currency transaction adjustments for periodic fluctuations in currency exchange rates between the U.S. dollar and Euro in connection with its student loan asset-backed Euro-denominated bonds with an interest rate based on a spread to the EURIBOR index.
The principal and accrued interest on these bonds were remeasured at each reporting period and recorded in the Company's consolidated balance sheet in U.S. dollars based on the foreign currency exchange rate on that date.
•The recognition of $97.1 million ($73.8 million after tax) of certain expenses during the first quarter of 2020 as a reductionresult of the COVID-19 pandemic, consisting of the recognition of an incremental provision for loan losses of $63.0 million ($47.9 million after tax), provision expense of $26.3 million ($20.0 million after tax) related to the Company's investment in certain consumer loan beneficial interest securitizations, and $7.8 million ($5.9 million after tax) impairment expense on certain venture capital investments.
•An increase of $45.5 million ($34.6 million after tax) in net gainsinterest income due to improved loan spread (including derivative settlements) on the Company's loan portfolio in the first quarter of 2021 as compared to 2020, including an increase in fixed rate floor income.
•A net gain of $38.8 million ($29.5 million after tax) related to changes in the fair values of derivative instruments that do not qualify for hedge accounting in the first quarter of 2021 as compared to a net loss of $20.6 million ($15.7 million after tax) in 2020.
28
•A decrease of $23.8 million ($18.1 million after tax) in interest expense during the first quarter of 2021 as a result of the Company reversing a historical accrued interest liability on certain bonds, which liability the Company determined is no longer probable of being required to be paid. The liability was initially recorded when certain asset-backed securitizations were acquired in 2011 and an2013.
•The recognition of $17.0 million ($13.0 million after tax) negative provision for loan losses on the Company's loan portfolio in the first quarter of 2021 as a result of management's estimate of certain continued improved economic conditions as of March 31, 2021 in comparison to management's estimate of certain economic conditions used to determine the allowance for loan losses as of December 31, 2020.
•The recognition of net investment gains during the first quarter of 2021 of $8.5 million ($6.5 million after tax), primarily from the sale of certain real estate investments.
•The recognition of a net loss by ALLO of $7.3 million ($5.5 million after tax) during the three months ended March 31, 2020. ALLO was deconsolidated in December 2020.
•An increase in losses related to foreign currency transaction adjustments caused by the re-measurement of the Company's Euro-denominated bonds to U.S. dollars.
These factors were partially offset by an increase inthe following items:
•The recognition of a net gainsloss of $19.9 million ($15.1 million after tax) during the first quarter of 2021 related to changesthe Company's investments in ALLO.
•The recognition of a $18.2 million ($13.8 million after tax) gain from the sale of consumer loans in the fair valuesfirst quarter of derivative instruments. 2020.
Operating Results
The Company earns net interest income on its FFELP student loan portfolio, consisting primarily of FFELP loans, in its Asset Generation and Management ("AGM") operating segment. This segment is expected to generate a stable net interest margin and significant amounts of cash as the FFELP portfolio amortizes. As of September 30, 2017, the CompanyMarch 31, 2021, AGM had a $22.5$19.0 billion student loan portfolio that management anticipates will amortize over the next approximately 2520 years and has a weighted average remaining life of 9.5 years. The Company actively works to maximize the amount and timing of cash flows generated by its FFELP portfolio and seeks to acquire additional FFELP loan portfoliosassets to leverage its servicing scale and expertise to generate incremental earnings and cash flow.
However, due to the continued amortization of the Company’s FFELP loan portfolio, over time, the Company's net income generated by the AGM segment will continue to decrease. The Company currently believes that in the short-term it will most likely not be able to invest the excess cash generated from the FFELP loan portfolio into assets that immediately generate the rates of return historically realized from that portfolio.
In addition, the Company earns fee-based revenue through the following reportable operating segments:
•Loan SystemsServicing and ServicingSystems ("LSS") - referred to as Nelnet Diversified SolutionsServices ("NDS")
On November 2, 2020, the Company obtained final approval for federal deposit insurance from the Federal Deposit Insurance Corporation ("Allo"FDIC")
and for a bank charter from the Utah Department of Financial Institutions ("UDFI") in connection with the establishment of Nelnet Bank, and Nelnet Bank launched operations. Nelnet Bank operates as an internet Utah-chartered industrial bank franchise focused on the private education loan marketplace, with a home office in Salt Lake City, Utah. Nelnet Bank’s operations are presented by the Company as a reportable operating segment.
Other business activities and operating segments that are not reportable are combined and included in Corporate and Other Activities ("Corporate"). Corporate and Other Activities also includes income earned on certain investments and interest expense incurred on unsecured and other corporate related debt transactions. In addition, the Corporate segment includes direct incremental costs associated with Nelnet Bank prior to the UDFI’s approval for its bank charter and certain shared service and
29
support costs incurred by the Company that will not be reflected in Nelnet Bank’s operating results through 2023 (the bank’s de novo period). Such Nelnet Bank-related costs included in the Corporate segment totaled $0.7 million (pre-tax) and $1.2 million (pre-tax) for the three months ended March 31, 2021 and 2020, respectively.
The information below provides the operating results for each reportable operating segment and Corporate and Other Activities for the three and nine months ended September 30, 2017March 31, 2021 and 20162020 (dollars in millions).
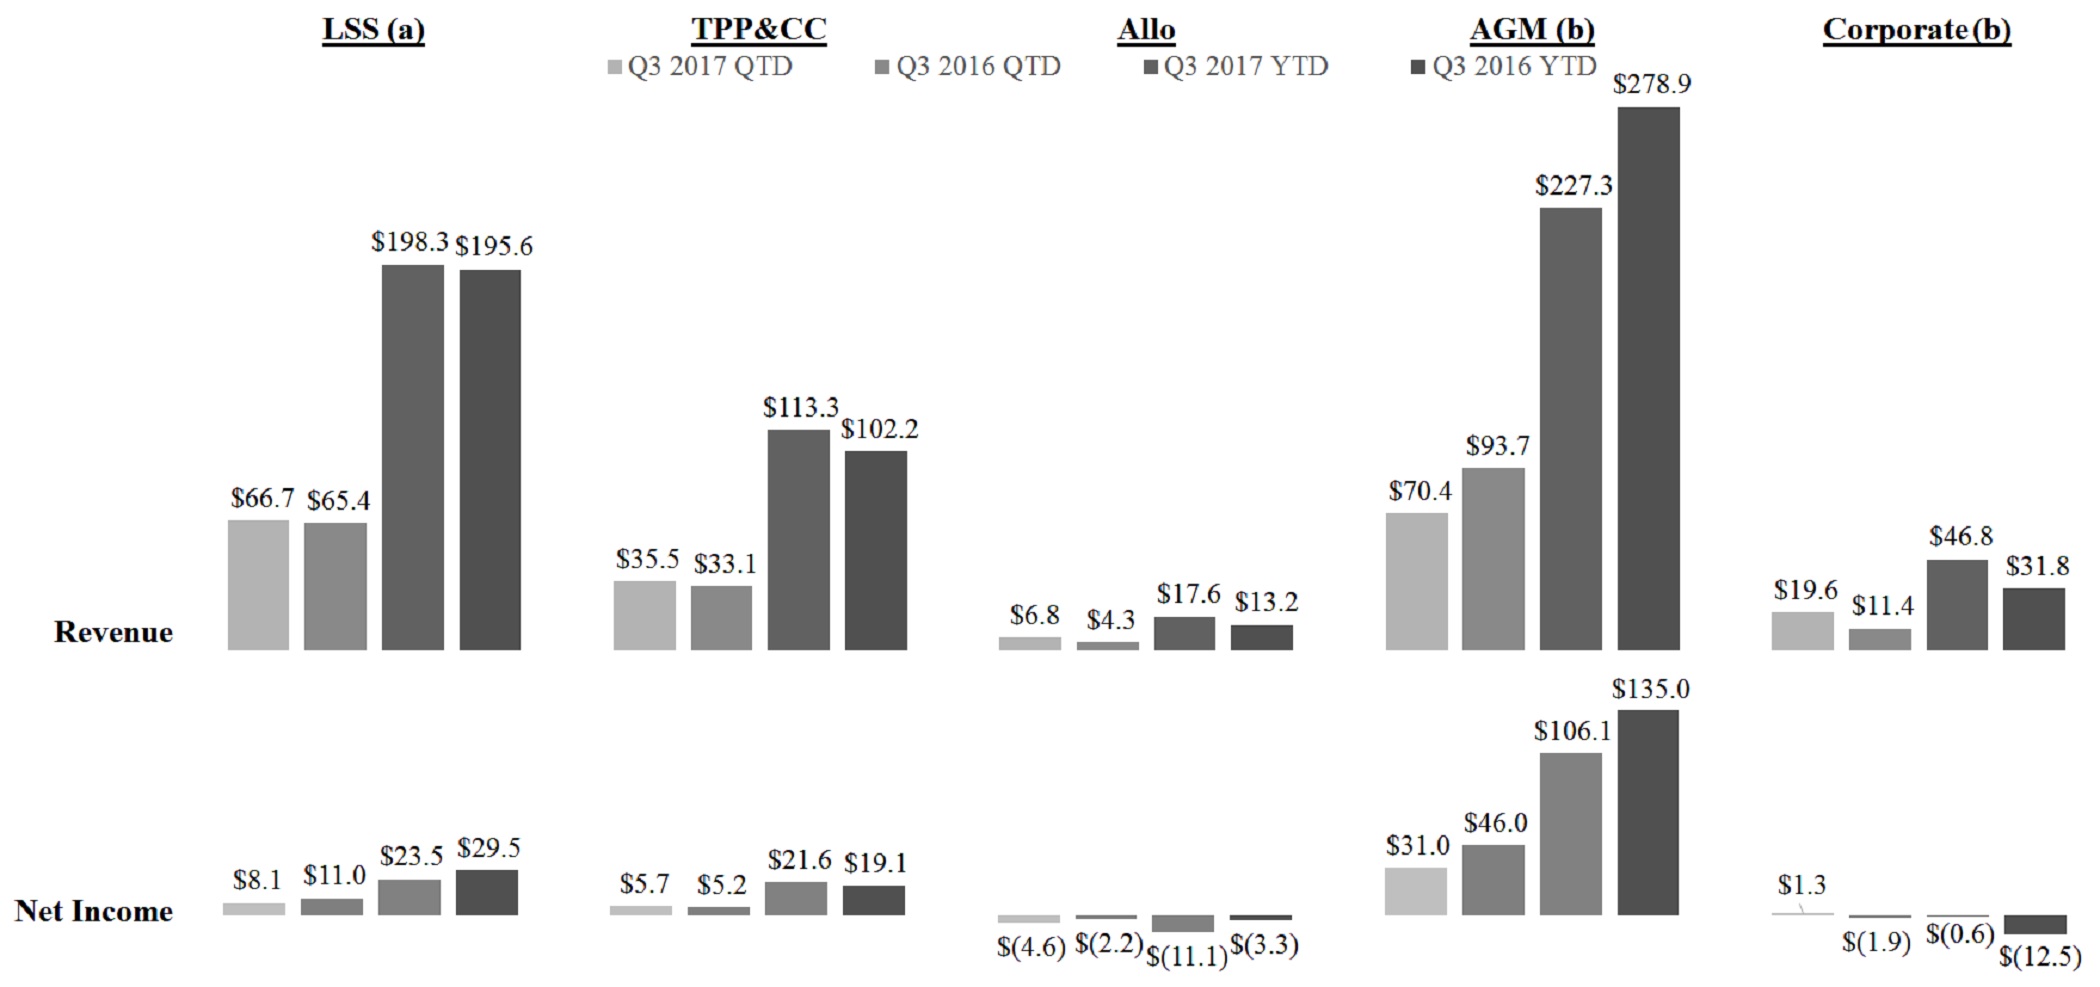
| LSS (a) | ETS&PP | ALLO (b) | AGM (c) | Bank (c) | |||||||||||||||||||||||||||||||
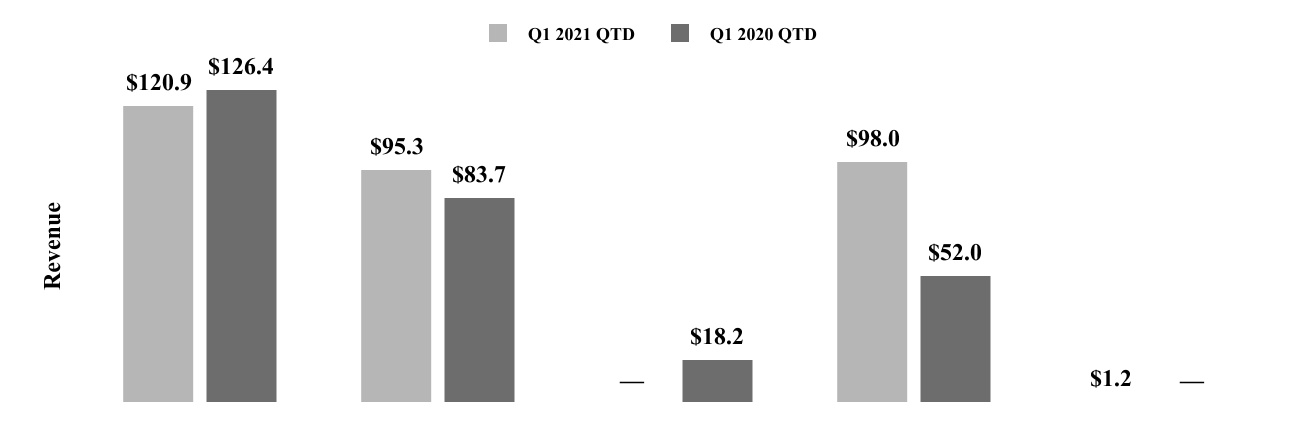
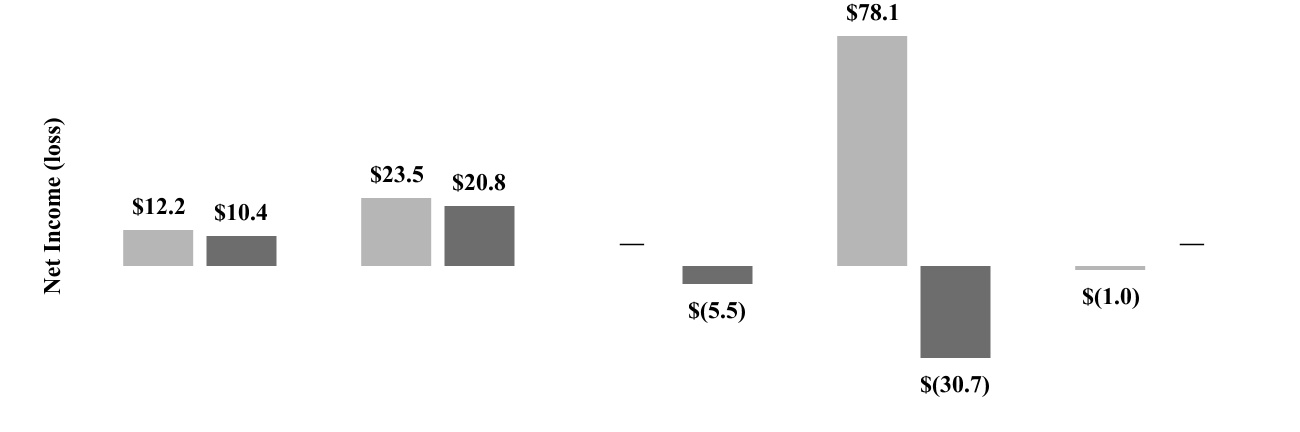
(b) On December 21, 2020, the Company was servicing $207.8 billion in FFELP, government owned, and private education and consumer loans, as compared with $193.2 billiondeconsolidated ALLO from the Company’s consolidated financial statements. See note 2 of loans as of September 30, 2016.
(c) Total revenue includes "net interest income" and "total other income/expense" from the Company's segment statements of operations, excluding the impact from changes in fair values of derivatives. Net income (loss) excludes changes in fair values of derivatives, net of tax. For information regarding the exclusion of the impact from changes in fair values of derivatives, see "GAAP Net Income and Non-GAAP Net Income, Excluding Adjustments" above.
COVID-19
Beginning in March 2020, the COVID-19 pandemic resulted in many businesses and schools closing or reducing hours throughout the U.S. to combat the spread of COVID-19, and states and local jurisdictions implementing various containment efforts, including lockdowns on non-essential business and other business restrictions, stay-at-home orders, and shelter-in-place orders. The COVID-19 pandemic caused significant disruption to the same periodsU.S. and world economies, including significantly higher unemployment and underemployment, significantly lower interest rates, and extreme volatility in 2016 due to growththe U.S. and world markets. While certain COVID-19 vaccines have been approved and have become widely available for use in private education and consumer loan servicing volume from existing and new clients. In addition, revenue increased for the nine months ended September 30, 2017 compared to the same period in 2016 due to an increase in revenue on the government servicing contract. The increase in revenue for the nine months ended September 30, 2017 compared to the same period in 2016 was partially offset by the loss of guaranty servicing and collection revenue on June 30, 2016.
COVID-19 Pandemic.”
30 2017, Allo's capital expenditures were $29.4 million and $78.4 million, respectively. The Company anticipates total network capital expenditures of approximately $30.0 million in the fourth quarter of 2017 and approximately $100.0 million in 2018; however, such amounts could change based on customer demand for Allo's services. The number of residential households passed, which represents the estimated number of single residence homes, apartments, and condominiums that Allo already serves and those in which Allo has the capacity to connect to its network distribution system without further material extensions to the transmission lines (but have not been connected) increased to 54,815 as of September 30, 2017 as compared to 30,962 as of December 31, 2016. The total households in current markets that Allo plans to expand its network to make services available is 137,500.
CONSOLIDATED RESULTS OF OPERATIONS
An analysis of the Company's operating results for the three and nine months ended September 30, 2017March 31, 2021 compared to the same periodsperiod in 20162020 is provided below.
The Company’s operating results are primarily driven by the performance of its existing loan portfolio and the revenues generated by its fee-based businesses and the costs to provide such services. The performance of the Company’s portfolio is driven by net interest income (which includes financing costs) and losses related to credit quality of the assets, along with the cost to administer and service the assets and related debt.
The Company operates as distinct reportable operating segments as described above. For a reconciliation of the reportable segment operating results to the consolidated results of operations, see note 10 of the notes to consolidated financial statements included under Part I, Item 1 of this report. Since the Company monitors and assesses its operations and results based on these segments, the discussion following the consolidated results of operations is presented on a reportable segment basis.basis (except for ALLO, which was deconsolidated from the Company's consolidated financial statements in December 2020).
| Three months ended | |||||||||||||||||||||||||||||
| March 31, | |||||||||||||||||||||||||||||
| 2021 | 2020 | Additional information | |||||||||||||||||||||||||||
| Loan interest | $ | 124,117 | 181,793 | Decrease was due primarily to decreases in the gross yield earned on loans and the average balance of loans, partially offset by an increase in gross fixed rate floor income due to lower interest rates in 2021 as compared to 2020. | |||||||||||||||||||||||||
| Investment interest | 4,986 | 7,398 | Includes income from unrestricted interest-earning deposits and investments and funds in asset-backed securitizations. Decrease was due to a decrease in interest rates. | ||||||||||||||||||||||||||
| Total interest income | 129,103 | 189,191 | |||||||||||||||||||||||||||
| Interest expense | 27,773 | 134,118 | Decrease was due primarily to a decrease in cost of funds and a decrease in the average balance of debt outstanding. In addition, during the first quarter of 2021, the Company reduced interest expense by $23.8 million as a result of reversing a historical accrued interest liability on certain bonds, which liability the Company determined is no longer probable of being required to be paid. The liability was initially recorded when certain asset-backed securitizations were acquired in 2011 and 2013. | ||||||||||||||||||||||||||
| Net interest income | 101,330 | 55,073 | See table below for additional analysis. | ||||||||||||||||||||||||||
| Less (negative provision) provision for loan losses | (17,048) | 76,299 | The Company recognized negative provision in the first quarter of 2021 due to management's estimate of improved economic conditions as of March 31, 2021 in comparison to management's estimate of economic conditions used to determine the allowance for loan losses as of December 31, 2020. During the first quarter of 2020, the Company recognized an incremental provision of $63.0 million as a result of an increase in expected defaults due to the COVID-19 pandemic. | ||||||||||||||||||||||||||
| Net interest income after provision for loan losses | 118,378 | (21,226) | |||||||||||||||||||||||||||
| Other income/expense: | |||||||||||||||||||||||||||||
| LSS revenue | 111,517 | 112,735 | See LSS operating segment - results of operations. | ||||||||||||||||||||||||||
| ETS&PP revenue | 95,258 | 83,675 | See ETS&PP operating segment - results of operations. | ||||||||||||||||||||||||||
| Communications revenue | — | 18,181 | As discussed above, on December 21, 2020, the Company deconsolidated ALLO from the Company’s consolidated financial statements. | ||||||||||||||||||||||||||
| Other | (4,604) | 8,281 | See table below for the components of "other." | ||||||||||||||||||||||||||
| Gain on sale of loans | — | 18,206 | The Company sold a portfolio of consumer loans in January 2020 and recognized a gain of $18.2 million. | ||||||||||||||||||||||||||
| Impairment expense and provision for beneficial interests, net | 2,436 | (34,087) | During the first quarter of 2020, the Company recognized impairments of $26.3 million and $7.8 million related to beneficial interest in consumer loan securitization investments and several venture capital investments, respectively. Such impairments were the result of impacts from the COVID-19 pandemic. During the first quarter of 2021, the Company reversed the remaining allowance of $2.4 million related to the beneficial interest in consumer loan securitizations due to continued improved economic conditions. | ||||||||||||||||||||||||||
| Derivative settlements, net | (4,304) | 4,237 | The Company maintains an overall risk management strategy that incorporates the use of derivative instruments to reduce the economic effect of interest rate volatility. Derivative settlements for each applicable period should be evaluated with the Company's net interest income. See table below for additional analysis. | ||||||||||||||||||||||||||
| Derivative market value adjustments, net | 38,809 | (20,602) | Includes the realized and unrealized gains and losses that are caused by changes in fair values of derivatives which do not qualify for "hedge treatment" under GAAP. The majority of the derivative market value adjustments related to the changes in fair value of the Company's floor income interest rate swaps. Such changes reflect that a decrease in the forward yield curve during a reporting period results in a decrease in the fair value of the Company's floor income interest rate swaps, and an increase in the forward yield curve during a reporting period results in an increase in the fair value of the Company's floor income interest rate swaps. | ||||||||||||||||||||||||||
| Total other income/expense | 239,112 | 190,626 | |||||||||||||||||||||||||||
| Cost of services: | |||||||||||||||||||||||||||||
| Cost to provide education technology, services, and payment processing services | 27,052 | 22,806 | Represents primarily direct costs to provide payment processing and instructional services in the ETS&PP operating segment. Increase in 2021 compared to 2020 was primarily due to additional instructional services costs. | ||||||||||||||||||||||||||
| Cost to provide communications services | — | 5,582 | As discussed above, on December 21, 2020, the Company deconsolidated ALLO from the Company’s consolidated financial statements. | ||||||||||||||||||||||||||
| Total cost of services | 27,052 | 28,388 | |||||||||||||||||||||||||||
31
| Three months | Nine months | |||||||||||||
| ended September 30, | ended September 30, | Additional information | ||||||||||||
| 2017 | 2016 | 2017 | 2016 | |||||||||||
| Loan interest | $ | 191,755 | 193,721 | 562,451 | 567,775 | Decrease due to a decrease in the average balance of student loans, a decrease in gross fixed rate floor income, and an adjustment recorded during the third quarter of 2016 to reflect the net impact on prior periods for a correction of an error regarding the Company's method of applying the interest method to amortize premiums and accrete discounts on its student loan portfolio, partially offset by an increase in the gross yield earned on the student loan portfolio. | ||||||||
| Investment interest | 5,129 | 2,460 | 11,335 | 6,674 | Includes income from unrestricted interest-earning deposits and investments and funds in asset-backed securitizations. The increase in 2017 compared to 2016 is due to an increase in interest-earning investments and an increase in interest rates. | |||||||||
| Total interest income | 196,884 | 196,181 | 573,786 | 574,449 | ||||||||||
| Interest expense | 121,650 | 96,386 | 341,787 | 280,847 | Increase due primarily to an increase in the Company's cost of funds, partially offset by a decrease in the average balance of debt outstanding. | |||||||||
| Net interest income | 75,234 | 99,795 | 231,999 | 293,602 | See table below for additional analysis. | |||||||||
| Less provision for loan losses | 6,000 | 6,000 | 9,000 | 10,500 | Represents the periodic expense of maintaining an allowance appropriate to absorb losses inherent in the portfolio of student loans. See AGM operating segment - results of operations. | |||||||||
| Net interest income after provision for loan losses | 69,234 | 93,795 | 222,999 | 283,102 | ||||||||||
| Other income: | ||||||||||||||
| LSS revenue | 55,950 | 54,350 | 167,079 | 161,082 | See LSS operating segment - results of operations. | |||||||||
| TPP&CC revenue | 35,450 | 33,071 | 113,293 | 102,211 | See TPP&CC operating segment - results of operations. | |||||||||
| Communications revenue | 6,751 | 4,343 | 17,577 | 13,167 | See Communications operating segment - results of operations. | |||||||||
| Enrollment services revenue | — | — | — | 4,326 | On February 1, 2016, the Company sold Sparkroom LLC. After this sale, the Company no longer earns enrollment services revenue. | |||||||||
| Other income | 19,756 | 15,150 | 44,874 | 38,711 | See table below for the components of "other income." | |||||||||
| Gain from debt repurchases | 116 | 2,160 | 5,537 | 2,260 | Gains are from the Company repurchasing its own debt. During the first quarter of 2017, the Company initiated a cash tender offer to purchase any and all of its outstanding Hybrid Securities. The Company paid $25.3 million to redeem $29.7 million of these notes and recognized a gain of $4.4 million. Other gains are from the repurchase of the Company's asset-backed debt securities. | |||||||||
| Derivative settlements, net | (573 | ) | (6,261 | ) | (2,314 | ) | (18,292 | ) | The Company maintains an overall risk management strategy that incorporates the use of derivative instruments to reduce the economic effect of interest rate volatility. Derivative settlements for each applicable period should be evaluated with the Company's net interest income. See table below for additional analysis. | |||||
| Derivative market value and foreign currency transaction adjustments, net | 7,746 | 42,262 | (23,254 | ) | (15,099 | ) | Includes (i) the realized and unrealized gains and losses that are caused by changes in fair values of derivatives which do not qualify for "hedge treatment" under GAAP; and (ii) the foreign currency transaction gains or losses caused by the re-measurement of the Company's Euro-denominated bonds to U.S. dollars. | |||||||
| Total other income | 125,196 | 145,075 | 322,792 | 288,366 | ||||||||||
| Operating expenses: | ||||||||||||||
| Salaries and benefits | 74,193 | 63,743 | 220,684 | 187,907 | Increase was due to an (i) increase in contract programming related to the GreatNet joint venture and an increase in personnel to support the increase in volume of loans serviced for the government entering repayment status and the increase in private education and consumer loan servicing volume in the LSS operating segment; (ii) increase in personnel to support the growth in revenue in the TPP&CC operating segment; and (iii) increase in personnel at Allo to support the Lincoln, Nebraska network expansion. See each individual operating segment results of operations discussion for additional information. | |||||||||
| Depreciation and amortization | 10,051 | 8,994 | 27,687 | 24,817 | Increase was due to additional depreciation expense at Allo. Since the acquisition of Allo on December 31, 2015, there has been a significant amount of property and equipment purchases to support the Lincoln, Nebraska network expansion. | |||||||||
| Loan servicing fees | 7,939 | 5,880 | 19,584 | 20,024 | Increase for the three months ended September 30, 2017 compared to the same period in 2016 due to a payment of $2.8 million in conversion fees related to a transfer of loans in August 2017 from a third-party servicer to the LSS operating segment's servicing platform. Excluding the $2.8 million conversion fee paid in the third quarter of 2017, loan servicing fees paid to third-parties decreased $0.7 million and $3.2 million for the three and nine months ended September 30, 2017 compared to the same periods in 2016 due to runoff of the Company's student loan portfolio and transfers of loans in August 2017 and June 2016 from third-party servicers to the LSS's servicing platform. | |||||||||
| Cost to provide communication services | 2,632 | 1,784 | 6,789 | 5,169 | Represents costs of services and products primarily associated with television programming costs in the Communications operating segment. | |||||||||
| Cost to provide enrollment services | — | — | — | 3,623 | On February 1, 2016, the Company sold Sparkroom LLC. After this sale, the Company no longer provides enrollment services. | |||||||||
| Other expenses | 30,518 | 26,391 | 84,593 | 84,174 | Increase was a result of an increase in operating expenses due to GreatNet, additional costs to support the increase in payment plans and campus commerce activity, and an increase in operating expenses at Allo to support the Lincoln, Nebraska network expansion, partially offset by the elimination of FFELP guaranty collection costs. The Company's remaining guaranty collection client exited the FFELP guaranty business at the end of their contract term on June 30, 2016, and after this date the Company has no remaining guaranty collection revenue. Accordingly, there were no collection costs for the three and nine months ended September 30, 2017, compared to no collection costs and $3.5 million for the three months and nine months ended September 30, 2016, respectively. | |||||||||
| Total operating expenses | 125,333 | 106,792 | 359,337 | 325,714 | ||||||||||
| Operating expenses: | |||||||||||||||||||||||||||||
| Salaries and benefits | 115,791 | 119,878 | Decrease was due to a decrease in contact center operations and support in the LSS operating segment as a result of federal student loan payments being suspended under the CARES Act and the deconsolidation of ALLO from the Company's consolidated financial statements. These decreases were partially offset by an increase in expenses in the ETS&PP operating segment due to an increase in headcount to support the growth of its customer base, the investment in the development of new technologies, and businesses it acquired in December 2020. | ||||||||||||||||||||||||||
| Depreciation and amortization | 20,184 | 27,648 | Decrease was primarily due to the deconsolidation of ALLO from the Company's consolidated financial statements on December 21, 2020, resulting in no depreciation expense being recorded in 2021 for ALLO. | ||||||||||||||||||||||||||
| Other expenses | 36,698 | 43,384 | Other expenses includes expenses necessary for operations, such as postage and distribution, consulting and professional fees, occupancy, communications, and certain information technology-related costs. Decrease was due to (i) cost savings in the LSS segment from an increase in the adoption of electronic borrower statements and correspondence and a decrease in printing and postage while loan payments are suspended as a result of COVID-19 borrower relief efforts; (ii) reduction of travel in the ETS&PP segment; and (iii) the deconsolidation of ALLO in December 2020. See the LSS and ETS&PP operating segment results of operations discussions for additional information. | ||||||||||||||||||||||||||
| Total operating expenses | 172,673 | 190,910 | |||||||||||||||||||||||||||
| Income (loss) before income taxes | 157,765 | (49,898) | |||||||||||||||||||||||||||
| Income tax (expense) benefit | (34,861) | 10,133 | The effective tax rate was 22.0% and 20.0% for the three months ended March 31, 2021 and 2020, respectively. The Company currently expects its effective tax rate for 2021 will range between 21 and 23 percent. | ||||||||||||||||||||||||||
| Net income (loss) | 122,904 | (39,765) | |||||||||||||||||||||||||||
| Net loss (income) attributable to noncontrolling interests | 694 | (767) | |||||||||||||||||||||||||||
| Net income (loss) attributable to Nelnet, Inc. | $ | 123,598 | (40,532) | ||||||||||||||||||||||||||
32
| Income before income taxes | 69,097 | 132,078 | 186,454 | 245,754 | ||||||||||
| Income tax expense | 25,562 | 47,715 | 70,349 | 87,184 | The effective tax rate was 35.60% and 36.15% for the three months ended September 30, 2017 and 2016, respectively, and 36.00% and 35.50% for the nine months ended September 30, 2017 and 2016, respectively. The lower effective tax rate for the nine months ended September 30, 2016 was due to the resolution of certain tax positions during the first quarter of 2016. | |||||||||
| Net income | 43,535 | 84,363 | 116,105 | 158,570 | ||||||||||
| Net loss (income) attributable to noncontrolling interest | 2,768 | (69 | ) | 8,960 | (165 | ) | In 2017, represents primarily the net loss of GreatNet attributable to Great Lakes. See "Noncontrolling Interest" in note 1 of the notes to consolidated financial statements included under Part I, Item 1 of this report. | |||||||
| Net income attributable to Nelnet, Inc. | $ | 46,303 | 84,294 | 125,065 | 158,405 | |||||||||
| Additional information: | ||||||||||||||
| Net income attributable to Nelnet, Inc. | $ | 46,303 | 84,294 | 125,065 | 158,405 | See "Overview - GAAP Net Income and Non-GAAP Net Income, Excluding Adjustments" above for additional information about non-GAAP net income, excluding derivative market value and foreign currency transaction adjustments. | ||||||||
| Derivative market value and foreign currency transaction adjustments, net | (7,746 | ) | (42,262 | ) | 23,254 | 15,099 | ||||||||
| Net tax effect | 2,943 | 16,060 | (8,837 | ) | (5,737 | ) | ||||||||
| Net income attributable to Nelnet, Inc., excluding derivative market value and foreign currency transaction adjustments | $ | 41,500 | 58,092 | 139,482 | 167,767 | |||||||||
The following table summarizes the components of “net interest income” and “derivative settlements, net.”
Derivative settlements represent the cash paid or received during the current period to settle with derivative instrument counterparties the economic effect of the Company's derivative instruments based on their contractual terms. Derivative accounting requires that net settlements with respect to derivatives that do not qualify for "hedge treatment" under GAAP be recorded in a separate income statement line item below net interest income. The Company maintains an overall risk management strategy that incorporates the use of derivative instruments to reduce the economic effect of interest rate volatility. As such, management believes derivative settlements for each applicable period should be evaluated with the Company’s net interest income as presented in the table below. Net interest income (net of settlements on derivatives) is a non-GAAP financial measure, and the Company reports this non-GAAP information because the Company believes that it provides additional information regarding operational and performance indicators that are closely assessed by management. There is no comprehensive, authoritative guidance for the presentation of such non-GAAP information, which is only meant to supplement GAAP results by providing additional information that management utilizes to assess performance. See note 4 of the notes to consolidated financial statements included under Part I, Item 1 of this report for additional information on the Company's derivative instruments, including the net settlement activity recognized by the Company for each type of derivative for the 2021 and 2020 periods presented in the table under the caption "Income"Consolidated Financial Statement Impact"Impact Related to Derivatives - Statements of Operations" in note 4 and in the table below.
| Three months ended March 31, | |||||||||||||||||||||||||||||
| 2021 | 2020 | Additional information | |||||||||||||||||||||||||||
| Variable loan interest margin | $ | 61,444 | 30,367 | Represents the yield the Company receives on its loan portfolio less the cost of funding these loans. Variable loan spread is also impacted by the amortization/accretion of loan premiums and discounts and the 1.05% per year consolidation loan rebate fee paid to the Department. See AGM operating segment - results of operations. For the three months ended March 31, 2021, variable loan interest margin also includes a reduction of interest expense of $23.8 million as a result of reversing a historical accrued interest liability on certain bonds, which liability the Company determined is no longer probable of being required to be paid. The liability was initially recorded when certain asset-backed securitizations were acquired in 2011 and 2013. | |||||||||||||||||||||||||
| Settlements on associated derivatives | (19) | 2,112 | Represents the net settlements (paid) received related to the Company’s 1:3 basis swaps. | ||||||||||||||||||||||||||
| Variable loan interest margin, net of settlements on derivatives | 61,425 | 32,479 | |||||||||||||||||||||||||||
| Fixed rate floor income | 35,539 | 18,758 | The Company has a portfolio of student loans that are earning interest at a fixed borrower rate which exceeds the statutorily defined variable lender rates, generating fixed rate floor income. See Item 3, "Quantitative and Qualitative Disclosures About Market Risk - Interest Rate Risk" for additional information. | ||||||||||||||||||||||||||
| Settlements on associated derivatives | (4,285) | 2,125 | Represents the net settlements (paid) received related to the Company’s floor income interest rate swaps. | ||||||||||||||||||||||||||
| Fixed rate floor income, net of settlements on derivatives | 31,254 | 20,883 | |||||||||||||||||||||||||||
| Investment interest | 4,986 | 7,398 | |||||||||||||||||||||||||||
| Corporate debt interest expense | (639) | (1,450) | Includes interest expense on the Company's unsecured line of credit, asset-backed securities participation agreement, and Junior Subordinated Hybrid Securities. Decrease was due to a decrease in interest rates and in the average balance outstanding on the Company's unsecured line of credit. In addition, in October 2020, the Company redeemed all the outstanding $20.4 million of Hybrid Securities. These items were partially offset by interest expense incurred on the asset-backed securities participation agreement that was executed in May of 2020. | ||||||||||||||||||||||||||
| Net interest income (net of settlements on derivatives) | $ | 97,026 | 59,310 | ||||||||||||||||||||||||||
33
| Three months ended September 30, | Nine months ended September 30, | Additional information | ||||||||||||
| 2017 | 2016 | 2017 | 2016 | |||||||||||
| Variable student loan interest margin | $ | 46,683 | 57,442 | 139,082 | 159,932 | Represents the yield the Company receives on its student loan portfolio less the cost of funding these loans. Variable student loan spread is also impacted by the amortization/accretion of loan premiums and discounts and the 1.05% per year consolidation loan rebate fee paid to the Department. In the third quarter of 2016, the Company revised its policy to correct for an error in its method of applying the interest method used to amortize premiums and accrete discounts on its student loan portfolio. During the third quarter of 2016, the Company recorded an adjustment to reflect the net impact on prior periods for the correction of this error that resulted in an $8.2 million reduction to the Company's net loan discount balance and a corresponding increase in interest income. See AGM operating segment - results of operations. | ||||||||
| Settlements on associated derivatives | (4,265 | ) | (871 | ) | (7,598 | ) | (2,355 | ) | Includes the net settlements paid/received related to the Company’s 1:3 basis swaps and cross-currency interest rate swap. | |||||
| Variable student loan interest margin, net of settlements on derivatives | 42,418 | 56,571 | 131,484 | 157,577 | ||||||||||
| Fixed rate floor income | 24,586 | 41,509 | 84,382 | 131,720 | The Company has a portfolio of student loans that are earning interest at a fixed borrower rate which exceeds the statutorily defined variable lender rates, generating fixed rate floor income. See Item 3, "Quantitative and Qualitative Disclosures About Market Risk - Interest Rate Risk" for additional information. | |||||||||
| Settlements on associated derivatives | 3,883 | (5,157 | ) | 5,877 | (15,241 | ) | Includes the net settlements paid/received related to the Company’s floor income interest rate swaps. | |||||||
| Fixed rate floor income, net of settlements on derivatives | 28,469 | 36,352 | 90,259 | 116,479 | ||||||||||
| Investment interest | 5,129 | 2,460 | 11,335 | 6,674 | ||||||||||
| Corporate debt interest expense | (1,164 | ) | (1,616 | ) | (2,800 | ) | (4,724 | ) | Includes interest expense on the Junior Subordinated Hybrid Securities and unsecured line of credit. During the first quarter of 2017, the Company repurchased $29.7 million of its Hybrid Securities. In addition, the weighted average balance outstanding under the Company's unsecured line of credit was lower during 2017 as compared to 2016. These factors resulted in less corporate debt interest expense in 2017 as compared to 2016. | |||||
| Non-portfolio related derivative settlements | (191 | ) | (233 | ) | (593 | ) | (696 | ) | Includes the net settlements paid/received related to the Company’s hybrid debt hedges. | |||||
| Net interest income (net of settlements on derivatives) | $ | 74,661 | 93,534 | 229,685 | 275,310 | |||||||||
The following table summarizes the components of "other" in "other income."income/expense" on the consolidated statements of operations.
| Three months ended March 31, | |||||||||||||||||||||||
| 2021 | 2020 | ||||||||||||||||||||||
| Income/gains from investments, net | $ | 8,498 | (1,025) | ||||||||||||||||||||
| Investment advisory services (a) | 2,697 | 2,802 | |||||||||||||||||||||
| ALLO preferred return (b) | 2,321 | — | |||||||||||||||||||||
| Management fee revenue (c) | 1,113 | 2,630 | |||||||||||||||||||||
| Borrower late fee income (d) | 442 | 3,188 | |||||||||||||||||||||
| Loss from ALLO voting membership interests investment (e) | (22,219) | — | |||||||||||||||||||||
| Loss from solar investments (f) | (1,679) | (2,839) | |||||||||||||||||||||
| Other | 4,223 | 3,525 | |||||||||||||||||||||
| $ | (4,604) | 8,281 | |||||||||||||||||||||
(a) The Company provides investment advisory services through Whitetail Rock Capital Management, LLC ("WRCM"), the Company's SEC-registered investment advisor subsidiary, under various arrangements. WRCM earns annual fees of 25 basis points on the majority of the outstanding balance of asset-backed securities under management and up to 50 percent of the gains from the sale of asset-backed securities or asset-backed securities being called prior to the full contractual maturity for which it provides advisory services. As of March 31, 2021, the outstanding balance of asset-backed securities under management subject to these arrangements was $1.4 billion. In addition, WRCM earns annual management fees of five basis points for certain other investments under management. The Company currently anticipates that assets under management will decrease from current levels and that opportunities to earn meaningful performance fees in future periods will be more limited.
(b) Represents the Company's income on its preferred membership interests in ALLO, which was deconsolidated from the Company's financial statements in December 2020. As of March 31, 2021, the amount of preferred membership interests held by the Company was $129.7 million and earns a preferred annual return of 6.25 percent.
(c) Represents revenue earned from providing administrative support and marketing services primarily to Great Lakes’ former parent company under a contract that expired in January 2021.
(d) Represents borrower late fees earned by the AGM operating segment. The decrease in borrower late fees for the three months ended March 31, 2021 as compared to the same period in 2020 was due to the Company suspending borrower late fees effective March 13, 2020 to provide borrowers relief as a result of the COVID-19 pandemic.
(e) Represents the Company's loss on its voting membership interests in ALLO. The Company accounts for its voting membership interests investment in ALLO under the Hypothetical Liquidation at Book Value ("HLBV") method of accounting. Applying the HLBV method of accounting, the Company will continue to recognize a significant portion of ALLO’s anticipated losses over the next several years due to expected investments by ALLO of substantial amounts in property and equipment to build its communications network and connect customers.
(f) Represents the Company's share of income or loss from solar investments accounted for using the HLBV method of accounting. For the majority of the Company's solar investments, the HLBV method of accounting results in accelerated losses in the initial years of investment.
34
| Three months ended September 30, | Nine months ended September 30, | |||||||||||
| 2017 | 2016 | 2017 | 2016 | |||||||||
| Investment advisory fees | $ | 5,852 | 1,535 | 11,661 | 3,367 | |||||||
| Peterson's revenue | 3,402 | 4,128 | 9,282 | 10,655 | ||||||||
| Borrower late fee income | 2,731 | 3,158 | 9,098 | 9,910 | ||||||||
| Realized and unrealized gains on investments classified as available-for-sale and trading, net | 2,468 | 506 | 3,185 | 1,444 | ||||||||
| Other | 5,303 | 5,823 | 11,648 | 13,335 | ||||||||
| Other income | $ | 19,756 | 15,150 | 44,874 | 38,711 | |||||||
LOAN SYSTEMSSERVICING AND SERVICINGSYSTEMS OPERATING SEGMENT – RESULTS OF OPERATIONS
Loan Servicing Volumes (dollars
| As of | |||||||||||||||||||||||||||||||||||||||||||||||
| December 31, 2019 | March 31, 2020 | June 30, 2020 | September 30, 2020 | December 31, 2020 | March 31, 2021 | ||||||||||||||||||||||||||||||||||||||||||
| Servicing volume (dollars in millions): | |||||||||||||||||||||||||||||||||||||||||||||||
| Nelnet: | |||||||||||||||||||||||||||||||||||||||||||||||
| Government | $ | 183,790 | 185,477 | 185,315 | 189,932 | 191,678 | 195,875 | ||||||||||||||||||||||||||||||||||||||||
| FFELP | 33,185 | 32,326 | 31,392 | 31,122 | 30,763 | 30,084 | |||||||||||||||||||||||||||||||||||||||||
| Private and consumer | 16,033 | 16,364 | 16,223 | 16,267 | 16,226 | 21,397 | |||||||||||||||||||||||||||||||||||||||||
| Great Lakes: | |||||||||||||||||||||||||||||||||||||||||||||||
| Government | 239,980 | 243,205 | 243,609 | 249,723 | 251,570 | 257,806 | |||||||||||||||||||||||||||||||||||||||||
| Total | $ | 472,988 | 477,372 | 476,539 | 487,044 | 490,237 | 505,162 | ||||||||||||||||||||||||||||||||||||||||
| Number of servicing borrowers: | |||||||||||||||||||||||||||||||||||||||||||||||
| Nelnet: | |||||||||||||||||||||||||||||||||||||||||||||||
| Government | 5,574,001 | 5,498,872 | 5,496,662 | 5,604,685 | 5,645,946 | 5,664,094 | |||||||||||||||||||||||||||||||||||||||||
| FFELP | 1,478,703 | 1,423,286 | 1,370,007 | 1,332,908 | 1,300,677 | 1,233,461 | |||||||||||||||||||||||||||||||||||||||||
| Private and consumer | 682,836 | 670,702 | 653,281 | 649,258 | 636,136 | 882,477 | |||||||||||||||||||||||||||||||||||||||||
| Great Lakes: | |||||||||||||||||||||||||||||||||||||||||||||||
| Government | 7,396,657 | 7,344,509 | 7,346,691 | 7,542,679 | 7,605,984 | 7,637,270 | |||||||||||||||||||||||||||||||||||||||||
| Total | 15,132,197 | 14,937,369 | 14,866,641 | 15,129,530 | 15,188,743 | 15,417,302 | |||||||||||||||||||||||||||||||||||||||||
| Number of remote hosted borrowers: | 6,433,324 | 6,354,158 | 6,264,559 | 6,251,598 | 6,555,841 | 4,307,342 | |||||||||||||||||||||||||||||||||||||||||
Government Loan Servicing
Nelnet Servicing and Great Lakes' servicing contracts with the Department are currently scheduled to expire on June 14, 2021, but provide the potential for an additional six-month extension at the Department's discretion through December 14, 2021. The Consolidated Appropriations Act, 2021, signed into law on December 27, 2020, provides that the Department may extend the period of performance for the servicing contracts scheduled to expire on December 14, 2021 for up to two additional years to December 14, 2023. The Department is conducting a contract procurement process for a new framework for the servicing of all student loans owned by the Department. See note 12 of the notes to consolidated financial statements included under Part I, Item 1 of this report for additional information.
Private Education Loan Servicing
In December of 2020, Wells Fargo announced the sale of its approximately $10.0 billion portfolio of private education student loans representing approximately 445,000 borrowers. In conjunction with the sale, the Company was selected as servicer of the portfolio. During March 2021, approximately 261,000 borrowers were converted to the Company's servicing platform, with the remaining borrowers converted in millions)
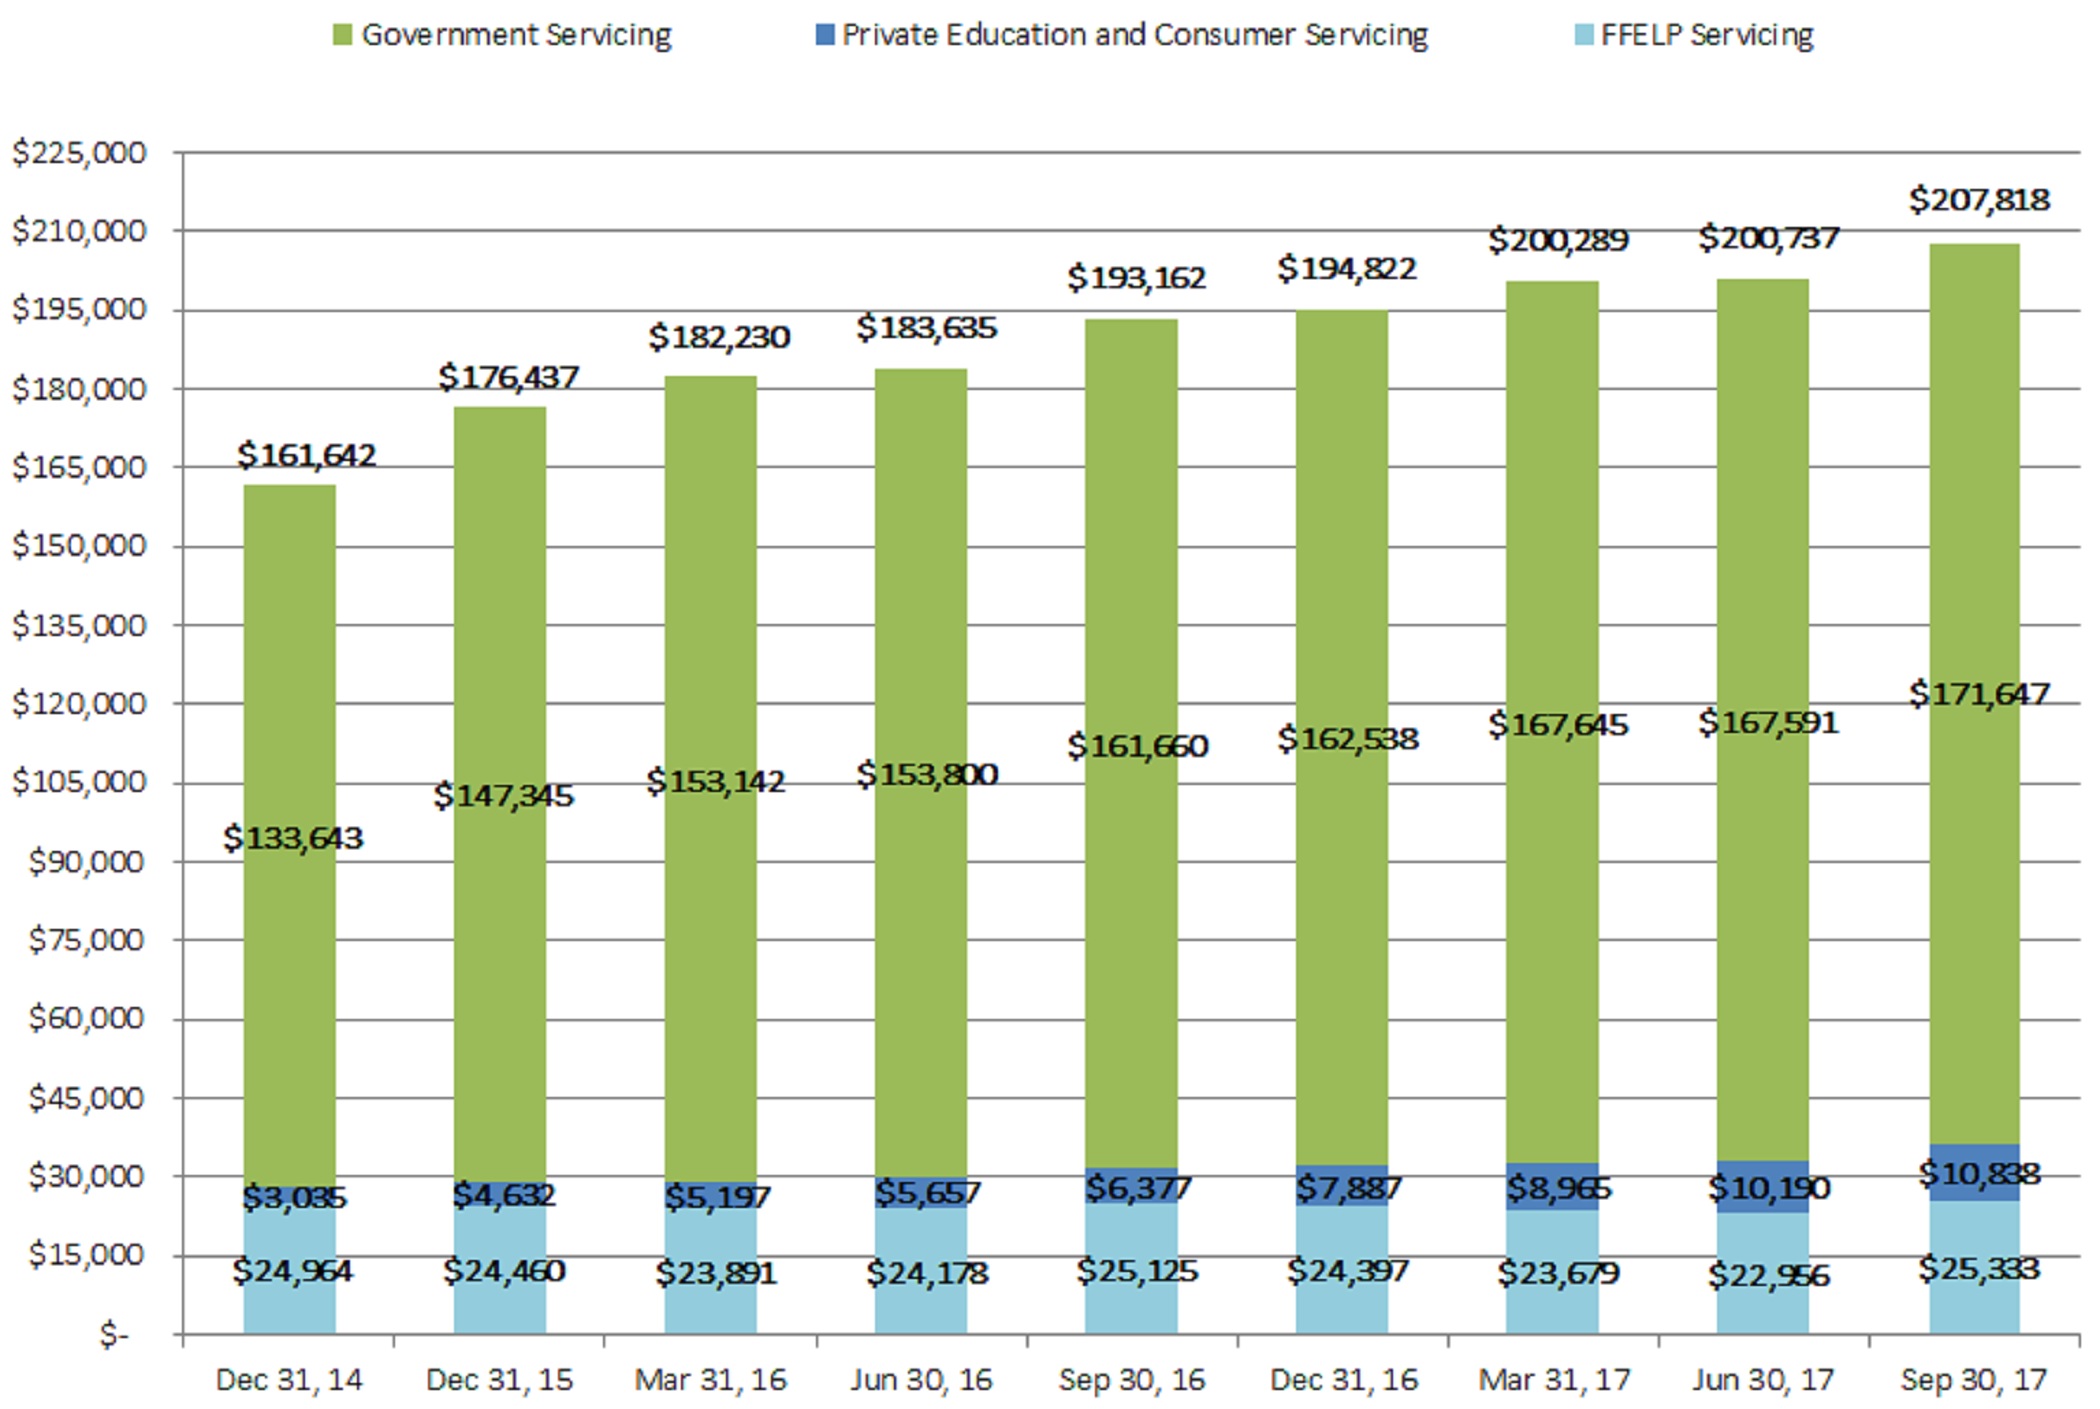
35
| Company owned | $19,742 | $18,886 | $18,433 | $18,079 | $17,429 | $16,962 | $16,352 | $15,789 | $18,403 | ||||||||||||||||||
| % of total | 12.2% | 10.7% | 10.1% | 9.8% | 9.0% | 8.7% | 8.2% | 7.9% | 8.9% | ||||||||||||||||||
| Number of servicing borrowers: | |||||||||||||||||||||||||||
| Government servicing: | 5,915,449 | 5,842,163 | 5,786,545 | 5,726,828 | 6,009,433 | 5,972,619 | 5,924,099 | 5,849,283 | 5,906,404 | ||||||||||||||||||
| FFELP servicing: | 1,397,295 | 1,335,538 | 1,298,407 | 1,296,198 | 1,357,412 | 1,312,192 | 1,263,785 | 1,218,706 | 1,317,552 | ||||||||||||||||||
| Private education and consumer loan servicing: | 202,529 | 245,737 | 250,666 | 267,073 | 292,989 | 355,096 | 389,010 | 454,182 | 478,150 | ||||||||||||||||||
| Total: | 7,515,273 | 7,423,438 | 7,335,618 | 7,290,099 | 7,659,834 | 7,639,907 | 7,576,894 | 7,522,171 | 7,702,106 | ||||||||||||||||||
| Number of remote hosted borrowers: | 1,611,654 | 1,755,341 | 1,796,783 | 1,842,961 | 2,103,989 | 2,230,019 | 2,305,991 | 2,317,151 | 2,714,588 | ||||||||||||||||||
Summary and Comparison of Operating Results
| Three months ended March 31, | |||||||||||||||||||||||||||||
| 2021 | 2020 | Additional information | |||||||||||||||||||||||||||
| Net interest income | $ | 11 | 273 | Decrease was due to lower interest rates in 2021 as compared to 2020. | |||||||||||||||||||||||||
| Loan servicing and systems revenue | 111,517 | 112,735 | See table below for additional information. | ||||||||||||||||||||||||||
| Intersegment servicing revenue | 8,268 | 11,054 | Represents revenue earned by the LSS operating segment as a result of servicing loans for the AGM and Nelnet Bank operating segments. Decrease in 2021 compared to 2020 was due to the impact of borrower relief policies implemented by AGM in response to the COVID-19 pandemic and the expected amortization of AGM's FFELP portfolio. FFELP intersegment servicing revenue will continue to decrease as AGM's FFELP portfolio pays off. | ||||||||||||||||||||||||||
| Other income | 1,113 | 2,630 | Represents revenue earned from providing administrative support and marketing services primarily to Great Lakes’ former parent company under a contract that expired in January 2021. | ||||||||||||||||||||||||||
| Total other income | 120,898 | 126,419 | |||||||||||||||||||||||||||
| Salaries and benefits | 66,458 | 70,493 | Decrease in 2021 compared to 2020 was due to a decrease in contact center operations and support as a result of federal student loan payments being suspended (through September 30, 2021) under the CARES Act. The Company currently expects salaries and benefits will increase as it prepares for the provisions of the CARES Act to expire. | ||||||||||||||||||||||||||
| Depreciation and amortization | 8,192 | 8,848 | Decrease in 2021 compared to 2020 was due to certain purchases to integrate Great Lakes and expand servicing capacity becoming fully depreciated. | ||||||||||||||||||||||||||
| Other expenses | 13,285 | 17,489 | Decrease in 2021 compared to 2020 was due to cost savings as a result of the impact of the COVID-19 pandemic and the resulting CARES Act, primarily associated with the fact that while student loan payments are suspended there is a significant reduction of borrower statement printing and postage costs. The Company currently expects these costs will increase when the provisions of the CARES Act expire, currently scheduled for September 30, 2021. Decrease was also due to cost savings from an increase in the adoption of electronic borrower statements and correspondence. | ||||||||||||||||||||||||||
| Intersegment expenses | 16,890 | 16,239 | Intersegment expenses represent costs for certain corporate activities and services that are allocated to each operating segment based on estimated use of such activities and services. | ||||||||||||||||||||||||||
| Total operating expenses | 104,825 | 113,069 | |||||||||||||||||||||||||||
| Income before income taxes | 16,084 | 13,623 | |||||||||||||||||||||||||||
| Income tax expense | (3,860) | (3,269) | Represents income tax expense at an effective tax rate of 24%. | ||||||||||||||||||||||||||
| Net income | $ | 12,224 | 10,354 | ||||||||||||||||||||||||||
| Before tax operating margin | 13.3 | % | 10.8 | % | Before tax operating margin is a measure of before tax operating profitability as a percentage of revenue, and for the LSS segment is calculated as income before income taxes divided by the total of loan servicing and systems revenue, intersegment servicing revenue, and other income revenue. The Company uses this metric to monitor and assess the segment’s performance, manage operating costs, identify and evaluate business trends affecting the segment, and make strategic decisions, and believes that it facilitates an understanding of the operating performance of the segment and provides a meaningful comparison of the results of operations between periods. Before tax operating margin increased in 2021 as compared to 2020 primarily due to operating expenses decreasing as a result of federal student loan payments being suspended under the CARES Act as discussed above. The Company currently expects these costs will increase as it prepares for the provisions of the CARES Act to expire. | ||||||||||||||||||||||||
36
| Three months ended September 30, | Nine months ended September 30, | Additional information | ||||||||||||
| 2017 | 2016 | 2017 | 2016 | |||||||||||
| Net interest income | $ | 147 | 37 | 361 | 80 | |||||||||
| Loan systems and servicing revenue | 55,950 | 54,350 | 167,079 | 161,082 | See table below for additional analysis. | |||||||||
| Intersegment servicing revenue | 10,563 | 11,021 | 30,839 | 34,436 | Represents revenue earned by the LSS operating segment as a result of servicing loans for the AGM operating segment. Decrease was due to a decrease in loans serviced for the AGM segment during the comparable periods due to portfolio run-off. In August 2017, the AGM operating segment converted $3.1 billion of loans from a third-party servicer to the LSS operating segment's servicing platform. | |||||||||
| Total other income | 66,513 | 65,371 | 197,918 | 195,518 | ||||||||||
| Salaries and benefits | 38,435 | 32,505 | 116,932 | 96,851 | Increase due to contract programming related to GreatNet and an increase in personnel to support the increase in volume of loans serviced for the government entering repayment status and the increase in private education and consumer loan servicing volume. | |||||||||
| Depreciation and amortization | 549 | 557 | 1,644 | 1,440 | ||||||||||
| Other expenses | 10,317 | 8,784 | 28,333 | 31,635 | Increase in the three months ended September 30, 2017 compared to the same period in 2016 due to increase in operating expenses related to GreatNet. Decrease in the nine months ended September 30, 2017 compared to the same period in 2016 due primarily to the elimination of FFELP guaranty collection costs directly related to the loss of FFELP guaranty collection revenue. There were no collection costs for the three and nine months ended September 30, 2017 and three months ended September 30, 2016, and $3.5 million for the nine months ended September 30, 2016. Excluding collection costs, other expenses were $28.1 million for the nine months ended September 30, 2016. See additional information below regarding the loss of FFELP guaranty collection revenue. | |||||||||
| Intersegment expenses, net | 7,774 | 5,825 | 23,496 | 18,168 | Intersegment expenses represent costs for certain corporate activities and services that are allocated to each operating segment based on estimated use of such activities and services. | |||||||||
| Total operating expenses | 57,075 | 47,671 | 170,405 | 148,094 | ||||||||||
| Income before income taxes | 9,585 | 17,737 | 27,874 | 47,504 | ||||||||||
| Income tax expense | (4,937 | ) | (6,740 | ) | (14,410 | ) | (18,052 | ) | Reflects income tax expense based on 38% of income before taxes and the net loss attributable to noncontrolling interest. | |||||
| Net income | 4,648 | 10,997 | 13,464 | 29,452 | ||||||||||
| Net loss attributable to noncontrolling interest | 3,408 | — | 10,050 | — | Represents the net loss of GreatNet attributable to Great Lakes. See "Noncontrolling Interest" in note 1 of the notes to consolidated financial statements included under Part I, Item 1 of this report. | |||||||||
Net income attributable to Nelnet, Inc. | $ | 8,056 | 10,997 | 23,514 | 29,452 | |||||||||
| Before tax operating margin | 14.4 | % | 27.1 | % | 14.1 | % | 24.3 | % | Decrease in margin due to increases in salaries and benefits and other operating expenses as described above (including costs incurred related to GreatNet) and the loss of the guaranty business which had higher margin than the remaining businesses. Before tax operating margin, excluding the net loss attributable to noncontrolling interest (Great Lakes) for the three and nine months ended September 30, 2017 was 18.5% and 18.2%, respectively. | |||||
Loan systemsservicing and servicingsystems revenue
| Three months ended March 31, | |||||||||||||||||||||||||||||
| 2021 | 2020 | Additional information | |||||||||||||||||||||||||||
| Government servicing - Nelnet | $ | 34,872 | 38,650 | Represents revenue from Nelnet Servicing's Department servicing contract. Decrease in 2021 compared to 2020 was due to a decrease in revenue from the administration of the Total and Permanent Disability (TPD) Discharge program, decrease in fees earned from the Department for originating consolidation loans, and decrease in revenue earned per borrower as a result of certain provisions included in the CARES Act. | |||||||||||||||||||||||||
| Government servicing - Great Lakes | 43,302 | 46,446 | Represents revenue from Great Lakes' Department servicing contract. Decrease in 2021 compared to 2020 was due to a decrease in fees earned from the Department for originating consolidation loans and decrease in revenue earned per borrower as a result of certain provisions included in the CARES Act. | ||||||||||||||||||||||||||
| Private education and consumer loan servicing | 8,548 | 8,609 | Decrease in 2021 compared to 2020 was due to a decrease in the number of legacy borrowers serviced, a decrease in origination fees, and the impact of borrower relief policies implemented by private lenders in response to the COVID-19 pandemic. The decrease was partially offset by an increase in borrowers as a result of the Wells Fargo private education loan conversion activity in March 2021. The private education loans converted in 2021 reflect revenue from the conversation date, and thus does not reflect a full quarter of revenue. See "Private Education Loan Servicing" included above under "Loan Servicing and Systems Operating Segment - Results of Operations." | ||||||||||||||||||||||||||
| FFELP servicing | 4,670 | 5,614 | Decrease in 2021 compared to 2020 was due to a decrease in the number of borrowers serviced and the impact of borrower relief policies implemented by lenders in response to the COVID-19 pandemic. Over time, FFELP servicing revenue will continue to decrease as third-party customers' FFELP portfolios pay off. | ||||||||||||||||||||||||||
| Software services | 8,454 | 11,318 | The decrease in revenue in 2021 as compared to 2020 was due to many of the services provided under the Company's remote hosted servicing and system support contract with Great Lakes' former parent, representing 2.3 million borrowers, decreasing and/or expiring in January 2021. This decrease in revenue was partially offset by an increase in the number of remote hosted servicing borrowers in 2021 as compared to 2020. | ||||||||||||||||||||||||||
| Outsourced services | 11,671 | 2,098 | The majority of this revenue relates to providing contact center and back office operational outsourcing activities. Increase in 2021 compared to 2020 was due to shorter-term contracts with state agencies to process unemployment claims and conduct certain health tracing support activities (including vaccination registration support). Revenue from providing these services to state agencies was $9.7 million during the three months ended March 31, 2021. | ||||||||||||||||||||||||||
| Loan servicing and systems revenue | $ | 111,517 | 112,735 | ||||||||||||||||||||||||||
37
| Three months ended September 30, | Nine months ended September 30, | Additional information | ||||||||||||
| 2017 | 2016 | 2017 | 2016 | |||||||||||
| Government servicing | $ | 38,594 | 40,159 | 117,409 | 112,453 | Increase for the nine months ended September 30, 2017 compared to the same period in 2016 due to an increase in application volume for the Company's administration of the Total and Permanent Disability Discharge (TPD) and Direct Loan Consolidation programs, the transfer of borrowers from a not-for-profit servicer who exited the loan servicing business in August 2016, and the shift in the portfolio of loans serviced to a greater portion of loans in higher paying repayment statuses. Decrease for the three months ended September 30, 2017 compared to the same period in 2016 due to lower TPD application volume. On August 15, 2017, the Department provided an update on its Direct Loan servicing contract with performance metrics results for the period January 1, 2017 through June 30, 2017 and new volume allocations for its student loan servicers based on these results. The new performance results had the Company ranked fourth among all TIVAS and NFP servicers, which resulted in the Company being allocated 11 percent of new student loan servicing volume for the period September 1, 2017 through February 28, 2018. The Company ranked second among the four large TIVAS, with Great Lakes ranking first. | ||||||||
| FFELP servicing | 3,979 | 4,541 | 11,693 | 11,864 | Decrease due to conversion revenue recognized during the third quarter of 2016. Over time, FFELP servicing revenue will decrease as third-party customers' FFELP portfolios run off. | |||||||||
| Private education and consumer loan servicing | 7,596 | 4,142 | 20,535 | 10,715 | Increase due to growth in loan servicing volume from existing and new clients. | |||||||||
| FFELP guaranty servicing | — | — | — | 2,349 | The Company’s remaining guaranty servicing client exited the FFELP guaranty business at the end of their contract term on June 30, 2016, and after this date the Company has no remaining guaranty servicing revenue. | |||||||||
| FFELP guaranty collection | — | — | — | 7,211 | The Company’s remaining guaranty collection client exited the FFELP guaranty business at the end of their contract term on June 30, 2016, and after this date the Company has no remaining guaranty collection revenue. The Company incurred collection costs that were directly related to guaranty collection revenue. | |||||||||
| Software services | 4,430 | 4,491 | 13,093 | 13,753 | The majority of software services revenue relates to providing hosted student loan servicing. The decrease in 2017 as compared to 2016 was due to (i) a not-for-profit servicer exiting the loan servicing business in August 2016, resulting in a transfer of its servicing volume to the Company that is included in the Company's government servicing volume; (ii) a shift in the composition of loans serviced by remote hosted customers from borrowers in higher paying repayment status to in-school status; and (iii) a decrease in revenue from other software service products. These decreases were partially offset by an increase in the number of remote hosted borrowers. | |||||||||
| Other | 1,351 | 1,017 | 4,349 | 2,737 | Increase due to growth in contact center outsourcing activities. | |||||||||
| Loan systems and servicing revenue | $ | 55,950 | 54,350 | 167,079 | 161,082 | |||||||||
On December 31, 2020, the Company acquired HigherSchool Instructional Services, a services company that provides supplemental instructional services and educational professional development for K-12 schools in New York City, and CD2 LLC, a platform technology solution that includes learning management, collaboration/workflow, gamification, customer management/document storage, and employee boarding. The results of HigherSchool Instructional Services and CD2 LLC are reported in the Company’s consolidated financial statements from the date of acquisition. Revenue recognized by these acquisitions during the three months ended March 31, 2021 was $8.0 million.
Summary and Comparison of Operating Results
| Three months ended March 31, | |||||||||||||||||||||||||||||
| 2021 | 2020 | Additional information | |||||||||||||||||||||||||||
| Net interest income | $ | 263 | 1,974 | Represents interest income on tuition funds held in custody for schools. Decrease was due to a decrease in interest rates in 2021 as compared with 2020. If interest rates remain at current levels, the Company anticipates this segment will earn minimal interest income in future periods. | |||||||||||||||||||||||||
| Education technology, services, and payment processing revenue | 95,258 | 83,675 | See table below for additional information. | ||||||||||||||||||||||||||
| Intersegment revenue | 3 | 11 | |||||||||||||||||||||||||||
| Total other income | 95,261 | 83,686 | |||||||||||||||||||||||||||
| Cost to provide education technology, services, and payment processing services | 27,052 | 22,806 | See table below for additional information. | ||||||||||||||||||||||||||
| Salaries and benefits | 25,941 | 23,696 | Increase in 2021 compared to 2020 was due to an increase in headcount to support the growth of the customer base, the investment in the development of new technologies, and the acquisitions of HigherSchool Instructional Services and CD2 LLC. | ||||||||||||||||||||||||||
| Depreciation and amortization | 3,071 | 2,387 | Represents primarily amortization of intangible assets from prior business acquisitions. Amortization of intangible assets related to business acquisitions was $2.9 million and $2.2 million for the three months ended March 31, 2021 and 2020, respectively. | ||||||||||||||||||||||||||
| Other expenses | 4,822 | 6,092 | Decrease in 2021 compared to 2020 was due to a reduction of travel expenses due to COVID-19. In addition, during the three months ended March 31, 2020, the Company recognized an additional expense to increase the allowance for doubtful accounts for the increased risk of uncollectible balances due to uncertain economic conditions resulting from the COVID-19 pandemic. | ||||||||||||||||||||||||||
| Intersegment expenses, net | 3,664 | 3,327 | Intersegment expenses represent costs for certain corporate activities and services that are allocated to each operating segment based on estimated use of such activities and services. | ||||||||||||||||||||||||||
| Total operating expenses | 37,498 | 35,502 | |||||||||||||||||||||||||||
| Income before income taxes | 30,974 | 27,352 | |||||||||||||||||||||||||||
| Income tax expense | (7,434) | (6,565) | Represents income tax expense at an effective tax rate of 24%. | ||||||||||||||||||||||||||
| Net income | $ | 23,540 | 20,787 | ||||||||||||||||||||||||||
38
| Three months ended September 30, | Nine months ended September 30, | Additional information | ||||||||||||
| 2017 | 2016 | 2017 | 2016 | |||||||||||
| Net interest income | $ | 5 | 2 | 10 | 7 | |||||||||
| Tuition payment processing, school information, and campus commerce revenue | 35,450 | 33,071 | 113,293 | 102,211 | Increase was due to an increase in the number of managed tuition payment plans, campus commerce customer transactions and payments volume, and new school customers. | |||||||||
| Salaries and benefits | 17,432 | 15,979 | 50,986 | 45,859 | Increase due to additional personnel to support the increase in payment plans and campus commerce activity and continued investments in and enhancements of payment plan and campus commerce systems and products. | |||||||||
| Depreciation and amortization | 2,316 | 2,929 | 7,053 | 7,711 | ||||||||||
| Other expenses | 4,224 | 4,149 | 14,072 | 13,122 | Increase due to additional costs to support the increase in payment plans and campus commerce activity and continued investments in and enhancements of payment plan and campus commerce systems and products. | |||||||||
| Intersegment expenses, net | 2,219 | 1,616 | 6,430 | 4,690 | Intersegment expenses represent costs for certain corporate activities and services that are allocated to each operating segment based on estimated use of such activities and services. | |||||||||
| Total operating expenses | 26,191 | 24,673 | 78,541 | 71,382 | ||||||||||
| Income before income taxes | 9,264 | 8,400 | 34,762 | 30,836 | ||||||||||
| Income tax expense | (3,520 | ) | (3,192 | ) | (13,210 | ) | (11,718 | ) | ||||||
| Net income | $ | 5,744 | 5,208 | 21,552 | 19,118 | |||||||||
| Before tax operating margin | 26.1 | % | 25.4 | % | 30.7 | % | 30.2 | % | ||||||
The following table provides disaggregated revenue by service offering and before tax operating margin for each reporting period.
| Three months ended March 31, | |||||||||||||||||||||||||||||
| 2021 | 2020 | Additional information | |||||||||||||||||||||||||||
| Tuition payment plan services | $ | 29,550 | 31,587 | Revenue recognized during the first three months of 2021 was primarily related to payment plans for the 2020-2021 academic year for K-12 schools and the spring 2021 semester for institutions of higher education. Revenues from tuition payment plans for these terms were impacted by COVID-19 resulting in lower volumes of plans compared to historical periods. | |||||||||||||||||||||||||
| Payment processing | 33,038 | 31,742 | Payment volumes in the first quarter of 2021 increased as compared to 2020 in both the K-12 and higher education markets. The increase in volumes in the higher education market was driven primarily by growth in volumes from existing customers. | ||||||||||||||||||||||||||
| Education technology and services | 32,322 | 20,054 | Increase in 2021 compared to 2020 was primarily the result of the 2020 acquisitions. Additionally, revenues from the Company’s application and enrollment products, grant and aid assessments, and FACTS Education instructional and professional development services increased compared to the prior year. | ||||||||||||||||||||||||||
| Other | 348 | 292 | |||||||||||||||||||||||||||
| Education technology, services, and payment processing revenue | 95,258 | 83,675 | |||||||||||||||||||||||||||
| Cost to provide education technology, services, and payment processing services | 27,052 | 22,806 | Costs primarily relate to payment processing revenue and such costs decrease/increase in relationship to payment revenue. Costs to provide instructional services are also included as a component of this expense and were the primary driver in the increase in 2021 compared to 2020 due to the acquisition of HigherSchool Instructional Services and growth in the FACTS Education Solutions division. | ||||||||||||||||||||||||||
| Net revenue | $ | 68,206 | 60,869 | ||||||||||||||||||||||||||
| Before tax operating margin | 45.4 | % | 44.9 | % | Before tax operating margin is a measure of before tax operating profitability as a percentage of revenue, and for the ETS&PP segment is calculated as income before income taxes divided by net revenue. The Company uses this metric to monitor and assess the segment’s performance, manage operating costs, identify and evaluate business trends affecting the segment, and make strategic decisions, and believes that it facilitates an understanding of the operating performance of the segment and provides a meaningful comparison of the results of operations between periods. | ||||||||||||||||||||||||
Proposed Community College Legislation
39
| Three months ended September 30, | Nine months ended September 30, | Additional information | ||||||||||||
| 2017 | 2016 | 2017 | 2016 | |||||||||||
| Net interest income (expense) | $ | (1,550 | ) | (318 | ) | (3,365 | ) | (670 | ) | Allo has a line of credit with Nelnet, Inc. (parent company). The interest expense incurred by Allo and related interest income earned by Nelnet, Inc. is eliminated for the Company's consolidated financial statements. The average outstanding balance on this line of credit for the three months ended September 30, 2017 and 2016 was $131.4 million and $35.7 million, respectively, and $98.3 million and $24.6 million for the nine months ended September 30, 2017 and 2016, respectively. The proceeds from debt were used by Allo for network capital expenditures and related expenses. | ||||
| Communications revenue | 6,751 | 4,343 | 17,577 | 13,167 | Communications revenue is derived primarily from the sale of pure fiber optic services to residential and business customers in Nebraska, including internet, television, and telephone services. Increase was primarily due to additional residential households served. See additional financial and operating data for Allo in the tables below. | |||||||||
| Salaries and benefits | 4,099 | 2,325 | 10,489 | 4,792 | Since the acquisition of Allo on December 31, 2015, there has been a significant increase in personnel to support the Lincoln, Nebraska network expansion. As of December 31, 2015, September 30, 2016, December 31, 2016, and September 30, 2017, Allo had 97, 279, 318, and 464 employees, respectively, including part-time employees. Allo also uses temporary employees in the normal course of business. Certain costs qualify for capitalization as Allo builds its network. | |||||||||
| Depreciation and amortization | 3,145 | 1,630 | 7,880 | 4,137 | Depreciation reflects the allocation of the costs of Allo's property and equipment over the period in which such assets are used. Since the acquisition of Allo on December 31, 2015, there has been a significant amount of property and equipment purchases to support the Lincoln, Nebraska network expansion. Amortization reflects the allocation of costs related to intangible assets recorded at fair value as of the date the Company acquired Allo over their estimated useful lives. | |||||||||
| Cost to provide communications services | 2,632 | 1,784 | 6,789 | 5,169 | Cost of services and products primarily associated with television programming costs. | |||||||||
| Other expenses | 2,278 | 1,545 | 5,422 | 3,110 | Other operating expenses includes selling, general, and administrative expenses necessary for operations, such as advertising, occupancy, professional services, construction materials, personal property taxes, and provision for losses on accounts receivable. Increase was due to expansion of the Lincoln, Nebraska network and number of households served. | |||||||||
| Intersegment expenses, net | 470 | 279 | 1,472 | 610 | Intersegment expenses represent costs for certain corporate activities and services that are allocated to each operating segment based on estimated use of such activities and services. | |||||||||
| Total operating expenses | 12,624 | 7,563 | 32,052 | 17,818 | ||||||||||
| Loss before income taxes | (7,423 | ) | (3,538 | ) | (17,840 | ) | (5,321 | ) | ||||||
| Income tax benefit | 2,821 | 1,344 | 6,779 | 2,022 | ||||||||||
| Net loss | $ | (4,602 | ) | (2,194 | ) | (11,061 | ) | (3,299 | ) | The Company anticipates this operating segment will be dilutive to consolidated earnings over the next several years as it continues to build its network in Lincoln, Nebraska, due to large upfront capital expenditures and associated depreciation and upfront customer acquisition costs. | ||||
| Additional Information: | ||||||||||||||
| Net loss | $ | (4,602 | ) | (2,194 | ) | (11,061 | ) | (3,299 | ) | |||||
| Net interest expense | 1,550 | 318 | 3,365 | 670 | ||||||||||
| Income tax benefit | (2,821 | ) | (1,344 | ) | (6,779 | ) | (2,022 | ) | ||||||
| Depreciation and amortization | 3,145 | 1,630 | 7,880 | 4,137 | ||||||||||
| Earnings (loss) before interest, income taxes, depreciation, and amortization (EBITDA) | $ | (2,728 | ) | (1,590 | ) | (6,595 | ) | (514 | ) | For additional information regarding this non-GAAP measure, see the table below. | ||||
| Three months ended September 30, | Nine months ended September 30, | |||||||||||
| 2017 | 2016 | 2017 | 2016 | |||||||||
| Residential revenue | $ | 4,691 | 2,643 | 11,862 | 7,695 | |||||||
| Business revenue | 2,003 | 1,565 | 5,514 | 4,777 | ||||||||
| Other revenue | 57 | 135 | 201 | 695 | ||||||||
| Total revenue | $ | 6,751 | 4,343 | 17,577 | 13,167 | |||||||
| Net loss | $ | (4,602 | ) | (2,194 | ) | (11,061 | ) | (3,299 | ) | |||
| EBITDA (a) | (2,728 | ) | (1,590 | ) | (6,595 | ) | (514 | ) | ||||
| Capital expenditures | 29,417 | 12,610 | 78,430 | 24,647 | ||||||||
| Revenue contribution: | ||||||||||||
| Internet | 46.7 | % | 40.5 | % | 44.6 | % | 38.5 | % | ||||
| Television | 30.8 | 32.5 | 30.7 | 32.2 | ||||||||
| Telephone | 20.6 | 27.2 | 22.5 | 27.1 | ||||||||
| Other | 1.9 | (0.2 | ) | 2.2 | 2.2 | |||||||
| 100.0 | % | 100.0 | % | 100.0 | % | 100.0 | % | |||||
| As of September 30, 2017 | As of June 30, 2017 | As of March 31, 2017 | As of December 31, 2016 | As of September 30, 2016 | As of June 30, 2016 | As of March 31, 2016 | As of December 31, 2015 | ||||||||||||||||
| Residential customer information: | |||||||||||||||||||||||
| Households served | 16,394 | 12,460 | 10,524 | 9,814 | 8,745 | 8,314 | 7,909 | 7,600 | |||||||||||||||
| Households passed (b) | 54,815 | 45,880 | 34,925 | 30,962 | 22,977 | 22,977 | 21,274 | 21,274 | |||||||||||||||
| Total households in current markets (c) | 137,500 | 137,500 | 137,500 | 137,500 | 137,500 | 137,500 | 137,500 | 28,874 | |||||||||||||||
ASSET GENERATION AND MANAGEMENT OPERATING SEGMENT – RESULTS OF OPERATIONS
As of September 30, 2017,March 31, 2021, the CompanyAGM operating segment had a $22.5$19.0 billion student loan portfolio, consisting primarily of federally insured loans, that management anticipates will amortize over the next approximately 2520 years and has a weighted average remaining life of 9.5 years. For a summary of the Company’s student loan portfolio as of September 30, 2017March 31, 2021 and December 31, 2016,2020, see note 2 of the notes to consolidated financial statements included under Part I, Item 1 of this report.
Loan Activity
The following table sets forth the activity of loans:
| Three months ended March 31, | |||||||||||||||||||||||
| 2021 | 2020 | ||||||||||||||||||||||
| Beginning balance | $ | 19,559,108 | 20,798,719 | ||||||||||||||||||||
| Loan acquisitions: | |||||||||||||||||||||||
| Federally insured student loans | 64,731 | 349,061 | |||||||||||||||||||||
| Private education loans | 23,038 | 47,605 | |||||||||||||||||||||
| Consumer loans | 19,456 | 62,831 | |||||||||||||||||||||
| Total loan acquisitions | 107,225 | 459,497 | |||||||||||||||||||||
| Repayments, claims, capitalized interest, and other | (406,565) | (312,579) | |||||||||||||||||||||
| Consolidation loans lost to external parties | (229,545) | (216,327) | |||||||||||||||||||||
| Consumer loans sold | — | (124,245) | |||||||||||||||||||||
| Ending balance | $ | 19,030,223 | 20,605,065 | ||||||||||||||||||||
| Three months ended September 30, | Nine months ended September 30, | |||||||||||
| 2017 | 2016 | 2017 | 2016 | |||||||||
| Beginning balance | $ | 23,390,300 | 26,754,560 | 25,103,643 | 28,555,749 | |||||||
| Loan acquisitions | 37,532 | 52,667 | 142,386 | 238,595 | ||||||||
| Repayments, claims, capitalized interest, and other | (446,588 | ) | (660,074 | ) | (1,643,049 | ) | (1,989,806 | ) | ||||
| Consolidation loans lost to external parties | (267,331 | ) | (327,766 | ) | (889,067 | ) | (940,413 | ) | ||||
| Loans sold | — | (22 | ) | — | (44,760 | ) | ||||||
| Ending balance | $ | 22,713,913 | 25,819,365 | 22,713,913 | 25,819,365 | |||||||
The Company has also purchased partial ownership in certain federally insured and consumer loan securitizations. As of the latest remittance reports filed by the various trusts prior to March 31, 2021, the Company’s ownership correlates to approximately $500 million and $230 million of federally insured and consumer loans, respectively, included in these securitizations.
The Company's federally insured student loan acquisitions include the purchase of rehabilitated loans purchased from guaranty agencies. After a guaranty agency rehabilitates a federally insured student loan, the agency sells the rehabilitated loan to a private lender, such as the Company. On March 30, 2021, the Department suspended collections on defaulted federally insured student loans held by guaranty agencies and reduced the interest rate on such loans to zero percent, effectively suspending interest payments. The collections pause and adjusted interest rate are both retroactive to March 13, 2020, when the President first declared a national emergency for the COVID-19 pandemic. The Company currently believes these relief efforts will negatively impact the amount of rehabilitated loans the Company will have the opportunity to purchase in future periods.
Allowance for Loan Losses and Loan Delinquencies
For a summary of the Company's activity in the allowance for loan losses for the three and nine months ended September 30, 2017March 31, 2021 and 2016,2020, and a summary of the Company's student loan status and delinquency amounts as of September 30, 2017, March 31, 2021, December 31, 2016,2020, and September 30, 2016,March 31, 2020, see note 2 of the notes to consolidated financial statements included under Part I, Item 1 of this report.
The Company recorded a negative provision for loan losses for its federally insured and consumer loan portfolios of $7.5 million and $11.4 million, respectively, for the three months ended March 31, 2021 due to management's estimate of certain continued improved economic conditions (including the improvement in certain macroeconomic variables (unemployment rates, gross domestic product, and consumer price index) used in the Company's loan loss models) as of March 31, 2021 in comparison to management's estimate of economic conditions used to determine the allowance for loan losses as of December 31, 2020. The Company recorded a $1.4 million provision expense on its private education loan losses forportfolio during the three and nine months ended September 30, 2017March 31, 2021 as a result of an increase of loans in forbearance, which was partially offset by management's estimate of certain continued improved economic conditions as of March 31, 2021 in comparison to management's estimate of economic conditions used to determine the allowance for loan losses as of December 31, 2020.
AGM's total allowance for loan losses of $156.7 million at March 31, 2021 represents reserves equal to 0.7% of AGM's federally insured loans (or 25.5% of the risk sharing component of the loans that is not covered by the federal guaranty), 6.6% of AGM's private education loans, and 2016 due to better than expected credit performance.12.8% of AGM's consumer loans.
40
The following table analyzes the student loan spread on the Company’sAGM’s portfolio of student loans, which represents the spread between the yield earned on student loan assets and the costs of the liabilities and derivative instruments used to fund the assets. The spread amounts included in the following table are calculated by using the notional dollar values found in the table under the caption "Net interest income after provision for loan losses, net of settlements on derivatives" below, divided by the average balance of student loans or debt outstanding.
| Three months ended March 31, | |||||||||||||||||||||||
| 2021 | 2020 | ||||||||||||||||||||||
| Variable loan yield, gross | 2.71 | % | 3.98 | % | |||||||||||||||||||
| Consolidation rebate fees | (0.84) | (0.83) | |||||||||||||||||||||
| Discount accretion, net of premium and deferred origination costs amortization | 0.00 | 0.01 | |||||||||||||||||||||
| Variable loan yield, net | 1.87 | 3.16 | |||||||||||||||||||||
| Loan cost of funds - interest expense (a) | (1.07) | (2.58) | |||||||||||||||||||||
| Loan cost of funds - derivative settlements (b) (c) | (0.00 | ) | 0.04 | ||||||||||||||||||||
| Variable loan spread | 0.80 | 0.62 | |||||||||||||||||||||
| Fixed rate floor income, gross | 0.74 | 0.36 | |||||||||||||||||||||
| Fixed rate floor income - derivative settlements (b) (d) | (0.09) | 0.04 | |||||||||||||||||||||
| Fixed rate floor income, net of settlements on derivatives | 0.65 | 0.40 | |||||||||||||||||||||
| Core loan spread | 1.45 | % | 1.02 | % | |||||||||||||||||||
| Average balance of AGM's loans | $ | 19,494,002 | 20,793,758 | ||||||||||||||||||||
| Average balance of AGM's debt outstanding | 19,156,797 | 20,616,771 | |||||||||||||||||||||
| Three months ended September 30, | Nine months ended September 30, | |||||||||||
| 2017 | 2016 | 2017 | 2016 | |||||||||
| Variable student loan yield, gross | 3.62 | % | 2.93 | % | 3.44 | % | 2.87 | % | ||||
| Consolidation rebate fees | (0.85 | ) | (0.83 | ) | (0.84 | ) | (0.83 | ) | ||||
| Discount accretion, net of premium and deferred origination costs amortization (a) | 0.07 | 0.06 | 0.07 | 0.06 | ||||||||
| Variable student loan yield, net | 2.84 | 2.16 | 2.67 | 2.10 | ||||||||
| Student loan cost of funds - interest expense | (2.09 | ) | (1.44 | ) | (1.91 | ) | (1.36 | ) | ||||
| Student loan cost of funds - derivative settlements (b) (c) | (0.07 | ) | (0.01 | ) | (0.04 | ) | (0.01 | ) | ||||
| Variable student loan spread | 0.68 | 0.71 | 0.72 | 0.73 | ||||||||
| Fixed rate floor income, gross | 0.42 | 0.63 | 0.47 | 0.64 | ||||||||
Fixed rate floor income - derivative settlements (b) (d) | 0.07 | (0.08 | ) | 0.03 | (0.07 | ) | ||||||
| Fixed rate floor income, net of settlements on derivatives | 0.49 | 0.55 | 0.50 | 0.57 | ||||||||
| Core student loan spread | 1.17 | % | 1.26 | % | 1.22 | % | 1.30 | % | ||||
| Average balance of student loans | $ | 23,188,577 | 26,368,507 | 23,948,108 | 27,305,128 | |||||||
| Average balance of debt outstanding | 22,892,789 | 26,235,053 | 23,687,067 | 27,188,069 | ||||||||
(a) In the first quarter of 2021, the Company reversed a historical accrued interest liability of $23.8 million on certain bonds, which liability the Company determined is no longer probable of being required to be paid. The liability was initially recorded when certain asset-backed securitizations were acquired in 2011 and 2013. The reduction of this liability is reflected in (a reduction of) "interest on bonds and notes payable and bank deposits" in the consolidated statements of operations and the impact of this reduction to interest expense was excluded in the table above.
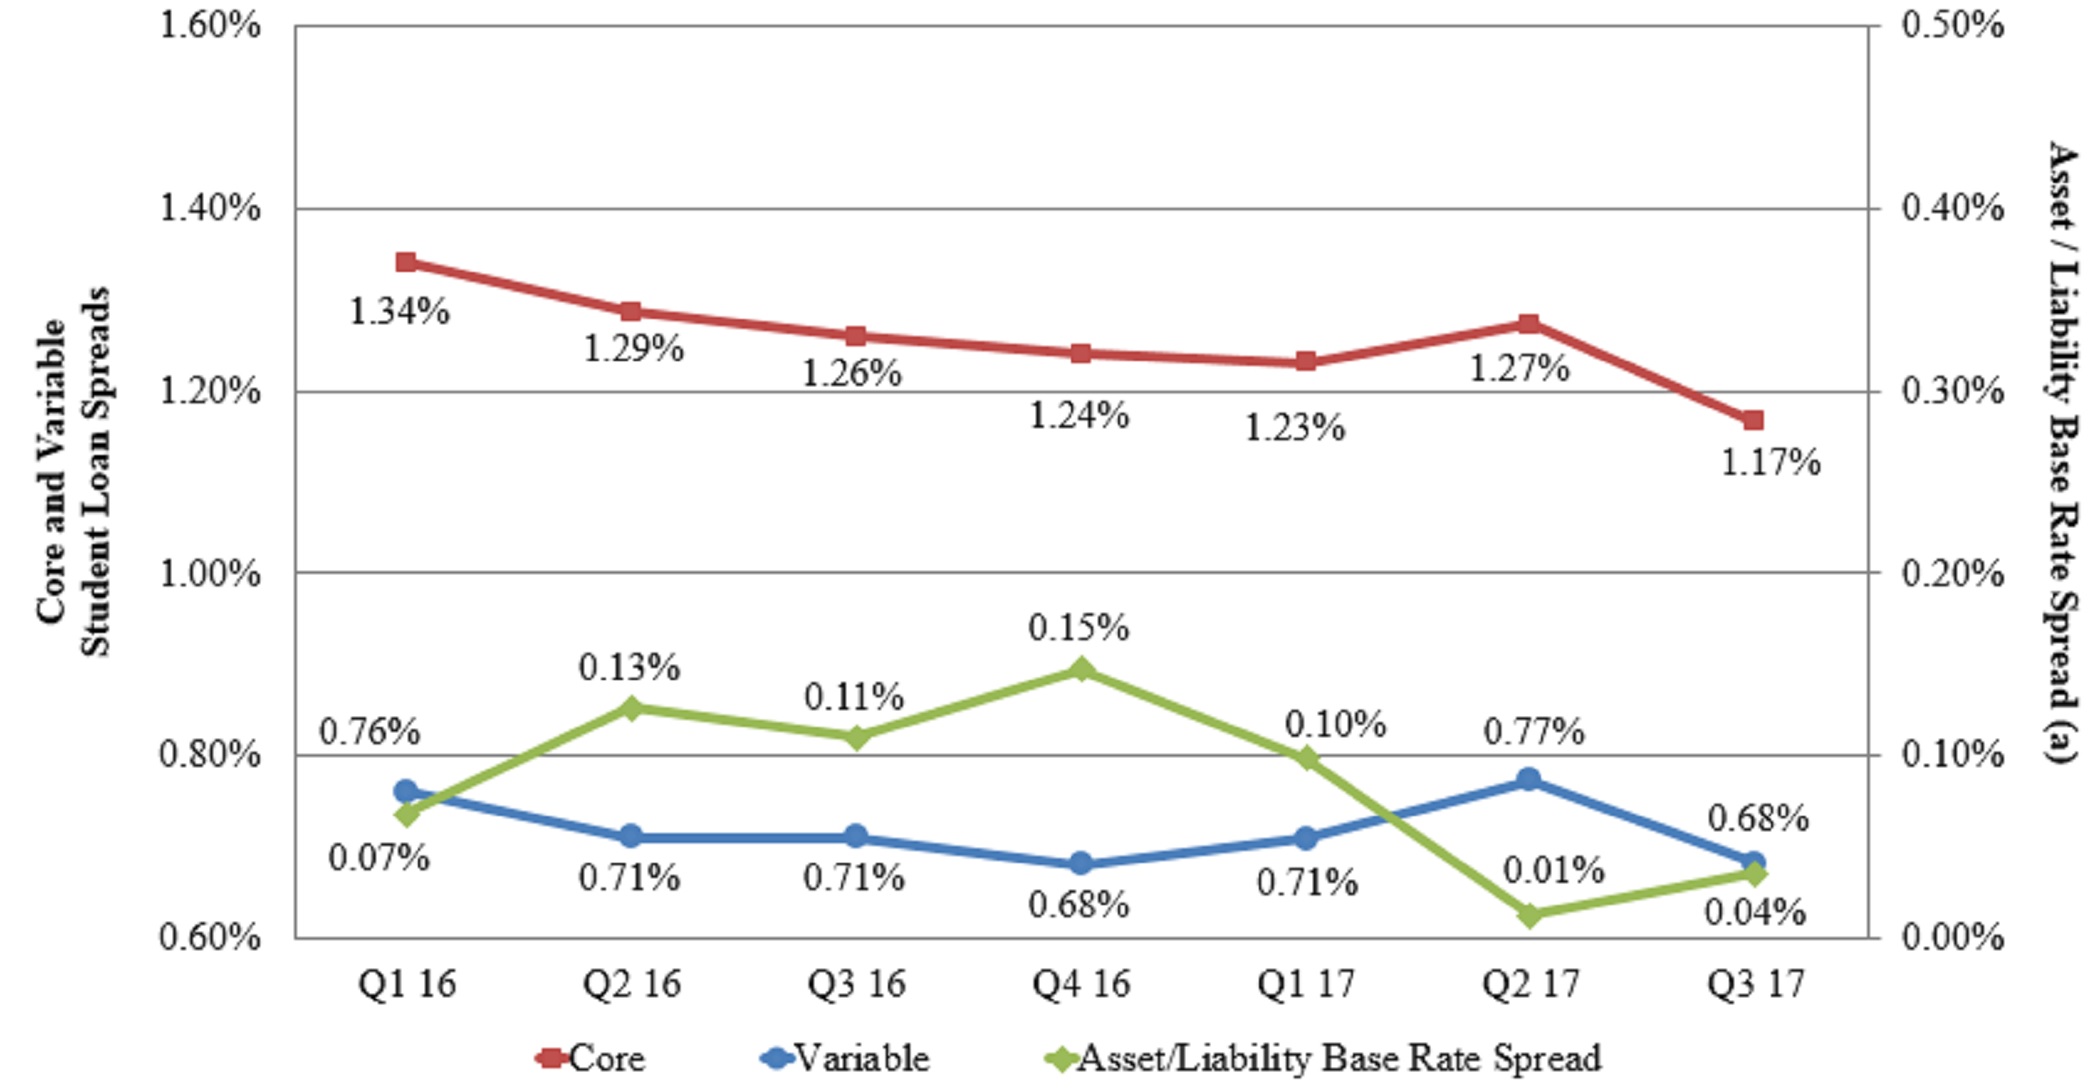
| Three months ended September 30, | Nine months ended September 30, | |||||||||||
| 2017 | 2016 | 2017 | 2016 | |||||||||
| Fixed rate floor income, gross | $ | 24,586 | 41,509 | 84,382 | 131,720 | |||||||
| Derivative settlements (a) | 3,883 | �� | (5,157 | ) | 5,877 | (15,241 | ) | |||||
| Fixed rate floor income, net | $ | 28,469 | 36,352 | 90,259 | 116,479 | |||||||
| Fixed rate floor income contribution to spread, net | 0.49 | % | 0.55 | % | 0.50 | % | 0.57 | % | ||||
| Three months ended September 30, | Nine months ended September 30, | Additional information | ||||||||||||
| 2017 | 2016 | 2017 | 2016 | |||||||||||
| Net interest income after provision for loan losses | $ | 67,894 | 93,318 | 218,763 | 281,861 | See table below for additional analysis. | ||||||||
| Other income | 2,753 | 4,265 | 9,152 | 12,362 | The primary component of other income is borrower late fees, which were $2.7 million and $3.2 million for the three months ended September 30, 2017 and 2016, respectively, and $9.1 million and $9.9 million for the nine months ended September 30, 2017 and 2016, respectively. | |||||||||
| Gain from debt repurchases | 116 | 2,160 | 1,097 | 2,260 | Gains were from the Company repurchasing its own asset-backed debt securities. | |||||||||
| Derivative settlements, net | (382 | ) | (6,028 | ) | (1,721 | ) | (17,596 | ) | The Company maintains an overall risk management strategy that incorporates the use of derivative instruments to reduce the economic effect of interest rate volatility. Derivative settlements for each applicable period should be evaluated with the Company's net interest income as reflected in the table below. | |||||
| Derivative market value and foreign currency transaction adjustments, net | 7,702 | 42,546 | (23,121 | ) | (8,763 | ) | Includes (i) the realized and unrealized gains and losses that are caused by changes in fair values of derivatives which do not qualify for "hedge treatment" under GAAP; and (ii) the unrealized foreign currency transaction gains or losses caused by the re-measurement of the Company's Euro-denominated bonds to U.S. dollars. | |||||||
| Total other income (expense) | 10,189 | 42,943 | (14,593 | ) | (11,737 | ) | ||||||||
| Salaries and benefits | 392 | 486 | 1,156 | 1,504 | ||||||||||
| Loan servicing fees | 7,939 | 5,880 | 19,584 | 20,024 | Increase for the three months ended September 30, 2017 compared to the same period in 2016 due to a payment of $2.8 million in conversion fees related to a transfer of loans in August 2017 from a third-party servicer to the LSS operating segment's servicing platform. Excluding the $2.8 million conversion fee paid in the third quarter of 2017, loan servicing fees paid to third parties decreased $0.7 million and $3.2 million for the three and nine months ended September 30, 2017 compared to the same periods in 2016 due to runoff of the Company's student loan portfolio and transfers of loans in August 2017 and June 2016 from third-party servicers to the LSS operating segment's servicing platform. | |||||||||
| Other expenses | 1,451 | 1,769 | 4,269 | 4,766 | ||||||||||
| Intersegment expenses, net | 10,659 | 11,146 | 31,114 | 34,791 | Amounts include fees paid to the LSS operating segment for the servicing of the Company’s student loan portfolio. These amounts exceed the actual cost of servicing the loans. Decrease due to a decrease in loans serviced by the LSS operating segment during the comparable periods due to portfolio runoff. In addition, intersegment expenses represent costs for certain corporate activities and services that are allocated to each operating segment based on estimated use of such activities and services. | |||||||||
| Total operating expenses | 20,441 | 19,281 | 56,123 | 61,085 | Total operating expenses were 35 basis points and 29 basis points of the average balance of student loans for the three months ended September 30, 2017 and 2016, respectively, and 31 basis points and 30 basis points for the nine months ended September 30, 2017 and 2016, respectively. When excluding the $2.8 million conversion fees paid in August 2017 to a third-party to transfer loans to the LSS operating segment's servicing platform, total operating expenses were 30, 29, 30 and 30 basis points for the three months ended September 30, 2017 and 2016 and nine months ended September 30, 2017 and 2016, respectively. | |||||||||
| Income before income taxes | 57,642 | 116,980 | 148,047 | 209,039 | ||||||||||
| Income tax expense | (21,904 | ) | (44,571 | ) | (56,258 | ) | (79,434 | ) | ||||||
| Net income | $ | 35,738 | 72,409 | 91,789 | 129,605 | |||||||||
| Additional information: | ||||||||||||||
| Net income | $ | 35,738 | 72,409 | 91,789 | 129,605 | |||||||||
| Derivative market value and foreign currency transaction adjustments, net | (7,702 | ) | (42,546 | ) | 23,121 | 8,763 | See "Overview - GAAP Net Income and Non-GAAP Net Income, Excluding Adjustments" above for additional information about non-GAAP net income, excluding derivative market value and foreign currency transaction adjustments. Net income, excluding derivative market value and foreign currency transaction adjustments, decreased in 2017 as compared to 2016 due to (i) a decrease in the Company's student loan portfolio, (ii) a decrease in core student loan spread, (iii) a $2.8 million ($1.7 million after tax) expense related to conversion fees paid in August 2017 to a third-party to transfer loans to the LSS operating segment's servicing platform, and (iv) an increase in interest income of $8.2 million ($5.1 million after tax) recognized in the third quarter of 2016 related to a correction of an error as further described in note 2 of the notes to consolidated financial statements included under Part I, Item 1 of this report. | |||||||
| Net tax effect | 2,927 | 16,167 | (8,786 | ) | (3,330 | ) | ||||||||
| Net income, excluding derivative market value and foreign currency transaction adjustments | $ | 30,963 | 46,030 | 106,124 | 135,038 | |||||||||
| Three months ended September 30, | Nine months ended September 30, | Additional information | ||||||||||||
| 2017 | 2016 | 2017 | 2016 | |||||||||||
| Variable interest income, gross | $ | 211,785 | 194,877 | 616,474 | 585,299 | Increase due to an increase in the gross yield earned on student loans, partially offset by a decrease in the average balance of student loans. | ||||||||
| Consolidation rebate fees | (48,986 | ) | (55,131 | ) | (151,469 | ) | (170,352 | ) | Decrease due to a decrease in the average consolidation loan balance. | |||||
| Discount accretion, net of premium and deferred origination costs amortization | 4,371 | 12,466 | 13,064 | 21,109 | Net discount accretion is due to the Company's purchases of loans at a net discount over the last several years. In the third quarter of 2016, the Company revised its policy to correct for an error in its method of applying the interest method used to amortize premiums and accrete discounts on its student loan portfolio. Under the Company's revised policy, as of September 30, 2016, the constant prepayment rate used by the Company to amortize/accrete student loan premiums/discounts was decreased. During the third quarter of 2016, the Company recorded an adjustment to reflect the net impact on prior periods for the correction of this error that resulted in an $8.2 million reduction to the Company's net loan discount balance and a corresponding increase in interest income. | |||||||||
| Variable interest income, net | 167,170 | 152,212 | 478,069 | 436,056 | ||||||||||
| Interest on bonds and notes payable | (120,487 | ) | (94,770 | ) | (338,987 | ) | (276,124 | ) | Increase due to an increase in cost of funds, partially offset by a decrease in the average balance of debt outstanding. | |||||
| Derivative settlements, net (a) | (4,265 | ) | (871 | ) | (7,598 | ) | (2,355 | ) | Derivative settlements include the net settlements paid/received related to the Company’s 1:3 basis swaps and cross-currency interest rate swap. | |||||
| Variable student loan interest margin, net of settlements on derivatives (a) | 42,418 | 56,571 | 131,484 | 157,577 | ||||||||||
| Fixed rate floor income, gross | 24,586 | 41,509 | 84,382 | 131,720 | The high levels of fixed rate floor income earned are due to historically low interest rates. Fixed rate floor income has decreased due to the rising interest rate environment. Derivative settlements include the net settlements paid/received related to the Company’s floor income interest rate swaps. | |||||||||
| Derivative settlements, net (a) | 3,883 | (5,157 | ) | 5,877 | (15,241 | ) | Derivative settlements include the settlements paid/received related to the Company's floor income interest rate swaps. | |||||||
| Fixed rate floor income, net of settlements on derivatives | 28,469 | 36,352 | 90,259 | 116,479 | ||||||||||
| Core student loan interest income | 70,887 | 92,923 | 221,743 | 274,056 | ||||||||||
| Investment interest | 3,213 | 980 | 6,210 | 2,614 | Increase due to a higher balance of interest-earning investments and an increase in interest rates. | |||||||||
| Intercompany interest | (588 | ) | (613 | ) | (1,911 | ) | (1,905 | ) | ||||||
| Provision for loan losses - federally insured loans | (7,000 | ) | (7,000 | ) | (11,000 | ) | (11,000 | ) | See "Allowance for Loan Losses and Loan Delinquencies" included above under "Asset Generation and Management Operating Segment - Results of Operations." | |||||
| Negative provision for loan losses - private education loans | 1,000 | 1,000 | 2,000 | 500 | ||||||||||
| Net interest income after provision for loan losses (net of settlements on derivatives) (a) | $ | 67,512 | 87,290 | 217,042 | 264,265 | |||||||||
for the presentation of such non-GAAP information, which is only meant to supplement GAAP results by providing additional information that management utilizes to assess performance. See note 4 of the notes to consolidated financial statements included under Part I, Item 1 of this report for additional information on the Company's derivative instruments, including the net settlement activity recognized by the Company for each type of derivative for the 2021 and 2020 periods presented in the table under the caption "Consolidated Financial Statement Impact Related to Derivatives - Statements of Operations" in note 4 and in this table.
A reconciliation of core loan spread, which includes the impact of derivative settlements on loan spread, to loan spread without
derivative settlements follows.
| Three months ended March 31, | |||||||||||||||||||||||
| 2021 | 2020 | ||||||||||||||||||||||
| Core loan spread | 1.45 | % | 1.02 | % | |||||||||||||||||||
| Derivative settlements (1:3 basis swaps) | 0.00 | (0.04) | |||||||||||||||||||||
| Derivative settlements (fixed rate floor income) | 0.09 | (0.04) | |||||||||||||||||||||
| Loan spread | 1.54 | % | 0.94 | % | |||||||||||||||||||
(c) Derivative settlements consist of net settlements (paid) received related to the Company’s 1:3 basis swaps.
(d) Derivative settlements consist of net settlements (paid) received related to the Company’s floor income interest rate swaps.
41
A trend analysis of AGM's core and variable loan spreads is summarized below.
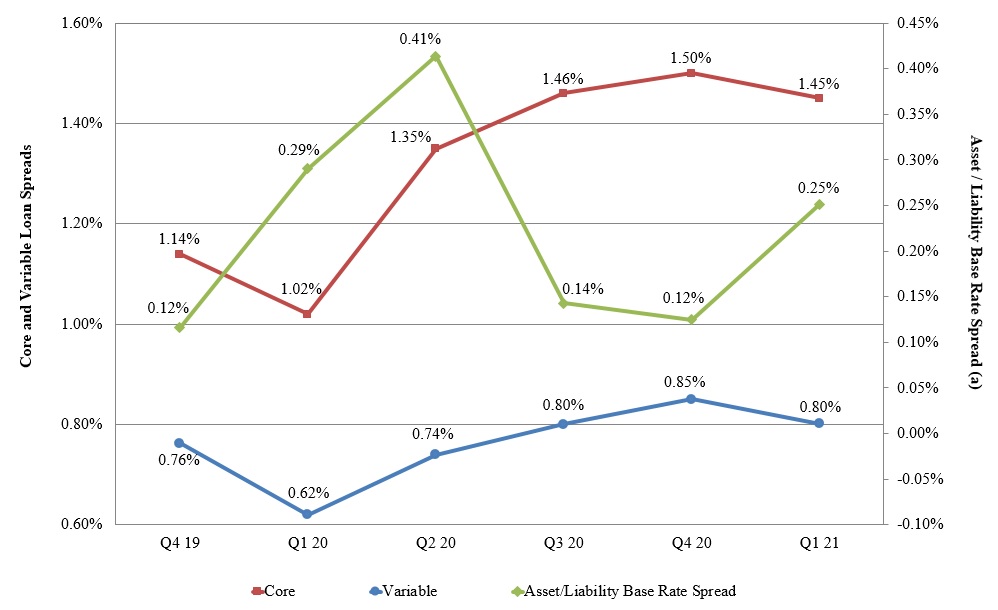
(a) The interest earned on a large portion of AGM's FFELP student loan assets is indexed to the one-month LIBOR rate. AGM funds a portion of its assets with three-month LIBOR indexed floating rate securities. The relationship between the indices in which AGM earns interest on its loans and funds such loans has a significant impact on loan spread. This table (the right axis) shows the difference between AGM's liability base rate and the one-month LIBOR rate by quarter. See Item 3, “Quantitative and Qualitative Disclosures About Market Risk - Interest Rate Risk,” which provides additional detail on AGM’s FFELP student loan assets and related funding for those assets.
Variable loan spread increased during the three months ended March 31, 2021 compared to the same period in 2020 due to a narrowing of the basis between the asset and debt indices in which the Company earns interest on its loans and funds such loans (as reflected in the table above). The significant widening during the first quarter of 2020 was the result of a significant decrease in interest rates during March 2020. In a declining interest rate environment, student loan spread is compressed, due to the timing of interest rate resets on the Company's assets occurring daily in contrast to the timing of the interest resets on the Company's debt that occurs either monthly or quarterly. See Item 3, “Quantitative and Qualitative Disclosures About Market Risk - Interest Rate Risk,” which provides additional detail on the AGM’s FFELP student loan assets and related funding for those assets.
The difference between variable loan spread and core loan spread is fixed rate floor income earned on a portion of AGM's federally insured student loan portfolio. A summary of fixed rate floor income and its contribution to core loan spread follows:
| Three months ended March 31, | |||||||||||||||||||||||
| 2021 | 2020 | ||||||||||||||||||||||
| Fixed rate floor income, gross | $ | 35,539 | 18,758 | ||||||||||||||||||||
| Derivative settlements (a) | (4,285) | 2,125 | |||||||||||||||||||||
| Fixed rate floor income, net | $ | 31,254 | 20,883 | ||||||||||||||||||||
| Fixed rate floor income contribution to spread, net | 0.65 | % | 0.40 | % | |||||||||||||||||||
(a) Derivative settlements consist of net settlements (paid) received related to the Company's derivatives used to hedge student loans earning fixed rate floor income.
The increase in gross fixed rate floor income for the three months ended March 31, 2021 compared to the same period in 2020 was due to lower interest rates in 2021 as compared to 2020. The Company has a portfolio of derivative instruments in which
42
the Company pays a fixed rate and receives a floating rate to economically hedge a portion of loans earning fixed rate floor income. The change from being in a net positive settlement position on such derivatives during the first quarter of 2020 to being in a net negative settlement position during the first quarter of 2021 was due to a decrease in interest rates. See Item 3, “Quantitative and Qualitative Disclosures About Market Risk - Interest Rate Risk,” which provides additional detail on the Company’s portfolio earning fixed rate floor income and the derivatives used by the Company to hedge these loans.
Interest Rate Risk - Replacement of LIBOR as a Benchmark Rate
On March 5, 2021, the ICE Benchmark Administration Limited (the “IBA”), which administers LIBOR, published the results of a consultation confirming its intention to cease the publication of LIBOR (i) after June 30, 2023 in the case of U.S. Dollar LIBOR rates for one-month, three-month, and certain other tenors, and (ii) after December 31, 2021 in all other cases. Also on March 5, 2021, the United Kingdom’s Financial Conduct Authority, which regulates the IBA, announced that it does not intend to sustain LIBOR by requiring panel banks to continue providing quotations of LIBOR beyond the dates for which they have notified their departure from IBA’s LIBOR quotation scheme, or to require IBA to publish LIBOR beyond such dates. As a result, immediately after the announced LIBOR discontinuation dates specified above, respectively, LIBOR will no longer be representative of the underlying market and economic reality that the rates are intended to measure. As of March 31, 2021, the interest earned on a principal amount of $17.3 billion of the Company’s FFELP student loan asset portfolio was indexed to one-month LIBOR, and the interest paid on a principal amount of $16.7 billion of the Company’s FFELP student loan asset-backed debt securities was indexed to one-month or three-month LIBOR. In addition, the Company’s derivative financial instrument transactions used to manage LIBOR interest rate risks are indexed to LIBOR. New LIBOR contracts are generally not expected to be entered into after December 31, 2021. A market transition away from the current LIBOR framework could result in significant changes to the interest rate characteristics of the Company's LIBOR-indexed assets and funding for those assets, as well as the Company’s LIBOR-indexed derivative instruments. See Item 1A, "Risk Factors - Loan Portfolio - Interest rate risk - replacement of LIBOR as a benchmark rate" in the Company's 2020 Annual Report for additional information.
Summary and Comparison of Operating Results
| Three months ended March 31, | |||||||||||||||||||||||||||||
| 2021 | 2020 | Additional information | |||||||||||||||||||||||||||
| Net interest income (expense) after provision for loan losses | $ | 116,922 | (23,622) | See table below for additional analysis. | |||||||||||||||||||||||||
| Other income | 445 | 3,215 | Represents primarily borrower late fees. The decrease in borrower late fees in 2021 compared to 2020 was due to the Company suspending borrower late fees effective March 13, 2020 to provide borrowers relief as a result of the COVID-19 pandemic. | ||||||||||||||||||||||||||
| Gain on sale of loans | — | 18,206 | The Company sold a portfolio of consumer loans in January 2020 and recognized a gain of $18.2 million. | ||||||||||||||||||||||||||
| Impairment expense and provision for beneficial interests, net | 2,436 | (26,303) | In March 2020, the Company recognized a provision expense of $26.3 million related to its beneficial interest in consumer loan securitization investments as a result of the expected impacts of the COVID-19 pandemic. During the first quarter of 2021, $2.4 million of such provision was reversed due to improved economic conditions. | ||||||||||||||||||||||||||
| Derivative settlements, net | (4,304) | 4,237 | The Company maintains an overall risk management strategy that incorporates the use of derivative instruments to reduce the economic effect of interest rate volatility. Derivative settlements for each applicable period should be evaluated with the Company's net interest income as reflected in the table below. | ||||||||||||||||||||||||||
| Derivative market value adjustments, net | 38,809 | (20,602) | Includes the realized and unrealized gains and losses that are caused by changes in fair values of derivatives which do not qualify for "hedge treatment" under GAAP. The majority of the derivative market value adjustments related to the changes in fair value of the Company's floor income interest rate swaps. Such changes reflect that a decrease in the forward yield curve during a reporting period results in a decrease in the fair value of the Company's floor income interest rate swaps, and an increase in the forward yield curve during a reporting period results in an increase in the fair value of the Company's floor income interest rate swaps. | ||||||||||||||||||||||||||
| Total other income/expense | 37,386 | (21,247) | |||||||||||||||||||||||||||
| Salaries and benefits | 495 | 443 | |||||||||||||||||||||||||||
| Other expenses | 3,777 | 3,717 | The primary component of other expenses is servicing fees paid to third parties. | ||||||||||||||||||||||||||
| Intersegment expenses | 8,427 | 11,916 | Amounts include fees paid to the LSS operating segment for the servicing of the Company’s loan portfolio. These amounts exceed the actual cost of servicing the loans. The decrease in servicing fees in 2021 compared to 2020 was due to the expected amortization of the Company's FFELP portfolio and a decrease in certain servicing activities due to borrower relief initiatives and policies as a result of the COVID-19 pandemic. Intersegment expenses also include costs for certain corporate activities and services that are allocated to each operating segment based on estimated use of such activities and services. | ||||||||||||||||||||||||||
43
| Total operating expenses | 12,699 | 16,076 | Total operating expenses were 26 basis points and 31 basis points of the average balance of loans for the three months ended March 31, 2021 and 2020, respectively. The decrease in 2021 as compared to 2020 was due to a decrease in certain servicing activities due to borrower relief initiatives and policies as a result of the COVID-19 pandemic. | ||||||||||||||||||||||||||
| Income (loss) before income taxes | 141,609 | (60,945) | |||||||||||||||||||||||||||
| Income tax (expense) benefit | (33,987) | 14,627 | Represents income tax (expense) benefit at an effective tax rate of 24%. | ||||||||||||||||||||||||||
| Net income (loss) | $ | 107,622 | (46,318) | ||||||||||||||||||||||||||
| Additional information: | |||||||||||||||||||||||||||||
| Net income (loss) | $ | 107,622 | (46,318) | See "Overview - GAAP Net Income and Non-GAAP Net Income, Excluding Adjustments" above for additional information about non-GAAP net income, excluding derivative market value adjustments. The increase in GAAP and non-GAAP net income was due to (i) an increase in core loan spread; (ii) a decrease in interest expense in 2021 as a result of reversing a historical accrued interest liability on certain bonds; and (iii) the recognition of a negative provision in the first quarter of 2021 related to loans and consumer loan residual investments as compared to provision expense on such assets in 2020 as a result of the COVID-19 pandemic. These items were partially offset by (i) a decrease in the average balance of loans in 2021 as compared to 2020 and (ii) a gain in 2020 from the sale of consumer loans. | |||||||||||||||||||||||||
| Derivative market value adjustments, net | (38,809) | 20,602 | |||||||||||||||||||||||||||
| Tax effect | 9,314 | (4,944) | |||||||||||||||||||||||||||
| Net income (loss), excluding derivative market value adjustments | $ | 78,127 | (30,660) | ||||||||||||||||||||||||||
44
Net interest income after provision for loan losses, net of settlements on derivatives
The following table summarizes the components of "net interest income (expense) after provision for loan losses" and "derivative settlements, net."
| Three months ended March 31, | |||||||||||||||||||||||||||||
| 2021 | 2020 | Additional information | |||||||||||||||||||||||||||
| Variable interest income, gross | $ | 129,170 | 205,512 | Decrease in 2021 compared to 2020 was due to a decrease in the gross yield earned on loans and a decrease in the average balance of loans. | |||||||||||||||||||||||||
| Consolidation rebate fees | (41,073) | (43,137) | Decrease in 2021 compared to 2020 was due to a decrease in the average consolidation loan balance. | ||||||||||||||||||||||||||
| Discount accretion, net of premium and deferred origination costs amortization | 118 | 660 | Net discount accretion is due to the Company's purchases of loans at a net discount over the last several years. | ||||||||||||||||||||||||||
| Variable interest income, net | 88,215 | 163,035 | |||||||||||||||||||||||||||
| Interest on bonds and notes payable | (26,771) | (132,668) | Decrease in 2021 compared to 2020 was due to a decrease in cost of funds and a decrease in the average balance of debt outstanding. In addition, during the first quarter of 2021, the Company reduced interest expense by $23.8 million as a result of reversing a historical accrued interest liability on certain bonds. | ||||||||||||||||||||||||||
| Derivative settlements, net (a) | (19) | 2,112 | Derivative settlements include the net settlements (paid) received related to the Company’s 1:3 basis swaps. | ||||||||||||||||||||||||||
| Variable loan interest margin, net of settlements on derivatives (a) | 61,425 | 32,479 | |||||||||||||||||||||||||||
| Fixed rate floor income, gross | 35,539 | 18,758 | Fixed rate floor income increased in 2021 compared to 2020 due to lower interest rates in 2021 as compared to 2020. | ||||||||||||||||||||||||||
| Derivative settlements, net (a) | (4,285) | 2,125 | Derivative settlements include the settlements (paid) received related to the Company's floor income interest rate swaps. The change from being in a net positive settlement position on such derivatives during the first quarter of 2020 to being in a net negative settlement position during the first quarter of 2021 was due to a decrease in interest rates. | ||||||||||||||||||||||||||
| Fixed rate floor income, net of settlements on derivatives | 31,254 | 20,883 | |||||||||||||||||||||||||||
| Core loan interest income (a) | 92,679 | 53,362 | |||||||||||||||||||||||||||
| Investment interest | 2,648 | 4,133 | Decrease in 2021 compared to 2020 was due to lower interest rates and lower weighted average cash and restricted cash balances in 2021 as compared to 2020. | ||||||||||||||||||||||||||
| Intercompany interest | (179) | (581) | Decrease in 2021 compared to 2020 was due to lower interest rates and lower weighted average debt outstanding in 2021 as compared to 2020. | ||||||||||||||||||||||||||
| Provision for loan losses - federally insured loans | 7,483 | (39,323) | See "Allowance for Loan Losses and Loan Delinquencies" included above under "Asset Generation and Management Operating Segment - Results of Operations." | ||||||||||||||||||||||||||
| Provision for loan losses - private education loans | (1,431) | (9,800) | |||||||||||||||||||||||||||
| Provision for loan losses - consumer loans | 11,418 | (27,176) | |||||||||||||||||||||||||||
| Net interest income (loss) after provision for loan losses (net of settlements on derivatives) (a) | $ | 112,618 | (19,385) | Increase in 2021 as compared to 2020 was due to (i) an increase in core loan spread; (ii) a decrease in interest expense in 2021 as a result of reversing a historical accrued interest liability on certain bonds; and (iii) the recognition of a negative provision for loan losses in 2021 as compared to provision for loan losses in 2020 as a result of the COVID-19 pandemic. These items were partially offset by a decrease in the average balance of loans. | |||||||||||||||||||||||||
(a) Derivative settlements represent the cash paid or received during the current period to settle with derivative instrument counterparties the economic effect of the Company's derivative instruments based on their contractual terms. Derivative accounting requires that net settlements on derivatives that do not qualify for "hedge treatment" under GAAP be recorded in a separate income statement line item below net interest income. The Company maintains an overall risk management strategy that incorporates the use of derivative instruments to reduce the economic effect of interest rate volatility. As such, management believes derivative settlements for each applicable period should be evaluated with the Company’s net interest income as presented in this table. Core loan interest income and net interest income after provision for loan losses (net of settlements on derivatives) are non-GAAP financial measures, and the Company reports this non-GAAP information because the Company believes that it provides additional information regarding operational and performance indicators that are closely assessed by management. There is no comprehensive, authoritative guidance for the presentation of such non-GAAP information, which is only meant to supplement GAAP results by providing additional information that management utilizes to assess performance.. See note 4 of the notes to consolidated financial statements included under Part I, Item 1 of this report for additional information on the Company's derivative instruments, including the net settlement activity recognized by the Company for each type of derivative referred to in the "Additional information" column of this table, for the 2021 and 2020 periods presented in the table under the caption "Income"Consolidated Financial Statement Impact"Impact Related to Derivatives - Statements of Operations" in note 4 and in this table.
NELNET BANK OPERATING SEGMENT – RESULTS OF OPERATIONS
Loan Portfolio
As of March 31, 2021, Nelnet Bank had a $79.2 million loan portfolio, consisting of private education loans.
As of March 31, 2021, Nelnet Bank's allowance for loan losses on its portfolio was $0.7 million, which represents a reserve equal to 0.9% of Nelnet Bank's private education loan portfolio. There were no charge offs recognized by the bank during the three months ended March 31, 2021.
The following table sets forth the activity in Nelnet Bank's loan portfolio:
| Three months ended | |||||
| March 31, 2021 | |||||
| Beginning balance: | $ | 17,543 | |||
| Originations | 64,909 | ||||
| Repayments | (1,995) | ||||
| Sales to AGM segment | (1,226) | ||||
| Ending balance: | $ | 79,231 | |||
Deposits
As of March 31, 2021, Nelnet Bank had $190.3 million of deposits. All of Nelnet Bank’s deposits are interest-bearing deposits and consist of brokered certificates of deposit (CDs), intercompany savings deposits, and retail and other savings deposits and CDs. The intercompany deposits are deposits from Nelnet, Inc. (Parent Company) and its subsidiaries and include a pledged deposit of $40.0 million from Nelnet, Inc. (Parent Company), as required under the Capital and Liquidity Maintenance Agreement with the FDIC, deposits required for intercompany transactions, operating deposits, and Nelnet Business Services custodial deposits consisting of tuition payments collected which are subsequently remitted to the appropriate school. Retail and other deposits include savings deposits from Educational 529 College Savings and Health Savings plans and commercial and institutional CDs. Union Bank and Trust Company ("Union Bank"), a related party, is the program manager for the College Savings plans.
Average Balance Sheet
The following table reflects the rates earned on interest-earning assets and paid on interest-bearing liabilities.
| Three months ended | |||||||||||
| March 31, 2021 | |||||||||||
| Balance | Rate | ||||||||||
| Average assets | |||||||||||
| Private education loans | $ | 43,746 | 3.37 | % | |||||||
| Cash and investments | 215,613 | 1.91 | |||||||||
| Total interest-earning assets | 259,359 | 2.15 | % | ||||||||
| Non-interest-earning assets | 6,541 | ||||||||||
| Total assets | $ | 265,900 | |||||||||
| Average liabilities and equity | |||||||||||
| Brokered deposits | 2,984 | 0.55 | % | ||||||||
| Intercompany deposits | 56,684 | 0.28 | |||||||||
| Retail and other deposits | 101,462 | 0.60 | |||||||||
| Total interest-bearing liabilities | 161,130 | 0.49 | % | ||||||||
| Non-interest-bearing liabilities | 2,870 | ||||||||||
| Equity | 101,900 | ||||||||||
| Total liabilities and equity | $ | 265,900 | |||||||||
46
Regulatory Capital Requirements
Under the regulatory framework for prompt corrective action, Nelnet Bank is subject to various regulatory capital requirements administered by the FDIC and the UDFI and must meet specific capital standards. Failure to meet minimum capital requirements can initiate certain mandatory and possibly additional discretionary actions by regulators that, if undertaken, could have a direct material adverse effect on Nelnet Bank's business, results of operations, and financial condition. On January 1, 2020, the Community Bank Leverage Ratio ("CBLR") framework, as issued jointly by the OCC, the Federal Reserve Board, and the FDIC, became effective. Any banking organization with total consolidated assets of less than $10 billion, limited amounts of certain types of assets and off-balance sheet exposures, and a community bank leverage ratio greater than 9% may opt into the CBLR framework quarterly. The CBLR framework allows banks to satisfy capital standards and be considered "well capitalized" under the prompt corrective action framework if their leverage ratio is greater than 9%, unless the banking organization's federal banking agency determines that the banking organization's risk profile warrants a more stringent leverage ratio. The FDIC has ordered Nelnet Bank to maintain at least a 12% leverage ratio. Nelnet Bank has opted into the CBLR framework for the quarter ended March 31, 2021 with a leverage ratio of 38.6%. Nelnet Bank intends to maintain at all times regulatory capital levels that meet both the minimum level necessary to be considered “well capitalized” under the FDIC’s prompt corrective action framework and the minimum level required by the FDIC.
Summary of Operating Results
On November 2, 2020, Nelnet Bank obtained final approval for federal deposit insurance from the FDIC and for a bank charter from the UDFI and Nelnet Bank launched operations. Nelnet Bank's operations are presented by the Company as a reportable operating segment. Costs associated with Nelnet Bank prior to November 2, 2020 are included in the Corporate operating segment. In addition, certain shared service and support costs incurred by the Company are not and will not be reflected as part of the Nelnet Bank operating segment through 2023 (the bank's de novo period). The shared service and support costs incurred by the Company related to Nelnet Bank and not reflected in the bank's operating segment were $0.7 million for the three months ended March 31, 2021.
| Three months ended | |||||||||||||||||||||||||||||
| March 31, 2021 | Additional information | ||||||||||||||||||||||||||||
| Total interest income | $ | 1,376 | Represents interest earned on Nelnet Bank's private education student loans and investments. | ||||||||||||||||||||||||||
| Interest expense | 194 | Represents interest expense on deposits. | |||||||||||||||||||||||||||
| Net interest income | 1,182 | ||||||||||||||||||||||||||||
| Less: Provision for loan losses | 422 | Represents provision expense during the period, primarily related to loans originated during the current period. | |||||||||||||||||||||||||||
| Net interest income after provision for loan losses | 760 | ||||||||||||||||||||||||||||
| Other income | 22 | ||||||||||||||||||||||||||||
| Salaries and benefits | 1,488 | Represents salaries and benefits of Nelnet Bank associates and third-party contract labor. | |||||||||||||||||||||||||||
| Other expenses | 545 | Represents various expenses such as postage, consulting and professional fees, occupancy, certain information technology-related costs, insurance, marketing, and other operating expenses. | |||||||||||||||||||||||||||
| Intersegment expenses | 3 | Represents servicing costs paid to the LSS operating segment. | |||||||||||||||||||||||||||
| Total operating expenses | 2,036 | ||||||||||||||||||||||||||||
| Loss before income taxes | (1,254) | ||||||||||||||||||||||||||||
| Income tax benefit | 286 | Represents income tax benefit at an effective tax rate of 22.8%. | |||||||||||||||||||||||||||
| Net loss | $ | (968) | |||||||||||||||||||||||||||
47
LIQUIDITY AND CAPITAL RESOURCES
The Company’s Loan Servicing and Systems, and ServicingEducation Technology, Services, and Tuition Payment Processing and Campus Commerce operating segments are non-capital intensive and both produce positive operating cash flows. As such, a minimal amount of debt and equity capital is allocated to these segments and any liquidity or capital needs are satisfied using cash flow from operations. Therefore, the following Liquidity and Capital Resources discussion is concentrated on the Company’s liquidity and capital needs to meet existing debt obligations in the Asset Generation and Management operating segment and capital needs to expand Allo's communications network in the Company's Communications operating segment.
Sources of Liquidity and Available Capacity
The Company has historically generated positive cash flow from operations. For the nine months ended September 30, 2017 and the year ended December 31, 2016,2020 and the Company'sthree months ended March 31, 2021, the Company’s net cash provided fromby operating activities was $230.3$212.8 million and $325.3$48.7 million, respectively.
As of September 30, 2017,March 31, 2021, the Company had cash and cash equivalents of $254.4$144.2 million. The Company also had a portfolio of available-for-sale investments, consisting primarily of student loan asset-backed securities (classified as available-for-sale) with a fair value of $75.4$379.2 million as of September 30, 2017.March 31, 2021. The Company invests excess cash in student loan asset-backed securities, and the cash proceeds from the sale of these securities could be used for operating and/or other investing opportunities.
Cash and investments held by Nelnet Bank are generally not available for Company activities outside of Nelnet Bank. Excluding Nelnet Bank, cash and cash equivalents and the fair value of student-loan asset backed securities as of March 31, 2021 was $120.5 million and $187.9 million, respectively. As of March 31, 2021, the Company had participated $113.5 million of its student-loan asset backed securities, and such participation is reflected as debt on the Company's consolidated balance sheet.
The Company also has a $350.0$455.0 million unsecured line of credit that matures on December 12, 2021.16, 2024. As of September 30, 2017,March 31, 2021, there was $210.0 millionno amount outstanding on the unsecured line of credit and $140.0$455.0 million was available for future use.
The line of credit provides that the Company may increase the aggregate financing commitments, through the existing lenders and/or through new lenders, up to a total of $550.0 million, subject to certain conditions. In addition, the Company has a $22.0 million secured line of credit agreement that matures on May 30, 2022. As of March 31, 2021, the secured line of credit had $5.0 million outstanding and $17.0 million was available for future use.
In addition, the Company has retained certain of its own asset-backed securities upon their initial issuance or repurchased certain of its own asset-backed securities (bonds and notes payable) in the secondary market. For accounting purposes, these notes are eliminated in consolidation and are not included in the Company's consolidated financial statements. However, these securities remain legally outstanding at the trust level and the Company could sell these notes to third parties or redeem the notes at par as cash is generated by the trust estate. Upon a sale of these notes to third parties, the Company would obtain cash proceeds equal to the market value of the notes on the date of such sale. As of September 30, 2017,March 31, 2021, the Company holds $81.1$24.3 million (par value) of its own asset-backed securities.
The Company intends to use its liquidity position to capitalize on market opportunities, including FFELP, private education, and consumer loan acquisitions;acquisitions (or investment interests therein); strategic acquisitions and investments; expansion of Allo's telecommunications network; and capital management initiatives, including stock repurchases, debt repurchases, and dividend distributions. The timing and size of these opportunities will vary and will have a direct impact on the Company's cash and investment balances.
Cash Flows
During the ninethree months ended September 30, 2017,March 31, 2021, the Company generated $230.3$48.7 million fromin operating activities, compared to $258.8using $144.5 million for the same period in 2016.2020. The decreaseincrease in such cash provided byflows from operating activities reflects the decreasewas due to:
•The increase in net income, changes in the adjustmentsincome;
•Adjustments to net income from derivative market value adjustments andfor the impact of gains from the sale of loans during the three months ended March 31, 2020 and the non-cash change in deferred income taxes;
•Proceeds from the Company's clearinghouse for margin payments on derivatives for the three months ended March 31, 2021 compared to payments to the clearinghouse in 2020; and
•The impact of changes in accounts receivableto the due to customers liability account, other liabilities, and accrued interest payablereceivable during the ninethree months ended September 30, 2017March 31, 2021 as compared to the same period in 2016. 2020.
These factors were partially offset by an increase in theby:
•The adjustments to net income for depreciation and amortization, changes in adjustmentsderivative market value adjustments;
48
•Adjustments to net income for foreign currency transaction adjustments, the impact of the non-cash provision for loan losses, beneficial interests, and impairment charges; and
•The impact of changes to accounts receivable, other assets, and accrued interest payable during the three months ended March 31, 2021 as compared to the same period in other liabilities, and net proceeds received in 2017 from the Company's clearinghouse to settle variation margin.
2020.
The primary items included in the statement of cash flows for investing activities are the purchase and repayment of student loans. The primary items included in financing activities are the proceeds from the issuance of and payments on bonds and notes payable used to fund student loans. Cash provided by investing activities for the nine months ended September 30, 2017 and 2016 was $2.5 billion and $2.7 billion, respectively. Cash used in financing activities was $2.6 billion and $2.9 billion for the ninethree months ended September 30, 2017March 31, 2021 was $468.4 million and 2016,$528.1 million, respectively. Cash provided by investing activities and used in financing activities for the three months ended March 31, 2020 was $105.7 million and $83.5 million, respectively. Investing and financing activities are further addressed in the discussion that follows.
Liquidity Needs and Sources of Liquidity Available to Satisfy Debt Obligations Secured by Student Loan Assets and Related Collateral
The following table shows the Company's debt obligations outstanding that are secured by student loan assets and related collateral.
| As of March 31, 2021 | |||||||||||
| Carrying amount | Final maturity | ||||||||||
| Bonds and notes issued in asset-backed securitizations | $ | 18,459,431 | 5/27/25 - 10/25/68 | ||||||||
| FFELP and private education loan warehouse facilities | 405,215 | 5/20/22 - 2/26/24 | |||||||||
| $ | 18,864,646 | ||||||||||
| As of September 30, 2017 | |||||
Carrying amount | Final maturity | ||||
| Bonds and notes issued in asset-backed securitizations | $ | 21,632,934 | 8/25/21 - 9/25/65 | ||
| FFELP warehouse facilities | 745,107 | 11/19/19 - 4/27/20 | |||
| $ | 22,378,041 | ||||
Bonds and Notes Issued in Asset-backed Securitizations
The majority of the Company’s portfolio of student loans is funded in asset-backed securitizations that are structured to substantially match the maturity of the funded assets, thereby minimizing liquidity risk. Cash generated from student loans funded in asset-backed securitizations provide the sources of liquidity to satisfy all obligations related to the outstanding bonds and notes issued in such securitizations. In addition, due to (i) the difference between the yield the Company receives on the loans and cost of financing within these transactions, and (ii) the servicing and administration fees the Company earns from these transactions, the Company has created a portfolio that will generate earnings and significant cash flow over the life of these transactions.
As of September 30, 2017,March 31, 2021, based on cash flow models developed to reflect management’s current estimate of, among other factors, prepayments, defaults, deferment, forbearance, and interest rates, the Company currently expects future undiscounted cash flows from its portfolio to be approximately $1.93$2.17 billion as detailed below. The $1.93 billion includes approximately $821.9 million (as of September 30, 2017) of overcollateralization included in the asset-backed securitizations. These excess net asset positions are reflected variously in the following balances in the consolidated balance sheet: "student loans receivable," "restricted cash," and "accrued interest receivable."
The forecasted cash flow presented below includes all loans funded in asset-backed securitizations as of September 30, 2017.March 31, 2021. As of September 30, 2017,March 31, 2021, the Company had $21.9$18.4 billion of loans included in asset-backed securitizations, which represented 96.596.8 percent of its total FFELP and private education student loan portfolio. The forecasted cash flow does not include cash flows that the Company expects to receive related to loans funded in its warehouse facilities as of September 30, 2017,March 31, 2021, private education and consumer loans funded with operating cash, on the balance sheet, and loans acquired subsequent to September 30, 2017.March 31, 2021, and loans owned by Nelnet Bank.
49
Asset-backed Securitization Cash Flow Forecast
$1.932.17 billion
(dollars in millions)
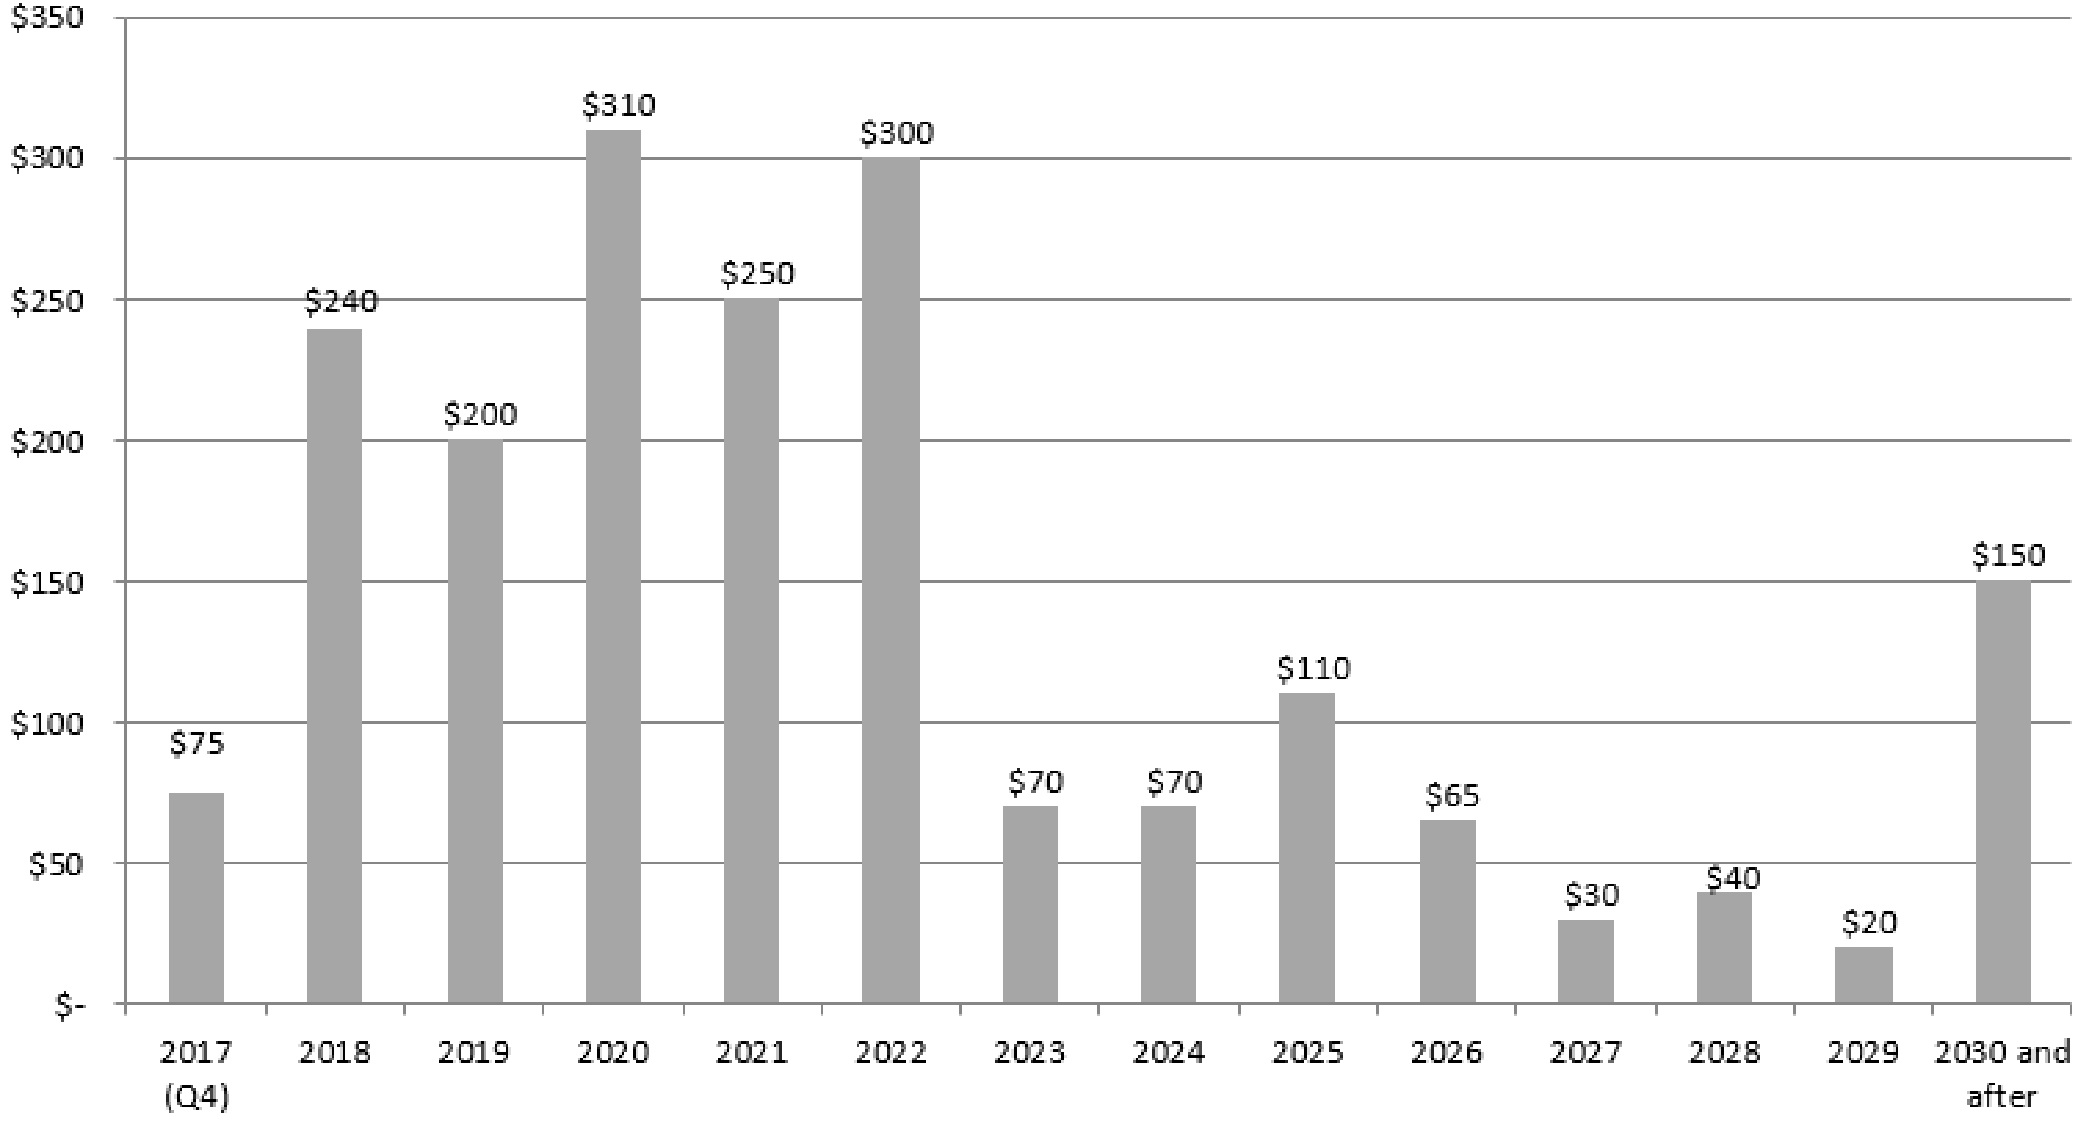
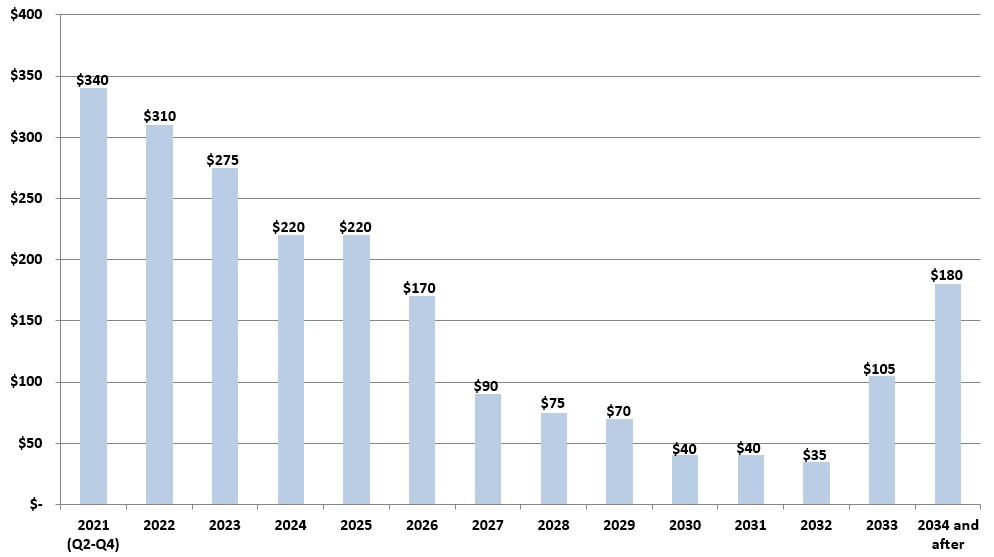
The forecasted future undiscounted cash flows of approximately $2.17 billion include approximately $1.19 billion (as of March 31, 2021) of overcollateralization included in the asset-backed securitizations. These excess net asset positions are included in the consolidated balance sheets and included in the balances of "loans and accrued interest receivable" and "restricted cash." The difference between the total estimated future undiscounted cash flows and the overcollateralization of approximately $0.98 billion, or approximately $0.74 billion after income taxes based on the estimated effective tax rate, is expected to be accretive to the Company's March 31, 2021 balance of consolidated shareholders' equity.
The Company uses various assumptions, including prepayments and future interest rates, when preparing its cash flow forecast. These assumptions are further discussed below.
Prepayments: The primary variable in establishing a life of loan estimate is the level and timing of prepayments. Prepayment rates equal the amount of loans that prepay annually as a percentage of the beginning of period balance, net of scheduled principal payments. A number of factors can affect estimated prepayment rates, including the level of consolidation activity, borrower default rates, and utilization of debt management options such as income-based repayment, deferments, and forbearance. Should any of these factors change, management may revise its assumptions, which in turn would impact the projected future cash flow. The Company’s cash flow forecast above assumes prepayment rates that are generally consistent with those utilized in the Company’s recent asset-backed securitization transactions. If management used a prepayment rate assumption two times greater than what was used to forecast the cash flow, the cash flow forecast would be reduced by approximately $220$140 million to $250$175 million.
Interest rates: The Company funds a majoritylarge portion of its student loans with three-month LIBOR indexed floating rate securities. Meanwhile, the interest earned on the Company’s student loan assets is indexed primarily to a one-month LIBOR rate. The different interest rate characteristics of the Company’s loan assets and liabilities funding these assets result in basis risk. The Company’s cash flow forecast assumes three-month LIBOR will exceed one-month LIBOR by 12 basis points for the life of the portfolio, which approximates the historical relationship between these indices. If the forecast is computed assuming a spread of 24 basis points between three-month and one-month LIBOR for the life of the portfolio, the cash flow forecast would be reduced by approximately $95$45 million to $115$70 million. As the percentage of the Company's outstanding debt financed by three-month LIBOR declines, the Company's basis risk will be reduced.
LIBOR is in the process of being discontinued as a benchmark rate, and any market transition away from the current LIBOR framework could result in significant changes to the forecasted cash flows from the Company's asset-backed securitizations. See "Interest Rate Risk - Replacement of LIBOR as a Benchmark Rate" above and Item 1A, "Risk Factors - Loan Portfolio -
50
Interest rate risk - replacement of LIBOR as a benchmark rate" in the Company's 2020 Annual Report for additional information.
The Company uses the current forward interest rate yield curve to forecast cash flows. A change in the forward interest rate curve would impact the future cash flows generated from the portfolio. An increase in future interest rates will reduce the amount of fixed rate floor income the Company is currently receiving. The Company attempts to mitigate the impact of a rise in short-term rates by hedging interest rate risks. The forecasted cash flow does not include cash flows the Company expects to pay/receive related to derivative instruments used by the Company to manage interest rate risk. See Item 3, "Quantitative and Qualitative Disclosures About Market Risk — Interest Rate Risk."
The Company funds a portion of its FFELP loan acquisitions using its FFELP warehouse facilities. Student loan warehousing allows the Company to buy and manage student loans prior to transferring them into more permanent financing arrangements. As of September 30, 2017,March 31, 2021, the Company had threetwo FFELP warehouse facilities with an aggregate maximum financing amount available
of $1.2 billion,$310.0 million, of which $0.7 billion$247.0 million was outstanding and $0.5 billion$63.0 million was available for additional funding. OfOne warehouse facility has a static advance rate until the three facilities, oneexpiration date of the liquidity provisions (May 20, 2021). In the event the liquidity provisions are not extended, the valuation agent has the right to perform a one-time mark to market on the underlying loans funded in this facility, provides for formula-based advance rates, depending on FFELP loan type, upsubject to a maximumfloor. The loans would then be funded at this new advance rate until the final maturity date of the principal and interest of loans financed. The advance rates for collateral may increase or decrease based on market conditions.facility (May 20, 2022). The other two FFELP warehouse facilities havefacility has a static advance ratesrate that requirerequires initial equity for loan funding but doand does not require increased equity based on market movements. As of September 30, 2017,March 31, 2021, the Company had $28.4$20.5 million advanced as equity support on these facilities. For further discussion of the Company's FFELP warehouse facilities outstanding at September 30, 2017,March 31, 2021, see note 3 of the notes to consolidated financial statements included under Part I, Item 1 of this report.
The Company has a private education loan warehouse facility that, as of March 31, 2021, had an aggregate maximum financing amount available of $175.0 million, an advance rate of 80 to 90 percent, liquidity provisions through February 13, 2022, and a final maturity date of February 13, 2023. As of March 31, 2021, $158.2 million was outstanding under this warehouse facility, $16.8 million was available for future funding, and $17.0 million was advanced as equity support.
Upon termination or expiration of the warehouse facilities, the Company would expect to access the securitization market, obtain replacement warehouse facilities, use operating cash, consider the sale of assets, or transfer collateral to satisfy any remaining obligations.
The Company had a $100.0 million consumer loan warehouse facility that was terminated on March 31, 2021. The Company used operating cash to pay off the $20.7 million outstanding balance on this facility upon its termination.
Other Uses of Liquidity
In December of 2020, Wells Fargo announced the sale of its approximately $10.0 billion portfolio of private education student loans representing approximately 445,000 borrowers. In conjunction with the sale, the Company was selected as servicer of the portfolio. During March 2021, approximately 261,000 borrowers were converted to the Company's servicing platform, with the remaining borrowers converted in April 2021. In addition, the Company has entered into agreements to participate in a joint venture to acquire the portfolio. In total (during March and April 2021), the Company has invested approximately $70 million in the joint venture for an approximate 8 percent of the interest in the loans. In addition, the Company will serve as the sponsor and administrator for loan securitizations on behalf of the purchaser group as the loans are securitized, and provide the required level of risk retention as the loans are permanently financed.
The Company plans to fund additional FFELP student loan acquisitions and related investments using current cash and investments; using its unsecured line of credit, using its Union Bank student loan participation agreement (as described below); using its FFELPUnion Bank student loan asset-backed securities participation agreement (as described below) and/or establishing similar secured borrowing facilities; using its existing warehouse facilities (as described above); increasing the capacity under existing and/or establishing new warehouse facilities; and continuing to access the asset-backed securities market.
Union Bank Participation Agreement
The Company maintains an agreement with Union Bank, a related party, as trustee for various grantor trusts, under which Union Bank has agreed to purchase from the Company participation interests in student loans. As of September 30, 2017, $461.3 March 31, 2021, $945.8
51
million of loans were subject to outstanding participation interests held by Union Bank, as trustee, under this agreement. The agreement automatically renews annually and is terminable by either party upon five business days' notice. This agreement provides beneficiaries of Union Bank’s grantor trusts with access to investments in interests in student loans, while providing liquidity to the Company. The Company can participate loans to Union Bank to the extent of availability under the grantor trusts, up to $750.0$900.0 million or an amount in excess of $750.0$900.0 million if mutually agreed to by both parties. Loans participated under this agreement have been accounted for by the Company as loan sales. Accordingly, the participation interests sold are not included on the Company’s consolidated balance sheets.
by completing asset-backed securitizations. Depending on future rating agency actions and market conditions, the Company currently anticipates continuing to access the asset-backed securitization market. Such asset-backed securitization transactions would be used to refinance student loans included in its warehouse facilities, student loans purchased from third parties, and/or student loans in its existing asset-backed securitizations.
There were no asset-backed securitization transactions completed during the first three months of 2021.
Liquidity Impact Related to Nelnet Bank
On November 2, 2020, the Company obtained final approval for federal deposit insurance from the FDIC and for a bank charter from the UDFI in connection with the establishment of Nelnet Bank, and Nelnet Bank launched operations. Nelnet Bank was funded by the Company with an initial capital contribution of $100.0 million, consisting of $55.9 million of cash and $44.1 million of student loan asset-backed securities. In addition, the Company made a pledged deposit of $40.0 million with Nelnet Bank, as required under an agreement with the FDIC discussed below.
Prior to FDIC approval, Nelnet Bank, Nelnet, Inc. (the parent), and Michael S. Dunlap (Nelnet, Inc.’s controlling shareholder) entered into a Capital and Liquidity Maintenance Agreement and a Parent Company Agreement with the FDIC in connection with Nelnet, Inc.’s role as a source of financial strength for Nelnet Bank. As part of the Capital and Liquidity Maintenance Agreement, Nelnet, Inc. is obligated to (i) contribute capital to Nelnet Bank for it to maintain capital levels that meet FDIC requirements for a “well capitalized” bank, including a leverage ratio of capital to total assets of at least 12 percent; (ii) provide and maintain an irrevocable asset liquidity takeout commitment for the benefit of Nelnet Bank in an amount equal to the greater of either 10 percent of Nelnet Bank’s total assets or such additional amount as agreed to by Nelnet Bank and Nelnet, Inc.; (iii) provide additional liquidity to Nelnet Bank in such amount and duration as may be necessary for Nelnet Bank to meet its ongoing liquidity obligations; and (iv) establish and maintain a pledged deposit of $40.0 million with Nelnet Bank.
Based on the current business plan for Nelnet Bank and its strong financial condition after the first few months of operations, the Company currently believes that the initial capital contribution of $100.0 million and pledged deposit of $40.0 million should provide sufficient capital and liquidity to Nelnet Bank for the next two to three years.
Liquidity Impact Related to ALLO Communications LLC
As previously disclosed, on October 1, 2020, the Company entered into various agreements with SDC, a third party global digital infrastructure investor, and ALLO, for various transactions contemplated by the parties in connection with a recapitalization and additional funding for ALLO. After completion of the initial transactions subject to these agreements, SDC, the Company, and members of ALLO's management own approximately 48 percent, 45 percent, and 7 percent, respectively, of the outstanding voting membership interests of ALLO, and upon the receipt of regulatory approvals for the transactions on December 21, 2020 the Company deconsolidated ALLO from the Company's consolidated financial statements. In addition, on January 19, 2021, ALLO closed on certain private debt financing facilities from unrelated third-party lenders providing for aggregate financing of up to $230.0 million. With proceeds from this transaction, ALLO redeemed a portion of its non-voting preferred membership interests held by the Company in exchange for an aggregate redemption price payment to the Company of $100.0 million.
The agreements among the Company, SDC, and ALLO provide that they will use commercially reasonable efforts (which expressly excludes requiring ALLO to raise any additional equity financing or sell any assets) to cause ALLO to redeem, on or before April 2024, the remaining non-voting preferred membership interests of ALLO held by the Company, plus the amount of accrued and unpaid preferred return on such interests. As of March 31, 2021, the outstanding preferred membership interests and accrued and unpaid preferred return of ALLO held by the Company was $131.2 million. The non-voting preferred membership interests earn a preferred annual return of 6.25 percent.
If ALLO needs additional capital to support its growth in existing or new markets, the Company has the option to contribute additional capital to maintain its voting equity interest. However, ALLO has obtained third-party debt financing to support its
52
current growth plans, and thus the Company currently believes additional equity contributions to ALLO are not likely in the immediate future.
Liquidity Impact Related to Hedging Activities
The Company utilizes derivative instruments to manage interest rate sensitivity. By using derivative instruments, the Company is exposed to market risk which could impact its liquidity. Based on the derivative portfolio outstanding as of September 30, 2017,March 31, 2021, the Company does not currently anticipate any movement in interest rates having a material impact on its capital or liquidity profile, nor does the Company expect that any movement in interest rates would have a material impact on its ability to meet potential collateral deposits with its counterparties and/ormake variation margin payments withto its third-party clearinghouse. However, if interest rates move materially and negatively impact the fair value of the Company's derivative portfolio, the replacement of LIBOR as a benchmark rate has significant adverse impacts on the Company's derivatives, or if the Company enters into additional derivatives for which the fair value becomes negative, the Company could be required to deposit additional collateral with its derivative instrument counterparties and/or pay additionalmake variation margin payments to aits third-party clearinghouse. Derivative contracts executed through a clearinghouse require daily movement of variation margin to be exchanged based on the net fair value of the contracts. The collateral deposits or variation margin, if significant, could negatively impact the Company's liquidity and capital resources. In addition, clearing rules require the Company to post amounts of liquid collateral when executing new derivative instruments, which could prevent or limit the Company from utilizing additional derivative instruments to manage interest rate sensitivity and risks. See note 4 of the notes to consolidated financial statements included under Part I, Item 1 of this report for additional information on the Company's derivative portfolio.
Other Debt Facilities
As discussed above, the Company has a $350.0$455.0 million unsecured line of credit with a maturity date of December 12, 2021.16, 2024. As of September 30, 2017,March 31, 2021, the unsecured line of credit had $210.0 millionno amount outstanding and $140.0$455.0 million was available for future use. The Company also has a $22.0 million secured line of credit agreement with a maturity date of May 30, 2022. As of March 31, 2021, the secured line of credit had $5.0 million outstanding with $17.0 million available for future use. The line of credit is secured by several Company-owned properties. Upon the maturity date in 2021,of these facilities, there can be no assurance that the Company will be able to maintain this linethese lines of credit, increase the amount outstanding under the line,lines, or find alternative funding if necessary.
sale of assets, or transfer collateral to satisfy any remaining obligations.
Stock Repurchases
The Board of Directors has authorized a stock repurchase program to repurchase up to a total of five million shares of the Company's Class A common stock during the three-year period ending May 25, 2019.7, 2022. As of March 31, 2021, 3,246,732 shares remained authorized for repurchase under the Company's stock repurchase program. Shares may be repurchased from time to time depending on various factors, including share prices and other potential uses of liquidity.
Shares repurchased by the Company during the three months ended March 31, 2017, June 30, 2017 and September 30, 20172021 are shown below. CertainSuch shares were repurchased from employees to satisfy tax withholding obligations upon the vesting of these repurchases were made pursuant to a trading plan adopted byrestricted stock, and not as part of the Company in accordance with Rule 10b5-1 under the Securities Exchange Act of 1934. For additional information on stock repurchases during the third quarter of 2017, see "Stock Repurchases" under Part II, Item 2 of this report.
| Total shares repurchased | Purchase price (in thousands) | Average price of shares repurchased (per share) | |||||||
| Quarter ended March 31, 2017 | 31,716 | $ | 1,369 | 43.18 | |||||
| Quarter ended June 30, 2017 | 384,061 | 16,826 | 43.81 | ||||||
| Quarter ended September 30, 2017 | 947,794 | 45,136 | 47.62 | ||||||
| Total | 1,363,571 | $ | 63,331 | 46.44 | |||||
| Total shares repurchased | Purchase price (in thousands) | Average price of shares repurchased (per share) | |||||||||||||||
| Quarter ended March 31, 2021 | 26,199 | $ | 2,009 | 76.70 | |||||||||||||
Dividends
On SeptemberMarch 15, 2017,2021, the Company paid a thirdfirst quarter 20172021 cash dividend on the Company's Class A and Class B common stock of $0.14$0.22 per share. In addition, the Company's Board of Directors has declared a fourthsecond quarter 20172021 cash dividend on the Company's outstanding shares of Class A and Class B common stock of $0.16$0.22 per share. The fourthsecond quarter cash dividend will be paid on December 15, 2017June 14, 2021 to shareholders of record at the close of business on December 1, 2017.
May 31, 2021.
The Company currently plans to continue making regular quarterly dividend payments, subject to future earnings, capital requirements, financial condition, and other factors. In addition, the payment of dividends is subject to the terms of the Company’s outstanding Hybrid Securities, which generally provide that if the Company defers interest payments on those securities it cannot pay dividends on its capital stock.
53
ITEM 3. QUANTITATIVE AND QUALITATIVE DISCLOSURES ABOUT MARKET RISK
(All dollars are in thousands, except share amounts, unless otherwise noted)
Interest Rate Risk
The Company’s primary market risk exposure arises from fluctuations in its borrowing and lending rates, the spread between which could impact the Company due to shifts in market interest rates.
The following table sets forth the Company’s loan assets and debt instruments by rate characteristics:
| As of September 30, 2017 | As of December 31, 2016 | As of March 31, 2021 | As of December 31, 2020 | |||||||||||||||||||||||||||||||||
| Dollars | Percent | Dollars | Percent | Dollars | Percent | Dollars | Percent | |||||||||||||||||||||||||||||
| Fixed-rate loan assets | $ | 5,334,565 | 23.5 | % | $ | 8,585,283 | 34.2 | % | Fixed-rate loan assets | $ | 8,470,975 | 44.3 | % | $ | 8,737,346 | 44.6 | % | |||||||||||||||||||
| Variable-rate loan assets | 17,379,348 | 76.5 | 16,518,360 | 65.8 | Variable-rate loan assets | 10,638,479 | 55.7 | 10,839,305 | 55.4 | |||||||||||||||||||||||||||
| Total | $ | 22,713,913 | 100.0 | % | $ | 25,103,643 | 100.0 | % | Total | $ | 19,109,454 | 100.0 | % | $ | 19,576,651 | 100.0 | % | |||||||||||||||||||
| Fixed-rate debt instruments | $ | 109,251 | 0.5 | % | $ | 131,733 | 0.5 | % | Fixed-rate debt instruments | $ | 951,143 | 5.0 | % | $ | 960,327 | 4.9 | % | |||||||||||||||||||
| Variable-rate debt instruments | 22,517,671 | 99.5 | 24,968,687 | 99.5 | Variable-rate debt instruments | 18,032,040 | 95.0 | 18,598,522 | 95.1 | |||||||||||||||||||||||||||
| Total | $ | 22,626,922 | 100.0 | % | $ | 25,100,420 | 100.0 | % | Total | $ | 18,983,183 | 100.0 | % | $ | 19,558,849 | 100.0 | % | |||||||||||||||||||
FFELP loans originated prior to April 1, 2006 generally earn interest at the higher of the borrower rate, which is fixed over a period of time, or a floating rate based on the special allowance payment ("SAP") formula set by the Department. The SAP rate is based on an applicable index plus a fixed spread that depends on loan type, origination date, and repayment status. The Company generally finances its FFELP student loan portfolio with variable rate debt. In low and/or declining interest rate environments, when the fixed borrower rate is higher than the SAP rate, the Company’s FFELP student loans earn at a fixed rate while the interest on the variable rate debt typically continues to reflect the low and/or declining interest rates. In these interest rate environments, the Company may earn additional spread income that it refers to as floor income.
Depending on the type of loan and when it was originated, the borrower rate is either fixed to term or is reset to an annual rate each July 1. As a result, for loans where the borrower rate is fixed to term, the Company may earn floor income for an extended period of time, which the Company refers to as fixed rate floor income, and for those loans where the borrower rate is reset annually on July 1, the Company may earn floor income to the next reset date, which the Company refers to as variable rate floor income. All FFELP loans first originated on or after April 1, 2006 effectively earn at the SAP rate, since lenders are required to rebate fixed rate floor income and variable rate floor income for those loans to the Department.
A summary of fixed rate floor income earned by the Company follows.
| Three months ended March 31, | |||||||||||||||||||||||
| 2021 | 2020 | ||||||||||||||||||||||
| Fixed rate floor income, gross | $ | 35,539 | 18,758 | ||||||||||||||||||||
| Derivative settlements (a) | (4,285) | 2,125 | |||||||||||||||||||||
| Fixed rate floor income, net | $ | 31,254 | 20,883 | ||||||||||||||||||||
| Three months ended September 30, | Nine months ended September 30, | |||||||||||
| 2017 | 2016 | 2017 | 2016 | |||||||||
| Fixed rate floor income, gross | $ | 24,586 | 41,509 | 84,382 | 131,720 | |||||||
| Derivative settlements (a) | 3,883 | (5,157 | ) | 5,877 | (15,241 | ) | ||||||
| Fixed rate floor income, net | $ | 28,469 | 36,352 | 90,259 | 116,479 | |||||||
Gross fixed rate floor income decreasedincreased for the three and nine months ended September 30, 2017March 31, 2021 as compared to the same periodsperiod in 20162020 due to an increaselower interest rates in interest rates.
2021 as compared to 2020.
Absent the use of derivative instruments, a rise in interest rates maywill reduce the amount of floor income received and this may havehas an impact on earnings due to interest margin compression caused by increasing financing costs, until such time as the federally insured loans earn interest at a variable rate in accordance with their special allowance paymentSAP formulas. In higher interest rate environments, where the interest rate rises above the borrower rate and fixed rate loans effectively become variable rate loans, the impact of the rate fluctuations is reduced.
The change from being in a net positive settlement position on such derivatives during the first quarter of 2020 to being in a net negative settlement position during the first quarter of 2021 was due to a decrease in interest rates.
54
The following graph depicts fixed rate floor income for a borrower with a fixed rate of 6.75% and a SAP rate of 2.64%.:

The following table shows the Company’s federally insured student loan assets that were earning fixed rate floor income as of September 30, 2017.March 31, 2021.
| Fixed interest rate range | Borrower/lender weighted average yield | Estimated variable conversion rate (a) | Loan balance | |||||||||||||||||
| < 3.0% | 2.88% | 0.24% | $ | 1,148,014 | ||||||||||||||||
| 3.0 - 3.49% | 3.19% | 0.55% | 1,457,170 | |||||||||||||||||
| 3.5 - 3.99% | 3.65% | 1.01% | 1,399,853 | |||||||||||||||||
| 4.0 - 4.49% | 4.20% | 1.56% | 1,048,179 | |||||||||||||||||
| 4.5 - 4.99% | 4.71% | 2.07% | 652,729 | |||||||||||||||||
| 5.0 - 5.49% | 5.22% | 2.58% | 435,515 | |||||||||||||||||
| 5.5 - 5.99% | 5.67% | 3.03% | 292,332 | |||||||||||||||||
| 6.0 - 6.49% | 6.19% | 3.55% | 335,607 | |||||||||||||||||
| 6.5 - 6.99% | 6.70% | 4.06% | 328,879 | |||||||||||||||||
| 7.0 - 7.49% | 7.17% | 4.53% | 121,487 | |||||||||||||||||
| 7.5 - 7.99% | 7.71% | 5.07% | 221,019 | |||||||||||||||||
| 8.0 - 8.99% | 8.18% | 5.54% | 525,096 | |||||||||||||||||
| > 9.0% | 9.05% | 6.41% | 198,084 | |||||||||||||||||
| $ | 8,163,964 | |||||||||||||||||||
(a) The estimated variable conversion rate is the estimated short-term interest rate at which loans would convert to a variable rate. As of March 31, 2021, the weighted average estimated variable conversion rate was 1.94% and the short-term interest rate was 12 basis points.
55
| Fixed interest rate range | Borrower/lender weighted average yield | Estimated variable conversion rate (a) | Loan balance | |||||||
| 3.5 - 3.99% | 3.92 | % | 1.28 | % | $ | 1,090 | ||||
| 4.0 - 4.49% | 4.20 | % | 1.56 | % | 1,408,663 | |||||
| 4.5 - 4.99% | 4.71 | % | 2.07 | % | 851,229 | |||||
| 5.0 - 5.49% | 5.22 | % | 2.58 | % | 539,482 | |||||
| 5.5 - 5.99% | 5.67 | % | 3.03 | % | 379,443 | |||||
| 6.0 - 6.49% | 6.19 | % | 3.55 | % | 437,761 | |||||
| 6.5 - 6.99% | 6.70 | % | 4.06 | % | 421,737 | |||||
| 7.0 - 7.49% | 7.17 | % | 4.53 | % | 150,722 | |||||
| 7.5 - 7.99% | 7.71 | % | 5.07 | % | 252,994 | |||||
| 8.0 - 8.99% | 8.18 | % | 5.54 | % | 584,749 | |||||
| > 9.0% | 9.05 | % | 6.41 | % | 202,455 | |||||
| $ | 5,230,325 | |||||||||
The following table summarizes the outstanding derivative instruments as of September 30, 2017March 31, 2021 used by the Company to economically hedge loans earning fixed rate floor income.
| Maturity | Notional amount | Weighted average fixed rate paid by the Company (a) | ||||||||||||
| 2021 | $ | 600,000 | 2.15 | % | ||||||||||
| 2022 (b) | 500,000 | 0.94 | ||||||||||||
| 2023 | 900,000 | 0.62 | ||||||||||||
| 2024 (c) | 2,500,000 | 0.35 | ||||||||||||
| 2025 | 500,000 | 0.35 | ||||||||||||
| $ | 5,000,000 | 0.67 | % | |||||||||||
| Maturity | Notional amount | Weighted average fixed rate paid by the Company (a) | |||||
| 2018 | $ | 1,350,000 | 1.07 | % | |||
| 2019 | 3,250,000 | 0.97 | |||||
| 2020 | 1,500,000 | 1.01 | |||||
| 2025 | 100,000 | 2.32 | |||||
| $ | 6,200,000 | 1.02 | % | ||||
(a) For all interest rate derivatives, |
(b) $250.0 million notional interest rate swapof these derivatives have forward effective start dates in which the Company would pay a fixed amountJune 2021.
(c) $500.0 million of 3.30% and receive discrete one-month LIBOR. If the interest rate swap option is exercised, the swap would becomethese derivatives have forward effective start dates in 2019 and mature in 2024.
June 2021.
The Company is also exposed to interest rate risk in the form of basis risk and repricing risk because the interest rate characteristics of the Company’s assets do not match the interest rate characteristics of the funding for those assets. The following table presents the Company’s FFELP student loan assets and related funding for those assets arranged by underlying indices as of September 30, 2017.March 31, 2021.
| Index | Frequency of variable resets | Assets | Funding of student loan assets | |||||||||||||||||
| 1 month LIBOR (a) | Daily | $ | 17,313,992 | — | ||||||||||||||||
| 3 month H15 financial commercial paper | Daily | 710,549 | — | |||||||||||||||||
| 3 month Treasury bill | Daily | 580,842 | — | |||||||||||||||||
| 1 month LIBOR | Monthly | — | 10,446,455 | |||||||||||||||||
| 3 month LIBOR (a) | Quarterly | — | 6,269,914 | |||||||||||||||||
| Fixed rate | — | — | 915,947 | |||||||||||||||||
| Auction-rate (b) | Varies | — | 747,075 | |||||||||||||||||
| Asset-backed commercial paper (c) | Varies | — | 247,018 | |||||||||||||||||
| Other (d) | — | 1,332,125 | 1,311,099 | |||||||||||||||||
| $ | 19,937,508 | 19,937,508 | ||||||||||||||||||
| Index | Frequency of variable resets | Assets | Funding of student loan assets | ||||||
| 1 month LIBOR (a) | Daily | $ | 20,692,662 | — | |||||
| 3 month H15 financial commercial paper | Daily | 1,146,947 | — | ||||||
| 3 month Treasury bill | Daily | 647,675 | — | ||||||
| 3 month LIBOR (a) (b) | Quarterly | — | 12,274,155 | ||||||
| 1 month LIBOR | Monthly | — | 8,550,438 | ||||||
| Auction-rate (c) | Varies | — | 781,276 | ||||||
| Asset-backed commercial paper (d) | Varies | — | 596,395 | ||||||
| Other (e) | 1,074,851 | 1,359,871 | |||||||
| $ | 23,562,135 | 23,562,135 | |||||||
(a) The Company has certain basis swaps outstanding in which the Company receives three-month LIBOR and pays one-month LIBOR plus or minus a spread as defined in the agreements (the "1:3 Basis Swaps"). The Company entered into these derivative instruments to better match the interest rate characteristics on its student loan assets and the debt funding such assets. The following table summarizes the 1:3 Basis Swaps outstanding as of March 31, 2021.
| Maturity | Notional amount | |||
| 2018 | $ | 4,000,000 | ||
| 2019 | 3,000,000 | |||
| 2024 | 250,000 | |||
| 2026 | 1,150,000 | |||
| 2027 | 375,000 | |||
| 2028 | 325,000 | |||
| 2029 | 100,000 | |||
| 2031 | 300,000 | |||
| $ | 9,500,000 | |||
| Maturity | Notional amount (i) | |||||||
| 2021 | $ | 250,000 | ||||||
| 2022 | 2,000,000 | |||||||
| 2023 | 750,000 | |||||||
| 2024 | 1,750,000 | |||||||
| 2026 | 1,150,000 | |||||||
| 2027 | 250,000 | |||||||
| $ | 6,150,000 | |||||||
(i) The weighted average rate paid by the Company on the 1:3 Basis Swaps as of September 30, 2017March 31, 2021 was one-month LIBOR plus 13.49.1 basis points.
(b) As of March 31, 2021, the Company was sponsor for $747.1 million of outstanding asset-backed securities that were set and provide for interest rates to be periodically reset via a "dutch auction" (“Auction Rate Securities”). Since the auction feature has essentially been inoperable for substantially all auction rate securities since 2008, the Auction Rate Securities generally pay interest to the holder at a maximum rate as defined by the indenture. While these rates will vary, they will generally be based on a spread to LIBOR or Treasury Securities, or the Net Loan Rate as defined in the financing documents.
(c) The interest rates on the Company's warehouse facilities are indexed to asset-backed commercial paper rates.
| (d) Assets include accrued interest receivable and restricted cash. Funding represents overcollateralization (equity) and other liabilities included in FFELP asset-backed securitizations and warehouse facilities. |
LIBOR is in the process of being discontinued as a benchmark rate, and any market transition away from the current LIBOR framework could result in significant changes to the interest rate characteristics of the Company's LIBOR-indexed assets and funding for those assets. See "Interest Rate Risk - Replacement of LIBOR as a Benchmark Rate" under Item 2 above and Item 1A, "Risk Factors - Loan Portfolio - Interest rate risk - replacement of LIBOR as a benchmark rate" in the Company's 2020 Annual Report for additional information.
56
Sensitivity Analysis
The following tables summarize the effect on the Company’s earnings, based upon a sensitivity analysis performed by the Company assuming hypothetical increases in interest rates of 100 basis points and 300 basis points while funding spreads remain constant. In addition, a sensitivity analysis was performed assuming the funding index increases 10 basis points and 30 basis points while holding the asset index constant, if the funding index is different than the asset index. The sensitivity analysis was performed on the Company’s variable rate assets (including loans earning fixed rate floor income) and liabilities. The analysis includes the effects of the Company’s interest rate and basis swapsderivative instruments in existence during these periods.
| Interest rates | Asset and funding index mismatches | ||||||||||||||||||||||||||
| Change from increase of 100 basis points | Change from increase of 300 basis points | Increase of 10 basis points | Increase of 30 basis points | ||||||||||||||||||||||||
| Dollars | Percent | Dollars | Percent | Dollars | Percent | Dollars | Percent | ||||||||||||||||||||
| Three months ended September 30, 2017 | |||||||||||||||||||||||||||
| Effect on earnings: | |||||||||||||||||||||||||||
| Decrease in pre-tax net income before impact of derivative settlements | $ | (9,044 | ) | (13.1 | )% | $ | (16,828 | ) | (24.4 | )% | $ | (3,296 | ) | (4.8 | )% | $ | (9,889 | ) | (14.3 | )% | |||||||
| Impact of derivative settlements | 14,179 | 20.5 | 42,534 | 61.6 | 1,890 | 2.7 | 5,671 | 8.2 | |||||||||||||||||||
| Increase (decrease) in net income before taxes | $ | 5,135 | 7.4 | % | $ | 25,706 | 37.2 | % | $ | (1,406 | ) | (2.1 | )% | $ | (4,218 | ) | (6.1 | )% | |||||||||
| Increase (decrease) in basic and diluted earnings per share | $ | 0.08 | $ | 0.38 | $ | (0.02 | ) | $ | (0.06 | ) | |||||||||||||||||
| Three months ended September 30, 2016 | |||||||||||||||||||||||||||
| Effect on earnings: | |||||||||||||||||||||||||||
| Decrease in pre-tax net income before impact of derivative settlements | $ | (16,758 | ) | (12.6 | )% | $ | (31,121 | ) | (23.6 | )% | $ | (3,987 | ) | (3.0 | )% | $ | (11,960 | ) | (9.1 | )% | |||||||
| Impact of derivative settlements | 15,775 | 11.9 | 47,324 | 35.9 | 436 | 0.3 | 1,307 | 1.0 | |||||||||||||||||||
| Increase (decrease) in net income before taxes | $ | (983 | ) | (0.7 | )% | $ | 16,203 | 12.3 | % | $ | (3,551 | ) | (2.7 | )% | $ | (10,653 | ) | (8.1 | )% | ||||||||
| Increase (decrease) in basic and diluted earnings per share | $ | (0.01 | ) | $ | 0.24 | $ | (0.05 | ) | $ | (0.15 | ) | ||||||||||||||||
| Nine months ended September 30, 2017 | |||||||||||||||||||||||||||
| Effect on earnings: | |||||||||||||||||||||||||||
| Decrease in pre-tax net income before impact of derivative settlements | $ | (30,205 | ) | (16.2 | )% | $ | (54,221 | ) | (29.1 | )% | $ | (10,314 | ) | (5.5 | )% | $ | (30,943 | ) | (16.6 | )% | |||||||
| Impact of derivative settlements | 45,396 | 24.3 | 136,182 | 73.1 | 4,368 | 2.3 | 13,105 | 7.0 | |||||||||||||||||||
| Increase (decrease) in net income before taxes | $ | 15,191 | 8.1 | % | $ | 81,961 | 44.0 | % | $ | (5,946 | ) | (3.2 | )% | $ | (17,838 | ) | (9.6 | )% | |||||||||
| Increase (decrease) in basic and diluted earnings per share | $ | 0.23 | $ | 1.20 | $ | (0.08 | ) | $ | (0.25 | ) | |||||||||||||||||
| Nine months ended September 30, 2016 | |||||||||||||||||||||||||||
| Effect on earnings: | |||||||||||||||||||||||||||
| Decrease in pre-tax net income before impact of derivative settlements | $ | (52,798 | ) | (21.5 | )% | $ | (97,144 | ) | (39.4 | )% | $ | (12,235 | ) | (4.9 | )% | $ | (36,705 | ) | (14.9 | )% | |||||||
| Impact of derivative settlements | 45,025 | 18.3 | 135,074 | 55.0 | 2,776 | 1.1 | 8,327 | 3.4 | |||||||||||||||||||
| Increase (decrease) in net income before taxes | $ | (7,773 | ) | (3.2 | )% | $ | 37,930 | 15.6 | % | $ | (9,459 | ) | (3.8 | )% | $ | (28,378 | ) | (11.5 | )% | ||||||||
| Increase (decrease) in basic and diluted earnings per share | $ | (0.11 | ) | $ | 0.55 | $ | (0.14 | ) | $ | (0.41 | ) | ||||||||||||||||
| Interest rates | Asset and funding index mismatches | ||||||||||||||||||||||||||||||||||||||||||||||
| Change from increase of 100 basis points | Change from increase of 300 basis points | Increase of 10 basis points | Increase of 30 basis points | ||||||||||||||||||||||||||||||||||||||||||||
| Dollars | Percent | Dollars | Percent | Dollars | Percent | Dollars | Percent | ||||||||||||||||||||||||||||||||||||||||
| Three months ended March 31, 2021 | |||||||||||||||||||||||||||||||||||||||||||||||
| Effect on earnings: | |||||||||||||||||||||||||||||||||||||||||||||||
| Decrease in pre-tax net income before impact of derivative settlements | $ | (14,282) | (9.1) | % | $ | (26,218) | (16.6) | % | $ | (1,605) | (1.0) | % | $ | (4,814) | (3.1) | % | |||||||||||||||||||||||||||||||
| Impact of derivative settlements | 9,130 | 5.8 | 27,390 | 17.3 | 1,516 | 1.0 | 4,549 | 2.9 | |||||||||||||||||||||||||||||||||||||||
| Increase (decrease) in net income before taxes | $ | (5,152) | (3.3) | % | $ | 1,172 | 0.7 | % | $ | (89) | — | % | $ | (265) | (0.2) | % | |||||||||||||||||||||||||||||||
| Increase (decrease) in basic and diluted earnings per share | $ | (0.10) | $ | 0.02 | $ | — | $ | (0.01) | |||||||||||||||||||||||||||||||||||||||
| Three months ended March 31, 2020 | |||||||||||||||||||||||||||||||||||||||||||||||
| Effect on earnings: | |||||||||||||||||||||||||||||||||||||||||||||||
| Decrease in pre-tax net income before impact of derivative settlements | $ | (9,915) | (19.9) | % | $ | (16,552) | (33.2) | % | $ | (1,974) | (4.0) | % | $ | (5,924) | (11.9) | % | |||||||||||||||||||||||||||||||
| Impact of derivative settlements | 4,351 | 8.7 | 13,053 | 26.2 | 1,591 | 3.2 | 4,774 | 9.6 | |||||||||||||||||||||||||||||||||||||||
| Increase (decrease) in net income before taxes | $ | (5,564) | (11.2) | % | $ | (3,499) | (7.0) | % | $ | (383) | (0.8) | % | $ | (1,150) | (2.3) | % | |||||||||||||||||||||||||||||||
| Increase (decrease) in basic and diluted earnings per share | $ | (0.11) | $ | (0.07) | $ | (0.01) | $ | (0.02) | |||||||||||||||||||||||||||||||||||||||
Financial Statement Impact – Derivatives and Foreign Currency Transaction Adjustments
For a table summarizing the effect of derivative instruments in the consolidated statements of income,operations, including the components of "derivative market value and foreign currency transaction adjustments and derivative settlements, net" included in the consolidated statements of income,operations, see note 4 of the notes to consolidated financial statements included under Part I, Item 1 of this report.
ITEM 4. CONTROLS AND PROCEDURES
Disclosure Controls and Procedures
March 31, 2021.
Changes in Internal Control over Financial Reporting
There waswere no changechanges in the Company’s internal control over financial reporting during the Company’s last fiscal quarter ended March 31, 2021 that hashave materially affected, or isare reasonably likely to materially affect, the Company’s internal control over financial reporting.
57
PART II. OTHER INFORMATION
ITEM 1. LEGAL PROCEEDINGS
There have been no material changes from the information set forthreferred to in the Legal Proceedings section of the Company's Annual Report on Form 10-K for the year ended December 31, 20162020 under Item 3 of Part I of such Form 10-K.
ITEM 1A. RISK FACTORS
There have been no material changes from the risk factors described in the Company’s Annual Report on Form 10-K for the year ended December 31, 20162020 in response to Item 1A of Part I of such Form 10-K.
ITEM 2. UNREGISTERED SALES OF EQUITY SECURITIES AND USE OF PROCEEDS
Stock Repurchases
The following table summarizes the repurchases of Class A common stock during the thirdfirst quarter of 20172021 by the Company or any “affiliated purchaser” of the Company, as defined in Rule 10b-18(a)(3) under the Securities Exchange Act of 1934. Certain share repurchases included in
| Period | Total number of shares purchased (a) | Average price paid per share | Total number of shares purchased as part of publicly announced plans or programs (b) | Maximum number of shares that may yet be purchased under the plans or programs (b) | ||||||||||||||||||||||
| January 1 - January 31, 2021 | 18 | $ | 71.22 | — | 3,246,732 | |||||||||||||||||||||
| February 1 - February 28, 2021 | — | — | — | 3,246,732 | ||||||||||||||||||||||
| March 1 - March 31, 2021 | 26,181 | 76.70 | — | 3,246,732 | ||||||||||||||||||||||
| Total | 26,199 | $ | 76.70 | — | ||||||||||||||||||||||
(a) The total number of shares consist of shares owned and tendered by employees to satisfy tax withholding obligations upon the table belowvesting of restricted shares. Unless otherwise indicated, shares owned and tendered by employees to satisfy tax withholding obligations were made pursuantpurchased at the closing price of the Company's shares on the date of vesting.
(b) On May 8, 2019, the Company announced that its Board of Directors authorized a stock repurchase program to repurchase up to a trading plan adopted bytotal of five million shares of the Company in accordance with Rule 10b5-1 underCompany's Class A common stock during the Securities Exchange Act of 1934.
| Period | Total number of shares purchased (a) | Average price paid per share | Total number of shares purchased as part of publicly announced plans or programs (b) | Maximum number of shares that may yet be purchased under the plans or programs (b) | |||||||||
| July 1 - July 31, 2017 | 318,610 | $ | 47.83 | 318,200 | 3,875,613 | ||||||||
| August 1 - August 31, 2017 | 325,983 | 46.84 | 325,983 | 3,549,630 | |||||||||
| September 1 - September 30, 2017 | 303,201 | 48.24 | 300,750 | 3,248,880 | |||||||||
| Total | 947,794 | $ | 47.62 | 944,933 | |||||||||
three-year period ending May 7, 2022.
Working capital and dividend restrictions/limitations
The Company’s credit facilities, including its revolvingCompany's $455.0 million unsecured line of credit, which is available through December 12, 2021, impose16, 2024, imposes restrictions with respect toon the Company’spayment of dividends through covenants requiring a minimum consolidated net worth the ratioand a minimum level of the Company’s adjusted EBITDA to corporate debt interest, the amount of recourse indebtedness, the amount and nature ofunencumbered cash, cash equivalent investments, and business acquisitions, andavailable borrowing capacity under the amountline of private education loans held by the Company.credit. In addition, trust indentures and other financing agreements governing debt issued by the Company's education lending subsidiaries maygenerally have general limitations on the amounts of funds that can be transferred to the Company by its subsidiaries through cash dividends.
ITEM 6. EXHIBITS
| 10.2*+ | |||||
| 31.1* | |||||
| 31.2* | |||||
| 32** | |||||
| 101.INS* | Inline XBRL Instance Document - the instance document does not appear in the Interactive Data File because its XBRL tags are embedded within the Inline XBRL document. | ||||
58
| 101.SCH* | Inline XBRL Taxonomy Extension Schema Document | ||||
| 101.CAL* | Inline XBRL Taxonomy Extension Calculation Linkbase Document | ||||
| 101.DEF* | Inline XBRL Taxonomy Extension Definition Linkbase Document | ||||
| 101.LAB* | Inline XBRL Taxonomy Extension Label Linkbase Document | ||||
| 101.PRE* | Inline XBRL Taxonomy Extension Presentation Linkbase Document | ||||
| 104* | Cover Page Interactive Data File (formatted as Inline XBRL and contained in Exhibit 101). | ||||
| * | Filed herewith | ||||
| ** | Furnished herewith | ||||
| + | Filed herewith for purposes of providing a complete set of all amendment documents to the Second Amended and Restated Credit Agreement with U.S. Bank National Association and various Lenders signatory thereto. The Second Amended and Restated Credit Agreement and all prior amendment documents thereto have been previously filed. | ||||
59
SIGNATURES
Pursuant to the requirements of the Securities Exchange Act of 1934, the registrant has duly caused this report to be signed on its behalf by the undersigned thereunto duly authorized.
| NELNET, INC. | ||||||||||||||
| Date: | By: | /s/ JEFFREY R. NOORDHOEK | ||||||||||||
| Name: | Jeffrey R. Noordhoek | |||||||||||||
| Title: | Chief Executive Officer Principal Executive Officer | |||||||||||||
| Date: | May 10, 2021 | By: | /s/ JAMES D. KRUGER | |||||||||||
| Name: | James D. Kruger | |||||||||||||
| Title: | Chief Financial Officer Principal Financial Officer and Principal Accounting Officer | |||||||||||||
60