
| ☒ | QUARTERLY REPORT PURSUANT TO SECTION 13 OR 15(d) OF THE SECURITIES EXCHANGE ACT OF 1934 | ||||
| ☐ | TRANSITION REPORT PURSUANT TO SECTION 13 OR 15(d) OF THE SECURITIES EXCHANGE ACT OF 1934 | ||||
| Nebraska | 84-0748903 | ||||||||||
| (State or other jurisdiction of incorporation or organization) | (I.R.S. Employer Identification No.) | ||||||||||
| 121 South 13th Street, Suite 100 | |||||||||||
| Lincoln, | Nebraska | 68508 | |||||||||
| (Address of principal executive offices) | (Zip Code) | ||||||||||
| Title of each class | Trading Symbol | Name of each exchange on which registered | ||||||
| Class A Common Stock, Par Value $0.01 per Share | NNI | New York Stock Exchange | ||||||
| Item 1. | |||||||||||
| Item 2. | |||||||||||
| Item 3. | |||||||||||
| Item 4. | |||||||||||
| Item 1. | |||||||||||
| Item 1A. | |||||||||||
| Item 2. | |||||||||||
| Item 5. | Other Information | ||||||||||
| Item 6. | |||||||||||
| NELNET, INC. AND SUBSIDIARIES | NELNET, INC. AND SUBSIDIARIES | NELNET, INC. AND SUBSIDIARIES | |||||||||||||||||||||||
| CONSOLIDATED BALANCE SHEETS | CONSOLIDATED BALANCE SHEETS | CONSOLIDATED BALANCE SHEETS | |||||||||||||||||||||||
| (Dollars in thousands, except share data) | (Dollars in thousands, except share data) | (Dollars in thousands, except share data) | |||||||||||||||||||||||
| (unaudited) | (unaudited) | (unaudited) | |||||||||||||||||||||||
| As of | As of | As of | As of | ||||||||||||||||||||||
| March 31, 2023 | December 31, 2022 | March 31, 2024 | December 31, 2023 | ||||||||||||||||||||||
| Assets: | Assets: | Assets: | |||||||||||||||||||||||
Loans and accrued interest receivable (net of allowance for loan losses of $134,704 and $131,827, respectively) | $ | 14,561,108 | 15,243,889 | ||||||||||||||||||||||
Loans and accrued interest receivable (net of allowance for loan losses of $106,008 and $104,643, respectively) | |||||||||||||||||||||||||
| Cash and cash equivalents: | Cash and cash equivalents: | Cash and cash equivalents: | |||||||||||||||||||||||
| Cash and cash equivalents - not held at a related party | Cash and cash equivalents - not held at a related party | 26,539 | 24,584 | ||||||||||||||||||||||
| Cash and cash equivalents - held at a related party | Cash and cash equivalents - held at a related party | 161,035 | 93,562 | ||||||||||||||||||||||
| Total cash and cash equivalents | Total cash and cash equivalents | 187,574 | 118,146 | ||||||||||||||||||||||
| Investments and notes receivable | 1,987,570 | 2,111,917 | |||||||||||||||||||||||
| Investments and notes receivable (including investments at fair value of $1,037,637 and $988,841, respectively) | |||||||||||||||||||||||||
| Restricted cash | Restricted cash | 576,267 | 945,159 | ||||||||||||||||||||||
| Restricted cash - due to customers | Restricted cash - due to customers | 134,202 | 294,311 | ||||||||||||||||||||||
| Accounts receivable (net of allowance for doubtful accounts of $3,841 and $3,079, respectively) | 151,172 | 194,851 | |||||||||||||||||||||||
| Restricted investments | |||||||||||||||||||||||||
| Accounts receivable (net of allowance for doubtful accounts of $4,248 and $4,304, respectively) | |||||||||||||||||||||||||
| Goodwill | Goodwill | 176,902 | 176,902 | ||||||||||||||||||||||
| Intangible assets, net | Intangible assets, net | 60,788 | 63,501 | ||||||||||||||||||||||
| Property and equipment, net | Property and equipment, net | 132,628 | 122,526 | ||||||||||||||||||||||
| Other assets | Other assets | 114,398 | 102,842 | ||||||||||||||||||||||
| Total assets | |||||||||||||||||||||||||
| Total assets | |||||||||||||||||||||||||
| Total assets | Total assets | $ | 18,082,609 | 19,374,044 | |||||||||||||||||||||
| Liabilities: | Liabilities: | Liabilities: | |||||||||||||||||||||||
| Bonds and notes payable | Bonds and notes payable | $ | 13,438,416 | 14,637,195 | |||||||||||||||||||||
| Accrued interest payable | Accrued interest payable | 34,374 | 36,049 | ||||||||||||||||||||||
| Bank deposits | Bank deposits | 675,767 | 691,322 | ||||||||||||||||||||||
| Other liabilities | Other liabilities | 430,099 | 461,259 | ||||||||||||||||||||||
| Due to customers | Due to customers | 280,624 | 348,317 | ||||||||||||||||||||||
| Total liabilities | Total liabilities | 14,859,280 | 16,174,142 | ||||||||||||||||||||||
| Total liabilities | |||||||||||||||||||||||||
| Total liabilities | |||||||||||||||||||||||||
| Commitments and contingencies | Commitments and contingencies | Commitments and contingencies | |||||||||||||||||||||||
| Equity: | Equity: | ||||||||||||||||||||||||
| Nelnet, Inc. shareholders' equity: | Nelnet, Inc. shareholders' equity: | ||||||||||||||||||||||||
| Nelnet, Inc. shareholders' equity: | |||||||||||||||||||||||||
| Nelnet, Inc. shareholders' equity: | |||||||||||||||||||||||||
| Preferred stock, $0.01 par value. Authorized 50,000,000 shares; no shares issued or outstanding | Preferred stock, $0.01 par value. Authorized 50,000,000 shares; no shares issued or outstanding | — | — | ||||||||||||||||||||||
| Common stock: | Common stock: | ||||||||||||||||||||||||
Class A, $0.01 par value. Authorized 600,000,000 shares; issued and outstanding 26,623,662 shares and 26,461,651 shares, respectively | 266 | 265 | |||||||||||||||||||||||
Class B, convertible, $0.01 par value. Authorized 60,000,000 shares; issued and outstanding 10,668,460 shares | 107 | 107 | |||||||||||||||||||||||
Class A, $0.01 par value. Authorized 600,000,000 shares; issued and outstanding 26,055,314 shares and 26,400,630 shares, respectively | |||||||||||||||||||||||||
Class A, $0.01 par value. Authorized 600,000,000 shares; issued and outstanding 26,055,314 shares and 26,400,630 shares, respectively | |||||||||||||||||||||||||
Class A, $0.01 par value. Authorized 600,000,000 shares; issued and outstanding 26,055,314 shares and 26,400,630 shares, respectively | |||||||||||||||||||||||||
Class B, convertible, $0.01 par value. Authorized 60,000,000 shares; issued and outstanding 10,663,088 shares | |||||||||||||||||||||||||
| Additional paid-in capital | Additional paid-in capital | 4,639 | 1,109 | ||||||||||||||||||||||
| Retained earnings | Retained earnings | 3,251,677 | 3,234,844 | ||||||||||||||||||||||
| Accumulated other comprehensive loss, net | Accumulated other comprehensive loss, net | (27,006) | (37,366) | ||||||||||||||||||||||
| Total Nelnet, Inc. shareholders' equity | Total Nelnet, Inc. shareholders' equity | 3,229,683 | 3,198,959 | ||||||||||||||||||||||
| Noncontrolling interests | Noncontrolling interests | (6,354) | 943 | ||||||||||||||||||||||
| Total equity | Total equity | 3,223,329 | 3,199,902 | ||||||||||||||||||||||
| Total liabilities and equity | Total liabilities and equity | $ | 18,082,609 | 19,374,044 | |||||||||||||||||||||
| Supplemental information - assets and liabilities of consolidated education and other lending variable interest entities: | Supplemental information - assets and liabilities of consolidated education and other lending variable interest entities: | ||||||||||||||||||||||||
| Loans and accrued interest receivable | |||||||||||||||||||||||||
| Loans and accrued interest receivable | |||||||||||||||||||||||||
| Loans and accrued interest receivable | Loans and accrued interest receivable | $ | 13,911,681 | 14,585,491 | |||||||||||||||||||||
| Restricted cash | Restricted cash | 540,675 | 867,961 | ||||||||||||||||||||||
| Bonds and notes payable | Bonds and notes payable | (13,222,429) | (14,233,586) | ||||||||||||||||||||||
| Bonds and notes payable | |||||||||||||||||||||||||
| Bonds and notes payable | |||||||||||||||||||||||||
| Accrued interest payable and other liabilities | Accrued interest payable and other liabilities | (140,221) | (145,309) | ||||||||||||||||||||||
| Net assets of consolidated education and other lending variable interest entities | Net assets of consolidated education and other lending variable interest entities | $ | 1,089,706 | 1,074,557 | |||||||||||||||||||||
| Net assets of consolidated education and other lending variable interest entities | |||||||||||||||||||||||||
| Net assets of consolidated education and other lending variable interest entities | |||||||||||||||||||||||||
| NELNET, INC. AND SUBSIDIARIES | ||||||||||||||||||||||||||||||||||
| NELNET, INC. AND SUBSIDIARIES | NELNET, INC. AND SUBSIDIARIES | |||||||||||||||||||||||||||||||||
| CONSOLIDATED STATEMENTS OF INCOME | CONSOLIDATED STATEMENTS OF INCOME | CONSOLIDATED STATEMENTS OF INCOME | ||||||||||||||||||||||||||||||||
| (Dollars in thousands, except share data) | (Dollars in thousands, except share data) | (Dollars in thousands, except share data) | ||||||||||||||||||||||||||||||||
| (unaudited) | (unaudited) | (unaudited) | ||||||||||||||||||||||||||||||||
| Three months ended | ||||||||||||||||||||||||||||||||||
| March 31, | ||||||||||||||||||||||||||||||||||
| 2023 | 2022 | |||||||||||||||||||||||||||||||||
| Interest income: | ||||||||||||||||||||||||||||||||||
| Interest income: | ||||||||||||||||||||||||||||||||||
| Interest income: | Interest income: | |||||||||||||||||||||||||||||||||
| Loan interest | Loan interest | $ | 225,243 | 111,377 | ||||||||||||||||||||||||||||||
| Loan interest | ||||||||||||||||||||||||||||||||||
| Loan interest | ||||||||||||||||||||||||||||||||||
| Investment interest | ||||||||||||||||||||||||||||||||||
| Investment interest | ||||||||||||||||||||||||||||||||||
| Investment interest | Investment interest | 40,725 | 13,819 | |||||||||||||||||||||||||||||||
| Total interest income | Total interest income | 265,968 | 125,196 | |||||||||||||||||||||||||||||||
| Total interest income | ||||||||||||||||||||||||||||||||||
| Total interest income | ||||||||||||||||||||||||||||||||||
| Interest expense on bonds and notes payable and bank deposits | ||||||||||||||||||||||||||||||||||
| Interest expense on bonds and notes payable and bank deposits | ||||||||||||||||||||||||||||||||||
| Interest expense on bonds and notes payable and bank deposits | Interest expense on bonds and notes payable and bank deposits | 199,449 | 48,079 | |||||||||||||||||||||||||||||||
| Net interest income | Net interest income | 66,519 | 77,117 | |||||||||||||||||||||||||||||||
| Less provision (negative provision) for loan losses | 34,275 | (435) | ||||||||||||||||||||||||||||||||
| Net interest income | ||||||||||||||||||||||||||||||||||
| Net interest income | ||||||||||||||||||||||||||||||||||
| Less provision for loan losses | ||||||||||||||||||||||||||||||||||
| Less provision for loan losses | ||||||||||||||||||||||||||||||||||
| Less provision for loan losses | ||||||||||||||||||||||||||||||||||
| Net interest income after provision for loan losses | ||||||||||||||||||||||||||||||||||
| Net interest income after provision for loan losses | ||||||||||||||||||||||||||||||||||
| Net interest income after provision for loan losses | Net interest income after provision for loan losses | 32,244 | 77,552 | |||||||||||||||||||||||||||||||
| Other income (expense): | Other income (expense): | |||||||||||||||||||||||||||||||||
| Other income (expense): | ||||||||||||||||||||||||||||||||||
| Other income (expense): | ||||||||||||||||||||||||||||||||||
| Loan servicing and systems revenue | Loan servicing and systems revenue | 139,227 | 136,368 | |||||||||||||||||||||||||||||||
| Education technology, services, and payment processing revenue | 133,603 | 112,286 | ||||||||||||||||||||||||||||||||
| Loan servicing and systems revenue | ||||||||||||||||||||||||||||||||||
| Loan servicing and systems revenue | ||||||||||||||||||||||||||||||||||
| Education technology services and payments revenue | ||||||||||||||||||||||||||||||||||
| Education technology services and payments revenue | ||||||||||||||||||||||||||||||||||
| Education technology services and payments revenue | ||||||||||||||||||||||||||||||||||
| Solar construction revenue | ||||||||||||||||||||||||||||||||||
| Solar construction revenue | ||||||||||||||||||||||||||||||||||
| Solar construction revenue | Solar construction revenue | 8,651 | — | |||||||||||||||||||||||||||||||
| Other, net | Other, net | (14,071) | 9,877 | |||||||||||||||||||||||||||||||
| Gain on sale of loans, net | 11,812 | 2,989 | ||||||||||||||||||||||||||||||||
| Other, net | ||||||||||||||||||||||||||||||||||
| Other, net | ||||||||||||||||||||||||||||||||||
| (Loss) gain on sale of loans, net | ||||||||||||||||||||||||||||||||||
| (Loss) gain on sale of loans, net | ||||||||||||||||||||||||||||||||||
| (Loss) gain on sale of loans, net | ||||||||||||||||||||||||||||||||||
| Derivative market value adjustments and derivative settlements, net | Derivative market value adjustments and derivative settlements, net | (14,074) | 142,925 | |||||||||||||||||||||||||||||||
| Total other income (expense) | 265,148 | 404,445 | ||||||||||||||||||||||||||||||||
| Derivative market value adjustments and derivative settlements, net | ||||||||||||||||||||||||||||||||||
| Derivative market value adjustments and derivative settlements, net | ||||||||||||||||||||||||||||||||||
| Total other income (expense), net | ||||||||||||||||||||||||||||||||||
| Total other income (expense), net | ||||||||||||||||||||||||||||||||||
| Total other income (expense), net | ||||||||||||||||||||||||||||||||||
| Cost of services: | Cost of services: | |||||||||||||||||||||||||||||||||
| Cost to provide education technology, services, and payment processing services | 47,704 | 35,545 | ||||||||||||||||||||||||||||||||
| Cost of services: | ||||||||||||||||||||||||||||||||||
| Cost of services: | ||||||||||||||||||||||||||||||||||
| Cost to provide education technology services and payments | ||||||||||||||||||||||||||||||||||
| Cost to provide education technology services and payments | ||||||||||||||||||||||||||||||||||
| Cost to provide education technology services and payments | ||||||||||||||||||||||||||||||||||
| Cost to provide solar construction services | ||||||||||||||||||||||||||||||||||
| Cost to provide solar construction services | ||||||||||||||||||||||||||||||||||
| Cost to provide solar construction services | Cost to provide solar construction services | 8,299 | — | |||||||||||||||||||||||||||||||
| Total cost of services | Total cost of services | 56,003 | 35,545 | |||||||||||||||||||||||||||||||
| Total cost of services | ||||||||||||||||||||||||||||||||||
| Total cost of services | ||||||||||||||||||||||||||||||||||
| Operating expenses: | ||||||||||||||||||||||||||||||||||
| Operating expenses: | ||||||||||||||||||||||||||||||||||
| Operating expenses: | Operating expenses: | |||||||||||||||||||||||||||||||||
| Salaries and benefits | Salaries and benefits | 152,710 | 149,414 | |||||||||||||||||||||||||||||||
| Salaries and benefits | ||||||||||||||||||||||||||||||||||
| Salaries and benefits | ||||||||||||||||||||||||||||||||||
| Depreciation and amortization | ||||||||||||||||||||||||||||||||||
| Depreciation and amortization | ||||||||||||||||||||||||||||||||||
| Depreciation and amortization | Depreciation and amortization | 16,627 | 16,956 | |||||||||||||||||||||||||||||||
| Other expenses | Other expenses | 40,785 | 39,499 | |||||||||||||||||||||||||||||||
| Other expenses | ||||||||||||||||||||||||||||||||||
| Other expenses | ||||||||||||||||||||||||||||||||||
| Total operating expenses | ||||||||||||||||||||||||||||||||||
| Total operating expenses | ||||||||||||||||||||||||||||||||||
| Total operating expenses | Total operating expenses | 210,122 | 205,869 | |||||||||||||||||||||||||||||||
| Income before income taxes | Income before income taxes | 31,267 | 240,583 | |||||||||||||||||||||||||||||||
| Income before income taxes | ||||||||||||||||||||||||||||||||||
| Income before income taxes | ||||||||||||||||||||||||||||||||||
| Income tax expense | ||||||||||||||||||||||||||||||||||
| Income tax expense | ||||||||||||||||||||||||||||||||||
| Income tax expense | Income tax expense | 8,250 | 55,697 | |||||||||||||||||||||||||||||||
| Net income | Net income | 23,017 | 184,886 | |||||||||||||||||||||||||||||||
| Net income | ||||||||||||||||||||||||||||||||||
| Net income | ||||||||||||||||||||||||||||||||||
| Net loss attributable to noncontrolling interests | ||||||||||||||||||||||||||||||||||
| Net loss attributable to noncontrolling interests | ||||||||||||||||||||||||||||||||||
| Net loss attributable to noncontrolling interests | Net loss attributable to noncontrolling interests | 3,470 | 1,761 | |||||||||||||||||||||||||||||||
| Net income attributable to Nelnet, Inc. | Net income attributable to Nelnet, Inc. | $ | 26,487 | 186,647 | ||||||||||||||||||||||||||||||
| Net income attributable to Nelnet, Inc. | ||||||||||||||||||||||||||||||||||
| Net income attributable to Nelnet, Inc. | ||||||||||||||||||||||||||||||||||
| Earnings per common share: | ||||||||||||||||||||||||||||||||||
| Earnings per common share: | ||||||||||||||||||||||||||||||||||
| Earnings per common share: | Earnings per common share: | |||||||||||||||||||||||||||||||||
| Net income attributable to Nelnet, Inc. shareholders - basic and diluted | Net income attributable to Nelnet, Inc. shareholders - basic and diluted | $ | 0.71 | 4.91 | ||||||||||||||||||||||||||||||
| Net income attributable to Nelnet, Inc. shareholders - basic and diluted | ||||||||||||||||||||||||||||||||||
| Net income attributable to Nelnet, Inc. shareholders - basic and diluted | ||||||||||||||||||||||||||||||||||
| Weighted average common shares outstanding - basic and diluted | Weighted average common shares outstanding - basic and diluted | 37,344,604 | 38,041,834 | |||||||||||||||||||||||||||||||
| Weighted average common shares outstanding - basic and diluted | ||||||||||||||||||||||||||||||||||
| Weighted average common shares outstanding - basic and diluted | ||||||||||||||||||||||||||||||||||
| NELNET, INC. AND SUBSIDIARIES | ||||||||||||||||||||||||||||||||||||||||||||||||||||||||||||||||||||||
| NELNET, INC. AND SUBSIDIARIES | NELNET, INC. AND SUBSIDIARIES | |||||||||||||||||||||||||||||||||||||||||||||||||||||||||||||||||||||
| CONSOLIDATED STATEMENTS OF COMPREHENSIVE INCOME | CONSOLIDATED STATEMENTS OF COMPREHENSIVE INCOME | CONSOLIDATED STATEMENTS OF COMPREHENSIVE INCOME | ||||||||||||||||||||||||||||||||||||||||||||||||||||||||||||||||||||
| (Dollars in thousands) | (Dollars in thousands) | (Dollars in thousands) | ||||||||||||||||||||||||||||||||||||||||||||||||||||||||||||||||||||
| (unaudited) | (unaudited) | (unaudited) | ||||||||||||||||||||||||||||||||||||||||||||||||||||||||||||||||||||
| Three months ended March 31, | ||||||||||||||||||||||||||||||||||||||||||||||||||||||||||||||||||||||
| 2023 | 2022 | |||||||||||||||||||||||||||||||||||||||||||||||||||||||||||||||||||||
| Three months ended March 31, | ||||||||||||||||||||||||||||||||||||||||||||||||||||||||||||||||||||||
| 2024 | ||||||||||||||||||||||||||||||||||||||||||||||||||||||||||||||||||||||
| 2024 | ||||||||||||||||||||||||||||||||||||||||||||||||||||||||||||||||||||||
| 2024 | ||||||||||||||||||||||||||||||||||||||||||||||||||||||||||||||||||||||
| Net income | Net income | $ | 23,017 | 184,886 | ||||||||||||||||||||||||||||||||||||||||||||||||||||||||||||||||||
| Other comprehensive income (loss): | ||||||||||||||||||||||||||||||||||||||||||||||||||||||||||||||||||||||
| Net income | ||||||||||||||||||||||||||||||||||||||||||||||||||||||||||||||||||||||
| Net income | ||||||||||||||||||||||||||||||||||||||||||||||||||||||||||||||||||||||
| Other comprehensive income: | ||||||||||||||||||||||||||||||||||||||||||||||||||||||||||||||||||||||
| Other comprehensive income: | ||||||||||||||||||||||||||||||||||||||||||||||||||||||||||||||||||||||
| Other comprehensive income: | ||||||||||||||||||||||||||||||||||||||||||||||||||||||||||||||||||||||
| Net changes related to foreign currency translation adjustments | ||||||||||||||||||||||||||||||||||||||||||||||||||||||||||||||||||||||
| Net changes related to foreign currency translation adjustments | ||||||||||||||||||||||||||||||||||||||||||||||||||||||||||||||||||||||
| Net changes related to foreign currency translation adjustments | Net changes related to foreign currency translation adjustments | $ | (3) | 9 | ||||||||||||||||||||||||||||||||||||||||||||||||||||||||||||||||||
| Net changes related to available-for-sale debt securities: | Net changes related to available-for-sale debt securities: | |||||||||||||||||||||||||||||||||||||||||||||||||||||||||||||||||||||
| Unrealized holding gains (losses) arising during period, net | 8,651 | (16,698) | ||||||||||||||||||||||||||||||||||||||||||||||||||||||||||||||||||||
| Reclassification of losses (gains) recognized in net income, net | 4,982 | (2,793) | ||||||||||||||||||||||||||||||||||||||||||||||||||||||||||||||||||||
| Net changes related to available-for-sale debt securities: | ||||||||||||||||||||||||||||||||||||||||||||||||||||||||||||||||||||||
| Net changes related to available-for-sale debt securities: | ||||||||||||||||||||||||||||||||||||||||||||||||||||||||||||||||||||||
| Unrealized holding gains arising during period, net of losses | ||||||||||||||||||||||||||||||||||||||||||||||||||||||||||||||||||||||
| Unrealized holding gains arising during period, net of losses | ||||||||||||||||||||||||||||||||||||||||||||||||||||||||||||||||||||||
| Unrealized holding gains arising during period, net of losses | ||||||||||||||||||||||||||||||||||||||||||||||||||||||||||||||||||||||
| Reclassification of (gains) losses recognized in net income, net | ||||||||||||||||||||||||||||||||||||||||||||||||||||||||||||||||||||||
| Reclassification of (gains) losses recognized in net income, net | ||||||||||||||||||||||||||||||||||||||||||||||||||||||||||||||||||||||
| Reclassification of (gains) losses recognized in net income, net | ||||||||||||||||||||||||||||||||||||||||||||||||||||||||||||||||||||||
| Amortization of net unrealized loss on securities transferred from available-for-sale to held-to-maturity | ||||||||||||||||||||||||||||||||||||||||||||||||||||||||||||||||||||||
| Amortization of net unrealized loss on securities transferred from available-for-sale to held-to-maturity | ||||||||||||||||||||||||||||||||||||||||||||||||||||||||||||||||||||||
| Amortization of net unrealized loss on securities transferred from available-for-sale to held-to-maturity | ||||||||||||||||||||||||||||||||||||||||||||||||||||||||||||||||||||||
| Income tax effect | ||||||||||||||||||||||||||||||||||||||||||||||||||||||||||||||||||||||
| Income tax effect | ||||||||||||||||||||||||||||||||||||||||||||||||||||||||||||||||||||||
| Income tax effect | Income tax effect | (3,272) | 10,361 | 4,678 | (14,813) | |||||||||||||||||||||||||||||||||||||||||||||||||||||||||||||||||
| Net changes related to equity method investee's other comprehensive income: | Net changes related to equity method investee's other comprehensive income: | |||||||||||||||||||||||||||||||||||||||||||||||||||||||||||||||||||||
| Gain on cash flow hedges | 2 | — | ||||||||||||||||||||||||||||||||||||||||||||||||||||||||||||||||||||
| Net changes related to equity method investee's other comprehensive income: | ||||||||||||||||||||||||||||||||||||||||||||||||||||||||||||||||||||||
| Net changes related to equity method investee's other comprehensive income: | ||||||||||||||||||||||||||||||||||||||||||||||||||||||||||||||||||||||
| (Loss) gain on cash flow hedge | ||||||||||||||||||||||||||||||||||||||||||||||||||||||||||||||||||||||
| (Loss) gain on cash flow hedge | ||||||||||||||||||||||||||||||||||||||||||||||||||||||||||||||||||||||
| (Loss) gain on cash flow hedge | ||||||||||||||||||||||||||||||||||||||||||||||||||||||||||||||||||||||
| Income tax effect | Income tax effect | — | 2 | — | — | |||||||||||||||||||||||||||||||||||||||||||||||||||||||||||||||||
| Other comprehensive income (loss) | 10,360 | (14,804) | ||||||||||||||||||||||||||||||||||||||||||||||||||||||||||||||||||||
| Income tax effect | ||||||||||||||||||||||||||||||||||||||||||||||||||||||||||||||||||||||
| Income tax effect | ||||||||||||||||||||||||||||||||||||||||||||||||||||||||||||||||||||||
| Other comprehensive income | ||||||||||||||||||||||||||||||||||||||||||||||||||||||||||||||||||||||
| Other comprehensive income | ||||||||||||||||||||||||||||||||||||||||||||||||||||||||||||||||||||||
| Other comprehensive income | ||||||||||||||||||||||||||||||||||||||||||||||||||||||||||||||||||||||
| Comprehensive income | ||||||||||||||||||||||||||||||||||||||||||||||||||||||||||||||||||||||
| Comprehensive income | ||||||||||||||||||||||||||||||||||||||||||||||||||||||||||||||||||||||
| Comprehensive income | Comprehensive income | 33,377 | 170,082 | |||||||||||||||||||||||||||||||||||||||||||||||||||||||||||||||||||
| Comprehensive loss attributable to noncontrolling interests | Comprehensive loss attributable to noncontrolling interests | 3,470 | 1,761 | |||||||||||||||||||||||||||||||||||||||||||||||||||||||||||||||||||
| Comprehensive loss attributable to noncontrolling interests | ||||||||||||||||||||||||||||||||||||||||||||||||||||||||||||||||||||||
| Comprehensive loss attributable to noncontrolling interests | ||||||||||||||||||||||||||||||||||||||||||||||||||||||||||||||||||||||
| Comprehensive income attributable to Nelnet, Inc. | Comprehensive income attributable to Nelnet, Inc. | $ | 36,847 | 171,843 | ||||||||||||||||||||||||||||||||||||||||||||||||||||||||||||||||||
| Comprehensive income attributable to Nelnet, Inc. | ||||||||||||||||||||||||||||||||||||||||||||||||||||||||||||||||||||||
| Comprehensive income attributable to Nelnet, Inc. | ||||||||||||||||||||||||||||||||||||||||||||||||||||||||||||||||||||||
| NELNET, INC. AND SUBSIDIARIES | CONSOLIDATED STATEMENTS OF SHAREHOLDERS' EQUITY | (Dollars in thousands, except share data) | (unaudited) | ||||||||||||||||||||||||||||||||||||||||||||||||||||||||||||||||||||||||||||||||||||||||||||||||||||||||||||||||||||||||||||||||||||||||||||||||||||||||
| Nelnet, Inc. Shareholders | |||||||||||||||||||||||||||||||||||||||||||||||||||||||||||||||||||||||||||||||||||||||||||||||||||||||||||||||||||||||||||||||||||||||||||||||||||||||||||
| Preferred stock shares | Common stock shares | Preferred stock | Class A common stock | Class B common stock | Additional paid-in capital | Retained earnings | Accumulated other comprehensive loss | Noncontrolling interests | Total equity | ||||||||||||||||||||||||||||||||||||||||||||||||||||||||||||||||||||||||||||||||||||||||||||||||||||||||||||||||||||||||||||||||||||||||||||||||||
| Class A | Class B | ||||||||||||||||||||||||||||||||||||||||||||||||||||||||||||||||||||||||||||||||||||||||||||||||||||||||||||||||||||||||||||||||||||||||||||||||||||||||||
| Balance as of December 31, 2021 | — | 27,239,654 | 10,676,642 | $ | — | 272 | 107 | 1,000 | 2,940,523 | 9,304 | 1,632 | 2,952,838 | |||||||||||||||||||||||||||||||||||||||||||||||||||||||||||||||||||||||||||||||||||||||||||||||||||||||||||||||||||||||||||||||||||||||||||||||
| Issuance of noncontrolling interests | — | — | — | — | — | — | — | — | — | 2,004 | 2,004 | ||||||||||||||||||||||||||||||||||||||||||||||||||||||||||||||||||||||||||||||||||||||||||||||||||||||||||||||||||||||||||||||||||||||||||||||||
| Net income (loss) | — | — | — | — | — | — | — | 186,647 | — | (1,761) | 184,886 | ||||||||||||||||||||||||||||||||||||||||||||||||||||||||||||||||||||||||||||||||||||||||||||||||||||||||||||||||||||||||||||||||||||||||||||||||
| Other comprehensive loss | — | — | — | — | — | — | — | — | (14,804) | — | (14,804) | ||||||||||||||||||||||||||||||||||||||||||||||||||||||||||||||||||||||||||||||||||||||||||||||||||||||||||||||||||||||||||||||||||||||||||||||||
| Distribution to noncontrolling interests | — | — | — | — | — | — | — | — | — | (5,125) | (5,125) | ||||||||||||||||||||||||||||||||||||||||||||||||||||||||||||||||||||||||||||||||||||||||||||||||||||||||||||||||||||||||||||||||||||||||||||||||
| Cash dividends on Class A and Class B common stock - $0.24 per share | — | — | — | — | — | — | — | (9,063) | — | — | (9,063) | ||||||||||||||||||||||||||||||||||||||||||||||||||||||||||||||||||||||||||||||||||||||||||||||||||||||||||||||||||||||||||||||||||||||||||||||||
| Issuance of common stock, net of forfeitures | — | 289,919 | — | — | 3 | — | 4,382 | — | — | — | 4,385 | ||||||||||||||||||||||||||||||||||||||||||||||||||||||||||||||||||||||||||||||||||||||||||||||||||||||||||||||||||||||||||||||||||||||||||||||||
| Compensation expense for stock based awards | — | — | — | — | — | — | 2,841 | — | — | — | 2,841 | ||||||||||||||||||||||||||||||||||||||||||||||||||||||||||||||||||||||||||||||||||||||||||||||||||||||||||||||||||||||||||||||||||||||||||||||||
| Repurchase of common stock | — | (380,053) | — | — | (3) | — | (7,015) | (25,881) | — | — | (32,899) | ||||||||||||||||||||||||||||||||||||||||||||||||||||||||||||||||||||||||||||||||||||||||||||||||||||||||||||||||||||||||||||||||||||||||||||||||
| Conversion of common stock | — | 1,750 | (1,750) | — | — | — | — | — | — | — | — | ||||||||||||||||||||||||||||||||||||||||||||||||||||||||||||||||||||||||||||||||||||||||||||||||||||||||||||||||||||||||||||||||||||||||||||||||
| Preferred stock shares | Common stock shares | Preferred stock | Class A common stock | Class B common stock | Additional paid-in capital | Retained earnings | Accumulated other comprehensive loss | Noncontrolling interests | Total equity | ||||||||||||||||||||||||||||||||||||||||||||||||||||||||||||||||||||||||||||||||||||||||||||||||||||||||||||||||||||||||||||||||||||||||||||||||||
| Balance as of March 31, 2022 | — | 27,151,270 | 10,674,892 | $ | — | 272 | 107 | 1,208 | 3,092,226 | (5,500) | (3,250) | 3,085,063 | |||||||||||||||||||||||||||||||||||||||||||||||||||||||||||||||||||||||||||||||||||||||||||||||||||||||||||||||||||||||||||||||||||||||||||||||
| Balance as of December 31, 2022 | |||||||||||||||||||||||||||||||||||||||||||||||||||||||||||||||||||||||||||||||||||||||||||||||||||||||||||||||||||||||||||||||||||||||||||||||||||||||||||
| Balance as of December 31, 2022 | |||||||||||||||||||||||||||||||||||||||||||||||||||||||||||||||||||||||||||||||||||||||||||||||||||||||||||||||||||||||||||||||||||||||||||||||||||||||||||
| Balance as of December 31, 2022 | Balance as of December 31, 2022 | — | 26,461,651 | 10,668,460 | $ | — | 265 | 107 | 1,109 | 3,234,844 | (37,366) | 943 | 3,199,902 | ||||||||||||||||||||||||||||||||||||||||||||||||||||||||||||||||||||||||||||||||||||||||||||||||||||||||||||||||||||||||||||||||||||||||||||||
| Issuance of noncontrolling interests | Issuance of noncontrolling interests | — | — | — | — | — | — | — | — | — | 1,201 | 1,201 | |||||||||||||||||||||||||||||||||||||||||||||||||||||||||||||||||||||||||||||||||||||||||||||||||||||||||||||||||||||||||||||||||||||||||||||||
| Net income (loss) | Net income (loss) | — | — | — | — | — | — | — | 26,487 | — | (3,470) | 23,017 | |||||||||||||||||||||||||||||||||||||||||||||||||||||||||||||||||||||||||||||||||||||||||||||||||||||||||||||||||||||||||||||||||||||||||||||||
| Other comprehensive income | Other comprehensive income | — | — | — | — | — | — | — | — | 10,360 | — | 10,360 | |||||||||||||||||||||||||||||||||||||||||||||||||||||||||||||||||||||||||||||||||||||||||||||||||||||||||||||||||||||||||||||||||||||||||||||||
| Distribution to noncontrolling interests | Distribution to noncontrolling interests | — | — | — | — | — | — | — | — | — | (5,028) | (5,028) | |||||||||||||||||||||||||||||||||||||||||||||||||||||||||||||||||||||||||||||||||||||||||||||||||||||||||||||||||||||||||||||||||||||||||||||||
| Cash dividends on Class A and Class B common stock - $0.26 per share | Cash dividends on Class A and Class B common stock - $0.26 per share | — | — | — | — | — | — | — | (9,654) | — | — | (9,654) | |||||||||||||||||||||||||||||||||||||||||||||||||||||||||||||||||||||||||||||||||||||||||||||||||||||||||||||||||||||||||||||||||||||||||||||||
| Issuance of common stock, net of forfeitures | Issuance of common stock, net of forfeitures | — | 198,524 | — | — | 1 | — | 3,063 | — | — | — | 3,064 | |||||||||||||||||||||||||||||||||||||||||||||||||||||||||||||||||||||||||||||||||||||||||||||||||||||||||||||||||||||||||||||||||||||||||||||||
| Compensation expense for stock based awards | Compensation expense for stock based awards | — | — | — | — | — | — | 3,769 | — | — | — | 3,769 | |||||||||||||||||||||||||||||||||||||||||||||||||||||||||||||||||||||||||||||||||||||||||||||||||||||||||||||||||||||||||||||||||||||||||||||||
| Repurchase of common stock | Repurchase of common stock | — | (36,513) | — | — | — | — | (3,302) | — | — | — | (3,302) | |||||||||||||||||||||||||||||||||||||||||||||||||||||||||||||||||||||||||||||||||||||||||||||||||||||||||||||||||||||||||||||||||||||||||||||||
| Balance as of March 31, 2023 | Balance as of March 31, 2023 | — | 26,623,662 | 10,668,460 | $ | — | 266 | 107 | 4,639 | 3,251,677 | (27,006) | (6,354) | 3,223,329 | ||||||||||||||||||||||||||||||||||||||||||||||||||||||||||||||||||||||||||||||||||||||||||||||||||||||||||||||||||||||||||||||||||||||||||||||
| Balance as of March 31, 2023 | |||||||||||||||||||||||||||||||||||||||||||||||||||||||||||||||||||||||||||||||||||||||||||||||||||||||||||||||||||||||||||||||||||||||||||||||||||||||||||
| Balance as of March 31, 2023 | |||||||||||||||||||||||||||||||||||||||||||||||||||||||||||||||||||||||||||||||||||||||||||||||||||||||||||||||||||||||||||||||||||||||||||||||||||||||||||
| Balance as of December 31, 2023 | |||||||||||||||||||||||||||||||||||||||||||||||||||||||||||||||||||||||||||||||||||||||||||||||||||||||||||||||||||||||||||||||||||||||||||||||||||||||||||
| Balance as of December 31, 2023 | |||||||||||||||||||||||||||||||||||||||||||||||||||||||||||||||||||||||||||||||||||||||||||||||||||||||||||||||||||||||||||||||||||||||||||||||||||||||||||
| Balance as of December 31, 2023 | |||||||||||||||||||||||||||||||||||||||||||||||||||||||||||||||||||||||||||||||||||||||||||||||||||||||||||||||||||||||||||||||||||||||||||||||||||||||||||
| Issuance of noncontrolling interests | |||||||||||||||||||||||||||||||||||||||||||||||||||||||||||||||||||||||||||||||||||||||||||||||||||||||||||||||||||||||||||||||||||||||||||||||||||||||||||
| Net income (loss) | |||||||||||||||||||||||||||||||||||||||||||||||||||||||||||||||||||||||||||||||||||||||||||||||||||||||||||||||||||||||||||||||||||||||||||||||||||||||||||
| Other comprehensive income | |||||||||||||||||||||||||||||||||||||||||||||||||||||||||||||||||||||||||||||||||||||||||||||||||||||||||||||||||||||||||||||||||||||||||||||||||||||||||||
| Distribution to noncontrolling interests | |||||||||||||||||||||||||||||||||||||||||||||||||||||||||||||||||||||||||||||||||||||||||||||||||||||||||||||||||||||||||||||||||||||||||||||||||||||||||||
| Cash dividends on Class A and Class B common stock - $0.28 per share | |||||||||||||||||||||||||||||||||||||||||||||||||||||||||||||||||||||||||||||||||||||||||||||||||||||||||||||||||||||||||||||||||||||||||||||||||||||||||||
| Issuance of common stock, net of forfeitures | |||||||||||||||||||||||||||||||||||||||||||||||||||||||||||||||||||||||||||||||||||||||||||||||||||||||||||||||||||||||||||||||||||||||||||||||||||||||||||
| Compensation expense for stock based awards | |||||||||||||||||||||||||||||||||||||||||||||||||||||||||||||||||||||||||||||||||||||||||||||||||||||||||||||||||||||||||||||||||||||||||||||||||||||||||||
| Repurchase of common stock | |||||||||||||||||||||||||||||||||||||||||||||||||||||||||||||||||||||||||||||||||||||||||||||||||||||||||||||||||||||||||||||||||||||||||||||||||||||||||||
| Balance as of March 31, 2024 | |||||||||||||||||||||||||||||||||||||||||||||||||||||||||||||||||||||||||||||||||||||||||||||||||||||||||||||||||||||||||||||||||||||||||||||||||||||||||||
| Balance as of March 31, 2024 | |||||||||||||||||||||||||||||||||||||||||||||||||||||||||||||||||||||||||||||||||||||||||||||||||||||||||||||||||||||||||||||||||||||||||||||||||||||||||||
| Balance as of March 31, 2024 | |||||||||||||||||||||||||||||||||||||||||||||||||||||||||||||||||||||||||||||||||||||||||||||||||||||||||||||||||||||||||||||||||||||||||||||||||||||||||||
| NELNET, INC. AND SUBSIDIARIES | NELNET, INC. AND SUBSIDIARIES | NELNET, INC. AND SUBSIDIARIES | |||||||||||||||||||||||||||||||
| CONSOLIDATED STATEMENTS OF CASH FLOWS | CONSOLIDATED STATEMENTS OF CASH FLOWS | CONSOLIDATED STATEMENTS OF CASH FLOWS | |||||||||||||||||||||||||||||||
| (Dollars in thousands) | (Dollars in thousands) | (Dollars in thousands) | |||||||||||||||||||||||||||||||
| (unaudited) | (unaudited) | (unaudited) | |||||||||||||||||||||||||||||||
| Three months ended | Three months ended | ||||||||||||||||||||||||||||||||
| March 31, | |||||||||||||||||||||||||||||||||
| March 31, | March 31, | ||||||||||||||||||||||||||||||||
| 2023 | 2022 | 2024 | 2023 | ||||||||||||||||||||||||||||||
| Net income attributable to Nelnet, Inc. | Net income attributable to Nelnet, Inc. | $ | 26,487 | 186,647 | |||||||||||||||||||||||||||||
| Net loss attributable to noncontrolling interests | Net loss attributable to noncontrolling interests | (3,470) | (1,761) | ||||||||||||||||||||||||||||||
| Net income | Net income | 23,017 | 184,886 | ||||||||||||||||||||||||||||||
| Adjustments to reconcile net income to net cash provided by operating activities: | Adjustments to reconcile net income to net cash provided by operating activities: | Adjustments to reconcile net income to net cash provided by operating activities: | |||||||||||||||||||||||||||||||
| Depreciation and amortization, including debt discounts and loan premiums and deferred origination costs | Depreciation and amortization, including debt discounts and loan premiums and deferred origination costs | 34,211 | 36,335 | ||||||||||||||||||||||||||||||
| Loan discount accretion | Loan discount accretion | (7,676) | (9,927) | ||||||||||||||||||||||||||||||
| Provision (negative provision) for loan losses | 34,275 | (435) | |||||||||||||||||||||||||||||||
| Provision for loan losses | |||||||||||||||||||||||||||||||||
| Derivative market value adjustments | Derivative market value adjustments | 37,411 | (145,734) | ||||||||||||||||||||||||||||||
| Proceeds from termination of derivative instruments | Proceeds from termination of derivative instruments | 164,079 | — | ||||||||||||||||||||||||||||||
| Proceeds from termination of derivative instruments | |||||||||||||||||||||||||||||||||
| Proceeds from termination of derivative instruments | |||||||||||||||||||||||||||||||||
| (Payments to) proceeds from clearinghouse - initial and variation margin, net | (210,284) | 149,649 | |||||||||||||||||||||||||||||||
| Proceeds from (payments to) clearinghouse - initial and variation margin, net | |||||||||||||||||||||||||||||||||
| Proceeds from (payments to) clearinghouse - initial and variation margin, net | |||||||||||||||||||||||||||||||||
| Proceeds from (payments to) clearinghouse - initial and variation margin, net | |||||||||||||||||||||||||||||||||
| Gain on sale of loans, net | (11,812) | (2,989) | |||||||||||||||||||||||||||||||
| Loss on investments, net | 24,344 | 2,801 | |||||||||||||||||||||||||||||||
| Loss (gain) on sale of loans, net | |||||||||||||||||||||||||||||||||
| Loss (gain) on sale of loans, net | |||||||||||||||||||||||||||||||||
| Loss (gain) on sale of loans, net | |||||||||||||||||||||||||||||||||
| Loss on investments, net of gains | |||||||||||||||||||||||||||||||||
| Proceeds from sale of equity securities, net | 75 | 572 | |||||||||||||||||||||||||||||||
| Deferred income tax (benefit) expense | (13,750) | 39,443 | |||||||||||||||||||||||||||||||
| Deferred income tax benefit | |||||||||||||||||||||||||||||||||
| Deferred income tax benefit | |||||||||||||||||||||||||||||||||
| Deferred income tax benefit | |||||||||||||||||||||||||||||||||
| Non-cash compensation expense | Non-cash compensation expense | 3,838 | 2,920 | ||||||||||||||||||||||||||||||
| Decrease in loan and investment accrued interest receivable | Decrease in loan and investment accrued interest receivable | 16,630 | 10,694 | ||||||||||||||||||||||||||||||
| Decrease in loan and investment accrued interest receivable | |||||||||||||||||||||||||||||||||
| Decrease in loan and investment accrued interest receivable | |||||||||||||||||||||||||||||||||
| Decrease in accounts receivable | Decrease in accounts receivable | 43,675 | 18,442 | ||||||||||||||||||||||||||||||
| Increase in other assets, net | (9,760) | (2,073) | |||||||||||||||||||||||||||||||
| Decrease (increase) in other assets, net | |||||||||||||||||||||||||||||||||
| Decrease in the carrying amount of ROU asset, net | Decrease in the carrying amount of ROU asset, net | 1,251 | 1,439 | ||||||||||||||||||||||||||||||
| (Decrease) increase in accrued interest payable | (1,675) | 2,650 | |||||||||||||||||||||||||||||||
| Decrease in accrued interest payable | |||||||||||||||||||||||||||||||||
| Decrease in other liabilities | Decrease in other liabilities | (3,729) | (11,824) | ||||||||||||||||||||||||||||||
| Decrease in the carrying amount of lease liability | Decrease in the carrying amount of lease liability | (1,275) | (1,500) | ||||||||||||||||||||||||||||||
| Other | |||||||||||||||||||||||||||||||||
| Net cash provided by operating activities | Net cash provided by operating activities | 122,845 | 275,349 | ||||||||||||||||||||||||||||||
| Cash flows from investing activities: | Cash flows from investing activities: | Cash flows from investing activities: | |||||||||||||||||||||||||||||||
| Purchases and originations of loans | Purchases and originations of loans | (289,177) | (161,334) | ||||||||||||||||||||||||||||||
| Purchases of loans from a related party | — | (1,049) | |||||||||||||||||||||||||||||||
| Net proceeds from loan repayments, claims, and capitalized interest | |||||||||||||||||||||||||||||||||
| Net proceeds from loan repayments, claims, and capitalized interest | |||||||||||||||||||||||||||||||||
| Net proceeds from loan repayments, claims, and capitalized interest | Net proceeds from loan repayments, claims, and capitalized interest | 684,962 | 848,188 | ||||||||||||||||||||||||||||||
| Proceeds from sale of loans | Proceeds from sale of loans | 157,444 | 15,170 | ||||||||||||||||||||||||||||||
| Purchases of available-for-sale securities | Purchases of available-for-sale securities | (242,370) | (139,195) | ||||||||||||||||||||||||||||||
| Purchases of restricted available-for-sale securities | |||||||||||||||||||||||||||||||||
| Proceeds from sales of available-for-sale securities | Proceeds from sales of available-for-sale securities | 492,173 | 113,980 | ||||||||||||||||||||||||||||||
| Proceeds from sales of restricted available-for-sale securities | |||||||||||||||||||||||||||||||||
| Proceeds from beneficial interest in loan securitizations | Proceeds from beneficial interest in loan securitizations | 4,725 | 7,271 | ||||||||||||||||||||||||||||||
| Purchases of other investments and issuance of notes receivable | Purchases of other investments and issuance of notes receivable | (70,509) | (73,944) | ||||||||||||||||||||||||||||||
| Proceeds from other investments | 11,114 | 9,776 | |||||||||||||||||||||||||||||||
| Proceeds from other investments and repayments of notes receivable | |||||||||||||||||||||||||||||||||
| Redemption of held-to-maturity debt securities | |||||||||||||||||||||||||||||||||
| Redemption of held-to-maturity debt securities | |||||||||||||||||||||||||||||||||
| Redemption of held-to-maturity debt securities | |||||||||||||||||||||||||||||||||
| Purchases of property and equipment | Purchases of property and equipment | (24,430) | (15,794) | ||||||||||||||||||||||||||||||
| Net cash provided by investing activities | Net cash provided by investing activities | 723,932 | 603,069 | ||||||||||||||||||||||||||||||
| Net cash provided by investing activities | |||||||||||||||||||||||||||||||||
| Net cash provided by investing activities | |||||||||||||||||||||||||||||||||
| NELNET, INC. AND SUBSIDIARIES | NELNET, INC. AND SUBSIDIARIES | NELNET, INC. AND SUBSIDIARIES | |||||||||||||||||||||||||||||||
| CONSOLIDATED STATEMENTS OF CASH FLOWS (Continued) | CONSOLIDATED STATEMENTS OF CASH FLOWS (Continued) | CONSOLIDATED STATEMENTS OF CASH FLOWS (Continued) | |||||||||||||||||||||||||||||||
| Three months ended | |||||||||||||||||||||||||||||||||
| March 31, | |||||||||||||||||||||||||||||||||
| 2023 | 2022 | ||||||||||||||||||||||||||||||||
| Three months ended | Three months ended | ||||||||||||||||||||||||||||||||
| March 31, | March 31, | ||||||||||||||||||||||||||||||||
| 2024 | 2024 | 2023 | |||||||||||||||||||||||||||||||
| Cash flows from financing activities: | Cash flows from financing activities: | Cash flows from financing activities: | |||||||||||||||||||||||||||||||
| Payments on bonds and notes payable | Payments on bonds and notes payable | $ | (1,415,424) | (918,270) | |||||||||||||||||||||||||||||
| Proceeds from issuance of bonds and notes payable | Proceeds from issuance of bonds and notes payable | 204,884 | 13,512 | ||||||||||||||||||||||||||||||
| Payments of debt issuance costs | Payments of debt issuance costs | (169) | (312) | ||||||||||||||||||||||||||||||
| (Decrease) increase in bank deposits, net | (15,555) | 139,732 | |||||||||||||||||||||||||||||||
| Increase (decrease) in bank deposits, net | |||||||||||||||||||||||||||||||||
| Increase (decrease) in bank deposits, net | |||||||||||||||||||||||||||||||||
| Increase (decrease) in bank deposits, net | |||||||||||||||||||||||||||||||||
| Decrease in due to customers | Decrease in due to customers | (67,642) | (89,884) | ||||||||||||||||||||||||||||||
| Dividends paid | Dividends paid | (9,654) | (9,063) | ||||||||||||||||||||||||||||||
| Repurchases of common stock | Repurchases of common stock | (3,302) | (32,899) | ||||||||||||||||||||||||||||||
| Proceeds from issuance of common stock | Proceeds from issuance of common stock | 395 | 435 | ||||||||||||||||||||||||||||||
| Issuance of noncontrolling interests | Issuance of noncontrolling interests | 1,201 | 2,004 | ||||||||||||||||||||||||||||||
| Issuance of noncontrolling interests | |||||||||||||||||||||||||||||||||
| Issuance of noncontrolling interests | |||||||||||||||||||||||||||||||||
| Distribution to noncontrolling interests | Distribution to noncontrolling interests | (993) | (365) | ||||||||||||||||||||||||||||||
| Net cash used in financing activities | Net cash used in financing activities | (1,306,259) | (895,110) | ||||||||||||||||||||||||||||||
| Effect of exchange rate changes on cash | (91) | 169 | |||||||||||||||||||||||||||||||
| Effect of exchange rate changes on cash and restricted cash | |||||||||||||||||||||||||||||||||
| Net decrease in cash, cash equivalents, and restricted cash | Net decrease in cash, cash equivalents, and restricted cash | (459,573) | (16,523) | ||||||||||||||||||||||||||||||
| Cash, cash equivalents, and restricted cash, beginning of period | Cash, cash equivalents, and restricted cash, beginning of period | 1,357,616 | 1,194,189 | ||||||||||||||||||||||||||||||
| Cash, cash equivalents, and restricted cash, end of period | Cash, cash equivalents, and restricted cash, end of period | $ | 898,043 | 1,177,666 | |||||||||||||||||||||||||||||
| Supplemental disclosures of cash flow information: | Supplemental disclosures of cash flow information: | ||||||||||||
| Cash disbursements made for interest | Cash disbursements made for interest | $ | 189,795 | 33,895 | |||||||||
| Cash disbursements made for interest | |||||||||||||
| Cash disbursements made for interest | |||||||||||||
| Cash disbursements made for income taxes, net of refunds and credits received (a) | Cash disbursements made for income taxes, net of refunds and credits received (a) | $ | 961 | 466 | |||||||||
| Cash disbursements made for operating leases | Cash disbursements made for operating leases | $ | 1,705 | 1,887 | |||||||||
| Noncash operating, investing, and financing activity: | |||||||||||||
| Non-cash operating, investing, and financing activity: | |||||||||||||
| ROU assets obtained in exchange for lease obligations | |||||||||||||
| ROU assets obtained in exchange for lease obligations | |||||||||||||
| ROU assets obtained in exchange for lease obligations | ROU assets obtained in exchange for lease obligations | $ | 15,545 | 746 | |||||||||
| Receipt of beneficial interest in consumer loan securitizations as consideration from sale of loans | Receipt of beneficial interest in consumer loan securitizations as consideration from sale of loans | $ | 34,540 | 3,660 | |||||||||
| Receipt of asset-backed investment securities as consideration from sale of loans | Receipt of asset-backed investment securities as consideration from sale of loans | $ | 58,182 | — | |||||||||
| Distribution to noncontrolling interests | Distribution to noncontrolling interests | $ | 4,035 | 4,760 | |||||||||
| Distribution to noncontrolling interests | |||||||||||||
| Distribution to noncontrolling interests | |||||||||||||
| Issuance of noncontrolling interests | |||||||||||||
| As of | As of | As of | As of | |||||||||||||||||||||||||||||||||||||||||||||||||||||||||
| March 31, 2023 | December 31, 2022 | March 31, 2022 | December 31, 2021 | |||||||||||||||||||||||||||||||||||||||||||||||||||||||||
| As of | As of | |||||||||||||||||||||||||||||||||||||||||||||||||||||||||||
| March 31, 2024 | March 31, 2024 | December 31, 2023 | March 31, 2023 | December 31, 2022 | ||||||||||||||||||||||||||||||||||||||||||||||||||||||||
| Total cash and cash equivalents | Total cash and cash equivalents | $ | 187,574 | 118,146 | 162,785 | 125,563 | ||||||||||||||||||||||||||||||||||||||||||||||||||||||
| Restricted cash | Restricted cash | 576,267 | 945,159 | 757,954 | 741,981 | |||||||||||||||||||||||||||||||||||||||||||||||||||||||
| Restricted cash - due to customers | Restricted cash - due to customers | 134,202 | 294,311 | 256,927 | 326,645 | |||||||||||||||||||||||||||||||||||||||||||||||||||||||
| Cash, cash equivalents, and restricted cash | Cash, cash equivalents, and restricted cash | $ | 898,043 | 1,357,616 | 1,177,666 | 1,194,189 | ||||||||||||||||||||||||||||||||||||||||||||||||||||||
| As of | As of | ||||||||||||||||||||||||||
| As of | As of | ||||||||||||||||||||||||||
| March 31, 2023 | December 31, 2022 | March 31, 2024 | December 31, 2023 | ||||||||||||||||||||||||
| Non-Nelnet Bank: | Non-Nelnet Bank: | ||||||||||||||||||||||||||
| Federally insured loans: | Federally insured loans: | ||||||||||||||||||||||||||
| Federally insured loans: | |||||||||||||||||||||||||||
| Federally insured loans: | |||||||||||||||||||||||||||
| Stafford and other | |||||||||||||||||||||||||||
| Stafford and other | |||||||||||||||||||||||||||
| Stafford and other | Stafford and other | $ | 3,229,778 | 3,389,178 | |||||||||||||||||||||||
| Consolidation | Consolidation | 9,701,781 | 10,177,295 | ||||||||||||||||||||||||
| Total | Total | 12,931,559 | 13,566,473 | ||||||||||||||||||||||||
| Private education loans | Private education loans | 241,515 | 252,383 | ||||||||||||||||||||||||
| Consumer and other loans | Consumer and other loans | 309,546 | 350,915 | ||||||||||||||||||||||||
| Non-Nelnet Bank loans | Non-Nelnet Bank loans | 13,482,620 | 14,169,771 | ||||||||||||||||||||||||
| Nelnet Bank: | Nelnet Bank: | ||||||||||||||||||||||||||
| Federally insured loans | 63,399 | 65,913 | |||||||||||||||||||||||||
| Private education loans | |||||||||||||||||||||||||||
| Private education loans | |||||||||||||||||||||||||||
| Private education loans | Private education loans | 355,705 | 353,882 | ||||||||||||||||||||||||
| Consumer and other loans | Consumer and other loans | 19,903 | — | ||||||||||||||||||||||||
| Nelnet Bank loans | Nelnet Bank loans | 439,007 | 419,795 | ||||||||||||||||||||||||
| Accrued interest receivable | Accrued interest receivable | 800,400 | 816,864 | ||||||||||||||||||||||||
| Accrued interest receivable | |||||||||||||||||||||||||||
| Accrued interest receivable | |||||||||||||||||||||||||||
| Loan discount, net of unamortized loan premiums and deferred origination costs | Loan discount, net of unamortized loan premiums and deferred origination costs | (26,215) | (30,714) | ||||||||||||||||||||||||
| Allowance for loan losses: | Allowance for loan losses: | ||||||||||||||||||||||||||
| Non-Nelnet Bank: | Non-Nelnet Bank: | ||||||||||||||||||||||||||
| Non-Nelnet Bank: | |||||||||||||||||||||||||||
| Non-Nelnet Bank: | |||||||||||||||||||||||||||
| Federally insured loans | |||||||||||||||||||||||||||
| Federally insured loans | |||||||||||||||||||||||||||
| Federally insured loans | Federally insured loans | (79,331) | (83,593) | ||||||||||||||||||||||||
| Private education loans | Private education loans | (15,175) | (15,411) | ||||||||||||||||||||||||
| Consumer and other loans | Consumer and other loans | (35,317) | (30,263) | ||||||||||||||||||||||||
| Non-Nelnet Bank allowance for loan losses | Non-Nelnet Bank allowance for loan losses | (129,823) | (129,267) | ||||||||||||||||||||||||
| Nelnet Bank: | Nelnet Bank: | ||||||||||||||||||||||||||
| Federally insured loans | (160) | (170) | |||||||||||||||||||||||||
| Private education loans | |||||||||||||||||||||||||||
| Private education loans | |||||||||||||||||||||||||||
| Private education loans | Private education loans | (2,894) | (2,390) | ||||||||||||||||||||||||
| Consumer and other loans | Consumer and other loans | (1,827) | — | ||||||||||||||||||||||||
| Nelnet Bank allowance for loan losses | Nelnet Bank allowance for loan losses | (4,881) | (2,560) | ||||||||||||||||||||||||
| $ | 14,561,108 | 15,243,889 | |||||||||||||||||||||||||
| As of | As of | |||||||||||||||||||||||||||||
| March 31, 2023 | December 31, 2022 | |||||||||||||||||||||||||||||
| As of | As of | |||||||||||||||||||||||||||||
| March 31, 2024 | March 31, 2024 | December 31, 2023 | ||||||||||||||||||||||||||||
| Non-Nelnet Bank: | Non-Nelnet Bank: | |||||||||||||||||||||||||||||
| Federally insured loans (a) | ||||||||||||||||||||||||||||||
| Federally insured loans (a) | ||||||||||||||||||||||||||||||
| Federally insured loans (a) | Federally insured loans (a) | 0.61 | % | 0.62 | % | 0.59 | % | 0.59 | % | |||||||||||||||||||||
| Private education loans | Private education loans | 6.28 | % | 6.11 | % | Private education loans | 5.63 | % | 5.68 | % | ||||||||||||||||||||
| Consumer and other loans | Consumer and other loans | 11.41 | % | 8.62 | % | Consumer and other loans | 12.08 | % | 13.66 | % | ||||||||||||||||||||
| Nelnet Bank: | Nelnet Bank: | |||||||||||||||||||||||||||||
| Federally insured loans (a) | 0.25 | % | 0.26 | % | ||||||||||||||||||||||||||
| Private education loans | ||||||||||||||||||||||||||||||
| Private education loans | ||||||||||||||||||||||||||||||
| Private education loans | Private education loans | 0.81 | % | 0.68 | % | 1.00 | % | 0.93 | % | |||||||||||||||||||||
| Consumer and other loans | Consumer and other loans | 9.18 | % | — | Consumer and other loans | 5.99 | % | 7.40 | % | |||||||||||||||||||||
| Loans sold (par value) | Gain (loss) | Loan type | Residual interest received in securitization | |||||||||||||||||||||||||||||||||||||||||||||||||||||||||||||||||||||||||||
| Three months ended March 31, 2023 | ||||||||||||||||||||||||||||||||||||||||||||||||||||||||||||||||||||||||||||||
| Loans sold (par value) | Loans sold (par value) | Gain (loss) | Loan type | Residual interest received in securitization | ||||||||||||||||||||||||||||||||||||||||||||||||||||||||||||||||||||||||||
| Three months ended March 31, 2024 | Three months ended March 31, 2024 | |||||||||||||||||||||||||||||||||||||||||||||||||||||||||||||||||||||||||||||
| March 27 | ||||||||||||||||||||||||||||||||||||||||||||||||||||||||||||||||||||||||||||||
| March 28 | ||||||||||||||||||||||||||||||||||||||||||||||||||||||||||||||||||||||||||||||
| March 28 | ||||||||||||||||||||||||||||||||||||||||||||||||||||||||||||||||||||||||||||||
| March 28 | ||||||||||||||||||||||||||||||||||||||||||||||||||||||||||||||||||||||||||||||
| $ | ||||||||||||||||||||||||||||||||||||||||||||||||||||||||||||||||||||||||||||||
| $ | ||||||||||||||||||||||||||||||||||||||||||||||||||||||||||||||||||||||||||||||
| $ | ||||||||||||||||||||||||||||||||||||||||||||||||||||||||||||||||||||||||||||||
| Three months ended March 31, 2023 | ||||||||||||||||||||||||||||||||||||||||||||||||||||||||||||||||||||||||||||||
| Three months ended March 31, 2023 | ||||||||||||||||||||||||||||||||||||||||||||||||||||||||||||||||||||||||||||||
| Three months ended March 31, 2023 | ||||||||||||||||||||||||||||||||||||||||||||||||||||||||||||||||||||||||||||||
| January 31 | January 31 | $ | 97,350 | (1,441) | Home equity | 64.8 | % | (a) | January 31 | $ | 97,350 | (1,441) | (1,441) | Home equity | Home equity | 64.8 | % | (a) | ||||||||||||||||||||||||||||||||||||||||||||||||||||||||||||
| January 31 | January 31 | 42,275 | 4,350 | Consumer | 13.3 | |||||||||||||||||||||||||||||||||||||||||||||||||||||||||||||||||||||||||
| March 2 | March 2 | 122,132 | 8,966 | Consumer | 24.6 | (a) | ||||||||||||||||||||||||||||||||||||||||||||||||||||||||||||||||||||||||
| March 2 | ||||||||||||||||||||||||||||||||||||||||||||||||||||||||||||||||||||||||||||||
| March 2 | 122,132 | 8,966 | Consumer | 24.6 | (a) | |||||||||||||||||||||||||||||||||||||||||||||||||||||||||||||||||||||||||
| March 22 | March 22 | 145 | (63) | Home equity | — | |||||||||||||||||||||||||||||||||||||||||||||||||||||||||||||||||||||||||
| $ | 261,902 | 11,812 | ||||||||||||||||||||||||||||||||||||||||||||||||||||||||||||||||||||||||||||
| Three months ended March 31, 2022 | ||||||||||||||||||||||||||||||||||||||||||||||||||||||||||||||||||||||||||||||
| January 26 | $ | 18,125 | 2,989 | Consumer | 6.6 | % | ||||||||||||||||||||||||||||||||||||||||||||||||||||||||||||||||||||||||
| $ | ||||||||||||||||||||||||||||||||||||||||||||||||||||||||||||||||||||||||||||||
| $ | ||||||||||||||||||||||||||||||||||||||||||||||||||||||||||||||||||||||||||||||
| $ | ||||||||||||||||||||||||||||||||||||||||||||||||||||||||||||||||||||||||||||||
| Balance at beginning of period | |||||||||||||||||||||||||||||||||||||||||||||||||||||||||||||||||||||||||||||||||||||||||||||||||||||||||||||||
| Balance at beginning of period | |||||||||||||||||||||||||||||||||||||||||||||||||||||||||||||||||||||||||||||||||||||||||||||||||||||||||||||||
| Balance at beginning of period | Provision (negative provision) for loan losses | Charge-offs | Recoveries | Loan sales | Balance at end of period | ||||||||||||||||||||||||||||||||||||||||||||||||||||||||||||||||||||||||||||||||||||||||||||||||||||||||||
| Three months ended March 31, 2024 | Three months ended March 31, 2024 | ||||||||||||||||||||||||||||||||||||||||||||||||||||||||||||||||||||||||||||||||||||||||||||||||||||||||||||||
| Non-Nelnet Bank: | |||||||||||||||||||||||||||||||||||||||||||||||||||||||||||||||||||||||||||||||||||||||||||||||||||||||||||||||
| Federally insured loans | |||||||||||||||||||||||||||||||||||||||||||||||||||||||||||||||||||||||||||||||||||||||||||||||||||||||||||||||
| Federally insured loans | |||||||||||||||||||||||||||||||||||||||||||||||||||||||||||||||||||||||||||||||||||||||||||||||||||||||||||||||
| Federally insured loans | |||||||||||||||||||||||||||||||||||||||||||||||||||||||||||||||||||||||||||||||||||||||||||||||||||||||||||||||
| Private education loans | |||||||||||||||||||||||||||||||||||||||||||||||||||||||||||||||||||||||||||||||||||||||||||||||||||||||||||||||
| Consumer and other loans | |||||||||||||||||||||||||||||||||||||||||||||||||||||||||||||||||||||||||||||||||||||||||||||||||||||||||||||||
| Nelnet Bank: | |||||||||||||||||||||||||||||||||||||||||||||||||||||||||||||||||||||||||||||||||||||||||||||||||||||||||||||||
| Balance at beginning of period | Provision (negative provision) for loan losses | Charge-offs | Recoveries | Initial allowance on loans purchased with credit deterioration | Loan sales | Balance at end of period | |||||||||||||||||||||||||||||||||||||||||||||||||||||||||||||||||||||||||||||||||||||||||||||||||||||||||
| Private education loans | |||||||||||||||||||||||||||||||||||||||||||||||||||||||||||||||||||||||||||||||||||||||||||||||||||||||||||||||
| Three months ended March 31, 2023 | |||||||||||||||||||||||||||||||||||||||||||||||||||||||||||||||||||||||||||||||||||||||||||||||||||||||||||||||
| Private education loans | |||||||||||||||||||||||||||||||||||||||||||||||||||||||||||||||||||||||||||||||||||||||||||||||||||||||||||||||
| Private education loans | |||||||||||||||||||||||||||||||||||||||||||||||||||||||||||||||||||||||||||||||||||||||||||||||||||||||||||||||
| Consumer and other loans | |||||||||||||||||||||||||||||||||||||||||||||||||||||||||||||||||||||||||||||||||||||||||||||||||||||||||||||||
| $ | |||||||||||||||||||||||||||||||||||||||||||||||||||||||||||||||||||||||||||||||||||||||||||||||||||||||||||||||
| Three months ended March 31, 2023 | |||||||||||||||||||||||||||||||||||||||||||||||||||||||||||||||||||||||||||||||||||||||||||||||||||||||||||||||
| Three months ended March 31, 2023 | |||||||||||||||||||||||||||||||||||||||||||||||||||||||||||||||||||||||||||||||||||||||||||||||||||||||||||||||
| Three months ended March 31, 2023 | |||||||||||||||||||||||||||||||||||||||||||||||||||||||||||||||||||||||||||||||||||||||||||||||||||||||||||||||
| Non-Nelnet Bank: | Non-Nelnet Bank: | ||||||||||||||||||||||||||||||||||||||||||||||||||||||||||||||||||||||||||||||||||||||||||||||||||||||||||||||
| Federally insured loans | |||||||||||||||||||||||||||||||||||||||||||||||||||||||||||||||||||||||||||||||||||||||||||||||||||||||||||||||
| Federally insured loans | |||||||||||||||||||||||||||||||||||||||||||||||||||||||||||||||||||||||||||||||||||||||||||||||||||||||||||||||
| Federally insured loans | Federally insured loans | $ | 83,593 | 2,411 | (6,679) | — | 6 | — | 79,331 | ||||||||||||||||||||||||||||||||||||||||||||||||||||||||||||||||||||||||||||||||||||||||||||||||||||||
| Private education loans | Private education loans | 15,411 | 240 | (640) | 164 | — | — | 15,175 | |||||||||||||||||||||||||||||||||||||||||||||||||||||||||||||||||||||||||||||||||||||||||||||||||||||||
| Consumer and other loans | Consumer and other loans | 30,263 | 29,207 | (2,267) | 220 | — | (22,106) | 35,317 | |||||||||||||||||||||||||||||||||||||||||||||||||||||||||||||||||||||||||||||||||||||||||||||||||||||||
| Nelnet Bank: | Nelnet Bank: | ||||||||||||||||||||||||||||||||||||||||||||||||||||||||||||||||||||||||||||||||||||||||||||||||||||||||||||||
| Federally insured loans | Federally insured loans | 170 | (9) | (1) | — | — | — | 160 | |||||||||||||||||||||||||||||||||||||||||||||||||||||||||||||||||||||||||||||||||||||||||||||||||||||||
| Private education loans | 2,390 | 614 | (110) | — | — | — | 2,894 | ||||||||||||||||||||||||||||||||||||||||||||||||||||||||||||||||||||||||||||||||||||||||||||||||||||||||
| Consumer and other loans | — | 1,827 | — | — | — | — | 1,827 | ||||||||||||||||||||||||||||||||||||||||||||||||||||||||||||||||||||||||||||||||||||||||||||||||||||||||
| $ | 131,827 | 34,290 | (9,697) | 384 | 6 | (22,106) | 134,704 | ||||||||||||||||||||||||||||||||||||||||||||||||||||||||||||||||||||||||||||||||||||||||||||||||||||||||
| Three months ended March 31, 2022 | |||||||||||||||||||||||||||||||||||||||||||||||||||||||||||||||||||||||||||||||||||||||||||||||||||||||||||||||
| Non-Nelnet Bank: | |||||||||||||||||||||||||||||||||||||||||||||||||||||||||||||||||||||||||||||||||||||||||||||||||||||||||||||||
| Federally insured loans | |||||||||||||||||||||||||||||||||||||||||||||||||||||||||||||||||||||||||||||||||||||||||||||||||||||||||||||||
| Federally insured loans | Federally insured loans | $ | 103,381 | (2,748) | (4,761) | — | 123 | — | 95,995 | ||||||||||||||||||||||||||||||||||||||||||||||||||||||||||||||||||||||||||||||||||||||||||||||||||||||
| Private education loans | Private education loans | 16,143 | (400) | (1,299) | 176 | — | 2 | 14,622 | |||||||||||||||||||||||||||||||||||||||||||||||||||||||||||||||||||||||||||||||||||||||||||||||||||||||
| Consumer and other loans | Consumer and other loans | 6,481 | 2,284 | (937) | 166 | — | (2,284) | 5,710 | |||||||||||||||||||||||||||||||||||||||||||||||||||||||||||||||||||||||||||||||||||||||||||||||||||||||
| Nelnet Bank: | |||||||||||||||||||||||||||||||||||||||||||||||||||||||||||||||||||||||||||||||||||||||||||||||||||||||||||||||
| Federally insured loans | 268 | (21) | — | — | — | — | 247 | ||||||||||||||||||||||||||||||||||||||||||||||||||||||||||||||||||||||||||||||||||||||||||||||||||||||||
| Private education loans | 840 | 426 | (13) | — | — | (2) | 1,251 | ||||||||||||||||||||||||||||||||||||||||||||||||||||||||||||||||||||||||||||||||||||||||||||||||||||||||
| $ | |||||||||||||||||||||||||||||||||||||||||||||||||||||||||||||||||||||||||||||||||||||||||||||||||||||||||||||||
| $ | 127,113 | (459) | (7,010) | 342 | 123 | (2,284) | 117,825 | ||||||||||||||||||||||||||||||||||||||||||||||||||||||||||||||||||||||||||||||||||||||||||||||||||||||||
| Three months ended March 31, | ||||||||||||||||||||||
| 2023 | 2022 | |||||||||||||||||||||
| Three months ended March 31, | ||||||||||||||||||||||
| Three months ended March 31, | ||||||||||||||||||||||
| Three months ended March 31, | ||||||||||||||||||||||
| 2024 | ||||||||||||||||||||||
| 2024 | ||||||||||||||||||||||
| 2024 | ||||||||||||||||||||||
| Non-Nelnet Bank: | ||||||||||||||||||||||
| Non-Nelnet Bank: | ||||||||||||||||||||||
| Non-Nelnet Bank: | Non-Nelnet Bank: | |||||||||||||||||||||
| Federally insured loans | Federally insured loans | 0.20 | % | 0.11 | % | |||||||||||||||||
| Federally insured loans | ||||||||||||||||||||||
| Federally insured loans | ||||||||||||||||||||||
| Private education loans | ||||||||||||||||||||||
| Private education loans | ||||||||||||||||||||||
| Private education loans | Private education loans | 0.78 | % | 1.58 | % | |||||||||||||||||
| Consumer and other loans | Consumer and other loans | 2.59 | % | 7.40 | % | |||||||||||||||||
| Consumer and other loans | ||||||||||||||||||||||
| Consumer and other loans | ||||||||||||||||||||||
| Nelnet Bank: | ||||||||||||||||||||||
| Nelnet Bank: | ||||||||||||||||||||||
| Nelnet Bank: | Nelnet Bank: | |||||||||||||||||||||
| Federally insured loans | Federally insured loans | 0.01 | % | 0.00 | % | |||||||||||||||||
| Federally insured loans | ||||||||||||||||||||||
| Federally insured loans | ||||||||||||||||||||||
| Private education loans | ||||||||||||||||||||||
| Private education loans | ||||||||||||||||||||||
| Private education loans | Private education loans | 0.13 | % | 0.02 | % | |||||||||||||||||
| Consumer and other loans | Consumer and other loans | — | — | |||||||||||||||||||
| Consumer and other loans | ||||||||||||||||||||||
| Consumer and other loans | ||||||||||||||||||||||
| As of March 31, 2023 | As of December 31, 2022 | As of March 31, 2022 | ||||||||||||||||||||||||||||||||||||||||||||||||||||||||||||||||||||||||||||||||||||||||||||||||||||||||||||||||||||||||||||||||||||||||||||||||||||||
| As of March 31, 2024 | As of March 31, 2024 | As of December 31, 2023 | As of March 31, 2023 | |||||||||||||||||||||||||||||||||||||||||||||||||||||||||||||||||||||||||||||||||||||||||||||||||||||||||||||||||||||||||||||||||||||||||||||||||||||
| Federally insured loans - Non-Nelnet Bank: | Federally insured loans - Non-Nelnet Bank: | |||||||||||||||||||||||||||||||||||||||||||||||||||||||||||||||||||||||||||||||||||||||||||||||||||||||||||||||||||||||||||||||||||||||||||||||||||||||
| Loans in-school/grace/deferment | Loans in-school/grace/deferment | $ | 641,914 | 5.0 | % | $ | 637,919 | 4.7 | % | $ | 839,566 | 5.2 | % | |||||||||||||||||||||||||||||||||||||||||||||||||||||||||||||||||||||||||||||||||||||||||||||||||||||||||||||||||||||||||||||||||||||||||||
| Loans in-school/grace/deferment | ||||||||||||||||||||||||||||||||||||||||||||||||||||||||||||||||||||||||||||||||||||||||||||||||||||||||||||||||||||||||||||||||||||||||||||||||||||||||
| Loans in-school/grace/deferment | ||||||||||||||||||||||||||||||||||||||||||||||||||||||||||||||||||||||||||||||||||||||||||||||||||||||||||||||||||||||||||||||||||||||||||||||||||||||||
| Loans in forbearance | ||||||||||||||||||||||||||||||||||||||||||||||||||||||||||||||||||||||||||||||||||||||||||||||||||||||||||||||||||||||||||||||||||||||||||||||||||||||||
| Loans in forbearance | ||||||||||||||||||||||||||||||||||||||||||||||||||||||||||||||||||||||||||||||||||||||||||||||||||||||||||||||||||||||||||||||||||||||||||||||||||||||||
| Loans in forbearance | Loans in forbearance | 984,738 | 7.6 | 1,103,181 | 8.1 | 1,160,048 | 7.1 | |||||||||||||||||||||||||||||||||||||||||||||||||||||||||||||||||||||||||||||||||||||||||||||||||||||||||||||||||||||||||||||||||||||||||||||||||
| Loans in repayment status: | Loans in repayment status: | |||||||||||||||||||||||||||||||||||||||||||||||||||||||||||||||||||||||||||||||||||||||||||||||||||||||||||||||||||||||||||||||||||||||||||||||||||||||
| Loans in repayment status: | ||||||||||||||||||||||||||||||||||||||||||||||||||||||||||||||||||||||||||||||||||||||||||||||||||||||||||||||||||||||||||||||||||||||||||||||||||||||||
| Loans in repayment status: | ||||||||||||||||||||||||||||||||||||||||||||||||||||||||||||||||||||||||||||||||||||||||||||||||||||||||||||||||||||||||||||||||||||||||||||||||||||||||
| Loans current | ||||||||||||||||||||||||||||||||||||||||||||||||||||||||||||||||||||||||||||||||||||||||||||||||||||||||||||||||||||||||||||||||||||||||||||||||||||||||
| Loans current | ||||||||||||||||||||||||||||||||||||||||||||||||||||||||||||||||||||||||||||||||||||||||||||||||||||||||||||||||||||||||||||||||||||||||||||||||||||||||
| Loans current | Loans current | 9,859,751 | 87.2 | % | 10,173,859 | 86.0 | % | 12,352,543 | 86.4 | % | 7,691,650 | 84.4 | 84.4 | % | 8,416,624 | 82.6 | 82.6 | % | 9,859,751 | 87.2 | 87.2 | % | ||||||||||||||||||||||||||||||||||||||||||||||||||||||||||||||||||||||||||||||||||||||||||||||||||||||||||||||||||||||||||||||||||
| Loans delinquent 31-60 days | Loans delinquent 31-60 days | 346,665 | 3.1 | 415,305 | 3.5 | 462,750 | 3.2 | |||||||||||||||||||||||||||||||||||||||||||||||||||||||||||||||||||||||||||||||||||||||||||||||||||||||||||||||||||||||||||||||||||||||||||||||||
| Loans delinquent 61-90 days | Loans delinquent 61-90 days | 254,353 | 2.2 | 253,565 | 2.2 | 282,810 | 2.0 | |||||||||||||||||||||||||||||||||||||||||||||||||||||||||||||||||||||||||||||||||||||||||||||||||||||||||||||||||||||||||||||||||||||||||||||||||
| Loans delinquent 91-120 days | Loans delinquent 91-120 days | 178,078 | 1.6 | 180,029 | 1.5 | 202,371 | 1.4 | |||||||||||||||||||||||||||||||||||||||||||||||||||||||||||||||||||||||||||||||||||||||||||||||||||||||||||||||||||||||||||||||||||||||||||||||||
| Loans delinquent 121-270 days | Loans delinquent 121-270 days | 440,695 | 3.9 | 534,410 | 4.5 | 712,753 | 5.0 | |||||||||||||||||||||||||||||||||||||||||||||||||||||||||||||||||||||||||||||||||||||||||||||||||||||||||||||||||||||||||||||||||||||||||||||||||
| Loans delinquent 271 days or greater | Loans delinquent 271 days or greater | 225,365 | 2.0 | 268,205 | 2.3 | 282,536 | 2.0 | |||||||||||||||||||||||||||||||||||||||||||||||||||||||||||||||||||||||||||||||||||||||||||||||||||||||||||||||||||||||||||||||||||||||||||||||||
| Total loans in repayment | Total loans in repayment | 11,304,907 | 87.4 | 100.0 | % | 11,825,373 | 87.2 | 100.0 | % | 14,295,763 | 87.7 | 100.0 | % | Total loans in repayment | 9,115,509 | 87.8 | 87.8 | 100.0 | 100.0 | % | 10,184,315 | 87.1 | 87.1 | 100.0 | 100.0 | % | 11,304,907 | 87.4 | 87.4 | 100.0 | 100.0 | % | ||||||||||||||||||||||||||||||||||||||||||||||||||||||||||||||||||||||||||||||||||||||||||||||||||||||||||||||||||||||||
| Total federally insured loans | Total federally insured loans | 12,931,559 | 100.0 | % | 13,566,473 | 100.0 | % | 16,295,377 | 100.0 | % | ||||||||||||||||||||||||||||||||||||||||||||||||||||||||||||||||||||||||||||||||||||||||||||||||||||||||||||||||||||||||||||||||||||||||||||||
| Accrued interest receivable | Accrued interest receivable | 791,476 | 808,150 | 770,853 | ||||||||||||||||||||||||||||||||||||||||||||||||||||||||||||||||||||||||||||||||||||||||||||||||||||||||||||||||||||||||||||||||||||||||||||||||||||
| Accrued interest receivable | ||||||||||||||||||||||||||||||||||||||||||||||||||||||||||||||||||||||||||||||||||||||||||||||||||||||||||||||||||||||||||||||||||||||||||||||||||||||||
| Accrued interest receivable | ||||||||||||||||||||||||||||||||||||||||||||||||||||||||||||||||||||||||||||||||||||||||||||||||||||||||||||||||||||||||||||||||||||||||||||||||||||||||
| Loan discount, net of unamortized premiums and deferred origination costs | ||||||||||||||||||||||||||||||||||||||||||||||||||||||||||||||||||||||||||||||||||||||||||||||||||||||||||||||||||||||||||||||||||||||||||||||||||||||||
| Loan discount, net of unamortized premiums and deferred origination costs | ||||||||||||||||||||||||||||||||||||||||||||||||||||||||||||||||||||||||||||||||||||||||||||||||||||||||||||||||||||||||||||||||||||||||||||||||||||||||
| Loan discount, net of unamortized premiums and deferred origination costs | Loan discount, net of unamortized premiums and deferred origination costs | (32,626) | (35,468) | (27,317) | ||||||||||||||||||||||||||||||||||||||||||||||||||||||||||||||||||||||||||||||||||||||||||||||||||||||||||||||||||||||||||||||||||||||||||||||||||||
| Allowance for loan losses | Allowance for loan losses | (79,331) | (83,593) | (95,995) | ||||||||||||||||||||||||||||||||||||||||||||||||||||||||||||||||||||||||||||||||||||||||||||||||||||||||||||||||||||||||||||||||||||||||||||||||||||
| Allowance for loan losses | ||||||||||||||||||||||||||||||||||||||||||||||||||||||||||||||||||||||||||||||||||||||||||||||||||||||||||||||||||||||||||||||||||||||||||||||||||||||||
| Allowance for loan losses | ||||||||||||||||||||||||||||||||||||||||||||||||||||||||||||||||||||||||||||||||||||||||||||||||||||||||||||||||||||||||||||||||||||||||||||||||||||||||
| Total federally insured loans and accrued interest receivable, net of allowance for loan losses | ||||||||||||||||||||||||||||||||||||||||||||||||||||||||||||||||||||||||||||||||||||||||||||||||||||||||||||||||||||||||||||||||||||||||||||||||||||||||
| Total federally insured loans and accrued interest receivable, net of allowance for loan losses | ||||||||||||||||||||||||||||||||||||||||||||||||||||||||||||||||||||||||||||||||||||||||||||||||||||||||||||||||||||||||||||||||||||||||||||||||||||||||
| Total federally insured loans and accrued interest receivable, net of allowance for loan losses | Total federally insured loans and accrued interest receivable, net of allowance for loan losses | $ | 13,611,078 | $ | 14,255,562 | $ | 16,942,918 | |||||||||||||||||||||||||||||||||||||||||||||||||||||||||||||||||||||||||||||||||||||||||||||||||||||||||||||||||||||||||||||||||||||||||||||||||
| Private education loans - Non-Nelnet Bank: | ||||||||||||||||||||||||||||||||||||||||||||||||||||||||||||||||||||||||||||||||||||||||||||||||||||||||||||||||||||||||||||||||||||||||||||||||||||||||
| Private education loans - Non-Nelnet Bank: | ||||||||||||||||||||||||||||||||||||||||||||||||||||||||||||||||||||||||||||||||||||||||||||||||||||||||||||||||||||||||||||||||||||||||||||||||||||||||
| Private education loans - Non-Nelnet Bank: | ||||||||||||||||||||||||||||||||||||||||||||||||||||||||||||||||||||||||||||||||||||||||||||||||||||||||||||||||||||||||||||||||||||||||||||||||||||||||
| Loans in-school/grace/deferment | ||||||||||||||||||||||||||||||||||||||||||||||||||||||||||||||||||||||||||||||||||||||||||||||||||||||||||||||||||||||||||||||||||||||||||||||||||||||||
| Loans in-school/grace/deferment | ||||||||||||||||||||||||||||||||||||||||||||||||||||||||||||||||||||||||||||||||||||||||||||||||||||||||||||||||||||||||||||||||||||||||||||||||||||||||
| Loans in-school/grace/deferment | ||||||||||||||||||||||||||||||||||||||||||||||||||||||||||||||||||||||||||||||||||||||||||||||||||||||||||||||||||||||||||||||||||||||||||||||||||||||||
| Loans in forbearance | ||||||||||||||||||||||||||||||||||||||||||||||||||||||||||||||||||||||||||||||||||||||||||||||||||||||||||||||||||||||||||||||||||||||||||||||||||||||||
| Loans in forbearance | ||||||||||||||||||||||||||||||||||||||||||||||||||||||||||||||||||||||||||||||||||||||||||||||||||||||||||||||||||||||||||||||||||||||||||||||||||||||||
| Loans in forbearance | ||||||||||||||||||||||||||||||||||||||||||||||||||||||||||||||||||||||||||||||||||||||||||||||||||||||||||||||||||||||||||||||||||||||||||||||||||||||||
| Loans in repayment status: | ||||||||||||||||||||||||||||||||||||||||||||||||||||||||||||||||||||||||||||||||||||||||||||||||||||||||||||||||||||||||||||||||||||||||||||||||||||||||
| Loans in repayment status: | ||||||||||||||||||||||||||||||||||||||||||||||||||||||||||||||||||||||||||||||||||||||||||||||||||||||||||||||||||||||||||||||||||||||||||||||||||||||||
| Loans in repayment status: | ||||||||||||||||||||||||||||||||||||||||||||||||||||||||||||||||||||||||||||||||||||||||||||||||||||||||||||||||||||||||||||||||||||||||||||||||||||||||
| Loans current | ||||||||||||||||||||||||||||||||||||||||||||||||||||||||||||||||||||||||||||||||||||||||||||||||||||||||||||||||||||||||||||||||||||||||||||||||||||||||
| Loans current | ||||||||||||||||||||||||||||||||||||||||||||||||||||||||||||||||||||||||||||||||||||||||||||||||||||||||||||||||||||||||||||||||||||||||||||||||||||||||
| Loans current | 243,637 | 97.4 | % | 257,639 | 97.1 | % | 220,921 | 97.5 | % | |||||||||||||||||||||||||||||||||||||||||||||||||||||||||||||||||||||||||||||||||||||||||||||||||||||||||||||||||||||||||||||||||||||||||||||||
| Loans delinquent 31-60 days | ||||||||||||||||||||||||||||||||||||||||||||||||||||||||||||||||||||||||||||||||||||||||||||||||||||||||||||||||||||||||||||||||||||||||||||||||||||||||
| Loans delinquent 61-90 days | ||||||||||||||||||||||||||||||||||||||||||||||||||||||||||||||||||||||||||||||||||||||||||||||||||||||||||||||||||||||||||||||||||||||||||||||||||||||||
| Loans delinquent 91 days or greater | ||||||||||||||||||||||||||||||||||||||||||||||||||||||||||||||||||||||||||||||||||||||||||||||||||||||||||||||||||||||||||||||||||||||||||||||||||||||||
| Total loans in repayment | Total loans in repayment | 250,002 | 95.6 | 100.0 | % | 265,316 | 95.7 | 100.0 | % | 226,599 | 93.8 | 100.0 | % | |||||||||||||||||||||||||||||||||||||||||||||||||||||||||||||||||||||||||||||||||||||||||||||||||||||||||||||||||||||||||||||||||||||||||||
| Total private education loans | ||||||||||||||||||||||||||||||||||||||||||||||||||||||||||||||||||||||||||||||||||||||||||||||||||||||||||||||||||||||||||||||||||||||||||||||||||||||||
| Accrued interest receivable | ||||||||||||||||||||||||||||||||||||||||||||||||||||||||||||||||||||||||||||||||||||||||||||||||||||||||||||||||||||||||||||||||||||||||||||||||||||||||
| Accrued interest receivable | ||||||||||||||||||||||||||||||||||||||||||||||||||||||||||||||||||||||||||||||||||||||||||||||||||||||||||||||||||||||||||||||||||||||||||||||||||||||||
| Accrued interest receivable | ||||||||||||||||||||||||||||||||||||||||||||||||||||||||||||||||||||||||||||||||||||||||||||||||||||||||||||||||||||||||||||||||||||||||||||||||||||||||
| Loan discount, net of unamortized premiums | ||||||||||||||||||||||||||||||||||||||||||||||||||||||||||||||||||||||||||||||||||||||||||||||||||||||||||||||||||||||||||||||||||||||||||||||||||||||||
| Loan discount, net of unamortized premiums | ||||||||||||||||||||||||||||||||||||||||||||||||||||||||||||||||||||||||||||||||||||||||||||||||||||||||||||||||||||||||||||||||||||||||||||||||||||||||
| Loan discount, net of unamortized premiums | ||||||||||||||||||||||||||||||||||||||||||||||||||||||||||||||||||||||||||||||||||||||||||||||||||||||||||||||||||||||||||||||||||||||||||||||||||||||||
| Allowance for loan losses | ||||||||||||||||||||||||||||||||||||||||||||||||||||||||||||||||||||||||||||||||||||||||||||||||||||||||||||||||||||||||||||||||||||||||||||||||||||||||
| Allowance for loan losses | ||||||||||||||||||||||||||||||||||||||||||||||||||||||||||||||||||||||||||||||||||||||||||||||||||||||||||||||||||||||||||||||||||||||||||||||||||||||||
| Allowance for loan losses | ||||||||||||||||||||||||||||||||||||||||||||||||||||||||||||||||||||||||||||||||||||||||||||||||||||||||||||||||||||||||||||||||||||||||||||||||||||||||
| Total private education loans and accrued interest receivable, net of allowance for loan losses | ||||||||||||||||||||||||||||||||||||||||||||||||||||||||||||||||||||||||||||||||||||||||||||||||||||||||||||||||||||||||||||||||||||||||||||||||||||||||
| Total private education loans and accrued interest receivable, net of allowance for loan losses | ||||||||||||||||||||||||||||||||||||||||||||||||||||||||||||||||||||||||||||||||||||||||||||||||||||||||||||||||||||||||||||||||||||||||||||||||||||||||
| Total private education loans and accrued interest receivable, net of allowance for loan losses | ||||||||||||||||||||||||||||||||||||||||||||||||||||||||||||||||||||||||||||||||||||||||||||||||||||||||||||||||||||||||||||||||||||||||||||||||||||||||
| As of March 31, 2023 | As of December 31, 2022 | As of March 31, 2022 | |||||||||||||||||||||||||||||||||||||||||||||||||||
| Private education loans - Non-Nelnet Bank: | |||||||||||||||||||||||||||||||||||||||||||||||||||||
| Loans in-school/grace/deferment | $ | 12,218 | 5.1 | % | $ | 12,756 | 5.1 | % | $ | 10,226 | 3.7 | % | |||||||||||||||||||||||||||||||||||||||||
| Loans in forbearance | 2,698 | 1.1 | 2,017 | 0.8 | 2,838 | 1.0 | |||||||||||||||||||||||||||||||||||||||||||||||
| Loans in repayment status: | |||||||||||||||||||||||||||||||||||||||||||||||||||||
| Loans current | 220,921 | 97.5 | % | 232,539 | 97.9 | % | 260,911 | 98.3 | % | ||||||||||||||||||||||||||||||||||||||||||||
| Loans delinquent 31-60 days | 2,014 | 0.9 | 2,410 | 1.0 | 1,699 | 0.6 | |||||||||||||||||||||||||||||||||||||||||||||||
| Loans delinquent 61-90 days | 931 | 0.4 | 767 | 0.3 | 1,040 | 0.4 | |||||||||||||||||||||||||||||||||||||||||||||||
| Loans delinquent 91 days or greater | 2,733 | 1.2 | 1,894 | 0.8 | 1,823 | 0.7 | |||||||||||||||||||||||||||||||||||||||||||||||
| Total loans in repayment | 226,599 | 93.8 | 100.0 | % | 237,610 | 94.1 | 100.0 | % | 265,473 | 95.3 | 100.0 | % | |||||||||||||||||||||||||||||||||||||||||
| Total private education loans | 241,515 | 100.0 | % | 252,383 | 100.0 | % | 278,537 | 100.0 | % | ||||||||||||||||||||||||||||||||||||||||||||
| Accrued interest receivable | 2,277 | 2,146 | 1,898 | ||||||||||||||||||||||||||||||||||||||||||||||||||
| Loan premium, net of unaccreted discount | 79 | (38) | (598) | ||||||||||||||||||||||||||||||||||||||||||||||||||
| Allowance for loan losses | (15,175) | (15,411) | (14,622) | ||||||||||||||||||||||||||||||||||||||||||||||||||
| Total private education loans and accrued interest receivable, net of allowance for loan losses | $ | 228,696 | $ | 239,080 | $ | 265,215 | |||||||||||||||||||||||||||||||||||||||||||||||
| Consumer and other loans - Non-Nelnet Bank: | |||||||||||||||||||||||||||||||||||||||||||||||||||||
| Loans in deferment | $ | 40 | 0.0 | % | $ | 109 | 0.0 | % | $ | 72 | 0.2 | % | |||||||||||||||||||||||||||||||||||||||||
| Loans in repayment status: | |||||||||||||||||||||||||||||||||||||||||||||||||||||
| Loans current | 304,414 | 98.3 | % | 346,812 | 98.9 | % | 43,424 | 97.3 | % | ||||||||||||||||||||||||||||||||||||||||||||
| Loans delinquent 31-60 days | 2,037 | 0.7 | 1,906 | 0.5 | 255 | 0.5 | |||||||||||||||||||||||||||||||||||||||||||||||
| Loans delinquent 61-90 days | 1,236 | 0.4 | 764 | 0.2 | 304 | 0.7 | |||||||||||||||||||||||||||||||||||||||||||||||
| Loans delinquent 91 days or greater | 1,819 | 0.6 | 1,324 | 0.4 | 658 | 1.5 | |||||||||||||||||||||||||||||||||||||||||||||||
| Total loans in repayment | 309,506 | 100.0 | 100.0 | % | 350,806 | 100.0 | 100.0 | % | 44,641 | 99.8 | 100.0 | % | |||||||||||||||||||||||||||||||||||||||||
| Total consumer and other loans | 309,546 | 100.0 | % | 350,915 | 100.0 | % | 44,713 | 100.0 | % | ||||||||||||||||||||||||||||||||||||||||||||
| Accrued interest receivable | 3,288 | 3,658 | 374 | ||||||||||||||||||||||||||||||||||||||||||||||||||
| Loan premium, net of unaccreted discount | 913 | (588) | 1,040 | ||||||||||||||||||||||||||||||||||||||||||||||||||
| Allowance for loan losses | (35,317) | (30,263) | (5,710) | ||||||||||||||||||||||||||||||||||||||||||||||||||
| Total consumer and other loans and accrued interest receivable, net of allowance for loan losses | $ | 278,430 | $ | 323,722 | $ | 40,417 | |||||||||||||||||||||||||||||||||||||||||||||||
| Federally insured loans - Nelnet Bank (a): | |||||||||||||||||||||||||||||||||||||||||||||||||||||
| Loans in-school/grace/deferment | $ | 151 | 0.3 | % | $ | 241 | 0.4 | % | $ | 286 | 0.3 | % | |||||||||||||||||||||||||||||||||||||||||
| Loans in forbearance | 1,046 | 1.6 | 981 | 1.5 | 948 | 1.2 | |||||||||||||||||||||||||||||||||||||||||||||||
| Loans in repayment status: | |||||||||||||||||||||||||||||||||||||||||||||||||||||
| Loans current | 60,895 | 97.9 | % | 63,225 | 97.8 | % | 80,421 | 98.6 | % | ||||||||||||||||||||||||||||||||||||||||||||
| Loans delinquent 30-59 days | 514 | 0.8 | 436 | 0.7 | 402 | 0.5 | |||||||||||||||||||||||||||||||||||||||||||||||
| Loans delinquent 60-89 days | 120 | 0.2 | 466 | 0.7 | 427 | 0.5 | |||||||||||||||||||||||||||||||||||||||||||||||
| Loans delinquent 90-119 days | 255 | 0.4 | 222 | 0.3 | 90 | 0.1 | |||||||||||||||||||||||||||||||||||||||||||||||
| Loans delinquent 120-270 days | 319 | 0.5 | 183 | 0.3 | 157 | 0.2 | |||||||||||||||||||||||||||||||||||||||||||||||
| Loans delinquent 271 days or greater | 99 | 0.2 | 159 | 0.2 | 58 | 0.1 | |||||||||||||||||||||||||||||||||||||||||||||||
| Total loans in repayment | 62,202 | 98.1 | 100.0 | % | 64,691 | 98.1 | 100.0 | % | 81,555 | 98.5 | 100.0 | % | |||||||||||||||||||||||||||||||||||||||||
| Total federally insured loans | 63,399 | 100.0 | % | 65,913 | 100.0 | % | 82,789 | 100.0 | % | ||||||||||||||||||||||||||||||||||||||||||||
| Accrued interest receivable | 1,857 | 1,758 | 1,231 | ||||||||||||||||||||||||||||||||||||||||||||||||||
| Loan premium | 18 | 20 | 25 | ||||||||||||||||||||||||||||||||||||||||||||||||||
| Allowance for loan losses | (160) | (170) | (247) | ||||||||||||||||||||||||||||||||||||||||||||||||||
| Total federally insured loans and accrued interest receivable, net of allowance for loan losses | $ | 65,114 | $ | 67,521 | $ | 83,798 | |||||||||||||||||||||||||||||||||||||||||||||||
| As of March 31, 2024 | As of March 31, 2024 | As of December 31, 2023 | As of March 31, 2023 | |||||||||||||||||||||||||||||||||||||||||||||||||||||||||||||||||||||||||||||||||||||||||||||||||||||||||||||||||||||||||||||||||||||||||||||||||||||
| Consumer and other loans - Non-Nelnet Bank: | ||||||||||||||||||||||||||||||||||||||||||||||||||||||||||||||||||||||||||||||||||||||||||||||||||||||||||||||||||||||||||||||||||||||||||||||||||||||||
| Loans in deferment | ||||||||||||||||||||||||||||||||||||||||||||||||||||||||||||||||||||||||||||||||||||||||||||||||||||||||||||||||||||||||||||||||||||||||||||||||||||||||
| Loans in deferment | ||||||||||||||||||||||||||||||||||||||||||||||||||||||||||||||||||||||||||||||||||||||||||||||||||||||||||||||||||||||||||||||||||||||||||||||||||||||||
| Loans in deferment | ||||||||||||||||||||||||||||||||||||||||||||||||||||||||||||||||||||||||||||||||||||||||||||||||||||||||||||||||||||||||||||||||||||||||||||||||||||||||
| Loans in repayment status: | ||||||||||||||||||||||||||||||||||||||||||||||||||||||||||||||||||||||||||||||||||||||||||||||||||||||||||||||||||||||||||||||||||||||||||||||||||||||||
| Loans in repayment status: | ||||||||||||||||||||||||||||||||||||||||||||||||||||||||||||||||||||||||||||||||||||||||||||||||||||||||||||||||||||||||||||||||||||||||||||||||||||||||
| Loans in repayment status: | ||||||||||||||||||||||||||||||||||||||||||||||||||||||||||||||||||||||||||||||||||||||||||||||||||||||||||||||||||||||||||||||||||||||||||||||||||||||||
| Loans current | ||||||||||||||||||||||||||||||||||||||||||||||||||||||||||||||||||||||||||||||||||||||||||||||||||||||||||||||||||||||||||||||||||||||||||||||||||||||||
| Loans current | ||||||||||||||||||||||||||||||||||||||||||||||||||||||||||||||||||||||||||||||||||||||||||||||||||||||||||||||||||||||||||||||||||||||||||||||||||||||||
| Loans current | 150,947 | 97.2 | % | 81,195 | 94.6 | % | 304,414 | 98.3 | % | |||||||||||||||||||||||||||||||||||||||||||||||||||||||||||||||||||||||||||||||||||||||||||||||||||||||||||||||||||||||||||||||||||||||||||||||
| Loans delinquent 31-60 days | ||||||||||||||||||||||||||||||||||||||||||||||||||||||||||||||||||||||||||||||||||||||||||||||||||||||||||||||||||||||||||||||||||||||||||||||||||||||||
| Loans delinquent 61-90 days | ||||||||||||||||||||||||||||||||||||||||||||||||||||||||||||||||||||||||||||||||||||||||||||||||||||||||||||||||||||||||||||||||||||||||||||||||||||||||
| Loans delinquent 91 days or greater | ||||||||||||||||||||||||||||||||||||||||||||||||||||||||||||||||||||||||||||||||||||||||||||||||||||||||||||||||||||||||||||||||||||||||||||||||||||||||
| Total loans in repayment | Total loans in repayment | 155,254 | 100.0 | 100.0 | % | 85,789 | 99.8 | 100.0 | % | 309,506 | 100.0 | 100.0 | % | |||||||||||||||||||||||||||||||||||||||||||||||||||||||||||||||||||||||||||||||||||||||||||||||||||||||||||||||||||||||||||||||||||||||||||
| Total consumer and other loans | ||||||||||||||||||||||||||||||||||||||||||||||||||||||||||||||||||||||||||||||||||||||||||||||||||||||||||||||||||||||||||||||||||||||||||||||||||||||||
| Accrued interest receivable | ||||||||||||||||||||||||||||||||||||||||||||||||||||||||||||||||||||||||||||||||||||||||||||||||||||||||||||||||||||||||||||||||||||||||||||||||||||||||
| Accrued interest receivable | ||||||||||||||||||||||||||||||||||||||||||||||||||||||||||||||||||||||||||||||||||||||||||||||||||||||||||||||||||||||||||||||||||||||||||||||||||||||||
| Accrued interest receivable | ||||||||||||||||||||||||||||||||||||||||||||||||||||||||||||||||||||||||||||||||||||||||||||||||||||||||||||||||||||||||||||||||||||||||||||||||||||||||
| Loan discount, net of unamortized premiums | ||||||||||||||||||||||||||||||||||||||||||||||||||||||||||||||||||||||||||||||||||||||||||||||||||||||||||||||||||||||||||||||||||||||||||||||||||||||||
| Loan discount, net of unamortized premiums | ||||||||||||||||||||||||||||||||||||||||||||||||||||||||||||||||||||||||||||||||||||||||||||||||||||||||||||||||||||||||||||||||||||||||||||||||||||||||
| Loan discount, net of unamortized premiums | ||||||||||||||||||||||||||||||||||||||||||||||||||||||||||||||||||||||||||||||||||||||||||||||||||||||||||||||||||||||||||||||||||||||||||||||||||||||||
| Allowance for loan losses | ||||||||||||||||||||||||||||||||||||||||||||||||||||||||||||||||||||||||||||||||||||||||||||||||||||||||||||||||||||||||||||||||||||||||||||||||||||||||
| Allowance for loan losses | ||||||||||||||||||||||||||||||||||||||||||||||||||||||||||||||||||||||||||||||||||||||||||||||||||||||||||||||||||||||||||||||||||||||||||||||||||||||||
| Allowance for loan losses | ||||||||||||||||||||||||||||||||||||||||||||||||||||||||||||||||||||||||||||||||||||||||||||||||||||||||||||||||||||||||||||||||||||||||||||||||||||||||
| Total consumer and other loans and accrued interest receivable, net of allowance for loan losses | ||||||||||||||||||||||||||||||||||||||||||||||||||||||||||||||||||||||||||||||||||||||||||||||||||||||||||||||||||||||||||||||||||||||||||||||||||||||||
| Total consumer and other loans and accrued interest receivable, net of allowance for loan losses | ||||||||||||||||||||||||||||||||||||||||||||||||||||||||||||||||||||||||||||||||||||||||||||||||||||||||||||||||||||||||||||||||||||||||||||||||||||||||
| Total consumer and other loans and accrued interest receivable, net of allowance for loan losses | ||||||||||||||||||||||||||||||||||||||||||||||||||||||||||||||||||||||||||||||||||||||||||||||||||||||||||||||||||||||||||||||||||||||||||||||||||||||||
| Private education loans - Nelnet Bank (a): | ||||||||||||||||||||||||||||||||||||||||||||||||||||||||||||||||||||||||||||||||||||||||||||||||||||||||||||||||||||||||||||||||||||||||||||||||||||||||
| Private education loans - Nelnet Bank (a): | ||||||||||||||||||||||||||||||||||||||||||||||||||||||||||||||||||||||||||||||||||||||||||||||||||||||||||||||||||||||||||||||||||||||||||||||||||||||||
| As of March 31, 2023 | As of December 31, 2022 | As of March 31, 2022 | ||||||||||||||||||||||||||||||||||||||||||||||||||||||||||||||||||||||||||||||||||||||||||||||||||||||||||||||||||||||||||||||||||||||||||||||||||||||
| Private education loans - Nelnet Bank (a): | Private education loans - Nelnet Bank (a): | |||||||||||||||||||||||||||||||||||||||||||||||||||||||||||||||||||||||||||||||||||||||||||||||||||||||||||||||||||||||||||||||||||||||||||||||||||||||
| Loans in-school/grace/deferment | Loans in-school/grace/deferment | $ | 17,021 | 4.8 | % | $ | 11,580 | 3.3 | % | $ | 497 | 0.2 | % | |||||||||||||||||||||||||||||||||||||||||||||||||||||||||||||||||||||||||||||||||||||||||||||||||||||||||||||||||||||||||||||||||||||||||||
| Loans in-school/grace/deferment | ||||||||||||||||||||||||||||||||||||||||||||||||||||||||||||||||||||||||||||||||||||||||||||||||||||||||||||||||||||||||||||||||||||||||||||||||||||||||
| Loans in-school/grace/deferment | ||||||||||||||||||||||||||||||||||||||||||||||||||||||||||||||||||||||||||||||||||||||||||||||||||||||||||||||||||||||||||||||||||||||||||||||||||||||||
| Loans in forbearance | ||||||||||||||||||||||||||||||||||||||||||||||||||||||||||||||||||||||||||||||||||||||||||||||||||||||||||||||||||||||||||||||||||||||||||||||||||||||||
| Loans in forbearance | ||||||||||||||||||||||||||||||||||||||||||||||||||||||||||||||||||||||||||||||||||||||||||||||||||||||||||||||||||||||||||||||||||||||||||||||||||||||||
| Loans in forbearance | Loans in forbearance | 681 | 0.2 | 864 | 0.2 | 317 | 0.1 | |||||||||||||||||||||||||||||||||||||||||||||||||||||||||||||||||||||||||||||||||||||||||||||||||||||||||||||||||||||||||||||||||||||||||||||||||
| Loans in repayment status: | Loans in repayment status: | |||||||||||||||||||||||||||||||||||||||||||||||||||||||||||||||||||||||||||||||||||||||||||||||||||||||||||||||||||||||||||||||||||||||||||||||||||||||
| Loans in repayment status: | ||||||||||||||||||||||||||||||||||||||||||||||||||||||||||||||||||||||||||||||||||||||||||||||||||||||||||||||||||||||||||||||||||||||||||||||||||||||||
| Loans in repayment status: | ||||||||||||||||||||||||||||||||||||||||||||||||||||||||||||||||||||||||||||||||||||||||||||||||||||||||||||||||||||||||||||||||||||||||||||||||||||||||
| Loans current | ||||||||||||||||||||||||||||||||||||||||||||||||||||||||||||||||||||||||||||||||||||||||||||||||||||||||||||||||||||||||||||||||||||||||||||||||||||||||
| Loans current | ||||||||||||||||||||||||||||||||||||||||||||||||||||||||||||||||||||||||||||||||||||||||||||||||||||||||||||||||||||||||||||||||||||||||||||||||||||||||
| Loans current | Loans current | 336,967 | 99.7 | % | 340,830 | 99.8 | % | 284,081 | 99.8 | % | 318,906 | 99.4 | 99.4 | % | 331,580 | 99.4 | 99.4 | % | 336,967 | 99.7 | 99.7 | % | ||||||||||||||||||||||||||||||||||||||||||||||||||||||||||||||||||||||||||||||||||||||||||||||||||||||||||||||||||||||||||||||||||
| Loans delinquent 30-59 days | Loans delinquent 30-59 days | 388 | 0.1 | 167 | 0.1 | 422 | 0.2 | |||||||||||||||||||||||||||||||||||||||||||||||||||||||||||||||||||||||||||||||||||||||||||||||||||||||||||||||||||||||||||||||||||||||||||||||||
| Loans delinquent 60-89 days | Loans delinquent 60-89 days | 536 | 0.2 | 32 | 0.0 | 78 | 0.0 | |||||||||||||||||||||||||||||||||||||||||||||||||||||||||||||||||||||||||||||||||||||||||||||||||||||||||||||||||||||||||||||||||||||||||||||||||
| Loans delinquent 90 days or greater | Loans delinquent 90 days or greater | 112 | — | 409 | 0.1 | 73 | 0.0 | |||||||||||||||||||||||||||||||||||||||||||||||||||||||||||||||||||||||||||||||||||||||||||||||||||||||||||||||||||||||||||||||||||||||||||||||||
| Total loans in repayment | Total loans in repayment | 338,003 | 95.0 | 100.0 | % | 341,438 | 96.5 | 100.0 | % | 284,654 | 99.7 | 100.0 | % | Total loans in repayment | 320,790 | 87.9 | 87.9 | 100.0 | 100.0 | % | 333,278 | 92.4 | 92.4 | 100.0 | 100.0 | % | 338,003 | 95.0 | 95.0 | 100.0 | 100.0 | % | ||||||||||||||||||||||||||||||||||||||||||||||||||||||||||||||||||||||||||||||||||||||||||||||||||||||||||||||||||||||||
| Total private education loans | Total private education loans | 355,705 | 100.0 | % | 353,882 | 100.0 | % | 285,468 | 100.0 | % | ||||||||||||||||||||||||||||||||||||||||||||||||||||||||||||||||||||||||||||||||||||||||||||||||||||||||||||||||||||||||||||||||||||||||||||||
| Accrued interest receivable | Accrued interest receivable | 1,385 | 1,152 | 418 | ||||||||||||||||||||||||||||||||||||||||||||||||||||||||||||||||||||||||||||||||||||||||||||||||||||||||||||||||||||||||||||||||||||||||||||||||||||
| Accrued interest receivable | ||||||||||||||||||||||||||||||||||||||||||||||||||||||||||||||||||||||||||||||||||||||||||||||||||||||||||||||||||||||||||||||||||||||||||||||||||||||||
| Accrued interest receivable | ||||||||||||||||||||||||||||||||||||||||||||||||||||||||||||||||||||||||||||||||||||||||||||||||||||||||||||||||||||||||||||||||||||||||||||||||||||||||
| Deferred origination costs, net of unaccreted discount | ||||||||||||||||||||||||||||||||||||||||||||||||||||||||||||||||||||||||||||||||||||||||||||||||||||||||||||||||||||||||||||||||||||||||||||||||||||||||
| Deferred origination costs, net of unaccreted discount | ||||||||||||||||||||||||||||||||||||||||||||||||||||||||||||||||||||||||||||||||||||||||||||||||||||||||||||||||||||||||||||||||||||||||||||||||||||||||
| Deferred origination costs, net of unaccreted discount | Deferred origination costs, net of unaccreted discount | 5,400 | 5,360 | 4,593 | ||||||||||||||||||||||||||||||||||||||||||||||||||||||||||||||||||||||||||||||||||||||||||||||||||||||||||||||||||||||||||||||||||||||||||||||||||||
| Allowance for loan losses | Allowance for loan losses | (2,894) | (2,390) | (1,251) | ||||||||||||||||||||||||||||||||||||||||||||||||||||||||||||||||||||||||||||||||||||||||||||||||||||||||||||||||||||||||||||||||||||||||||||||||||||
| Allowance for loan losses | ||||||||||||||||||||||||||||||||||||||||||||||||||||||||||||||||||||||||||||||||||||||||||||||||||||||||||||||||||||||||||||||||||||||||||||||||||||||||
| Allowance for loan losses | ||||||||||||||||||||||||||||||||||||||||||||||||||||||||||||||||||||||||||||||||||||||||||||||||||||||||||||||||||||||||||||||||||||||||||||||||||||||||
| Total private education loans and accrued interest receivable, net of allowance for loan losses | ||||||||||||||||||||||||||||||||||||||||||||||||||||||||||||||||||||||||||||||||||||||||||||||||||||||||||||||||||||||||||||||||||||||||||||||||||||||||
| Total private education loans and accrued interest receivable, net of allowance for loan losses | ||||||||||||||||||||||||||||||||||||||||||||||||||||||||||||||||||||||||||||||||||||||||||||||||||||||||||||||||||||||||||||||||||||||||||||||||||||||||
| Total private education loans and accrued interest receivable, net of allowance for loan losses | Total private education loans and accrued interest receivable, net of allowance for loan losses | $ | 359,596 | $ | 358,004 | $ | 289,228 | |||||||||||||||||||||||||||||||||||||||||||||||||||||||||||||||||||||||||||||||||||||||||||||||||||||||||||||||||||||||||||||||||||||||||||||||||
| Consumer and other loans - Nelnet Bank (a): | Consumer and other loans - Nelnet Bank (a): | |||||||||||||||||||||||||||||||||||||||||||||||||||||||||||||||||||||||||||||||||||||||||||||||||||||||||||||||||||||||||||||||||||||||||||||||||||||||
| Consumer and other loans - Nelnet Bank (a): | ||||||||||||||||||||||||||||||||||||||||||||||||||||||||||||||||||||||||||||||||||||||||||||||||||||||||||||||||||||||||||||||||||||||||||||||||||||||||
| Consumer and other loans - Nelnet Bank (a): | ||||||||||||||||||||||||||||||||||||||||||||||||||||||||||||||||||||||||||||||||||||||||||||||||||||||||||||||||||||||||||||||||||||||||||||||||||||||||
| Loans in deferment | Loans in deferment | $ | — | — | % | |||||||||||||||||||||||||||||||||||||||||||||||||||||||||||||||||||||||||||||||||||||||||||||||||||||||||||||||||||||||||||||||||||||||||||||||||||
| Loans in deferment | ||||||||||||||||||||||||||||||||||||||||||||||||||||||||||||||||||||||||||||||||||||||||||||||||||||||||||||||||||||||||||||||||||||||||||||||||||||||||
| Loans in deferment | ||||||||||||||||||||||||||||||||||||||||||||||||||||||||||||||||||||||||||||||||||||||||||||||||||||||||||||||||||||||||||||||||||||||||||||||||||||||||
| Loans in repayment status: | Loans in repayment status: | |||||||||||||||||||||||||||||||||||||||||||||||||||||||||||||||||||||||||||||||||||||||||||||||||||||||||||||||||||||||||||||||||||||||||||||||||||||||
| Loans in repayment status: | ||||||||||||||||||||||||||||||||||||||||||||||||||||||||||||||||||||||||||||||||||||||||||||||||||||||||||||||||||||||||||||||||||||||||||||||||||||||||
| Loans in repayment status: | ||||||||||||||||||||||||||||||||||||||||||||||||||||||||||||||||||||||||||||||||||||||||||||||||||||||||||||||||||||||||||||||||||||||||||||||||||||||||
| Loans current | ||||||||||||||||||||||||||||||||||||||||||||||||||||||||||||||||||||||||||||||||||||||||||||||||||||||||||||||||||||||||||||||||||||||||||||||||||||||||
| Loans current | ||||||||||||||||||||||||||||||||||||||||||||||||||||||||||||||||||||||||||||||||||||||||||||||||||||||||||||||||||||||||||||||||||||||||||||||||||||||||
| Loans current | Loans current | 19,903 | 100.0 | % | 115,152 | 96.9 | 96.9 | % | 69,584 | 96.3 | 96.3 | % | 19,903 | 100.0 | 100.0 | % | ||||||||||||||||||||||||||||||||||||||||||||||||||||||||||||||||||||||||||||||||||||||||||||||||||||||||||||||||||||||||||||||||||||||||
| Loans delinquent 30-59 days | Loans delinquent 30-59 days | — | — | |||||||||||||||||||||||||||||||||||||||||||||||||||||||||||||||||||||||||||||||||||||||||||||||||||||||||||||||||||||||||||||||||||||||||||||||||||||
| Loans delinquent 60-89 days | Loans delinquent 60-89 days | — | — | |||||||||||||||||||||||||||||||||||||||||||||||||||||||||||||||||||||||||||||||||||||||||||||||||||||||||||||||||||||||||||||||||||||||||||||||||||||
| Loans delinquent 90 days or greater | Loans delinquent 90 days or greater | — | — | |||||||||||||||||||||||||||||||||||||||||||||||||||||||||||||||||||||||||||||||||||||||||||||||||||||||||||||||||||||||||||||||||||||||||||||||||||||
| Total loans in repayment | Total loans in repayment | 19,903 | 100.0 | 100.0 | % | Total loans in repayment | 118,816 | 99.9 | 99.9 | 100.0 | 100.0 | % | 72,249 | 99.9 | 99.9 | 100.0 | 100.0 | % | 19,903 | 100.0 | 100.0 | 100.0 | 100.0 | % | ||||||||||||||||||||||||||||||||||||||||||||||||||||||||||||||||||||||||||||||||||||||||||||||||||||||||||||||||||||||||||||||||
| Total consumer and other loans | Total consumer and other loans | 19,903 | 100.0 | % | ||||||||||||||||||||||||||||||||||||||||||||||||||||||||||||||||||||||||||||||||||||||||||||||||||||||||||||||||||||||||||||||||||||||||||||||||||||
| Accrued interest receivable | Accrued interest receivable | 117 | ||||||||||||||||||||||||||||||||||||||||||||||||||||||||||||||||||||||||||||||||||||||||||||||||||||||||||||||||||||||||||||||||||||||||||||||||||||||
| Loan premium | 1 | |||||||||||||||||||||||||||||||||||||||||||||||||||||||||||||||||||||||||||||||||||||||||||||||||||||||||||||||||||||||||||||||||||||||||||||||||||||||
| Accrued interest receivable | ||||||||||||||||||||||||||||||||||||||||||||||||||||||||||||||||||||||||||||||||||||||||||||||||||||||||||||||||||||||||||||||||||||||||||||||||||||||||
| Accrued interest receivable | ||||||||||||||||||||||||||||||||||||||||||||||||||||||||||||||||||||||||||||||||||||||||||||||||||||||||||||||||||||||||||||||||||||||||||||||||||||||||
| Loan premium, net of unaccreted discount | ||||||||||||||||||||||||||||||||||||||||||||||||||||||||||||||||||||||||||||||||||||||||||||||||||||||||||||||||||||||||||||||||||||||||||||||||||||||||
| Loan premium, net of unaccreted discount | ||||||||||||||||||||||||||||||||||||||||||||||||||||||||||||||||||||||||||||||||||||||||||||||||||||||||||||||||||||||||||||||||||||||||||||||||||||||||
| Loan premium, net of unaccreted discount | ||||||||||||||||||||||||||||||||||||||||||||||||||||||||||||||||||||||||||||||||||||||||||||||||||||||||||||||||||||||||||||||||||||||||||||||||||||||||
| Allowance for loan losses | ||||||||||||||||||||||||||||||||||||||||||||||||||||||||||||||||||||||||||||||||||||||||||||||||||||||||||||||||||||||||||||||||||||||||||||||||||||||||
| Allowance for loan losses | ||||||||||||||||||||||||||||||||||||||||||||||||||||||||||||||||||||||||||||||||||||||||||||||||||||||||||||||||||||||||||||||||||||||||||||||||||||||||
| Allowance for loan losses | Allowance for loan losses | (1,827) | ||||||||||||||||||||||||||||||||||||||||||||||||||||||||||||||||||||||||||||||||||||||||||||||||||||||||||||||||||||||||||||||||||||||||||||||||||||||
| Total consumer and other loans and accrued interest receivable, net of allowance for loan losses | Total consumer and other loans and accrued interest receivable, net of allowance for loan losses | $ | 18,194 | |||||||||||||||||||||||||||||||||||||||||||||||||||||||||||||||||||||||||||||||||||||||||||||||||||||||||||||||||||||||||||||||||||||||||||||||||||||
| Total consumer and other loans and accrued interest receivable, net of allowance for loan losses | ||||||||||||||||||||||||||||||||||||||||||||||||||||||||||||||||||||||||||||||||||||||||||||||||||||||||||||||||||||||||||||||||||||||||||||||||||||||||
| Total consumer and other loans and accrued interest receivable, net of allowance for loan losses | ||||||||||||||||||||||||||||||||||||||||||||||||||||||||||||||||||||||||||||||||||||||||||||||||||||||||||||||||||||||||||||||||||||||||||||||||||||||||
| Loan balance as of March 31, 2023 | |||||||||||||||||||||||||||||
| Three months ended March 31, 2023 | 2022 | 2021 | 2020 | Total | |||||||||||||||||||||||||
| FICO at origination: | |||||||||||||||||||||||||||||
| Less than 705 | $ | 836 | 5,956 | 5,258 | 344 | 12,394 | |||||||||||||||||||||||
| 705 - 734 | 2,657 | 23,313 | 9,979 | 536 | 36,485 | ||||||||||||||||||||||||
| 735 - 764 | 2,874 | 35,250 | 16,284 | 1,419 | 55,827 | ||||||||||||||||||||||||
| 765 - 794 | 1,413 | 56,325 | 29,900 | 1,579 | 89,217 | ||||||||||||||||||||||||
| Greater than 794 | 3,006 | 86,055 | 66,882 | 5,839 | 161,782 | ||||||||||||||||||||||||
| $ | 10,786 | 206,899 | 128,303 | 9,717 | 355,705 | ||||||||||||||||||||||||
| Loan balance as of March 31, 2024 | |||||||||||||||||||||||||||||||||||
| Three months ended March 31, 2024 | 2023 | 2022 | 2021 | 2020 | Total | ||||||||||||||||||||||||||||||
| FICO at origination: | |||||||||||||||||||||||||||||||||||
| Less than 705 | $ | 380 | 4,175 | 5,349 | 4,524 | 381 | 14,809 | ||||||||||||||||||||||||||||
| 705 - 734 | 834 | 9,946 | 21,468 | 8,410 | 519 | 41,177 | |||||||||||||||||||||||||||||
| 735 - 764 | 954 | 9,479 | 32,227 | 14,383 | 1,338 | 58,381 | |||||||||||||||||||||||||||||
| 765 - 794 | 625 | 6,815 | 50,588 | 26,414 | 1,322 | 85,764 | |||||||||||||||||||||||||||||
| Greater than 794 | 1,523 | 18,207 | 75,304 | 56,079 | 4,979 | 156,092 | |||||||||||||||||||||||||||||
| No FICO score available or required | 2,488 | 6,055 | — | — | — | 8,543 | |||||||||||||||||||||||||||||
| $ | 6,804 | 54,677 | 184,936 | 109,810 | 8,539 | 364,766 | |||||||||||||||||||||||||||||
| Loan balance as of December 31, 2023 | |||||||||||||||||||||||||||||
| 2023 | 2022 | 2021 | 2020 | Total | |||||||||||||||||||||||||
| FICO at origination: | |||||||||||||||||||||||||||||
| Less than 705 | $ | 3,840 | 5,495 | 4,647 | 386 | 14,368 | |||||||||||||||||||||||
| 705 - 734 | 9,534 | 21,961 | 8,805 | 525 | 40,825 | ||||||||||||||||||||||||
| 735 - 764 | 8,648 | 32,969 | 14,910 | 1,358 | 57,885 | ||||||||||||||||||||||||
| 765 - 794 | 5,776 | 52,045 | 27,221 | 1,374 | 86,416 | ||||||||||||||||||||||||
| Greater than 794 | 15,057 | 77,996 | 58,695 | 5,226 | 156,974 | ||||||||||||||||||||||||
| No FICO score available or required | 4,052 | — | — | — | 4,052 | ||||||||||||||||||||||||
| $ | 46,907 | 190,466 | 114,278 | 8,869 | 360,520 | ||||||||||||||||||||||||
| Loan balance as of March 31, 2024 | |||||||||||||||||||||||||||||||||||
| Three months ended March 31, 2024 | 2023 | 2022 | 2021 | 2020 | Total | ||||||||||||||||||||||||||||||
| FICO at origination: | |||||||||||||||||||||||||||||||||||
| Less than 720 | $ | 12,913 | 18,324 | — | — | — | 31,237 | ||||||||||||||||||||||||||||
| 720 - 769 | 21,017 | 29,900 | 48 | — | — | 50,965 | |||||||||||||||||||||||||||||
| Greater than 769 | 21,359 | 14,280 | 108 | — | — | 35,747 | |||||||||||||||||||||||||||||
| No FICO score available or required | 230 | 441 | 282 | 55 | — | 1,008 | |||||||||||||||||||||||||||||
| $ | 55,519 | 62,945 | 438 | 55 | — | 118,957 | |||||||||||||||||||||||||||||
| Loan balance as of December 31, 2023 | |||||||||||||||||||||||||||||
| 2023 | 2022 | 2021 | 2020 | Total | |||||||||||||||||||||||||
| FICO at origination: | |||||||||||||||||||||||||||||
| Less than 720 | $ | 21,412 | — | — | — | 21,412 | |||||||||||||||||||||||
| 720 - 769 | 33,571 | 51 | — | — | 33,622 | ||||||||||||||||||||||||
| Greater than 769 | 16,484 | 109 | — | — | 16,593 | ||||||||||||||||||||||||
| No FICO score available or required | 386 | 284 | 55 | — | 725 | ||||||||||||||||||||||||
| $ | 71,853 | 444 | 55 | — | 72,352 | ||||||||||||||||||||||||
| Loan balance as of December 31, 2022 | |||||||||||||||||||||||
| 2022 | 2021 | 2020 | Total | ||||||||||||||||||||
| FICO at origination: | |||||||||||||||||||||||
| Less than 705 | $ | 5,898 | 5,389 | 348 | 11,635 | ||||||||||||||||||
| 705 - 734 | 23,392 | 10,543 | 542 | 34,477 | |||||||||||||||||||
| 735 - 764 | 35,456 | 16,686 | 1,473 | 53,615 | |||||||||||||||||||
| 765 - 794 | 57,141 | 31,035 | 1,622 | 89,798 | |||||||||||||||||||
| Greater than 794 | 87,959 | 70,135 | 6,263 | 164,357 | |||||||||||||||||||
| $ | 209,846 | 133,788 | 10,248 | 353,882 | |||||||||||||||||||
| Three months ended March 31, 2023 | 2022 | 2021 | 2020 | 2019 | Prior years | Total | |||||||||||||||||||||||||||||||||||||||||||||||||||||||||||||||||||||||||||||||||||||||||||||||||||
| Three months ended March 31, 2024 | Three months ended March 31, 2024 | 2023 | 2022 | 2021 | 2020 | Prior years | Total | ||||||||||||||||||||||||||||||||||||||||||||||||||||||||||||||||||||||||||||||||||||||||||||||||||
| Private education loans - Non-Nelnet Bank: | Private education loans - Non-Nelnet Bank: | ||||||||||||||||||||||||||||||||||||||||||||||||||||||||||||||||||||||||||||||||||||||||||||||||||||||||
| Loans in-school/grace/deferment | |||||||||||||||||||||||||||||||||||||||||||||||||||||||||||||||||||||||||||||||||||||||||||||||||||||||||
| Loans in-school/grace/deferment | |||||||||||||||||||||||||||||||||||||||||||||||||||||||||||||||||||||||||||||||||||||||||||||||||||||||||
| Loans in-school/grace/deferment | Loans in-school/grace/deferment | $ | — | 1,780 | 5,581 | 1,284 | 2,080 | 1,493 | 12,218 | ||||||||||||||||||||||||||||||||||||||||||||||||||||||||||||||||||||||||||||||||||||||||||||||||
| Loans in forbearance | Loans in forbearance | — | — | 79 | 804 | 808 | 1,007 | 2,698 | |||||||||||||||||||||||||||||||||||||||||||||||||||||||||||||||||||||||||||||||||||||||||||||||||
| Loans in repayment status: | Loans in repayment status: | ||||||||||||||||||||||||||||||||||||||||||||||||||||||||||||||||||||||||||||||||||||||||||||||||||||||||
| Loans current | |||||||||||||||||||||||||||||||||||||||||||||||||||||||||||||||||||||||||||||||||||||||||||||||||||||||||
| Loans current | |||||||||||||||||||||||||||||||||||||||||||||||||||||||||||||||||||||||||||||||||||||||||||||||||||||||||
| Loans current | Loans current | 116 | 4,009 | 4,057 | 51,441 | 40,385 | 120,913 | 220,921 | |||||||||||||||||||||||||||||||||||||||||||||||||||||||||||||||||||||||||||||||||||||||||||||||||
| Loans delinquent 31-60 days | Loans delinquent 31-60 days | — | 14 | 19 | 103 | 252 | 1,626 | 2,014 | |||||||||||||||||||||||||||||||||||||||||||||||||||||||||||||||||||||||||||||||||||||||||||||||||
| Loans delinquent 61-90 days | Loans delinquent 61-90 days | — | — | — | — | 71 | 860 | 931 | |||||||||||||||||||||||||||||||||||||||||||||||||||||||||||||||||||||||||||||||||||||||||||||||||
| Loans delinquent 91 days or greater | Loans delinquent 91 days or greater | — | — | 5 | 35 | 441 | 2,252 | 2,733 | |||||||||||||||||||||||||||||||||||||||||||||||||||||||||||||||||||||||||||||||||||||||||||||||||
| Total loans in repayment | Total loans in repayment | 116 | 4,023 | 4,081 | 51,579 | 41,149 | 125,651 | 226,599 | |||||||||||||||||||||||||||||||||||||||||||||||||||||||||||||||||||||||||||||||||||||||||||||||||
| Total private education loans | Total private education loans | $ | 116 | 5,803 | 9,741 | 53,667 | 44,037 | 128,151 | 241,515 | ||||||||||||||||||||||||||||||||||||||||||||||||||||||||||||||||||||||||||||||||||||||||||||||||
| Accrued interest receivable | Accrued interest receivable | 2,277 | |||||||||||||||||||||||||||||||||||||||||||||||||||||||||||||||||||||||||||||||||||||||||||||||||||||||
| Loan premium, net of unaccreted discount | 79 | ||||||||||||||||||||||||||||||||||||||||||||||||||||||||||||||||||||||||||||||||||||||||||||||||||||||||
| Loan discount, net of unamortized premiums | |||||||||||||||||||||||||||||||||||||||||||||||||||||||||||||||||||||||||||||||||||||||||||||||||||||||||
| Allowance for loan losses | Allowance for loan losses | (15,175) | |||||||||||||||||||||||||||||||||||||||||||||||||||||||||||||||||||||||||||||||||||||||||||||||||||||||
| Total private education loans and accrued interest receivable, net of allowance for loan losses | Total private education loans and accrued interest receivable, net of allowance for loan losses | $ | 228,696 | ||||||||||||||||||||||||||||||||||||||||||||||||||||||||||||||||||||||||||||||||||||||||||||||||||||||
| Gross charge-offs - three months ended March 31, 2023 | $ | — | — | — | — | 171 | 469 | 640 | |||||||||||||||||||||||||||||||||||||||||||||||||||||||||||||||||||||||||||||||||||||||||||||||||
| Gross charge-offs - three months ended March 31, 2024 | |||||||||||||||||||||||||||||||||||||||||||||||||||||||||||||||||||||||||||||||||||||||||||||||||||||||||
| Consumer and other loans - Non-Nelnet Bank: | |||||||||||||||||||||||||||||||||||||||||||||||||||||||||||||||||||||||||||||||||||||||||||||||||||||||||
| Consumer and other loans - Non-Nelnet Bank: | |||||||||||||||||||||||||||||||||||||||||||||||||||||||||||||||||||||||||||||||||||||||||||||||||||||||||
| Consumer and other loans - Non-Nelnet Bank: | Consumer and other loans - Non-Nelnet Bank: | ||||||||||||||||||||||||||||||||||||||||||||||||||||||||||||||||||||||||||||||||||||||||||||||||||||||||
| Loans in deferment | Loans in deferment | $ | — | — | 24 | — | 16 | — | 40 | ||||||||||||||||||||||||||||||||||||||||||||||||||||||||||||||||||||||||||||||||||||||||||||||||
| Loans in deferment | |||||||||||||||||||||||||||||||||||||||||||||||||||||||||||||||||||||||||||||||||||||||||||||||||||||||||
| Loans in deferment | |||||||||||||||||||||||||||||||||||||||||||||||||||||||||||||||||||||||||||||||||||||||||||||||||||||||||
| Loans in repayment status: | Loans in repayment status: | ||||||||||||||||||||||||||||||||||||||||||||||||||||||||||||||||||||||||||||||||||||||||||||||||||||||||
| Loans current | |||||||||||||||||||||||||||||||||||||||||||||||||||||||||||||||||||||||||||||||||||||||||||||||||||||||||
| Loans current | |||||||||||||||||||||||||||||||||||||||||||||||||||||||||||||||||||||||||||||||||||||||||||||||||||||||||
| Loans current | Loans current | 185,920 | 109,009 | 6,692 | 498 | 1,354 | 941 | 304,414 | |||||||||||||||||||||||||||||||||||||||||||||||||||||||||||||||||||||||||||||||||||||||||||||||||
| Loans delinquent 31-60 days | Loans delinquent 31-60 days | 89 | 1,593 | 337 | — | 10 | 8 | 2,037 | |||||||||||||||||||||||||||||||||||||||||||||||||||||||||||||||||||||||||||||||||||||||||||||||||
| Loans delinquent 61-90 days | Loans delinquent 61-90 days | — | 1,085 | 84 | 38 | 26 | 3 | 1,236 | |||||||||||||||||||||||||||||||||||||||||||||||||||||||||||||||||||||||||||||||||||||||||||||||||
| Loans delinquent 91 days or greater | Loans delinquent 91 days or greater | — | 1,112 | 141 | 55 | 186 | 325 | 1,819 | |||||||||||||||||||||||||||||||||||||||||||||||||||||||||||||||||||||||||||||||||||||||||||||||||
| Total loans in repayment | Total loans in repayment | 186,009 | 112,799 | 7,254 | 591 | 1,576 | 1,277 | 309,506 | |||||||||||||||||||||||||||||||||||||||||||||||||||||||||||||||||||||||||||||||||||||||||||||||||
| Total consumer and other loans | Total consumer and other loans | $ | 186,009 | 112,799 | 7,278 | 591 | 1,592 | 1,277 | 309,546 | ||||||||||||||||||||||||||||||||||||||||||||||||||||||||||||||||||||||||||||||||||||||||||||||||
| Accrued interest receivable | Accrued interest receivable | 3,288 | |||||||||||||||||||||||||||||||||||||||||||||||||||||||||||||||||||||||||||||||||||||||||||||||||||||||
| Loan premium, net of unaccreted discount | 913 | ||||||||||||||||||||||||||||||||||||||||||||||||||||||||||||||||||||||||||||||||||||||||||||||||||||||||
| Loan discount, net of unamortized premiums | |||||||||||||||||||||||||||||||||||||||||||||||||||||||||||||||||||||||||||||||||||||||||||||||||||||||||
| Allowance for loan losses | Allowance for loan losses | (35,317) | |||||||||||||||||||||||||||||||||||||||||||||||||||||||||||||||||||||||||||||||||||||||||||||||||||||||
| Total consumer and other loans and accrued interest receivable, net of allowance for loan losses | Total consumer and other loans and accrued interest receivable, net of allowance for loan losses | $ | 278,430 | ||||||||||||||||||||||||||||||||||||||||||||||||||||||||||||||||||||||||||||||||||||||||||||||||||||||
| Gross charge-offs - three months ended March 31, 2023 | $ | — | 1,868 | 245 | 27 | 46 | 81 | 2,267 | |||||||||||||||||||||||||||||||||||||||||||||||||||||||||||||||||||||||||||||||||||||||||||||||||
| Gross charge-offs - three months ended March 31, 2024 | |||||||||||||||||||||||||||||||||||||||||||||||||||||||||||||||||||||||||||||||||||||||||||||||||||||||||
| Three months ended March 31, 2023 | 2022 | 2021 | 2020 | 2019 | Prior years | Total | |||||||||||||||||||||||||||||||||||||||||||||||||||||||||||||||||||||||||||||||||||||||||||||||||||
| Three months ended March 31, 2024 | Three months ended March 31, 2024 | 2023 | 2022 | 2021 | 2020 | Prior years | Total | ||||||||||||||||||||||||||||||||||||||||||||||||||||||||||||||||||||||||||||||||||||||||||||||||||
| Private education loans - Nelnet Bank (a): | Private education loans - Nelnet Bank (a): | ||||||||||||||||||||||||||||||||||||||||||||||||||||||||||||||||||||||||||||||||||||||||||||||||||||||||
| Loans in-school/grace/deferment | |||||||||||||||||||||||||||||||||||||||||||||||||||||||||||||||||||||||||||||||||||||||||||||||||||||||||
| Loans in-school/grace/deferment | |||||||||||||||||||||||||||||||||||||||||||||||||||||||||||||||||||||||||||||||||||||||||||||||||||||||||
| Loans in-school/grace/deferment | Loans in-school/grace/deferment | $ | 1,863 | 12,915 | 1,117 | 1,126 | — | — | 17,021 | ||||||||||||||||||||||||||||||||||||||||||||||||||||||||||||||||||||||||||||||||||||||||||||||||
| Loans in forbearance | Loans in forbearance | — | 485 | 196 | — | — | — | 681 | |||||||||||||||||||||||||||||||||||||||||||||||||||||||||||||||||||||||||||||||||||||||||||||||||
| Loans in repayment status: | Loans in repayment status: | ||||||||||||||||||||||||||||||||||||||||||||||||||||||||||||||||||||||||||||||||||||||||||||||||||||||||
| Loans current | |||||||||||||||||||||||||||||||||||||||||||||||||||||||||||||||||||||||||||||||||||||||||||||||||||||||||
| Loans current | |||||||||||||||||||||||||||||||||||||||||||||||||||||||||||||||||||||||||||||||||||||||||||||||||||||||||
| Loans current | Loans current | 8,913 | 192,723 | 126,740 | 8,591 | — | — | 336,967 | |||||||||||||||||||||||||||||||||||||||||||||||||||||||||||||||||||||||||||||||||||||||||||||||||
| Loans delinquent 30-59 days | Loans delinquent 30-59 days | 10 | 247 | 131 | — | — | — | 388 | |||||||||||||||||||||||||||||||||||||||||||||||||||||||||||||||||||||||||||||||||||||||||||||||||
| Loans delinquent 60-89 days | Loans delinquent 60-89 days | — | 481 | 55 | — | — | — | 536 | |||||||||||||||||||||||||||||||||||||||||||||||||||||||||||||||||||||||||||||||||||||||||||||||||
| Loans delinquent 90 days or greater | Loans delinquent 90 days or greater | — | 48 | 64 | — | — | — | 112 | |||||||||||||||||||||||||||||||||||||||||||||||||||||||||||||||||||||||||||||||||||||||||||||||||
| Total loans in repayment | Total loans in repayment | 8,923 | 193,499 | 126,990 | 8,591 | — | — | 338,003 | |||||||||||||||||||||||||||||||||||||||||||||||||||||||||||||||||||||||||||||||||||||||||||||||||
| Total private education loans | Total private education loans | $ | 10,786 | 206,899 | 128,303 | 9,717 | — | — | 355,705 | ||||||||||||||||||||||||||||||||||||||||||||||||||||||||||||||||||||||||||||||||||||||||||||||||
| Accrued interest receivable | Accrued interest receivable | 1,385 | |||||||||||||||||||||||||||||||||||||||||||||||||||||||||||||||||||||||||||||||||||||||||||||||||||||||
| Deferred origination costs, net of unaccreted discount | Deferred origination costs, net of unaccreted discount | 5,400 | |||||||||||||||||||||||||||||||||||||||||||||||||||||||||||||||||||||||||||||||||||||||||||||||||||||||
| Allowance for loan losses | Allowance for loan losses | (2,894) | |||||||||||||||||||||||||||||||||||||||||||||||||||||||||||||||||||||||||||||||||||||||||||||||||||||||
| Total private education loans and accrued interest receivable, net of allowance for loan losses | Total private education loans and accrued interest receivable, net of allowance for loan losses | $ | 359,596 | ||||||||||||||||||||||||||||||||||||||||||||||||||||||||||||||||||||||||||||||||||||||||||||||||||||||
| Gross charge-offs - three months ended March 31, 2023 | $ | — | 110 | — | — | — | — | 110 | |||||||||||||||||||||||||||||||||||||||||||||||||||||||||||||||||||||||||||||||||||||||||||||||||
| Gross charge-offs - three months ended March 31, 2024 | |||||||||||||||||||||||||||||||||||||||||||||||||||||||||||||||||||||||||||||||||||||||||||||||||||||||||
| Consumer and other loans - Nelnet Bank (a): | Consumer and other loans - Nelnet Bank (a): | ||||||||||||||||||||||||||||||||||||||||||||||||||||||||||||||||||||||||||||||||||||||||||||||||||||||||
| Consumer and other loans - Nelnet Bank (a): | |||||||||||||||||||||||||||||||||||||||||||||||||||||||||||||||||||||||||||||||||||||||||||||||||||||||||
| Consumer and other loans - Nelnet Bank (a): | |||||||||||||||||||||||||||||||||||||||||||||||||||||||||||||||||||||||||||||||||||||||||||||||||||||||||
| Loans in deferment | Loans in deferment | $ | — | — | — | — | — | — | — | ||||||||||||||||||||||||||||||||||||||||||||||||||||||||||||||||||||||||||||||||||||||||||||||||
| Loans in deferment | |||||||||||||||||||||||||||||||||||||||||||||||||||||||||||||||||||||||||||||||||||||||||||||||||||||||||
| Loans in deferment | |||||||||||||||||||||||||||||||||||||||||||||||||||||||||||||||||||||||||||||||||||||||||||||||||||||||||
| Loans in repayment status: | Loans in repayment status: | ||||||||||||||||||||||||||||||||||||||||||||||||||||||||||||||||||||||||||||||||||||||||||||||||||||||||
| Loans in repayment status: | |||||||||||||||||||||||||||||||||||||||||||||||||||||||||||||||||||||||||||||||||||||||||||||||||||||||||
| Loans in repayment status: | |||||||||||||||||||||||||||||||||||||||||||||||||||||||||||||||||||||||||||||||||||||||||||||||||||||||||
| Loans current | |||||||||||||||||||||||||||||||||||||||||||||||||||||||||||||||||||||||||||||||||||||||||||||||||||||||||
| Loans current | |||||||||||||||||||||||||||||||||||||||||||||||||||||||||||||||||||||||||||||||||||||||||||||||||||||||||
| Loans current | Loans current | 19,259 | 589 | 55 | — | — | — | 19,903 | |||||||||||||||||||||||||||||||||||||||||||||||||||||||||||||||||||||||||||||||||||||||||||||||||
| Loans delinquent 30-59 days | Loans delinquent 30-59 days | — | — | — | — | — | — | — | |||||||||||||||||||||||||||||||||||||||||||||||||||||||||||||||||||||||||||||||||||||||||||||||||
| Loans delinquent 60-89 days | Loans delinquent 60-89 days | — | — | — | — | — | — | — | |||||||||||||||||||||||||||||||||||||||||||||||||||||||||||||||||||||||||||||||||||||||||||||||||
| Loans delinquent 90 days or greater | Loans delinquent 90 days or greater | — | — | — | — | — | — | — | |||||||||||||||||||||||||||||||||||||||||||||||||||||||||||||||||||||||||||||||||||||||||||||||||
| Total loans in repayment | Total loans in repayment | 19,259 | 589 | 55 | — | — | — | 19,903 | |||||||||||||||||||||||||||||||||||||||||||||||||||||||||||||||||||||||||||||||||||||||||||||||||
| Total consumer and other loans | Total consumer and other loans | $ | 19,259 | 589 | 55 | — | — | — | 19,903 | ||||||||||||||||||||||||||||||||||||||||||||||||||||||||||||||||||||||||||||||||||||||||||||||||
| Accrued interest receivable | Accrued interest receivable | 117 | |||||||||||||||||||||||||||||||||||||||||||||||||||||||||||||||||||||||||||||||||||||||||||||||||||||||
| Loan premium | 1 | ||||||||||||||||||||||||||||||||||||||||||||||||||||||||||||||||||||||||||||||||||||||||||||||||||||||||
| Loan premium, net of unaccreted discount | |||||||||||||||||||||||||||||||||||||||||||||||||||||||||||||||||||||||||||||||||||||||||||||||||||||||||
| Allowance for loan losses | Allowance for loan losses | (1,827) | |||||||||||||||||||||||||||||||||||||||||||||||||||||||||||||||||||||||||||||||||||||||||||||||||||||||
| Total consumer and other loans and accrued interest receivable, net of allowance for loan losses | Total consumer and other loans and accrued interest receivable, net of allowance for loan losses | $ | 18,194 | ||||||||||||||||||||||||||||||||||||||||||||||||||||||||||||||||||||||||||||||||||||||||||||||||||||||
| Gross charge-offs - three months ended March 31, 2023 | $ | — | — | — | — | — | — | — | |||||||||||||||||||||||||||||||||||||||||||||||||||||||||||||||||||||||||||||||||||||||||||||||||
| Gross charge-offs - three months ended March 31, 2024 | |||||||||||||||||||||||||||||||||||||||||||||||||||||||||||||||||||||||||||||||||||||||||||||||||||||||||
| As of March 31, 2023 | As of March 31, 2024 | ||||||||||||||||||||||||||||||||||||||||||||
Carrying amount | Interest rate range | Final maturity | |||||||||||||||||||||||||||||||||||||||||||
Carrying amount | Carrying amount | Interest rate range | Final maturity | ||||||||||||||||||||||||||||||||||||||||||
| Variable-rate bonds and notes issued in FFELP loan asset-backed securitizations: | Variable-rate bonds and notes issued in FFELP loan asset-backed securitizations: | Variable-rate bonds and notes issued in FFELP loan asset-backed securitizations: | |||||||||||||||||||||||||||||||||||||||||||
| Bonds and notes based on indices | Bonds and notes based on indices | $ | 11,043,945 | 4.93% - 6.85% | 8/26/30 - 9/25/69 | Bonds and notes based on indices | $ | 8,766,041 | 5.47% - 7.44% | 5.47% - 7.44% | 8/26/30 - 9/25/69 | ||||||||||||||||||||||||||||||||||
| Bonds and notes based on auction | Bonds and notes based on auction | 142,385 | 0.00% - 5.43% | 3/22/32 - 11/26/46 | Bonds and notes based on auction | 84,660 | 0.00% - 6.44% | 0.00% - 6.44% | 3/22/32 - 11/26/46 | ||||||||||||||||||||||||||||||||||||
| Total FFELP variable-rate bonds and notes | Total FFELP variable-rate bonds and notes | 11,186,330 | |||||||||||||||||||||||||||||||||||||||||||
| Fixed-rate bonds and notes issued in FFELP loan asset-backed securitizations | Fixed-rate bonds and notes issued in FFELP loan asset-backed securitizations | 548,642 | 1.42% - 3.45% | 10/25/67 - 8/27/68 | |||||||||||||||||||||||||||||||||||||||||
| FFELP loan warehouse facility | 919,337 | 5.12% / 5.15% | 5/22/24 | ||||||||||||||||||||||||||||||||||||||||||
| Private education loan warehouse facility | 47,937 | 5.18% | 12/31/23 | ||||||||||||||||||||||||||||||||||||||||||
| Fixed-rate bonds and notes issued in FFELP loan asset-backed securitizations | |||||||||||||||||||||||||||||||||||||||||||||
| Fixed-rate bonds and notes issued in FFELP loan asset-backed securitizations | 430,061 | 1.42% - 3.45% | 10/25/67 - 8/27/68 | ||||||||||||||||||||||||||||||||||||||||||
| FFELP loan warehouse facilities | FFELP loan warehouse facilities | 1,066,197 | 5.41% - 5.57% | 4/2/25 / 5/22/25 | |||||||||||||||||||||||||||||||||||||||||
| Consumer loan warehouse facility | |||||||||||||||||||||||||||||||||||||||||||||
| Consumer loan warehouse facility | |||||||||||||||||||||||||||||||||||||||||||||
| Consumer loan warehouse facility | Consumer loan warehouse facility | 82,405 | 5.15% | 11/14/25 | 41,762 | 5.55% | 5.55% | 11/14/25 | |||||||||||||||||||||||||||||||||||||
| Variable-rate bonds and notes issued in private education loan asset-backed securitizations | Variable-rate bonds and notes issued in private education loan asset-backed securitizations | 17,808 | 6.40% / 6.60% | 12/26/40 / 6/25/49 | Variable-rate bonds and notes issued in private education loan asset-backed securitizations | 71,963 | 6.90% / 7.57% | 6.90% / 7.57% | 6/25/49 / 11/25/53 | ||||||||||||||||||||||||||||||||||||
| Fixed-rate bonds and notes issued in private education loan asset-backed securitization | 22,145 | 3.60% / 5.35% | 12/26/40 / 12/28/43 | ||||||||||||||||||||||||||||||||||||||||||
| Fixed-rate bonds and notes issued in private education loan asset-backed securitizations | Fixed-rate bonds and notes issued in private education loan asset-backed securitizations | 70,310 | 5.35% / 7.15% | 12/28/43 / 11/25/53 | |||||||||||||||||||||||||||||||||||||||||
| Unsecured line of credit | Unsecured line of credit | — | — | 9/22/26 | Unsecured line of credit | — | — | — | 9/22/26 | ||||||||||||||||||||||||||||||||||||
| Participation agreement | 311,771 | 5.48% | 5/4/23 | ||||||||||||||||||||||||||||||||||||||||||
| Repurchase agreements | 432,984 | 5.38% - 5.85% | 4/6/23 - 11/27/24 | ||||||||||||||||||||||||||||||||||||||||||
| Participation agreements | Participation agreements | 9,023 | 5.58% - 6.06% | 5/4/24 / 1/30/33 | |||||||||||||||||||||||||||||||||||||||||
| Repurchase agreement | Repurchase agreement | 114,498 | 6.43% - 6.74% | 11/27/24 / 12/20/24 | |||||||||||||||||||||||||||||||||||||||||
| Other - due to related party | Other - due to related party | 6,181 | 3.55% - 6.05% | 3/1/24 - 11/15/30 | |||||||||||||||||||||||||||||||||||||||||
| 13,575,540 | |||||||||||||||||||||||||||||||||||||||||||||
| Other - due to related party | |||||||||||||||||||||||||||||||||||||||||||||
| Other - due to related party | 5,591 | 5.00% - 6.05% | 4/30/24 - 11/15/30 | ||||||||||||||||||||||||||||||||||||||||||
| 10,660,106 | 10,660,106 | ||||||||||||||||||||||||||||||||||||||||||||
| Discount on bonds and notes payable and debt issuance costs | Discount on bonds and notes payable and debt issuance costs | (137,124) | |||||||||||||||||||||||||||||||||||||||||||
| Total | Total | $ | 13,438,416 | ||||||||||||||||||||||||||||||||||||||||||
| Total | |||||||||||||||||||||||||||||||||||||||||||||
| Total | |||||||||||||||||||||||||||||||||||||||||||||
| As of December 31, 2022 | As of December 31, 2023 | ||||||||||||||||||||||||||||||||||||||||||||
Carrying amount | Interest rate range | Final maturity | |||||||||||||||||||||||||||||||||||||||||||
Carrying amount | Carrying amount | Interest rate range | Final maturity | ||||||||||||||||||||||||||||||||||||||||||
| Variable-rate bonds and notes issued in FFELP loan asset-backed securitizations: | Variable-rate bonds and notes issued in FFELP loan asset-backed securitizations: | Variable-rate bonds and notes issued in FFELP loan asset-backed securitizations: | |||||||||||||||||||||||||||||||||||||||||||
| Bonds and notes based on indices | Bonds and notes based on indices | $ | 11,868,190 | 4.47% - 6.39% | 8/26/30 - 9/25/69 | Bonds and notes based on indices | $ | 9,552,667 | 5.45% - 7.47% | 5.45% - 7.47% | 8/26/30 - 9/25/69 | ||||||||||||||||||||||||||||||||||
| Bonds and notes based on auction | Bonds and notes based on auction | 178,960 | 0.00% - 4.02% | 3/22/32 - 11/26/46 | Bonds and notes based on auction | 87,360 | 0.00% - 6.45% | 0.00% - 6.45% | 3/22/32 - 11/26/46 | ||||||||||||||||||||||||||||||||||||
| Total FFELP variable-rate bonds and notes | Total FFELP variable-rate bonds and notes | 12,047,150 | |||||||||||||||||||||||||||||||||||||||||||
| Fixed-rate bonds and notes issued in FFELP loan asset-backed securitizations | Fixed-rate bonds and notes issued in FFELP loan asset-backed securitizations | 594,051 | 1.42% - 3.45% | 10/25/67 - 8/27/68 | |||||||||||||||||||||||||||||||||||||||||
| FFELP loan warehouse facility | 978,956 | 4.69% / 4.71% | 5/22/24 | ||||||||||||||||||||||||||||||||||||||||||
| Private education loan warehouse facility | 64,356 | 4.72% | 12/31/23 | ||||||||||||||||||||||||||||||||||||||||||
| Fixed-rate bonds and notes issued in FFELP loan asset-backed securitizations | |||||||||||||||||||||||||||||||||||||||||||||
| Fixed-rate bonds and notes issued in FFELP loan asset-backed securitizations | 471,427 | 1.42% - 3.45% | 10/25/67 - 8/27/68 | ||||||||||||||||||||||||||||||||||||||||||
| FFELP loan warehouse facilities | FFELP loan warehouse facilities | 1,398,485 | 5.41% - 5.70% | 4/2/25 / 5/22/25 | |||||||||||||||||||||||||||||||||||||||||
| Consumer loan warehouse facility | |||||||||||||||||||||||||||||||||||||||||||||
| Consumer loan warehouse facility | |||||||||||||||||||||||||||||||||||||||||||||
| Consumer loan warehouse facility | Consumer loan warehouse facility | 89,000 | 4.73% | 11/14/25 | 23,691 | 5.70% | 5.70% | 11/14/25 | |||||||||||||||||||||||||||||||||||||
| Variable-rate bonds and notes issued in private education loan asset-backed securitizations | Variable-rate bonds and notes issued in private education loan asset-backed securitizations | 19,865 | 5.90% / 6.14% | 12/26/40 / 6/25/49 | Variable-rate bonds and notes issued in private education loan asset-backed securitizations | 80,393 | 6.90% / 7.57% | 6.90% / 7.57% | 6/25/49 / 11/25/53 | ||||||||||||||||||||||||||||||||||||
| Fixed-rate bonds and notes issued in private education loan asset-backed securitization | 23,032 | 3.60% / 5.35% | 12/26/40 / 12/28/43 | ||||||||||||||||||||||||||||||||||||||||||
| Fixed-rate bonds and notes issued in private education loan asset-backed securitizations | Fixed-rate bonds and notes issued in private education loan asset-backed securitizations | 80,130 | 5.35% / 7.15% | 12/28/43 / 11/25/53 | |||||||||||||||||||||||||||||||||||||||||
| Unsecured line of credit | Unsecured line of credit | — | — | 9/22/26 | Unsecured line of credit | — | — | — | 9/22/26 | ||||||||||||||||||||||||||||||||||||
| Participation agreement | 395,432 | 5.02% | 5/4/23 | ||||||||||||||||||||||||||||||||||||||||||
| Repurchase agreements | 567,254 | 0.97% - 5.60% | 1/4/23 - 11/27/24 | ||||||||||||||||||||||||||||||||||||||||||
| Participation agreements | Participation agreements | 10,063 | 5.58% - 6.08% | 3/12/24 / 5/4/24 | |||||||||||||||||||||||||||||||||||||||||
| Repurchase agreement | Repurchase agreement | 208,164 | 6.35% - 6.81% | 1/22/24 - 12/20/24 | |||||||||||||||||||||||||||||||||||||||||
| Other - due to related party | Other - due to related party | 6,187 | 3.55% - 6.05% | 3/1/24 - 11/15/30 | |||||||||||||||||||||||||||||||||||||||||
| 14,785,283 | |||||||||||||||||||||||||||||||||||||||||||||
| Other - due to related party | |||||||||||||||||||||||||||||||||||||||||||||
| Other - due to related party | 5,778 | 5.00% - 6.05% | 3/1/24 - 11/15/30 | ||||||||||||||||||||||||||||||||||||||||||
| 11,918,158 | 11,918,158 | ||||||||||||||||||||||||||||||||||||||||||||
| Discount on bonds and notes payable and debt issuance costs | Discount on bonds and notes payable and debt issuance costs | (148,088) | |||||||||||||||||||||||||||||||||||||||||||
| Total | Total | $ | 14,637,195 | ||||||||||||||||||||||||||||||||||||||||||
| Total | |||||||||||||||||||||||||||||||||||||||||||||
| Total | |||||||||||||||||||||||||||||||||||||||||||||
| Type of loans | Maximum financing amount | Amount outstanding | Amount available | Expiration of liquidity provisions | Final maturity date | Advance rate | Advanced as equity support | ||||||||||||||||||||||||||||||||||||||||
| FFELP (a) | $ | 950,000 | 712,198 | 237,802 | 11/22/2024 | 5/22/2025 | note (b) | $ | 50,093 | ||||||||||||||||||||||||||||||||||||||
| FFELP (c) | 432,000 | 353,999 | 78,001 | 4/2/2024 | 4/2/2025 | 92 | % | 29,196 | |||||||||||||||||||||||||||||||||||||||
| $ | 1,382,000 | 1,066,197 | 315,803 | $ | 79,289 | ||||||||||||||||||||||||||||||||||||||||||
| Consumer (d) | 150,000 | 41,762 | 108,238 | 11/14/2024 | 11/14/2025 | 70 | % | 17,405 | |||||||||||||||||||||||||||||||||||||||
| Three months ended March 31, | |||||||||||||||||||||||
| 2023 | 2022 | ||||||||||||||||||||||
| Purchase price | $ | (828) | (18,454) | ||||||||||||||||||||
| Par value | 908 | 18,530 | |||||||||||||||||||||
| Remaining unamortized cost of issuance | (2) | (45) | |||||||||||||||||||||
| Gain | $ | 78 | 31 | ||||||||||||||||||||
| Maturity | |||||||||||||||||||||||
| Maturity | |||||||||||||||||||||||
| Maturity | Maturity | Notional amount | Notional amount | ||||||||||||||||||||
| As of | As of | ||||||||||||||||||||||
| March 31, 2023 | December 31, 2022 | ||||||||||||||||||||||
| 2023 | $ | — | 750,000 | ||||||||||||||||||||
| 2024 | |||||||||||||||||||||||
| 2024 | |||||||||||||||||||||||
| 2024 | 2024 | 1,750,000 | 1,750,000 | ||||||||||||||||||||
| 2026 | 2026 | 1,150,000 | 1,150,000 | ||||||||||||||||||||
| 2026 | |||||||||||||||||||||||
| 2026 | |||||||||||||||||||||||
| 2027 | |||||||||||||||||||||||
| 2027 | |||||||||||||||||||||||
| 2027 | 2027 | 250,000 | 250,000 | ||||||||||||||||||||
| $ | 3,150,000 | 3,900,000 | |||||||||||||||||||||
| $ | |||||||||||||||||||||||
| $ | |||||||||||||||||||||||
| $ | |||||||||||||||||||||||
| Maturity | Notional amount | Weighted average fixed rate paid by the Company (a) | ||||||||||||||||||||||||
| 2024 | $ | 2,000,000 | 0.35 | % | ||||||||||||||||||||||
| 2026 | 500,000 | 1.02 | ||||||||||||||||||||||||
| 2031 | 100,000 | 1.53 | ||||||||||||||||||||||||
| 2032 (b) | 200,000 | 2.92 | ||||||||||||||||||||||||
| $ | 2,800,000 | 0.70 | % | |||||||||||||||||||||||
| Maturity | Notional amount | Weighted average fixed rate paid by the Company (a) | ||||||||||||||||||||||||
| 2026 | $ | 200,000 | 3.92 | % | ||||||||||||||||||||||
| 2028 | 50,000 | 3.56 | ||||||||||||||||||||||||
| 2029 (b) | 50,000 | 3.17 | ||||||||||||||||||||||||
| 2030 (c) | 100,000 | 3.63 | ||||||||||||||||||||||||
| $ | 400,000 | 3.71 | % | |||||||||||||||||||||||
| Maturity | Notional amount | Weighted average fixed rate paid by the Company (a) | ||||||||||||||||||||||||
| 2028 | $ | 40,000 | 3.33 | % | ||||||||||||||||||||||
| 2030 (b) | 50,000 | 3.06 | ||||||||||||||||||||||||
| 2032 (c) | 25,000 | 4.03 | ||||||||||||||||||||||||
| 2033 (d) | 25,000 | 3.90 | ||||||||||||||||||||||||
| $ | 140,000 | 3.46 | % | |||||||||||||||||||||||
| Fair value of asset derivatives | Fair value of liability derivatives | ||||||||||||||||||||||
| As of March 31, 2024 | As of December 31, 2023 | As of March 31, 2024 | As of December 31, 2023 | ||||||||||||||||||||
| Interest rate swaps - Nelnet Bank | $ | 1,820 | 452 | 1,085 | 1,976 | ||||||||||||||||||
| Three months ended March 31, | |||||||||||||||||||||||
| 2023 | 2022 | ||||||||||||||||||||||
| Settlements: | |||||||||||||||||||||||
| 1:3 basis swaps | $ | 859 | 396 | ||||||||||||||||||||
| Interest rate swaps - floor income hedges (a) | 22,478 | (3,205) | |||||||||||||||||||||
| Total settlements - income (expense) | 23,337 | (2,809) | |||||||||||||||||||||
| Change in fair value: | |||||||||||||||||||||||
| 1:3 basis swaps | (23) | 889 | |||||||||||||||||||||
| Interest rate swaps - floor income hedges (a) | (37,388) | 144,845 | |||||||||||||||||||||
| Total change in fair value - (expense) income | (37,411) | 145,734 | |||||||||||||||||||||
| Derivative market value adjustments and derivative settlements, net - (expense) income | $ | (14,074) | 142,925 | ||||||||||||||||||||
| Three months ended March 31, | |||||||||||||||||||||||
| 2024 | 2023 | ||||||||||||||||||||||
| Settlements: | |||||||||||||||||||||||
| 1:3 basis swaps | $ | 365 | 859 | ||||||||||||||||||||
| Interest rate swaps - floor income hedges | 1,190 | 22,478 | |||||||||||||||||||||
| Interest rate swaps - Nelnet Bank | 202 | — | |||||||||||||||||||||
| Total settlements - income | 1,757 | 23,337 | |||||||||||||||||||||
| Change in fair value: | |||||||||||||||||||||||
| 1:3 basis swaps | (354) | (23) | |||||||||||||||||||||
| Interest rate swaps - floor income hedges | 6,060 | (37,388) | |||||||||||||||||||||
| Interest rate swaps - Nelnet Bank | 2,258 | — | |||||||||||||||||||||
| Total change in fair value - income (expense) | 7,964 | (37,411) | |||||||||||||||||||||
| Derivative market value adjustments and derivative settlements, net - income (expense) | $ | 9,721 | (14,074) | ||||||||||||||||||||
| As of March 31, 2024 | As of March 31, 2024 | As of December 31, 2023 | ||||||||||||||||||||||||||||||||||||||||||||||||||||||||||||||||||||||||||||||||||||||||||||||||||||||||||||||||||||||
| Amortized cost | Amortized cost | Gross unrealized gains | Gross unrealized losses | Fair value | Amortized cost | Gross unrealized gains | Gross unrealized losses | Fair value | ||||||||||||||||||||||||||||||||||||||||||||||||||||||||||||||||||||||||||||||||||||||||||||||||||||||||||||||||
| Restricted available-for-sale investments (at fair value): | ||||||||||||||||||||||||||||||||||||||||||||||||||||||||||||||||||||||||||||||||||||||||||||||||||||||||||||||||||||||||
| FFELP loan and other debt securities | ||||||||||||||||||||||||||||||||||||||||||||||||||||||||||||||||||||||||||||||||||||||||||||||||||||||||||||||||||||||||
| FFELP loan and other debt securities | ||||||||||||||||||||||||||||||||||||||||||||||||||||||||||||||||||||||||||||||||||||||||||||||||||||||||||||||||||||||||
| FFELP loan and other debt securities | ||||||||||||||||||||||||||||||||||||||||||||||||||||||||||||||||||||||||||||||||||||||||||||||||||||||||||||||||||||||||
| Non-restricted available-for-sale investments (at fair value): | ||||||||||||||||||||||||||||||||||||||||||||||||||||||||||||||||||||||||||||||||||||||||||||||||||||||||||||||||||||||||
| As of March 31, 2023 | As of December 31, 2022 | |||||||||||||||||||||||||||||||||||||||||||||||||||||||||||||||||||||||||||||||||||||||||||||||||||||||||||||||||||||||
| Non-Nelnet Bank: | ||||||||||||||||||||||||||||||||||||||||||||||||||||||||||||||||||||||||||||||||||||||||||||||||||||||||||||||||||||||||
| Amortized cost | Gross unrealized gains | Gross unrealized losses | Fair value | Amortized cost | Gross unrealized gains | Gross unrealized losses | Fair value | |||||||||||||||||||||||||||||||||||||||||||||||||||||||||||||||||||||||||||||||||||||||||||||||||||||||||||||||||
| Investments (at fair value): | ||||||||||||||||||||||||||||||||||||||||||||||||||||||||||||||||||||||||||||||||||||||||||||||||||||||||||||||||||||||||
| Available-for-sale asset-backed securities | ||||||||||||||||||||||||||||||||||||||||||||||||||||||||||||||||||||||||||||||||||||||||||||||||||||||||||||||||||||||||
| Non-Nelnet Bank: | Non-Nelnet Bank: | |||||||||||||||||||||||||||||||||||||||||||||||||||||||||||||||||||||||||||||||||||||||||||||||||||||||||||||||||||||||
| FFELP loan (a) | $ | 336,327 | 4,175 | (7,926) | 332,576 | 463,861 | 3,498 | (11,105) | 456,254 | |||||||||||||||||||||||||||||||||||||||||||||||||||||||||||||||||||||||||||||||||||||||||||||||||||||||||||||||
| Private education loan (b) | 321,120 | — | (26,531) | 294,589 | 335,903 | — | (29,438) | 306,465 | ||||||||||||||||||||||||||||||||||||||||||||||||||||||||||||||||||||||||||||||||||||||||||||||||||||||||||||||||
| FFELP loan | ||||||||||||||||||||||||||||||||||||||||||||||||||||||||||||||||||||||||||||||||||||||||||||||||||||||||||||||||||||||||
| FFELP loan | ||||||||||||||||||||||||||||||||||||||||||||||||||||||||||||||||||||||||||||||||||||||||||||||||||||||||||||||||||||||||
| FFELP loan | ||||||||||||||||||||||||||||||||||||||||||||||||||||||||||||||||||||||||||||||||||||||||||||||||||||||||||||||||||||||||
| Private education loan (a) | ||||||||||||||||||||||||||||||||||||||||||||||||||||||||||||||||||||||||||||||||||||||||||||||||||||||||||||||||||||||||
| Other debt securities | Other debt securities | 53,743 | 2,365 | (803) | 55,305 | 158,589 | 151 | (3,790) | 154,950 | |||||||||||||||||||||||||||||||||||||||||||||||||||||||||||||||||||||||||||||||||||||||||||||||||||||||||||||||
| Total Non-Nelnet Bank | Total Non-Nelnet Bank | 711,190 | 6,540 | (35,260) | 682,470 | 958,353 | 3,649 | (44,333) | 917,669 | |||||||||||||||||||||||||||||||||||||||||||||||||||||||||||||||||||||||||||||||||||||||||||||||||||||||||||||||
| Nelnet Bank: | Nelnet Bank: | |||||||||||||||||||||||||||||||||||||||||||||||||||||||||||||||||||||||||||||||||||||||||||||||||||||||||||||||||||||||
| FFELP loan (c) | 240,348 | 754 | (3,622) | 237,480 | 349,855 | 955 | (8,853) | 341,957 | ||||||||||||||||||||||||||||||||||||||||||||||||||||||||||||||||||||||||||||||||||||||||||||||||||||||||||||||||
| FFELP loan | ||||||||||||||||||||||||||||||||||||||||||||||||||||||||||||||||||||||||||||||||||||||||||||||||||||||||||||||||||||||||
| FFELP loan | ||||||||||||||||||||||||||||||||||||||||||||||||||||||||||||||||||||||||||||||||||||||||||||||||||||||||||||||||||||||||
| FFELP loan | ||||||||||||||||||||||||||||||||||||||||||||||||||||||||||||||||||||||||||||||||||||||||||||||||||||||||||||||||||||||||
| Private education loan | Private education loan | 1,818 | — | (101) | 1,717 | 1,941 | — | (122) | 1,819 | |||||||||||||||||||||||||||||||||||||||||||||||||||||||||||||||||||||||||||||||||||||||||||||||||||||||||||||||
| Other debt securities | Other debt securities | 152,571 | 14 | (3,549) | 149,036 | 131,481 | 18 | (3,907) | 127,592 | |||||||||||||||||||||||||||||||||||||||||||||||||||||||||||||||||||||||||||||||||||||||||||||||||||||||||||||||
| Total Nelnet Bank | Total Nelnet Bank | 394,737 | 768 | (7,272) | 388,233 | 483,277 | 973 | (12,882) | 471,368 | |||||||||||||||||||||||||||||||||||||||||||||||||||||||||||||||||||||||||||||||||||||||||||||||||||||||||||||||
| Total available-for-sale asset-backed securities | Total available-for-sale asset-backed securities | $ | 1,105,927 | 7,308 | (42,532) | 1,070,703 | 1,441,630 | 4,622 | (57,215) | 1,389,037 | ||||||||||||||||||||||||||||||||||||||||||||||||||||||||||||||||||||||||||||||||||||||||||||||||||||||||||||||
| Equity securities | Equity securities | 35,663 | 39,082 | |||||||||||||||||||||||||||||||||||||||||||||||||||||||||||||||||||||||||||||||||||||||||||||||||||||||||||||||||||||
| Total investments at fair value | Total investments at fair value | 1,106,366 | 1,428,119 | |||||||||||||||||||||||||||||||||||||||||||||||||||||||||||||||||||||||||||||||||||||||||||||||||||||||||||||||||||||
| Other Investments and Notes Receivable (not measured at fair value): | Other Investments and Notes Receivable (not measured at fair value): | |||||||||||||||||||||||||||||||||||||||||||||||||||||||||||||||||||||||||||||||||||||||||||||||||||||||||||||||||||||||
| Held to maturity investments | ||||||||||||||||||||||||||||||||||||||||||||||||||||||||||||||||||||||||||||||||||||||||||||||||||||||||||||||||||||||||
| Held-to-maturity investments | ||||||||||||||||||||||||||||||||||||||||||||||||||||||||||||||||||||||||||||||||||||||||||||||||||||||||||||||||||||||||
| Held-to-maturity investments | ||||||||||||||||||||||||||||||||||||||||||||||||||||||||||||||||||||||||||||||||||||||||||||||||||||||||||||||||||||||||
| Held-to-maturity investments | ||||||||||||||||||||||||||||||||||||||||||||||||||||||||||||||||||||||||||||||||||||||||||||||||||||||||||||||||||||||||
| Non-Nelnet Bank: | Non-Nelnet Bank: | |||||||||||||||||||||||||||||||||||||||||||||||||||||||||||||||||||||||||||||||||||||||||||||||||||||||||||||||||||||||
| Debt securities (d) | 4,700 | 18,554 | ||||||||||||||||||||||||||||||||||||||||||||||||||||||||||||||||||||||||||||||||||||||||||||||||||||||||||||||||||||||
| Non-Nelnet Bank: | ||||||||||||||||||||||||||||||||||||||||||||||||||||||||||||||||||||||||||||||||||||||||||||||||||||||||||||||||||||||||
| Non-Nelnet Bank: | ||||||||||||||||||||||||||||||||||||||||||||||||||||||||||||||||||||||||||||||||||||||||||||||||||||||||||||||||||||||||
| Debt securities | ||||||||||||||||||||||||||||||||||||||||||||||||||||||||||||||||||||||||||||||||||||||||||||||||||||||||||||||||||||||||
| Debt securities | ||||||||||||||||||||||||||||||||||||||||||||||||||||||||||||||||||||||||||||||||||||||||||||||||||||||||||||||||||||||||
| Debt securities | ||||||||||||||||||||||||||||||||||||||||||||||||||||||||||||||||||||||||||||||||||||||||||||||||||||||||||||||||||||||||
| Nelnet Bank: | Nelnet Bank: | |||||||||||||||||||||||||||||||||||||||||||||||||||||||||||||||||||||||||||||||||||||||||||||||||||||||||||||||||||||||
| FFELP loan asset-backed securities (c) | 149,179 | — | ||||||||||||||||||||||||||||||||||||||||||||||||||||||||||||||||||||||||||||||||||||||||||||||||||||||||||||||||||||||
| Other debt securities | 240 | 220 | ||||||||||||||||||||||||||||||||||||||||||||||||||||||||||||||||||||||||||||||||||||||||||||||||||||||||||||||||||||||
| FFELP loan asset-backed securities | ||||||||||||||||||||||||||||||||||||||||||||||||||||||||||||||||||||||||||||||||||||||||||||||||||||||||||||||||||||||||
| FFELP loan asset-backed securities | ||||||||||||||||||||||||||||||||||||||||||||||||||||||||||||||||||||||||||||||||||||||||||||||||||||||||||||||||||||||||
| FFELP loan asset-backed securities | ||||||||||||||||||||||||||||||||||||||||||||||||||||||||||||||||||||||||||||||||||||||||||||||||||||||||||||||||||||||||
| Private education loan asset-backed securities | ||||||||||||||||||||||||||||||||||||||||||||||||||||||||||||||||||||||||||||||||||||||||||||||||||||||||||||||||||||||||
| Total Nelnet Bank | Total Nelnet Bank | 149,419 | 220 | |||||||||||||||||||||||||||||||||||||||||||||||||||||||||||||||||||||||||||||||||||||||||||||||||||||||||||||||||||||
| Total held to maturity investments | 154,119 | 18,774 | ||||||||||||||||||||||||||||||||||||||||||||||||||||||||||||||||||||||||||||||||||||||||||||||||||||||||||||||||||||||
| Total held-to-maturity investments | ||||||||||||||||||||||||||||||||||||||||||||||||||||||||||||||||||||||||||||||||||||||||||||||||||||||||||||||||||||||||
| Venture capital and funds: | Venture capital and funds: | |||||||||||||||||||||||||||||||||||||||||||||||||||||||||||||||||||||||||||||||||||||||||||||||||||||||||||||||||||||||
| Measurement alternative (e) | 191,731 | 160,052 | ||||||||||||||||||||||||||||||||||||||||||||||||||||||||||||||||||||||||||||||||||||||||||||||||||||||||||||||||||||||
| Measurement alternative | ||||||||||||||||||||||||||||||||||||||||||||||||||||||||||||||||||||||||||||||||||||||||||||||||||||||||||||||||||||||||
| Measurement alternative | ||||||||||||||||||||||||||||||||||||||||||||||||||||||||||||||||||||||||||||||||||||||||||||||||||||||||||||||||||||||||
| Measurement alternative | ||||||||||||||||||||||||||||||||||||||||||||||||||||||||||||||||||||||||||||||||||||||||||||||||||||||||||||||||||||||||
| Equity method | Equity method | 98,217 | 89,332 | |||||||||||||||||||||||||||||||||||||||||||||||||||||||||||||||||||||||||||||||||||||||||||||||||||||||||||||||||||||
| Total venture capital and funds | Total venture capital and funds | 289,948 | 249,384 | |||||||||||||||||||||||||||||||||||||||||||||||||||||||||||||||||||||||||||||||||||||||||||||||||||||||||||||||||||||
| Real estate: | Real estate: | |||||||||||||||||||||||||||||||||||||||||||||||||||||||||||||||||||||||||||||||||||||||||||||||||||||||||||||||||||||||
| Equity method | Equity method | 84,526 | 80,364 | |||||||||||||||||||||||||||||||||||||||||||||||||||||||||||||||||||||||||||||||||||||||||||||||||||||||||||||||||||||
| Equity method | ||||||||||||||||||||||||||||||||||||||||||||||||||||||||||||||||||||||||||||||||||||||||||||||||||||||||||||||||||||||||
| Equity method | ||||||||||||||||||||||||||||||||||||||||||||||||||||||||||||||||||||||||||||||||||||||||||||||||||||||||||||||||||||||||
| Investment in ALLO: | Investment in ALLO: | |||||||||||||||||||||||||||||||||||||||||||||||||||||||||||||||||||||||||||||||||||||||||||||||||||||||||||||||||||||||
| Voting interest/equity method (f) | 55,756 | 67,538 | ||||||||||||||||||||||||||||||||||||||||||||||||||||||||||||||||||||||||||||||||||||||||||||||||||||||||||||||||||||||
| Preferred membership interest and accrued and unpaid preferred return (g) | 148,175 | 145,926 | ||||||||||||||||||||||||||||||||||||||||||||||||||||||||||||||||||||||||||||||||||||||||||||||||||||||||||||||||||||||
| Voting interest/equity method (b) | ||||||||||||||||||||||||||||||||||||||||||||||||||||||||||||||||||||||||||||||||||||||||||||||||||||||||||||||||||||||||
| Voting interest/equity method (b) | ||||||||||||||||||||||||||||||||||||||||||||||||||||||||||||||||||||||||||||||||||||||||||||||||||||||||||||||||||||||||
| Voting interest/equity method (b) | ||||||||||||||||||||||||||||||||||||||||||||||||||||||||||||||||||||||||||||||||||||||||||||||||||||||||||||||||||||||||
| Preferred membership interest and accrued and unpaid preferred return (c) | ||||||||||||||||||||||||||||||||||||||||||||||||||||||||||||||||||||||||||||||||||||||||||||||||||||||||||||||||||||||||
| Total investment in ALLO | Total investment in ALLO | 203,931 | 213,464 | |||||||||||||||||||||||||||||||||||||||||||||||||||||||||||||||||||||||||||||||||||||||||||||||||||||||||||||||||||||
| Beneficial interest in loan securitizations (h): | ||||||||||||||||||||||||||||||||||||||||||||||||||||||||||||||||||||||||||||||||||||||||||||||||||||||||||||||||||||||||
| Consumer loans and other | 81,399 | 39,249 | ||||||||||||||||||||||||||||||||||||||||||||||||||||||||||||||||||||||||||||||||||||||||||||||||||||||||||||||||||||||
| Beneficial interest in loan securitizations (d): | ||||||||||||||||||||||||||||||||||||||||||||||||||||||||||||||||||||||||||||||||||||||||||||||||||||||||||||||||||||||||
| Consumer loans | ||||||||||||||||||||||||||||||||||||||||||||||||||||||||||||||||||||||||||||||||||||||||||||||||||||||||||||||||||||||||
| Consumer loans | ||||||||||||||||||||||||||||||||||||||||||||||||||||||||||||||||||||||||||||||||||||||||||||||||||||||||||||||||||||||||
| Consumer loans | ||||||||||||||||||||||||||||||||||||||||||||||||||||||||||||||||||||||||||||||||||||||||||||||||||||||||||||||||||||||||
| Private education loans | Private education loans | 72,898 | 75,261 | |||||||||||||||||||||||||||||||||||||||||||||||||||||||||||||||||||||||||||||||||||||||||||||||||||||||||||||||||||||
| Federally insured student loans | Federally insured student loans | 23,591 | 24,228 | |||||||||||||||||||||||||||||||||||||||||||||||||||||||||||||||||||||||||||||||||||||||||||||||||||||||||||||||||||||
| Total beneficial interest in loan securitizations | Total beneficial interest in loan securitizations | 177,888 | 138,738 | |||||||||||||||||||||||||||||||||||||||||||||||||||||||||||||||||||||||||||||||||||||||||||||||||||||||||||||||||||||
| Solar (i) | (66,353) | (55,448) | ||||||||||||||||||||||||||||||||||||||||||||||||||||||||||||||||||||||||||||||||||||||||||||||||||||||||||||||||||||||
| Solar (e) | ||||||||||||||||||||||||||||||||||||||||||||||||||||||||||||||||||||||||||||||||||||||||||||||||||||||||||||||||||||||||
| Notes receivable | Notes receivable | 30,246 | 31,106 | |||||||||||||||||||||||||||||||||||||||||||||||||||||||||||||||||||||||||||||||||||||||||||||||||||||||||||||||||||||
| Tax liens, affordable housing, and other | Tax liens, affordable housing, and other | 6,899 | 7,416 | |||||||||||||||||||||||||||||||||||||||||||||||||||||||||||||||||||||||||||||||||||||||||||||||||||||||||||||||||||||
| Total investments (not measured at fair value) | Total investments (not measured at fair value) | 881,204 | 683,798 | |||||||||||||||||||||||||||||||||||||||||||||||||||||||||||||||||||||||||||||||||||||||||||||||||||||||||||||||||||||
| Total investments and notes receivable | Total investments and notes receivable | $ | 1,987,570 | $ | 2,111,917 | |||||||||||||||||||||||||||||||||||||||||||||||||||||||||||||||||||||||||||||||||||||||||||||||||||||||||||||||||||
| As of March 31, 2024 | |||||||||||||||||||||||||||||
| 1 year or less | After 1 year through 5 years | After 5 years through 10 years | After 10 years | Total | |||||||||||||||||||||||||
| Available-for-sale asset-backed securities | |||||||||||||||||||||||||||||
| Restricted Investments: | |||||||||||||||||||||||||||||
| FFELP loan and other debt securities | $ | — | 9,267 | 4,017 | 21,674 | 34,958 | |||||||||||||||||||||||
| Fair value | — | 9,270 | 4,037 | 22,769 | 36,076 | ||||||||||||||||||||||||
| Non-Nelnet Bank: | |||||||||||||||||||||||||||||
| FFELP loan | 8,796 | 9,206 | 22,190 | 223,143 | 263,335 | ||||||||||||||||||||||||
| Private education loan | — | — | — | 269,983 | 269,983 | ||||||||||||||||||||||||
| Other debt securities | — | 99 | — | 20,487 | 20,586 | ||||||||||||||||||||||||
| Total Non-Nelnet Bank | 8,796 | 9,305 | 22,190 | 513,613 | 553,904 | ||||||||||||||||||||||||
| Fair value | 8,697 | 9,244 | 21,651 | 497,751 | 537,343 | ||||||||||||||||||||||||
| Nelnet Bank: | |||||||||||||||||||||||||||||
| FFELP loan | 60,739 | 22,744 | 26,144 | 190,608 | 300,235 | ||||||||||||||||||||||||
| Private education loan | — | — | 15,940 | 13,500 | 29,440 | ||||||||||||||||||||||||
| Other debt securities | — | 47,839 | 11,868 | 51,208 | 110,915 | ||||||||||||||||||||||||
| Total Nelnet Bank | 60,739 | 70,583 | 53,952 | 255,316 | 440,590 | ||||||||||||||||||||||||
| Fair value | 61,249 | 70,585 | 53,924 | 259,510 | 445,268 | ||||||||||||||||||||||||
| Total available-for-sale asset-backed securities at amortized cost | $ | 69,535 | 89,155 | 80,159 | 790,603 | 1,029,452 | |||||||||||||||||||||||
| Total available-for-sale asset-backed securities at fair value | $ | 69,946 | 89,099 | 79,612 | 780,030 | 1,018,687 | |||||||||||||||||||||||
| Held-to-maturity investments | |||||||||||||||||||||||||||||
| Non-Nelnet Bank: | |||||||||||||||||||||||||||||
| Debt securities | $ | 4,700 | — | — | — | 4,700 | |||||||||||||||||||||||
| Fair value | 4,700 | — | — | — | 4,700 | ||||||||||||||||||||||||
| Nelnet Bank: | |||||||||||||||||||||||||||||
| FFELP loan asset-backed securities | — | 3,278 | 1,407 | 143,753 | 148,438 | ||||||||||||||||||||||||
| Private education loan asset-backed securities | — | — | — | 8,100 | 8,100 | ||||||||||||||||||||||||
| Total Nelnet Bank | — | 3,278 | 1,407 | 151,853 | 156,538 | ||||||||||||||||||||||||
| Fair value | — | 3,351 | 1,435 | 155,007 | 159,793 | ||||||||||||||||||||||||
| Total held-to-maturity investments at amortized cost | $ | 4,700 | 3,278 | 1,407 | 151,853 | 161,238 | |||||||||||||||||||||||
| Total held-to-maturity investments at fair value | $ | 4,700 | 3,351 | 1,435 | 155,007 | 164,493 | |||||||||||||||||||||||
| Beneficial interest in loan securitizations (a): | |||||||||||||||||||||||||||||
| Amortized cost | $ | — | — | — | — | 235,824 | |||||||||||||||||||||||
| Fair value | $ | — | — | — | — | 260,537 | |||||||||||||||||||||||
| Carrying value | Gross unrealized gains | Gross unrealized losses (a) | Fair value | ||||||||||||||||||||
| Asset-backed and other securities | $ | 161,238 | 3,302 | (47) | 164,493 | ||||||||||||||||||
| Beneficial interest in loan securitizations | 235,824 | 28,806 | (4,093) | 260,537 | |||||||||||||||||||
| As of March 31, 2023 | |||||||||||||||||||||||||||||
| 1 year or less | After 1 year through 5 years | After 5 years through 10 years | After 10 years | Total | |||||||||||||||||||||||||
| Available-for-sale asset-backed securities | |||||||||||||||||||||||||||||
| Non-Nelnet Bank: | |||||||||||||||||||||||||||||
| FFELP loan | $ | 26,196 | 12,274 | 50,051 | 247,806 | 336,327 | |||||||||||||||||||||||
| Private education loan | — | — | — | 321,120 | 321,120 | ||||||||||||||||||||||||
| Other debt securities | — | 99 | — | 53,644 | 53,743 | ||||||||||||||||||||||||
| Total Non-Nelnet Bank | 26,196 | 12,373 | 50,051 | 622,570 | 711,190 | ||||||||||||||||||||||||
| Fair value | 25,997 | 12,308 | 48,679 | 595,486 | 682,470 | ||||||||||||||||||||||||
| Nelnet Bank: | |||||||||||||||||||||||||||||
| FFELP loan | 39,728 | 6,933 | 34,659 | 159,028 | 240,348 | ||||||||||||||||||||||||
| Private education loan | — | — | — | 1,818 | 1,818 | ||||||||||||||||||||||||
| Other debt securities | — | 23,084 | 92,316 | 37,171 | 152,571 | ||||||||||||||||||||||||
| Total Nelnet Bank | 39,728 | 30,017 | 126,975 | 198,017 | 394,737 | ||||||||||||||||||||||||
| Fair value | 39,139 | 29,704 | 124,228 | 195,162 | 388,233 | ||||||||||||||||||||||||
| Total available-for-sale asset-backed securities at amortized cost | $ | 65,924 | 42,390 | 177,026 | 820,587 | 1,105,927 | |||||||||||||||||||||||
| Total available-for-sale asset-backed securities at fair value | $ | 65,136 | 42,012 | 172,907 | 790,648 | 1,070,703 | |||||||||||||||||||||||
| Held to maturity investments | |||||||||||||||||||||||||||||
| Non-Nelnet Bank: | |||||||||||||||||||||||||||||
| Debt securities | $ | 4,700 | — | — | — | 4,700 | |||||||||||||||||||||||
| Fair value | 4,700 | — | — | — | 4,700 | ||||||||||||||||||||||||
| Nelnet Bank: | |||||||||||||||||||||||||||||
| FFELP loan asset-backed securities | — | — | 3,797 | 145,382 | 149,179 | ||||||||||||||||||||||||
| Other debt securities | 240 | — | — | — | 240 | ||||||||||||||||||||||||
| Total Nelnet Bank | 240 | — | 3,797 | 145,382 | 149,419 | ||||||||||||||||||||||||
| Fair value | 240 | — | 3,797 | 145,382 | 149,419 | ||||||||||||||||||||||||
| Total held-to-maturity investments at amortized cost | $ | 4,940 | — | 3,797 | 145,382 | 154,119 | |||||||||||||||||||||||
| Total held-to-maturity investments at fair value | $ | 4,940 | — | 3,797 | 145,382 | 154,119 | |||||||||||||||||||||||
| As of March 31, 2023 | |||||||||||||||||||||||||||||||||||
| Unrealized loss position less than 12 months | Unrealized loss position 12 months or more | Total | |||||||||||||||||||||||||||||||||
| Available-for-sale asset-backed securities | Unrealized loss | Fair value | Unrealized loss | Fair value | Unrealized loss | Fair value | |||||||||||||||||||||||||||||
| Non-Nelnet Bank: | |||||||||||||||||||||||||||||||||||
| FFELP loan | $ | (5,324) | 182,059 | (2,602) | 44,238 | (7,926) | 226,297 | ||||||||||||||||||||||||||||
| Private education loan | — | — | (26,531) | 294,590 | (26,531) | 294,590 | |||||||||||||||||||||||||||||
| Other debt securities | (803) | 21,462 | — | — | (803) | 21,462 | |||||||||||||||||||||||||||||
| Total Non-Nelnet Bank | (6,127) | 203,521 | (29,133) | 338,828 | (35,260) | 542,349 | |||||||||||||||||||||||||||||
| Nelnet Bank: | |||||||||||||||||||||||||||||||||||
| FFELP loan | (2,891) | 155,672 | (731) | 37,285 | (3,622) | 192,957 | |||||||||||||||||||||||||||||
| Private education loan | (101) | 1,717 | — | — | (101) | 1,717 | |||||||||||||||||||||||||||||
| Other debt securities | (3,492) | 111,638 | (57) | 3,940 | (3,549) | 115,578 | |||||||||||||||||||||||||||||
| Total Nelnet Bank | (6,484) | 269,027 | (788) | 41,225 | (7,272) | 310,252 | |||||||||||||||||||||||||||||
| Total available-for-sale asset-backed securities | $ | (12,611) | 472,548 | (29,921) | 380,053 | (42,532) | 852,601 | ||||||||||||||||||||||||||||
| As of March 31, 2024 | |||||||||||||||||||||||||||||||||||
| Unrealized loss position less than 12 months | Unrealized loss position 12 months or more | Total | |||||||||||||||||||||||||||||||||
| Unrealized loss | Fair value | Unrealized loss | Fair value | Unrealized loss | Fair value | ||||||||||||||||||||||||||||||
| Available-for-sale asset-backed securities | |||||||||||||||||||||||||||||||||||
| Restricted Investments: | |||||||||||||||||||||||||||||||||||
| FFELP loan and other debt securities | $ | (80) | 8,175 | — | — | (80) | 8,175 | ||||||||||||||||||||||||||||
| Non-Nelnet Bank: | |||||||||||||||||||||||||||||||||||
| FFELP loan | (335) | 16,011 | (2,708) | 119,466 | (3,043) | 135,477 | |||||||||||||||||||||||||||||
| Private education loan | — | — | (21,547) | 248,436 | (21,547) | 248,436 | |||||||||||||||||||||||||||||
| Total Non-Nelnet Bank | (335) | 16,011 | (24,255) | 367,902 | (24,590) | 383,913 | |||||||||||||||||||||||||||||
| Nelnet Bank: | |||||||||||||||||||||||||||||||||||
| FFELP loan | (779) | 26,112 | (832) | 34,654 | (1,611) | 60,766 | |||||||||||||||||||||||||||||
| Other debt securities | (63) | 15,088 | (1,435) | 14,713 | (1,498) | 29,801 | |||||||||||||||||||||||||||||
| Total Nelnet Bank | (842) | 41,200 | (2,267) | 49,367 | (3,109) | 90,567 | |||||||||||||||||||||||||||||
| Total available-for-sale asset-backed securities | $ | (1,257) | 65,386 | (26,522) | 417,269 | (27,779) | 482,655 | ||||||||||||||||||||||||||||
| Gross realized gains | Gross realized losses | Gross proceeds from sales | |||||||||||||||
| Three months ended March 31, 2023 | $ | 1,274 | (6,256) | 492,173 | |||||||||||||
| Three months ended March 31, 2022 | 2,965 | (172) | 113,980 | ||||||||||||||
| Three months ended | |||||||||||||||||||||||
| March 31, | |||||||||||||||||||||||
| 2024 | 2023 | ||||||||||||||||||||||
| Gross proceeds from sales | $ | 153,373 | 492,173 | ||||||||||||||||||||
| Gross realized gains | $ | 1,054 | 1,274 | ||||||||||||||||||||
| Gross realized losses | (502) | (6,256) | |||||||||||||||||||||
| Net gains (losses) | $ | 552 | (4,982) | ||||||||||||||||||||
Weighted average remaining useful life as of March 31, 2023 (months) | |||||||||||||||||
| As of | As of | ||||||||||||||||
| March 31, 2023 | December 31, 2022 | ||||||||||||||||
| Amortizable intangible assets, net: | |||||||||||||||||
| Customer relationships (net of accumulated amortization of $57,285 and $55,116, respectively) | 110 | $ | 49,569 | 51,738 | |||||||||||||
| Trade names (net of accumulated amortization of $882 and $617, respectively) | 111 | 8,028 | 8,293 | ||||||||||||||
| Computer software (net of accumulated amortization of $6,514 and $6,400, respectively) | 49 | 1,406 | 1,520 | ||||||||||||||
| Other (net of accumulated amortization of $655 and $490, respectively) | 51 | 1,785 | 1,950 | ||||||||||||||
| Total - amortizable intangible assets, net | 107 | $ | 60,788 | 63,501 | |||||||||||||
Weighted average remaining useful life as of March 31, 2024 (months) | |||||||||||||||||
| As of | As of | ||||||||||||||||
| March 31, 2024 | December 31, 2023 | ||||||||||||||||
| Amortizable intangible assets, net: | |||||||||||||||||
| Customer relationships (net of accumulated amortization of $48,617 and $46,573, respectively) | 102 | $ | 40,987 | 43,031 | |||||||||||||
| Trade names (net of accumulated amortization of $148 and $8,268, respectively) | 97 | 622 | 642 | ||||||||||||||
| Computer software (net of accumulated amortization of $659 and $574, respectively) | 37 | 1,061 | 1,146 | ||||||||||||||
| Total amortizable intangible assets, net | 100 | $ | 42,670 | 44,819 | |||||||||||||
| 2023 (April 1 - December 31) | $ | 7,648 | |||
| 2024 | 9,773 | ||||
| 2024 (April 1 - December 31) | |||||
| 2025 | 2025 | 8,145 | |||
| 2026 | 2026 | 7,262 | |||
| 2027 | 2027 | 6,736 | |||
| 2028 and thereafter | 21,224 | ||||
| 2028 | |||||
| 2029 and thereafter | |||||
| $ | 60,788 | ||||
| Loan Servicing and Systems | Education Technology, Services, and Payment Processing | Asset Generation and Management | Nelnet Bank | Corporate and Other Activities | Total | ||||||||||||||||||||||||||||||
| Goodwill balance | $ | 23,639 | 92,507 | 41,883 | — | 18,873 | 176,902 | ||||||||||||||||||||||||||||
| Nelnet Financial Services | |||||||||||||||||||||||||||||||||||||||||
| Loan Servicing and Systems | Education Technology Services and Payments | Asset Generation and Management | Nelnet Bank | NFS Other Operating Segments | Corporate and Other Activities | Total | |||||||||||||||||||||||||||||||||||
| Total goodwill | $ | 23,639 | 92,507 | 41,883 | — | — | — | 158,029 | |||||||||||||||||||||||||||||||||
| As of | As of | ||||||||||
| March 31, 2024 | December 31, 2023 | ||||||||||
| Retail and other savings | $ | 575,732 | 517,960 | ||||||||
| Brokered CDs, net of brokered deposit fees | 204,174 | 203,522 | |||||||||
| Retail and other CDs (commercial and institutional) | 19,320 | 20,060 | |||||||||
| Commercial | 2,835 | 2,057 | |||||||||
| Total interest-bearing deposits | $ | 802,061 | 743,599 | ||||||||
| As of | As of | ||||||||||
| March 31, 2023 | December 31, 2022 | ||||||||||
| Brokered CDs, net of brokered deposit fees | $ | 203,714 | 254,817 | ||||||||
| Retail and other savings (529, STFIT, and HSA) | 447,792 | 410,556 | |||||||||
| Retail and other CDs (commercial and institutional) | 24,261 | 25,949 | |||||||||
| Total interest-bearing deposits | $ | 675,767 | 691,322 | ||||||||
| One year or less | $ | — | ||||
| After one year to two years | 63,026 | |||||
| After two years to three years | ||||||
| After three years to four years | ||||||
| After four years to five years | ||||||
| After five years | — | |||||
| Total | $ | |||||
| Three months ended March 31, | Three months ended March 31, | |||||||||||||||||||||||||||||||||||||||||||||||||||||||||||||||||||||||||||||||||||||||||
| 2023 | 2022 | |||||||||||||||||||||||||||||||||||||||||||||||||||||||||||||||||||||||||||||||||||||||||
| Common shareholders | Unvested restricted stock shareholders | Total | Common shareholders | Unvested restricted stock shareholders | Total | |||||||||||||||||||||||||||||||||||||||||||||||||||||||||||||||||||||||||||||||||||||
| 2024 | 2024 | 2023 | ||||||||||||||||||||||||||||||||||||||||||||||||||||||||||||||||||||||||||||||||||||||||
| Common shareholders | Common shareholders | Unvested restricted stock shareholders | Total | Common shareholders | Unvested restricted stock shareholders | Total | ||||||||||||||||||||||||||||||||||||||||||||||||||||||||||||||||||||||||||||||||||||
| Numerator: | Numerator: | |||||||||||||||||||||||||||||||||||||||||||||||||||||||||||||||||||||||||||||||||||||||||
| Net income attributable to Nelnet, Inc. | Net income attributable to Nelnet, Inc. | $ | 25,945 | 542 | 26,487 | 183,328 | 3,319 | 186,647 | ||||||||||||||||||||||||||||||||||||||||||||||||||||||||||||||||||||||||||||||||||
| Net income attributable to Nelnet, Inc. | ||||||||||||||||||||||||||||||||||||||||||||||||||||||||||||||||||||||||||||||||||||||||||
| Net income attributable to Nelnet, Inc. | ||||||||||||||||||||||||||||||||||||||||||||||||||||||||||||||||||||||||||||||||||||||||||
| Denominator: | Denominator: | |||||||||||||||||||||||||||||||||||||||||||||||||||||||||||||||||||||||||||||||||||||||||
| Weighted-average common shares outstanding - basic and diluted | ||||||||||||||||||||||||||||||||||||||||||||||||||||||||||||||||||||||||||||||||||||||||||
| Weighted-average common shares outstanding - basic and diluted | ||||||||||||||||||||||||||||||||||||||||||||||||||||||||||||||||||||||||||||||||||||||||||
| Weighted-average common shares outstanding - basic and diluted | Weighted-average common shares outstanding - basic and diluted | 36,580,204 | 764,400 | 37,344,604 | 37,365,339 | 676,495 | 38,041,834 | |||||||||||||||||||||||||||||||||||||||||||||||||||||||||||||||||||||||||||||||||||
| Earnings per share - basic and diluted | Earnings per share - basic and diluted | $ | 0.71 | 0.71 | 0.71 | 4.91 | 4.91 | 4.91 | ||||||||||||||||||||||||||||||||||||||||||||||||||||||||||||||||||||||||||||||||||
| Three months ended March 31, 2023 | Three months ended March 31, 2024 | ||||||||||||||||||||||||||||||||||||||||||||||||||||||||||||||||||||||||||||||||||||||||||||||||||||||||||||
| Loan Servicing and Systems | Education Technology, Services, and Payment Processing | Asset Generation and Management | Nelnet Bank | Corporate and Other Activities | Eliminations | Total | |||||||||||||||||||||||||||||||||||||||||||||||||||||||||||||||||||||||||||||||||||||||||||||||||||||||
| Nelnet Financial Services | |||||||||||||||||||||||||||||||||||||||||||||||||||||||||||||||||||||||||||||||||||||||||||||||||||||||||||||
| Loan Servicing and Systems | |||||||||||||||||||||||||||||||||||||||||||||||||||||||||||||||||||||||||||||||||||||||||||||||||||||||||||||
| Loan Servicing and Systems | |||||||||||||||||||||||||||||||||||||||||||||||||||||||||||||||||||||||||||||||||||||||||||||||||||||||||||||
| Loan Servicing and Systems | Education Technology Services and Payments | Asset Generation and Management | Nelnet Bank | NFS Other Operating Segments | Corporate and Other Activities | Eliminations | Total | ||||||||||||||||||||||||||||||||||||||||||||||||||||||||||||||||||||||||||||||||||||||||||||||||||||||
| Total interest income | Total interest income | $ | 1,037 | 6,036 | 234,719 | 12,259 | 21,199 | (9,282) | 265,968 | ||||||||||||||||||||||||||||||||||||||||||||||||||||||||||||||||||||||||||||||||||||||||||||||||||||
| Interest expense | Interest expense | — | — | 189,198 | 7,214 | 12,318 | (9,282) | 199,449 | |||||||||||||||||||||||||||||||||||||||||||||||||||||||||||||||||||||||||||||||||||||||||||||||||||||
| Net interest income | Net interest income | 1,037 | 6,036 | 45,521 | 5,045 | 8,881 | — | 66,519 | |||||||||||||||||||||||||||||||||||||||||||||||||||||||||||||||||||||||||||||||||||||||||||||||||||||
| Less provision (negative provision) for loan losses | — | — | 31,858 | 2,417 | — | — | 34,275 | ||||||||||||||||||||||||||||||||||||||||||||||||||||||||||||||||||||||||||||||||||||||||||||||||||||||
| Less provision for loan losses | |||||||||||||||||||||||||||||||||||||||||||||||||||||||||||||||||||||||||||||||||||||||||||||||||||||||||||||
| Net interest income after provision for loan losses | Net interest income after provision for loan losses | 1,037 | 6,036 | 13,663 | 2,628 | 8,881 | — | 32,244 | |||||||||||||||||||||||||||||||||||||||||||||||||||||||||||||||||||||||||||||||||||||||||||||||||||||
| Other income (expense): | Other income (expense): | ||||||||||||||||||||||||||||||||||||||||||||||||||||||||||||||||||||||||||||||||||||||||||||||||||||||||||||
| Loan servicing and systems revenue | Loan servicing and systems revenue | 139,227 | — | — | — | — | — | 139,227 | |||||||||||||||||||||||||||||||||||||||||||||||||||||||||||||||||||||||||||||||||||||||||||||||||||||
| Loan servicing and systems revenue | |||||||||||||||||||||||||||||||||||||||||||||||||||||||||||||||||||||||||||||||||||||||||||||||||||||||||||||
| Loan servicing and systems revenue | |||||||||||||||||||||||||||||||||||||||||||||||||||||||||||||||||||||||||||||||||||||||||||||||||||||||||||||
| Intersegment revenue | Intersegment revenue | 7,790 | 56 | — | — | — | (7,846) | — | |||||||||||||||||||||||||||||||||||||||||||||||||||||||||||||||||||||||||||||||||||||||||||||||||||||
| Education technology, services, and payment processing revenue | — | 133,603 | — | — | — | — | 133,603 | ||||||||||||||||||||||||||||||||||||||||||||||||||||||||||||||||||||||||||||||||||||||||||||||||||||||
| Education technology services and payments revenue | |||||||||||||||||||||||||||||||||||||||||||||||||||||||||||||||||||||||||||||||||||||||||||||||||||||||||||||
| Solar construction revenue | Solar construction revenue | — | — | — | — | 8,651 | — | 8,651 | |||||||||||||||||||||||||||||||||||||||||||||||||||||||||||||||||||||||||||||||||||||||||||||||||||||
| Other, net | Other, net | 608 | — | 2,845 | 210 | (17,734) | — | (14,071) | |||||||||||||||||||||||||||||||||||||||||||||||||||||||||||||||||||||||||||||||||||||||||||||||||||||
| Gain on sale of loans, net | — | — | 11,812 | — | — | — | 11,812 | ||||||||||||||||||||||||||||||||||||||||||||||||||||||||||||||||||||||||||||||||||||||||||||||||||||||
| (Loss) gain on sale of loans, net | |||||||||||||||||||||||||||||||||||||||||||||||||||||||||||||||||||||||||||||||||||||||||||||||||||||||||||||
| Derivative settlements, net | Derivative settlements, net | — | — | 23,337 | — | — | — | 23,337 | |||||||||||||||||||||||||||||||||||||||||||||||||||||||||||||||||||||||||||||||||||||||||||||||||||||
| Derivative settlements, net | |||||||||||||||||||||||||||||||||||||||||||||||||||||||||||||||||||||||||||||||||||||||||||||||||||||||||||||
| Derivative settlements, net | |||||||||||||||||||||||||||||||||||||||||||||||||||||||||||||||||||||||||||||||||||||||||||||||||||||||||||||
| Derivative market value adjustments, net | Derivative market value adjustments, net | — | — | (37,411) | — | — | — | (37,411) | |||||||||||||||||||||||||||||||||||||||||||||||||||||||||||||||||||||||||||||||||||||||||||||||||||||
| Total other income (expense) | 147,625 | 133,659 | 583 | 210 | (9,083) | (7,846) | 265,148 | ||||||||||||||||||||||||||||||||||||||||||||||||||||||||||||||||||||||||||||||||||||||||||||||||||||||
| Total other income (expense), net | |||||||||||||||||||||||||||||||||||||||||||||||||||||||||||||||||||||||||||||||||||||||||||||||||||||||||||||
| Cost of services: | Cost of services: | ||||||||||||||||||||||||||||||||||||||||||||||||||||||||||||||||||||||||||||||||||||||||||||||||||||||||||||
| Cost to provide education technology, services, and payment processing services | — | 47,704 | — | — | — | — | 47,704 | ||||||||||||||||||||||||||||||||||||||||||||||||||||||||||||||||||||||||||||||||||||||||||||||||||||||
| Cost to provide education technology services and payments | |||||||||||||||||||||||||||||||||||||||||||||||||||||||||||||||||||||||||||||||||||||||||||||||||||||||||||||
| Cost to provide education technology services and payments | |||||||||||||||||||||||||||||||||||||||||||||||||||||||||||||||||||||||||||||||||||||||||||||||||||||||||||||
| Cost to provide education technology services and payments | |||||||||||||||||||||||||||||||||||||||||||||||||||||||||||||||||||||||||||||||||||||||||||||||||||||||||||||
| Cost to provide solar construction services | Cost to provide solar construction services | — | — | — | — | 8,299 | — | 8,299 | |||||||||||||||||||||||||||||||||||||||||||||||||||||||||||||||||||||||||||||||||||||||||||||||||||||
| Total cost of services | Total cost of services | — | 47,704 | — | — | 8,299 | — | 56,003 | |||||||||||||||||||||||||||||||||||||||||||||||||||||||||||||||||||||||||||||||||||||||||||||||||||||
| Operating expenses: | Operating expenses: | ||||||||||||||||||||||||||||||||||||||||||||||||||||||||||||||||||||||||||||||||||||||||||||||||||||||||||||
| Salaries and benefits | |||||||||||||||||||||||||||||||||||||||||||||||||||||||||||||||||||||||||||||||||||||||||||||||||||||||||||||
| Salaries and benefits | |||||||||||||||||||||||||||||||||||||||||||||||||||||||||||||||||||||||||||||||||||||||||||||||||||||||||||||
| Salaries and benefits | Salaries and benefits | 84,560 | 37,913 | 755 | 2,064 | 27,419 | — | 152,710 | |||||||||||||||||||||||||||||||||||||||||||||||||||||||||||||||||||||||||||||||||||||||||||||||||||||
| Depreciation and amortization | Depreciation and amortization | 4,513 | 2,578 | — | 5 | 9,531 | — | 16,627 | |||||||||||||||||||||||||||||||||||||||||||||||||||||||||||||||||||||||||||||||||||||||||||||||||||||
| Other expenses | Other expenses | 13,313 | 8,063 | 5,016 | 782 | 13,611 | — | 40,785 | |||||||||||||||||||||||||||||||||||||||||||||||||||||||||||||||||||||||||||||||||||||||||||||||||||||
| Intersegment expenses, net | Intersegment expenses, net | 21,057 | 5,800 | 8,696 | 80 | (27,787) | (7,846) | — | |||||||||||||||||||||||||||||||||||||||||||||||||||||||||||||||||||||||||||||||||||||||||||||||||||||
| Total operating expenses | Total operating expenses | 123,443 | 54,354 | 14,467 | 2,931 | 22,774 | (7,846) | 210,122 | |||||||||||||||||||||||||||||||||||||||||||||||||||||||||||||||||||||||||||||||||||||||||||||||||||||
| Income (loss) before income taxes | Income (loss) before income taxes | 25,219 | 37,637 | (221) | (93) | (31,275) | — | 31,267 | |||||||||||||||||||||||||||||||||||||||||||||||||||||||||||||||||||||||||||||||||||||||||||||||||||||
| Income tax (expense) benefit | Income tax (expense) benefit | (6,053) | (9,066) | 53 | 35 | 6,781 | — | (8,250) | |||||||||||||||||||||||||||||||||||||||||||||||||||||||||||||||||||||||||||||||||||||||||||||||||||||
| Net income (loss) | Net income (loss) | 19,166 | 28,571 | (168) | (58) | (24,494) | — | 23,017 | |||||||||||||||||||||||||||||||||||||||||||||||||||||||||||||||||||||||||||||||||||||||||||||||||||||
| Net loss attributable to noncontrolling interests | — | 138 | — | — | 3,332 | — | 3,470 | ||||||||||||||||||||||||||||||||||||||||||||||||||||||||||||||||||||||||||||||||||||||||||||||||||||||
| Net loss (income) attributable to noncontrolling interests | |||||||||||||||||||||||||||||||||||||||||||||||||||||||||||||||||||||||||||||||||||||||||||||||||||||||||||||
| Net income (loss) attributable to Nelnet, Inc. | Net income (loss) attributable to Nelnet, Inc. | $ | 19,166 | 28,709 | (168) | (58) | (21,162) | — | 26,487 | ||||||||||||||||||||||||||||||||||||||||||||||||||||||||||||||||||||||||||||||||||||||||||||||||||||
| Total assets as of March 31, 2023 | $ | 232,667 | 424,742 | 14,939,324 | 1,000,659 | 2,207,722 | (722,505) | 18,082,609 | |||||||||||||||||||||||||||||||||||||||||||||||||||||||||||||||||||||||||||||||||||||||||||||||||||||
| Total assets as of March 31, 2024 | |||||||||||||||||||||||||||||||||||||||||||||||||||||||||||||||||||||||||||||||||||||||||||||||||||||||||||||
| Total assets as of March 31, 2024 | |||||||||||||||||||||||||||||||||||||||||||||||||||||||||||||||||||||||||||||||||||||||||||||||||||||||||||||
| Total assets as of March 31, 2024 | |||||||||||||||||||||||||||||||||||||||||||||||||||||||||||||||||||||||||||||||||||||||||||||||||||||||||||||
| Three months ended March 31, 2022 | Three months ended March 31, 2023 | ||||||||||||||||||||||||||||||||||||||||||||||||||||||||||||||||||||||||||||||||||||||||||||||||||||||||||||
| Loan Servicing and Systems | Education Technology, Services, and Payment Processing | Asset Generation and Management | Nelnet Bank | Corporate and Other Activities | Eliminations | Total | |||||||||||||||||||||||||||||||||||||||||||||||||||||||||||||||||||||||||||||||||||||||||||||||||||||||
| Nelnet Financial Services | |||||||||||||||||||||||||||||||||||||||||||||||||||||||||||||||||||||||||||||||||||||||||||||||||||||||||||||
| Loan Servicing and Systems | |||||||||||||||||||||||||||||||||||||||||||||||||||||||||||||||||||||||||||||||||||||||||||||||||||||||||||||
| Loan Servicing and Systems | |||||||||||||||||||||||||||||||||||||||||||||||||||||||||||||||||||||||||||||||||||||||||||||||||||||||||||||
| Loan Servicing and Systems | Education Technology Services and Payments | Asset Generation and Management | Nelnet Bank | NFS Other Operating Segments | Corporate and Other Activities | Eliminations | Total | ||||||||||||||||||||||||||||||||||||||||||||||||||||||||||||||||||||||||||||||||||||||||||||||||||||||
| Total interest income | Total interest income | $ | 67 | 339 | 118,598 | 3,030 | 3,992 | (828) | 125,196 | ||||||||||||||||||||||||||||||||||||||||||||||||||||||||||||||||||||||||||||||||||||||||||||||||||||
| Interest expense | Interest expense | 24 | — | 46,003 | 856 | 2,026 | (828) | 48,079 | |||||||||||||||||||||||||||||||||||||||||||||||||||||||||||||||||||||||||||||||||||||||||||||||||||||
| Net interest income | Net interest income | 43 | 339 | 72,595 | 2,174 | 1,966 | — | 77,117 | |||||||||||||||||||||||||||||||||||||||||||||||||||||||||||||||||||||||||||||||||||||||||||||||||||||
| Less provision (negative provision) for loan losses | — | — | (864) | 429 | — | — | (435) | ||||||||||||||||||||||||||||||||||||||||||||||||||||||||||||||||||||||||||||||||||||||||||||||||||||||
| Less provision for loan losses | |||||||||||||||||||||||||||||||||||||||||||||||||||||||||||||||||||||||||||||||||||||||||||||||||||||||||||||
| Net interest income after provision for loan losses | Net interest income after provision for loan losses | 43 | 339 | 73,459 | 1,745 | 1,966 | — | 77,552 | |||||||||||||||||||||||||||||||||||||||||||||||||||||||||||||||||||||||||||||||||||||||||||||||||||||
| Other income (expense): | Other income (expense): | ||||||||||||||||||||||||||||||||||||||||||||||||||||||||||||||||||||||||||||||||||||||||||||||||||||||||||||
| Loan servicing and systems revenue | Loan servicing and systems revenue | 136,368 | — | — | — | — | — | 136,368 | |||||||||||||||||||||||||||||||||||||||||||||||||||||||||||||||||||||||||||||||||||||||||||||||||||||
| Loan servicing and systems revenue | |||||||||||||||||||||||||||||||||||||||||||||||||||||||||||||||||||||||||||||||||||||||||||||||||||||||||||||
| Loan servicing and systems revenue | |||||||||||||||||||||||||||||||||||||||||||||||||||||||||||||||||||||||||||||||||||||||||||||||||||||||||||||
| Intersegment revenue | Intersegment revenue | 8,480 | 3 | — | — | — | (8,483) | — | |||||||||||||||||||||||||||||||||||||||||||||||||||||||||||||||||||||||||||||||||||||||||||||||||||||
| Education technology, services, and payment processing revenue | — | 112,286 | — | — | — | — | 112,286 | ||||||||||||||||||||||||||||||||||||||||||||||||||||||||||||||||||||||||||||||||||||||||||||||||||||||
| Education technology services and payments revenue | |||||||||||||||||||||||||||||||||||||||||||||||||||||||||||||||||||||||||||||||||||||||||||||||||||||||||||||
| Solar construction revenue | Solar construction revenue | — | — | — | — | — | — | — | |||||||||||||||||||||||||||||||||||||||||||||||||||||||||||||||||||||||||||||||||||||||||||||||||||||
| Other, net | Other, net | 740 | — | 6,511 | 1,500 | 1,125 | — | 9,877 | |||||||||||||||||||||||||||||||||||||||||||||||||||||||||||||||||||||||||||||||||||||||||||||||||||||
| Gain on sale of loans, net | — | — | 2,989 | — | — | — | 2,989 | ||||||||||||||||||||||||||||||||||||||||||||||||||||||||||||||||||||||||||||||||||||||||||||||||||||||
| (Loss) gain on sale of loans, net | |||||||||||||||||||||||||||||||||||||||||||||||||||||||||||||||||||||||||||||||||||||||||||||||||||||||||||||
| Derivative settlements, net | Derivative settlements, net | — | — | (2,809) | — | — | — | (2,809) | |||||||||||||||||||||||||||||||||||||||||||||||||||||||||||||||||||||||||||||||||||||||||||||||||||||
| Derivative settlements, net | |||||||||||||||||||||||||||||||||||||||||||||||||||||||||||||||||||||||||||||||||||||||||||||||||||||||||||||
| Derivative settlements, net | |||||||||||||||||||||||||||||||||||||||||||||||||||||||||||||||||||||||||||||||||||||||||||||||||||||||||||||
| Derivative market value adjustments, net | Derivative market value adjustments, net | — | — | 145,734 | — | — | — | 145,734 | |||||||||||||||||||||||||||||||||||||||||||||||||||||||||||||||||||||||||||||||||||||||||||||||||||||
| Total other income (expense) | 145,588 | 112,289 | 152,425 | 1,500 | 1,125 | (8,483) | 404,445 | ||||||||||||||||||||||||||||||||||||||||||||||||||||||||||||||||||||||||||||||||||||||||||||||||||||||
| Total other income (expense), net | |||||||||||||||||||||||||||||||||||||||||||||||||||||||||||||||||||||||||||||||||||||||||||||||||||||||||||||
| Cost of services: | Cost of services: | ||||||||||||||||||||||||||||||||||||||||||||||||||||||||||||||||||||||||||||||||||||||||||||||||||||||||||||
| Cost to provide education technology, services, and payment processing services | — | 35,545 | — | — | — | — | 35,545 | ||||||||||||||||||||||||||||||||||||||||||||||||||||||||||||||||||||||||||||||||||||||||||||||||||||||
| Cost to provide education technology services and payments | |||||||||||||||||||||||||||||||||||||||||||||||||||||||||||||||||||||||||||||||||||||||||||||||||||||||||||||
| Cost to provide education technology services and payments | |||||||||||||||||||||||||||||||||||||||||||||||||||||||||||||||||||||||||||||||||||||||||||||||||||||||||||||
| Cost to provide education technology services and payments | |||||||||||||||||||||||||||||||||||||||||||||||||||||||||||||||||||||||||||||||||||||||||||||||||||||||||||||
| Cost to provide solar construction services | Cost to provide solar construction services | — | — | — | — | — | — | — | |||||||||||||||||||||||||||||||||||||||||||||||||||||||||||||||||||||||||||||||||||||||||||||||||||||
| Total cost of services | Total cost of services | — | 35,545 | — | — | — | — | 35,545 | |||||||||||||||||||||||||||||||||||||||||||||||||||||||||||||||||||||||||||||||||||||||||||||||||||||
| Operating expenses: | Operating expenses: | ||||||||||||||||||||||||||||||||||||||||||||||||||||||||||||||||||||||||||||||||||||||||||||||||||||||||||||
| Salaries and benefits | |||||||||||||||||||||||||||||||||||||||||||||||||||||||||||||||||||||||||||||||||||||||||||||||||||||||||||||
| Salaries and benefits | |||||||||||||||||||||||||||||||||||||||||||||||||||||||||||||||||||||||||||||||||||||||||||||||||||||||||||||
| Salaries and benefits | Salaries and benefits | 91,972 | 31,286 | 591 | 1,554 | 24,012 | — | 149,414 | |||||||||||||||||||||||||||||||||||||||||||||||||||||||||||||||||||||||||||||||||||||||||||||||||||||
| Depreciation and amortization | Depreciation and amortization | 4,954 | 2,315 | — | 3 | 9,684 | — | 16,956 | |||||||||||||||||||||||||||||||||||||||||||||||||||||||||||||||||||||||||||||||||||||||||||||||||||||
| Other expenses | Other expenses | 16,213 | 5,764 | 3,033 | 682 | 13,804 | — | 39,499 | |||||||||||||||||||||||||||||||||||||||||||||||||||||||||||||||||||||||||||||||||||||||||||||||||||||
| Intersegment expenses, net | Intersegment expenses, net | 20,398 | 4,605 | 8,831 | 45 | (25,396) | (8,483) | — | |||||||||||||||||||||||||||||||||||||||||||||||||||||||||||||||||||||||||||||||||||||||||||||||||||||
| Total operating expenses | Total operating expenses | 133,537 | 43,970 | 12,455 | 2,284 | 22,104 | (8,483) | 205,869 | |||||||||||||||||||||||||||||||||||||||||||||||||||||||||||||||||||||||||||||||||||||||||||||||||||||
| Income (loss) before income taxes | Income (loss) before income taxes | 12,094 | 33,113 | 213,429 | 961 | (19,013) | — | 240,583 | |||||||||||||||||||||||||||||||||||||||||||||||||||||||||||||||||||||||||||||||||||||||||||||||||||||
| Income tax (expense) benefit | Income tax (expense) benefit | (2,903) | (7,947) | (51,223) | (223) | 6,598 | — | (55,697) | |||||||||||||||||||||||||||||||||||||||||||||||||||||||||||||||||||||||||||||||||||||||||||||||||||||
| Net income (loss) | Net income (loss) | 9,191 | 25,166 | 162,206 | 738 | (12,415) | — | 184,886 | |||||||||||||||||||||||||||||||||||||||||||||||||||||||||||||||||||||||||||||||||||||||||||||||||||||
| Net loss attributable to noncontrolling interests | — | — | — | — | 1,761 | — | 1,761 | ||||||||||||||||||||||||||||||||||||||||||||||||||||||||||||||||||||||||||||||||||||||||||||||||||||||
| Net loss (income) attributable to noncontrolling interests | |||||||||||||||||||||||||||||||||||||||||||||||||||||||||||||||||||||||||||||||||||||||||||||||||||||||||||||
| Net income (loss) attributable to Nelnet, Inc. | Net income (loss) attributable to Nelnet, Inc. | $ | 9,191 | 25,166 | 162,206 | 738 | (10,654) | — | 186,647 | ||||||||||||||||||||||||||||||||||||||||||||||||||||||||||||||||||||||||||||||||||||||||||||||||||||
| Total assets as of March 31, 2022 | $ | 259,712 | 376,794 | 18,158,972 | 656,242 | 2,066,417 | (528,396) | 20,989,741 | |||||||||||||||||||||||||||||||||||||||||||||||||||||||||||||||||||||||||||||||||||||||||||||||||||||
| Total assets as of March 31, 2023 | |||||||||||||||||||||||||||||||||||||||||||||||||||||||||||||||||||||||||||||||||||||||||||||||||||||||||||||
| Total assets as of March 31, 2023 | |||||||||||||||||||||||||||||||||||||||||||||||||||||||||||||||||||||||||||||||||||||||||||||||||||||||||||||
| Total assets as of March 31, 2023 | |||||||||||||||||||||||||||||||||||||||||||||||||||||||||||||||||||||||||||||||||||||||||||||||||||||||||||||
| Three months ended March 31, | |||||||||||||||||||||||||
| 2023 | 2022 | ||||||||||||||||||||||||
| Government loan servicing | Government loan servicing | $ | 108,880 | 109,125 | |||||||||||||||||||||
| Government loan servicing | |||||||||||||||||||||||||
| Government loan servicing | |||||||||||||||||||||||||
| Private education and consumer loan servicing | |||||||||||||||||||||||||
| Private education and consumer loan servicing | |||||||||||||||||||||||||
| Private education and consumer loan servicing | Private education and consumer loan servicing | 12,164 | 12,873 | ||||||||||||||||||||||
| FFELP loan servicing | FFELP loan servicing | 3,368 | 4,248 | ||||||||||||||||||||||
| FFELP loan servicing | |||||||||||||||||||||||||
| FFELP loan servicing | |||||||||||||||||||||||||
| Software services | |||||||||||||||||||||||||
| Software services | |||||||||||||||||||||||||
| Software services | Software services | 9,697 | 7,400 | ||||||||||||||||||||||
| Outsourced services | Outsourced services | 5,118 | 2,722 | ||||||||||||||||||||||
| Outsourced services | |||||||||||||||||||||||||
| Outsourced services | |||||||||||||||||||||||||
| Loan servicing and systems revenue | Loan servicing and systems revenue | $ | 139,227 | 136,368 | |||||||||||||||||||||
| Loan servicing and systems revenue | |||||||||||||||||||||||||
| Loan servicing and systems revenue | |||||||||||||||||||||||||
| Three months ended March 31, | |||||||||||||||||||||||||
| 2023 | 2022 | ||||||||||||||||||||||||
| Tuition payment plan services | Tuition payment plan services | $ | 34,187 | 30,716 | |||||||||||||||||||||
| Tuition payment plan services | |||||||||||||||||||||||||
| Tuition payment plan services | |||||||||||||||||||||||||
| Payment processing | Payment processing | 44,041 | 38,071 | ||||||||||||||||||||||
| Education technology and services | 54,787 | 43,251 | |||||||||||||||||||||||
| Payment processing | |||||||||||||||||||||||||
| Payment processing | |||||||||||||||||||||||||
| Education technology services | |||||||||||||||||||||||||
| Education technology services | |||||||||||||||||||||||||
| Education technology services | |||||||||||||||||||||||||
| Other | Other | 588 | 248 | ||||||||||||||||||||||
| Education technology, services, and payment processing revenue | $ | 133,603 | 112,286 | ||||||||||||||||||||||
| Other | |||||||||||||||||||||||||
| Other | |||||||||||||||||||||||||
| Education technology services and payments revenue | |||||||||||||||||||||||||
| Education technology services and payments revenue | |||||||||||||||||||||||||
| Education technology services and payments revenue | |||||||||||||||||||||||||
| Three months ended March 31, | |||||||||||||||||||||||
| 2024 | 2023 | ||||||||||||||||||||||
| Commercial revenue | $ | 11,578 | 5,876 | ||||||||||||||||||||
| Residential revenue (a) | 2,148 | 2,775 | |||||||||||||||||||||
| Solar construction revenue | $ | 13,726 | 8,651 | ||||||||||||||||||||
| Three months ended March 31, | ||||||||||||||||||||||||||||||||||
| 2023 | 2022 | |||||||||||||||||||||||||||||||||
| Three months ended March 31, | ||||||||||||||||||||||||||||||||||
| Three months ended March 31, | ||||||||||||||||||||||||||||||||||
| Three months ended March 31, | ||||||||||||||||||||||||||||||||||
| 2024 | ||||||||||||||||||||||||||||||||||
| 2024 | ||||||||||||||||||||||||||||||||||
| 2024 | ||||||||||||||||||||||||||||||||||
| Reinsurance premiums | ||||||||||||||||||||||||||||||||||
| Reinsurance premiums | ||||||||||||||||||||||||||||||||||
| Reinsurance premiums | ||||||||||||||||||||||||||||||||||
| Borrower late fee income | ||||||||||||||||||||||||||||||||||
| Borrower late fee income | ||||||||||||||||||||||||||||||||||
| Borrower late fee income | ||||||||||||||||||||||||||||||||||
| Gain (loss) from solar investments, net | ||||||||||||||||||||||||||||||||||
| Gain (loss) from solar investments, net | ||||||||||||||||||||||||||||||||||
| Gain (loss) from solar investments, net | ||||||||||||||||||||||||||||||||||
| ALLO preferred return | ALLO preferred return | $ | 2,249 | 2,117 | ||||||||||||||||||||||||||||||
| Borrower late fee income | 2,247 | 2,431 | ||||||||||||||||||||||||||||||||
| ALLO preferred return | ||||||||||||||||||||||||||||||||||
| ALLO preferred return | ||||||||||||||||||||||||||||||||||
| Administration/sponsor fee income | Administration/sponsor fee income | 1,772 | 2,123 | |||||||||||||||||||||||||||||||
| Investment advisory services | 1,612 | 1,282 | ||||||||||||||||||||||||||||||||
| Administration/sponsor fee income | ||||||||||||||||||||||||||||||||||
| Administration/sponsor fee income | ||||||||||||||||||||||||||||||||||
| Investment advisory services (WRCM) | ||||||||||||||||||||||||||||||||||
| Investment advisory services (WRCM) | ||||||||||||||||||||||||||||||||||
| Investment advisory services (WRCM) | ||||||||||||||||||||||||||||||||||
| Loss from ALLO voting membership interest investment | ||||||||||||||||||||||||||||||||||
| Loss from ALLO voting membership interest investment | ||||||||||||||||||||||||||||||||||
| Loss from ALLO voting membership interest investment | Loss from ALLO voting membership interest investment | (20,213) | (13,130) | |||||||||||||||||||||||||||||||
| Investment activity, net | Investment activity, net | (3,577) | 11,856 | |||||||||||||||||||||||||||||||
| Loss from solar investments | (1,947) | (1,030) | ||||||||||||||||||||||||||||||||
| Investment activity, net | ||||||||||||||||||||||||||||||||||
| Investment activity, net | ||||||||||||||||||||||||||||||||||
| Other | ||||||||||||||||||||||||||||||||||
| Other | ||||||||||||||||||||||||||||||||||
| Other | Other | 3,786 | 4,228 | |||||||||||||||||||||||||||||||
| Other, net | Other, net | $ | (14,071) | 9,877 | ||||||||||||||||||||||||||||||
| Other, net | ||||||||||||||||||||||||||||||||||
| Other, net | ||||||||||||||||||||||||||||||||||
| As of March 31, 2023 | As of December 31, 2022 | As of March 31, 2024 | As of December 31, 2023 | ||||||||||||||||||||||||||||||||||||||||||||||||||||||||||||||||||||||||||||||||||||||||||||||||||||||||||||||||||||||
| Level 1 | Level 2 | Total | Level 1 | Level 2 | Total | Level 1 | Level 2 | Total | Level 1 | Level 2 | Total | ||||||||||||||||||||||||||||||||||||||||||||||||||||||||||||||||||||||||||||||||||||||||||||||||||||||||||||||
| Assets: | Assets: | ||||||||||||||||||||||||||||||||||||||||||||||||||||||||||||||||||||||||||||||||||||||||||||||||||||||||||||||||||||||||
| Investments: | Investments: | ||||||||||||||||||||||||||||||||||||||||||||||||||||||||||||||||||||||||||||||||||||||||||||||||||||||||||||||||||||||||
| Investments: | |||||||||||||||||||||||||||||||||||||||||||||||||||||||||||||||||||||||||||||||||||||||||||||||||||||||||||||||||||||||||
| Investments: | |||||||||||||||||||||||||||||||||||||||||||||||||||||||||||||||||||||||||||||||||||||||||||||||||||||||||||||||||||||||||
| Asset-backed debt securities - available-for-sale | |||||||||||||||||||||||||||||||||||||||||||||||||||||||||||||||||||||||||||||||||||||||||||||||||||||||||||||||||||||||||
| Asset-backed debt securities - available-for-sale | |||||||||||||||||||||||||||||||||||||||||||||||||||||||||||||||||||||||||||||||||||||||||||||||||||||||||||||||||||||||||
| Asset-backed debt securities - available-for-sale | Asset-backed debt securities - available-for-sale | $ | 99 | 1,070,604 | 1,070,703 | 100 | 1,388,937 | 1,389,037 | |||||||||||||||||||||||||||||||||||||||||||||||||||||||||||||||||||||||||||||||||||||||||||||||||||||||||||||||||
| Equity securities | Equity securities | 91 | — | 91 | 6,719 | — | 6,719 | ||||||||||||||||||||||||||||||||||||||||||||||||||||||||||||||||||||||||||||||||||||||||||||||||||||||||||||||||||
| Equity securities measured at net asset value (a) | Equity securities measured at net asset value (a) | 35,572 | 32,363 | ||||||||||||||||||||||||||||||||||||||||||||||||||||||||||||||||||||||||||||||||||||||||||||||||||||||||||||||||||||||
| Total investments | Total investments | 190 | 1,070,604 | 1,106,366 | 6,819 | 1,388,937 | 1,428,119 | ||||||||||||||||||||||||||||||||||||||||||||||||||||||||||||||||||||||||||||||||||||||||||||||||||||||||||||||||||
| Derivative instruments | |||||||||||||||||||||||||||||||||||||||||||||||||||||||||||||||||||||||||||||||||||||||||||||||||||||||||||||||||||||||||
| Total assets | Total assets | $ | 190 | 1,070,604 | 1,106,366 | 6,819 | 1,388,937 | 1,428,119 | |||||||||||||||||||||||||||||||||||||||||||||||||||||||||||||||||||||||||||||||||||||||||||||||||||||||||||||||||
| Liabilities: | |||||||||||||||||||||||||||||||||||||||||||||||||||||||||||||||||||||||||||||||||||||||||||||||||||||||||||||||||||||||||
| Derivative instruments | |||||||||||||||||||||||||||||||||||||||||||||||||||||||||||||||||||||||||||||||||||||||||||||||||||||||||||||||||||||||||
| Derivative instruments | |||||||||||||||||||||||||||||||||||||||||||||||||||||||||||||||||||||||||||||||||||||||||||||||||||||||||||||||||||||||||
| Derivative instruments | |||||||||||||||||||||||||||||||||||||||||||||||||||||||||||||||||||||||||||||||||||||||||||||||||||||||||||||||||||||||||
| Total liabilities | |||||||||||||||||||||||||||||||||||||||||||||||||||||||||||||||||||||||||||||||||||||||||||||||||||||||||||||||||||||||||
| As of March 31, 2023 | As of March 31, 2024 | |||||||||||||||||||||||||||||||||||||||||||||||||||||||||||||||||||||
| Fair value | Carrying value | Level 1 | Level 2 | Level 3 | Fair value | Carrying value | Level 1 | Level 2 | Level 3 | |||||||||||||||||||||||||||||||||||||||||||||||||||||||||||||
| Financial assets: | Financial assets: | |||||||||||||||||||||||||||||||||||||||||||||||||||||||||||||||||||||
| Loans receivable | Loans receivable | $ | 13,919,785 | 13,760,708 | — | — | 13,919,785 | |||||||||||||||||||||||||||||||||||||||||||||||||||||||||||||||
| Loans receivable | ||||||||||||||||||||||||||||||||||||||||||||||||||||||||||||||||||||||
| Loans receivable | ||||||||||||||||||||||||||||||||||||||||||||||||||||||||||||||||||||||
| Accrued loan interest receivable | Accrued loan interest receivable | 800,400 | 800,400 | — | 800,400 | — | ||||||||||||||||||||||||||||||||||||||||||||||||||||||||||||||||
| Cash and cash equivalents | Cash and cash equivalents | 187,574 | 187,574 | 187,574 | — | — | ||||||||||||||||||||||||||||||||||||||||||||||||||||||||||||||||
| Investments (at fair value) | Investments (at fair value) | 1,106,366 | 1,106,366 | 190 | 1,070,604 | — | ||||||||||||||||||||||||||||||||||||||||||||||||||||||||||||||||
| Investments - held to maturity | 154,119 | 154,119 | — | 154,119 | — | |||||||||||||||||||||||||||||||||||||||||||||||||||||||||||||||||
| Investments - held-to-maturity | ||||||||||||||||||||||||||||||||||||||||||||||||||||||||||||||||||||||
| Notes receivable | Notes receivable | 30,246 | 30,246 | — | 30,246 | — | ||||||||||||||||||||||||||||||||||||||||||||||||||||||||||||||||
| Beneficial interest in loan securitizations | Beneficial interest in loan securitizations | 201,216 | 177,888 | — | — | 201,216 | ||||||||||||||||||||||||||||||||||||||||||||||||||||||||||||||||
| Restricted cash | Restricted cash | 576,267 | 576,267 | 576,267 | — | — | ||||||||||||||||||||||||||||||||||||||||||||||||||||||||||||||||
| Restricted cash – due to customers | Restricted cash – due to customers | 134,202 | 134,202 | 134,202 | — | — | ||||||||||||||||||||||||||||||||||||||||||||||||||||||||||||||||
| Derivative instruments | ||||||||||||||||||||||||||||||||||||||||||||||||||||||||||||||||||||||
| Derivative instruments | ||||||||||||||||||||||||||||||||||||||||||||||||||||||||||||||||||||||
| Derivative instruments | ||||||||||||||||||||||||||||||||||||||||||||||||||||||||||||||||||||||
| Financial liabilities: | Financial liabilities: | |||||||||||||||||||||||||||||||||||||||||||||||||||||||||||||||||||||
| Bonds and notes payable | ||||||||||||||||||||||||||||||||||||||||||||||||||||||||||||||||||||||
| Bonds and notes payable | ||||||||||||||||||||||||||||||||||||||||||||||||||||||||||||||||||||||
| Bonds and notes payable | Bonds and notes payable | 12,933,378 | 13,438,416 | — | 12,933,378 | — | ||||||||||||||||||||||||||||||||||||||||||||||||||||||||||||||||
| Accrued interest payable | Accrued interest payable | 34,374 | 34,374 | — | 34,374 | — | ||||||||||||||||||||||||||||||||||||||||||||||||||||||||||||||||
| Bank deposits | Bank deposits | 647,708 | 675,767 | 391,379 | 256,329 | — | ||||||||||||||||||||||||||||||||||||||||||||||||||||||||||||||||
| Due to customers | Due to customers | 280,624 | 280,624 | 280,624 | — | — | ||||||||||||||||||||||||||||||||||||||||||||||||||||||||||||||||
| Derivative instruments | ||||||||||||||||||||||||||||||||||||||||||||||||||||||||||||||||||||||
| As of December 31, 2022 | As of December 31, 2023 | |||||||||||||||||||||||||||||||||||||||||||||||||||||||||||||||||||||
| Fair value | Carrying value | Level 1 | Level 2 | Level 3 | Fair value | Carrying value | Level 1 | Level 2 | Level 3 | |||||||||||||||||||||||||||||||||||||||||||||||||||||||||||||
| Financial assets: | Financial assets: | |||||||||||||||||||||||||||||||||||||||||||||||||||||||||||||||||||||
| Loans receivable | Loans receivable | $ | 14,586,794 | 14,427,025 | — | — | 14,586,794 | |||||||||||||||||||||||||||||||||||||||||||||||||||||||||||||||
| Loans receivable | ||||||||||||||||||||||||||||||||||||||||||||||||||||||||||||||||||||||
| Loans receivable | ||||||||||||||||||||||||||||||||||||||||||||||||||||||||||||||||||||||
| Accrued loan interest receivable | Accrued loan interest receivable | 816,864 | 816,864 | — | 816,864 | — | ||||||||||||||||||||||||||||||||||||||||||||||||||||||||||||||||
| Cash and cash equivalents | Cash and cash equivalents | 118,146 | 118,146 | 118,146 | — | — | ||||||||||||||||||||||||||||||||||||||||||||||||||||||||||||||||
| Investments (at fair value) | Investments (at fair value) | 1,428,119 | 1,428,119 | 6,819 | 1,388,937 | — | ||||||||||||||||||||||||||||||||||||||||||||||||||||||||||||||||
| Investments - held to maturity | 18,996 | 18,774 | — | 18,996 | — | |||||||||||||||||||||||||||||||||||||||||||||||||||||||||||||||||
| Investments - held-to-maturity | ||||||||||||||||||||||||||||||||||||||||||||||||||||||||||||||||||||||
| Notes receivable | Notes receivable | 31,106 | 31,106 | — | 31,106 | — | ||||||||||||||||||||||||||||||||||||||||||||||||||||||||||||||||
| Beneficial interest in loan securitizations | Beneficial interest in loan securitizations | 162,360 | 138,738 | — | — | 162,360 | ||||||||||||||||||||||||||||||||||||||||||||||||||||||||||||||||
| Restricted cash | Restricted cash | 945,159 | 945,159 | 945,159 | — | — | ||||||||||||||||||||||||||||||||||||||||||||||||||||||||||||||||
| Restricted cash – due to customers | Restricted cash – due to customers | 294,311 | 294,311 | 294,311 | — | — | ||||||||||||||||||||||||||||||||||||||||||||||||||||||||||||||||
| Derivative instruments | ||||||||||||||||||||||||||||||||||||||||||||||||||||||||||||||||||||||
| Derivative instruments | ||||||||||||||||||||||||||||||||||||||||||||||||||||||||||||||||||||||
| Derivative instruments | ||||||||||||||||||||||||||||||||||||||||||||||||||||||||||||||||||||||
| Financial liabilities: | Financial liabilities: | |||||||||||||||||||||||||||||||||||||||||||||||||||||||||||||||||||||
| Bonds and notes payable | ||||||||||||||||||||||||||||||||||||||||||||||||||||||||||||||||||||||
| Bonds and notes payable | ||||||||||||||||||||||||||||||||||||||||||||||||||||||||||||||||||||||
| Bonds and notes payable | Bonds and notes payable | 14,088,666 | 14,637,195 | — | 14,088,666 | — | ||||||||||||||||||||||||||||||||||||||||||||||||||||||||||||||||
| Accrued interest payable | Accrued interest payable | 36,049 | 36,049 | — | 36,049 | — | ||||||||||||||||||||||||||||||||||||||||||||||||||||||||||||||||
| Bank deposits | Bank deposits | 664,573 | 691,322 | 355,282 | 309,291 | — | ||||||||||||||||||||||||||||||||||||||||||||||||||||||||||||||||
| Due to customers | Due to customers | 348,317 | 348,317 | 348,317 | — | — | ||||||||||||||||||||||||||||||||||||||||||||||||||||||||||||||||
| Derivative instruments | ||||||||||||||||||||||||||||||||||||||||||||||||||||||||||||||||||||||
| Three months ended March 31, | ||||||||||||||||||||||||||||||||||
| 2023 | 2022 | |||||||||||||||||||||||||||||||||
| Three months ended March 31, | ||||||||||||||||||||||||||||||||||
| Three months ended March 31, | ||||||||||||||||||||||||||||||||||
| Three months ended March 31, | ||||||||||||||||||||||||||||||||||
| 2024 | ||||||||||||||||||||||||||||||||||
| 2024 | ||||||||||||||||||||||||||||||||||
| 2024 | ||||||||||||||||||||||||||||||||||
| GAAP net income attributable to Nelnet, Inc. | ||||||||||||||||||||||||||||||||||
| GAAP net income attributable to Nelnet, Inc. | ||||||||||||||||||||||||||||||||||
| GAAP net income attributable to Nelnet, Inc. | GAAP net income attributable to Nelnet, Inc. | $ | 26,487 | 186,647 | ||||||||||||||||||||||||||||||
| Realized and unrealized derivative market value adjustments | Realized and unrealized derivative market value adjustments | 37,411 | (145,734) | |||||||||||||||||||||||||||||||
| Realized and unrealized derivative market value adjustments | ||||||||||||||||||||||||||||||||||
| Realized and unrealized derivative market value adjustments | ||||||||||||||||||||||||||||||||||
| Tax effect (a) | Tax effect (a) | (8,979) | 34,976 | |||||||||||||||||||||||||||||||
| Tax effect (a) | ||||||||||||||||||||||||||||||||||
| Tax effect (a) | ||||||||||||||||||||||||||||||||||
| Non-GAAP net income attributable to Nelnet, Inc., excluding derivative market value adjustments (b) | ||||||||||||||||||||||||||||||||||
| Non-GAAP net income attributable to Nelnet, Inc., excluding derivative market value adjustments (b) | ||||||||||||||||||||||||||||||||||
| Non-GAAP net income attributable to Nelnet, Inc., excluding derivative market value adjustments (b) | Non-GAAP net income attributable to Nelnet, Inc., excluding derivative market value adjustments (b) | $ | 54,919 | 75,889 | ||||||||||||||||||||||||||||||
| Earnings per share: | Earnings per share: | |||||||||||||||||||||||||||||||||
| Earnings per share: | ||||||||||||||||||||||||||||||||||
| Earnings per share: | ||||||||||||||||||||||||||||||||||
| GAAP net income attributable to Nelnet, Inc. | ||||||||||||||||||||||||||||||||||
| GAAP net income attributable to Nelnet, Inc. | ||||||||||||||||||||||||||||||||||
| GAAP net income attributable to Nelnet, Inc. | GAAP net income attributable to Nelnet, Inc. | $ | 0.71 | 4.91 | ||||||||||||||||||||||||||||||
| Realized and unrealized derivative market value adjustments | Realized and unrealized derivative market value adjustments | 1.00 | (3.83) | |||||||||||||||||||||||||||||||
| Realized and unrealized derivative market value adjustments | ||||||||||||||||||||||||||||||||||
| Realized and unrealized derivative market value adjustments | ||||||||||||||||||||||||||||||||||
| Tax effect (a) | ||||||||||||||||||||||||||||||||||
| Tax effect (a) | ||||||||||||||||||||||||||||||||||
| Tax effect (a) | Tax effect (a) | (0.24) | 0.91 | |||||||||||||||||||||||||||||||
| Non-GAAP net income attributable to Nelnet, Inc., excluding derivative market value adjustments (b) | Non-GAAP net income attributable to Nelnet, Inc., excluding derivative market value adjustments (b) | $ | 1.47 | 1.99 | ||||||||||||||||||||||||||||||
| Non-GAAP net income attributable to Nelnet, Inc., excluding derivative market value adjustments (b) | ||||||||||||||||||||||||||||||||||
| Non-GAAP net income attributable to Nelnet, Inc., excluding derivative market value adjustments (b) | ||||||||||||||||||||||||||||||||||
| Three months ended March 31, | Certain Items Impacting Comparability (All dollar amounts below are pre-tax) | ||||||||||||||||
| 2023 | 2022 | ||||||||||||||||
| NDS | $ | 25,219 | 12,094 | •An increase in before tax operating margin in 2023 compared with 2022 due to a decrease in operating expenses, primarily salaries and benefits. In 2022, the Company was fully staffed in preparation for the resumption of federal student loan payments once the CARES Act suspension was to expire. The expiration of the CARES Act was extended multiple times throughout 2022. The Company reduced staff in January 2023 to manage excess staff due to the delays in the government's student debt relief and return to repayment programs. | |||||||||||||
| NBS | 37,637 | 33,113 | •The recognition of $6.0 million of interest income in 2023 compared with $0.3 million in 2022 due to higher interest rates. •A decrease in before tax operating margin, excluding net interest income, in 2023 compared with 2022 due to additional investments in the development of new services and technologies and superior customer experiences to align with the Company's strategies to grow, retain, and diversify revenue. | ||||||||||||||
| AGM | (221) | 213,429 | •A net loss of $37.4 million related to changes in the fair values of derivative instruments that do not qualify for hedge accounting in 2023 compared with a net gain of $145.7 million in 2022. •The recognition of $31.9 million in provision for loan losses in 2023 compared with a negative provision of $0.9 million in 2022. •A decrease of $12.6 million in net interest income due to the decrease in the average balance of loans in 2023 compared with 2022. •An increase of $4.2 million in net interest income due to an increase in core loan spread in 2023 compared with 2022. •The recognition of $11.8 million in gains from the sale of loans in 2023 compared with $3.0 million in 2022. | ||||||||||||||
| Nelnet Bank | (93) | 961 | |||||||||||||||
| Corporate | (31,275) | (19,013) | •The recognition of a net loss of $20.2 million in 2023 related to the Company’s investment in ALLO, compared with a net loss of $13.1 million in 2022. •The recognition of net investment losses of $3.3 million in 2023 compared with net investment income and gains of $8.5 million in 2022. | ||||||||||||||
| Income before income taxes | 31,267 | 240,583 | |||||||||||||||
| Income tax expense | (8,250) | (55,697) | |||||||||||||||
| Net loss attributable to noncontrolling interests | 3,470 | 1,761 | |||||||||||||||
| Net income | $ | 26,487 | 186,647 | ||||||||||||||
| Three months ended March 31, | Certain Items Impacting Comparability (All dollar amounts below are pre-tax) | ||||||||||||||||||||||||||||
| 2024 | 2023 | ||||||||||||||||||||||||||||
| NDS | $ | 15,990 | 25,219 | •A decrease in before tax operating margin due primarily to a decrease in loan servicing and systems revenue, partially offset by a decrease in salaries and benefits resulting from restructure charges incurred during the first quarter of 2023 and staff reductions in 2023. | |||||||||||||||||||||||||
| NBS | 47,635 | 37,637 | •An increase in before tax operating margin, excluding net interest income, due to increased revenue while maintaining a consistent cost structure. •The recognition of $7.9 million of interest income in 2024 compared with $6.0 million in 2023 due to higher interest rates. | ||||||||||||||||||||||||||
| Nelnet Financial Services division: | |||||||||||||||||||||||||||||
| AGM | 33,743 | (221) | •A net gain of $5.7 million related to changes in the fair values of derivative instruments that do not qualify for hedge accounting in 2024 compared with a net loss of $37.4 million in 2023. •A decrease of $21.1 million in net interest income due to a decrease in core loan spread in 2024 compared with 2023. •A decrease of $5.1 million in net interest income due to the decrease in the average balance of loans in 2024 compared with 2023. •The recognition of $6.6 million in provision for loan losses in 2024 compared with $31.9 million in 2023. •The recognition of a net gain of $11.8 million in 2023 from the sale of loans. •The recognition of $21.8 million of investment interest in 2024 compared with $13.8 million in 2023 due to an increase in interest earned on the Company's partial ownership in loan securitizations that are accounted for as held-to-maturity beneficial interest investments. | ||||||||||||||||||||||||||
| Nelnet Bank | 1,147 | (93) | |||||||||||||||||||||||||||
| NFS other operating segments | 13,762 | 5,177 | •The recognition of $12.2 million of net interest income in 2024 compared with $6.4 million in 2023 due to higher average yield on interest-earning debt securities (bonds) and a decrease in outstanding debt used to finance such investments. •The recognition of $4.0 million of realized losses on sales of investment securities in 2023. | ||||||||||||||||||||||||||
| Corporate: | |||||||||||||||||||||||||||||
| Unallocated corporate costs | (10,045) | (12,989) | |||||||||||||||||||||||||||
| ALLO investment | (8,593) | (17,882) | •The recognition of a net loss from the ALLO voting membership interest investment of $10.7 million in 2024 compared with $20.2 million in 2023. Absent additional equity contributions, the Company will not recognize additional losses for its voting membership interests in ALLO. •The recognition of income of $2.4 million and $2.2 million in 2024 and 2023, respectively, on the $155.0 million (as of March 31, 2024) outstanding preferred membership interests of ALLO. The preferred membership interests of ALLO held by the Company historically earned a preferred annual return of 6.25% that increased to 10.00% on April 1, 2024. | ||||||||||||||||||||||||||
| Nelnet Renewable Energy | (1,533) | (6,701) | •The recognition of a loss in the solar construction business of $4.0 million in 2024 compared with $3.1 million in 2023. •The recognition of a net gain from tax solar investments of $3.0 million in 2024 compared with a net loss of $1.9 million in 2023. | ||||||||||||||||||||||||||
| Other corporate activities | 2,019 | 1,120 | |||||||||||||||||||||||||||
| Net income before taxes | 94,127 | 31,267 | |||||||||||||||||||||||||||
| Income tax expense | (23,119) | (8,250) | |||||||||||||||||||||||||||
| Net loss attributable to noncontrolling interests | 2,202 | 3,470 | •The majority of noncontrolling interests represents losses attributed to noncontrolling membership interests in the Company’s Nelnet Renewable Energy operating segment, which were $2.3 million and $3.5 million in 2024 and 2023, respectively. | ||||||||||||||||||||||||||
| Net income | $ | 73,210 | 26,487 | ||||||||||||||||||||||||||
| Three months ended | |||||||||||||||||||||||||||||||||||||||||||||||||||||||||||||||||||||||||||||||||||||||
| March 31, | |||||||||||||||||||||||||||||||||||||||||||||||||||||||||||||||||||||||||||||||||||||||
| 2023 | 2022 | Additional information | 2024 | 2023 | Additional information | ||||||||||||||||||||||||||||||||||||||||||||||||||||||||||||||||||||||||||||||||||
| Loan interest | Loan interest | $ | 225,243 | 111,377 | Increase was due to an increase in the gross yield earned on loans, partially offset by a decrease in the average balance of loans and in gross fixed rate floor income. | Loan interest | $ | 216,724 | 225,243 | 225,243 | Decrease was due to decreases in the average balance of loans and gross fixed rate floor income partially offset by an increase in the gross yield earned on loans. | Decrease was due to decreases in the average balance of loans and gross fixed rate floor income partially offset by an increase in the gross yield earned on loans. | |||||||||||||||||||||||||||||||||||||||||||||||||||||||||||||||||||||||||||
| Investment interest | Investment interest | 40,725 | 13,819 | Includes income from interest-earning deposits and investments and restricted cash in asset-backed securitizations. Increase was due to an increase in interest earning investments and an increase in interest rates. | Investment interest | 52,078 | 40,725 | 40,725 | Includes income from unrestricted interest-earning deposits and investments, and restricted cash in asset-backed securitizations. Increase was due to an increase in interest rates and an increase in interest earned on the Company's partial ownership in loan securitizations that are accounted for as held-to-maturity beneficial interest investments. | Includes income from unrestricted interest-earning deposits and investments, and restricted cash in asset-backed securitizations. Increase was due to an increase in interest rates and an increase in interest earned on the Company's partial ownership in loan securitizations that are accounted for as held-to-maturity beneficial interest investments. | |||||||||||||||||||||||||||||||||||||||||||||||||||||||||||||||||||||||||||||
| Total interest income | Total interest income | 265,968 | 125,196 | ||||||||||||||||||||||||||||||||||||||||||||||||||||||||||||||||||||||||||||||||||||
| Interest expense | Interest expense | 199,449 | 48,079 | Increase was due to an increase in cost of funds, partially offset by a decrease in the average balance of debt outstanding. | |||||||||||||||||||||||||||||||||||||||||||||||||||||||||||||||||||||||||||||||||||
| Interest expense | |||||||||||||||||||||||||||||||||||||||||||||||||||||||||||||||||||||||||||||||||||||||
| Interest expense | 194,580 | 199,449 | Decrease was due to a decrease in the average balance of debt outstanding partially offset by an increase in cost of funds. | ||||||||||||||||||||||||||||||||||||||||||||||||||||||||||||||||||||||||||||||||||||
| Net interest income | Net interest income | 66,519 | 77,117 | ||||||||||||||||||||||||||||||||||||||||||||||||||||||||||||||||||||||||||||||||||||
| Less provision (negative provision) for loan losses | 34,275 | (435) | Represents the current period provision (negative provision) to reflect the lifetime expected credit losses related to the Company's loan portfolio. See note 2 of the notes to consolidated financial statements included under Part I, Item 1 of this report for the activity in the Company's allowance for loan losses. | ||||||||||||||||||||||||||||||||||||||||||||||||||||||||||||||||||||||||||||||||||||
| Less provision for loan losses | |||||||||||||||||||||||||||||||||||||||||||||||||||||||||||||||||||||||||||||||||||||||
| Less provision for loan losses | |||||||||||||||||||||||||||||||||||||||||||||||||||||||||||||||||||||||||||||||||||||||
| Less provision for loan losses | 10,928 | 34,275 | Represents the current period provision to reflect the lifetime expected credit losses related to the Company's loan portfolio. See note 2 of the notes to consolidated financial statements in this report for the factors impacting provision for loan losses for the periods presented. | ||||||||||||||||||||||||||||||||||||||||||||||||||||||||||||||||||||||||||||||||||||
| Net interest income after provision for loan losses | Net interest income after provision for loan losses | 32,244 | 77,552 | ||||||||||||||||||||||||||||||||||||||||||||||||||||||||||||||||||||||||||||||||||||
| Other income (expense): | Other income (expense): | ||||||||||||||||||||||||||||||||||||||||||||||||||||||||||||||||||||||||||||||||||||||
| Other income (expense): | |||||||||||||||||||||||||||||||||||||||||||||||||||||||||||||||||||||||||||||||||||||||
| Other income (expense): | |||||||||||||||||||||||||||||||||||||||||||||||||||||||||||||||||||||||||||||||||||||||
| LSS revenue | LSS revenue | 139,227 | 136,368 | See LSS operating segment - results of operations. | |||||||||||||||||||||||||||||||||||||||||||||||||||||||||||||||||||||||||||||||||||
| ETS&PP revenue | 133,603 | 112,286 | See ETS&PP operating segment - results of operations. | ||||||||||||||||||||||||||||||||||||||||||||||||||||||||||||||||||||||||||||||||||||
| LSS revenue | |||||||||||||||||||||||||||||||||||||||||||||||||||||||||||||||||||||||||||||||||||||||
| LSS revenue | 127,201 | 139,227 | See LSS operating segment - results of operations. | ||||||||||||||||||||||||||||||||||||||||||||||||||||||||||||||||||||||||||||||||||||
| ETSP revenue | ETSP revenue | 143,539 | 133,603 | See ETSP operating segment - results of operations. | |||||||||||||||||||||||||||||||||||||||||||||||||||||||||||||||||||||||||||||||||||
| Solar construction revenue | Solar construction revenue | 8,651 | — | On July 1, 2022, the Company acquired 80% of the ownership interests of GRNE Solar. GRNE Solar designs and installs residential, commercial, and utility-scale solar systems. The acquisition diversifies the Company's position in the renewable energy space to include solar construction. | Solar construction revenue | 13,726 | 8,651 | 8,651 | Represents revenue earned from GRNE Solar providing solar construction services, including design and installations of residential and commercial solar systems. On April 12, 2024, the Company announced a change in its solar EPC operations to focus exclusively on the commercial solar market and will discontinue its residential solar operations. As a result, residential revenue will decline in future periods as existing customer contracts are completed. Residential solar construction revenue was $2.1 million and $2.8 million for the three months ended March 31, 2024 and 2023, respectively, and $11.8 million for the year ended December 31, 2023. | Represents revenue earned from GRNE Solar providing solar construction services, including design and installations of residential and commercial solar systems. On April 12, 2024, the Company announced a change in its solar EPC operations to focus exclusively on the commercial solar market and will discontinue its residential solar operations. As a result, residential revenue will decline in future periods as existing customer contracts are completed. Residential solar construction revenue was $2.1 million and $2.8 million for the three months ended March 31, 2024 and 2023, respectively, and $11.8 million for the year ended December 31, 2023. | |||||||||||||||||||||||||||||||||||||||||||||||||||||||||||||||||||||||||||||
| Other, net | Other, net | (14,071) | 9,877 | See table below for the components of "other, net." | Other, net | 17,015 | (14,071) | (14,071) | See table below for the components of "other, net." | See table below for the components of "other, net." | |||||||||||||||||||||||||||||||||||||||||||||||||||||||||||||||||||||||||||||
| Gain on sale of loans, net | 11,812 | 2,989 | The Company sold $261.9 million (par value) of consumer and other loans during 2023 and recognized a net gain of $11.8 million. The Company sold $18.1 million (par value) of consumer loans in 2022 and recognized a gain of $3.0 million. | ||||||||||||||||||||||||||||||||||||||||||||||||||||||||||||||||||||||||||||||||||||
| (Loss) gain on sale of loans, net | (Loss) gain on sale of loans, net | (41) | 11,812 | The Company recognized a loss and net gains from selling loans in 2024 and 2023, respectively. For additional information, see note 2 of the notes to consolidated financial statements included under Part I, Item 1 of this report. | |||||||||||||||||||||||||||||||||||||||||||||||||||||||||||||||||||||||||||||||||||
| Derivative settlements, net | Derivative settlements, net | 23,337 | (2,809) | The Company maintains an overall risk management strategy that incorporates the use of derivative instruments to reduce the economic effect of interest rate volatility. Derivative settlements for each applicable period should be evaluated with the Company's net interest income. The majority of derivative settlements received in 2023 was from the Company's derivatives used to hedge loans earning fixed rate floor income. This entire derivative portfolio was terminated on March 15, 2023 to minimize the Company's exposure to market volatility. As such, there will be no derivative settlements received on this portfolio of derivatives in future periods. See AGM operating segment - results of operations. | |||||||||||||||||||||||||||||||||||||||||||||||||||||||||||||||||||||||||||||||||||
| Derivative settlements, net | |||||||||||||||||||||||||||||||||||||||||||||||||||||||||||||||||||||||||||||||||||||||
| Derivative settlements, net | 1,757 | 23,337 | The Company maintains an overall risk management strategy that incorporates the use of derivative instruments to reduce the economic effect of interest rate volatility. Derivative settlements for each applicable period should be evaluated with the Company's net interest income. The majority of derivative settlements received in the periods presented was from the Company's derivatives used to hedge loans earning fixed rate floor income. To minimize the Company's exposure to market volatility and increase liquidity, the Company terminated this derivative portfolio on March 15, 2023. Subsequent to terminating these derivatives, during the second and fourth quarters of 2023, the Company entered into a total of $400 million notional amount of derivatives to hedge loans earning fixed rate floor income and other loans and investments in which the Company receives a fixed rate. See AGM operating segment - results of operations for additional information. | ||||||||||||||||||||||||||||||||||||||||||||||||||||||||||||||||||||||||||||||||||||
| Derivative market value adjustments, net | Derivative market value adjustments, net | (37,411) | 145,734 | Includes the realized and unrealized gains and losses that are caused by changes in fair values of derivatives which do not qualify for "hedge treatment" under GAAP. The majority of the derivative market value adjustments were related to the changes in fair value of the Company's floor income interest rate swaps. Such changes reflect that a decrease in the forward yield curve during a reporting period results in a decrease in the fair value of the Company's floor income interest rate swaps, and an increase in the forward yield curve during a reporting period results in an increase in the fair value of such swaps. The entire portfolio of floor income interest rate swaps was terminated on March 15, 2023 to minimize the Company's exposure to market volatility. As such, the Company expects the derivative market value adjustments in future periods will be less substantial. | Derivative market value adjustments, net | 7,964 | (37,411) | (37,411) | Includes the realized and unrealized gains and losses that are caused by changes in fair values of derivatives which do not qualify for "hedge treatment" under GAAP. The majority of the derivative market value adjustments during the periods presented related to the changes in fair value of the Company's floor income interest rate swaps. Such changes reflect that a decrease in the forward yield curve during a reporting period results in a decrease in the fair value of the Company's floor income interest rate swaps, and an increase in the forward yield curve during a reporting period results in an increase in the fair value of such swaps. To minimize the Company's exposure to market volatility and increase liquidity, the Company terminated this derivative portfolio on March 15, 2023. As such, the Company expects the derivative market value adjustments in future periods will be less substantial. | Includes the realized and unrealized gains and losses that are caused by changes in fair values of derivatives which do not qualify for "hedge treatment" under GAAP. The majority of the derivative market value adjustments during the periods presented related to the changes in fair value of the Company's floor income interest rate swaps. Such changes reflect that a decrease in the forward yield curve during a reporting period results in a decrease in the fair value of the Company's floor income interest rate swaps, and an increase in the forward yield curve during a reporting period results in an increase in the fair value of such swaps. To minimize the Company's exposure to market volatility and increase liquidity, the Company terminated this derivative portfolio on March 15, 2023. As such, the Company expects the derivative market value adjustments in future periods will be less substantial. | |||||||||||||||||||||||||||||||||||||||||||||||||||||||||||||||||||||||||||||
| Total other income (expense) | 265,148 | 404,445 | |||||||||||||||||||||||||||||||||||||||||||||||||||||||||||||||||||||||||||||||||||||
| Total other income (expense), net | |||||||||||||||||||||||||||||||||||||||||||||||||||||||||||||||||||||||||||||||||||||||
| Total other income (expense), net | |||||||||||||||||||||||||||||||||||||||||||||||||||||||||||||||||||||||||||||||||||||||
| Total other income (expense), net | |||||||||||||||||||||||||||||||||||||||||||||||||||||||||||||||||||||||||||||||||||||||
| Cost of services: | Cost of services: | ||||||||||||||||||||||||||||||||||||||||||||||||||||||||||||||||||||||||||||||||||||||
| Cost to provide education technology, services, and payment processing services | 47,704 | 35,545 | Represents direct costs to provide payment processing and instructional services in ETS&PP. Increase was primarily due to additional instructional services costs. See ETS&PP operating segment - results of operations. | ||||||||||||||||||||||||||||||||||||||||||||||||||||||||||||||||||||||||||||||||||||
| Cost of services: | |||||||||||||||||||||||||||||||||||||||||||||||||||||||||||||||||||||||||||||||||||||||
| Cost of services: | |||||||||||||||||||||||||||||||||||||||||||||||||||||||||||||||||||||||||||||||||||||||
| Cost to provide education technology services and payments | |||||||||||||||||||||||||||||||||||||||||||||||||||||||||||||||||||||||||||||||||||||||
| Cost to provide education technology services and payments | |||||||||||||||||||||||||||||||||||||||||||||||||||||||||||||||||||||||||||||||||||||||
| Cost to provide education technology services and payments | 48,610 | 47,704 | Represents direct costs to provide payment processing and instructional services in ETSP. See ETSP operating segment - results of operations. | ||||||||||||||||||||||||||||||||||||||||||||||||||||||||||||||||||||||||||||||||||||
| Cost to provide solar construction services | Cost to provide solar construction services | 8,299 | — | As noted above, the Company acquired GRNE Solar on July 1, 2022. These amounts represent direct costs related to GRNE providing solar construction services. | Cost to provide solar construction services | 14,229 | 8,299 | 8,299 | Represents direct costs to provide solar construction services. Since the acquisition of GRNE in July 2022, it has incurred low and, in some cases, negative margins on certain projects. | Represents direct costs to provide solar construction services. Since the acquisition of GRNE in July 2022, it has incurred low and, in some cases, negative margins on certain projects. | |||||||||||||||||||||||||||||||||||||||||||||||||||||||||||||||||||||||||||||
| Total cost of services | Total cost of services | 56,003 | 35,545 | ||||||||||||||||||||||||||||||||||||||||||||||||||||||||||||||||||||||||||||||||||||
| Operating expenses: | Operating expenses: | ||||||||||||||||||||||||||||||||||||||||||||||||||||||||||||||||||||||||||||||||||||||
| Operating expenses: | |||||||||||||||||||||||||||||||||||||||||||||||||||||||||||||||||||||||||||||||||||||||
| Operating expenses: | |||||||||||||||||||||||||||||||||||||||||||||||||||||||||||||||||||||||||||||||||||||||
| Salaries and benefits | |||||||||||||||||||||||||||||||||||||||||||||||||||||||||||||||||||||||||||||||||||||||
| Salaries and benefits | |||||||||||||||||||||||||||||||||||||||||||||||||||||||||||||||||||||||||||||||||||||||
| Salaries and benefits | Salaries and benefits | 152,710 | 149,414 | Increase was due to an increase in headcount in ETS&PP to support the growth of its customer base and the investment in the development of new technologies. This increase was partially offset by staff reductions in LSS to manage excess staff due to delays in the government's student debt relief and return to repayment programs. | 143,875 | 152,710 | 152,710 | Decrease was primarily due to restructuring charges recognized in the first quarter of 2023 and staff reductions in LSS to manage expenses due to delays in the government's student debt relief and return to repayment programs and lower pricing and reduced servicing volume for LSS's Department servicing contract. This was partially offset by an increase in ETSP due to annual merit pay increases and an increase in headcount to support the growth of the customer base and the investment in the development of new technologies. | Decrease was primarily due to restructuring charges recognized in the first quarter of 2023 and staff reductions in LSS to manage expenses due to delays in the government's student debt relief and return to repayment programs and lower pricing and reduced servicing volume for LSS's Department servicing contract. This was partially offset by an increase in ETSP due to annual merit pay increases and an increase in headcount to support the growth of the customer base and the investment in the development of new technologies. | ||||||||||||||||||||||||||||||||||||||||||||||||||||||||||||||||||||||||||||||
| Depreciation and amortization | Depreciation and amortization | 16,627 | 16,956 | Includes depreciation of property and equipment and the amortization of intangibles from prior business acquisitions. | Depreciation and amortization | 16,769 | 16,627 | 16,627 | Includes depreciation of property and equipment and the amortization of intangibles from prior business acquisitions. | Includes depreciation of property and equipment and the amortization of intangibles from prior business acquisitions. | |||||||||||||||||||||||||||||||||||||||||||||||||||||||||||||||||||||||||||||
| Other expenses | Other expenses | 40,785 | 39,499 | Includes expenses necessary for operations, such as postage and distribution, consulting and professional fees, occupancy, communications, and certain information technology-related costs. Increase was due to an increase in expenses in ETS&PP due to higher costs for consulting, professional fees, and technology services resulting from investments in new technologies, and an increase in costs for travel and in-person hosted conferences that had previously subsided due to the COVID-19 pandemic. The increase was partially offset by a decrease in expenses in LSS due to a decrease in professional fees and facility costs. Over the last year, the Company has reduced its office space as a large number of employees continue to work from home. | Other expenses | 56,845 | 40,785 | 40,785 | Represents expenses necessary for operations, such as postage and distribution, consulting and professional fees, occupancy, communications, reinsurance loss reserve and acquisitions costs, and certain information technology-related costs. Increase was driven by an increase in NFS due to reinsurance loss reserve and acquisition costs as a result of growth in reinsurance policies and in LSS due to additional postage and communication costs as a result of borrowers returning to repayment on September 1, 2023. | Represents expenses necessary for operations, such as postage and distribution, consulting and professional fees, occupancy, communications, reinsurance loss reserve and acquisitions costs, and certain information technology-related costs. Increase was driven by an increase in NFS due to reinsurance loss reserve and acquisition costs as a result of growth in reinsurance policies and in LSS due to additional postage and communication costs as a result of borrowers returning to repayment on September 1, 2023. | |||||||||||||||||||||||||||||||||||||||||||||||||||||||||||||||||||||||||||||
| Total operating expenses | Total operating expenses | 210,122 | 205,869 | ||||||||||||||||||||||||||||||||||||||||||||||||||||||||||||||||||||||||||||||||||||
| Income before income taxes | Income before income taxes | 31,267 | 240,583 | ||||||||||||||||||||||||||||||||||||||||||||||||||||||||||||||||||||||||||||||||||||
| Income before income taxes | |||||||||||||||||||||||||||||||||||||||||||||||||||||||||||||||||||||||||||||||||||||||
| Income before income taxes | |||||||||||||||||||||||||||||||||||||||||||||||||||||||||||||||||||||||||||||||||||||||
| Income tax expense | |||||||||||||||||||||||||||||||||||||||||||||||||||||||||||||||||||||||||||||||||||||||
| Income tax expense | |||||||||||||||||||||||||||||||||||||||||||||||||||||||||||||||||||||||||||||||||||||||
| Income tax expense | Income tax expense | 8,250 | 55,697 | The effective tax rate was 23.7% and 23.0% for the three months ended March 31, 2023 and 2022, respectively. | 23,119 | 8,250 | 8,250 | The effective tax rate was 24.0% and 23.7% for the three months ended March 31, 2024 and 2023, respectively. The Company expects its tax rate will range between 22% and 24% for the remainder of 2024. | The effective tax rate was 24.0% and 23.7% for the three months ended March 31, 2024 and 2023, respectively. The Company expects its tax rate will range between 22% and 24% for the remainder of 2024. | ||||||||||||||||||||||||||||||||||||||||||||||||||||||||||||||||||||||||||||||
| Net income | Net income | 23,017 | 184,886 | ||||||||||||||||||||||||||||||||||||||||||||||||||||||||||||||||||||||||||||||||||||
| Net loss attributable to noncontrolling interests | Net loss attributable to noncontrolling interests | 3,470 | 1,761 | Amounts for noncontrolling interests reflect the net income/loss attributable to the holders of noncontrolling membership interests in WRCM, NextGen, multiple solar entities including, GRNE Solar, and multiple entities investing in federal opportunity zone programs. | |||||||||||||||||||||||||||||||||||||||||||||||||||||||||||||||||||||||||||||||||||
| Net loss attributable to noncontrolling interests | |||||||||||||||||||||||||||||||||||||||||||||||||||||||||||||||||||||||||||||||||||||||
| Net loss attributable to noncontrolling interests | 2,202 | 3,470 | Represents the net income/loss attributable to the holders of noncontrolling membership interests. The majority is attributed to noncontrolling membership interests in the Company's Nelnet Renewable Energy operating segment. | ||||||||||||||||||||||||||||||||||||||||||||||||||||||||||||||||||||||||||||||||||||
| Net income attributable to Nelnet, Inc. | Net income attributable to Nelnet, Inc. | $ | 26,487 | 186,647 | |||||||||||||||||||||||||||||||||||||||||||||||||||||||||||||||||||||||||||||||||||
| Additional information: | |||||||||||||||||||||||||||||||||||||||||||||||||||||||||||||||||||||||||||||||||||||||
| Additional information: | |||||||||||||||||||||||||||||||||||||||||||||||||||||||||||||||||||||||||||||||||||||||
| Additional information: | Additional information: | See "Overview - GAAP Net Income and Non-GAAP Net Income, Excluding Adjustments" above for additional information about non-GAAP net income, excluding derivative market value adjustments. | See "Overview - GAAP Net Income and Non-GAAP Net Income, Excluding Adjustments" above for additional information about non-GAAP net income, excluding derivative market value adjustments. | ||||||||||||||||||||||||||||||||||||||||||||||||||||||||||||||||||||||||||||||||||||
| Net income attributable to Nelnet, Inc. | Net income attributable to Nelnet, Inc. | $ | 26,487 | 186,647 | |||||||||||||||||||||||||||||||||||||||||||||||||||||||||||||||||||||||||||||||||||
| Derivative market value adjustments, net | Derivative market value adjustments, net | 37,411 | (145,734) | ||||||||||||||||||||||||||||||||||||||||||||||||||||||||||||||||||||||||||||||||||||
| Derivative market value adjustments, net | |||||||||||||||||||||||||||||||||||||||||||||||||||||||||||||||||||||||||||||||||||||||
| Derivative market value adjustments, net | |||||||||||||||||||||||||||||||||||||||||||||||||||||||||||||||||||||||||||||||||||||||
| Tax effect | Tax effect | (8,979) | 34,976 | See "Overview - GAAP Net Income and Non-GAAP Net Income, Excluding Adjustments" above for additional information about non-GAAP net income, excluding derivative market value adjustments. | |||||||||||||||||||||||||||||||||||||||||||||||||||||||||||||||||||||||||||||||||||
| Net income attributable to Nelnet, Inc., excluding derivative market value adjustments | $ | 54,919 | 75,889 | ||||||||||||||||||||||||||||||||||||||||||||||||||||||||||||||||||||||||||||||||||||
| Tax effect | |||||||||||||||||||||||||||||||||||||||||||||||||||||||||||||||||||||||||||||||||||||||
| Tax effect | |||||||||||||||||||||||||||||||||||||||||||||||||||||||||||||||||||||||||||||||||||||||
| Non-GAAP net income attributable to Nelnet, Inc., excluding derivative market value adjustments | |||||||||||||||||||||||||||||||||||||||||||||||||||||||||||||||||||||||||||||||||||||||
| Non-GAAP net income attributable to Nelnet, Inc., excluding derivative market value adjustments | |||||||||||||||||||||||||||||||||||||||||||||||||||||||||||||||||||||||||||||||||||||||
| Non-GAAP net income attributable to Nelnet, Inc., excluding derivative market value adjustments | |||||||||||||||||||||||||||||||||||||||||||||||||||||||||||||||||||||||||||||||||||||||
| Three months ended March 31, | |||||||||||||||||||||||||||||||||||||||||||||||||||||||||||||||||||||||||||||||||||||||
| 2023 | 2022 | Additional information | |||||||||||||||||||||||||||||||||||||||||||||||||||||||||||||||||||||||||||||||||||||
| 2024 | 2023 | Additional information | |||||||||||||||||||||||||||||||||||||||||||||||||||||||||||||||||||||||||||||||||||||
| Reinsurance premiums | Reinsurance premiums | $ | 12,780 | 535 | See NFS division - results of operations - NFS other operating segments. | ||||||||||||||||||||||||||||||||||||||||||||||||||||||||||||||||||||||||||||||||||
| Borrower late fee income | Borrower late fee income | 3,133 | 2,247 | See NFS division - results of operations - AGM operating segment. | |||||||||||||||||||||||||||||||||||||||||||||||||||||||||||||||||||||||||||||||||||
| Gain (loss) from solar investments, net | Gain (loss) from solar investments, net | 2,971 | (1,947) | See Corporate - results of operations. | |||||||||||||||||||||||||||||||||||||||||||||||||||||||||||||||||||||||||||||||||||
| ALLO preferred return | ALLO preferred return | $ | 2,249 | 2,117 | See Corporate - results of operations. | ALLO preferred return | 2,409 | 2,249 | 2,249 | See Corporate - results of operations. | See Corporate - results of operations. | ||||||||||||||||||||||||||||||||||||||||||||||||||||||||||||||||||||||||||||
| Borrower late fee income | 2,247 | 2,431 | See AGM operating segment - results of operations. | ||||||||||||||||||||||||||||||||||||||||||||||||||||||||||||||||||||||||||||||||||||
| Administration/sponsor fee income | Administration/sponsor fee income | 1,772 | 2,123 | See AGM operating segment - results of operations. | Administration/sponsor fee income | 1,546 | 1,772 | 1,772 | See NFS division - results of operations - AGM operating segment. | See NFS division - results of operations - AGM operating segment. | |||||||||||||||||||||||||||||||||||||||||||||||||||||||||||||||||||||||||||||
| Investment advisory services | 1,612 | 1,282 | See Corporate - results of operations. | ||||||||||||||||||||||||||||||||||||||||||||||||||||||||||||||||||||||||||||||||||||
| Investment advisory services (WRCM) | Investment advisory services (WRCM) | 1,508 | 1,612 | See NFS division - results of operations - NFS other operating segments. | |||||||||||||||||||||||||||||||||||||||||||||||||||||||||||||||||||||||||||||||||||
| Loss from ALLO voting membership interest investment | Loss from ALLO voting membership interest investment | (20,213) | (13,130) | See Corporate - results of operations. | Loss from ALLO voting membership interest investment | (10,693) | (20,213) | (20,213) | See Corporate - results of operations. | See Corporate - results of operations. | |||||||||||||||||||||||||||||||||||||||||||||||||||||||||||||||||||||||||||||
| Investment activity, net | Investment activity, net | (3,577) | 11,856 | See Corporate - results of operations and note (a) below for additional information. | Investment activity, net | (1,298) | (3,577) | (3,577) | See note (a) below for additional information. | See note (a) below for additional information. | |||||||||||||||||||||||||||||||||||||||||||||||||||||||||||||||||||||||||||||
| Loss from solar investments | (1,947) | (1,030) | See Corporate - results of operations. | ||||||||||||||||||||||||||||||||||||||||||||||||||||||||||||||||||||||||||||||||||||
| Other | Other | 3,786 | 4,228 | ||||||||||||||||||||||||||||||||||||||||||||||||||||||||||||||||||||||||||||||||||||
| Other | |||||||||||||||||||||||||||||||||||||||||||||||||||||||||||||||||||||||||||||||||||||||
| Other | |||||||||||||||||||||||||||||||||||||||||||||||||||||||||||||||||||||||||||||||||||||||
| Other, net | Other, net | $ | (14,071) | 9,877 | |||||||||||||||||||||||||||||||||||||||||||||||||||||||||||||||||||||||||||||||||||
| Other, net | |||||||||||||||||||||||||||||||||||||||||||||||||||||||||||||||||||||||||||||||||||||||
| Other, net | |||||||||||||||||||||||||||||||||||||||||||||||||||||||||||||||||||||||||||||||||||||||
| Real Estate | Venture Capital and Funds | Equity / Bonds | Total | Real Estate | Venture Capital and Funds | Equity / Bonds | Total | ||||||||||||||||||||||||||||||||||||||||
| Three months ended March 31, | |||||||||||||||||||||||||||||||||||||||||||||||
| 2024 | 2023 | ||||||||||||||||||||||||||||||||||||||||||||||
| NFS - AGM | $ | — | 322 | — | 322 | — | (104) | (476) | (580) | ||||||||||||||||||||||||||||||||||||||
| NFS - Nelnet Bank | — | (179) | 529 | 350 | — | (263) | 465 | 202 | |||||||||||||||||||||||||||||||||||||||
| NFS - Other Operating Segments | (1,794) | — | 212 | (1,582) | 1,148 | — | (4,058) | (2,910) | |||||||||||||||||||||||||||||||||||||||
| Corporate | — | (388) | — | (388) | — | (289) | — | (289) | |||||||||||||||||||||||||||||||||||||||
| $ | (1,794) | (245) | 741 | (1,298) | 1,148 | (656) | (4,069) | (3,577) | |||||||||||||||||||||||||||||||||||||||
| As of | ||||||||||||||||||||||||||||||||||||||||||||||||||||||||||||||||||||||||||||||||||||||||||||||||||||||||||||||||||||||||||||||||||||||
| December 31, 2021 | March 31, 2022 | June 30, 2022 | September 30, 2022 | December 31, 2022 | March 31, 2023 | |||||||||||||||||||||||||||||||||||||||||||||||||||||||||||||||||||||||||||||||||||||||||||||||||||||||||||||||||||||||||||||||||
| As of | ||||||||||||||||||||||||||||||||||||||||||||||||||||||||||||||||||||||||||||||||||||||||||||||||||||||||||||||||||||||||||||||||||||||
| As of | ||||||||||||||||||||||||||||||||||||||||||||||||||||||||||||||||||||||||||||||||||||||||||||||||||||||||||||||||||||||||||||||||||||||
| As of | ||||||||||||||||||||||||||||||||||||||||||||||||||||||||||||||||||||||||||||||||||||||||||||||||||||||||||||||||||||||||||||||||||||||
| March 31, 2024 | March 31, 2024 | December 31, 2023 | September 30, 2023 | June 30, 2023 | March 31, 2023 | December 31, 2022 | ||||||||||||||||||||||||||||||||||||||||||||||||||||||||||||||||||||||||||||||||||||||||||||||||||||||||||||||||||||||||||||||||
| Servicing volume (dollars in millions): | Servicing volume (dollars in millions): | |||||||||||||||||||||||||||||||||||||||||||||||||||||||||||||||||||||||||||||||||||||||||||||||||||||||||||||||||||||||||||||||||||||
| Government | ||||||||||||||||||||||||||||||||||||||||||||||||||||||||||||||||||||||||||||||||||||||||||||||||||||||||||||||||||||||||||||||||||||||
| Government | ||||||||||||||||||||||||||||||||||||||||||||||||||||||||||||||||||||||||||||||||||||||||||||||||||||||||||||||||||||||||||||||||||||||
| Government | Government | $ | 478,402 | 507,653 | 542,398 | 545,546 | 545,373 | 537,291 | ||||||||||||||||||||||||||||||||||||||||||||||||||||||||||||||||||||||||||||||||||||||||||||||||||||||||||||||||||||||||||||||
| FFELP | FFELP | 26,916 | 25,646 | 24,224 | 22,412 | 20,226 | 19,815 | |||||||||||||||||||||||||||||||||||||||||||||||||||||||||||||||||||||||||||||||||||||||||||||||||||||||||||||||||||||||||||||||
| Private and consumer | Private and consumer | 23,702 | 23,433 | 22,838 | 22,461 | 21,866 | 21,484 | |||||||||||||||||||||||||||||||||||||||||||||||||||||||||||||||||||||||||||||||||||||||||||||||||||||||||||||||||||||||||||||||
| Total | Total | $ | 529,020 | 556,732 | 589,460 | 590,419 | 587,465 | 578,590 | ||||||||||||||||||||||||||||||||||||||||||||||||||||||||||||||||||||||||||||||||||||||||||||||||||||||||||||||||||||||||||||||
| Number of servicing borrowers: | Number of servicing borrowers: | |||||||||||||||||||||||||||||||||||||||||||||||||||||||||||||||||||||||||||||||||||||||||||||||||||||||||||||||||||||||||||||||||||||
| Number of servicing borrowers: | ||||||||||||||||||||||||||||||||||||||||||||||||||||||||||||||||||||||||||||||||||||||||||||||||||||||||||||||||||||||||||||||||||||||
| Number of servicing borrowers: | ||||||||||||||||||||||||||||||||||||||||||||||||||||||||||||||||||||||||||||||||||||||||||||||||||||||||||||||||||||||||||||||||||||||
| Government | ||||||||||||||||||||||||||||||||||||||||||||||||||||||||||||||||||||||||||||||||||||||||||||||||||||||||||||||||||||||||||||||||||||||
| Government | ||||||||||||||||||||||||||||||||||||||||||||||||||||||||||||||||||||||||||||||||||||||||||||||||||||||||||||||||||||||||||||||||||||||
| Government | Government | 14,196,520 | 14,727,860 | 15,426,607 | 15,657,942 | 15,777,328 | 15,518,751 | |||||||||||||||||||||||||||||||||||||||||||||||||||||||||||||||||||||||||||||||||||||||||||||||||||||||||||||||||||||||||||||||
| FFELP | FFELP | 1,092,066 | 1,034,913 | 977,785 | 910,188 | 829,939 | 819,791 | |||||||||||||||||||||||||||||||||||||||||||||||||||||||||||||||||||||||||||||||||||||||||||||||||||||||||||||||||||||||||||||||
| Private and consumer | Private and consumer | 1,065,439 | 1,030,863 | 998,454 | 979,816 | 951,866 | 925,861 | |||||||||||||||||||||||||||||||||||||||||||||||||||||||||||||||||||||||||||||||||||||||||||||||||||||||||||||||||||||||||||||||
| Total | Total | 16,354,025 | 16,793,636 | 17,402,846 | 17,547,946 | 17,559,133 | 17,264,403 | |||||||||||||||||||||||||||||||||||||||||||||||||||||||||||||||||||||||||||||||||||||||||||||||||||||||||||||||||||||||||||||||
| Number of remote hosted borrowers: | Number of remote hosted borrowers: | 4,799,368 | 5,487,943 | 5,738,381 | 6,025,377 | 6,135,760 | 5,048,324 | |||||||||||||||||||||||||||||||||||||||||||||||||||||||||||||||||||||||||||||||||||||||||||||||||||||||||||||||||||||||||||||||
| Number of remote hosted borrowers: | ||||||||||||||||||||||||||||||||||||||||||||||||||||||||||||||||||||||||||||||||||||||||||||||||||||||||||||||||||||||||||||||||||||||
| Number of remote hosted borrowers: | ||||||||||||||||||||||||||||||||||||||||||||||||||||||||||||||||||||||||||||||||||||||||||||||||||||||||||||||||||||||||||||||||||||||
| Three months ended March 31, | |||||||||||||||||||||||||||||
| 2024 | 2023 | Additional information | |||||||||||||||||||||||||||
| Net interest income | $ | 1,894 | 1,037 | Increase was due to higher interest rates. | |||||||||||||||||||||||||
| Loan servicing and systems revenue | 127,201 | 139,227 | See table below for additional information. | ||||||||||||||||||||||||||
| Intersegment servicing revenue | 6,886 | 7,790 | Represents revenue earned by LSS from servicing loans for AGM and Nelnet Bank. Decrease was due to the continued amortization of AGM's FFELP portfolio. FFELP intersegment servicing revenue will continue to decrease as AGM's FFELP portfolio pays off. | ||||||||||||||||||||||||||
| Other income | 710 | 608 | Represents revenue earned from providing administrative support services. | ||||||||||||||||||||||||||
| Total other income | 134,797 | 147,625 | |||||||||||||||||||||||||||
| Salaries and benefits | 76,722 | 84,560 | Decrease was due to the Company being fully staffed at the beginning of 2023 with contact center operations and support associates as the Company prepared for expiration of the federal student loan payment pause under the CARES Act. In the first half of 2023, the Company reduced staff to manage expenses due to delays in the government's student debt relief and return to repayment programs and lower pricing and reduced servicing volume for LSS's Department servicing contract. As part of these reductions, the Company recognized a restructuring charge of $2.7 million in the first quarter of 2023. | ||||||||||||||||||||||||||
| Depreciation and amortization | 5,109 | 4,513 | |||||||||||||||||||||||||||
| Other expenses | 19,538 | 13,313 | Increase was due to additional postage and communication costs due to borrowers returning to repayment on September 1, 2023. | ||||||||||||||||||||||||||
| Intersegment expenses | 19,332 | 21,057 | Represents costs for certain corporate activities and services that are allocated to each operating segment based on estimated use of such activities and services. | ||||||||||||||||||||||||||
| Total operating expenses | 120,701 | 123,443 | |||||||||||||||||||||||||||
| Income before income taxes | 15,990 | 25,219 | |||||||||||||||||||||||||||
| Income tax expense | (3,838) | (6,053) | Represents income tax expense at an effective tax rate of 24%. | ||||||||||||||||||||||||||
| Net income | $ | 12,152 | 19,166 | ||||||||||||||||||||||||||
| Before tax operating margin | 11.9 | % | 17.1 | % | Before tax operating margin represents before tax operating profitability as a percentage of revenue, and for LSS is calculated as income before income taxes divided by the total of loan servicing and systems revenue, intersegment servicing revenue, and other income. The Company uses this metric to monitor and assess the segment’s performance, manage operating costs, identify and evaluate business trends affecting the segment, and make strategic decisions, and believes that it provides additional information to facilitate an understanding of the operating performance of the segment and provides a meaningful comparison of the results of operations between periods. Before tax operating margin decreased due primarily to a decrease in loan servicing and systems revenue as described in the table below, partially offset by a decrease in salaries and benefits resulting from restructure charges incurred during the first quarter of 2023 and staff reductions in 2023. | ||||||||||||||||||||||||
| Three months ended March 31, | |||||||||||||||||||||||||||||
| 2023 | 2022 | Additional information | |||||||||||||||||||||||||||
| Net interest income | $ | 1,037 | 43 | Increase in 2023 compared with 2022 was due to higher interest rates. | |||||||||||||||||||||||||
| Loan servicing and systems revenue | 139,227 | 136,368 | See table below for additional information. | ||||||||||||||||||||||||||
| Intersegment servicing revenue | 7,790 | 8,480 | Represents revenue earned by LSS from servicing loans for AGM and Nelnet Bank. Decrease in 2023 compared with 2022 was due to the continued amortization of AGM's FFELP portfolio. FFELP intersegment servicing revenue will continue to decrease as AGM's FFELP portfolio pays off. | ||||||||||||||||||||||||||
| Other income | 608 | 740 | Represents revenue earned from providing administrative support and marketing services. | ||||||||||||||||||||||||||
| Total other income | 147,625 | 145,588 | |||||||||||||||||||||||||||
| Salaries and benefits | 84,560 | 91,972 | Decrease in 2023 compared with 2022 was due to the Company being fully staffed with contact center operations and support associates in 2022 in preparation for the resumption of federal student loan payments and other activities after the CARES Act suspension. See “Government Loan Servicing - The CARES Act” above for additional details. In addition, the Company reduced staff in January and March 2023. See "Reduction in Staff" above for additional details. | ||||||||||||||||||||||||||
| Depreciation and amortization | 4,513 | 4,954 | |||||||||||||||||||||||||||
| Other expenses | 13,313 | 16,213 | Decrease in 2023 compared with 2022 was due to a decrease in professional fees and facility costs. Over the last year, the Company has reduced its office space as a large number of employees continue to work from home. | ||||||||||||||||||||||||||
| Intersegment expenses | 21,057 | 20,398 | Represent costs for certain corporate activities and services that are allocated to each operating segment based on estimated use of such activities and services. | ||||||||||||||||||||||||||
| Total operating expenses | 123,443 | 133,537 | |||||||||||||||||||||||||||
| Income before income taxes | 25,219 | 12,094 | |||||||||||||||||||||||||||
| Income tax expense | (6,053) | (2,903) | Represents income tax expense at an effective tax rate of 24%. | ||||||||||||||||||||||||||
| Net income | $ | 19,166 | 9,191 | ||||||||||||||||||||||||||
| Before tax operating margin | 17.1 | % | 8.3 | % | Before tax operating margin represents before tax operating profitability as a percentage of revenue, and for LSS is calculated as income before income taxes divided by the total of loan servicing and systems revenue, intersegment servicing revenue, and other income revenue. The Company uses this metric to monitor and assess the segment’s performance, manage operating costs, identify and evaluate business trends affecting the segment, and make strategic decisions, and believes that it provides additional information to facilitate an understanding of the operating performance of the segment and provides a meaningful comparison of the results of operations between periods. Before tax operating margin increased in 2023 compared with 2022 due to a decrease in operating expenses as described above. | ||||||||||||||||||||||||
| Three months ended March 31, | |||||||||||||||||||||||||||||
| 2023 | 2022 | Additional information | |||||||||||||||||||||||||||
| Government loan servicing | $ | 108,880 | 109,125 | Represents revenue from the Company's Department servicing contracts. Decrease in 2023 compared with 2022 was due to (i) the recognition of $6.7 million of revenue in the first quarter of 2022 for incremental work related primarily to CARES Act forbearance exit outreach activities to borrowers; and (ii) the recognition of $10.5 million of revenue in the first quarter of 2022 related to the discharge of borrowers under the Total and Permanent Disability (TPD) discharge program (the Company earns revenue per each borrower that satisfies the requirements for their loan to be discharged under the TPD discharge program). These decreases were partially offset by (i) an increase in the number of PHEAA borrowers serviced on the Company's servicing platform; (ii) a per borrower CARES Act forbearance rate increase on May 1, 2022; and (iii) a per borrower rate increase on September 1, 2022 (5.0%) to reflect the increase in the cost of labor (Employment Cost Index) per the provisions of the contracts. Effective April 1, 2023, the monthly fee earned per borrower on certain borrower statuses will be reduced by $0.19. See “Government Loan Servicing - Contract Modifications and Award" above for additional details. | |||||||||||||||||||||||||
| Private education and consumer loan servicing | 12,164 | 12,873 | Decrease in 2023 compared with 2022 was due to a decrease in servicing volume and client requested enhanced delinquency services. | ||||||||||||||||||||||||||
| FFELP loan servicing | 3,368 | 4,248 | Decrease in 2023 compared with 2022 was due to a decrease in the number of borrowers serviced. Over time, FFELP servicing revenue will continue to decrease as third-party customers' FFELP portfolios pay off. Since late 2021, the Company has experienced accelerated run-off of its FFELP servicing portfolio due to FFELP borrowers consolidating their loans into Federal Direct Loan Program loans as a result of the continued extension of borrower relief under the CARES Act and initiatives offered by the Department for FFELP borrowers to consolidate their loans to qualify for loan forgiveness under the Public Service Loan Forgiveness and other programs. | ||||||||||||||||||||||||||
| Software services | 9,697 | 7,400 | Increase in 2023 compared with 2022 was due to an increase in remote hosted borrowers and an increase in rates. Software services revenue from Department remote hosted servicing customers will be adversely impacted in future periods. See “Government Loan Servicing - Loan Volume Transfers” above for additional details. | ||||||||||||||||||||||||||
| Outsourced services | 5,118 | 2,722 | Represents primarily revenue to provide contact center and back office operational outsourcing services. Increase in 2023 compared with 2022 was due to additional outsourced opportunities, including assisting existing Department servicers as operations transition from exiting servicers. | ||||||||||||||||||||||||||
| Loan servicing and systems revenue | $ | 139,227 | 136,368 | ||||||||||||||||||||||||||
| Three months ended March 31, | |||||||||||||||||||||||||||||
| 2024 | 2023 | Additional information | |||||||||||||||||||||||||||
| Government loan servicing | $ | 105,474 | 108,880 | Represents revenue from the Company's Department legacy servicing contract. Decrease was due to the reduction of the monthly fee earned per borrower on certain borrower statuses by $0.19 effective April 1, 2023 and a decrease of borrowers serviced due to the Department transferring one million of the Company's existing borrowers to another third-party servicer during the second and third quarters of 2023. These decreases were partially offset by an increase in the average revenue earned on a per borrower blended basis as a result of borrowers moving to a repayment status on September 1, 2023. | |||||||||||||||||||||||||
| Private education and consumer loan servicing | 12,620 | 12,164 | Increase was due to rate increases based on contractual consumer price index changes, partially offset by a decrease in the number of borrowers serviced. | ||||||||||||||||||||||||||
| FFELP loan servicing | 3,380 | 3,368 | Represents revenue from servicing third-party customers' FFELP portfolios. Over time, FFELP servicing revenue will decrease as third-party customers' FFELP portfolios pay off. | ||||||||||||||||||||||||||
| Software services | 4,541 | 9,697 | Represents revenue from providing remote hosted servicing software to certain Department and other servicers and providing diversified technology services. Decrease was primarily due to the transfer of all Department remote hosted borrowers to other third-party servicers throughout 2023 under the Department's legacy servicing contracts. | ||||||||||||||||||||||||||
| Outsourced services | 1,186 | 5,118 | Represents revenue from providing contact center and back office operational outsourcing services. Decrease was due to the contracts for support provided to certain Department servicers expiring in July 2023. | ||||||||||||||||||||||||||
| Loan servicing and systems revenue | $ | 127,201 | 139,227 | ||||||||||||||||||||||||||
| Three months ended March 31, | |||||||||||||||||||||||||||||||||||||||||||||||||||||||||||||||||||||||||||||||||||||||
| 2023 | 2022 | Additional information | 2024 | 2023 | Additional information | ||||||||||||||||||||||||||||||||||||||||||||||||||||||||||||||||||||||||||||||||||
| Net interest income | Net interest income | $ | 6,036 | 339 | Represents interest income on tuition funds held in custody for schools. Increase in 2023 compared with 2022 was due to higher interest rates. | Net interest income | $ | 7,866 | 6,036 | 6,036 | Represents interest income on tuition funds held in custody for schools. Increase was due to higher interest rates. | Represents interest income on tuition funds held in custody for schools. Increase was due to higher interest rates. | |||||||||||||||||||||||||||||||||||||||||||||||||||||||||||||||||||||||||||
| Education technology, services, and payment processing revenue | 133,603 | 112,286 | See table below for additional information. | ||||||||||||||||||||||||||||||||||||||||||||||||||||||||||||||||||||||||||||||||||||
| Education technology services and payments revenue | Education technology services and payments revenue | 143,539 | 133,603 | See table below for additional information. | |||||||||||||||||||||||||||||||||||||||||||||||||||||||||||||||||||||||||||||||||||
| Intersegment revenue | Intersegment revenue | 56 | 3 | ||||||||||||||||||||||||||||||||||||||||||||||||||||||||||||||||||||||||||||||||||||
| Total other income | Total other income | 133,659 | 112,289 | ||||||||||||||||||||||||||||||||||||||||||||||||||||||||||||||||||||||||||||||||||||
| Total other income | |||||||||||||||||||||||||||||||||||||||||||||||||||||||||||||||||||||||||||||||||||||||
| Total other income | |||||||||||||||||||||||||||||||||||||||||||||||||||||||||||||||||||||||||||||||||||||||
| Cost of services | |||||||||||||||||||||||||||||||||||||||||||||||||||||||||||||||||||||||||||||||||||||||
| Cost of services | |||||||||||||||||||||||||||||||||||||||||||||||||||||||||||||||||||||||||||||||||||||||
| Cost of services | Cost of services | 47,704 | 35,545 | See table below for additional information. | 48,610 | 47,704 | 47,704 | See table below for additional information. | See table below for additional information. | ||||||||||||||||||||||||||||||||||||||||||||||||||||||||||||||||||||||||||||||
| Salaries and benefits | Salaries and benefits | 37,913 | 31,286 | Increase in 2023 compared with 2022 was due to an increase in headcount to support the growth of the customer base and the investment in the development of new technologies. | Salaries and benefits | 40,167 | 37,913 | 37,913 | Increase was due to annual merit pay increases and an increase in headcount to support the growth of the customer base and the investment in the development of new technologies. | Increase was due to annual merit pay increases and an increase in headcount to support the growth of the customer base and the investment in the development of new technologies. | |||||||||||||||||||||||||||||||||||||||||||||||||||||||||||||||||||||||||||||
| Depreciation and amortization | Depreciation and amortization | 2,578 | 2,315 | Represents primarily amortization of intangible assets from prior business acquisitions. | Depreciation and amortization | 2,683 | 2,578 | 2,578 | Represents primarily amortization of intangible assets from prior business acquisitions. | Represents primarily amortization of intangible assets from prior business acquisitions. | |||||||||||||||||||||||||||||||||||||||||||||||||||||||||||||||||||||||||||||
| Other expenses | Other expenses | 8,063 | 5,764 | Increase in 2023 compared with 2022 was due to higher costs for consulting, professional fees, and technology services resulting from investments in new technologies. Increase was also due to an increase in costs for travel and in-person hosted conferences that previously subsided due to the COVID pandemic. | Other expenses | 7,558 | 8,063 | 8,063 | Decrease was due to a decrease in consulting and professional services resulting from reduced outsourced work. Decrease was partially offset by an increase in technology services. | Decrease was due to a decrease in consulting and professional services resulting from reduced outsourced work. Decrease was partially offset by an increase in technology services. | |||||||||||||||||||||||||||||||||||||||||||||||||||||||||||||||||||||||||||||
| Intersegment expenses, net | Intersegment expenses, net | 5,800 | 4,605 | Represents costs for certain corporate activities and services that are allocated to each operating segment based on estimated use of such activities and services. | Intersegment expenses, net | 4,801 | 5,800 | 5,800 | Represents costs for certain corporate activities and services that are allocated to each operating segment based on estimated use of such activities and services. | Represents costs for certain corporate activities and services that are allocated to each operating segment based on estimated use of such activities and services. | |||||||||||||||||||||||||||||||||||||||||||||||||||||||||||||||||||||||||||||
| Total operating expenses | Total operating expenses | 54,354 | 43,970 | ||||||||||||||||||||||||||||||||||||||||||||||||||||||||||||||||||||||||||||||||||||
| Income before income taxes | Income before income taxes | 37,637 | 33,113 | ||||||||||||||||||||||||||||||||||||||||||||||||||||||||||||||||||||||||||||||||||||
| Income before income taxes | |||||||||||||||||||||||||||||||||||||||||||||||||||||||||||||||||||||||||||||||||||||||
| Income before income taxes | |||||||||||||||||||||||||||||||||||||||||||||||||||||||||||||||||||||||||||||||||||||||
| Income tax expense | |||||||||||||||||||||||||||||||||||||||||||||||||||||||||||||||||||||||||||||||||||||||
| Income tax expense | |||||||||||||||||||||||||||||||||||||||||||||||||||||||||||||||||||||||||||||||||||||||
| Income tax expense | Income tax expense | (9,066) | (7,947) | Represents income tax expense at an effective tax rate of 24%. | (11,435) | (9,066) | (9,066) | Represents income tax expense at an effective tax rate of 24%. | Represents income tax expense at an effective tax rate of 24%. | ||||||||||||||||||||||||||||||||||||||||||||||||||||||||||||||||||||||||||||||
| Net income | Net income | 28,571 | 25,166 | ||||||||||||||||||||||||||||||||||||||||||||||||||||||||||||||||||||||||||||||||||||
| Net loss attributable to noncontrolling interests | Net loss attributable to noncontrolling interests | 138 | — | Amounts for noncontrolling interests reflect the net loss attributable to the holders of minority membership interests in NextGen, of which the Company became the majority owner on April 30, 2022. | |||||||||||||||||||||||||||||||||||||||||||||||||||||||||||||||||||||||||||||||||||
| Net loss attributable to noncontrolling interests | |||||||||||||||||||||||||||||||||||||||||||||||||||||||||||||||||||||||||||||||||||||||
| Net loss attributable to noncontrolling interests | |||||||||||||||||||||||||||||||||||||||||||||||||||||||||||||||||||||||||||||||||||||||
| Net income | Net income | $ | 28,709 | 25,166 | |||||||||||||||||||||||||||||||||||||||||||||||||||||||||||||||||||||||||||||||||||
| Net income | |||||||||||||||||||||||||||||||||||||||||||||||||||||||||||||||||||||||||||||||||||||||
| Net income | |||||||||||||||||||||||||||||||||||||||||||||||||||||||||||||||||||||||||||||||||||||||
| Three months ended March 31, | ||||||||||||||||||||||||||||||||||||||||||||||||||||||||||||||||||||||||||||
| 2023 | 2022 | Additional information | 2024 | 2023 | Additional information | |||||||||||||||||||||||||||||||||||||||||||||||||||||||||||||||||||||||
| Tuition payment plan services | Tuition payment plan services | $ | 34,187 | 30,716 | Increase in 2023 compared with 2022 was due to a higher number of payment plans in the K-12 and higher education market. | Tuition payment plan services | $ | 38,880 | 34,187 | Increase was due to a higher number of payment plans in the K-12 and higher education markets for both new and existing customers. | ||||||||||||||||||||||||||||||||||||||||||||||||||||||||||||||||||
| Payment processing | Payment processing | 44,041 | 38,071 | Increase in 2023 compared with 2022 was due to increase in payment volumes for both the K-12 and higher education markets due to new customers and an increase in volume from existing customers. | Payment processing | 47,786 | 44,041 | Increase was due to increase in payment volumes for both the K-12 and higher education markets due to new customers and an increase in volume from existing customers. | ||||||||||||||||||||||||||||||||||||||||||||||||||||||||||||||||||||
| Education technology and services | 54,787 | 43,251 | Increase in 2023 compared with 2022 was due to an increase in revenue from the Company’s school information system software, enrollment and communication services, the NextGen acquisition completed in April 2022, and FACTS Education Solutions instructional and professional development services. FACTS Education Solutions instructional services revenue was the largest component of this increase, driven by the Emergency Assistance to Non-Public Schools (EANS) program which provides funds to non-public schools through September 2024 to address the impact COVID-19 has had or continues to have on students and teachers. | |||||||||||||||||||||||||||||||||||||||||||||||||||||||||||||||||||||||||
| Education technology services | Education technology services | 56,021 | 54,787 | Increase was due to an increase in revenue from the Company’s school information system software and application and enrollment services. This increase was partially offset by a decrease in FACTS learning management services revenue as a result of decrease in economic aid provided to private schools in response to the COVID 19 pandemic. Learning management instructional services revenue provided to private schools has been funded by the CARES Act and the Emergency Assistance to Non-Public Schools (EANS) programs. The EANS I program funding ended on September 30, 2023 and EANS II program funding ends on September 30, 2024. As economic aid provided to schools under the EANS programs stopped on September 30, 2023 (EANS I) and winds down (EANS II), future instructional services revenue will decrease from recent historical periods. Revenue earned under the EANS programs for the three months ended March 31, 2024 and 2023 was $10.6 million and $16.4 million, respectively. | ||||||||||||||||||||||||||||||||||||||||||||||||||||||||||||||||||||||||
| Other | Other | 588 | 248 | |||||||||||||||||||||||||||||||||||||||||||||||||||||||||||||||||||||||||
| Education technology, services, and payment processing revenue | 133,603 | 112,286 | ||||||||||||||||||||||||||||||||||||||||||||||||||||||||||||||||||||||||||
| Education technology services and payments revenue | ||||||||||||||||||||||||||||||||||||||||||||||||||||||||||||||||||||||||||||
| Education technology services and payments revenue | ||||||||||||||||||||||||||||||||||||||||||||||||||||||||||||||||||||||||||||
| Education technology services and payments revenue | ||||||||||||||||||||||||||||||||||||||||||||||||||||||||||||||||||||||||||||
| Cost of services | ||||||||||||||||||||||||||||||||||||||||||||||||||||||||||||||||||||||||||||
| Cost of services | ||||||||||||||||||||||||||||||||||||||||||||||||||||||||||||||||||||||||||||
| Cost of services | Cost of services | 47,704 | 35,545 | Represents costs relating to payment processing revenue and such costs decrease/increase in relationship to payment volumes. Costs to provide instructional services are also a component of this expense and were the primary driver of the increase in 2023 compared with 2022 due to the increase in instructional services resulting from the EANS program as noted above. | 48,610 | 47,704 | Represents direct costs to provide payment processing revenue and such costs decrease/increase in relationship to payment volumes. Costs to provide instructional services are also a component of this expense and decrease/increase in relationship to instructional services revenues. | |||||||||||||||||||||||||||||||||||||||||||||||||||||||||||||||||||||
| Net revenue | Net revenue | $ | 85,899 | 76,741 | ||||||||||||||||||||||||||||||||||||||||||||||||||||||||||||||||||||||||
| GAAP before tax operating margin | GAAP before tax operating margin | 43.8 | % | 43.1 | % | Before tax operating margin, excluding net interest income, is a non-GAAP measure of before tax operating profitability as a percentage of revenue, and for the ETS&PP segment is calculated as income before income taxes less interest income divided by net revenue. The Company uses this metric to monitor and assess the segment’s performance, manage operating costs, identify and evaluate business trends affecting the segment, and make strategic decisions, and believes that it facilitates an understanding of the operating performance of the segment and provides a meaningful comparison of the results of operations between periods. Before tax operating margin, excluding net interest income, decreased in 2023 compared with 2022 due to investments in (i) the development of new services and technologies; and (ii) superior customer experiences to align with the Company’s strategies to grow, retain, and diversify revenues. The Company anticipates before tax operating margin, excluding net interest income, will be impacted over the next several years as it continues to invest in these areas. | ||||||||||||||||||||||||||||||||||||||||||||||||||||||||||||||||||||||
| GAAP before tax operating margin | ||||||||||||||||||||||||||||||||||||||||||||||||||||||||||||||||||||||||||||
| GAAP before tax operating margin | 50.2 | % | 43.8 | % | Before tax operating margin, excluding net interest income, is a non-GAAP measure of before tax operating profitability as a percentage of revenue, and for the ETSP segment is calculated as income before income taxes less net interest income divided by net revenue. The Company uses this metric to monitor and assess the segment’s performance, manage operating costs, identify and evaluate business trends affecting the segment, and make strategic decisions, and believes that it facilitates an understanding of the operating performance of the segment and provides a meaningful comparison of the results of operations between periods. Before tax operating margin, excluding net interest income, increased due to increased net revenue while maintaining a consistent cost structure. | |||||||||||||||||||||||||||||||||||||||||||||||||||||||||||||||||||||||
| Net interest income | Net interest income | (7.0) | (0.4) | Before tax operating margin, excluding net interest income, is a non-GAAP measure of before tax operating profitability as a percentage of revenue, and for the ETS&PP segment is calculated as income before income taxes less interest income divided by net revenue. The Company uses this metric to monitor and assess the segment’s performance, manage operating costs, identify and evaluate business trends affecting the segment, and make strategic decisions, and believes that it facilitates an understanding of the operating performance of the segment and provides a meaningful comparison of the results of operations between periods. Before tax operating margin, excluding net interest income, decreased in 2023 compared with 2022 due to investments in (i) the development of new services and technologies; and (ii) superior customer experiences to align with the Company’s strategies to grow, retain, and diversify revenues. The Company anticipates before tax operating margin, excluding net interest income, will be impacted over the next several years as it continues to invest in these areas. | ||||||||||||||||||||||||||||||||||||||||||||||||||||||||||||||||||||||||
| Non-GAAP before tax operating margin, excluding net interest income | Non-GAAP before tax operating margin, excluding net interest income | 36.8 | % | 42.7 | % | |||||||||||||||||||||||||||||||||||||||||||||||||||||||||||||||||||||||
| Non-GAAP before tax operating margin, excluding net interest income | ||||||||||||||||||||||||||||||||||||||||||||||||||||||||||||||||||||||||||||
| Non-GAAP before tax operating margin, excluding net interest income | ||||||||||||||||||||||||||||||||||||||||||||||||||||||||||||||||||||||||||||
| Three months ended March 31, | |||||||||||||||||||||||||||||
| 2024 | 2023 | Additional information | |||||||||||||||||||||||||||
| Net interest income | $ | 1,894 | 1,037 | Increase was due to higher interest rates. | |||||||||||||||||||||||||
| Loan servicing and systems revenue | 127,201 | 139,227 | See table below for additional information. | ||||||||||||||||||||||||||
| Intersegment servicing revenue | 6,886 | 7,790 | Represents revenue earned by LSS from servicing loans for AGM and Nelnet Bank. Decrease was due to the continued amortization of AGM's FFELP portfolio. FFELP intersegment servicing revenue will continue to decrease as AGM's FFELP portfolio pays off. | ||||||||||||||||||||||||||
| Other income | 710 | 608 | Represents revenue earned from providing administrative support services. | ||||||||||||||||||||||||||
| Total other income | 134,797 | 147,625 | |||||||||||||||||||||||||||
| Salaries and benefits | 76,722 | 84,560 | Decrease was due to the Company being fully staffed at the beginning of 2023 with contact center operations and support associates as the Company prepared for expiration of the federal student loan payment pause under the CARES Act. In the first half of 2023, the Company reduced staff to manage expenses due to delays in the government's student debt relief and return to repayment programs and lower pricing and reduced servicing volume for LSS's Department servicing contract. As part of these reductions, the Company recognized a restructuring charge of $2.7 million in the first quarter of 2023. | ||||||||||||||||||||||||||
| Depreciation and amortization | 5,109 | 4,513 | |||||||||||||||||||||||||||
| Other expenses | 19,538 | 13,313 | Increase was due to additional postage and communication costs due to borrowers returning to repayment on September 1, 2023. | ||||||||||||||||||||||||||
| Intersegment expenses | 19,332 | 21,057 | Represents costs for certain corporate activities and services that are allocated to each operating segment based on estimated use of such activities and services. | ||||||||||||||||||||||||||
| Total operating expenses | 120,701 | 123,443 | |||||||||||||||||||||||||||
| Income before income taxes | 15,990 | 25,219 | |||||||||||||||||||||||||||
| Income tax expense | (3,838) | (6,053) | Represents income tax expense at an effective tax rate of 24%. | ||||||||||||||||||||||||||
| Net income | $ | 12,152 | 19,166 | ||||||||||||||||||||||||||
| Before tax operating margin | 11.9 | % | 17.1 | % | Before tax operating margin represents before tax operating profitability as a percentage of revenue, and for LSS is calculated as income before income taxes divided by the total of loan servicing and systems revenue, intersegment servicing revenue, and other income. The Company uses this metric to monitor and assess the segment’s performance, manage operating costs, identify and evaluate business trends affecting the segment, and make strategic decisions, and believes that it provides additional information to facilitate an understanding of the operating performance of the segment and provides a meaningful comparison of the results of operations between periods. Before tax operating margin decreased due primarily to a decrease in loan servicing and systems revenue as described in the table below, partially offset by a decrease in salaries and benefits resulting from restructure charges incurred during the first quarter of 2023 and staff reductions in 2023. | ||||||||||||||||||||||||
| Three months ended March 31, | |||||||||||||||||||||||||||||
| 2024 | 2023 | Additional information | |||||||||||||||||||||||||||
| Government loan servicing | $ | 105,474 | 108,880 | Represents revenue from the Company's Department legacy servicing contract. Decrease was due to the reduction of the monthly fee earned per borrower on certain borrower statuses by $0.19 effective April 1, 2023 and a decrease of borrowers serviced due to the Department transferring one million of the Company's existing borrowers to another third-party servicer during the second and third quarters of 2023. These decreases were partially offset by an increase in the average revenue earned on a per borrower blended basis as a result of borrowers moving to a repayment status on September 1, 2023. | |||||||||||||||||||||||||
| Private education and consumer loan servicing | 12,620 | 12,164 | Increase was due to rate increases based on contractual consumer price index changes, partially offset by a decrease in the number of borrowers serviced. | ||||||||||||||||||||||||||
| FFELP loan servicing | 3,380 | 3,368 | Represents revenue from servicing third-party customers' FFELP portfolios. Over time, FFELP servicing revenue will decrease as third-party customers' FFELP portfolios pay off. | ||||||||||||||||||||||||||
| Software services | 4,541 | 9,697 | Represents revenue from providing remote hosted servicing software to certain Department and other servicers and providing diversified technology services. Decrease was primarily due to the transfer of all Department remote hosted borrowers to other third-party servicers throughout 2023 under the Department's legacy servicing contracts. | ||||||||||||||||||||||||||
| Outsourced services | 1,186 | 5,118 | Represents revenue from providing contact center and back office operational outsourcing services. Decrease was due to the contracts for support provided to certain Department servicers expiring in July 2023. | ||||||||||||||||||||||||||
| Loan servicing and systems revenue | $ | 127,201 | 139,227 | ||||||||||||||||||||||||||
| Three months ended March 31, | |||||||||||||||||||||||||||||
| 2024 | 2023 | Additional information | |||||||||||||||||||||||||||
| Net interest income | $ | 7,866 | 6,036 | Represents interest income on tuition funds held in custody for schools. Increase was due to higher interest rates. | |||||||||||||||||||||||||
| Education technology services and payments revenue | 143,539 | 133,603 | See table below for additional information. | ||||||||||||||||||||||||||
| Intersegment revenue | 49 | 56 | |||||||||||||||||||||||||||
| Total other income | 143,588 | 133,659 | |||||||||||||||||||||||||||
| Cost of services | 48,610 | 47,704 | See table below for additional information. | ||||||||||||||||||||||||||
| Salaries and benefits | 40,167 | 37,913 | Increase was due to annual merit pay increases and an increase in headcount to support the growth of the customer base and the investment in the development of new technologies. | ||||||||||||||||||||||||||
| Depreciation and amortization | 2,683 | 2,578 | Represents primarily amortization of intangible assets from prior business acquisitions. | ||||||||||||||||||||||||||
| Other expenses | 7,558 | 8,063 | Decrease was due to a decrease in consulting and professional services resulting from reduced outsourced work. Decrease was partially offset by an increase in technology services. | ||||||||||||||||||||||||||
| Intersegment expenses, net | 4,801 | 5,800 | Represents costs for certain corporate activities and services that are allocated to each operating segment based on estimated use of such activities and services. | ||||||||||||||||||||||||||
| Total operating expenses | 55,209 | 54,354 | |||||||||||||||||||||||||||
| Income before income taxes | 47,635 | 37,637 | |||||||||||||||||||||||||||
| Income tax expense | (11,435) | (9,066) | Represents income tax expense at an effective tax rate of 24%. | ||||||||||||||||||||||||||
| Net income | 36,200 | 28,571 | |||||||||||||||||||||||||||
| Net loss attributable to noncontrolling interests | 17 | 138 | |||||||||||||||||||||||||||
| Net income | $ | 36,217 | 28,709 | ||||||||||||||||||||||||||
| Three months ended March 31, | |||||||||||||||||||||||||||||
| 2024 | 2023 | Additional information | |||||||||||||||||||||||||||
| Tuition payment plan services | $ | 38,880 | 34,187 | Increase was due to a higher number of payment plans in the K-12 and higher education markets for both new and existing customers. | |||||||||||||||||||||||||
| Payment processing | 47,786 | 44,041 | Increase was due to increase in payment volumes for both the K-12 and higher education markets due to new customers and an increase in volume from existing customers. | ||||||||||||||||||||||||||
| Education technology services | 56,021 | 54,787 | Increase was due to an increase in revenue from the Company’s school information system software and application and enrollment services. This increase was partially offset by a decrease in FACTS learning management services revenue as a result of decrease in economic aid provided to private schools in response to the COVID 19 pandemic. Learning management instructional services revenue provided to private schools has been funded by the CARES Act and the Emergency Assistance to Non-Public Schools (EANS) programs. The EANS I program funding ended on September 30, 2023 and EANS II program funding ends on September 30, 2024. As economic aid provided to schools under the EANS programs stopped on September 30, 2023 (EANS I) and winds down (EANS II), future instructional services revenue will decrease from recent historical periods. Revenue earned under the EANS programs for the three months ended March 31, 2024 and 2023 was $10.6 million and $16.4 million, respectively. | ||||||||||||||||||||||||||
| Other | 852 | 588 | |||||||||||||||||||||||||||
| Education technology services and payments revenue | 143,539 | 133,603 | |||||||||||||||||||||||||||
| Cost of services | 48,610 | 47,704 | Represents direct costs to provide payment processing revenue and such costs decrease/increase in relationship to payment volumes. Costs to provide instructional services are also a component of this expense and decrease/increase in relationship to instructional services revenues. | ||||||||||||||||||||||||||
| Net revenue | $ | 94,929 | 85,899 | ||||||||||||||||||||||||||
| GAAP before tax operating margin | 50.2 | % | 43.8 | % | Before tax operating margin, excluding net interest income, is a non-GAAP measure of before tax operating profitability as a percentage of revenue, and for the ETSP segment is calculated as income before income taxes less net interest income divided by net revenue. The Company uses this metric to monitor and assess the segment’s performance, manage operating costs, identify and evaluate business trends affecting the segment, and make strategic decisions, and believes that it facilitates an understanding of the operating performance of the segment and provides a meaningful comparison of the results of operations between periods. Before tax operating margin, excluding net interest income, increased due to increased net revenue while maintaining a consistent cost structure. | ||||||||||||||||||||||||
| Net interest income | (8.3) | (7.0) | |||||||||||||||||||||||||||
| Non-GAAP before tax operating margin, excluding net interest income | 41.9 | % | 36.8 | % | |||||||||||||||||||||||||
| Three months ended March 31, | |||||||||||||||||||||||
| 2023 | 2022 | ||||||||||||||||||||||
| Beginning balance | $ | 14,169,771 | 17,441,790 | ||||||||||||||||||||
| Loan acquisitions: | |||||||||||||||||||||||
| Federally insured student loans | 2,980 | 10,202 | |||||||||||||||||||||
| Private education loans | — | 1,026 | |||||||||||||||||||||
| Consumer and other loans | 250,706 | 18,522 | |||||||||||||||||||||
| Total loan acquisitions | 253,686 | 29,750 | |||||||||||||||||||||
| Repayments, claims, capitalized interest, participations, and other, net | (410,239) | (447,140) | |||||||||||||||||||||
| Loans lost to external parties | (268,696) | (387,648) | |||||||||||||||||||||
| Loans sold | (261,902) | (18,125) | |||||||||||||||||||||
| Ending balance | $ | 13,482,620 | 16,618,627 | ||||||||||||||||||||
| Three months ended March 31, | |||||||||||||||||||||||
| 2023 | 2022 | ||||||||||||||||||||||
| Variable loan yield, gross | 7.12 | % | 2.75 | % | |||||||||||||||||||
| Consolidation rebate fees | (0.81) | (0.85) | |||||||||||||||||||||
| Discount accretion, net of premium and deferred origination costs amortization | 0.05 | 0.03 | |||||||||||||||||||||
| Variable loan yield, net | 6.36 | 1.93 | |||||||||||||||||||||
| Loan cost of funds - interest expense | (5.53) | (1.09) | |||||||||||||||||||||
| Loan cost of funds - derivative settlements (a) (b) | 0.03 | 0.01 | |||||||||||||||||||||
| Variable loan spread | 0.86 | 0.85 | |||||||||||||||||||||
| Fixed rate floor income, gross | 0.03 | 0.68 | |||||||||||||||||||||
| Fixed rate floor income - derivative settlements (a) (c) | 0.68 | (0.08) | |||||||||||||||||||||
| Fixed rate floor income, net of settlements on derivatives | 0.71 | 0.60 | |||||||||||||||||||||
| Core loan spread | 1.57 | % | 1.45 | % | |||||||||||||||||||
| Average balance of AGM's loans | $ | 13,991,241 | 17,208,909 | ||||||||||||||||||||
| Average balance of AGM's debt outstanding | 13,364,876 | 16,773,698 | |||||||||||||||||||||
| Three months ended March 31, | |||||||||||||||||||||||
| 2023 | 2022 | ||||||||||||||||||||||
| Core loan spread | 1.57 | % | 1.45 | % | |||||||||||||||||||
| Derivative settlements (1:3 basis swaps) | (0.03) | (0.01) | |||||||||||||||||||||
| Derivative settlements (fixed rate floor income) | (0.68) | 0.08 | |||||||||||||||||||||
| Loan spread | 0.86 | % | 1.52 | % | |||||||||||||||||||
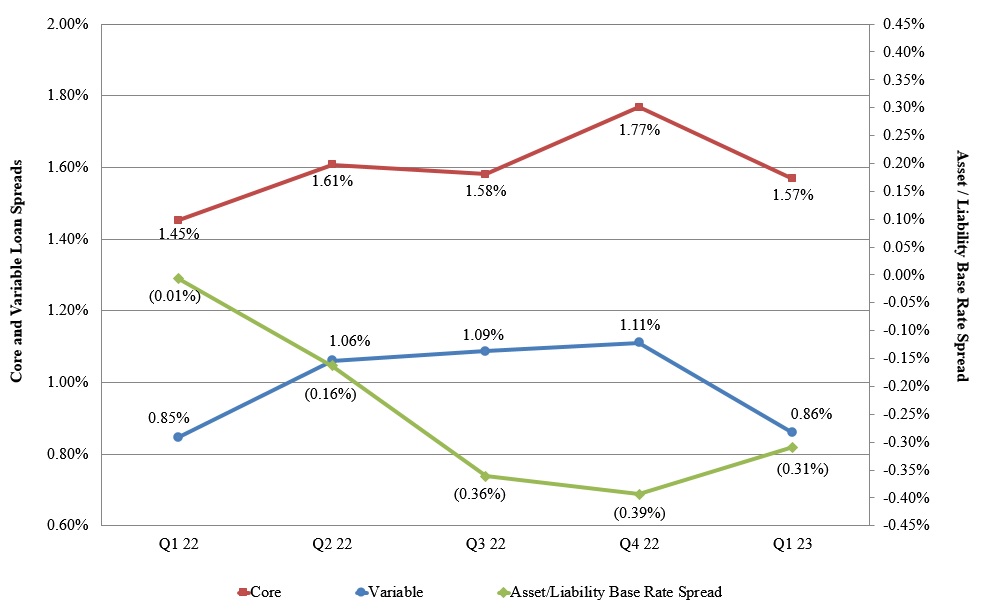
| Three months ended March 31, | |||||||||||||||||||||||
| 2023 | 2022 | ||||||||||||||||||||||
| Fixed rate floor income, gross | $ | 1,110 | 28,993 | ||||||||||||||||||||
| Derivative settlements (a) | 22,478 | (3,205) | |||||||||||||||||||||
| Fixed rate floor income, net | $ | 23,588 | 25,788 | ||||||||||||||||||||
| Fixed rate floor income contribution to spread, net | 0.71 | % | 0.60 | % | |||||||||||||||||||
| Three months ended March 31, | |||||||||||||||||||||||||||||
| 2023 | 2022 | Additional information | |||||||||||||||||||||||||||
| Net interest income after provision for loan losses | $ | 13,663 | 73,459 | See table below for additional analysis. | |||||||||||||||||||||||||
| Other income, net | 2,845 | 6,511 | Represents primarily borrower late fees, income from providing administration activities for third parties, and income from AGM's investment in a joint venture. Decrease in 2023 compared with 2022 was primarily due to the recognition of a $0.1 million loss in the first quarter of 2023 compared with $1.9 million of income for the same period in 2022 related to its investment in the joint venture. | ||||||||||||||||||||||||||
| Gain on sale of loans, net | 11,812 | 2,989 | The Company sold $261.9 million (par value) and $18.1 million (par value) of loans to unrelated third parties in 2023 and 2022, respectively, and recognized net gains from such sales. | ||||||||||||||||||||||||||
| Derivative settlements, net | 23,337 | (2,809) | The Company maintains an overall risk management strategy that incorporates the use of derivative instruments to reduce the economic effect of interest rate volatility. Derivative settlements for each applicable period should be evaluated with the Company's net interest income as reflected in the table below. The majority of derivative settlements received in 2023 was from the Company's derivatives used to hedge loans earning fixed rate floor income. This entire derivative portfolio was terminated on March 15, 2023 to minimize the Company's exposure to market volatility. As such, there will be no derivative settlements received on these derivatives in future periods. | ||||||||||||||||||||||||||
| Derivative market value adjustments, net | (37,411) | 145,734 | Includes the realized and unrealized gains and losses that are caused by changes in fair values of derivatives which do not qualify for "hedge treatment" under GAAP. The majority of the derivative market value adjustments during 2023 and 2022 related to the changes in fair value of the Company's floor income interest rate swaps. Such changes reflect that a decrease in the forward yield curve during a reporting period results in a decrease in the fair value of the Company's floor income interest rate swaps, and an increase in the forward yield curve during a reporting period results in an increase in the fair value of such swaps. The entire portfolio of floor income interest rate swaps was terminated on March 15, 2023 to minimize the Company's exposure to market volatility. As such, the Company expects the derivative market value adjustments in future periods will be less substantial. | ||||||||||||||||||||||||||
| Total other income (expense) | 583 | 152,425 | |||||||||||||||||||||||||||
| Salaries and benefits | 755 | 591 | |||||||||||||||||||||||||||
| Other expenses | 5,016 | 3,033 | Represents primarily servicing fees paid to third parties. Also includes certain professional and legal fees. Increase in 2023 compared with 2022 was due to incurring additional professional fees as the Company actively expands into new asset loan classes. | ||||||||||||||||||||||||||
| Intersegment expenses | 8,696 | 8,831 | Represents fees paid to LSS for the servicing of AGM’s loan portfolio. These amounts exceed the actual cost of servicing the loans. Intersegment expenses also includes costs for certain corporate activities and services that are allocated to each operating segment based on estimated use of such activities and services. | ||||||||||||||||||||||||||
| Total operating expenses | 14,467 | 12,455 | Total operating expenses were 41 basis points and 29 basis points of the average balance of loans for the three months ended March 31, 2023 and 2022, respectively. The increase in operating expenses as a percent of the average balance of loans in 2023 compared with 2022 was due to an increase in certain professional costs as discussed above. | ||||||||||||||||||||||||||
| (Loss) income before income taxes | (221) | 213,429 | |||||||||||||||||||||||||||
| Income tax benefit (expense) | 53 | (51,223) | Represents income tax expense at an effective tax rate of 24%. | ||||||||||||||||||||||||||
| Net (loss) income | $ | (168) | 162,206 | ||||||||||||||||||||||||||
| Additional information: | |||||||||||||||||||||||||||||
| Net (loss) income | $ | (168) | 162,206 | See "Overview - GAAP Net Income and Non-GAAP Net Income, Excluding Adjustments" above for additional details about non-GAAP net income, excluding derivative market value adjustments. | |||||||||||||||||||||||||
| Derivative market value adjustments, net | 37,411 | (145,734) | |||||||||||||||||||||||||||
| Tax effect | (8,979) | 34,976 | |||||||||||||||||||||||||||
| Net income, excluding derivative market value adjustments | $ | 28,264 | 51,448 | ||||||||||||||||||||||||||
| Three months ended March 31, | |||||||||||||||||||||||||||||
| 2024 | 2023 | Additional information | |||||||||||||||||||||||||||
| Net interest income | $ | 1,894 | 1,037 | Increase was due to higher interest rates. | |||||||||||||||||||||||||
| Loan servicing and systems revenue | 127,201 | 139,227 | See table below for additional information. | ||||||||||||||||||||||||||
| Intersegment servicing revenue | 6,886 | 7,790 | Represents revenue earned by LSS from servicing loans for AGM and Nelnet Bank. Decrease was due to the continued amortization of AGM's FFELP portfolio. FFELP intersegment servicing revenue will continue to decrease as AGM's FFELP portfolio pays off. | ||||||||||||||||||||||||||
| Other income | 710 | 608 | Represents revenue earned from providing administrative support services. | ||||||||||||||||||||||||||
| Total other income | 134,797 | 147,625 | |||||||||||||||||||||||||||
| Salaries and benefits | 76,722 | 84,560 | Decrease was due to the Company being fully staffed at the beginning of 2023 with contact center operations and support associates as the Company prepared for expiration of the federal student loan payment pause under the CARES Act. In the first half of 2023, the Company reduced staff to manage expenses due to delays in the government's student debt relief and return to repayment programs and lower pricing and reduced servicing volume for LSS's Department servicing contract. As part of these reductions, the Company recognized a restructuring charge of $2.7 million in the first quarter of 2023. | ||||||||||||||||||||||||||
| Depreciation and amortization | 5,109 | 4,513 | |||||||||||||||||||||||||||
| Other expenses | 19,538 | 13,313 | Increase was due to additional postage and communication costs due to borrowers returning to repayment on September 1, 2023. | ||||||||||||||||||||||||||
| Intersegment expenses | 19,332 | 21,057 | Represents costs for certain corporate activities and services that are allocated to each operating segment based on estimated use of such activities and services. | ||||||||||||||||||||||||||
| Total operating expenses | 120,701 | 123,443 | |||||||||||||||||||||||||||
| Income before income taxes | 15,990 | 25,219 | |||||||||||||||||||||||||||
| Income tax expense | (3,838) | (6,053) | Represents income tax expense at an effective tax rate of 24%. | ||||||||||||||||||||||||||
| Net income | $ | 12,152 | 19,166 | ||||||||||||||||||||||||||
| Before tax operating margin | 11.9 | % | 17.1 | % | Before tax operating margin represents before tax operating profitability as a percentage of revenue, and for LSS is calculated as income before income taxes divided by the total of loan servicing and systems revenue, intersegment servicing revenue, and other income. The Company uses this metric to monitor and assess the segment’s performance, manage operating costs, identify and evaluate business trends affecting the segment, and make strategic decisions, and believes that it provides additional information to facilitate an understanding of the operating performance of the segment and provides a meaningful comparison of the results of operations between periods. Before tax operating margin decreased due primarily to a decrease in loan servicing and systems revenue as described in the table below, partially offset by a decrease in salaries and benefits resulting from restructure charges incurred during the first quarter of 2023 and staff reductions in 2023. | ||||||||||||||||||||||||
| Three months ended March 31, | |||||||||||||||||||||||||||||
| 2024 | 2023 | Additional information | |||||||||||||||||||||||||||
| Government loan servicing | $ | 105,474 | 108,880 | Represents revenue from the Company's Department legacy servicing contract. Decrease was due to the reduction of the monthly fee earned per borrower on certain borrower statuses by $0.19 effective April 1, 2023 and a decrease of borrowers serviced due to the Department transferring one million of the Company's existing borrowers to another third-party servicer during the second and third quarters of 2023. These decreases were partially offset by an increase in the average revenue earned on a per borrower blended basis as a result of borrowers moving to a repayment status on September 1, 2023. | |||||||||||||||||||||||||
| Private education and consumer loan servicing | 12,620 | 12,164 | Increase was due to rate increases based on contractual consumer price index changes, partially offset by a decrease in the number of borrowers serviced. | ||||||||||||||||||||||||||
| FFELP loan servicing | 3,380 | 3,368 | Represents revenue from servicing third-party customers' FFELP portfolios. Over time, FFELP servicing revenue will decrease as third-party customers' FFELP portfolios pay off. | ||||||||||||||||||||||||||
| Software services | 4,541 | 9,697 | Represents revenue from providing remote hosted servicing software to certain Department and other servicers and providing diversified technology services. Decrease was primarily due to the transfer of all Department remote hosted borrowers to other third-party servicers throughout 2023 under the Department's legacy servicing contracts. | ||||||||||||||||||||||||||
| Outsourced services | 1,186 | 5,118 | Represents revenue from providing contact center and back office operational outsourcing services. Decrease was due to the contracts for support provided to certain Department servicers expiring in July 2023. | ||||||||||||||||||||||||||
| Loan servicing and systems revenue | $ | 127,201 | 139,227 | ||||||||||||||||||||||||||
| Three months ended March 31, | |||||||||||||||||||||||||||||
| 2024 | 2023 | Additional information | |||||||||||||||||||||||||||
| Net interest income | $ | 7,866 | 6,036 | Represents interest income on tuition funds held in custody for schools. Increase was due to higher interest rates. | |||||||||||||||||||||||||
| Education technology services and payments revenue | 143,539 | 133,603 | See table below for additional information. | ||||||||||||||||||||||||||
| Intersegment revenue | 49 | 56 | |||||||||||||||||||||||||||
| Total other income | 143,588 | 133,659 | |||||||||||||||||||||||||||
| Cost of services | 48,610 | 47,704 | See table below for additional information. | ||||||||||||||||||||||||||
| Salaries and benefits | 40,167 | 37,913 | Increase was due to annual merit pay increases and an increase in headcount to support the growth of the customer base and the investment in the development of new technologies. | ||||||||||||||||||||||||||
| Depreciation and amortization | 2,683 | 2,578 | Represents primarily amortization of intangible assets from prior business acquisitions. | ||||||||||||||||||||||||||
| Other expenses | 7,558 | 8,063 | Decrease was due to a decrease in consulting and professional services resulting from reduced outsourced work. Decrease was partially offset by an increase in technology services. | ||||||||||||||||||||||||||
| Intersegment expenses, net | 4,801 | 5,800 | Represents costs for certain corporate activities and services that are allocated to each operating segment based on estimated use of such activities and services. | ||||||||||||||||||||||||||
| Total operating expenses | 55,209 | 54,354 | |||||||||||||||||||||||||||
| Income before income taxes | 47,635 | 37,637 | |||||||||||||||||||||||||||
| Income tax expense | (11,435) | (9,066) | Represents income tax expense at an effective tax rate of 24%. | ||||||||||||||||||||||||||
| Net income | 36,200 | 28,571 | |||||||||||||||||||||||||||
| Net loss attributable to noncontrolling interests | 17 | 138 | |||||||||||||||||||||||||||
| Net income | $ | 36,217 | 28,709 | ||||||||||||||||||||||||||
| Three months ended March 31, | |||||||||||||||||||||||||||||
| 2024 | 2023 | Additional information | |||||||||||||||||||||||||||
| Tuition payment plan services | $ | 38,880 | 34,187 | Increase was due to a higher number of payment plans in the K-12 and higher education markets for both new and existing customers. | |||||||||||||||||||||||||
| Payment processing | 47,786 | 44,041 | Increase was due to increase in payment volumes for both the K-12 and higher education markets due to new customers and an increase in volume from existing customers. | ||||||||||||||||||||||||||
| Education technology services | 56,021 | 54,787 | Increase was due to an increase in revenue from the Company’s school information system software and application and enrollment services. This increase was partially offset by a decrease in FACTS learning management services revenue as a result of decrease in economic aid provided to private schools in response to the COVID 19 pandemic. Learning management instructional services revenue provided to private schools has been funded by the CARES Act and the Emergency Assistance to Non-Public Schools (EANS) programs. The EANS I program funding ended on September 30, 2023 and EANS II program funding ends on September 30, 2024. As economic aid provided to schools under the EANS programs stopped on September 30, 2023 (EANS I) and winds down (EANS II), future instructional services revenue will decrease from recent historical periods. Revenue earned under the EANS programs for the three months ended March 31, 2024 and 2023 was $10.6 million and $16.4 million, respectively. | ||||||||||||||||||||||||||
| Other | 852 | 588 | |||||||||||||||||||||||||||
| Education technology services and payments revenue | 143,539 | 133,603 | |||||||||||||||||||||||||||
| Cost of services | 48,610 | 47,704 | Represents direct costs to provide payment processing revenue and such costs decrease/increase in relationship to payment volumes. Costs to provide instructional services are also a component of this expense and decrease/increase in relationship to instructional services revenues. | ||||||||||||||||||||||||||
| Net revenue | $ | 94,929 | 85,899 | ||||||||||||||||||||||||||
| GAAP before tax operating margin | 50.2 | % | 43.8 | % | Before tax operating margin, excluding net interest income, is a non-GAAP measure of before tax operating profitability as a percentage of revenue, and for the ETSP segment is calculated as income before income taxes less net interest income divided by net revenue. The Company uses this metric to monitor and assess the segment’s performance, manage operating costs, identify and evaluate business trends affecting the segment, and make strategic decisions, and believes that it facilitates an understanding of the operating performance of the segment and provides a meaningful comparison of the results of operations between periods. Before tax operating margin, excluding net interest income, increased due to increased net revenue while maintaining a consistent cost structure. | ||||||||||||||||||||||||
| Net interest income | (8.3) | (7.0) | |||||||||||||||||||||||||||
| Non-GAAP before tax operating margin, excluding net interest income | 41.9 | % | 36.8 | % | |||||||||||||||||||||||||
| Three months ended March 31, | |||||||||||||||||||||||
| 2024 | 2023 | ||||||||||||||||||||||
| Beginning balance | $ | 12,049,462 | 14,169,771 | ||||||||||||||||||||
| Loan acquisitions: | |||||||||||||||||||||||
| Federally insured student loans | — | 2,980 | |||||||||||||||||||||
| Consumer and other loans | 80,730 | 250,706 | |||||||||||||||||||||
| Total loan acquisitions | 80,730 | 253,686 | |||||||||||||||||||||
| Repayments, claims, capitalized interest, participations, and other, net | (350,496) | (410,239) | |||||||||||||||||||||
| Loans lost to external parties | (779,655) | (268,696) | |||||||||||||||||||||
| Loans sold | (200,099) | (261,902) | |||||||||||||||||||||
| Ending balance | $ | 10,799,942 | 13,482,620 | ||||||||||||||||||||
| Three months ended March 31, | |||||||||||||||||||||||
| 2024 | 2023 | ||||||||||||||||||||||
| Variable loan yield, gross | 7.99 | % | 7.12 | % | |||||||||||||||||||
| Consolidation rebate fees | (0.80) | (0.81) | |||||||||||||||||||||
| Discount accretion, net of premium and deferred origination costs amortization | 0.09 | 0.05 | |||||||||||||||||||||
| Variable loan yield, net | 7.28 | 6.36 | |||||||||||||||||||||
| Loan cost of funds - interest expense | (6.50) | (5.53) | |||||||||||||||||||||
| Loan cost of funds - derivative settlements (a) (b) | 0.01 | 0.03 | |||||||||||||||||||||
| Variable loan spread | 0.79 | 0.86 | |||||||||||||||||||||
| Fixed rate floor income, gross | 0.01 | 0.03 | |||||||||||||||||||||
| Fixed rate floor income - derivative settlements (a) (c) | 0.04 | 0.68 | |||||||||||||||||||||
| Fixed rate floor income, net of settlements on derivatives | 0.05 | 0.71 | |||||||||||||||||||||
| Core loan spread | 0.84 | % | 1.57 | % | |||||||||||||||||||
| Average balance of AGM's loans | $ | 11,561,504 | 13,991,241 | ||||||||||||||||||||
| Average balance of AGM's debt outstanding | 11,387,400 | 13,364,876 | |||||||||||||||||||||
| Three months ended March 31, | |||||||||||||||||||||||
| 2024 | 2023 | ||||||||||||||||||||||
| Core loan spread | 0.84 | % | 1.57 | % | |||||||||||||||||||
| Derivative settlements (1:3 basis swaps) | (0.01) | (0.03) | |||||||||||||||||||||
| Derivative settlements (fixed rate floor income) | (0.04) | (0.68) | |||||||||||||||||||||
| Loan spread | 0.79 | % | 0.86 | % | |||||||||||||||||||
| Three months ended March 31, | |||||||||||||||||||||||
| 2024 | 2023 | ||||||||||||||||||||||
| Fixed rate floor income, gross | $ | 180 | 1,110 | ||||||||||||||||||||
| Derivative settlements (a) | 1,190 | 22,478 | |||||||||||||||||||||
| Fixed rate floor income, net | $ | 1,370 | 23,588 | ||||||||||||||||||||
| Fixed rate floor income contribution to spread, net | 0.05 | % | 0.71 | % | |||||||||||||||||||
| Three months ended March 31, | |||||||||||||||||||||||||||||
| 2024 | 2023 | Additional information | |||||||||||||||||||||||||||
| Net interest income after provision for loan losses | $ | 34,003 | 13,663 | See table below for additional analysis. | |||||||||||||||||||||||||
| Other income, net | 4,983 | 2,845 | Represents primarily borrower late fees, income from providing administration activities for third parties, and income/losses from AGM's investment in joint ventures. | ||||||||||||||||||||||||||
| (Loss) gain on sale of loans, net | (41) | 11,812 | The Company recognized a loss and net gains from selling portfolios of loans in 2024 and 2023, respectively. For additional information, see note 2 of the notes to consolidated financial statements included under Part I, Item 1 of this report. | ||||||||||||||||||||||||||
| Derivative settlements, net | 1,555 | 23,337 | The Company maintains an overall risk management strategy that incorporates the use of derivative instruments to reduce the economic effect of interest rate volatility. Derivative settlements for each applicable period should be evaluated with the Company's net interest income as reflected in the table below. The majority of derivative settlements received in the periods presented was from the Company's derivative portfolio used to hedge loans earning fixed rate floor income. The decrease in net derivative settlements received by the Company was due to the termination of the floor income interest rate swaps in March 2023. See above under "Loan Spread Analysis" for further information. | ||||||||||||||||||||||||||
| Derivative market value adjustments, net | 5,706 | (37,411) | Includes the realized and unrealized gains and losses that are caused by changes in fair values of derivatives which do not qualify for "hedge treatment" under GAAP. The majority of the derivative market value adjustments during the periods presented related to the changes in fair value of the Company's floor income interest rate swaps. Such changes reflect that a decrease in the forward yield curve during a reporting period results in a decrease in the fair value of the Company's floor income interest rate swaps, and an increase in the forward yield curve during a reporting period results in an increase in the fair value of such swaps. On March 15, 2023, AGM terminated its portfolio of floor income interest rate swaps to minimize the Company's exposure to market volatility and increase liquidity. As such, the Company expects the derivative market value adjustments in future periods will be less substantial. See above under "Loan Spread Analysis" for further information. | ||||||||||||||||||||||||||
| Total other income, net | 12,203 | 583 | |||||||||||||||||||||||||||
| Salaries and benefits | 1,195 | 755 | Increase was due to additional headcount as the Company actively expands into new asset loan classes. | ||||||||||||||||||||||||||
| Other expenses | 3,418 | 5,016 | Represents primarily servicing fees paid to third parties. Decrease in servicing fees was due to the amortization of the FFELP student loan portfolio. | ||||||||||||||||||||||||||
| Intersegment expenses | 7,850 | 8,696 | Represents fees paid to LSS for the servicing of the majority of AGM’s loans. These amounts exceed the actual cost of servicing the loans. Intersegment expenses also includes costs for certain corporate activities and services that are allocated to each operating segment based on estimated use of such activities and services. | ||||||||||||||||||||||||||
| Total operating expenses | 12,463 | 14,467 | Total operating expenses were 43 basis points and 41 basis points of the average balance of loans for the three months ended March 31, 2024 and 2023, respectively. The increase in operating expenses as a percent of the average balance of loans was due to an increase in costs as the Company actively expands into new asset loan classes. | ||||||||||||||||||||||||||
| Income (loss) before income taxes | 33,743 | (221) | |||||||||||||||||||||||||||
| Income tax (expense) benefit | (8,099) | 53 | Represents income tax expense at an effective tax rate of 24%. | ||||||||||||||||||||||||||
| Net income (loss) | $ | 25,644 | (168) | ||||||||||||||||||||||||||
| Additional information: | |||||||||||||||||||||||||||||
| GAAP net income (loss) | $ | 25,644 | (168) | See "Overview - GAAP Net Income and Non-GAAP Net Income, Excluding Adjustments" above for additional information about non-GAAP net income, excluding derivative market value adjustments. The decrease in non-GAAP net income, excluding derivative market value adjustments was due to (i) a decrease in the average balance of loans; (ii) a decrease in core loan spread; and (iii) the net gain on sale of loans in 2023. These changes were partially offset by (i) a decrease in provision expense and (ii) an increase in investment interest income on the Company's partial ownership in loan securitizations that are accounted for as held-to-maturity beneficial interest investments. | |||||||||||||||||||||||||
| Derivative market value adjustments, net | (5,706) | 37,411 | |||||||||||||||||||||||||||
| Tax effect | 1,369 | (8,979) | |||||||||||||||||||||||||||
| Non-GAAP net income, excluding derivative market value adjustments | $ | 21,307 | 28,264 | ||||||||||||||||||||||||||
| Three months ended March 31, | |||||||||||||||||||||||||||||||||||||||||||||||||||||||||||||||||||||||||||||||||||||||
| 2023 | 2022 | Additional information | 2024 | 2023 | Additional information | ||||||||||||||||||||||||||||||||||||||||||||||||||||||||||||||||||||||||||||||||||
| Variable interest income, gross | Variable interest income, gross | $ | 246,594 | 115,753 | Increase in 2023 compared with 2022 was due to an increase in the gross yield earned on loans, partially offset by a decrease in the average balance of loans. | Variable interest income, gross | $ | 229,817 | 246,594 | 246,594 | Decrease was due to a decrease in the average balance of loans partially offset by an increase in the gross yield earned on loans. | Decrease was due to a decrease in the average balance of loans partially offset by an increase in the gross yield earned on loans. | |||||||||||||||||||||||||||||||||||||||||||||||||||||||||||||||||||||||||||
| Consolidation rebate fees | Consolidation rebate fees | (28,399) | (36,771) | Decrease in 2023 compared with 2022 was due to a decrease in the average consolidation loan balance. | Consolidation rebate fees | (23,057) | (28,399) | (28,399) | Decrease was due to a decrease in the average consolidation loan balance. | Decrease was due to a decrease in the average consolidation loan balance. | |||||||||||||||||||||||||||||||||||||||||||||||||||||||||||||||||||||||||||||
| Discount accretion, net of premium and deferred origination costs amortization | Discount accretion, net of premium and deferred origination costs amortization | 1,607 | 1,459 | Net discount accretion is due to the Company's purchases of loans at a net discount over the last several years. | Discount accretion, net of premium and deferred origination costs amortization | 2,688 | 1,607 | 1,607 | Net discount accretion is due to the Company's purchases of loans at a net discount over the last several years. | Net discount accretion is due to the Company's purchases of loans at a net discount over the last several years. | |||||||||||||||||||||||||||||||||||||||||||||||||||||||||||||||||||||||||||||
| Variable interest income, net | Variable interest income, net | 219,802 | 80,441 | ||||||||||||||||||||||||||||||||||||||||||||||||||||||||||||||||||||||||||||||||||||
| Interest on bonds and notes payable | Interest on bonds and notes payable | (182,063) | (45,209) | Increase in 2023 compared with 2022 was due to an increase in cost of funds, partially offset by a decrease in the average balance of debt outstanding. | |||||||||||||||||||||||||||||||||||||||||||||||||||||||||||||||||||||||||||||||||||
| Interest on bonds and notes payable | |||||||||||||||||||||||||||||||||||||||||||||||||||||||||||||||||||||||||||||||||||||||
| Interest on bonds and notes payable | (184,145) | (182,063) | Increase was due to an increase in cost of funds, partially offset by a decrease in the average balance of debt outstanding. | ||||||||||||||||||||||||||||||||||||||||||||||||||||||||||||||||||||||||||||||||||||
| Derivative settlements, net (a) | Derivative settlements, net (a) | 859 | 396 | Derivative settlements include the net settlements received related to the Company’s 1:3 basis swaps. | Derivative settlements, net (a) | 365 | 859 | 859 | Represents net derivative settlements received related to the Company’s 1:3 basis swaps. | Represents net derivative settlements received related to the Company’s 1:3 basis swaps. | |||||||||||||||||||||||||||||||||||||||||||||||||||||||||||||||||||||||||||||
| Variable loan interest margin, net of settlements on derivatives | Variable loan interest margin, net of settlements on derivatives | 38,598 | 35,628 | ||||||||||||||||||||||||||||||||||||||||||||||||||||||||||||||||||||||||||||||||||||
| Fixed rate floor income, gross | |||||||||||||||||||||||||||||||||||||||||||||||||||||||||||||||||||||||||||||||||||||||
| Fixed rate floor income, gross | |||||||||||||||||||||||||||||||||||||||||||||||||||||||||||||||||||||||||||||||||||||||
| Fixed rate floor income, gross | Fixed rate floor income, gross | 1,110 | 28,993 | Decrease in 2023 compared with 2022 was due to higher interest rates. | 180 | 1,110 | 1,110 | Decrease was due to higher interest rates. | Decrease was due to higher interest rates. | ||||||||||||||||||||||||||||||||||||||||||||||||||||||||||||||||||||||||||||||
| Derivative settlements, net (a) | Derivative settlements, net (a) | 22,478 | (3,205) | Derivative settlements include the settlements received (paid) related to the Company's floor income interest rate swaps. The increase in net derivative settlements received by the Company during 2023, compared with net derivative settlements paid during 2022, was due to an increase in interest rates, partially offset by a decrease in the notional amount of derivatives outstanding. The entire portfolio of floor income interest rate swaps was terminated on March 15, 2023 to minimize the Company's exposure to market volatility. As such, there will be no derivative settlements received on these derivatives in future periods. | Derivative settlements, net (a) | 1,190 | 22,478 | 22,478 | Represents net derivative settlements received related to the Company's floor income interest rate swaps. The decrease in net derivative settlements received by the Company was due to the termination of the floor income interest rate swaps in March 2023. See above under "Loan Spread Analysis" for further information. | Represents net derivative settlements received related to the Company's floor income interest rate swaps. The decrease in net derivative settlements received by the Company was due to the termination of the floor income interest rate swaps in March 2023. See above under "Loan Spread Analysis" for further information. | |||||||||||||||||||||||||||||||||||||||||||||||||||||||||||||||||||||||||||||
| Fixed rate floor income, net of settlements on derivatives | Fixed rate floor income, net of settlements on derivatives | 23,588 | 25,788 | ||||||||||||||||||||||||||||||||||||||||||||||||||||||||||||||||||||||||||||||||||||
| Core loan interest income (a) | Core loan interest income (a) | 62,186 | 61,416 | ||||||||||||||||||||||||||||||||||||||||||||||||||||||||||||||||||||||||||||||||||||
| Core loan interest income (a) | |||||||||||||||||||||||||||||||||||||||||||||||||||||||||||||||||||||||||||||||||||||||
| Core loan interest income (a) | |||||||||||||||||||||||||||||||||||||||||||||||||||||||||||||||||||||||||||||||||||||||
| Investment interest | |||||||||||||||||||||||||||||||||||||||||||||||||||||||||||||||||||||||||||||||||||||||
| Investment interest | |||||||||||||||||||||||||||||||||||||||||||||||||||||||||||||||||||||||||||||||||||||||
| Investment interest | Investment interest | 13,807 | 9,164 | Increase in 2023 compared with 2022 was due to an increase of interest earned on restricted cash due to higher rates. | 21,835 | 13,807 | 13,807 | Increase was due to an increase in the Company's partial ownership in loan securitizations that are accounted for as held-to-maturity beneficial interest investments. | Increase was due to an increase in the Company's partial ownership in loan securitizations that are accounted for as held-to-maturity beneficial interest investments. | ||||||||||||||||||||||||||||||||||||||||||||||||||||||||||||||||||||||||||||||
| Intercompany interest | Intercompany interest | (7,135) | (794) | Increase in 2023 compared with 2022 was due to an increase in the balance of borrowings and higher rates. | |||||||||||||||||||||||||||||||||||||||||||||||||||||||||||||||||||||||||||||||||||
| (Provision) negative provision for loan losses - federally insured loans | (2,411) | 2,748 | The Company has recognized provision for loan losses during the three months ended March 31, 2023 due to management's estimate of declining economic conditions, as well as establishing an initial allowance for loans acquired during the period. For additional information, see note 2 of the notes to consolidated financial statements included under Part I, Item 1 of this report. | ||||||||||||||||||||||||||||||||||||||||||||||||||||||||||||||||||||||||||||||||||||
| (Provision) negative provision for loan losses - private education loans | (240) | 400 | |||||||||||||||||||||||||||||||||||||||||||||||||||||||||||||||||||||||||||||||||||||
| (Provision) for loan losses - consumer and other loans | (29,207) | (2,284) | |||||||||||||||||||||||||||||||||||||||||||||||||||||||||||||||||||||||||||||||||||||
| Negative provision (provision) for loan losses - federally insured loans | |||||||||||||||||||||||||||||||||||||||||||||||||||||||||||||||||||||||||||||||||||||||
| Negative provision (provision) for loan losses - federally insured loans | |||||||||||||||||||||||||||||||||||||||||||||||||||||||||||||||||||||||||||||||||||||||
| Negative provision (provision) for loan losses - federally insured loans | 1,870 | (2,411) | See note 2 of the notes to consolidated financial statements included under Part I, Item 1 of this report for factors impacting provision for loan losses for the periods presented. | ||||||||||||||||||||||||||||||||||||||||||||||||||||||||||||||||||||||||||||||||||||
| Negative provision (provision) for loan losses - private education loans | |||||||||||||||||||||||||||||||||||||||||||||||||||||||||||||||||||||||||||||||||||||||
| Provision for loan losses - consumer and other loans | |||||||||||||||||||||||||||||||||||||||||||||||||||||||||||||||||||||||||||||||||||||||
| Provision for loan losses - consumer and other loans | |||||||||||||||||||||||||||||||||||||||||||||||||||||||||||||||||||||||||||||||||||||||
| Provision for loan losses - consumer and other loans | |||||||||||||||||||||||||||||||||||||||||||||||||||||||||||||||||||||||||||||||||||||||
| Net interest income after provision for loan losses (net of settlements on derivatives) (a) | Net interest income after provision for loan losses (net of settlements on derivatives) (a) | $ | 37,000 | 70,650 | Decrease in 2023 compared with 2022 was due to (i) a decrease in the average balance of loans; and (ii) an increase in provision for loan losses. These items were partially offset by (i) an increase in core loan spread; and (ii) an increase in investment interest income. | ||||||||||||||||||||||||||||||||||||||||||||||||||||||||||||||||||||||||||||||||||
| Net interest income after provision for loan losses (net of settlements on derivatives) (a) | |||||||||||||||||||||||||||||||||||||||||||||||||||||||||||||||||||||||||||||||||||||||
| Net interest income after provision for loan losses (net of settlements on derivatives) (a) | |||||||||||||||||||||||||||||||||||||||||||||||||||||||||||||||||||||||||||||||||||||||
| Three months ended March 31, | |||||||||||||||||||||||
| 2024 | 2023 | ||||||||||||||||||||||
| Beginning balance | $ | 432,872 | 419,795 | ||||||||||||||||||||
| Loan acquisitions and originations: | |||||||||||||||||||||||
| Private education loans | 16,715 | 14,226 | |||||||||||||||||||||
| Consumer and other loans | 56,847 | 19,632 | |||||||||||||||||||||
| Total loan acquisitions and originations | 73,562 | 33,858 | |||||||||||||||||||||
| Repayments | (22,711) | (14,529) | |||||||||||||||||||||
| Loans sold to AGM | — | (117) | |||||||||||||||||||||
| Ending balance | $ | 483,723 | 439,007 | ||||||||||||||||||||
| Three months ended March 31, | |||||||||||||||||||||||
| 2023 | 2022 | ||||||||||||||||||||||
| Beginning balance | $ | 419,795 | 257,901 | ||||||||||||||||||||
| Loan originations: | |||||||||||||||||||||||
| Private education loans | 14,226 | 130,342 | |||||||||||||||||||||
| Consumer and other loans | 19,632 | — | |||||||||||||||||||||
| Total loan originations | 33,858 | 130,342 | |||||||||||||||||||||
| Repayments | (14,529) | (18,394) | |||||||||||||||||||||
| Sales to AGM | (117) | (1,592) | |||||||||||||||||||||
| Ending balance | $ | 439,007 | 368,257 | ||||||||||||||||||||
| Three months ended March 31, (a) | |||||||||||||||||||||||||||||||||||||||||||||||
| 2023 | 2022 | ||||||||||||||||||||||||||||||||||||||||||||||
| Balance | Rate | Balance | Rate | ||||||||||||||||||||||||||||||||||||||||||||
| Average assets | |||||||||||||||||||||||||||||||||||||||||||||||
| Federally insured student loans | $ | 64,655 | 5.93 | % | $ | 85,266 | 1.42 | % | |||||||||||||||||||||||||||||||||||||||
| Private education loans | 355,698 | 3.61 | 228,934 | 2.91 | |||||||||||||||||||||||||||||||||||||||||||
| Consumer and other loans | 7,308 | 12.30 | — | — | |||||||||||||||||||||||||||||||||||||||||||
| Cash and investments | 540,513 | 5.95 | 265,101 | 1.66 | |||||||||||||||||||||||||||||||||||||||||||
| Total interest-earning assets | 968,174 | 5.14 | % | 579,301 | 2.12 | % | |||||||||||||||||||||||||||||||||||||||||
| Non-interest-earning assets | 9,323 | 15,275 | |||||||||||||||||||||||||||||||||||||||||||||
| Total assets | $ | 977,497 | $ | 594,576 | |||||||||||||||||||||||||||||||||||||||||||
| Average liabilities and equity | |||||||||||||||||||||||||||||||||||||||||||||||
| Brokered deposits | $ | 205,411 | 1.39 | % | $ | 144,527 | 1.20 | % | |||||||||||||||||||||||||||||||||||||||
| Intercompany deposits | 187,872 | 4.96 | 70,576 | 0.20 | |||||||||||||||||||||||||||||||||||||||||||
| Retail and other deposits | 452,008 | 3.78 | 269,027 | 0.59 | |||||||||||||||||||||||||||||||||||||||||||
| Total interest-bearing liabilities | 845,291 | 3.46 | % | 484,130 | 0.72 | % | |||||||||||||||||||||||||||||||||||||||||
| Non-interest-bearing liabilities | 5,608 | 6,427 | |||||||||||||||||||||||||||||||||||||||||||||
| Equity | 126,598 | 104,019 | |||||||||||||||||||||||||||||||||||||||||||||
| Total liabilities and equity | $ | 977,497 | $ | 594,576 | |||||||||||||||||||||||||||||||||||||||||||
| Three months ended March 31, | |||||||||||||||||||||||||||||
| 2023 | 2022 | Additional information | |||||||||||||||||||||||||||
| Total interest income | $ | 12,259 | 3,030 | Represents interest earned on loans, cash, and investments. Increase in 2023 compared with 2022 was due to an increase of these balances and interest rates. | |||||||||||||||||||||||||
| Interest expense | 7,214 | 856 | Represents interest expense on deposits. Increase in 2023 compared with 2022 was due to an increase of deposits and interest rates. | ||||||||||||||||||||||||||
| Net interest income | 5,045 | 2,174 | |||||||||||||||||||||||||||
| Provision for loan losses | 2,417 | 429 | Increase in provision for loan losses was due to the mix of loans, including the mix of loans originated in 2023 compared with 2022, and management's estimate of declining economic conditions. For additional information, see note 2 of the notes to consolidated financial statements included under Part I, Item 1 of this report. | ||||||||||||||||||||||||||
| Net interest income after provision for loan losses | 2,628 | 1,745 | |||||||||||||||||||||||||||
| Other income | 210 | 1,500 | Represents primarily income and net gains from investments. | ||||||||||||||||||||||||||
| Salaries and benefits | 2,064 | 1,554 | Represents salaries and benefits of Nelnet Bank associates and third-party contract labor. Increase in 2023 compared with 2022 was due to the overall growth of Nelnet Bank activities. | ||||||||||||||||||||||||||
| Depreciation | 5 | 3 | |||||||||||||||||||||||||||
| Other expenses | 782 | 682 | |||||||||||||||||||||||||||
| Intersegment expenses | 80 | 45 | Represents primarily servicing costs paid to LSS. Certain shared service and support costs incurred by the Company to support Nelnet Bank are not and will not be reflected as part of Nelnet Bank through 2023 (when the bank’s de novo period will end). The shared service and support costs incurred by the Company related to Nelnet Bank and not reflected in the bank’s operating segment were $1.7 million and $1.3 million for the three months ended March 31, 2023 and 2022, respectively. | ||||||||||||||||||||||||||
| Total operating expenses | 2,931 | 2,284 | |||||||||||||||||||||||||||
| (Loss) income before income taxes | (93) | 961 | |||||||||||||||||||||||||||
| Income tax benefit (expense) | 35 | (223) | Represents income tax benefit (expense) at an effective tax rate of 37.4% and 23.2% for the three months ended March 31, 2023 and 2022, respectively. | ||||||||||||||||||||||||||
| Net (loss) income | $ | (58) | 738 | ||||||||||||||||||||||||||
| Three months ended March 31, | |||||||||||||||||||||||||||||
| 2024 | 2023 | Additional information | |||||||||||||||||||||||||||
| Net interest income | $ | 1,894 | 1,037 | Increase was due to higher interest rates. | |||||||||||||||||||||||||
| Loan servicing and systems revenue | 127,201 | 139,227 | See table below for additional information. | ||||||||||||||||||||||||||
| Intersegment servicing revenue | 6,886 | 7,790 | Represents revenue earned by LSS from servicing loans for AGM and Nelnet Bank. Decrease was due to the continued amortization of AGM's FFELP portfolio. FFELP intersegment servicing revenue will continue to decrease as AGM's FFELP portfolio pays off. | ||||||||||||||||||||||||||
| Other income | 710 | 608 | Represents revenue earned from providing administrative support services. | ||||||||||||||||||||||||||
| Total other income | 134,797 | 147,625 | |||||||||||||||||||||||||||
| Salaries and benefits | 76,722 | 84,560 | Decrease was due to the Company being fully staffed at the beginning of 2023 with contact center operations and support associates as the Company prepared for expiration of the federal student loan payment pause under the CARES Act. In the first half of 2023, the Company reduced staff to manage expenses due to delays in the government's student debt relief and return to repayment programs and lower pricing and reduced servicing volume for LSS's Department servicing contract. As part of these reductions, the Company recognized a restructuring charge of $2.7 million in the first quarter of 2023. | ||||||||||||||||||||||||||
| Depreciation and amortization | 5,109 | 4,513 | |||||||||||||||||||||||||||
| Other expenses | 19,538 | 13,313 | Increase was due to additional postage and communication costs due to borrowers returning to repayment on September 1, 2023. | ||||||||||||||||||||||||||
| Intersegment expenses | 19,332 | 21,057 | Represents costs for certain corporate activities and services that are allocated to each operating segment based on estimated use of such activities and services. | ||||||||||||||||||||||||||
| Total operating expenses | 120,701 | 123,443 | |||||||||||||||||||||||||||
| Income before income taxes | 15,990 | 25,219 | |||||||||||||||||||||||||||
| Income tax expense | (3,838) | (6,053) | Represents income tax expense at an effective tax rate of 24%. | ||||||||||||||||||||||||||
| Net income | $ | 12,152 | 19,166 | ||||||||||||||||||||||||||
| Before tax operating margin | 11.9 | % | 17.1 | % | Before tax operating margin represents before tax operating profitability as a percentage of revenue, and for LSS is calculated as income before income taxes divided by the total of loan servicing and systems revenue, intersegment servicing revenue, and other income. The Company uses this metric to monitor and assess the segment’s performance, manage operating costs, identify and evaluate business trends affecting the segment, and make strategic decisions, and believes that it provides additional information to facilitate an understanding of the operating performance of the segment and provides a meaningful comparison of the results of operations between periods. Before tax operating margin decreased due primarily to a decrease in loan servicing and systems revenue as described in the table below, partially offset by a decrease in salaries and benefits resulting from restructure charges incurred during the first quarter of 2023 and staff reductions in 2023. | ||||||||||||||||||||||||
| Three months ended March 31, | |||||||||||||||||||||||||||||
| 2024 | 2023 | Additional information | |||||||||||||||||||||||||||
| Government loan servicing | $ | 105,474 | 108,880 | Represents revenue from the Company's Department legacy servicing contract. Decrease was due to the reduction of the monthly fee earned per borrower on certain borrower statuses by $0.19 effective April 1, 2023 and a decrease of borrowers serviced due to the Department transferring one million of the Company's existing borrowers to another third-party servicer during the second and third quarters of 2023. These decreases were partially offset by an increase in the average revenue earned on a per borrower blended basis as a result of borrowers moving to a repayment status on September 1, 2023. | |||||||||||||||||||||||||
| Private education and consumer loan servicing | 12,620 | 12,164 | Increase was due to rate increases based on contractual consumer price index changes, partially offset by a decrease in the number of borrowers serviced. | ||||||||||||||||||||||||||
| FFELP loan servicing | 3,380 | 3,368 | Represents revenue from servicing third-party customers' FFELP portfolios. Over time, FFELP servicing revenue will decrease as third-party customers' FFELP portfolios pay off. | ||||||||||||||||||||||||||
| Software services | 4,541 | 9,697 | Represents revenue from providing remote hosted servicing software to certain Department and other servicers and providing diversified technology services. Decrease was primarily due to the transfer of all Department remote hosted borrowers to other third-party servicers throughout 2023 under the Department's legacy servicing contracts. | ||||||||||||||||||||||||||
| Outsourced services | 1,186 | 5,118 | Represents revenue from providing contact center and back office operational outsourcing services. Decrease was due to the contracts for support provided to certain Department servicers expiring in July 2023. | ||||||||||||||||||||||||||
| Loan servicing and systems revenue | $ | 127,201 | 139,227 | ||||||||||||||||||||||||||
| Three months ended March 31, | |||||||||||||||||||||||||||||
| 2024 | 2023 | Additional information | |||||||||||||||||||||||||||
| Net interest income | $ | 7,866 | 6,036 | Represents interest income on tuition funds held in custody for schools. Increase was due to higher interest rates. | |||||||||||||||||||||||||
| Education technology services and payments revenue | 143,539 | 133,603 | See table below for additional information. | ||||||||||||||||||||||||||
| Intersegment revenue | 49 | 56 | |||||||||||||||||||||||||||
| Total other income | 143,588 | 133,659 | |||||||||||||||||||||||||||
| Cost of services | 48,610 | 47,704 | See table below for additional information. | ||||||||||||||||||||||||||
| Salaries and benefits | 40,167 | 37,913 | Increase was due to annual merit pay increases and an increase in headcount to support the growth of the customer base and the investment in the development of new technologies. | ||||||||||||||||||||||||||
| Depreciation and amortization | 2,683 | 2,578 | Represents primarily amortization of intangible assets from prior business acquisitions. | ||||||||||||||||||||||||||
| Other expenses | 7,558 | 8,063 | Decrease was due to a decrease in consulting and professional services resulting from reduced outsourced work. Decrease was partially offset by an increase in technology services. | ||||||||||||||||||||||||||
| Intersegment expenses, net | 4,801 | 5,800 | Represents costs for certain corporate activities and services that are allocated to each operating segment based on estimated use of such activities and services. | ||||||||||||||||||||||||||
| Total operating expenses | 55,209 | 54,354 | |||||||||||||||||||||||||||
| Income before income taxes | 47,635 | 37,637 | |||||||||||||||||||||||||||
| Income tax expense | (11,435) | (9,066) | Represents income tax expense at an effective tax rate of 24%. | ||||||||||||||||||||||||||
| Net income | 36,200 | 28,571 | |||||||||||||||||||||||||||
| Net loss attributable to noncontrolling interests | 17 | 138 | |||||||||||||||||||||||||||
| Net income | $ | 36,217 | 28,709 | ||||||||||||||||||||||||||
| Three months ended March 31, | |||||||||||||||||||||||||||||
| 2024 | 2023 | Additional information | |||||||||||||||||||||||||||
| Tuition payment plan services | $ | 38,880 | 34,187 | Increase was due to a higher number of payment plans in the K-12 and higher education markets for both new and existing customers. | |||||||||||||||||||||||||
| Payment processing | 47,786 | 44,041 | Increase was due to increase in payment volumes for both the K-12 and higher education markets due to new customers and an increase in volume from existing customers. | ||||||||||||||||||||||||||
| Education technology services | 56,021 | 54,787 | Increase was due to an increase in revenue from the Company’s school information system software and application and enrollment services. This increase was partially offset by a decrease in FACTS learning management services revenue as a result of decrease in economic aid provided to private schools in response to the COVID 19 pandemic. Learning management instructional services revenue provided to private schools has been funded by the CARES Act and the Emergency Assistance to Non-Public Schools (EANS) programs. The EANS I program funding ended on September 30, 2023 and EANS II program funding ends on September 30, 2024. As economic aid provided to schools under the EANS programs stopped on September 30, 2023 (EANS I) and winds down (EANS II), future instructional services revenue will decrease from recent historical periods. Revenue earned under the EANS programs for the three months ended March 31, 2024 and 2023 was $10.6 million and $16.4 million, respectively. | ||||||||||||||||||||||||||
| Other | 852 | 588 | |||||||||||||||||||||||||||
| Education technology services and payments revenue | 143,539 | 133,603 | |||||||||||||||||||||||||||
| Cost of services | 48,610 | 47,704 | Represents direct costs to provide payment processing revenue and such costs decrease/increase in relationship to payment volumes. Costs to provide instructional services are also a component of this expense and decrease/increase in relationship to instructional services revenues. | ||||||||||||||||||||||||||
| Net revenue | $ | 94,929 | 85,899 | ||||||||||||||||||||||||||
| GAAP before tax operating margin | 50.2 | % | 43.8 | % | Before tax operating margin, excluding net interest income, is a non-GAAP measure of before tax operating profitability as a percentage of revenue, and for the ETSP segment is calculated as income before income taxes less net interest income divided by net revenue. The Company uses this metric to monitor and assess the segment’s performance, manage operating costs, identify and evaluate business trends affecting the segment, and make strategic decisions, and believes that it facilitates an understanding of the operating performance of the segment and provides a meaningful comparison of the results of operations between periods. Before tax operating margin, excluding net interest income, increased due to increased net revenue while maintaining a consistent cost structure. | ||||||||||||||||||||||||
| Net interest income | (8.3) | (7.0) | |||||||||||||||||||||||||||
| Non-GAAP before tax operating margin, excluding net interest income | 41.9 | % | 36.8 | % | |||||||||||||||||||||||||
| Three months ended March 31, | |||||||||||||||||||||||
| 2024 | 2023 | ||||||||||||||||||||||
| Beginning balance | $ | 12,049,462 | 14,169,771 | ||||||||||||||||||||
| Loan acquisitions: | |||||||||||||||||||||||
| Federally insured student loans | — | 2,980 | |||||||||||||||||||||
| Consumer and other loans | 80,730 | 250,706 | |||||||||||||||||||||
| Total loan acquisitions | 80,730 | 253,686 | |||||||||||||||||||||
| Repayments, claims, capitalized interest, participations, and other, net | (350,496) | (410,239) | |||||||||||||||||||||
| Loans lost to external parties | (779,655) | (268,696) | |||||||||||||||||||||
| Loans sold | (200,099) | (261,902) | |||||||||||||||||||||
| Ending balance | $ | 10,799,942 | 13,482,620 | ||||||||||||||||||||
| Three months ended March 31, | |||||||||||||||||||||||
| 2024 | 2023 | ||||||||||||||||||||||
| Variable loan yield, gross | 7.99 | % | 7.12 | % | |||||||||||||||||||
| Consolidation rebate fees | (0.80) | (0.81) | |||||||||||||||||||||
| Discount accretion, net of premium and deferred origination costs amortization | 0.09 | 0.05 | |||||||||||||||||||||
| Variable loan yield, net | 7.28 | 6.36 | |||||||||||||||||||||
| Loan cost of funds - interest expense | (6.50) | (5.53) | |||||||||||||||||||||
| Loan cost of funds - derivative settlements (a) (b) | 0.01 | 0.03 | |||||||||||||||||||||
| Variable loan spread | 0.79 | 0.86 | |||||||||||||||||||||
| Fixed rate floor income, gross | 0.01 | 0.03 | |||||||||||||||||||||
| Fixed rate floor income - derivative settlements (a) (c) | 0.04 | 0.68 | |||||||||||||||||||||
| Fixed rate floor income, net of settlements on derivatives | 0.05 | 0.71 | |||||||||||||||||||||
| Core loan spread | 0.84 | % | 1.57 | % | |||||||||||||||||||
| Average balance of AGM's loans | $ | 11,561,504 | 13,991,241 | ||||||||||||||||||||
| Average balance of AGM's debt outstanding | 11,387,400 | 13,364,876 | |||||||||||||||||||||
| Three months ended March 31, | |||||||||||||||||||||||
| 2024 | 2023 | ||||||||||||||||||||||
| Core loan spread | 0.84 | % | 1.57 | % | |||||||||||||||||||
| Derivative settlements (1:3 basis swaps) | (0.01) | (0.03) | |||||||||||||||||||||
| Derivative settlements (fixed rate floor income) | (0.04) | (0.68) | |||||||||||||||||||||
| Loan spread | 0.79 | % | 0.86 | % | |||||||||||||||||||
| Three months ended March 31, | |||||||||||||||||||||||
| 2024 | 2023 | ||||||||||||||||||||||
| Fixed rate floor income, gross | $ | 180 | 1,110 | ||||||||||||||||||||
| Derivative settlements (a) | 1,190 | 22,478 | |||||||||||||||||||||
| Fixed rate floor income, net | $ | 1,370 | 23,588 | ||||||||||||||||||||
| Fixed rate floor income contribution to spread, net | 0.05 | % | 0.71 | % | |||||||||||||||||||
| Three months ended March 31, | |||||||||||||||||||||||||||||
| 2024 | 2023 | Additional information | |||||||||||||||||||||||||||
| Net interest income after provision for loan losses | $ | 34,003 | 13,663 | See table below for additional analysis. | |||||||||||||||||||||||||
| Other income, net | 4,983 | 2,845 | Represents primarily borrower late fees, income from providing administration activities for third parties, and income/losses from AGM's investment in joint ventures. | ||||||||||||||||||||||||||
| (Loss) gain on sale of loans, net | (41) | 11,812 | The Company recognized a loss and net gains from selling portfolios of loans in 2024 and 2023, respectively. For additional information, see note 2 of the notes to consolidated financial statements included under Part I, Item 1 of this report. | ||||||||||||||||||||||||||
| Derivative settlements, net | 1,555 | 23,337 | The Company maintains an overall risk management strategy that incorporates the use of derivative instruments to reduce the economic effect of interest rate volatility. Derivative settlements for each applicable period should be evaluated with the Company's net interest income as reflected in the table below. The majority of derivative settlements received in the periods presented was from the Company's derivative portfolio used to hedge loans earning fixed rate floor income. The decrease in net derivative settlements received by the Company was due to the termination of the floor income interest rate swaps in March 2023. See above under "Loan Spread Analysis" for further information. | ||||||||||||||||||||||||||
| Derivative market value adjustments, net | 5,706 | (37,411) | Includes the realized and unrealized gains and losses that are caused by changes in fair values of derivatives which do not qualify for "hedge treatment" under GAAP. The majority of the derivative market value adjustments during the periods presented related to the changes in fair value of the Company's floor income interest rate swaps. Such changes reflect that a decrease in the forward yield curve during a reporting period results in a decrease in the fair value of the Company's floor income interest rate swaps, and an increase in the forward yield curve during a reporting period results in an increase in the fair value of such swaps. On March 15, 2023, AGM terminated its portfolio of floor income interest rate swaps to minimize the Company's exposure to market volatility and increase liquidity. As such, the Company expects the derivative market value adjustments in future periods will be less substantial. See above under "Loan Spread Analysis" for further information. | ||||||||||||||||||||||||||
| Total other income, net | 12,203 | 583 | |||||||||||||||||||||||||||
| Salaries and benefits | 1,195 | 755 | Increase was due to additional headcount as the Company actively expands into new asset loan classes. | ||||||||||||||||||||||||||
| Other expenses | 3,418 | 5,016 | Represents primarily servicing fees paid to third parties. Decrease in servicing fees was due to the amortization of the FFELP student loan portfolio. | ||||||||||||||||||||||||||
| Intersegment expenses | 7,850 | 8,696 | Represents fees paid to LSS for the servicing of the majority of AGM’s loans. These amounts exceed the actual cost of servicing the loans. Intersegment expenses also includes costs for certain corporate activities and services that are allocated to each operating segment based on estimated use of such activities and services. | ||||||||||||||||||||||||||
| Total operating expenses | 12,463 | 14,467 | Total operating expenses were 43 basis points and 41 basis points of the average balance of loans for the three months ended March 31, 2024 and 2023, respectively. The increase in operating expenses as a percent of the average balance of loans was due to an increase in costs as the Company actively expands into new asset loan classes. | ||||||||||||||||||||||||||
| Income (loss) before income taxes | 33,743 | (221) | |||||||||||||||||||||||||||
| Income tax (expense) benefit | (8,099) | 53 | Represents income tax expense at an effective tax rate of 24%. | ||||||||||||||||||||||||||
| Net income (loss) | $ | 25,644 | (168) | ||||||||||||||||||||||||||
| Additional information: | |||||||||||||||||||||||||||||
| GAAP net income (loss) | $ | 25,644 | (168) | See "Overview - GAAP Net Income and Non-GAAP Net Income, Excluding Adjustments" above for additional information about non-GAAP net income, excluding derivative market value adjustments. The decrease in non-GAAP net income, excluding derivative market value adjustments was due to (i) a decrease in the average balance of loans; (ii) a decrease in core loan spread; and (iii) the net gain on sale of loans in 2023. These changes were partially offset by (i) a decrease in provision expense and (ii) an increase in investment interest income on the Company's partial ownership in loan securitizations that are accounted for as held-to-maturity beneficial interest investments. | |||||||||||||||||||||||||
| Derivative market value adjustments, net | (5,706) | 37,411 | |||||||||||||||||||||||||||
| Tax effect | 1,369 | (8,979) | |||||||||||||||||||||||||||
| Non-GAAP net income, excluding derivative market value adjustments | $ | 21,307 | 28,264 | ||||||||||||||||||||||||||
| Three months ended March 31, | |||||||||||||||||||||||||||||
| 2024 | 2023 | Additional information | |||||||||||||||||||||||||||
| Variable interest income, gross | $ | 229,817 | 246,594 | Decrease was due to a decrease in the average balance of loans partially offset by an increase in the gross yield earned on loans. | |||||||||||||||||||||||||
| Consolidation rebate fees | (23,057) | (28,399) | Decrease was due to a decrease in the average consolidation loan balance. | ||||||||||||||||||||||||||
| Discount accretion, net of premium and deferred origination costs amortization | 2,688 | 1,607 | Net discount accretion is due to the Company's purchases of loans at a net discount over the last several years. | ||||||||||||||||||||||||||
| Variable interest income, net | 209,448 | 219,802 | |||||||||||||||||||||||||||
| Interest on bonds and notes payable | (184,145) | (182,063) | Increase was due to an increase in cost of funds, partially offset by a decrease in the average balance of debt outstanding. | ||||||||||||||||||||||||||
| Derivative settlements, net (a) | 365 | 859 | Represents net derivative settlements received related to the Company’s 1:3 basis swaps. | ||||||||||||||||||||||||||
| Variable loan interest margin, net of settlements on derivatives | 25,668 | 38,598 | |||||||||||||||||||||||||||
| Fixed rate floor income, gross | 180 | 1,110 | Decrease was due to higher interest rates. | ||||||||||||||||||||||||||
| Derivative settlements, net (a) | 1,190 | 22,478 | Represents net derivative settlements received related to the Company's floor income interest rate swaps. The decrease in net derivative settlements received by the Company was due to the termination of the floor income interest rate swaps in March 2023. See above under "Loan Spread Analysis" for further information. | ||||||||||||||||||||||||||
| Fixed rate floor income, net of settlements on derivatives | 1,370 | 23,588 | |||||||||||||||||||||||||||
| Core loan interest income (a) | 27,038 | 62,186 | |||||||||||||||||||||||||||
| Investment interest | 21,835 | 13,807 | Increase was due to an increase in the Company's partial ownership in loan securitizations that are accounted for as held-to-maturity beneficial interest investments. | ||||||||||||||||||||||||||
| Intercompany interest | (6,760) | (7,135) | |||||||||||||||||||||||||||
| Negative provision (provision) for loan losses - federally insured loans | 1,870 | (2,411) | See note 2 of the notes to consolidated financial statements included under Part I, Item 1 of this report for factors impacting provision for loan losses for the periods presented. | ||||||||||||||||||||||||||
| Negative provision (provision) for loan losses - private education loans | 265 | (240) | |||||||||||||||||||||||||||
| Provision for loan losses - consumer and other loans | (8,690) | (29,207) | |||||||||||||||||||||||||||
| Net interest income after provision for loan losses (net of settlements on derivatives) (a) | $ | 35,558 | 37,000 | ||||||||||||||||||||||||||
| Three months ended March 31, | |||||||||||||||||||||||
| 2024 | 2023 | ||||||||||||||||||||||
| Beginning balance | $ | 432,872 | 419,795 | ||||||||||||||||||||
| Loan acquisitions and originations: | |||||||||||||||||||||||
| Private education loans | 16,715 | 14,226 | |||||||||||||||||||||
| Consumer and other loans | 56,847 | 19,632 | |||||||||||||||||||||
| Total loan acquisitions and originations | 73,562 | 33,858 | |||||||||||||||||||||
| Repayments | (22,711) | (14,529) | |||||||||||||||||||||
| Loans sold to AGM | — | (117) | |||||||||||||||||||||
| Ending balance | $ | 483,723 | 439,007 | ||||||||||||||||||||
| Nelnet Renewable Energy (c) | |||||||||||||||||||||||||||||||||||||||||||||||||||||||||||
| Shared services (a) | WRCM (b) | Tax equity investments / syndication / administration | GRNE Solar | ALLO investment (d) | Real estate investments (e) | Venture capital investments (f) | Interest income/expense, net (g) | Other | Total | ||||||||||||||||||||||||||||||||||||||||||||||||||
| Three months ended March 31, 2023 | |||||||||||||||||||||||||||||||||||||||||||||||||||||||||||
| Interest income | $ | — | 2 | — | 41 | — | 141 | 670 | 20,237 | 108 | 21,199 | ||||||||||||||||||||||||||||||||||||||||||||||||
| Interest expense | — | — | — | (273) | — | — | — | (11,977) | (68) | (12,318) | |||||||||||||||||||||||||||||||||||||||||||||||||
| Net interest income | — | 2 | — | (232) | — | 141 | 670 | 8,260 | 40 | 8,881 | |||||||||||||||||||||||||||||||||||||||||||||||||
| Solar construction revenue | — | — | — | 8,651 | — | — | — | — | — | 8,651 | |||||||||||||||||||||||||||||||||||||||||||||||||
| Other, net | 626 | 1,612 | (1,948) | 44 | (17,864) | 800 | 67 | (3,941) | 2,870 | (17,734) | |||||||||||||||||||||||||||||||||||||||||||||||||
| Cost to provide solar construction services | — | — | — | (8,299) | — | — | — | — | — | (8,299) | |||||||||||||||||||||||||||||||||||||||||||||||||
| Salaries and benefits | (23,384) | (56) | (1,007) | (1,196) | (30) | (81) | (177) | — | (1,488) | (27,419) | |||||||||||||||||||||||||||||||||||||||||||||||||
| Depreciation and amortization | (8,830) | — | — | (617) | — | (6) | — | — | (78) | (9,531) | |||||||||||||||||||||||||||||||||||||||||||||||||
| Other expenses | (10,566) | (81) | (821) | (948) | 12 | (16) | (165) | (2,218) | 1,192 | (13,611) | |||||||||||||||||||||||||||||||||||||||||||||||||
| Intersegment expenses, net | 29,165 | (3) | 15 | (513) | — | (95) | (10) | (97) | (675) | 27,787 | |||||||||||||||||||||||||||||||||||||||||||||||||
| Income (loss) before income taxes | (12,989) | 1,474 | (3,761) | (3,110) | (17,882) | 743 | 385 | 2,004 | 1,861 | (31,275) | |||||||||||||||||||||||||||||||||||||||||||||||||
| Income tax (expense) benefit | 3,117 | (319) | 206 | 610 | 4,292 | (180) | (92) | (481) | (372) | 6,781 | |||||||||||||||||||||||||||||||||||||||||||||||||
| Net (income) loss attributable to noncontrolling interests | — | (146) | 2,903 | 569 | — | 6 | — | — | — | 3,332 | |||||||||||||||||||||||||||||||||||||||||||||||||
| Net income (loss) | $ | (9,872) | 1,009 | (652) | (1,931) | (13,590) | 569 | 293 | 1,523 | 1,489 | (21,162) | ||||||||||||||||||||||||||||||||||||||||||||||||
| Three months ended March 31, 2022 | |||||||||||||||||||||||||||||||||||||||||||||||||||||||||||
| Interest income | $ | — | — | — | — | — | 289 | — | 3,603 | 100 | 3,992 | ||||||||||||||||||||||||||||||||||||||||||||||||
| Interest expense | — | — | — | — | — | — | — | (1,745) | (281) | (2,026) | |||||||||||||||||||||||||||||||||||||||||||||||||
| Net interest income | — | — | — | — | — | 289 | — | 1,858 | (181) | 1,966 | |||||||||||||||||||||||||||||||||||||||||||||||||
| Solar construction revenue | — | — | — | — | — | — | — | — | — | — | |||||||||||||||||||||||||||||||||||||||||||||||||
| Other, net | 689 | 1,281 | (869) | — | (11,014) | 4,472 | 4,902 | (864) | 2,528 | 1,125 | |||||||||||||||||||||||||||||||||||||||||||||||||
| Cost to provide solar construction services | — | — | — | — | — | — | — | — | — | — | |||||||||||||||||||||||||||||||||||||||||||||||||
| Salaries and benefits | (21,868) | (55) | (258) | — | (84) | (110) | (239) | — | (1,398) | (24,012) | |||||||||||||||||||||||||||||||||||||||||||||||||
| Depreciation and amortization | (9,615) | — | — | — | — | — | — | — | (69) | (9,684) | |||||||||||||||||||||||||||||||||||||||||||||||||
| Other expenses | (12,261) | (100) | (102) | — | (24) | (2) | (23) | (449) | (843) | (13,804) | |||||||||||||||||||||||||||||||||||||||||||||||||
| Intersegment expenses, net | 25,755 | (3) | (3) | — | — | (95) | — | (56) | (202) | 25,396 | |||||||||||||||||||||||||||||||||||||||||||||||||
| Income (loss) before income taxes | (17,300) | 1,123 | (1,232) | — | (11,122) | 4,554 | 4,640 | 489 | (165) | (19,013) | |||||||||||||||||||||||||||||||||||||||||||||||||
| Income tax (expense) benefit | 4,152 | (243) | (153) | — | 2,669 | (1,092) | (1,114) | (117) | 2,496 | 6,598 | |||||||||||||||||||||||||||||||||||||||||||||||||
| Net (income) loss attributable to noncontrolling interests | — | (112) | 1,869 | — | — | (6) | — | — | 10 | 1,761 | |||||||||||||||||||||||||||||||||||||||||||||||||
| Net income (loss) | $ | (13,148) | 768 | 484 | — | (8,453) | 3,456 | 3,526 | 372 | 2,341 | (10,654) | ||||||||||||||||||||||||||||||||||||||||||||||||
| Three months ended March 31, | |||||||||||||||||||||||||||||
| 2024 | 2023 | Additional information | |||||||||||||||||||||||||||
| Net interest income | $ | 1,894 | 1,037 | Increase was due to higher interest rates. | |||||||||||||||||||||||||
| Loan servicing and systems revenue | 127,201 | 139,227 | See table below for additional information. | ||||||||||||||||||||||||||
| Intersegment servicing revenue | 6,886 | 7,790 | Represents revenue earned by LSS from servicing loans for AGM and Nelnet Bank. Decrease was due to the continued amortization of AGM's FFELP portfolio. FFELP intersegment servicing revenue will continue to decrease as AGM's FFELP portfolio pays off. | ||||||||||||||||||||||||||
| Other income | 710 | 608 | Represents revenue earned from providing administrative support services. | ||||||||||||||||||||||||||
| Total other income | 134,797 | 147,625 | |||||||||||||||||||||||||||
| Salaries and benefits | 76,722 | 84,560 | Decrease was due to the Company being fully staffed at the beginning of 2023 with contact center operations and support associates as the Company prepared for expiration of the federal student loan payment pause under the CARES Act. In the first half of 2023, the Company reduced staff to manage expenses due to delays in the government's student debt relief and return to repayment programs and lower pricing and reduced servicing volume for LSS's Department servicing contract. As part of these reductions, the Company recognized a restructuring charge of $2.7 million in the first quarter of 2023. | ||||||||||||||||||||||||||
| Depreciation and amortization | 5,109 | 4,513 | |||||||||||||||||||||||||||
| Other expenses | 19,538 | 13,313 | Increase was due to additional postage and communication costs due to borrowers returning to repayment on September 1, 2023. | ||||||||||||||||||||||||||
| Intersegment expenses | 19,332 | 21,057 | Represents costs for certain corporate activities and services that are allocated to each operating segment based on estimated use of such activities and services. | ||||||||||||||||||||||||||
| Total operating expenses | 120,701 | 123,443 | |||||||||||||||||||||||||||
| Income before income taxes | 15,990 | 25,219 | |||||||||||||||||||||||||||
| Income tax expense | (3,838) | (6,053) | Represents income tax expense at an effective tax rate of 24%. | ||||||||||||||||||||||||||
| Net income | $ | 12,152 | 19,166 | ||||||||||||||||||||||||||
| Before tax operating margin | 11.9 | % | 17.1 | % | Before tax operating margin represents before tax operating profitability as a percentage of revenue, and for LSS is calculated as income before income taxes divided by the total of loan servicing and systems revenue, intersegment servicing revenue, and other income. The Company uses this metric to monitor and assess the segment’s performance, manage operating costs, identify and evaluate business trends affecting the segment, and make strategic decisions, and believes that it provides additional information to facilitate an understanding of the operating performance of the segment and provides a meaningful comparison of the results of operations between periods. Before tax operating margin decreased due primarily to a decrease in loan servicing and systems revenue as described in the table below, partially offset by a decrease in salaries and benefits resulting from restructure charges incurred during the first quarter of 2023 and staff reductions in 2023. | ||||||||||||||||||||||||
| Three months ended March 31, | |||||||||||||||||||||||||||||
| 2024 | 2023 | Additional information | |||||||||||||||||||||||||||
| Government loan servicing | $ | 105,474 | 108,880 | Represents revenue from the Company's Department legacy servicing contract. Decrease was due to the reduction of the monthly fee earned per borrower on certain borrower statuses by $0.19 effective April 1, 2023 and a decrease of borrowers serviced due to the Department transferring one million of the Company's existing borrowers to another third-party servicer during the second and third quarters of 2023. These decreases were partially offset by an increase in the average revenue earned on a per borrower blended basis as a result of borrowers moving to a repayment status on September 1, 2023. | |||||||||||||||||||||||||
| Private education and consumer loan servicing | 12,620 | 12,164 | Increase was due to rate increases based on contractual consumer price index changes, partially offset by a decrease in the number of borrowers serviced. | ||||||||||||||||||||||||||
| FFELP loan servicing | 3,380 | 3,368 | Represents revenue from servicing third-party customers' FFELP portfolios. Over time, FFELP servicing revenue will decrease as third-party customers' FFELP portfolios pay off. | ||||||||||||||||||||||||||
| Software services | 4,541 | 9,697 | Represents revenue from providing remote hosted servicing software to certain Department and other servicers and providing diversified technology services. Decrease was primarily due to the transfer of all Department remote hosted borrowers to other third-party servicers throughout 2023 under the Department's legacy servicing contracts. | ||||||||||||||||||||||||||
| Outsourced services | 1,186 | 5,118 | Represents revenue from providing contact center and back office operational outsourcing services. Decrease was due to the contracts for support provided to certain Department servicers expiring in July 2023. | ||||||||||||||||||||||||||
| Loan servicing and systems revenue | $ | 127,201 | 139,227 | ||||||||||||||||||||||||||
| Three months ended March 31, | |||||||||||||||||||||||||||||
| 2024 | 2023 | Additional information | |||||||||||||||||||||||||||
| Net interest income | $ | 7,866 | 6,036 | Represents interest income on tuition funds held in custody for schools. Increase was due to higher interest rates. | |||||||||||||||||||||||||
| Education technology services and payments revenue | 143,539 | 133,603 | See table below for additional information. | ||||||||||||||||||||||||||
| Intersegment revenue | 49 | 56 | |||||||||||||||||||||||||||
| Total other income | 143,588 | 133,659 | |||||||||||||||||||||||||||
| Cost of services | 48,610 | 47,704 | See table below for additional information. | ||||||||||||||||||||||||||
| Salaries and benefits | 40,167 | 37,913 | Increase was due to annual merit pay increases and an increase in headcount to support the growth of the customer base and the investment in the development of new technologies. | ||||||||||||||||||||||||||
| Depreciation and amortization | 2,683 | 2,578 | Represents primarily amortization of intangible assets from prior business acquisitions. | ||||||||||||||||||||||||||
| Other expenses | 7,558 | 8,063 | Decrease was due to a decrease in consulting and professional services resulting from reduced outsourced work. Decrease was partially offset by an increase in technology services. | ||||||||||||||||||||||||||
| Intersegment expenses, net | 4,801 | 5,800 | Represents costs for certain corporate activities and services that are allocated to each operating segment based on estimated use of such activities and services. | ||||||||||||||||||||||||||
| Total operating expenses | 55,209 | 54,354 | |||||||||||||||||||||||||||
| Income before income taxes | 47,635 | 37,637 | |||||||||||||||||||||||||||
| Income tax expense | (11,435) | (9,066) | Represents income tax expense at an effective tax rate of 24%. | ||||||||||||||||||||||||||
| Net income | 36,200 | 28,571 | |||||||||||||||||||||||||||
| Net loss attributable to noncontrolling interests | 17 | 138 | |||||||||||||||||||||||||||
| Net income | $ | 36,217 | 28,709 | ||||||||||||||||||||||||||
| Three months ended March 31, | |||||||||||||||||||||||||||||
| 2024 | 2023 | Additional information | |||||||||||||||||||||||||||
| Tuition payment plan services | $ | 38,880 | 34,187 | Increase was due to a higher number of payment plans in the K-12 and higher education markets for both new and existing customers. | |||||||||||||||||||||||||
| Payment processing | 47,786 | 44,041 | Increase was due to increase in payment volumes for both the K-12 and higher education markets due to new customers and an increase in volume from existing customers. | ||||||||||||||||||||||||||
| Education technology services | 56,021 | 54,787 | Increase was due to an increase in revenue from the Company’s school information system software and application and enrollment services. This increase was partially offset by a decrease in FACTS learning management services revenue as a result of decrease in economic aid provided to private schools in response to the COVID 19 pandemic. Learning management instructional services revenue provided to private schools has been funded by the CARES Act and the Emergency Assistance to Non-Public Schools (EANS) programs. The EANS I program funding ended on September 30, 2023 and EANS II program funding ends on September 30, 2024. As economic aid provided to schools under the EANS programs stopped on September 30, 2023 (EANS I) and winds down (EANS II), future instructional services revenue will decrease from recent historical periods. Revenue earned under the EANS programs for the three months ended March 31, 2024 and 2023 was $10.6 million and $16.4 million, respectively. | ||||||||||||||||||||||||||
| Other | 852 | 588 | |||||||||||||||||||||||||||
| Education technology services and payments revenue | 143,539 | 133,603 | |||||||||||||||||||||||||||
| Cost of services | 48,610 | 47,704 | Represents direct costs to provide payment processing revenue and such costs decrease/increase in relationship to payment volumes. Costs to provide instructional services are also a component of this expense and decrease/increase in relationship to instructional services revenues. | ||||||||||||||||||||||||||
| Net revenue | $ | 94,929 | 85,899 | ||||||||||||||||||||||||||
| GAAP before tax operating margin | 50.2 | % | 43.8 | % | Before tax operating margin, excluding net interest income, is a non-GAAP measure of before tax operating profitability as a percentage of revenue, and for the ETSP segment is calculated as income before income taxes less net interest income divided by net revenue. The Company uses this metric to monitor and assess the segment’s performance, manage operating costs, identify and evaluate business trends affecting the segment, and make strategic decisions, and believes that it facilitates an understanding of the operating performance of the segment and provides a meaningful comparison of the results of operations between periods. Before tax operating margin, excluding net interest income, increased due to increased net revenue while maintaining a consistent cost structure. | ||||||||||||||||||||||||
| Net interest income | (8.3) | (7.0) | |||||||||||||||||||||||||||
| Non-GAAP before tax operating margin, excluding net interest income | 41.9 | % | 36.8 | % | |||||||||||||||||||||||||
| Three months ended March 31, | |||||||||||||||||||||||
| 2024 | 2023 | ||||||||||||||||||||||
| Beginning balance | $ | 12,049,462 | 14,169,771 | ||||||||||||||||||||
| Loan acquisitions: | |||||||||||||||||||||||
| Federally insured student loans | — | 2,980 | |||||||||||||||||||||
| Consumer and other loans | 80,730 | 250,706 | |||||||||||||||||||||
| Total loan acquisitions | 80,730 | 253,686 | |||||||||||||||||||||
| Repayments, claims, capitalized interest, participations, and other, net | (350,496) | (410,239) | |||||||||||||||||||||
| Loans lost to external parties | (779,655) | (268,696) | |||||||||||||||||||||
| Loans sold | (200,099) | (261,902) | |||||||||||||||||||||
| Ending balance | $ | 10,799,942 | 13,482,620 | ||||||||||||||||||||
| Three months ended March 31, | |||||||||||||||||||||||
| 2024 | 2023 | ||||||||||||||||||||||
| Variable loan yield, gross | 7.99 | % | 7.12 | % | |||||||||||||||||||
| Consolidation rebate fees | (0.80) | (0.81) | |||||||||||||||||||||
| Discount accretion, net of premium and deferred origination costs amortization | 0.09 | 0.05 | |||||||||||||||||||||
| Variable loan yield, net | 7.28 | 6.36 | |||||||||||||||||||||
| Loan cost of funds - interest expense | (6.50) | (5.53) | |||||||||||||||||||||
| Loan cost of funds - derivative settlements (a) (b) | 0.01 | 0.03 | |||||||||||||||||||||
| Variable loan spread | 0.79 | 0.86 | |||||||||||||||||||||
| Fixed rate floor income, gross | 0.01 | 0.03 | |||||||||||||||||||||
| Fixed rate floor income - derivative settlements (a) (c) | 0.04 | 0.68 | |||||||||||||||||||||
| Fixed rate floor income, net of settlements on derivatives | 0.05 | 0.71 | |||||||||||||||||||||
| Core loan spread | 0.84 | % | 1.57 | % | |||||||||||||||||||
| Average balance of AGM's loans | $ | 11,561,504 | 13,991,241 | ||||||||||||||||||||
| Average balance of AGM's debt outstanding | 11,387,400 | 13,364,876 | |||||||||||||||||||||
| Three months ended March 31, | |||||||||||||||||||||||
| 2024 | 2023 | ||||||||||||||||||||||
| Core loan spread | 0.84 | % | 1.57 | % | |||||||||||||||||||
| Derivative settlements (1:3 basis swaps) | (0.01) | (0.03) | |||||||||||||||||||||
| Derivative settlements (fixed rate floor income) | (0.04) | (0.68) | |||||||||||||||||||||
| Loan spread | 0.79 | % | 0.86 | % | |||||||||||||||||||
| Three months ended March 31, | |||||||||||||||||||||||
| 2024 | 2023 | ||||||||||||||||||||||
| Fixed rate floor income, gross | $ | 180 | 1,110 | ||||||||||||||||||||
| Derivative settlements (a) | 1,190 | 22,478 | |||||||||||||||||||||
| Fixed rate floor income, net | $ | 1,370 | 23,588 | ||||||||||||||||||||
| Fixed rate floor income contribution to spread, net | 0.05 | % | 0.71 | % | |||||||||||||||||||
| Three months ended March 31, | |||||||||||||||||||||||||||||
| 2024 | 2023 | Additional information | |||||||||||||||||||||||||||
| Net interest income after provision for loan losses | $ | 34,003 | 13,663 | See table below for additional analysis. | |||||||||||||||||||||||||
| Other income, net | 4,983 | 2,845 | Represents primarily borrower late fees, income from providing administration activities for third parties, and income/losses from AGM's investment in joint ventures. | ||||||||||||||||||||||||||
| (Loss) gain on sale of loans, net | (41) | 11,812 | The Company recognized a loss and net gains from selling portfolios of loans in 2024 and 2023, respectively. For additional information, see note 2 of the notes to consolidated financial statements included under Part I, Item 1 of this report. | ||||||||||||||||||||||||||
| Derivative settlements, net | 1,555 | 23,337 | The Company maintains an overall risk management strategy that incorporates the use of derivative instruments to reduce the economic effect of interest rate volatility. Derivative settlements for each applicable period should be evaluated with the Company's net interest income as reflected in the table below. The majority of derivative settlements received in the periods presented was from the Company's derivative portfolio used to hedge loans earning fixed rate floor income. The decrease in net derivative settlements received by the Company was due to the termination of the floor income interest rate swaps in March 2023. See above under "Loan Spread Analysis" for further information. | ||||||||||||||||||||||||||
| Derivative market value adjustments, net | 5,706 | (37,411) | Includes the realized and unrealized gains and losses that are caused by changes in fair values of derivatives which do not qualify for "hedge treatment" under GAAP. The majority of the derivative market value adjustments during the periods presented related to the changes in fair value of the Company's floor income interest rate swaps. Such changes reflect that a decrease in the forward yield curve during a reporting period results in a decrease in the fair value of the Company's floor income interest rate swaps, and an increase in the forward yield curve during a reporting period results in an increase in the fair value of such swaps. On March 15, 2023, AGM terminated its portfolio of floor income interest rate swaps to minimize the Company's exposure to market volatility and increase liquidity. As such, the Company expects the derivative market value adjustments in future periods will be less substantial. See above under "Loan Spread Analysis" for further information. | ||||||||||||||||||||||||||
| Total other income, net | 12,203 | 583 | |||||||||||||||||||||||||||
| Salaries and benefits | 1,195 | 755 | Increase was due to additional headcount as the Company actively expands into new asset loan classes. | ||||||||||||||||||||||||||
| Other expenses | 3,418 | 5,016 | Represents primarily servicing fees paid to third parties. Decrease in servicing fees was due to the amortization of the FFELP student loan portfolio. | ||||||||||||||||||||||||||
| Intersegment expenses | 7,850 | 8,696 | Represents fees paid to LSS for the servicing of the majority of AGM’s loans. These amounts exceed the actual cost of servicing the loans. Intersegment expenses also includes costs for certain corporate activities and services that are allocated to each operating segment based on estimated use of such activities and services. | ||||||||||||||||||||||||||
| Total operating expenses | 12,463 | 14,467 | Total operating expenses were 43 basis points and 41 basis points of the average balance of loans for the three months ended March 31, 2024 and 2023, respectively. The increase in operating expenses as a percent of the average balance of loans was due to an increase in costs as the Company actively expands into new asset loan classes. | ||||||||||||||||||||||||||
| Income (loss) before income taxes | 33,743 | (221) | |||||||||||||||||||||||||||
| Income tax (expense) benefit | (8,099) | 53 | Represents income tax expense at an effective tax rate of 24%. | ||||||||||||||||||||||||||
| Net income (loss) | $ | 25,644 | (168) | ||||||||||||||||||||||||||
| Additional information: | |||||||||||||||||||||||||||||
| GAAP net income (loss) | $ | 25,644 | (168) | See "Overview - GAAP Net Income and Non-GAAP Net Income, Excluding Adjustments" above for additional information about non-GAAP net income, excluding derivative market value adjustments. The decrease in non-GAAP net income, excluding derivative market value adjustments was due to (i) a decrease in the average balance of loans; (ii) a decrease in core loan spread; and (iii) the net gain on sale of loans in 2023. These changes were partially offset by (i) a decrease in provision expense and (ii) an increase in investment interest income on the Company's partial ownership in loan securitizations that are accounted for as held-to-maturity beneficial interest investments. | |||||||||||||||||||||||||
| Derivative market value adjustments, net | (5,706) | 37,411 | |||||||||||||||||||||||||||
| Tax effect | 1,369 | (8,979) | |||||||||||||||||||||||||||
| Non-GAAP net income, excluding derivative market value adjustments | $ | 21,307 | 28,264 | ||||||||||||||||||||||||||
| Three months ended March 31, | |||||||||||||||||||||||||||||
| 2024 | 2023 | Additional information | |||||||||||||||||||||||||||
| Variable interest income, gross | $ | 229,817 | 246,594 | Decrease was due to a decrease in the average balance of loans partially offset by an increase in the gross yield earned on loans. | |||||||||||||||||||||||||
| Consolidation rebate fees | (23,057) | (28,399) | Decrease was due to a decrease in the average consolidation loan balance. | ||||||||||||||||||||||||||
| Discount accretion, net of premium and deferred origination costs amortization | 2,688 | 1,607 | Net discount accretion is due to the Company's purchases of loans at a net discount over the last several years. | ||||||||||||||||||||||||||
| Variable interest income, net | 209,448 | 219,802 | |||||||||||||||||||||||||||
| Interest on bonds and notes payable | (184,145) | (182,063) | Increase was due to an increase in cost of funds, partially offset by a decrease in the average balance of debt outstanding. | ||||||||||||||||||||||||||
| Derivative settlements, net (a) | 365 | 859 | Represents net derivative settlements received related to the Company’s 1:3 basis swaps. | ||||||||||||||||||||||||||
| Variable loan interest margin, net of settlements on derivatives | 25,668 | 38,598 | |||||||||||||||||||||||||||
| Fixed rate floor income, gross | 180 | 1,110 | Decrease was due to higher interest rates. | ||||||||||||||||||||||||||
| Derivative settlements, net (a) | 1,190 | 22,478 | Represents net derivative settlements received related to the Company's floor income interest rate swaps. The decrease in net derivative settlements received by the Company was due to the termination of the floor income interest rate swaps in March 2023. See above under "Loan Spread Analysis" for further information. | ||||||||||||||||||||||||||
| Fixed rate floor income, net of settlements on derivatives | 1,370 | 23,588 | |||||||||||||||||||||||||||
| Core loan interest income (a) | 27,038 | 62,186 | |||||||||||||||||||||||||||
| Investment interest | 21,835 | 13,807 | Increase was due to an increase in the Company's partial ownership in loan securitizations that are accounted for as held-to-maturity beneficial interest investments. | ||||||||||||||||||||||||||
| Intercompany interest | (6,760) | (7,135) | |||||||||||||||||||||||||||
| Negative provision (provision) for loan losses - federally insured loans | 1,870 | (2,411) | See note 2 of the notes to consolidated financial statements included under Part I, Item 1 of this report for factors impacting provision for loan losses for the periods presented. | ||||||||||||||||||||||||||
| Negative provision (provision) for loan losses - private education loans | 265 | (240) | |||||||||||||||||||||||||||
| Provision for loan losses - consumer and other loans | (8,690) | (29,207) | |||||||||||||||||||||||||||
| Net interest income after provision for loan losses (net of settlements on derivatives) (a) | $ | 35,558 | 37,000 | ||||||||||||||||||||||||||
| Three months ended March 31, | |||||||||||||||||||||||
| 2024 | 2023 | ||||||||||||||||||||||
| Beginning balance | $ | 432,872 | 419,795 | ||||||||||||||||||||
| Loan acquisitions and originations: | |||||||||||||||||||||||
| Private education loans | 16,715 | 14,226 | |||||||||||||||||||||
| Consumer and other loans | 56,847 | 19,632 | |||||||||||||||||||||
| Total loan acquisitions and originations | 73,562 | 33,858 | |||||||||||||||||||||
| Repayments | (22,711) | (14,529) | |||||||||||||||||||||
| Loans sold to AGM | — | (117) | |||||||||||||||||||||
| Ending balance | $ | 483,723 | 439,007 | ||||||||||||||||||||
| Three months ended March 31, (a) | |||||||||||||||||||||||||||||||||||||||||||||||
| 2024 | 2023 | ||||||||||||||||||||||||||||||||||||||||||||||
| Balance | Rate | Balance | Rate | ||||||||||||||||||||||||||||||||||||||||||||
| Average assets | |||||||||||||||||||||||||||||||||||||||||||||||
| Federally insured student loans | $ | — | — | % | $ | 64,655 | 5.93 | % | |||||||||||||||||||||||||||||||||||||||
| Private education loans | 366,858 | 4.28 | 355,698 | 3.61 | |||||||||||||||||||||||||||||||||||||||||||
| Consumer and other loans | 97,136 | 13.23 | 7,308 | 12.30 | |||||||||||||||||||||||||||||||||||||||||||
| Cash and investments | 577,947 | 6.94 | 540,513 | 5.95 | |||||||||||||||||||||||||||||||||||||||||||
| Total interest-earning assets | 1,041,941 | 6.59 | % | 968,174 | 5.14 | % | |||||||||||||||||||||||||||||||||||||||||
| Non-interest-earning assets | 12,767 | 9,323 | |||||||||||||||||||||||||||||||||||||||||||||
| Total assets | $ | 1,054,708 | $ | 977,497 | |||||||||||||||||||||||||||||||||||||||||||
| Average liabilities and equity | |||||||||||||||||||||||||||||||||||||||||||||||
| Brokered deposits | $ | 204,651 | 1.39 | % | $ | 205,411 | 1.39 | % | |||||||||||||||||||||||||||||||||||||||
| Intercompany deposits | 160,349 | 4.90 | 187,872 | 4.96 | |||||||||||||||||||||||||||||||||||||||||||
| Retail and other deposits | 544,136 | 4.90 | 452,008 | 3.78 | |||||||||||||||||||||||||||||||||||||||||||
| Total interest-bearing liabilities | 909,136 | 4.11 | % | 845,291 | 3.46 | % | |||||||||||||||||||||||||||||||||||||||||
| Non-interest-bearing liabilities | 8,477 | 5,608 | |||||||||||||||||||||||||||||||||||||||||||||
| Equity | 137,095 | 126,598 | |||||||||||||||||||||||||||||||||||||||||||||
| Total liabilities and equity | $ | 1,054,708 | $ | 977,497 | |||||||||||||||||||||||||||||||||||||||||||
| Three months ended March 31, | |||||||||||||||||||||||||||||
| 2024 | 2023 | Additional information | |||||||||||||||||||||||||||
| Total interest income | $ | 17,064 | 12,259 | Represents interest earned on loans, cash, and investments. Increase was due to an increase of these balances and interest rates. | |||||||||||||||||||||||||
| Interest expense | 9,497 | 7,214 | Represents interest expense on deposits. Increase was due to an increase of deposits and interest rates. | ||||||||||||||||||||||||||
| Net interest income | 7,567 | 5,045 | |||||||||||||||||||||||||||
| Provision for loan losses | 4,373 | 2,417 | Increase in provision for loan losses was due to the mix of loans, including the mix of loans acquired and originated in 2024 compared with 2023. For additional information, see note 2 of the notes to consolidated financial statements included under Part I, Item 1 of this report. | ||||||||||||||||||||||||||
| Net interest income after provision for loan losses | 3,194 | 2,628 | |||||||||||||||||||||||||||
| Other income | 375 | 210 | Represents primarily net gains and income from investments. | ||||||||||||||||||||||||||
| Derivative settlements, net | 202 | — | During the second and third quarter of 2023, Nelnet Bank entered into derivatives to hedge its exposure related to variable rate intercompany deposits to minimize volatility from future changes in interest rates. Nelnet Bank has designated its derivative instruments as cash flow hedges; however, because the hedged items are intercompany deposits, the derivative instruments are not eligible for hedge accounting in the consolidated financial statements. Accordingly, all changes in fair value of such derivatives are recorded through earnings and presented as "derivative market value adjustments, net" in the statements of operations. For additional information on Nelnet Bank's derivative portfolio, see note 4 of the notes to consolidated financial statements included under Part I, Item 1 of this report. | ||||||||||||||||||||||||||
| Derivative market value adjustments, net | 2,258 | — | |||||||||||||||||||||||||||
| Total other income, net | 2,835 | 210 | |||||||||||||||||||||||||||
| Salaries and benefits | 2,721 | 2,064 | Represents salaries and benefits of Nelnet Bank associates and third-party contract labor. Increase was due to the overall growth of Nelnet Bank activities. | ||||||||||||||||||||||||||
| Depreciation | 260 | 5 | |||||||||||||||||||||||||||
| Other expenses | 1,128 | 782 | Represents various expenses such as consulting and professional fees, Nelnet Bank director fees, occupancy, certain technology-related costs, insurance, and marketing. Increase was due to the overall growth of Nelnet Bank activities. | ||||||||||||||||||||||||||
| Intersegment expenses | 773 | 80 | Represents fees paid to LSS for servicing certain of Nelnet Bank's loans. These amounts exceed the actual cost of servicing the loans. Intersegment expenses also include costs for certain corporate activities and services that are allocated to each operating segment based on estimated use of such activities and services. The majority of shared service costs incurred by the Company to support Nelnet Bank were not allocated to Nelnet Bank through the bank’s de novo period which ended at the end of 2023. The shared service and support costs incurred by the Company related to Nelnet Bank and not allocated to Nelnet Bank were $1.7 million for the three months ended March 31, 2023. | ||||||||||||||||||||||||||
| Total operating expenses | 4,882 | 2,931 | |||||||||||||||||||||||||||
| Income (loss) before income taxes | 1,147 | (93) | |||||||||||||||||||||||||||
| Income tax (expense) benefit | (259) | 35 | Represents income tax expense at an effective tax rate of 22.6% and 37.4% for the three months ended March 31, 2024 and 2023, respectively. | ||||||||||||||||||||||||||
| Net income (loss) | $ | 888 | (58) | ||||||||||||||||||||||||||
| Additional information: | |||||||||||||||||||||||||||||
| Net income (loss) | $ | 888 | (58) | See "Overview - GAAP Net Income and Non-GAAP Net Income, Excluding Adjustments" above for additional details about non-GAAP net income, excluding derivative market value adjustments. | |||||||||||||||||||||||||
| Derivative market value adjustments, net | (2,258) | — | |||||||||||||||||||||||||||
| Tax effect | 542 | — | |||||||||||||||||||||||||||
| Net loss, excluding derivative market value adjustments | $ | (828) | (58) | ||||||||||||||||||||||||||
| WRCM (a) | Nelnet Insurance Services (b) | Real estate investments (c) | Investment securities (d) | Total | |||||||||||||||||||||||||
| Three months ended March 31, 2024 | |||||||||||||||||||||||||||||
| Interest income | $ | 3 | 818 | 141 | 14,654 | 15,616 | |||||||||||||||||||||||
| Interest expense | — | — | — | (2,418) | (2,418) | ||||||||||||||||||||||||
| Net interest income | 3 | 818 | 141 | 12,236 | 13,198 | ||||||||||||||||||||||||
| Other income, net | 1,477 | 13,066 | (1,794) | 192 | 12,941 | ||||||||||||||||||||||||
| Salaries and benefits | (55) | (114) | (189) | — | (358) | ||||||||||||||||||||||||
| Other expenses | (75) | (11,657) | (70) | — | (11,802) | ||||||||||||||||||||||||
| Intersegment expenses, net | (4) | (47) | (130) | (36) | (217) | ||||||||||||||||||||||||
| Income (loss) before income taxes | 1,346 | 2,066 | (2,042) | 12,392 | 13,762 | ||||||||||||||||||||||||
| Income tax (expense) benefit | (291) | (496) | 487 | (2,974) | (3,274) | ||||||||||||||||||||||||
| Net (income) loss attributable to noncontrolling interests | (135) | — | 15 | — | (120) | ||||||||||||||||||||||||
| Net income (loss) | $ | 920 | 1,570 | (1,540) | 9,418 | 10,368 | |||||||||||||||||||||||
| Three months ended March 31, 2023 | |||||||||||||||||||||||||||||
| Interest income | $ | 2 | 326 | 141 | 18,191 | 18,660 | |||||||||||||||||||||||
| Interest expense | — | — | — | (11,827) | (11,827) | ||||||||||||||||||||||||
| Net interest income | 2 | 326 | 141 | 6,364 | 6,833 | ||||||||||||||||||||||||
| Other income, net | 1,596 | 691 | 1,147 | (4,175) | (741) | ||||||||||||||||||||||||
| Salaries and benefits | (56) | (95) | (68) | — | (219) | ||||||||||||||||||||||||
| Other expenses | (81) | (469) | (16) | (1) | (567) | ||||||||||||||||||||||||
| Intersegment expenses, net | (3) | (31) | (95) | — | (129) | ||||||||||||||||||||||||
| Income (loss) before income taxes | 1,458 | 422 | 1,109 | 2,188 | 5,177 | ||||||||||||||||||||||||
| Income tax (expense) benefit | (315) | (101) | (268) | (525) | (1,209) | ||||||||||||||||||||||||
| Net (income) loss attributable to noncontrolling interests | (146) | — | 6 | — | (140) | ||||||||||||||||||||||||
| Net income (loss) | $ | 997 | 321 | 847 | 1,663 | 3,828 | |||||||||||||||||||||||
| Nelnet Renewable Energy (b) | |||||||||||||||||||||||||||||||||||||||||
| Shared services (a) | Tax equity investments / syndication / administration | GRNE Solar | ALLO investment (c) | Venture capital investments (d) | Other | Total | |||||||||||||||||||||||||||||||||||
| Three months ended March 31, 2024 | |||||||||||||||||||||||||||||||||||||||||
| Net interest income (expense) | $ | — | — | (312) | — | — | 3,451 | 3,139 | |||||||||||||||||||||||||||||||||
| Solar construction revenue | — | — | 13,726 | — | — | — | 13,726 | ||||||||||||||||||||||||||||||||||
| Other income, net | 706 | 3,067 | 42 | (8,236) | (426) | 2,853 | (1,994) | ||||||||||||||||||||||||||||||||||
| Cost to provide solar construction services | — | — | (14,229) | — | — | — | (14,229) | ||||||||||||||||||||||||||||||||||
| Salaries and benefits | (20,020) | (683) | (1,371) | — | (237) | (1,210) | (23,521) | ||||||||||||||||||||||||||||||||||
| Depreciation and amortization | (8,368) | — | (250) | — | (6) | (92) | (8,716) | ||||||||||||||||||||||||||||||||||
| Other expenses | (9,891) | (171) | (885) | (356) | (16) | (2,083) | (13,402) | ||||||||||||||||||||||||||||||||||
| Intersegment expenses, net | 27,528 | 291 | (758) | (1) | (19) | (196) | 26,845 | ||||||||||||||||||||||||||||||||||
| Income (loss) before income taxes | (10,045) | 2,504 | (4,037) | (8,593) | (704) | 2,723 | (18,152) | ||||||||||||||||||||||||||||||||||
| Income tax (expense) benefit | 2,411 | (979) | 794 | 2,062 | 169 | (672) | 3,785 | ||||||||||||||||||||||||||||||||||
| Net loss attributable to noncontrolling interests | — | 1,577 | 728 | — | — | — | 2,305 | ||||||||||||||||||||||||||||||||||
| Net income (loss) | $ | (7,634) | 3,102 | (2,515) | (6,531) | (535) | 2,051 | (12,062) | |||||||||||||||||||||||||||||||||
| Three months ended March 31, 2023 | |||||||||||||||||||||||||||||||||||||||||
| Net interest income (expense) | $ | — | — | (232) | — | — | 2,280 | 2,048 | |||||||||||||||||||||||||||||||||
| Solar construction revenue | — | — | 8,651 | — | — | — | 8,651 | ||||||||||||||||||||||||||||||||||
| Other income, net | 626 | (1,948) | 6 | (17,864) | (289) | 2,476 | (16,993) | ||||||||||||||||||||||||||||||||||
| Cost to provide solar construction services | — | — | (8,299) | — | — | — | (8,299) | ||||||||||||||||||||||||||||||||||
| Salaries and benefits | (23,384) | (870) | (1,196) | (30) | (190) | (1,530) | (27,200) | ||||||||||||||||||||||||||||||||||
| Depreciation and amortization | (8,830) | — | (617) | — | — | (84) | (9,531) | ||||||||||||||||||||||||||||||||||
| Other expenses | (10,240) | (765) | (886) | 12 | (165) | (1,000) | (13,044) | ||||||||||||||||||||||||||||||||||
| Intersegment expenses, net | 28,839 | (8) | (537) | — | (10) | (368) | 27,916 | ||||||||||||||||||||||||||||||||||
| Income (loss) before income taxes | (12,989) | (3,591) | (3,110) | (17,882) | (654) | 1,774 | (36,452) | ||||||||||||||||||||||||||||||||||
| Income tax (expense) benefit | 3,117 | 165 | 610 | 4,292 | 157 | (351) | 7,990 | ||||||||||||||||||||||||||||||||||
| Net loss attributable to noncontrolling interests | — | 2,903 | 569 | — | — | — | 3,472 | ||||||||||||||||||||||||||||||||||
| Net income (loss) | $ | (9,872) | (523) | (1,931) | (13,590) | (497) | 1,423 | (24,990) | |||||||||||||||||||||||||||||||||
| Cash and cash equivalents | $ | ||||||||
| Less: Cash and cash equivalents held at Nelnet Bank | |||||||||
| Net cash and cash equivalents | |||||||||
| Available-for-sale (AFS) debt securities (investments) - at fair value | |||||||||
| Less: AFS debt securities held at Nelnet Bank - at fair value | |||||||||
| AFS private education loan debt securities | |||||||||
| Unencumbered AFS debt securities (investments) - at fair value | |||||||||
| Unencumbered private, consumer, and other loans (Non-Nelnet Bank) - at par | |||||||||
| Unused capacity on unsecured line of credit | 495,000 | ||||||||
| Sources of liquidity as of March 31, | $ | ||||||||
| As of March 31, | |||||||||||
| Carrying amount | Final maturity | ||||||||||
| Bonds and notes issued in asset-backed securitizations | $ | 8/26/30 - 9/25/69 | |||||||||
| FFELP | |||||||||||
| $ | |||||||||||
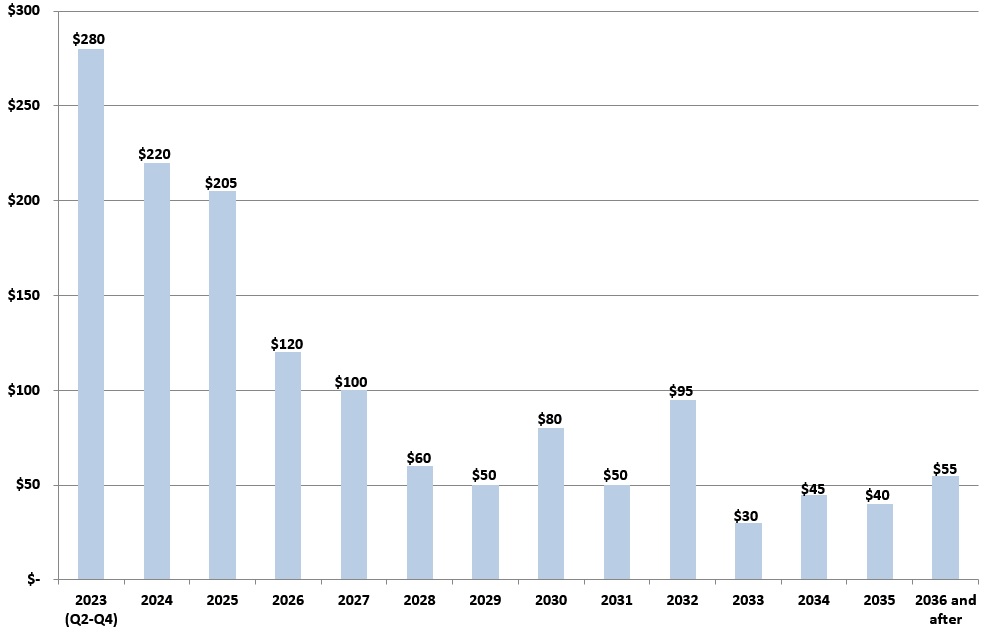
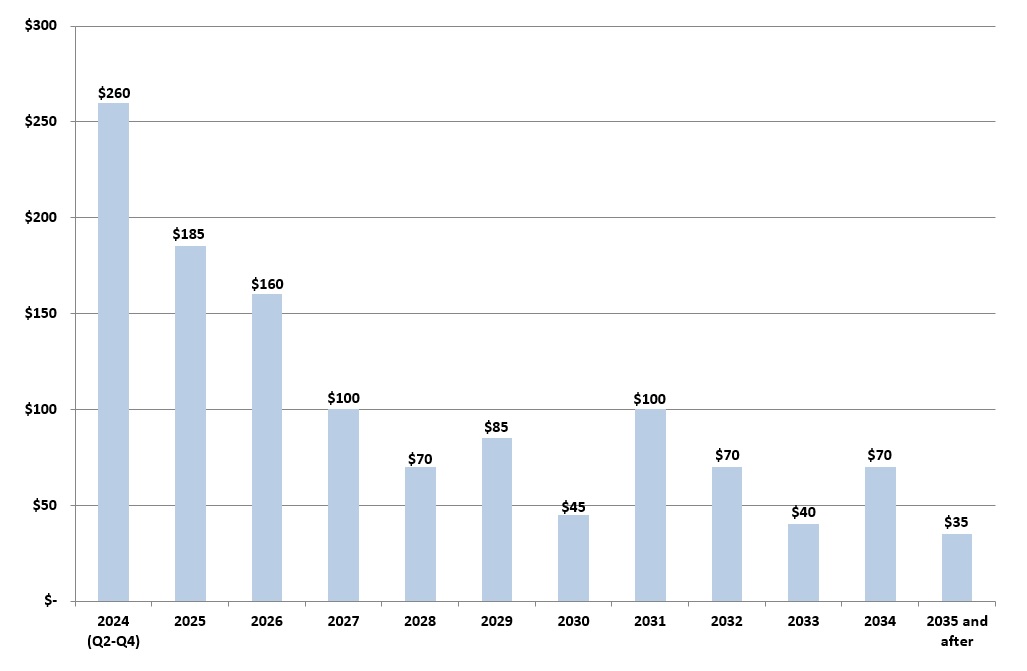
| Increase in prepayment rate | Reduction in forecasted cash flow from table above | Forecasted cash flow using increased prepayment rate | ||||||||||||
| 2x | $ | $ | ||||||||||||
| 4x | $ | $ | ||||||||||||
| 10x | $ | $ | ||||||||||||
| Total shares repurchased | Purchase price (in thousands) | Average price of shares repurchased (per share) (a) | |||||||||||||||
| Quarter ended March 31, 2024 | 396,724 | $ | 35,469 | 89.41 | |||||||||||||
| As of March 31, 2023 | As of December 31, 2022 | As of March 31, 2024 | As of December 31, 2023 | ||||||||||||||||||||||||||||||||||||||||||||||||||||||
| Dollars | Percent | Dollars | Percent | Dollars | Percent | Dollars | Percent | ||||||||||||||||||||||||||||||||||||||||||||||||||
| Fixed-rate loan assets | Fixed-rate loan assets | $ | 1,038,386 | 7.7 | % | $ | 1,339,900 | 9.5 | % | Fixed-rate loan assets | $ | 536,445 | 5.0 | 5.0 | % | $ | 510,666 | 4.2 | 4.2 | % | |||||||||||||||||||||||||||||||||||||
| Variable-rate loan assets | Variable-rate loan assets | 12,444,234 | 92.3 | 12,829,871 | 90.5 | ||||||||||||||||||||||||||||||||||||||||||||||||||||
| Total | Total | $ | 13,482,620 | 100.0 | % | $ | 14,169,771 | 100.0 | % | Total | $ | 10,799,942 | 100.0 | 100.0 | % | $ | 12,049,462 | 100.0 | 100.0 | % | |||||||||||||||||||||||||||||||||||||
| Fixed-rate debt instruments | Fixed-rate debt instruments | $ | 570,787 | 4.5 | % | $ | 617,083 | 4.5 | % | ||||||||||||||||||||||||||||||||||||||||||||||||
| Fixed-rate debt instruments | |||||||||||||||||||||||||||||||||||||||||||||||||||||||||
| Fixed-rate debt instruments | $ | 509,294 | 4.8 | % | $ | 561,557 | 4.8 | % | |||||||||||||||||||||||||||||||||||||||||||||||||
| Variable-rate debt instruments | Variable-rate debt instruments | 12,253,817 | 95.5 | 13,199,327 | 95.5 | ||||||||||||||||||||||||||||||||||||||||||||||||||||
| Total | Total | $ | 12,824,604 | 100.0 | % | $ | 13,816,410 | 100.0 | % | Total | $ | 10,539,917 | 100.0 | 100.0 | % | $ | 11,704,153 | 100.0 | 100.0 | % | |||||||||||||||||||||||||||||||||||||
| Three months ended March 31, | ||||||||||||||||||||||||||||||||||
| 2023 | 2022 | |||||||||||||||||||||||||||||||||
| Three months ended March 31, | ||||||||||||||||||||||||||||||||||
| Three months ended March 31, | ||||||||||||||||||||||||||||||||||
| Three months ended March 31, | ||||||||||||||||||||||||||||||||||
| 2024 | ||||||||||||||||||||||||||||||||||
| 2024 | ||||||||||||||||||||||||||||||||||
| 2024 | ||||||||||||||||||||||||||||||||||
| Fixed rate floor income, gross | ||||||||||||||||||||||||||||||||||
| Fixed rate floor income, gross | ||||||||||||||||||||||||||||||||||
| Fixed rate floor income, gross | Fixed rate floor income, gross | $ | 1,110 | 28,993 | ||||||||||||||||||||||||||||||
| Derivative settlements (a) | Derivative settlements (a) | 22,478 | (3,205) | |||||||||||||||||||||||||||||||
| Derivative settlements (a) | ||||||||||||||||||||||||||||||||||
| Derivative settlements (a) | ||||||||||||||||||||||||||||||||||
| Fixed rate floor income, net | Fixed rate floor income, net | $ | 23,588 | 25,788 | ||||||||||||||||||||||||||||||
| Fixed rate floor income, net | ||||||||||||||||||||||||||||||||||
| Fixed rate floor income, net | ||||||||||||||||||||||||||||||||||

| Fixed interest rate range | Fixed interest rate range | Borrower/lender weighted average yield | Estimated variable conversion rate (a) | Loan balance | Fixed interest rate range | Borrower/lender weighted average yield | Estimated variable conversion rate (a) | Loan balance | |||||||||||||||||||||||||||||||||||||||||
| 7.0 - 7.49% | 7.38% | 4.74% | $ | 14,294 | |||||||||||||||||||||||||||||||||||||||||||||
| 7.5 - 7.99% | 7.73% | 5.09% | 124,236 | ||||||||||||||||||||||||||||||||||||||||||||||
| 8.0 - 8.99% | |||||||||||||||||||||||||||||||||||||||||||||||||
| 8.0 - 8.99% | |||||||||||||||||||||||||||||||||||||||||||||||||
| 8.0 - 8.99% | 8.0 - 8.99% | 8.18% | 5.54% | 339,275 | |||||||||||||||||||||||||||||||||||||||||||||
> 9.0% | > 9.0% | 9.05% | 6.41% | 131,116 | |||||||||||||||||||||||||||||||||||||||||||||
| $ | 608,921 | ||||||||||||||||||||||||||||||||||||||||||||||||
| $ | |||||||||||||||||||||||||||||||||||||||||||||||||
| Index | Index | Frequency of variable resets | Assets | Funding of student loan assets | Index | Frequency of variable resets | Assets | Funding of student loan assets | |||||||||||||||||||||||||||||||||||||||||
| 1 month LIBOR (a) | Daily | $ | 12,099,443 | — | |||||||||||||||||||||||||||||||||||||||||||||
| 3 month H15 financial commercial paper | Daily | 432,655 | — | ||||||||||||||||||||||||||||||||||||||||||||||
| 3 month Treasury bill | Daily | 399,461 | — | ||||||||||||||||||||||||||||||||||||||||||||||
| 1 month LIBOR | Monthly | — | 7,612,093 | ||||||||||||||||||||||||||||||||||||||||||||||
| 3 month LIBOR (a) | Quarterly | — | 3,431,852 | ||||||||||||||||||||||||||||||||||||||||||||||
| 30-day average SOFR (a) | |||||||||||||||||||||||||||||||||||||||||||||||||
| 3-month H15 financial commercial paper | |||||||||||||||||||||||||||||||||||||||||||||||||
| 3-month Treasury bill | |||||||||||||||||||||||||||||||||||||||||||||||||
| 30-day average SOFR / 1-month CME Term SOFR | |||||||||||||||||||||||||||||||||||||||||||||||||
| 90-day average SOFR / 3-month CME Term SOFR (a) | |||||||||||||||||||||||||||||||||||||||||||||||||
| Asset-backed commercial paper (b) | Asset-backed commercial paper (b) | Varies | — | 919,337 | |||||||||||||||||||||||||||||||||||||||||||||
| Fixed rate | Fixed rate | — | — | 548,642 | |||||||||||||||||||||||||||||||||||||||||||||
| Auction-rate (c) | Auction-rate (c) | Varies | — | 142,385 | |||||||||||||||||||||||||||||||||||||||||||||
| Other (d) | Other (d) | — | 1,315,962 | 1,593,212 | |||||||||||||||||||||||||||||||||||||||||||||
| $ | 14,247,521 | 14,247,521 | |||||||||||||||||||||||||||||||||||||||||||||||
| Maturity | Notional amount (i) | |||||||
| 2024 | $ | 1,750,000 | ||||||
| 2026 | 1,150,000 | |||||||
| 2027 | 250,000 | |||||||
| $ | 3,150,000 | |||||||
| Interest rates | Interest rates | |||||||||||||||||||||||||||||||||||||||||||||||||||||||||||||||||||||||||||||||||||||||||||||||||||||||||||||||||||||||||||||||||
| Change from increase of 100 basis points | Change from increase of 100 basis points | Change from increase of 300 basis points | Change from decrease of 100 basis points | Change from decrease of 300 basis points | ||||||||||||||||||||||||||||||||||||||||||||||||||||||||||||||||||||||||||||||||||||||||||||||||||||||||||||||||||||||||||||||
| Change from increase of 100 basis points | Change from increase of 300 basis points | Change from decrease of 100 basis points | Change from decrease of 300 basis points | Dollars | Percent | Dollars | Percent | Dollars | Percent | Dollars | Percent | |||||||||||||||||||||||||||||||||||||||||||||||||||||||||||||||||||||||||||||||||||||||||||||||||||||||||||||||||||||||
| Three months ended March 31, 2024 | ||||||||||||||||||||||||||||||||||||||||||||||||||||||||||||||||||||||||||||||||||||||||||||||||||||||||||||||||||||||||||||||||||
| Effect on earnings: | Effect on earnings: | |||||||||||||||||||||||||||||||||||||||||||||||||||||||||||||||||||||||||||||||||||||||||||||||||||||||||||||||||||||||||||||||||
| Increase in pre-tax net income before impact of derivative settlements | Increase in pre-tax net income before impact of derivative settlements | $ | 711 | 0.7 | % | $ | 2,500 | 2.7 | % | $ | 1,941 | 2.1 | % | $ | 8,557 | 9.1 | % | |||||||||||||||||||||||||||||||||||||||||||||||||||||||||||||||||||||||||||||||||||||||||||||||||||||||||||||||||
| Impact of derivative settlements | ||||||||||||||||||||||||||||||||||||||||||||||||||||||||||||||||||||||||||||||||||||||||||||||||||||||||||||||||||||||||||||||||||
| Increase in net income before taxes | Increase in net income before taxes | $ | 1,457 | 1.5 | % | $ | 4,738 | 5.0 | % | $ | 1,195 | 1.3 | % | $ | 6,319 | 6.7 | % | |||||||||||||||||||||||||||||||||||||||||||||||||||||||||||||||||||||||||||||||||||||||||||||||||||||||||||||||||
| Increase in basic and diluted earnings per share | ||||||||||||||||||||||||||||||||||||||||||||||||||||||||||||||||||||||||||||||||||||||||||||||||||||||||||||||||||||||||||||||||||
| Change from increase of 100 basis points | Change from increase of 300 basis points | Change from decrease of 100 basis points | Change from decrease of 300 basis points | |||||||||||||||||||||||||||||||||||||||||||||||||||||||||||||||||||||||||||||||||||||||||||||||||||||||||||||||||||||||||||||||
| Three months ended March 31, 2023 | Three months ended March 31, 2023 | |||||||||||||||||||||||||||||||||||||||||||||||||||||||||||||||||||||||||||||||||||||||||||||||||||||||||||||||||||||||||||||||||
| Effect on earnings: | Effect on earnings: | Effect on earnings: | ||||||||||||||||||||||||||||||||||||||||||||||||||||||||||||||||||||||||||||||||||||||||||||||||||||||||||||||||||||||||||||||||
| Increase in pre-tax net income before impact of derivative settlements | Increase in pre-tax net income before impact of derivative settlements | $ | 772 | 2.5 | % | $ | 4,403 | 14.1 | % | $ | 76 | 0.2 | % | $ | 3,650 | 11.7 | % | Increase in pre-tax net income before impact of derivative settlements | $ | 772 | 2.5 | 2.5 | % | $ | 4,403 | 14.1 | 14.1 | % | $ | 76 | 0.2 | 0.2 | % | $ | 3,650 | 11.7 | 11.7 | % | ||||||||||||||||||||||||||||||||||||||||||||||||||||||||||||||||||||||||||||||||||||||||||||
| Impact of derivative settlements (a) | Impact of derivative settlements (a) | — | — | — | — | — | — | — | — | |||||||||||||||||||||||||||||||||||||||||||||||||||||||||||||||||||||||||||||||||||||||||||||||||||||||||||||||||||||||||
| Increase in net income before taxes | Increase in net income before taxes | $ | 772 | 2.5 | % | $ | 4,403 | 14.1 | % | $ | 76 | 0.2 | % | $ | 3,650 | 11.7 | % | Increase in net income before taxes | $ | 772 | 2.5 | 2.5 | % | $ | 4,403 | 14.1 | 14.1 | % | $ | 76 | 0.2 | 0.2 | % | $ | 3,650 | 11.7 | 11.7 | % | ||||||||||||||||||||||||||||||||||||||||||||||||||||||||||||||||||||||||||||||||||||||||||||
| Increase in basic and diluted earnings per share | Increase in basic and diluted earnings per share | $ | 0.02 | $ | 0.09 | $ | 0.00 | $ | 0.07 | |||||||||||||||||||||||||||||||||||||||||||||||||||||||||||||||||||||||||||||||||||||||||||||||||||||||||||||||||||||||||
| Asset and funding index mismatches | |||||||||||||||||||||||||||||||||||||||||||||||
| Increase of 10 basis points | Increase of 30 basis points | ||||||||||||||||||||||||||||||||||||||||||||||
| Dollars | Percent | Dollars | Percent | ||||||||||||||||||||||||||||||||||||||||||||
| Three months ended March 31, 2023 | |||||||||||||||||||||||||||||||||||||||||||||||
| Effect on earnings: | |||||||||||||||||||||||||||||||||||||||||||||||
| Decrease in pre-tax net income before impact of derivative settlements | $ | (1,113) | (3.6) | % | $ | (3,339) | (10.7) | % | |||||||||||||||||||||||||||||||||||||||
| Impact of derivative settlements | 777 | 2.5 | 2,330 | 7.5 | |||||||||||||||||||||||||||||||||||||||||||
| Decrease in net income before taxes | $ | (336) | (1.1) | % | $ | (1,009) | (3.2) | % | |||||||||||||||||||||||||||||||||||||||
| Decrease in basic and diluted earnings per share | $ | (0.01) | $ | (0.02) | |||||||||||||||||||||||||||||||||||||||||||
| Asset and funding index mismatches | |||||||||||||||||||||||||||||||||||||||||||||||||||||||||||||||||||||||
| Increase of 10 basis points | Increase of 30 basis points | Increase of 10 basis points | Increase of 30 basis points | ||||||||||||||||||||||||||||||||||||||||||||||||||||||||||||||||||||
| Dollars | Percent | Dollars | Percent | Dollars | Percent | Dollars | Percent | ||||||||||||||||||||||||||||||||||||||||||||||||||||||||||||||||
| Three months ended March 31, 2024 | Three months ended March 31, 2023 | ||||||||||||||||||||||||||||||||||||||||||||||||||||||||||||||||||||||
| Effect on earnings: | |||||||||||||||||||||||||||||||||||||||||||||||||||||||||||||||||||||||
| Decrease in pre-tax net income before impact of derivative settlements | $ | (1,017) | (1.0) | % | $ | (3,050) | (3.2) | % | $ | (1,113) | (3.6) | % | $ | (3,339) | (10.7) | % | |||||||||||||||||||||||||||||||||||||||||||||||||||||||
| Impact of derivative settlements | 783 | 0.8 | 2,349 | 2.5 | 777 | 2.5 | 2,330 | 7.5 | |||||||||||||||||||||||||||||||||||||||||||||||||||||||||||||||
| Decrease in net income before taxes | $ | (234) | (0.2) | % | $ | (701) | (0.7) | % | $ | (336) | (1.1) | % | $ | (1,009) | (3.2) | % | |||||||||||||||||||||||||||||||||||||||||||||||||||||||
| Decrease in basic and diluted earnings per share | $ (0.00) | $ | (0.01) | $ | (0.01) | $ | (0.02) | ||||||||||||||||||||||||||||||||||||||||||||||||||||||||||||||||
| As of March 31, 2023 | As of December 31, 2022 | As of March 31, 2024 | As of December 31, 2023 | ||||||||||||||||||||||||||||||||||||||||||||||||||||||
| Dollars | Percent | Dollars | Percent | Dollars | Percent | Dollars | Percent | ||||||||||||||||||||||||||||||||||||||||||||||||||
| Fixed-rate loan assets | Fixed-rate loan assets | $ | 364,818 | $ | 341,776 | ||||||||||||||||||||||||||||||||||||||||||||||||||||
| Fixed-rate investments | Fixed-rate investments | 142,152 | 123,809 | ||||||||||||||||||||||||||||||||||||||||||||||||||||||
| Fixed-rate investments | |||||||||||||||||||||||||||||||||||||||||||||||||||||||||
| Fixed-rate investments | |||||||||||||||||||||||||||||||||||||||||||||||||||||||||
| Total fixed-rate assets | |||||||||||||||||||||||||||||||||||||||||||||||||||||||||
| Total fixed-rate assets | |||||||||||||||||||||||||||||||||||||||||||||||||||||||||
| Total fixed-rate assets | Total fixed-rate assets | 506,970 | 51.9 | % | 465,585 | 52.2 | % | 546,522 | 50.3 | 50.3 | % | 458,928 | 47.7 | 47.7 | % | ||||||||||||||||||||||||||||||||||||||||||
| Variable-rate loan assets | Variable-rate loan assets | 74,189 | 78,019 | ||||||||||||||||||||||||||||||||||||||||||||||||||||||
| Variable-rate investments | Variable-rate investments | 395,259 | 347,559 | ||||||||||||||||||||||||||||||||||||||||||||||||||||||
| Variable-rate investments | |||||||||||||||||||||||||||||||||||||||||||||||||||||||||
| Variable-rate investments | |||||||||||||||||||||||||||||||||||||||||||||||||||||||||
| Total variable rate assets | |||||||||||||||||||||||||||||||||||||||||||||||||||||||||
| Total variable rate assets | |||||||||||||||||||||||||||||||||||||||||||||||||||||||||
| Total variable rate assets | Total variable rate assets | 469,448 | 48.1 | 425,578 | 47.8 | ||||||||||||||||||||||||||||||||||||||||||||||||||||
| Total assets | Total assets | $ | 976,418 | 100.0 | % | $ | 891,163 | 100.0 | % | Total assets | $ | 1,085,529 | 100.0 | 100.0 | % | $ | 962,520 | 100.0 | 100.0 | % | |||||||||||||||||||||||||||||||||||||
| Fixed-rate deposits | Fixed-rate deposits | $ | 284,387 | 32.7 | % | $ | 336,040 | 42.6 | % | ||||||||||||||||||||||||||||||||||||||||||||||||
| Variable-rate deposits | 585,391 | 67.3 | 453,604 | 57.4 | |||||||||||||||||||||||||||||||||||||||||||||||||||||
| Fixed-rate deposits | |||||||||||||||||||||||||||||||||||||||||||||||||||||||||
| Fixed-rate deposits | $ | 279,331 | 29.1 | % | $ | 280,736 | 33.1 | % | |||||||||||||||||||||||||||||||||||||||||||||||||
| Variable-rate deposits (a) | |||||||||||||||||||||||||||||||||||||||||||||||||||||||||
| Total deposits | Total deposits | $ | 869,778 | 100.0 | % | $ | 789,644 | 100.0 | % | Total deposits | $ | 960,633 | 100.0 | 100.0 | % | $ | 847,564 | 100.0 | 100.0 | % | |||||||||||||||||||||||||||||||||||||
| Three months ended March 31, | ||||||||||||||||||||||||||||||||||||||||||||||||||||||||||||||||||||||||||||||||||||||||||
| 2023 | 2022 | |||||||||||||||||||||||||||||||||||||||||||||||||||||||||||||||||||||||||||||||||||||||||
| Average balance | Interest income/ expense | Average yields/ rates | Average balance | Interest income/ expense | Average yields/ rates | |||||||||||||||||||||||||||||||||||||||||||||||||||||||||||||||||||||||||||||||||||||
| Three months ended March 31, | ||||||||||||||||||||||||||||||||||||||||||||||||||||||||||||||||||||||||||||||||||||||||||
| Three months ended March 31, | ||||||||||||||||||||||||||||||||||||||||||||||||||||||||||||||||||||||||||||||||||||||||||
| Three months ended March 31, | ||||||||||||||||||||||||||||||||||||||||||||||||||||||||||||||||||||||||||||||||||||||||||
| 2024 | 2024 | 2023 | ||||||||||||||||||||||||||||||||||||||||||||||||||||||||||||||||||||||||||||||||||||||||
| Average balance | Average balance | Interest income/ expense | Average yields/ rates | Average balance | Interest income/ expense | Average yields/ rates | ||||||||||||||||||||||||||||||||||||||||||||||||||||||||||||||||||||||||||||||||||||
| Investments: | Investments: | |||||||||||||||||||||||||||||||||||||||||||||||||||||||||||||||||||||||||||||||||||||||||
| Asset-backed securities available-for-sale (a) (b) | ||||||||||||||||||||||||||||||||||||||||||||||||||||||||||||||||||||||||||||||||||||||||||
| Asset-backed securities available-for-sale (a) (b) | ||||||||||||||||||||||||||||||||||||||||||||||||||||||||||||||||||||||||||||||||||||||||||
| Asset-backed securities available-for-sale (a) (b) | Asset-backed securities available-for-sale (a) (b) | $ | 1,309,752 | 17,486 | 5.41 | % | $ | 1,092,640 | 3,242 | 1.20 | % | $ | 863,634 | 14,012 | 14,012 | 6.51 | 6.51 | % | $ | 1,309,752 | 17,486 | 17,486 | 5.41 | 5.41 | % | |||||||||||||||||||||||||||||||||||||||||||||||||||||||||||||||||
| Debt funding asset-backed securities available-for-sale: | Debt funding asset-backed securities available-for-sale: | |||||||||||||||||||||||||||||||||||||||||||||||||||||||||||||||||||||||||||||||||||||||||
| Debt funding asset-backed securities available-for-sale: | ||||||||||||||||||||||||||||||||||||||||||||||||||||||||||||||||||||||||||||||||||||||||||
| Debt funding asset-backed securities available-for-sale: | ||||||||||||||||||||||||||||||||||||||||||||||||||||||||||||||||||||||||||||||||||||||||||
| Participation agreement - variable rate (c) | Participation agreement - variable rate (c) | $ | 365,115 | 5,059 | 5.62 | % | $ | 256,535 | 560 | 0.89 | % | |||||||||||||||||||||||||||||||||||||||||||||||||||||||||||||||||||||||||||||||
| Repurchases agreements - variable rate (d) | 511,759 | 6,768 | 5.36 | 404,040 | 1,031 | 1.03 | ||||||||||||||||||||||||||||||||||||||||||||||||||||||||||||||||||||||||||||||||||||
| $ | 876,874 | 11,827 | 5.47 | $ | 660,575 | 1,591 | 0.98 | |||||||||||||||||||||||||||||||||||||||||||||||||||||||||||||||||||||||||||||||||||
| Participation agreement - variable rate (c) | ||||||||||||||||||||||||||||||||||||||||||||||||||||||||||||||||||||||||||||||||||||||||||
| Participation agreement - variable rate (c) | $ | 91 | 1 | 4.41 | % | $ | 365,115 | 5,059 | 5.62 | % | ||||||||||||||||||||||||||||||||||||||||||||||||||||||||||||||||||||||||||||||||
| Repurchase agreements - variable rate (d) | ||||||||||||||||||||||||||||||||||||||||||||||||||||||||||||||||||||||||||||||||||||||||||
| $ | ||||||||||||||||||||||||||||||||||||||||||||||||||||||||||||||||||||||||||||||||||||||||||
| Period | Total number of shares purchased (a) | Average price paid per share | Total number of shares purchased as part of publicly announced plans or programs (b) | Maximum number of shares that may yet be purchased under the plans or programs (b) | ||||||||||||||||||||||
| January 1 - January 31, 2023 | — | $ | — | — | 4,467,021 | |||||||||||||||||||||
| February 1 - February 28, 2023 | — | — | — | 4,467,021 | ||||||||||||||||||||||
| March 1 - March 31, 2023 | 36,513 | 90.43 | — | 4,467,021 | ||||||||||||||||||||||
| Total | 36,513 | $ | 90.43 | — | ||||||||||||||||||||||
| Period | Total number of shares purchased (a) | Average price paid per share (b) | Total number of shares purchased as part of publicly announced plans or programs (c) | Maximum number of shares that may yet be purchased under the plans or programs (c) | ||||||||||||||||||||||
| January 1 - January 31, 2024 | 13,523 | $ | 82.79 | 13,523 | 4,167,651 | |||||||||||||||||||||
| February 1 - February 29, 2024 | — | — | — | 4,167,651 | ||||||||||||||||||||||
| March 1 - March 31, 2024 | 383,201 | 89.03 | 342,884 | 3,824,767 | ||||||||||||||||||||||
| Total | 396,724 | $ | 88.82 | 356,407 | ||||||||||||||||||||||
| Name and Title | Date of Adoption of Rule 10b5-1 Trading Plan | Scheduled Expiration Date of Rule 10b5-1 Trading Plan (a) | Aggregate Number of Securities to Be Purchased or Sold | |||||||||||||||||
Kathleen A. Farrell Director | 3/6/2024 | 3/5/2025 | Sale of 1,700 shares of Class A common stock | |||||||||||||||||
| 31.1* | |||||
| 31.2* | |||||
| 32** | |||||
| 101.INS* | Inline XBRL Instance Document - the instance document does not appear in the Interactive Data File because its XBRL tags are embedded within the Inline XBRL document. | ||||
| 101.SCH* | Inline XBRL Taxonomy Extension Schema Document. | ||||
| 101.CAL* | Inline XBRL Taxonomy Extension Calculation Linkbase Document. | ||||
| 101.DEF* | Inline XBRL Taxonomy Extension Definition Linkbase Document. | ||||
| 101.LAB* | Inline XBRL Taxonomy Extension Label Linkbase Document. | ||||
| 101.PRE* | Inline XBRL Taxonomy Extension Presentation Linkbase Document. | ||||
| 104* | Cover Page Interactive Data File (formatted as Inline XBRL and contained in Exhibit 101). | ||||
| * | Filed herewith | ||||
| ** | Furnished herewith | ||||
| NELNET, INC. | ||||||||||||||
| Date: | May | By: | /s/ JEFFREY R. NOORDHOEK | |||||||||||
| Name: | Jeffrey R. Noordhoek | |||||||||||||
| Title: | Chief Executive Officer Principal Executive Officer | |||||||||||||
| Date: | May | By: | /s/ JAMES D. KRUGER | |||||||||||
| Name: | James D. Kruger | |||||||||||||
| Title: | Chief Financial Officer Principal Financial Officer and Principal Accounting Officer | |||||||||||||