17
| Three and Nine Months Ended | ||||
| September 30, | ||||
| 2017 | ||||
| Accumulated OCI beginning balance | $ | — | ||
| Mark-to-market of cash flow hedge accounting contracts | 197 | |||
| Accumulated OCI ending balance | $ | 197 | ||
| Gains expected to be realized from accumulated OCI during the next 12 months | $ | — | ||
VONAGE HOLDINGS CORP.
NOTES TO CONDENSED CONSOLIDATED FINANCIAL STATEMENTS
(In thousands, except per share amounts)
(Unaudited)
Uncertain Tax Positions
| September 30, 2021 | December 31, 2020 | ||||||||||
| Balance as of January 1 | $ | 632 | $ | 914 | |||||||
| Increase due to current year positions | 375 | 114 | |||||||||
| Increase due to prior year positions | 10 | — | |||||||||
| Decrease due to settlements and payments | (355) | (173) | |||||||||
| Decrease due to lapse of applicable statute of limitations | (10) | (238) | |||||||||
| (Decrease) increase due to foreign currency fluctuation | (2) | 15 | |||||||||
| Uncertain tax benefits as of the end of the period | $ | 650 | $ | 632 | |||||||
Net Operating Loss Carry Forwards
As of September 30, 20172021, the Company has U.S. Federal and state NOL carryforwards of $410,731 and $207,769, respectively. With the exception of $5,822 of U.S. Federal NOL which has no expiration date, the remaining NOLs expire at various times through 2037. We have non-US NOLs of $159,152 primarily related to the United Kingdom which has no expiration date.
Note 6. Long-Term Debt
This footnote should be read in conjunction with the complete description of our financing arrangements under Note 8, Long-Term Debt, to the consolidated financial statements included in our Annual Report on Form 10-K for the year ended December 31, 2020.
The following table summarizes the Company's long-term debt as of September 30, 2021 and December 31, 2016,2020:
| September 30, 2021 | December 31, 2020 | ||||||||||
| Revolving credit facility - due 2023 | 150,500 | 215,500 | |||||||||
| Convertible senior notes - due 2024 | 345,000 | 345,000 | |||||||||
| Long-term debt including current maturities | 495,500 | 560,500 | |||||||||
| Less unamortized discount | 38,875 | 48,702 | |||||||||
| Less debt issuance costs | 4,318 | 5,514 | |||||||||
| Total long-term debt | $ | 452,307 | $ | 506,284 | |||||||
Convertible Senior Notes
In June 2019, the Company issued $300.0 million aggregate principal amount of 1.75% convertible senior notes due 2024 in a private placement and an additional $45.0 million aggregate principal amount of such notes pursuant to the exercise in full of the over-allotment option of the initial purchasers (collectively, "Convertible Senior Notes"). The Convertible Senior Notes are the Company's senior unsecured obligations. The Convertible Senior Notes will mature on June 1, 2024, unless earlier redeemed, repurchased or converted. We may not redeem the notes prior to June 5, 2022.
18
VONAGE HOLDINGS CORP.
NOTES TO CONDENSED CONSOLIDATED FINANCIAL STATEMENTS
(In thousands, except per share amounts)
(Unaudited)
Each $1,000 principal amount of the Convertible Senior Notes is initially convertible into 59.8256 shares of the Company's common stock, which is equivalent to an initial conversion price of approximately $16.72 per share. The conversion rate is subject to adjustment upon the occurrence of certain specified events but will not be adjusted for any accrued and unpaid interest. In addition, upon the occurrence of a make-whole fundamental change or a redemption period, each as defined in the indenture setting forth the terms of the Convertible Senior Notes, the Company will, in certain circumstances, increase the conversion rate by a number of additional shares for a holder that elects to convert its Convertible Senior Notes in connection with such make-whole fundamental change or during the relevant redemption period.
Prior to December 1, 2023, the notes will be convertible only upon satisfaction of certain conditions and during certain periods, and thereafter, at any time until the close of business on the second scheduled trading day immediately preceding the maturity date. We will satisfy any conversion election by paying or delivering, as the case may be, cash, shares of common stock or a combination of cash and shares of common stock. During the nine months ended September 30, 2021, the conditions allowing holders of the Convertible Senior Notes to convert were not met.
The net carrying amount of the liability component of the Convertible Senior Notes was as follows:
| September 30, 2021 | ||||||||
| Principal | $ | 345,000 | ||||||
| Unamortized discount | (38,875) | |||||||
| Unamortized issuance cost | (4,318) | |||||||
| Net carrying amount | $ | 301,807 | ||||||
The following table sets forth the interest expense recognized related to the Convertible Senior Notes:
| Three Months Ended | Nine Months Ended | ||||||||||||||||||||||
| September 30, | September 30, | ||||||||||||||||||||||
| 2021 | 2020 | 2021 | 2020 | ||||||||||||||||||||
| Contractual interest expense | $ | 1,509 | $ | 1,510 | $ | 4,528 | $ | 4,528 | |||||||||||||||
| Amortization of debt discount | 3,349 | 3,159 | 9,827 | 9,322 | |||||||||||||||||||
| Amortization of debt issuance costs | 398 | 398 | 1,196 | 1,196 | |||||||||||||||||||
| Total interest expense related to the Convertible Senior Notes | $ | 5,256 | $ | 5,067 | $ | 15,551 | $ | 15,046 | |||||||||||||||
In connection with the pricing of the Convertible Senior Notes and subsequently in connection with the exercise of the initial purchaser's option to purchase additional notes, the Company entered into privately negotiated capped call transactions with certain counterparties (the "Capped Calls"). The Capped Calls each have a strike price of $16.72 per share, subject to certain adjustments, which corresponds to the initial conversion price of the Convertible Senior Notes. The Capped Calls have initial cap prices of $23.46 per share, subject to certain adjustments. The Capped Calls are expected generally to reduce potential dilution to the Company's common stock upon any conversion of notes and/or offset any cash payments the Company is required to make in excess of the aggregate principal amount of converted notes, as the case may be, with such reduction and/or offset subject to a cap. The initial cap price of the Capped Call transactions was $23.46.
2018 Term Note and Revolving Credit Facility
On July 31, 2018, the Company entered into the 2018 Credit Facility consisting of a $100 million senior secured term loan and a $500 million revolving credit facility. The co-borrowers under the 2018 Credit Facility are the Company and Vonage America Inc., the Company’s wholly owned subsidiary. Obligations under the 2018 Credit Facility are guaranteed, fully and unconditionally, by the Company’s other United States subsidiaries and are secured by substantially all of the assets of each borrower and each guarantor.
19
VONAGE HOLDINGS CORP.
NOTES TO CONDENSED CONSOLIDATED FINANCIAL STATEMENTS
(In thousands, except per share amounts)
(Unaudited)
During the nine months ended September 30, 2021, we repaid $65 million under the revolving facility. In addition, the effective interest rate was 2.88% as of September 30, 2021. During the nine months ended September 30, 2020, we borrowed $75 million under the revolving credit facility and repaid $55 million under the revolving facility. As of September 30, 2021, we were in compliance with all covenants, including financial covenants, for the 2018 Credit Facility.
Note 7. Leases
The Company entered into various non-cancelable operating lease arrangements for certain of our existing office and telecommunications co-location space as well as operating leases for certain equipment. The operating leases expire at various times through 2028, some of which provide the Company options to extend the lease for terms up to 5 years beyond the original term. We are committed to pay a portion of the buildings’ operating expenses as required under the arrangements which we will separate as a non-lease component when readily determinable. The Company did not have any finance leases as of September 30, 2021 and December 31, 2020.
The Company incurred operating lease expense of $2,318 and $7,363, respectively, during the three and nine months ended September 30, 2021 and $2,919 and $8,784, respectively, during the three and nine months ended September 30, 2020, related to its operating leases. In addition, the Company received sub-lease income of $266 and $851, respectively, during the three and nine months ended September 30, 2021 and $293 and $904, respectively, during the three and nine months ended September 30, 2020. Additionally, the remaining weighted average lease term for our operating leases was 4.71 years and the weighted average discount rate utilized to measure the Company's operating leases was 4.29% as of September 30, 2021.
Supplemental cash flow related to the Company's operating leases is as follows:
| Nine Months Ended | |||||||||||
| September 30, 2021 | September 30, 2020 | ||||||||||
| Cash paid for amounts included in the measurement of lease liabilities | $ | 8,737 | $ | 12,090 | |||||||
| Right-of-use assets obtained in exchange for lease obligations | $ | 8,431 | $ | 1,261 | |||||||
Maturities of operating lease liabilities as of September 30, 2021 and December 31, 2020 are as follows:
| September 30, 2021 | December 31, 2020 | ||||||||||
2021 (1) | $ | 2,956 | 13,134 | ||||||||
| 2022 | 11,682 | 9,645 | |||||||||
| 2023 | 10,806 | 8,401 | |||||||||
| 2024 | 6,756 | 4,148 | |||||||||
| 2025 | 6,857 | 4,248 | |||||||||
| Thereafter | 9,479 | 7,522 | |||||||||
| Total lease payments | 48,536 | 47,098 | |||||||||
| Less imputed interest | (4,421) | (4,525) | |||||||||
| Total | $ | 44,115 | $ | 42,573 | |||||||
(1) Excluding nine months ended September 30, 2021 for the period ended September 30, 2021.
During the first quarter of 2020, the Company amended one of its office leases to remove a renewal period of 5 years beyond the initial lease term. In the Company's adoption of ASC 842, the Company had included the available renewal term within the transition asset and liability as the renewal was highly probable at the time of adoption. As a result, the Company's operating lease liability was reduced by $15,825 with a corresponding reduction in the Company's operating lease right-of-use assets as of March 31, 2020. During the third and fourth quarters of 2020, the Company abandoned certain of its office leases and as such, the Company reduced its operating lease right-of-use asset by $9,503 as of December 31, 2020 by accelerating the amortization of the right-of-use asset through the cease use date which is included in general and administrative expense.
20
VONAGE HOLDINGS CORP.
NOTES TO CONDENSED CONSOLIDATED FINANCIAL STATEMENTS
(In thousands, except per share amounts)
(Unaudited)
During the three months ended September 30, 2021, the Company entered into a new lease agreement to relocate its corporate headquarters to a new leased facility located in Holmdel, New Jersey. As a result, the Company expects to incur a charge associated with the abandonment of its former corporate headquarters in early 2022 upon successful relocation.
Note 8. Common Stock
As of September 30, 2021 and December 31, 2020, the Company had 596,950 shares of common stock authorized and had 10,31810,633 shares available for grants under our share-based compensation programs as of September 30, 2017.2021. For a detailed description of our share-based compensation programs refer to Note 9, 11, Employee Stock Benefit Plans in the consolidated financial statements included in our Annual Report on Form 10-K for the year ended December 31, 2016.
| For the Three Months Ended | |||||||||||||||||
| (in thousands) | Issued | Treasury | Outstanding | ||||||||||||||
| Balance at June 30, 2020 | 320,155 | (74,700) | 245,455 | ||||||||||||||
| Shares issued under the 2015 Equity Incentive Plan | 2,784 | — | 2,784 | ||||||||||||||
| Employee taxes paid on withholding shares | — | (61) | (61) | ||||||||||||||
| Balance at September 30, 2020 | 322,939 | (74,761) | 248,178 | ||||||||||||||
| Balance at June 30, 2021 | 327,813 | (76,272) | 251,541 | ||||||||||||||
| Shares issued under the 2015 Equity Incentive Plan | 1,032 | — | 1,032 | ||||||||||||||
| Employee taxes paid on withholding shares | — | (241) | (241) | ||||||||||||||
| Balance at September 30, 2021 | 328,845 | (76,513) | 252,332 | ||||||||||||||
| For the Nine Months Ended | |||||||||||||||||
| (in thousands) | Issued | Treasury | Outstanding | ||||||||||||||
| Balance at December 31, 2019 | 315,808 | (72,959) | 242,849 | ||||||||||||||
| Shares issued under the 2015 Equity Incentive Plan | 7,131 | — | 7,131 | ||||||||||||||
| Employee taxes paid on withholding shares | — | (1,802) | (1,802) | ||||||||||||||
| Balance at September 30, 2020 | 322,939 | (74,761) | 248,178 | ||||||||||||||
| Balance at December 31, 2020 | 323,815 | (74,841) | 248,974 | ||||||||||||||
| Shares issued under the 2015 Equity Incentive Plan | 5,030 | — | 5,030 | ||||||||||||||
| Employee taxes paid on withholding shares | — | (1,672) | (1,672) | ||||||||||||||
| Balance at September 30, 2021 | 328,845 | (76,513) | 252,332 | ||||||||||||||
21
| Three Months Ended | Nine Months Ended | ||||||||||||||
| September 30, | September 30, | ||||||||||||||
| 2017 | 2016 | 2017 | 2016 | ||||||||||||
| Shares of common stock repurchased | — | — | 1,599 | 7,400 | |||||||||||
| Value of common stock repurchased | $ | — | $ | — | $ | 9,510 | $ | 32,762 | |||||||
NOTES TO CONDENSED CONSOLIDATED FINANCIAL STATEMENTS
(In any period under the 2014 $100.0 million repurchase program, cash used in financing activities related to common stock repurchases may differ from the comparable change in stockholders' equity, reflecting timing differences between the recognition ofthousands, except per share repurchase transactions and their settlement for cash.amounts)
Note 7.9. Commitments and Contingencies
Litigation
From time to time in addition to those identified below, we are subject to legal proceedings, governmental inquiries, claims and investigations and proceedings in the ordinary course ofrelating to our business, including claims of alleged infringement of third-party patents and othercommercial, employment, intellectual property rights, commercial, employment, and other matters. From time to timeIn addition, we receive letters or other communications from third parties inviting us to obtain patent licenses that might be relevant to our business or alleging that our services infringe upon third partythird-party patents or other intellectual property. In accordance with generally accepted accounting principles, we make a provision for a liability when it is both probable that a liability has been incurred and the amount of the loss or range of loss can be reasonably estimated. These provisions, if any, are reviewed at least quarterly and adjusted to reflect the impacts of negotiations, settlements, rulings, advice of legal counsel, and other information and events pertaining to a particular case. Litigation is inherently unpredictable. We believe that we have valid defenses with respect to the legal matters pending against us and are vigorously defending these matters. Given the uncertainty surrounding litigation and our inability to assess the likelihood of a favorable or unfavorable outcome in thesuch matters noted below and our inability to reasonably estimate the amount of loss or range of loss, it is possible that the resolution of one or more of these matters could have a material adverse effect on our condensed consolidated financial position, cash flows or results of operations.
Regulation
Telephony services are subject to a broad spectrum of state, federal and federalforeign regulations. Because of the uncertainty over whether Voice over Internet Protocol (“VoIP”)VoIP should be treated as a telecommunications or information service, we have been involved in a substantial amount of state and federal regulatory activity. Implementation and interpretation of the existing laws and regulations is ongoing and is subject to litigation by various federal and state agencies and courts. Due to the uncertainty over the regulatory classification of VoIP service, there can be no assurance that we will not be subject to new regulations or existing regulations under new interpretations, and that such change would not introduce material additional costs to our business.
local regulatory authorities.
State and Municipal Taxes
In accordance with generally accepted accounting principles, we make a provision for a liability for taxes when it is both probable that a liability has been incurred and the amount of the liability or range of liability can be reasonably estimated. These provisions are reviewed at least quarterly and adjusted to reflect the impacts of negotiations, settlements, rulings, advice of legal counsel, and other information and events pertaining to a particular case. For a period ofFrom time to time, we did not collect or remit state or municipal taxes (such as sales, excise, utility, use, and ad valorem taxes), fees or surcharges (“Taxes”) on the charges to our customers for our services, except that we historically complied with the New Jersey sales tax. We have received inquiries or demands from a number of statestates and municipallocal taxing agencies with respect to the remittance of sales, use, telecommunications, and 911 agencies seeking paymentexcise taxes. Several jurisdictions are currently conducting tax audits of Taxesthe Company's records. While the Company collects or has accrued for taxes that it believes are appliedrequired to or collected from customers of providers of traditional public switched telephone network services. Although we have consistently maintained that these Taxes do not apply to our service for a variety of reasons depending on the statute or rule that establishes such obligations, we are now collecting and remitting sales taxes in certain of those states including a number of states that have changed their statutes to expressly include VoIP. In addition, many states address how VoIP providers should contribute to support public safety agencies, andbe remitted, it has reviewed its positions in those states we remitvarious jurisdictions as well as other regulatory fees to theand has established appropriate state agencies. We could also be contacted by state or municipal taxing and 911 agencies regarding Taxes that do explicitly apply to VoIP and these agencies could seek retroactive payment of Taxes.reserves. As such, we have established reserves of $901$9,882 and $1,763$8,560 as of September 30, 20172021 and December 31, 2016,2020, respectively, as our best estimate of the potential tax exposure for any retroactive assessment.
22
VONAGE HOLDINGS CORP.
NOTES TO CONDENSED CONSOLIDATED FINANCIAL STATEMENTS
(In thousands, except per share amounts)
(Unaudited)
| Cash paid at closing (inclusive of cash acquired of $16,094) | $ | 179,186 | |
| Stock paid at closing | 31,591 | ||
| Contingent consideration (described below) | 16,472 | ||
| Employee Payout Amount (described below) | 4,779 | ||
| Acquisition Cost | $ | 232,028 | |
| Acquisition Date Fair Value as of December 31, 2016 | Measurement period adjustments | Revised Acquisition Date Fair Value | |||||||||
| Assets | |||||||||||
| Current assets: | |||||||||||
| Cash and cash equivalents | $ | 16,094 | $ | — | $ | 16,094 | |||||
| Accounts receivable | 8,764 | — | 8,764 | ||||||||
| Prepaid expenses and other current assets | 3,507 | — | 3,507 | ||||||||
| Total current assets | 28,365 | — | 28,365 | ||||||||
| Property and equipment | 757 | — | 757 | ||||||||
| Software, net | 242 | — | 242 | ||||||||
| Intangible assets | 101,770 | — | 101,770 | ||||||||
| Restricted cash | 51 | — | 51 | ||||||||
| Total assets acquired | 131,185 | — | 131,185 | ||||||||
| Liabilities | |||||||||||
| Current liabilities: | |||||||||||
| Accounts payable | 1,841 | — | 1,841 | ||||||||
| Accrued expenses | 9,299 | — | 9,299 | ||||||||
| Deferred revenue, current portion | 1,735 | — | 1,735 | ||||||||
| Total current liabilities | 12,875 | — | 12,875 | ||||||||
| Deferred tax liabilities, net, non-current | 29,355 | (5,482 | ) | 23,873 | |||||||
| Total liabilities assumed | 42,230 | (5,482 | ) | 36,748 | |||||||
| Net identifiable assets acquired | 88,955 | 5,482 | 94,437 | ||||||||
| Goodwill | 143,073 | (5,482 | ) | 137,591 | |||||||
| Total purchase price | $ | 232,028 | $ | — | $ | 232,028 | |||||
| Customer relationships | $ | 85,900 | |
| Developed technologies | 13,768 | ||
| Non-compete agreements | 972 | ||
| Trade names | 1,130 | ||
| $ | 101,770 | ||
| Balance at December 31, 2016 | $ | 360,363 | ||
| Decrease in goodwill related acquisition of Nexmo | (5,482 | ) | ||
| Currency translation adjustments | 16,654 | |||
| Balance at September 30, 2017 | $ | 371,535 | ||
| Nine Months Ended | ||||
| September 30, | ||||
| 2016 | ||||
| Revenues | $ | 743,083 | ||
| Net income | $ | 12,718 | ||
| Earnings per common share - basic | $ | 0.06 | ||
| Earnings per common share - diluted | $ | 0.05 | ||
Note 9.10. Industry Segment and Geographic Information
ASC 280, "Segment Reporting"Segment Reporting, establishes reporting standards for an enterprise's business segments and related disclosures about its products, services, geographic areas and major customers. Under ASC 280, the method for determining what information to report is based upon the way management organizes the reportable operating segments within the Company for making operating decisions and assessing financial performance. Our chief operating decision-maker reviews revenue and gross margin informationAdjusted EBITDA for each of our reportable operating segments. Beginning as of December 31, 2020, the Company includes Adjusted EBITDA as this is the measure management uses to evaluate the profitability of our reportable operating segments. The items excluded from Adjusted EBITDA are not separately evaluated for each reportable operating segment. The Company has recast data from prior years to reflect the change how the Company evaluates the profitability of its reportable operating segments but does not review operating expenses on a segment by segment basis.to conform to the current year presentation. In addition, with the exception of goodwill and intangible assets, we do not identify or allocate our assets by the reportable segments.operating segments as this information is not utilized by management to allocate resources or capital.
Consumer
For our Consumer customers, we enable users to access and utilize our UCaaS services and features, via their existing internet connections,a single “identity,” either a number or user name, regardless of how they are connected to the Internet, including over 3G/4G, LTE, Cable, or DSL broadband networks. This technology enables us to offer our Consumer customers attractively priced voice communicationand messaging services and other features around the world on a variety of devices.
23
VONAGE HOLDINGS CORP.
NOTES TO CONDENSED CONSOLIDATED FINANCIAL STATEMENTS
(In thousands, except per share amounts)
(Unaudited)
| Three Months Ended | Service Revenue | Revenue | Adjusted EBITDA | Depreciation and Amortization | ||||||||||||||||||||||||||||
| September 30, 2021 | ||||||||||||||||||||||||||||||||
| Vonage Communications Platform | $ | 274,031 | $ | 288,156 | $ | 5,022 | $ | 22,325 | ||||||||||||||||||||||||
| Consumer | 60,162 | 70,185 | 45,839 | 182 | ||||||||||||||||||||||||||||
| Total Vonage | $ | 334,193 | $ | 358,341 | $ | 50,861 | $ | 22,507 | ||||||||||||||||||||||||
| September 30, 2020 | ||||||||||||||||||||||||||||||||
| Vonage Communications Platform | $ | 218,456 | $ | 233,826 | $ | (14,399) | $ | 21,929 | ||||||||||||||||||||||||
| Consumer | 71,693 | 82,823 | 56,001 | 958 | ||||||||||||||||||||||||||||
| Total Vonage | $ | 290,149 | $ | 316,649 | $ | 41,602 | $ | 22,887 | ||||||||||||||||||||||||
| Nine Months Ended | Service Revenue | Revenue | Adjusted EBITDA | Depreciation and Amortization | ||||||||||||||||||||||||||||
| September 30, 2021 | ||||||||||||||||||||||||||||||||
| Vonage Communications Platform | $ | 774,925 | $ | 820,023 | $ | 4,274 | $ | 64,460 | ||||||||||||||||||||||||
| Consumer | 189,148 | 222,687 | 143,559 | 748 | ||||||||||||||||||||||||||||
| Total Vonage | $ | 964,073 | $ | 1,042,710 | $ | 147,833 | $ | 65,208 | ||||||||||||||||||||||||
| September 30, 2020 | ||||||||||||||||||||||||||||||||
| Vonage Communications Platform | $ | 626,416 | $ | 670,328 | $ | (53,000) | $ | 60,777 | ||||||||||||||||||||||||
| Consumer | 223,981 | 254,311 | 174,983 | 3,287 | ||||||||||||||||||||||||||||
| Total Vonage | $ | 850,397 | $ | 924,639 | $ | 121,983 | $ | 64,064 | ||||||||||||||||||||||||
The Company uses Adjusted EBITDA as the measure of revenue attributableprofit or loss for the evaluation of performance and allocation of resources of our reportable operating segments. Adjusted EBITDA is defined as net income or net loss before income tax expense or benefit, interest expense, depreciation and amortization, stock-based expense, amortization of costs to our communication services for Consumerimplement cloud computing arrangements, organizational transformation costs, restructuring activities, and Software Defined Wide Area Network, or SD-WAN, UCaaSother non-recurring items. Organizational transformation includes employee related exits including CEO succession, system change management, facility exit costs, and CPaaS services for Business,
24
VONAGE HOLDINGS CORP.
NOTES TO CONDENSED CONSOLIDATED FINANCIAL STATEMENTS
(In thousands, except per share amounts)
(Unaudited)
| Three Months Ended | Nine Months Ended | ||||||||||||||||||||||
| September 30, | September 30, | ||||||||||||||||||||||
| 2021 | 2020 | 2021 | 2020 | ||||||||||||||||||||
| Adjusted EBITDA | $ | 50,861 | $ | 41,602 | $ | 147,833 | $ | 121,983 | |||||||||||||||
| Interest expense | (7,045) | (7,373) | (21,424) | (24,776) | |||||||||||||||||||
| Depreciation and amortization | (22,507) | (22,887) | (65,208) | (64,064) | |||||||||||||||||||
| Amortization of costs to implement cloud computing arrangements | (818) | (670) | (2,675) | (1,947) | |||||||||||||||||||
| Share-based expense | (17,247) | (11,530) | (47,575) | (33,972) | |||||||||||||||||||
| Organizational transformation | — | — | — | (5,119) | |||||||||||||||||||
| Restructuring activities | — | (15,182) | (2,655) | (15,182) | |||||||||||||||||||
| Other non-recurring items | (944) | (1,959) | (3,398) | (5,864) | |||||||||||||||||||
| Income (Loss) before taxes | $ | 2,300 | $ | (17,999) | $ | 4,898 | $ | (28,941) | |||||||||||||||
| Three Months Ended | Nine Months Ended | ||||||||||||||||||||||
| September 30, 2017 | September 30, 2017 | ||||||||||||||||||||||
| Business | Consumer | Total | Business | Consumer | Total | ||||||||||||||||||
| Revenues | |||||||||||||||||||||||
| Service revenues | $ | 109,483 | $ | 111,913 | $ | 221,396 | $ | 305,599 | $ | 346,666 | $ | 652,265 | |||||||||||
Product revenues (1) | 13,085 | 94 | 13,179 | 39,837 | 498 | 40,335 | |||||||||||||||||
| Service and product revenues | 122,568 | 112,007 | 234,575 | 345,436 | 347,164 | 692,600 | |||||||||||||||||
| USF revenues | 6,738 | 11,770 | 18,508 | 19,386 | 36,280 | 55,666 | |||||||||||||||||
| Total revenues | 129,306 | 123,777 | 253,083 | 364,822 | 383,444 | 748,266 | |||||||||||||||||
| Cost of revenues | |||||||||||||||||||||||
Service cost of revenues (2) | 50,777 | 19,434 | 70,211 | 139,218 | 62,969 | 202,187 | |||||||||||||||||
Product cost of revenues (1) | 12,702 | 1,517 | 14,219 | 38,360 | 5,475 | 43,835 | |||||||||||||||||
| Service and product cost of revenues | 63,479 | 20,951 | 84,430 | 177,578 | 68,444 | 246,022 | |||||||||||||||||
| USF cost of revenues | 6,738 | 11,770 | 18,508 | 19,386 | 36,280 | 55,666 | |||||||||||||||||
| Total cost of revenues | 70,217 | 32,721 | 102,938 | 196,964 | 104,724 | 301,688 | |||||||||||||||||
| Segment gross margin | |||||||||||||||||||||||
| Service margin | 58,706 | 92,479 | 151,185 | 166,381 | 283,697 | 450,078 | |||||||||||||||||
| Product margin | 383 | (1,423 | ) | (1,040 | ) | 1,477 | (4,977 | ) | (3,500 | ) | |||||||||||||
| Gross margin ex-USF (Service and product margin) | 59,089 | 91,056 | 150,145 | 167,858 | 278,720 | 446,578 | |||||||||||||||||
| USF margin | — | — | — | — | — | — | |||||||||||||||||
| Segment gross margin | $ | 59,089 | $ | 91,056 | $ | 150,145 | $ | 167,858 | $ | 278,720 | $ | 446,578 | |||||||||||
| Segment gross margin % | |||||||||||||||||||||||
| Service margin % | 53.6 | % | 82.6 | % | 68.3 | % | 54.4 | % | 81.8 | % | 69.0 | % | |||||||||||
| Gross margin ex-USF (Service and product margin %) | 48.2 | % | 81.3 | % | 64.0 | % | 48.6 | % | 80.3 | % | 64.5 | % | |||||||||||
| Segment gross margin % | 45.7 | % | 73.6 | % | 59.3 | % | 46.0 | % | 72.7 | % | 59.7 | % | |||||||||||
| Three Months Ended | Nine Months Ended | ||||||||||||||||||||||
| September 30, 2016 | September 30, 2016 | ||||||||||||||||||||||
| Business | Consumer | Total | Business | Consumer | Total | ||||||||||||||||||
| Revenues | |||||||||||||||||||||||
| Service revenues | $ | 86,662 | $ | 128,167 | $ | 214,829 | $ | 210,214 | $ | 399,401 | $ | 609,615 | |||||||||||
Product revenues (1) | 13,618 | 207 | 13,825 | 39,795 | 514 | 40,309 | |||||||||||||||||
| Service and product revenues | 100,280 | 128,374 | 228,654 | 250,009 | 399,915 | 649,924 | |||||||||||||||||
| USF revenues | 6,029 | 13,676 | 19,705 | 15,832 | 43,102 | 58,934 | |||||||||||||||||
| Total revenues | 106,309 | 142,050 | 248,359 | 265,841 | 443,017 | 708,858 | |||||||||||||||||
| Cost of revenues | |||||||||||||||||||||||
Service cost of revenues (2) | 34,858 | 24,973 | 59,831 | 72,788 | 77,220 | 150,008 | |||||||||||||||||
Product cost of revenues (1) | 13,101 | 3,331 | 16,432 | 38,465 | 11,196 | 49,661 | |||||||||||||||||
| Service and product cost of revenues | 47,959 | 28,304 | 76,263 | 111,253 | 88,416 | 199,669 | |||||||||||||||||
| USF cost of revenues | 6,029 | 13,676 | 19,705 | 15,843 | 43,102 | 58,945 | |||||||||||||||||
| Total cost of revenues | 53,988 | 41,980 | 95,968 | 127,096 | 131,518 | 258,614 | |||||||||||||||||
| Segment gross margin | |||||||||||||||||||||||
| Service margin | 51,804 | 103,194 | 154,998 | 137,426 | 322,181 | 459,607 | |||||||||||||||||
| Product margin | 517 | (3,124 | ) | (2,607 | ) | 1,330 | (10,682 | ) | (9,352 | ) | |||||||||||||
| Gross margin ex-USF (Service and product margin) | 52,321 | 100,070 | 152,391 | 138,756 | 311,499 | 450,255 | |||||||||||||||||
| USF margin | — | — | — | (11 | ) | — | (11 | ) | |||||||||||||||
| Segment gross margin | $ | 52,321 | $ | 100,070 | $ | 152,391 | $ | 138,745 | $ | 311,499 | $ | 450,244 | |||||||||||
| Segment gross margin % | |||||||||||||||||||||||
| Service margin % | 59.8 | % | 80.5 | % | 72.1 | % | 65.4 | % | 80.7 | % | 75.4 | % | |||||||||||
| Gross margin ex-USF (Service and product margin %) | 52.2 | % | 78.0 | % | 66.6 | % | 55.5 | % | 77.9 | % | 69.3 | % | |||||||||||
| Segment gross margin % | 49.2 | % | 70.4 | % | 61.4 | % | 52.2 | % | 70.3 | % | 63.5 | % | |||||||||||
| Three Months Ended | Nine Months Ended | ||||||||||||||
| September 30, | September 30, | ||||||||||||||
| 2017 | 2016 | 2017 | 2016 | ||||||||||||
| Total reportable gross margin | $ | 150,145 | $ | 152,391 | $ | 446,578 | $ | 450,244 | |||||||
| Sales and marketing | 73,576 | 83,731 | 235,245 | 246,676 | |||||||||||
| Engineering and development | 6,956 | 8,075 | 21,996 | 22,152 | |||||||||||
| General and administrative | 26,811 | 27,538 | 98,411 | 89,261 | |||||||||||
| Depreciation and amortization | 18,179 | 18,018 | 54,520 | 53,215 | |||||||||||
| Income from operations | 24,623 | 15,029 | 36,406 | 38,940 | |||||||||||
| Interest income | 3 | 19 | 12 | 65 | |||||||||||
| Interest expense | (3,821 | ) | (3,974 | ) | (11,385 | ) | (9,477 | ) | |||||||
| Other income (expense), net | 465 | (495 | ) | 931 | (237 | ) | |||||||||
| Income before income taxes | $ | 21,270 | $ | 10,579 | $ | 25,964 | $ | 29,291 | |||||||
Information about our operations by geographic location is as follows:
| September 30, 2021 | December 31, 2020 | ||||||||||
| Long-lived assets: | |||||||||||
| United States | $ | 626,966 | $ | 646,072 | |||||||
| United Kingdom | 279,653 | 293,457 | |||||||||
| Israel | 1,005 | 1,325 | |||||||||
| $ | 907,624 | $ | 940,854 | ||||||||
25
| Three Months Ended | Nine Months Ended | ||||||||||||||
| September 30, | September 30, | ||||||||||||||
| 2017 | 2016 | 2017 | 2016 | ||||||||||||
| Revenues: | |||||||||||||||
| United States | $ | 212,346 | $ | 220,262 | $ | 639,852 | $ | 655,350 | |||||||
| Canada | 6,877 | 6,878 | 23,324 | 19,491 | |||||||||||
| United Kingdom | 7,175 | 5,021 | 15,419 | 12,636 | |||||||||||
Other Countries (1) | 26,685 | 16,198 | 69,671 | 21,381 | |||||||||||
| $ | 253,083 | $ | 248,359 | $ | 748,266 | $ | 708,858 | ||||||||
| September 30, 2017 | December 31, 2016 | ||||||
| Long-lived assets: | |||||||
| United States | $ | 621,750 | $ | 629,269 | |||
| United Kingdom | 392 | 450 | |||||
| Israel | 249 | 286 | |||||
| $ | 622,391 | $ | 630,005 | ||||
| Three Months Ended | Nine Months Ended | |||||||||||||||
| September 30, | September 30, | |||||||||||||||
| 2017 | 2016 | 2017 | 2016 | |||||||||||||
| Income before income taxes | $ | 21,270 | $ | 10,579 | $ | 25,964 | $ | 29,291 | ||||||||
| Income tax expense | (10,668 | ) | (3,539 | ) | (4,624 | ) | (14,102 | ) | ||||||||
| Effective tax rate | 50.2 | % | 33.5 | % | 17.8 | % | 48.1 | % | ||||||||
| Item 2. | Management’s Discussion and Analysis of Financial Condition and Results of Operations | ||||
You should read the following discussion together with our condensed consolidated financial statements and the related notes included elsewhere in this Form 10-Q and our audited financial statements included in our Annual Report on Form 10-K. This discussion contains forward-looking statements. These forward-looking statements are based on information available at the time the statements are made and/or management’s belief as of that time with respect to future events and involve risks and uncertainties that could cause actual results and outcomes to be materially different. Important factors that could cause such differences include but are not limited to: realizing the benefits of optimization and cost-saving initiatives; the impact of the COVID-19 pandemic; the competition we face; the expansion of competition in the cloud communications market; risks related to the acquisition or integration of businesses we have acquired; our ability to adapt to rapid changes in the cloud communications market; the nascent state of the cloud communications for business market; our ability to retain customers and attract new customers;customers cost-effectively; the risk associated with developing and maintaining effective internal sales teams and effective distribution channels; risks related to the acquisition or integration of businesses we have acquired; security breaches and other compromises of information security; risks associated with sales of our services to medium-sized and enterprise customers; our reliance on third partythird-party hardware and software; our dependence on third partythird-party facilities, equipment, systems and services; system disruptions or flaws in our technology and systems; our ability to comply with data privacy and related regulatory matters; our ability to scale our business and grow efficiently; our dependence on third party vendors; the impact of fluctuations in economic conditions, particularly on our small and medium business customers; our ability to comply with data privacy and related regulatory matters; our ability to obtain or maintain relevant intellectual property licenses; failurelicenses or to protect our trademarks and internally developed software; restrictions in our debt agreements that may limit our operating flexibility; our ability to obtain additional financing if required; our ability to raise funds necessary to settle conversion of the 2024 convertible senior notes; conditional conversion features of the convertible senior notes; the cash settlement of the convertible senior notes; the effects of the capped call transactions in connection with the convertible senior notes; fraudulent use of our name or services; intellectual property and other litigation that have been and may be brought against us; reliance on third parties for our 911 services; uncertainties relating to regulation of VoIPbusiness services; risks associated with legislative, regulatory or judicial actions regarding our CPaaSbusiness products; the impact of governmental export controls or sanctions on our CPaaS products; our ability to establish and expand strategic alliances; risks associated with operating abroad; risks associated with the taxation of our business; risks associated with a material weakness in our internal controls; our dependence upon key personnel; governmental regulation and taxes in our international operations; liability under anti-corruption laws;laws or from governmental export controls or economic sanctions; our dependence on our customers' existingunimpeded access to broadband connections; differences between our services and traditional telephone service; restrictions in our debt agreements that may limit our operating flexibility; foreign currency exchange risk; the market for our stock; our ability to obtain additional financing if required; any reinstatement of holdbacks by our credit card processors; our history of net losses and ability to achieve consistent profitability in the future; our ability to fully realize the benefits of our net operating loss carry-forwards if an ownership change occurs; certain provisions of our charter documents; and other factors that are set forth in theunder “Risk Factors” in Item 1A of our Annual Report on Form 10-K in our Quarterly Reports on Form 10-Q and in our Current Reports on Form 8-K.for the fiscal year ended December 31, 2020. While we may elect to update forward-looking statements at some point in the future, we specifically disclaim any obligation to do so, and therefore, you should not rely on these forward-looking statements as representing our views as of any date subsequent to the date this Form 10-Q is filed with the Securities and Exchange Commission.
Financial Information Presentation
Management's discussion and analysis of financial condition and results of operations is provided as a supplement to, and should be read in connection with, the consolidated financial statements and related notes thereof. For the financial information discussed in this Quarterly Report on Form 10-Q, other than per share per line and per seatline amounts, dollar amounts are presented in thousands, except where noted. All trademarks are the property of their owners.
Overview and Strategy
At Vonage, our vision is to accelerate the world's ability to connect. We are observing a secular change in the way business is done, with a fundamental shift in how communications technologies are being leveraged in almost every industry. Through the Vonage Communications Platform, our strategy is to deliver a single leading provider of cloud communications services for businessesplatform that powers our customers' and consumers. Our business services transform the way people work and businesses operate through a portfolio of communicationspartners' global engagement solutions that enable internal collaboration among employees, while also keeping companies closely connected with their customers, across any mode of communication, on any cloud-connected device. Vonage customers can choose among or combine two separate service delivery options to suit their specific cloud communication needs. They can buy Vonage Business as a subscription and they can buyusing our Vonage API Platform and consume our cloud communication as a service product as programmable modules, delivered via application program interfaces. We also provide a robust suite of feature-rich residential communication solutions.
Our business is organized under two reportable operating segments: Vonage Communications Platform and Consumer. The Vonage Communications Platform includes our Unified Communications, Contact Center Communications, and APIs service offerings and represents the Company’s strategic business as the source of future growth. Our Consumer segment includes our communications solutions for residential customers to communicate with their customers and employees through any cloud-connected device,based on our roots in any place, at any time withoutproviding VoIP communication services.
26
Vonage Communications Platform
Our strategic business is the often costly investment required with on-site equipment. We haveVonage Communications Platform which delivers a robust set of product families tailored to serve the full range of the business value chain, from the small and medium business, or SMB, market, through mid-market and enterprise markets. We provide customers with multiple deployment options, designed to provide the reliability and quality of service they demand. We provide customers the ability to integrate oursingle leading cloud communications platform with many cloud-based productivitythat powers our customers' and CRMpartners' global engagement solutions using our APIs, Unified Communications, and Contact Center innovations. The Vonage Communications Platform brings unique value to businesses by providing multiple communications channels - including Google’s G Suite, Zendesk, Salesforce’s Sales Cloud, Oracle,video, voice, messaging, email, verification, and Clio.
Consumer
For our Consumer customers, we enable users to access and utilize our services and features, via their existing internet connections, including over 3G/4G, LTE, Cable, or DSL broadband networks. This technology enables us to offer our Consumer customers attractively priced voice communicationand messaging services and other features around the world on a variety of devices.
Our Consumer strategy is focused on the continued penetration of our core North American markets, where we will continue towhich provide value in domestic and international long distance and target under-served segments.
Services outsideOutside of the United States. States
We currently have UCaaS and consumer operations in the United States, United Kingdom, and Canada and believe that our low-cost Internet based communications platform enables us to cost effectively deliver voice and messaging services to other locations throughout the world. Through Nexmo, we have operations in the United States, United Kingdom, Canada, Israel, Hong Kong, and Singapore, and provide CPaaSa wide range of communications solutions to our customers located in many countries around the world.
A novel strain of coronavirus, or COVID-19, was first identified in China in December 2019 and subsequently declared a pandemic on March 11, 2020, by the World Health Organization. To date, COVID-19 has impacted nearly all regions around the world and resulted in travel restrictions and business seats asslowdowns worldwide. The full impact of September 30, 2017. Customersthe pandemic on our business, operations and financial results has and will depend on various factors that continue to evolve, which we may not accurately predict. In response to the COVID-19 pandemic, governments across the world have enacted measures aimed at containing the spread of the virus, including the practice of social distancing when engaging in authorized activities. While some of these restrictions have been lifted on a global scale, many regions, including the United States represented 84%where Vonage is headquartered, are experiencing a resurgence of COVID-19 variants. As a result of the ongoing COVID-19 pandemic, typical business travel remains at reduced levels to protect the health of our consolidated revenues atemployees and to comply with local guidelines, and we have also continued modified usage of Vonage offices worldwide to comply with social distancing (including our corporate headquarters), all of which disrupt how we typically operate our business.
COVID-19 has impacted some of our customers more than others, including customers in the travel, hospitality, retail, and other industries where physical interaction is critical. We have experienced and expect that we will continue to experience slowdowns in bookings and customer payments, customer churn and reduced usage, and issuance of customer credits to distressed customers served by certain product lines in the Vonage Communications Platform. In addition, COVID-19 may have impacts on many additional aspects of our operations, directly and indirectly, including with respect to its impacts on customer behaviors, our business and our employees, and the market generally, and the scope and nature of these impacts continue to evolve each day.
Recent Significant Events
On October 18, 2021, the Company completed the acquisition of certain assets and liabilities of Jumper AI Pte. Ltd. for cash consideration of $7 million. The Company expects to allocate the purchase price primarily to developed technology and customer relationships. The Company may make additional payments of up to $9 million over the next two years subject to continuing employment of key individuals and achievement of certain financial targets.
During the three months ended September 30, 2017,2021, the Company entered into a new lease agreement to relocate its corporate headquarters to a new leased facility located in Holmdel, New Jersey. As a result, the Company expects to incur a charge associated with the balanceabandonment of its former corporate headquarters in Canada, the United Kingdom, and other countries. Nexmo has operations in the United States, United Kingdom, Hong Kong, and Singapore, and provides CPaaS solutions to our customers located in many countries around the world.early 2022 upon successful relocation.
27
Trends in Our Industry
A number of trends in our industry have a significant effect on our results of operations and are important to an understanding of our financial statements.
Competitive landscape. The business cloud communications markets and consumer services market in which we participate are highly competitive. We face intense competition from a broad set of companies, including (i) SaaS companies, CCaaS companies, other alternative communication providers, other providers of cloud communication services and (ii) traditional telephone, companies, wireless companies,service providers, cable companies, and alternative communication providers. Most traditional wirelinecommunications providers with consumer offerings. As the cloud communications market evolves, and wireless telephone service providersthe convergence of voice, video, messaging, mobility and cable companies are substantially larger and better capitalized thandata networking technologies accelerates, we are and have the advantage of a large existing customer base. In addition, because our competitors provide other services, they often choose to offer VoIP services or other voice services as part of a bundle that includes other products, such as video, high speed Internet access, and wireless telephone service, which we do not offer. In addition, such competitors may face competition in the future require newfrom companies that do not currently compete in the market, including companies that currently compete in other sectors, companies that serve consumers rather than business customers, or existing customers making changescompanies which expand their market presence to their serviceinclude cloud communications. Moreover, as businesses and educational institutions are quickly pivoting to purchase voice services when purchasing high speed Internet access. Further, as wireless providers offer more minutes at lower prices, better coverage,cloud-based communications in light the increased need for remote work and companion landline alternative services, their services have become more attractiveremote learning due to households as a replacement for wireline service. We also compete against alternative communication providers, such as Twilio, Ooma, magicJack, Skype, WhatsApp, and Google Voice. Some of these service providers have chosen to sacrifice telephony revenue in order to gain market share and have offered their services at low prices or for free. As we continue to introduce applications that integrate different forms of voice and messaging services over multiple devices,the COVID-19 pandemic, we are facingexperiencing intense competition from our existing competitors, and also emerging competitors, focused on similar integration, as well as from alternative voice communication providers. In addition, our competitors have partnered and may in the future partner with other competitorsseeking to offer products and services, leveraging their collective competitive positions. We also are subject to the risk of future disruptive technologies. In connection with our emphasiscapitalize on the international long distance market in the United States, we face competition from low-cost international calling cardsgrowing needs for businesses and VoIP providers in additioneducators to traditional telephone companies, cable companies, and wireless companies, each of which may implement promotional pricing targeting international long distance callers.transform their operations.
Regulation. Our business has developed in a relatively lightly regulated environment. The United States and other countries, however, are examining how VoIP services should be regulated. In particular, state telecommunications regulators continue to try to regulate VoIP service despite the FCC’s 2004 Vonage Preemption Order that preempted state regulation. For example, on July 28, 2015, the Minnesota Public Utility Commission found that it has authority to regulate Charter’s ‘fixed' interconnected VoIP service. In addition to regulatory matters that directly address VoIP, a number of other regulatory initiatives could impact our business. One such regulatory initiative is net neutrality. On February 26, 2015, the FCC adopted strong net neutrality rules. Several parties filed appeals which are pending at the D.C. Circuit Court of Appeals. Oral arguments at the D.C. Circuit Court of Appeals were held on December 4, 2015. On June 14, 2016, the D.C. Circuit of Appeals denied the appeals. Several parties filed a petition for rehearing en banc on July 29, 2016, which was denied on May 1, 2017. See also the discussion under "Regulation" in Note 79 to our condensed consolidated financial statements for a discussion of regulatory issues that impact us. On July 2, 2017, Chief Justice John Roberts extended the time within which interested parties could file a petition for a writ of certiorari until September 28, 2017. Multiple interest parties and intervenors filed petitions. The Supreme Court has not yet ruled on the petitions.
Key Operating Data
The table below includes key operating data that our management uses to measure the growth and operating performance of the BusinessVonage Communications Platform segment:
Vonage Communications Platform | Three Months Ended | Nine Months Ended | ||||||||||||||||||||||||
| September 30, | September 30, | |||||||||||||||||||||||||
| 2021 | 2020 | 2021 | 2020 | |||||||||||||||||||||||
| Service revenue per customer | $ | 657 | $ | 527 | $ | 624 | $ | 504 | ||||||||||||||||||
| Vonage Communications Platform service revenue churn | 0.6 | % | 1.2 | % | 0.7 | % | 1.0 | % | ||||||||||||||||||
Business | Three Months Ended | Nine Months Ended | ||||||||||||||
| September 30, | September 30, | |||||||||||||||
| 2017 | 2016 | 2017 | 2016 | |||||||||||||
Revenues (1) | $ | 129,306 | $ | 106,309 | $ | 364,822 | $ | 265,841 | ||||||||
Average monthly revenues per seat (2) | $ | 43.53 | $ | 45.50 | $ | 43.70 | $ | 44.96 | ||||||||
Seats (at period end) (2) | 709,736 | 615,728 | 709,736 | 615,728 | ||||||||||||
Revenue churn (2) | 1.2 | % | 1.4 | % | 1.3 | % | 1.4 | % | ||||||||
Vonage Communications Platform Service Revenue Churn. RevenueChurn. Vonage Communications Platform service revenue churn is calculated by dividing the monthly recurringservice revenue from customers or customer locations that have terminatedbeen confirmed to be foregone during a period by the simple average of the total monthly recurringservice revenue from all customers in that period. Service revenue for purposes of determining VCP revenue churn is service revenue excluding revenue from our trading and auction customers, and usage in excess of a given period.customer’s contracted service plan, regulatory fees charged to customers, and credits. The simple average of total monthly recurringservice revenue from all customers during the period is the total monthly recurringservice revenue as defined herein on the first day of the period, plus the total monthly recurringservice revenue as defined herein on the last day of the period, divided by two. Terminations, as used in the calculation of churn statistics, do not include customers terminated during the period if termination occurred within the first month after activation. Other companies may calculate service revenue churn differently, and their service revenue churn data may not be directly comparable to ours. RevenueVonage Communications Platform revenue churn was 1.4%decreased from 1.2% for the three andmonths ended September 30, 2020 to 0.6% for the three months ended September 30, 2021. Vonage Communications Platform revenue churn decreased from 1.0% for the nine months ended September 30, 2016, respectively, and 1.2% and 1.3%2020 to 0.7% for the three and nine months ended months ended September 30, 2017, respectively.2021. Our service revenue churn willmay fluctuate over time due to economic conditions, seasonality in certain customer's operations, loss of customers who are acquired, and competitive pressures including promotional pricing. We are continuing to invest in our overall quality of service which includes customer care headcount and systems, billing systems, on-boarding processes and self-service options to ensure we scale our processes to our growth and continue to improve the overall customer experience.
28
The table below includes key operating data that our management uses to measure the growth and operating performance of the Consumer segment:
| Consumer | Three Months Ended | Nine Months Ended | ||||||||||||||||||||||||
| September 30, | September 30, | |||||||||||||||||||||||||
| 2021 | 2020 | 2021 | 2020 | |||||||||||||||||||||||
| Average monthly revenues per subscriber line | $ | 28.47 | $ | 28.31 | $ | 28.82 | $ | 27.71 | ||||||||||||||||||
| Subscriber lines (at period end) | 807,265 | 951,729 | 807,265 | 951,729 | ||||||||||||||||||||||
| Customer churn | 1.5 | % | 1.8 | % | 1.5 | % | 1.7 | % | ||||||||||||||||||
| Consumer | Three Months Ended | Nine Months Ended | ||||||||||||||
| September 30, | September 30, | |||||||||||||||
| 2017 | 2016 | 2017 | 2016 | |||||||||||||
| Revenues | $ | 123,777 | $ | 142,050 | $ | 383,444 | $ | 443,017 | ||||||||
| Average monthly revenues per subscriber line | $ | 26.29 | $ | 26.36 | $ | 26.18 | $ | 26.55 | ||||||||
| Subscriber lines (at period end) | 1,543,760 | 1,767,212 | 1,543,760 | 1,767,212 | ||||||||||||
| Customer churn | 1.9 | % | 2.2 | % | 2.0 | % | 2.2 | % | ||||||||
Average monthly revenuesMonthly Revenues per subscriber line. Subscriber Line. Average monthly revenues per subscriber line for a particular period is calculated by dividing our revenues for that period by the simple average number of subscriber lines for the period, and dividing the result by the number of months in the period. The simple average number of subscriber lines for the period is the number of subscriber lines on the first day of the period, plus the number of subscriber lines on the last day of the period, divided by two. Our average monthly revenues per subscriber line decreasedincreased from $26.36 and $26.55$28.31 for the three andmonths ended September 30, 2020 to $28.47 for the three months ended September 30, 2021 due primarily to the Company's ability to retain its more tenured customers. Our average monthly revenues per subscriber line increased from $27.71 for the nine months ended September 30, 2016, respectively2020 to $26.29 and $26.18$28.82 for the three and nine months ended September 30, 2017, respectively,2021 due primarily to lower international long distance pay-per-use revenue.the Company's ability to retain its more tenured customers.
Subscriber lines. Lines. Our subscriber lines include, as of a particular date, all paid subscriber lines from which a customer can make an outbound telephone call on that date. Our subscriber lines include fax lines, including fax lines bundled with subscriber lines in our small office home office calling plans and soft phones, but do not include our virtual phone numbers and toll free numbers, which only allow inbound telephone calls to customers. Subscriber lines decreased from 1,767,212951,729 as of September 30, 20162020 to 1,543,760807,265 as of September 30, 2017,2021, reflecting planned actions to enhance the profitability of the assisted sales channel byincluding eliminating lower performing locationssales channels and restructuring the pricing offers, and to shiftmanaging customer churn while shifting investment to our business market.
Customer churn. Churn. Customer churn is calculated by dividing the number of customers that have terminated during a period by the simple average of number of customers in a given period. The simple average number of customers during the period is the number of customers on the first day of the period, plus the number of customers on the last day of the period, divided by two. Terminations, as used in the calculation of churn statistics, do not include customers terminated during the period if termination occurred within the first month after activation. Other companies may calculate customer churn differently, and their customer churn data may not be directly comparable to ours. Customer churn decreased from 2.2%to 1.5% for both the three andmonths ended September 30, 2021 from 1.8% for the three months ended September 30, 2020, respectively. Customer churn decreased to 1.5% for the nine months ended September 30, 2016, to 1.9% and 2.0%2021 from 1.7% for the three and nine months ended September 30, 2017,2020, respectively. We maximize customer value by focusing marketing spend on higher return channels and away from assisted selling channels which had higher early life churn. We monitor customer churn on a daily basis and use it as an indicator of the level of customer satisfaction. Customers who have been with us for a year or more tend to have a lower churn rate than customers who have not. In addition, our customers who are international callers generally churn at a lower rate than customers who are domestic callers. Our customer churn will fluctuate over time due to economic conditions, competitive pressures including promotional pricing targeting international long distance callers, marketplace perception of our services, and our ability to provide high quality customer care and network quality and add future innovative products and services. See the discussion above for detail regarding churn impacting our business customers.
29
REVENUE
Revenues consist of services revenue and customer equipment and shipping fee revenue. Substantially all of our revenues are services revenue. For Consumer customers in the United States, we offer domestic and international rate plans, including a variety of residential plans and mobile plans. For our VCP customers, we offer micro, SMB, mid-market, and enterprise customers several service plans with different pricing structures and contractual requirements ranging in duration from month-to-month to three years. In addition, we provide managed equipment to VCP customers for which the customers pay a monthly fee. Customers also have the opportunity to purchase premium features for additional fees. In addition, we derive revenue from usage-based fees earned from customers using our cloud-based software products. These usage-based software products include our messaging, voice, Verify and chat APIs. Usage-based fees include number of text messages sent or received using our messaging APIs, minutes of call duration activity for our voice APIs, and number of converted authentications for our Verify API. Services revenue is offset by the cost of certain customer acquisition activities, such as rebates and promotions. In addition, in certain instances, we charge disconnect fees which are recognized as revenue at the time the disconnect fees are collected from our customer.
In the United States, we charge regulatory, compliance and intellectual property, and E-911 recovery fees on a monthly basis to defray costs, and to cover taxes that we are charged by the suppliers of telecommunications services. In addition, we recognize revenue on a gross basis for contributions to the USF and related fees. All other taxes are recorded on a net basis.
Revenues are generated from sales of customer equipment directly to customers for replacement devices, or for upgrading their device at the time of customer sign-up for which we charge an additional fee. In addition, customer equipment and shipping revenues include revenues from the sale of VoIP telephones in order to access our small and medium business services. Customer equipment and shipping revenues also include the fees that customers are charged for shipping their customer equipment to them.
OPERATING EXPENSES
Operating expenses consist of cost of revenues, sales and marketing expense, engineering and development expense, general and administrative expense, and depreciation and amortization.
30
Results of Operations
The following table sets forth as a percentage of total revenues, our condensed consolidated statementstatements of operations for the periods indicated:
| Three Months Ended | Nine Months Ended | |||||||||||||||||||||||||
| September 30, | September 30, | |||||||||||||||||||||||||
| 2021 | 2020 | 2021 | 2020 | |||||||||||||||||||||||
| Total revenues | $ | 358,341 | $ | 316,649 | $ | 1,042,710 | $ | 924,639 | ||||||||||||||||||
| Operating Expenses: | ||||||||||||||||||||||||||
| Cost of revenues (exclusive of depreciation and amortization) | 177,864 | 141,901 | 503,448 | 403,307 | ||||||||||||||||||||||
| Sales and marketing | 86,826 | 85,505 | 254,515 | 261,953 | ||||||||||||||||||||||
| Engineering and development | 17,636 | 20,110 | 60,706 | 59,097 | ||||||||||||||||||||||
| General and administrative | 44,063 | 56,835 | 132,297 | 140,537 | ||||||||||||||||||||||
| Depreciation and amortization | 22,507 | 22,887 | 65,208 | 64,064 | ||||||||||||||||||||||
| Total operating expenses | 348,896 | 327,238 | 1,016,174 | 928,958 | ||||||||||||||||||||||
| Income from operations | 9,445 | (10,589) | 26,536 | (4,319) | ||||||||||||||||||||||
| Other Income (Expense): | ||||||||||||||||||||||||||
| Interest expense | (7,045) | (7,373) | (21,424) | (24,776) | ||||||||||||||||||||||
| Other income (expense), net | (100) | (37) | (214) | 154 | ||||||||||||||||||||||
| Total other income (expense), net | (7,145) | (7,410) | (21,638) | (24,622) | ||||||||||||||||||||||
| Income (Loss) before income tax benefit | 2,300 | (17,999) | 4,898 | (28,941) | ||||||||||||||||||||||
| Income tax (expense) benefit | (4,332) | 7,937 | (7,244) | 6,694 | ||||||||||||||||||||||
| Net loss | $ | (2,032) | $ | (10,062) | $ | (2,346) | $ | (22,247) | ||||||||||||||||||
| Three Months Ended | Nine Months Ended | |||||||||||
| September 30, | September 30, | |||||||||||
| 2017 | 2016 | 2017 | 2016 | |||||||||
| Total revenues | 100 | % | 100 | % | 100 | % | 100 | % | ||||
| Operating Expenses: | ||||||||||||
| Cost of service (exclusive of depreciation and amortization) | 38 | 35 | 38 | 33 | ||||||||
| Cost of goods sold | 3 | 4 | 3 | 4 | ||||||||
| Sales and marketing | 29 | 34 | 31 | 35 | ||||||||
| Engineering and development | 3 | 3 | 3 | 3 | ||||||||
| General and administrative | 11 | 11 | 13 | 13 | ||||||||
| Depreciation and amortization | 7 | 7 | 7 | 7 | ||||||||
| Total operating expenses | 91 | 94 | 95 | 95 | ||||||||
| Income from operations | 9 | 6 | 5 | 5 | ||||||||
| Other Income (Expense): | ||||||||||||
| Interest income | — | — | — | — | ||||||||
| Interest expense | (1 | ) | (2 | ) | (1 | ) | (1 | ) | ||||
| Other income (expense), net | — | — | — | — | ||||||||
| Total other income (expense), net | (1 | ) | (2 | ) | (1 | ) | (1 | ) | ||||
| Income before income taxes | 8 | 4 | 4 | 4 | ||||||||
| Income tax benefit (expense) | (4 | ) | (1 | ) | (1 | ) | (2 | ) | ||||
| Net income | 4 | % | 3 | % | 3 | % | 2 | % | ||||
Management's discussionDiscussion of the resultsResults of operationsOperations for the Three and Nine Months Ended September 30, 20172021 and 20162020
The Company reported income before income taxes of $2,300 and loss before income taxes of $17,999 for the three months ended September 30, 2021 and September 30, 2020, respectively. The income before income taxes for the three months ended September 30, 2021 was primarily due to higher gross margin dollars of $5,729 driven by increased sales within the VCP platform primarily associated with the 43% growth in API services as compared to the prior year quarter along with a decrease in operating expenses of $14,305 driven by lower general and administrative expenses as the prior year quarter includes restructuring charges that did not reoccur in the current year quarter.
The Company reported income before income taxes of $4,898 and loss before income taxes of $28,941 for the nine months ended September 30, 2021 and September 30, 2020, respectively. The income before income taxes for the nine months ended September 30, 2021 was primarily due to higher gross margin dollars of $17,930 driven by increased sales within the VCP platform primarily associated with the 43% growth in API services and lower operating expenses of $12,925 as compared to the nine months ended September 30, 2020 due to decreased general and administrative expenses.
31
The Company reported net loss of $2,032 and $10,062 for the three months ended September 30, 2021 and September 30, 2020, respectively. The Company reported net loss of $2,346 and $22,247 for the nine months ended September 30, 2021 and September 30, 2020, respectively. The decrease in net loss for the three and nine months ended September 30, 2021 compared to the three and nine months ended September 30, 2020 was due to the income before income taxes for the three and nine months ended September 30, 2021 and loss before income taxes for the three and nine months ended September 30, 2020 as discussed above. While the Company reported income before income tax for the three and nine months ended September 30, 2021 and loss before income tax for the three and nine months ended September 30, 2020, the Company recognized tax expense of $4,332 and $7,244, respectively, during the three and nine months ended September 30, 2021 and tax benefit of $7,937 and $6,694, respectively, during the three and nine months ended September 30, 2020. The tax expense during the three and nine months ended September 30, 2021 was driven by an increase in permanent items related to limitations on executive compensation, the inclusion of foreign income in the U.S. due to foreign disregarded entities, and limitation on foreign losses. In addition, the Company recorded a current year benefit of $1.8 million related to a partial research and development tax credit associated with earlier years.
Segment Adjusted EBITDA
The following graphs illustrate the composition of our Adjusted EBITDA with respect to each of our reportable segments for the three and nine months ended September 30, 2021 and September 30, 2020.
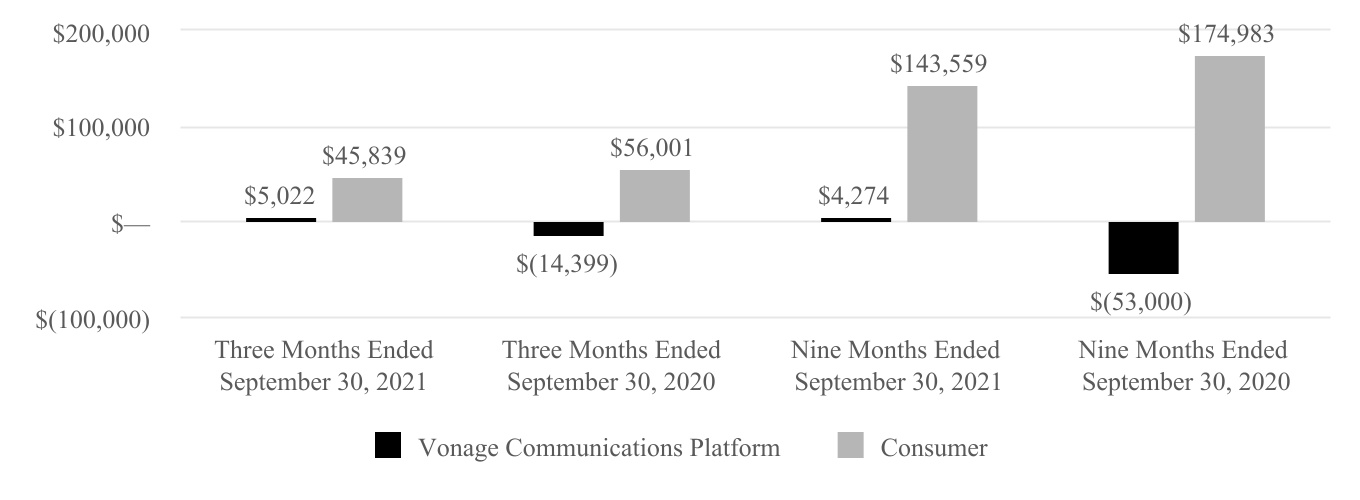
The Adjusted EBITDA for Vonage Communications Platform has improved from loss of $14,399 and $53,000 for the three and nine months ended September 30, 2020 to income of $5,022 and $4,274 for the three and nine months ended September 30, 2021, respectively. This improvement in Vonage Communications Platform Adjusted EBITDA is primarily due to an increase in Vonage Communications Platform gross margin dollars of $16,646 and $51,948, respectively, for the three and nine months ended September 30, 2021, as the Company experience growth in API services as compared to the prior year. Adjusted EBITDA for Vonage Communications Platform was also positively impacted in the three and nine months ended September 30, 2021 due to cost saving initiatives executed in the second half of 2020. The decline of Consumer Adjusted EBITDA for the three and nine months ended September 30, 2021 as compared to the three and nine months ended September 30, 2020 is primarily driven by the decrease in subscriber lines year over year as further described below.
32
Consolidated Gross Margin for the Three and Nine Months Ended September 30, 2021 and September 30, 2020
We calculate gross margin in order to evaluate operating revenues as total revenues less cost of service,revenues, which primarily consists of fees that we pay to third parties on an ongoing basis in order to provide our services and cost of goods sold which primarily includes costs incurred when a customer first subscribes to our service. The following table presents consolidated revenues, cost of revenues and the composition of gross margin for the three and nine month periods endingmonths ended September 30, 20172021 and 2016:September 30, 2020:
| (in thousands, except percentages) | Three Months Ended | Nine Months Ended | ||||||||||||||||||||||||||||||||||||||||||||||||
| September 30, | September 30, | |||||||||||||||||||||||||||||||||||||||||||||||||
| 2021 | 2020 | Dollar Change | Percent Change | 2021 | 2020 | Dollar Change | Percent Change | |||||||||||||||||||||||||||||||||||||||||||
| Service, access and product revenues | $ | 341,544 | $ | 298,991 | $ | 42,553 | 14 | % | $ | 988,896 | $ | 878,584 | $ | 110,312 | 13 | % | ||||||||||||||||||||||||||||||||||
| USF revenues | 16,797 | 17,658 | (861) | (5) | % | $ | 53,814 | $ | 46,055 | $ | 7,759 | 17 | % | |||||||||||||||||||||||||||||||||||||
| Total revenues | 358,341 | 316,649 | 41,692 | 13 | % | $ | 1,042,710 | $ | 924,639 | $ | 118,071 | 13 | % | |||||||||||||||||||||||||||||||||||||
| Service, access and product cost of revenues | 161,067 | 124,243 | 36,824 | 30 | % | 449,634 | 357,252 | 92,382 | 26 | % | ||||||||||||||||||||||||||||||||||||||||
| USF cost of revenues | 16,797 | 17,658 | (861) | (5) | % | 53,814 | 46,055 | 7,759 | 17 | % | ||||||||||||||||||||||||||||||||||||||||
Total cost of revenues (1) | 177,864 | 141,901 | 35,963 | 25 | % | 503,448 | 403,307 | 100,141 | 25 | % | ||||||||||||||||||||||||||||||||||||||||
| Gross margin | $ | 180,477 | $ | 174,748 | $ | 5,729 | 3 | % | $ | 539,262 | $ | 521,332 | $ | 17,930 | 3 | % | ||||||||||||||||||||||||||||||||||
| (in thousands, except percentages) | Three Months Ended | Nine Months Ended | ||||||||||||||||||||||||||||
| September 30, | September 30, | |||||||||||||||||||||||||||||
| 2017 | 2016 | Dollar Change | Percent Change | 2017 | 2016 | Dollar Change | Percent Change | |||||||||||||||||||||||
| Total revenues | $ | 253,083 | $ | 248,359 | $ | 4,724 | 2 | % | $ | 748,266 | $ | 708,858 | $ | 39,408 | 6 | % | ||||||||||||||
| Cost of service | 96,632 | 87,377 | 9,255 | 11 | % | 281,902 | 232,605 | 49,297 | 21 | % | ||||||||||||||||||||
| Cost of goods sold | 6,306 | 8,591 | (2,285 | ) | (27 | )% | 19,786 | 26,009 | (6,223 | ) | (24 | )% | ||||||||||||||||||
| Gross margin | $ | 150,145 | $ | 152,391 | $ | (2,246 | ) | (1 | )% | $ | 446,578 | $ | 450,244 | $ | (3,666 | ) | (1 | )% | ||||||||||||
(1) Excludes depreciation and amortization of $6,852$15,817 and $7,460$13,649 for the three months ended September 30, 20172021 and 2016,2020, respectively and $20,497$44,979 and $21,278$35,953 for the nine months ended September 30, 20172021 and 2016,2020, respectively.
Total revenues and cost of revenues were impacted by the following trends and uncertainties:
| Three Months Ended | Nine Months Ended | |||||||||||||||||||||||||||||
| September 30, | September 30, | |||||||||||||||||||||||||||||
| (in thousands, except percentages) | 2017 | 2016 | Dollar Change | Percent Change | 2017 | 2016 | Dollar Change | Percent Change | ||||||||||||||||||||||
| Revenues | ||||||||||||||||||||||||||||||
| Service revenues | $ | 109,483 | $ | 86,662 | $ | 22,821 | 26 | % | $ | 305,599 | $ | 210,214 | $ | 95,385 | 45 | % | ||||||||||||||
Product revenues (1) | 13,085 | 13,618 | (533 | ) | (4 | )% | 39,837 | 39,795 | 42 | — | % | |||||||||||||||||||
| Service and product revenues | 122,568 | 100,280 | 22,288 | 22 | % | 345,436 | 250,009 | 95,427 | 38 | % | ||||||||||||||||||||
| USF revenues | 6,738 | 6,029 | 709 | 12 | % | 19,386 | 15,832 | 3,554 | 22 | % | ||||||||||||||||||||
| Total revenues | 129,306 | 106,309 | 22,997 | 22 | % | 364,822 | 265,841 | 98,981 | 37 | % | ||||||||||||||||||||
| Cost of revenues | ||||||||||||||||||||||||||||||
Service cost of revenues (2) | 50,777 | 34,858 | 15,919 | 46 | % | 139,218 | 72,788 | 66,430 | 91 | % | ||||||||||||||||||||
Product cost of revenues (1) | 12,702 | 13,101 | (399 | ) | (3 | )% | 38,360 | 38,465 | (105 | ) | — | % | ||||||||||||||||||
| Service and product cost of revenues | 63,479 | 47,959 | 15,520 | 32 | % | 177,578 | 111,253 | 66,325 | 60 | % | ||||||||||||||||||||
| USF cost of revenues | 6,738 | 6,029 | 709 | 12 | % | 19,386 | 15,843 | 3,543 | 22 | % | ||||||||||||||||||||
| Total cost of revenues | 70,217 | 53,988 | 16,229 | 30 | % | 196,964 | 127,096 | 69,868 | 55 | % | ||||||||||||||||||||
| Segment gross margin | ||||||||||||||||||||||||||||||
| Service margin | 58,706 | 51,804 | 6,902 | 13 | % | 166,381 | 137,426 | 28,955 | 21 | % | ||||||||||||||||||||
| Gross margin ex-USF (Service and product margin) | 59,089 | 52,321 | 6,768 | 13 | % | 167,858 | 138,756 | 29,102 | 21 | % | ||||||||||||||||||||
| Segment gross margin | $ | 59,089 | $ | 52,321 | $ | 6,768 | 13 | % | $ | 167,858 | $ | 138,745 | $ | 29,113 | 21 | % | ||||||||||||||
| Segment gross Margin % | ||||||||||||||||||||
| Service margin % | 53.6 | % | 59.8 | % | 54.4 | % | 65.4 | % | ||||||||||||
| Gross margin ex-USF (Service and product margin) % | 48.2 | % | 52.2 | % | 48.6 | % | 55.5 | % | ||||||||||||
| Segment gross margin % | 45.7 | % | 49.2 | % | 46.0 | % | 52.2 | % | ||||||||||||
Three Months Ended September 30, 2017 compared2021 Compared to Three Months Ended September 30, 20162020
Nine Months Ended September 30, 2021 Compared to Nine Months Ended September 30, 2020
Total revenues increased 13% for the nine months ended September 30, 2021 as compared to the prior year period. The increase was primarily due to the VCP customer growth driving an increase in revenues of revenues. $149,695 as a result of increased usage of the Company's API product in the current year. Due to the increase in the USF rate, USF revenues increased as well. The increase in total revenues was partially offset by $709, or 12% and USFdeclining Consumer revenues of $31,624 in connection with the continued decline of Consumer subscriber lines.
Total cost of revenues increased 25% for the nine months ended September 30, 2021 as compared to the prior year period driven by $709, or 12%,increased costs incurred in servicing our VCP customers of $97,747 due to synchronization of methodologies across Business segment and increasethe 43% growth in the number of UCaaS seats.
33
| Three Months Ended | Nine Months Ended | |||||||||||||||||||||||||||||
| September 30, | September 30, | |||||||||||||||||||||||||||||
| (in thousands, except percentages) | 2017 | 2016 | Dollar Change | Percent Change | 2017 | 2016 | Dollar Change | Percent Change | ||||||||||||||||||||||
| Revenues | ||||||||||||||||||||||||||||||
| Service revenues | $ | 111,913 | $ | 128,167 | $ | (16,254 | ) | (13 | )% | $ | 346,666 | $ | 399,401 | $ | (52,735 | ) | (13 | )% | ||||||||||||
Product revenues (1) | 94 | 207 | (113 | ) | (55 | )% | 498 | 514 | (16 | ) | (3 | )% | ||||||||||||||||||
| Service and product revenues | 112,007 | 128,374 | (16,367 | ) | (13 | )% | 347,164 | 399,915 | (52,751 | ) | (13 | )% | ||||||||||||||||||
| USF revenues | 11,770 | 13,676 | (1,906 | ) | (14 | )% | 36,280 | 43,102 | (6,822 | ) | (16 | )% | ||||||||||||||||||
| Total revenues | 123,777 | 142,050 | (18,273 | ) | (13 | )% | 383,444 | 443,017 | (59,573 | ) | (13 | )% | ||||||||||||||||||
| Cost of revenues | ||||||||||||||||||||||||||||||
Service cost of revenues (2) | 19,434 | 24,973 | (5,539 | ) | (22 | )% | 62,969 | 77,220 | (14,251 | ) | (18 | )% | ||||||||||||||||||
Product cost of revenues (1) | 1,517 | 3,331 | (1,814 | ) | (54 | )% | 5,475 | 11,196 | (5,721 | ) | (51 | )% | ||||||||||||||||||
| Service and product cost of revenues | 20,951 | 28,304 | (7,353 | ) | (26 | )% | 68,444 | 88,416 | (19,972 | ) | (23 | )% | ||||||||||||||||||
| USF cost of revenues | 11,770 | 13,676 | (1,906 | ) | (14 | )% | 36,280 | 43,102 | (6,822 | ) | (16 | )% | ||||||||||||||||||
| Total cost of revenues | 32,721 | 41,980 | (9,259 | ) | (22 | )% | 104,724 | 131,518 | (26,794 | ) | (20 | )% | ||||||||||||||||||
| Segment gross margin | ||||||||||||||||||||||||||||||
| Service margin | 92,479 | 103,194 | (10,715 | ) | (10 | )% | 283,697 | 322,181 | (38,484 | ) | (12 | )% | ||||||||||||||||||
| Gross margin ex-USF (Service and product margin) | 91,056 | 100,070 | (9,014 | ) | (9 | )% | 278,720 | 311,499 | (32,779 | ) | (11 | )% | ||||||||||||||||||
| Segment gross margin | $ | 91,056 | $ | 100,070 | $ | (9,014 | ) | (9 | )% | $ | 278,720 | $ | 311,499 | $ | (32,779 | ) | (11 | )% | ||||||||||||
| Three Months Ended | Nine Months Ended | |||||||||||||||||||||||||||||||||||||||||||||||||
| September 30, | September 30, | |||||||||||||||||||||||||||||||||||||||||||||||||
| (in thousands, except percentages) | 2021 | 2020 | Dollar Change | Percent Change | 2021 | 2020 | Dollar Change | Percent Change | ||||||||||||||||||||||||||||||||||||||||||
| Revenues | ||||||||||||||||||||||||||||||||||||||||||||||||||
| Service revenues | $ | 274,031 | $ | 218,456 | $ | 55,575 | 25 | % | $ | 774,925 | $ | 626,416 | $ | 148,509 | 24 | % | ||||||||||||||||||||||||||||||||||
Access and product revenues(1) | 7,280 | 8,757 | (1,477) | (17) | % | 24,643 | 27,987 | (3,344) | (12) | % | ||||||||||||||||||||||||||||||||||||||||
| Service, access and product revenues excluding USF | 281,311 | 227,213 | 54,098 | 24 | % | 799,568 | 654,403 | 145,165 | 22 | % | ||||||||||||||||||||||||||||||||||||||||
| USF revenues | 6,845 | 6,613 | 232 | 4 | % | 20,455 | 15,925 | 4,530 | 28 | % | ||||||||||||||||||||||||||||||||||||||||
| Total revenues | 288,156 | 233,826 | 54,330 | 23 | % | 820,023 | 670,328 | 149,695 | 22 | % | ||||||||||||||||||||||||||||||||||||||||
| Cost of revenues | ||||||||||||||||||||||||||||||||||||||||||||||||||
Service cost of revenues (2) | 144,156 | 105,593 | 38,563 | 37 | % | 394,524 | 298,588 | 95,936 | 32 | % | ||||||||||||||||||||||||||||||||||||||||
Access and product cost of revenues (1) | 8,783 | 9,894 | (1,111) | (11) | % | 29,037 | 31,756 | (2,719) | (9) | % | ||||||||||||||||||||||||||||||||||||||||
| Service, access and product cost of revenues excluding USF | 152,939 | 115,487 | 37,452 | 32 | % | 423,561 | 330,344 | 93,217 | 28 | % | ||||||||||||||||||||||||||||||||||||||||
| USF cost of revenues | 6,845 | 6,613 | 232 | 4 | % | 20,455 | 15,925 | 4,530 | 28 | % | ||||||||||||||||||||||||||||||||||||||||
| Total cost of revenues | 159,784 | 122,100 | 37,684 | 31 | % | 444,016 | 346,269 | 97,747 | 28 | % | ||||||||||||||||||||||||||||||||||||||||
| Segment gross margin | ||||||||||||||||||||||||||||||||||||||||||||||||||
| Service margin | 129,875 | 112,863 | 17,012 | 15 | % | 380,401 | 327,828 | 52,573 | 16 | % | ||||||||||||||||||||||||||||||||||||||||
| Gross margin excluding USF (Service, access and product margin) | 128,372 | 111,726 | 16,646 | 15 | % | 376,007 | 324,059 | 51,948 | 16 | % | ||||||||||||||||||||||||||||||||||||||||
| Segment gross margin | $ | 128,372 | $ | 111,726 | $ | 16,646 | 15 | % | $ | 376,007 | $ | 324,059 | $ | 51,948 | 16 | % | ||||||||||||||||||||||||||||||||||
| Segment gross Margin % | ||||||||||||||||||||||||||||||||||||||||||||||||||
| Service margin % | 47.4 | % | 51.7 | % | 49.1 | % | 52.3 | % | ||||||||||||||||||||||||||||||||||||||||||
| Gross margin excluding USF (Service, access and product margin) % | 45.6 | % | 49.2 | % | 47.0 | % | 49.5 | % | ||||||||||||||||||||||||||||||||||||||||||
| Segment gross margin % | 44.5 | % | 47.8 | % | 45.9 | % | 48.3 | % | ||||||||||||||||||||||||||||||||||||||||||
(1) Includes customer premise equipment, access, and shipping and handling.
(2) Excludes depreciation and amortization of $15,635 and $12,691 for the three months ended September 30, 2021 and 2020 and $44,231 and $32,370 for the nine months ended September 30, 2021 and 2020, respectively.
34
| Segment gross Margin % | |||||||||||||||||||
| Service margin % | 82.6 | % | 80.5 | % | 81.8 | % | 80.7 | % | |||||||||||
| Gross margin ex-USF (Service and product margin) % | 81.3 | % | 78.0 | % | 80.3 | % | 77.9 | % | |||||||||||
| Segment gross margin % | 73.6 | % | 70.4 | % | 72.7 | % | 70.3 | % | |||||||||||
Three Months Ended September 30, 20172021 compared to Three Months Ended September 30, 20162020
| (in thousands) | |||||
| Service gross margin increase is primarily due to increased usage of the Company's API services primarily in APAC | $ | 17,012 | |||
| Access and product gross margin decreased due to higher costs providing access services to VCP customers during the current quarter | (366) | ||||
| Increase in segment gross margin | $ | 16,646 | |||
Vonage Communications Platform service gross margin percentage decreased to 47.4% for the three months ended September 30, 2021 from 51.7% for the three months ended September 30, 2020. The decrease in business service gross margin percentage is a result of greater proportion of lower margin services across our VCP segment during the quarter ended September 30, 2021 as compared to the same period in the prior year quarter. Revenues from API services have grown to 57% of VCP revenues for the three months ended September 30, 2021 from 50% of 13%VCP revenues during the prior year quarter driven by growth in line with planned actionspart of API products, particularly messaging, as the Company continues to enhance profitability.strategically pursue new customer opportunities to drive product adoption across the VCP platform. Our gross margin percentage may continue to be impacted by changes in the mix of service offerings provided to our customers across our VCP segment.
The following table describes the increase in VCP gross margin dollars for the nine months ended September 30, 2021 as compared to the three months ended September 30, 2020:
| (in thousands) | |||||
| Service gross margin increase is primarily due to increased usage of the Company's API services primarily in APAC | $ | 52,573 | |||
| Access and product gross margin decreased due to higher costs providing access services to VCP customers during the current quarter | (625) | ||||
| Increase in segment gross margin | $ | 51,948 | |||
Vonage Communications Platform service gross margin percentage decreased to 49.1% for the nine months ended September 30, 2021 from 52.3% for the nine months ended September 30, 2020. The decrease in business service gross margin percentage is a result of greater proportion of lower margin services across our VCP segment during the nine months ended September 30, 2021 as compared to the same period in the prior year. Revenues from API services have grown to 55% of VCP revenues for the nine months ended September 30, 2021 from 48% of VCP revenues during the prior year driven by growth in part of API products, particularly messaging, as the Company continues to strategically pursue new customer opportunities to drive product adoption across the VCP platform. Our gross margin percentage may continue to be impacted by changes in the mix of service offerings provided to our customers across our VCP segment.
35
Consumer Gross Margin for the Three and Nine Months Ended September 30, 2021 and 2020
| Three Months Ended | Nine Months Ended | |||||||||||||||||||||||||||||||||||||||||||||||||
| September 30, | September 30, | |||||||||||||||||||||||||||||||||||||||||||||||||
| (in thousands, except percentages) | 2021 | 2020 | Dollar Change | Percent Change | 2021 | 2020 | Dollar Change | Percent Change | ||||||||||||||||||||||||||||||||||||||||||
| Revenues | ||||||||||||||||||||||||||||||||||||||||||||||||||
| Service revenues | $ | 60,162 | $ | 71,693 | $ | (11,531) | (16) | % | $ | 189,148 | $ | 223,981 | $ | (34,833) | (16) | % | ||||||||||||||||||||||||||||||||||
Access and product revenues(1) | 71 | 85 | (14) | (16) | % | 180 | 200 | (20) | (10) | % | ||||||||||||||||||||||||||||||||||||||||
| Service, access and product revenues excluding USF | 60,233 | 71,778 | (11,545) | (16) | % | 189,328 | 224,181 | (34,853) | (16) | % | ||||||||||||||||||||||||||||||||||||||||
| USF revenues | 9,952 | 11,045 | (1,093) | (10) | % | 33,359 | 30,130 | 3,229 | 11 | % | ||||||||||||||||||||||||||||||||||||||||
| Total revenues | 70,185 | 82,823 | (12,638) | (15) | % | 222,687 | 254,311 | (31,624) | (12) | % | ||||||||||||||||||||||||||||||||||||||||
| Cost of revenues | ||||||||||||||||||||||||||||||||||||||||||||||||||
Service cost of revenues (2) | 7,607 | 8,287 | (680) | (8) | % | 24,532 | 25,470 | (938) | (4) | % | ||||||||||||||||||||||||||||||||||||||||
Access and product cost of revenues (1) | 521 | 469 | 52 | 11 | % | 1,541 | 1,438 | 103 | 7 | % | ||||||||||||||||||||||||||||||||||||||||
| Service, access and product cost of revenues excluding USF | 8,128 | 8,756 | (628) | (7) | % | 26,073 | 26,908 | (835) | (3) | % | ||||||||||||||||||||||||||||||||||||||||
| USF cost of revenues | 9,952 | 11,045 | (1,093) | (10) | % | 33,359 | 30,130 | 3,229 | 11 | % | ||||||||||||||||||||||||||||||||||||||||
| Total cost of revenues | 18,080 | 19,801 | (1,721) | (9) | % | 59,432 | 57,038 | 2,394 | 4 | % | ||||||||||||||||||||||||||||||||||||||||
| Segment gross margin | ||||||||||||||||||||||||||||||||||||||||||||||||||
| Service margin | 52,555 | 63,406 | (10,851) | (17) | % | 164,616 | 198,511 | (33,895) | (17) | % | ||||||||||||||||||||||||||||||||||||||||
| Gross margin excluding USF (Service, access and product margin) | 52,105 | 63,022 | (10,917) | (17) | % | 163,255 | 197,273 | (34,018) | (17) | % | ||||||||||||||||||||||||||||||||||||||||
| Segment gross margin | $ | 52,105 | $ | 63,022 | $ | (10,917) | (17) | % | $ | 163,255 | $ | 197,273 | $ | (34,018) | (17) | % | ||||||||||||||||||||||||||||||||||
| Segment gross Margin % | |||||||||||||||||||||||||||||||||||||||||||||||
| Service margin % | 87.4 | % | 88.4 | % | 87.0 | % | 88.6% | ||||||||||||||||||||||||||||||||||||||||
| Gross margin excluding USF (Service, access and product margin) % | 86.5 | % | 87.8 | % | 86.2 | % | 88.0% | ||||||||||||||||||||||||||||||||||||||||
| Segment gross margin % | 74.2 | % | 76.1 | % | 73.3 | % | 77.6% | ||||||||||||||||||||||||||||||||||||||||
(1) Includes customer premise equipment and shipping and handling.
(2) Excludes depreciation and amortization of $182 and $958 for the three months ended September 30, 2021 and 2020 and $748 and $3,583 for the nine months ended September 30, 2021 and 2020, respectively.
36
Three Months Ended September 30, 2021 Compared to Three Months Ended September 30, 2020
The following table describes the decrease in customers' equipment costsconsumer gross margin dollars for the three months ended September 30, 2021 as compared to the three months ended September 30, 2020:
| (in thousands) | |||||
| Service gross margin decreased due to a decline in usage as subscriber lines declined 15% resulting in lower gross margin of $10,563 | $ | (10,851) | |||
| Access and product gross margin decreased 17% primarily due to sales to customers during the current quarter | (66) | ||||
| Decrease in segment gross margin | $ | (10,917) | |||
Consumer service gross margin percentage decreased to 87.4% for the three months ended September 30, 2021 from 88.4% for the three months ended September 30, 2020 due to lower new customer additions.slightly higher international and domestic termination rates.
Nine Months EndedSeptember 30, 2017 compared2021 Compared toNine Months EndedSeptember 30, 20162020
| (in thousands) | |||||
| Service gross margin decreased due to a decline in usage as subscriber lines declined 15% resulting in lower gross margin of $33,686 | $ | (33,895) | |||
| Access and product gross margin decreased 10% primarily due to sales to customers for the nine months ended September 30, 2021 | (123) | ||||
| Decrease in segment gross margin | $ | (34,018) | |||
Consumer service gross margin percentage decreased to 87.0% for the nine months ended September 30, 2021 from 88.6% for the nine months ended September 30, 2020 due to lower new customer additionsslightly higher international and a decrease in reserve related to inventory.domestic termination rates.
37
Other Operating Expenses
The following table presents our other operating costs during the three and nine months ended September 30, 20172021 and 2016,2020, respectively:
| Three Months Ended | Nine Months Ended | |||||||||||||||||||||||||||||||||||||||||||||||||
| September 30, | September 30, | |||||||||||||||||||||||||||||||||||||||||||||||||
| (in thousands, except percentages) | 2021 | 2020 | Dollar Change | Percent Change | 2021 | 2020 | Dollar Change | Percent Change | ||||||||||||||||||||||||||||||||||||||||||
| Sales and marketing | $ | 86,826 | $ | 85,505 | $ | 1,321 | 2 | % | $ | 254,515 | $ | 261,953 | $ | (7,438) | (3) | % | ||||||||||||||||||||||||||||||||||
| Engineering and development | 17,636 | 20,110 | (2,474) | (12) | % | 60,706 | 59,097 | 1,609 | 3 | % | ||||||||||||||||||||||||||||||||||||||||
| General and administrative | 44,063 | 56,835 | (12,772) | (22) | % | 132,297 | 140,537 | (8,240) | (6) | % | ||||||||||||||||||||||||||||||||||||||||
| Depreciation and amortization | 22,507 | 22,887 | (380) | (2) | % | 65,208 | 64,064 | 1,144 | 2 | % | ||||||||||||||||||||||||||||||||||||||||
| Total other operating expenses | $ | 171,032 | $ | 185,337 | $ | (14,305) | (8) | % | $ | 512,726 | $ | 525,651 | $ | (12,925) | (2) | % | ||||||||||||||||||||||||||||||||||
| Three Months Ended | Nine Months Ended | |||||||||||||||||||||||||||||
| September 30, | September 30, | |||||||||||||||||||||||||||||
| 2017 | 2016 | Dollar Change | Percent Change | 2017 | 2016 | Dollar Change | Percent Change | |||||||||||||||||||||||
| Sales and marketing | $ | 73,576 | $ | 83,731 | $ | (10,155 | ) | (12 | )% | $ | 235,245 | $ | 246,676 | $ | (11,431 | ) | (5 | )% | ||||||||||||
| Engineering and development | 6,956 | 8,075 | (1,119 | ) | (14 | )% | 21,996 | 22,152 | (156 | ) | (1 | )% | ||||||||||||||||||
| General and administrative | 26,811 | 27,538 | (727 | ) | (3 | )% | 98,411 | 89,261 | 9,150 | 10 | % | |||||||||||||||||||
| Depreciation and amortization | 18,179 | 18,018 | 161 | 1 | % | 54,520 | 53,215 | 1,305 | 2 | % | ||||||||||||||||||||
| Total other operating expenses | $ | 125,522 | $ | 137,362 | $ | (11,840 | ) | (9 | )% | $ | 410,172 | $ | 411,304 | $ | (1,132 | ) | — | % | ||||||||||||
Three Months Ended September 30, 2017 compared2021 Compared to Three Months Ended September 30, 20162020
Total other operating expenses decreased by $11,840$14,305 as compared to the three months ended September 30, 20162020 due to the following:
•Engineering and development expense decreased by $1,119$2,474, due to decreased employee costs associated with engineering costs related to Consumera shift in resources as compared to the priorprevious year quarter as the Company has focused oncontinues to optimize its overall organization.
•General and administrative expense decreased by $12,772, primarily due to restructuring costs recognized in the ongoing growth ofprior year quarter associated with the Business segment.cost savings initiatives initiated in the prior year along with abandonment charges associated with certain leased space which did not reoccur in the current year.
Nine Months Ended September 30, 2017 compared2021 Compared to Nine Months Ended September 30, 20162020
Total other operating expenses decreased by $1,132$12,925 as compared to the nine months ended September 30, 20162020 due to the following:
•Sales and marketing expense decreased by $11,431$7,438, primarily due to a shiftcontinued reductions in traditional media marketing investments from Consumertravel associated costs with the COVID-19 pandemic continues to Business customers as part of an effort to attract these more profitable customers duringimpact businesses across the current year.globe.
•General and administrative expense increaseddecreased by $9,150$8,240, primarily due to decreased employee costs as the acquisition of Nexmo duringCompany has begun to realize benefits associated with the cost saving initiatives executed upon in the prior year along with costs associated withand significantly lower restructuring activities duringcharges in 2021 which is partially offset by an increase in stock compensation expense and a $2 million donation to the Company's foundation in the current year period.year.
Other Income (Expense)
| (in thousands, except percentages) | Three Months Ended | Nine Months Ended | ||||||||||||||||||||||||||||||||||||||||||||||||
| September 30, | September 30, | |||||||||||||||||||||||||||||||||||||||||||||||||
| 2021 | 2020 | Dollar Change | Percent Change | 2021 | 2020 | Dollar Change | Percent Change | |||||||||||||||||||||||||||||||||||||||||||
| Interest expense | $ | (7,045) | $ | (7,373) | $ | 328 | 4 | % | $ | (21,424) | $ | (24,776) | $ | 3,352 | 14 | % | ||||||||||||||||||||||||||||||||||
| Other income (expense), net | (100) | (37) | (63) | 170 | % | (214) | 154 | (368) | 239 | % | ||||||||||||||||||||||||||||||||||||||||
| $ | (7,145) | $ | (7,410) | $ | 265 | $ | (21,638) | $ | (24,622) | $ | 2,984 | |||||||||||||||||||||||||||||||||||||||
| (in thousands, except percentages) | Three Months Ended | Nine Months Ended | ||||||||||||||||||||||||||||
| September 30, | September 30, | |||||||||||||||||||||||||||||
| 2017 | 2016 | Dollar Change | Percent Change | 2017 | 2016 | Dollar Change | Percent Change | |||||||||||||||||||||||
| Interest income | $ | 3 | $ | 19 | $ | (16 | ) | (84 | )% | $ | 12 | $ | 65 | $ | (53 | ) | (82 | )% | ||||||||||||
| Interest expense | (3,821 | ) | (3,974 | ) | 153 | 4 | % | (11,385 | ) | (9,477 | ) | (1,908 | ) | (20 | )% | |||||||||||||||
| Other income (expense), net | 465 | (495 | ) | 960 | (194 | )% | 931 | (237 | ) | 1,168 | (493 | )% | ||||||||||||||||||
| $ | (3,353 | ) | $ | (4,450 | ) | $ | 1,097 | $ | (10,442 | ) | $ | (9,649 | ) | $ | (793 | ) | ||||||||||||||
Three Months Ended September 30, 2017 compared2021 Compared to Three Months Ended September 30, 20162020
Interest expense. The decrease in interest expense of $153,$328, or 4%, was driven bymainly due to lower interest associated with the Company's capital lease as comparedexpense due to the prior year.lower principal balances on our 2018 Credit Facility.
38
Nine Months Ended September 30, 2017 compared2021 Compared to Nine Months Ended September 30, 20162020
Interest expense. The increasedecrease in interest expense of $1,908,$3,352, or 20%14%, was mainly due mainly to the funds we borrowed from the 2016lower interest expense due to lower principal balances on our 2018 Credit Facility in June 2016 in connection with the acquisition of Nexmo and the additional funds we borrowed in the first quarter of 2017 to fund operations.Facility.
| (in thousands, except percentages) | Three Months Ended | Nine Months Ended | |||||||||||||||||||||||||||||||||||||||||||||
| September 30, | September 30, | ||||||||||||||||||||||||||||||||||||||||||||||
| 2021 | 2020 | Dollar Change | Percent Change | 2021 | 2020 | Dollar Change | Percent Change | ||||||||||||||||||||||||||||||||||||||||
| Income tax (expense) benefit | $ | (4,332) | $ | 7,937 | $ | (12,269) | 155 | % | $ | (7,244) | $ | 6,694 | $ | (13,938) | 208 | % | |||||||||||||||||||||||||||||||
| Effective tax rate | (188) | % | (44) | % | (148) | % | (23) | % | |||||||||||||||||||||||||||||||||||||||
Three Months Ended September 30, 2021 Compared to Three Months Ended September 30, 2020
The tax expense recorded for the three months ended September 30, 2021 compared to the tax benefit for the three months ended September 30, 2020 is primarily due to an increase in permanent items related to limitations on executive compensation, the inclusion of foreign income in the U.S. due to foreign disregarded entities, and limitation on foreign losses as compared to the three months ended September 30, 2020. The limitation on executive compensation significantly impacted the deductibility of equity compensation and the Company recorded an expense of $2,097 in the current quarter. The three months ended September 30, 2021, also includes a benefit of $1.8 million related to a partial research and development tax credit associated with earlier years. For the three months ended September 30, 2021, the actual discrete was determined to be the appropriate method for calculating the interim tax provision as using the estimated annual effective tax rate method would have produced an unreliable rate stemming from a marginal loss and large permanent adjustments.
Nine Months Ended September 30, 2021 Compared to Nine Months Ended September 30, 2020
The tax expense recorded for the nine months ended September 30, 2017, we recognized2021 compared to the tax benefit for the nine months ended September 30, 2020 is primarily due to an increase in permanent items related to limitations on executive compensation, the inclusion of foreign income in the U.S. due to foreign disregarded entities, and limitation on foreign losses as compared to the nine months ended September 30, 2020. The nine months ended September 30, 2021, also includes a benefit of $1.8 million related to a partial research and development tax credit associated with earlier years. For the nine months ended September 30, 2021, the actual discrete periodwas determined to be the appropriate method for calculating the interim tax benefitsprovision as using the estimated annual effective tax rate method would have produced an unreliable rate stemming from a marginal loss and large permanent adjustments.
39
Non-GAAP Metrics
Adjusted EBITDA is a non-GAAP financial measure and is the primary basis used as the measure of $9,539profit or loss for our businesses. Adjusted EBITDA is defined as net income or net loss attributable to Vonage before income tax expense or benefit, interest expense, depreciation and $1,433amortization, stock-based expense, amortization of costs to implement cloud computing arrangements, organizational transformation costs, restructuring activities, and other non-recurring items. Organizational transformation in the prior year included employee related exits including CEO succession, system change management, facility exit costs, and rebranding. Restructuring activities relate to the Company's business-wide optimization and alignment project initiated in 2020 which included employee related exits and facility exit costs executed upon as part of the overall project. Other non-recurring items principally include certain litigation charges including defense costs and other non-recurring project costs such as the review of the Consumer business review and the business optimization project, both of which were recognized relatedinitiated in 2020. This is also consistent with the measure used under our bank credit assessment. Our management and our Board of Directors utilize Adjusted EBITDA to excess tax benefits on equity compensation recognized primarily inevaluate our consolidated operating performance and the first quarterperformance of 2017 as well as an adjustmentour operating segments and to allocate resources and capital to our deferred asset relatedsegments. It is also a significant performance measure in our annual incentive compensation programs. We believe that Adjusted EBITDA is useful to stock compensation.our investors as a basis for comparing our operating performance with that of other companies in our industries, although our measure of Adjusted EBITDA may not be directly comparable to that of other companies.
| Three Months Ended | Nine Months Ended | |||||||||||||||||||||||||
| September 30, | September 30, | |||||||||||||||||||||||||
| 2021 | 2020 | 2021 | 2020 | |||||||||||||||||||||||
| Net income (loss) | $ | (2,032) | $ | (10,062) | $ | (2,346) | $ | (22,247) | ||||||||||||||||||
| Income tax expense | 4,332 | (7,937) | 7,244 | (6,694) | ||||||||||||||||||||||
| Interest expense | 7,045 | 7,373 | 21,424 | 24,776 | ||||||||||||||||||||||
| Depreciation and amortization | 22,507 | 22,887 | 65,208 | 64,064 | ||||||||||||||||||||||
| Amortization of costs to implement cloud computing arrangements | 818 | 670 | 2,675 | 1,947 | ||||||||||||||||||||||
| Share-based expense | 17,247 | 11,530 | 47,575 | 33,972 | ||||||||||||||||||||||
| Organizational transformation | — | — | — | 5,119 | ||||||||||||||||||||||
| Restructuring activities | — | 15,182 | 2,655 | 15,182 | ||||||||||||||||||||||
| Other non-recurring items | 944 | 1,959 | 3,398 | 5,864 | ||||||||||||||||||||||
| Adjusted EBITDA | $ | 50,861 | $ | 41,602 | $ | 147,833 | $ | 121,983 | ||||||||||||||||||
40
Liquidity and Capital Resources
Overview
For the nine months ended September 30, 2017,2021, we generatedhad higher net cash from operations.operations compared to the prior year due to higher gross profit dollars during the current year. We expect to continue to balance efforts to grow our revenue whilewith seeking to consistently achievingachieve operating profitability. To grow our revenue, we continue to make investments in growth initiatives, marketing, applicationapplications development, network quality and expansion, and customer care. Although we believe we will achieve consistent profitability in the future, we ultimately may not be successful and we may not achieve consistent profitability. We believe that cash flow from operations and cash on hand will fund our operations for at least the next twelve months.
The following table sets forth a summary of our cash flows for the periods indicated:
| Nine Months Ended | |||||||||||||||||
| September 30, | |||||||||||||||||
| (in thousands) | 2021 | 2020 | Dollar Change | ||||||||||||||
| Net cash provided by operating activities | $ | 133,407 | $ | 51,431 | $ | 81,976 | |||||||||||
| Net cash used in investing activities | (41,984) | (38,234) | (3,750) | ||||||||||||||
| Net cash (used in) provided by financing activities | (84,227) | 12,871 | (97,098) | ||||||||||||||
| Effect of exchange rate changes on cash and cash equivalents | (1,346) | (1,334) | (12) | ||||||||||||||
| Nine Months Ended | ||||||||||
| September 30, | ||||||||||
| 2017 | 2016 | Dollar Change | ||||||||
| (in thousands) | ||||||||||
| Net cash provided by operating activities | $ | 80,600 | $ | 69,614 | 10,986 | |||||
| Net cash used in investing activities | (23,626 | ) | (188,637 | ) | 165,011 | |||||
| Net cash (used)/provided by financing activities | (56,757 | ) | 93,264 | (150,021 | ) | |||||
Operating Activities
| (in thousands) | |||||
| Increase in operating income adjusted for non-cash items primarily due to increased gross margin driven by growth within VCP during the quarter | $ | 44,265 | |||
| Increase in working capital driven primarily by timing of vendor payments, prepayments for annual licenses and improvement in operating cash flows as a result of benefits under the CARES Act offset by declines in deferred revenue as customers shift from annual billings to more frequent billings. | 37,711 | ||||
| Increase in cash provided by operating activities | $ | 81,976 | |||
Investing Activities
| (in thousands) | |||||
| Increase in payments to acquire and develop software assets | (5,264) | ||||
| Decrease in payments related to capital expenditures | 936 | ||||
| Increase from proceeds on sale of intangible assets net of payments to acquire new patents on our developed technology | 578 | ||||
| Increase in cash used in investing activities | $ | (3,750) | |||
41
Financing Activities
| (in thousands) | |||||
| Decreased borrowings net of repayments during the current year | $ | (85,000) | |||
| Increase in payments associated with taxes on share based compensation due to higher vesting and stock price in 2021 | (6,426) | ||||
| Decrease in proceeds received from exercise of stock options due to fewer exercises in 2021 | (5,672) | ||||
| Decrease in cash (used in) provided by financing activities | $ | (97,098) | |||
Sources of $93,264 was primarily attributableLiquidity
The principal sources of liquidity are derived from available borrowings under our existing financing arrangements, existing cash on hand, and cash flows from operations. As described in Note 6, Long-Term Debt, to $181,250 in net proceeds received from our 2016the Condensed Consolidated Financial Statements, the Company's financing arrangements consist of its Convertible Senior Notes and the 2018 Credit Facility and $6,169 in proceeds received from the exercisecomprised of stock option, offset by $9,375 in 2016a $100,000 term note principal payments, $25 million in 2016and a $500,000 revolving credit facility principal payments, $3,750 in 2015 term note principal payments, $10 million in 2015 revolving credit facility principal payments, $4,250 in patent license payments, $3,203 in capital lease payments, $32,902 in common stock repurchases, $1,316 in debt related costs payments, and $4,359 in employee taxes paid on withholding shares.
We maintain significant availability under our lines of credit to meet our short-term liquidity requirements. As of September 30, 2017,2021, amounts available under the 20162018 Credit Facility totaled $143$349.5 million.
Uses of Liquidity
The Company's requirements for liquidity and Local Sales Taxes
capital expenditures. For the nine months ended September 30, 2017,2021, capital expenditures were primarily for the implementation of software solutions and purchase of network equipment as we continue to expand our network. Our capital expenditures for the nine months ended September 30, 20172021, were $25,228,$41,984, of which $9,438$35,520 was for software acquisition and development. The majority of these expenditures are comprised of investments in information technology and systems infrastructure, including an electronic data warehouse, online customer service, and customer management platforms. For 2017,full year 2021, we believeestimate our capital and software expenditures will be approximately $35,000. This amount is net of Tenant Improvement capital dollars we are investing in our Holmdel, New Jersey headquarters which are being refunded by the building owner in connection with the long-term lease renewal we executed in the fourth quarter of 2015.$60 million.
Off-Balance Sheet Arrangements
Obligations under Certain Guarantee Contracts
We enter guarantee arrangements in the normal course of business to facilitate transactions with third parties. These arrangements include financial and performance guarantees, stand-by letters of credit, debt guarantees and indemnifications. As of September 30, 20172021 and December 31, 20162020 we had stand-by letters of credit totaling $1,561of $1,852 and $1,578,$1,502, respectively.
Contractual Obligations and Commitments
Except as set forth below and in Note 7. 9. Commitments and Contingencies included in Part 1, Item 1 of this Form 10-Q, there were no significant changes in our commitments under contractual obligations as disclosed in the Company's Annual Report on Form 10-K for the year ended December 31, 2016.2020.
Contingencies
42
Critical Accounting Policies
Our consolidated financial statements and accompanying notes are prepared in accordance with U.S. GAAP. Our significant accounting policies are described in Note 1, Basis2, Summary of Presentation and Significant Accounting Policies to the consolidated financial statements included in our Annual Report on Form 10-K for the year ended December 31, 2016.2020. The preparation of financial statements and related disclosures in compliance with GAAP requires management to make estimates and assumptions that affect the reported amount of assets, liabilities, revenues and expenses as well as the disclosure of contingent assets and liabilities. The application of these policies involves judgment regarding future events and these judgments could materially affect the financial statements and disclosures based on varying assumptions, which may be appropriate to use.assumptions.
We identify our most critical accounting policies as those that are the most pervasive and important to the portrayal of our financial position and results of operations, and those that require the most difficult, subjective or complex judgments by management regarding estimates. Our critical accounting policies include revenue recognition, impairmentvaluation of goodwill and long livedintangible assets, income taxes and valuation allowance for deferred taxes, share-based compensation, inventory and accounting for business combinations.
capitalized software. As of September 30, 2017,2021, our goodwill is attributable to our BusinessVCP operating segment. We perform our annual test of goodwill on October 1st. Additionally, we will assess our goodwill for impairment between annual tests when specific circumstances dictate.
COVID-19 has created and may continue to create uncertainty in bookings and customer payments, reduced usage, and issuance of customer credits to distressed customers served by certain product lines. As of the date of our condensed consolidated financial statements, we are not aware of any specific event or circumstance that would require us to update our estimates or judgments. However, these estimates may change as new events occur and additional information is obtained, which may result in changes being recognized in our condensed consolidated financial statements in future periods. In particular and in light of the COVID-19 pandemic, the assumptions and estimates associated with collectability assessment of revenue and credit losses of accounts receivable may have a material impact our consolidated financial statements in future periods, depending on the duration or degree of the impact of the COVID-19 pandemic on the global economy.
43
| Item 3. | Quantitative and Qualitative Disclosures about Market Risk | ||||
We are exposed to financial market risks, including changes in currency exchange rates and interest rates.
Foreign Exchange Risk
We sell our products and services primarily in the United States, Canada, and the European Union. Changes in currency exchange rates affect the valuation in our financial statements of the assetsUnion, and liabilities of these operations. We also have aAsia. A portion of our sales denominated in Euros, the Canadian Dollar, and the British Pound Sterling, which are also affected by changes in currency exchange rates. Our financial results could be affected by changes in foreign currency exchange rates, although foreign exchange risks have not been material to our financial position or results of operations to date.
On January 31, 2020, the United Kingdom officially withdrew from the European Union or , "EU". The 11-month transition period ended on. December 31, 2020. As of January 1, 2021, the UK is no longer inside the EU's Single Market and Customs Union and is free to implement trade deals struck with third countries. Uncertainty and currency volatility in the British Pound Sterling exchange rate is expected to continue.
Interest Rate and Debt Risk
Our exposure to market risk for changes in interest rates primarily relates to our long-term debt. In order to hedge the variability of expected future cash interest payments related to the 2016 Credit Facility we have entered into three interest rate swap agreements which were executed on July 14, 2017. The swaps have an aggregate notional amount of $150 million and are effective on July 31, 2017 through June, 3, 2020 concurrent with the term of the 2016 Credit Facility. Under the swaps our interest rate is fixed at 4.7%. The interest rate swaps will be accounted for as cash flow hedges in accordance with ASC 815, Derivatives and Hedging.
As of September 30, 2017,2021, if the interest rate on our variable rate debt changed by 1% on our 2016 term note,2018 Revolving Credit Facility, our annual debt service payment would change by approximately $1 million. $1,505.
As of September 30, 2017, if the2021, we had $345.0 million outstanding on our 1.75% convertible senior notes due 2024. The Notes have 1.75% percent fixed annual interest rates and, therefore, our economic interest rate exposure on our variableconvertible senior notes is fixed. However, the values of the convertible senior notes are exposed to interest rate debt changedrisk. Generally, the fair market value of our fixed interest rate convertible senior notes will increase as interest rates fall and decrease as interest rates rise. In addition, the fair values of the convertible senior notes are affected by 1%our stock price. The fair value of the convertible senior notes will generally increase as our common stock price increases and will generally decrease as our common stock price declines in value. Additionally, we carry the convertible senior notes at face value less unamortized discount on our 2016 revolving credit facility, our annual debt service payment would change by approximately $1.8 million.balance sheet, and we present the fair value for required disclosure purposes only.
| Item 4. | Controls and Procedures | ||||
Evaluation of Disclosure Controls and Procedures. Based on the evaluation of our disclosure controls and procedures (as defined in Securities Exchange Act of 1934 Rules 13a-15(e) and 15d-15(e)) required by Securities Exchange Act Rules 13a-15(b) or 15d-15(b), our Chief Executive Officer and our Chief Financial Officer have concluded that, as of the end of the period covered by this report, our disclosure controls and procedures were effective.
Changes in Internal Controls. During the third quarter of 2021, the Company completed the transition of certain accounting transaction-processing activities to a third-party service organization as part of an ongoing initiative to optimize business processes across the organization. These changes have not effective as of such date duematerially affected, and are not reasonably likely to materially affect, the material weakness inCompany's internal control over financial reporting that was disclosed in our Annual Report on Form 10-Kreporting. Other than the aforementioned transition to a third-party service organization for the fiscal year ended December 31, 2016 related to our controls over the preparation of the annual tax provision.
44
Part II—Other Information
| Item 1. | Legal Proceedings | ||||
We are subject to a number of lawsuits, government investigations and claims arising out of the conduct of our business. See a discussion of our litigation matters in Note 79 of Notes to our Condensed Consolidated Financial Statements, which is incorporated herein by reference.
| Item 1A. | Risk Factors | ||||
| Item 2. | Unregistered Sales of Equity Securities and Use of Proceeds | ||||
| Item 3. | Defaults Upon Senior Securities | ||||
None.
| Item 4. | Mine Safety Disclosures | ||||
Not applicable.
| Item 5. | Other Information | ||||
None.
| Item 6. | Exhibits | ||||
See accompanying Exhibit Index for a list of the exhibits filed or furnished with this Quarterly Report on Form 10-Q.
EXHIBIT INDEX
| 31.1 | |||||||||
| 31.2 | |||||||||
| 32.1 | |||||||||
| 101 | The following financial | ||||||||
| Cover Page Interactive Data File (formatted as Inline XBRL and contained in Exhibit 101) |
* Filed herewith.
45
SIGNATURE
Pursuant to the requirements of the Securities Exchange Act of 1934, as amended, the registrant has duly caused this report to be signed on its behalf by the undersigned thereunto duly authorized.
| VONAGE HOLDINGS CORP. | |||||||||||||||||
| Dated: | November | By: | /s/ | ||||||||||||||
Stephen Lasher Chief Financial Officer (Principal Financial Officer and Duly Authorized Officer) | |||||||||||||||||
46