UNITED STATES
SECURITIES AND EXCHANGE COMMISSION
Washington, D.C. 20549
Form 10-Q
| | | | | |
| ☒ | QUARTERLY REPORT PURSUANT TO SECTION 13 OR 15(d) OF THE SECURITIES EXCHANGE ACT OF 1934 |
For the Quarterly Period Ended March 31, 20212022
or
| | | | | |
| ☐ | TRANSITION REPORT PURSUANT TO SECTION 13 OR 15(d) OF THE SECURITIES EXCHANGE ACT OF 1934 |
For the Transition Period From __________ to __________
Commission File Number 001-32887
VONAGE HOLDINGS CORP.
(Exact name of registrant as specified in its charter)
| | | | | | | | | | | | | | | | | |
| Delaware | | 11-3547680 |
| (State or other jurisdiction of incorporation or organization) | | (IRS Employer Identification No.) |
| | |
23 Main Street101 Crawfords Corner Road, Suite 2416 | Holmdel | , | NJ | , | 07733 |
| (Address of principal executive offices) | | | | | (Zip Code) |
Registrant’s telephone number, including area code: (732) 528-2600
(Former name, former address and former fiscal year, if changed since last report): Not Applicable
Securities registered pursuant to Section 12(b) of the Act:
| | | | | | | | | | | | | | |
| Title of each class | | Trading Symbol(s) | | Name of each exchange on which registered |
| Common Stock, par value $0.001 | | VG | | Nasdaq Global Select Market |
Indicate by check mark whether the registrant: (1) has filed all reports required to be filed by Section 13 or 15(d) of the Securities Exchange Act of 1934 during the preceding 12 months (or for such shorter period that the registrant was required to file such reports), and (2) has been subject to such filing requirements for the past 90 days. Yes x No o
Indicate by check mark whether the registrant has submitted electronically every Interactive Data File required to be submitted pursuant to Rule 405 of Regulation S-T (§232.405 of this chapter) during the preceding 12 months (or for such shorter period that the registrant was required to submit such files). Yes x No o
Indicate by check mark whether the registrant is a large accelerated filer, an accelerated filer, a non-accelerated filer, smaller reporting company, or an emerging growth company. See the definitions of “large accelerated filer,” “accelerated filer,” “smaller reporting company,” and “emerging growth company” in Rule 12b-2 of the Exchange Act.
| | | | | | | | | | | | | | |
| Large accelerated filer | x | | Accelerated filer | o |
| | | | |
| Non-accelerated filer | o | | | |
| Smaller reporting company | ☐ | | Emerging growth company | ☐ |
| | | | |
| If an emerging growth company, indicate by check mark if the registrant has elected not to use the extended transition period for complying with any new or revised financial accounting standards provided pursuant to Section 13(a) of the Exchange Act. | |
Indicate by check mark whether the registrant is a shell company (as defined in Rule 12b-2 of the Exchange Act). Yes ☐ No x
Indicate the number of shares outstanding of each of the issuer’s classes of common stock, as of the latest practicable date.
| | | | | | | | | | | | | | |
| Class | Outstanding at | April 30, 2021May 2, 2022 |
| Common Stock, par value $0.001 | | 251,388,823256,582,410 | | shares |
VONAGE HOLDINGS CORP.
INDEX
| | | | | | | | |
| Part 1 - Financial Information | |
| | |
| | | Page |
| Item 1. | | |
| | |
| | |
| | |
| | |
| | |
| | |
| | |
| Item 2. | | |
| | |
| Item 3. | | |
| | |
| Item 4 | | |
| |
| |
| | |
| Item 1. | | |
| | |
| Item 1A. | | |
| | |
| Item 2. | | |
| | |
| Item 3. | | |
| | |
| Item 4. | | |
| | |
| Item 5. | | |
| | |
| Item 6. | | |
| | |
| | |
Financial Information Presentation
For the financial information discussed in this Quarterly Report on Form 10-Q, other than per share and per line amounts, dollar amounts are presented in thousands, except where noted.
GLOSSARY OF TERMS
When the following terms and abbreviations appear in the text of this report, they have the meanings indicated below:
| | | | | | | | |
| | |
| 2018 Credit Facility | | $100 million senior secured term loan and $500 million revolving facility due 2023 |
Convertible Senior Notes | | $345 million aggregate principal amount of 1.75% convertible notes due 2024 |
| API | | Application Program Interfaces |
| | |
| | |
| ASC | | The FASB Accounting Standards Codification, which the FASB established as the source of authoritative GAAP |
| ASU | | Accounting Standards Updates - updates to the ASC |
| CCaaS | | Contact Center as a Service |
| | |
| Convertible Senior Notes | | $345 million aggregate principal amount of 1.75% convertible notes due 2024 |
| CPaaS | | Communications Platform as a Service |
| CRM | | Customer Relationship Management |
| Exchange Act | | The Securities Exchange Act of 1934, as amended |
| | |
| EPS | | Earnings Per Share |
| FASB | | Financial Accounting Standards Board |
| FCC | | Federal Communications Commission |
| | |
| | |
| IP | | Internet Protocol |
| | |
| LIBOR | | London Inter-Bank Offered Rate |
| MPLS | | Multi-Protocol Label Switching |
| NOLs | | Net Operating Losses |
| | |
| | |
| SaaS | | Software as a Service |
| SAB | | Staff Accounting Bulletin |
| SD-WAN | | Software-Defined Wide Area Network |
| SEC | | U.S. Securities and Exchange Commission |
| SIP | | Session Initiation Protocol |
| SMB | | Small to medium-sized business |
SMS | | Short Message Service |
| | |
| | |
| | |
| UCaaS | | Unified Communications as a Service |
| | |
| USF | | Federal Universal Service Fund |
| | |
| VCP | | Vonage Communications Platform formerly referred to as Business |
| VoIP | | Voice over Internet Protocol |
PART 1 - FINANCIAL INFORMATION
ITEM 1 - CONDENSED CONSOLIDATED FINANCIAL STATEMENTS AND NOTES
VONAGE HOLDINGS CORP.
CONDENSED CONSOLIDATED BALANCE SHEETS
(In thousands, except par value)
| | | March 31,
2021 | | December 31,
2020 | | March 31,
2022 | | December 31,
2021 |
| Assets | Assets | (Unaudited) | | | Assets | (Unaudited) | | |
| Current assets: | Current assets: | | Current assets: | |
| Cash and cash equivalents | Cash and cash equivalents | $ | 51,623 | | | $ | 43,078 | | Cash and cash equivalents | $ | 15,719 | | | $ | 18,342 | |
| Accounts receivable, net of allowance of $8,094 and $8,878, respectively | 111,584 | | | 116,304 | | |
| Accounts receivable, net of allowance of $5,111 and $5,299, respectively | | Accounts receivable, net of allowance of $5,111 and $5,299, respectively | 145,895 | | | 147,622 | |
| | Deferred customer acquisition costs, current portion | Deferred customer acquisition costs, current portion | 19,490 | | | 18,161 | | Deferred customer acquisition costs, current portion | 23,871 | | | 23,961 | |
| Prepaid expenses | Prepaid expenses | 37,133 | | | 32,131 | | Prepaid expenses | 34,293 | | | 33,875 | |
| Other current assets | Other current assets | 3,615 | | | 6,230 | | Other current assets | 3,435 | | | 3,513 | |
| Total current assets | Total current assets | 223,445 | | | 215,904 | | Total current assets | 223,213 | | | 227,313 | |
| Property and equipment, net of accumulated depreciation of $119,646 and $117,761, respectively | 29,848 | | | 31,621 | | |
| Property and equipment, net of accumulated depreciation of $88,870 and $130,053, respectively | | Property and equipment, net of accumulated depreciation of $88,870 and $130,053, respectively | 20,155 | | | 24,334 | |
| Operating lease right-of-use assets | Operating lease right-of-use assets | 35,745 | | | 29,330 | | Operating lease right-of-use assets | 32,221 | | | 31,855 | |
| Goodwill | Goodwill | 620,585 | | | 624,328 | | Goodwill | 612,214 | | | 615,134 | |
| Software, net of accumulated amortization of $116,855 and $111,642, respectively | 88,827 | | | 80,638 | | |
| Software, net of accumulated amortization of $149,946 and $140,565, respectively | | Software, net of accumulated amortization of $149,946 and $140,565, respectively | 110,707 | | | 106,516 | |
| Deferred customer acquisition costs | Deferred customer acquisition costs | 68,609 | | | 67,529 | | Deferred customer acquisition costs | 77,826 | | | 77,442 | |
| Restricted cash | Restricted cash | 2,213 | | | 1,919 | | Restricted cash | 2,172 | | | 1,967 | |
| Intangible assets, net of accumulated amortization of $283,659 and $275,346, respectively | 192,113 | | | 204,267 | | |
| Intangible assets, net of accumulated amortization of $320,353 and $312,677, respectively | | Intangible assets, net of accumulated amortization of $320,353 and $312,677, respectively | 149,199 | | | 161,134 | |
| Deferred tax assets | Deferred tax assets | 106,594 | | | 106,374 | | Deferred tax assets | 121,996 | | | 109,087 | |
| Other assets | Other assets | 34,762 | | | 33,926 | | Other assets | 32,753 | | | 33,362 | |
| Total assets | Total assets | $ | 1,402,741 | | | $ | 1,395,836 | | Total assets | $ | 1,382,456 | | | $ | 1,388,144 | |
| Liabilities and Stockholders’ Equity | Liabilities and Stockholders’ Equity | | | | Liabilities and Stockholders’ Equity | | | |
| | Current liabilities: | Current liabilities: | | Current liabilities: | |
| Accounts payable | Accounts payable | $ | 31,324 | | | $ | 17,464 | | Accounts payable | $ | 57,382 | | | $ | 39,662 | |
| Accrued expenses | Accrued expenses | 154,706 | | | 158,080 | | Accrued expenses | 174,649 | | | 186,835 | |
| Deferred revenue, current portion | Deferred revenue, current portion | 60,030 | | | 65,506 | | Deferred revenue, current portion | 53,978 | | | 61,420 | |
| Operating lease liabilities, current portion | Operating lease liabilities, current portion | 10,562 | | | 11,554 | | Operating lease liabilities, current portion | 10,981 | | | 10,393 | |
| | Total current liabilities | Total current liabilities | 256,622 | | | 252,604 | | Total current liabilities | 296,990 | | | 298,310 | |
| Indebtedness under revolving credit facility | Indebtedness under revolving credit facility | 210,500 | | | 215,500 | | Indebtedness under revolving credit facility | 130,500 | | | 130,500 | |
| | Convertible senior notes, net | Convertible senior notes, net | 294,444 | | | 290,784 | | Convertible senior notes, net | 340,620 | | | 305,609 | |
| Operating lease liabilities | Operating lease liabilities | 38,349 | | | 31,019 | | Operating lease liabilities | 34,040 | | | 32,663 | |
| Other liabilities | Other liabilities | 3,561 | | | 3,155 | | Other liabilities | 5,006 | | | 3,341 | |
| Total liabilities | Total liabilities | 803,476 | | | 793,062 | | Total liabilities | 807,156 | | | 770,423 | |
| Commitments and Contingencies (Note 9) | Commitments and Contingencies (Note 9) | 0 | | 0 | Commitments and Contingencies (Note 9) | 0 | | 0 |
| Stockholders’ Equity: | Stockholders’ Equity: | | Stockholders’ Equity: | |
| Common stock, par value 0.001 per share; 596,950 shares authorized at March 31, 2021, and December 31, 2020 | 327 | | | 324 | | |
Common stock, par value 0.001 per share; 596,950 shares authorized at March 31, 2021, and December 31, 2021 | | Common stock, par value 0.001 per share; 596,950 shares authorized at March 31, 2021, and December 31, 2021 | 334 | | | 331 | |
| Additional paid-in capital | Additional paid-in capital | 1,571,025 | | | 1,554,574 | | Additional paid-in capital | 1,627,599 | | | 1,646,725 | |
| Accumulated deficit | Accumulated deficit | (667,597) | | | (667,221) | | Accumulated deficit | (684,855) | | | (691,718) | |
| Treasury stock, at cost | Treasury stock, at cost | (337,532) | | | (320,891) | | Treasury stock, at cost | (383,386) | | | (359,068) | |
| Accumulated other comprehensive income | Accumulated other comprehensive income | 33,042 | | | 35,988 | | Accumulated other comprehensive income | 15,608 | | | 21,451 | |
| Total stockholders’ equity | Total stockholders’ equity | 599,265 | | | 602,774 | | Total stockholders’ equity | 575,300 | | | 617,721 | |
| Total liabilities and stockholders’ equity | Total liabilities and stockholders’ equity | $ | 1,402,741 | | | $ | 1,395,836 | | Total liabilities and stockholders’ equity | $ | 1,382,456 | | | $ | 1,388,144 | |
See accompanying notes to condensed consolidated financial statements.
VONAGE HOLDINGS CORP.
CONDENSED CONSOLIDATED STATEMENTS OF OPERATIONS
(In thousands, except per share amounts)
(Unaudited)
| | | Three Months Ended | | | Three Months Ended | |
| | March 31, | | | March 31, | |
| | | 2021 | | 2020 | | | 2022 | | 2021 | |
| | Revenues: | Revenues: | | | Revenues: | | |
| Service, access and product revenues | Service, access and product revenues | $ | 314,793 | | | $ | 283,077 | | | Service, access and product revenues | $ | 344,852 | | | $ | 314,793 | | |
| USF revenues | USF revenues | 18,107 | | | 14,380 | | | USF revenues | 13,976 | | | 18,107 | | |
| Total revenues | Total revenues | 332,900 | | | 297,457 | | | Total revenues | 358,828 | | | 332,900 | | |
| | Operating Expenses: | Operating Expenses: | | | Operating Expenses: | | |
| Service, access and product cost of revenues (excluding depreciation and amortization) | Service, access and product cost of revenues (excluding depreciation and amortization) | 138,680 | | | 113,038 | | | Service, access and product cost of revenues (excluding depreciation and amortization) | 168,409 | | | 138,680 | | |
| USF cost of revenues | USF cost of revenues | 18,107 | | | 14,380 | | | USF cost of revenues | 13,976 | | | 18,107 | | |
| | Sales and marketing | Sales and marketing | 81,474 | | | 85,621 | | | Sales and marketing | 78,878 | | | 81,474 | | |
| Engineering and development | Engineering and development | 20,360 | | | 19,203 | | | Engineering and development | 20,760 | | | 20,360 | | |
| General and administrative | General and administrative | 44,933 | | | 40,882 | | | General and administrative | 70,456 | | | 44,933 | | |
| Depreciation and amortization | Depreciation and amortization | 20,417 | | | 20,485 | | | Depreciation and amortization | 25,195 | | | 20,417 | | |
| Total operating expenses | Total operating expenses | 323,971 | | | 293,609 | | | Total operating expenses | 377,674 | | | 323,971 | | |
| Income from operations | 8,929 | | | 3,848 | | | |
| (Loss) Income from operations | | (Loss) Income from operations | (18,846) | | | 8,929 | | |
| Other Income (Expense): | Other Income (Expense): | | | Other Income (Expense): | | |
| Interest expense | Interest expense | (7,298) | | | (8,082) | | | Interest expense | (3,653) | | | (7,298) | | |
| Other income (expense), net | Other income (expense), net | 174 | | | 229 | | | Other income (expense), net | 511 | | | 174 | | |
| Total other expense, net | Total other expense, net | (7,124) | | | (7,853) | | | Total other expense, net | (3,142) | | | (7,124) | | |
| Income (Loss) before income tax benefit | 1,805 | | | (4,005) | | | |
| Income tax (expense) benefit | (2,181) | | | 250 | | | |
| (Loss) Income before income tax | | (Loss) Income before income tax | (21,988) | | | 1,805 | | |
| Income tax benefit (expense) | | Income tax benefit (expense) | 4,866 | | | (2,181) | | |
| Net loss | Net loss | $ | (376) | | | $ | (3,755) | | | Net loss | $ | (17,122) | | | $ | (376) | | |
| | Loss per common share: | Loss per common share: | | | Loss per common share: | | |
| Basic and diluted | $ | 0 | | | $ | (0.02) | | | |
| Basic and Diluted | | Basic and Diluted | $ | (0.07) | | | $ | — | | |
| | Weighted-average common shares outstanding: | Weighted-average common shares outstanding: | | | | | Weighted-average common shares outstanding: | | | | |
| Basic and diluted | 249,638 | | | 243,627 | | | |
| Basic and Diluted | | Basic and Diluted | 254,666 | | | 249,638 | | |
|
See accompanying notes to condensed consolidated financial statements.
VONAGE HOLDINGS CORP.
CONDENSED CONSOLIDATED STATEMENTS OF COMPREHENSIVE INCOME / (LOSS)LOSS
(In thousands)
(Unaudited)
| | | | Three Months Ended | | | Three Months Ended | |
| | March 31, | | | March 31, | |
| | 2021 | | 2020 | | | 2022 | | 2021 | |
| | Net loss | Net loss | $ | (376) | | | $ | (3,755) | | | Net loss | $ | (17,122) | | | $ | (376) | | |
| Other comprehensive loss: | | | |
| Foreign currency translation adjustment, net of tax expense (benefit) of $1,293 and $(470), respectively | (2,946) | | | (23,627) | | | |
| Unrealized loss on derivatives, net of tax benefit of $0 and $(50), respectively | 0 | | | (418) | | | |
| Other comprehensive income (loss): | | Other comprehensive income (loss): | | |
| Foreign currency translation adjustment, net of tax (benefit) expense of $(132) and $1,293, respectively | | Foreign currency translation adjustment, net of tax (benefit) expense of $(132) and $1,293, respectively | (5,843) | | | (2,946) | | |
| | Total other comprehensive loss | Total other comprehensive loss | (2,946) | | | (24,045) | | | Total other comprehensive loss | (5,843) | | | (2,946) | | |
| Comprehensive loss | Comprehensive loss | $ | (3,322) | | | $ | (27,800) | | | Comprehensive loss | $ | (22,965) | | | $ | (3,322) | | |
See accompanying notes to condensed consolidated financial statements.
VONAGE HOLDINGS CORP.
CONDENSED CONSOLIDATED STATEMENTS OF CASH FLOWS
(In thousands)
(Unaudited)
| | | Three Months Ended | | Three Months Ended |
| | March 31, | | March 31, |
| | | 2021 | | 2020 | | 2022 | | 2021 |
| Cash flows from operating activities: | Cash flows from operating activities: | | | | Cash flows from operating activities: | | | |
| Net loss | Net loss | $ | (376) | | | $ | (3,755) | | Net loss | $ | (17,122) | | | $ | (376) | |
| Adjustments to reconcile net loss to net cash provided by operating activities: | Adjustments to reconcile net loss to net cash provided by operating activities: | | Adjustments to reconcile net loss to net cash provided by operating activities: | |
| Depreciation and amortization | Depreciation and amortization | 9,614 | | | 6,331 | | Depreciation and amortization | 15,697 | | | 9,614 | |
| Amortization of intangibles | Amortization of intangibles | 10,803 | | | 14,154 | | Amortization of intangibles | 9,498 | | | 10,803 | |
| | Deferred income taxes | Deferred income taxes | 999 | | | 1,468 | | Deferred income taxes | (4,302) | | | 999 | |
| Amortization of deferred customer acquisition costs | Amortization of deferred customer acquisition costs | 4,762 | | | 3,661 | | Amortization of deferred customer acquisition costs | 5,899 | | | 4,762 | |
| | Allowances for doubtful accounts | Allowances for doubtful accounts | 964 | | | 1,448 | | Allowances for doubtful accounts | 804 | | | 964 | |
| Amortization of financing costs and debt discount | Amortization of financing costs and debt discount | 3,863 | | | 3,656 | | Amortization of financing costs and debt discount | 698 | | | 3,863 | |
| (Gain) Loss on disposal of property and equipment | (7) | | | 741 | | |
| (Gain) Loss on disposal of property and equipment and intangible assets | | (Gain) Loss on disposal of property and equipment and intangible assets | 6 | | | (7) | |
| | Share-based expense | Share-based expense | 14,566 | | | 11,116 | | Share-based expense | 29,042 | | | 14,566 | |
| Changes in derivatives | 0 | | | (133) | | |
| | Changes in operating assets and liabilities: | Changes in operating assets and liabilities: | | Changes in operating assets and liabilities: | |
| Accounts receivable | Accounts receivable | 737 | | | 2,361 | | Accounts receivable | (134) | | | 737 | |
| | Prepaid expenses and other current assets | Prepaid expenses and other current assets | (2,305) | | | (5,387) | | Prepaid expenses and other current assets | (325) | | | (2,305) | |
| Deferred customer acquisition costs | Deferred customer acquisition costs | (7,187) | | | (9,042) | | Deferred customer acquisition costs | (6,436) | | | (7,187) | |
| | Accounts payable and accrued expenses | Accounts payable and accrued expenses | 16,416 | | | (25,459) | | Accounts payable and accrued expenses | 10,780 | | | 16,416 | |
| Deferred revenue | Deferred revenue | (4,821) | | | 2,934 | | Deferred revenue | (6,946) | | | (4,821) | |
| Other assets - deferred cloud computing implementation costs | Other assets - deferred cloud computing implementation costs | (1,017) | | | (669) | | Other assets - deferred cloud computing implementation costs | (1,131) | | | (1,017) | |
| Other assets and liabilities | Other assets and liabilities | 307 | | | (922) | | Other assets and liabilities | 4,843 | | | 307 | |
| Net cash provided by operating activities | Net cash provided by operating activities | 47,318 | | | 2,503 | | Net cash provided by operating activities | 40,871 | | | 47,318 | |
| Cash flows used in investing activities: | Cash flows used in investing activities: | | | | Cash flows used in investing activities: | | | |
| Capital expenditures | Capital expenditures | (2,553) | | | (2,887) | | Capital expenditures | (2,773) | | | (2,553) | |
| Purchase of intangible assets | (62) | | | (75) | | |
| Proceeds from sale of intangible assets, net of payment for intangible assets | | Proceeds from sale of intangible assets, net of payment for intangible assets | (21) | | | (62) | |
| Acquisition and development of software assets | Acquisition and development of software assets | (13,865) | | | (10,273) | | Acquisition and development of software assets | (17,623) | | | (13,865) | |
| | Net cash used in investing activities | Net cash used in investing activities | (16,480) | | | (13,235) | | Net cash used in investing activities | (20,417) | | | (16,480) | |
| Cash flows provided by (used in) financing activities: | | | | |
| Cash flows used in financing activities: | | Cash flows used in financing activities: | | | |
| Payments for short and long-term debt | Payments for short and long-term debt | (5,000) | | | 0 | | Payments for short and long-term debt | (10,000) | | | (5,000) | |
| Proceeds from issuance of long-term debt | Proceeds from issuance of long-term debt | 0 | | | 45,000 | | Proceeds from issuance of long-term debt | 10,000 | | | — | |
| Employee taxes paid on withholding shares | Employee taxes paid on withholding shares | (16,641) | | | (12,656) | | Employee taxes paid on withholding shares | (24,318) | | | (16,641) | |
| Proceeds from exercise of stock options | Proceeds from exercise of stock options | 622 | | | 155 | | Proceeds from exercise of stock options | 245 | | | 622 | |
| Net cash (used in) provided by financing activities | (21,019) | | | 32,499 | | |
| Net cash used in financing activities | | Net cash used in financing activities | (24,073) | | | (21,019) | |
| Effect of exchange rate changes on cash | Effect of exchange rate changes on cash | (980) | | | (2,290) | | Effect of exchange rate changes on cash | 1,201 | | | (980) | |
| Net increase in cash, cash equivalents, and restricted cash | Net increase in cash, cash equivalents, and restricted cash | 8,839 | | | 19,477 | | Net increase in cash, cash equivalents, and restricted cash | (2,418) | | | 8,839 | |
| Cash, cash equivalents, and restricted cash, beginning of period | Cash, cash equivalents, and restricted cash, beginning of period | 44,997 | | | 25,635 | | Cash, cash equivalents, and restricted cash, beginning of period | 20,309 | | | 44,997 | |
| Cash, cash equivalents, and restricted cash, end of period | Cash, cash equivalents, and restricted cash, end of period | $ | 53,836 | | | $ | 45,112 | | Cash, cash equivalents, and restricted cash, end of period | $ | 17,891 | | | $ | 53,836 | |
| Supplemental disclosures of cash flow information: | Supplemental disclosures of cash flow information: | | | | Supplemental disclosures of cash flow information: | | | |
| Cash paid (received) during the periods for: | Cash paid (received) during the periods for: | | Cash paid (received) during the periods for: | |
| Interest | Interest | $ | 1,863 | | | $ | 2,866 | | Interest | $ | 1,430 | | | $ | 1,863 | |
| Income taxes | Income taxes | $ | (3,965) | | | $ | 1,249 | | Income taxes | $ | 1,071 | | | $ | (3,965) | |
| Non-cash investing activities: | Non-cash investing activities: | | Non-cash investing activities: | |
| Acquisition of long-term assets included in accounts payable and accrued expenses | Acquisition of long-term assets included in accounts payable and accrued expenses | $ | 1,302 | | | $ | 2,119 | | Acquisition of long-term assets included in accounts payable and accrued expenses | $ | 1,354 | | | $ | 1,302 | |
| Share-based compensation capitalized in internally developed software costs | Share-based compensation capitalized in internally developed software costs | $ | 1,266 | | | $ | 928 | | Share-based compensation capitalized in internally developed software costs | $ | 1,712 | | | $ | 1,266 | |
See accompanying notes to condensed consolidated financial statements.
VONAGE HOLDINGS CORP.
CONDENSED CONSOLIDATED STATEMENT OF STOCKHOLDERS’ EQUITY
(In thousands)
(Unaudited)
| | | | Common Stock | | Additional
Paid-in
Capital | | Accumulated
Deficit | | Treasury
Stock | | Accumulated
Other
Comprehensive
Income | | Total |
| Balance at December 31, 2020 | | Balance at December 31, 2020 | | $ | 324 | | | $ | 1,554,574 | | | $ | (667,221) | | | $ | (320,891) | | | $ | 35,988 | | | $ | 602,774 | |
| Stock option exercises | | Stock option exercises | | 3 | | | 619 | | | 622 | |
| Share-based expense | | Share-based expense | | 15,832 | | | 15,832 | |
Employee taxes paid on withholding
shares | | Employee taxes paid on withholding
shares | | (16,641) | | | (16,641) | |
Foreign currency translation
adjustment | | Foreign currency translation
adjustment | | (2,946) | | | (2,946) | |
| Net loss | | Net loss | | (376) | | | (376) | |
| Balance at March 31, 2021 | | Balance at March 31, 2021 | | $ | 327 | | | $ | 1,571,025 | | | $ | (667,597) | | | $ | (337,532) | | | $ | 33,042 | | | $ | 599,265 | |
| | | | Common Stock | | Additional
Paid-in
Capital | | Accumulated
Deficit | | Treasury
Stock | | Accumulated
Other
Comprehensive
Income | | Total |
| Balance at December 31, 2021 | | Balance at December 31, 2021 | | $ | 331 | | | $ | 1,646,725 | | | $ | (691,718) | | | $ | (359,068) | | | $ | 21,451 | | | $ | 617,721 | |
| Adoption of ASU 2020-06 | | Adoption of ASU 2020-06 | | (50,123) | | | 23,985 | | | (26,138) | |
| Stock option exercises | | Stock option exercises | | 3 | | | 242 | | | 245 | |
| Share-based expense | | Share-based expense | | 30,755 | | | 30,755 | |
Employee taxes paid on withholding
shares | | Employee taxes paid on withholding
shares | | (24,318) | | | (24,318) | |
Foreign currency translation
adjustment | | Foreign currency translation
adjustment | | (5,843) | | | (5,843) | |
| Net loss | | Net loss | | (17,122) | | | (17,122) | |
| Balance at March 31, 2022 | | Balance at March 31, 2022 | | $ | 334 | | | $ | 1,627,599 | | | $ | (684,855) | | | $ | (383,386) | | | $ | 15,608 | | | $ | 575,300 | |
| | | | | | | | | Common Stock | | Additional
Paid-in
Capital | | Accumulated
Deficit | | Treasury
Stock | | Accumulated
Other
Comprehensive
Income | | Total | |
| Balance at December 31, 2019 | | $ | 316 | | | $ | 1,494,469 | | | $ | (631,009) | | | $ | (306,043) | | | $ | 9,329 | | | $ | 567,062 | | |
| Stock option exercises | | 4 | | | 151 | | | 155 | | |
| Share-based expense | | 12,044 | | | 12,044 | | |
Employee taxes paid on
withholding shares | | (12,748) | | | (12,748) | | |
Foreign currency translation
adjustment | | (23,627) | | | (23,627) | | |
| Unrealized gain on derivatives | | (418) | | | (418) | | |
| Net loss | | (3,755) | | | (3,755) | | |
| Balance at March 31, 2020 | | $ | 320 | | | $ | 1,506,664 | | | $ | (634,764) | | | $ | (318,791) | | | $ | (14,716) | | | $ | 538,713 | | |
| | Common Stock | | Additional
Paid-in
Capital | | Accumulated
Deficit | | Treasury
Stock | | Accumulated
Other
Comprehensive
Income | | Total | |
| Balance at December 31, 2020 | | $ | 324 | | | $ | 1,554,574 | | | $ | (667,221) | | | $ | (320,891) | | | $ | 35,988 | | | $ | 602,774 | | |
| Stock option exercises | | 3 | | | 619 | | | 622 | | |
| Share-based expense | | 15,832 | | | 15,832 | | |
Employee taxes paid on withholding
shares | | (16,641) | | | (16,641) | | |
Foreign currency translation
adjustment | | (2,946) | | | (2,946) | | |
| | Net loss | | (376) | | | (376) | | |
| Balance at March 31, 2021 | | $ | 327 | | | $ | 1,571,025 | | | $ | (667,597) | | | $ | (337,532) | | | $ | 33,042 | | | $ | 599,265 | | |
See accompanying notes to condensed consolidated financial statements.
VONAGE HOLDINGS CORP.
NOTES TO CONDENSED CONSOLIDATED FINANCIAL STATEMENTS
(In thousands, except per share amounts)
(Unaudited)
Note 1. Nature of Business
Nature of Operations
Vonage Holdings Corp. (“Vonage”, “Company”, “we”, “our”, “us”) is incorporated as a Delaware corporation. At Vonage, our vision is to accelerate the world's ability to connect. We are observing a secular change in the way business is done, with a fundamental shift in how communications technologies are being leveraged in almost every industry. Through the Vonage Communications Platform, our strategy is to deliver a single leading cloud communications platform that powers our customers' and partners' global engagement solutions using our APIs, Unified Communications, and Contact Center innovations. We believe that the Vonage Communications Platform's products and services are well positioned to take advantage of emerging trends with sizable, growing total addressable markets as companies look to cloud-based communications solutions and API programming architectures as part of their digital transformation.
Our strategic business is the Vonage Communications Platform which delivers a single leading cloud communications platform that powers our customers' and partners' global engagement solutions using our APIs, Unified Communications, and Contact Center innovations. The Vonage Communications Platform brings unique value to businesses by providing multiple communications channels - including video, voice, messaging, email, verification, and artificial intelligence - that integrate into the applications, products and workflows that our customers are already using. We believe this delivers both the power and the flexibility to our customers to address the growing need to transform their communications, connections and experiences for customers and enables the type of business continuity, remote work, and remote delivery of services that are now essential for team members.
For our Consumer customers, we enable users to access and utilize our services and features, via their existing internet connections, including over 3G/4G, LTE, Cable, or DSL broadband networks. This technology enables us to offer our Consumer customers attractively priced voice and messaging services and other features around the world on a variety of devices. Our Consumer strategy is focused on the continued penetration of our core North American markets, which provide value in international long distance and target under-served segments.
Customers in the United States represented 66% and 69%66% of our consolidated revenues for the three months ended March 31, 20212022 and 2020,2021, respectively, with the balance in Canada, the United Kingdom, China, Singapore, Netherlands, and other countries around the world.
Unaudited Interim Financial Information
The accompanying unaudited interim condensed consolidated financial statements and information have been prepared in accordance with accounting principles generally accepted in the United States and in accordance with the SEC's regulations for interim financial information and with the instructions for Form 10-Q. Accordingly, they do not include all of the information and disclosures required by accounting principles generally accepted in the United States for complete financial statements. In the opinion of management, these financial statements contain all normal and recurring adjustments considered necessary to present fairly the Company's financial position, results of operations, comprehensive income, cash flows, and stockholders’ equity for the periods presented. The results for the three months ended March 31, 20212022 are not necessarily indicative of the results to be expected for the full year.
These unaudited interim condensed consolidated financial statements should be read in conjunction with the audited consolidated financial statements and related notes included in our Annual Report on Form 10-K for the year ended December 31, 20202021 filed with the Securities and Exchange Commission on February 19, 2021.24, 2022.
Use of Estimates
Our condensed consolidated financial statements and notes thereof are prepared in conformity with accounting principles generally accepted in the United States, which require management to make estimates and assumptions that affect the amounts of assets and liabilities at the date of the financial statements and the reported amounts of revenues and expenses during the reporting period. Actual results could differ from these estimates, including uncertainty in the economic environment due to the ongoing outbreak of the novel coronavirus COVID-19.war between Russia and Ukraine.
VONAGE HOLDINGS CORP.
NOTES TO CONDENSED CONSOLIDATED FINANCIAL STATEMENTS
(In thousands, except per share amounts)
(Unaudited)
We base our estimates on historical experience, available market information, appropriate valuation methodologies, and on various other assumptions that we believe to be reasonable, the results of which form the basis for making judgments about the carrying values of assets and liabilities. Estimates are used for such items as depreciable lives for long-lived assets including intangible assets, tax provisions, uncollectible accounts, and assets and liabilities assumed in business combinations, among others. In addition, estimates are used to test long-lived assets and goodwill for impairment.
COVID-19 has created and may continue to create uncertainty in customer payments, reduced usage, and issuance of customer credits to distressed customers served by certain product lines. As of the date of our condensed consolidated financial statements, we are not aware of any specific event or circumstance that would require us to materially update our estimates or judgments. However, these estimates may change as new events occur and additional information is obtained, which may result in changes being recognized in our condensed consolidated financial statements in future periods. In particular and in light of the COVID-19 pandemic, the assumptions and estimates associated with collectability assessment of revenue and credit losses of accounts receivable may have a material impact our consolidated financial statements in future periods, depending on the continued duration or degree of the impact of the COVID-19 pandemic on the global economy.
In February 2022, the Russian Federation commenced a military action with the country of Ukraine. As a result of this action, various nations, including the United States, have instituted economic sanctions against the Russian Federation and Belarus. Further, the impact of this action and related sanctions on the world economy are not fully determinable as of the date of these financial statements and the specific impact on the Company’s financial condition, results of operations, and cash flows may be material depending on the duration and degree of the invasion.
Reclassifications
Reclassifications have been made to our condensed consolidated financial statements for the prior year periods to conform to classifications used in the current year periods. The reclassifications did not affect results of operations, net assets or cash flows.
Note 2. Summary of Significant Accounting Policies
This footnote should be read in conjunction with the complete description of our significant accounting policies under Note 2, Summary of Significant Accounting Policies to the consolidated financial statements included in our Annual Report on Form 10-K for the year ended December 31, 2020.2021.
Recent Significant Events
On November 22, 2021, the Company, Telefonaktiebolaget LM Ericsson (publ), an entity organized and existing under the Laws of Sweden ("Ericsson"), and Ericsson Muon Holding Inc., a Delaware corporation ("Merger Sub”), entered into an Agreement and Plan of Merger (the “Merger Agreement”) providing for the acquisition of the Company by Ericsson for approximately $6.2 billion to be funded by cash on hand.
The Merger Agreement provides that, among other things, upon the terms and subject to the conditions set forth in the Merger Agreement, Merger Sub will merge with and into the Company, continuing as the surviving corporation and an indirect wholly owned subsidiary of Ericsson. The proposed transaction is expected to be consummated during the first half of 2022 following the satisfaction of certain other customary conditions. The Company obtained the required approval by the stockholders on February 9, 2022.
Pursuant to the Merger Agreement, each share of common stock, par value $0.001 per share, of the Company (collectively, the “Shares”) issued and outstanding immediately prior to the effective time of the Merger (the “Effective Time”) (other than (i) Shares owned by Ericsson or Merger Sub or any of their respective subsidiaries, (ii) Shares owned by the Company as treasury stock, and (iii) Shares held by stockholders who will not have voted in favor of the adoption of the Merger Agreement (as may be amended) and who will have properly exercised appraisal rights in respect of such Shares in accordance with Section 262 of the DGCL) will be converted into the right to receive $21.00 per Share in cash, without interest.
Service, Access, and Product Cost of Revenues
Service, access, and product cost of revenues excludes depreciation and amortization expense of $13,647$17,679 and $9,609$13,647 for the three months ended March 31, 20212022 and 2020,2021, respectively. In addition, costs of goods sold included service, access, and product cost of revenues during the three months ended March 31, 2022 and 2021 were $3,459 and 2020 were $2,579, and $3,676, respectively.
VONAGE HOLDINGS CORP.
NOTES TO CONDENSED CONSOLIDATED FINANCIAL STATEMENTS
(In thousands, except per share amounts)
(Unaudited)
Sales and Marketing Expenses
We incurred advertising costs, which are included in sales and marketing, of $9,657$11,382 and $9,460$9,657 for the three months ended March 31, 20212022 and 2019,2021, respectively.
Fair Value of Financial Instruments
Certain of the Company's other financial instruments, which include cash and cash equivalents, restricted cash, accounts receivable and accounts payable, approximate fair value due to their short-term nature and as such are classified as Level 1. We believe the fair value of our 2018 Credit Facility at March 31, 20212022 and December 31, 20202021 was approximately the same as its carrying amount as the facility bears interest at a variable rate indexed to current market conditions and is classified as Level 2 within the fair value hierarchy.
As of March 31, 20212022 and December 31, 2020,2021, the fair value of the 1.75% convertible senior notes due 2024 (the “Convertible Senior Notes”) was approximately $361,156$453,503 and $373,373,$425,125, respectively. The fair value was determined based on the quoted price for the Convertible Senior Notes in an inactive market on the last trading day of the reporting period and is classified as Level 2 in the fair value hierarchy.
VONAGE HOLDINGS CORP.
NOTES TO CONDENSED CONSOLIDATED FINANCIAL STATEMENTS
(In thousands, except per share amounts)
(Unaudited)
We account for financial assets using a framework that establishes a hierarchy that ranks the quality and reliability of the inputs, or assumptions, we use in the determination of fair value, and we classify financial assets and liabilities carried at fair value in one of the following three categories:
•Level 1 - quoted prices (unadjusted) in active markets that are accessible at the measurement date for identical assets and liabilities. The fair value hierarchy gives the highest priority to Level 1 inputs.
•Level 2 - observable prices that are based on inputs not quoted on active markets but corroborated by market data; and
•Level 3 - unobservable inputs when there is little or no market data available, thereby requiring an entity to develop its own assumptions. The fair value hierarchy gives the lowest priority to Level 3 inputs.
Supplemental Balance Sheet Information
The following table provides a reconciliation of cash and cash equivalents and restricted cash reported within the consolidated balance sheets to amounts included in the consolidated statements of cash flows:
| | | As of March 31, | | As of December 31, | | As of March 31, | | As of December 31, |
| | 2021 | | 2020 | | 2020 | | 2019 | | 2022 | | 2021 | | 2021 | | 2020 |
| Cash and cash equivalents | Cash and cash equivalents | $ | 51,623 | | | $ | 43,073 | | | $ | 43,078 | | | $ | 23,620 | | Cash and cash equivalents | $ | 15,719 | | | $ | 51,623 | | | $ | 18,342 | | | $ | 43,078 | |
| Restricted cash | Restricted cash | 2,213 | | | 2,039 | | | 1,919 | | | 2,015 | | Restricted cash | 2,172 | | | 2,213 | | | 1,967 | | | 1,919 | |
| Total cash, cash equivalents and restricted cash | Total cash, cash equivalents and restricted cash | $ | 53,836 | | | $ | 45,112 | | | $ | 44,997 | | | $ | 25,635 | | Total cash, cash equivalents and restricted cash | $ | 17,891 | | | $ | 53,836 | | | $ | 20,309 | | | $ | 44,997 | |
The following tables provides supplemental information of intangible assets and accrued expenses within the consolidated balance sheets:
Intangible assets, net
| | | March 31, 2021 | | December 31, 2020 | | March 31, 2022 | | December 31, 2021 |
| | Gross Carrying Value | Accumulated Amortization | Net Carrying Value | | Gross Carrying Value | Accumulated Amortization | Net Carrying Value | | Gross Carrying Value | Accumulated Amortization | Net Carrying Value | | Gross Carrying Value | Accumulated Amortization | Net Carrying Value |
| Customer relationships | Customer relationships | $ | 281,019 | | $ | (153,678) | | $ | 127,341 | | | $ | 284,692 | | $ | (150,094) | | $ | 134,598 | | Customer relationships | $ | 274,938 | | $ | (172,245) | | $ | 102,693 | | | $ | 277,435 | | $ | (168,292) | | $ | 109,143 | |
| Developed technology | Developed technology | 173,416 | | (109,239) | | 64,177 | | | 173,572 | | (104,468) | | 69,104 | | Developed technology | 173,082 | | (127,294) | | 45,788 | | | 174,862 | | (123,585) | | 51,277 | |
| Patents and patent licenses | Patents and patent licenses | 20,896 | | (20,301) | | 595 | | | 20,849 | | (20,284) | | 565 | | Patents and patent licenses | 21,074 | | (20,356) | | 718 | | | 21,056 | | (20,342) | | 714 | |
| Trade names | Trade names | 441 | | (441) | | 0 | | | 500 | | (500) | | 0 | | Trade names | 458 | | (458) | | — | | | 458 | | (458) | | — | |
| | Total intangible assets | Total intangible assets | $ | 475,772 | | $ | (283,659) | | $ | 192,113 | | | $ | 479,613 | | $ | (275,346) | | $ | 204,267 | | Total intangible assets | $ | 469,552 | | $ | (320,353) | | $ | 149,199 | | | $ | 473,811 | | $ | (312,677) | | $ | 161,134 | |
VONAGE HOLDINGS CORP.
NOTES TO CONDENSED CONSOLIDATED FINANCIAL STATEMENTS
(In thousands, except per share amounts)
(Unaudited)
Accrued expenses
| | | | | | | | | | | |
| March 31, 2021 | | December 31, 2020 |
| Compensation and related taxes and temporary labor | $ | 31,118 | | | $ | 43,580 | |
| Marketing | 19,849 | | | 15,319 | |
| Taxes and fees | 31,669 | | | 25,977 | |
| Telecommunications | 48,572 | | | 52,975 | |
| Severance | 1,674 | | | 3,594 | |
| Interest | 2,408 | | | 847 | |
| Customer credits | 3,393 | | | 4,738 | |
| Professional fees | 2,754 | | | 1,953 | |
| Inventory | 907 | | | 659 | |
| Other accruals | 12,362 | | | 8,438 | |
| Accrued expenses | $ | 154,706 | | | $ | 158,080 | |
In the second half of 2020, the Company initiated a business-wide optimization and alignment project to focus the Company's resources and drive stronger operational execution. In connection with this project, the Company incurred accrued severance costs of $1,294 during the three months ended March 31, 2021, related to further employee exits, which was included in general and administrative expense. | | | | | | | | | | | |
| March 31, 2022 | | December 31, 2021 |
| Compensation and related taxes and temporary labor | $ | 32,350 | | | $ | 45,712 | |
| Marketing | 25,845 | | | 32,312 | |
| Taxes and fees | 32,334 | | | 28,214 | |
| Telecommunications | 58,964 | | | 59,934 | |
| Severance | 1,009 | | | 845 | |
| Interest | 2,433 | | | 884 | |
| Customer credits | 3,188 | | | 4,461 | |
| Professional fees | 10,513 | | | 7,324 | |
| Inventory | 1,484 | | | 886 | |
| Other accruals | 6,529 | | | 6,263 | |
| Accrued expenses | $ | 174,649 | | | $ | 186,835 | |
Goodwill
The Company's goodwill is derived primarily from the acquisitions of Vocalocity, Telesphere, iCore, Simple Signal, Nexmo, TokBox, and NewVoiceMedia which are included in the Company's Vonage Communications Platform segment. The following table provides a summary of the changes in the carrying amounts of goodwill:
| | | | | |
Balance at December 31, 20202021 | $ | 624,328615,134 | |
| Foreign currency translation adjustment | (3,743)(2,920) | |
Balance at March 31, 20212022 | $ | 620,585612,214 | |
Recent Accounting Pronouncements
The following standard was adopted by the Company during the quarter ended March 31, 2022.
In August 2020, the FASB issued ASU 2020-06, "Debt"Debt - Debt with Conversion Options (Subtopic 470-20) and Derivatives and Hedging - Contractsin Entity's Own Equity (Subtopic 815-40): Accounting for Convertible Instruments and Contracts in an Entity's Own Equity". This ASU simplifies theaccounting for certain convertible instruments such that the embedded conversion features are no longer separated from the host contract for convertible instruments with conversion features that are not required to be accounted for as derivatives under ASC 815, or that do not result in substantial premiums accounted for as paid-in-capital. As a result, more convertible debt instruments will be accounted for as a single liability measured at its amortized cost. In addition, the ASU requires the use of the if-converted method to be applied to convertible instruments when calculating earnings per share. The ASU is effective for fiscal years beginning after December 15, 2021, including interim periods within those fiscal years, using either a modified retrospective or a full retrospective approach. Early adoption is permitted for fiscal years beginning after December 15, 2020. The Company is currently evaluatingadopted the impact of this standardASU on our consolidated financial statements.
VONAGE HOLDINGS CORP.
NOTES TO CONDENSED CONSOLIDATED FINANCIAL STATEMENTS
(In thousands, except per share amounts)
(Unaudited)
Note 3. Revenue Recognition
The Company recognizes revenue in accordance with ASC Topic 606, Revenue from Contracts with Customers which is further described in Note 2, Summary of Significant Accounting Policies and Note 3, Revenue Recognition to the consolidated financial statements in our Annual Report on Form 10-K for the year ended December 31, 2020.2021.
Disaggregation of Revenue
The following tables detail our revenue from customers disaggregated by primary geographical market and source of revenue. The tables also include a reconciliation of the disaggregated revenue for our Vonage Communications Platform, or VCP, and Consumer segments.
| | | Three Months Ended | | Three Months Ended | | Three Months Ended | | Three Months Ended |
| | March 31, 2021 | | March 31, 2020 | | March 31, 2022 | | March 31, 2021 |
| | VCP | | Consumer | | Total | | VCP | | Consumer | | Total | | VCP | | Consumer | | Total | | VCP | | Consumer | | Total |
| Primary geographical markets | Primary geographical markets | | | | | | | | | | | | Primary geographical markets | | | | | | | | | | | |
| Americas | Americas | $ | 150,072 | | | $ | 74,932 | | | $ | 225,004 | | | $ | 129,379 | | | $ | 84,573 | | | $ | 213,952 | | Americas | $ | 177,957 | | | $ | 60,254 | | | $ | 238,211 | | | $ | 150,072 | | | $ | 74,932 | | | $ | 225,004 | |
| EMEA | EMEA | 62,835 | | | 2,514 | | | 65,349 | | | 49,217 | | | 2,631 | | | 51,848 | | EMEA | 73,768 | | | 2,164 | | | 75,932 | | | 62,835 | | | 2,514 | | | 65,349 | |
| APAC | APAC | 42,547 | | | 0 | | | 42,547 | | | 31,657 | | | 0 | | | 31,657 | | APAC | 44,685 | | | — | | | 44,685 | | | 42,547 | | | — | | | 42,547 | |
| | $ | 255,454 | | | $ | 77,446 | | | $ | 332,900 | | | $ | 210,253 | | | $ | 87,204 | | | $ | 297,457 | | | $ | 296,410 | | | $ | 62,418 | | | $ | 358,828 | | | $ | 255,454 | | | $ | 77,446 | | | $ | 332,900 | |
| Major Sources of Revenue | Major Sources of Revenue | | | | | | | | | | | | Major Sources of Revenue | | | | | | | | | | | |
| Service revenues | Service revenues | $ | 240,442 | | | $ | 65,697 | | | $ | 306,139 | | | $ | 195,649 | | | $ | 77,243 | | | $ | 272,892 | | Service revenues | $ | 284,198 | | | $ | 55,132 | | | $ | 339,330 | | | $ | 240,442 | | | $ | 65,697 | | | $ | 306,139 | |
| Access and product revenues | Access and product revenues | 8,598 | | | 56 | | | 8,654 | | | 10,122 | | | 63 | | | 10,185 | | Access and product revenues | 5,464 | | | 58 | | | 5,522 | | | 8,598 | | | 56 | | | 8,654 | |
| USF revenues | USF revenues | 6,414 | | | 11,693 | | | 18,107 | | | 4,482 | | | 9,898 | | | 14,380 | | USF revenues | 6,748 | | | 7,228 | | | 13,976 | | | 6,414 | | | 11,693 | | | 18,107 | |
| | $ | 255,454 | | | $ | 77,446 | | | $ | 332,900 | | | $ | 210,253 | | | $ | 87,204 | | | $ | 297,457 | | | $ | 296,410 | | | $ | 62,418 | | | $ | 358,828 | | | $ | 255,454 | | | $ | 77,446 | | | $ | 332,900 | |
| | |
In addition, the Company recognizes service revenues from its customers through subscription services provided or through usage or pay-per-use type arrangements. During the three months ended March 31, 2022, the Company recognized $144,752 related to subscription services, $167,166 related to usage, and $46,910 related to other revenues such as USF, other regulatory fees, and credits. During the three months ended March 31, 2021, the Company recognized $150,453 related to subscription services, $133,652 related to usage, and $48,795 related to other revenues such as USF, other regulatory fees, and credits. During the three months ended March 31, 2020, the Company recognized $156,455 related to subscription services, $93,047 related to usage, and $47,955 related to other revenues such as USF, other regulatory fees, and credits.
Contract Assets and Liabilities
The following table provides information about receivables and contract liabilities from contracts with customers:
| | | March 31, 2021 | December 31, 2020 | | March 31, 2022 | December 31, 2021 |
Receivables (1) | Receivables (1) | $ | 111,584 | | $ | 116,304 | | Receivables (1) | $ | 145,895 | | $ | 147,622 | |
Contract liabilities (2) | Contract liabilities (2) | 60,030 | | 65,506 | | Contract liabilities (2) | 53,978 | | 61,420 | |
(1) Amounts included in accounts receivables on our condensed consolidated balance sheets.
(2) Amounts included in deferred revenues on our condensed consolidated balance sheet.
Our deferred revenue represents the advance consideration received from customers for subscription services and is predominantly recognized over the following month as transfer of control occurs. During the three months ended March 31, 20212022 and March 31, 2020,2021, the Company recognized revenue of $106,037$102,363 and $108,875,$106,037, respectively, related to its contract liabilities. We expect to recognize $60,030$53,978 into revenue over the next twelve months related to our deferred revenue as of March 31, 2021.2022.
VONAGE HOLDINGS CORP.
NOTES TO CONDENSED CONSOLIDATED FINANCIAL STATEMENTS
(In thousands, except per share amounts)
(Unaudited)
Remaining Performance Obligation
Transaction price allocated to the remaining performance obligation represents contracted revenue that has not yet been recognized. The typical subscription term may range from 1 month to 3 years. Contracted revenue as of March 31, 20212022 that has not yet been recognized was approximately $0.4 billion. This excludes contracts with an original expected length of less than one year. The Company expects to recognize the majority of its remaining performance obligation over the next 18 months.
Contract Acquisition Costs
We have various commission programs for internal sales personnel and channel partners that are incremental to the acquisition of customer contracts. These costs are recorded as deferred contract acquisition costs on the consolidated balance sheets which eligible employees and third parties may earn a commission on sales of services and products to customers. We expect that these commission fees are recoverable and, therefore, we have capitalized $88,099$101,697 and $85,690$101,403 as contract costs, net of accumulated amortization, as of March 31, 20212022 and December 31, 2020,2021, respectively, included within deferred customer acquisitions costs, current portion and deferred customer acquisition costs on our condensed consolidated balance sheets. Capitalized commission fees are amortized to sales and marketing expense over estimated customer life, which is 7 years for Vonage Communications Platform customers. The amounts amortized to sales and marketing expense were $4,762$5,899 and $3,661, respectively,$4,762 for the three months ended March 31, 20212022 and March 31, 2020,2021, respectively. There were no impairment losses recognized in relation to the costs capitalized during the three months ended March 31, 20212022 and 2020.2021. In addition, the Company expenses sales commissions for commission plans related to customer arrangements deemed less than a year and for residuals and renewals.
VONAGE HOLDINGS CORP.
NOTES TO CONDENSED CONSOLIDATED FINANCIAL STATEMENTS
(In thousands, except per share amounts)
(Unaudited)
Note 4. Earnings Per Share
The following table sets forth the computation for basic and diluted loss per share for the three months ended March 31, 20212022 and 2020:2021:
| | | | | Three Months Ended | | | | Three Months Ended | |
| | March 31, | | | March 31, | |
| | | | 2021 | | 2020 | | | | 2022 | | 2021 | |
| Numerator | Numerator | | | | | | Numerator | | | | | |
| Net loss | Net loss | | $ | (376) | | | $ | (3,755) | | | Net loss | | $ | (17,122) | | | $ | (376) | | |
| Denominator | Denominator | | | Denominator | | |
| Weighted average common shares outstanding for basic and diluted net loss per share | Weighted average common shares outstanding for basic and diluted net loss per share | | 249,638 | | | 243,627 | | | Weighted average common shares outstanding for basic and diluted net loss per share | | 254,666 | | | 249,638 | | |
| | Basic and diluted loss per share | Basic and diluted loss per share | | | Basic and diluted loss per share | | |
| Basic and diluted loss per share | Basic and diluted loss per share | | $ | 0 | | | $ | (0.02) | | | Basic and diluted loss per share | | $ | (0.07) | | | $ | — | | |
|
For the three months ended March 31, 20212022 and 2020,2021, the following were excluded from the calculation of diluted loss per common share because of their anti-dilutive effects:
| | | | | Three Months Ended | | | | Three Months Ended | |
| | March 31, | | | March 31, | |
| | | | 2021 | | 2020 | | | | 2022 | | 2021 | |
| Restricted stock units | Restricted stock units | | 15,795 | | | 13,894 | | | Restricted stock units | | 13,534 | | | 15,795 | | |
| Stock options | Stock options | | 1,387 | | | 4,878 | | | Stock options | | 360 | | | 1,387 | | |
| Convertible senior notes | | Convertible senior notes | | 20,634 | | | — | | |
| | | 34,528 | | | 17,182 | | |
| 17,182 | | | 18,772 | | | |
AsUpon adoption of ASU 2020-06 on January 1, 2022, the Company expectsutilizes the if-converted method when calculating any potential dilutive effect on diluted net income per share, if applicable. Under the if-converted method, shares related to our convertible senior notes, to the extent dilutive, are assumed to be converted into common stock at the beginning of the period. Prior to the adoption of ASU 2020-06, as the Company expected to settle the principal amount of its outstanding convertible senior notes in cash and any excess in cash or shares of the Company’s common stock, the Company usesused the treasury stock method for calculating any potential dilutive effect of the conversion spread on diluted net income per share, if applicable. The conversion spread willwould have had a dilutive impact on diluted net income per share of common stock when the average market price of the Company’s common stock for a given period exceeds the conversion price of $16.72 per share. The Company's Convertible Senior Notes are further described in Note 6, Long-Term Debt.
VONAGE HOLDINGS CORP.
NOTES TO CONDENSED CONSOLIDATED FINANCIAL STATEMENTS
(In thousands, except per share amounts)
(Unaudited)
Note 5. Income Taxes
The income tax consisted of the following:
| | | | | | | | | | | | | | | | | | |
| | Three Months Ended | |
| | March 31, | |
| | | 2021 | | 2020 | | | | |
| Income (loss) before income taxes | | $ | 1,805 | | | $ | (4,005) | | | | | |
| Income tax (expense) benefit | | (2,181) | | | 250 | | | | | |
| Effective tax rate | | 120.8 | % | | 6.2 | % | | | | |
| | | | | | | | | | | | | | | | | | |
| | Three Months Ended | |
| | March 31, | |
| | | 2022 | | 2021 | | | | |
| (Loss) Income before income taxes | | $ | (21,988) | | | $ | 1,805 | | | | | |
| Income tax benefit (expense) | | 4,866 | | | (2,181) | | | | | |
| Effective tax rate | | 22.1 | % | | 120.8 | % | | | | |
Generally, provisions for income taxes during interim reporting periods apply an estimate of the annual effective tax rate for the full year. The provision for income taxes will vary with levels of pre-tax income (loss) and non-deductible expenses, NOL valuation allowances and other permanent non-deductible charges which can cause the rate to fluctuate from quarter to quarter. An alternative approach may be recorded under a discrete method which applies actual adjustments for the period including specific permanent adjustments and geographic distribution of our pre-tax income (loss). TheConsistent with the prior interim period, the discrete method was determined to be the appropriate method for calculating the interim tax provision as using the estimated annual effective tax rate method would have produced an unreliable rate stemming from aan estimated annual marginal loss and large permanent adjustments.
For the three months ended March 31, 2022, our effective tax rate was different than the statutory rate primarily due to the permanent items related to limitations on executive compensation, the benefit related to equity compensation, and limitation on foreign nondeductible losses.
For the three months ended March 31, 2021, our effective tax rate was different than the statutory rate primarily due to an increase in permanent items related to limitations on executive compensation, the inclusion of foreign income in the U.S. due to foreign disregarded entities, and limitation on foreign losses.
For the three months ended March 31, 2020, our effective tax rate was different than the statutory rate primarily due to the recognition of discrete period tax benefit of $2,115, which was recognized related to excess tax benefits on equity compensation. In addition, the Company’s actual effective tax rate for the current year has reduced the expected annual benefit as a result of permanent adjustments related to limitations on executive compensation deductibility and inclusion of income in the U.S. due to foreign disregarded entities.
Uncertain Tax Positions
The Company had uncertain tax benefits of $1,001$1,296 and $632$1,271 as of March 31, 20212022 and December 31, 2020,2021, respectively. The Company recognizes interest and penalties related to uncertain tax benefits in income tax expense. The Company incurred interest expense and/or penalties of $2$9 and $0, respectively,$2, during the three months ended March 31, 2022 and 2021, and March 31, 2020.respectively. The following table reconciles the total amounts of uncertain tax benefits:
| | | | | | | | | | | |
| | March 31, 2021 | | December 31, 2020 |
| Balance as of January 1 | $ | 632 | | | $ | 914 | |
| Increase due to current year positions | 375 | | | 114 | |
| Increase due to prior year positions | 4 | | | 0 | |
| Decrease due to settlements and payments | 0 | | | (173) | |
| Decrease due to lapse of applicable statute of limitations | 0 | | | (238) | |
| (Decrease) increase due to foreign currency fluctuation | (10) | | | 15 | |
| Uncertain tax benefits as of the end of the period | $ | 1,001 | | | $ | 632 | |
Net Operating Loss Carry Forwards
As of March 31, 2021, the Company has U.S. Federal and state NOL carryforwards of $410,731 and $207,769, respectively, which expire at various times through 2037. We have Non-US NOLs of $159,152 primarily related to the United Kingdom which has no expiration date. | | | | | | | | | | | |
| | March 31, 2022 | | December 31, 2021 |
| Balance as of January 1 | $ | 1,271 | | | $ | 632 | |
| Increase due to current year positions | 26 | | | 1,061 | |
| Increase (decrease) due to prior year positions | 3 | | | (5) | |
| Decrease due to settlements and payments | — | | | (355) | |
| Decrease due to lapse of applicable statute of limitations | — | | | (60) | |
| Decrease due to foreign currency fluctuation | (4) | | | (2) | |
| Uncertain tax benefits as of the end of the period | $ | 1,296 | | | $ | 1,271 | |
VONAGE HOLDINGS CORP.
NOTES TO CONDENSED CONSOLIDATED FINANCIAL STATEMENTS
(In thousands, except per share amounts)
(Unaudited)
Net Operating Loss Carry Forwards
As of March 31, 2022, the Company has U.S. Federal and state NOL carryforwards of $352,077 and $184,914, respectively, which expire at various times through 2037. We have non-US NOLs of $170,366 primarily related to the United Kingdom which has no expiration date. Under Section 382 of the Internal Revenue Code, if we undergo an “ownership change” which is generally defined as a greater than 50% change by value in our equity ownership over a three-year period, our ability to use our pre-change of control NOLs and other pre-change tax attributes against our post-change income may be limited. The Section 382 limitation is applied so as to limit the use of our pre-change NOLs to an amount that generally equals the value of our stock immediately before the ownership change multiplied by a designated federal long-term tax-exempt rate. At March 31, 2022, there were no limitations on the use of our NOLs except for a certain portion of the NOLs acquired with Vocalocity, which the Company has reflected in the deferred tax asset.
Note 6. Long-Term Debt
This footnote should be read in conjunction with the complete description of our financing arrangements under Note 8, Long-Term Debt, to the consolidated financial statements included in our Annual Report on Form 10-K for the year ended December 31, 2020.2021.
The following table summarizes the Company's long-term debt as of March 31, 20212022 and December 31, 2020:2021:
| | | March 31, 2021 | | December 31, 2020 | | March 31, 2022 | | December 31, 2021 |
| Revolving credit facility - due 2023 | Revolving credit facility - due 2023 | 210,500 | | | 215,500 | | Revolving credit facility - due 2023 | 130,500 | | | 130,500 | |
| Convertible senior notes - due 2024 | Convertible senior notes - due 2024 | 345,000 | | | 345,000 | | Convertible senior notes - due 2024 | 345,000 | | | 345,000 | |
| Long-term debt including current maturities | Long-term debt including current maturities | 555,500 | | | 560,500 | | Long-term debt including current maturities | 475,500 | | | 475,500 | |
| Less unamortized discount | Less unamortized discount | 45,441 | | | 48,702 | | Less unamortized discount | — | | | 35,472 | |
| Less debt issuance costs | Less debt issuance costs | 5,115 | | | 5,514 | | Less debt issuance costs | 4,380 | | | 3,919 | |
| Total long-term debt | Total long-term debt | $ | 504,944 | | | $ | 506,284 | | Total long-term debt | $ | 471,120 | | | $ | 436,109 | |
Convertible Senior Notes
In June 2019, the Company issued $300.0 million aggregate principal amount of 1.75% convertible senior notes due 2024 in a private placement and an additional $45.0 million aggregate principal amount of such notes pursuant to the exercise in full of the over-allotment option of the initial purchasers (collectively, "Convertible Senior Notes"). The Convertible Senior Notes are the Company's senior unsecured obligations. The Convertible Senior Notes will mature on June 1, 2024, unless earlier redeemed, repurchased or converted. We may not redeem the notes prior to June 5, 2022.
Each $1,000 principal amount of the Convertible Senior Notes is initially convertible into 59.8256 shares of the Company's common stock, which is equivalent to an initial conversion price of approximately $16.72 per share. The conversion rate is subject to adjustment upon the occurrence of certain specified events but will not be adjusted for any accrued and unpaid interest. In addition, upon the occurrence of a make-whole fundamental change or a redemption period, each as defined in the indenture setting forth the terms of the Convertible Senior Notes, the Company will, in certain circumstances, increase the conversion rate by a number of additional shares for a holder that elects to convert its Convertible Senior Notes in connection with such make-whole fundamental change or during the relevant redemption period.
Prior to December 1, 2023, the notes will be convertible only upon satisfaction of certain conditions and during certain periods, and thereafter, at any time until the close of business on the second scheduled trading day immediately preceding the maturity date. We will satisfy any conversion election by paying or delivering, as the case may be, cash, shares of common stock or a combination of cash and shares of common stock. During the three months ended March 31, 2021,2022, the conditions allowing holders of the Convertible Senior Notes to convert were not met.
VONAGE HOLDINGS CORP.
NOTES TO CONDENSED CONSOLIDATED FINANCIAL STATEMENTS
(In thousands, except per share amounts)
(Unaudited)
The net carrying amount of the liability component of the Convertible Senior Notes was as follows:
| | | | | | | | |
| | March 31, 20212022 |
| Principal | | $ | 345,000 | |
Unamortized discount | | (45,441) | |
| Unamortized issuance cost | | (5,115)(4,380) | |
| Net carrying amount | | $ | 294,444340,620 | |
VONAGE HOLDINGS CORP.
NOTES TO CONDENSED CONSOLIDATED FINANCIAL STATEMENTS
(In thousands, except per share amounts)
(Unaudited)
The following table sets forth the interest expense recognized related to the Convertible Senior Notes:
| | | Three Months Ended | | | Three Months Ended | |
| | March 31, | | | March 31, | |
| | 2021 | | 2020 | | | 2022 | | 2021 | |
| Contractual interest expense | Contractual interest expense | $ | 1,509 | | | $ | 1,509 | | | Contractual interest expense | $ | 1,509 | | | $ | 1,509 | | |
| Amortization of debt discount | Amortization of debt discount | 3,261 | | | 3,054 | | | Amortization of debt discount | — | | | 3,261 | | |
| Amortization of debt issuance costs | Amortization of debt issuance costs | 399 | | | 399 | | | Amortization of debt issuance costs | 495 | | | 399 | | |
| Total interest expense related to the Convertible Senior Notes | Total interest expense related to the Convertible Senior Notes | $ | 5,169 | | | $ | 4,962 | | | Total interest expense related to the Convertible Senior Notes | $ | 2,004 | | | $ | 5,169 | | |
In connection with the pricing of the Convertible Senior Notes and subsequently in connection with the exercise of the initial purchaser's option to purchase additional notes, the Company entered into privately negotiated capped call transactions with certain counterparties (the "Capped Calls"). The Capped Calls each have a strike price of $16.72 per share, subject to certain adjustments, which corresponds to the initial conversion price of the Convertible Senior Notes. The Capped Calls have initial cap prices of $23.46 per share, subject to certain adjustments. The Capped Calls are expected generally to reduce potential dilution to the Company's common stock upon any conversion of notes and/or offset any cash payments the Company is required to make in excess of the aggregate principal amount of converted notes, as the case may be, with such reduction and/or offset subject to a cap. The initial cap price of the Capped Call transactions was $23.46.
2018 Term Note and Revolving Credit Facility
On July 31, 2018, the Company entered into the 2018 Credit Facility consisting of a $100 million senior secured term loan and a $500 million revolving credit facility. The co-borrowers under the 2018 Credit Facility are the Company and Vonage America Inc., the Company’s wholly owned subsidiary. Obligations under the 2018 Credit Facility are guaranteed, fully and unconditionally, by the Company’s other United States subsidiaries and are secured by substantially all of the assets of each borrower and each guarantor.
The effective interest rate was 3.25% as of March 31, 2022. During three months ended March 31, 2022, we borrowed $10 million and repaid $10 million under the revolving facility, respectively. During the three months ended March 31, 2021, we repaid $5 million under the revolving facility. In addition, the effective interest rate was 2.88% as of March 31, 2021. During the three months ended March 31, 2020, we borrowed $45 million under the revolving credit facility. As of March 31, 2021,2022, we were in compliance with all covenants, including financial covenants, for the 2018 Credit Facility.
Note 7. Leases
The Company entered into various non-cancelable operating lease arrangements for certain of our existing office and telecommunications co-location space as well as operating leases for certain equipment. The operating leases expire at various times through 2028, some of which provide the Company options to extend the lease for terms up to 5 years beyond the original term. We are committed to pay a portion of the buildings’ operating expenses as required under the arrangements which we will separate as a non-lease component when readily determinable. The Company did not have any finance leases as of March 31, 20212022 and December 31, 2020.2021.
The Company incurred operating lease expense of $2,558 and $2,965, respectively, during the three months ended March 31, 2021 and March 31, 2020, related to its operating leases. In addition, the Company received sub-lease income of $284 and $319, respectively, during the three months ended March 31, 2021 and March 31, 2020. Additionally, the remaining weighted average lease term for our operating leases was 5.03 years and the weighted average discount rate utilized to measure the Company's operating leases was 4.35% as of March 31, 2021.
VONAGE HOLDINGS CORP.
NOTES TO CONDENSED CONSOLIDATED FINANCIAL STATEMENTS
(In thousands, except per share amounts)
(Unaudited)
The Company incurred operating lease expense of $2,472 and $2,558, respectively, during the three months ended March 31, 2022 and 2021, related to its operating leases. In addition, the Company received sub-lease income of $287 and $284, respectively, during the three months ended March 31, 2022 and 2021. Additionally, the remaining weighted average lease term for our operating leases was 4.50 years and the weighted average discount rate utilized to measure the Company's operating leases was 4.09% as of March 31, 2022.
Supplemental cash flow related to the Company's operating leases is as follows:
| | | Three Months Ended | | Three Months Ended |
| | March 31, 2021 | | March 31, 2020 | | March 31, 2022 | | March 31, 2021 |
| | Cash paid for amounts included in the measurement of lease liabilities | Cash paid for amounts included in the measurement of lease liabilities | $ | 2,628 | | | $ | 4,139 | | Cash paid for amounts included in the measurement of lease liabilities | $ | 2,924 | | | $ | 2,628 | |
| Right-of-use assets obtained in exchange for lease obligations | Right-of-use assets obtained in exchange for lease obligations | $ | 8,431 | | | $ | 1,261 | | Right-of-use assets obtained in exchange for lease obligations | $ | 4,759 | | | $ | 8,431 | |
Maturities of operating lease liabilities as of March 31, 20212022 and December 31, 20202021 are as follows:
| | | March 31, 2021 | | December 31, 2020 | | March 31, 2022 | | December 31, 2021 |
2021 (1) | $ | 9,407 | | | 13,134 | | |
| 2022 | 10,975 | | | 9,645 | | |
2022 (1) | | 2022 (1) | $ | 10,736 | | | 11,825 | |
| 2023 | 2023 | 10,735 | | | 8,401 | | 2023 | 11,871 | | | 11,089 | |
| 2024 | 2024 | 6,817 | | | 4,148 | | 2024 | 8,195 | | | 7,193 | |
| 2025 | 2025 | 6,917 | | | 4,248 | | 2025 | 8,430 | | | 7,404 | |
| 2026 | | 2026 | 7,512 | | | 6,431 | |
| Thereafter | Thereafter | 9,525 | | | 7,522 | | Thereafter | 3,669 | | | 3,280 | |
| Total lease payments | Total lease payments | 54,376 | | | 47,098 | | Total lease payments | 50,413 | | | 47,222 | |
| Less imputed interest | Less imputed interest | (5,465) | | | (4,525) | | Less imputed interest | (5,392) | | | (4,166) | |
| Total | Total | $ | 48,911 | | | $ | 42,573 | | Total | $ | 45,021 | | | $ | 43,056 | |
(1) Excluding three months ended March 31, 20212022 for the period ended March 31, 2021.
During the year ended December 31, 2021, the Company entered into a new lease agreement to relocate its corporate headquarters to a new leased facility located in Holmdel, New Jersey. As a result, the Company incurred a charge associated with the abandonment of its former corporate headquarters during the first quarter of 2020, the Company amended one2022 of its office leases to remove a renewal period of 5 years beyond the initial lease term. In the Company's adoption of ASC 842, the Company had included the available renewal term within the transition asset and liability as the renewal was highly probable at the time of adoption. As a result, the Company's operating lease liability was reduced by $15,825 with a corresponding reduction in the Company's operating lease right-of-use assets as of March 31, 2020. During the third and fourth quarters of 2020, the Company abandoned a few of its office leases and as such, the Company reduced its operating lease right-of-use asset by $9,503 as of December 31, 2020 by accelerating the amortization of the right-of-use asset through the cease use date which is included in general and administrative expense.$2,103.
VONAGE HOLDINGS CORP.
NOTES TO CONDENSED CONSOLIDATED FINANCIAL STATEMENTS
(In thousands, except per share amounts)
(Unaudited)
Note 8. Common Stock
As of March 31, 20212022 and December 31, 2020,2021, the Company had 596,950 shares of common stock authorized and had 9,7828,540 shares available for grants under our share-based compensation programs as of March 31, 2021.2022. For a detailed description of our share-based compensation programs refer to Note 11, Employee Stock Benefit Plans in the consolidated financial statements included in our Annual Report on Form 10-K for the year ended December 31, 2020.2021. The following table reflects the changes in the Company's common stock issued and outstanding:
| | For the Three Months Ended | For the Three Months Ended | | For the Three Months Ended | |
| (in thousands) | (in thousands) | Issued | | Treasury | | Outstanding | (in thousands) | Issued | | Treasury | | Outstanding |
| Balance at December 31, 2019 | 315,808 | | | (72,959) | | | 242,849 | | |
| Shares issued under the 2015 Equity Incentive Plan | 4,072 | | | 0 | | | 4,072 | | |
| Employee taxes paid on withholding shares | 0 | | | (1,675) | | | (1,675) | | |
| Balance at March 31, 2020 | 319,880 | | | (74,634) | | | 245,246 | | |
| | Balance at December 31, 2020 | Balance at December 31, 2020 | 323,815 | | | (74,841) | | | 248,974 | | Balance at December 31, 2020 | 323,815 | | | (74,841) | | | 248,974 | |
| Shares issued under the 2015 Equity Incentive Plan | Shares issued under the 2015 Equity Incentive Plan | 3,612 | | | 0 | | | 3,612 | | Shares issued under the 2015 Equity Incentive Plan | 3,612 | | | — | | | 3,612 | |
| Employee taxes paid on withholding shares | Employee taxes paid on withholding shares | 0 | | | (1,316) | | | (1,316) | | Employee taxes paid on withholding shares | — | | | (1,316) | | | (1,316) | |
| Balance at March 31, 2021 | Balance at March 31, 2021 | 327,427 | | | (76,157) | | | 251,270 | | Balance at March 31, 2021 | 327,427 | | | (76,157) | | | 251,270 | |
| | Balance at December 31, 2021 | | Balance at December 31, 2021 | 331,330 | | | (77,324) | | | 254,006 | |
| Shares issued under the 2015 Equity Incentive Plan | | Shares issued under the 2015 Equity Incentive Plan | 3,637 | | | 0 | | 3,637 | |
| Employee taxes paid on withholding shares | | Employee taxes paid on withholding shares | 0 | | (1,208) | | | (1,208) | |
| Balance at March 31, 2022 | | Balance at March 31, 2022 | 334,967 | | | (78,532) | | | 256,435 | |
|
Note 9. Commitments and Contingencies
Litigation
From time to time we are subject to legal proceedings, governmental inquiries, claims and investigations relating to our business, including claims of alleged infringement of commercial, employment, intellectual property rights, and other matters. From time to time,In addition, we receive letters or other communications from third parties inviting us to obtain patent licenses that might be relevant to our business or alleging that our services infringe upon third-party patents or other intellectual property. In accordance with generally accepted accounting principles, we make a provision for a liability when it is both probable that a liability has been incurred and the amount of the loss or range of loss can be reasonably estimated. These provisions, if any, are reviewed at least quarterly and adjusted to reflect the impacts of negotiations, settlements, rulings, advice of legal counsel, and other information and events pertaining to a particular case. Litigation is inherently unpredictable. We believe that we have valid defenses with respect to the legal matters pending against us and are vigorously defending these matters. Given the uncertainty surrounding litigation and our inability to assess the likelihood of a favorable or unfavorable outcome in such matters and our inability to reasonably estimate the amount of loss or range of loss, it is possible that the resolution of one or more of these matters could have a material adverse effect on our condensed consolidated financial position, cash flows or results of operations.
Regulation
Telephony services are subject to a broad spectrum of state, federal and foreign regulations. Because of the uncertainty over whether VoIP should be treated as a telecommunications or information service, we have been involved in a substantial amount of state and federal regulatory activity. Implementation and interpretation of the existing laws and regulations is ongoing and is subject to litigation by various federal and state agencies and courts. Due to the uncertainty over the regulatory classification of VoIP service, there can be no assurance that we will not be subject to new regulations or existing regulations under new interpretations, and that such change would not introduce material additional costs to our business. The Company continues to monitor federal regulations relating to net neutrality, rural call completion issues, number slamming, 911 access, access to telecommunication equipment and services by persons with disabilities, caller ID services, number portability, unwanted calls to reassigned numbers, and robocalling. As we continue to expand globally, these types of regulations are likely to be similarly enacted and enforced by the local regulatory authorities.
VONAGE HOLDINGS CORP.
NOTES TO CONDENSED CONSOLIDATED FINANCIAL STATEMENTS
(In thousands, except per share amounts)
(Unaudited)
State and Municipal Taxes
In accordance with generally accepted accounting principles, we make a provision for a liability for taxes when it is both probable that a liability has been incurred and the amount of the liability or range of liability can be reasonably estimated. These provisions are reviewed at least quarterly and adjusted to reflect the impacts of negotiations, settlements, rulings, advice of legal counsel, and other information and events pertaining to a particular case. From time to time, we have received inquiries from a number of states and local taxing agencies with respect to the remittance of sales, use, telecommunications, and excise taxes. Several jurisdictions are currently conducting tax audits of the Company's records. While the Company collects or has accrued for taxes that it believes are required to be remitted, it has reviewed its positions in those various jurisdictions as well as other regulatory fees and has established appropriate reserves. As such, we have established reserves of $8,648$10,428 and $8,560$10,010 as of March 31, 20212022 and December 31, 2020,2021, respectively, as our best estimate of the potential tax exposure for any retroactive assessment.
VONAGE HOLDINGS CORP.
NOTES TO CONDENSED CONSOLIDATED FINANCIAL STATEMENTS
(In thousands, except per share amounts)
(Unaudited)
Note 10. Industry Segment and Geographic Information
ASC 280, Segment Reporting, establishes reporting standards for an enterprise's business segments and related disclosures about its products, services, geographic areas and major customers. Under ASC 280, the method for determining what information to report is based upon the way management organizes the reportable operating segments within the Company for making operating decisions and assessing financial performance. Our chief operating decision-maker reviews revenue and Adjusted EBITDA for each of our reportable operating segments. Beginning as of December 31, 2020, the Company includes Adjusted EBITDA as this is the measure management uses to evaluate the profitability of our reportable operating segments. The items excluded from Adjusted EBITDA are not separately evaluated for each reportable operating segment. The Company has recast data from prior years to reflect the change how the Company evaluates the profitability of its reportable operating segments to conform to the current year presentation. In addition, with the exception of goodwill and intangible assets, we do not identify or allocate our assets by the reportable operating segments as this information is not utilized by management to allocate resources or capital.
Vonage Communications Platform
The Vonage Communications Platform is our single enterprise cloud communications platform, offering our wide range of enterprise communications services and solutions including Communications APIs, Unified Communications, and Contact Center Communications. The Vonage Communications Platform brings unique value to businesses by providing multiple communications channels - video, voice, messaging, email and verification - that integrate into applications, products and workflows. This delivers both the power and the flexibility our customers need to disrupt their industries, and enables the type of business continuity, remote work, and remote delivery of services that are now essential for companies to work and serve customers from anywhere. Vonage products and services enable our business customers to fundamentally change how they engage with their customers and team members. We have a robust set of solutions and services that meet the needs of businesses of all sizes, from micro, to SMB through mid-market and enterprise. We provide customers with multiple deployment options designed to provide the reliability and quality of service they demand. Vonage solutions also integrate with today's leading business applications, CRM and productivity tools,, including Google’s G Suite, Zendesk, Salesforce’s Sales and Service Clouds, Microsoft Dynamics, ServiceNow, Oracle, and Clio among others, to drive internal communications and collaboration among team members and external engagement with customers.
Consumer
For our Consumer customers, we enable users to access and utilize our UCaaS services and features, via a single “identity,” either a number or user name, regardless of how they are connected to the Internet, including over 3G/4G, LTE, Cable, or DSL broadband networks. This technology enables us to offer our Consumer customers attractively priced voice and messaging services and other features around the world on a variety of devices.
Information about our segment results for the three months ended March 31, 20212022 and March 31, 20202021 were as follows:
| | Three Months Ended | Three Months Ended | | Service Revenue | | Revenue | | | Adjusted EBITDA | | Depreciation and Amortization | Three Months Ended | | Service Revenue | | Revenue | | | Adjusted EBITDA | | Depreciation and Amortization |
| March 31, 2021 | | | | | | | | | | |
| March 31, 2022 | | March 31, 2022 | | | | | | | | | |
| Vonage Communications Platform | Vonage Communications Platform | | $ | 240,442 | | | $ | 255,454 | | | | $ | (1,846) | | | $ | 20,080 | | Vonage Communications Platform | | $ | 284,198 | | | $ | 296,410 | | | | $ | 2,166 | | | $ | 25,054 | |
| Consumer | Consumer | | 65,697 | | | 77,446 | | | | 50,013 | | | 337 | | Consumer | | 55,132 | | | 62,418 | | | | 41,893 | | | 141 | |
| Total Vonage | Total Vonage | | $ | 306,139 | | | $ | 332,900 | | | | $ | 48,167 | | | $ | 20,417 | | Total Vonage | | $ | 339,330 | | | $ | 358,828 | | | | $ | 44,059 | | | $ | 25,195 | |
| | March 31, 2020 | | | | |
| March 31, 2021 | | March 31, 2021 | | | |
| Vonage Communications Platform | Vonage Communications Platform | | $ | 195,649 | | | $ | 210,253 | | | | $ | (21,088) | | | $ | 19,198 | | Vonage Communications Platform | | $ | 240,442 | | | $ | 255,454 | | | | $ | (1,846) | | | $ | 20,080 | |
| Consumer | Consumer | | 77,243 | | | 87,204 | | | | 59,925 | | | 1,287 | | Consumer | | 65,697 | | | 77,446 | | | | 50,013 | | | 337 | |
| Total Vonage | Total Vonage | | $ | 272,892 | | | $ | 297,457 | | | | $ | 38,837 | | | $ | 20,485 | | Total Vonage | | $ | 306,139 | | | $ | 332,900 | | | | $ | 48,167 | | | $ | 20,417 | |
|
VONAGE HOLDINGS CORP.
NOTES TO CONDENSED CONSOLIDATED FINANCIAL STATEMENTS
(In thousands, except per share amounts)
(Unaudited)
The Company uses Adjusted EBITDA as the measure of profit or loss for the evaluation of performance and allocation of resources of our reportable operating segments. Adjusted EBITDA is defined as net income or net loss attributable to Vonage before income tax expense or benefit, interest expense, depreciation and amortization, stock-based expense, amortization of costs to implement cloud computing arrangements, share-based expense, acquisition related transaction and integration costs, organizational transformation costs, restructuringexit activities - severance and lease abandonment, and other non-recurring items. Organizational transformation includes employee related exits including CEO succession, system change management, facility exit costs,Exit activities - severance and rebranding. Restructuring activitieslease abandonment relate to the Company's business-wide optimization and alignment project initiated in 2020 which included employee related exits and further facility exit costs executed upon as part of the overall project. Other non-recurring items principally include certain litigation charges including defense costs, acquisition related consideration accounted for as compensation, long term incentive award and other non-recurring project costs such as the review of the Consumer business review and the business optimization project, both of which were initiated in 2020.business. This is also consistent with the measure used under our bank credit assessment. Our reconciliation of the aggregate amount of Adjusted EBITDA for our reportable segments to consolidated income before taxes is presented below:
| | | Three Months Ended | | | Three Months Ended | |
| | March 31, | | | March 31, | |
| | 2021 | | 2020 | | | 2022 | | 2021 | |
| Adjusted EBITDA | Adjusted EBITDA | $ | 48,167 | | | $ | 38,837 | | | Adjusted EBITDA | $ | 44,059 | | | $ | 48,167 | | |
| Interest expense | Interest expense | (7,298) | | | (8,082) | | | Interest expense | (3,653) | | | (7,298) | | |
| Depreciation and amortization | Depreciation and amortization | (20,417) | | | (20,485) | | | Depreciation and amortization | (25,195) | | | (20,417) | | |
| Amortization of costs to implement cloud computing arrangements | Amortization of costs to implement cloud computing arrangements | (896) | | | (609) | | | Amortization of costs to implement cloud computing arrangements | (1,175) | | | (896) | | |
| Share-based expense | Share-based expense | (14,566) | | | (11,116) | | | Share-based expense | (29,042) | | | (14,566) | | |
| Acquisition related transaction and integration costs | | Acquisition related transaction and integration costs | (1,744) | | | — | | |
| | Organizational transformation | 0 | | | (1,194) | | | |
| Restructuring activities | (1,294) | | | 0 | | | |
| Exit activities - severance and lease abandonment | | Exit activities - severance and lease abandonment | (2,103) | | | (1,294) | | |
| Other non-recurring items | Other non-recurring items | (1,891) | | | (1,356) | | | Other non-recurring items | (3,135) | | | (1,891) | | |
| Income (Loss) before taxes | $ | 1,805 | | | $ | (4,005) | | | |
| (Loss) Income before taxes | | (Loss) Income before taxes | $ | (21,988) | | | $ | 1,805 | | |
Information about our operations by geographic location is as follows:
| | | | March 31, 2021 | | December 31, 2020 | | March 31, 2022 | | December 31, 2021 |
| Long-lived assets: | Long-lived assets: | | | | Long-lived assets: | | | |
| United States | United States | $ | 635,595 | | | $ | 646,072 | | United States | $ | 622,093 | | | $ | 627,243 | |
| United Kingdom | United Kingdom | 294,600 | | | 293,457 | | United Kingdom | 268,519 | | | 278,173 | |
| Israel | Israel | 1,178 | | | 1,325 | | Israel | 1,663 | | | 1,702 | |
| | $ | 931,373 | | | $ | 940,854 | | | $ | 892,275 | | | $ | 907,118 | |
| | | | | |
| Item 2. | Management’s Discussion and Analysis of Financial Condition and Results of Operations |
You should read the following discussion together with our condensed consolidated financial statements and the related notes included elsewhere in this Form 10-Q and our audited financial statements included in our Annual Report on Form 10-K. This discussion contains forward-looking statements. These forward-looking statements are based on information available at the time the statements are made and/or management’s belief as of that time with respect to future events and involve risks and uncertainties that could cause actual results and outcomes to be materially different. Important factors that could cause such differences include but are not limited to: realizing the benefits of optimization and cost-saving initiatives; the impact of the COVID-19 pandemic; the competition we face; the expansion of competition in the cloud communications market; risks related to the acquisition or integration of businesses we have acquired; our ability to adapt to rapid changes in the cloud communications market; the nascent state of the cloud communications for business market; our ability to retain customers and attract new customers cost-effectively; the risk associated with developing and maintaining effective internal sales teams and effective distribution channels; security breaches and other compromises of information security; risks associated with sales of our services to medium-sized and enterprise customers; our reliance on third-party hardware and software; our dependence on third-party facilities, equipment, systems and services; system disruptions or flaws in our technology and systems; our ability to comply with data privacy and related regulatory matters; our ability to scale our business and grow efficiently; our dependence on third party vendors; the impact of fluctuations in economic conditions, particularly on our small and medium business customers; our ability to obtain or maintain relevant intellectual property licenses or to protect our trademarks and internally developed software; restrictions in our debt agreements that may limit our operating flexibility; our ability to obtain additional financing if required; our ability to raise funds necessary to settle conversion of the 2024 convertible senior notes; conditional conversion features of the convertible senior notes; the cash settlement of the convertible senior notes; the effects of the capped call transactions in connection with the convertible senior notes; fraudulent use of our name or services; intellectual property and other litigation that have been and may be brought against us; reliance on third parties for our 911 services; uncertainties relating to regulation of business services; risks associated with legislative, regulatory or judicial actions regarding our business products; risks associated with operating abroad; risks associated with the taxation of our business; governmental regulation and taxes in our international operations; liability under anti-corruption laws or from governmental export controls or economic sanctions; our dependence on our customers' unimpeded access to broadband connections; foreign currency exchange risk; our history of net losses and ability to achieve consistent profitability in the future; our ability to fully realize the benefits of our net operating loss carry-forwards if an ownership change occurs; certain provisions of our charter documents; and other factors that are set forth under “Risk Factors” in Item 1A of our Annual Report on Form 10-K for the fiscal year ended December 31, 2020.2021. While we may elect to update forward-looking statements at some point in the future, we specifically disclaim any obligation to do so, and therefore, you should not rely on these forward-looking statements as representing our views as of any date subsequent to the date this Form 10-Q is filed with the Securities and Exchange Commission.
Financial Information Presentation
Management's discussion and analysis of financial condition and results of operations is provided as a supplement to, and should be read in connection with, the consolidated financial statements and related notes thereof. For the financial information discussed in this Quarterly Report on Form 10-Q, other than per share and per line amounts, dollar amounts are presented in thousands, except where noted. All trademarks are the property of their owners.
Overview
At Vonage, our vision is to accelerate the world's ability to connect. We are observing a secular change in the way business is done, with a fundamental shift in how communications technologies are being leveraged in almost every industry. Through the Vonage Communications Platform, our strategy is to deliver a single leading cloud communications platform that powers our customers' and partners' global engagement solutions using our APIs, Unified Communications, and Contact Center innovations. We believe that the Vonage Communications Platform's products and services are well positioned to take advantage of emerging trends with sizable, growing total addressable markets as companies look to cloud-based communications solutions and API programming architectures as part of their digital transformation.
Our business is organized under two reportable operating segments: Vonage Communications Platform and Consumer. The Vonage Communications Platform includes our Unified Communications, Contact Center Communications, and APIs service offerings and represents the Company’s strategic business as the source of future growth. Our Consumer segment includes our communications solutions for residential customers based on our roots in providing VoIP communication services.
Vonage Communications Platform
Our strategic business is the Vonage Communications Platform which delivers a single leading cloud communications platform that powers our customers' and partners' global engagement solutions using our APIs, Unified Communications, and Contact Center innovations. The Vonage Communications Platform brings unique value to businesses by providing multiple communications channels - including video, voice, messaging, email, verification, and artificial intelligence - that integrate into the applications, products and workflows that our customers are already using. We believe this delivers both the power and the flexibility to our customers to address the growing need to transform their communications, connections and experiences for customers and enables the type of business continuity, remote work, and remote delivery of services that are now essential for team members.
Consumer
For our Consumer customers, we enable users to access and utilize our services and features, via their existing internet connections, including over 3G/4G, LTE, Cable, or DSL broadband networks. This technology enables us to offer our Consumer customers attractively priced voice and messaging services and other features around the world on a variety of devices. Our Consumer strategy is focused on the continued penetration of our core North American markets, which provide value in international long distance and target under-served segments.
Services Outside of the United States
We have operations in the United States, United Kingdom, Canada, Israel, Hong Kong, and Singapore, and provide a wide range of communications solutions to our customers located in many countries around the world.
Impact of COVID-19Russia and Ukraine Invasion
A novel strainIn February 2022, the Russian Federation commenced a military action with the country of coronavirus, or COVID-19, was first identified in China in December 2019 and subsequently declaredUkraine. As a pandemic on March 11, 2020, by the World Health Organization. To date, COVID-19 has impacted nearly all regions around the world and resulted in travel restrictions and business slowdowns worldwide. The full impactresult of the pandemic on our business, operations and financial results has and will depend onthis action, various factors that continue to evolve, which we may not accurately predict. In response to the COVID-19 pandemic, governments across the world have enacted measures aimed at containing the spread of the virus, including ordering the closure of all businesses not deemed "essential," restricting residents to their homes, and the practice of social distancing when engaging in authorized activities. While some of these restrictions have been lifted on a global scale, many regions,nations, including the United States, where Vonage is headquartered,have instituted economic sanctions against the Russian Federation and Belarus. Further, the impact of this action and related sanctions on the world economy are experiencing a resurgence of COVID-19. As a resultnot fully determinable as of the date of these financial statements and the specific impact on the Company’s financial condition, results of operations, and cash flows may be material depending on the duration and degree of the invasion.
Impact of COVID-19
The ongoing COVID-19 pandemic, alltypical business travel has beenremains at reduced levels to protect the health of our employees and to comply with local guidelines, and we have also continued modified the usage of Vonage offices worldwide to comply with social distancing (including our corporate headquarters), bothall of which disrupt how we typically operate our business.
COVID-19 has impacted some of our customers more than others, including customers in the travel, hospitality, retail, and other industries where physical interaction is critical. We have experienced and expect that we will continue to experience slowdowns in bookings and customer payments, customer churn and reduced usage, and issuance of customer credits to distressed customers served by certain product lines in the Vonage Communications Platform. In addition, COVID-19 may have impacts on many additional aspects of our operations, directly and indirectly, including with respect to its impacts on customer behaviors, our business and our employees, and the market generally, and the scope and nature of these impacts continue to evolve each day.
Recent Significant Events
On November 22, 2021, the Company, Telefonaktiebolaget LM Ericsson (publ) ("Ericsson"), and Ericsson Muon Holding Inc., entered into an Agreement and Plan of Merger (the "Merger Agreement") providing for the acquisition of the Company by Ericsson for approximately $6.2 billion in cash. The proposed transaction received the required approval of the Company's stockholders on February 9, 2022 and is expected to be consummated during the first half of 2022 following the satisfaction of certain other customary conditions.
During the year December 31, 2021, the Company entered into a new lease agreement to relocate its corporate headquarters to a new leased facility located in Holmdel, New Jersey. As a result, the Company incurred a charge associated with the abandonment of its former corporate headquarters during the first quarter of 2022.
Trends in Our Industry
A number of trends in our industry have a significant effect on our results of operations and are important to an understanding of our financial statements.
Competitive landscape. The business cloud communications markets and consumer services market in which we participate are highly competitive. We face competition from a broad set of companies, including (i) SaaS companies, CCaaS companies, other alternative communication providers, other providers of cloud communication services and (ii) traditional telephone, wireless service providers, cable companies, and alternative communications providers with consumer offerings. As the cloud communications market evolves, and the convergence of voice, video, messaging, mobility and data networking technologies accelerates, we may face competition in the future from companies that do not currently compete in the market, including companies that currently compete in other sectors, companies that serve consumers rather than business customers, or companies which expand their market presence to include cloud communications. Moreover, as businesses and educational institutions are quickly pivoting to cloud-based communications in light the increased need for remote work and remote learning due to the COVID-19 pandemic, we are experiencing intense competition from our existing competitors, and also emerging competitors, seeking to capitalize on the growing needs for businesses and educators to transform their operations.
Regulation. Our business has developed in a relatively lightly regulated environment. See the discussion under "Regulation" in Note 9 to our condensed consolidated financial statements for a discussion of regulatory issues that impact us.
Key Operating Data
The table below includes key operating data that our management uses to measure the growth and operating performance of the Vonage Communications Platform segment:
| Vonage Communications Platform | Vonage Communications Platform | | Three Months Ended | | Vonage Communications Platform | | Three Months Ended | |
| | March 31, | | | March 31, | |
| | | | 2021 | | 2020 | | | | 2022 | | 2021 | |
| Service revenue per customer | Service revenue per customer | | $ | 582 | | | $ | 475 | | | Service revenue per customer | | $ | 677 | | | $ | 582 | | |
| Vonage Communications Platform service revenue churn | Vonage Communications Platform service revenue churn | | 0.5 | % | | 0.8 | % | | Vonage Communications Platform service revenue churn | | 0.6 | % | | 0.5 | % | |
Service Revenue per Customer. Service revenues per customer for a particular period is calculated by dividing the average monthly service revenues for the period by the average number of customers over the number of months in the period. The average number of customers is the number of customers on the first day of the period, plus the number of customers on the last day of the period, divided by two. Service revenues excludes revenues from trading and auction customers. Service revenue per customer increased from $475 for the three months ended March 31, 2020 to $582 for the three months ended March 31, 2021 to $677 for the three months ended March 31, 2022 primarily driven by the Company's successful efforts to attract larger VCP customers, and to expand services provided to our existing VCP customers.customers, and to growth in our API SMS services.
Vonage Communications Platform Service Revenue Churn. Vonage Communications Platform service revenue churn is calculated by dividing the service revenue from customers or customer locations that have been confirmed to be foregone during a period by the simple average of the total service revenue from all customers in that period. Service revenue for purposes of determining VCP revenue churn is service revenue excluding revenue from our trading and auction customers, and usage in excess of a customer’s contracted service plan, regulatory fees charged to customers, and credits. The simple average of total service revenue from all customers during the period is the total service revenue as defined herein on the first day of the period, plus the total service revenue as defined herein on the last day of the period, divided by two. Terminations, as used in the calculation of churn statistics, do not include customers terminated during the period if termination occurred within the first month after activation. Other companies may calculate service revenue churn differently, and their service revenue churn data may not be directly comparable to ours. Vonage Communications Platform revenue churn decreasedincreased from 0.8% for the three months ended March 31, 2020 to 0.5% for the three months ended March 31, 2021.2021 to 0.6% for the three months ended March 31, 2022. Our service revenue churn may fluctuate over time due to economic conditions, seasonality in certain customer's operations, loss of customers who are acquired, and competitive pressures including promotional pricing. We are continuing to invest in our overall quality of service which includes customer care headcount and systems, billing systems, on-boarding processes and self-service options to ensure we scale our processes to our growth and continue to improve the overall customer experience.
The table below includes key operating data that our management uses to measure the growth and operating performance of the Consumer segment:
| | Consumer | Consumer | | Three Months Ended | | Consumer | | Three Months Ended | |
| | March 31, | | | March 31, | |
| | | | 2021 | | 2020 | | | | 2022 | | 2021 | |
| Average monthly revenues per subscriber line | Average monthly revenues per subscriber line | | $ | 29.05 | | | $ | 27.35 | | | Average monthly revenues per subscriber line | | $ | 27.23 | | | $ | 29.05 | | |
| Subscriber lines (at period end) | Subscriber lines (at period end) | | 867,243 | | | 1,037,794 | | | Subscriber lines (at period end) | | 749,108 | | | 867,243 | | |
| Customer churn | Customer churn | | 1.9 | % | | 1.8 | % | | Customer churn | | 1.6 | % | | 1.9 | % | |
Average Monthly Revenues per Subscriber Line. Average monthly revenues per subscriber line for a particular period is calculated by dividing our revenues for that period by the simple average number of subscriber lines for the period, and dividing the result by the number of months in the period. The simple average number of subscriber lines for the period is the number of subscriber lines on the first day of the period, plus the number of subscriber lines on the last day of the period, divided by two. Our average monthly revenues per subscriber line increaseddecreased from $27.35 for the three months ended March 31, 2020 to $29.05 for the three months ended March 31, 2021 to $27.23 for the three months ended March 31, 2022 due primarily to the Company's abilitylower USF revenue period over period due to retain its more tenured customers.declining rates.
Subscriber Lines. Our subscriber lines include, as of a particular date, all paid subscriber lines from which a customer can make an outbound telephone call on that date. Our subscriber lines include fax lines, including fax lines bundled with subscriber lines in our small office home office calling plans and soft phones, but do not include our virtual phone numbers and toll free numbers, which only allow inbound telephone calls to customers. Subscriber lines decreased from 1,037,794 as of March 31, 2020 to 867,243 as of March 31, 2021 to 749,108 as of March 31, 2022, reflecting planned actions to enhancemanage the profitability of the assisted sales channel by eliminating lower performing locations and restructuring the pricing offers, and to shift investment to our business market.decline in customer base.
Customer Churn. Customer churn is calculated by dividing the number of customers that have terminated during a period by the simple average of number of customers in a given period. The simple average number of customers during the period is the number of customers on the first day of the period, plus the number of customers on the last day of the period, divided by two. Terminations, as used in the calculation of churn statistics, do not include customers terminated during the period if termination occurred within the first month after activation. Other companies may calculate customer churn differently, and their customer churn data may not be directly comparable to ours. Customer churn increaseddecreased to 1.6% for the three months ended March 31, 2022 from 1.9% for the three months ended March 31, 2021, from 1.8% for the three months ended March 31, 2020, respectively. We maximize customer value by focusing marketing spend on higher return channels and away from assisted selling channels which had higher early life churn. We monitor customer churn on a daily basis and use it as an indicator of the level of customer satisfaction. Customers who have been with us for a year or more tend to have a lower churn rate than customers who have not. In addition, our customers who are international callers generally churn at a lower rate than customers who are domestic callers. Our customer churn will fluctuate over time due to economic conditions, competitive pressures including promotional pricing targeting international long distance callers, marketplace perception of our services, and our ability to provide high quality customer care and network quality and add future innovative products and services. See the discussion above for detail regarding churn impacting our business customers.
REVENUE
Revenues consist of services revenue and customer equipment and shipping fee revenue. Substantially all of our revenues are services revenue. For Consumer customers in the United States, we offer domestic and international rate plans, including a variety of residential plans and mobile plans. For our VCP customers, we offer micro, SMB, mid-market, and enterprise customers several service plans with different pricing structures and contractual requirements ranging in duration from month-to-month to three years. In addition, we provide managed equipment to VCP customers for which the customers pay a monthly fee. Customers also have the opportunity to purchase premium features for additional fees. In addition, we derive revenue from usage-based fees earned from customers using our cloud-based software products. These usage-based software products include our messaging, voice, Verify and chat APIs. Usage-based fees include number of text messages sent or received using our messaging APIs, minutes of call duration activity for our voice APIs, and number of converted authentications for our Verify API. Services revenue is offset by the cost of certain customer acquisition activities, such as rebates and promotions. In addition, in certain instances, we charge disconnect fees which are recognized as revenue at the time the disconnect fees are collected from our customer.
In the United States, we charge regulatory, compliance and intellectual property, and E-911 recovery fees on a monthly basis to defray costs, and to cover taxes that we are charged by the suppliers of telecommunications services. In addition, we recognize revenue on a gross basis for contributions to the USF and related fees. All other taxes are recorded on a net basis.
Revenues are generated from sales of customer equipment directly to customers for replacement devices, or for upgrading their device at the time of customer sign-up for which we charge an additional fee. In addition, customer equipment and shipping revenues include revenues from the sale of VoIP telephones in order to access our small and medium business services. Customer equipment and shipping revenues also include the fees that customers are charged for shipping their customer equipment to them.
OPERATING EXPENSES
Operating expenses consist of cost of revenues, sales and marketing expense, engineering and development expense, general and administrative expense, and depreciation and amortization.
Results of Operations
The following table sets forth our condensed consolidated statements of operations for the periods indicated:
| | | | | Three Months Ended | | | | Three Months Ended | |
| | March 31, | | | March 31, | |
| | | | 2021 | | 2020 | | | | 2022 | | 2021 | |
| | Total revenues | Total revenues | | $ | 332,900 | | | $ | 297,457 | | | Total revenues | | $ | 358,828 | | | $ | 332,900 | | |
| | Operating Expenses: | Operating Expenses: | | | Operating Expenses: | | |
| Cost of revenues (exclusive of depreciation and amortization) | Cost of revenues (exclusive of depreciation and amortization) | | 156,787 | | | 127,418 | | | Cost of revenues (exclusive of depreciation and amortization) | | 182,385 | | | 156,787 | | |
| Sales and marketing | Sales and marketing | | 81,474 | | | 85,621 | | | Sales and marketing | | 78,878 | | | 81,474 | | |
| Engineering and development | Engineering and development | | 20,360 | | | 19,203 | | | Engineering and development | | 20,760 | | | 20,360 | | |
| General and administrative | General and administrative | | 44,933 | | | 40,882 | | | General and administrative | | 70,456 | | | 44,933 | | |
| Depreciation and amortization | Depreciation and amortization | | 20,417 | | | 20,485 | | | Depreciation and amortization | | 25,195 | | | 20,417 | | |
| Total operating expenses | Total operating expenses | | 323,971 | | | 293,609 | | | Total operating expenses | | 377,674 | | | 323,971 | | |
| Income from operations | | 8,929 | | | 3,848 | | | |
| (Loss) Income from operations | | (Loss) Income from operations | | (18,846) | | | 8,929 | | |
| Other Income (Expense): | Other Income (Expense): | | | Other Income (Expense): | | |
| Interest expense | Interest expense | | (7,298) | | | (8,082) | | | Interest expense | | (3,653) | | | (7,298) | | |
| Other income (expense), net | Other income (expense), net | | 174 | | | 229 | | | Other income (expense), net | | 511 | | | 174 | | |
| Total other income (expense), net | | (7,124) | | | (7,853) | | | |
| Income (Loss) before income tax benefit | | 1,805 | | | (4,005) | | | |
| Income tax (expense) benefit | | (2,181) | | | 250 | | | |
| Total other expense, net | | Total other expense, net | | (3,142) | | | (7,124) | | |
| (Loss) Income before income tax | | (Loss) Income before income tax | | (21,988) | | | 1,805 | | |
| Income tax benefit (expense) | | Income tax benefit (expense) | | 4,866 | | | (2,181) | | |
| Net loss | Net loss | | $ | (376) | | | $ | (3,755) | | | Net loss | | $ | (17,122) | | | $ | (376) | | |
Management's Discussion of the Results of Operations for the Three Months Ended March 31, 20212022 and 20202021
The Company reported loss before income taxes of $21,988 and income before income taxes of $1,805 for the three months ended March 31, 20212022 and loss from income taxes of $4,005 for the three months ended March 31, 2020, respectively. The income before income taxes for the three months ended March 31, 2021, was primarily due to higher gross margin of $6,074 driven by increased sales within the VCP platform primarily associated with API service offerings. This was slightly offset by higher operating expenses of $993.
The Company reported net loss of $376 and $3,755 for the three months ended March 31, 2021 and March 31, 2020, respectively. The decrease in net loss for the three months ended March 31, 2021 compared to the three months ended March 31, 2020 was due to the income before income taxes for the three months ended March 31, 2021 and loss before income taxes for the three months ended March 31, 20202022 was primarily due higher operating expenses of $28,105 due to increased general and administrative expenses resulting from consulting fees associated with the pending Ericsson acquisition, facility exits costs associated with lease abandonment, and higher stock based compensation.
The Company reported net loss of $17,122 and $376 for the three months ended March 31, 2022 and March 31, 2021, respectively. The increase in net loss for the three months ended March 31, 2022 compared to the three months ended March 31, 2021 was due to the loss before income taxes for the three months ended March 31, 2022 and income before income taxes for the three and three months ended March 31, 2021 as discussed above. While the Company reported anloss before income tax for the three months ended March 31, 2022 and income before income tax for the three months ended March 31, 2021, the Company recognized aan income tax benefit of $4,866 during the three ended March 31, 2022 and an income tax expense of $2,181 as compared to tax benefit of $250 during the prior year quarter. The tax expense during the three months ended March 31, 20212021. The income tax benefit during the three months ended March 31, 2022 was driven by a benefit related to equity compensation which was slightly offset by an increase in permanent items related to limitations on executive compensation and the inclusion oflimitation on foreign income in the U.S. due to foreign disregarded entities.nondeductible losses.
Segment Adjusted EBITDA
The following graphs illustrate the composition of our Adjusted EBITDA with respect to each of our reportable segments for the three months ended March 31, 20212022 and March 31, 2020.2021.
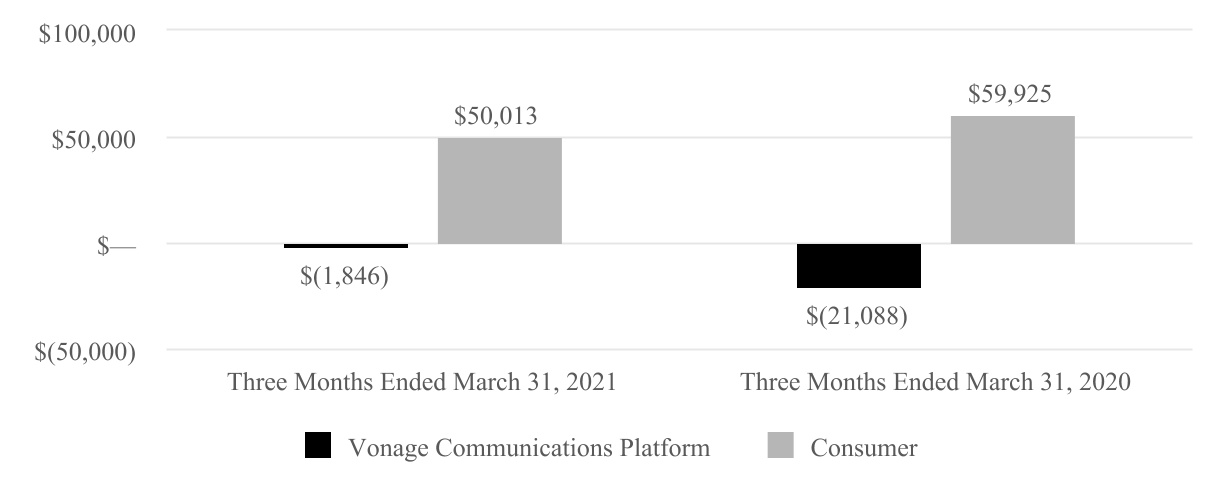
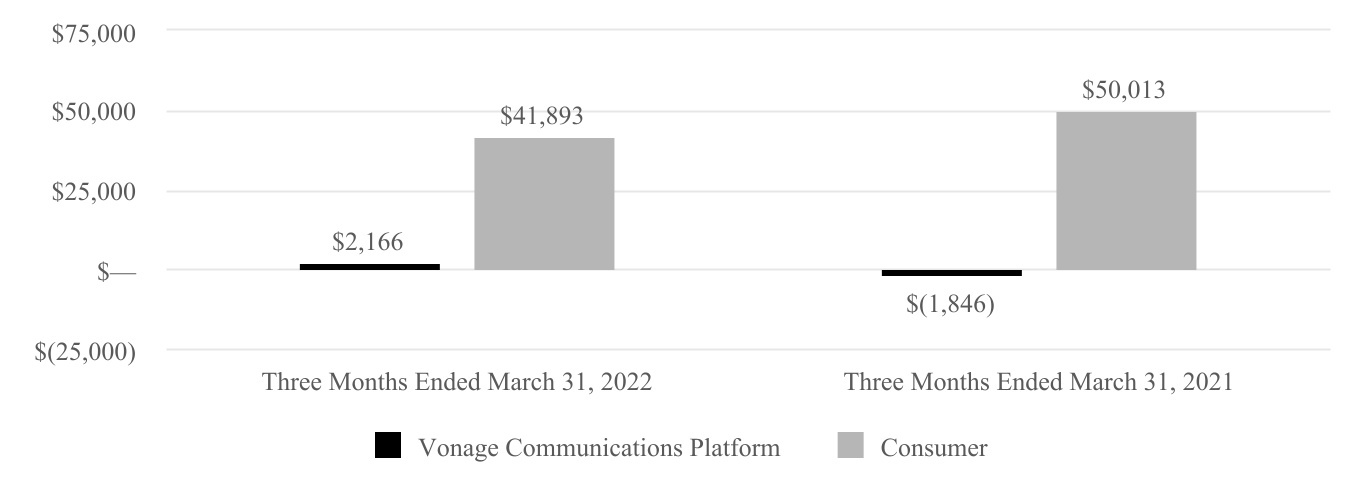
The Adjusted EBITDA for Vonage Communications Platform has improved from loss of $21,088 for the three months ended March 31, 2020 to loss of $1,846 for the three months ended March 31, 2021 to income of $2,166 for the three months ended March 31, 2022, respectively. This improvement in Vonage Communications Platform Adjusted EBITDA is primarily due to an increase in Vonage Communications Platform gross margin dollars of $17,579$9,636 for the three months ended March 31, 2022, as the Company experience growth in API services as compared to the prior year.year quarter. Adjusted EBITDA for Vonage Communications Platform was also positively impacted in the current quarterthree months ended March 31, 2022 due to the realization of cost saving initiatives executedthat were implemented towards the end of 2020 mainly driven by reductions in the second half of 2020.headcount related costs. The decline year over year of Consumer Adjusted EBITDA for Consumerthe three months ended March 31, 2022 as compared to the three months ended March 31, 2021 is primarily driven by the decrease in subscriber lines year over year as further described below.
Consolidated Gross Margin for the three months endedThree Months Ended March 31, 20212022 and March 31, 20202021
We calculate gross margin as total revenues less cost of revenues, which primarily consists of fees that we pay to third parties on an ongoing basis in order to provide our services and costs incurred when a customer first subscribes to our service. The following table presents consolidated revenues, cost of revenues and the composition of gross margin for the three months ended March 31, 20212022 and 2020:March 31, 2021:
| | (in thousands, except percentages) | (in thousands, except percentages) | | Three Months Ended | | (in thousands, except percentages) | | Three Months Ended | |
| | March 31, | | | March 31, | |
| | | | 2021 | | 2020 | | Dollar
Change | | Percent
Change | | | | 2022 | | 2021 | | Dollar
Change | | Percent
Change | |
| Service, access and product revenues | Service, access and product revenues | | $ | 314,793 | | | $ | 283,077 | | | $ | 31,716 | | | 11 | % | | Service, access and product revenues | | $ | 344,852 | | | $ | 314,793 | | | $ | 30,059 | | | 10 | % | |
| USF revenues | USF revenues | | 18,107 | | | 14,380 | | | 3,727 | | | 26 | % | | USF revenues | | 13,976 | | | 18,107 | | | (4,131) | | | (23) | % | |
| Total revenues | Total revenues | | 332,900 | | | 297,457 | | | 35,443 | | | 12 | % | | Total revenues | | 358,828 | | | 332,900 | | | 25,928 | | | 8 | % | |
| | Service, access and product cost of revenues | Service, access and product cost of revenues | | 138,680 | | | 113,038 | | | 25,642 | | | 23 | % | | Service, access and product cost of revenues | | 168,409 | | | 138,680 | | | 29,729 | | | 21 | % | |
| USF cost of revenues | USF cost of revenues | | 18,107 | | | 14,380 | | | 3,727 | | | 26 | % | | USF cost of revenues | | 13,976 | | | 18,107 | | | (4,131) | | | (23) | % | |
Total cost of revenues (1) | Total cost of revenues (1) | | 156,787 | | | 127,418 | | | 29,369 | | | 23 | % | | Total cost of revenues (1) | | 182,385 | | | 156,787 | | | 25,598 | | | 16 | % | |
| Gross margin | Gross margin | | $ | 176,113 | | | $ | 170,039 | | | $ | 6,074 | | | 4 | % | | Gross margin | | $ | 176,443 | | | $ | 176,113 | | | $ | 330 | | | — | % | |
(1) Excludes depreciation and amortization of $13,647$17,679 and $9,609$13,647 for the three months ended March 31, 2022 and 2021, and 2020, respectively.
Total revenues and cost of revenues were impacted by the following trends and uncertainties:
Three Months Ended March 31, 2021 compared2022 Compared to Three Months Ended March 31, 20202021
Total revenues increased 12%8% for the three months ended March 31, 20212022 as compared to the prior year period. The increase was primarily due to the VCP customer growth driving an increase in revenues of $45,201$40,956 as a result of increased usage onof the Company's API Platform in the current year. Due to the increase in the USF rate, USF revenues increased as well.year quarter. The increase in total revenues was partially offset by declining Consumer revenues of $9,758$15,028 in connection with the continued decline of Consumer subscriber lines. The Company continues to expect that the Consumer portion of the Company's overall business will become less significant. The Company will focus its resources in an effort to increase market share in its VCP communications platforms.
Total cost of revenues increased 23%16% for the three months ended March 31, 20212022 as compared to the prior year period driven by increased costs incurred in servicing our VCP customers of $27,622$31,320 due to the increase28% growth in customers and higher volume of API usage. There was also anservices. The increase in costs was partially offset by the cost decrease in Consumer of $1,747$5,722 mainly due to the increase in USF costs offset by the decline indeclining subscriber lines resulting in lower international and long-distance termination costs and USF costs.
Vonage Communications Platform Gross Margin for the Three Months Ended March 31, 20212022 and 20202021
| | | Three Months Ended | | | Three Months Ended | |
| | March 31, | | | March 31, | |
| (in thousands, except percentages) | (in thousands, except percentages) | | 2021 | | 2020 | | Dollar
Change | | Percent
Change | | (in thousands, except percentages) | | 2022 | | 2021 | | Dollar
Change | | Percent
Change | |
| Revenues | Revenues | | | | | | | | | | Revenues | | | | | | | | | |
| Service revenues | Service revenues | | $ | 240,442 | | | $ | 195,649 | | | $ | 44,793 | | | 23 | % | | Service revenues | | $ | 284,198 | | | $ | 240,442 | | | $ | 43,756 | | | 18 | % | |
Access and product revenues(1) | Access and product revenues(1) | | 8,598 | | | 10,122 | | | (1,524) | | | (15) | % | | Access and product revenues(1) | | 5,464 | | | 8,598 | | | (3,134) | | | (36) | % | |
| Service, access and product revenues excluding USF | Service, access and product revenues excluding USF | | 249,040 | | | 205,771 | | | 43,269 | | | 21 | % | | Service, access and product revenues excluding USF | | 289,662 | | | 249,040 | | | 40,622 | | | 16 | % | |
| USF revenues | USF revenues | | 6,414 | | | 4,482 | | | 1,932 | | | 43 | % | | USF revenues | | 6,748 | | | 6,414 | | | 334 | | | 5 | % | |
| Total revenues | Total revenues | | 255,454 | | | 210,253 | | | 45,201 | | | 21 | % | | Total revenues | | 296,410 | | | 255,454 | | | 40,956 | | | 16 | % | |
| | Cost of revenues | Cost of revenues | | | Cost of revenues | | |
Service cost of revenues (2) | Service cost of revenues (2) | | 120,017 | | | 92,357 | | | 27,660 | | | 30 | % | | Service cost of revenues (2) | | 150,427 | | | 120,017 | | | 30,410 | | | 25 | % | |
Access and product cost of revenues (1) | Access and product cost of revenues (1) | | 9,626 | | | 11,596 | | | (1,970) | | | (17) | % | | Access and product cost of revenues (1) | | 10,202 | | | 9,626 | | | 576 | | | 6 | % | |
| Service, access and product cost of revenues excluding USF | Service, access and product cost of revenues excluding USF | | 129,643 | | | 103,953 | | | 25,690 | | | 25 | % | | Service, access and product cost of revenues excluding USF | | 160,629 | | | 129,643 | | | 30,986 | | | 24 | % | |
| USF cost of revenues | USF cost of revenues | | 6,414 | | | 4,482 | | | 1,932 | | | 43 | % | | USF cost of revenues | | 6,748 | | | 6,414 | | | 334 | | | 5 | % | |
| Total cost of revenues | Total cost of revenues | | 136,057 | | | 108,435 | | | 27,622 | | | 25 | % | | Total cost of revenues | | 167,377 | | | 136,057 | | | 31,320 | | | 23 | % | |
| | Segment gross margin | Segment gross margin | | | Segment gross margin | | |
| Service margin | Service margin | | 120,425 | | | 103,292 | | | 17,133 | | | 17 | % | | Service margin | | 133,771 | | | 120,425 | | | 13,346 | | | 11 | % | |
| Gross margin excluding USF (Service, access and product margin) | Gross margin excluding USF (Service, access and product margin) | | 119,397 | | | 101,818 | | | 17,579 | | | 17 | % | | Gross margin excluding USF (Service, access and product margin) | | 129,033 | | | 119,397 | | | 9,636 | | | 8 | % | |
| Segment gross margin | Segment gross margin | | $ | 119,397 | | | $ | 101,818 | | | $ | 17,579 | | | 17 | % | | Segment gross margin | | $ | 129,033 | | | $ | 119,397 | | | $ | 9,636 | | | 8 | % | |
| | Segment gross Margin % | Segment gross Margin % | | | Segment gross Margin % | | |
| Service margin % | Service margin % | | 50.1 | % | | 52.8 | % | | | Service margin % | | 47.1 | % | | 50.1 | % | | |
| Gross margin excluding USF (Service, access and product margin) % | Gross margin excluding USF (Service, access and product margin) % | | 47.9 | % | | 49.5 | % | | | Gross margin excluding USF (Service, access and product margin) % | | 44.5 | % | | 47.9 | % | | |
| Segment gross margin % | Segment gross margin % | | 46.7 | % | | 48.4 | % | | | Segment gross margin % | | 43.5 | % | | 46.7 | % | | |
(1) Includes customer premise equipment, access, and shipping and handling.
(2) Excludes depreciation and amortization of $13,310$17,538 and $8,519$13,310 for the three months ended March 31, 2022 and 2021, and 2020, respectively.
Three Months Ended March 31, 20212022 compared to Three Months Ended March 31, 20202021
The following table describes the increase in VCP gross margin dollars for the three months ended March 31, 20212022 as compared to the three months ended March 31, 20202021:
| | | | | |
| (in thousands) |
Service gross margin increase is primarily due to increased usage of the Company's API services primarily related to SMS services in APAC | $ | 17,13313,346 | |
Access and product gross margin increaseddecreased due to lowerhigher costs providing access services to VCP customers during the current quarter | 446 (3,710) | |
| |
| Increase in segment gross margin | $ | 17,5799,636 | |
Vonage Communications Platform service gross margin percentage decreased to 47.1% for the three months ended March 31, 2022 from 50.1% for the three months ended March 31, 2021 from 52.8% for the three months ended March 31, 2020.2021. The decrease in businessVCP service gross margin percentage is a result of greater proportion of lower margin services across our VCP segment, particularly SMS, during the quarter ended March 31, 20212022 as compared to the same period in the prior quarter as revenuesyear quarter. Revenues from API services hashave grown to 50%57% of VCP revenues for the three months ended March 31, 20212022 from 41%53% of VCP revenues during the prior year quarter.quarter, driven by growth in part of API products, particularly SMS, as the Company continues to strategically pursue new opportunities to drive product adoption across the VCP platform. Our gross margin percentage may continue to be impacted by changes in the mix of service offerings provided to our customers across our VCP segment.
Consumer Gross Margin for the Three Months Ended March 31, 20212022 and 20202021
| | | Three Months Ended | | | Three Months Ended | |
| | March 31, | | | March 31, | |
| (in thousands, except percentages) | (in thousands, except percentages) | | 2021 | | 2020 | | Dollar
Change | | Percent
Change | | (in thousands, except percentages) | | 2022 | | 2021 | | Dollar
Change | | Percent
Change | |
| Revenues | Revenues | | | | | | | | | | Revenues | | | | | | | | | |
| Service revenues | Service revenues | | $ | 65,697 | | | $ | 77,243 | | | $ | (11,546) | | | (15) | % | | Service revenues | | $ | 55,132 | | | $ | 65,697 | | | $ | (10,565) | | | (16) | % | |
Access and product revenues(1) | Access and product revenues(1) | | 56 | | | 63 | | | (7) | | | (11) | % | | Access and product revenues(1) | | 58 | | | 56 | | | 2 | | | 4 | % | |
| Service, access and product revenues excluding USF | Service, access and product revenues excluding USF | | 65,753 | | | 77,306 | | | (11,553) | | | (15) | % | | Service, access and product revenues excluding USF | | 55,190 | | | 65,753 | | | (10,563) | | | (16) | % | |
| USF revenues | USF revenues | | 11,693 | | | 9,898 | | | 1,795 | | | 18 | % | | USF revenues | | 7,228 | | | 11,693 | | | (4,465) | | | (38) | % | |
| Total revenues | Total revenues | | 77,446 | | | 87,204 | | | (9,758) | | | (11) | % | | Total revenues | | 62,418 | | | 77,446 | | | (15,028) | | | (19) | % | |
| | Cost of revenues | Cost of revenues | | | Cost of revenues | | |
Service cost of revenues (2) | Service cost of revenues (2) | | 8,513 | | | 8,512 | | | 1 | | | — | % | | Service cost of revenues (2) | | 7,228 | | | 8,513 | | | (1,285) | | | (15) | % | |
Access and product cost of revenues (1) | Access and product cost of revenues (1) | | 524 | | | 573 | | | (49) | | | (9) | % | | Access and product cost of revenues (1) | | 552 | | | 524 | | | 28 | | | 5 | % | |
| Service, access and product cost of revenues excluding USF | Service, access and product cost of revenues excluding USF | | 9,037 | | | 9,085 | | | (48) | | | (1) | % | | Service, access and product cost of revenues excluding USF | | 7,780 | | | 9,037 | | | (1,257) | | | (14) | % | |
| USF cost of revenues | USF cost of revenues | | 11,693 | | | 9,898 | | | 1,795 | | | 18 | % | | USF cost of revenues | | 7,228 | | | 11,693 | | | (4,465) | | | (38) | % | |
| Total cost of revenues | Total cost of revenues | | 20,730 | | | 18,983 | | | 1,747 | | | 9 | % | | Total cost of revenues | | 15,008 | | | 20,730 | | | (5,722) | | | (28) | % | |
| | Segment gross margin | Segment gross margin | | | Segment gross margin | | |
| Service margin | Service margin | | 57,184 | | | 68,731 | | | (11,547) | | | (17) | % | | Service margin | | 47,904 | | | 57,184 | | | (9,280) | | | (16) | % | |
| Gross margin excluding USF (Service, access and product margin) | Gross margin excluding USF (Service, access and product margin) | | 56,716 | | | 68,221 | | | (11,505) | | | (17) | % | | Gross margin excluding USF (Service, access and product margin) | | 47,410 | | | 56,716 | | | (9,306) | | | (16) | % | |
| Segment gross margin | Segment gross margin | | $ | 56,716 | | | $ | 68,221 | | | $ | (11,505) | | | (17) | % | | Segment gross margin | | $ | 47,410 | | | $ | 56,716 | | | $ | (9,306) | | | (16) | % | |
| | Segment gross Margin % | Segment gross Margin % | | | Segment gross Margin % | | |
| Service margin % | Service margin % | 87.0 | % | | 89.0 | % | | | Service margin % | 86.9 | % | | 87.0 | % | | |
| Gross margin excluding USF (Service, access and product margin) % | Gross margin excluding USF (Service, access and product margin) % | 86.3 | % | | 88.2 | % | | | Gross margin excluding USF (Service, access and product margin) % | 85.9 | % | | 86.3 | % | | |
| Segment gross margin % | Segment gross margin % | 73.2 | % | | 78.2 | % | | | Segment gross margin % | 76.0 | % | | 73.2 | % | | |
(1) Includes customer premise equipment and shipping and handling.
(2) Excludes depreciation and amortization of $337$141 and $1,090$337 for the three months ended March 31, 20212022 and 2020,2021, respectively.
Three Months Ended March 31, 2021 compared2022 Compared to Three Months Ended March 31, 20202021
The following table describes the decrease in consumer gross margin dollars for the three months ended March 31, 20212022 as compared to the three months ended March 31, 20202021:
| | | | | |
| (in thousands) |
Service gross margin decreased primarily due to a decrease in the number of subscriber lines of 16%by 14% resulting in lower gross margin of $11,455 which has been declining over recent years as the Company has focused on the growth of the Vonage Communications Platform$8,865 | $ | (11,547)(9,280) | |
Access and product gross margin increased 8%decreased 6% primarily due to lower equipment costs associated withdeclines in sales to customers during the current quarter | 42 (26) | |
| |
| Decrease in segment gross margin | $ | (11,505)(9,306) | |
Consumer service gross margin percentage decreased slightly to 86.9% for the three months ended March 31, 2022 from 87.0% for the three months ended March 31, 2021 from 89.0% for the three months ended March 31, 2020 due to slightly higher international and domestic termination rates.
Other Operating Expenses
The following table presents our other operating costs during the three months ended March 31, 20212022 and 2020,2021, respectively:
| | | Three Months Ended | | | Three Months Ended | |
| | March 31, | | | March 31, | |
| (in thousands, except percentages) | (in thousands, except percentages) | | 2021 | | 2020 | | Dollar
Change | | Percent
Change | | (in thousands, except percentages) | | 2022 | | 2021 | | Dollar
Change | | Percent
Change | |
| Sales and marketing | Sales and marketing | | $ | 81,474 | | | $ | 85,621 | | | $ | (4,147) | | | (5) | % | | Sales and marketing | | $ | 78,878 | | | $ | 81,474 | | | $ | (2,596) | | | (3) | % | |
| Engineering and development | Engineering and development | | 20,360 | | | 19,203 | | | 1,157 | | | 6 | % | | Engineering and development | | 20,760 | | | 20,360 | | | 400 | | | 2 | % | |
| General and administrative | General and administrative | | 44,933 | | | 40,882 | | | 4,051 | | | 10 | % | | General and administrative | | 70,456 | | | 44,933 | | | 25,523 | | | 57 | % | |
| Depreciation and amortization | Depreciation and amortization | | 20,417 | | | 20,485 | | | (68) | | | — | % | | Depreciation and amortization | | 25,195 | | | 20,417 | | | 4,778 | | | 23 | % | |
| Total other operating expenses | Total other operating expenses | | $ | 167,184 | | | $ | 166,191 | | | $ | 993 | | | 1 | % | | Total other operating expenses | | $ | 195,289 | | | $ | 167,184 | | | $ | 28,105 | | | 17 | % | |
Three Months Ended March 31, 2021 compared2022 Compared to Three Months Ended March 31, 20202021
Total other operating expenses increased by $993$28,105 as compared to the three months ended March 31, 20202021 due to the following:
•Sales and marketing expense decreased by $4,147,3%, primarily due to continued reduced travel through the realization of cost savings related to initiatives executed during the second half of the prior yearongoing COVID-19 pandemic along with lower travel related costsreduction in the current year as travel continues to be limited due to the ongoing pandemic.
•Engineering and development expense increased by $1,157, in connection with the Company's increased employee related costs as there is continued focus on innovation and developing further functionality related to its proprietary platform in order to support customers through the mid-market and enterprise sector.costs.
•General and administrative expense increased by $4,051,$25,523, primarily due to consulting fees associated with the pending acquisition by Ericsson, costs associated with the exit of certain facilities and higher stock based compensation expense.
•Depreciation and amortization expense with restructuring activities, an increase in stock compensation expenseincreased by $4,778, due to employees and a $2 million donation to the Company's foundation in the current year. This was slightly offset by decreased employee costs asamortization of capitalized software for which the Company has begun to realize cost savings associated with the initiatives executed uponincreased its investment in the prior year.over recent periods.
Other Income (Expense)
| | (in thousands, except percentages) | (in thousands, except percentages) | | Three Months Ended | | (in thousands, except percentages) | | Three Months Ended | |
| | March 31, | | | March 31, | |
| | | | 2021 | | 2020 | | Dollar
Change | | Percent
Change | | | | 2022 | | 2021 | | Dollar
Change | | Percent
Change | |
| Interest expense | Interest expense | | $ | (7,298) | | | $ | (8,082) | | | $ | 784 | | | 10 | % | | Interest expense | | $ | (3,653) | | | $ | (7,298) | | | $ | 3,645 | | | 50 | % | |
| Other income (expense), net | Other income (expense), net | | 174 | | | 229 | | | (55) | | | (24) | % | | Other income (expense), net | | 511 | | | 174 | | | 337 | | | 194 | % | |
| | $ | (7,124) | | | $ | (7,853) | | | $ | 729 | | | | | $ | (3,142) | | | $ | (7,124) | | | $ | 3,982 | | | |
Three Months Ended March 31, 2021 compared2022 Compared to Three Months Ended March 31, 20202021
Interest expense. The decrease in interest expense of $784,$3,645, or 10%50%, was mainly due to lowerthe adoption of ASU 2020-06 upon which the discount associated with the Convertible Notes was eliminated and is no longer being amortized to interest expense due to lower principal balances on our 2018 Credit Facility.expense.
Income Taxes
| | (in thousands, except percentages) | (in thousands, except percentages) | Three Months Ended | | (in thousands, except percentages) | Three Months Ended | |
| | March 31, | | | March 31, | |
| | | 2021 | | 2020 | | Dollar
Change | | Percent
Change | | | 2022 | | 2021 | | Dollar
Change | | Percent
Change | |
| Income tax (expense) benefit | $ | (2,181) | | | $ | 250 | | | $ | (2,431) | | | 972 | % | | |
| Income tax benefit (expense) | | Income tax benefit (expense) | $ | 4,866 | | | $ | (2,181) | | | $ | 7,047 | | | 323 | % | |
| Effective tax rate | Effective tax rate | (121) | % | | (6) | % | | | Effective tax rate | 22 | % | | 121 | % | | |
Three Months Ended March 31, 2021 compared2022 Compared to Three Months Ended March 31, 20202021
The income tax expensebenefit recorded for the three months ended March 31, 20212022 compared to the income tax benefitexpense for the three months ended March 31, 20202021 is primarily due to an increased current period benefit related to equity compensation which was slightly offset by an increase in permanent items related to limitations on executive compensation the inclusion of foreign income in the U.S. due to foreign disregarded entities, and limitation on foreign nondeductible losses as compared to the three months ended March 31, 2020. For2021 for which the three months ended March 31, 2021, the actual discreteincome tax expense was determineddriven by permanent items related to be the appropriate method for calculating the interim tax provision as using the estimated annual effective tax rate method would have produced an unreliable rate stemming from a marginal loss and large permanent adjustments.limitations on executive compensation.
Non-GAAP Metrics
Adjusted EBITDA is a non-GAAP financial measure and is the primary basis used as the measure of profit or loss for our businesses. Adjusted EBITDA is defined as net income or net loss attributable to Vonage before income tax expense or benefit, interest expense, depreciation and amortization, stock-based expense, amortization of costs to implement cloud computing arrangements, share-based expense, acquisition related transaction and integration costs, organizational transformation costs, restructuringexit activities - severance and lease abandonment, and other non-recurring items. Organizational transformation includes employee related exits including CEO succession, system change management, facility exit costs,Exit activities - severance and rebranding. Restructuring activitieslease abandonment relate to the Company's business-wide optimization and alignment project initiated in 2020 which included employee related exits and further facility exit costs executed upon as part of the overall project. Other non-recurring items principally include certain litigation charges including defense costs, acquisition related consideration accounted for as compensation, long term incentive award and other non-recurring project costs such as the review of the Consumer business review and the business optimization project, both of which were initiated in 2020.business. This is also consistent with the measure used under our bank credit assessment. Our management and our Board of Directors utilize Adjusted EBITDA to evaluate our consolidated operating performance and the performance of our operating segments and to allocate resources and capital to our segments. It is also a significant performance measure in our annual incentive compensation programs. We believe that Adjusted EBITDA is useful to our investors as a basis for comparing our operating performance with that of other companies in our industries, although our measure of Adjusted EBITDA may not be directly comparable to that of other companies.
Our reconciliation of the aggregate amount of Adjusted EBITDA to consolidated income before taxes is presented below:
| | | Three Months Ended | | | Three Months Ended | |
| | March 31, | | | March 31, | |
| | 2021 | | 2020 | | | 2022 | | 2021 | |
| Net loss | Net loss | | $ | (376) | | | $ | (3,755) | | | Net loss | | $ | (17,122) | | | $ | (376) | | |
| Income tax expense (benefit) | | 2,181 | | | (250) | | | |
| Income tax expense | | Income tax expense | | (4,866) | | | 2,181 | | |
| Interest expense | Interest expense | | 7,298 | | | 8,082 | | | Interest expense | | 3,653 | | | 7,298 | | |
| Depreciation and amortization | Depreciation and amortization | | 20,417 | | | 20,485 | | | Depreciation and amortization | | 25,195 | | | 20,417 | | |
| Amortization of costs to implement cloud computing arrangements | Amortization of costs to implement cloud computing arrangements | | 896 | | | 609 | | | Amortization of costs to implement cloud computing arrangements | | 1,175 | | | 896 | | |
| Share-based expense | Share-based expense | | 14,566 | | | 11,116 | | | Share-based expense | | 29,042 | | | 14,566 | | |
| Acquisition related transaction and integration costs | | Acquisition related transaction and integration costs | | 1,744 | | | — | | |
| | Organizational transformation | | — | | | 1,194 | | | |
| Restructuring activities | | 1,294 | | | — | | | |
| Exit activities - severance and lease abandonment | | Exit activities - severance and lease abandonment | | 2,103 | | | 1,294 | | |
| Other non-recurring items | Other non-recurring items | | 1,891 | | | 1,356 | | | Other non-recurring items | | 3,135 | | | 1,891 | | |
| Adjusted EBITDA | Adjusted EBITDA | | $ | 48,167 | | | $ | 38,837 | | | Adjusted EBITDA | | $ | 44,059 | | | $ | 48,167 | | |
Liquidity and Capital Resources
Overview
For the three months ended March 31, 2021,2022, we had higherlower net cash from operations compared to the prior year due to lowerhigher operating expenses during the current year.year quarter. We expect to continue to balance efforts to grow our revenue with seeking to consistently achieve operating profitability. To grow our revenue, we continue to make investments in growth initiatives, marketing, applications development, network quality and expansion, and customer care. We believe that cash flow from operations and cash on hand will fund our operations for at least the next twelve months.
The following table sets forth a summary of our cash flows for the periods indicated:
| | | | Three Months Ended | | Three Months Ended |
| | March 31, | | March 31, |
| (in thousands) | (in thousands) | 2021 | | 2020 | | Dollar
Change | (in thousands) | 2022 | | 2021 | | Dollar
Change |
| Net cash provided by operating activities | Net cash provided by operating activities | $ | 47,318 | | | $ | 2,503 | | | $ | 44,815 | | Net cash provided by operating activities | $ | 40,871 | | | $ | 47,318 | | | $ | (6,447) | |
| Net cash used in investing activities | Net cash used in investing activities | (16,480) | | | (13,235) | | | (3,245) | | Net cash used in investing activities | (20,417) | | | (16,480) | | | (3,937) | |
| Net cash (used in) provided by financing activities | Net cash (used in) provided by financing activities | (21,019) | | | 32,499 | | | (53,518) | | Net cash (used in) provided by financing activities | (24,073) | | | (21,019) | | | (3,054) | |
| Effect of exchange rate changes on cash and cash equivalents | Effect of exchange rate changes on cash and cash equivalents | (980) | | | (2,290) | | | 1,310 | | Effect of exchange rate changes on cash and cash equivalents | 1,201 | | | (980) | | | 2,181 | |
Operating Activities
The following table describes the changes in cash provided by operating activities for the three months ended March 31, 20212022 as compared to the three months ended March 31, 2020:2021:
| | | | | |
| (in thousands) |
IncreaseDecrease in operating incomenet loss adjusted for non-cash items primarily due to increase in net loss offset by increased gross margin driven by growth within VCP during the quarter | $ | 6,501 (4,968) | |
IncreaseDecrease in working capital driven primarily by timing of vendor payments prepayments forand declines in deferred revenue as customers shift from annual licenses and improvement in operating cash flows as a result of benefits under the CARES Act. This was slightly offset duebillings to the timing in customer payments for annual subscription servicesmore frequent billings. | 38,314 (1,479) | |
IncreaseDecrease in cash provided by operating activities | $ | 44,815 (6,447) | |
Investing Activities
The following table describes the changes in cash used in investing activities for the three months ended March 31, 20212022 as compared to the three months ended March 31, 2020:2021:
| | | | | |
| (in thousands) |
| Increase in payments to acquire and develop software assets | (3,592)(3,758) | |
DecreaseIncrease in payments related to capital expenditures | 334 (220) | |
| |
| Decrease in payments to acquire new patents on our developed technology | 1341 | |
| Increase in cash used in investing activities | $ | (3,245)(3,937) | |
Financing Activities
The following table describes the changes in cash (used in) provided by financing activities for the three months ended March 31, 20212022 as compared to the three months ended March 31, 2020:2021:
| | | | | |
| (in thousands) |
DecreasedIncreased borrowings net of repayments during the current year quarter | $ | (50,000)5,000 | |
DecreaseIncrease in payments associated with taxes on share based compensation due to lower vestingmore shares vested in 20212022 | (3,985)(7,677) | |
IncreaseDecrease in proceeds received from exercise of stock options due to fewer exercises in 20202022 | 467 (377) | |
DecreaseIncrease in cash (used in) provided byused in financing activities | $ | (53,518)(3,054) | |
Sources of Liquidity
The principal sources of liquidity are derived from available borrowings under our existing financing arrangements, existing cash on hand, and cash flows from operations. As described in Note 6, Long-Term Debt, to the Condensed Consolidated Financial Statements, the Company's financing arrangements consist of its Convertible Senior Notes and the 2018 Credit Facility comprised of a $100,000 term note and a $500,000 revolving credit facility. The COVID-19 pandemic has caused disruption in global capital markets. This could result in future financing becoming more difficult or expensive to obtain or the Company may not be able to obtain financing on acceptable terms or at all.
We maintain significant availability under our lines of credit to meet our short-term liquidity requirements. As of March 31, 2021,2022, amounts available under the 2018 Credit Facility totaled $289.5$369.5 million.
Uses of Liquidity
The Company's requirements for liquidity and capital resources are generally for the purposes of operating activities, debt service obligations, restructuring initiatives, and capital expenditures. For the three months ended March 31, 2021,2022, capital expenditures were primarily for the implementation of software solutions and purchase of network equipment as we continue to expand our network. Our capital expenditures for the three months ended March 31, 2021,2022, were $16,480,$20,417, of which $13,865$17,623 was for software acquisition and development. The majority of these expenditures are comprised of investments in information technology and systems infrastructure, including an electronic data warehouse, online customer service, and customer management platforms. For full year 2021,2022, we estimate our capital and software expenditures will be approximately $65 million.
State and Local Sales Taxes
We have contingent liabilities for state and local sales taxes. As of March 31, 2021, we had a reserve of $8,648. If our ultimate liability exceeds this amount, it could affect our liquidity unfavorably. However, we do not believe it will significantly impair our liquidity.
Off-Balance Sheet Arrangements
Obligations under Certain Guarantee Contracts
We enter guarantee arrangements in the normal course of business to facilitate transactions with third parties. These arrangements include financial and performance guarantees, stand-by letters of credit, debt guarantees and indemnifications. As of March 31, 20212022 and December 31, 20202021 we had stand-by letters of credit of $1,502,$1,547 and $1,350, respectively.
Contractual Obligations and Commitments
Except as set forth below and in Note 9. Commitments and Contingencies included in Part 1, Item 1 of this Form 10-Q, there were no significant changes in our commitments under contractual obligations as disclosed in the Company's Annual Report on Form 10-K for the year ended December 31, 2020.2021.
Contingencies
From time to time we are subject to legal proceedings, claims and investigations relating to our business, including claims of alleged infringement of commercial, employment, intellectual property rights, and other matters. From time to time, we receive letters or other communications from third parties inviting us to obtain patent licenses that might be relevant to our business or alleging that our services infringe upon third-party patents or other intellectual property. In accordance with generally accepted accounting principles, we make a provision for a loss when it is both probable that a liability has been incurred and the amount of the loss or range of loss can be reasonably estimated. Such legal proceedings are inherently unpredictable and subject to further uncertainties. Should any of these estimates and assumptions change it is possible that the resolution of the matters described in Note 9, Commitments and Contingencies included in Part 1, Item 1 of this Form 10-Q could have a material adverse effect on our condensed consolidated financial position, cash flows or results of operations.
Critical Accounting Policies
Our consolidated financial statements and accompanying notes are prepared in accordance with U.S. GAAP. Our significant accounting policies are described in Note 2, Summary of Significant Accounting Policies to the consolidated financial statements included in our Annual Report on Form 10-K for the year ended December 31, 2020.2021. The preparation of financial statements and related disclosures in compliance with GAAP requires management to make estimates and assumptions that affect the reported amount of assets, liabilities, revenues and expenses as well as the disclosure of contingent assets and liabilities. The application of these policies involves judgment regarding future events and these judgments could materially affect the financial statements and disclosures based on varying assumptions.
We identify our most critical accounting policies as those that are the most pervasive and important to the portrayal of our financial position and results of operations, and those that require the most difficult, subjective or complex judgments by management regarding estimates. Our critical accounting policies include revenue recognition, valuation of goodwill and intangible assets, income taxes and capitalized software. As of March 31, 2021,2022, our goodwill is attributable to our VCP operating segment. We perform our annual test of goodwill on October 1st. Additionally, we will assess our goodwill for impairment between annual tests when specific circumstances dictate.
COVID-19 has created and may continue to create uncertainty in bookings and customer payments, reduced usage, and issuance of customer credits to distressed customers served by certain product lines. As of the date of our condensed consolidated financial statements, we are not aware of any specific event or circumstance that would require us to update our estimates or judgments. However, these estimates may change as new events occur and additional information is obtained, which may result in changes being recognized in our condensed consolidated financial statements in future periods. In particular and in light of the COVID-19 pandemic, the assumptions and estimates associated with collectability assessment of revenue and credit losses of accounts receivable may have a material impact our consolidated financial statements in future periods, depending on the duration or degree of the impact of the COVID-19 pandemic on the global economy.
In February 2022, the Russian Federation commenced a military action with the country of Ukraine. As a result of this action, various nations, including the United States, have instituted economic sanctions against the Russian Federation and Belarus. Further, the impact of this action and related sanctions on the world economy are not fully determinable as of the date of these financial statements and the specific impact on the Company’s financial condition, results of operations, and cash flows may be material depending on the duration and degree of the invasion.
| | | | | |
| Item 3. | Quantitative and Qualitative Disclosures about Market Risk |
We are exposed to financial market risks, including changes in currency exchange rates and interest rates.
Foreign Exchange Risk
We sell our products and services primarily in the United States, Canada, the European Union, and Asia. A portion of our sales denominated in Euros, the Canadian Dollar, and the British Pound Sterling, which are affected by changes in currency exchange rates. Our financial results could be affected by changes in foreign currency exchange rates, although foreign exchange risks have not been material to our financial position or results of operations to date.
On January 31, 2020, the United Kingdom officially withdrew from the European Union or , "EU". The 11-month transition period ended on. December 31, 2020. As of January 1, 2021, the UK is no longer inside the EU's Single Market and Customs Union and is free to implement trade deals struck with third countries. Uncertainty and currency volatility in the British Pound Sterling exchange rate is expected to continue.
Interest Rate and Debt Risk
Our exposure to market risk for changes in interest rates primarily relates to our long-term debt.
As of March 31, 2021,2022, if the interest rate on our variable rate debt changed by 1% on our 2018 Revolving Credit Facility, our annual debt service payment would change by approximately $2,105.$1,305.
As of March 31, 2021,2022, we had $345.0 million outstanding on our 1.75% convertible senior notes due 2024. The Notes have 1.75% percent fixed annual interest rates and, therefore, our economic interest rate exposure on our convertible senior notes is fixed. However, the values of the convertible senior notes are exposed to interest rate risk. Generally, the fair market value of our fixed interest rate convertible senior notes will increase as interest rates fall and decrease as interest rates rise. In addition, the fair values of the convertible senior notes are affected by our stock price. The fair value of the convertible senior notes will generally increase as our common stock price increases and will generally decrease as our common stock price declines in value. Additionally, we carry the convertible senior notes at face value less unamortized discount on our balance sheet, and we present the fair value for required disclosure purposes only.
| | | | | |
| Item 4. | Controls and Procedures |
Evaluation of Disclosure Controls and Procedures. Based on the evaluation of our disclosure controls and procedures (as defined in Securities Exchange Act of 1934 Rules 13a-15(e) and 15d-15(e)) required by Securities Exchange Act Rules 13a-15(b) or 15d-15(b), our Chief Executive Officer and our Chief Financial Officer have concluded that, as of the end of the period covered by this report, our disclosure controls and procedures were effective.
Changes in Internal Controls. There were no changes in our internal control over financial reporting that occurred during our most recent fiscal quarter that have materially affected, or are reasonably likely to materially affect, our internal control over financial reporting. In response to COVID-19, we have undertaken measures to protect our employees, partners, and clients, including encouraging employees to work remotely. These measures have compelled us to modify some of our control procedures, however, those modifications have so far not been material. We are continually monitoring and assessing the COVID-19 situation in order to minimize the impact on the design, implementation, and operating effectiveness of our internal controls.
Part II—Other Information
We are subject to a number of lawsuits, government investigations and claims arising out of the conduct of our business. See a discussion of our litigation matters in Note 9 of Notes to our Condensed Consolidated Financial Statements, which is incorporated herein by reference.
Other than the risk factor set forth below, there have been no material changes from the risk factors previously disclosed in Item 1A of our Annual Report on Form 10-K for the fiscal year ended December 31, 20202021 and our Quarterly Report on Form 10-Q for the quarter ended March 31, 2021.2022.
| | | | | |
| Item 2. | Unregistered Sales of Equity Securities and Use of Proceeds |
Not applicable.
| | | | | |
| Item 3. | Defaults Upon Senior Securities |
None.
| | | | | |
| Item 4. | Mine Safety Disclosures |
Not applicable.
None.
See accompanying Exhibit Index for a list of the exhibits filed or furnished with this Quarterly Report on Form 10-Q.
EXHIBIT INDEX
| | | | | | | | |
| | |
10.1 | | |
| | |
10.2 | | |
| | |
| 31.1 | | |
| | |
| 31.2 | | |
| | |
| 32.1 | | |
| | |
| 101 | | The following financial information from Vonage Holdings Corp.'s Quarterly Report on Form 10-Q for the quarter ended March 31, 20212022 formatted in Inline XBRL (Extensible Business Reporting Language) includes: (i) the Condensed Consolidated Balance Sheets, (ii) the Condensed Consolidated Statements of Operations, (iii) the Condensed Consolidated Statements of Comprehensive (Loss) Income, (iv) the Condensed Consolidated Statements of Cash Flows, (v) the Condensed Consolidated Statements of Stockholders Equity, and (vi) Notes to the Condensed Consolidated Financial Statements. |
| | |
| 104 | | Cover Page Interactive Data File (formatted as Inline XBRL and contained in Exhibit 101) |
* Filed herewith.
† Portions of this exhibit were redacted pursuant to Item 601(b)(10) of Regulation S-K.
SIGNATURE
Pursuant to the requirements of the Securities Exchange Act of 1934, as amended, the registrant has duly caused this report to be signed on its behalf by the undersigned thereunto duly authorized.
| | | | | | | | | | | | | | | | | |
| | | VONAGE HOLDINGS CORP. |
| | | |
| Dated: | May 6, 20215, 2022 | | By: | | /s/ Stephen Lasher |
| | | | | Stephen Lasher
Chief Financial Officer
(Principal Financial Officer and Duly Authorized Officer) |