UNITED STATES SECURITIES AND EXCHANGE COMMISSION
Washington, D.C. 20549
FORM 10-Q
(Mark One)
| | | | | | | | |
| ☒ | | QUARTERLY REPORT PURSUANT TO SECTION 13 OR 15(d) OF THE SECURITIES EXCHANGE ACT OF 1934 |
For the quarterly period ended March 31,September 30, 2023
or
| | | | | | | | |
| ☐ | | TRANSITION REPORT PURSUANT TO SECTION 13 OR 15(d) OF THE SECURITIES EXCHANGE ACT OF 1934 |
For the transition period from __________ to __________
Commission file number 001-34018
GRAN TIERRA ENERGY INC.
(Exact name of registrant as specified in its charter)
| | | | | | | | | | | | | | | | | |
| Delaware | | 98-0479924 |
| (State or other jurisdiction of incorporation or organization) | | (I.R.S. Employer Identification No.) |
| 500 Centre Street S.E. |
| Calgary, | Alberta | Canada | T2G 1A6 | |
| (Address of principal executive offices, including zip code) |
(403) 265-3221
(Registrant’s telephone number, including area code)
Securities registered pursuant to Section 12(b) of the Act:
| | | | | | | | |
| Title of each class | Trading Symbol(s) | Name of each exchange on which registered |
| Common Stock, par value $0.001 per share | GTE | NYSE American |
| Toronto Stock Exchange |
| London Stock Exchange |
Indicate by check mark whether the registrant (1) has filed all reports required to be filed by Section 13 or 15(d) of the Securities Exchange Act of 1934 during the preceding 12 months (or for such shorter period that the registrant was required to file such reports), and (2) has been subject to such filing requirements for the past 90 days. Yes ☒ No ☐
Indicate by check mark whether the registrant has submitted electronically every Interactive Data File required to be submitted pursuant to Rule 405 of Regulation S-T (§ 232.405 of this chapter) during the preceding 12 months (or for such shorter period that the registrant was required to submit such files).
Yes ☒ No ☐
Indicate by check mark whether the registrant is a large accelerated filer, an accelerated filer, a non-accelerated filer, a smaller reporting company, or an emerging growth company. See the definitions of large accelerated filer, accelerated filer, smaller reporting company, and emerging growth company in Rule 12b-2 of the Exchange Act.
| | | | | | | | | | | |
| Large accelerated filer | ☐ | Accelerated filer | ☒ |
| Non-accelerated filer | ☐ | Smaller reporting company | ☐ |
| | Emerging growth company | ☐ |
If an emerging growth company, indicate by check mark if the registrant has elected not to use the extended transition period for complying with any new or revised financial accounting standards provided pursuant to Section 13(a) of the Exchange Act. ☐
Indicate by check mark whether the registrant is a shell company (as defined in Rule 12b-2 of the Act). Yes ☐ No ☒
On April 26,October 27, 2023, 368,904,49633,288,305 shares of the registrant’s Common Stock, $0.001 par value, were issued.
Gran Tierra Energy Inc.
Quarterly Report on Form 10-Q
Quarterly Period Ended March 31,September 30, 2023
Table of contents
| | | | | | | | |
| | | Page |
| PART I | Financial Information | |
| Item 1. | Financial Statements | |
| Item 2. | Management’s Discussion and Analysis of Financial Condition and Results of Operations | |
| Item 3. | Quantitative and Qualitative Disclosures About Market Risk | |
| Item 4. | Controls and Procedures | |
| | |
| PART II | Other Information | |
| Item 1. | Legal Proceedings | |
| Item 1A. | Risk Factors | |
| | |
| Item 2. | Unregistered Sales of Equity Securities and Use of Proceeds | |
| Item 5. | Other information | |
| Item 6. | Exhibits | |
| SIGNATURES | |
| |
CAUTIONARY LANGUAGE REGARDING FORWARD-LOOKING STATEMENTS
This Quarterly Report on Form 10-Q includes forward-looking statements within the meaning of Section 27A of the Securities Act of 1933, as amended (the “Securities Act”), and Section 21E of the Securities Exchange Act of 1934, as amended (the “Exchange Act”). All statements other than statements of historical facts included in this Quarterly Report on Form 10-Q regarding our financial position, estimated quantities and net present values of reserves, business strategy, plans and objectives of our management for future operations, covenant compliance, capital spending plans and benefits of the changes in our capital program or expenditures, our liquidity the impacts of the coronavirus (COVID-19) pandemic and those statements preceded by, followed by or that otherwise include the words “believe,” “expect,” “anticipate,” “intend,” “estimate,” “project,” “target,” “goal,” “plan,” “budget,” “objective,” “could,” “should,” or similar expressions or variations on these expressions are forward-looking statements. We can give no assurances that the assumptions upon which the forward-looking statements are based will prove to be correct or that, even if correct, intervening circumstances will not occur to cause actual results to be different than expected. Because forward-looking statements are subject to risks and uncertainties, actual results may differ materially from those expressed or implied by the forward-looking statements. There are a number of risks, uncertainties and other important factors that could cause our actual results to differ materially from the forward-looking statements, including, but not limited to, our operations are located in South America and unexpected problems can arise due to guerilla activity, strikes, local blockades or protests; technical difficulties and operational difficulties may arise which impact the production, transport or sale of our products; other disruptions to local operations; global health events (including the ongoing COVID-19 pandemic);events; global and regional changes in the demand, supply, prices, differentials or other market conditions affecting oil and gas, including inflation and changes resulting from a global health crisis, geopolitical events, including the Russian invasion ofongoing conflicts in Ukraine and the Gaza region, or from the imposition or lifting of crude oil production quotas or other actions that might be imposed by OPEC, such as its recent decision (occurred June 2023) to cut production and other producing countries and the resulting company or third-party actions in response to such changes; changes in commodity prices, including volatility or a prolonged decline in these prices relative to historical or future expected levels; the risk that current global economic and credit conditions may impact oil prices and oil consumption more than we currently predicts, which could cause further modification of our strategy and capital spending program; prices and markets for oil and natural gas are unpredictable and volatile; the effect of hedges; the accuracy of productive capacity of any particular field; geographic, political and weather conditions can impact the production, transport or sale of our products; our ability to execute itsour business plan and realize expected benefits from current initiatives; the risk that unexpected delays and difficulties in developing currently owned properties may occur; the ability to replace reserves and production and develop and manage reserves on an economically viable basis; the accuracy of testing and production results and seismic data, pricing and cost estimates (including with respect to commodity pricing and exchange rates); the risk profile of planned exploration activities; the effects of drilling down-dip; the effects of waterflood and multi-stage fracture stimulation operations; the extent and effect of delivery disruptions, equipment performance and costs; actions by third parties; the timely receipt of regulatory or other required approvals for our operating activities; the failure of exploratory drilling to result in commercial wells; unexpected delays due to the limited availability of drilling equipment and personnel; volatility or declines in the trading price of our common stockCommon Stock or bonds; the risk that we do not receive the anticipated benefits of government programs, including government tax refunds; our ability to obtain a new credit agreement and comply with financial covenants in itsour credit agreement and indentures and make borrowings under any credit agreement; and those factors set out in Part II, Item 1A “Risk Factors” in this Quarterly Report on Form 10-Q and Part I, Item 1A “Risk Factors” in our 2022 Annual Report on Form 10-K (the “2022 Annual Report on Form 10-K”), and in our other filings with the Securities and Exchange Commission (“SEC”). during the current fiscal year. The unprecedented nature of the current volatility in the worldwide economy and oil and gas industry makes it more difficult to predict the accuracy of forward-looking statements. The information included herein (other than in the context of the financial statements) is given as of the filing date of this Quarterly Report on Form 10-Q with the SEC and, except as otherwise required by the federal securities laws, we disclaim any obligation or undertaking to publicly release any updates or revisions to or to withdraw, any forward-looking statement contained in this Quarterly Report on Form 10-Q to reflect any change in our expectations with regard thereto or any change in events, conditions or circumstances on which any forward-looking statement is based.
GLOSSARY OF OIL AND GAS TERMS
In this document, the abbreviations set forth below have the following meanings:
| | | | | |
| bbl | barrel |
| BOPD | barrels of oil per day |
| NAR | net after royalty |
Sales volumes represent production NAR adjusted for inventory changes. Our oil and gas reserves are reported as NAR. Our production is also reported NAR, except as otherwise specifically noted as "working“working interest production before royalties."royalties”.
PART I - Financial Information
Item 1. Financial Statements
Gran Tierra Energy Inc.
Condensed Consolidated Statements of Operations (Unaudited)
(Thousands of U.S. Dollars, Except Share and Per Share Amounts) | | | | Three Months Ended March 31, | | Three Months Ended September 30, | | Nine Months Ended September 30, |
| | | | 2023 | | 2022 | | 2023 | | 2022 | | 2023 | | 2022 |
| OIL SALES (Note 6) | OIL SALES (Note 6) | | $ | 144,190 | | | $ | 174,569 | | OIL SALES (Note 6) | $ | 179,921 | | | $ | 168,397 | | | $ | 482,013 | | | $ | 548,751 | |
| | | | | | |
| EXPENSES | EXPENSES | | | EXPENSES | |
| Operating | Operating | | 41,369 | | | 34,935 | | Operating | 49,367 | | | 41,837 | | | 139,227 | | | 116,266 | |
| Transportation | Transportation | | 3,066 | | | 2,834 | | Transportation | 3,842 | | | 2,417 | | | 10,599 | | | 7,764 | |
| Depletion, depreciation and accretion (Note 3) | Depletion, depreciation and accretion (Note 3) | | 51,721 | | | 40,963 | | Depletion, depreciation and accretion (Note 3) | 55,019 | | | 45,320 | | | 162,949 | | | 128,499 | |
| Inventory impairment | | 475 | | | — | | |
| General and administrative (Note 9) | General and administrative (Note 9) | | 12,696 | | | 12,336 | | General and administrative (Note 9) | 10,238 | | | 8,114 | | | 32,800 | | | 30,286 | |
| Foreign exchange loss (gain) | | 1,702 | | | (3,725) | | |
| Foreign exchange loss | | Foreign exchange loss | 1,717 | | | 1,489 | | | 8,126 | | | 486 | |
| Derivative instruments loss (Note 9) | Derivative instruments loss (Note 9) | | — | | | 21,439 | | Derivative instruments loss (Note 9) | — | | | — | | | — | | | 26,611 | |
| | Gain on re-purchase of Senior Notes (Note 4) | | (1,090) | | | — | | |
| Other gain (Note 4) | | Other gain (Note 4) | (354) | | | (2,598) | | | (969) | | | (2,598) | |
| Interest expense (Note 4) | Interest expense (Note 4) | | 11,836 | | | 12,128 | | Interest expense (Note 4) | 13,503 | | | 11,421 | | | 38,017 | | | 35,743 | |
| | | | 121,775 | | | 120,910 | | | 133,332 | | | 108,000 | | | 390,749 | | | 343,057 | |
| | INTEREST INCOME | INTEREST INCOME | | 768 | | | — | | INTEREST INCOME | 271 | | | — | | | 1,686 | | | — | |
| INCOME BEFORE INCOME TAXES | INCOME BEFORE INCOME TAXES | | 23,183 | | | 53,659 | | INCOME BEFORE INCOME TAXES | 46,860 | | | 60,397 | | | 92,950 | | | 205,694 | |
| | INCOME TAX EXPENSE | INCOME TAX EXPENSE | | | INCOME TAX EXPENSE | |
| Current (Note 7) | Current (Note 7) | | 17,606 | | | 20,827 | | Current (Note 7) | 26,343 | | | 16,820 | | | 63,706 | | | 63,072 | |
| Deferred (Note 7) | Deferred (Note 7) | | 15,277 | | | 18,713 | | Deferred (Note 7) | 13,990 | | | 4,914 | | | 43,242 | | | 36,868 | |
| | | 32,883 | | | 39,540 | | | 40,333 | | | 21,734 | | | 106,948 | | | 99,940 | |
| NET AND COMPREHENSIVE (LOSS) INCOME | | $ | (9,700) | | | $ | 14,119 | | |
| NET AND COMPREHENSIVE INCOME (LOSS) | | NET AND COMPREHENSIVE INCOME (LOSS) | $ | 6,527 | | | $ | 38,663 | | | $ | (13,998) | | | $ | 105,754 | |
| | NET (LOSS) INCOME PER SHARE | | | |
NET INCOME (LOSS) PER SHARE (1) | | NET INCOME (LOSS) PER SHARE (1) | |
| | BASIC AND DILUTED | | $ | (0.03) | | | $ | 0.04 | | |
| | - BASIC | | - BASIC | $ | 0.20 | | | $ | 1.05 | | | $ | (0.42) | | | $ | 2.88 | |
| - DILUTED | | - DILUTED | $ | 0.20 | | | $ | 1.04 | | | $ | (0.42) | | | $ | 2.84 | |
| WEIGHTED AVERAGE SHARES OUTSTANDING - BASIC (Note 5) | WEIGHTED AVERAGE SHARES OUTSTANDING - BASIC (Note 5) | | 344,513,998 | | | 367,386,664 | | WEIGHTED AVERAGE SHARES OUTSTANDING - BASIC (Note 5) | 33,287,368 | | | 36,730,543 | | | 33,675,160 | | | 36,775,419 | |
| WEIGHTED AVERAGE SHARES OUTSTANDING - DILUTED (Note 5) | WEIGHTED AVERAGE SHARES OUTSTANDING - DILUTED (Note 5) | | 344,513,998 | | | 372,375,245 | | WEIGHTED AVERAGE SHARES OUTSTANDING - DILUTED (Note 5) | 33,350,050 | | | 37,131,074 | | | 33,675,160 | | | 37,238,790 | |
(1) Reflects our 1-for-10 reverse stock split that became effective May 5, 2023. See Note 5 in the notes to the condensed consolidated financial statements for further discussion.
(See notes to the condensed consolidated financial statements)
Gran Tierra Energy Inc.
Condensed Consolidated Balance Sheets (Unaudited)
(Thousands of U.S. Dollars, Except Share and Per Share Amounts)
| | | | As at March 31, 2023 | | As at December 31, 2022 | | As at September 30, 2023 | | As at December 31, 2022 |
| | ASSETS | ASSETS | | | | ASSETS | | | |
| Current Assets | Current Assets | | | | Current Assets | | | |
| Cash and cash equivalents (Note 10) | Cash and cash equivalents (Note 10) | $ | 105,684 | | | $ | 126,873 | | Cash and cash equivalents (Note 10) | $ | 123,216 | | | $ | 126,873 | |
| Restricted cash and cash equivalents (Note 10) | Restricted cash and cash equivalents (Note 10) | 1,142 | | | 1,142 | | Restricted cash and cash equivalents (Note 10) | 1,142 | | | 1,142 | |
| Accounts receivable | Accounts receivable | 13,596 | | | 10,706 | | Accounts receivable | 19,157 | | | 10,706 | |
| Inventory | Inventory | 20,075 | | | 20,192 | | Inventory | 25,724 | | | 20,192 | |
| Taxes receivable | 113 | | | 54 | | |
| Other current assets (Note 9) | Other current assets (Note 9) | 11,681 | | | 9,620 | | Other current assets (Note 9) | 12,082 | | | 9,674 | |
| Total Current Assets | Total Current Assets | 152,291 | | | 168,587 | | Total Current Assets | 181,321 | | | 168,587 | |
| | Oil and Gas Properties | Oil and Gas Properties | | | | Oil and Gas Properties | | | |
| Proved | Proved | 1,036,350 | | | 1,000,424 | | Proved | 1,040,254 | | | 1,000,424 | |
| Unproved | Unproved | 63,454 | | | 74,471 | | Unproved | 70,253 | | | 74,471 | |
| Total Oil and Gas Properties | Total Oil and Gas Properties | 1,099,804 | | | 1,074,895 | | Total Oil and Gas Properties | 1,110,507 | | | 1,074,895 | |
| Other capital assets | Other capital assets | 25,319 | | | 26,007 | | Other capital assets | 30,448 | | | 26,007 | |
| Total Property, Plant and Equipment (Note 3) | Total Property, Plant and Equipment (Note 3) | 1,125,123 | | | 1,100,902 | | Total Property, Plant and Equipment (Note 3) | 1,140,955 | | | 1,100,902 | |
| | Other Long-Term Assets | Other Long-Term Assets | | | | Other Long-Term Assets | | | |
| Deferred tax assets | Deferred tax assets | 11,806 | | | 22,990 | | Deferred tax assets | 9,758 | | | 22,990 | |
| Taxes receivable | Taxes receivable | 31,273 | | | 27,796 | | Taxes receivable | 46,736 | | | 27,796 | |
| Other long-term assets (Note 9) | 5,923 | | | 15,335 | | |
| Other long-term assets (Note 9 and 10) | | Other long-term assets (Note 9 and 10) | 7,265 | | | 15,335 | |
| Total Other Long-Term Assets | Total Other Long-Term Assets | 49,002 | | | 66,121 | | Total Other Long-Term Assets | 63,759 | | | 66,121 | |
| Total Assets | Total Assets | $ | 1,326,416 | | | $ | 1,335,610 | | Total Assets | $ | 1,386,035 | | | $ | 1,335,610 | |
| | LIABILITIES AND SHAREHOLDERS’ EQUITY | LIABILITIES AND SHAREHOLDERS’ EQUITY | | | | LIABILITIES AND SHAREHOLDERS’ EQUITY | | | |
| Current Liabilities | Current Liabilities | | | | Current Liabilities | | | |
| Accounts payable and accrued liabilities | Accounts payable and accrued liabilities | $ | 187,598 | | | $ | 167,579 | | Accounts payable and accrued liabilities | $ | 176,489 | | | $ | 167,579 | |
| | Credit facility (Note 4) | | Credit facility (Note 4) | 49,067 | | | — | |
| Taxes payable | Taxes payable | 65,202 | | | 58,978 | | Taxes payable | 46,398 | | | 58,978 | |
| Equity compensation award liability (Note 5 and 9) | 8,011 | | | 15,082 | | |
| Equity compensation award liability (Note 5) | | Equity compensation award liability (Note 5) | 7,794 | | | 15,082 | |
| | Total Current Liabilities | Total Current Liabilities | 260,811 | | | 241,639 | | Total Current Liabilities | 279,748 | | | 241,639 | |
| | Long-Term Liabilities | Long-Term Liabilities | | | | Long-Term Liabilities | | | |
| Long-term debt (Notes 4 and 9) | Long-term debt (Notes 4 and 9) | 581,391 | | | 589,593 | | Long-term debt (Notes 4 and 9) | 587,444 | | | 589,593 | |
| Deferred tax liabilities | Deferred tax liabilities | 5,377 | | | 28 | | Deferred tax liabilities | 35,011 | | | 28 | |
| Asset retirement obligation | Asset retirement obligation | 65,159 | | | 63,358 | | Asset retirement obligation | 70,712 | | | 63,358 | |
| Equity compensation award liability (Note 5 and 9) | 8,592 | | | 16,437 | | |
| Equity compensation award liability (Note 5) | | Equity compensation award liability (Note 5) | 9,525 | | | 16,437 | |
| | Other long-term liabilities | Other long-term liabilities | 7,319 | | | 6,989 | | Other long-term liabilities | 9,055 | | | 6,989 | |
| Total Long-Term Liabilities | Total Long-Term Liabilities | 667,838 | | | 676,405 | | Total Long-Term Liabilities | 711,747 | | | 676,405 | |
| | Contingencies (Note 8) | Contingencies (Note 8) | | Contingencies (Note 8) | |
| | Shareholders' Equity | | | | |
| Common Stock (Note 5) (368,898,619 issued, 333,069,042 and 346,151,157 outstanding shares of Common Stock, par value $0.001 per share, as at March 31, 2023, and December 31, 2022, respectively) | 10,272 | | | 10,272 | | |
Shareholders' Equity (1) | | Shareholders' Equity (1) | | | |
| Common Stock (Note 5) (33,288,305 and 36,889,862 issued, 33,288,305 and 34,615,116 outstanding shares of Common Stock, par value $0.001 per share, as at September 30, 2023, and December 31, 2022, respectively) | | Common Stock (Note 5) (33,288,305 and 36,889,862 issued, 33,288,305 and 34,615,116 outstanding shares of Common Stock, par value $0.001 per share, as at September 30, 2023, and December 31, 2022, respectively) | 10,237 | | | 10,272 | |
| Additional paid-in capital | Additional paid-in capital | 1,291,973 | | | 1,291,354 | | Additional paid-in capital | 1,255,044 | | | 1,291,354 | |
| Treasury Stock (Note 5) | Treasury Stock (Note 5) | (38,035) | | | (27,317) | | Treasury Stock (Note 5) | — | | | (27,317) | |
| Deficit | Deficit | (866,443) | | | (856,743) | | Deficit | (870,741) | | | (856,743) | |
| Total Shareholders’ Equity | Total Shareholders’ Equity | 397,767 | | | 417,566 | | Total Shareholders’ Equity | 394,540 | | | 417,566 | |
| Total Liabilities and Shareholders’ Equity | Total Liabilities and Shareholders’ Equity | $ | 1,326,416 | | | $ | 1,335,610 | | Total Liabilities and Shareholders’ Equity | $ | 1,386,035 | | | $ | 1,335,610 | |
(See notes to the condensed consolidated financial statements)
Gran Tierra Energy Inc.
Condensed Consolidated Statements of Cash Flows (Unaudited)
(Thousands of U.S. Dollars)
| | | | Three Months Ended March 31, | | Nine Months Ended September 30, |
| | | 2023 | | 2022 | | 2023 | | 2022 |
| Operating Activities | Operating Activities | | | | Operating Activities | | | |
| Net (loss) income | Net (loss) income | $ | (9,700) | | | $ | 14,119 | | Net (loss) income | $ | (13,998) | | | $ | 105,754 | |
| Adjustments to reconcile net (loss) income to net cash provided by operating activities: | Adjustments to reconcile net (loss) income to net cash provided by operating activities: | | | Adjustments to reconcile net (loss) income to net cash provided by operating activities: | | |
| Depletion, depreciation and accretion | 51,721 | | | 40,963 | | |
| Inventory impairment | 475 | | | — | | |
| Deferred tax expense | 15,277 | | | 18,713 | | |
| Depletion, depreciation and accretion (Note 3) | | Depletion, depreciation and accretion (Note 3) | 162,949 | | | 128,499 | |
| Deferred tax expense (Note 7) | | Deferred tax expense (Note 7) | 43,242 | | | 36,868 | |
| Stock-based compensation expense (Note 5) | Stock-based compensation expense (Note 5) | 1,500 | | | 4,557 | | Stock-based compensation expense (Note 5) | 3,748 | | | 6,376 | |
| Amortization of debt issuance costs (Note 4) | Amortization of debt issuance costs (Note 4) | 781 | | | 887 | | Amortization of debt issuance costs (Note 4) | 3,394 | | | 2,769 | |
| Unrealized foreign exchange loss (gain) | 514 | | | (4,839) | | |
| Gain on re-purchase of Senior Notes (Note 4) | (1,090) | | | — | | |
| Derivative instruments loss | — | | | 21,439 | | |
| Cash settlements on derivatives instruments | — | | | (8,596) | | |
| | Unrealized foreign exchange (gain) loss | | Unrealized foreign exchange (gain) loss | (7,814) | | | 6,138 | |
| Other gain (Note 4) | | Other gain (Note 4) | (969) | | | (2,598) | |
| Derivative instrument loss (Note 9) | | Derivative instrument loss (Note 9) | — | | | 26,611 | |
| Cash settlement on derivative instruments | | Cash settlement on derivative instruments | — | | | (26,611) | |
| Cash settlement of asset retirement obligation | Cash settlement of asset retirement obligation | — | | | (5) | | Cash settlement of asset retirement obligation | (376) | | | (1,673) | |
| Non-cash lease expenses | Non-cash lease expenses | 1,144 | | | 411 | | Non-cash lease expenses | 3,488 | | | 2,009 | |
| Lease payments | Lease payments | (606) | | | (344) | | Lease payments | (1,918) | | | (1,134) | |
| Net change in assets and liabilities from operating activities (Note 10) | Net change in assets and liabilities from operating activities (Note 10) | (10,763) | | | 16,520 | | Net change in assets and liabilities from operating activities (Note 10) | (34,235) | | | 72,838 | |
| Net cash provided by operating activities | Net cash provided by operating activities | 49,253 | | | 103,825 | | Net cash provided by operating activities | 157,511 | | | 355,846 | |
| | Investing Activities | Investing Activities | | | | Investing Activities | | | |
| Additions to property, plant and equipment | Additions to property, plant and equipment | (71,062) | | | (41,483) | | Additions to property, plant and equipment | (179,707) | | | (163,717) | |
| | Changes in non-cash investing working capital (Note 10) | Changes in non-cash investing working capital (Note 10) | 14,871 | | | (1,803) | | Changes in non-cash investing working capital (Note 10) | (11,051) | | | 3,255 | |
| Net cash used in investing activities | Net cash used in investing activities | (56,191) | | | (43,286) | | Net cash used in investing activities | (190,758) | | | (160,462) | |
| | Financing Activities | Financing Activities | | | | Financing Activities | | | |
| Debt issuance costs (Note 4) | (50) | | | — | | |
| Repayment of debt (Note 4) | — | | | (27,525) | | |
| Re-purchase of Senior Notes (Note 4) | (4,225) | | | — | | |
| Proceeds from debt, net of issuance costs (Note 4) | | Proceeds from debt, net of issuance costs (Note 4) | 48,125 | | | — | |
| Repayment of debt | | Repayment of debt | — | | | (67,623) | |
| Purchase of Senior Notes (Note 4) | | Purchase of Senior Notes (Note 4) | (6,805) | | | (17,274) | |
| Re-purchase of shares of Common Stock (Note 5) | Re-purchase of shares of Common Stock (Note 5) | (10,718) | | | — | | Re-purchase of shares of Common Stock (Note 5) | (10,825) | | | (14,365) | |
| Proceeds from issuance of Common Stock, net of issuance costs | — | | | 2 | | |
| Proceeds from exercise of stock options | Proceeds from exercise of stock options | — | | | 980 | | Proceeds from exercise of stock options | 8 | | | 1,294 | |
| Lease payments | Lease payments | (1,105) | | | (777) | | Lease payments | (5,101) | | | (1,991) | |
| Net cash used in financing activities | (16,098) | | | (27,320) | | |
| Net cash provided by (used in) financing activities | | Net cash provided by (used in) financing activities | 25,402 | | | (99,959) | |
| | Foreign exchange loss on cash, cash equivalents and restricted cash and cash equivalents | 2,214 | | | 478 | | |
| Foreign exchange gain (loss) on cash, cash equivalents and restricted cash and cash equivalents | | Foreign exchange gain (loss) on cash, cash equivalents and restricted cash and cash equivalents | 5,897 | | | (1,996) | |
| | Net (decrease) increase in cash, cash equivalents and restricted cash and cash equivalents | Net (decrease) increase in cash, cash equivalents and restricted cash and cash equivalents | (20,822) | | | 33,697 | | Net (decrease) increase in cash, cash equivalents and restricted cash and cash equivalents | (1,948) | | | 93,429 | |
Cash, cash equivalents and restricted cash and cash equivalents, beginning of period (Note 10) | 133,358 | | | 31,404 | | |
Cash, cash equivalents and restricted cash and cash equivalents, end of period (Note 10) | $ | 112,536 | | | $ | 65,101 | | |
Cash and cash equivalents and restricted cash and cash equivalents, beginning of period (Note 10) | | Cash and cash equivalents and restricted cash and cash equivalents, beginning of period (Note 10) | 133,358 | | | 31,404 | |
Cash and cash equivalents and restricted cash and cash equivalents, end of period (Note 10) | | Cash and cash equivalents and restricted cash and cash equivalents, end of period (Note 10) | $ | 131,410 | | | $ | 124,833 | |
| | Supplemental cash flow disclosures (Note 10) | Supplemental cash flow disclosures (Note 10) | | | | Supplemental cash flow disclosures (Note 10) | | | |
(See notes to the condensed consolidated financial statements)
Gran Tierra Energy Inc.
Condensed Consolidated Statements of Shareholders’ Equity (Unaudited)
(Thousands of U.S. Dollars)
| | | | | Three Months Ended March 31, | | Three Months Ended September 30, | | Nine Months Ended September 30, |
| | | | 2023 | | 2022 | | 2023 | | 2022 | | 2023 | | 2022 |
Share Capital | Share Capital | | | | | Share Capital | | | | |
| Balance, beginning of period | Balance, beginning of period | | $ | 10,272 | | | $ | 10,270 | | Balance, beginning of period | $ | 10,237 | | | $ | 10,272 | | | $ | 10,272 | | | $ | 10,270 | |
| Issuance of common stock (Note 5) | | — | | | 2 | | |
Issuance of shares of Common Stock (Note 5) | | Issuance of shares of Common Stock (Note 5) | — | | | — | | | — | | | 2 | |
| Re-purchase of shares of Common Stock (Note 5) | | Re-purchase of shares of Common Stock (Note 5) | — | | | — | | | (35) | | | — | |
| Balance, end of period | Balance, end of period | | $ | 10,272 | | | $ | 10,272 | | Balance, end of period | $ | 10,237 | | | $ | 10,272 | | | $ | 10,237 | | | $ | 10,272 | |
| | Additional Paid-in Capital | Additional Paid-in Capital | | | | | Additional Paid-in Capital | | | | |
| Balance, beginning of period | Balance, beginning of period | | $ | 1,291,354 | | | $ | 1,287,582 | | Balance, beginning of period | $ | 1,254,449 | | | $ | 1,290,075 | | | $ | 1,291,354 | | | $ | 1,287,582 | |
| | Exercise of stock options | Exercise of stock options | | — | | | 980 | | Exercise of stock options | 3 | | | 9 | | | 8 | | | 1,292 | |
| | Re-purchase of shares of Common Stock (Note 5) | | Re-purchase of shares of Common Stock (Note 5) | — | | | — | | | (38,107) | | | — | |
| Stock-based compensation (Note 5) | Stock-based compensation (Note 5) | | 619 | | | 600 | | Stock-based compensation (Note 5) | 592 | | | 627 | | | 1,789 | | | 1,837 | |
| Balance, end of period | Balance, end of period | | $ | 1,291,973 | | | $ | 1,289,162 | | Balance, end of period | $ | 1,255,044 | | | $ | 1,290,711 | | | $ | 1,255,044 | | | $ | 1,290,711 | |
| | Treasury Stock | Treasury Stock | | | Treasury Stock | |
| Balance, beginning of period | Balance, beginning of period | | $ | (27,317) | | | $ | — | | Balance, beginning of period | $ | — | | | $ | — | | | $ | (27,317) | | | $ | — | |
| Purchase of treasury shares (Note 5) | Purchase of treasury shares (Note 5) | | (10,718) | | | — | | Purchase of treasury shares (Note 5) | — | | | (14,365) | | | (10,825) | | | (14,365) | |
| Cancellation of treasury shares (Note 5) | | Cancellation of treasury shares (Note 5) | — | | | — | | | 38,142 | | | — | |
| Balance, end of period | Balance, end of period | | $ | (38,035) | | | $ | — | | Balance, end of period | $ | — | | | $ | (14,365) | | | $ | — | | | $ | (14,365) | |
| | Deficit | Deficit | | | | | Deficit | | | | |
| Balance, beginning of period | Balance, beginning of period | | $ | (856,743) | | | $ | (995,772) | | Balance, beginning of period | $ | (877,268) | | | $ | (928,681) | | | $ | (856,743) | | | $ | (995,772) | |
| Net (loss) income | | (9,700) | | | 14,119 | | |
| Net income (loss) | | Net income (loss) | 6,527 | | | 38,663 | | | (13,998) | | | 105,754 | |
| Balance, end of period | Balance, end of period | | $ | (866,443) | | | $ | (981,653) | | Balance, end of period | $ | (870,741) | | | $ | (890,018) | | | $ | (870,741) | | | $ | (890,018) | |
| | Total Shareholders’ Equity | Total Shareholders’ Equity | | $ | 397,767 | | | $ | 317,781 | | Total Shareholders’ Equity | $ | 394,540 | | | $ | 396,600 | | | $ | 394,540 | | | $ | 396,600 | |
(1) Reflects our 1-for-10 reverse stock split that became effective May 5, 2023. See Note 5 in the notes to the condensed consolidated financial statements for further discussion.
(See notes to the condensed consolidated financial statements)
Gran Tierra Energy Inc.
Notes to the Condensed Consolidated Financial Statements (Unaudited)
(Expressed in U.S. Dollars, unless otherwise indicated)
1. Description of Business
Gran Tierra Energy Inc. a Delaware corporation (the “Company” or “Gran Tierra”), is a publicly traded company focused on international oil and natural gas exploration and production with assets currently in Colombia and Ecuador.
2. Significant Accounting Policies
These interim unaudited condensed consolidated financial statements have been prepared in accordance with generally accepted accounting principles in the United States of America (“GAAP”). The information furnished herein reflects all normal recurring adjustments that are, in the opinion of management, necessary for the fair presentation of results for the interim periods.
The note disclosure requirements of annual audited consolidated financial statements provide additional disclosures required for interim unaudited condensed consolidated financial statements. Accordingly, these interim unaudited condensed consolidated financial statements should be read in conjunction with the Company’s consolidated financial statements as at and for the year ended December 31, 2022, included in the Company’s 2022 Annual Report on Form 10-K.
The Company’s significant accounting policies are described in Note 2 of the consolidated financial statements, which are included in the Company’s 2022 Annual Report on Form 10-K and are the same policies followed in these interim unaudited condensed consolidated financial statements. The Company has evaluated all subsequent events to the date these interim unaudited condensed consolidated financial statements were issued.
3. Property, Plant and Equipment
| | (Thousands of U.S. Dollars) | (Thousands of U.S. Dollars) | As at March 31, 2023 | | As at December 31, 2022 | (Thousands of U.S. Dollars) | As at September 30, 2023 | | As at December 31, 2022 |
| Oil and natural gas properties | Oil and natural gas properties | | | | Oil and natural gas properties | | | |
| Proved | Proved | $ | 4,702,991 | | | $ | 4,617,804 | | Proved | $ | 4,812,245 | | | $ | 4,617,804 | |
| Unproved | Unproved | 63,454 | | | 74,471 | | Unproved | 70,253 | | | 74,471 | |
| | | 4,766,445 | | | 4,692,275 | | | 4,882,498 | | | 4,692,275 | |
Other(1) | Other(1) | 59,180 | | | 61,386 | | Other(1) | 68,954 | | | 61,386 | |
| | 4,825,625 | | | 4,753,661 | | | 4,951,452 | | | 4,753,661 | |
| Accumulated depletion, depreciation and impairment | Accumulated depletion, depreciation and impairment | (3,700,502) | | | (3,652,759) | | Accumulated depletion, depreciation and impairment | (3,810,497) | | | (3,652,759) | |
| | $ | 1,125,123 | | | $ | 1,100,902 | | | $ | 1,140,955 | | | $ | 1,100,902 | |
(1) The “other” category includes right-of-use assets for operating and finance leases of $38.3$47.9 million, which had a net book value of $24.0$29.3 million as at March 31,September 30, 2023 (December 31, 2022 - $38.9 million, which had a net book value of $24.6 million).
On April 11, 2023, the Company and Ecopetrol S.A. renegotiated the terms of the contract for Company’s operatorship of the Suroriente Block ("Suroriente") which was previously scheduled to end in mid-2024. The duration of the contract was extended for 20 years from September 1, 2023 (the “Effective Date”), the date on which the Company satisfied the relevant conditions precedent and regulatory approval was received. The Company continues to be the operator of Suroriente. In connection with the contract extension, the Company paid cash consideration of $6.2 million and provided letters of credit of $123.0 million (Note 8) related to committed capital investments to be made over a three-year period from the Effective Date.
For the three and nine months ended March 31,September 30, 2023 and 2022, respectively, the Company had no ceiling test impairment losses. The Company used a 12-month unweighted average of the first-day-of the month Brent price prior to the ending date of the periods March 31,September 30, 2023, and 2022 of $95.99$83.86 and $77.41$94.85 per bbl, respectively, for the purpose of the ceiling test calculations.
4. Debt and Debt Issuance Costs
The Company’s debt as at March 31,September 30, 2023, and December 31, 2022, was as follows:
| | | | | | | | | | | |
| (Thousands of U.S. Dollars) | As at March 31, 2023 | | As at December 31, 2022 |
| | | |
| | | |
| | | |
| | | |
| | | |
| Long-Term | | | |
| 6.25% Senior Notes, due February 2025 | $ | 271,909 | | | $ | 279,909 | |
| 7.75% Senior Notes, due May 2027 | 300,000 | | | 300,000 | |
| | | |
| Unamortized debt issuance costs | (11,651) | | | (10,992) | |
| 560,258 | | | 568,917 | |
Long-term lease obligation(1) | 21,133 | | | 20,676 | |
| | | |
| Total debt | $ | 581,391 | | | $ | 589,593 | |
| | | | | | | | | | | |
| (Thousands of U.S. Dollars) | As at September 30, 2023 | | As at December 31, 2022 |
| Current | | | |
| Credit facility | $ | 50,000 | | | $ | — | |
| Unamortized debt issuance costs | (933) | | | — | |
| $ | 49,067 | | | $ | — | |
| | | |
| Long-Term | | | |
| 6.25% Senior Notes, due February 2025 (“6.25% Senior Notes”) | $ | 271,909 | | | $ | 279,909 | |
| 7.75% Senior Notes, due May 2027 (“7.75% Senior Notes”) | 300,000 | | | 300,000 | |
Unamortized debt issuance costs (1) | (8,334) | | | (10,992) | |
| 563,575 | | | 568,917 | |
Long-term lease obligation(2) | 23,869 | | | 20,676 | |
| $ | 587,444 | | | $ | 589,593 | |
| Total Debt | $ | 636,511 | | | $ | 589,593 | |
(1) As atDecember 31, 2022, the amount of deferred financing fees included $0.3 million related to the credit facility.
(2)The current portion of the lease obligation has been included in accounts payable and accrued liabilities on the Company’s balance sheet and totaled $4.8$10.0 million as at March 31,September 30, 2023 (December 31, 2022 - $4.8 million).
As of March 31,During the three months ended September 30, 2023, the Company, had aas guarantor, and Gran Tierra Energy Colombia GmbH and and Gran Tierra Operations Colombia GmbH, as borrowers, amended and restated their credit facility with a market lenderleader in the global commodities industry. As part of the restatement, the initial commitment was adjusted from $100 million to $50 million (maintaining the potential option of up to additional $50 million, subject to approval by the lender). Additionally, the availability period for the draws under the amendment to the credit facility was extended until December 31, 2023. The credit facility has a borrowing base of upcontinues to $150 million, with $100 million as an initial commitment available at March 31, 2023, and an option for an additional $50 million upon mutual agreement by the Company and the lender. The credit facility bearsbear interest based on the secured overnight financing rate posted by the Federal Reserve Bank of New York plus a credit margin of 6.00% and a credit-adjusted spread of 0.26%. Undrawn amounts under the credit facility bear interest at 2.10% per annum, based on the amount available. The credit facility is secured by the Company’s Colombian assets and economic rights. Itrights and has a final maturity date of August 15, 2024, which may be extended to February 18, 2025, upon2024. During the satisfaction of certain conditions. The availability period for the draws underthree months ended September 30, 2023, the credit facility expires on August 20, 2023. As of March 31, 2023, and December 31, 2022, the credit facility remained undrawn.was drawn by $50 million.
Under the terms of the credit facility, the Company is required to maintain compliance with the following financial covenants:
i.Global Coverage Ratio of at least 150%, calculated using the net present value of the consolidated future cash flows of the Company up to the final maturity date discounted at 10% over the outstanding amount on the credit facility at each reporting period. The net present value of the consolidated future cash flows of the Company is required to be based on 80% of the prevailing ICE Brent forward strip.
ii.Prepayment Life Coverage Ratio of at least 150%, calculated using the estimated aggregate value of commodities to be delivered under the commercial contract from the commencement date to the final maturity date based on 80% of the prevailing ICE Brent forward strip and adjusted for quality and transportation discounts over the outstanding amount on the credit facility including interest and all other costs payable to the lender.
i.iii.Liquidity ratio where the Company’s projected sources of cash exceed projected uses of cash by at least 1.15 times in each quarter period included in one year consolidated future cash flows. The future cash flows represent forecasted expected cash flows from operations, less anticipated capital expenditures, and certain other adjustments. The commodity pricing assumption used in this covenant is required to be 90% of the prevailing ICE Brent forward strip for the projected future cash flows.
As of September 30, 2023, the Company was in compliance with all the above covenants.
Senior Notes
During the threenine months ended March 31,September 30, 2023, the Company re-purchasedpurchased in the open market $8.0 million of 6.25% Senior Notes for cash consideration of $6.8 million, of which $2.6 million was included in accounts payable on the Company’s balance sheet as of March 31, 2023.million. The re-purchasepurchase resulted in a $1.1 million gain, which included the write-off of
deferred financing fees of $0.1 million. The re-purchasedpurchase gain was recorded in “other gain” in the Company’s condensed consolidated statements of operations. Subsequent to the quarter, the Company cancelled all previously purchased 6.25% Senior Notes. No notes were purchased during the three months ended September 30, 2023.
Subsequent to the quarter, the Company completed exchange offers of $247.1 million of 6.25% Senior Notes were not canceled and held by$275.8 million of 7.75% Senior Notes (together with 6.25% Senior Notes, the “Senior Notes”) for $487.6 million newly issued 9.50% Senior Secured Notes due 2029. The exchange consideration for $242.5 million of 6.25% Senior Notes included early participation premium of $80 for each $1,000 aggregate principal amount with the remainder of $4.6 million exchanged at $1,000 and for $274.2 million of 7.75% Senior Notes early participation premium of $20 for each $1,000 aggregate principal amount with remainder of $1.6 million of 7.75% Senior Notes exchanged at $950 for each $1,000 aggregate principal amount. In addition, the Company paid cash consideration of $60.0 million for 6.25% Senior Notes exchanged as part of total consideration to eligible holders on a pro rata basis, for each $1,000 aggregate principal amount tendered and accepted for the early exchange deadline. The settlement date of the exchange offer was on October 20, 2023. The Senior Notes tendered and accepted for exchange, as well as the notes held as treasury bonds, as of March 31, 2023.were cancelled.
Interest Expense
The following table presents the total interest expense recognized in the accompanying interim unaudited condensed consolidated statements of operations:
| | | | Three Months Ended March 31, | | Three Months Ended September 30, | | Nine Months Ended September 30, |
| (Thousands of U.S. Dollars) | (Thousands of U.S. Dollars) | | 2023 | 2022 | (Thousands of U.S. Dollars) | 2023 | | 2022 | | 2023 | 2022 |
| Contractual interest and other financing expenses | Contractual interest and other financing expenses | | $ | 11,055 | | $ | 11,241 | | Contractual interest and other financing expenses | $ | 11,909 | | | $ | 10,670 | | | $ | 34,623 | | $ | 32,974 | |
| Amortization of debt issuance costs | Amortization of debt issuance costs | | 781 | | 887 | | Amortization of debt issuance costs | 1,594 | | | 751 | | | 3,394 | | 2,769 | |
| | | $ | 11,836 | | $ | 12,128 | | | $ | 13,503 | | | $ | 11,421 | | | $ | 38,017 | | $ | 35,743 | |
5. Share Capital
| | | | | |
| Shares of Common Stock |
Shares issued at December 31, 2022 and March 31, 2023 | 368,898,61936,889,862 | |
| Shares re-purchased | (2,274,746) | |
| Shares outstanding at December 31, 2022 | 346,151,157 34,615,116 | |
Treasury stockShares issued on option exercise | (13,082,115)1,839 | |
| Shares re-purchased | (1,328,650) | |
Shares issued and outstanding at March 31,September 30, 2023 | 333,069,04233,288,305 | |
On May 5, 2023, the Company completed a 1-for-10 reverse stock split of the Company’s common stock. As a result of the reverse stock split, every ten of the Company’s issued shares of Common Stock were automatically combined into one issued share of Common Stock, without any change to the par value per share. All share and per share numbers have been adjusted to reflect the reverse stock split. The Company’s outstanding options were also proportionately adjusted as a result of the reverse stock split to increase the exercise price and reduce the number of shares issuable upon exercise.
During the year ended December 31, 2022, the Company implemented a share re-purchase program (the “2022 Program”) through the facilities of the Toronto Stock Exchange (“TSX”) and eligible alternative trading platforms in Canada. Under the 2022 Program, the Company iswas able to purchase at prevailing market prices up to 36,033,9693,603,396 shares of Common Stock, representing approximately 10% of the issued and outstanding shares of Common Stock as of August 22, 2022. The 2022 Program will expire on August 31, 2023, or earlier if the 10% share maximum is reached. Re-purchases are subject to the availability of stock, prevailing market conditions, the trading price of the Company’s stock, the Company’s financial performance and other conditions.
During the three and nine months ended March 31,September 30, 2023, the Company re-purchased 13,082,115nil and 1,328,650 shares at a weighted average price of $0.82nil and $8.15 per share, respectively (three and nine months ended March 31,September 30, 2022 - nil)1,073,370 shares). The re-purchasedAs of September 30, 2023, all 3,603,396 shares were held by the Company and recorded as treasury stock. As of March 31,stock were canceled. The 2022 Program expired in May 2023 the Company held 35,829,577 treasury stock shares (December 31, 2022 - 22,747,462).when 10% share maximum was reached.
Equity Compensation Awards
The following table provides information about performance stock units (“PSUs”), deferred share units (“DSUs”), and stock option activity for the threenine months ended March 31,September 30, 2023:
| | | | | | | | | | | | | | | | | |
| PSUs | DSUs | | Stock Options |
| Number of Outstanding Share Units | Number of Outstanding Share Units | | Number of Outstanding Stock Options | Weighted Average Exercise Price/Stock Option ($) |
| Balance, December 31, 2022 | 31,528,233 | | 6,561,859 | | | 17,302,860 | | 1.15 | |
| Granted | 14,614,248 | | 220,124 | | | 4,010,289 | | 0.86 | |
| Exercised | (15,234,082) | | — | | | — | | — | |
| Forfeited | (30,448) | | — | | | (13,799) | | 1.01 | |
| Expired | — | | — | | | (1,267,481) | | 2.47 | |
| Balance, March 31, 2023 | 30,877,951 | | 6,781,983 | | | 20,031,869 | | 1.01 | |
| | | | | | | | | | | | | | | | | |
| PSUs | DSUs | | Stock Options |
| Number of Outstanding Share Units | Number of Outstanding Share Units | | Number of Outstanding Stock Options | Weighted Average Exercise Price/Stock Option ($) |
| Balance, December 31, 2022 | 3,152,823 | | 656,186 | | | 1,730,286 | | 11.52 | |
| Granted | 1,504,546 | | 89,643 | | | 409,435 | | 8.58 | |
| Exercised | (1,523,408) | | — | | | (1,839) | | 4.17 | |
| Forfeited | (21,574) | | — | | | (22,336) | | 5.79 | |
| Expired | — | | — | | | (133,880) | | 25.15 | |
| Balance, September 30, 2023 | 3,112,387 | | 745,829 | | | 1,981,666 | | 10.06 | |
For the three and nine months ended March 31,September 30, 2023, there was $1.9 million and $3.7 million of stock-based compensation expense, respectively. For the three and nine months ended September 30, 2022, there was $1.5$0.2 million of stock-based compensation recovery and $4.6$6.4 million of stock-based compensation expense, respectively.
At March 31,As at September 30, 2023, there was $19.5$11.4 million (December 31, 2022 - $10.5 million) of unrecognized compensation costs related to unvested PSUs and stock options, which are expected to be recognized over a weighted-average period of 2.11.8 years. During the threenine months ended March 31,September 30, 2023, the Company paid out $15.1 million for PSUs vested on December 31, 2022 (three(nine months ended March 31,September 30, 2022 - $2.4 million for PSUs vested on December 31, 2021).
Net Income (Loss) Income per Share
Basic net lossincome or incomeloss per share is calculated by dividing net lossincome or incomeloss attributable to common shareholders by the weighted average number of shares of common stockCommon Stock issued and outstanding during each period.
Diluted net lossincome or incomeloss per share is calculated using the treasury stock method for share-based compensation arrangements. The treasury stock method assumes that any proceeds obtained on the exercise of share-based compensation arrangements would be used to purchase common shares of Common Stock at the average market price during the period. The weighted average number of shares is then adjusted by the difference between the number of shares issued from the exercise of share-based compensation arrangements and shares re-purchased from the related proceeds. Anti-dilutive shares represent potentially dilutive securities excluded from the computation of diluted lossincome or incomeloss per share as their impact would be anti-dilutive.
Weighted Average Shares Outstanding
| | | | | Three Months Ended March 31, | | Three Months Ended September 30, | | Nine Months Ended September 30, |
| | | | 2023 | 2022 | | 2023 | 2022 | | 2023 | 2022 |
| Weighted average number of common shares outstanding | | 344,513,998 | | 367,386,664 | |
| Weighted average number of shares of Common Stock outstanding | | Weighted average number of shares of Common Stock outstanding | 33,287,368 | | 36,730,543 | | | 33,675,160 | | 36,775,419 |
| Shares issuable pursuant to stock options | Shares issuable pursuant to stock options | | — | | 12,950,523 | Shares issuable pursuant to stock options | 129,299 | | 1,133,014 | | | — | | 1,202,431 |
| Shares assumed to be purchased from proceeds of stock options | Shares assumed to be purchased from proceeds of stock options | | — | | (7,961,942) | Shares assumed to be purchased from proceeds of stock options | (66,617) | | (732,483) | | | — | | (739,060) |
| Weighted average number of diluted common shares outstanding | | 344,513,998 | | 372,375,245 | |
| Weighted average number of diluted shares of Common Stock outstanding | | Weighted average number of diluted shares of Common Stock outstanding | 33,350,050 | | 37,131,074 | | | 33,675,160 | | 37,238,790 |
For the three and nine months ended March 31,September 30, 2023, 1,854,307 of options and 2022,all options, respectively, on a weighted average basis all(three and nine months ended September 30, 2022, 616,167 and 586,388 options, and 5,331,160 options, respectively,respectively), were excluded from the diluted income (loss) income per share calculation as the options were anti-dilutive.
6. Revenue
The Company’s revenues are generated from oil sales at prices that reflect the blended prices received upon shipment by the purchaser at defined sales points or defined by contract relative to ICE Brent and adjusted for Vasconia Oriente or Castilla (Colombia sales) or Oriente (Ecuador sales) crude differentials, quality and transportation discounts and premiums each month. For the three and nine months ended March 31,September 30, 2023, 100% (three months ended March 31, 2022 - 100%) of the Company’s revenue resulted from oil sales.sales (three and nine months ended September 30, 2022 - 100%). During the three and nine months ended March 31,September 30, 2023, quality and
transportation discounts were 22%14% and 18% of the average ICE Brent price (three and nine months ended March 31,September 30, 2022 - 14% and 13%)., respectively.
During the three months ended March 31,September 30, 2023, the Company’s production was sold primarily to one major customer in Colombia, representing 96% of the total sales volumes (three months ended September 30, 2022 - one major customer, representing 99% of the total sales volumes).
During the nine months ended September 30, 2023, the Company’s production was sold primarily to one major customer in Colombia, representing 97% of the total sales volumes (three(nine months ended March 31,September 30, 2022 - two major customers, representing 57%71% and 43%29% of the total sales volumes).
As at March 31,September 30, 2023, accounts receivable included $3.2 millionnil of accrued sales revenue related to MarchSeptember 2023 production (December 31, 2022 - nil related to December 2022 production).
7. Taxes
The Company'sCompany’s effective tax rate was 142%115% for the threenine months ended March 31,September 30, 2023, compared to 74%49% in the comparative period of 2022. The increase was primarily due to an increase in non-deductible foreign exchange adjustments and non-deductible third-party royalty in Colombia. These were partially offset by a decrease in valuation allowance.
Current income tax expense was $17.6$63.7 million for the threenine months ended March 31,September 30, 2023, compared to $20.8$63.1 million in the corresponding period of 2022, primarily due to a decrease in taxable income.income in Colombia, which is subject to a higher Colombian tax rate.
The deferred income tax expense for the threenine months ended March 31,September 30, 2023, was $15.3$43.2 million compared to $36.9 million in the corresponding period of 2022. In both cases, this can be primarily attributed to higher tax depreciation compared to accounting depreciation and the utilization of tax losses to offset taxable income in Colombia.
For the nine months ended September 30, 2022, the deferred income tax expense was mainly the result of tax depreciation being higher than accounting depreciation and the use of tax losses to offset taxable income in Colombia. The deferred income tax expense in the comparative period of 20222021 was $18.7 million asalso the result of tax depreciation being higher compared to accounting depreciation and the use of tax losses to offset taxable income in Colombia.
For the threenine months ended March 31,September 30, 2023, the difference between the effective tax rate of 142%115% and the 50% Colombian tax rate was primarily due to an increase in non-deductible foreign translationexchange adjustments, the impact of foreign taxes, non-deductible royaltyroyalties in Colombia and increase in the valuation allowance.non-deductible stock-based compensation. These were partially offset by other permanent differences.a decrease in valuation allowance.
For the threenine months ended March 31,September 30, 2022, the difference between the effective tax rate of 74%49% and the 35% Colombian tax rate was primarily due to an increase in the impact of foreign taxes, foreign translation adjustments, increase in the valuation allowance, non-deductible third-party royalties in Colombia, other permanent differences, and non-deductible stock-based compensation.compensation which were partially offset by a decrease in foreign currency translation.
8. Contingencies
Legal Proceedings
Gran Tierra has several lawsuits and claims pending. The outcome of the lawsuits and disputes cannot be predicted with certainty; Gran Tierra believes the resolution of these matters would not have a material adverse effect on the Company’s consolidated financial position, results of operations, or cash flows. Gran Tierra records costs as they are incurred or become probable and determinable.
Letters of credit and other credit support
At March 31,September 30, 2023, the Company had provided letters of credit and other credit support totaling $109.6$220.1 million (December 31, 2022 - $111.1 million) as security relating to work commitment guarantees in Colombia and Ecuador contained in exploration contracts, the Suroriente Block (Note 3), and other capital or operating requirements.
9. Financial Instruments and Fair Value Measurement
Financial Instruments
Financial instruments are initially recorded at fair value, defined as the price that would be received to sell an asset or paid to market participants to settle liability at the measurement date. For financial instruments carried at fair value, GAAP establishes a fair value hierarchy that prioritizes the inputs to valuation techniques used to measure fair value. This hierarchy consists of three broad levels:
•Level 1 - Inputs representing quoted market prices in active markets for identical assets and liabilities
•Level 2 - Inputs other than quoted prices included within Level 1 that are observable for the assets and liabilities, either directly or indirectly
•Level 3 - Unobservable inputs for assets and liabilities
At March 31,September 30, 2023, the Company’s financial instruments recognized on the balance sheet consist of cash and cash equivalents, restricted cash and cash equivalents, accounts receivable, other current assets, other long-term assets, accounts payable and accrued liabilities, other short-term payables,credit facility, long-term debt short-term and long-term equity compensation reward liability and other long-term liabilities. The Company uses appropriate valuation techniques based on the available information to measure the fair values of assets and liabilities.
Fair Value Measurement
The following table presents the Company’s fair value measurements of its financial instruments as of March 31,September 30, 2023, and December 31, 2022:
| | | As at March 31, 2023 | | As at December 31, 2022 | | | | | | | | | | |
| (Thousands of U.S. Dollars) | (Thousands of U.S. Dollars) | | (Thousands of U.S. Dollars) | As at September 30, 2023 | | As at December 31, 2022 |
| Level 1 | Level 1 | | Level 1 | |
| Assets | Assets | | Assets | |
PEF - current (2) | $ | 8,874 | | | $ | 5,981 | | |
PEF - long-term(1) | — | | | 9,975 | | |
Prepaid equity forward (“PEF”) - current (1) | | Prepaid equity forward (“PEF”) - current (1) | $ | 6,973 | | | $ | 5,981 | |
PEF - long-term(2) | | PEF - long-term(2) | — | | | 9,975 | |
| | $ | 8,874 | | | $ | 15,956 | | | $ | 6,973 | | | $ | 15,956 | |
| | Liabilities | Liabilities | | Liabilities | |
DSUs liability - long-term(3) | $ | 5,962 | | | $ | 6,496 | | |
| 6.25% Senior Notes | 6.25% Senior Notes | 233,645 | | | 243,801 | | 6.25% Senior Notes | $ | 255,594 | | | $ | 243,801 | |
| 7.75% Senior Notes | 7.75% Senior Notes | 235,500 | | 241,455 | | 7.75% Senior Notes | 257,145 | | | 241,455 | |
| | $ | 475,107 | | | $ | 491,752 | | | $ | 512,739 | | | $ | 485,256 | |
| Level 2 | Level 2 | | Level 2 | |
| Assets | Assets | | Assets | |
| Restricted cash and cash equivalents - long-term(1) | 5,710 | | | 5,344 | | |
| $ | 5,710 | | | $ | 5,344 | | |
| Liabilities | | |
Restricted cash and cash equivalents - long-term(2) | | Restricted cash and cash equivalents - long-term(2) | $ | 7,052 | | | $ | 5,343 | |
| | PSUs liability - current | 8,011 | | 15,082 | |
PSUs liability - long-term(3) | 2,630 | | | 9,941 | | |
| | $ | 10,641 | | | $ | 25,023 | | |
| |
(1) The current portion of PEF is included in the other current assets on the Company’s condensed consolidated balance sheet
(2) The long-term portion of restricted cash and PEF is included in the other long-term assets on the Company’s balance sheet
(2) The current portion of PEF is included in the other current assets on the Company’s balance sheet
(3) Long-term DSUs and PSUs liabilities are included in the long-term equity compensation award liability on the Company’scondensed consolidated balance sheet
The fair values of cash and cash equivalents, current restricted cash and cash equivalents, accounts receivable, accounts payable and accrued liabilities and credit facility approximate their carrying amounts due to the short-term maturity of these instruments.
.
Restricted cash - long-term
The fair value of long-term restricted cash and cash equivalents approximated their carrying value because interest rates are variable and reflective of market rates.
Prepaid Equity Forward (“PEF”)
To reduce the Company’s exposure to changes in the trading price of the Company’s common shares of Common Stock on outstanding PSUs and DSUs, the Company entered into a PEF. At the end of the term, the counterparty will pay the Company an amount equivalent to the notional amount of the shares using the price of the Company’s common shares of Common Stock at the valuation date. The Company has the discretion to increase or decrease the notional amount of the PEF or terminate the agreement early. As at March 31,September 30, 2023, the Company’s PEF had a notional amount of 101.0 million shares with a fair value of $8.9$7.0 million (As at December 31, 2022 - 161.6 million shares with a fair value of $16.0 million). During the three and nine months ended March 31,September 30, 2023, the Company recorded a $1.7$2.2 million gain and $3.6 million loss, respectively, on the PEF in general and administrative expenses (three and nine months ended March 31, 2022- $7.8September 30, 2022 - $2.6 million gain)and $5.3 million gain, respectively). The
fair value of the PEF asset was estimated using the Company’s share price quoted in active markets at the end of each reporting period.
DSUs liability
The fair value of DSUs liability was estimated using the Company’s share price quoted in active markets at the end of each reporting period.
PSUs liability
The fair value of the PSUs liability was estimated based on a pricing model using inputs such as Company’s share price and PSUs performance factor.
Senior Notes
Financial instruments not recorded at fair value at March 31,September 30, 2023, were the Senior Notes (Note 4).
At March 31,September 30, 2023, the carrying amounts of the 6.25% Senior Notes and the 7.75% Senior Notes were $268.5$269.4 million and $293.6$294.2 million, respectively, which represented the aggregate principal amount less unamortized debt issuance costs, and the fair values were $233.6$255.6 million and $235.5$257.1 million, respectively.
During the three and nine months ended March 31,September 30, 2023, the Company did not have any derivative instruments and consequently did not incur any gains orand losses related to derivativesderivative instruments (three and nine months ended March 31,September 30, 2022 - $21.4nil and $26.6 million loss related to commodity price derivatives).
10. Supplemental Cash Flow Information
The following table provides a reconciliation of cash and cash equivalents and restricted cash and cash equivalents shown as a sum of these amounts in the interim unaudited condensed consolidated statements of cash flows:
| | | As at March 31, | | As at December 31, | | As at September 30, | | As at December 31, |
| (Thousands of U.S. Dollars) | (Thousands of U.S. Dollars) | 2023 | 2022 | | 2022 | 2021 | (Thousands of U.S. Dollars) | 2023 | 2022 | | 2022 | 2021 |
| Cash and cash equivalents | Cash and cash equivalents | $ | 105,684 | | $ | 58,707 | | | $ | 126,873 | | $ | 26,109 | | Cash and cash equivalents | $ | 123,216 | | $ | 118,173 | | | $ | 126,873 | | $ | 26,109 | |
| Restricted cash and cash equivalents - current | Restricted cash and cash equivalents - current | 1,142 | | 1,142 | | | 1,142 | | 392 | | Restricted cash and cash equivalents - current | 1,142 | | 1,142 | | | 1,142 | | 392 | |
Restricted cash and cash equivalents - long-term (1) | Restricted cash and cash equivalents - long-term (1) | 5,710 | | 5,252 | | | 5,343 | | 4,903 | | Restricted cash and cash equivalents - long-term (1) | 7,052 | | 5,518 | | | 5,343 | | 4,903 | |
| | $ | 112,536 | | $ | 65,101 | | | $ | 133,358 | | $ | 31,404 | | | $ | 131,410 | | $ | 124,833 | | | $ | 133,358 | | $ | 31,404 | |
(1) Included in other long-term assets on the Company’s condensed consolidated balance sheet
Net changes in assets and liabilities from operating activities were as follows:
| | | Three Months Ended March 31, | | Nine Months Ended September 30, |
| (Thousands of U.S. Dollars) | (Thousands of U.S. Dollars) | 2023 | | 2022 | (Thousands of U.S. Dollars) | 2023 | | 2022 |
| Accounts receivable and other long-term assets | Accounts receivable and other long-term assets | $ | (3,022) | | | $ | (10,150) | | Accounts receivable and other long-term assets | $ | (8,484) | | | $ | 2,811 | |
| Derivatives | Derivatives | — | | | 3,276 | | Derivatives | — | | | (2,757) | |
| Prepaid Equity Forward | 7,806 | | | (10,982) | | |
| PEF | | PEF | 9,664 | | | (13,837) | |
| | Prepaids & Inventory | Prepaids & Inventory | 740 | | | (159) | | Prepaids & Inventory | (6,809) | | | (6,025) | |
| Accounts payable and accrued and other long-term liabilities | Accounts payable and accrued and other long-term liabilities | (17,252) | | | 12,021 | | Accounts payable and accrued and other long-term liabilities | (3,040) | | | 37,862 | |
| Taxes receivable and payable | Taxes receivable and payable | 965 | | | 22,514 | | Taxes receivable and payable | (25,566) | | | 54,784 | |
| Net changes in assets and liabilities from operating activities | Net changes in assets and liabilities from operating activities | $ | (10,763) | | | $ | 16,520 | | Net changes in assets and liabilities from operating activities | $ | (34,235) | | | $ | 72,838 | |
Changes in non-cash investing working capital for the threenine months ended March 31,September 30, 2023, were comprised of a decrease in accounts payable and accrued liabilities of $11.0 million and an increase in accounts receivable of $0.1 million (nine months ended September 30, 2022, an increase in accounts payable and accrued liabilities of $14.9 million (three months ended March 31, 2022, a decrease in accounts payable and accrued liabilities of $1.7$3.7 million and an increase in accounts receivable of $0.1$0.4 million).
The following table provides additional supplemental cash flow disclosures: | | | Three Months Ended March 31, | | Nine Months Ended September 30, |
| (Thousands of U.S. Dollars) | (Thousands of U.S. Dollars) | 2023 | | 2022 | (Thousands of U.S. Dollars) | 2023 | | 2022 |
| Cash paid for income taxes | $ | 8,461 | | | $ | 9,703 | | |
| Cash paid for income taxes including withholding tax | | Cash paid for income taxes including withholding tax | $ | 85,203 | | | $ | 29,881 | |
| Cash paid for interest | Cash paid for interest | $ | 8,781 | | | $ | 10,042 | | Cash paid for interest | $ | 29,446 | | | $ | 31,455 | |
| | Non-cash investing activities: | Non-cash investing activities: | | Non-cash investing activities: | |
| Net liabilities related to property, plant and equipment, end of period | Net liabilities related to property, plant and equipment, end of period | $ | 69,989 | | | $ | 28,339 | | Net liabilities related to property, plant and equipment, end of period | $ | 44,067 | | | $ | 33,397 | |
Item 2. Management’s Discussion and Analysis of Financial Condition and Results of Operations
The following discussion of our financial condition and results of operations should be read in conjunction with the “Financial Statements” as set out in Part I, Item 1 of this Quarterly Report on Form 10-Q, as well as the “Financial Statements and Supplementary Data” and “Management’s Discussion and Analysis of Financial Condition and Results of Operations” included in Part II, Items 7 and 8, respectively, of our 2022 Annual Report on Form 10-K. Please see the cautionary language at the beginning of this Quarterly Report on Form 10-Q regarding the identification of and risks relating to forward-looking statements and the risk factors described in Part II, Item 1A “Risk Factors” of this Quarterly Report on Form 10-Q, as well as Part I, Item 1A “Risk Factors” in our 2022 Annual Report on Form 10-K. On May 5, 2023, the Company completed 1-for-10 reverse stock split of the Company’s Common Stock. As a result of the reverse stock split, every ten of the Company’s issued shares of Common Stock were automatically combined into one issued share of Common Stock. All share and per share data included in this quarterly report have been retroactively adjusted to reflect the reverse stock split.
Financial and Operational Highlights
Key Highlights for the firstthird quarter of 2023
•Net lossincome in the firstthird quarter of 2023 was $9.7$6.5 million or $(0.03)$0.20 per share basic and diluted, compared to a net income of $14.1$38.7 million or $0.04$1.05 per share basic and $1.04 per share diluted in the firstthird quarter of 2022
•Income before income taxes in the firstthird quarter of 2023 was $23.2$46.9 million, compared to an income before income taxes of $53.7$60.4 million in the firstthird quarter of 2022
•DuringAdjusted EBITDA(2) increased to $119.2 million, compared to $116.1 million in the firstthird quarter of 2023, we re-purchased $8.02022 and increased from $97.3 million of 6.25% Senior Notes for a cash consideration of $6.8 million and re-purchased 13,082,115 of our common shares at a weighted average price of $0.82 per sharein the prior quarter
•Funds flow from operations(2) decreased by 31%16% to $60.0$79.0 million, compared to the firstthird quarter of 2022 primarily due to a 16% decreaseand increased by 49% from $53.1 million in Brent price, an 18% increase in operating costs, and an 8% increase in transportation expenses which were offset by an 11% higher sales volumes. Compared to the prior quarter funds flow decreased by 26%, primarily due to a 7% decrease in Brent price, a 2% decrease in sales volumes, 26% higher transportation costs and offset by a 10% decrease in operating costs
•NAR production for the firstthird quarter of 2023 increased by 14% to 26,776 BOPD, compared to 23,472 BOPD in the third quarter of 2022 and decreased by 2% from the prior quarter
•Sales volumes for the third quarter of 2023 increased by 12% to 25,526 BOPD, compared to 22,833 BOPD in the first quarter of 2022 and was comparable to the fourth quarter of 2022
•Sales volumes for the first quarter of 2023 increased by 11% to 25,17126,396 BOPD, compared to 22,73023,516 BOPD in the firstthird quarter of 2022 and decreased by 3%2% from the fourthprior quarter of 2022
•Oil sales for the third quarter of 2023 were $144.2$179.9 million, 17% lower7% higher compared to the firstthird quarter of 2022, mainlyprimarily due to a 16% decreaselower quality and transportation discounts and utilization of marketing arrangements which used Brent monthly average of the month of delivery (“M pricing”) during the current quarter compared to utilization of Brent monthly average following the month of deliveries (“M+1” pricing) which negatively impacted revenues in Brent price.the third quarter of 2022. Oil sales decreasedincreased by 11% compared to $162.614% from $157.9 million in the fourthsecond quarter of 20222023 primarily due to a 7% decreasean 11% increase in Brent priceprices and a 2%lower quality and transportation discounts, offset by 3% lower sales volumes
•Operating expenses increased by 18% to $41.4$49.4 million or by $1.19$0.99 per bbl to $18.26$20.33 per bbl when compared to the firstthird quarter of 2022, primarily as a result of higher lifting costs attributed to Ecuador.offset by lower workover activities. Operating expenses decreased by 10%increased from $48.5 million or $1.27$19.54 per bbl from $46.1 million or $19.53 per bbl when compared toin the fourthprior quarter, of 2022, primarily due to lower workover activitiesfor the same reason mentioned above
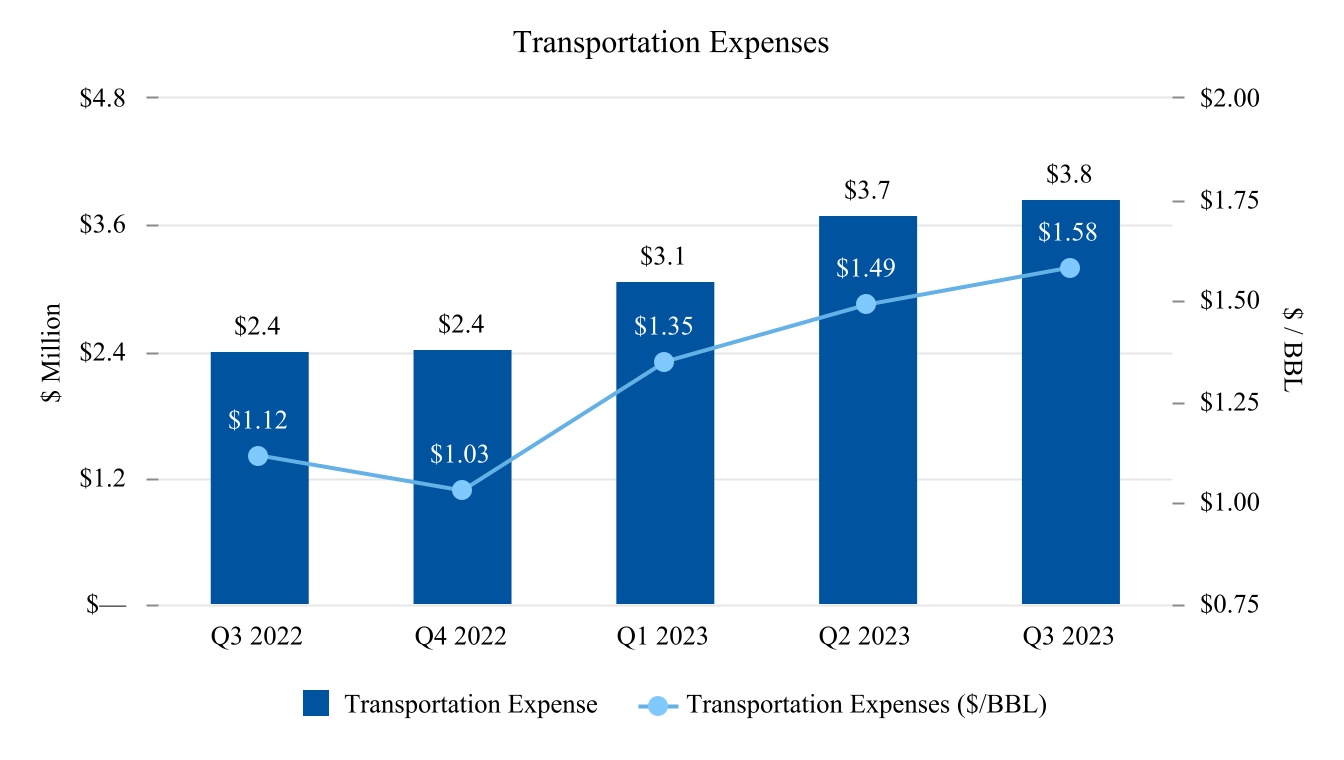
•Transportation expenses per bbl decreasedincreased by 3%$0.46 when compared to the third quarter of 2022, due to higher transportation tariffs affecting Acordionero sales, utilization of new transportation routes for new exploration wells in Colombia and Ecuador and increased by $0.09 from the firstsecond quarter of 2023 due to higher sales volumes when compared totrucking costs resulting from utilization longer distance delivery points and depreciation of U.S. dollar against the first quarter of 2022 and increased 31% from the fourth quarter of 2022 due to Ecuador salesColombian peso
•Operating netback(2) decreasedincreased to $99.8$126.7 million compared to $136.8$124.1 million in the firstthird quarter of 2022 and decreasedincreased from $114.1$105.7 million in the fourthprior quarter of 2022
•Adjusted EBITDA(2) decreased to $88.7 million compared to $119.4 million in the first quarter of 2022 and decreased from $108.8 million in the fourth quarter of 2022
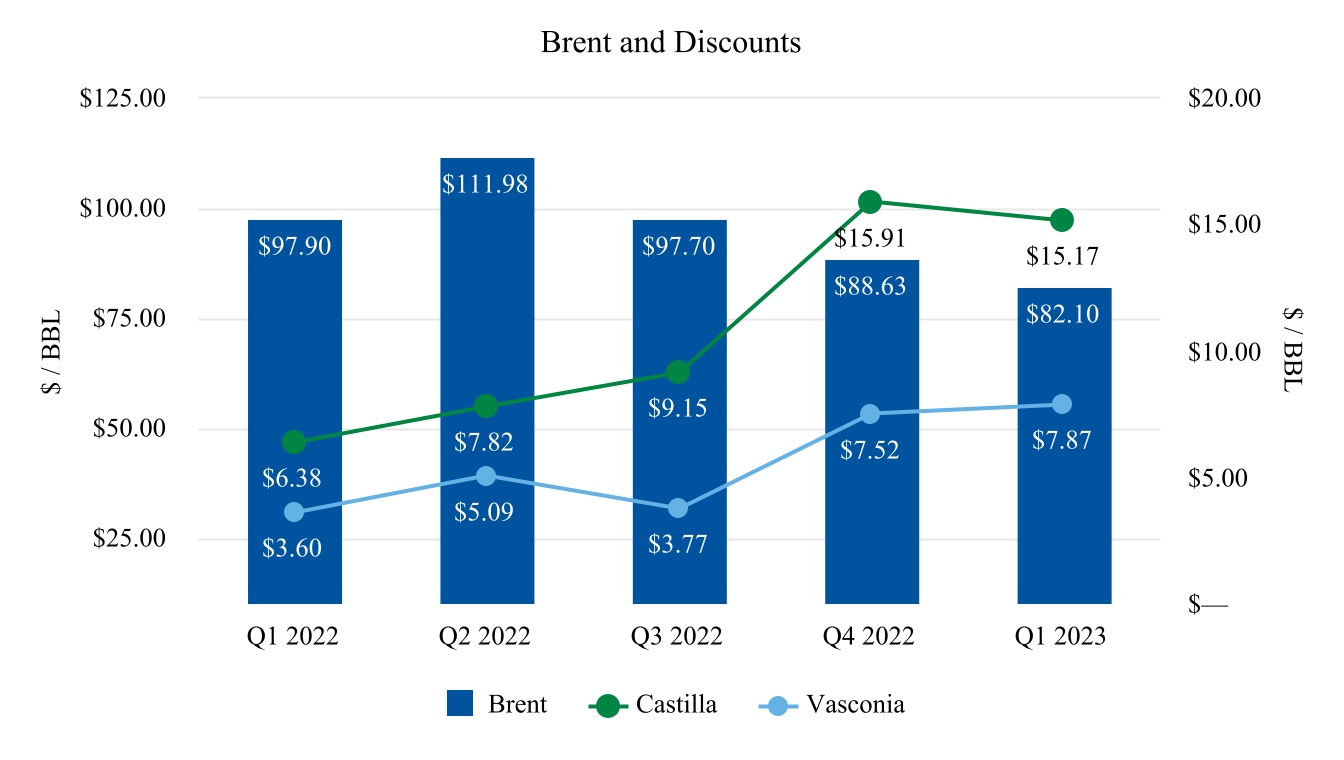
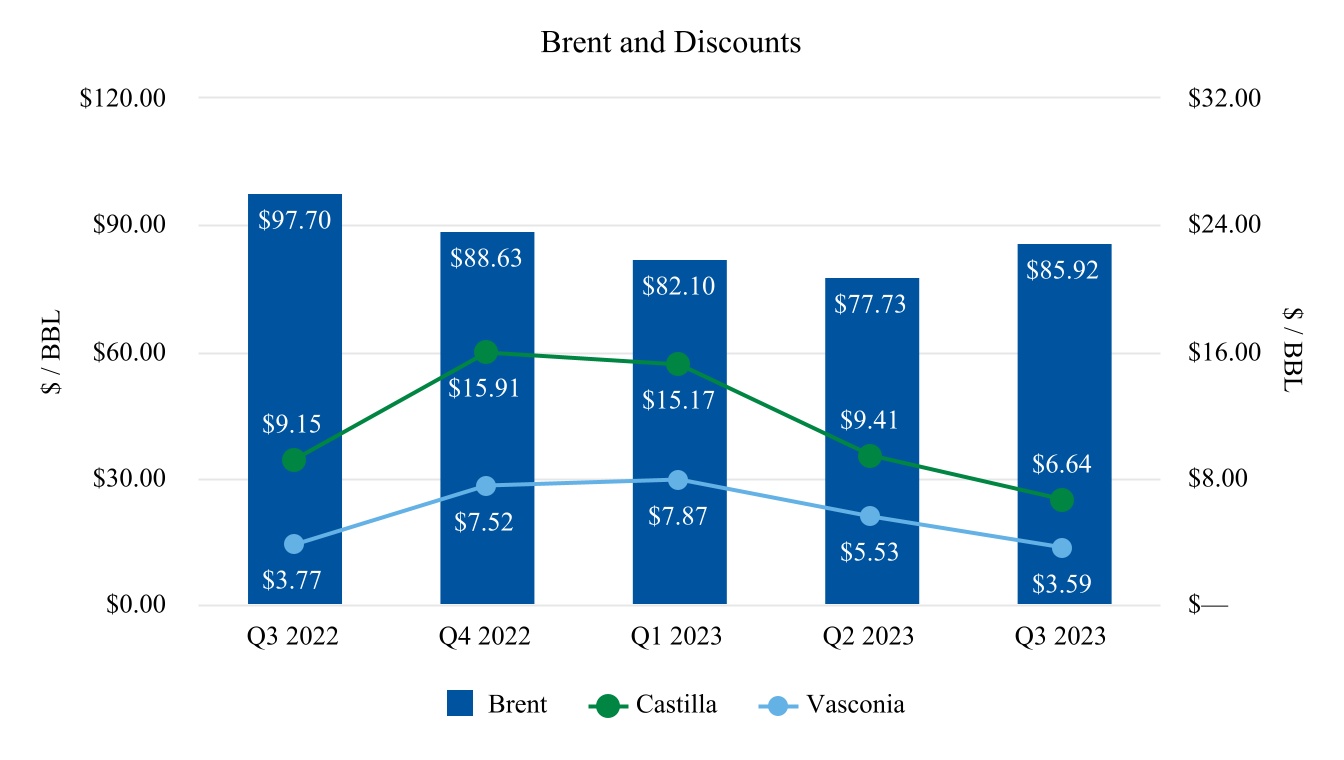
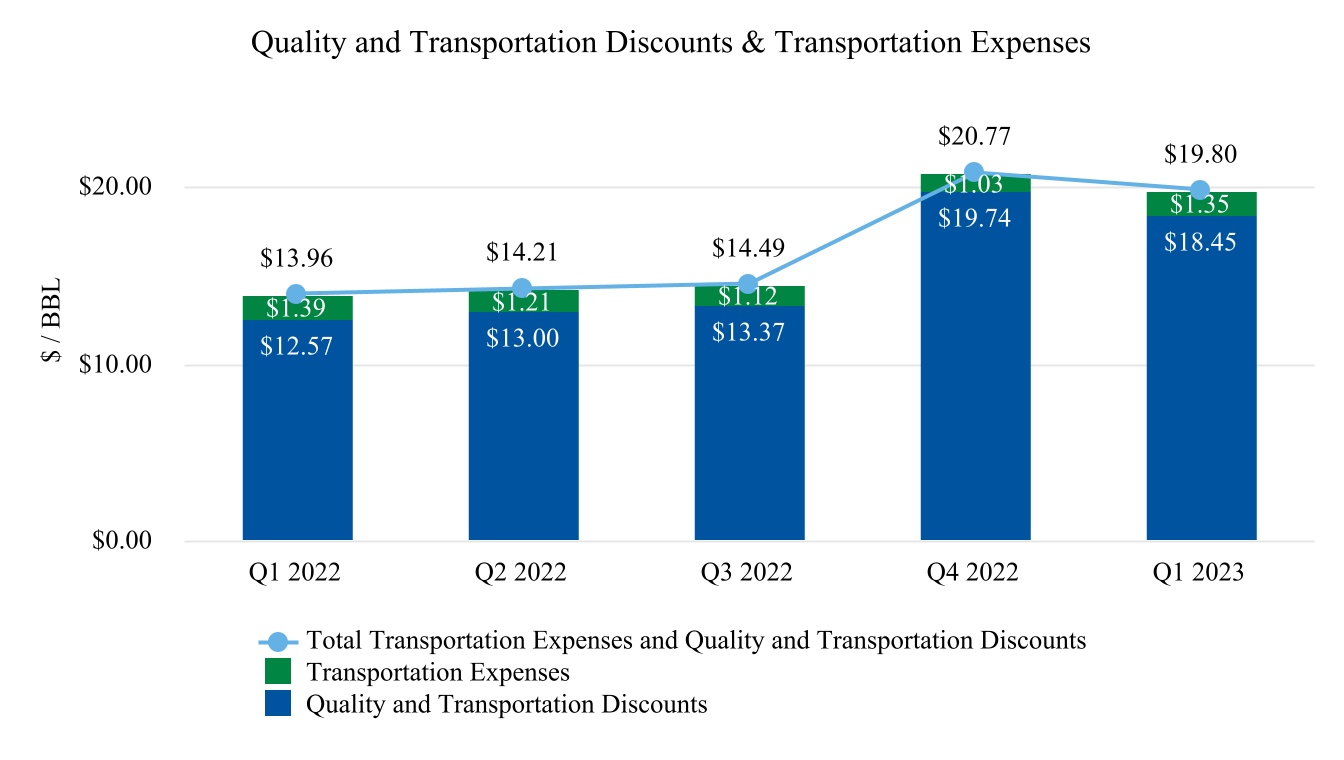
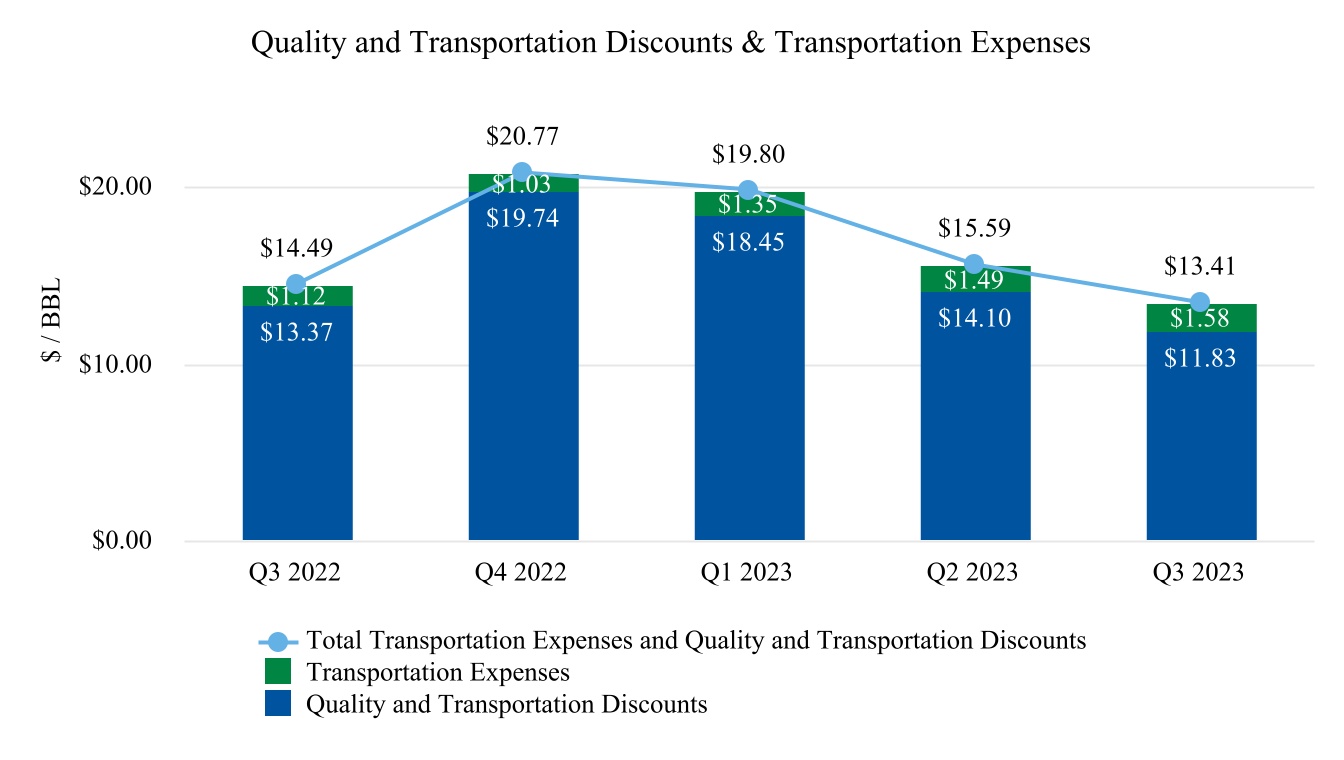
•Quality and transportation discounts for the firstthird quarter of 2023 increaseddecreased to $18.45$11.83 per bbl compared to $12.57$13.37 per bbl in the firstthird quarter of 2022, primarily as a result of the wideningtightening of the Castilla and Vasconia differentials and decreased from $19.74$14.10 per bbl compared toin the fourthprior quarter of 2022
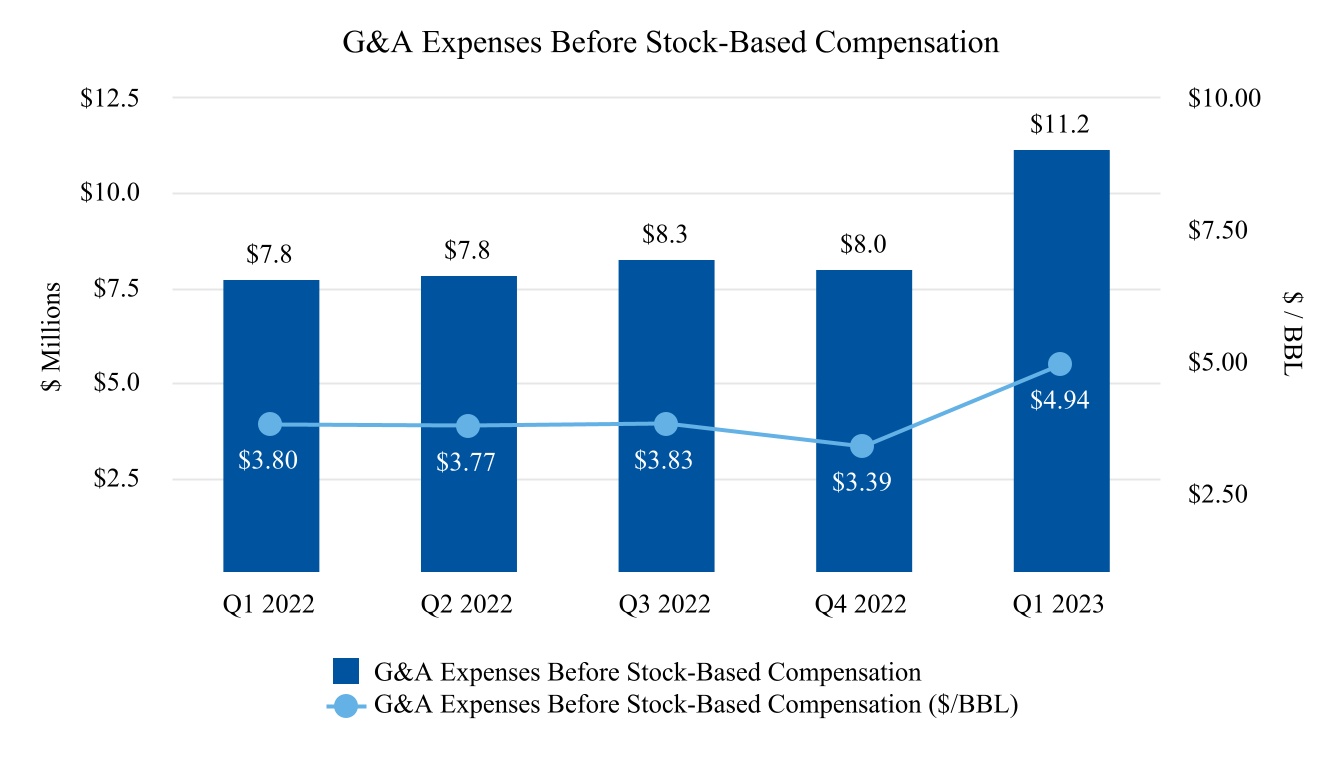
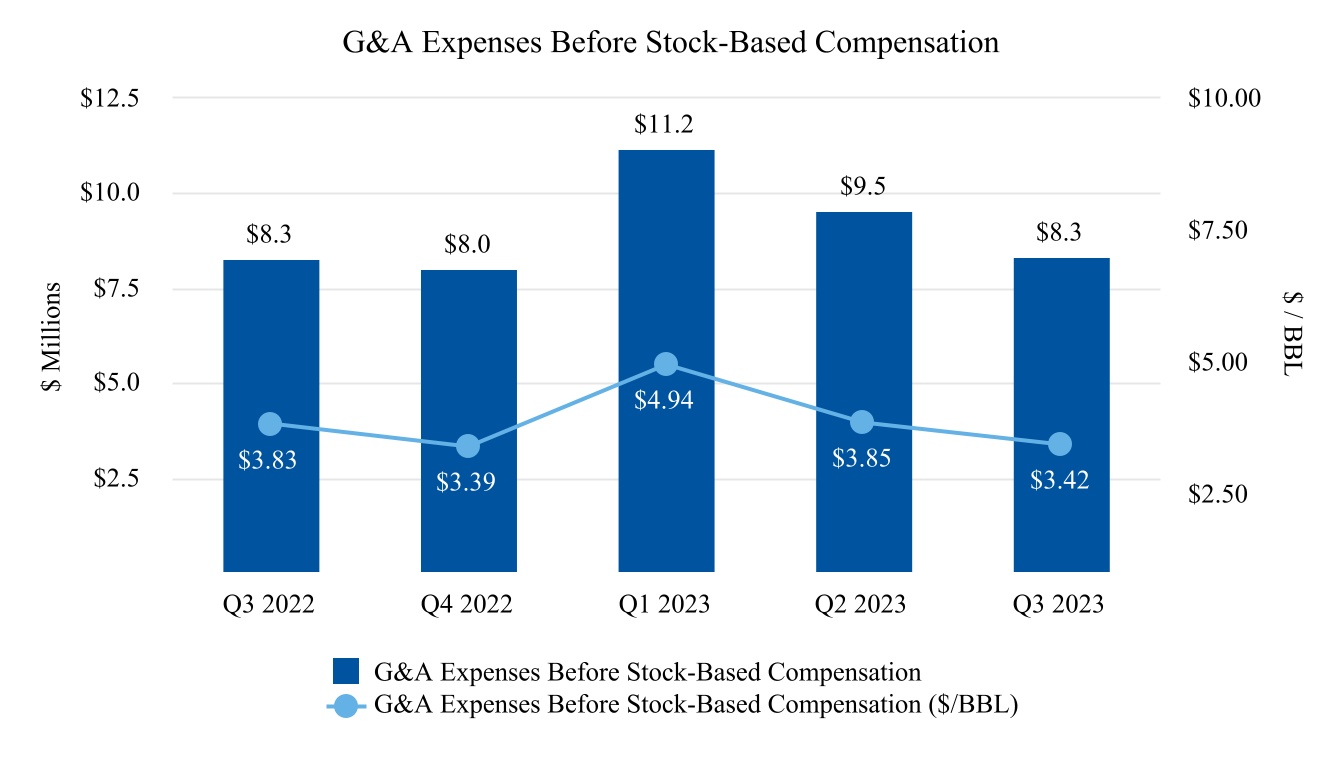
•General and administrative expenses (“G&A”) before stock-based compensation increased by 44% compared to the first quarter of 2022 due to optimization projects and lease obligations expenses and increased by 40% from the fourth quarter of 2022 for the same reason mentioned above
•General and administrative (“G&A”) expenses before stock-based compensation were comparable to the third quarter of 2022 and decreased by 13% from the second quarter of 2023 due to lower legal fees and consulting costs attributed to optimization projects
•Capital additions for the firstthird quarter of 2023 were $71.1$43.1 million, an increasea decrease of 71%24% compared to the firstthird quarter of 2022, asand a resultdecrease of 34% from the second quarter of 2023 due to the completion of the 2023 drilling program in all major fields and decreased 3% from the fourth quarterfirst half of 2022
•On April 11, 2023 we announced our agreement with Ecopetrol, the national oil company of Colombia, by which Gran Tierra and Ecopetrol renegotiated the terms and the duration of the contract for 20 years after the effective date for the Suroriente Block in the Putumayo Basin, which was scheduled to end in mid-2024. The agreement is subject to certain conditions precedent, including regulatory approval by the Superintendence of Industry and Commerce of Colombia (“SIC”). The satisfaction of such conditions precedent will determine the agreement’s effective date
| | (Thousands of U.S. Dollars, unless otherwise indicated) | (Thousands of U.S. Dollars, unless otherwise indicated) | Three Months Ended March 31, | | Three Months Ended December 31, | | (Thousands of U.S. Dollars, unless otherwise indicated) | Three Months Ended September 30, | | Three Months Ended June 30, | | Nine Months Ended September 30, |
| | | 2023 | 2022 | % Change | | 2022 | | | 2023 | 2022 | % Change | | 2023 | | 2023 | 2022 | % Change |
| Average Daily Volumes (BOPD) | Average Daily Volumes (BOPD) | | | | | Average Daily Volumes (BOPD) | | | | | |
| Consolidated | Consolidated | | | Consolidated | |
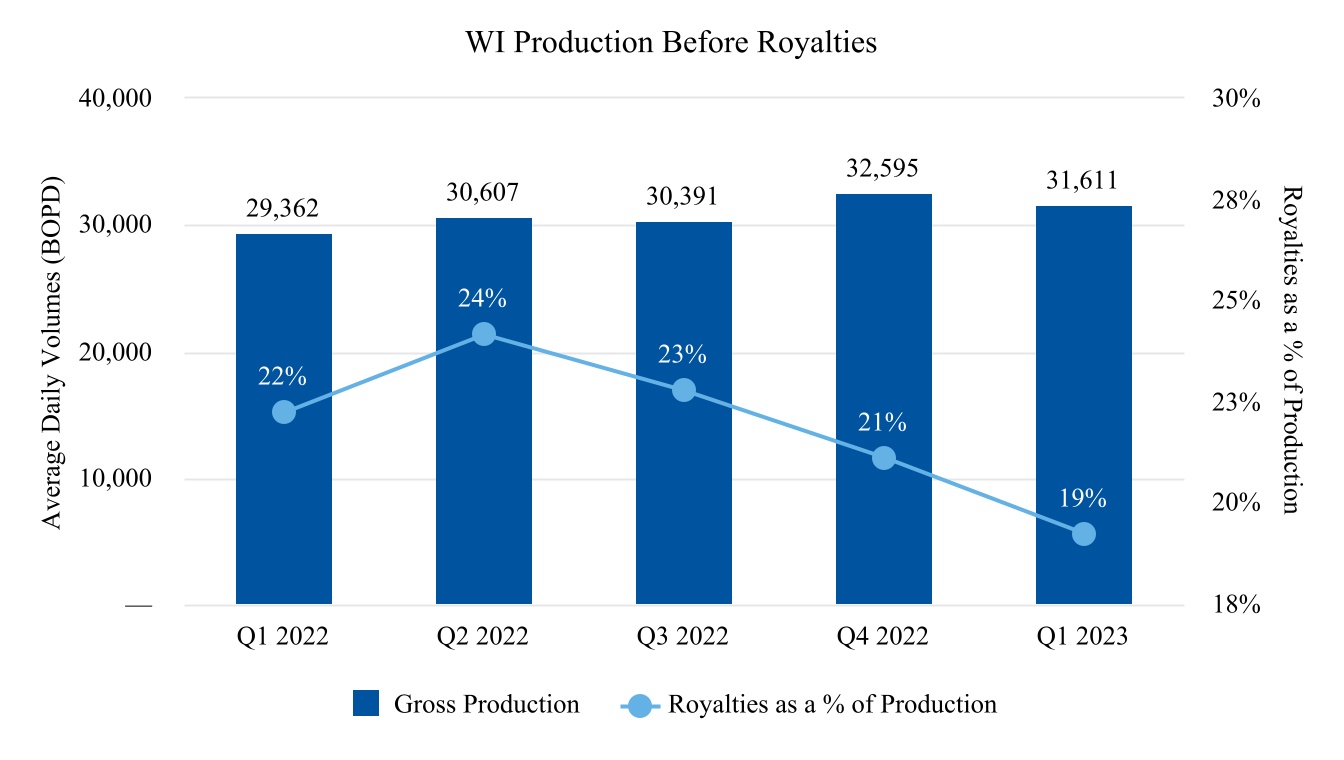
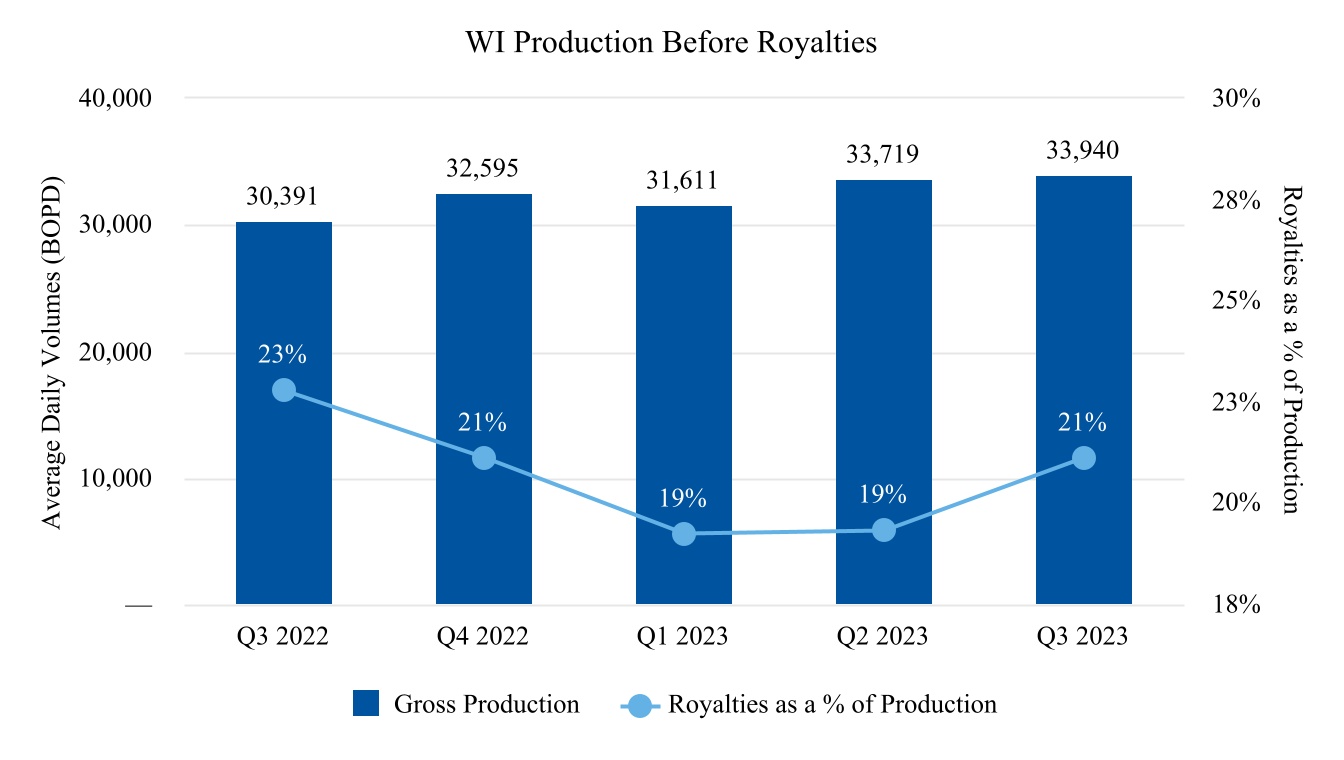
| Working Interest (“WI”) Production Before Royalties | Working Interest (“WI”) Production Before Royalties | 31,611 | | 29,362 | | 8 | | | 32,595 | | | Working Interest (“WI”) Production Before Royalties | 33,940 | | 30,391 | | 12 | | | 33,719 | | | 33,098 | | 30,123 | | 10 | |
| Royalties | Royalties | (6,085) | | (6,529) | | (7) | | | (6,880) | | | Royalties | (7,164) | | (6,919) | | 4 | | | (6,515) | | | (6,592) | | (6,948) | | (5) | |
| Production NAR | Production NAR | 25,526 | | 22,833 | | 12 | | | 25,715 | | | Production NAR | 26,776 | | 23,472 | | 14 | | | 27,204 | | | 26,506 | | 23,175 | | 14 | |
| Increase in Inventory | (355) | | (103) | | 245 | | | (53) | | | |
| (Increase) Decrease in Inventory | | (Increase) Decrease in Inventory | (380) | | 44 | | (964) | | | 67 | | | (222) | | (141) | | (57) | |
Sales(1) | Sales(1) | 25,171 | | 22,730 | | 11 | | | 25,662 | | | Sales(1) | 26,396 | | 23,516 | | 12 | | | 27,271 | | | 26,284 | | 23,034 | | 14 | |
| | Net (Loss) Income | $ | (9,700) | | $ | 14,119 | | (169) | | | $ | 33,275 | | | |
| Net Income (Loss) | | Net Income (Loss) | $ | 6,527 | | $ | 38,663 | | (83) | | | $ | (10,825) | | | $ | (13,998) | | $ | 105,754 | | (113) | |
| | Operating Netback | Operating Netback | | | Operating Netback | |
| Oil Sales | Oil Sales | $ | 144,190 | | $ | 174,569 | | (17) | | | $ | 162,637 | | | Oil Sales | $ | 179,921 | | $ | 168,397 | | 7 | | | $ | 157,902 | | | $ | 482,013 | | $ | 548,751 | | (12) | |
| Operating Expenses | Operating Expenses | (41,369) | | (34,935) | | 18 | | | (46,119) | | | Operating Expenses | (49,367) | | (41,837) | | 18 | | | (48,491) | | | (139,227) | | (116,266) | | 20 | |
| | Transportation Expenses | Transportation Expenses | (3,066) | | (2,834) | | 8 | | | (2,433) | | | Transportation Expenses | (3,842) | | (2,417) | | 59 | | | (3,691) | | | (10,599) | | (7,764) | | 37 | |
Operating Netback(2) | Operating Netback(2) | $ | 99,755 | | $ | 136,800 | | (27) | | | $ | 114,085 | | | Operating Netback(2) | $ | 126,712 | | $ | 124,143 | | 2 | | | $ | 105,720 | | | $ | 332,187 | | $ | 424,721 | | (22) | |
| | G&A Expenses Before Stock-Based Compensation | G&A Expenses Before Stock-Based Compensation | $ | 11,196 | | $ | 7,779 | | 44 | | | $ | 7,998 | | | G&A Expenses Before Stock-Based Compensation | $ | 8,307 | | $ | 8,284 | | — | | | $ | 9,549 | | | $ | 29,052 | | $ | 23,910 | | 22 | |
| G&A Stock-Based Compensation Expense | 1,500 | | 4,557 | | (67) | | | 2,673 | | | |
| G&A Stock-Based Compensation Expense (Recovery) | | G&A Stock-Based Compensation Expense (Recovery) | 1,931 | | (170) | | 1,236 | | | 317 | | | 3,748 | | 6,376 | | (41) | |
| G&A Expenses, Including Stock-Based Compensation | G&A Expenses, Including Stock-Based Compensation | $ | 12,696 | | $ | 12,336 | | 3 | | | $ | 10,671 | | | G&A Expenses, Including Stock-Based Compensation | $ | 10,238 | | $ | 8,114 | | 26 | | | $ | 9,866 | | | $ | 32,800 | | $ | 30,286 | | 8 | |
| Adjusted EBITDA(2) | Adjusted EBITDA(2) | $ | 88,677 | | $ | 119,378 | | (26) | | | $ | 108,828 | | | Adjusted EBITDA(2) | $ | 119,235 | | $ | 116,089 | | 3 | | | $ | 97,291 | | | $ | 306,391 | | $ | 375,075 | | (18) | |
| Funds Flow From Operations(2) | Funds Flow From Operations(2) | $ | 60,016 | | $ | 87,310 | | (31) | | | $ | 81,343 | | | Funds Flow From Operations(2) | $ | 79,000 | | $ | 93,746 | | (16) | | | $ | 53,106 | | | $ | 192,122 | | $ | 284,681 | | (33) | |
| | Capital Expenditures | Capital Expenditures | $ | 71,062 | | $ | 41,483 | | 71 | | | $ | 72,887 | | | Capital Expenditures | $ | 43,080 | | $ | 57,035 | | (24) | | | $ | 65,565 | | | $ | 179,707 | | $ | 163,717 | | 10 | |
(1) Sales volumes represent production NAR adjusted for inventory changes.
(2) Non-GAAP measures
Operating netback, EBITDA, adjusted EBITDA, and funds flow from operations are non-GAAP measures that do not have any standardized meaning prescribed under GAAP. Management views these measures as financial performance measures. Investors are cautioned that these measures should not be construed as alternatives to oil sales, net income (loss) income or other measures of financial performance as determined in accordance with GAAP. Our method of calculating these measures may differ from other companies and, accordingly, may not be comparable to similar measures used by other companies. Disclosure of each non-GAAP financial measure is preceded by the corresponding GAAP measure so as not to imply that more emphasis should be placed on the non-GAAP measure.
Operating netback, as presented, is defined as oil sales less operating and transportation expenses. Management believes that operating netback is a useful supplemental measure for management and investors to analyze financial performance and provides an indication of the results generated by our principal business activities prior to the consideration of other income and expenses. A reconciliation from oil sales to operating netback is provided in the table above.
EBITDA, as presented, is defined as net income (loss) income adjusted for depletion, depreciation and accretion (“DD&A”) expenses, interest expense and income tax expense. Adjusted EBITDA, as presented, is defined as EBITDA adjusted for non-cash lease expense, lease payments, unrealized foreign exchange gain or loss, stock-based compensation expense or recovery, unrealized derivative instruments gain or loss, inventory impairment, gain on re-purchase of Senior Notes and other financial instruments gain. Management uses this supplemental measure to analyze performance and income generated by our principal business activities prior to the consideration of how non-cash items affect that income and believes that this
financial measure is useful supplemental information for investors to analyze our performance and our financial results. A reconciliation from net income (loss) income to EBITDA and adjusted EBITDA is as follows:
| | | | | | | | | | | | | | | | | | | |
| | Three Months Ended March 31, | | Three Months Ended December 31, | | | | |
| (Thousands of U.S. Dollars) | 2023 | 2022 | | 2022 | | | | | |
| Net (loss) income | $ | (9,700) | | $ | 14,119 | | | $ | 33,275 | | | | | | |
| Adjustments to reconcile net (loss) income to EBITDA and Adjusted EBITDA | | | | | | | | | |
| DD&A expenses | 51,721 | | 40,963 | | | 51,781 | | | | | | |
| Interest expense | 11,836 | | 12,128 | | | 10,750 | | | | | | |
| Current income tax expense | 32,883 | | 39,540 | | | 5,966 | | | | | | |
| EBITDA (non-GAAP) | $ | 86,740 | | $ | 106,750 | | | $ | 101,772 | | | | | | |
| Non-cash lease expense | 1,144 | | 411 | | | 809 | | | | | | |
| Lease payments | (606) | | (344) | | | (532) | | | | | | |
| Unrealized foreign exchange loss (gain) | 514 | | (4,839) | | | 4,113 | | | | | | |
| Stock-based compensation expense | 1,500 | | 4,557 | | | 2,673 | | | | | | |
| Unrealized derivative instruments loss | — | | 12,843 | | | — | | | | | | |
| Inventory impairment | 475 | | — | | | — | | | | | | |
| Gain on re-purchase of Senior Notes | (1,090) | | — | | | — | | | | | | |
| Other financial instruments gain | — | | — | | | (7) | | | | | | |
| Adjusted EBITDA (non-GAAP) | $ | 88,677 | | $ | 119,378 | | | $ | 108,828 | | | | | | |
| | | | | | | | | | | | | | | | | | | | | | | | | |
| | Three Months Ended September 30, | | Three Months Ended June 30, | | Nine Months Ended September 30, | | |
| (Thousands of U.S. Dollars) | 2023 | 2022 | | 2023 | | 2023 | 2022 | | |
| Net income (loss) | $ | 6,527 | | $ | 38,663 | | | $ | (10,825) | | | $ | (13,998) | | $ | 105,754 | | | |
| Adjustments to reconcile net income (loss) to EBITDA and Adjusted EBITDA | | | | | | | | | |
| DD&A expenses | 55,019 | | 45,320 | | | 56,209 | | | 162,949 | | 128,499 | | | |
| Interest expense | 13,503 | | 11,421 | | | 12,678 | | | 38,017 | | 35,743 | | | |
| Income tax expense | 40,333 | | 21,734 | | | 33,732 | | | 106,948 | | 99,940 | | | |
| EBITDA (non-GAAP) | $ | 115,382 | | $ | 117,138 | | | $ | 91,794 | | | $ | 293,916 | | $ | 369,936 | | | |
| Non-cash lease expense | 1,235 | | 851 | | | 1,109 | | | 3,488 | | 2,009 | | | |
| Lease payments | (676) | | (402) | | | (636) | | | (1,918) | | (1,134) | | | |
| Foreign exchange loss | 1,717 | | 1,489 | | | 4,707 | | | 8,126 | | 486 | | | |
| Stock-based compensation expense (recovery) | 1,931 | | (170) | | | 317 | | | 3,748 | | 6,376 | | | |
| Unrealized derivative instruments gain | — | | (219) | | | — | | | — | | — | | | |
| Other gain | (354) | | (2,598) | | | — | | | (969) | | (2,598) | | | |
| | | | | | | | | |
| Adjusted EBITDA (non-GAAP) | $ | 119,235 | | $ | 116,089 | | | $ | 97,291 | | | $ | 306,391 | | $ | 375,075 | | | |
Funds flow from operations, as presented, is defined as net income (loss) income adjusted for DD&A expenses, inventory impairment, deferred income tax expense, or recovery, stock-based compensation expense or recovery, amortization of debt issuance costs, non-cash lease expense, lease payments, unrealized foreign exchange gain or loss, unrealized derivative instruments gain or loss, cash settlement on derivative instruments, gain on re-purchase of Senior Notes, and other financial instruments gain. Management uses this financial measure to analyze performance and income generated by our principal business activities prior to the consideration of how non-cash items affect that income and believes that this financial measure is also useful supplemental information for investors to analyze performance and our financial results. A reconciliation from net income (loss) income to funds flow from operations is as follows:
| | | | | | | | | | | | | | | | | |
| | Three Months Ended March 31, | | Three Months Ended December 31, | | |
| (Thousands of U.S. Dollars) | 2023 | 2022 | | 2022 | | | |
| Net (loss) income | $ | (9,700) | | $ | 14,119 | | | $ | 33,275 | | | | |
| Adjustments to reconcile net(loss) income to funds flow from operations | | | | | | | |
| DD&A expenses | 51,721 | | 40,963 | | | 51,781 | | | | |
| Inventory impairment | 475 | | — | | | — | | | | |
| Deferred income tax expense (recovery) | 15,277 | | 18,713 | | | (11,528) | | | | |
| Stock-based compensation expense | 1,500 | | 4,557 | | | 2,673 | | | | |
| Amortization of debt issuance costs | 781 | | 887 | | | 759 | | | | |
| Non-cash lease expense | 1,144 | | 411 | | | 809 | | | | |
| Lease payments | (606) | | (344) | | | (532) | | | | |
| Unrealized foreign exchange loss (gain) | 514 | | (4,839) | | | 4,113 | | | | |
| Derivative instruments loss | — | | 21,439 | | | — | | | | |
| Cash settlements on derivative instruments | — | | (8,596) | | | — | | | | |
| Gain on re-purchase of Senior Notes | (1,090) | | — | | | — | | | | |
| Other financial instruments gain | — | | — | | | (7) | | | | |
| Funds flow from operations (non-GAAP) | $ | 60,016 | | $ | 87,310 | | | $ | 81,343 | | | | |
| | | | | | | |
| | | | | | | |
| | | | | | | |
| | | | | | | |
| | | | | | | | | | | | | | | | | | | | | | | |
| | Three Months Ended September 30, | | Three Months Ended June 30, | | Nine Months Ended September 30, |
| (Thousands of U.S. Dollars) | 2023 | 2022 | | 2023 | | 2023 | 2022 |
| Net income (loss) | $ | 6,527 | $ | 38,663 | | $ | (10,825) | | $ | (13,998) | | $ | 105,754 | |
| Adjustments to reconcile net income (loss) to funds flow from operations | | | | | | | |
| DD&A expenses | 55,019 | 45,320 | | 56,209 | | 162,949 | | 128,499 | |
| Deferred income tax expense | 13,990 | 4,914 | | 13,975 | | 43,242 | | 36,868 | |
| Stock-based compensation expense (recovery) | 1,931 | (170) | | 317 | | 3,748 | | 6,376 | |
| Amortization of debt issuance costs | 1,594 | 751 | | 1,019 | | 3,394 | | 2,769 | |
| Non-cash lease expense | 1,235 | 851 | | 1,109 | | 3,488 | | 2,009 | |
| Lease payments | (676) | (402) | | (636) | | (1,918) | | (1,134) | |
| Unrealized foreign exchange (gain) loss | (266) | 6,636 | | (8,062) | | (7,814) | | 6,138 | |
| Unrealized derivative instruments gain | — | | (219) | | | — | | | — | | — | |
| Other gain | (354) | (2,598) | | — | | (969) | | (2,598) | |
| | | | | | | |
| Funds flow from operations (non-GAAP) | $ | 79,000 | $ | 93,746 | | $ | 53,106 | | $ | 192,122 | | $ | 284,681 | |
| | | | | | | |
| | | | | | | |
| | | | | | | |
| | | | | | | |
Additional Operational Results
Additional Operational Results
| | | | Three Months Ended March 31, | | Three Months Ended December 31, | | | Three Months Ended September 30, | | Three Months Ended June 30, | | Nine Months Ended September 30, |
| (Thousands of U.S. Dollars) | (Thousands of U.S. Dollars) | 2023 | 2022 | % Change | | 2022 | | (Thousands of U.S. Dollars) | 2023 | 2022 | % Change | | 2023 | | 2023 | 2022 | % Change |
| Oil sales | Oil sales | $ | 144,190 | | $ | 174,569 | | (17) | | | $ | 162,637 | | | Oil sales | $ | 179,921 | | $ | 168,397 | | 7 | | | $ | 157,902 | | | $ | 482,013 | | $ | 548,751 | | (12) | |
| Operating expenses | Operating expenses | 41,369 | | 34,935 | | 18 | | | 46,119 | | | Operating expenses | 49,367 | | 41,837 | | 18 | | | 48,491 | | | 139,227 | | 116,266 | | 20 | |
| Transportation expenses | Transportation expenses | 3,066 | | 2,834 | | 8 | | | 2,433 | | | Transportation expenses | 3,842 | | 2,417 | | 59 | | | 3,691 | | | 10,599 | | 7,764 | | 37 | |
Operating netback(1) | Operating netback(1) | 99,755 | | 136,800 | | (27) | | | 114,085 | | | Operating netback(1) | 126,712 | | 124,143 | | 2 | | | 105,720 | | | 332,187 | | 424,721 | | (22) | |
| | DD&A expenses | DD&A expenses | 51,721 | | 40,963 | | 26 | | | 51,781 | | | DD&A expenses | 55,019 | | 45,320 | | 21 | | | 56,209 | | | 162,949 | | 128,499 | | 27 | |
| Inventory impairment | 475 | | — | | 100 | | | — | | | |
| | G&A expenses before stock-based compensation | G&A expenses before stock-based compensation | 11,196 | | 7,779 | | 44 | | | 7,998 | | | G&A expenses before stock-based compensation | 8,307 | | 8,284 | | — | | | 9,549 | | | 29,052 | | 23,910 | | 22 | |
| G&A stock-based compensation expense | 1,500 | | 4,557 | | (67) | | | 2,673 | | | |
| Foreign exchange loss (gain) | 1,702 | | (3,725) | | (146) | | | 2,092 | | | |
| G&A stock-based compensation expense (recovery) | | G&A stock-based compensation expense (recovery) | 1,931 | | (170) | | 1,236 | | | 317 | | | 3,748 | | 6,376 | | (41) | |
| Foreign exchange loss | | Foreign exchange loss | 1,717 | | 1,489 | | 15 | | | 4,707 | | | 8,126 | | 486 | | 1,572 | |
| Derivative instruments loss | Derivative instruments loss | — | | 21,439 | | (100) | | | — | | | Derivative instruments loss | — | | — | | — | | | — | | | — | | 26,611 | | (100) | |
| Other financial instruments gain | — | | — | | — | | | (7) | | | |
| Gain on re-purchase of Senior Notes | (1,090) | | — | | 100 | | | — | | | |
| Other gain | | Other gain | (354) | | (2,598) | | (86) | | | — | | | (969) | | (2,598) | | (63) | |
| Interest expense | Interest expense | 11,836 | | 12,128 | | (2) | | | 10,750 | | | Interest expense | 13,503 | | 11,421 | | 18 | | | 12,678 | | | 38,017 | | 35,743 | | 6 | |
| | 77,340 | | 83,141 | | (7) | | | 75,287 | | | | 80,123 | | 63,746 | | 26 | | | 83,460 | | | 240,923 | | 219,027 | | 10 | |
| | Interest income | Interest income | 768 | | — | | 100 | | | 443 | | | Interest income | 271 | | — | | 100 | | | 647 | | | 1,686 | | — | | 100 | |
| | Income before income taxes | Income before income taxes | 23,183 | | 53,659 | | (57) | | | 39,241 | | | Income before income taxes | 46,860 | | 60,397 | | (22) | | | 22,907 | | | 92,950 | | 205,694 | | (55) | |
| | Current income tax expense | Current income tax expense | 17,606 | | 20,827 | | (15) | | | 17,494 | | | Current income tax expense | 26,343 | | 16,820 | | 57 | | | 19,757 | | | 63,706 | | 63,072 | | 1 | |
| Deferred income tax expense (recovery) | 15,277 | | 18,713 | | (18) | | | (11,528) | | | |
| Deferred income tax expense | | Deferred income tax expense | 13,990 | | 4,914 | | 185 | | | 13,975 | | | 43,242 | | 36,868 | | 17 | |
| | 32,883 | | 39,540 | | (17) | | | 5,966 | | | | 40,333 | | 21,734 | | 86 | | | 33,732 | | | 106,948 | | 99,940 | | 7 | |
| Net (loss) income | $ | (9,700) | | $ | 14,119 | | (169) | | | $ | 33,275 | | | |
| Net income (loss) | | Net income (loss) | $ | 6,527 | | $ | 38,663 | | (83) | | | $ | (10,825) | | | $ | (13,998) | | $ | 105,754 | | (113) | |
| | Sales Volumes (NAR) | Sales Volumes (NAR) | | | Sales Volumes (NAR) | |
| | Total sales volumes, BOPD | Total sales volumes, BOPD | 25,171 | | 22,730 | | 11 | | | 25,662 | | | Total sales volumes, BOPD | 26,396 | | 23,516 | | 12 | | | 27,271 | | | 26,284 | | 23,034 | | 14 | |
| | Brent Price per bbl | Brent Price per bbl | $ | 82.10 | | $ | 97.90 | | (16) | | | $ | 88.63 | | | Brent Price per bbl | $ | 85.92 | | $ | 97.70 | | (12) | | | $ | 77.73 | | | $ | 81.94 | | $ | 102.48 | | (20) | |
| | Consolidated Results of Operations per bbl Sales Volumes NAR | Consolidated Results of Operations per bbl Sales Volumes NAR | | | Consolidated Results of Operations per bbl Sales Volumes NAR | |
| Oil sales | Oil sales | $ | 63.65 | | $ | 85.33 | | (25) | | | $ | 68.89 | | | Oil sales | $ | 74.09 | | $ | 77.84 | | (5) | | | $ | 63.63 | | | $ | 67.18 | | $ | 87.27 | | (23) | |
| Operating expenses | Operating expenses | 18.26 | | 17.07 | | 7 | | | 19.53 | | | Operating expenses | 20.33 | | 19.34 | | 5 | | | 19.54 | | | 19.40 | | 18.49 | | 5 | |
| Transportation expenses | Transportation expenses | 1.35 | | 1.39 | | (3) | | | 1.03 | | | Transportation expenses | 1.58 | | 1.12 | | 41 | | | 1.49 | | | 1.48 | | 1.23 | | 20 | |
Operating netback(1) | Operating netback(1) | 44.04 | | 66.87 | | (34) | | | 48.33 | | | Operating netback(1) | 52.18 | | 57.38 | | (9) | | | 42.60 | | | 46.30 | | 67.55 | | (31) | |
| | DD&A expenses | DD&A expenses | 22.83 | | 20.02 | | 14 | | | 21.93 | | | DD&A expenses | 22.66 | | 20.95 | | 8 | | | 22.65 | | | 22.71 | | 20.43 | | 11 | |
| Inventory impairment | 0.21 | | — | | 100 | | | — | | | |
| | G&A expenses before stock-based compensation | G&A expenses before stock-based compensation | 4.94 | | 3.80 | | 30 | | | 3.39 | | | G&A expenses before stock-based compensation | 3.42 | | 3.83 | | (11) | | | 3.85 | | | 4.05 | | 3.80 | | 7 | |
| G&A stock-based compensation expense | 0.66 | | 2.23 | | (70) | | | 1.13 | | | |
| Foreign exchange loss (gain) | 0.75 | | (1.82) | | (141) | | | 0.89 | | | |
| | G&A stock-based compensation expense (recovery) | | G&A stock-based compensation expense (recovery) | 0.80 | | (0.08) | | 1,100 | | | 0.13 | | | 0.52 | | 1.01 | | (49) | |
| Foreign exchange loss | | Foreign exchange loss | 0.71 | | 0.69 | | 3 | | | 1.90 | | | 1.13 | | 0.08 | | 1,313 | |
| Derivative instruments loss | Derivative instruments loss | — | | 10.48 | | (100) | | | — | | | Derivative instruments loss | — | | — | | — | | | — | | | — | | 4.23 | | (100) | |
| Other financial instruments gain | — | | — | | — | | | — | | | |
| Gain on re-purchase of Senior Notes | (0.48) | | — | | 100 | | | — | | | |
| Other gain | | Other gain | (0.15) | | (1.20) | | (88) | | | — | | | (0.14) | | (0.41) | | (66) | |
| Interest expense | Interest expense | 5.22 | | 5.93 | | (12) | | | 4.55 | | | Interest expense | 5.56 | | 5.28 | | 5 | | | 5.11 | | | 5.30 | | 5.68 | | (7) | |
| | 34.13 | | 40.64 | | (16) | | | 31.89 | | | | 33.00 | | 29.47 | | 12 | | | 33.64 | | | 33.57 | | 34.82 | | (4) | |
| | Interest income | Interest income | 0.34 | | — | | 100 | | | 0.19 | | | Interest income | 0.11 | | — | | 100 | | | 0.26 | | | 0.23 | | — | | 100 | |
| | Income before income taxes | Income before income taxes | 10.25 | | 26.22 | | (61) | | | 16.63 | | | Income before income taxes | 19.29 | | 27.91 | | (31) | | | 9.22 | | | 12.96 | | 32.73 | | (60) | |
| | Current income tax expense | Current income tax expense | 7.77 | | 10.18 | | (24) | | | 7.41 | | | Current income tax expense | 10.85 | | 7.77 | | 40 | | | 7.96 | | | 8.88 | | 10.03 | | (11) | |
| Deferred income tax expense (recovery) | 6.74 | | 9.15 | | (26) | | | (4.88) | | | |
| Deferred income tax expense | | Deferred income tax expense | 5.76 | | 2.27 | | 154 | | | 5.63 | | | 6.03 | | 5.86 | | 3 | |
| | 14.51 | | 19.33 | | (25) | | | 2.53 | | | | 16.61 | | 10.04 | | 65 | | | 13.59 | | | 14.91 | | 15.89 | | (6) | |
| Net (loss) income | $ | (4.26) | | $ | 6.89 | | (162) | | | $ | 14.10 | | | |
| Net income (loss) | | Net income (loss) | $ | 2.68 | | $ | 17.87 | | (85) | | | $ | (4.37) | | | $ | (1.95) | | $ | 16.84 | | (112) | |
(1) Operating netback is a non-GAAP measure that does not have any standardized meaning prescribed under GAAP. Refer to “Financial and Operational Highlights—non-GAAP measures” for a definition of this measure.
Oil Production and Sales Volumes, BOPD
| | | Three Months Ended March 31, | | Three Months Ended December 31, | | | Three Months Ended September 30, | | Three Months Ended June 30, | | Nine Months Ended September 30, |
| | 2023 | 2022 | | 2022 | | | 2023 | 2022 | | 2023 | | 2023 | 2022 |
| Average Daily Volumes (BOPD) | Average Daily Volumes (BOPD) | | | | | Average Daily Volumes (BOPD) | | | | | |
| WI Production Before Royalties | WI Production Before Royalties | 31,611 | | 29,362 | | | 32,595 | | | WI Production Before Royalties | 33,940 | | 30,391 | | | 33,719 | | | 33,098 | | 30,123 | |
| Royalties | Royalties | (6,085) | | (6,529) | | | (6,880) | | | Royalties | (7,164) | | (6,919) | | | (6,515) | | | (6,592) | | (6,948) | |
| Production NAR | Production NAR | 25,526 | | 22,833 | | | 25,715 | | | Production NAR | 26,776 | | 23,472 | | | 27,204 | | | 26,506 | | 23,175 | |
| Increase in Inventory | (355) | | (103) | | | (53) | | | |
| (Increase) Decrease in Inventory | | (Increase) Decrease in Inventory | (380) | | 44 | | | 67 | | | (222) | | (141) | |
| Sales | Sales | 25,171 | | 22,730 | | | 25,662 | | | Sales | 26,396 | | 23,516 | | | 27,271 | | | 26,284 | | 23,034 | |
| | Royalties, % of WI Production Before Royalties | Royalties, % of WI Production Before Royalties | 19 | % | 22 | % | | 21 | % | | Royalties, % of WI Production Before Royalties | 21 | % | 23 | % | | 19 | % | | 20 | % | 23 | % |
Oil production NAR for the three and nine months ended March 31,September 30, 2023, increased by 12%14% in each of the periods compared to 25,526 from the corresponding periodperiods of 2022 due to successful drilling and workover campaigns in all majorAcordionero, Costayaco and Moqueta fields in Colombia and exploration success in Ecuador.
Oil production from Ecuador duringNAR decreased by 2% compared to the prior quarter due to higher royalties driven by an increase in benchmark oil prices in the current quarter. Oil production NAR was comparable to prior quarter.
Royalties as a percentage of WI production for the three and nine months ended March 31,September 30, 2023, decreased to 19%21% and 20%, respectively, compared to the corresponding periodperiods of 2022 and the prior quarter commensurate with the decrease in benchmark oil prices and the price sensitive royalty regime in Colombia.
The Midas block includes the Acordionero, Chuira, Ayombero and AyomberoGaitas oil fields, and the Chaza block includes the Costayaco and Moqueta oil fields.
Realized price per bbl for thethree months ended March 31,September 30, 2023 decreased by 25%5%, compared to the corresponding period of 2022, mainlyprimarily as a result of a 16%12% decrease in Brent price, offset by lower differentials in the current quarter.
Realized price per bbl for thenine months ended September 30, 2023, decreased by 23%, compared to the corresponding period of 2022, primarily as a result of 20% decrease in Brent price and higher differentials.differentials in the current period.
For the three andnine months ended September 30, 2023, Castilla differentials decreased to $6.64 and Vasconia differentials increased to $15.17 per bbl and $7.87$10.41 per bbl from $6.38 per bbl$9.15 and $3.60$7.89 per bbl, respectively, in the corresponding periodperiods of 2022. Vasconia differentials decreased to $3.59 and increased to $5.66 per bbl from $3.77 and $4.17 per bbl, respectively, in the corresponding periods of 2022.
Compared to the prior quarter, the average realized price per bbl decreased by 8%, primarilyincreased due to a 7% decreasean 11% increase in Brent price.price and lower differentials.
Oil sales for the three months ended March 31,September 30, 2023, increased by 7% to $179.9 million, compared to the corresponding period of 2022 due to lower Castilla and Vasconia differentials and utilization of marketing arrangements which used Brent monthly average of the month of delivery (“M pricing”) during the current quarter compared to marketing arrangements which used Brent monthly average following the month of deliveries (“M+1” pricing) which negatively impacted revenues in the corresponding period of 2022.
Oil sales for the nine months ended September 30, 2023, decreased by 17%12% to $144.2$482.0 million, compared to the corresponding period of 2022 due to a 16%20% decrease in Brent price, and higher Castilla and Vasconia differentials. Additionally, during the three months ended March 31, 2023, we commenced oildifferentials offset by 14% higher sales in Ecuador, which contributed $3.2 million to oil sales and were subject to a $13.89 per bbl Oriente differential.volumes.
Compared to the prior quarter, oil sales decreasedincreased by 11%14%, primarily as a result of a 7% decreasean 11% increase in Brent price and lower Castilla, Vasconia and Oriente differentials partially offset by a 2%3% decrease in sales volumes.
The following table shows the effect of changes in realized price and sale volumes on our oil sales for the three and nine months ended March 31,September 30, 2023, compared to the prior quarter and the corresponding periodperiods of 2022:
| | | | | | | | | | | | | |
| (Thousands of U.S. Dollars) | First Quarter 2023 Compared with Fourth Quarter 2022 | | First Quarter 2023 Compared with First Quarter 2022 | | |
| Oil sales for the comparative period | $ | 162,637 | | | $ | 174,569 | | | |
| Realized sales price decrease effect | (11,867) | | | (49,120) | | | |
| Sales volumes (decrease) increase effect | (6,580) | | | 18,741 | | | |
| Oil sales for the three month ended March 31, 2023 | $ | 144,190 | | | $ | 144,190 | | | |
| | | | | | | | | | | | | | | | | |
| (Thousands of U.S. Dollars) | Third Quarter 2023 Compared with Second Quarter 2023 | | Third Quarter 2023 Compared with Third Quarter 2022 | | Nine Months Ended September 30, 2023 Compared with Nine Months Ended September 30, 2022 |
| Oil sales for the comparative period | $ | 157,902 | | | $ | 168,397 | | | $ | 548,751 | |
| Realized sales price increase (decrease) effect | 25,408 | | | (9,095) | | | (144,152) | |
| Sales volumes (decrease) increase effect | (3,389) | | | 20,619 | | | 77,414 | |
Oil sales for the three and nine months ended September 30, 2023 | $ | 179,921 | | | $ | 179,921 | | | $ | 482,013 | |
Operating Netback
| | | Three Months Ended March 31, | | Three Months Ended December 31, | | | Three Months Ended September 30, | | Three Months Ended June 30, | | Nine Months Ended September 30, |
| (Thousands of U.S. Dollars) | (Thousands of U.S. Dollars) | 2023 | 2022 | | 2022 | | (Thousands of U.S. Dollars) | 2023 | 2022 | | 2023 | | 2023 | 2022 |
| | Oil Sales | Oil Sales | $ | 144,190 | | $ | 174,569 | | | $ | 162,637 | | | Oil Sales | $ | 179,921 | | $ | 168,397 | | | $ | 157,902 | | | $ | 482,013 | | $ | 548,751 | |
| Transportation Expenses | Transportation Expenses | (3,066) | | (2,834) | | | (2,433) | | | Transportation Expenses | (3,842) | | (2,417) | | | (3,691) | | | (10,599) | | (7,764) | |
| | 141,124 | | 171,735 | | | 160,204 | | | | 176,079 | | 165,980 | | | 154,211 | | | 471,414 | | 540,987 | |
| Operating Expenses | Operating Expenses | (41,369) | | (34,935) | | | (46,119) | | | Operating Expenses | (49,367) | | (41,837) | | | (48,491) | | | (139,227) | | (116,266) | |
Operating Netback(1) | Operating Netback(1) | $ | 99,755 | | $ | 136,800 | | | $ | 114,085 | | | Operating Netback(1) | $ | 126,712 | | $ | 124,143 | | | $ | 105,720 | | | $ | 332,187 | | $ | 424,721 | |
| | (U.S. Dollars Per bbl Sales Volumes NAR) | (U.S. Dollars Per bbl Sales Volumes NAR) | | | (U.S. Dollars Per bbl Sales Volumes NAR) | |
| Brent | Brent | $ | 82.10 | | $ | 97.90 | | | $ | 88.63 | | | Brent | $ | 85.92 | | $ | 97.70 | | | $ | 77.73 | | | $ | 81.94 | | $ | 102.48 | |
| One Month Forward Brent (“M+1”) Adjustment | | One Month Forward Brent (“M+1”) Adjustment | — | | (6.49) | | | — | | | — | | (2.23) | |
| Quality and Transportation Discounts | Quality and Transportation Discounts | (18.45) | | (12.57) | | | (19.74) | | | Quality and Transportation Discounts | (11.83) | | (13.37) | | | (14.10) | | | (14.76) | | (12.98) | |
| Average Realized Price | Average Realized Price | 63.65 | | 85.33 | | | 68.89 | | | Average Realized Price | 74.09 | | 77.84 | | | 63.63 | | | 67.18 | | 87.27 | |
| Transportation Expenses | Transportation Expenses | (1.35) | | (1.39) | | | (1.03) | | | Transportation Expenses | (1.58) | | (1.12) | | | (1.49) | | | (1.48) | | (1.23) | |
| Average Realized Price Net of Transportation Expenses | Average Realized Price Net of Transportation Expenses | 62.30 | | 83.94 | | | 67.86 | | | Average Realized Price Net of Transportation Expenses | 72.51 | | 76.72 | | | 62.14 | | | 65.70 | | 86.04 | |
| Operating Expenses | Operating Expenses | (18.26) | | (17.07) | | | (19.53) | | | Operating Expenses | (20.33) | | (19.34) | | | (19.54) | | | (19.40) | | (18.49) | |
Operating Netback(1) | Operating Netback(1) | $ | 44.04 | | $ | 66.87 | | | $ | 48.33 | | | Operating Netback(1) | $ | 52.18 | | $ | 57.38 | | | $ | 42.60 | | | $ | 46.30 | | $ | 67.55 | |
(1) Operating netback is a non-GAAP measure that does not have any standardized meaning prescribed under GAAP. Refer to “Financial and Operational Highlights—non-GAAP measures” for a definition and reconciliation of this measure.
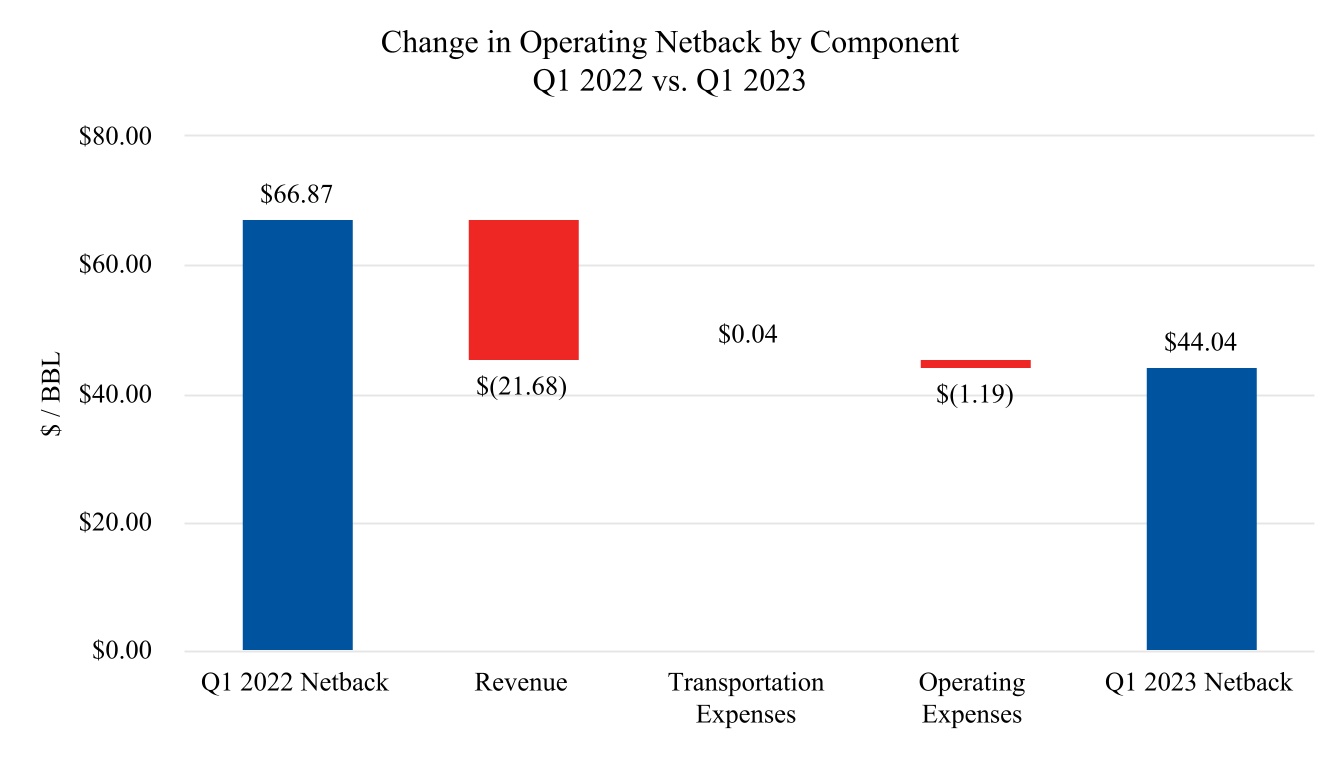
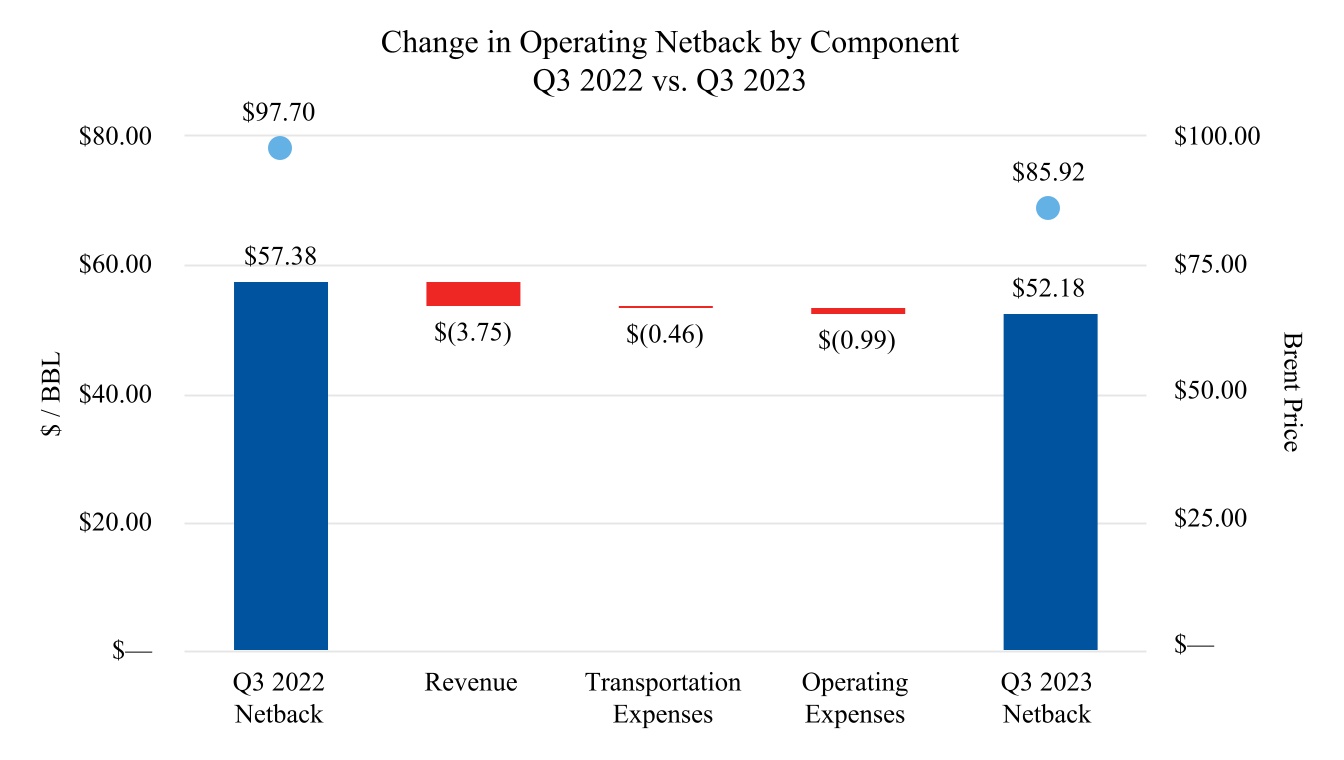
Operating expenses for the three months ended March 31,September 30, 2023, increased by 18% to $41.4$49.4 million or by $1.19$0.99 per bbl to $18.26$20.33 per bbl, compared to the corresponding period of 2022, primarily as a result of $1.23$3.28 per bbl higher lifting costs $0.81associated with road and pipeline maintenance, power generation due to to increased compressed natural gas purchases and higher diesel tariffs and equipment rental associated with testing exploratory wells, offset by $2.29 per bbl of lower workovers. As a result of an El-Niño-induced drought, power costs have increased across Colombia, which were attributedrelies on hydroelectricity for more than two-thirds of its installed power capacity. In addition, operating costs increased as a result of the depreciation of U.S. dollar against the Colombian peso.
Operating expenses for the nine months ended September 30, 2023, increased by 20% to Ecuador operations with$139.2 million or by $0.91 per bbl to $19.40 per bbl, compared to the remaindercorresponding period of 2022, primarily as a result of $2.17 higher lifting costs associated with higherenvironmental activities, equipment rental, in Colombia required for testing new exploration wells, partiallypower generation and road maintenance, offset by $0.04$1.26 per bbl lower workovers.
Compared to the prior quarter, operating expenses decreasedincreased by 10%2% or $1.27$0.79 per bbl from $46.1$48.5 million or $19.53$19.54 per bbl, primarily due to $1.08$1.48 per bbl lower workover activities and $0.19 per bbl lowerhigher lifting costs attributed to lower road maintenance activities,and power generation, partially offset by operating costs incurred in Ecuador and higher equipment rental during the current quarter.$0.69 per bbl lower workovers.
Transportation expenses
We have options to sell our oil through multiple pipelines and trucking routes. Each option has varying effects on realized sales price and transportation expenses. The following table shows the percentage of oil volumes we sold in Colombia and Ecuador using each option for the three and nine months ended March 31,September 30, 2023, and 2022, and the prior quarter:
| | | Three Months Ended March 31, | | Three Months Ended December 31, | | | Three Months Ended September 30, | | Three Months Ended June 30, | | Nine Months Ended September 30, | |
| | 2023 | 2022 | | 2022 | | | 2023 | 2022 | | 2023 | | 2023 | 2022 | |
| Volume transported through pipeline | Volume transported through pipeline | 2 | % | — | % | | — | % | | Volume transported through pipeline | 3 | % | — | % | | 1 | % | | 2 | % | — | % | |
| Volume sold at wellhead | Volume sold at wellhead | 45 | % | 47 | % | | 48 | % | | Volume sold at wellhead | 47 | % | 47 | % | | 46 | % | | 46 | % | 47 | % | |
| Volume transported via truck to sales point | Volume transported via truck to sales point | 53 | % | 53 | % | | 52 | % | | Volume transported via truck to sales point | 50 | % | 53 | % | | 53 | % | | 52 | % | 53 | % | |
| | 100 | % | 100 | % | | 100 | % | | | 100 | % | 100 | % | | 100 | % | | 100 | % | 100 | % | |
Volumes transported through pipeline or via truck receive a higher realized price, but incur higher transportation expenses. Conversely, volumes sold at the wellhead have the opposite effect of a lower realized price, offset by lower transportation expenses.
Transportation expenses for the three and nine months ended March 31,September 30, 2023, increased by 8%59% and 37% to $3.1$3.8 million and $10.6 million, respectively, compared to the corresponding periodperiods of 2022 due to higher transportation tariffs affecting Acordionero sales, and the utilization of new transportation routes related to sales from for Ecuador sales andnew exploration wells brought online during the current quarter.in Colombia and Ecuador.
On a per bbl basis, transportation expenses decreasedincreased by 3%41% and 20% to $1.35$1.58 and $1.48 for the three and nine months ended March 31,September 30, 2023, respectively, compared to the corresponding periodperiods of 2022 due to higher sales volumes infor the current quarter.same reason mentioned above.
Transportation expenses increased by 26%4% from $2.4$3.7 million in the prior quarter due to higher new transportation routes utilized for Ecuador salestrucking costs resulting from using longer distance delivery points and higher sales volumes transported via truck, which resulted in higher transportation costsdepreciation of the U.S. dollar against the Colombian peso. On a per bbl basis, transportation expenses increased by $0.09 from $1.49 in the current quarter.
DD&A Expenses
| | | Three Months Ended March 31, | | Three Months Ended December 31, | | | Three Months Ended September 30, | | Three Months Ended June 30, | | Nine Months Ended September 30, | |
| | 2023 | 2022 | | 2022 | | | 2023 | 2022 | | 2023 | | 2023 | 2022 | |
| DD&A Expenses, thousands of U.S. Dollars | DD&A Expenses, thousands of U.S. Dollars | $ | 51,721 | | $ | 40,963 | | | $ | 51,781 | | | DD&A Expenses, thousands of U.S. Dollars | $ | 55,019 | | $ | 45,320 | | | $ | 56,209 | | | $ | 162,949 | | $ | 128,499 | | |
| DD&A Expenses, U.S. Dollars per bbl | DD&A Expenses, U.S. Dollars per bbl | 22.83 | | 20.02 | | | 21.93 | | | DD&A Expenses, U.S. Dollars per bbl | 22.66 | | 20.95 | | | 22.65 | | | 22.71 | | 20.43 | | |
DD&A expenses for the three and nine months ended March 31,September 30, 2023, increased by 26%21% and 27% or by $2.81$1.71 and $2.28 per bbl, respectively, due to increased production and higher costs in the depletable base compared to the corresponding periodperiods of 2022.
DD&A expenses were comparabledecreased by 2% compared to the prior quarter and increased by $0.90$0.01 per bbl when compared to the prior quarter, due to lower production and a higher costs inadditions to the depletable base.reserves along with lower production.
G&A Expenses
| | | | | | | | | | | | | | | | | | | | | | | | | | | | | |
| Three Months Ended September 30, | | Three Months Ended June 30, | | Nine Months Ended September 30, |
| (Thousands of U.S. Dollars) | 2023 | 2022 | % Change | | 2023 | | 2023 | 2022 | % Change |
| G&A Expenses Before Stock-Based Compensation | $ | 8,307 | | $ | 8,284 | | — | | | $ | 9,549 | | | $ | 29,052 | | $ | 23,910 | | 22 | |
| G&A Stock-Based Compensation Expense (Recovery) | 1,931 | | (170) | | 1,236 | | | 317 | | | 3,748 | | 6,376 | | (41) | |
| G&A Expenses, Including Stock-Based Compensation | $ | 10,238 | | $ | 8,114 | | 26 | | | $ | 9,866 | | | $ | 32,800 | | $ | 30,286 | | 8 | |
| (U.S. Dollars Per bbl Sales Volumes NAR) | | | | | | | | | |
| G&A Expenses Before Stock-Based Compensation | $ | 3.42 | | $ | 3.83 | | (11) | | | $ | 3.85 | | | $ | 4.05 | | $ | 3.80 | | 7 | |
| G&A Stock-Based Compensation Expense (Recovery) | 0.80 | | (0.08) | | 1,100 | | | 0.13 | | | 0.52 | | 1.01 | | (49) | |
| G&A Expenses, Including Stock-Based Compensation | $ | 4.22 | | $ | 3.75 | | 13 | | | $ | 3.98 | | | $ | 4.57 | | $ | 4.81 | | (5) | |
G&A Expenses
| | | | | | | | | | | | | | | | | | | | | | | |
| Three Months Ended March 31, | | Three Months Ended December 31, | | |
| (Thousands of U.S. Dollars) | 2023 | 2022 | % Change | | 2022 | | | | | | |
| G&A Expenses Before Stock-Based Compensation | $ | 11,196 | | $ | 7,779 | | 44 | | | $ | 7,998 | | | | | | | |
| G&A Stock-Based Compensation Expense | 1,500 | | 4,557 | | (67) | | | 2,673 | | | | | | | |
| G&A Expenses, Including Stock-Based Compensation | $ | 12,696 | | $ | 12,336 | | 3 | | | $ | 10,671 | | | | | | | |
| (U.S. Dollars Per bbl Sales Volumes NAR) | | | | | | | | | | | |
| G&A Expenses Before Stock-Based Compensation | $ | 4.94 | | $ | 3.80 | | 30 | | | $ | 3.39 | | | | | | | |
| G&A Stock-Based Compensation Expense | 0.66 | | 2.23 | | (70) | | | 1.13 | | | | | | | |
| G&A Expenses, Including Stock-Based Compensation | $ | 5.60 | | $ | 6.03 | | (7) | | | $ | 4.52 | | | | | | | |
expenses before stock-based compensation
For for the three months ended March 31,September 30, 2023, were comparable to the corresponding period of 2022. On a per bbl basis, G&A expenses before stock-based compensation decreased by $0.41 per bbl to $3.42 due to higher sales volumes in the current quarter.
G&A expenses before stock-based compensation for the nine months ended September 30, 2023, increased by 22% to $29.1 million, due to higher consulting costs and legal fees attributed to optimization projects when compared to the corresponding period of 2022. On a per bbl basis, G&A expenses before stock-based compensation increased by 44% to $11.2 million or by $1.14$0.25 per bbl to $4.94$4.05 per bbl, due tofor the same reason mentioned above and higher costs attributed to optimization projects and lease obligationssales volumes during current period.
G&A expenses associated with additional leases whenafter stock-based compensation for the three months ended September 30, 2023, increased 26% compared to the corresponding period of 2022.2022 and increased by $0.47 per bbl due to share price appreciation in the current quarter.
G&A expenses after stock-based compensation for the threenine months ended March 31,September 30, 2023, increased by 3% or $0.438% due to higher G&A expenses before stock-based compensation offset by share price devaluation and decreased by $0.24 per bbl due to a lower share pricehigher sales volumes when compared to the corresponding period of 2022.
Compared to the prior quarter, G&A expenses before stock-based compensation increaseddecreased by 40%13% or $1.55$0.43 on a per bbl basis for the same reason mentioned above.due to lower legal fees and consulting costs attributed to optimization projects.
Compared to the prior quarter, G&A expenses after stock-based compensation increased by 19%4% or $1.08$0.24 on a per bbl basis for the same reason as mentioned above, partially offset by lower stock-based compensation resulting from a lowerdue to share price appreciation in the firstthird quarter of 2023.
Foreign Exchange Gains and Losses
For the three and nine months ended March 31,September 30, 2023, we had a $1.7 million and $8.1 million loss on foreign exchange, of $1.7 million, compared to a $3.7$1.5 million gainand $0.5 million loss in the corresponding periodperiods of 2022, respectively, and a $2.1$4.7 million loss in the prior quarter. Accounts receivable, taxes receivable and payable, deferred income taxes, accounts payable, and prepaid equity forward (“PEF”) are considered monetary items and require translation from local currencies to U.S. dollar functional currency at each balance sheet date. This translation was the primary source of the foreign exchange gains and losses in the periods.
The following table presents the change in the U.S. dollar against the Colombian peso and Canadian dollar for the three and nine months ended March 31,September 30, 2023, and 2022:
| | | Three Months Ended March 31, | | Three Months Ended December 31, | | | Three Months Ended September 30, | | | Nine Months Ended September 30, |
| | 2023 | 2022 | | 2022 | | | 2023 | 2022 | | | 2023 | 2022 |
| Change in the U.S. dollar against the Colombian peso | Change in the U.S. dollar against the Colombian peso | strengthened by | strengthened by | | weakened by | | Change in the U.S. dollar against the Colombian peso | weakened by | strengthened by | | | weakened by | strengthened by |
| 4% | 6% | | 21% | | 3% | 10% | | | 16% | 14% |
| Change in the U.S. dollar against the Canadian dollar | Change in the U.S. dollar against the Canadian dollar | strengthened by | strengthened by | | weakened by | | Change in the U.S. dollar against the Canadian dollar | strengthened by | strengthened by | | | weakened by | strengthened by |
| —% | 2% | | 7% | | 2% | 6% | | | —% | 8% |
Income Tax Expense
| | | | | | | | | | | | | | | | | |
| Three Months Ended September 30, | | Nine Months Ended September 30, |
| (Thousands of U.S. Dollars) | 2023 | 2022 | | 2023 | 2022 |
| Income before income tax | $ | 46,860 | | $ | 60,397 | | | $ | 92,950 | | $ | 205,694 | |
| | | | | |
| Current income tax expense | $ | 26,343 | | $ | 16,820 | | | $ | 63,706 | | $ | 63,072 | |
| Deferred income tax expense | 13,990 | | 4,914 | | | 43,242 | | 36,868 | |
| Income tax expense | $ | 40,333 | | $ | 21,734 | | | $ | 106,948 | | $ | 99,940 | |
| | | | | |
| Effective tax rate | 86 | % | 36 | % | | 115 | % | 49 | % |
| | | | | |
| | | | | |
Income Tax Expense
| | | | | | | | | | | |
| | | Three Months Ended March 31, |
| (Thousands of U.S. Dollars) | | | | 2023 | 2022 |
| Income before income tax | | | | $ | 23,183 | | $ | 53,659 | |
| | | | | |
| Current income tax expense | | | | $ | 17,606 | | $ | 20,827 | |
| Deferred income tax expense | | | | 15,277 | | 18,713 | |
| Total income tax expense | | | | $ | 32,883 | | $ | 39,540 | |
| | | | | |
| Effective tax rate | | | | 142 | % | 74 | % |
| | | | | |
| | | | | |
Current income tax expense was $17.6$63.7 million for the threenine months ended March 31,September 30, 2023, compared to $20.8$63.1 million in the corresponding period inof 2022, primarily due to a decrease in taxable income.income in Colombia, which is subject to a higher Colombian tax rate.
The deferred income tax expense for the threenine months ended March 31,September 30, 2023, was $15.3$43.2 million mainly theprimarily as a result of tax depreciation being higher than accounting depreciation and the use of tax losses to offset taxable income in Colombia. The deferred income tax expense in the comparative period of 2022 was $18.7 million as the result of tax depreciation being higher compared with accounting depreciation in Colombia.
For the threenine months ended March 31,September 30, 2023, the difference between the effective tax rate of 142%115% and the 50% Colombian tax rate was primarily due to an increase in non-deductible foreign translationexchange adjustments, the impact of foreign taxes, non-deductible royaltyroyalties in Colombia and increase in the valuation allowance.non-deductible stock-based compensation. These were partially offset by other permanent differences.a decrease in valuation allowance.
For the threenine months ended March 31,September 30, 2022, the difference between the effective tax rate of 74%49% and the 35% Colombian tax rate was primarily due to an increase$26.6 million of hedging loss, $35.7 million of financing cost related to Senior Notes, and $21.5 million of corporate costs, which were incurred in the impactjurisdictions where no tax benefit is recognized which was partially offset by $12.5 million of non-taxable foreign taxes, foreign translation adjustments, increase in the valuation allowance, other permanent differences, and non-deductible stock-based compensation.exchange gain.
Net Income (Loss) and Funds Flow from Operations (a Non-GAAP Measure)
| | | | | | | | | | | | | | | | |
| (Thousands of U.S. Dollars) | First Quarter 2023 Compared with Fourth Quarter 2022 | % change | First Quarter 2023 Compared with First Quarter 2022 | % change | | |
| Net income for the comparative period | $ | 33,275 | | | $ | 14,119 | | | | |
| Increase (decrease) due to: | | | | | | |
| Sales price | (11,867) | | | (49,120) | | | | |
| Sales volumes | (6,580) | | | 18,741 | | | | |
| Expenses: | | | | | | |
| Operating | 4,750 | | | (6,434) | | | | |
| Transportation | (633) | | | (232) | | | | |
| Cash G&A | (3,198) | | | (3,417) | | | | |
| Net lease payments | 261 | | | 471 | | | | |
| | | | | | |
| Interest, net of amortization of debt issuance costs | (1,064) | | | 186 | | | | |
| Realized foreign exchange | (3,209) | | | (74) | | | | |
| Cash settlements on derivative instruments | — | | | 8,596 | | | | |
| Current taxes | (112) | | | 3,221 | | | | |
| | | | | | |
| Interest income | 325 | | | 768 | | | | |
Net change in funds flow from operations(1) from comparative period | (21,327) | | | (27,294) | | | | |
| Expenses: | | | | | | |
| Depletion, depreciation and accretion | 60 | | | (10,758) | | | | |
| | | | | | |
| Inventory impairment | (475) | | | (475) | | | | |
| Deferred tax | (26,805) | | | 3,436 | | | | |
| Amortization of debt issuance costs | (22) | | | 106 | | | | |
| Stock-based compensation | 1,173 | | | 3,057 | | | | |
| Derivative instruments gain or loss, net of settlements on derivative instruments | — | | | 12,843 | | | | |
| Gain on re-purchase of Senior Notes | 1,090 | | | 1,090 | | | | |
| Other financial instruments gain | (7) | | | — | | | | |
| Unrealized foreign exchange | 3,599 | | | (5,353) | | | | |
| | | | | | |
| Net lease payments | (261) | | | (471) | | | | |
| Net change in net income | (42,975) | | | (23,819) | | | | |
| Net loss for the current period | $ | (9,700) | | (129)% | $ | (9,700) | | 169% | | |
| | | | | | | | | | | | | | | | | | | | |
| (Thousands of U.S. Dollars) | Third Quarter 2023 Compared with Second Quarter 2023 | % change | Third Quarter 2023 Compared with Third Quarter 2022 | % change | Nine Months Ended September 30, 2023 Compared with Nine Months Ended September 30, 2022 | % change |
| Net (loss) income for the comparative period | $ | (10,825) | | | $ | 38,663 | | | $ | 105,754 | | |
| Increase (decrease) due to: | | | | | | |
| Sales price | 25,408 | | | (9,095) | | | (144,152) | | |
| Sales volumes | (3,389) | | | 20,619 | | | 77,414 | | |
| Expenses: | | | | | | |
| Operating | (876) | | | (7,530) | | | (22,961) | | |
| Transportation | (151) | | | (1,425) | | | (2,835) | | |
| Cash G&A | 1,242 | | | (23) | | | (5,142) | | |
| Net lease payments | 86 | | | 110 | | | 695 | | |
| | | | | | |
| Interest, net of amortization of debt issuance costs | (250) | | | (1,239) | | | (1,649) | | |
| Realized foreign exchange | 10,786 | | | (7,130) | | | (21,592) | | |
| Cash settlements on derivative instruments | — | | | 219 | | | 26,611 | | |
| Current taxes | (6,586) | | | (9,523) | | | (634) | | |
| Interest income | (376) | | | 271 | | | 1,686 | | |
Net change in funds flow from operations(1) from comparative period | 25,894 | | | (14,746) | | | (92,559) | | |
| Expenses: | | | | | | |
| Depletion, depreciation and accretion | 1,190 | | | (9,699) | | | (34,450) | | |
| | | | | | |
| | | | | | |
| Deferred tax | (15) | | | (9,076) | | | (6,374) | | |
| Proceeds from debt, net of issuance costs | (575) | | | (843) | | | (625) | | |
| Stock-based compensation | (1,614) | | | (2,101) | | | 2,628 | | |
| Derivative instruments gain or loss, net of settlements on derivative instruments | — | | | (219) | | | — | | |
| | | | | | |
| Unrealized foreign exchange | (7,796) | | | 6,902 | | | 13,952 | | |
| Other gain | 354 | | | (2,244) | | | (1,629) | | |
| Net lease payments | (86) | | | (110) | | | (695) | | |
| Net change in net (loss) income | 17,352 | | | (32,136) | | | (119,752) | | |
| Net income (loss) for the current period | $ | 6,527 | | 160% | $ | 6,527 | | (83)% | $ | (13,998) | | (113)% |
(1)Funds flow from operations is a non-GAAP measure that does not have any standardized meaning prescribed under GAAP. Refer to "Financial and Operational Highlights—non-GAAP measures" for a definition and reconciliation of this measure.
Capital expenditures during the three months ended March 31,September 30, 2023, were $71.1$43.1 million:
| | (Millions of U.S. Dollars) | (Millions of U.S. Dollars) | Colombia | Ecuador | Total | (Millions of U.S. Dollars) | Colombia | Ecuador | Total |
| Exploration | Exploration | $ | 3.2 | | $ | 1.1 | | $ | 4.3 | | Exploration | $ | 4.0 | | $ | 2.9 | | $ | 6.9 | |
| Development: | Development: | | Development: | |
| Drilling and Completions | Drilling and Completions | 45.1 | | — | | 45.1 | | Drilling and Completions | 9.3 | | — | | 9.3 | |
| Facilities | Facilities | 6.3 | | 0.3 | | 6.6 | | Facilities | 5.2 | | 0.6 | | 5.8 | |
| Workovers | Workovers | 5.4 | | — | | 5.4 | | Workovers | 4.8 | | — | | 4.8 | |
| Other | Other | 9.7 | | — | | 9.7 | | Other | 14.0 | | 2.3 | | 16.3 | |
| | $ | 69.7 | | $ | 1.4 | | $ | 71.1 | | | $ | 37.3 | | $ | 5.8 | | $ | 43.1 | |
During the three months ended March 31,September 30, 2023, we commenced drilling the following wells in Colombia:
| | | | | |
| Number of wells (Gross and Net) |
Colombia | |
| |
Development | 10.0 | |
Service | 4.0 | |
| 14.0 | |
| |
| |
| |
We spud 10 development and four water injection wells, of which eight were in Midas Block and six in Chaza. Of the development wells spud during the quarter, six were completed, and four were in-progress as of March 31, 2023. During the three months ended March 31, 2023, we havedid not spud any wells neither in Colombia nor in Ecuador.
On April 11, 2023, we and Ecopetrol S.A. renegotiated the terms of the contract for our operatorship of the Suroriente which was previously scheduled to end in mid-2024. The duration of the contract was extended for 20 years from September 1, 2023 (the “Effective Date”), the date on which we satisfied the relevant conditions precedent and regulatory approval was received. We continue to be the operator of Suroriente. In connection with the contract extension, we paid cash consideration of $6.2 million and provided letters of credit of $123.0 million (see Note 8 in the Notes to Condensed Consolidated Financial Statements (Unaudited) in Part I, Item 1 of this Quarterly Report on Form 10-Q which incorporated herein by reference) related to committed capital investments to be made over a three-year period from the Effective Date.
Liquidity and Capital Resources
| | | | As at | | As at |
| (Thousands of U.S. Dollars) | (Thousands of U.S. Dollars) | March 31, 2023 | | % Change | | December 31, 2022 | (Thousands of U.S. Dollars) | September 30, 2023 | | % Change | | December 31, 2022 |
| Cash and Cash Equivalents | Cash and Cash Equivalents | $ | 105,684 | | | (17) | | | $ | 126,873 | | Cash and Cash Equivalents | $ | 123,216 | | | (3) | | | $ | 126,873 | |
| | | Credit Facility | | Credit Facility | $ | 50,000 | | | 100 | | | $ | — | |
| | 6.25% Senior Notes | 6.25% Senior Notes | $ | 271,909 | | | (3) | | | $ | 279,909 | | 6.25% Senior Notes | $ | 271,909 | | | (3) | | | $ | 279,909 | |
| | 7.75% Senior Notes | 7.75% Senior Notes | $ | 300,000 | | | — | | | $ | 300,000 | | 7.75% Senior Notes | $ | 300,000 | | | — | | | $ | 300,000 | |
|
We believe that our capital resources, including cash on hand, cash generated from operations, and available borrowings under the credit facility, will provide us with sufficient liquidity to meet our strategic objectives and planned capital program for the next 12 months, given the current oil price trends and production levels. We may also access capital markets to pursue financing or refinance our Senior Notes.financing. In accordance with our investment policy, available cash balances are held in our primary cash management banks or may be invested in U.S. or Canadian government-backed federal, provincial or state securities or other money market instruments with high credit ratings and short-term liquidity. We believe that our current financial position provides us with the flexibility to respond to both internal growth opportunities and those available through acquisitions. We intend to pursue growth opportunities and acquisitions from time to time, which may require significant capital, be located in basins or countries beyond our current operations, involve joint ventures, or be sizable compared to our current assets and operations.
At March 31,During the three months ended September 30, 2023, we, had aas guarantor, and Gran Tierra Energy Colombia GmbH and and Gran Tierra Operations Colombia GmbH, as borrowers, amended and restated their credit facility with a market lenderleader in the global commodities industry. As part of the restatement, the initial commitment was adjusted from $100 million to $50 million (maintaining the potential option of up to additional $50 million, subject to approval by the lender). Additionally, the availability period for the draws under the amendment to the credit facility was extended until December 31, 2023. The credit facility has a borrowing base of upcontinues to $150 million, with $100 million readily available at March 31, 2023, and a potential option for an additional $50 million of borrowings upon mutual agreement by the lender and us. The credit facility bearsbear interest based on a risk-freethe secured overnight financing rate posted by the Federal Reserve Bank of New York plus a credit margin of 6.00% and a credit-adjusted spread of 0.26%. Undrawn amounts under the credit facility bear interest at 2.10% per annum, based on the amount available. The credit facility is secured by our Colombian assets and economic rights. Itrights and has a final maturity date of August 15, 2024, which may be extended to February 18, 2025, upon2024. During the satisfaction of certain conditions. The availability period for the draws under the credit facility expires on August 20, 2023. As of March 31,three months ended September 30, 2023, the credit facility remained undrawn.was drawn by $50 million.
Under the terms of the credit facility, we are required to maintain compliance with the following financial covenants:
i.Global Coverage ratioRatio of at least 150%, calculated using the net present value of the consolidated future cash flows of the Company up to the final maturity date discounted at 10% over the outstanding amount on the credit facility at each reporting period. The net present value of the consolidated future cash flows of the Company is required to be based on 80% of the prevailing ICE Brent forward strip.
ii.Prepayment Life Coverage Ratio of at least 150%, calculated using the estimated aggregate value of commodities to be delivered under the commercial contract from the commencement date to the final maturity date based on 80% of the prevailing ICE Brent forward strip and adjusted for quality and transportation discounts over the outstanding amount on the credit facility including interest and all other costs payable to the lender.
iii.Liquidity ratio where the Company’s projected sources of cash exceed projected uses of cash by at least 1.15 times in each quarter period included in one year consolidated future cash flows. The future cash flows represent forecasted expected cash flows from operations, less anticipated capital expenditures, and certain other adjustments. The commodity pricing assumption used in this covenant is required to be 90% of the prevailing ICE Brent forward strip forward for the projected future cash flows.
As of September 30, 2023, the Company was in compliance with all the above covenants.
At March 31,September 30, 2023, we had a $271.9 million aggregate principal amount of 6.25% Senior Notes due 2025 (“6.25% Senior Notes”) and a $300.0 million aggregate principal amount of 7.75% Senior Notes due 2027 (“7.75% Senior Notes” and together with 6.25% Senior Notes, the “Senior Notes”) outstanding.
During the three and nine months ended March 31,September 30, 2023, we repurchasedpurchased in the open market nil and $8.0 million, respectively, of 6.25% Senior Notes for cash consideration of $6.8 million, whichmillion. The purchase resulted in a $1.1 million gain, on re-purchase which included the write-off of deferred financing fees of $0.1 million. The re-purchasedSubsequent to the quarter, the Company cancelled all previously purchased 6.25% Senior Notes. No notes were purchased during the three months ended September 30, 2023.
Subsequent to the quarter, we completed exchange offers of $247.1 million of 6.25% Senior Notes were not cancelled and $275.8 million of 7.75% Senior Notes for $487.6 million newly issued 9.50% Senior Secured Notes due 2029. The exchange consideration for $242.5 million of 6.25% Senior Notes included early participation premium of $80 for each $1,000 aggregate principal amount with the remainder of $4.6 million exchanged at $1,000 and for $274.2 million of 7.75% Senior Notes early participation premium of $20 for each $1,000 aggregate principal amount with remainder of $1.6 million of 7.75% Senior Notes exchanged at $950 for each $1,000 aggregate principal amount. In addition, we paid cash consideration of $60.0 million for 6.25% Senior Notes exchanged as part of total consideration to eligible holders on a pro rata basis, for each $1,000 aggregate principal amount tendered and accepted up to the early exchange deadline. The settlement date of the exchange offer was on October 20, 2023. The Senior Notes tendered and accepted for exchange, as well as the notes held by us as treasury bonds, as of March 31, 2023.were cancelled.
During the year ended December 31, 2022, we implemented a share re-purchase program (the “2022 Program”) through the facilities of the Toronto Stock Exchange (“TSX”) and eligible alternative trading platforms in Canada. Under the 2022 Program, we arewere able to purchase at prevailing market prices up to 36,033,9693,603,396 shares of Common Stock, representing approximately 10% of the issued and outstanding shares of Common Stock as of August 22, 2022. The 2022 Program expires on August 31, 2023, or earlier if the 10% share maximum is reached. Re-purchases are subject to prevailing market conditions, the trading price of our Common Stock, our financial performance and other conditions.
During the three and nine months ended March 31,September 30, 2023, we re-purchased 13,082,115nil and 1,328,650 shares at a weighted average price of $0.82nil and $8.15 per share. The re-purchasedshare, respectively (three and nine months ended September 30, 2022 - 1,073,370 shares). As of September 30, 2023, all 3,603,396 shares were held by us recorded as treasury stock. As of March 31,stock were canceled. The 2022 Program expired in May 2023 the Company held 35,829,577 treasury stock shares (December 31, 2022 - 22,747,462).
Cash Flows
The following table presents our primary sources and uses of cash and cash equivalents and restricted cash and cash equivalents for the periods presented:
| | | Three Months Ended March 31, | | Nine Months Ended September 30, |
| (Thousands of U.S. Dollars) | (Thousands of U.S. Dollars) | 2023 | 2022 | (Thousands of U.S. Dollars) | 2023 | 2022 |
| Sources of cash and cash equivalents: | Sources of cash and cash equivalents: | | Sources of cash and cash equivalents: | |
| Net (loss) income | Net (loss) income | $ | (9,700) | | $ | 14,119 | | Net (loss) income | $ | (13,998) | | $ | 105,754 | |
Adjustments to reconcile net loss to Adjusted EBITDA(1) and funds flow from operations(1) | Adjustments to reconcile net loss to Adjusted EBITDA(1) and funds flow from operations(1) | | Adjustments to reconcile net loss to Adjusted EBITDA(1) and funds flow from operations(1) | |
| DD&A expenses | DD&A expenses | 51,721 | | 40,963 | | DD&A expenses | 162,949 | | 128,499 | |
| Inventory impairment | 475 | | — | | |
| | Interest expense | Interest expense | 11,836 | | 12,128 | | Interest expense | 38,017 | | 35,743 | |
| Income tax expense | Income tax expense | 32,883 | | 39,540 | | Income tax expense | 106,948 | | 99,940 | |
| | Non-cash lease expenses | Non-cash lease expenses | 1,144 | | 411 | | Non-cash lease expenses | 3,488 | | 2,009 | |
| Lease payments | Lease payments | (606) | | (344) | | Lease payments | (1,918) | | (1,134) | |
| Unrealized foreign exchange loss (gain) | 514 | | (4,839) | | |
| Foreign exchange loss | | Foreign exchange loss | 8,126 | | 486 | |
| Stock-based compensation expense | Stock-based compensation expense | 1,500 | | 4,557 | | Stock-based compensation expense | 3,748 | | 6,376 | |
| Unrealized derivative instruments loss | — | | 12,843 | | |
| Gain on re-purchase of Senior Notes | (1,090) | | — | | |
| | Other gain | | Other gain | (969) | | (2,598) | |
| Adjusted EBITDA(1) | Adjusted EBITDA(1) | 88,677 | | 119,378 | | Adjusted EBITDA(1) | 306,391 | | 375,075 | |
| Current income tax expense | Current income tax expense | (17,606) | | (20,827) | | Current income tax expense | (63,706) | | (63,072) | |
| Contractual interest and other financing expenses | Contractual interest and other financing expenses | (11,055) | | (11,241) | | Contractual interest and other financing expenses | (34,623) | | (32,974) | |
| Realized foreign exchange (loss) gain | | Realized foreign exchange (loss) gain | (15,940) | | 5,652 | |
Funds flow from operations(1) | Funds flow from operations(1) | 60,016 | | 87,310 | | Funds flow from operations(1) | 192,122 | | 284,681 | |
| Proceeds from exercise of stock options | Proceeds from exercise of stock options | — | | 980 | | Proceeds from exercise of stock options | 8 | | 1,294 | |
| Proceeds from issuance of shares of Common Stock, net of issuance costs | — | | 2 | | |
| | | Net changes in assets and liabilities from operating activities | Net changes in assets and liabilities from operating activities | — | | 16,520 | | Net changes in assets and liabilities from operating activities | — | | 72,838 | |
| Foreign exchange gain on cash and cash equivalents and restricted cash and cash equivalents | | Foreign exchange gain on cash and cash equivalents and restricted cash and cash equivalents | 5,897 | | — | |
| Proceeds from debt, net of issuance costs | | Proceeds from debt, net of issuance costs | 48,125 | | — | |
| Changes in non-cash investing working capital | Changes in non-cash investing working capital | 14,871 | | — | | Changes in non-cash investing working capital | — | | 3,255 | |
| | 74,887 | | 104,812 | | | 246,152 | | 362,068 | |
| | Uses of cash and cash equivalents: | Uses of cash and cash equivalents: | | Uses of cash and cash equivalents: | |
| Additions to property, plant and equipment | Additions to property, plant and equipment | (71,062) | | (41,483) | | Additions to property, plant and equipment | (179,707) | | (163,717) | |
| Net changes in assets and liabilities from operating activities | Net changes in assets and liabilities from operating activities | (10,763) | | — | | Net changes in assets and liabilities from operating activities | (34,235) | | — | |
| Changes in non-cash investing working capital | | Changes in non-cash investing working capital | (11,051) | | — | |
| Repayment of debt | Repayment of debt | — | | (27,525) | | Repayment of debt | — | | (67,623) | |
| Changes in non-cash investing working capital | — | | (1,803) | | |
| Re-purchase of Common Stock | (10,718) | | — | | |
| Re-purchase of Senior Notes | (4,225) | | — | | |
| Debt issuance costs | (50) | | — | | |
| Re-purchase of shares of Common Stock | | Re-purchase of shares of Common Stock | (10,825) | | (14,365) | |
| Purchase of Senior Notes | | Purchase of Senior Notes | (6,805) | | (17,274) | |
| | Settlement of asset retirement obligations | Settlement of asset retirement obligations | — | | (5) | | Settlement of asset retirement obligations | (376) | | (1,673) | |
| Lease payments | Lease payments | (1,105) | | (777) | | Lease payments | (5,101) | | (1,991) | |
| Foreign exchange loss on cash, cash equivalents and restricted cash and cash equivalents | 2,214 | | 478 | | |
| Foreign exchange loss on cash, and cash equivalents and restricted cash and cash equivalents | | Foreign exchange loss on cash, and cash equivalents and restricted cash and cash equivalents | — | | (1,996) | |
| | (95,709) | | (71,115) | | | (248,100) | | (268,639) | |
| Net (decrease) increase in cash and cash equivalents and restricted cash and cash equivalents | Net (decrease) increase in cash and cash equivalents and restricted cash and cash equivalents | $ | (20,822) | | $ | 33,697 | | Net (decrease) increase in cash and cash equivalents and restricted cash and cash equivalents | $ | (1,948) | | $ | 93,429 | |
(1) Adjusted EBITDA and funds flow from operations are non-GAAP measures which do not have any standardized meaning prescribed under GAAP. Refer to “Financial and Operational Highlights - non-GAAP measures” for a definition and reconciliation of this measure.
One of the primary sources of variability in our cash flows from operating activities is the fluctuation in oil prices. Sales volume changes, costs related to operations and debt servicetransactions also impact cash flows. Our cash flows from operating activities are also impacted by foreign currency exchange rate changes. During the three and nine months ended March 31,September 30, 2023, funds flow from operations decreased by 31%16% and 33%, respectively, compared to the corresponding periodperiods of 2022, primarily due to a decrease in Brent price, lower and higher quality and transportation discounts, andrespectively, higher operating costs.costs and realized foreign exchange loss.
Critical Accounting Policies and Estimates
Our critical accounting policies and estimates are disclosed in Item 7 of our 2022 Annual Report on Form 10-K and have not changed materially since the filing of that document.
Item 3. Quantitative and Qualitative Disclosures About Market Risk
Commodity price risk
Our principal market risk relates to oil prices. Oil prices are volatile and unpredictable and influenced by concerns over world supply and demand imbalance and many other market factors outside of our control. Our revenues are from oil sales at ICE Brent adjusted for quality differentials.
Foreign currency risk
Foreign currency risk is a factor for our Company but is ameliorated to a certain degree by the nature of expenditures and revenues in the countries where we operate. Our reporting currency is U.S. dollars and 100% of our revenues are related to the U.S. dollar price of Brent adjusted for quality differentials. We receive 100% of our revenues in U.S. dollars and the majority of our capital expenditures is in U.S. dollars or is based on U.S. dollar prices. The majority of value added taxes, operating and G&A expenses in Colombia are in the local currency. Certain G&A expenses incurred at our head office in Canada are denominated in Canadian dollars. While we operate in South America exclusively, the majority of our acquisition expenditures have been valued and paid in U.S. dollars.
Additionally, foreign exchange gains and losses result primarily from the fluctuation of the U.S. dollar to the Colombian peso due to our current and deferred tax assets and liabilities which are monetary assets and liabilities denominated in the local currency of the Colombian foreign operations. As a result, a foreign exchange gain or loss must be calculated on conversion to the U.S. dollar functional currency.
Interest Rate Risk
Interest rate risk is the risk that future cash flows will fluctuate as a result of changes in market interest rates. We are exposed to interest rate fluctuations on our credit facility, which bears floating rates of interest. At March 31,September 30, 2023, our outstanding balance under the credit facility was nil$50 million (December 31, 2022 - nil).
Item 4. Controls and Procedures
Disclosure Controls and Procedures
We have established disclosure controls and procedures (as defined in Rules 13a-15(e) and 15d-15(e) under the Securities Exchange Act of 1934, or Exchange Act). Our disclosure controls and procedures are designed to provide reasonable assurance that the information required to be disclosed by Gran Tierra in the reports that it files or submits under the Exchange Act is recorded, processed, summarized, and reported within the time periods specified in the SEC rules and forms and that such information is accumulated and communicated to management, including our Chief Executive Officer and Chief Financial Officer, as appropriate, to allow timely decisions regarding required disclosure. Our management, with the participation of our Chief Executive Officer and Chief Financial Officer, evaluated the effectiveness of the design and operation of our disclosure controls and procedures as of the end of the period covered by this report, as required by Rule l3a-15(b) of the Exchange Act. Based on this evaluation, our Chief Executive Officer and Chief Financial Officer have concluded that Gran Tierra’s disclosure controls and procedures were effective as of March 31,September 30, 2023.
Changes in Internal Control over Financial Reporting
There were no changes in our internal control over financial reporting during the quarter ended March 31,September 30, 2023, that have materially affected, or are reasonably likely to materially affect our internal control over financial reporting.
PART II - Other Information
Item 1. Legal Proceedings
See Note 8 in the Notes to the Condensed Consolidated Financial Statements (Unaudited) in Part I, Item 1 of this Quarterly Report on Form 10-Q, which is incorporated herein by reference, for any material developments with respect to matters previously reported in our Annual Report on Form 10-K for the year ended December 31, 2022, and any material matters that have arisen since the filing of such report.
Item 1A. Risk Factors
There are numerous factors that affect our business and results of operations, many of which are beyond our control. In addition to information set forth in this quarterly report on Form 10-Q, including in Part I, Item 2 “Management’s Discussion and Analysis of Financial Condition and Results of Operations”, you should carefully read and consider the factors set out in Part I, Item 1A “Risk Factors” in our Annual Report on Form 10-K for the year ended December 31, 2022. These risk factors could materially affect our business, financial condition and results of operations. The unprecedented nature of ongoing conflicts in several parts of the current pandemic andworld, the volatility in the worldwide economy and oil and gas industry may make it more difficult to identify all the risks to our business, results of operations and financial condition and the ultimate impact of identified risks.
Item 2. Unregistered Sales of Equity Securities and Use of Proceeds
Issuer Purchases of Equity Securities
| | | | | | | | | | | | | | | |
| (a)
Total Number of Shares Purchased | (b)
Average Price Paid per Share (1) | (c) Total Number of Shares Purchased as Part of Publicly Announced Plans or Programs | (d) Maximum Number of Shares that May Yet be Purchased Under the Plans or Programs (2) | |
| January 1-31, 2023 | — | | $ | — | | — | | 13,286,507 | | |
| February 1-28, 2023 | — | | $ | — | | — | | 13,286,507 | | |
| March 1-31, 2023 | 13,082,115 | | $ | 0.82 | | 13,082,115 | | 204,392 | | |
| Total | 13,082,115 | | $ | 0.82 | | 13,082,115 | | 204,392 | | |
(1) Including commission fees paid to the broker to re-purchase the Common Stock.
None.
(2)
Item 5. Other Information
On August 29, 2022, we announced that we intended to implement a share re-purchase program (the “2022 Program”) through
During the facilitiesthree months ended September 30, 2023, no director or Section 16 officer adopted or terminated any Rule 10b5-1 trading arrangements or non-Rule 10b5-1 trading arrangements (in each case, as defined in Item 408(a) of the TSX and eligible alternative trading platforms in Canada commencing September 1, 2022, and ending on August 31, 2023. We will be able to purchase for cancellation at prevailing market prices up to 36,033,969 shares of Common Stock, representing approximately 10% of our issued and outstanding shares of Common Stock as of August 22, 2022.Regulation S-K).
Item 6. Exhibits
| | | | | | | | | | | |
| Exhibit No. | Description | | Reference |
| | | |
| 3.1 | | | Incorporated by reference to Exhibit 3.3 to the Current Report on Form 8-K, filed with the SEC on November 4, 2016 (SEC File No. 001-34018). |
| | | |
| 3.2 | | | Incorporated by reference to Exhibit 3.1 to the Current Report on Form 8-K, filed with the SEC on May 5, 2023 (SEC File No. 001-34018). |
| | | |
| 3.3 | | | Incorporated by reference to Exhibit 3.4 to the Current Report on Form 8-K, filed with the SEC on November 4, 2016 (SEC File No. 001-34018). |
| | | |
3.33.4 | | | Incorporated by reference to Exhibit 3.1 to the Current Report on Form 8-K filed with the SEC on August 4, 2021 (SEC File No. 001-34018). |
| | | |
| 3.5 | | | Incorporated by reference to Exhibit 3.1 to the Current Report on Form 8-K filed with the SEC on July 9, 2018 (SEC File No. 001-34018). |
| | | |
3.410.1 | | | Incorporated by reference to Exhibit 3.1 to the Current
Report on Form 8-K filed with the SEC on August 4,
2021 (SEC File No. 001-34018).Filed herewith. |
| | | |
| 31.1 | | | Filed herewith. |
| | | |
| 31.2 | | | Filed herewith. |
| | | |
| 32.1 | | | Furnished herewith. |
101.INS XBRL Instance Document - the instance document does not appear in the Interactive Data File because its XBRL tags are embedded within the Inline XBRL document
101.SCH Inline XBRL Taxonomy Extension Schema Document
101.CAL Inline XBRL Taxonomy Extension Calculation Linkbase Document
101.DEF Inline XBRL Taxonomy Extension Definition Linkbase Document
101.LAB Inline XBRL Taxonomy Extension Label Linkbase Document
101.PRE Inline XBRL Taxonomy Extension Presentation Linkbase Document
104.The cover page from Gran Tierra Energy Inc.’s Quarterly Report on Form 10-Q for the quarter ended March 31,September 30, 2023, formatted in Inline XBRL (included within the Exhibit 101 attachments).
SIGNATURES
Pursuant to the requirements of the Securities Exchange Act of 1934, the registrant has duly caused this report to be signed on its behalf by the undersigned thereunto duly authorized.
GRAN TIERRA ENERGY INC.
| | | | | | | | |
Date: May 2,October 31, 2023 | | /s/ Gary S. Guidry |
| | | By: Gary S. Guidry |
| | | President and Chief Executive Officer |
| | | (Principal Executive Officer) |
| | | | | | | | |
Date: May 2,October 31, 2023 | | /s/ Ryan Ellson |
| | | By: Ryan Ellson |
| | Executive Vice President and Chief Financial Officer |
| | | (Principal Financial and Accounting Officer) |