UNITED STATES
SECURITIES AND EXCHANGE COMMISSION
Washington, D.C. 20549
FORM 10-Q
|
| | | | |
þ☑ | QUARTERLY REPORT PURSUANT TO SECTION 13 OR 15(d) OF THE SECURITIES EXCHANGE ACT OF 1934 |
| For the quarterly period ended June 30, 2021 |
For the quarterly period ended September 30, 2017
or
|
| | | | |
¨☐ | TRANSITION REPORT PURSUANT TO SECTION 13 OR 15(d) OF THE SECURITIES EXCHANGE ACT OF 1934 |
| For the transition period from to . |
For the transition period from to .
Commission file number:000-50600
Blackbaud, Inc.
(Exact name of registrant as specified in its charter)
| | | | | |
| |
| Delaware | 11-2617163 |
Delaware | 11-2617163 |
| (State or other jurisdiction of incorporation or organization) | (I.R.S. Employer Identification No.) |
2000 Daniel Island Drive65 Fairchild Street
Charleston, South Carolina 29492
(Address of principal executive offices, including zip code)
(843) 216-6200
(Registrant’s telephone number, including area code)
| | | | | | | | |
| | |
| Securities Registered Pursuant to Section 12(b) of the Act: |
| Title of Each Class | Trading Symbol(s) | Name of Each Exchange on which Registered |
| Common Stock, $0.001 Par Value | BLKB | Nasdaq Global Select Market |
| | |
Indicate by check mark whether the registrant (1) has filed all reports required to be filed by Section 13 or 15(d) of the Securities Exchange Act of 1934 during the preceding 12 months (or for such shorter period that the registrant was required to file such reports), and (2) has been subject to such filing requirements for the past 90 days.
YES þ NO ¨Yes☑No☐
Indicate by check mark whether the registrant has submitted electronically and posted on its corporate web site, if any, every Interactive Data File required to be submitted and posted pursuant to Rule 405 of Regulation S-T (Section 232.405 of this chapter) during the preceding 12 months (or for such shorter period that the registrant was required to submit and post such files).
YES þ NO ¨Yes☑No☐
Indicate by check mark whether the registrant is a large accelerated filer, an accelerated filer, a non-accelerated filer, a smaller reporting company, or an emerging growth company. See the definitions of “large accelerated filer,” “accelerated filer,” “smaller reporting company,” and "emerging growth company" in Rule 12b-2 of the Exchange Act.
| | | | | | | | | | | | | | |
| Large accelerated filer | ☑ | | Accelerated filer | ☐ |
| Non-accelerated filer | ☐ | | Smaller reporting company | ☐ |
| | |
Large accelerated filer þ
| Accelerated filer | ¨ |
Non-accelerated filer ¨ (Do not check if a smaller reporting company)
| Smaller reporting company | ¨ |
| Emerging growth company | ¨☐ |
If an emerging growth company, indicate by check mark if the registrant has elected not to use the extended transition period for complying with any new or revised financial accounting standards provided pursuant to Section 13(a) of the Exchange Act.¨☐
Indicate by check mark whether registrant is a shell company (as defined in Rule 12b-2 of the Exchange Act).
YES ¨ NO þYes☐No☑
The number of shares of the registrant’s Common Stock outstanding as of October 23, 2017August 2, 2021 was 48,089,595.48,883,115.
TABLE OF CONTENTS
|
| | | | | | | |
ThirdSecond Quarter 20172021 Form 10-Q | | 1 |
|
| | | | | | | |
| | CAUTIONARY STATEMENT REGARDING FORWARD-LOOKING STATEMENTS |
This Quarterly Report on Form 10-Q, including the documents incorporated herein by reference, contains forward-looking statements that anticipate results based on our estimates, assumptions and plans that are subject to uncertainty. These "forward-looking statements" are made subject to the safe-harbor provisions of the Private Securities Litigation Reform Act of 1995, Section 27A of the Securities Act of 1933, as amended, and Section 21E of the Securities Exchange Act of 1934, as amended. Forward-looking statements consist of, among other things, specific and overall impacts of the COVID-19 global pandemic on our financial condition and results of operations and on the markets and communities in which we and our customers and partners operate, trend analyses, statements regarding future events, future financial performance, our anticipated growth, the effect of general economic and market conditions, our business strategy and our plan to build and grow our business, our operating results, our ability to successfully integrate acquired businesses and technologies, the effect of foreign currency exchange rate and interest rate fluctuations on our financial results, the impact of expensing stock-based compensation, the sufficiency of our capital resources, our ability to meet our ongoing debt and obligations as they become due, cybersecurity and data protection risks and related liabilities, and current or potential litigationlegal proceedings involving us, all of which are based on current expectations, estimates, and forecasts, and the beliefs and assumptions of our management. Words such as “believes,” “seeks,” “expects,” “may,” “might,” “should,” “intends,” “could,” “would,” “likely,” “will,” “targets,” “plans,” “anticipates,” “aims,” “projects,” “estimates” or any variations of such words and similar expressions are also intended to identify such forward-looking statements. These forward-looking statements are subject to risks, uncertainties and assumptions that are difficult to predict. Accordingly, they should not be viewed as assurances of future performance, and actual results may differ materially and adversely from those expressed in any forward-looking statements.
Important factors that could cause actual results to differ materially from our expectations expressed in forward-looking statements include, but are not limited to, those summarized under “Item“Part II, Item 1A. Risk factors” and elsewhere in this report, in our Annual Report on Form 10-K for the year ended December 31, 20162020 and in our other SEC filings.filings made with the United States Securities & Exchange Commission ("SEC"). Forward-looking statements represent our management's beliefs and assumptions only as of the date of this Quarterly Report on Form 10-Q. We undertake no obligation to update or revise any forward-looking statements, or to update the reasons actual results could differ materially from those anticipated in any forward-looking statement, whether as a result of new information, future events or otherwise.
|
| | | | | | | |
| 2 | | ThirdSecond Quarter 20172021 Form 10-Q |
|
| | | | | | | |
| | PART I. FINANCIAL INFORMATION |
ITEM 1. FINANCIAL STATEMENTS
| | Blackbaud, Inc. Consolidated balance sheets (Unaudited) | |
Blackbaud, Inc.
Condensed Consolidated Balance Sheets
(Unaudited) | | Blackbaud, Inc.
Condensed Consolidated Balance Sheets
(Unaudited) |
| (dollars in thousands) | September 30,
2017 |
| December 31,
2016 |
| (dollars in thousands) | June 30,
2021 | December 31,
2020 |
| Assets | | Assets | |
| Current assets: | | Current assets: | |
| Cash and cash equivalents | $ | 17,050 |
| $ | 16,902 |
| Cash and cash equivalents | $ | 28,288 | | $ | 35,750 | |
| Restricted cash due to customers | 139,095 |
| 353,771 |
| |
| Accounts receivable, net of allowance of $4,540 and $3,291 at September 30, 2017 and December 31, 2016, respectively | 100,868 |
| 88,932 |
| |
| Restricted cash | | Restricted cash | 434,567 | | 609,219 | |
| Accounts receivable, net of allowance of $9,911 and $10,292 at June 30, 2021 and December 31, 2020, respectively | | Accounts receivable, net of allowance of $9,911 and $10,292 at June 30, 2021 and December 31, 2020, respectively | 119,270 | | 95,404 | |
| Customer funds receivable | | Customer funds receivable | 5,390 | | 321 | |
| Prepaid expenses and other current assets | 50,082 |
| 48,314 |
| Prepaid expenses and other current assets | 103,493 | | 78,366 | |
| Total current assets | 307,095 |
| 507,919 |
| Total current assets | 691,008 | | 819,060 | |
| Property and equipment, net | 43,903 |
| 50,269 |
| Property and equipment, net | 104,914 | | 105,177 | |
| Operating lease right-of-use assets | | Operating lease right-of-use assets | 22,630 | | 22,671 | |
| Software development costs, net | 48,618 |
| 37,582 |
| Software development costs, net | 116,562 | | 111,827 | |
| Goodwill | 472,776 |
| 438,240 |
| Goodwill | 637,510 | | 635,854 | |
| Intangible assets, net | 252,713 |
| 253,676 |
| Intangible assets, net | 260,072 | | 277,506 | |
| Other assets | 21,889 |
| 22,524 |
| Other assets | 70,666 | | 72,639 | |
| Total assets | $ | 1,146,994 |
| $ | 1,310,210 |
| Total assets | $ | 1,903,362 | | $ | 2,044,734 | |
| Liabilities and stockholders’ equity | | Liabilities and stockholders’ equity | |
| Current liabilities: | | Current liabilities: | |
| Trade accounts payable | $ | 17,830 |
| $ | 23,274 |
| Trade accounts payable | $ | 30,605 | | $ | 27,836 | |
| Accrued expenses and other current liabilities | 45,650 |
| 54,196 |
| Accrued expenses and other current liabilities | 55,808 | | 52,228 | |
| Due to customers | 139,095 |
| 353,771 |
| Due to customers | 438,633 | | 608,264 | |
| Debt, current portion | 8,576 |
| 4,375 |
| Debt, current portion | 12,911 | | 12,840 | |
| Deferred revenue, current portion | 277,008 |
| 244,500 |
| Deferred revenue, current portion | 339,670 | | 312,236 | |
| Total current liabilities | 488,159 |
| 680,116 |
| Total current liabilities | 877,627 | | 1,013,404 | |
| Debt, net of current portion | 329,380 |
| 338,018 |
| Debt, net of current portion | 531,973 | | 518,193 | |
| Deferred tax liability | 39,352 |
| 29,558 |
| Deferred tax liability | 56,227 | | 54,086 | |
| Deferred revenue, net of current portion | 5,412 |
| 6,440 |
| Deferred revenue, net of current portion | 5,749 | | 4,678 | |
| Operating lease liabilities, net of current portion | | Operating lease liabilities, net of current portion | 17,173 | | 17,357 | |
| Other liabilities | 7,799 |
| 8,533 |
| Other liabilities | 9,339 | | 10,866 | |
| Total liabilities | 870,102 |
| 1,062,665 |
| Total liabilities | 1,498,088 | | 1,618,584 | |
| Commitments and contingencies (see Note 10) |
| |
| Commitments and contingencies (see Note 9) | | Commitments and contingencies (see Note 9) | 0 |
| Stockholders’ equity: | | Stockholders’ equity: | |
| Preferred stock; 20,000,000 shares authorized, none outstanding | — |
| — |
| |
| Common stock, $0.001 par value; 180,000,000 shares authorized, 58,503,687 and 57,672,401 shares issued at September 30, 2017 and December 31, 2016, respectively | 59 |
| 58 |
| |
| Preferred stock; 20,000,000 shares authorized, 0ne outstanding | | Preferred stock; 20,000,000 shares authorized, 0ne outstanding | 0 | | 0 | |
| Common stock, $0.001 par value; 180,000,000 shares authorized, 62,332,714 and 60,904,638 shares issued at June 30, 2021 and December 31, 2020, respectively | | Common stock, $0.001 par value; 180,000,000 shares authorized, 62,332,714 and 60,904,638 shares issued at June 30, 2021 and December 31, 2020, respectively | 62 | | 61 | |
| Additional paid-in capital | 341,476 |
| 310,452 |
| Additional paid-in capital | 605,486 | | 544,963 | |
| Treasury stock, at cost; 10,426,122 and 10,166,801 shares at September 30, 2017 and December 31, 2016, respectively | (234,329 | ) | (215,237 | ) | |
| Accumulated other comprehensive loss | (1,013 | ) | (457 | ) | |
| Treasury stock, at cost; 13,451,524 and 12,054,268 shares at June 30, 2021 and December 31, 2020, respectively | | Treasury stock, at cost; 13,451,524 and 12,054,268 shares at June 30, 2021 and December 31, 2020, respectively | (449,877) | | (353,091) | |
| Accumulated other comprehensive income (loss) | | Accumulated other comprehensive income (loss) | 6,291 | | (2,497) | |
| Retained earnings | 170,699 |
| 152,729 |
| Retained earnings | 243,312 | | 236,714 | |
| Total stockholders’ equity | 276,892 |
| 247,545 |
| Total stockholders’ equity | 405,274 | | 426,150 | |
| Total liabilities and stockholders’ equity | $ | 1,146,994 |
| $ | 1,310,210 |
| Total liabilities and stockholders’ equity | $ | 1,903,362 | | $ | 2,044,734 | |
| | | |
| The accompanying notes are an integral part of these consolidated financial statements. | |
| The accompanying notes are an integral part of these condensed consolidated financial statements. | | The accompanying notes are an integral part of these condensed consolidated financial statements. |
|
| | | | | | | |
ThirdSecond Quarter 20172021 Form 10-Q | | 3 |
| Blackbaud, Inc.
Condensed Consolidated Statements of Comprehensive Income
(Unaudited) | | Blackbaud, Inc.
Condensed Consolidated Statements of Comprehensive Income
(Unaudited) |
| | | | | | | | | | | Three months ended
June 30, | | Six months ended
June 30, |
Blackbaud, Inc. Consolidated statements of comprehensive income (Unaudited) | |
| (dollars in thousands, except per share amounts) | Three months ended
September 30, | | | Nine months ended
September 30, | | |
| 2017 |
| 2016 |
| | 2017 |
| 2016 |
| (dollars in thousands, except per share amounts) | 2021 | 2020 | | 2021 | 2020 |
| Revenue | | | | Revenue | | | |
| Subscriptions | $ | 127,492 |
| $ | 105,440 |
| | $ | 370,923 |
| $ | 306,330 |
| |
| Maintenance | 31,486 |
| 36,410 |
| | 98,184 |
| 111,019 |
| |
| Services and other | 36,535 |
| 41,213 |
| | 102,222 |
| 115,161 |
| |
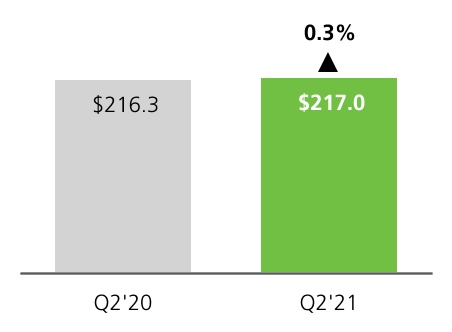
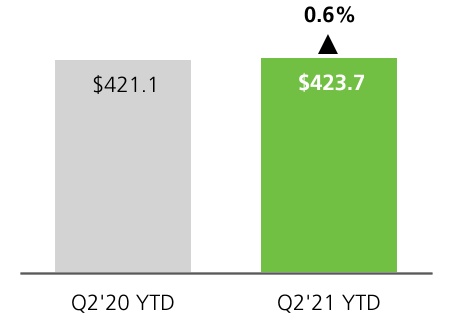
| Recurring | | Recurring | $ | 216,986 | | $ | 216,260 | | | $ | 423,736 | | $ | 421,127 | |
| One-time services and other | | One-time services and other | 12,454 | | 15,731 | | | 24,895 | | 34,485 | |
| Total revenue | 195,513 |
| 183,063 |
| | 571,329 |
| 532,510 |
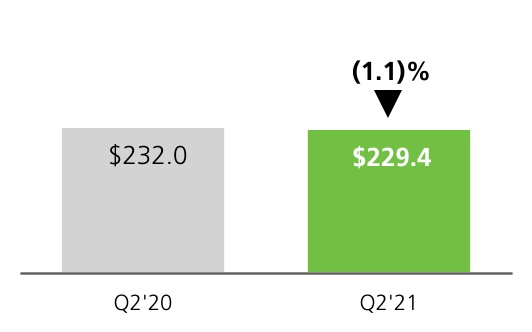
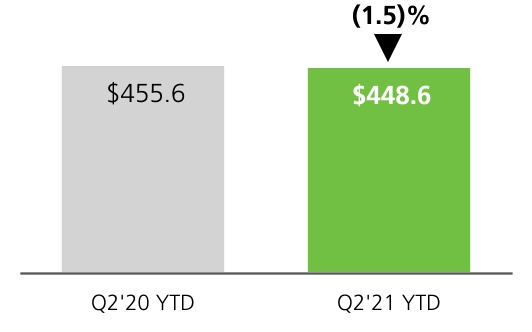
| Total revenue | 229,440 | | 231,991 | | | 448,631 | | 455,612 | |
| Cost of revenue | | | | Cost of revenue | |
| Cost of subscriptions | 58,045 |
| 51,943 |
| | 170,336 |
| 153,772 |
| |
| Cost of maintenance | 5,698 |
| 5,531 |
| | 17,551 |
| 16,547 |
| |
| Cost of services and other | 23,262 |
| 25,843 |
| | 71,595 |
| 76,499 |
| |
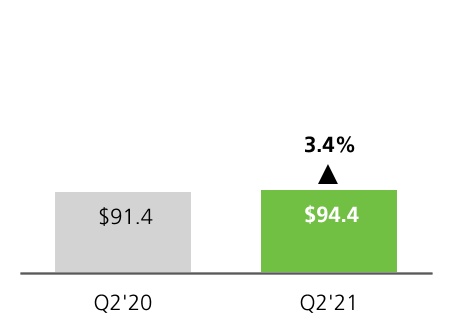
| Cost of recurring | | Cost of recurring | 94,435 | | 91,370 | | | 183,300 | | 180,921 | |
| Cost of one-time services and other | | Cost of one-time services and other | 13,635 | | 13,569 | | | 28,155 | | 28,883 | |
| Total cost of revenue | 87,005 |
| 83,317 |
| | 259,482 |
| 246,818 |
| Total cost of revenue | 108,070 | | 104,939 | | | 211,455 | | 209,804 | |
| Gross profit | 108,508 |
| 99,746 |
| | 311,847 |
| 285,692 |
| Gross profit | 121,370 | | 127,052 | | | 237,176 | | 245,808 | |
| Operating expenses | | | | Operating expenses | | | |
| Sales, marketing and customer success | 44,193 |
| 40,690 |
| | 129,394 |
| 115,707 |
| Sales, marketing and customer success | 45,452 | | 51,954 | | | 94,245 | | 110,689 | |
| Research and development | 22,071 |
| 22,510 |
| | 67,647 |
| 67,973 |
| Research and development | 30,222 | | 24,895 | | | 59,401 | | 49,872 | |
| General and administrative | 23,545 |
| 22,319 |
| | 67,350 |
| 62,089 |
| General and administrative | 32,008 | | 29,842 | | | 62,595 | | 55,697 | |
| Amortization | 734 |
| 687 |
| | 2,164 |
| 2,147 |
| Amortization | 567 | | 729 | | | 1,116 | | 1,470 | |
| Restructuring | | Restructuring | 78 | | 50 | | | 132 | | 74 | |
| Total operating expenses | 90,543 |
| 86,206 |
| | 266,555 |
| 247,916 |
| Total operating expenses | 108,327 | | 107,470 | | | 217,489 | | 217,802 | |
| Income from operations | 17,965 |
| 13,540 |
| | 45,292 |
| 37,776 |
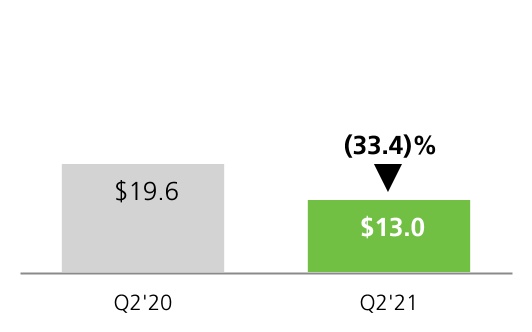
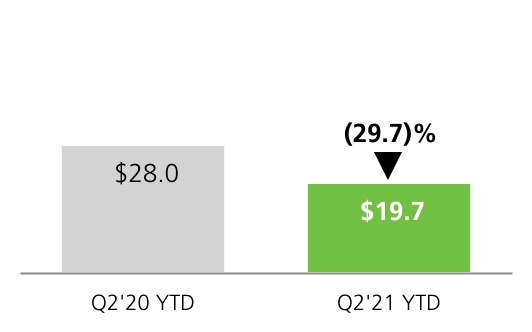
| Income from operations | 13,043 | | 19,582 | | | 19,687 | | 28,006 | |
| Interest expense | (3,092 | ) | (2,641 | ) | | (8,685 | ) | (8,037 | ) | Interest expense | (5,054) | | (3,893) | | | (10,168) | | (8,052) | |
| Other income (expense), net | 468 |
| (15 | ) | | 1,581 |
| (185 | ) | Other income (expense), net | 487 | | 630 | | | (523) | | 1,700 | |
| Income before provision for income taxes | 15,341 |
| 10,884 |
| | 38,188 |
| 29,554 |
| Income before provision for income taxes | 8,476 | | 16,319 | | | 8,996 | | 21,654 | |
| Income tax provision | 2,793 |
| 1,950 |
| | 2,964 |
| 5,323 |
| Income tax provision | 1,745 | | 4,496 | | | 2,429 | | 5,192 | |
| Net income | $ | 12,548 |
| $ | 8,934 |
| | $ | 35,224 |
| $ | 24,231 |
| Net income | $ | 6,731 | | $ | 11,823 | | | $ | 6,567 | | $ | 16,462 | |
| Earnings per share | | | | Earnings per share | | | |
| Basic | $ | 0.27 |
| $ | 0.19 |
| | $ | 0.76 |
| $ | 0.53 |
| Basic | $ | 0.14 | | $ | 0.25 | | | $ | 0.14 | | $ | 0.34 | |
| Diluted | $ | 0.26 |
| $ | 0.19 |
| | $ | 0.74 |
| $ | 0.51 |
| Diluted | $ | 0.14 | | $ | 0.24 | | | $ | 0.14 | | $ | 0.34 | |
| Common shares and equivalents outstanding | | | | Common shares and equivalents outstanding | |
| Basic weighted average shares | 46,711,709 |
| 46,159,956 |
| | 46,627,213 |
| 46,078,306 |
| Basic weighted average shares | 47,756,326 | | 48,239,928 | | | 47,560,847 | | 48,138,125 | |
| Diluted weighted average shares | 47,846,997 |
| 47,394,106 |
| | 47,679,103 |
| 47,268,469 |
| Diluted weighted average shares | 48,444,874 | | 48,418,378 | | | 48,444,658 | | 48,465,077 | |
| Dividends per share | $ | 0.12 |
| $ | 0.12 |
| | $ | 0.36 |
| $ | 0.36 |
| |
| Other comprehensive (loss) income | | | | |
| Other comprehensive income (loss) | | Other comprehensive income (loss) | |
| Foreign currency translation adjustment | (188 | ) | 289 |
| | (467 | ) | 261 |
| Foreign currency translation adjustment | 1,783 | | (887) | | | 4,294 | | (6,615) | |
| Unrealized (loss) gain on derivative instruments, net of tax | (267 | ) | 409 |
| | (89 | ) | (378 | ) | |
| Total other comprehensive (loss) income | (455 | ) | 698 |
| | (556 | ) | (117 | ) | |
| Unrealized gain (loss) on derivative instruments, net of tax | | Unrealized gain (loss) on derivative instruments, net of tax | 345 | | 551 | | | 4,494 | | (2,571) | |
| Total other comprehensive income (loss) | | Total other comprehensive income (loss) | 2,128 | | (336) | | | 8,788 | | (9,186) | |
| Comprehensive income | $ | 12,093 |
| $ | 9,632 |
| | $ | 34,668 |
| $ | 24,114 |
| Comprehensive income | $ | 8,859 | | $ | 11,487 | | | $ | 15,355 | | $ | 7,276 | |
| | | | | |
| The accompanying notes are an integral part of these consolidated financial statements. | |
| The accompanying notes are an integral part of these condensed consolidated financial statements. | | The accompanying notes are an integral part of these condensed consolidated financial statements. |
|
| | | | | | | |
| 4 | | ThirdSecond Quarter 20172021 Form 10-Q |
| | Blackbaud, Inc. Consolidated statements of cash flows (Unaudited) | |
Blackbaud, Inc.
Condensed Consolidated Statements of Cash Flows
(Unaudited) | | Blackbaud, Inc.
Condensed Consolidated Statements of Cash Flows
(Unaudited) |
| | Nine months ended
September 30, | | | Six months ended
June 30, |
| (dollars in thousands) | 2017 |
| 2016 |
| (dollars in thousands) | 2021 | 2020 |
| Cash flows from operating activities | | Cash flows from operating activities | |
| Net income | $ | 35,224 |
| $ | 24,231 |
| Net income | $ | 6,567 | | $ | 16,462 | |
| Adjustments to reconcile net income to net cash provided by operating activities: | | Adjustments to reconcile net income to net cash provided by operating activities: | |
| Depreciation and amortization | 54,765 |
| 53,109 |
| Depreciation and amortization | 40,742 | | 46,088 | |
| Provision for doubtful accounts and sales returns | 7,246 |
| 3,139 |
| |
| Provision for credit losses and sales returns | | Provision for credit losses and sales returns | 4,418 | | 6,677 | |
| Stock-based compensation expense | 31,055 |
| 25,005 |
| Stock-based compensation expense | 60,554 | | 33,713 | |
| Deferred taxes | (2,511 | ) | (225 | ) | Deferred taxes | 276 | | 1,945 | |
| Amortization of deferred financing costs and discount | 650 |
| 718 |
| Amortization of deferred financing costs and discount | 879 | | 376 | |
| Other non-cash adjustments | 572 |
| (634 | ) | Other non-cash adjustments | 155 | | 477 | |
| Changes in operating assets and liabilities, net of acquisition and disposal of businesses: | | Changes in operating assets and liabilities, net of acquisition and disposal of businesses: | |
| Accounts receivable | (17,169 | ) | (9,288 | ) | Accounts receivable | (27,134) | | (48,167) | |
| Prepaid expenses and other assets | 596 |
| (934 | ) | Prepaid expenses and other assets | (18,162) | | (7,068) | |
| Trade accounts payable | (2,891 | ) | 267 |
| Trade accounts payable | 2,356 | | (8,984) | |
| Accrued expenses and other liabilities | (9,522 | ) | (12,837 | ) | Accrued expenses and other liabilities | 1,443 | | (26,520) | |
| Restricted cash due to customers | 214,244 |
| 119,291 |
| |
| Due to customers | (214,244 | ) | (119,291 | ) | |
| Deferred revenue | 25,370 |
| 17,593 |
| Deferred revenue | 27,828 | | 22,489 | |
| Net cash provided by operating activities | 123,385 |
| 100,144 |
| Net cash provided by operating activities | 99,922 | | 37,488 | |
| Cash flows from investing activities | | Cash flows from investing activities | |
| Purchase of property and equipment | (8,417 | ) | (15,459 | ) | Purchase of property and equipment | (6,128) | | (5,887) | |
| Capitalized software development costs | (20,605 | ) | (19,078 | ) | Capitalized software development costs | (19,862) | | (21,679) | |
| Purchase of net assets of acquired companies, net of cash acquired | (49,729 | ) | (3,377 | ) | |
| Purchase of derivative instruments | (516 | ) | — |
| |
| Proceeds from settlement of derivative instruments | 1,030 |
| — |
| |
| | Net cash used in investing activities | (78,237 | ) | (37,914 | ) | Net cash used in investing activities | (25,990) | | (27,566) | |
| Cash flows from financing activities | | Cash flows from financing activities | |
| Proceeds from issuance of debt | 588,300 |
| 179,000 |
| Proceeds from issuance of debt | 128,300 | | 202,100 | |
| Payments on debt | (594,144 | ) | (212,581 | ) | Payments on debt | (113,477) | | (185,250) | |
| Debt issuance costs | (3,085 | ) | — |
| |
| | Employee taxes paid for withheld shares upon equity award settlement | (19,092 | ) | (10,497 | ) | Employee taxes paid for withheld shares upon equity award settlement | (38,712) | | (20,996) | |
| Proceeds from exercise of stock options | 14 |
| 10 |
| Proceeds from exercise of stock options | 0 | | 4 | |
| Change in due to customers | | Change in due to customers | (170,061) | | (121,612) | |
| Change in customer funds receivable | | Change in customer funds receivable | (5,014) | | (828) | |
| Purchase of treasury stock | | Purchase of treasury stock | (58,074) | | 0 | |
| Dividend payments to stockholders | (17,299 | ) | (17,108 | ) | Dividend payments to stockholders | 0 | | (5,960) | |
| Net cash used in financing activities | (45,306 | ) | (61,176 | ) | Net cash used in financing activities | (257,038) | | (132,542) | |
| Effect of exchange rate on cash and cash equivalents | 306 |
| 46 |
| |
| Net increase in cash and cash equivalents | 148 |
| 1,100 |
| |
| Cash and cash equivalents, beginning of period | 16,902 |
| 15,362 |
| |
| Cash and cash equivalents, end of period | $ | 17,050 |
| $ | 16,462 |
| |
| | | |
| The accompanying notes are an integral part of these consolidated financial statements. | |
| Effect of exchange rate on cash, cash equivalents and restricted cash | | Effect of exchange rate on cash, cash equivalents and restricted cash | 992 | | (2,229) | |
| Net decrease in cash, cash equivalents and restricted cash | | Net decrease in cash, cash equivalents and restricted cash | (182,114) | | (124,849) | |
| Cash, cash equivalents and restricted cash, beginning of period | | Cash, cash equivalents and restricted cash, beginning of period | 644,969 | | 577,295 | |
| Cash, cash equivalents and restricted cash, end of period | | Cash, cash equivalents and restricted cash, end of period | $ | 462,855 | | $ | 452,446 | |
The following table provides a reconciliation of cash and cash equivalents and restricted cash reported within the condensed consolidated balance sheets that sum to the total of the same such amounts shown above in the condensed consolidated statements of cash flows:
| | | | | | | | |
| (dollars in thousands) | June 30,
2021 | December 31,
2020 |
| Cash and cash equivalents | $ | 28,288 | | $ | 35,750 | |
| Restricted cash | 434,567 | | 609,219 | |
| Total cash, cash equivalents and restricted cash in the statement of cash flows | $ | 462,855 | | $ | 644,969 | |
| | |
| The accompanying notes are an integral part of these condensed consolidated financial statements. |
|
| | | | | | | |
ThirdSecond Quarter 20172021 Form 10-Q | | 5 |
Blackbaud, Inc.
Condensed Consolidated Statements of Stockholders' Equity
(Unaudited)
|
| | | | | | | | | | | | | | | | | | | | |
Blackbaud, Inc. Consolidated statement of stockholders' equity (Unaudited) |
| (dollars in thousands) | Common stock | | Additional paid-in capital |
| Treasury stock |
| Accumulated other comprehensive loss |
| Retained earnings |
| Total stockholders' equity |
|
| Shares |
| Amount |
|
| Balance at December 31, 2016 | 57,672,401 |
| $ | 58 |
| $ | 310,452 |
| $ | (215,237 | ) | $ | (457 | ) | $ | 152,729 |
| $ | 247,545 |
|
| Net income | — |
| — |
| — |
| — |
| — |
| 35,224 |
| 35,224 |
|
| Payment of dividends | — |
| — |
| — |
| — |
| — |
| (17,299 | ) | (17,299 | ) |
| Exercise of stock options and stock appreciation rights and vesting of restricted stock units | 349,713 |
| — |
| 14 |
| — |
| — |
| — |
| 14 |
|
| Employee taxes paid for 259,321 withheld shares upon equity award settlement | — |
| — |
| — |
| (19,092 | ) | — |
| — |
| (19,092 | ) |
| Stock-based compensation | — |
| — |
| 31,010 |
| — |
| — |
| 45 |
| 31,055 |
|
| Restricted stock grants | 549,589 |
| 1 |
| — |
| — |
| — |
| — |
| 1 |
|
| Restricted stock cancellations | (68,016 | ) | — |
| — |
| — |
| — |
| — |
| — |
|
| Other comprehensive loss | — |
| — |
| — |
| — |
| (556 | ) | — |
| (556 | ) |
| Balance at September 30, 2017 | 58,503,687 |
| $ | 59 |
| $ | 341,476 |
| $ | (234,329 | ) | $ | (1,013 | ) | $ | 170,699 |
| $ | 276,892 |
|
| | | | | | | | |
| The accompanying notes are an integral part of these consolidated financial statements. |
| | | | | | | | | | | | | | | | | | | | | | | |
| (dollars in thousands) | Common stock | Additional
paid-in
capital | Treasury
stock | Accumulated
other
comprehensive
income (loss) | Retained
earnings | Total
stockholders'
equity |
| Shares | Amount |
| Balance at December 31, 2020 | 60,904,638 | | $ | 61 | | $ | 544,963 | | $ | (353,091) | | $ | (2,497) | | $ | 236,714 | | $ | 426,150 | |
| Net loss | — | | — | | — | | — | | — | | (164) | | (164) | |
| Purchase of 465,821 treasury shares under stock repurchase program | — | | — | | — | | (28,066) | | — | | — | | (28,066) | |
| Vesting of restricted stock units | 206,418 | | — | | 0 | | — | | — | | — | | 0 | |
| Employee taxes paid for 240,867 withheld shares upon equity award settlement | — | | — | | — | | (18,426) | | — | | — | | (18,426) | |
| Stock-based compensation | — | | — | | 29,995 | | — | | — | | 10 | | 30,005 | |
| Restricted stock grants | 519,009 | | 1 | | — | | — | | — | | — | | 1 | |
| Restricted stock cancellations | (34,789) | | — | | — | | — | | — | | — | | — | |
| Other comprehensive income | — | | — | | — | | — | | 6,660 | | — | | 6,660 | |
| Balance at March 31, 2021 | 61,595,276 | | $ | 62 | | $ | 574,958 | | $ | (399,583) | | $ | 4,163 | | $ | 236,560 | | $ | 416,160 | |
| Net income | — | | — | | — | | — | | — | | 6,731 | | 6,731 | |
| Purchase of 405,047 treasury shares under stock repurchase program | — | | — | | — | | (30,008) | | — | | — | | (30,008) | |
| Vesting of restricted stock units | 804,323 | | — | | 0 | | — | | — | | — | | 0 | |
| Employee taxes paid for 285,521 withheld shares upon equity award settlement | — | | — | | — | | (20,286) | | — | | — | | (20,286) | |
| Stock-based compensation | — | | — | | 30,528 | | — | | — | | 21 | | 30,549 | |
| Restricted stock grants | 9,431 | | 0 | | — | | — | | — | | — | | 0 | |
| Restricted stock cancellations | (76,316) | | — | | — | | — | | — | | — | | — | |
| Other comprehensive income | — | | — | | — | | — | | 2,128 | | — | | 2,128 | |
| Balance at June 30, 2021 | 62,332,714 | | $ | 62 | | $ | 605,486 | | $ | (449,877) | | $ | 6,291 | | $ | 243,312 | | $ | 405,274 | |
| | | | | | | |
| | | | | | | |
| | | | | | | |
| | | | | | | |
| | | | | | | |
| | | | | | | |
| | | | | | | |
| | | | | | | |
| | | | | | | |
| | | | | | | |
|
| | | | | | | |
| 6 | | ThirdSecond Quarter 20172021 Form 10-Q |
Blackbaud, Inc.
Condensed Consolidated Statements of Stockholders' Equity (continued)
(Unaudited)
| | | | | | | | | | | | | | | | | | | | | | | |
| (dollars in thousands) | Common stock | Additional
paid-in
capital | Treasury
stock | Accumulated
other
comprehensive
income (loss) | Retained
earnings | Total
stockholders'
equity |
| Shares | Amount |
| Balance at December 31, 2019 | 60,206,091 | | $ | 60 | | $ | 457,804 | | $ | (290,665) | | $ | (5,290) | | $ | 234,855 | | $ | 396,764 | |
| Net income | — | | — | | — | | — | | — | | 4,639 | | 4,639 | |
| Payment of dividends ($0.12 per share) | — | | — | | — | | — | | — | | (5,960) | | (5,960) | |
| Exercise of stock options and vesting of restricted stock units | 210,057 | | — | | 1 | | — | | — | | — | | 1 | |
| Employee taxes paid for 245,358 withheld shares upon equity award settlement | — | | — | | — | | (19,782) | | — | | — | | (19,782) | |
| Stock-based compensation | — | | — | | 13,539 | | — | | — | | 41 | | 13,580 | |
| Restricted stock grants | 563,947 | | 1 | | — | | — | | — | | — | | 1 | |
| Restricted stock cancellations | (47,456) | | — | | — | | — | | — | | — | | — | |
| Other comprehensive loss | — | | — | | — | | — | | (8,850) | | — | | (8,850) | |
| Balance at March 31, 2020 | 60,932,639 | | $ | 61 | | $ | 471,344 | | $ | (310,447) | | $ | (14,140) | | $ | 233,575 | | $ | 380,393 | |
| Net income | — | | — | | — | | — | | — | | 11,823 | | 11,823 | |
| | | | | | | |
| Exercise of stock options and vesting of restricted stock units | 7,111 | | — | | 3 | | — | | — | | — | | 3 | |
| Employee taxes paid for 21,200 withheld shares upon equity award settlement | — | | — | | — | | (1,214) | | — | | — | | (1,214) | |
| Stock-based compensation | — | | — | | 20,103 | | — | | — | | 30 | | 20,133 | |
| Restricted stock grants | 20,776 | | 0 | | — | | — | | — | | — | | 0 | |
| Restricted stock cancellations | (59,426) | | — | | — | | — | | — | | — | | — | |
| Other comprehensive loss | — | | — | | — | | — | | (336) | | — | | (336) | |
| Balance at June 30, 2020 | 60,901,100 | | $ | 61 | | $ | 491,450 | | $ | (311,661) | | $ | (14,476) | | $ | 245,428 | | $ | 410,802 | |
| | | | | | | |
| | | | | | | |
| | | | | | | |
| | | | | | | |
| | | | | | | |
| | | | | | | |
| | | | | | | |
| | | | | | | |
| | | | | | | |
| | | | | | | |
| The accompanying notes are an integral part of these condensed consolidated financial statements. |
| | | | | | | | |
| Second Quarter 2021 Form 10-Q | | 7 |
Blackbaud, Inc.
Notes to consolidated financial statementsCondensed Consolidated Financial Statements
(Unaudited)
We are the world’s leading cloud software company powering social good. Serving the entire social good community—nonprofits, foundations, corporations,higher education institutions, K–12 schools, healthcare institutionsorganizations, faith communities, arts and cultural organizations, foundations, companies and individual change agents—we connect and empower organizations to increase their impact through cloud software, services, expertise and data intelligence. Our portfolio is tailored to the unique needs of vertical markets, with solutions for fundraising and CRM, marketing, advocacy, peer-to-peer fundraising, corporate social responsibility, school management, ticketing, grantmaking, financial management, payment processing and analytics. Serving the industry for more than threefour decades, we are headquartered in Charleston, South Carolina, and have operations in the United States, Australia, Canada, Costa Rica and the United Kingdom. As of September 30, 2017, we had approximately 35,000 customers.
Unaudited condensed consolidated interim consolidated financial statements
The accompanying condensed consolidated interim consolidated financial statements have been prepared pursuant to the rules and regulations of the United States Securities and Exchange Commission ("SEC") for interim financial reporting. These consolidated statements are unaudited and, in the opinion of management, include all adjustments (consisting of normal recurring adjustments and accruals) necessary to state fairly the consolidated balance sheets, consolidated statements of comprehensive income, consolidated statements of cash flows and consolidated statements of stockholders’ equity, for the periods presented in accordance with accounting principles generally accepted in the United States ("U.S.") ("GAAP"). The consolidated balance sheet at December 31, 2016,2020 has been derived from the audited consolidated financial statements at that date. Operating results and cash flows for the ninesix months ended SeptemberJune 30, 20172021 are not necessarily indicative of the results that may be expected for the fiscal year ending December 31, 2017,2021, or any other future period. Certain information and footnote disclosures normally included in annual financial statements prepared in accordance with GAAP have been omitted in accordance with the rules and regulations for interim reporting of the SEC. These condensed consolidated interim consolidated financial statements should be read in conjunction with the consolidated financial statements and notes thereto included in our Annual Report on Form 10-K for the year ended December 31, 2016,2020, and other forms filed with the SEC from time to time.
Reclassifications
Due to the insignificance of our revenue from "license fees and other," we have combined that revenue with our "services" revenue beginning in 2017. In order to provide comparability between periods presented, "services" and "license fees and other" have been combined within "services and other" in the previously reported consolidated statements of comprehensive income to conform to presentation of the current period. Similarly, "cost of services" and "cost of license fees and other" have been combined within "cost of services and other" in the previously reported consolidated statements of comprehensive income to conform to presentation of the current period.
Basis of consolidation
The condensed consolidated financial statements include the accounts of Blackbaud, Inc. and its wholly-ownedwholly owned subsidiaries. All intercompany balances and transactions have been eliminated in consolidation.
Recently adopted accounting pronouncementsReportable segment
In May 2017,We report our operating results and financial information in one operating and reportable segment. Our chief operating decision maker uses consolidated financial information to make operating decisions, assess financial performance and allocate resources. Our chief operating decision maker is our chief executive officer ("CEO").
As discussed in Note 13, beginning in the FASB issued ASU 2017-09, Compensation-Stock Compensation (Topic 718) - Scopesecond quarter of Modification Accounting2021, we combined our General Markets Group ("ASU 2017-09"GMG"), and Enterprise Markets Group ("EMG") into a single U.S. Markets Group ("UMG") and moved our Corporations vertical under our International Markets Group ("IMG"). This change was made to better align our resources toward customer retention and growth which, provides guidance about which changes to the terms or conditions of a share-based payment award require an entity to apply modification accounting in Topic 718. Under ASU 2017-09, modification accounting is required only if the fair value, the vesting conditions, or the classification of the award (as equity or liability) changesare key objectives as a result of thewe progress toward our long-term aspirational goals. The change in terms or conditions. ASU 2017-09 is effective for all companies for annualdid not impact our conclusion that we have one operating and interim periods beginning after December 15, 2017, with early adoption permitted in any interim period forreportable segment and one goodwill reporting periods for
unit.
|
| | | | | | | |
Third8 | | Second Quarter 20172021 Form 10-Q | | 7 |
Blackbaud, Inc.
Notes to consolidatedCondensed Consolidated Financial Statements
(Unaudited)
Risks and uncertainties related to COVID-19
We are subject to risks and uncertainties as a result of the global COVID-19 pandemic. We believe that COVID-19 may continue to significantly impact our vertical markets and geographies, but the magnitude of the impact on our business cannot be determined at this time due to numerous uncertainties, including the duration of the outbreak, the severity of variants which may develop, travel restrictions and business closures, the effectiveness of vaccination programs and other actions taken to contain the disease and other unforeseeable consequences.
Use of estimates
The preparation of financial statements (continued)
(Unaudited)
which financial statements have not been issued. ASU 2017-09 should be applied prospectivelyin conformity with GAAP requires management to an award modified on or aftermake estimates and assumptions that affect the adoption date. We early adopted ASU 2017-09 as of April 1, 2017. As this standard is prospective in nature, the impact to our financial statements will depend on the nature of our future award modifications.
In January 2017, the FASB issued ASU 2017-01, Business Combinations (Topic 805) Clarifying the Definition of a Business ("ASU 2017-01"), which provides a screen to determine when an integrated setreported amounts of assets and activities is not a business. The screen requires that when substantially allliabilities and disclosure of contingent assets and liabilities at the date of the fair valuefinancial statements, as well as the reported amounts of revenues and expenses during the grossreporting periods. On an ongoing basis, we reconsider and evaluate our estimates and assumptions, including those that impact revenue recognition, long-lived and intangible assets, acquired (or disposed of) is concentratedincome taxes, business combinations, stock-based compensation, capitalization of software development costs, our allowances for credit losses and sales returns, costs of obtaining contracts, valuation of derivative instruments and loss contingencies, among others. Changes in a single identifiable assetthe facts or a group of similar identifiable assets, the set is not a business. ASU 2017-01 is effective for annualcircumstances underlying these estimates, including due to COVID-19, could result in material changes and interim periods beginning after December 15, 2017, with early adoption permitted, and applied prospectively. We early adopted ASU 2017-01 as of July 1, 2017 and do notactual results could materially differ from these estimates.
Recently issued accounting pronouncements
There are no recently issued accounting pronouncements that we expect the standard to have a material impact on our consolidated financial statements.statements when adopted in the future.
In January 2017, the FASB issued ASU 2017-04, Intangibles - Goodwill and Other (Topic 350): Simplifying the Accounting for Goodwill Impairment("ASU 2017-04"), which removes the requirementSummary of significant accounting policies
There have been no new or material changes to perform a hypothetical purchase price allocation to measure goodwill impairment. A goodwill impairment will now be the amount by which a reporting unit’s carrying value exceeds its fair value, not to exceed the carrying amount of goodwill. ASU 2017-04 is effective for annual and interim periods beginning after December 15, 2019, with early adoption permitted, and applied prospectively. We early adopted ASU 2017-04 as of July 1, 2017 for useour significant accounting policies described in our fourth quarter annual goodwill impairment testing and do not expectAnnual Report on Form 10-K for the standard to have a material impactyear ended December 31, 2020, filed with the SEC on our consolidated financial statements.February 23, 2021.
Recently issued accounting pronouncements
In November 2016, the FASB issued ASU 2016-18, Statement of Cash Flows (Topic 230) - Restricted Cash ("ASU 2016-18"), which requires entities to show the changes in the total of cash, cash equivalents, restricted cash and restricted cash equivalents in the statement of cash flows. ASU 2016-18 is effective for annual periods beginning after December 15, 2017, including interim periods within those periods. Early adoption is permitted, including adoption in an interim period, but any adjustments must be reflected as of the beginning of the fiscal year that includes that interim period. The new standard must be adopted retrospectively. We are currently evaluating the impact of this standard on our consolidated statements of cash flows.
In February 2016, the FASB issued ASU 2016-02, Leases (Topic 842) (ASU 2016-02). ASU 2016-02 will require lessees to record most leases on their balance sheets but recognize expenses in the income statement in a manner similar to current guidance. The updated guidance also eliminates certain real estate-specific provisions and changes the guidance on sale-leaseback transactions, initial direct costs and lease executory costs for all entities. For lessors, the standard modifies the classification criteria and the accounting for sales-type and direct financing leases. All entities will classify leases to determine how to recognize lease-related revenue and expense. Classification will continue to affect amounts that lessors record on the balance sheet. ASU 2016-02 is effective for annual periods beginning after December 15, 2018, and interim periods within those years. Early adoption is permitted. Upon adoption, entities will be required to use a modified retrospective approach for leases that exist or are entered into after the beginning of the earliest comparative period in the financial statements. The modified retrospective approach includes a number of optional practical expedients that entities may elect to apply. We expect ASU 2016-02 will impact our consolidated financial statements and are currently evaluating the extent of the impact that implementation of this standard will have on adoption.
In May 2014, the FASB issued ASU 2014-09, Revenue from Contracts with Customers (Topic 606) (ASU 2014-09). ASU 2014-09 outlines a single comprehensive model for entities to use in accounting for revenue arising from contracts with customers. The standard also provides guidance on the recognition of costs related to obtaining customer contracts. ASU 2014-09 will replace most existing revenue recognition guidance in GAAP when it becomes effective and permits the use of either the retrospective or cumulative effect transition method. ASU 2014-09 will be effective for us beginning in the first quarter of 2018 and we anticipate using the full retrospective transition method. We are currently evaluating the impact that the adoption of ASU 2014-09 will have on our consolidated financial statements and related disclosures. As a result of our evaluation to date, we expect that ASU 2014-09 will generally result in the deferral of more costs to obtain a contract over a longer period using the expected period of benefit as compared with our current practice of using our average initial contract term. We also anticipate incremental disclosures, including, but not limited to, the opening and closing balances of contract assets and liabilities, revenue recognized in the reporting period that was included in the contract liability balance at the beginning of the period, and the aggregate amount of the transaction price allocated to remaining performance obligations at the end of each reporting period including when we expect to recognize that amount.
|
| | |
8 | | Third Quarter 2017 Form 10-Q |
Blackbaud, Inc.
Notes to consolidated financial statements (continued)
(Unaudited)
AcademicWorks acquisition
On April 3, 2017, we acquired all of the outstanding shares of capital stock, including all voting equity interests, of AcademicWorks, Inc., a Texas corporation ("AcademicWorks"), pursuant to a stock purchase agreement. AcademicWorks is the market leader in scholarship management for higher education and K-12 institutions, foundations, and grant-making institutions. The acquisition extends our offerings for our higher education, K-12, and corporate and foundation customers. We acquired AcademicWorks for $52.1 million in cash, net of closing adjustments. We financed the acquisition through a draw down of a revolving credit loan under our then-existing credit facility. As a result of the acquisition, AcademicWorks has become a wholly-owned subsidiary of ours. The operating results of AcademicWorks have been included in our consolidated financial statements within our EMG and GMG reportable segments (as defined in Note 14 below) from the date of acquisition. During the three and nine months ended September 30, 2017, we incurred insignificant acquisition-related expenses associated with the acquisition of AcademicWorks, which were recorded in general and administrative expense.
The fair values assigned to the assets acquired and liabilities assumed in the table below are based on our best estimates and assumptions as of the reporting date and are considered preliminary pending finalization. The estimates and assumptions are subject to change as we obtain additional information during the measurement period, which may be up to one year from the acquisition date. The assets and liabilities, pending finalization, include the valuation of acquired finite-lived intangible assets as well as the assumed deferred revenue and deferred income tax balances.
|
| | | |
| (in thousands) | Purchase price allocation |
|
| Net working capital, excluding deferred revenue | $ | 2,949 |
|
| Property and equipment | 290 |
|
| Finite-lived intangible assets | 30,900 |
|
| Deferred revenue | (3,950 | ) |
| Deferred tax liability | (12,350 | ) |
| Goodwill | 34,305 |
|
| Total purchase price | $ | 52,144 |
|
The estimated fair value of accounts receivable acquired approximates the contractual value of $1.0 million. The estimated goodwill recognized is attributable primarily to the opportunities for expected synergies from combining operations and the assembled workforce of AcademicWorks, with $20.6 million and $13.7 million assigned to our EMG and GMG reportable segments, respectively. None of the goodwill arising in the acquisition is deductible for income tax purposes.
The AcademicWorks acquisition resulted in the identification of the following identifiable finite-lived intangible assets: |
| | | | |
| | Intangible assets acquired |
| Weighted average amortization period |
| AcademicWorks | (in thousands) |
| (in years) |
| Acquired technology | $ | 22,500 |
| 9 |
| Customer relationships | 8,000 |
| 15 |
| Marketing assets | 320 |
| 2 |
| Non-compete agreements | 80 |
| 3 |
| Total intangible assets | $ | 30,900 |
| 10 |
The estimated fair values of the finite-lived intangible assets were based on variations of the income approach, which estimates fair value based upon the present value of cash flows that the assets are expected to generate, and which included the relief-from-royalty method, incremental cash flow method, including the comparative (with and without) method and multi-period excess earnings method, depending on the intangible asset being valued. The method of amortization of
|
| | |
Third Quarter 2017 Form 10-Q | | 9 |
Blackbaud, Inc.
Notes to consolidated financial statements (continued)
(Unaudited)
identifiable finite-lived intangible assets is based on the expected pattern in which the estimated economic benefits of the respective assets are consumed or otherwise used up. Customer relationships and acquired technology are being amortized on an accelerated basis. Marketing assets and non-compete agreements are being amortized on a straight-line basis.
We determined that the impact of this acquisition was not material to our consolidated financial statements; therefore, revenue and earnings since the acquisition date and pro forma information are not required or presented.
|
|
4. Goodwill and Other Intangible Assets |
The change in goodwill for each reportable segment (as defined in Note 14 below) during the ninesix months ended SeptemberJune 30, 2017,2021, consisted of the following:
|
| | | | | | | | | | | | |
| (dollars in thousands) | EMG | GMG | IMG | Total |
| Balance at December 31, 2016 | $ | 241,334 |
| $ | 192,238 |
| $ | 4,668 |
| $ | 438,240 |
|
Additions related to current year business combination(1) | 20,583 |
| 13,722 |
| — |
| 34,305 |
|
Adjustments related to prior year business combination(2) | (29 | ) | (58 | ) | (1 | ) | (88 | ) |
| Effect of foreign currency translation | — |
| — |
| 319 |
| 319 |
|
| Balance at September 30, 2017 | $ | 261,888 |
| $ | 205,902 |
| $ | 4,986 |
| $ | 472,776 |
|
| | | | | |
| (dollars in thousands) | Total |
| Balance at December 31, 2020 | $ | 635,854 | |
| |
(1) | See Note 3 to these consolidated financial statements for details regarding our acquisition
|
Effect of AcademicWorks.foreign currency translation | 1,656 | |
| Balance at June 30, 2021 | $ | 637,510 | |
| | |
(2) | The change in goodwill was related to a post-closing working capital adjustment associated with the prior year acquisition of Good+Geek, Inc. ("Attentive.ly"), as well as an immaterial measurement period adjustment. |
We compute basic earnings per share by dividing net income available to common stockholders by the weighted average number of common shares outstanding during the period. Diluted earnings per share is computed by dividing net income available to common stockholders by the weighted average number of common shares and dilutive potential common shares outstanding during the period. Diluted earnings per share reflect the assumed exercise, settlement and vesting of all dilutive securities using the “treasury stock method” except when the effect is anti-dilutive. Potentially dilutive securities consist of shares issuable upon the exercise of stock options, settlement of stock appreciation rights and vesting of restricted stock awards and units.
|
| | | | | | | |
10Second Quarter 2021 Form 10-Q | | Third Quarter 2017 Form 10-Q9 |
Blackbaud, Inc.
Notes to consolidated financial statements (continued)Condensed Consolidated Financial Statements
(Unaudited)
The following table sets forth the computation of basic and diluted earnings per share:
| | | | | | | | | | | | | | | | | |
| | Three months ended June 30, | | Six months ended June 30, |
| (dollars in thousands, except per share amounts) | 2021 | 2020 | | 2021 | 2020 |
| Numerator: | | | | | |
| Net income | $ | 6,731 | | $ | 11,823 | | | $ | 6,567 | | $ | 16,462 | |
| Denominator: | | | | | |
| Weighted average common shares | 47,756,326 | | 48,239,928 | | | 47,560,847 | | 48,138,125 | |
| Add effect of dilutive securities: | | | | | |
| Stock-based awards | 688,548 | | 178,450 | | | 883,811 | | 326,952 | |
| Weighted average common shares assuming dilution | 48,444,874 | | 48,418,378 | | | 48,444,658 | | 48,465,077 | |
| Earnings per share: | | | | | |
| Basic | $ | 0.14 | | $ | 0.25 | | | $ | 0.14 | | $ | 0.34 | |
| Diluted | $ | 0.14 | | $ | 0.24 | | | $ | 0.14 | | $ | 0.34 | |
| | | | | |
| Anti-dilutive shares excluded from calculations of diluted earnings per share | 907,210 | | 1,484,976 | | | 1,032,655 | | 1,329,519 | |
|
| | | | | | | | | | | | | |
| | Three months ended
September 30, | | | Nine months ended
September 30, | |
| (dollars in thousands, except per share amounts) | 2017 |
| 2016 |
| | 2017 |
| 2016 |
|
| Numerator: | | | | | |
| Net income | $ | 12,548 |
| $ | 8,934 |
| | $ | 35,224 |
| $ | 24,231 |
|
| Denominator: | | | | | |
| Weighted average common shares | 46,711,709 |
| 46,159,956 |
| | 46,627,213 |
| 46,078,306 |
|
| Add effect of dilutive securities: | | | | | |
| Stock-based awards | 1,135,288 |
| 1,234,150 |
| | 1,051,890 |
| 1,190,163 |
|
| Weighted average common shares assuming dilution | 47,846,997 |
| 47,394,106 |
| | 47,679,103 |
| 47,268,469 |
|
| Earnings per share: | | | | | |
| Basic | $ | 0.27 |
| $ | 0.19 |
| | $ | 0.76 |
| $ | 0.53 |
|
| Diluted | $ | 0.26 |
| $ | 0.19 |
| | $ | 0.74 |
| $ | 0.51 |
|
| | | | | | |
| Anti-dilutive shares excluded from calculations of diluted earnings per share | 1,719 |
| 1,723 |
| | 4,938 |
| 3,766 |
|
|
| |
6.5. Fair Value Measurements |
We use a three-tier fair value hierarchy to measure fair value. This hierarchy prioritizes the inputs into three broad levels as follows:
•Level 1 - Quoted prices for identical assets or liabilities in active markets;
•Level 2 - Quoted prices for similar assets and liabilities in active markets, quoted prices for identical or similar assets in markets that are not active, and model-derived valuations in which all significant inputs and significant value drivers are observable in active markets; and
•Level 3 - Valuations derived from valuation techniques in which one or more significant inputs are unobservable.
|
| | | | | | | |
Third10 | | Second Quarter 20172021 Form 10-Q | | 11 |
Blackbaud, Inc.
Notes to consolidated financial statements (continued)Condensed Consolidated Financial Statements
(Unaudited)
Recurring fair value measurements
Financial assetsAssets and liabilities that are measured at fair value on a recurring basis consisted of the following, as of the dates indicated below: | | | | Fair value measurement using | | | | Fair value measurement using | | |
| (dollars in thousands) | Level 1 |
| | Level 2 |
| | Level 3 |
| | Total |
| (dollars in thousands) | Level 1 | | Level 2 | | Level 3 | | Total |
| Fair value as of September 30, 2017 | | | | | | | | |
| Fair value as of June 30, 2021 | | Fair value as of June 30, 2021 | |
| Financial assets: | | | | | | | | Financial assets: | |
| Derivative instruments | $ | — |
| | $ | 223 |
| | $ | — |
| | $ | 223 |
| Derivative instruments | $ | 0 | | | $ | 2,061 | | | $ | 0 | | | $ | 2,061 | |
| Total financial assets | $ | — |
| | $ | 223 |
| | $ | — |
| | $ | 223 |
| Total financial assets | $ | 0 | | | $ | 2,061 | | | $ | 0 | | | $ | 2,061 | |
| | | | | | | | | |
| Fair value as of September 30, 2017 | | | | | | | | |
| | Financial liabilities: | | | | | | | | Financial liabilities: | |
| Derivative instruments | $ | — |
| | $ | 369 |
| | $ | — |
| | $ | 369 |
| Derivative instruments | $ | 0 | | | $ | 138 | | | $ | 0 | | | $ | 138 | |
| Total financial liabilities | $ | — |
| | $ | 369 |
| | $ | — |
| | $ | 369 |
| Total financial liabilities | $ | 0 | | | $ | 138 | | | $ | 0 | | | $ | 138 | |
| | | | | | | | | |
| Fair value as of December 31, 2016 | | | | | | | | |
| Financial assets: | | | | | | | | |
| Derivative instruments | $ | — |
| | $ | 206 |
| | $ | — |
| | $ | 206 |
| |
| Total financial assets | $ | — |
| | $ | 206 |
| | $ | — |
| | $ | 206 |
| |
| | | | | | | | | |
| Fair value as of December 31, 2016 | | | | | | | | |
| | | Fair value as of December 31, 2020 | | Fair value as of December 31, 2020 | |
| Financial liabilities: | | | | | | | | Financial liabilities: | |
| Derivative instruments | $ | — |
| | $ | 163 |
| | $ | — |
| | $ | 163 |
| Derivative instruments | $ | 0 | | | $ | 4,159 | | | $ | 0 | | | $ | 4,159 | |
| Total financial liabilities | $ | — |
| | $ | 163 |
| | $ | — |
| | $ | 163 |
| Total financial liabilities | $ | 0 | | | $ | 4,159 | | | $ | 0 | | | $ | 4,159 | |
Our derivative instruments within the scope of ASCAccounting Standards Codification ("ASC") 815, Derivatives and Hedging, are required to be recorded at fair value. Our derivative instruments that are recorded at fair value include interest rate swaps, as well as foreign currency forward and option contracts.swaps.
The fair value of our interest rate swaps was based on model-driven valuations using LIBOR rates, which are observable at commonly quoted intervals. Accordingly, our interest rate swaps are classified within Level 2 of the fair value hierarchy.
Our foreign currency forward and option The Financial Conduct Authority in the U.K. has stated that it plans to phase out all tenors of LIBOR by June 2023. We do not currently anticipate a significant impact to our financial position or results of operations as a result of this action as we expect that our financial contracts are valued using standard calculations/models that use as their basis readily observable market parameters including, foreign currency exchange rates, volatilities, and interest rates. Therefore, our foreign currency forward and option contracts are classified within Level 2 ofcurrently indexed to LIBOR will either expire or be modified without significant financial impact before the fair value hierarchy.phase out occurs.
We believe the carrying amounts of our cash and cash equivalents, restricted cash, due to customers, accounts receivable, trade accounts payable, accrued expenses and other current liabilities and due to customers approximate their fair values at SeptemberJune 30, 20172021 and December 31, 2016,2020, due to the immediate or short-term maturity of these instruments.
We believe the carrying amount of our debt approximates its fair value at SeptemberJune 30, 20172021 and December 31, 2016,2020, as the debt bears interest rates that approximate market value. As LIBOR rates are observable at commonly quoted intervals, our debt under the 2020 Credit Facility (as defined below) is classified within Level 2 of the fair value hierarchy. Our fixed rate debt is also classified within Level 2 of the fair value hierarchy.
We did not transfer any assets or liabilities among the levels within the fair value hierarchy during the ninesix months ended SeptemberJune 30, 2017.2021. Additionally, we did not hold any Level 3 assets or liabilities during the ninesix months ended SeptemberJune 30, 2017.
2021.
|
| | | | | | | |
12Second Quarter 2021 Form 10-Q | | Third Quarter 2017 Form 10-Q11 |
Blackbaud, Inc.
Notes to consolidated financial statements (continued)Condensed Consolidated Financial Statements
(Unaudited)
Non-recurring fair value measurements
Assets and liabilities that are measured at fair value on a non-recurring basis include long-lived assets, intangible assets, goodwill and goodwill, whichoperating lease right-of-use ("ROU") assets. These assets are recognized at fair value during the period in which an acquisition is completed or at lease commencement, from updated estimates and assumptions during the measurement period, or when they are considered to be impaired. These non-recurring fair value measurements, primarily for long-lived assets, intangible assets acquired and operating lease ROU assets, are based on Level 3 unobservable inputs. In the event of an impairment, we determine the fair value of thethese assets other than goodwill and intangible assets using a discounted cash flow approach, which contains significant unobservable inputs and, therefore, is considered a Level 3 fair value measurement. The unobservable inputs in the analysis generally include future cash flow projections and a discount rate. For goodwill impairment testing, we estimate fair value using market-based methods including the use of market capitalization and consideration of a control premium.
There were no non-recurring fair value adjustments to our long-lived assets, intangible assets, goodwill and goodwilloperating lease ROU assets during the ninesix months ended SeptemberJune 30, 2017, except2021.
| | |
| 6. Consolidated Financial Statement Details |
Restricted cash
| | | | | | | | |
| (dollars in thousands) | June 30,
2021 | December 31,
2020 |
| Restricted cash due to customers | $ | 433,243 | | $ | 607,943 | |
| Real estate escrow balances | 1,324 | | 1,276 | |
| Total restricted cash | 434,567 | | 609,219 | |
Prepaid expenses and other assets
| | | | | | | | |
| (dollars in thousands) | June 30,
2021 | December 31,
2020 |
Costs of obtaining contracts(1)(2) | $ | 81,478 | | $ | 84,914 | |
Prepaid software maintenance and subscriptions(3) | 32,599 | | 24,471 | |
Receivables for probable insurance recoveries(4) | 23,373 | | 6,288 | |
Implementation costs for cloud computing arrangements, net(5)(6) | 12,068 | | 11,298 | |
| Unbilled accounts receivable | 5,579 | | 10,385 | |
| Prepaid insurance | 4,991 | | 1,426 | |
| Derivative instruments | 2,061 | | 0 | |
| Taxes, prepaid and receivable | 1,474 | | 1,891 | |
| Other assets | 10,536 | | 10,332 | |
| Total prepaid expenses and other assets | 174,159 | | 151,005 | |
| Less: Long-term portion | 70,666 | | 72,639 | |
| Prepaid expenses and other current assets | $ | 103,493 | | $ | 78,366 | |
(1)Amortization expense from costs of obtaining contracts was $9.0 million and $18.2 million for an insignificant business combination accounting adjustmentthe three and six months ended June 30, 2021, respectively, and $9.4 million and $18.9 million for the three and six months ended June 30, 2020, respectively.
(2)The current portion of costs of obtaining contracts as of June 30, 2021 and December 31, 2020 was $31.0 million and $31.9 million, respectively.
(3)The current portion of prepaid software maintenance and subscriptions as of June 30, 2021 and December 31, 2020 was $28.2 million and $19.8 million, respectively.
(4)See discussion of the Security Incident at Note 9.
(5)These costs primarily relate to the initial fair value estimatesmulti-year implementations of our new global enterprise resource planning and customer relationship management systems.
(6)Amortization expense from capitalized cloud computing implementation costs was insignificant and $0.9 million for the Attentive.ly assets acquiredthree and liabilities assumed atsix months ended June 30, 2021, respectively, and insignificant for the acquisition date from updated information obtained during the measurement period. See Note 4 tothree and six months ended June 30, 2020. Accumulated amortization for these consolidated financial statements for additional details. The measurement periodcosts was $2.0 million as of a business combination may be up to one year from the acquisition date. We record any measurement period adjustments to the fair valueJune 30, 2021 and $1.1 million as of assets acquired and liabilities assumed, with the corresponding offset to goodwill.
|
| | | | | | | |
7. Consolidated Financial Statement Details12 | | Second Quarter 2021 Form 10-Q |
Blackbaud, Inc.
Notes to Condensed Consolidated Financial Statements
(Unaudited)
Accrued expenses and other liabilities
| | | | | | | | |
| (dollars in thousands) | June 30,
2021 | December 31,
2020 |
Taxes payable(1) | $ | 14,310 | | $ | 19,577 | |
| Accrued legal costs | 17,796 | | 4,808 | |
| Operating lease liabilities, current portion | 7,856 | | 9,359 | |
| Customer credit balances | 5,816 | | 5,874 | |
| Accrued commissions and salaries | 4,970 | | 5,010 | |
| Unrecognized tax benefit | 3,563 | | 3,351 | |
| Accrued health care costs | 2,526 | | 2,341 | |
| Accrued vacation costs | 2,206 | | 2,311 | |
| Derivative instruments | 138 | | 4,159 | |
| Other liabilities | 5,966 | | 6,304 | |
| Total accrued expenses and other liabilities | 65,147 | | 63,094 | |
| Less: Long-term portion | 9,339 | | 10,866 | |
| Accrued expenses and other current liabilities | $ | 55,808 | | $ | 52,228 | |
|
| | | | | | |
| (dollars in thousands) | September 30,
2017 |
| December 31,
2016 |
|
| Accrued bonuses | $ | 14,581 |
| $ | 19,217 |
|
| Accrued commissions and salaries | 5,429 |
| 9,352 |
|
| Lease incentive obligations | 4,780 |
| 5,604 |
|
| Customer credit balances | 5,246 |
| 5,148 |
|
| Deferred rent liabilities | 4,400 |
| 4,110 |
|
| Taxes payable | 2,584 |
| 3,452 |
|
| Unrecognized tax benefit | 3,609 |
| 3,295 |
|
| Accrued subscriptions | 2,638 |
| 2,840 |
|
| Accrued vacation costs | 2,626 |
| 2,214 |
|
| Accrued health care costs | 2,479 |
| 1,495 |
|
| Other liabilities | 5,077 |
| 6,002 |
|
| Total accrued expenses and other liabilities | 53,449 |
| 62,729 |
|
| Less: Long-term portion | 7,799 |
| 8,533 |
|
| Accrued expenses and other current liabilities | $ | 45,650 |
| $ | 54,196 |
|
Other income (expense), net
| | | | | | | | | | | | | | | | | |
| | Three months ended June 30, | | Six months ended June 30, |
| (dollars in thousands) | 2021 | 2020 | | 2021 | 2020 |
| Interest income | $ | 77 | | $ | 110 | | | $ | 229 | | $ | 632 | |
| Other income (expense), net | 410 | | 520 | | | (752) | | 1,068 | |
| Other income (expense), net | $ | 487 | | $ | 630 | | | $ | (523) | | $ | 1,700 | |
|
| | | | | | | | | | | | | |
| | Three months ended
September 30, | | | Nine months ended
September 30, | |
| (dollars in thousands) | 2017 |
| 2016 |
| | 2017 |
| 2016 |
|
| Components of Other Income (Expense), Net | | | | | |
| Interest income | $ | 393 |
| $ | 224 |
| | $ | 771 |
| $ | 463 |
|
| (Loss) gain on derivative instrument | (3 | ) | — |
| | 472 |
| — |
|
| Loss on debt extinguishment | (137 | ) | — |
| | (299 | ) | — |
|
| Other income (expense), net | 215 |
| (239 | ) | | 637 |
| (648 | ) |
| Other income (expense), net | $ | 468 |
| $ | (15 | ) | | $ | 1,581 |
| $ | (185 | ) |
|
| | |
Third Quarter 2017 Form 10-Q | | 13 |
Blackbaud, Inc.
Notes to consolidated financial statements (continued)
(Unaudited)
The following table summarizes our debt balances and the related weighted average effective interest rates, which includes the effect of interest rate swap agreements.
|
| | | | | | | | | | | |
| | Debt balance at | | | Weighted average effective interest rate at | |
| (dollars in thousands) | September 30,
2017 |
| December 31,
2016 |
| | September 30,
2017 |
| December 31,
2016 |
|
| Credit facility: | | | | | |
| Revolving credit loans | $ | 39,900 |
| $ | 180,900 |
| | 3.38 | % | 2.36 | % |
| Term loans | 298,125 |
| 162,969 |
| | 2.64 | % | 2.62 | % |
| Other debt | 2,151 |
| — |
| | 4.50 | % | — | % |
| Total debt | 340,176 |
| 343,869 |
| | 2.74 | % | 2.48 | % |
| Less: Unamortized discount and debt issuance costs | 2,220 |
| 1,476 |
| | | |
| Less: Debt, current portion | 8,576 |
| 4,375 |
| | 2.74 | % | 2.50 | % |
| Debt, net of current portion | $ | 329,380 |
| $ | 338,018 |
| | 2.74 | % | 2.48 | % |
Financing for AcademicWorks acquisition
As discussed in Note 3 to these consolidated financial statements, on April 3, 2017 we acquired AcademicWorks for $52.1 million in cash, net of closing adjustments. We financed the acquisition through a draw down of a revolving credit loan under the 2014 Credit Facility (defined below).
2017 refinancing
We were previously party to a $325.0 million five-year credit facility entered into during February 2014. The credit facility included: a dollar and a designated currency revolving credit facility with sublimits for letters of credit and swingline loans (the “2014 Revolving Facility”) and a term loan facility (the “2014 Term Loan”), together, (the “2014 Credit Facility”).
In June 2017, we entered into a five-year $700.0 million senior credit facility (the “2017 Credit Facility”). The 2017 Credit Facility includes a $400.0 million revolving credit facility (the “2017 Revolving Facility”) and a $300.0 million term loan facility (the “2017 Term Loan”). Upon closing we drew $300.0 million on a term loan and $110.0 million in revolving credit loans, which was used to repay all amounts outstanding under the 2014 Credit Facility, fees and expenses incurred in connection with the 2017 Credit Facility, and for other general corporate purposes.
Certain lenders of the 2014 Term Loan participated in the 2017 Term Loan and the change in the present value of our future cash flows to these lenders under the 2014 Term Loan and under the 2017 Term Loan was less than 10%. Accordingly, we accounted for the refinancing event for these lenders as a debt modification. Certain lenders of the 2014 Term Loan did not participate in the 2017 Term Loan. Accordingly, we accounted for the refinancing event for these lenders as a debt extinguishment. Certain lenders of the 2014 Revolving Facility participated in the 2017 Revolving Facility and provided increased borrowing capacities. Accordingly, we accounted for the refinancing event for these lenders as a debt modification. Certain lenders of the 2014 Revolving Facility did not participate in the 2017 Revolving Facility. Accordingly, we accounted for the refinancing event for these lenders as a debt extinguishment.
We recorded an insignificant loss on debt extinguishment related to the write-off of debt discount and deferred financing costs for the portions of the 2014 Credit Facility considered to be extinguished. This loss was recognized in the consolidated statements of comprehensive income within other income (expense), net.
In connection with our entry into the 2017 Credit Facility, we paid $3.1 million in financing costs, of which $1.0 million was capitalized in other assets and, together with a portion of the unamortized deferred financing costs from the 2014 Credit Facility and prior facilities, are being amortized into interest expense ratably over the term of the new facility. As of September 30, 2017, deferred financing costs totaling $1.3 million were included in other assets on our consolidated balance sheets. As of December 31, 2016, deferred financing costs included in other assets on our consolidated balance sheets were insignificant. We recorded aggregate financing costs of $1.8 million as a direct deduction from the carrying
| | | | | | | | | | | | | | | | | |
| Debt balance at | | Weighted average
effective interest rate at |
| (dollars in thousands) | June 30,
2021 | December 31,
2020 | | June 30,
2021 | December 31,
2020 |
| Credit facility: | | | | | |
| Revolving credit loans | $ | 90,000 | | $ | 69,625 | | | 1.73 | % | 1.83 | % |
| Term loans | 395,000 | | 400,000 | | | 2.60 | % | 3.12 | % |
| Real estate loans | 60,074 | | 60,626 | | | 5.22 | % | 5.22 | % |
| Other debt | 2,232 | | 3,926 | | | 5.00 | % | 5.00 | % |
| Total debt | 547,306 | | 534,177 | | | 2.75 | % | 3.21 | % |
| Less: Unamortized discount and debt issuance costs | 2,422 | | 3,144 | | | | |
| Less: Debt, current portion | 12,911 | | 12,840 | | | 2.61 | % | 2.61 | % |
| Debt, net of current portion | $ | 531,973 | | $ | 518,193 | | | 2.76 | % | 3.22 | % |
|
| | | | | | | |
14Second Quarter 2021 Form 10-Q | | Third Quarter 2017 Form 10-Q13 |
Blackbaud, Inc.
Notes to consolidated financial statements (continued)Condensed Consolidated Financial Statements
(Unaudited)
2020 credit facility
amount of our debt liability, which related to debt discount (fees paid to lenders) and debt issuance costs for the 2017 Term Loan.
Summary of the 2017In October 2020, we entered into a five-year $900.0 million senior credit facility (the "2020 Credit Facility
The 2017 Revolving Facility includes (i) a $50.0 million sublimit available for the issuance of standby letters of credit, (ii) a $50.0 million sublimit available for swingline loans, and (iii) a $100.0 million sublimit available for multicurrency borrowings.
The 2017 Credit Facility is secured by the stock and limited liability company interests of certain of our subsidiaries and any of our material domestic subsidiaries.
Amounts borrowed under the dollar tranche revolving credit loans and term loan under the 2017 Credit Facility bear interest at a rate per annum equal to, at our option, (a) a base rate equal to the highest of (i) the prime rate announced by Bank of America, N.A., (ii) the Federal Funds Rate plus 0.50% and (iii) the Eurocurrency Rate (which varies depending on the currency in which the loan is denominated) plus 1.00% (the “Base Rate”Facility"), in addition to a margin of 0.00% to 0.75%, or (b) Eurocurrency Rate plus a margin of 1.00% to 1.75%.
We also pay a quarterly commitment fee on the unused portion of the 2017 Revolving Facility from 0.15% to 0.25% per annum, depending on our net leverage ratio. At SeptemberJune 30, 2017, the commitment fee was 0.20%.
The term loan under the 2017 Credit Facility requires periodic principal payments. The balance of the term loan and any amounts drawn on the revolving credit loans are due upon maturity of the 2017 Credit Facility in June 2022. We evaluate the classification of our debt as current or non-current based on the required annual maturities of the 2017 Credit Facility.
The 2017 Credit Facility includes financial covenants related to the net leverage ratio and interest coverage ratio, as well as restrictions on our ability to declare and pay dividends and our ability to repurchase shares of our common stock. At September 30, 2017,2021, we were in compliance with our debt covenants under the 20172020 Credit Facility.
Real estate loans
The 2017 Credit Facility also includes an option to request increases inIn August 2020, we completed the revolving commitments and/or request additional term loans inpurchase of our global headquarters facility. As part of the purchase price, we assumed the Seller’s obligations under two senior secured notes with an aggregate outstanding principal amount of up to $200.0$61.1 million plus an amount, if any, such that(collectively, the Net Leverage Ratio shall be no greater than 3.00 to 1.00.
“Real Estate Loans”). At June 30, 2021, we were in compliance with our debt covenants under the Real Estate Loans.
Other debt
In September 2017,From time to time, we enteredenter into a two-year $2.2 million agreement to finance our purchasethird-party financing agreements for purchases of software licenses and related services. The agreement is a non-interest bearing noteservices for our internal use. Generally, the agreements are non-interest-bearing notes requiring annual payments, with the first payment due in November 2017.payments. Interest associated with the notenotes is imputed at the rate we would incur for amounts borrowed under our then-existing credit facility at the 2017 Credit Facility.inception of the notes.
The following table summarizes our currently effective financing agreements as of June 30, 2021:
| | | | | | | | | | | | | | |
| (dollars in thousands) | Term
in Months | Number of
Annual Payments | First Annual
Payment Due | Original Loan
Value |
| Effective dates of agreements: | | | | |
| December 2019 | 51 | 4 | | January 2020 | $ | 2,150 | |
| January 2020 | 39 | 3 | | March 2020 | 3,470 | |
| | | | |
As of
SeptemberJune 30,
2017,2021, the required annual maturities related to the
20172020 Credit Facility,
the Real Estate Loans and
our other debt were as follows:
|
| | | |
Years ending December 31, (dollars in thousands) | Annual maturities |
|
| 2017 - remaining | $ | 2,950 |
|
| 2018 | 8,576 |
|
| 2019 | 7,500 |
|
| 2020 | 7,500 |
|
| 2021 | 7,500 |
|
| Thereafter | 306,150 |
|
| Total required maturities | $ | 340,176 |
|
| | | | | |
Years ending December 31,
(dollars in thousands) | Annual
maturities |
| 2021 - remaining | $ | 5,594 | |
| 2022 | 12,985 | |
| 2023 | 11,983 | |
| 2024 | 11,609 | |
| 2025 | 451,784 | |
| Thereafter | 53,351 | |
| Total required maturities | $ | 547,306 | |
|
| | |
Third Quarter 2017 Form 10-Q | | 15 |
Blackbaud, Inc.
Notes to consolidated financial statements (continued)
(Unaudited)
|
|
9.8. Derivative Instruments |
Cash flow hedges
We generally use derivative instruments to manage our variable interest rate risk. In March 2014, weWe have entered into an interest rate swap agreement (the "March 2014 Swap Agreement"),agreements, which effectively convertsconvert portions of our variable rate debt under our credit facilitythe 2020 Credit Facility to a fixed rate for the term of the swap agreement. The initial notional valueagreements. We designated each of the March 2014 Swap Agreement was $125.0 million with an effective date beginning in March 2014. In March 2017, the notional value of the March 2014 Swap Agreement decreased to $75.0 million for the remaining term through February 2018. We designated the March 2014 Swap Agreementinterest rate swap agreements as a cash flow hedge at the inception of the contract.
In October 2015, we entered into an additional interest rate swap agreement (the "October 2015 Swap Agreement"), which effectively converts portions of our variable rate debt under our credit facility to a fixed rate for the term of the October 2015 Swap Agreement. The notional value of the October 2015 Swap Agreement was $75.0 million with an effective date beginning in October 2015 and maturing in February 2018. We designated the October 2015 Swap Agreement as a cash flow hedge at the inception of the contract.
In July 2017, we entered into an additional interest rate swap agreement (the "July 2017 Swap Agreement"), which effectively converts portions of our variable rate debt under our credit facility to a fixed rate for the term of the swap agreement. The notional value of the July 2017 Swap Agreement was $150.0 million with an effective date beginning in July 2017 through July 2021. We designated the July 2017 Swap Agreement as a cash flow hedge at the inception of the contract.
Undesignated contracts
In June 2017, we entered into a foreign currency option contract to hedge our exposure to currency fluctuations in connection with our acquisition of JustGiving because the purchase price was denominated in British Pounds. The notional value of the instrument was £100.0 million with an effective date beginning in June 2017 and maturing in September 2017. We settled the foreign currency option contract in September 2017. We did not designate the foreign currency option contract as a cash flow hedge for accounting purposes since it involved a business combination. As such, changes in the fair value of this derivative are recognized currently in earnings. The insignificant premium paid for this option and the $1.0 million in proceeds from the settlement are shown within cash flows from investing activities in our consolidated statements of cash flows.
As the closing date of our acquisition of JustGiving extended beyond the settlement date of the foreign currency option contract, we entered into a foreign currency forward contract in September 2017 with settlement in October 2017. The notional value of the instrument was £103.5 million. We did not designate the foreign currency forward contract as a cash flow hedge for accounting purposes since it involved a business combination. As such, changes in the fair value of this derivative are recognized currently in earnings.
contracts.
| | | | | | | | |
| 14 | | Second Quarter 2021 Form 10-Q |
Blackbaud, Inc.
Notes to Condensed Consolidated Financial Statements
(Unaudited)
The terms and notional values of our derivative instruments were as follows as of June 30, 2021:
| | | | | | | | |
| (dollars in thousands) | Term of derivative instrument | Notional
value |
| Derivative instruments designated as hedging instruments: | | |
| Interest rate swap | July 2017 - July 2021 | $ | 150,000 | |
| Interest rate swap | November 2020 - October 2024 | 60,000 | |
| Interest rate swap | November 2020 - October 2024 | 60,000 | |
| Interest rate swap | June 2021 - October 2024 | 120,000 | |
| | $ | 390,000 | |
| | |
16Forward-starting interest rate swap | July 2021 - October 2024 | Third Quarter 2017 Form 10-Q120,000 | |
| | $ | 120,000 | |
Table of ContentsIn July 2021, we entered into a new interest rate swap agreement. See additional details at Note 14.
Blackbaud, Inc.
Notes to consolidated financial statements (continued)
(Unaudited)
The fair values of our derivative instruments were as follows as of: | | | | | Asset Derivatives | | | Liability Derivatives | | Asset derivatives | | | Liability derivatives |
| (dollars in thousands) | Balance sheet location | September 30,
2017 |
| December 31,
2016 |
| | Balance sheet location | September 30,
2017 |
| December 31,
2016 |
| (dollars in thousands) | Balance sheet location | June 30,
2021 | December 31,
2020 | | Balance sheet location | June 30,
2021 | December 31,
2020 |
| Derivative instruments designated as hedging instruments: | | | | | Derivative instruments designated as hedging instruments: | | | |
| Interest rate swaps, current portion | Prepaid expenses and other current assets | $ | 223 |
| $ | — |
| | Accrued expenses and other current liabilities | $ | — |
| $ | — |
| Interest rate swaps, current portion | Prepaid expenses
and other
current assets | $ | 0 | | $ | 0 | | | Accrued expenses
and other
current liabilities | $ | 138 | | $ | 2,698 | |
| Interest rate swaps, long-term portion | Other assets | — |
| 206 |
| | Other liabilities | 328 |
| 163 |
| Interest rate swaps, long-term portion | Other assets | 2,061 | | 0 | | | Other liabilities | 0 | | 1,461 | |
| Total derivative instruments designated as hedging instruments | | $ | 223 |
| $ | 206 |
| | $ | 328 |
| $ | 163 |
| Total derivative instruments designated as hedging instruments | | $ | 2,061 | | $ | 0 | | | $ | 138 | | $ | 4,159 | |
| | | | | | |
Derivative instruments not designated as hedging instruments: | |
| | | | |
| Foreign currency forward contracts | Prepaid expenses
and other current assets | $ | — |
| $ | — |
| | Accrued expenses and other current liabilities | $ | 41 |
| $ | — |
| |
Total derivative instruments not designated as hedging instruments | | $ | — |
| $ | — |
| | $ | 41 |
| $ | — |
| |
|
| | | | |
| Total derivative instruments | | $ | 223 |
| $ | 206 |
| | $ | 369 |
| $ | 163 |
| |
|
The effects of derivative instruments in cash flow hedging relationships were as follows: | | | | Gain (loss) recognized in accumulated other comprehensive loss as of |
| Location of gain (loss) reclassified from accumulated other comprehensive loss into income | Gain (loss) reclassified from accumulated other comprehensive loss into income | | | Gain (loss) recognized
in accumulated other
comprehensive
loss as of | Location
of gain (loss)
reclassified from
accumulated other
comprehensive
loss into income | Gain (loss) reclassified from accumulated
other comprehensive loss into income |
| (dollars in thousands) | September 30,
2017 |
| Three months ended
September 30, 2017 |
| | Nine months ended
September 30, 2017 |
| (dollars in thousands) | June 30,
2021 | Three months ended June 30, 2021 | | Six months ended June 30, 2021 |
| Interest rate swaps | $ | (105 | ) | Interest expense | $ | (88 | ) | | $ | (192 | ) | Interest rate swaps | $ | 1,923 | | Interest expense | $ | (1,408) | | | $ | (2,784) | |
| | | | | | | |
| | September 30,
2016 |
| | Three months ended
September 30, 2016 |
| | Nine months ended
September 30, 2016 |
| | June 30,
2020 | | Three months ended June 30, 2020 | | Six months ended June 30, 2020 |
| Interest rate swaps | $ | (654 | ) | Interest expense | $ | (265 | ) | | $ | (875 | ) | Interest rate swaps | $ | (5,233) | | Interest expense | $ | (1,018) | | | $ | (1,223) | |
Our policy requires that derivatives used for hedging purposes be designated and effective as a hedge of the identified risk exposure at the inception of the contract. Accumulated other comprehensive income (loss) includes unrealized gains or losses from the change in fair value measurement of our derivative instruments each reporting period and the related income tax expense or benefit. Changes in the fair value measurements of the derivative instruments and the related income tax expense or benefit are reflected as adjustments to accumulated other comprehensive income (loss) until the actual hedged expense is incurred or until the hedge is terminated at which point the unrealized gain (loss) is reclassified from accumulated other comprehensive income (loss) to current earnings. The estimated accumulated other comprehensive incomeloss as of SeptemberJune 30, 20172021 that is expected to be reclassified into earnings within the next twelve months
| | | | | | | | |
| Second Quarter 2021 Form 10-Q | | 15 |
Blackbaud, Inc.
Notes to Condensed Consolidated Financial Statements
(Unaudited)
is insignificant.$1.2 million. There were no0 ineffective portions of our interest rate swap derivatives during the ninesix months ended SeptemberJune 30, 20172021 and 2016.2020. See Note 13 to these consolidated financial statements12 for a summary of the changes in accumulated other comprehensive income (loss) by component.
|
| | |
Third Quarter 2017 Form 10-Q | | 179. Commitments and Contingencies |
Leases
Blackbaud, Inc.
Notes to consolidated financial statements (continued)
(Unaudited)
WeJune 30, 2021, we did not have any undesignated derivative instruments during 2016. operating leases that had not yet commenced.
The
effectscomponents of
undesignated derivative instruments during the three and nine months ended September 30, 2017lease expense were as follows:
|
| | | | | | | | |
| | Location of gain (loss) recognized in income on derivative | Gain (loss) recognized in income | |
| (dollars in thousands) | Three months ended
September 30, 2017 |
| | Nine months ended
September 30, 2017 |
|
| Foreign currency option contracts | Other income (expense), net | $ | 38 |
| | $ | 513 |
|
| Foreign currency forward contracts | Other income (expense), net | $ | (41 | ) | | $ | (41 | ) |
Total (loss) gain(1) | | $ | (3 | ) | | $ | 472 |
|
| |
(1) | The individual amounts for each year may not sum to total gain (loss) due to rounding. |
| | | | | | | | | | | | | | | | | |
| Three months ended June 30, | | Six months ended June 30, |
| (dollars in thousands) | 2021 | 2020 | | 2021 | 2020 |
Operating lease cost(1) | $ | 2,372 | | $ | 6,281 | | | $ | 5,213 | | $ | 12,592 | |
| Variable lease cost | 699 | | 1,113 | | | 1,398 | | 2,371 | |
| Sublease income | (366) | | (940) | | | (826) | | (1,853) | |
| Net lease cost | $ | 2,705 | | $ | 6,454 | | | $ | 5,785 | | $ | 13,110 | |
|
|
10. Commitments and Contingencies |
Leases
Total rent expense was $3.8 million and $3.1 million for the three months ended September 30, 2017 and 2016, respectively, and $11.9 million and $8.6 million for the nine months ended September 30, 2017 and 2016, respectively. The quarterly South Carolina state incentive payments we received as a result of locating our headquarters facility in Berkeley County, South Carolina, ended in the fourth quarter of 2016. These amounts(1)Includes short-term lease costs, which were recorded as a reduction of rent expense upon receipt and were insignificant during the three months ended September 30, 2016 and $2.2 million during the nine months ended September 30, 2016.immaterial.
Other commitments
The term loans under the 20172020 Credit Facility require periodic principal payments. The balance of the term loans and any amounts drawn on the revolving credit loans are due upon maturity of the 20172020 Credit Facility in June 2022.October 2025. The Real Estate Loans also require periodic principal payments and the balance of the Real Estate Loans are due upon maturity in April 2038.
We have contractual obligations for third-party technology used in our solutions and for other services we purchase as part of our normal operations. In certain cases, these arrangements require a minimum annual purchase commitment by us. As of SeptemberJune 30, 2017,2021, the remaining aggregate minimum purchase commitment under these arrangements was approximately $51.9$45.0 million through 2021.2024.
Solution and service indemnifications
In the ordinary course of business, we provide certain indemnifications of varying scope to customers against claims of intellectual property infringement made by third parties arising from the use of our solutions or services. If we determine that it is probable that a loss has been incurred related to solution or service indemnifications, any such loss that could be reasonably estimated would be recognized. We have not identified any losses and, accordingly, we have not recorded a liability related to these indemnifications.
Legal proceedings
We are subject to legal proceedings and claims that arise in the ordinary course of business.business, as well as certain other non-ordinary course proceedings, claims and inquiries, as described below. We make a provision for a loss contingency when it is both probable that a material liability has been incurred and the amount of the loss can be reasonably estimated. TheseIf only a range of estimated losses can be determined, we accrue an amount within the range that, in our judgment, reflects the most likely outcome; if none of the estimates within that range is a better estimate than any other amount, we accrue the low end of the range. For proceedings in which an unfavorable outcome is reasonably possible but not probable and an estimate of the loss or range of losses arising from the proceeding can be made, we disclose such an estimate, if material. If such a loss or range of losses is not reasonably estimable, we disclose that fact. We review any such loss contingency provisions are reviewed at least quarterly and adjustedadjust them to reflect the impacts of negotiations, settlements, rulings, advice of legal counsel and other information and events pertaining to a particular case. Unless otherwise specifically disclosed in this note, we have determined asWe
| | | | | | | | |
| 16 | | Second Quarter 2021 Form 10-Q |
Blackbaud, Inc.
Notes to Condensed Consolidated Financial Statements
(Unaudited)
recognize insurance recoveries, if any, claim against us because (a) there is not a reasonable possibility that a loss exceeding amounts already recognized (if any) may be incurred with respectwhen they are probable of receipt. All associated costs due to such claim; (b) a reasonably possible loss or range of loss cannot be estimated; or (c) such estimate is immaterial.
Allthird-party service providers and consultants, including legal costs associated with litigationfees, are expensed as incurred. Litigation is
Legal proceedings are inherently unpredictable. However, we believe that we have valid defenses with respect to the legal matters pending or threatened against us.us and intend to defend ourselves vigorously against all claims asserted. It is possible nevertheless, that our consolidated financial position, results of operations or cash flows could be materially negatively affected in any particular period by an unfavorable resolution of one or more of such legal proceedings.
Security incident
As previously disclosed, we are subject to risks and uncertainties as a result of a ransomware attack against us in May 2020 in which a cybercriminal removed a copy of a subset of data from our self-hosted environment (the "Security Incident"). Based on the nature of the Security Incident, our research and third party (including law enforcement) investigation, we have no reason to believe that any data went beyond the cybercriminal, was or will be misused, or will be disseminated or otherwise made available publicly. Our investigation into the Security Incident by our cybersecurity team and third-party forensic advisors remains ongoing.
As a result of the Security Incident, we are currently subject to certain legal proceedings, claims, inquiries and investigations, as discussed below, and could be the subject of additional legal proceedings, claims, inquires and investigations in the future that might result in adverse judgments, settlements, fines, penalties, or investigations.other resolution. To limit our exposure to losses related to claims against us, including data breaches such as the Security Incident, we maintain $50 million of insurance above a $250 thousand deductible payable by us. As noted below, this coverage has reduced our financial exposure related to the Security Incident, and we will continue to seek recoveries under these insurance policies. Based on our review of expenses incurred to date, and upon consideration of the number of matters outstanding (as described below), we believe it is probable that total losses related to the Security Incident will ultimately exceed the limits of our insurance coverage. However, we are currently unable to determine when that will be the case nor are we able to determine the approximate amount or range of any such excess.
In the three and six months ended June 30, 2021, we recorded $11.7 million and $24.4 million, respectively, of expenses related to the Security Incident and offsetting probable insurance recoveries of $11.2 million and $23.9 million, respectively. As of June 30, 2021, we have recorded cumulative expenses related to the Security Incident of $34.2 million and cumulative probable insurance recoveries of $33.3 million. Due to the time required to submit and process such insurance claims, we have not yet received all of the accrued insurance recoveries. Of the insurance recoveries recorded, $10.0 million had been paid as of June 30, 2021. Recorded expenses consisted primarily of payments to third-party service providers and consultants, including legal fees. We present expenses and insurance recoveries related to the Security Incident in general and administrative expense on our condensed consolidated statements of comprehensive income and as operating activities on our condensed consolidated statements of cash flows. We expect to continue to experience significant expenses related to our response to the Security Incident, resolution of legal proceedings, claims, inquiries and investigations discussed below, and our efforts to further enhance our security measures, and those expenses may be material.
Based on our analysis of the factors described above, we have not recorded a liability related to the Security Incident as of June 30, 2021 because we are unable at this time to reasonably estimate the possible loss or range of loss.
Customer claims. To date, we have received approximately 260 specific requests for reimbursement of expenses ("Customer Reimbursement Requests") and approximately 400 reservations of the right to seek expense recovery in the future from customers or their attorneys in the U.S., U.K. and Canada related to the Security Incident (none of which have as yet been filed in court and only one of which is in arbitration). Of the Customer Reimbursement Requests received to date, approximately 160 have been fully resolved and closed. Customer claims generally seek reimbursement of their costs and expenses associated with notifying their own customers of the Security Incident and taking steps to assure that personal information has not been compromised as a result of the Security Incident. Our review of customer claims includes analyzing individual customer contracts into which we have entered, the specific claims made and applicable law.
Customer constituent class actions. Presently, we are a defendant in 29 putative consumer class action cases [27 in U.S. federal courts (some of which have been consolidated under multi district litigation to a single federal court) and 2
|
| | | | | | | |
18Second Quarter 2021 Form 10-Q | | Third Quarter 2017 Form 10-Q17 |
Blackbaud, Inc.
Notes to consolidated financial statements (continued)Condensed Consolidated Financial Statements
(Unaudited)
in Canadian courts] alleging harm from the Security Incident. The plaintiffs in these cases, who purport to represent various classes of individual constituents of our customers, generally claim to have been harmed by alleged actions and/or omissions by us in connection with the Security Incident and assert a variety of common law and statutory claims seeking monetary damages, injunctive relief, costs and attorneys’ fees, and other related relief.
Lawsuits that are putative class actions require a plaintiff to satisfy a number of procedural requirements before proceeding to trial. These requirements include, among others, demonstration to a court that the law proscribes in some manner our activities, the making of factual allegations sufficient to suggest that our activities exceeded the limits of the law and a determination by the court—known as class certification—that the law permits a group of individuals to pursue the case together as a class. If these procedural requirements are not met, the lawsuit cannot proceed as a class action and the plaintiff may lose the financial incentive to proceed with the case. Frequently, a court’s determination as to these procedural requirements is subject to appeal to a higher court. As a result of these uncertainties, we may be unable to determine the probability of loss until, or after, a court has finally determined that a plaintiff has satisfied the applicable class action procedural requirements.
Furthermore, for putative class actions, it is often not possible to estimate the possible loss or a range of loss amounts, even where we have determined that a loss is reasonably possible. Generally, class actions involve a large number of people and raise complex legal and factual issues that result in uncertainty as to their outcome and, ultimately, making it difficult for us to estimate the amount of damages that a plaintiff might successfully prove. This analysis is further complicated by the fact that the plaintiffs lack contractual privity with us.
Governmental inquiries and investigations. To date, we have received a consolidated, multi-state Civil Investigative Demand issued on behalf of 47 state Attorneys General and the District of Columbia and separate Civil Investigative Demands from the offices of the Illinois Attorney General and the California Attorney General relating to the Security Incident. In addition, we have received communications, inquires and requests from the U.S. Federal Trade Commission, the SEC, the U.S. Department of Health and Human Services, the Information Commissioner’s Office in the United Kingdom under the U.K. Data Protection Act 2018, the Office of the Australian Information Commissioner, the Office of the Privacy Commissioner of Canada and the Spanish Data Protection Agency. We are cooperating with these offices and responding to their inquiries, which include various requests for documents, policies, narratives and communications, as well as requests to interview or depose various Company-related personnel. As noted above, each of these separate governmental inquiries and investigations could result in adverse judgements, settlements, fines, penalties, or other resolution, the amount, scope and timing of which we are currently unable to predict, but could be material.
Our income tax provision and effective income tax rates, including the effects of period-specific events, were:
| | | | | | | | | | | | | | | | | |
| | Three months ended June 30, | | Six months ended June 30, |
| (dollars in thousands) | 2021 | 2020 | | 2021 | 2020 |
| Income tax provision | $ | 1,745 | | $ | 4,496 | | | $ | 2,429 | | $ | 5,192 | |
| Effective income tax rate | 20.6 | % | 27.6 | % | | 27.0 | % | 24.0 | % |
|
| | | | | | | | | | | | | |
| | Three months ended
September 30, | | | Nine months ended
September 30, | |
| (dollars in thousands) | 2017 |
| 2016 |
| | 2017 |
| 2016 |
|
| Income tax provision | $ | 2,793 |
| $ | 1,950 |
| | $ | 2,964 |
| $ | 5,323 |
|
| Effective income tax rate | 18.2 | % | 17.9 | % | | 7.8 | % | 18.0 | % |
Our effective income tax rate during the three months ended September 30, 2017 remained relatively unchanged when compared to the same period in 2016. The decrease in our effective income tax rate duringfor the ninethree months ended SeptemberJune 30, 2017,2021, when compared to the same period in 2016,2020, was primarily dueattributable to a $9.0 million2021 discrete tax benefit toagainst lower pre-tax income. The 2020 effective income tax rate was negatively impacted by discrete adjustments comprised of tax expense relatingattributable to stock-based compensation items, as comparedand unrecognized tax benefits net of benefit attributable to deferred tax adjustment. The 2021 effective income tax rate was positively impacted by increased tax benefit attributable to stock-based compensation offset against tax expense attributable to a $4.3 million discretecorporate income tax benefit forrate increase enacted during the same period in 2016. against lower pre-tax income.
The increase in the discreteour effective income tax benefitrate for the ninesix months ended SeptemberJune 30, 2017, as2021 when compared to the same periodperiods in 2016,2020, was primarily attributable to an increase in the market price for sharesimpact of our common stock, as reported by the NASDAQ Stock Market LLC ("NASDAQ"), as well as an increase in the number of stock awards that vested and were exercised. Most of our equity awards are granted during our first quarter and vest in subsequent years during the same quarter.
non deductible expenses against lower pre-tax income. |
| | | | | | | |
12.18 | | Second Quarter 2021 Form 10-Q |
Blackbaud, Inc.
Notes to Condensed Consolidated Financial Statements
(Unaudited)
| | |
| 11. Stock-based Compensation |
Stock-based compensation expense is allocated to cost of revenue and operating expenses on the condensed consolidated statements of comprehensive income based on where the associated employee’s compensation is recorded. The following table summarizes stock-based compensation expense:
| | | | | | | | | | | | | | | | | |
| | Three months ended June 30, | | Six months ended June 30, |
| (dollars in thousands) | 2021 | 2020 | | 2021 | 2020 |
| Included in cost of revenue: | | | | | |
| Cost of recurring | $ | 3,492 | | $ | 1,151 | | | $ | 5,903 | | $ | 1,621 | |
| Cost of one-time services and other | 1,745 | | 1,419 | | | 4,692 | | 1,814 | |
| Total included in cost of revenue | 5,237 | | 2,570 | | | 10,595 | | 3,435 | |
| Included in operating expenses: | | | | | |
| Sales, marketing and customer success | 4,678 | | 3,603 | | | 10,106 | | 6,081 | |
| Research and development | 6,901 | | 4,348 | | | 13,615 | | 7,147 | |
| General and administrative | 13,733 | | 9,612 | | | 26,238 | | 17,050 | |
| Total included in operating expenses | 25,312 | | 17,563 | | | 49,959 | | 30,278 | |
| Total stock-based compensation expense | $ | 30,549 | | $ | 20,133 | | | $ | 60,554 | | $ | 33,713 | |
|
| | | | | | | | | | | | | |
| | Three months ended
September 30, | | | Nine months ended
September 30, | |
| (dollars in thousands) | 2017 |
| 2016 |
| | 2017 |
| 2016 |
|
| Included in cost of revenue: | | | | | |
| Cost of subscriptions | $ | 331 |
| $ | 318 |
| | $ | 963 |
| $ | 904 |
|
| Cost of maintenance | 103 |
| 137 |
| | 294 |
| 391 |
|
| Cost of services and other | 500 |
| 461 |
| | 1,418 |
| 1,308 |
|
| Total included in cost of revenue | 934 |
| 916 |
| | 2,675 |
| 2,603 |
|
| Included in operating expenses: | | | | | |
| Sales, marketing and customer success | 1,686 |
| 1,055 |
| | 4,906 |
| 2,972 |
|
| Research and development | 2,093 |
| 1,674 |
| | 5,877 |
| 4,874 |
|
| General and administrative | 6,213 |
| 5,173 |
| | 17,597 |
| 14,556 |
|
| Total included in operating expenses | 9,992 |
| 7,902 |
| | 28,380 |
| 22,402 |
|
| Total stock-based compensation expense | $ | 10,926 |
| $ | 8,818 |
| | $ | 31,055 |
| $ | 25,005 |
|
In November 2020, our Board of Directors reauthorized and expanded a stock repurchase program that authorizes us to purchase up to $250.0 million of our outstanding shares of common stock. The program does not have an expiration date. Under the stock repurchase program, we are authorized to repurchase shares from time to time in accordance with applicable laws both on the open market, including under trading plans established pursuant to Rule 10b5-1 under the Securities Exchange Act of 1934, as amended, and in privately negotiated transactions. The timing and amount of repurchases depends on several factors, including market and business conditions, the trading price of our common stock and the nature of other investment opportunities. The repurchase program may be limited, suspended or discontinued at any time without prior notice. Under the 2020 Credit Facility, we have restrictions on our ability to repurchase shares of our common stock, which are summarized on page 40 below.
We account for purchases of treasury stock under the cost method. During the three and six months ended June 30, 2021, we purchased 405,047 and 870,868 shares for $30.0 million and $58.1 million, respectively. The remaining amount available to purchase stock under the stock repurchase program was $150.9 million as of June 30, 2021.
|
| | | | | | | |
ThirdSecond Quarter 20172021 Form 10-Q | | 19 |
Blackbaud, Inc.
Notes to consolidated financial statements (continued)Condensed Consolidated Financial Statements
(Unaudited)
Dividends
Our Board of Directors has adopted a dividend policy, which provides for the distribution to stockholders of a portion of cash generated by us that is in excess of operational needs and capital expenditures. The 2017 Credit Facility limits the amount of dividends payable and certain state laws restrict the amount of dividends distributed.
In February 2017, our Board of Directors approved an annual dividend rate of $0.48 per share to be made in quarterly payments. Dividend payments are not guaranteed and our Board of Directors may decide, in its absolute discretion, at any time and for any reason, not to declare and pay further dividends. The following table provides information with respect to quarterly dividends of $0.12 per share paid on common stock during the nine months ended September 30, 2017. |
| | | | | | |
| Declaration Date | Dividend per Share |
| Record Date | | Payable Date |
| February 8, 2017 | $ | 0.12 |
| February 28 | | March 15 |
| May 1, 2017 | $ | 0.12 |
| May 26 | | June 15 |
| July 31, 2017 | $ | 0.12 |
| August 28 | | September 15 |
On October 25, 2017, our Board of Directors declared a fourth quarter dividend of $0.12 per share payable on December 15, 2017 to stockholders of record on November 28, 2017.
Changes in accumulated other comprehensive lossincome (loss) by component
The changes in accumulated other comprehensive lossincome (loss) by component, consisted of the following:
| | | | | | | | | | | | | | | | | |
| Three months ended June 30, | | Six months ended June 30, |
| (dollars in thousands) | 2021 | 2020 | | 2021 | 2020 |
| Accumulated other comprehensive income (loss), beginning of period | $ | 4,163 | | $ | (14,140) | | | $ | (2,497) | | $ | (5,290) | |
| By component: | | | | | |
| Gains and losses on cash flow hedges: | | | | | |
| Accumulated other comprehensive income (loss) balance, beginning of period | $ | 1,048 | | $ | (4,445) | | | $ | (3,101) | | $ | (1,323) | |
| | | | | |
| Other comprehensive income (loss) before reclassifications, net of tax effects of $244, $71, $(856) and $1,225 | (692) | | (200) | | | 2,438 | | (3,473) | |
| Amounts reclassified from accumulated other comprehensive (loss) income to interest expense | 1,408 | | 1,018 | | | 2,784 | | 1,223 | |
| Tax benefit included in provision for income taxes | (371) | | (267) | | | (728) | | (321) | |
| Total amounts reclassified from accumulated other comprehensive (loss) income | 1,037 | | 751 | | | 2,056 | | 902 | |
| Net current-period other comprehensive income (loss) | 345 | | 551 | | | 4,494 | | (2,571) | |
| Accumulated other comprehensive income (loss) balance, end of period | $ | 1,393 | | $ | (3,894) | | | $ | 1,393 | | $ | (3,894) | |
| Foreign currency translation adjustment: | | | | | |
| Accumulated other comprehensive income (loss) balance, beginning of period | $ | 3,115 | | $ | (9,695) | | | $ | 604 | | $ | (3,967) | |
| Translation adjustments | 1,783 | | (887) | | | 4,294 | | (6,615) | |
| Accumulated other comprehensive income (loss) balance, end of period | 4,898 | | (10,582) | | | 4,898 | | (10,582) | |
| Accumulated other comprehensive income (loss), end of period | $ | 6,291 | | $ | (14,476) | | | $ | 6,291 | | $ | (14,476) | |
|
| | | | | | | | | | | | | |
| | Three months ended
September 30, | | | Nine months ended
September 30, | |
| (dollars in thousands) | 2017 |
| 2016 |
| | 2017 |
| 2016 |
|
| Accumulated other comprehensive loss, beginning of period | $ | (558 | ) | $ | (1,640 | ) | | $ | (457 | ) | $ | (825 | ) |
| By component: | | | | | |
| Gains and losses on cash flow hedges: | | | | | |
| Accumulated other comprehensive income (loss) balance, beginning of period | $ | 203 |
| $ | (806 | ) | | $ | 25 |
| $ | (19 | ) |
| Other comprehensive (loss) income before reclassifications, net of tax effects of $209, $(161), $135 and $589 | (320 | ) | 248 |
| | (205 | ) | (909 | ) |
| Amounts reclassified from accumulated other comprehensive loss to interest expense | 88 |
| 265 |
| | 192 |
| 875 |
|
| Tax benefit included in provision for income taxes | (35 | ) | (104 | ) | | (76 | ) | (344 | ) |
| Total amounts reclassified from accumulated other comprehensive loss | 53 |
| 161 |
| | 116 |
| 531 |
|
| Net current-period other comprehensive (loss) income | (267 | ) | 409 |
| | (89 | ) | (378 | ) |
| Accumulated other comprehensive loss balance, end of period | $ | (64 | ) | $ | (397 | ) | | $ | (64 | ) | $ | (397 | ) |
| Foreign currency translation adjustment: | | | | | |
| Accumulated other comprehensive loss balance, beginning of period | $ | (761 | ) | $ | (834 | ) | | $ | (482 | ) | $ | (806 | ) |
| Translation adjustments | (188 | ) | 289 |
| | (467 | ) | 261 |
|
| Accumulated other comprehensive loss balance, end of period | (949 | ) | (545 | ) | | (949 | ) | (545 | ) |
| Accumulated other comprehensive loss, end of period | $ | (1,013 | ) | $ | (942 | ) | | $ | (1,013 | ) | $ | (942 | ) |
As of June 30, 2021, approximately $797 million of revenue is expected to be recognized from remaining performance obligations. We expect to recognize revenue on approximately 55% of these remaining performance obligations over the next 12 months, with the remainder recognized thereafter.
We applied the practical expedient in ASC 606-10-50-14 and have excluded the value of unsatisfied performance obligations for (i) contracts with an original expected length of one year or less (one-time services); and (ii) contracts for which we recognize revenue at the amount to which we have the right to invoice for services performed (transactional revenue).
Contract balances
Our contract assets as of June 30, 2021 and December 31, 2020 were insignificant. Our opening and closing balances of deferred revenue were as follows:
| | | | | | | | |
| (in thousands) | June 30,
2021 | December 31,
2020 |
| Total deferred revenue | $ | 345,419 | | $ | 316,914 | |
|
| | | | | | | |
| 20 | | ThirdSecond Quarter 20172021 Form 10-Q |
Blackbaud, Inc.
Notes to consolidated financial statements (continued)Condensed Consolidated Financial Statements
(Unaudited)
The increase in deferred revenue during the six months ended June 30, 2021 was primarily due to a seasonal increase in customer contract renewals and, to a lesser extent, early progress in initiatives to bring our pricing in line with the market. Historically, due to the timing of customer budget cycles, we have an increase in customer contract renewals at or near the beginning of our third quarter. The amount of revenue recognized during the six months ended June 30, 2021 that was included in the deferred revenue balance at the beginning of the period was approximately $229 million. The amount of revenue recognized during the six months ended June 30, 2021 from performance obligations satisfied in prior periods was insignificant.
Disaggregation of revenue We sell our cloud solutions and related services in three primary geographical markets: to customers in the United States, to customers in the United Kingdom and to customers located in other countries. The following table presents our revenue by geographic area based on the address of our customers: During | | | | | | | | | | | | | | | | | |
| Three months ended June 30, | | Six months ended June 30, |
| (dollars in thousands) | 2021 | 2020 | | 2021 | 2020 |
| United States | $ | 192,000 | | $ | 189,304 | | | $ | 377,327 | | $ | 383,263 | |
| United Kingdom | 24,505 | | 29,535 | | | 46,810 | | 45,359 | |
| Other countries | 12,935 | | 13,152 | | | 24,494 | | 26,990 | |
| Total revenue | $ | 229,440 | | $ | 231,991 | | | $ | 448,631 | | $ | 455,612 | |
Beginning in the firstsecond quarter of 2017,2021, we changed the names ofcombined our reportable segments. However, there was no change in the determination of our reportable segments or our reporting units at that time. As of September 30, 2017, our reportable segments were the General Markets Group ("GMG"), the Emerging and Enterprise Markets Group ("EMG"), into a single U.S. Markets Group ("UMG") and themoved our Corporations vertical under our International Markets Group ("IMG"). This change was made to better align our resources toward customer retention and growth, which are key objectives as we progress toward our long-term aspirational goals.
The UMG and the IMG comprised our go-to-market organizations as of June 30, 2021. The following is a description of each reportable segment:market group as of that date:
•The GMG is generally focusedUMG focuses on sales primarily to all emerging and mid-sized prospects and customers in North America;inside of the U.S.; and
•The EMG is generally focusedIMG focuses on sales to all large and/or strategic prospects and customers in North America; and
The IMG is focused on marketing, sales, delivery and supportprimarily to all prospects and customers outside of North America.the U.S, as well as corporations.
Our chief operating decision maker isThe following table presents our chief executive officer ("CEO"). Currently,revenue by market group:
| | | | | | | | | | | | | | | | | |
| Three months ended June 30, | | Six months ended June 30, |
| (dollars in thousands) | 2021 | 2020(1) | | 2021 | 2020(1) |
| UMG | $ | 179,436 | | $ | 182,925 | | | $ | 352,903 | | $ | 370,544 | |
| IMG | 50,028 | | 49,790 | | | 95,797 | | 85,828 | |
| Other | (24) | | (724) | | | (69) | | (760) | |
| Total revenue | $ | 229,440 | | $ | 231,991 | | | $ | 448,631 | | $ | 455,612 | |
(1)Due to the market group change discussed above, we have recast our CEO reviews financial information presented on an operating segment basisrevenue by market group for the purposes of making certain operating decisionsthree and assessing financial performance. The CEO uses internal financial reports that provide segment revenues and operating income, as adjusted, which excludes stock-based compensation expense, amortization expense, depreciation expense, research and development expense and certain corporate sales, marketing, general and administrative expenses. Segment operating income, as adjusted, includes direct, controllable costs relatedsix months ended June 30, 2020 to present them on a consistent basis with the sale of our solutions and services, and our customer success program.current year.
The CEO does not review any segment balance sheet information. Summarized reportable segment financial results, were as follows:following table presents our recurring revenue by type:
|
| | | | | | | | | | | | | |
| | Three months ended
September 30, | | | Nine months ended
September 30, | |
| (dollars in thousands) | 2017 |
| 2016 |
| | 2017 |
| 2016 |
|
| Revenue by segment: | | | | | |
| GMG | $ | 102,838 |
| $ | 97,621 |
| | $ | 296,954 |
| $ | 279,543 |
|
| EMG | 81,836 |
| 74,351 |
| | 243,713 |
| 220,887 |
|
| IMG | 10,846 |
| 11,030 |
| | 30,632 |
| 31,926 |
|
Other(1) | (7 | ) | 61 |
| | 30 |
| 154 |
|
| Total revenue | $ | 195,513 |
| $ | 183,063 |
| | $ | 571,329 |
| $ | 532,510 |
|
Segment operating income, as adjusted(2): | | | | | |
| GMG | $ | 49,971 |
| $ | 46,540 |
| | $ | 143,658 |
| $ | 134,408 |
|
| EMG | 44,375 |
| 38,696 |
| | 130,887 |
| 113,186 |
|
| IMG | 2,888 |
| 1,064 |
| | 7,084 |
| 3,126 |
|
Other(1) | (58 | ) | (157 | ) | | (113 | ) | (109 | ) |
| | 97,176 |
| 86,143 |
| | 281,516 |
| 250,611 |
|
| Less: | | | | | |
Corporate unallocated costs(3) | (57,575 | ) | (53,236 | ) | | (173,102 | ) | (156,013 | ) |
| Stock-based compensation costs | (10,926 | ) | (8,818 | ) | | (31,055 | ) | (25,005 | ) |
| Amortization expense | (10,710 | ) | (10,549 | ) | | (32,067 | ) | (31,817 | ) |
| Interest expense | (3,092 | ) | (2,641 | ) | | (8,685 | ) | (8,037 | ) |
| Other income (expense), net | 468 |
| (15 | ) | | 1,581 |
| (185 | ) |
| Income before provision for income taxes | $ | 15,341 |
| $ | 10,884 |
| | $ | 38,188 |
| $ | 29,554 |
|
| |
(1) | Other includes revenue and the related costs from the sale of solutions and services not directly attributable to a reportable segment. |
| |
(2) | Segment operating income, as adjusted, includes direct, controllable costs related to the sale of our solutions and service, and our customer success program. |
| |
(3) | Corporate unallocated costs include research and development, depreciation expense, and certain corporate sales, marketing, general and administrative expenses. |
| | | | | | | | | | | | | | | | | |
| Three months ended June 30, | | Six months ended June 30, |
| (dollars in thousands) | 2021 | 2020 | | 2021 | 2020 |
| Contractual recurring | $ | 151,150 | | $ | 148,214 | | | $ | 297,971 | | $ | 295,958 | |
| Transactional recurring | 65,836 | | 68,046 | | | 125,765 | | 125,169 | |
| Total recurring revenue | $ | 216,986 | | $ | 216,260 | | | $ | 423,736 | | $ | 421,127 | |
|
| | | | | | | |
ThirdSecond Quarter 20172021 Form 10-Q | | 21 |
Blackbaud, Inc.
Notes to consolidated financial statements (continued)Condensed Consolidated Financial Statements
(Unaudited)
In light of the ongoing and anticipated increasing centralization of our operations, including without limitation marketing, customer support, customer success and professional services, we are evaluating whether changes may need to be made to our internal reporting structure to better support and assess the operations of our business going forward. If changes are made, we will assess the resulting effect on our reportable segments, operating segments and reporting units, if any.
JustGiving acquisitionInterest rate swap agreement
On October 2, 2017, Blackbaud Global Limited (“Blackbaud Global”In July 2021, we entered into an additional interest rate swap agreement (the "July 2021 Swap Agreement"), a United Kingdom limited liability company and wholly-owned subsidiarywhich effectively converts portions of ours, acquired the entire issued share capital, including all voting equity interests, of Giving Limited, a United Kingdom private limited company doing business as “JustGiving” for an aggregate purchase price of £95.0 million, or approximately $127.4 million, in cash, subject to certain adjustments set forth in the stock purchase agreement. JustGiving is a market leading social platform for giving, and the acquisition is expected to enhance our capabilities to serve both individual donors and nonprofits, expanding the peer-to-peer fundraising capabilities we offer today. As a result of the acquisition, JustGiving has become a wholly-owned subsidiary of ours. We will include the operating results of JustGiving as well as the net assets acquired and liabilities assumed in our consolidated financial statements from the date of acquisition. During the three and nine months ended September 30, 2017, we incurred acquisition-related expenses associated with the acquisition of JustGiving of $0.7 million and $2.2 million, respectively, which are recorded in general and administrative expense. Due to the timing of the transaction, the initial accounting for this acquisition, including the measurement of assets acquired, liabilities assumed and goodwill, is not complete and is pending detailed analyses of the facts and circumstances that existed as of the October 2, 2017 acquisition date.
On October 2, 2017, we borrowed $138.7 million pursuant to a revolving credit loanvariable rate debt under the 20172020 Credit Facility to financea fixed rate for the acquisitionterm of JustGiving. Following the borrowing, approximately $178.6July 2021 Swap Agreement. The notional value of the July 2021 Swap Agreement was $75.0 million was outstanding underwith an effective date beginning in July 2021 through Oct 2024. We designated the revolving credit loans with approximately $169.8 millionJuly 2021 Swap Agreement as a cash flow hedge at the inception of available borrowing capacity under the 2017 Credit Facility.contract. See Note 8 for information about our other interest rate swap agreements.
|
| | | | | | | |
| 22 | | ThirdSecond Quarter 20172021 Form 10-Q |
Blackbaud, Inc.
(Unaudited)
ITEM 2. MANAGEMENT'S DISCUSSION AND ANALYSIS OF FINANCIAL CONDITION AND RESULTS OF OPERATIONS
The following discussion and analysis of our financial condition and results of operations should be read in conjunction with our condensed consolidated financial statements and related notes included elsewhere in this Quarterly Report on Form 10-Q. The following discussion and analysis presents financial information denominated in millions of dollars which can lead to differences from rounding when compared to similar information contained in the condensed consolidated financial statements and related notes which are primarily denominated in thousands of dollars.
We are the world’s leading cloud software company powering social good. Serving the entire social good community—nonprofits, foundations, corporations,higher education institutions, K–12 schools, healthcare institutionsorganizations, faith communities, arts and cultural organizations, foundations, companies and individual change agents—we connect and empower organizations to increase their impact through cloud software, services, expertise and data intelligence. Our portfolio is tailored to the unique needs of vertical markets, with solutions for fundraising and CRM, marketing, advocacy, peer-to-peer fundraising, corporate social responsibility, school management, ticketing, grantmaking, financial management, payment processing and analytics. Serving the industry for more than threefour decades, we are headquartered in Charleston, South Carolina, and have operations in the United States, Australia, Canada, Costa Rica and the United Kingdom. As of September 30, 2017, we had approximately 35,000 customers.
Our revenue is primarily generated from the following sources: (i) charging for the use of our software solutions in cloud-basedcloud and hosted environments; (ii) providing transactionpayment and payment processingother transactional-type services; (iii) providing software maintenance and support services; and (iv) providing professional services, including implementation, consulting, training, consulting, analytic and other services;services.
COVID-19 Impact
The economic impact of COVID-19 on the social good industry remains uncertain, although we are beginning to see signs of recovery in the industry. If our existing and (iv) providing software maintenanceprospective customers remain cautious in their purchase decisions, our operating environment may continue to be challenging for the remainder of 2021 and support services.
During the third quarter of 2017,potentially beyond. Notwithstanding these conditions, we continuedremain focused on continuing to execute on our four-point growth strategy targeted to drive an extended period of quality enhancement, solution and service innovation and increasing operating efficiency and financial performance:strengthening our leadership position.
Four-Point Strategy
| | | | | | | | | | | | | | |
1. | Deliver Integrated1 | | Expand Total Addressable Market | |
| | | | |
| 2 | | Lead with World Class Teams and OpenOperations | |
| | | | |
| 3 | | Delight Customers with Innovative Cloud Solutions in the Cloud | |
| | | | |
| 4 | | Focus on Employees, Culture and ESG Initiatives | |
1.Expand Total Addressable Market ("TAM")
We continueare now once again actively evaluating opportunities to transitionfurther expand our business to predominantly serve customersaddressable market through acquisitions and internal product development. We have significant opportunities in front of us as we are less than 10% penetrated into a subscription-based cloud delivery model, enabling lower costTAM of entry, greater scalability and lower total cost of ownership to our customers. We continue to optimize our portfolio of solutions and integrate powerful capabilities — such as built in data, analytics, artificial intelligence, payment processing and tailored user-specific experiences — to bring even greater value and performance to our customers.
The Blackbaud SKY™ cloud platform is allowing us to innovate at a more rapid pace, including delivering enhanced integrated analytics capabilities that surface directly in our customers’ software through SKY AI and SKY Analytics—componentsover $10 billion. Acquisitions are an important element of our broader Intelligence for Good approach that combines AI, analytics, one of the industry’s most robust data sets and expertise to drive powerful insights for our customers. These embedded, cloud-delivered insights provide high impact, workflow-integrated intelligence that drives fundraising, advocacy, event participation and other purpose driven constituent interactions.
At our annual user conference, bbcon, we announced a joint-partnership with Microsoft to couple together Microsoft's horizontal solutions with our industry-leading vertical solutions. We now intend to fully power Blackbaud SKY in the Microsoft Azure environment, and we will become a Cloud Solution Provider Partner for the Microsoft platform.
strategy going forward.
|
| | | | | | | |
ThirdSecond Quarter 20172021 Form 10-Q | | 23 |
Blackbaud, Inc.
(Unaudited)
| |
2. | Drive Sales Effectiveness |
We continue2.Lead with World Class Teams and Operations
This strategy expands upon our previous strategies to invest in a world-classdrive sales organization to accelerate revenue growth and penetrate our large and expanding total addressable market ("TAM"), which is currently estimated to be over $7.0 billion. During the first three quarters of 2017, we created a new Senior Vice President of Global Sales position to lead this effort across the organization and we have focused on enabling our expanding sales teams with training, processes, and tools to improve effectiveness and drive revenueimprove operating efficiency to include improving overall company performance as measured by the Rule of 40 (see discussion of Non-GAAP Financial Measures below). We have a strong executive team that is delivering on our mission and executing on our strategy. We have talent across our company, at every level, who are aligned with these goals as well. In support of this strategy, during the second quarter of 2021, we merged our EMG and GMG to create one U.S. Market Group ("UMG") to better align our resources toward customer retention and growth. The further development ofFor more information, see Note 13 to our customer success program is allowing our sales teams to focus on closing sales rather than account management. The move to selling pre-integrated solution suites instead of individual point-solutions continues to be successful, and we have furthered our go-to-market shift with a concentrated sales focus by sub-vertical, including K-12 private schools, foundations, corporations, arts & cultural, higher education and healthcare.
| |
3. | Expand TAM into Near Adjacencies through Acquisitions and Product Investments |
We continue to evaluate compelling opportunities to acquire companies, technologies and/or services. We are guided by our acquisition criteria for considering attractive assets that expand our TAM, provide entry into new and near adjacencies, accelerate our shift to the cloud, accelerate revenue growth, are accretive to margins and present synergistic opportunities.
During the third quarter, we launched Blackbaud Labs as a means to incubate new ideas and foster our strong culture of innovation and creativity within Blackbaud, with the sole focus of bringing new capabilities to market organically. We previously announced the promotion of our new Senior Vice President of Corporate Strategy and Business Development, who led the effort for many of our acquisitions, including AcademicWorks in April 2017 and, most recently, JustGiving.
AcademicWorks is the market leader in scholarship management for higher education and K-12 institutions, foundations, and grant-making institutions. Their cloud platform enables students to apply for all awards at an institution using one intuitive and streamlined process, while offering schools and awarding institutions a common platform for improved awarding, reporting, compliance, communication and stewardship of those awards. Additional details regarding our acquisition of AcademicWorks are provided in Note 3 to ourcondensed consolidated financial statements in this report.
3.Delight Customers with Innovative Cloud Solutions
2020 required unprecedented speed and scale to support our customers, and we were quick to reprioritize and expedite product enhancements to support our customers' changing needs as they needed to operate more digitally. We have carried that momentum into 2021. For example, as arts and cultural organizations begin to open their doors, maintaining high standards for the safety and security of their patrons is a top priority; therefore, we recently announced the general availability of Payment Terminal™. This solution allows organizations to receive secure, contactless chip and tap payments for tickets and donations through Blackbaud Altru® and Blackbaud Merchant Services™. Not only does this minimize staff handling of credit cards during point-of-sale, but it enables them to process payments faster than with a magnetic swipe device and helps to better protect their constituents and their organization from credit card fraud with EMV-certified card readers that offer end-to-end encryption. During the thirdsecond quarter, we also announced the general availability of Blackbaud Peer-to-Peer Fundraising™, powered by JustGiving® in Australia, New Zealand and Canada bringing this turnkey solution to even more organizations with no subscription fees or setup costs and furthering our efforts to globalize our products.
4.Focus on Employees, Culture and ESG Initiatives
During the first quarter of 2021, we elevated a specific strategy focused on integrating AcademicWorks' solutionsemployees, culture and operationsESG initiatives. This is not new for us. It is something that is in our DNA and is a big advantage as well as cross-selling.
In October 2017, we closedlook to attract and retain top talent. This is evident in our acquisition2020 social responsibility report, which was released in April 2021. We are fully committed to continuing to create a diverse and inclusive environment at all levels of the United Kingdom-based online fundraising services provider JustGiving, whose online social giving platform has playedorganization. During May 2021, we held a powerful role in the growthmonth-long celebration of peer-to-peer fundraising. The acquisition enhances our capability40th anniversary with our employees, some of whom have been around to serve both individual donors and nonprofits, expanding the peer-to-peer fundraising capabilities we currently offer today through TeamRaiser and everydayhero, which are used by leading nonprofit organizationswatch our business grow from just one product to connect their causes to the individuals who support them. JustGiving also adds personal crowdfunding to our portfolio, which is an offering we did not previously provide and a fast growing segment of charitable giving. Additional details regarding our acquisition of JustGiving are provided below and in Note 15 to our consolidated financial statements in this report.
Both AcademicWorks and JustGiving meet the acquisition criteria discussed above. We remain active in the evaluation of acquisition opportunities to broaden our portfolio, provide better integratedproviding purpose-built solutions for the entire social good industry. In the second quarter of 2021, we furthered our customers, differentiate ourselves fromefforts to create a best-in-class candidate and employee experience with the competition and improvelaunch of our financial performance.
| |
4. | Improve Operating Efficiency |
We are also focused on operational efficiency to deliver improved profitability. Our organizational model has evolved in recent years allowingnew careers site. This enables us to gain efficiencylift our social presence and consistency in how we execute. We have centralized our operations, including marketing, product management, finance, customer support, customer successvisibility, create personalized experiences for candidates via artificial intelligence, reduce the time to apply, and professional services. In 2014, we setaccept applications start to finish from a long-term aspirational goalmobile device. It also enables us to improve operating margins annually,leverage data analytics to better understand the talent marketplace and increase our non-GAAP operating margins by at least 300 basis points on a constant currency basis from our 2014 baseline of 17.5%, by the end of 2017. Since setting that goal, we have improved margins annually, inclusive of heightened investments to driveinform future growth and in the midst of migrating our customer base to the cloud. We expect to deliver on our goal, and we see future opportunity ahead to further improve profitability through the infrastructure investments we have made in our back office for scale, focus on operational excellence, and achieving our productivity initiatives.
We have included the results of operations of AcademicWorks in our consolidated results of operations from the date of acquisition. We determined that the AcademicWorks acquisition was not a material business combination; therefore, revenue and earnings since the acquisition date are not required or presented.
investments.
|
| | | | | | | |
| 24 | | ThirdSecond Quarter 20172021 Form 10-Q |
Blackbaud, Inc.
(Unaudited)
|
| | | | | | | | | | | | | | | | | |
| Total revenue | | | | | | | |
| | Three months ended
September 30, | | | Nine months ended
September 30, | |
| (dollars in millions) | 2017 |
| 2016 |
| Change |
| | 2017 |
| 2016 |
| Change |
|
| Total revenue | $ | 195.5 |
| $ | 183.1 |
| 6.8 | % | | $ | 571.3 |
| $ | 532.5 |
| 7.3 | % |
The increases in total
| | | | | | | | |
| Total revenue ($M) | | Income from operations ($M) |
| YoY Growth (%) | | YoY Growth (%) |
Total revenue decreased by $2.6 million and $7.0 million during the three and ninesix months ended SeptemberJune 30, 2017,2021, respectively, when compared to the same periods in 2016, were primarily2020, driven largely by growth in subscriptions revenue as our business model continues to shift towards providing predominantly cloud-based subscription solutions. Subscriptions revenue also grew as a resultthe following:
| | | | | | | | | | | |
| - | | Decreases in one-time consulting revenue due primarily to less implementation and customization services. We changed our commission plans during the first quarter of 2020 to intentionally shift our sales teams' focus towards selling our cloud solutions. Additionally, the bookings shortfalls during 2020 caused by the COVID-19 pandemic contributed to the decreases in one-time consulting revenue. |
| - | | Decreases in one-time analytics revenue as analytics are generally integrated in our cloud solutions |
| + | | Growth in recurring revenue related to increases in contractual revenue related to the performance of our cloud software solutions and, to a lesser extent, early progress in initiatives to bring our pricing in line with the market |
| | | | | | | | |
| Second Quarter 2021 Form 10-Q | | 25 |
Blackbaud, Inc.
(Unaudited)
Income from operations decreased by $6.5 million and the volume of transactions for which we process payments. Services and other revenue as well as maintenance revenue declined$8.3 million during the three and ninesix months ended SeptemberJune 30, 2017 from our continued shift in focus towards selling cloud-based subscription solutions. In general, our NXT and other cloud-based solutions require less implementation services, which we expect to continue to negatively impact services and other revenue over time. In addition, we have also used promotions and discounts for our consulting services as incentives to accelerate the migration of our existing customer base from on-premises solutions toward our cloud-based subscriptions. In the near-term, the transition to subscription-based solutions also negatively impacts total revenue growth, as time-based revenue from subscription arrangements is deferred and recognized ratably over the subscription period, typically three years at contract inception, whereas on-premises license revenue from arrangements that include perpetual licenses is recognized up-front.
|
| | | | | | | | | | | | | | | | | |
| Income from operations | | | | | | | |
| | Three months ended
September 30, | | | Nine months ended
September 30, | |
| (dollars in millions) | 2017 |
| 2016 |
| Change |
| | 2017 |
| 2016 |
| Change |
|
| Income from operations | $ | 18.0 |
| $ | 13.5 |
| 32.7 | % | | $ | 45.3 |
| $ | 37.8 |
| 19.9 | % |
Income from operations increased during the three and nine months ended September 30, 2017,2021, respectively, when compared to the same periods in 2016. The positive impact of growth2020, driven largely by the following:
| | | | | | | | | | | |
| - | | Increases in stock-based compensation expense of $10.4 million and $26.8 million, respectively, due to: •Certain changes to our compensation program that are expected to cause stock-based compensation expense to remain higher than historical levels, including ◦replacement of our annual cash bonus plans with a short-term performance-based equity award plan ◦decrease in the vesting period for our annual long-term incentive time-based equity awards from 4 years (1/4 per year) to 3 years (1/3 per year), beginning in February 2021; and ◦replacement of cash sign-on and retention bonuses with time-based equity awards. •Increases in the grant date fair values of our annual equity awards granted to employees; •As a one-time response to COVID-19, replacement of our 2020 base salary merit increases with one-year time-based equity awards, which vested and were recognized as expense between May 1, 2020 and May 1, 2021; and •Overall Company performance against 2020 goals. |
| - | | Decreases in total revenue, as described above |
| - | | Increases in transaction-based costs of $1.9 million and $1.7 million, respectively, related to payment services integrated in our cloud solutions |
| - | | Increases in hosting and data center costs of $0.8 million and $1.5 million, respectively, as we continue to migrate our cloud infrastructure to leading public cloud service providers |
| + | | Decreases in rent expense of $4.1 million and $7.2 million, respectively, related to the purchase of our global headquarters facility during the third quarter of 2020 and our exit of certain other office leases globally during the second half of 2020 in-line with our new workforce strategy |
| + | | Decreases in employee severance of $3.8 million and $2.9 million, related to a modest and targeted headcount reduction during the three months ended June 30, 2020, in response to the COVID-19 pandemic |
| + | | Decreases in amortization of intangible assets from business combinations of $1.0 million and $3.0 million, respectively |
| + | | Decrease in compensation costs other than stock-based compensation of $13.2 million, during the six months ended June 30, 2021, primarily due to a decrease in headcount |
| + | | Decrease in travel costs of $3.5 million, during the six months ended June 30, 2021, due to our restriction on non-essential employee travel in response to the COVID-19 pandemic |
| | | |
| | | |
We are continuing to make critical investments in total revenue driven by subscriptionsthe business in areas such as discussed above was partially offset primarily by investments we are making in our sales organization anddigital marketing, engineering, security, customer success program and our continued shift of cloud infrastructure to a lesser extent, increasesleading public cloud service providers. We expect the level of investment in stock based compensation expense of $2.1 million and $6.1 million, respectively, rent expense of $0.7 million and $3.3 million, respectively, and net increases in acquisition-related expenses and integration costs of $0.8 million and $2.8 million, respectively. An increase of $2.5 million in employee severance costs during the nine months ended September 30, 2017 also negatively impacted income from operations. Thethese areas to increase in rent expense was primarily driven by the end in the fourth quartersecond half of 20162021.
| | | | | | | | |
| 26 | | Second Quarter 2021 Form 10-Q |
Customer retention
SubscriptionBlackbaud, Inc.
(Unaudited)
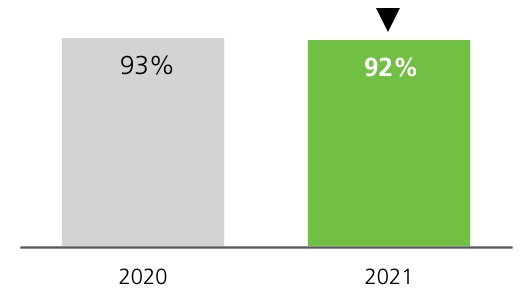
Our recurring revenue contracts are typicallygenerally for a term of three years at contract inception with one to three yearthree-year renewals thereafter. Over time, weWe anticipate a continued decrease in maintenance contract renewals as we transition our solution portfolio and maintenance customers from a perpetual license-based model to a cloud-basedcloud subscription delivery model. WeIn the long term, we also anticipate an increase in recurring subscription contract renewals as we continue focusing on innovation, quality and the integration of our subscriptioncloud solutions, which we believe will provide value-adding capabilities to better address our customers' needs. Due primarily to these factors, we believe a recurring revenue customer retention measure that combines recurring subscription, maintenance and maintenanceservice customer contracts provides an accuratea better representation of our customers' overall behavior. For the yeartwelve months ended SeptemberJune 30, 2017,2021, approximately 93%92% of our customers with recurring subscription or maintenancerevenue contracts were retained. This customer retention rate is relativelymaterially unchanged from our rate for the full year 2016.
|
| | |
Third Quarter 2017 Form 10-Q | | 25 |
ended December 31, 2020.
Balance sheet and cash flow
At SeptemberJune 30, 2017,2021, our cash and cash equivalents were $17.1$28.3 million and outstanding borrowingsthe carrying amount of our debt under the 20172020 Credit Facility were $340.2was $483.1 million. Our net leverage ratio was 1.78 to 1.00.
During the ninesix months ended SeptemberJune 30, 2017,2021, we generated $123.4$99.9 million in cash flow from operations, reduced ourhad a net increase in borrowings by $5.8of $14.8 million, inclusive of the incremental borrowings needed to finance the acquisition of AcademicWorks, returned $17.3$58.1 million to stockholders by way of dividendsshare repurchases and had aggregate cash outlays of $29.0$26.0 million for purchases of property and equipment and capitalized software development costs.
Recent development - JustGiving acquisitionSecurity Incident
On October 2, 2017, we acquired the entire issued share capital of JustGiving for an aggregate purchase price of £95.0 million, or approximately $127.4 million,As discussed in cash, subjectNote 9 to certain adjustments set forth in the stock purchase agreement. We financed the acquisition through borrowings under the 2017 Credit Facility. As a result of the acquisition, JustGiving has become a wholly-owned subsidiary of ours. We will include the operating results of JustGiving as well as the net assets acquired and liabilities assumed in our unaudited, condensed consolidated financial statements from the date of acquisition. Dueincluded in this report, we believe it is probable that total losses related to the timingSecurity Incident will ultimately exceed the limits of our insurance coverage. However, as we are currently unable to determine when that will be the transaction, the initial accounting for this acquisition, including the measurement of assets acquired, liabilities assumed and goodwill, is not complete and is pending detailed analyses of the facts and circumstances that existed as of the October 2, 2017 acquisition date.
Comparison of the three and nine months ended September 30, 2017 and 2016
|
| | | | | | | | | | | | | | | | | |
| Revenue by segment | | | | | | |
| | Three months ended
September 30, | |
| Nine months ended
September 30, | |
| (dollars in millions) | 2017 |
| 2016 |
| Change |
| | 2017 |
| 2016 |
| Change |
|
| GMG | $ | 102.8 |
| $ | 97.6 |
| 5.3 | % | | $ | 297.0 |
| $ | 279.5 |
| 6.2 | % |
| EMG | 81.8 |
| 74.4 |
| 10.1 | % | | 243.7 |
| 220.9 |
| 10.3 | % |
| IMG | 10.8 |
| 11.0 |
| (1.7 | )% | | 30.6 |
| 31.9 |
| (4.1 | )% |
Total revenue(1) | $ | 195.5 |
| $ | 183.1 |
| 6.8 | % | | $ | 571.3 |
| $ | 532.5 |
| 7.3 | % |
| |
(1) | The individual amounts for each year may not sum to total revenue due to rounding. |
|
| | | | | | | | | | | | | | | | | |
| GMG | | | | | | | |
| | Three months ended
September 30, | | | Nine months ended
September 30, | |
| (dollars in millions) | 2017 |
| 2016 |
| Change |
| | 2017 |
| 2016 |
| Change |
|
| GMG revenue | $ | 102.8 |
| $ | 97.6 |
| 5.3 | % | | $ | 297.0 |
| $ | 279.5 |
| 6.2 | % |
| % of total revenue | 52.6 | % | 53.3 | % | | | 52.0 | % | 52.5 | % | |
The increases in GMG revenue during the three and nine months ended September 30, 2017 when compared to the same periods in 2016 were attributable to growth in subscriptions revenue, partially offset by declines in maintenance revenue and, to a lesser extent, services and other revenue. The growth in GMG subscriptions revenue was primarily due to increases in demand across our portfolio of cloud-based solutions. To a much lesser extent, GMG subscriptions revenue growth was also driven by increases in the number of customerscase and the volumeapproximate amount or range of transactions for whichany such excess, we process payments. We expect thatare unable to determine the ongoing shift ineffect the Security Incident will have on our go-to-market strategy towards cloud-based subscription offerings, which, in general, require less implementation services will continue to negatively impact both services and other revenue and maintenance revenue over time.results of operations, liquidity, or financial condition.
| | | | | | | | |
| Second Quarter 2021 Form 10-Q | | 27 |
Blackbaud, Inc.
(Unaudited)
| | |
26 | | Third Quarter 2017 Form 10-QResults of Operations |
|
| | | | | | | | | | | | | | | | | |
| EMG | | | | | | | |
| | Three months ended
September 30, | | | Nine months ended
September 30, | |
| (dollars in millions) | 2017 |
| 2016 |
| Change |
| | 2017 |
| 2016 |
| Change |
|
| EMG revenue | $ | 81.8 |
| $ | 74.4 |
| 10.1 | % | | $ | 243.7 |
| $ | 220.9 |
| 10.3 | % |
| % of total revenue | 41.9 | % | 40.6 | % | | | 42.7 | % | 41.5 | % | |
The increases in EMG revenue during the three and ninesix months ended SeptemberJune 30, 2017, when compared to the same periods in 2016, were primarily attributable to growth in subscriptions revenue, partially offset by decreases in services2021 and other revenue2020
Revenue and to a lesser extent, maintenance revenue. The growth in EMG subscriptions was driven primarily by increases in demand for our cloud-based solutions, as well as an increase in the numberCost of customers and the volume of transactions for which we process payments. We are increasingly selling our Blackbaud CRM solution as a subscription offering, which has resulted in less license fees revenue during the three and nine months ended, September 30, 2017, when compared to the same periods in 2016. We expect that the ongoing shift in our go-to-market strategy towards cloud-based subscription offerings, which, in general, require less implementation services will continue to negatively impact both services and other revenue and maintenance revenue over time.
|
| | | | | | | | | | | | | | | | | |
| IMG | | | | | | | |
| | Three months ended
September 30, | | | Nine months ended
September 30, | |
| (dollars in millions) | 2017 |
| 2016 |
| Change |
| | 2017 |
| 2016 |
| Change |
|
| IMG revenue | $ | 10.8 |
| $ | 11.0 |
| (1.7 | )% | | $ | 30.6 |
| $ | 31.9 |
| (4.1 | )% |
| % of total revenue | 5.5 | % | 6.0 | % | | | 5.4 | % | 6.0 | % | |
The decreases in IMG revenue during the three and nine months ended September 30, 2017, when compared to the same periods in 2016, were primarily related to reductions in services and other revenue and maintenance revenue, partially offset by increases in subscriptions revenue. The increases in IMG subscriptions revenue during the three and nine months ended September 30, 2017 were primarily due to increased demand for our cloud-based solutions and, to a much lesser extent, increases in the volume of transactions for which we process payments. The fluctuation in foreign currency exchange rates had an insignificant impact on IMG revenue during the three months ended September 30, 2017 and negatively impacted IMG revenue during the nine months ended September 30, 2017 by approximately $0.8 million. Further explanation of this impact is included below under the caption "Foreign Currency Exchange Rates". We expect that the ongoing shift in our go-to-market strategy towards cloud-based subscription offerings, which, in general, require less implementation services will continue to negatively impact both services and other revenue and maintenance revenue over time.
|
| | | | | | | | | | | | | |
Third Quarter 2017 Form 10-QRecurring | | 27 |
Operating results
|
| | | | | | | | | | | | | | | | | |
| Subscriptions | | | | | | |
| | Three months ended
September 30, | | | Nine months ended
September 30, | |
| (dollars in millions) | 2017 |
| 2016 |
| Change |
| | 2017 |
| 2016 |
| Change |
|
| Subscriptions revenue | $ | 127.5 |
| $ | 105.4 |
| 20.9 | % | | $ | 370.9 |
| $ | 306.3 |
| 21.1 | % |
| Cost of subscriptions | 58.0 |
| 51.9 |
| 11.7 | % | | 170.3 |
| 153.8 |
| 10.8 | % |
Subscriptions gross profit(1) | $ | 69.4 |
| $ | 53.5 |
| 29.8 | % | | $ | 200.6 |
| $ | 152.6 |
| 31.5 | % |
| Subscriptions gross margin | 54.5 | % | 50.7 | % | | | 54.1 | % | 49.8 | % | |
| |
(1)Revenue ($M) | The individual amounts for each year may not sum to subscriptions | Cost of revenue ($M) | | Gross profit ($M)
and gross profit due to rounding.margin (%) |
| YoY Growth (%) | | YoY Growth (%) | | |
Recurring revenue is comprised of revenue from chargingfees for the use of our subscription-based software solutions, which includes providing access to cloud-basedcloud solutions, and hosting services, accessonline training programs, subscription-based analytic services, such as donor acquisitions and data enrichment, and payment services. Recurring revenue also includes fees from maintenance services for our on-premises solutions, services included in our renewable subscription contracts, retained and managed services contracts that we expect to certain data serviceshave a term consistent with our cloud solution contracts, and our online subscription training offerings, revenue from payment processing services, as well as variable transaction revenue associated with the use of our solutions.
We continue to experience growth in sales of our cloud-based solutions and hosting services as we meet the demand of our customers that increasingly prefer cloud-based subscription offerings, including existing customers that are migrating from on-premises solutions to our cloud-based solutions. In addition, we have experienced growth in our payment processing services from the continued shift to online giving, further integration of these services to our existing solution portfolio and the sale of these services to new and existing customers. Recurring subscriptions contracts are typically for a term of three years at contract inception with one to three year renewals thereafter. We intend to continue focusing on innovation, quality and integration of our subscription solutions, which we believe will drive subscriptions revenue growth.
Cost of subscriptionsrecurring revenue is primarily comprised of compensation costs for customer support and production IT personnel, hosting and data center costs, third-party contractor expenses, third-party royalty and data expenses, hosting expenses, allocated depreciation, facilities and IT support costs, amortization of intangible assets from business combinations, amortization of software development costs, transaction-based costs related to payments services including remittances of amounts due to third-parties and other costs incurred in providing support and recurring services to our customers.
The increasesOur customers continue to prefer cloud subscription offerings with integrated analytics, training and payment services. Recurring subscription contracts are typically for a term of three years at contract inception with one to three-year renewals thereafter. We intend to continue focusing on innovation, quality and integration of our cloud solutions, which we believe will drive future revenue growth.
| | | | | | | | |
| 28 | | Second Quarter 2021 Form 10-Q |
Blackbaud, Inc.
(Unaudited)
Recurring revenue increased by $0.7 million, or 0.3%, during the three months ended June 30, 2021, when compared to the same period in subscriptions2020, driven primarily by the following:
| | | | | | | | | | | |
| + | | Increase in contractual recurring revenue of $2.9 million related to the performance of our cloud solutions and, to a lesser extent, early progress in initiatives to bring our pricing in line with the market, partially offset by a decrease in maintenance revenue as customers migrate to our cloud solutions |
| | | |
| - | | Decrease in transactional revenue of $2.2 million primarily due to a decrease in the volume of transactions for which we process payments when compared to the elevated online charitable giving, mainly related to COVID-19, during the second quarter of 2020 |
Recurring revenue increased by $2.6 million, or 0.6%, during the six months ended June 30, 2021, when compared to the same period in 2020, driven primarily by the following:
| | | | | | | | | | | |
| + | | Increase in contractual recurring revenue of $2.0 million related to the performance of our cloud solutions, partially offset by a decrease in maintenance revenue as customers migrate to our cloud solutions |
| + | | Increase in transactional revenue of $0.6 million, primarily due to the continued shift toward virtual fundraising and online charitable giving, partially offset by the second quarter 2021 decrease in the volume of transactions for which we process payments, as discussed above |
Cost of recurring revenue increased by $3.1 million, or 3.4%, and $2.4 million, or 1.3%, during the three and ninesix months ended SeptemberJune 30, 2017,2021, respectively, when compared to the same periods in 2016, were2020, driven primarily due to strong demand across our cloud-based solution portfolio, and, to a much lesser extent, increases inby the number of customers and the volume of transactions for which we process payments.
The increases in cost of subscriptions during the three and nine months ended September 30, 2017, when compared to the same periods in 2016, were primarily due to increases in transaction-based costs related to our payments services of $4.7 million and $12.4 million, respectively and increases in the cost of third-party technology embedded in certain of our subscription solutions of $1.5 million and $4.8 million. Partially offsetting the increase in cost of subscriptions during the nine months ended September 30, 2017 was a decrease in third-party contractor expenses of $1.5 million.
The increases in subscriptions gross margin for the three and nine months ended September 30, 2017, when compared to the same periods in 2016, were primarily the result of the positive economics of shifting customers to our next generation cloud-based solutions as growth in subscriptions revenue outpaced the growth in related costs. The results of AcademicWorks did not significantly impact our subscriptions gross margins for the three and nine months ended September 30, 2017.
| | | | | | | | | | | |
| + | | Increases in compensation costs of $2.8 million and $4.2 million, respectively, primarily related to stock-based compensation due to the factors discussed above on page 26 |
| + | | Increases in transaction-based costs of $1.9 million and $1.7 million, respectively, related to payment services integrated in our cloud solutions |
| + | | Increases in hosting and data center costs of $0.6 million and $1.1 million, respectively, as we continue to migrate our cloud infrastructure to leading public cloud service providers |
| + | | Increase in third-party contractor costs of $0.8 million during the three months ended June 30, 2021; the increase in third-party contractor costs during the six months ended June 30, 2021 was insignificant |
| - | | Decreases in amortization of software development costs of $2.6 million and $1.6 million, respectively, due to an impairment charge in Q2 2020 which did not occur during the same period in 2021 |
| - | | Decreases in amortization of intangible assets from business combinations of $0.7 million and $2.5 million, respectively |
| | | |
| | |
28 | | Third Quarter 2017 Form 10-Q |
|
| | | | | | | | | | | | | | | | | |
| Maintenance | | | | | | |
| | Three months ended
September 30, | | | Nine months ended
September 30, | |
| (dollars in millions) | 2017 |
| 2016 |
| Change |
| | 2017 |
| 2016 |
| Change |
|
| Maintenance revenue | $ | 31.5 |
| $ | 36.4 |
| (13.5 | )% | | $ | 98.2 |
| $ | 111.0 |
| (11.6 | )% |
| Cost of maintenance | 5.7 |
| 5.5 |
| 3.0 | % | | 17.6 |
| 16.5 |
| 6.1 | % |
Maintenance gross profit(1) | $ | 25.8 |
| $ | 30.9 |
| (16.5 | )% | | $ | 80.6 |
| $ | 94.5 |
| (14.6 | )% |
| Maintenance gross margin | 81.9 | % | 84.8 | % | | | 82.1 | % | 85.1 | % | |
| |
(1) | The individual amounts for each year may not sum to maintenance gross profit due to rounding. |
Maintenance revenue is comprised of annual fees derived from maintenance contracts associated with new software licenses and annual renewals of existing maintenance contracts. These contracts provide customers with updates, enhancements and certain upgrades to our software solutions and online, telephone and email support. Maintenance contracts are typically renewed on an annual basis.
Cost of maintenance is primarily comprised of compensation costs for customer support personnel, third-party contractor expenses, third-party royalty costs, allocated depreciation, facilities and IT support costs, amortization of intangible assets from business combinations, amortization of software development costs and other costs incurred in providing support and services to our customers.
The decreases in maintenance revenue during the three and nine months ended September 30, 2017, when compared to the same periods in 2016, were primarily comprised of (i) reductions in maintenance from contracts that were migrated to a cloud-based subscription or not renewed and reductions in contracts with existing customers of $9.2 million and $25.7 million, respectively; partially offsetRecurring gross margin decreased by (ii) incremental maintenance from new customers associated with new license contracts and increases in contracts with existing customers of $4.3 million and $12.1 million, respectively; and (iii) insignificant amounts of incremental maintenance from contractual inflationary rate adjustments.
Cost of maintenance during1.3% for the three months ended SeptemberJune 30, 2017 remained relatively unchanged2021, when compared to the same period in 2016. Cost of maintenance increased2020, primarily due to the decrease in higher margin transactional revenue.
Recurring gross margin remained relatively consistent during the ninesix months ended SeptemberJune 30, 2017,2021, when compared to the same period in 2016, primarily as a result of an increase in compensation costs of $1.0 million, driven by a refinement in the method in which we allocate customer support costs between cost of maintenance and cost of subscriptions.
Maintenance gross margin decreased during the three and nine months ended September 30, 2017, when compared to the same periods in 2016, primarily due to the increase in maintenance customer support costs combined with the decline in maintenance revenue as discussed above.
2020.
|
| | | | | | | |
ThirdSecond Quarter 20172021 Form 10-Q | | 29 |
Blackbaud, Inc.
(Unaudited)
|
| | | | | | | | | | | | | | | | | |
| Services and other | | | | | | |
| | Three months ended
September 30, | | | Nine months ended
September 30, | |
| (dollars in millions) | 2017 |
| 2016 |
| Change |
| | 2017 |
| 2016 |
| Change |
|
| Services and other revenue | $ | 36.5 |
| $ | 41.2 |
| (11.4 | )% | | $ | 102.2 |
| $ | 115.2 |
| (11.2 | )% |
| Cost of services and other | 23.3 |
| 25.8 |
| (10.0 | )% | | 71.6 |
| 76.5 |
| (6.4 | )% |
Services and other gross profit(1) | $ | 13.3 |
| $ | 15.4 |
| (13.6 | )% | | $ | 30.6 |
| $ | 38.7 |
| (20.8 | )% |
| Services and other gross margin | 36.3 | % | 37.3 | % | | | 30.0 | % | 33.6 | % | |
| | | | | | | | | | | | | | |
(1) | The individual amounts for each year may not sum toOne-time services and other | | | | |
| Revenue ($M) | | Cost of revenue ($M) | | Gross profit ($M)
and gross profit due to rounding.margin (%) |
| YoY Growth (%) | | YoY Growth (%) | | |
One-time services and other revenue includesis comprised of fees for one-time consulting, implementation, training, analytic and installationonsite training services, as well asfees for retained and managed services contracts that we do not expect to have a term consistent with our cloud solution contracts, revenue from the sale of our software sold under perpetual license arrangements, fees from user conferences and third-party software referral fees. Consulting, implementation and installation services involve converting data from a customer’s existing system, system configuration, process re-engineering and assistance in file set up. Analytic services are comprised of donor prospect research, sales of lists of potential donors, benchmarking studies and data modeling services. These analytic services involve the assessment of current and prospective donor information of the customer and are performed using our proprietary analytical tools. The end product is intended to enable organizations to more effectively target their fundraising activities.
Cost of one-time services and other is primarily comprised of compensation costs for professional services and onsite training personnel, third-party contractor expenses,other costs incurred in providing onsite customer training, third-party contractor expenses, data expense incurred to perform one-time analytic services, third-party software royalties, variable reseller commissions, costs of user conferences, allocated depreciation, facilities and IT support costs and amortization of intangible assets from business combinations.
ServicesOne-time services and other revenue decreased by $3.3 million, or 20.8%, and $9.6 million, or 27.8%, during the three and ninesix months ended SeptemberJune 30, 2017,2021, respectively, when compared to the same periods in 2016,2020, driven primarily due to decreases in consulting revenue and, to a lesser extent, declines in analytics revenue and license fees revenue. We expect thatby the ongoing shift in our go-to-market strategy towards cloud-based subscription offerings, which, in general, require less implementation services, will continue to negatively impactfollowing:
| | | | | | | | | | | |
| - | | Decreases in one-time consulting revenue of $2.4 million and $7.1 million, respectively, due primarily to less implementation and customization services. In line with our multi-year strategic shift from a license-based and one-time services business model to a cloud subscription business model, we changed our commission plans during the first quarter of 2020 to intentionally shift our sales teams' focus towards selling our cloud solutions. Additionally, the bookings shortfalls during 2020 caused by the COVID-19 pandemic contributed to the decreases in one-time consulting revenue. |
| - | | Decreases in one-time analytics revenue of $0.8 million and $1.8 million, respectively, as analytics are generally integrated in our cloud solutions |
| | | |
| | | | | | | | |
| 30 | | Second Quarter 2021 Form 10-Q |
Blackbaud, Inc.
(Unaudited)
Cost of one-time services and other revenue over time. We have also used promotions and discounts for our consulting services as incentivesremained relatively consistent during the three months ended June 30, 2021, when compared to accelerate the migration of our existing customer base from on-premises solutions toward our cloud-based subscriptions. The maturation of our Blackbaud Enterprise CRM solution is lessening the extent of implementation services required for that solution. In addition, we are increasingly selling our Blackbaud CRM solution as a subscription offering, which has resultedsame period in less license fees revenue.2020.
Cost of one-time services and other decreased by $0.7 million, or 2.5%, during the six months ended June 30, 2021, when compared to the same period in 2020, driven primarily by a decrease in third-party contractor costs of $1.0 million due to the timing of our spending.
One-time services and other gross margin decreased by 23.2% and 29.3% during the three and ninesix months ended SeptemberJune 30, 2017,2021, respectively, when compared to the same periods in 2016, primarily due to decreases in compensation costs of $1.4 million and $2.5 million, respectively, which is in line with the ongoing shift in our go-to-market strategy as discussed above.
Services and other gross margin decreased during the three and nine months ended September 30, 2017, when compared to the same periods in 2016,2020, primarily due to the declines in consulting, analytics and license fees revenue coupled with the slightly more modestsignificant reductions in costs of servicesone-time consulting and other.analytics revenue discussed above.
|
| | | | | | | | | | | | | |
30Sales, marketing and
customer success ($M) | | Third Quarter 2017 Form 10-QResearch and
development ($M) | | General and
administrative ($M) |
| Percentages indicate expenses as a percentage of total revenue |
Operating expenses
|
| | | | | | | | | | | | | | | | | |
| Sales, marketing and customer success | | | | | | |
| | Three months ended
September 30, | | | Nine months ended
September 30, | |
| (dollars in millions) | 2017 |
| 2016 |
| Change |
| | 2017 |
| 2016 |
| Change |
|
| Sales, marketing and customer success expense | $ | 44.2 |
| $ | 40.7 |
| 8.6 | % | | $ | 129.4 |
| $ | 115.7 |
| 11.8 | % |
| % of total revenue | 22.6 | % | 22.2 | % | | | 22.6 | % | 21.7 | % | |
Sales, marketing and customer success expense includes compensation costs, variable sales commissions, travel-related expenses, sales commissions, advertising and marketing materials, public relations costs, variable reseller commissions and allocated depreciation, facilities and IT support costs.
We see a large market opportunity in the long-term and will continue to make investments to drive sales effectiveness, which iseffectiveness. We have also implemented software tools to enhance our digital footprint and drive lead generation. In response to the COVID-19 pandemic, we implemented a componentmodest and targeted headcount reduction during the second quarter of our four-point growth strategy to accelerate revenue growth. We are also investing2020, including a reduction in our sales headcount with a focus on retaining our most highly productive sales executives. The enhancements we are making in our go-to-market approach are expected to significantly reduce our average customer success organization to drive customer loyalty, retention, and referrals. The increase inacquisition cost as well as the related payback period while increasing sales velocity. As a result, we do not expect our sales, marketing and customer success expense in dollarsto return to pre-pandemic levels.
| | | | | | | | |
| Second Quarter 2021 Form 10-Q | | 31 |
Blackbaud, Inc.
(Unaudited)
Sales, marketing and as a percentage of total revenuecustomer success expense decreased by $6.5 million, or 12.5%, and $16.4 million, or 14.9%, during the three and ninesix months ended SeptemberJune 30, 2017,2021, respectively, when compared to the same periods in 2016, were primarily due to increases in compensation costs of $3.3 million and $10.5 million, respectively. Also contributing to the increase in sales, marketing and customer success expense for the nine months ended September 30, 2017 was an increase in commission expense of $1.8 million. Compensation costs increased primarily due to incremental headcount associated with the increase in direct sales, marketing, and customer success efforts of our growing operations. The increase in commission expense was2020, primarily driven by a refinement in the period over which we recognize deferred commission to expense.following:
|
| | | | | | | | | | | | | | | | | |
| Research and development | | | | | | |
| | Three months ended
September 30, | | | Nine months ended
September 30, | |
| (dollars in millions) | 2017(1) |
| 2016(1) |
| Change |
| | 2017(2) |
| 2016(2) |
| Change |
|
| Research and development expense | $ | 22.1 |
| $ | 22.5 |
| (2.0 | )% | | $ | 67.6 |
| $ | 68.0 |
| (0.5 | )% |
| % of total revenue | 11.3 | % | 12.3 | % | | | 11.8 | % | 12.8 | % | |
| | | | | | | | | | | |
(1) | Not included-
| | Decreases in researchcompensation costs other than stock-based compensation of $5.4 million and development$14.0 million, respectively, due to the targeted reduction in sales headcount during the second quarter of 2020, discussed above |
| - | | Decreases in allocated costs of $1.9 million and $4.4 million, respectively, primarily related to a decrease in rent expense forand the threeimpact of the targeted reduction in sales headcount during the second quarter of 2020, as discussed above |
| - | | Decrease in travel costs of $2.1 million, during the six months ended SeptemberJune 30, 2017 and 2016 were $7.0 million and $6.9 million, respectively, of qualifying costs associated with development activities that are required2021, due to be capitalized underour restriction on non-essential employee travel in response to the internal-use software accounting guidance such as those related to development of our next generation cloud-based solutions. Qualifying capitalized software development costs associated with our cloud-based solutions are subsequently amortized to cost of subscriptions revenue over the related asset's estimated useful life,COVID-19 pandemic, which generally range from three to seven years.went into effect during March 2020 |
| | | |
(2) | Not included+
| | Increases in research and development expense for the nine months endedSeptember 30, 2017 and 2016 were $20.6stock-based compensation costs of $1.1 million and $18.9$4.0 million, respectively, of qualifying costs associated with development activities that are requireddue to be capitalized under the internal-use software accounting guidance.factors discussed above on page 26 |
Research and development
Research and development expense includes compensation costs for engineering and product management personnel, third-party contractor expenses, software development tools and other expenses related to developing new solutions or upgrading and enhancing existing solutions that do not qualify for capitalization, and allocated depreciation, facilities and IT support costs.
We continue to make investments to deliver integrated and opendelight our customers with innovative cloud solutions, in the cloud, which is a component of our four-point growth strategy to accelerate revenue growth. strategy. We increased engineering hiring beginning in the fourth quarter of 2020.
Research and development expense remained relatively unchangedexpenses increased by $5.3 million or 21.4%, and $9.5 million or 19.1%, during the three and ninesix months ended SeptemberJune 30, 2017,2021, respectively, when compared to the same periods in 2016. During2020, primarily driven by the ninefollowing:
| | | | | | | | | | | |
| + | | Increases in compensation costs of $4.8 million and $8.1 million, respectively, primarily related to stock-based compensation due to the factors discussed above on page 26 |
| | | |
| + | | Decrease in software development costs of $1.9 million, during the six months ended June 30, 2021, that were required to be capitalized under the internal-use software guidance |
Not included in research and development expense for the three months ended SeptemberJune 30, 2017, an increase in compensation costs2021 and 2020 were $10.4 million and $10.6 million, respectively, and for the six months ended June 30, 2021 and 2020 were $19.5 million and $21.4 million, respectively, of $1.4 million associated with our addition of specialized engineering resources to help drive our solution development efforts was offset primarily by an increase in the amount of software development costs that were capitalized of $1.7 million. As discussed above, the increases in the amounts capitalized were a result of incurring more qualifying costs associated with development activities that are required to be capitalized under the internal-use software guidance.accounting guidance such as those for our cloud solutions, as well as development costs associated with acquired companies. Qualifying capitalized software development costs associated with our cloud solutions are subsequently amortized to cost of subscriptions revenue over the related asset's estimated useful life, which generally range from three to seven years. We expect that the amount of software development costs capitalized will continue to increase modestlybe relatively consistent in the near-term as we makecontinue making investments in innovation, quality and the integration of our solutions, which we believe will drive long-term revenue growth.
ResearchGeneral and development expense decreased as a percentage of total revenue during the three and nine months ended September 30, 2017, when compared to the same periods in 2016, primarily due to productivity gains, which have allowed us to scale our business. The increases in the amounts of software development costs capitalized as discussed above also contributed to the decreases in research and development expense as a percentage of total revenue.
|
| | |
Third Quarter 2017 Form 10-Q | | 31 |
|
| | | | | | | | | | | | | | | | | |
| General and administrative | | | | | | |
| | Three months ended
September 30, | | | Nine months ended
September 30, | |
| (dollars in millions) | 2017 |
| 2016 |
| Change |
| | 2017 |
| 2016 |
| Change |
|
| General and administrative expense | $ | 23.5 |
| $ | 22.3 |
| 5.5 | % | | $ | 67.4 |
| $ | 62.1 |
| 8.5 | % |
| % of total revenue | 12.0 | % | 12.2 | % | | | 11.8 | % | 11.7 | % | |
General and administrative expense consists primarily of compensation costs for general corporate functions, including senior management, finance, accounting, legal, human resources and corporate development, third-party professional fees, insurance, allocated depreciation, facilities and IT support costs, acquisition-related expenses and other administrative expenses.
The increases in generalDuring the third quarter of 2020, we adjusted our workforce strategy to provide more flexibility to our employees and we now have more employees working remotely either part-time or full-time, even within our hub locations. This change has created efficiencies within our real estate footprint as we have shifted toward more collaborative workspaces within our offices.
| | | | | | | | |
| 32 | | Second Quarter 2021 Form 10-Q |
Blackbaud, Inc.
(Unaudited)
General and administrative expense increased by $2.2 million, or 7.3%, and $6.9 million, or 12.4%, during the three and ninesix months ended SeptemberJune 30, 2017,2021, respectively, when compared to the same periods in 2016, were primarily due to increases in rent expense of $0.7 million and $3.3 million, respectively, and net increases in acquisition-related expenses and integration costs of $0.8 million and $2.8 million, respectively. An increase of $2.5 million in employee severance costs during the nine months ended September 30, 2017 also drove up general and administrative expense. The increases in rent expense were2020, primarily driven by the end in the fourth quarter of 2016 of the South Carolina state incentive payments we received as a result of locating our headquarters facility in Berkeley County, South Carolina. These amounts were recorded as a reduction of rent expense upon receipt. Also contributingfollowing:
| | | | | | | | | | | |
| + | | Increases in stock-based compensation costs of $4.1 million and $9.2 million, respectively, due to the factors discussed above on page 26 |
| | | |
| | | |
| - | | Decreases in rent expense, net of allocated costs, of $2.0 million and $0.9 million, respectively, primarily related to the purchase of our global headquarters facility during the third quarter of 2020 and our exit of certain other office leases globally during the second half of 2020 in-line with our new workforce strategy |
| - | | Decrease in third-party contractor costs of $1.5 million during the six months ended June 30, 2021 |
| | | |
| | | |
| | | |
Interest Expense
| | | | | | | | |
| Interest expense ($M) |
| Percentages indicate expenses as a percentage of total revenue |
The increases in rentinterest expense were new operating leases for equipment that we have historically purchased.
Generalin dollars and administrative expense as a percentage of total revenue remained relatively unchanged during the three and ninesix months ended SeptemberJune 30, 2017,2021, respectively, when compared to the same periods in 2016.
|
| | | | | | | | | | | | | | | | | |
| Interest expense | | | | | | |
| | Three months ended
September 30, | | | Nine months ended
September 30, | |
| (dollars in millions) | 2017 |
| 2016 |
| Change |
| | 2017 |
| 2016 |
| Change |
|
| Interest expense | $ | 3.1 |
| $ | 2.6 |
| 17.1 | % | | $ | 8.7 |
| $ | 8.0 |
| 8.1 | % |
| % of total revenue | 1.6 | % | 1.4 | % | | | 1.5 | % | 1.5 | % | |
Interest expense increased during the three and nine months ended September 30, 2017, when compared to the same periods in 2016,2020, was primarily due to modest increases inthe Real Estate Loans assumed for the purchase of our weighted average effective interest rates. Also contributing to the increase in interest expense during the nine months ended September 30, 2017 was the required immediate expense recognition for certain debt issuance costs when we refinanced our creditglobal headquarters facility in June 2017. InAugust 2020 and the near term, we expect interest expense as well as interest expense as a percentage of revenue to increase as a result of our acquisition of JustGiving.deferred financing costs and debt discount associated with the 2020 Credit Facility, which was entered into in October 2020.
|
| | |
32 | | Third Quarter 2017 Form 10-Q |
Deferred revenueRevenue
The table below compares the components of deferred revenue from our consolidated balance sheets:
| | | | | | | | | | | | | | |
| (dollars in millions) | Timing of recognition | June 30,
2021 | December 31,
2020 | Change |
| Recurring | Over the period billed in advance,
generally one year | $ | 324.3 | | $ | 303.8 | | 6.7 | % |
| One-time services and other | As services are delivered | 21.1 | | 13.1 | | 61.4 | % |
Total deferred revenue(1) | | 345.4 | | 316.9 | | 9.0 | % |
| Less: Long-term portion | | 5.7 | | 4.7 | | 22.9 | % |
Current portion(1) | | $ | 339.7 | | $ | 312.2 | | 8.8 | % |
|
| | | | | | | | | | |
| (dollars in millions) | Timing of recognition | September 30,
2017 |
| Change |
| | December 31,
2016 |
|
| Subscriptions | Over the period billed in advance, generally one year | $ | 179.9 |
| 24.4 | % | | $ | 144.6 |
|
| Maintenance | Over the period billed in advance, generally one year | 68.5 |
| (10.8 | )% | | 76.8 |
|
| Services and other | As services are delivered | 34.0 |
| 15.2 | % | | 29.5 |
|
Total deferred revenue(1) | | 282.4 |
| 12.5 | % | | 250.9 |
|
| Less: Long-term portion | | 5.4 |
| (16.0 | )% | | 6.4 |
|
Current portion(1) | | $ | 277.0 |
| 13.3 | % | | $ | 244.5 |
|
| |
(1) | The individual amounts for each year may not sum to total deferred revenue or current portion of deferred revenue due to rounding. |
To the extent that our customers are billed for our solutions and services in advance of delivery, we record such amounts in deferred revenue. Our recurring revenue contracts are generally for a term of three years at contract inception, billed annually in advance, and non-cancelable. We have been for several years successfully shifting our legacy customer base away from annual renewals and moving them onto multi-year renewal contracts. We generally invoice our subscription and maintenance customers with recurring revenue contracts in annual cycles 30 days prior to the end of the contract term. each one-year period.
Deferred revenue from subscriptionsrecurring revenue contracts increased during the ninesix months ended SeptemberJune 30, 2017,2021, primarily due to an increase in subscription sales, as well as a seasonal increase in subscription customer contract renewals.renewals and, to a lesser extent, early progress in initiatives to bring our pricing in line with the market. Historically, due to the timing of customer budget cycles, we have an increase in customer contract renewals inat or near the beginning of our second quarter as compared to our fourththird quarter. The increase in deferredDeferred revenue from one-time services and other
| | | | | | | | |
| Second Quarter 2021 Form 10-Q | | 33 |
Blackbaud, Inc.
(Unaudited)
increased during the ninesix months ended SeptemberJune 30, 2017 was2021, primarily the result of an increase in training sales and related billings. Adue to a seasonal increase in advance registrationone-time service billings associated with our bbcon user conference, which occurs each year in October, also contributed to the increase in deferred revenue from services and other. The decrease in deferred revenue attributable to maintenance during the nine months ended September 30, 2017 was primarily due to the continuing shift in our go-to-market strategy towards cloud-based subscription offerings, which do not require maintenance contracts.second quarter.
We have acquired businesses whose net tangible assets include deferred revenue. In accordance with GAAP reporting requirements, we recorded write-downs of deferred revenue from customer arrangements predating the acquisition to fair value, which resulted in lower recorded deferred revenue as of the acquisition date than the actual amounts paid in advance for solutions and services under those customer arrangements. Therefore, our deferred revenue after an acquisition will not reflect the full amount of deferred revenue that would have been reported if the acquired deferred revenue was not written down to fair value. Further explanation of this impact is included below under the caption "Non-GAAP financial measures".
| | | | | | | | |
| Income tax provision ($M) |
| Percentages indicate effective income tax rates |
|
| | | | | | | | | | | | | | | | | |
| Income tax provision | | | | | | |
| | Three months ended
September 30, | | | Nine months ended
September 30, | |
| (dollars in millions) | 2017 |
| 2016 |
| Change |
| | 2017 |
| 2016 |
| Change |
|
| Income tax provision | $ | 2.8 |
| $ | 2.0 |
| 43.2 | % | | $ | 3.0 |
| $ | 5.3 |
| (44.3 | )% |
| Effective income tax rate | 18.2 | % | 17.9 | % | | | 7.8 | % | 18.0 | % | |
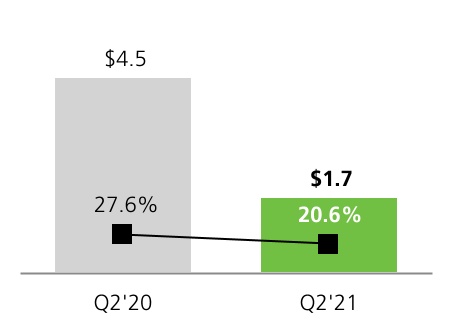
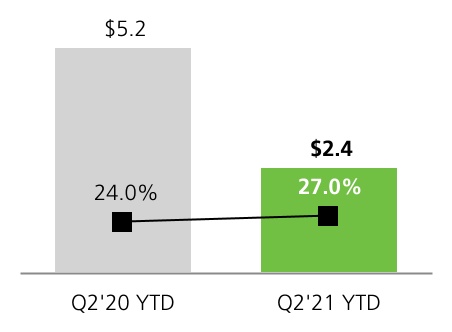
Our effective income tax rate during the three months ended September 30, 2017 remained relatively unchanged when compared to the same period in 2016. The decrease in our effective income tax rate duringfor the ninethree months ended SeptemberJune 30, 2017,2021, when compared to the same period in 2016,2020, was primarily dueattributable to a $9.0 million2021 discrete tax benefit toagainst lower pre-tax income. The 2020 effective income tax rate was negatively impacted by discrete adjustments comprised of tax expense relatingattributable to stock-based compensation items, as comparedand unrecognized tax benefits net of benefit attributable to deferred tax adjustment. The 2021 effective income tax rate was positively impacted by increased tax benefit attributable to stock-based compensation offset against tax expense attributable to a $4.3 million discretecorporate income tax benefit forrate increase enacted during the same period in 2016. against lower pre-tax income.
The increase in the discreteour effective income tax benefitrate for the ninesix months ended SeptemberJune 30, 2017, as2021 when compared to the same periodperiods in 2016,2020, was primarily attributable to an increase in the market price for sharesimpact of our common stock, as reported by NASDAQ, as well as an increase in the number of stock awards that vested and were exercised. Most of our equity awards are granted during our first quarter and vest in subsequent years during the same quarter.non deductible expenses against lower pre-tax income.
|
| | |
Third Quarter 2017 Form 10-Q | | 33 |
Non-GAAP financial measuresFinancial Measures
The operating results analyzed below are presented on a non-GAAP basis. We use non-GAAP revenue, non-GAAP gross profit, non-GAAP gross margin, non-GAAP income from operations, non-GAAP operating margin, non-GAAP net income and non-GAAP diluted earnings per sharefinancial measures internally in analyzing our operational performance. Accordingly, we believe these non-GAAP measures are useful to investors, as a supplement to GAAP measures, in evaluating our ongoing operational performance. While we believe these non-GAAP measures provide useful supplemental information, non-GAAP financial measures should not be considered in isolation from, or as a substitute for, financial information prepared in accordance with GAAP. In addition, these non-GAAP financial measures may not be completely comparable to similarly titled measures of other companies due to potential differences in the exact method of calculation between companies.
We have acquired businesses whose net tangible assets include deferred revenue. In accordance with GAAP reporting requirements, we recorded write-downs of deferred revenue under arrangements predating the acquisition to fair value, which resulted in lower recognized revenue than the contributed purchase price until the related obligations to provide services under such arrangements are fulfilled. Therefore, our GAAP revenues after the acquisitions will not reflect the full amount of revenue that would have been reported if the acquired deferred revenue was not written down to fair value. The non-GAAP measures described below reverse the acquisition-related deferred revenue write-downs so that the full amount of revenue booked by the acquired companies is included, which we believe provides a more accurate representation of a revenue run-rate in a given period and, therefore, will provide more meaningful comparative results in future periods.
The non-GAAP financial measures discussed below exclude the impact of certain transactions because we believe they are not directly related to our operating performance in any particular period, but are for our long-term benefit over multiple periods. We believe that these non-GAAP financial measures reflect our ongoing business in a manner that allows for meaningful period-to-period comparisons and analysis of trends in our business.
|
| | | | | | | | | | | | | | | | | |
| | Three months ended
September 30, | | | Nine months ended
September 30, | |
| (dollars in millions) | 2017 |
| 2016 |
| Change |
| | 2017 |
| 2016 |
| Change |
|
| GAAP Revenue | $ | 195.5 |
| $ | 183.1 |
| 6.8 | % | | $ | 571.3 |
| $ | 532.5 |
| 7.3 | % |
| Non-GAAP adjustments: | | | | | | | |
| Add: Acquisition-related deferred revenue write-down | 0.3 |
| — |
| 100.0 | % | | 0.7 |
| 3.6 |
| (80.8 | )% |
Non-GAAP revenue(1) | $ | 195.9 |
| $ | 183.1 |
| 7.0 | % | | $ | 572.0 |
| $ | 536.1 |
| 6.7 | % |
| | | | | | | | |
| GAAP gross profit | $ | 108.5 |
| $ | 99.7 |
| 8.8 | % | | $ | 311.8 |
| $ | 285.7 |
| 9.2 | % |
| GAAP gross margin | 55.5 | % | 54.5 | % | | | 54.6 | % | 53.7 | % | |
| Non-GAAP adjustments: | | | | | | | |
| Add: Acquisition-related deferred revenue write-down | 0.3 |
| — |
| 100.0 | % | | 0.7 |
| 3.6 |
| (80.8 | )% |
| Add: Stock-based compensation expense | 0.9 |
| 0.9 |
| 2.0 | % | | 2.7 |
| 2.6 |
| 2.8 | % |
| Add: Amortization of intangibles from business combinations | 10.0 |
| 9.9 |
| 1.2 | % | | 29.9 |
| 29.7 |
| 0.8 | % |
| Add: Employee severance | — |
| — |
| (100.0 | )% | | 1.0 |
| 0.2 |
| 508.1 | % |
| Add: Acquisition-related integration costs | — |
| — |
| — | % | | 0.1 |
| — |
| 100.0 | % |
Subtotal(1) | 11.3 |
| 10.8 |
| 4.3 | % | | 34.3 |
| 36.1 |
| (4.8 | )% |
Non-GAAP gross profit(1) | $ | 119.8 |
| $ | 110.5 |
| 8.3 | % | | $ | 346.2 |
| $ | 321.8 |
| 7.6 | % |
| Non-GAAP gross margin | 61.1 | % | 60.4 | % | | | 60.5 | % | 60.0 | % | |
| |
(1) | The individual amounts for each year may not sum to non-GAAP revenue, subtotal or non-GAAP gross profit due to rounding. |
|
| | | | | | | |
| 34 | | ThirdSecond Quarter 20172021 Form 10-Q |
Blackbaud, Inc.
(Unaudited)
| | | | Three months ended June 30, | | Six months ended June 30, |
| (dollars in millions, except per share amounts) | | (dollars in millions, except per share amounts) | 2021 | 2020 | Change | | 2021 | 2020 | Change |
| GAAP Revenue | | GAAP Revenue | $ | 229.4 | | $ | 232.0 | | (1.1) | % | | $ | 448.6 | | $ | 455.6 | | (1.5) | % |
| | | | Three months ended
September 30, | | | Nine months ended
September 30, | | |
| (dollars in millions, except per share amounts) | 2017 |
| 2016 |
| Change |
| | 2017 |
| 2016 |
| Change |
| |
| | GAAP gross profit | | GAAP gross profit | $ | 121.4 | | $ | 127.1 | | (4.5) | % | | $ | 237.2 | | $ | 245.8 | | (3.5) | % |
| GAAP gross margin | | GAAP gross margin | 52.9 | % | 54.8 | % | | 52.9 | % | 54.0 | % | |
| Non-GAAP adjustments: | | Non-GAAP adjustments: | |
| | Add: Stock-based compensation expense | | Add: Stock-based compensation expense | 5.2 | | 2.6 | | 103.8 | % | | 10.6 | | 3.4 | | 208.4 | % |
| Add: Amortization of intangibles from business combinations | | Add: Amortization of intangibles from business combinations | 8.9 | | 9.7 | | (8.3) | % | | 18.0 | | 20.6 | | (12.7) | % |
| Add: Employee severance | | Add: Employee severance | — | | 0.8 | | (98.1) | % | | — | | 0.8 | | (98.2) | % |
| Subtotal(1) | | Subtotal(1) | 14.1 | | 13.0 | | 8.4 | % | | 28.6 | | 24.9 | | 15.1 | % |
Non-GAAP gross profit(1) | | Non-GAAP gross profit(1) | $ | 135.5 | | $ | 140.1 | | (3.3) | % | | $ | 265.8 | | $ | 270.7 | | (1.8) | % |
| Non-GAAP gross margin | | Non-GAAP gross margin | 59.1 | % | 60.4 | % | | 59.2 | % | 59.4 | % | |
| | GAAP income from operations | $ | 18.0 |
| $ | 13.5 |
| 32.7 | % | | $ | 45.3 |
| $ | 37.8 |
| 19.9 | % | GAAP income from operations | $ | 13.0 | | $ | 19.6 | | (33.4) | % | | $ | 19.7 | | $ | 28.0 | | (29.7) | % |
| GAAP operating margin | 9.2 | % | 7.4 | % | | | 7.9 | % | 7.1 | % | | GAAP operating margin | 5.7 | % | 8.4 | % | | 4.4 | % | 6.1 | % | |
| Non-GAAP adjustments: | | | | | | Non-GAAP adjustments: | |
| Add: Acquisition-related deferred revenue write-down | 0.3 |
| — |
| 100.0 | % | | 0.7 |
| 3.6 |
| (80.8 | )% | |
| | Add: Stock-based compensation expense | 10.9 |
| 8.8 |
| 23.9 | % | | 31.1 |
| 25.0 |
| 24.2 | % | Add: Stock-based compensation expense | 30.5 | | 20.1 | | 51.7 | % | | 60.6 | | 33.7 | | 79.6 | % |
| Add: Amortization of intangibles from business combinations | 10.7 |
| 10.5 |
| 1.5 | % | | 32.1 |
| 31.8 |
| 0.8 | % | Add: Amortization of intangibles from business combinations | 9.4 | | 10.4 | | (9.3) | % | | 19.1 | | 22.1 | | (13.4) | % |
| Add: Employee severance | 0.1 |
| 0.1 |
| 77.8 | % | | 3.0 |
| 0.5 |
| 533.0 | % | Add: Employee severance | 0.5 | | 4.3 | | (89.4) | % | | 1.4 | | 4.4 | | (66.9) | % |
| Add: Acquisition-related integration costs | 0.4 |
| 0.9 |
| (58.2 | )% | | 0.6 |
| 1.4 |
| (56.8 | )% | Add: Acquisition-related integration costs | — | | (0.1) | | (100.0) | % | | (0.1) | | (0.1) | | (4.9) | % |
| Add: Acquisition-related expenses | 1.5 |
| 0.2 |
| 899.3 | % | | 3.9 |
| 0.3 |
| 1,353.2 | % | Add: Acquisition-related expenses | 0.1 | | 0.1 | | (24.7) | % | | 0.1 | | 0.2 | | (42.4) | % |
| Add: Restructuring and other real estate activities | | Add: Restructuring and other real estate activities | 0.1 | | 0.1 | | 136.0 | % | | — | | 0.1 | | (90.5) | % |
Add: Security Incident-related costs, net of insurance(2) | | Add: Security Incident-related costs, net of insurance(2) | 0.5 | | — | | 100.0 | % | | 0.5 | | — | | 100.0 | % |
Subtotal(1) | 24.0 |
| 20.5 |
| 17.1 | % | | 71.3 |
| 62.6 |
| 13.8 | % | Subtotal(1) | 41.1 | | 34.9 | | 17.8 | % | | 81.6 | | 60.4 | | 35.2 | % |
Non-GAAP income from operations(1) | $ | 42.0 |
| $ | 34.0 |
| 23.3 | % | | $ | 116.6 |
| $ | 100.4 |
| 16.1 | % | Non-GAAP income from operations(1) | $ | 54.1 | | $ | 54.5 | | (0.6) | % | | $ | 101.3 | | $ | 88.4 | | 14.7 | % |
| Non-GAAP operating margin | 21.4 | % | 18.6 | % | | | 20.4 | % | 18.7 | % | | Non-GAAP operating margin | 23.6 | % | 23.5 | % | | 22.6 | % | 19.4 | % | |
| | | | | | | |
| GAAP income before provision for income taxes | | GAAP income before provision for income taxes | $ | 8.5 | | $ | 16.3 | | (48.1) | % | | $ | 9.0 | | $ | 21.7 | | (58.5) | % |
| GAAP net income | $ | 12.5 |
| $ | 8.9 |
| 40.5 | % | | $ | 35.2 |
| $ | 24.2 |
| 45.4 | % | GAAP net income | $ | 6.7 | | $ | 11.8 | | (43.1) | % | | $ | 6.6 | | $ | 16.5 | | (60.1) | % |
| Shares used in computing GAAP diluted earnings per share | 47,846,997 |
| 47,394,106 |
| 1.0 | % | | 47,679,103 |
| 47,268,469 |
| 0.9 | % | Shares used in computing GAAP diluted earnings per share | 48,444,874 | | 48,418,378 | | 0.1 | % | | 48,444,658 | | 48,465,077 | | — | % |
| GAAP diluted earnings per share | $ | 0.26 |
| $ | 0.19 |
| 36.8 | % | | $ | 0.74 |
| $ | 0.51 |
| 45.1 | % | GAAP diluted earnings per share | $ | 0.14 | | $ | 0.24 | | (41.7) | % | | $ | 0.14 | | $ | 0.34 | | (58.8) | % |
| Non-GAAP adjustments: | | | | | | Non-GAAP adjustments: | |
| Add: Total Non-GAAP adjustments affecting income from operations | 24.0 |
| 20.5 |
| 17.1 | % | | 71.3 |
| 62.6 |
| 13.8 | % | |
| Add (less): Loss (gain) on derivative instrument | — |
| — |
| 100.0 | % | | (0.5 | ) | — |
| 100.0 | % | |
| Add: Loss on debt extinguishment | 0.1 |
| — |
| 100.0 | % | | 0.3 |
| — |
| 100.0 | % | |
Less: Tax impact related to Non-GAAP adjustments(2) | (9.8 | ) | (8.1 | ) | 21.6 | % | | (32.0 | ) | (24.2 | ) | 32.4 | % | |
| Add: GAAP income tax provision | | Add: GAAP income tax provision | 1.7 | | 4.5 | | (61.2) | % | | 2.4 | | 5.2 | | (53.2) | % |
| Add: Total non-GAAP adjustments affecting income from operations | | Add: Total non-GAAP adjustments affecting income from operations | 41.1 | | 34.9 | | 17.8 | % | | 81.6 | | 60.4 | | 35.2 | % |
| | Non-GAAP income before provision for income taxes | | Non-GAAP income before provision for income taxes | 49.6 | | 51.2 | | (3.2) | % | | 90.6 | | 82.0 | | 10.5 | % |
Assumed non-GAAP income tax provision(3) | | Assumed non-GAAP income tax provision(3) | 9.9 | | 10.2 | | (3.2) | % | | 18.1 | | 16.4 | | 10.5 | % |
Non-GAAP net income(1) | $ | 26.9 |
| $ | 21.3 |
| 25.8 | % | | $ | 74.3 |
| $ | 62.7 |
| 18.6 | % | Non-GAAP net income(1) | $ | 39.7 | | $ | 41.0 | | (3.2) | % | | $ | 72.5 | | $ | 65.6 | | 10.5 | % |
| | | | | | | | | | | |
| Shares used in computing Non-GAAP diluted earnings per share | 47,846,997 |
| 47,394,106 |
| 1.0 | % | | 47,679,103 |
| 47,268,469 |
| 0.9 | % | |
| Shares used in computing non-GAAP diluted earnings per share | | Shares used in computing non-GAAP diluted earnings per share | 48,444,874 | | 48,418,378 | | 0.1 | % | | 48,444,658 | | 48,465,077 | | — | % |
| Non-GAAP diluted earnings per share | $ | 0.56 |
| $ | 0.45 |
| 24.4 | % | | $ | 1.56 |
| $ | 1.33 |
| 17.3 | % | Non-GAAP diluted earnings per share | $ | 0.82 | | $ | 0.85 | | (3.5) | % | | $ | 1.50 | | $ | 1.35 | | 11.1 | % |
| |
(1) | The individual amounts for each year may not sum to subtotal, non-GAAP income from operations or non-GAAP net income due to rounding. |
| |
(2) | We apply a non-GAAP effective tax rate of 32.0% in our determination of non-GAAP net income, which represents the GAAP effective tax rate, excluding the discrete tax effect of stock-based compensation. |
(1)The increases inindividual amounts for each year may not sum to non-GAAP gross profit, subtotal, non-GAAP income from operations or non-GAAP net income due to rounding.
(2)Includes Security Incident-related costs incurred during the three and ninesix months ended SeptemberJune 30, 2017, when compared to2021 of $11.7 million and $24.4 million, respectively, net of probable insurance recoveries during the same periods of $11.2 million and $23.9 million, respectively. Recorded expenses consisted primarily of payments to third-party service providers and consultants, including legal fees, as well as settlements of customer claims. Not included in 2016,this adjustment were primarily duecosts associated with enhancements to growth in subscriptions revenue, partially offset by investments we are making in our sales organizationcybersecurity program.
(3)We apply a non-GAAP effective tax rate of 20.0% when calculating non-GAAP net income and customer success program and, to a lesser extent, increases in rent expense, which are discussed above.non-GAAP diluted earnings per share.
| | | | | | | | |
| Second Quarter 2021 Form 10-Q | | 35 |
Blackbaud, Inc.
(Unaudited)
Non-GAAP organic revenue growth
In addition, we discuss non-GAAP organic revenue growth, non-GAAP organic revenue growth on a constant currency basis non-GAAP organic subscriptions revenue growth and non-GAAP organic recurring revenue growth, which wein analyzing our operating performance. We believe providesthat these non-GAAP measures are useful informationto investors, as a supplement to GAAP measures, for evaluating the periodic growth of our business on a consistent basis. Each of these measures of non-GAAP organic revenue growth excludes incremental acquisition-related revenue attributable to companies acquired in the current fiscal year. For companies, if any, acquired in the immediately preceding fiscal year, each of these non-GAAP organic revenue growth measures reflects presentation of full year incremental non-GAAP revenue derived from such companies as if they were combined throughout the prior period, and it includesthey include the non-GAAP revenue attributable to those companies, as if there were no acquisition-related write-downs of acquired deferred revenue to fair value as required by GAAP. In addition, each of these non-GAAP organic revenue growth measures excludes prior period revenue associated with divested businesses. The exclusion of the prior period revenue is to present the results of the divested businesses within the results of the combined company for the same period of time in both the prior and current periods. We believe this presentation provides a more comparable representation of our current business’ organic revenue growth and revenue run-rate.
| | | | | | | | | | | | | | | | | |
| (dollars in millions) | Three months ended June 30, | | Six months ended June 30, |
| 2021 | 2020 | | 2021 | 2020 |
| GAAP revenue | $ | 229.4 | | $ | 232.0 | | | $ | 448.6 | | $ | 455.6 | |
| GAAP revenue growth | (1.1) | % | | | (1.5) | % | |
Add: Non-GAAP acquisition-related revenue(1) | — | | — | | | — | | — | |
Non-GAAP organic revenue(2) | $ | 229.4 | | $ | 232.0 | | | $ | 448.6 | | $ | 455.6 | |
| Non-GAAP organic revenue growth | (1.1) | % | | | (1.5) | % | |
| | | | | |
Non-GAAP organic revenue(2) | $ | 229.4 | | $ | 232.0 | | | $ | 448.6 | | $ | 455.6 | |
Foreign currency impact on Non-GAAP organic revenue(3) | (4.4) | | — | | | (6.3) | | — | |
Non-GAAP organic revenue on constant currency basis(3) | $ | 225.1 | | $ | 232.0 | | | $ | 442.3 | | $ | 455.6 | |
| Non-GAAP organic revenue growth on constant currency basis | (3.0) | % | | | (2.9) | % | |
| | | | | |
| GAAP recurring revenue | $ | 217.0 | | $ | 216.3 | | | $ | 423.7 | | $ | 421.1 | |
| GAAP recurring revenue growth | 0.3 | % | | | 0.6 | % | |
Add: Non-GAAP acquisition-related revenue(1) | — | | — | | | — | | — | |
| Non-GAAP organic recurring revenue | $ | 217.0 | | $ | 216.3 | | | $ | 423.7 | | $ | 421.1 | |
| Non-GAAP organic recurring revenue growth | 0.3 | % | | | 0.6 | % | |
(1)Non-GAAP acquisition-related revenue excludes incremental acquisition-related revenue calculated in accordance with GAAP that is attributable to companies acquired in the current fiscal year. For companies, if any, acquired in the immediately preceding fiscal year, non-GAAP acquisition-related revenue reflects presentation of full-year incremental non-GAAP revenue derived from such companies, as if they were combined throughout the prior period, and it includes the non-GAAP revenue from the acquisition-related deferred revenue write-down attributable to those companies.
(2)Non-GAAP organic revenue for the prior year periods presented herein will not agree to non-GAAP organic revenue presented in the respective prior period quarterly financial information solely due to the manner in which non-GAAP organic revenue growth is calculated.
(3)To determine non-GAAP organic revenue growth on a constant currency basis, revenues from entities reporting in foreign currencies were translated to U.S. Dollars using the comparable prior period's quarterly weighted average foreign currency exchange rates. The primary foreign currencies creating the impact are the Australian Dollar, British Pound, Canadian Dollar and EURO.
|
| | | | | | | |
Third36 | | Second Quarter 20172021 Form 10-Q |
Blackbaud, Inc.
(Unaudited)
Rule of 40
Rule of 40 is defined as non-GAAP organic revenue growth plus non-GAAP adjusted EBITDA margin. Non-GAAP adjusted EBITDA is defined as GAAP net income plus interest, net; income tax provision (benefit); depreciation; amortization of intangible assets from business combinations; amortization of software development costs; acquisition-related deferred revenue write-down; stock-based compensation; acquisition-related integration costs; acquisition-related expenses; employee severance; restructuring and other real estate activities; and Security Incident-related costs, net of insurance.
| | | | | | | | | | | | | | | | | | | | | | | |
| Three months ended June 30, | | Six months ended June 30, |
| (dollars in millions) | 2021 | 2020 | Change | | 2021 | 2020 | Change |
| GAAP net income | $ | 6.7 | | $ | 11.8 | | (43.1) | % | | $ | 6.6 | | $ | 16.5 | | (60.1) | % |
| Non-GAAP adjustments: | | | | | | | |
| Add: Interest, net | 5.0 | | 3.8 | | 31.6 | % | | 9.9 | | 7.4 | | 33.9 | % |
| Add: GAAP income tax provision | 1.7 | | 4.5 | | (61.2) | % | | 2.4 | | 5.2 | | (53.2) | % |
| Add: Depreciation | 3.1 | | 3.6 | | (12.7) | % | | 6.4 | | 7.1 | | (11.0) | % |
| Add: Amortization of intangibles from business combinations | 9.4 | | 10.4 | | (9.3) | % | | 19.1 | | 22.1 | | (13.4) | % |
Add: Amortization of software development costs(1) | 8.1 | | 10.4 | | (21.7) | % | | 16.1 | | 17.0 | | (5.6) | % |
Subtotal(2) | 27.4 | | 32.7 | | (16.0) | % | | 53.9 | | 58.9 | | (8.4) | % |
Non-GAAP EBITDA(2) | $ | 34.2 | | $ | 44.5 | | (23.2) | % | | $ | 60.5 | | $ | 75.3 | | (19.7) | % |
| Non-GAAP EBITDA margin | 14.9 | % | | | | 13.5 | % | | |
| | | | | | | |
| Non-GAAP adjustments: | | | | | | | |
| | | | | | | |
| Add: Stock-based compensation expense | 30.5 | | 20.1 | | 51.7 | % | | 60.6 | | 33.7 | | 79.6 | % |
| Add: Employee severance | 0.5 | | 4.3 | | (89.4) | % | | 1.4 | | 4.4 | | (66.9) | % |
| Add: Acquisition-related integration costs | — | | (0.1) | | (100.0) | % | | (0.1) | | (0.1) | | (4.9) | % |
| Add: Acquisition-related expenses | 0.1 | | 0.1 | | (24.7) | % | | 0.1 | | 0.2 | | (42.4) | % |
| Add: Restructuring and other real estate activities | 0.1 | | 0.1 | | 136.0 | % | | — | | 0.1 | | (90.5) | % |
Add: Security Incident-related costs, net of insurance(3) | 0.5 | | — | | 100.0 | % | | 0.5 | | — | | 100.0 | % |
Subtotal(2) | 31.7 | | 24.5 | | 29.4 | % | | 62.5 | | 38.3 | | 63.3 | % |
Adjusted Non-GAAP EBITDA(2) | $ | 65.8 | | $ | 68.9 | | (4.5) | % | | $ | 123.0 | | $ | 113.6 | | 8.3 | % |
| Adjusted Non-GAAP EBITDA margin | 28.7 | % | | | | 27.4 | % | | |
| | | | | | | |
Rule of 40(4) | 27.6 | % | | | | 25.9 | % | | |
(1)Includes amortization expense related to software development costs and amortization expense from capitalized cloud computing implementation costs.
(2)The individual amounts for each year may not sum to subtotal, non-GAAP EBITDA or adjusted non-GAAP EBITDA due to rounding.
(3)Includes Security Incident-related costs incurred, net of probable insurance recoveries. See additional details in the reconciliation of GAAP to Non-GAAP operating income above.
(4)Measured by non-GAAP organic revenue growth plus non-GAAP adjusted EBITDA margin. See Non-GAAP organic revenue growth table above.
Non-GAAP free cash flow
Non-GAAP free cash flow is defined as operating cash flow less capital expenditures, including costs required to be capitalized for software development, and capital expenditures for property and equipment.
| | | | | | | | | | | |
| Six months ended June 30, |
| (dollars in millions) | 2021 | 2020 | Change |
| GAAP net cash provided by operating activities | $ | 99.9 | | $ | 37.5 | | 166.5 | % |
| Less: purchase of property and equipment | (6.1) | | (5.9) | | 4.1 | % |
| Less: capitalized software development costs | (19.9) | | (21.7) | | (8.4) | % |
| Non-GAAP free cash flow | $ | 73.9 | | $ | 9.9 | | 645.1 | % |
| | | | | | | | |
| Second Quarter 2021 Form 10-Q | | 3537 |
Blackbaud, Inc.
(Unaudited)
|
| | | | | | | | | | | | | |
| (dollars in millions) | Three months ended
September 30, | | | Nine months ended
September 30, | |
| 2017 |
| 2016 |
| | 2017 |
| 2016 |
|
| GAAP revenue | $ | 195.5 |
| $ | 183.1 |
| | $ | 571.3 |
| $ | 532.5 |
|
| GAAP revenue growth | 6.8 | % | | | 7.3 | % | |
(Less) Add: Non-GAAP acquisition-related revenue (1) | (2.1 | ) | — |
| | (4.0 | ) | 3.6 |
|
| Total Non-GAAP adjustments | (2.1 | ) | — |
| | (4.0 | ) | 3.6 |
|
| Non-GAAP revenue | $ | 193.4 |
| $ | 183.1 |
| | $ | 567.3 |
| $ | 536.1 |
|
| Non-GAAP organic revenue growth | 5.6 | % | | | 5.8 | % | |
| | | | | | |
Non-GAAP revenue (2) | $ | 193.4 |
| $ | 183.1 |
| | $ | 567.3 |
| $ | 536.1 |
|
Foreign currency impact on Non-GAAP organic revenue (3) | (0.5 | ) | — |
| | 0.8 |
| — |
|
Non-GAAP revenue on constant currency basis (3) | $ | 192.9 |
| $ | 183.1 |
| | $ | 568.1 |
| $ | 536.1 |
|
| Non-GAAP organic revenue growth on constant currency basis | 5.4 | % | | | 6.0 | % | |
| | | | | | |
| GAAP subscriptions revenue | $ | 127.5 |
| $ | 105.4 |
| | $ | 370.9 |
| $ | 306.3 |
|
| GAAP subscriptions revenue growth | 20.9 | % | | | 21.1 | % | |
(Less) Add: Non-GAAP acquisition-related revenue (1) | (2.0 | ) | — |
| | (3.7 | ) | 3.5 |
|
| Total Non-GAAP adjustments | (2.0 | ) | — |
| | (3.7 | ) | 3.5 |
|
| Non-GAAP organic subscriptions revenue | $ | 125.5 |
| $ | 105.4 |
| | $ | 367.2 |
| $ | 309.9 |
|
| Non-GAAP organic subscriptions revenue growth | 19.0 | % | | | 18.5 | % | |
| | | | | | |
| GAAP subscriptions revenue | $ | 127.5 |
| $ | 105.4 |
| | $ | 370.9 |
| $ | 306.3 |
|
| GAAP maintenance revenue | $ | 31.5 |
| $ | 36.4 |
| | 98.2 |
| 111.0 |
|
| GAAP recurring revenue | $ | 159.0 |
| $ | 141.9 |
| | 469.1 |
| 417.3 |
|
| GAAP recurring revenue growth | 12.1 | % | | | 12.4 | % | |
(Less) Add: Non-GAAP acquisition-related revenue (1) | (2.0 | ) | — |
| | (3.7 | ) | 3.6 |
|
| Total Non-GAAP adjustments | (2.0 | ) | — |
| | (3.7 | ) | 3.6 |
|
| Non-GAAP recurring revenue | $ | 157.0 |
| $ | 141.9 |
| | $ | 465.4 |
| $ | 421.0 |
|
| Non-GAAP organic recurring revenue growth | 10.7 | % | | | 10.5 | % | |
| |
(1) | Non-GAAP acquisition-related revenue excludes incremental acquisition-related revenue calculated in accordance with GAAP that is attributable to companies acquired in the current fiscal year. For companies, if any, acquired in the immediately preceding fiscal year, non-GAAP acquisition-related revenue reflects presentation of full-year incremental non-GAAP revenue derived from such companies, as if they were combined throughout the prior period, and it includes the non-GAAP revenue from the acquisition-related deferred revenue write-down attributable to those companies. |
| |
(2) | Non-GAAP revenue for the prior year periods presented herein may not agree to non-GAAP revenue presented in the respective prior period quarterly financial information solely due to the manner in which non-GAAP organic revenue growth is calculated. |
| |
(3) | To determine non-GAAP organic revenue growth on a constant currency basis, revenues from entities reporting in foreign currencies were translated to U.S. Dollars using the comparable prior period's quarterly weighted average foreign currency exchange rates. The primary foreign currencies creating the impact are the Canadian Dollar, EURO, British Pound and Australian Dollar. |
Seasonality
Our revenues normally fluctuate as a result of certain seasonal variations in our business. Our transactionfirst quarter has historically been the seasonal low for bookings, with the second and fourth quarters historically being seasonally higher, and our bookings tend to be back-end loaded within individual quarters given our quarterly quota plans. Transactional revenue is non-contractual and less predictable given the susceptibility to certain drivers such as timing and number of events and marketing campaigns, as well as fluctuations in donation volumes and tuition payments. Our transactional revenue has historically been at its lowest in the first quarter due to the timing of customer fundraising initiatives and events. Our revenue from payment processing services hasWe have historically increasedexperienced seasonal highs during the fourth quarter due to year-end giving.giving campaigns and during the second quarter when a large number of events are held. Our revenue from professional services has historically been lower in the first quarter when many of those services commence and in the fourth quarter due to the holiday season. As a result of these and other factors, our total revenue has historically been lower in the first quarter than in the remainder of our fiscal year, with the third and fourth quartersquarter historically achieving the highest total revenues.revenue. Our expenses, however, do not vary significantly as a result of these factors, but do fluctuate on a quarterly basis due to varying timing of expenditures.
Our cash flow from operations normally fluctuates quarterly due to the combination of the timing of customer contract renewals including renewals associated with customers of acquired companies, delivery of professional services and occurrence of customer events, the payment of bonuses, as well as merit-based salary increases, among other factors. Historically, due to lower revenues in our first quarter, combined with the payment of bonuses from the prior year in our first quarter,certain annual vendor contracts, our cash flow from operations has been lowest in
|
| | |
36 | | Third Quarter 2017 Form 10-Q |
our first quarter, and duequarter. Due to the timing of customer contract renewals and student enrollments, many of which take place at or near the beginning of our third quarter, our cash flow from operations has been lower in our second quarter as compared to our third and fourth quarters. Partially offsetting these favorable drivers of cash flow from operations in our third and fourth quarters are merit-basedbase salary merit increases, which are generally effectivewere replaced in April each year.2020 with performance-based equity awards due to COVID-19, but returned in July 2021. In addition, deferred revenues can vary on a seasonal basis for the same reasons. Our cash flow from financing is negatively impacted in our first quarter when most of our equity awards vest, as we pay taxes on behalf of our employees related to the settlement or exercise of equity awards. During the second quarter of 2021, however, we experienced an increase in the amount taxes we paid on behalf of our employees related to the settlement of equity awards when compared to the same period in 2020, as the equity granted in May 2020 in lieu of cash bonus plans and base salary merit increases vested. These patterns may change as a result of the continued shift to online giving, growth in volume of transactions for which we process payments, or as a result of acquisitions, new market opportunities, new solution introductions, the COVID-19 pandemic or other factors. Our cash flow from financing is negatively impacted in our first quarter when most of our equity awards vest, as we pay taxes on behalf of our employees related to the settlement or exercise of equity awards.
|
| |
| Liquidity and Capital Resources |
The following table presents selected financial information about our financial position:
| | | (dollars in millions) | September 30,
2017 |
| Change |
| | December 31,
2016 |
| (dollars in millions) | June 30,
2021 | December 31,
2020 | Change |
| Cash and cash equivalents | $ | 17.1 |
| 0.9 | % | | $ | 16.9 |
| Cash and cash equivalents | $ | 28.3 | | $ | 35.8�� | | (20.9) | % |
| Property and equipment, net | 43.9 |
| (12.7 | )% | | 50.3 |
| Property and equipment, net | 104.9 | | 105.2 | | (0.3) | % |
| Software development costs, net | 48.6 |
| 29.4 | % | | 37.6 |
| Software development costs, net | 116.6 | | 111.8 | | 4.2 | % |
| Total carrying value of debt | 338.0 |
| (1.3 | )% | | 342.4 |
| Total carrying value of debt | 544.9 | | 531.0 | | 2.6 | % |
| Working capital | (181.1 | ) | (5.1 | )% | | (172.2 | ) | Working capital | (186.6) | | (194.3) | | 4.0 | % |
| Working capital excluding deferred revenue | 95.9 |
| 32.7 | % | | 72.3 |
| |
The following table presents selected financial information about our cash flows:
| | | | | | | | | | | |
| Six months ended June 30, |
| (dollars in millions) | 2021 | 2020 | Change |
| Net cash provided by operating activities | $ | 99.9 | | $ | 37.5 | | 166.5 | % |
| Net cash used in investing activities | (26.0) | | (27.6) | | (5.7) | % |
| Net cash used in financing activities | (257.0) | | (132.5) | | 93.9 | % |
|
| | | | | | | | | |
| | Nine months ended September 30, | |
| (dollars in millions) | 2017 |
| Change |
| | 2016 |
|
| Net cash provided by operating activities | $ | 123.4 |
| 23.2 | % | | $ | 100.1 |
|
| Net cash used in investing activities | (78.2 | ) | 106.4 | % | | (37.9 | ) |
| Net cash used in financing activities | (45.3 | ) | (25.9 | )% | | (61.2 | ) |
| | | | | | | | |
| 38 | | Second Quarter 2021 Form 10-Q |
Blackbaud, Inc.
(Unaudited)
Our principal sources of liquidity are our operating cash flow, funds available under the 20172020 Credit Facility and cash on hand. Our operating cash flow depends on continued customer renewal of our subscription and maintenance and support arrangements, and market acceptance of our solutions and services.services and our customers' ability to pay. Based on current estimates of revenue and expenses, we believe that the currently available sources of funds and anticipated cash flows from operations will be adequate for at least the next twelve months to finance our operations, fund anticipated capital expenditures and meet our debt obligations and pay dividends. Dividend payments are not guaranteed and our Board of Directors may decide, in its absolute discretion, at any time and for any reason, not to declare and pay further dividends and/or repurchase our common stock.obligations. To the extent we undertake future material acquisitions, investments or unanticipated capital expenditures, we may require additional capital. In that context, we regularly evaluate opportunities to enhance our capital structure including through potential debt or equity issuances.
At SeptemberJune 30, 2017,2021, our total cash and cash equivalents balance included approximately $7.5$14.4 million of cash that was held by operations outside the U.S. While these funds may not be needed to fund our U.S. operations for at least the next twelve months, if we need these funds, we may be required to accrue and pay taxes to repatriate the funds. We currently do not intend nor anticipate a need to repatriate our cash held outside the U.S.
Operating cash flowCash Flow
Net cash provided by operating activities of $123.4 million increased by $23.2$62.4 million during the ninesix months ended SeptemberJune 30, 2017,2021, when compared to the same period in 2016,2020, primarily due to an increase in net income adjusted for non-cash expenses, and ana $54.6 million increase in cash flow from operations associated with working capital.capital and an $7.9 million increase in net income adjusted for non-cash expenses. Throughout both periods, our cash flows from operations were derived principally from: (i) our earnings from on-going operations prior to non-cash
|
| | |
Third Quarter 2017 Form 10-Q | | 37 |
expenses such as depreciation, amortization, stock-based compensation, amortization of deferred financing costs and debt discount and adjustments to our provision for credit losses and sales returns and allowances;returns; and (ii) changes in our working capital.
Working capital changes are composed of changes in accounts receivable, prepaid expenses and other assets, trade accounts payable, accrued expenses and other liabilities, and deferred revenue. CashThe increase in cash flow from operations associated with working capital increased $1.6 million during the ninesix months ended SeptemberJune 30, 2017,2021, when compared to the samesame period in 2016,2020, was primarily due to a decreaseto:
•the payment of our 2019 cash bonus plans in 2020 and the replacement of our 2020 cash bonus payments partially offset by plans with performance-based equity awards (which we expect will continue going forward);
•an increase in cash taxes paid.the collection of our accounts receivable balances, including early progress in initiatives to bring our pricing in line with the market; and
•fluctuations in the timing of vendor payments. Investing cash flowCash Flow
Net cash used in investing activities of $78.2$26.0 million increaseddecreased by $40.3$1.6 million during the ninesix months ended SeptemberJune 30, 2017,2021, when compared to the same period in 2016.2020.
During the ninesix months ended SeptemberJune 30, 2017,2021, we used net cash of $49.7$19.9 million for the acquisition of AcademicWorks compared to $3.4 million spent on investments in acquired companies during the same period in 2016. We used $20.6 million for software development costs, which was up $1.5down $1.8 million from cash spent induring the same period in 2016. The increase2020, primarily due to less costs qualifying for capitalization under the internal-use software accounting guidance. We increased engineering hiring beginning in cash outlays for software development costs was primarily driven by development activities relatedthe fourth quarter of 2020 and continue to invest in our next generation cloud-basedinnovative cloud solutions, andas well as development activities for Blackbaud SKY, our new modern cloud platform.
We also spent $8.4$6.1 million of cash for purchases of property and equipment during the ninesix months ended SeptemberJune 30, 2017,2021, which was down $7.0 million from cashin line with what we spent during the same period in 2016. The decrease in cash outlays for property and equipment was primarily driven by a shift toward leasing certain equipment that we have historically purchased. Cash outlays for operating leases are presented in operating cash flows.2020.
Financing cash flowCash Flow
During the ninesix months ended SeptemberJune 30, 2017,2021, we had a net decreaseincrease in borrowings of $5.8 million, even with the incremental borrowings needed to finance our acquisition of AcademicWorks. We also paid $3.1 million in financing costs as a result of refinancing our credit facility.$14.8 million.
We paid $19.1$38.7 million to satisfy tax obligations of employees upon settlement or exercise of equity awards during the ninesix months ended SeptemberJune 30, 20172021 compared to $10.5$21.0 million during the same period in 2016.2020. The amount of taxes paid by us on the behalf of employees related to the settlement or exercise of equity awards varies from period to period based upon the timing of grants and vesting, employee exercise decisions, as well as the market price for shares of our common stock at the time of settlement. Due to a change in the timing of our annual equity award grants,While most of
| | | | | | | | |
| Second Quarter 2021 Form 10-Q | | 39 |
Blackbaud, Inc.
(Unaudited)
our equity awards nowcurrently vest in our first quarter. In addition, duringquarter, the nineequity awards that we granted in May 2020 to replace our 2020 cash bonus plans and base salary merit increases vested in May 2021. During the six months ended SeptemberJune 30, 2017,2020, we paid dividends of $17.3$6.0 million which was relatively consistentand we did not pay dividends during the same period in 2021, as we discontinued the declaration and payment of all cash dividends, beginning with the comparablesecond quarter of 2020.
Cash used in financing activities associated with changes in restricted cash due to customers increased $48.4 million during the six months ended June 30, 2021 when compared to the same period in 2020, as the amount of 2016.restricted cash held and payable by us to customers as of December 31, 2020 was larger than at the same date in 2019 primarily due to the timing of year-end donations.
2017Stock repurchase program
In November 2020, our Board of Directors reauthorized and expanded a stock repurchase program that authorizes us to purchase up to $250.0 million of our outstanding shares of common stock. The program does not have an expiration date. Under the stock repurchase program, we are authorized to repurchase shares from time to time in accordance with applicable laws both on the open market, including under trading plans established pursuant to Rule 10b5-1 under the Securities Exchange Act of 1934, as amended, and in privately negotiated transactions. The timing and amount of repurchases depends on several factors, including market and business conditions, the trading price of our common stock and the nature of other investment opportunities. The repurchase program may be limited, suspended or discontinued at any time without prior notice. During the three and six months ended June 30, 2021, we purchased 405,047 and 870,868 shares for $30.0 million and $58.1 million, respectively. The remaining amount available to purchase stock under the stock repurchase program was $150.9 million as of June 30, 2021.
2020 Credit Facility
As discussed above, in June 2017,Historically, we entered into the 2017 Credit Facility. Upon closing, we drew $300.0 million on a term loan and $110.0 million in revolving credit loans, which was used to repay all amounts outstanding under our previous credit facility and for other general corporate purposes.
We have drawn on our credit facility from time to time to help us meet financial needs, such asprimarily due to the seasonality of our cash flows from operations and financing for business acquisitions. At SeptemberJune 30, 2017,2021, our available borrowing capacity under the 20172020 Credit Facility was $356.2$409.6 million. The 20172020 Credit Facility matures in June 2022.October 2025.
At SeptemberJune 30, 2017,2021, the carrying amount of our debt under the 20172020 Credit Facility was $335.8$483.1 million. Our average daily borrowings during the three and ninesix months ended SeptemberJune 30, 20172021 were $355.4$495.6 million and $368.5$492.6 million, respectively.
The following is a summary of the financial covenants under our credit facility:
the 2020 Credit Facility: |
| | | | | | | |
Financial Covenantcovenant | Requirement | Ratio as of SeptemberJune 30, 20172021 |
Net Leverage Ratioleverage ratio | ≤ 3.504.00 to 1.00 | 1.791.78 to 1.00 |
Interest Coverage Ratiocoverage ratio | ≥ 2.50 to 1.00 | 16.3115.87 to 1.00 |
|
| | |
38 | | Third Quarter 2017 Form 10-Q |
Under the 20172020 Credit Facility, we also have restrictions on our ability to declare and pay dividends and our ability to repurchase shares of our common stock. In order to pay any cash dividends and/or repurchase shares of stock: (i) no default or event of default shall have occurred and be continuing under the 20172020 Credit Facility, and (ii) our pro forma net leverage ratio, as set forth in the 20172020 Credit Facility, must be 0.25 less than the net leverage ratio requirement at the time of dividend declaration or share repurchase. At SeptemberJune 30, 2017,2021, we were in compliance with our debt covenants under the 20172020 Credit Facility.
| | | | | | | | |
| 40 | | Second Quarter 2021 Form 10-Q |
Blackbaud, Inc.
(Unaudited)
Commitments and contingenciesContingencies
As of SeptemberJune 30, 2017,2021, we had contractual obligations with future minimum commitments as follows: | | | | Payments due by period | | Payments due by period |
| (in millions) | Total |
| Less than 1 year |
| 1-3 years |
| 3-5 years |
| More than 5 years |
| (in millions) | Total(1) | Less than 1
year | 1-3 years | 3-5 years | More than 5
years |
| Recorded contractual obligations: | | Recorded contractual obligations: | |
Debt(1) | $ | 340.2 |
| $ | 8.6 |
| $ | 16.1 |
| $ | 315.5 |
| $ | — |
| |
Debt(2) | | Debt(2) | $ | 547.3 | | $ | 12.9 | | $ | 23.4 | | $ | 458.6 | | $ | 52.4 | |
Interest payments on debt(3) | | Interest payments on debt(3) | 1.3 | | 1.2 | | 0.2 | | — | | — | |
Operating leases(4) | | Operating leases(4) | 27.5 | | 8.8 | | 11.4 | | 4.1 | | 3.2 | |
| | | |
| Unrecorded contractual obligations: | | Unrecorded contractual obligations: | |
Operating leases(2) | 190.4 |
| 20.2 |
| 40.0 |
| 33.1 |
| 97.1 |
| |
Interest payments on debt(3)(5) | 41.9 |
| 8.9 |
| 18.7 |
| 14.3 |
| — |
| 75.2 | | 11.7 | | 24.7 | | 16.6 | | 22.2 | |
Purchase obligations(4)(6) | 51.9 |
| 21.3 |
| 30.6 |
| — |
| — |
| 45.0 | | 28.9 | | 16.0 | | — | | — | |
| Total contractual obligations | $ | 624.4 |
| $ | 59.0 |
| $ | 105.4 |
| $ | 362.9 |
| $ | 97.1 |
| Total contractual obligations | $ | 696.4 | | $ | 63.5 | | $ | 75.7 | | $ | 479.4 | | $ | 77.8 | |
| |
(1) | Represents principal payments only, under the following assumptions: (i) that the amounts outstanding under the 2017 Credit Facility and our other debt at September 30, 2017 will remain outstanding until maturity, with minimum payments occurring as currently scheduled, and (ii) that there are no assumed future borrowings on the 2017 Revolving Facility for the purposes of determining minimum commitment amounts.(1)The individual amounts for each period may not sum to total due to rounding. (2)Represents principal payments only, under the following assumptions: (i) that the amounts outstanding under the 2020 Credit Facility, our Real Estate Loans and our other debt at June 30, 2021 will remain outstanding until maturity, with minimum payments occurring as currently scheduled, and (ii) that there are no assumed future borrowings on the 2020 Credit Facility for the purposes of determining minimum commitment amounts. (3)Represents interest payment obligations related to our interest rate swap agreements. (4)Our commitments related to operating leases have not been reduced by sublease income, incentive payments and reimbursement of leasehold improvements. (5)The actual interest expense recognized in our consolidated statements of comprehensive income will depend on the amount of debt, the length of time the debt is outstanding and the interest rate, which could be different from our assumptions described in (1) above. (6)We have contractual obligations for third-party technology used in our solutions and for other services we purchase as part of our normal operations. In certain cases, these arrangements require a minimum annual purchase commitment by us. |
| |
(2) | Our commitments related to operating leases have not been reduced by incentive payments and reimbursement of leasehold improvements. |
| |
(3) | The actual interest expense recognized in our consolidated statements of comprehensive income will depend on the amount of debt, the length of time the debt is outstanding and the interest rate, which could be different from our assumptions described in (1) above. |
| |
(4) | We have contractual obligations for third-party technology used in our solutions and for other services we purchase as part of our normal operations. In certain cases, these arrangements require a minimum annual purchase commitment by us. |
The term loan under the 20172020 Credit Facility and our other debt require periodic principal payments. The balance of the term loans and any amounts drawn on the revolving credit loans are due upon maturity of the 20172020 Credit Facility in June 2022.October 2025. The Real Estate Loans also require periodic principal payments and the balance of the Real Estate Loans are due upon maturity in April 2038.
The total liability for uncertain tax positions as of SeptemberJune 30, 20172021 and December 31, 2016,2020, was $3.4$4.7 million and $3.1$4.6 million, respectively. Our accrued interest and penalties related to tax positions taken on our tax returns was insignificant$1.2 million and $1.1 million as of SeptemberJune 30, 20172021 and December 31, 2016.2020, respectively.
In February 2017,Security Incident
As discussed in Note 9 to our Boardunaudited, condensed consolidated financial statements included in this report, we believe it is probable that total losses related to the Security Incident will ultimately exceed the limits of Directors approved our annual dividend rateinsurance coverage. However, as we are currently unable to determine when that will be the case and the approximate amount or range of $0.48 per shareany such excess, we are unable to be made in quarterly payments. Dividends at this annual rate would aggregate to $23.0 million assuming 48.0 million sharesdetermine the effect the Security Incident will have on our results of common stock are outstanding, although dividends are not guaranteed and our Board of Directors may decide, in its absolute discretion, to changeoperations, liquidity, or suspend dividend payments at any time for any reason. Our ability to continue to declare and pay dividends quarterly this year and beyond might be restricted by, among other things, the terms of the 2017 Credit Facility, general economic conditions and our ability to generate adequate operating cash flow.financial condition.
On October 25, 2017, our Board of Directors declared a fourth quarter dividend of $0.12 per share payable on December 15, 2017 to stockholders of record on November 28, 2017.
|
| |
| Off-Balance Sheet Arrangements |
As of SeptemberJune 30, 2017,2021, we did not have any off-balance sheet arrangements as previously defined inby Item 303(a)(4)(ii) of Regulation S-K promulgated by the SEC that have, or are reasonably likely to have, a current or future effect on our financial condition, changes in our financial condition, revenues or expenses, results of operations, liquidity, capital expenditures or capital resources that is material to investors.
| | | | | | | | |
| Second Quarter 2021 Form 10-Q | | 41 |
Blackbaud, Inc.
(Unaudited)
| | |
Third Quarter 2017 Form 10-Q | | 39 |
|
|
| Foreign Currency Exchange Rates |
Approximately 10%16% of our total revenue for the ninesix months ended SeptemberJune 30, 20172021 was generated from operations outside the United States.U.S. We do not have significant operations in countries in which the economy is considered to be highly inflationary. Our consolidated financial statements are denominated in U.S. dollars and, accordingly, changes in the exchange rate between foreign currencies and the U.S. dollar will affect the translation of our subsidiaries’ financial results into U.S. dollars for purposes of reporting our consolidated financial results. The accumulated currency translation adjustment, recorded within accumulated other comprehensive loss as a component of stockholders’ equity, was a lossgain of $0.9 million and $0.5$4.9 million as of SeptemberJune 30, 20172021 and a gain of $0.6 million as of December 31, 2016, respectively.2020.
The vast majority of our contracts are entered into by our U.S. or U.K. entities. The contracts entered into by the U.S. entity are almost always denominated in U.S. dollars or Canadian dollars, and contracts entered into by our U.K., Australian and Irish subsidiaries are generally denominated in British Pounds, Australian dollars and Euros, respectively. Historically, as the U.S. dollar weakened, foreign currency translation resulted in an increase in our revenues and expenses denominated in non-U.S. currencies. Conversely, as the U.S. dollar strengthened, foreign currency translation resulted in a decrease in our revenue and expenses denominated in non-U.S. currencies. During the ninesix months ended SeptemberJune 30, 2017,2021, foreign translation resulted in an decreaseincreases in our revenues and expenses denominated in non-U.S. currencies. Though we have exposure to fluctuations in currency exchange rates, primarily those between the U.S. dollar and both the British Pound and Canadian dollar, the impact has generally not been material to our consolidated results of operations or financial position. For the ninesix months ended SeptemberJune 30, 2017,2021, the fluctuation in foreign currency exchange rates had insignificant impacts onincreased our total revenue and our income from operations. For the nine months ended September 30, 2017, the fluctuation in foreign currency exchange rates decreased IMG revenueoperations by approximately $0.8 million.$6.3 million and $2.3 million, respectively. We will continue monitoring such exposure and take action as appropriate. To determine the impacts on revenue (or income from operations) from fluctuations in currency exchange rates, current period revenues (or income from operations) from entities reporting in foreign currencies were translated into U.S. dollars using the comparable prior year period's weighted average foreign currency exchange rates. These impacts are non-GAAP financial information and are not in accordance with, or an alternative to, information prepared in accordance with GAAP.
In June and September 2017, we entered into a foreign currency option contract and a foreign currency forward contract, respectively, to hedge our exposure to currency fluctuations in connection with our acquisition of JustGiving, because the purchase price was denominated in British Pounds. See Note 9 of our consolidated financial statements in this report for additional information about these derivative instruments.
We do not believe that inflation has had a material effect on our business, financial condition or results of operations. If our costs were to become subject to significant inflationary pressures, we may not be able to fully offset such higher costs through price increases. Our inability or failure to do so could harm our business, financial condition and results of operations. In addition, if inflationary pressures impact the rate of giving to our customers, there could be adverse impacts to our business, financial condition and results of operations.
|
|
| Critical Accounting Policies and Estimates |
There have been no significant changes in our critical accounting policies and estimates during the ninesix months ended SeptemberJune 30, 20172021 as compared to those disclosed in “Management’s Discussion and Analysis of Financial Condition and Results of Operations” included in our Annual Report on Form 10-K for the fiscal year ended December 31, 2016.2020.
|
| |
| Recently Issued Accounting Pronouncements |
For a discussion of the impact that recently issued accounting pronouncements are expected to have on our financial position and results of operations when adopted in the future, see Note 2 ofto our condensed consolidated financial statements in this report.
|
| | |
40 | | Third Quarter 2017 Form 10-Q |
ITEM 3. QUANTITATIVE AND QUALITATIVE DISCLOSURES ABOUT MARKET RISK
We have market rate sensitivity for interest rates and foreign currency exchange rates.
Our variable rate debt is our primary financial instrument with market risk exposure for changing interest rates. We manage our variable rate interest rate risk through a combination of short-term and long-term borrowings and the use of derivative instruments entered into for hedging purposes. Our interest rate exposure includes LIBOR rates. The Financial Conduct Authority in the U.K. has stated that it plans to phase out all tenors of LIBOR by June 2023. We do not currently anticipate a significant impact to our financial position or results of operations as a result of this action as we expect that our financial contracts currently indexed to LIBOR will either expire or be modified without significant financial impact before the phase out occurs. Due to the nature of our debt, the materiality of the fair values of the
| | | | | | | | |
| 42 | | Second Quarter 2021 Form 10-Q |
Blackbaud, Inc.
(Unaudited)
derivative instruments and the highly liquid, short-term nature and level of our cash and cash equivalents as of SeptemberJune 30, 2017,2021, we believe there is no materialthat the risk of exposure to changing interest rates for those positions.positions is immaterial. There were no significant changes in how we manage interest rate risk between December 31, 20162020 and SeptemberJune 30, 2017.
For a discussion of our exposure to foreign currency exchange rate fluctuations, see “Management’s Discussion and Analysis of Financial Condition and Results of Operations — Foreign Currency Exchange Rates” in this report.
ITEM 4. CONTROLS AND PROCEDURES
| | |
|
| Evaluation of Disclosure Controls and Procedures |
Disclosure controls and procedures (as defined in Securities Exchange Act Rule 13a-15(e) and 15d-15(e)) are designed only to provide reasonable assurance that they will meet their objectives. As of the end of the period covered by this report, we carried out an evaluation, under the supervision and with the participation of our management, including our Chief Executive Officer (principal executive officer) and Chief Financial Officer (principal financial and accounting officer), of the effectiveness of our disclosure controls and procedures (as defined in Rule 13a-15(e) and 15d-15(e)) pursuant to Securities Exchange Act Rule 13a-15(b). Based upon that evaluation, our Chief Executive Officer and Chief Financial Officer have concluded that our disclosure controls and procedures are effective to provide the reasonable assurance discussed above.
| | |
|
| Changes in Internal Control Over Financial Reporting |
No changechanges in internal control over financial reporting occurred during the most recent fiscal quarter ended SeptemberJune 30, 20172021 with respect to our operations, which hashave materially affected, or isare reasonably likely to materially affect, our internal control over financial reporting.
|
| | | | | | | |
ThirdSecond Quarter 20172021 Form 10-Q | | 4143 |
|
| | | | | | | |
| | PART II. OTHER INFORMATION |
ITEM 1. LEGAL PROCEEDINGS For a discussion of our legal proceedings, see Note 9 to our condensed consolidated financial statements in this report.
ITEM 1A. RISK FACTORS
Our operations and financial resultsWe are subject to various risks and uncertainties, including those described in Part I,supplementing Item IA, "Risk factors"1A. Risk Factors in our Annual Report on Form 10-K for the year ended December 31, 2016,2020, as filed with the Securities and Exchange Commission on February 23, 2021 (the “Annual Report”). The following risk factors should be read in conjunction with the risk factors set forth in that Annual Report.
The Security Incident could have numerous adverse effects on our business.
As previously disclosed, on July 16, 2020, we contacted certain customers to inform them about the Security Incident, including that in May 2020 we discovered and stopped a ransomware attack. Prior to our successfully preventing the cybercriminal from blocking our system access and fully encrypting files, and ultimately expelling them from our system with no significant disruption to our operations, the cybercriminal removed a copy of a subset of data from our self-hosted environment. Although the nature of the incident, our research and third party (including law enforcement) investigation have provided no reason to believe that any data went beyond the cybercriminal, was or will be misused, or will be disseminated or otherwise made available publicly, our investigation into the Security Incident remains ongoing and may provide additional information.
To date, we have received approximately 260 specific requests for reimbursement of expenses ("Customer Reimbursement Requests") and approximately 400 reservations of the right to seek expense recovery in the future from customers or their attorneys in the U.S., U.K. and Canada related to the Security Incident (none of which have as yet been filed in court) and are in the process of assessing what liability may exist pursuant to such claims. Of the Customer Reimbursement Requests received to date, approximately 160 have been fully resolved and closed. Customer claims generally seek reimbursement of their costs and expenses associated with notifying their own customers of the Security Incident and taking steps to assure that personal information has not been compromised as a result of the Security Incident. In addition, presently, we are a defendant in 29 putative consumer class action cases [27 in U.S. federal courts (some of which have been consolidated under multi district litigation to a single federal court) and 2 in Canadian courts] alleging harm from the Security Incident. The plaintiffs in these cases, who generally purport to represent various classes of individual constituents of our customers, generally claim to have been harmed by alleged actions and/or omissions by us in connection with the Security Incident and assert a variety of common law and statutory claims seeking monetary damages, injunctive relief, costs and attorneys’ fees, and other related relief. To date, we also have received a consolidated, multi-state Civil Investigative Demand issued on behalf of 47 state Attorneys General and the District of Columbia and separate Civil Investigative Demands from the offices of the Illinois Attorney General and the California Attorney General relating to the Security Incident. In addition, we have received communications, inquires and requests from the U.S. Federal Trade Commission, the U.S. Department of Health and Human Services, the U.S. Securities and Exchange Commission, the Information Commissioner’s Office in the United Kingdom (the “ICO”) under the U.K. Data Protection Act 2018, the Office of the Australian Information Commissioner, the Office of the Privacy Commissioner of Canada and the Spanish Data Protection Agency. (See Note 9 to our unaudited, condensed consolidated financial statements included in this report for a more detailed description of the Security Incident and related matters.)
We may be named as a party in additional lawsuits, other claims may be asserted by or on behalf of our customers or their constituents, and we may be subject to additional governmental inquires, requests or investigations. Responding to and resolving these current and any future lawsuits, claims and/or investigations could result in material remedial and other expenses that may not be covered by insurance. Governmental authorities also may seek to impose undertakings, injunctive relief, consent decrees, or other civil or criminal penalties, which could, adversely affectamong other things, materially increase our data security costs or otherwise require us to alter how we operate our business. Although we intend to
| | | | | | | | |
| 44 | | Second Quarter 2021 Form 10-Q |
defend ourselves vigorously against the claims asserted against us, we cannot predict the potential outcomes, cost and expenses associated with current and any future claims, lawsuits, inquiries and investigations.
Significant management time and Company resources have been, and are expected to continue to be, devoted to the Security Incident. In the three and six months ended June 30, 2021, we recorded $11.7 million and $24.4 million, respectively, of expenses related to the Security Incident and offsetting probable insurance recoveries of $11.2 million and $23.9 million, respectively. As of June 30, 2021, we have recorded cumulative expenses related to the Security Incident of $34.2 million and cumulative probable insurance recoveries of $33.3 million. Although we carry insurance designed to protect us against certain losses related to cybersecurity events, we believe it is probable that insurance coverage will not be sufficient to cover all expenses or other losses (including fines) or all types of claims that may arise in connection with cyberattacks, security compromises and other related incidents. Furthermore, in the future such insurance may not be available on commercially reasonable terms, or at all. (See Note 9 to our unaudited, condensed consolidated financial statements included in this report.)
Future publicity or developments related to the Security Incident could have a range of other adverse effects on our business financial condition, resultsor prospects, including causing or contributing to loss of operations, cash flows,customer confidence, reduced customer demand, reduced customer retention, strategic growth opportunities, and the trading price of our stock. There have been no material changes to our risk factors since our Annual Report on Form 10-K for the year ended December 31, 2016.associated retention and recruiting difficulties.
ITEM 2. UNREGISTERED SALES OF EQUITY SECURITIES AND USE OF PROCEEDS
| | |
|
| Issuer Purchases of Equity Securities |
The following table provides information about shares of common stock acquired or repurchased during the three months ended SeptemberJune 30, 2017. All of these acquisitions were of2021 under the stock repurchase program then in effect, as well as common stock withheld by us to satisfy the minimum tax obligations of employees due upon exercisevesting of restricted stock appreciation rightsawards and units.
| | | | | | | | | | | | | | | | | | | | | | | |
| Period | Total number of shares purchased(1) | | Average
price
paid
per
share | | Total number of shares purchased as part of publicly announced plans or programs(2) | | Approximate
dollar value
of shares
that may yet
be purchased
under the
plans or
programs
(in thousands) |
| Beginning balance, April 1, 2021 | | | | | | | $ | 180,933 | |
| April 1, 2021 through April 30, 2021 | 377 | | | $ | 71.97 | | | — | | | 180,933 | |
| May 1, 2021 through May 31, 2021 | 284,869 | | | 71.04 | | | — | | | 180,933 | |
| June 1, 2021 through June 30, 2021 | 405,322 | | | 74.09 | | | 405,047 | | | 150,925 | |
| Total | 690,568 | | | $ | 72.83 | | | 405,047 | | | $ | 150,925 | |
(1)Includes 285,521 shares (377 in April, 284,869 in May and 275 in June) withheld by us to satisfy the minimum tax obligations of employees due upon vesting of restricted stock awards and units. The level of this acquisition activity varies from period to period based upon the timing of award grants and vesting as well as employee exercise decisions.vesting.
|
| | | | | | | | | | | | | |
| Period | Total number of shares purchased |
| | Average price paid per share |
| | Total number of shares purchased as part of publicly announced plans or programs(1) |
| | Approximate dollar value of shares that may yet be purchased under the plans or programs (in thousands) |
|
| Beginning balance, July 1, 2017 | | | | | | | $ | 50,000 |
|
| July 1, 2017 through July 31, 2017 | — |
| | $ | — |
| | — |
| | 50,000 |
|
| August 1, 2017 through August 31, 2017 | 24,710 |
| | 86.24 |
| | — |
| | 50,000 |
|
| September 1, 2017 through September 30, 2017 | 3,644 |
| | 87.00 |
| | — |
| | 50,000 |
|
| Total | 28,354 |
| | $ | 86.34 |
| | — |
| | $ | 50,000 |
|
| |
(1) | In August 2010, our Board of Directors approved a stock repurchase program that authorized us to purchase up to $50.0 million of our outstanding shares of common stock. We have not made any repurchases under the program to date, and the program does not have an expiration date. |
(2)In November 2020, our Board of Directors reauthorized and expanded our stock repurchase program to authorize us to purchase up to $250.0 million of our outstanding shares of common stock. The program does not have an expiration date.
|
| | | | | | | |
42 | | ThirdSecond Quarter 20172021 Form 10-Q | | 45 |
ITEM 6. EXHIBITS
The exhibits listed below are filed or incorporated by reference as part of this Quarterly Report on Form 10-Q: |
| | | | | | | | | | | | | | | | | | | | | | | | | | | | | | | |
| | | | Filed In |
Exhibit
Number | | Description of Document | | Filed Herewith | | Form | | Exhibit Number | | Filing Date |
| | | | | | DEF 14A | | Appendix B | | 4/20/2021 |
| | | | X | | | | | | |
| | | | X | | | | | | |
| | | | X | | | | | | |
| | | | X | | | | | | |
101.INS*101.INS | | Inline XBRL Instance Document - the Instance Document does not appear in the interactive data file because its XBRL tags are embedded within the Inline XBRL Document. | | X | | | | | | |
101.SCH*101.SCH | | Inline XBRL Taxonomy Extension Schema Document. | | X | | | | | | |
101.CAL*101.CAL | | Inline XBRL Taxonomy Extension Calculation Linkbase Document. | | X | | | | | | |
101.DEF*101.DEF | | Inline XBRL Taxonomy Extension Definition Linkbase Document. | | X | | | | | | |
101.LAB*101.LAB | | Inline XBRL Taxonomy Extension Label Linkbase Document. | | X | | | | | | |
101.PRE*101.PRE | | Inline XBRL Taxonomy Extension Presentation Linkbase Document. | | X | | | | | | |
| 104 | | Cover Page Interactive Data File (formatted as Inline XBRL and contained in Exhibit 101). | | X | | | | | | |
* Pursuant to Rule 406T of Regulation S-T, the XBRL related information in Exhibit 101 to this Quarterly Report on Form 10-Q shall not be deemed “filed” for purposes of Section 18 of the Securities Exchange Act of 1934, as amended or otherwise subject to liability of that Section, and shall not be part of any registration statement or other document filed under the Securities Act of 1933, as amended or the Securities Exchange Act of 1934, as amended, except as shall be expressly set forth by specific reference in such filing.
|
| | | | | | | |
Third46 | | Second Quarter 20172021 Form 10-Q | | 43 |
Pursuant to the requirements of the Securities Exchange Act of 1934, the Registrant has duly caused this Report to be signed on its behalf by the undersigned thereunto duly authorized.
| | | | | | | | | | | |
| | BLACKBAUD, INC. |
| | | |
| Date: | August 6, 2021 | BLACKBAUD, INC. |
| By: | | | |
Date: | November 2, 2017 | By: | /s/ Michael P. Gianoni |
| | | Michael P. Gianoni |
| | | President and Chief Executive Officer |
| | | (Principal Executive Officer) |
| | | |
| Date: | November 2, 2017August 6, 2021 | By: | /s/ Anthony W. Boor |
| | | Anthony W. Boor |
| | | Executive Vice President and Chief Financial Officer |
| | | (Principal Financial and Accounting Officer) |
|
| | | | | | | |
44 | | ThirdSecond Quarter 20172021 Form 10-Q | | 47 |