UNITED STATES
SECURITIES AND EXCHANGE COMMISSION
Washington, D.C. 20549
FORM 10-Q
|
| | | | |
| ☑ | QUARTERLY REPORT PURSUANT TO SECTION 13 OR 15(d) OF THE SECURITIES EXCHANGE ACT OF 1934 |
For the quarterly period ended June 30, 2020March 31, 2021
or
|
| | | | |
| ☐ | TRANSITION REPORT PURSUANT TO SECTION 13 OR 15(d) OF THE SECURITIES EXCHANGE ACT OF 1934 |
For the transition period from to .
Commission file number: 000-50600
Blackbaud, Inc.
(Exact name of registrant as specified in its charter)
| | | | | |
| |
| Delaware | 11-2617163 |
Delaware | 11-2617163 |
| (State or other jurisdiction of incorporation or organization) | (I.R.S. Employer Identification No.) |
65 Fairchild Street
Charleston,, South Carolina29492
(Address of principal executive offices, including zip code)
(843) (843) 216-6200
(Registrant’s telephone number, including area code)
| | | | | | | | |
| | |
| | |
| Securities Registered Pursuant to Section 12(b) of the Act: |
| Title of Each Class | Trading Symbol(s) | Name of Each Exchange on which Registered |
| Common Stock, $0.001 Par Value | BLKB | Nasdaq Global Select Market |
| | |
Indicate by check mark whether the registrant (1) has filed all reports required to be filed by Section 13 or 15(d) of the Securities Exchange Act of 1934 during the preceding 12 months (or for such shorter period that the registrant was required to file such reports), and (2) has been subject to such filing requirements for the past 90 days.
Yes ☑ No ☐
Indicate by check mark whether the registrant has submitted electronically every Interactive Data File required to be submitted pursuant to Rule 405 of Regulation S-T (Section 232.405 of this chapter) during the preceding 12 months (or for such shorter period that the registrant was required to submit such files).
Yes ☑ No ☐
Indicate by check mark whether the registrant is a large accelerated filer, an accelerated filer, a non-accelerated filer, a smaller reporting company, or an emerging growth company. See the definitions of “large accelerated filer,” “accelerated filer,” “smaller reporting company,” and "emerging growth company" in Rule 12b-2 of the Exchange Act.
|
| | | | | | | | | | | | | |
| Large accelerated filer | ☑ | | Accelerated filer | ☐ |
| Non-accelerated filer | ☐ | | Smaller reporting company | ☐ |
| | | Emerging growth company | ☐ |
If an emerging growth company, indicate by check mark if the registrant has elected not to use the extended transition period for complying with any new or revised financial accounting standards provided pursuant to Section 13(a) of the Exchange Act. ☐
Indicate by check mark whether registrant is a shell company (as defined in Rule 12b-2 of the Exchange Act).
Yes ☐ No ☑
The number of shares of the registrant’s Common Stock outstanding as of July 29, 2020April 28, 2021 was 49,575,132.48,818,991.
TABLE OF CONTENTS
|
| | | | | | | |
SecondFirst Quarter 20202021 Form 10-Q | | 1 |
|
| | | | | | | |
| | CAUTIONARY STATEMENT REGARDING FORWARD-LOOKING STATEMENTS |
This Quarterly Report on Form 10-Q, including the documents incorporated herein by reference, contains forward-looking statements that anticipate results based on our estimates, assumptions and plans that are subject to uncertainty. These "forward-looking statements" are made subject to the safe-harbor provisions of the Private Securities Litigation Reform Act of 1995, Section 27A of the Securities Act of 1933, as amended, and Section 21E of the Securities Exchange Act of 1934, as amended. Forward-looking statements consist of, among other things, specific and overall impacts of the COVID-19 global pandemic on our financial condition and results of operations and on the markets and communities in which we and our customers and partners operate, trend analyses, statements regarding future events, future financial performance, our anticipated growth, the effect of general economic and market conditions, our business strategy and our plan to build and grow our business, our operating results, our ability to successfully integrate acquired businesses and technologies, the effect of foreign currency exchange rate and interest rate fluctuations on our financial results, the impact of expensing stock-based compensation, the sufficiency of our capital resources, our ability to meet our ongoing debt and obligations as they become due, cybersecurity and data protection risks, and potential litigation involving us, all of which are based on current expectations, estimates, and forecasts, and the beliefs and assumptions of our management. Words such as “believes,” “seeks,” “expects,” “may,” “might,” “should,” “intends,” “could,” “would,” “likely,” “will,” “targets,” “plans,” “anticipates,” “aims,” “projects,” “estimates” or any variations of such words and similar expressions are also intended to identify such forward-looking statements. These forward-looking statements are subject to risks, uncertainties and assumptions that are difficult to predict. Accordingly, they should not be viewed as assurances of future performance, and actual results may differ materially and adversely from those expressed in any forward-looking statements.
Important factors that could cause actual results to differ materially from our expectations expressed in forward-looking statements include, but are not limited to, those summarized under “Part II, Item 1A. Risk factors” and elsewhere in this report, in our Annual Report on Form 10-K for the year ended December 31, 20192020 and in our other SEC filings. Forward-looking statements represent our management's beliefs and assumptions only as of the date of this Quarterly Report on Form 10-Q. We undertake no obligation to update or revise any forward-looking statements, or to update the reasons actual results could differ materially from those anticipated in any forward-looking statement, whether as a result of new information, future events or otherwise.
|
| | | | | | | |
| 2 | | SecondFirst Quarter 20202021 Form 10-Q |
|
| | | | | | | |
| | PART I. FINANCIAL INFORMATION |
ITEM 1. FINANCIAL STATEMENTS
|
| | | | | | |
Blackbaud, Inc. Condensed Consolidated Balance Sheets (Unaudited) |
| (dollars in thousands) | June 30,
2020 |
| December 31,
2019 |
|
| Assets | | |
| Current assets: | | |
| Cash and cash equivalents | $ | 30,531 |
| $ | 31,810 |
|
| Restricted cash due to customers | 421,915 |
| 545,485 |
|
| Accounts receivable, net of allowance of $9,025 and $5,529 at June 30, 2020 and December 31, 2019, respectively | 129,675 |
| 88,868 |
|
| Customer funds receivable | 1,284 |
| 524 |
|
| Prepaid expenses and other current assets | 83,699 |
| 67,852 |
|
| Total current assets | 667,104 |
| 734,539 |
|
| Property and equipment, net | 36,539 |
| 35,546 |
|
| Operating lease right-of-use assets | 95,575 |
| 104,400 |
|
| Software development costs, net | 106,044 |
| 101,302 |
|
| Goodwill | 630,687 |
| 634,088 |
|
| Intangible assets, net | 292,187 |
| 317,895 |
|
| Other assets | 68,673 |
| 65,193 |
|
| Total assets | $ | 1,896,809 |
| $ | 1,992,963 |
|
| Liabilities and stockholders’ equity | | |
| Current liabilities: | | |
| Trade accounts payable | $ | 41,029 |
| $ | 47,676 |
|
| Accrued expenses and other current liabilities | 52,893 |
| 73,317 |
|
| Due to customers | 423,199 |
| 546,009 |
|
| Debt, current portion | 9,194 |
| 7,500 |
|
| Deferred revenue, current portion | 332,570 |
| 314,335 |
|
| Total current liabilities | 858,885 |
| 988,837 |
|
| Debt, net of current portion | 478,919 |
| 459,600 |
|
| Deferred tax liability | 45,108 |
| 44,594 |
|
| Deferred revenue, net of current portion | 4,626 |
| 1,802 |
|
| Operating lease liabilities, net of current portion | 86,586 |
| 95,624 |
|
| Other liabilities | 11,883 |
| 5,742 |
|
| Total liabilities | 1,486,007 |
| 1,596,199 |
|
| Commitments and contingencies (see Note 9) |
|
|
| Stockholders’ equity: | | |
| Preferred stock; 20,000,000 shares authorized, none outstanding | — |
| — |
|
| Common stock, $0.001 par value; 180,000,000 shares authorized, 60,901,100 and 60,206,091 shares issued at June 30, 2020 and December 31, 2019, respectively | 61 |
| 60 |
|
| Additional paid-in capital | 491,450 |
| 457,804 |
|
| Treasury stock, at cost; 11,332,912 and 11,066,354 shares at June 30, 2020 and December 31, 2019, respectively | (311,661 | ) | (290,665 | ) |
| Accumulated other comprehensive loss | (14,476 | ) | (5,290 | ) |
| Retained earnings | 245,428 |
| 234,855 |
|
| Total stockholders’ equity | 410,802 |
| 396,764 |
|
| Total liabilities and stockholders’ equity | $ | 1,896,809 |
| $ | 1,992,963 |
|
| | | |
| The accompanying notes are an integral part of these condensed consolidated financial statements. |
| | | | | | | | |
Blackbaud, Inc.
Condensed Consolidated Balance Sheets
(Unaudited) |
| (dollars in thousands) | March 31,
2021 | December 31,
2020 |
| Assets | | |
| Current assets: | | |
| Cash and cash equivalents | $ | 27,753 | | $ | 35,750 | |
| Restricted cash | 255,158 | | 609,219 | |
| Accounts receivable, net of allowance of $10,361 and $10,292 at March 31, 2021 and December 31, 2020, respectively | 83,333 | | 95,404 | |
| Customer funds receivable | 945 | | 321 | |
| Prepaid expenses and other current assets | 98,095 | | 78,366 | |
| Total current assets | 465,284 | | 819,060 | |
| Property and equipment, net | 105,124 | | 105,177 | |
| Operating lease right-of-use assets | 20,055 | | 22,671 | |
| Software development costs, net | 113,624 | | 111,827 | |
| Goodwill | 637,113 | | 635,854 | |
| Intangible assets, net | 269,118 | | 277,506 | |
| Other assets | 74,022 | | 72,639 | |
| Total assets | $ | 1,684,340 | | $ | 2,044,734 | |
| Liabilities and stockholders’ equity | | |
| Current liabilities: | | |
| Trade accounts payable | $ | 35,274 | | $ | 27,836 | |
| Accrued expenses and other current liabilities | 53,013 | | 52,228 | |
| Due to customers | 254,947 | | 608,264 | |
| Debt, current portion | 12,875 | | 12,840 | |
| Deferred revenue, current portion | 290,025 | | 312,236 | |
| Total current liabilities | 646,134 | | 1,013,404 | |
| Debt, net of current portion | 537,924 | | 518,193 | |
| Deferred tax liability | 54,444 | | 54,086 | |
| Deferred revenue, net of current portion | 4,495 | | 4,678 | |
| Operating lease liabilities, net of current portion | 15,744 | | 17,357 | |
| Other liabilities | 9,439 | | 10,866 | |
| Total liabilities | 1,268,180 | | 1,618,584 | |
| Commitments and contingencies (see Note 9) | 0 | 0 |
| Stockholders’ equity: | | |
| Preferred stock; 20,000,000 shares authorized, 0ne outstanding | 0 | | 0 | |
| Common stock, $0.001 par value; 180,000,000 shares authorized, 61,595,276 and 60,904,638 shares issued at March 31, 2021 and December 31, 2020, respectively | 62 | | 61 | |
| Additional paid-in capital | 574,958 | | 544,963 | |
| Treasury stock, at cost; 12,760,956 and 12,054,268 shares at March 31, 2021 and December 31, 2020, respectively | (399,583) | | (353,091) | |
| Accumulated other comprehensive income (loss) | 4,163 | | (2,497) | |
| Retained earnings | 236,560 | | 236,714 | |
| Total stockholders’ equity | 416,160 | | 426,150 | |
| Total liabilities and stockholders’ equity | $ | 1,684,340 | | $ | 2,044,734 | |
| | |
| The accompanying notes are an integral part of these condensed consolidated financial statements. |
|
| | | | | | | |
SecondFirst Quarter 20202021 Form 10-Q | | 3 |
|
| | | | | | | | | | | | | |
Blackbaud, Inc. Condensed Consolidated Statements of Comprehensive Income (Unaudited) |
| | Three months ended
June 30, | | | Six months ended
June 30, | |
| (dollars in thousands, except per share amounts) | 2020 |
| 2019 |
| | 2020 |
| 2019 |
|
| Revenue | | | | | |
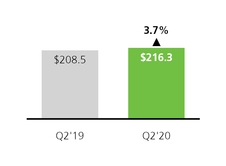
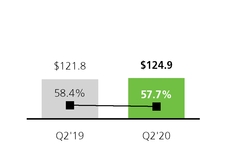
| Recurring | $ | 216,260 |
| $ | 208,468 |
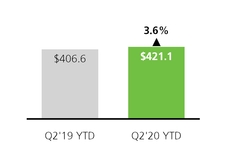
| | $ | 421,127 |
| $ | 406,562 |
|
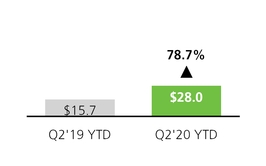
| One-time services and other | 15,731 |
| 17,166 |
| | 34,485 |
| 34,902 |
|
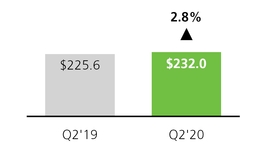
| Total revenue | 231,991 |
| 225,634 |
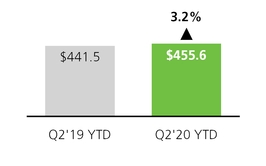
| | 455,612 |
| 441,464 |
|
| Cost of revenue | | | | | |
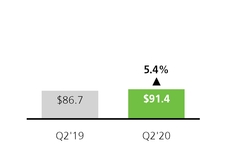
| Cost of recurring | 91,370 |
| 86,657 |
| | 180,921 |
| 171,368 |
|
| Cost of one-time services and other | 13,569 |
| 14,150 |
| | 28,883 |
| 28,722 |
|
| Total cost of revenue | 104,939 |
| 100,807 |
| | 209,804 |
| 200,090 |
|
| Gross profit | 127,052 |
| 124,827 |
| | 245,808 |
| 241,374 |
|
| Operating expenses | | | | | |
| Sales, marketing and customer success | 51,954 |
| 55,009 |
| | 110,689 |
| 110,464 |
|
| Research and development | 24,895 |
| 25,902 |
| | 49,872 |
| 54,363 |
|
| General and administrative | 29,842 |
| 28,543 |
| | 55,697 |
| 55,660 |
|
| Amortization | 729 |
| 1,152 |
| | 1,470 |
| 2,528 |
|
| Restructuring | 50 |
| 730 |
| | 74 |
| 2,683 |
|
| Total operating expenses | 107,470 |
| 111,336 |
| | 217,802 |
| 225,698 |
|
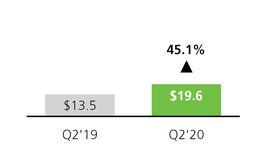
| Income from operations | 19,582 |
| 13,491 |
| | 28,006 |
| 15,676 |
|
| Interest expense | (3,893 | ) | (5,799 | ) | | (8,052 | ) | (11,122 | ) |
| Other income, net | 630 |
| 2,181 |
| | 1,700 |
| 2,363 |
|
| Income before provision for income taxes | 16,319 |
| 9,873 |
| | 21,654 |
| 6,917 |
|
| Income tax provision | 4,496 |
| 2,733 |
| | 5,192 |
| 899 |
|
| Net income | $ | 11,823 |
| $ | 7,140 |
| | $ | 16,462 |
| $ | 6,018 |
|
| Earnings per share | | | | | |
| Basic | $ | 0.25 |
| $ | 0.15 |
| | $ | 0.34 |
| $ | 0.13 |
|
| Diluted | $ | 0.24 |
| $ | 0.15 |
| | $ | 0.34 |
| $ | 0.13 |
|
| Common shares and equivalents outstanding | | | | | |
| Basic weighted average shares | 48,239,928 |
| 47,714,621 |
| | 48,138,125 |
| 47,622,740 |
|
| Diluted weighted average shares | 48,418,378 |
| 48,160,684 |
| | 48,465,077 |
| 48,101,212 |
|
| Other comprehensive loss | | | | | |
| Foreign currency translation adjustment | (887 | ) | (6,018 | ) | | (6,615 | ) | (1,428 | ) |
| Unrealized gain (loss) on derivative instruments, net of tax | 551 |
| (1,939 | ) | | (2,571 | ) | (2,871 | ) |
| Total other comprehensive loss | (336 | ) | (7,957 | ) | | (9,186 | ) | (4,299 | ) |
| Comprehensive income (loss) | $ | 11,487 |
| $ | (817 | ) | | $ | 7,276 |
| $ | 1,719 |
|
| | | | | | |
| The accompanying notes are an integral part of these condensed consolidated financial statements. |
| | | | | | | | | | | |
Blackbaud, Inc.
Condensed Consolidated Statements of Comprehensive Income
(Unaudited) |
| | | Three months ended
March 31, |
| (dollars in thousands, except per share amounts) | | | | 2021 | 2020 |
| Revenue | | | | | |
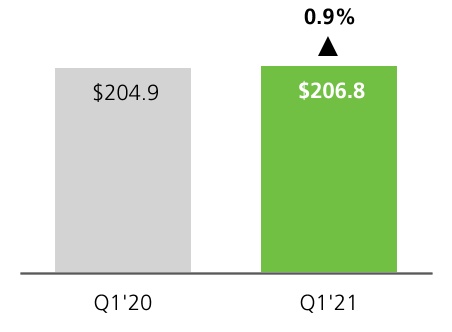
| Recurring | | | | $ | 206,750 | | $ | 204,867 | |
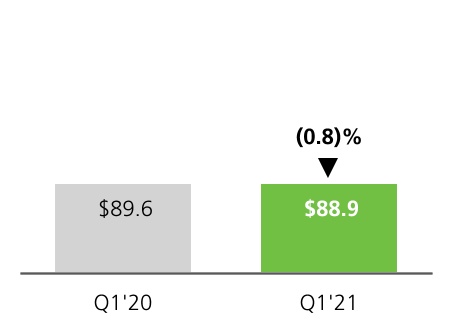
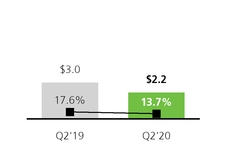
| One-time services and other | | | | 12,441 | | 18,754 | |
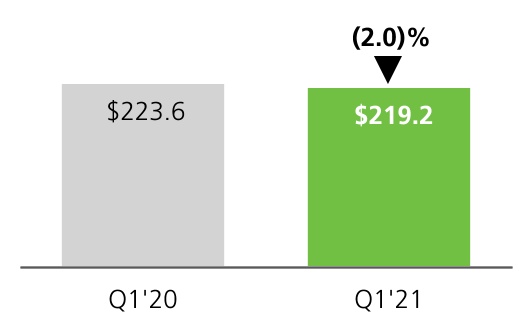
| Total revenue | | | | 219,191 | | 223,621 | |
| Cost of revenue | | | | | |
| Cost of recurring | | | | 88,865 | | 89,551 | |
| Cost of one-time services and other | | | | 14,520 | | 15,314 | |
| Total cost of revenue | | | | 103,385 | | 104,865 | |
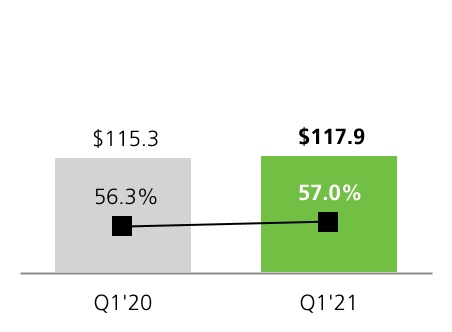
| Gross profit | | | | 115,806 | | 118,756 | |
| Operating expenses | | | | | |
| Sales, marketing and customer success | | | | 48,793 | | 58,735 | |
| Research and development | | | | 29,179 | | 24,977 | |
| General and administrative | | | | 30,587 | | 25,855 | |
| Amortization | | | | 549 | | 741 | |
| Restructuring | | | | 54 | | 24 | |
| Total operating expenses | | | | 109,162 | | 110,332 | |
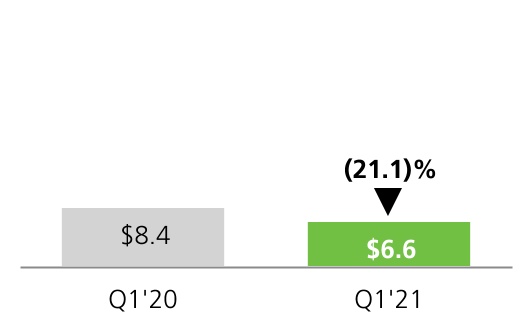
| Income from operations | | | | 6,644 | | 8,424 | |
| Interest expense | | | | (5,114) | | (4,159) | |
| Other (expense) income, net | | | | (1,010) | | 1,070 | |
| Income before provision for income taxes | | | | 520 | | 5,335 | |
| Income tax provision | | | | 684 | | 696 | |
| Net (loss) income | | | | $ | (164) | | $ | 4,639 | |
| Earnings (loss) per share | | | | | |
| Basic | | | | $ | 0 | | $ | 0.10 | |
| Diluted | | | | $ | 0 | | $ | 0.10 | |
| Common shares and equivalents outstanding | | | | | |
| Basic weighted average shares | | | | 47,363,197 | | 48,036,300 | |
| Diluted weighted average shares | | | | 47,363,197 | | 48,455,751 | |
| Other comprehensive income (loss) | | | | | |
| Foreign currency translation adjustment | | | | 2,511 | | (5,728) | |
| Unrealized gain (loss) on derivative instruments, net of tax | | | | 4,149 | | (3,122) | |
| Total other comprehensive income (loss) | | | | 6,660 | | (8,850) | |
| Comprehensive income (loss) | | | | $ | 6,496 | | $ | (4,211) | |
| | | | | |
| The accompanying notes are an integral part of these condensed consolidated financial statements. |
|
| | | | | | | |
| 4 | | SecondFirst Quarter 20202021 Form 10-Q |
| | Blackbaud, Inc. Condensed Consolidated Statements of Cash Flows (Unaudited) | Blackbaud, Inc. Condensed Consolidated Statements of Cash Flows (Unaudited) | Blackbaud, Inc.
Condensed Consolidated Statements of Cash Flows
(Unaudited) |
| | Six months ended
June 30, | | | Three months ended
March 31, |
| (dollars in thousands) | 2020 |
| 2019 |
| (dollars in thousands) | 2021 | 2020 |
| Cash flows from operating activities | | Cash flows from operating activities | |
| Net income | $ | 16,462 |
| $ | 6,018 |
| |
| Adjustments to reconcile net income to net cash provided by operating activities: | | |
| Net (loss) income | | Net (loss) income | $ | (164) | | $ | 4,639 | |
| Adjustments to reconcile net (loss) income to net cash provided by (used in) operating activities: | | Adjustments to reconcile net (loss) income to net cash provided by (used in) operating activities: | |
| Depreciation and amortization | 46,088 |
| 43,113 |
| Depreciation and amortization | 20,461 | | 21,804 | |
| Provision for credit losses and sales returns | 6,677 |
| 4,646 |
| Provision for credit losses and sales returns | 2,141 | | 2,488 | |
| Stock-based compensation expense | 33,713 |
| 28,755 |
| Stock-based compensation expense | 30,005 | | 13,580 | |
| Deferred taxes | 1,945 |
| 465 |
| Deferred taxes | (1,142) | | 954 | |
| Amortization of deferred financing costs and discount | 376 |
| 376 |
| Amortization of deferred financing costs and discount | 506 | | 188 | |
| Other non-cash adjustments | 477 |
| 1,982 |
| Other non-cash adjustments | (32) | | 102 | |
| Changes in operating assets and liabilities, net of acquisition and disposal of businesses: | | Changes in operating assets and liabilities, net of acquisition and disposal of businesses: | |
| Accounts receivable | (48,167 | ) | (45,071 | ) | Accounts receivable | 10,407 | | (3,876) | |
| Prepaid expenses and other assets | (7,068 | ) | (12,725 | ) | Prepaid expenses and other assets | (17,426) | | (5,303) | |
| Trade accounts payable | (8,984 | ) | 216 |
| Trade accounts payable | 7,550 | | (4,021) | |
| Accrued expenses and other liabilities | (26,520 | ) | (9,014 | ) | Accrued expenses and other liabilities | 549 | | (31,694) | |
| Deferred revenue | 22,489 |
| 26,328 |
| Deferred revenue | (22,752) | | (23,364) | |
| Net cash provided by operating activities | 37,488 |
| 45,089 |
| |
| Net cash provided by (used in) operating activities | | Net cash provided by (used in) operating activities | 30,103 | | (24,503) | |
| Cash flows from investing activities | | Cash flows from investing activities | |
| Purchase of property and equipment | (5,887 | ) | (6,375 | ) | Purchase of property and equipment | (3,470) | | (2,867) | |
| Capitalized software development costs | (21,679 | ) | (23,206 | ) | Capitalized software development costs | (9,302) | | (10,937) | |
| Purchase of net assets of acquired companies, net of cash and restricted cash acquired | — |
| (109,386 | ) | |
| Other investing activities | — |
| 500 |
| |
| | Net cash used in investing activities | (27,566 | ) | (138,467 | ) | Net cash used in investing activities | (12,772) | | (13,804) | |
| Cash flows from financing activities | | Cash flows from financing activities | |
| Proceeds from issuance of debt | 202,100 |
| 329,100 |
| Proceeds from issuance of debt | 80,700 | | 144,700 | |
| Payments on debt | (185,250 | ) | (155,150 | ) | Payments on debt | (59,667) | | (86,075) | |
| | Employee taxes paid for withheld shares upon equity award settlement | (20,996 | ) | (19,760 | ) | Employee taxes paid for withheld shares upon equity award settlement | (18,426) | | (19,782) | |
| Proceeds from exercise of stock options | 4 |
| 6 |
| Proceeds from exercise of stock options | 0 | | 1 | |
| Change in due to customers | (121,612 | ) | (107,808 | ) | Change in due to customers | (353,597) | | (311,095) | |
| Change in customer funds receivable | (828 | ) | (3,741 | ) | Change in customer funds receivable | (563) | | (733) | |
| Purchase of treasury stock | | Purchase of treasury stock | (28,066) | | 0 | |
| Dividend payments to stockholders | (5,960 | ) | (11,802 | ) | Dividend payments to stockholders | 0 | | (5,960) | |
| Net cash (used in) provided by financing activities | (132,542 | ) | 30,845 |
| |
| Net cash used in financing activities | | Net cash used in financing activities | (379,619) | | (278,944) | |
| Effect of exchange rate on cash, cash equivalents and restricted cash | (2,229 | ) | (526 | ) | Effect of exchange rate on cash, cash equivalents and restricted cash | 230 | | (2,822) | |
| Net decrease in cash, cash equivalents and restricted cash | (124,849 | ) | (63,059 | ) | Net decrease in cash, cash equivalents and restricted cash | (362,058) | | (320,073) | |
| Cash, cash equivalents and restricted cash, beginning of period | 577,295 |
| 449,846 |
| Cash, cash equivalents and restricted cash, beginning of period | 644,969 | | 577,295 | |
| Cash, cash equivalents and restricted cash, end of period | $ | 452,446 |
| $ | 386,787 |
| Cash, cash equivalents and restricted cash, end of period | $ | 282,911 | | $ | 257,222 | |
The following table provides a reconciliation of cash and cash equivalents and restricted cash reported within the condensed consolidated balance sheets that sum to the total of the same such amounts shown above in the condensed consolidated statements of cash flows:
| | | | | | | | |
| (dollars in thousands) | March 31,
2021 | December 31,
2020 |
| Cash and cash equivalents | $ | 27,753 | | $ | 35,750 | |
| Restricted cash | 255,158 | | 609,219 | |
| Total cash, cash equivalents and restricted cash in the statement of cash flows | $ | 282,911 | | $ | 644,969 | |
| | |
| The accompanying notes are an integral part of these condensed consolidated financial statements. |
|
| | | | | | |
| (dollars in thousands) | June 30,
2020 |
| December 31,
2019 |
|
| Cash and cash equivalents | $ | 30,531 |
| $ | 31,810 |
|
| Restricted cash due to customers | 421,915 |
| 545,485 |
|
| Total cash, cash equivalents and restricted cash in the statement of cash flows | $ | 452,446 |
| $ | 577,295 |
|
| | | |
| The accompanying notes are an integral part of these condensed consolidated financial statements. |
|
| | | | | | | |
SecondFirst Quarter 20202021 Form 10-Q | | 5 |
Blackbaud, Inc.
Condensed Consolidated Statements of Stockholders' Equity
(Unaudited)
| | | | | | | | | | | | | | | | | | | | | | | |
| (dollars in thousands) | Common stock | Additional
paid-in
capital | Treasury
stock | Accumulated
other
comprehensive
income (loss) | Retained
earnings | Total
stockholders'
equity |
| Shares | Amount |
| Balance at December 31, 2020 | 60,904,638 | | $ | 61 | | $ | 544,963 | | $ | (353,091) | | $ | (2,497) | | $ | 236,714 | | $ | 426,150 | |
| Net loss | — | | — | | — | | — | | — | | (164) | | (164) | |
| | | | | | | |
| Purchase of 465,821 treasury shares under stock repurchase program | — | | — | | — | | (28,066) | | — | | — | | (28,066) | |
| Vesting of restricted stock units | 206,418 | | — | | 0 | | — | | — | | — | | 0 | |
| Employee taxes paid for 240,867 withheld shares upon equity award settlement | — | | — | | — | | (18,426) | | — | | — | | (18,426) | |
| Stock-based compensation | — | | — | | 29,995 | | — | | — | | 10 | | 30,005 | |
| Restricted stock grants | 519,009 | | 1 | | — | | — | | — | | — | | 1 | |
| Restricted stock cancellations | (34,789) | | — | | — | | — | | — | | — | | — | |
| Other comprehensive income | — | | — | | — | | — | | 6,660 | | — | | 6,660 | |
| Balance at March 31, 2021 | 61,595,276 | | $ | 62 | | $ | 574,958 | | $ | (399,583) | | $ | 4,163 | | $ | 236,560 | | $ | 416,160 | |
| | | | | | | |
| | | | | | | |
| | | | | | | |
| | | | | | | |
| | | | | | | |
| | | | | | | |
| | | | | | | |
| | | | | | | |
| | | | | | | |
| | | | | | | |
| | | | | | | |
| | | | | | | |
| | | | | | | |
| | | | | | | |
| | | | | | | |
| | | | | | | |
| | | | | | | |
| | | | | | | |
| | | | | | | |
| | | | | | | |
| | | | | | | |
|
| | | (dollars in thousands) | Common stock | | Additional paid-in capital |
| Treasury stock |
| Accumulated other comprehensive income (loss) |
| Retained earnings |
| Total stockholders' equity |
| (dollars in thousands) | Common stock | Additional
paid-in
capital | Treasury
stock | Accumulated
other
comprehensive
income (loss) | Retained
earnings | Total
stockholders'
equity |
| Shares |
| Amount |
| Shares | Amount |
| Balance at December 31, 2019 | 60,206,091 |
| $ | 60 |
| $ | 457,804 |
| $ | (290,665 | ) | $ | (5,290 | ) | $ | 234,855 |
| $ | 396,764 |
| Balance at December 31, 2019 | 60,206,091 | | $ | 60 | | $ | 457,804 | | $ | (290,665) | | $ | (5,290) | | $ | 234,855 | | $ | 396,764 | |
| Net income | — |
| — |
| — |
| — |
| — |
| 4,639 |
| 4,639 |
| Net income | — | | — | | — | | — | | — | | 4,639 | | 4,639 | |
| Payment of dividends ($0.12 per share) | — |
| — |
| — |
| — |
| — |
| (5,960 | ) | (5,960 | ) | Payment of dividends ($0.12 per share) | — | | — | | — | | — | | — | | (5,960) | | (5,960) | |
| Exercise of stock options and vesting of restricted stock units | 210,057 |
| — |
| 1 |
| — |
| — |
| — |
| 1 |
| Exercise of stock options and vesting of restricted stock units | 210,057 | | — | | 1 | | — | | — | | — | | 1 | |
| Employee taxes paid for 245,358 withheld shares upon equity award settlement | — |
| — |
| — |
| (19,782 | ) | — |
| — |
| (19,782 | ) | Employee taxes paid for 245,358 withheld shares upon equity award settlement | — | | — | | — | | (19,782) | | — | | — | | (19,782) | |
| Stock-based compensation | — |
| — |
| 13,539 |
| — |
| — |
| 41 |
| 13,580 |
| Stock-based compensation | — | | — | | 13,539 | | — | | — | | 41 | | 13,580 | |
| Restricted stock grants | 563,947 |
| 1 |
| — |
| — |
| — |
| — |
| 1 |
| Restricted stock grants | 563,947 | | 1 | | — | | — | | — | | — | | 1 | |
| Restricted stock cancellations | (47,456 | ) | — |
| — |
| — |
| — |
| — |
| — |
| Restricted stock cancellations | (47,456) | | — | | — | | — | | — | | — | | — | |
| Other comprehensive loss | — |
| — |
| — |
| — |
| (8,850 | ) | — |
| (8,850 | ) | Other comprehensive loss | — | | — | | — | | — | | (8,850) | | — | | (8,850) | |
| Balance at March 31, 2020 | 60,932,639 |
| $ | 61 |
| $ | 471,344 |
| $ | (310,447 | ) | $ | (14,140 | ) | $ | 233,575 |
| $ | 380,393 |
| Balance at March 31, 2020 | 60,932,639 | | $ | 61 | | $ | 471,344 | | $ | (310,447) | | $ | (14,140) | | $ | 233,575 | | $ | 380,393 | |
| Net income | — |
| — |
| — |
| — |
| — |
| 11,823 |
| 11,823 |
| |
| Exercise of stock options and vesting of restricted stock units | 7,111 |
| — |
| 3 |
| — |
| — |
| — |
| 3 |
| |
| Employee taxes paid for 21,200 withheld shares upon equity award settlement | — |
| — |
| — |
| (1,214 | ) | — |
| — |
| (1,214 | ) | |
| Stock-based compensation | — |
| — |
| 20,103 |
| — |
| — |
| 30 |
| 20,133 |
| |
| Restricted stock grants | 20,776 |
| — |
| — |
| — |
| — |
| — |
| — |
| |
| Restricted stock cancellations | (59,426 | ) | — |
| — |
| — |
| — |
| — |
| — |
| |
| Other comprehensive loss | — |
| — |
| — |
| — |
| (336 | ) | — |
| (336 | ) | |
| Balance at June 30, 2020 | 60,901,100 |
| $ | 61 |
| $ | 491,450 |
| $ | (311,661 | ) | $ | (14,476 | ) | $ | 245,428 |
| $ | 410,802 |
| |
| | | | |
| | | |
| | | The accompanying notes are an integral part of these condensed consolidated financial statements. | | The accompanying notes are an integral part of these condensed consolidated financial statements. |
|
| | | | | | | |
| 6 | | SecondFirst Quarter 20202021 Form 10-Q |
Blackbaud, Inc.
Condensed Consolidated statements of stockholders' equity (continued)
(Unaudited)
|
| | | | | | | | | | | | | | | | | | | | |
| (dollars in thousands) | Common stock | | Additional paid-in capital |
| Treasury stock |
| Accumulated other comprehensive income (loss) |
| Retained earnings |
| Total stockholders' equity |
|
| Shares |
| Amount |
|
| Balance at December 31, 2018 | 59,327,633 |
| $ | 59 |
| $ | 399,241 |
| $ | (266,884 | ) | $ | (5,110 | ) | $ | 246,477 |
| $ | 373,783 |
|
| Net loss | — |
| — |
| — |
| — |
| — |
| (1,122 | ) | (1,122 | ) |
| Payment of dividends ($0.12 per share) | — |
| — |
| — |
| — |
| — |
| (5,901 | ) | (5,901 | ) |
| Exercise of stock options and stock appreciation rights and vesting of restricted stock units | 234,453 |
| — |
| 3 |
| — |
| — |
| — |
| 3 |
|
| Employee taxes paid for 239,311 withheld shares upon equity award settlement | — |
| — |
| — |
| (18,400 | ) | — |
| — |
| (18,400 | ) |
| Stock-based compensation | — |
| — |
| 13,693 |
| — |
| — |
| 33 |
| 13,726 |
|
| Restricted stock grants | 663,906 |
| 1 |
| — |
| — |
| — |
| — |
| 1 |
|
| Restricted stock cancellations | (43,314 | ) | — |
| — |
| — |
| — |
| — |
| — |
|
| Other comprehensive income | — |
| — |
| — |
| — |
| 3,658 |
| — |
| 3,658 |
|
| Balance at March 31, 2019 | 60,182,678 |
| $ | 60 |
| $ | 412,937 |
| $ | (285,284 | ) | $ | (1,452 | ) | $ | 239,487 |
| $ | 365,748 |
|
| Net income | — |
| — |
| — |
| — |
| — |
| 7,140 |
| 7,140 |
|
| Payment of dividends ($0.12 per share) | — |
| — |
| — |
| — |
| — |
| (5,901 | ) | (5,901 | ) |
| Exercise of stock options and stock appreciation rights and vesting of restricted stock units | 21,726 |
| — |
| 3 |
| — |
| — |
| — |
| 3 |
|
| Employee taxes paid for 17,119 withheld shares upon equity award settlement | — |
| — |
| — |
| (1,360 | ) | — |
| — |
| (1,360 | ) |
| Stock-based compensation | — |
| — |
| 15,010 |
| — |
| — |
| 19 |
| 15,029 |
|
| Restricted stock grants | 12,405 |
| — |
| — |
| — |
| — |
| — |
| — |
|
| Restricted stock cancellations | (29,746 | ) | — |
| — |
| — |
| — |
| — |
| — |
|
| Other comprehensive loss | — |
| — |
| — |
| — |
| (7,957 | ) | — |
| (7,957 | ) |
| Balance at June 30, 2019 | 60,187,063 |
| $ | 60 |
| $ | 427,950 |
| $ | (286,644 | ) | $ | (9,409 | ) | $ | 240,745 |
| $ | 372,702 |
|
| | | | | | | | |
| The accompanying notes are an integral part of these condensed consolidated financial statements. |
|
| | |
Second Quarter 2020 Form 10-Q | | 7 |
Blackbaud, Inc.
Notes to Condensed Consolidated Financial Statements
(Unaudited)
We are the world’s leading cloud software company powering social good. Serving the entire social good community—nonprofits, higher education institutions, K–12 schools, healthcare organizations, faith communities, arts and cultural organizations, foundations, companies and individual change agents—we connect and empower organizations to increase their impact through cloud software, services, expertise and data intelligence. Our portfolio is tailored to the unique needs of vertical markets, with solutions for fundraising and CRM, marketing, advocacy, peer-to-peer fundraising, corporate social responsibility, school management, ticketing, grantmaking, financial management, payment processing and analytics. Serving the industry for more than threenearly four decades, we are headquartered in Charleston, South Carolina, and have operations in the United States, Australia, Canada, Costa Rica and the United Kingdom.
Unaudited condensed consolidated interim financial statements
The accompanying condensed consolidated interim financial statements have been prepared pursuant to the rules and regulations of the United States Securities and Exchange Commission ("SEC") for interim financial reporting. These consolidated statements are unaudited and, in the opinion of management, include all adjustments (consisting of normal recurring adjustments and accruals) necessary to state fairly the consolidated balance sheets, consolidated statements of comprehensive income, consolidated statements of cash flows and consolidated statements of stockholders’ equity, for the periods presented in accordance with accounting principles generally accepted in the United States ("U.S.") ("GAAP"). The consolidated balance sheet at December 31, 20192020 has been derived from the audited consolidated financial statements at that date. Operating results and cash flows for the sixthree months ended June 30, 2020March 31, 2021 are not necessarily indicative of the results that may be expected for the fiscal year ending December 31, 2020,2021, or any other future period. Certain information and footnote disclosures normally included in annual financial statements prepared in accordance with GAAP have been omitted in accordance with the rules and regulations for interim reporting of the SEC. These condensed consolidated interim financial statements should be read in conjunction with the consolidated financial statements and notes thereto included in our Annual Report on Form 10-K for the year ended December 31, 2019,2020, and other forms filed with the SEC from time to time.
Basis of consolidation
The condensed consolidated financial statements include the accounts of Blackbaud, Inc. and its wholly owned subsidiaries. All intercompany balances and transactions have been eliminated in consolidation.
Reportable segment
We report our operating results and financial information in one operating and reportable segment. Our chief operating decision maker uses consolidated financial information to make operating decisions, assess financial performance and allocate resources. Our chief operating decision maker is our chief executive officer ("CEO").
Risks and uncertainties
Impact of related to COVID-19
We are subject to risks and uncertainties as a result of the global COVID-19 pandemic. We expectbelieve that COVID-19 willmay continue to impact all of our vertical markets across all of ourand geographies, to some degree, but the significance and duration of the impact on our business cannot be determined at this time due to numerous uncertainties, including the ultimate geographic spread of the disease, the duration of the outbreak, travel restrictions and business closures, the effectiveness of vaccination programs and other actions taken to contain the disease and other unforeseeable consequences.
|
| | | | | | | |
8First Quarter 2021 Form 10-Q | | Second Quarter 2020 Form 10-Q7 |
Blackbaud, Inc.
Notes to Condensed Consolidated Financial Statements (Continued)
(Unaudited)
The preparation of financial statements in conformity with GAAP requires management to make estimates and assumptions that affect the reported amounts of assets and liabilities and disclosure of contingent assets and liabilities at the date of the financial statements, as well as the reported amounts of revenues and expenses during the reporting periods. On an ongoing basis, we reconsider and evaluate our estimates and assumptions, including those that impact revenue recognition, long-lived and intangible assets, income taxes, business combinations, stock-based compensation, capitalization of software development costs, our allowances for credit losses and sales returns, costs of obtaining contracts, valuation of derivative instruments and loss contingencies, among others. Changes in the facts or circumstances underlying these estimates, including due to COVID-19, could result in material changes and actual results could materially differ from these estimates.
Response to COVID-19
To better enable us to weather the extraordinary business challenges brought about by the global COVID-19 pandemic, to protect the safety and welfare of our employees, and to further effect our long-term strategy to deliver the greatest value to our stockholders, we have taken several actions. These initial measures taken are expected to provide us the financial flexibility needed to manage a wide array of outcomes that may result from the pandemic. Some of these actions include the following:
Temporarily closed our offices worldwide and transitioned our employees to work remotely;
| |
• | Rescinded our previously announced policy to pay an annual dividend at a rate of $0.48 per share of common stock and discontinued the declaration and payment of all cash dividends, beginning with the second quarter of 2020 and thereafter until such time, if any, as our Board of Directors may otherwise determine in its sole discretion;
|
| |
• | Temporarily suspended our 401(k)-match program, whereby we have historically matched 50% of qualified U.S. employees' contributions to our 401(k) plan up to 6% of their salaries, effective with the payroll period commencing April 1, 2020;
|
Temporarily froze our hiring efforts and implemented a modest and targeted headcount reduction, though we have since began backfilling sales positions;
Michael Gianoni, our President and Chief Executive Officer, elected to forego receipt of all but that portion of his base salary necessary to fund, on a pre-tax basis, his contributions to continue to participate in our health benefits plan, between April 1, 2020 and June 16, 2020;
Restricted non-essential employee travel and put in place other operating cost containment actions;
| |
• | All of our employees with a base salary equal to or less than $75 thousand received financial support in the form of a one-time bonus of $1 thousand on April 30, 2020;
|
| |
• | On May 1, 2020, we granted restricted stock units with a total grant date fair value of $8.3 million to our employees that were eligible for base salary merit increases in lieu of such increases, which will vest on May 1, 2021 subject to the recipient's continued employment with us;
|
| |
• | On May 1, 2020, we granted performance-based restricted stock units with a total grant date fair value of $34.4 million to our employees that were eligible for a 2020 cash bonus plan in lieu of such cash bonus, which may be earned and become eligible for vesting on May 1, 2021 subject to meeting certain performance conditions and the recipient's continued employment with us.
|
Recently adopted accounting pronouncements
In June 2016, the Financial Accounting Standards Board (“FASB”) issued Accounting Standards Update (“ASU”) 2016-13, Financial Instruments-Credit Losses (Topic 326): Measurement of Credit Losses on Financial Instruments (“ASU 2016-13”). ASU 2016-13 requires certain types of financial instruments, including trade receivables, to be presented at the net amount expected to be collected based on historical events, current conditions and forward-looking information. We adopted ASU 2016-13 as of the January 1, 2020 effective date and the adoption did not have a material impact on our consolidated financial statements.
In August 2018, the FASB issued ASU 2018-15, Intangibles-Goodwill and Other-Internal-Use Software (Subtopic 350-40): Customer’s Accounting for Implementation Costs Incurred in a Cloud Computing Arrangement That Is a Service Contract (“ASU 2018-15”). ASU 2018-15 aligns the accounting for implementation costs related to a hosting arrangement that is a service contract with the guidance on capitalizing costs associated with developing or obtaining internal-use software. We adopted ASU 2018-15 prospectively as of the January 1, 2020 effective date and the adoption did not have a material impact on our consolidated financial statements.
|
| | |
Second Quarter 2020 Form 10-Q | | 9 |
Blackbaud, Inc.
Notes to Condensed Consolidated Financial Statements (Continued)
(Unaudited)
Recently issued accounting pronouncements
There are no recently issued accounting pronouncements that are expectedwe expect to have a material impact on our consolidated financial position or results of operationsstatements when adopted in the future.
Summary of significant accounting policies
Except for the accounting policies for allowance for credit losses and allowance for sales returns below that were updated as a result of adopting ASU 2016-13, thereThere have been no new or material changes to our significant accounting policies described in our Annual Report on Form 10-K for the year ended December 31, 2019,2020, filed with the SEC on February 20, 2020.23, 2021.
Allowance for credit losses
Our accounts receivable consist of a single portfolio segment. Accounts receivable are recorded at original invoice amounts less an allowance for credit losses, an amount we estimate to be sufficient to provide adequate protection against lifetime expected losses resulting from extending credit to our customers. In judging the adequacy of the allowance for credit losses, we consider multiple factors including historical bad debt experience, the current aging of our receivables and current economic conditions that may affect our customers' ability to pay. A considerable amount of judgment is required in assessing these factors and if any receivables were to deteriorate, an additional provision for credit losses could be required. Accounts are written off after all means of collection are exhausted and recovery is considered remote. Provisions for credit losses are recorded in general and administrative expense.
Below is a summary of the changes in our allowance for credit losses.
|
| | | | | | | | | | | | | | | |
| (in thousands) | Balance at beginning of year (1) |
| Provision/ adjustment |
| Write-off |
| Recovery |
| Balance at June 30, 2020 |
|
| 2020 | $ | 4,011 |
| $ | 3,708 |
| $ | (554 | ) | $ | 243 |
| $ | 7,408 |
|
| |
(1) | Upon adoption of ASU 2016-13 at January 1, 2020, we reclassified certain balances previously disclosed within the allowance for sales returns to the allowance for credit losses, as these amounts reflect the credit risk associated with our accounts receivable. |
The increase in our allowance for credit losses during the six months ended June 30, 2020 was primarily due to an increase in the aging of our receivables and observed changes in some of our customers' payment behavior associated with the COVID-19 pandemic. The increase in the amount of write-offs during the six months ended June 30, 2020 was insignificant.
Allowance for sales returns
We maintain a reserve for returns and credits which is estimated based on several factors including historical experience, known credits yet to be issued, the aging of customer accounts and the nature of service level commitments. A considerable amount of judgment is required in assessing these factors. Provisions for sales returns and credits are charged against the related revenue items.
Below is a summary of the changes in our allowance for sales returns.
|
| | | | | | | | | | | | |
| (in thousands) | Balance at
beginning of year (1) |
| Provision/ adjustment |
| Deduction |
| Balance at June 30, 2020 |
|
| 2020 | $ | 1,518 |
| $ | 2,969 |
| $ | (2,870 | ) | $ | 1,617 |
|
| |
(1) | As discussed above, we reclassified certain balances previously disclosed within the allowance for sales returns to the allowance for credit losses upon adoption of ASU 2016-13 at January 1, 2020. |
|
| | |
10 | | Second Quarter 2020 Form 10-Q |
Blackbaud, Inc.
Notes to Condensed Consolidated Financial Statements (Continued)
(Unaudited)
|
|
| 3. Goodwill and Other Intangible Assets |
The change in goodwill during the sixthree months ended June 30, 2020,March 31, 2021, consisted of the following:
|
| | | |
| (dollars in thousands) | Total |
| Balance at December 31, 2019 | $ | 634,088 |
|
| Effect of foreign currency translation | (3,401 | ) |
| Balance at June 30, 2020 | $ | 630,687 |
|
| | | | | |
| (dollars in thousands) | Total |
| Balance at December 31, 2020 | $ | 635,854 | |
| |
| |
| Effect of foreign currency translation | 1,259 | |
| Balance at March 31, 2021 | $ | 637,113 | |
| | |
| 4. Earnings (Loss) Per Share |
We compute basic earnings (loss) per share by dividing net income available to common stockholders by the weighted average number of common shares outstanding during the period. Diluted earnings (loss) per share is computed by dividing net income available to common stockholders by the weighted average number of common shares and dilutive potential common shares outstanding during the period. Diluted earnings (loss) per share reflect the assumed exercise, settlement and vesting of all dilutive securities using the “treasury stock method” except when the effect is anti-dilutive. Potentially dilutive securities consist of shares issuable upon the exercise of stock options, settlement of stock appreciation rights and vesting of restricted stock awards and units. Diluted loss per share for the three months ended March 31, 2021 was the same as basic loss per share as there was a net loss in the period and inclusion of potentially dilutive securities was anti-dilutive.
| | | | | | | | |
| 8 | | First Quarter 2021 Form 10-Q |
Blackbaud, Inc.
Notes to Condensed Consolidated Financial Statements (Continued)
(Unaudited)
The following table sets forth the computation of basic and diluted earnings (loss) per share:
|
| | | | | | | | | | | | | |
| | Three months ended
June 30, | | | Six months ended
June 30, | |
| (dollars in thousands, except per share amounts) | 2020 |
| 2019 |
| | 2020 |
| 2019 |
|
| Numerator: | | | | | |
| Net income | $ | 11,823 |
| $ | 7,140 |
| | $ | 16,462 |
| $ | 6,018 |
|
| Denominator: | | | | | |
| Weighted average common shares | 48,239,928 |
| 47,714,621 |
| | 48,138,125 |
| 47,622,740 |
|
| Add effect of dilutive securities: | | | | | |
| Stock-based awards | 178,450 |
| 446,063 |
| | 326,952 |
| 478,472 |
|
| Weighted average common shares assuming dilution | 48,418,378 |
| 48,160,684 |
| | 48,465,077 |
| 48,101,212 |
|
| Earnings per share: | | | | | |
| Basic | $ | 0.25 |
| $ | 0.15 |
| | $ | 0.34 |
| $ | 0.13 |
|
| Diluted | $ | 0.24 |
| $ | 0.15 |
| | $ | 0.34 |
| $ | 0.13 |
|
| | | | | | |
| Anti-dilutive shares excluded from calculations of diluted earnings per share | 1,484,976 |
| 245,060 |
| | 1,329,519 |
| 748,743 |
|
| | | | | | | | | | | |
| | | | Three months ended March 31, |
| (dollars in thousands, except per share amounts) | | | | 2021 | 2020 |
| Numerator: | | | | | |
| Net (loss) income | | | | $ | (164) | | $ | 4,639 | |
| Denominator: | | | | | |
| Weighted average common shares | | | | 47,363,197 | | 48,036,300 | |
| Add effect of dilutive securities: | | | | | |
| Stock-based awards | | | | 0 | | 419,451 | |
| Weighted average common shares assuming dilution | | | | 47,363,197 | | 48,455,751 | |
| Earnings (loss) per share: | | | | | |
| Basic | | | | $ | 0 | | $ | 0.10 | |
| Diluted | | | | $ | 0 | | $ | 0.10 | |
| | | | | |
| Anti-dilutive shares excluded from calculations of diluted earnings (loss) per share | | | | 1,360,378 | | 1,170,289 | |
|
| | |
Second Quarter 2020 Form 10-Q | | 11 |
Blackbaud, Inc.
Notes to Condensed Consolidated Financial Statements (Continued)
(Unaudited)
|
|
| 5. Fair Value Measurements |
We use a three-tier fair value hierarchy to measure fair value. This hierarchy prioritizes the inputs into three broad levels as follows:
•Level 1 - Quoted prices for identical assets or liabilities in active markets;
•Level 2 - Quoted prices for similar assets and liabilities in active markets, quoted prices for identical or similar assets in markets that are not active, and model-derived valuations in which all significant inputs and significant value drivers are observable in active markets; and
•Level 3 - Valuations derived from valuation techniques in which one or more significant inputs are unobservable.
| | | | | | | | |
| First Quarter 2021 Form 10-Q | | 9 |
Blackbaud, Inc.
Notes to Condensed Consolidated Financial Statements (Continued)
(Unaudited)
Recurring fair value measurements
Assets and liabilities that are measured at fair value on a recurring basis consisted of the following, as of the dates indicated below:
|
| | | | | | | | | | | | | | | |
| | Fair value measurement using | | |
| (dollars in thousands) | Level 1 |
| | Level 2 |
| | Level 3 |
| | Total |
|
| Fair value as of June 30, 2020 | | | | | | | |
| Financial liabilities: | | | | | | | |
| Derivative instruments | $ | — |
| | $ | 5,233 |
| | $ | — |
| | $ | 5,233 |
|
| Total financial liabilities | $ | — |
| | $ | 5,233 |
| | $ | — |
| | $ | 5,233 |
|
| | | | | | | | |
| Fair value as of December 31, 2019 | | | | | | | |
| Financial liabilities: | | | | | | | |
| Derivative instruments | $ | — |
| | $ | 1,757 |
| | $ | — |
| | $ | 1,757 |
|
| Total financial liabilities | $ | — |
| | $ | 1,757 |
| | $ | — |
| | $ | 1,757 |
|
| | | | | | | | | | | | | | | | | | | | | | | |
| Fair value measurement using | | |
| (dollars in thousands) | Level 1 | | Level 2 | | Level 3 | | Total |
| Fair value as of March 31, 2021 | | | | | | | |
| Financial assets: | | | | | | | |
| Derivative instruments | $ | 0 | | | $ | 2,851 | | | $ | 0 | | | $ | 2,851 | |
| Total financial assets | $ | 0 | | | $ | 2,851 | | | $ | 0 | | | $ | 2,851 | |
| | | | | | | |
| | | | | | | |
| Financial liabilities: | | | | | | | |
| Derivative instruments | $ | 0 | | | $ | 1,431 | | | $ | 0 | | | $ | 1,431 | |
| Total financial liabilities | $ | 0 | | | $ | 1,431 | | | $ | 0 | | | $ | 1,431 | |
| | | | | | | |
| | | | | | | |
| | | | | | | |
| | | | | | | |
| | | | | | | |
| | | | | | | |
| Fair value as of December 31, 2020 | | | | | | | |
| Financial liabilities: | | | | | | | |
| Derivative instruments | $ | 0 | | | $ | 4,159 | | | $ | 0 | | | $ | 4,159 | |
| Total financial liabilities | $ | 0 | | | $ | 4,159 | | | $ | 0 | | | $ | 4,159 | |
Our derivative instruments within the scope of Accounting Standards Codification ("ASC") 815, Derivatives and Hedging, are required to be recorded at fair value. Our derivative instruments that are recorded at fair value include interest rate swaps.
The fair value of our interest rate swaps was based on model-driven valuations using LIBOR rates, which are observable at commonly quoted intervals. Accordingly, our interest rate swaps are classified within Level 2 of the fair value hierarchy. The Financial ConductConduct Authority in the U.K. has stated that it plans to phase out LIBOR by the end of calendar year 2021. We do not currently anticipate a significant impact to our financial position or results of operations as a result of this action as we expect that our financial contracts currently indexed to LIBOR will either expire or be modified without significant financial impact before the phasephase out occurs.
We believe the carrying amounts of our cash and cash equivalents, restricted cash, due to customers, accounts receivable, trade accounts payable, accrued expenses and other current liabilities and due to customers approximate their fair values at June 30,March 31, 2021 and December��31, 2020, and December 31, 2019, due to the immediate or short-term maturity of these instruments.
We believe the carrying amount of our debt approximates its fair value at June 30, 2020March 31, 2021 and December 31, 2019,2020, as the debt bears interest rates that approximate market value. As LIBOR rates are observable at commonly quoted intervals, our debt under the 2020 Credit Facility (as defined below) is classified within Level 2 of the fair value hierarchy. Our fixed rate debt is also classified within Level 2 of the fair value hierarchy.
We did not transfer any assets or liabilities among the levels within the fair value hierarchy during the sixthree months ended June 30, 2020.March 31, 2021. Additionally, we did not hold any Level 3 assets or liabilities during the sixthree months ended June 30, 2020.
|
| | | | | | | |
1210 | | SecondFirst Quarter 20202021 Form 10-Q |
Blackbaud, Inc.
Notes to Condensed Consolidated Financial Statements (Continued)
(Unaudited)
Non-recurring fair value measurements
Assets and liabilities that are measured at fair value on a non-recurring basis include long-lived assets, intangible assets, goodwill and operating lease right-of-use ("ROU") assets. These assets which are recognized at fair value during the period in which an acquisition is completed or at lease commencement, from updated estimates and assumptions during the measurement period, or when they are considered to be impaired. These non-recurring fair value measurements, primarily for long-lived assets, intangible assets acquired and operating lease ROU assets, are based on Level 3 unobservable inputs. In the event of an impairment, we determine the fair value of these assets other than goodwill using a discounted cash flow approach, which contains significant unobservable inputs and, therefore, is considered a Level 3 fair value measurement. The unobservable inputs in the analysis generally include future cash flow projections and a discount rate. For goodwill impairment testing, we estimate fair value using market-based methods including the use of market capitalization and consideration of a control premium.
During the six months ended June 30, 2020, we recorded an impairment charge of $4.3 million against certain previously capitalized software development costs that reduced the carrying value of those assets to zero. The impairment charge is reflected in cost of recurring revenue and resulted primarily from our decision to accelerate the end of customer support for certain solutions. During the six months ended June 30, 2020, we also recorded an insignificant impairment of operating lease ROU assets associated with certain leased office space we ceased using. This impairment charge is reflected in general and administrative expense.
There were no other non-recurring fair value adjustments to our long-lived assets, intangible assets, goodwill and operating lease ROU assets and goodwill during the sixthree months ended June 30, 2020.March 31, 2021.
|
| |
| 6. Consolidated Financial Statement Details |
Restricted cash
| | | | | | | | |
| (dollars in thousands) | March 31,
2021 | December 31,
2020 |
| Restricted cash due to customers | $ | 254,002 | | $ | 607,943 | |
| Real estate escrow balances | 1,156 | | 1,276 | |
| Total restricted cash | 255,158 | | 609,219 | |
Prepaid expenses and other assets
| | | | | | | | |
| (dollars in thousands) | March 31,
2021 | December 31,
2020 |
Costs of obtaining contracts(1)(2) | $ | 83,421 | | $ | 84,914 | |
Prepaid software maintenance and subscriptions(3) | 33,113 | | 24,471 | |
Receivables for probable insurance recoveries(4) | 15,723 | | 6,288 | |
Implementation costs for cloud computing arrangements, net(5)(6) | 11,451 | | 11,298 | |
| Unbilled accounts receivable | 7,660 | | 10,385 | |
| Prepaid insurance | 6,397 | | 1,426 | |
| Derivative instruments | 2,851 | | 0 | |
| Taxes, prepaid and receivable | 1,486 | | 1,891 | |
| Other assets | 10,015 | | 10,332 | |
| Total prepaid expenses and other assets | 172,117 | | 151,005 | |
| Less: Long-term portion | 74,022 | | 72,639 | |
| Prepaid expenses and other current assets | $ | 98,095 | | $ | 78,366 | |
|
| | | | | | |
| (dollars in thousands) | June 30,
2020 |
| December 31,
2019 |
|
Costs of obtaining contracts(1)(2) | $ | 89,080 |
| $ | 90,764 |
|
Prepaid software maintenance and subscriptions(3) | 28,975 |
| 17,384 |
|
Implementation costs for cloud computing arrangements, net(4)(5) | 10,563 |
| 7,294 |
|
| Unbilled accounts receivable | 8,647 |
| 6,233 |
|
| Prepaid insurance | 2,638 |
| 1,585 |
|
| Taxes, prepaid and receivable | 842 |
| 849 |
|
| Security deposits | 861 |
| 885 |
|
| Other assets | 10,766 |
| 8,051 |
|
| Total prepaid expenses and other assets | 152,372 |
| 133,045 |
|
| Less: Long-term portion | 68,673 |
| 65,193 |
|
| Prepaid expenses and other current assets | $ | 83,699 |
| $ | 67,852 |
|
| |
(1) | Amortization expense from(2)The current portion of costs of obtaining contracts as of March 31, 2021 and December 31, 2020 was $31.6 million and $31.9 million, respectively. (3)The current portion of prepaid software maintenance and subscriptions as of March 31, 2021 and December 31, 2020 was $28.0 million and $19.8 million, respectively. (4)See discussion of the Security Incident at Note 9. (5)These costs primarily relate to the multi-year implementations of our new global enterprise resource planning and customer relationship management systems. (6)Amortization expense from capitalized cloud computing implementation costs was insignificant for the three months ended March 31, 2021 and 2020, respectively. Accumulated amortization for these costs was $1.6 million as of March 31, 2021 and $1.1 million as of December 31, 2020.$9.4 million and $18.9 million for the three and six months endedJune 30, 2020, respectively, $9.8 million and $19.4 million for the three and six months endedJune 30, 2019, respectively. |
| |
(2) | The current portion of costs of obtaining contracts as of June 30, 2020 and December 31, 2019 was $32.7 million and $33.0 million, respectively.
|
| |
(3) | The current portion of prepaid software maintenance and subscriptions as of June 30, 2020 and December 31, 2019 was $24.4 million and $16.1 million, respectively.
|
| |
(4) | These costs, which were previously included in prepaid software maintenance and subscriptions, primarily relate to the multi-year implementations of our new global enterprise resource planning and customer relationship management systems. |
| |
(5) | Amortization expense from capitalized cloud computing implementation costs was insignificant for the three and six months endedJune 30, 2020 and 2019, respectively. Accumulated amortization for these costs was insignificant as of June 30, 2020 and December 31, 2019.
|
|
| | | | | | | |
SecondFirst Quarter 20202021 Form 10-Q | | 1311 |
Blackbaud, Inc.
Notes to Condensed Consolidated Financial Statements (Continued)
(Unaudited)
Accrued expenses and other liabilities
| | | | | | | | |
| (dollars in thousands) | March 31,
2021 | December 31,
2020 |
Taxes payable(1) | $ | 16,458 | | $ | 19,577 | |
| Accrued legal costs | 12,055 | | 4,808 | |
| Operating lease liabilities, current portion | 7,191 | | 9,359 | |
| Customer credit balances | 5,891 | | 5,874 | |
| Accrued commissions and salaries | 5,524 | | 5,010 | |
| Unrecognized tax benefit | 3,546 | | 3,351 | |
| Accrued health care costs | 2,389 | | 2,341 | |
| Accrued vacation costs | 2,304 | | 2,311 | |
| Derivative instruments | 1,431 | | 4,159 | |
| Other liabilities | 5,663 | | 6,304 | |
| Total accrued expenses and other liabilities | 62,452 | | 63,094 | |
| Less: Long-term portion | 9,439 | | 10,866 | |
| Accrued expenses and other current liabilities | $ | 53,013 | | $ | 52,228 | |
|
| | | | | | |
| (dollars in thousands) | June 30,
2020 |
| December 31,
2019 |
|
| Operating lease liabilities, current portion | $ | 19,316 |
| $ | 19,784 |
|
Accrued bonuses(1) | 5 |
| 24,617 |
|
| Accrued commissions and salaries | 7,601 |
| 6,980 |
|
| Taxes payable | 12,576 |
| 6,835 |
|
| Derivative instruments | 5,233 |
| 1,757 |
|
| Customer credit balances | 5,032 |
| 4,505 |
|
| Unrecognized tax benefit | 3,833 |
| 3,758 |
|
| Accrued vacation costs | 2,278 |
| 2,232 |
|
| Accrued health care costs | 2,991 |
| 2,399 |
|
| Other liabilities | 5,911 |
| 6,192 |
|
| Total accrued expenses and other liabilities | 64,776 |
| 79,059 |
|
| Less: Long-term portion | 11,883 |
| 5,742 |
|
| Accrued expenses and other current liabilities | $ | 52,893 |
| $ | 73,317 |
|
| |
(1) | In March 2020, we reduced our accrued bonuses due to the payment of bonuses from the prior year and, in response to the global COVID-19 pandemic, determined to replace our 2020 cash bonus plans with performance-based equity awards (See Note 2). |
Other (expense) income, net
|
| | | | | | | | | | | | | |
| | Three months ended
June 30, | | | Six months ended
June 30, | |
| (dollars in thousands) | 2020 |
| 2019 |
| | 2020 |
| 2019 |
|
| Interest income | $ | 110 |
| $ | 525 |
| | $ | 632 |
| $ | 1,179 |
|
| Other income, net | 520 |
| 1,656 |
| | 1,068 |
| 1,184 |
|
| Other income, net | $ | 630 |
| $ | 2,181 |
| | $ | 1,700 |
| $ | 2,363 |
|
| | | | | | | | | | | |
| | | | Three months ended March 31, |
| (dollars in thousands) | | | | 2021 | 2020 |
| Interest income | | | | $ | 152 | | $ | 522 | |
| | | | | |
| | | | | |
| Other (expense) income, net | | | | (1,162) | | 548 | |
| Other (expense) income, net | | | | $ | (1,010) | | $ | 1,070 | |
The following table summarizes our debt balances and the related weighted average effective interest rates, which includes the effect of interest rate swap agreements.
|
| | | | | | | | | | | |
| | Debt balance at | | | Weighted average effective interest rate at | |
| (dollars in thousands) | June 30,
2020 |
| December 31,
2019 |
| | June 30,
2020 |
| December 31,
2019 |
|
| Credit facility: | | | | | |
| Revolving credit loans | $ | 207,600 |
| $ | 187,000 |
| | 2.41 | % | 3.11 | % |
| Term loans | 277,500 |
| 281,250 |
| | 3.02 | % | 3.22 | % |
| Other debt | 3,926 |
| — |
| | 5.00 | % | — | % |
| Total debt | 489,026 |
| 468,250 |
| | 2.78 | % | 3.18 | % |
| Less: Unamortized discount and debt issuance costs | 913 |
| 1,150 |
| | | |
| Less: Debt, current portion | 9,194 |
| 7,500 |
| | 2.29 | % | 3.05 | % |
| Debt, net of current portion | $ | 478,919 |
| $ | 459,600 |
| | 2.78 | % | 3.18 | % |
| | | | | | | | | | | | | | | | | |
| Debt balance at | | Weighted average
effective interest rate at |
| (dollars in thousands) | March 31,
2021 | December 31,
2020 | | March 31,
2021 | December 31,
2020 |
| Credit facility: | | | | | |
| Revolving credit loans | $ | 93,425 | | $ | 69,625 | | | 1.80 | % | 1.83 | % |
| Term loans | 397,500 | | 400,000 | | | 3.13 | % | 3.12 | % |
| Real estate loans | 60,358 | | 60,626 | | | 5.22 | % | 5.22 | % |
| Other debt | 2,232 | | 3,926 | | | 5.00 | % | 5.00 | % |
| Total debt | 553,515 | | 534,177 | | | 3.14 | % | 3.21 | % |
| Less: Unamortized discount and debt issuance costs | 2,716 | | 3,144 | | | | |
| Less: Debt, current portion | 12,875 | | 12,840 | | | 2.67 | % | 2.61 | % |
| Debt, net of current portion | $ | 537,924 | | $ | 518,193 | | | 3.15 | % | 3.22 | % |
|
| | | | | | | |
1412 | | SecondFirst Quarter 20202021 Form 10-Q |
Blackbaud, Inc.
Notes to Condensed Consolidated Financial Statements (Continued)
(Unaudited)
20172020 credit facility
In June 2017,October 2020, we entered into a five-year $700.0$900.0 million senior credit facility (the "2017"2020 Credit Facility"). At June 30, 2020,March 31, 2021, we were in compliance with our debt covenants under the 20172020 Credit Facility.
Real estate loans
In August 2020, we completed the purchase of our global headquarters facility. As part of the purchase price, we assumed the Seller’s obligations under two senior secured notes with an aggregate outstanding principal amount of $61.1 million (collectively, the “Real Estate Loans”). At March 31, 2021, we were in compliance with our debt covenants under the Real Estate Loans.
Other debt
In December 2019,From time to time, we enteredenter into a 51-month $2.2 million agreement to finance our purchasethird-party financing agreements for purchases of software and related services for our internal use. The agreement is aGenerally, the agreements are non-interest-bearing notenotes requiring four equal annual payments, where the first payment was due in January 2020.payments. Interest associated with the note has beennotes is imputed at the rate we would incur for amounts borrowed under the 2017 Credit Facility.
In January 2020, we entered into an additional 39-month $3.5 million agreement to finance our purchase of software and related services for our internal use. The agreement is a non-interest-bearing note requiring three equal annual payments, where the first payment was due in March 2020. Interest associated with the note has been imputedthen-existing credit facility at the rate we would incur for amounts borrowed underinception of the 2017 Credit Facility.notes.
The following table summarizes our currently effective financing agreements as of March 31, 2021:
| | | | | | | | | | | | | | |
| (dollars in thousands) | Term
in Months | Number of
Annual Payments | First Annual Payment Due | Original Loan Value |
| Effective dates of agreements: | | | | |
| December 2019 | 51 | 4 | | January 2020 | $ | 2,150 | |
| January 2020 | 39 | 3 | | March 2020 | 3,470 | |
| | | | |
As of June 30, 2020,March 31, 2021, the required annual maturities related to the 20172020 Credit Facility, the Real Estate Loans and our other debt were as follows:
|
| | | |
Years ending December 31, (dollars in thousands) | Annual maturities |
|
| 2020 - remaining | $ | 3,750 |
|
| 2021 | 9,194 |
|
| 2022 | 475,544 |
|
| 2023 | 538 |
|
| 2024 | — |
|
| Thereafter | — |
|
| Total required maturities | $ | 489,026 |
|
| | | | | |
Years ending December 31,
(dollars in thousands) | Annual
maturities |
| 2021 - remaining | $ | 8,378 | |
| 2022 | 12,985 | |
| 2023 | 11,982 | |
| 2024 | 11,609 | |
| 2025 | 455,209 | |
| |
| Thereafter | 53,352 | |
| Total required maturities | $ | 553,515 | |
|
| |
| 8. Derivative Instruments |
Cash flow hedges
We generally use derivative instruments to manage our variable interest rate risk. We have entered into interest rate swap agreements, which effectively convert portions of our variable rate debt under the 20172020 Credit Facility to a fixed rate for the term of the swap agreements. We designated each of the interest rate swap agreements as a cash flow hedge at the inception of the contracts.
| | | | | | | | |
| First Quarter 2021 Form 10-Q | | 13 |
Blackbaud, Inc.
Notes to Condensed Consolidated Financial Statements (Continued)
(Unaudited)
The terms and notional values of our derivative instruments were as follows as of June 30, 2020:
|
| | | | |
| (dollars in thousands) | Term of derivative instrument | Notional Value |
|
| Derivative instruments designated as hedging instruments: | | |
| Interest rate swap | July 2017 - July 2021 | $ | 150,000 |
|
| Interest rate swap | February 2018 - June 2021 | 50,000 |
|
| Interest rate swap | June 2019 - June 2021 | 75,000 |
|
| | | $ | 275,000 |
|
| | | | | | | | |
| (dollars in thousands) | Term of derivative instrument | Notional
value |
| Derivative instruments designated as hedging instruments: | | |
| Interest rate swap | July 2017 - July 2021 | $ | 150,000 | |
| Interest rate swap | February 2018 - June 2021 | 50,000 | |
| Interest rate swap | June 2019 - June 2021 | 75,000 | |
| Interest rate swap | November 2020 - October 2024 | 60,000 | |
| Interest rate swap | November 2020 - October 2024 | 60,000 | |
| | $ | 395,000 | |
| | |
Second Quarter 2020 Form 10-QForward-starting interest rate swap | June 2021 - October 2024 | 15120,000 | |
| Forward-starting interest rate swap | July 2021 - October 2024 | 120,000 | |
| | $ | 240,000 | |
Blackbaud, Inc.
Notes to Condensed Consolidated Financial Statements (Continued)
(Unaudited)
The fair values of our derivative instruments were as follows as of:
|
| | | | | | | |
| | | Liability Derivatives |
| (dollars in thousands) | Balance sheet location | June 30,
2020 |
| December 31,
2019 |
|
| Derivative instruments designated as hedging instruments: | | | |
| Interest rate swaps, current portion | Accrued expenses and other current liabilities | $ | 2,515 |
| $ | — |
|
| Interest rate swaps, long-term portion | Other liabilities | 2,718 |
| 1,757 |
|
| Total derivative instruments designated as hedging instruments | | $ | 5,233 |
| $ | 1,757 |
|
| | | | | | | | | | | | | | | | | | | | | | | |
| | Asset derivatives | | | Liability derivatives |
| (dollars in thousands) | Balance sheet location | March 31,
2021 | December 31,
2020 | | Balance sheet location | March 31,
2021 | December 31,
2020 |
| Derivative instruments designated as hedging instruments: | | | | | | | |
| Interest rate swaps, current portion | Prepaid expenses
and other current assets | $ | 0 | | $ | 0 | | | Accrued expenses
and other
current liabilities | $ | 1,431 | | $ | 2,698 | |
| Interest rate swaps, long-term portion | Other assets | 2,851 | | 0 | | | Other liabilities | 0 | | 1,461 | |
| Total derivative instruments designated as hedging instruments | | $ | 2,851 | | $ | 0 | | | | $ | 1,431 | | $ | 4,159 | |
| | | | | | | |
| | | | | | | |
| | | | | | | |
| | | | | | | |
| | | | | | | |
| | | | | | | |
The effects of derivative instruments in cash flow hedging relationships were as follows:
|
| | | | | | | | | | | |
| | Gain (loss) recognized in accumulated other comprehensive loss as of |
| Location of gain (loss) reclassified from accumulated other comprehensive loss into income | Gain (loss) reclassified from accumulated other comprehensive loss into income | |
| (dollars in thousands) | June 30,
2020 |
| Three months ended
June 30, 2020 |
| | Six months ended
June 30, 2020 |
|
| Interest rate swaps | $ | (5,233 | ) | Interest expense | $ | (1,018 | ) | | $ | (1,223 | ) |
| | | | | | |
| | June 30,
2019 |
| | Three months ended
June 30, 2019 |
| | Six months ended
June 30, 2019 |
|
| Interest rate swaps | $ | (1,826 | ) | Interest expense | $ | 244 |
| | $ | 473 |
|
| | | | | | | | | | | | | |
| Gain (loss) recognized
in accumulated other
comprehensive
loss as of | Location
of gain (loss)
reclassified from
accumulated other
comprehensive
loss into income | | | Gain (loss) reclassified from accumulated
other comprehensive loss into income |
| (dollars in thousands) | March 31,
2021 | | | Three months ended March 31, 2021 |
| Interest rate swaps | $ | 1,420 | | Interest expense | | | $ | (1,373) | |
| | | | | |
| March 31,
2020 | | | | Three months ended March 31, 2020 |
| Interest rate swaps | $ | (5,979) | | Interest expense | | | $ | (205) | |
Our policy requires that derivatives used for hedging purposes be designated and effective as a hedge of the identified risk exposure at the inception of the contract. Accumulated other comprehensive income (loss) includes unrealized gains or losses from the change in fair value measurement of our derivative instruments each reporting period and the related income tax expense or benefit. Changes in the fair value measurements of the derivative instruments and the related income tax expense or benefit are reflected as adjustments to accumulated other comprehensive income (loss) until the actual hedged expense is incurred or until the hedge is terminated at which point the unrealized gain (loss) is reclassified from accumulated other comprehensive income (loss) to current earnings. The estimated accumulated other comprehensive loss as of June 30, 2020March 31, 2021 that is expected to be reclassified into earnings within the next twelve months is $5.1$2.2 million. There were no0 ineffective portions of our interest rate swap derivatives during the sixthree months ended June 30, 2020
| | | | | | | | |
| 14 | | First Quarter 2021 Form 10-Q |
Blackbaud, Inc.
Notes to Condensed Consolidated Financial Statements (Continued)
(Unaudited)
March 31, 2021 and 2019.2020. See Note 12 for a summary of the changes in accumulated other comprehensive income (loss) by component.
|
| |
| 9. Commitments and Contingencies |
Leases
We have operating leases for corporate offices, subleased offices and certain equipment and furniture. As of June 30, 2020,March 31, 2021, we had operating leases for equipmentoffice space that had not yet commenced with future rent payments of $0.9$3.5 million. These operating leases are expected to commence during 20202021 with lease terms of 53 years.
|
| | |
16 | | Second Quarter 2020 Form 10-Q |
Blackbaud, Inc.
Notes to Condensed Consolidated Financial Statements (Continued)
(Unaudited)
The components of lease expense were as follows:
| | | | | | | | | | | |
| | | Three months ended March 31, |
| (dollars in thousands) | | | | 2021 | 2020 |
Operating lease cost(1) | | | | $ | 2,841 | | $ | 6,311 | |
| Variable lease cost | | | | 699 | | 1,258 | |
| Sublease income | | | | (460) | | (913) | |
| Net lease cost | | | | $ | 3,080 | | $ | 6,656 | |
|
| | | | | | | | | | | | | |
| | Three months ended
June 30, | | | Six months ended
June 30, | |
| (dollars in thousands) | 2020 |
| 2019 |
| | 2020 |
| 2019 |
|
Operating lease cost(1)(2) | $ | 6,281 |
| $ | 5,894 |
| | $ | 12,592 |
| $ | 11,894 |
|
| Variable lease cost | 1,113 |
| 988 |
| | 2,371 |
| 1,979 |
|
| Sublease income | (940 | ) | (755 | ) | | (1,853 | ) | (1,459 | ) |
| Net lease cost | $ | 6,454 |
| $ | 6,127 |
| | $ | 13,110 |
| $ | 12,414 |
|
| |
(1) | Includes short-term lease costs, which were immaterial. |
| |
(2) | See Note 15 for a discussion of the pending purchase of our Headquarters Facility that we currently lease. |
Other commitments
The term loans under the 20172020 Credit Facility require periodic principal payments. The balance of the term loans and any amounts drawn on the revolving credit loans are due upon maturity of the 20172020 Credit Facility in June 2022.October 2025. The Real Estate Loans also require periodic principal payments and the balance of the Real Estate Loans are due upon maturity in April 2038.
We have contractual obligations for third-party technology used in our solutions and for other services we purchase as part of our normal operations. In certain cases, these arrangements require a minimum annual purchase commitment by us. As of June 30, 2020,March 31, 2021, the remaining aggregate minimum purchase commitment under these arrangements was approximately $90.5$79.0 million through 2024.
Solution and service indemnifications
In the ordinary course of business, we provide certain indemnifications of varying scope to customers against claims of intellectual property infringement made by third parties arising from the use of our solutions or services. If we determine that it is probable that a loss has been incurred related to solution or service indemnifications, any such loss that could be reasonably estimated would be recognized. We have not identified any losses and, accordingly, we have not recorded a liability related to these indemnifications.
Legal proceedings
We are subject to legal proceedings and claims that arise in the ordinary course of business, as well as certain other non-ordinary course proceedings, claims and inquiries, as described below. We make a provision for a loss contingency when it is both probable that a material liability has been incurred and the amount of the loss can be reasonably estimated. If only a range of estimated losses can be determined, we accrue an amount within the range that, in our judgment, reflects the most likely outcome; if none of the estimates within that range is a better estimate than any other amount, we accrue the low end of the range. For proceedings in which an unfavorable outcome is reasonably possible but not probable and an estimate of the loss or range of losses arising from the proceeding can be made, we disclose such an estimate, if material. If such a loss or range of losses is not reasonably estimable, we disclose that fact. We review any such loss contingency provisions at least quarterly and adjust them to reflect the impacts of negotiations, settlements, rulings, advice of legal counsel and other information and events pertaining to a particular case. We
| | | | | | | | |
| First Quarter 2021 Form 10-Q | | 15 |
Blackbaud, Inc.
Notes to Condensed Consolidated Financial Statements (Continued)
(Unaudited)
recognize insurance recoveries, if any, when they are probable of receipt. All associated legal costs are expensed as incurred.
Legal proceedings are inherently unpredictable. However, we believe that we have valid defenses with respect to the legal matters pending or threatened against us and intend to defend ourselves vigorously against all claims asserted. We further believe that the amount or range of reasonably possible losses related to such pending or threatened legal proceedings will not have a material adverse effect on our business, operating results, cash flows, or financial condition should such litigation be resolved unfavorably. It is possible, nevertheless, that our consolidated financial position, results of operations or cash flows could be materially negatively affected in any particular period by an unfavorable resolution of one or more of such legal proceedings.
Security incident
WeAs previously disclosed, we are subject to risks and uncertainties as a result of a ransomware attack against us in May 2020 in which a cybercriminal removed a copy of a subset of data from our self-hosted environment (the "Incident""Security Incident"). Based on the nature of the Security Incident, our research and third party (including law enforcement) investigation, we have no reason to believe that any data went beyond the cybercriminal, was or will be misused, or will be disseminated or otherwise made available publicly. Our investigation into the Security Incident by our cybersecurity team and third-party forensic advisors remains ongoing. We incurred insignificant costs associated with
As a result of the Security Incident, duringwe are currently subject to certain legal proceedings, claims, inquiries and investigations, as discussed below, and could be the subject of additional legal proceedings, claims, inquires and investigations in the future that might result in adverse judgments, settlements, fines, penalties, or other resolution. To limit our exposure to losses related to claims against us, including data breaches such as the Security Incident, we maintain $50 million of insurance above a $250 thousand deductible payable by us. As noted below, this coverage has reduced our financial exposure related to the Security Incident, and we will continue to seek recoveries under these insurance policies. Although it is possible that total losses related to the Security Incident will ultimately exceed the limits of our insurance coverage, we are currently unable to determine if or when that will be the case and, if so, the approximate amount or range of any such excess.
In the three months ended June 30, 2020. It is expected thatMarch 31, 2021, we willrecorded $12.8 million of expenses related to the Security Incident and offsetting probable insurance recoveries of $12.8 million. As of March 31, 2021, we have recorded cumulative expenses related to the Security Incident of $22.6 million and cumulative probable insurance recoveries of $22.1 million. Due to the time required to submit and process such insurance claims, we have not yet received all of the accrued insurance recoveries. Of the insurance recoveries recorded, $6.4 million had been paid as of March 31, 2021. Recorded expenses consisted primarily of payments to third-party service providers and consultants, including legal fees. We present expenses and insurance recoveries related to the Security Incident in general and administrative expense on our condensed consolidated statements of comprehensive income. We expect to continue to experience increased costssignificant expenses related to our response to the Security Incident, resolution of legal proceedings, claims, inquiries and investigations discussed below, and our efforts to further enhance our security measures. Becausemeasures, which expenses may be material.
Based on our analysis of the factors described above, we have not recorded a liability related to the Security Incident as of March 31, 2021 because we are unable at this time to reasonably estimate the possible loss or range of loss,loss.
Customer claims. To date, we have not recorded a liabilityreceived approximately 630 claims for reimbursement of expenses from customers or their attorneys in the U.S., U.K. and Canada related to the Security Incident (none of which have as yet been filed in court or in arbitration). Possible exposure could result from our customers’ costs and expenses associated with notifying their own customers of June 30, 2020.
Legal proceedings
the Security Incident and taking steps to assure that personal information has not been compromised as a result of the Security Incident. We are subject to legal proceedings and claims that arise in the ordinary courseprocess of business. We makeanalyzing individual customer contracts into which we have entered, the specific claims made and applicable law.
Customer constituent class actions. Presently, we are a provision for a loss contingency when it is both probable that a liability hasdefendant in 30 putative consumer class action cases [27 in U.S. federal courts (some of which have been incurred and the amount of the loss can be reasonably estimated. These provisions are reviewed at least quarterly and adjusted to reflect the impacts of negotiations, settlements, rulings, advice of legal counsel and other information and events pertainingconsolidated under multi district litigation to a particular case. Unless otherwise specifically disclosedsingle federal court), 1 in this note, wea U.S. state court and 2 in Canadian courts] alleging harm from the Security Incident. The plaintiffs in these cases, who purport to represent various classes of individual constituents of our customers, generally claim to have determined as of June 30, 2020, that no provision for liability nor disclosure is required related to any claim against us because (a) there is not a reasonable possibility that a loss exceeding amounts already recognized (if any) may be incurred with respect to such claim; (b) a reasonably possible loss or range of loss cannot be estimated; or (c) such estimate is immaterial. All legal costs associated with litigation are expensed as incurred. Litigation is inherently unpredictable. However, we believe that we have valid defenses with respect to the legal matters pending against us. It is possible, nevertheless, that our consolidated financial position, results of operations or cash flows could be negatively affected in any particular periodbeen harmed by an unfavorable resolution of one or more of such proceedings, claims or investigations.
|
| | | | | | | |
Second16 | | First Quarter 20202021 Form 10-Q | | 17 |
Blackbaud, Inc.
Notes to Condensed Consolidated Financial Statements (Continued)
(Unaudited)
Lawsuits that are putative class actions require a plaintiff to satisfy a number of procedural requirements before proceeding to trial. These requirements include, among others, demonstration to a court that the law proscribes in some manner our activities, the making of factual allegations sufficient to suggest that our activities exceeded the limits of the law and a determination by the court—known as class certification—that the law permits a group of individuals to pursue the case together as a class. If these procedural requirements are not met, the lawsuit cannot proceed as a class action and the plaintiff may lose the financial incentive to proceed with the case. Frequently, a court’s determination as to these procedural requirements is subject to appeal to a higher court. As a result of these uncertainties, we may be unable to determine the probability of loss until, or after, a court has finally determined that a plaintiff has satisfied the applicable class action procedural requirements.
Furthermore, for putative class actions, it is often not possible to estimate the possible loss or a range of loss amounts, even where we have determined that a loss is reasonably possible. Generally, class actions involve a large number of people and raise complex legal and factual issues that result in uncertainty as to their outcome and, ultimately, making it difficult for us to estimate the amount of damages that a plaintiff might successfully prove. This analysis is further complicated by the fact that the plaintiffs lack contractual privity with us.
Governmental inquiries and investigations. To date, we have received a consolidated, multi-state Civil Investigative Demand issued on behalf of 47 state Attorneys General and the District of Columbia and a separate Civil Investigative Demand from the office of the Illinois Attorney General’s Office relating to the Security Incident. In addition, we have received communications, inquires and requests from the U.S. Federal Trade Commission, the U.S. Securities and Exchange Commission, the U.S. Department of Health and Human Services, the Information Commissioner’s Office in the United Kingdom (the “ICO”) under the U.K. Data Protection Act 2018, the Office of the Australian Information Commissioner and the Office of the Privacy Commissioner of Canada. We are cooperating with these offices and responding to their inquiries, which include various requests for documents, policies, narratives and communications, as well as requests to interview or depose various Company-related personnel. As noted above, each of these separate governmental inquiries and investigations could result in adverse judgements, settlements, fines, penalties, or other resolution, the amount, scope and timing of which we are currently unable to predict, but could be material.
Our income tax provision and effective income tax rates, including the effects of period-specific events, were:
|
| | | | | | | | | | | | | |
| | Three months ended
June 30, | | | Six months ended
June 30, | |
| (dollars in thousands) | 2020 |
| 2019 |
| | 2020 |
| 2019 |
|
| Income tax provision | $ | 4,496 |
| $ | 2,733 |
| | $ | 5,192 |
| $ | 899 |
|
| Effective income tax rate | 27.6 | % | 27.7 | % | | 24.0 | % | 13.0 | % |
| | | | | | | | | | | |
| | | | Three months ended March 31, |
| (dollars in thousands) | | | | 2021 | 2020 |
| Income tax provision | | | | $ | 684 | | $ | 696 | |
| Effective income tax rate | | | | 131.5 | % | 13.0 | % |
The increase in our effective income tax rate duringfor the sixthree months ended June 30, 2020,March 31, 2021, when compared to the same period in 2019,2020, was primarily attributable to improvedhigher 2021 discrete tax expense against lower pre-tax income. The 2020 profitability and changes in jurisdictional mix and reduced 2020 non-deductible costs. Furthermore, our 2020 effective income tax rate was positively impacted by benefits attributable to stock-based compensation. The 2021 effective income tax rate was negatively impacted by a decrease in the total discrete benefit to income tax expense relatedattributable to stock-based compensation.
compensation against lower pre-tax income. |
| | | | | | | |
| First Quarter 2021 Form 10-Q | | 17 |
Blackbaud, Inc.
Notes to Condensed Consolidated Financial Statements (Continued)
(Unaudited)
| | |
| 11. Stock-based Compensation |
Stock-based compensation expense is allocated to cost of revenue and operating expenses on the condensed consolidated statements of comprehensive income based on where the associated employee’s compensation is recorded. The following table summarizes stock-based compensation expense:
|
| | | | | | | | | | | | | |
| | Three months ended
June 30, | | | Six months ended
June 30, | |
| (dollars in thousands) | 2020 |
| 2019 |
| | 2020 |
| 2019 |
|
| Included in cost of revenue: | | | | | |
| Cost of recurring | $ | 1,151 |
| $ | 451 |
| | $ | 1,621 |
| $ | 963 |
|
| Cost of one-time services and other | 1,419 |
| 340 |
| | 1,814 |
| 802 |
|
| Total included in cost of revenue | 2,570 |
| 791 |
| | 3,435 |
| 1,765 |
|
| Included in operating expenses: | | | | | |
| Sales, marketing and customer success | 3,603 |
| 2,827 |
| | 6,081 |
| 5,738 |
|
| Research and development | 4,348 |
| 2,753 |
| | 7,147 |
| 5,427 |
|
| General and administrative | 9,612 |
| 8,658 |
| | 17,050 |
| 15,825 |
|
| Total included in operating expenses | 17,563 |
| 14,238 |
| | 30,278 |
| 26,990 |
|
| Total stock-based compensation expense | $ | 20,133 |
| $ | 15,029 |
| | $ | 33,713 |
| $ | 28,755 |
|
| | | | | | | | | | | |
| | | | Three months ended March 31, |
| (dollars in thousands) | | | | 2021 | 2020 |
| Included in cost of revenue: | | | | | |
| Cost of recurring | | | | $ | 2,411 | | $ | 470 | |
| Cost of one-time services and other | | | | 2,947 | | 395 | |
| Total included in cost of revenue | | | | 5,358 | | 865 | |
| Included in operating expenses: | | | | | |
| Sales, marketing and customer success | | | | 5,428 | | 2,478 | |
| Research and development | | | | 6,714 | | 2,799 | |
| General and administrative | | | | 12,505 | | 7,438 | |
| Total included in operating expenses | | | | 24,647 | | 12,715 | |
| Total stock-based compensation expense | | | | $ | 30,005 | | $ | 13,580 | |
See Note 2 for discussion of the additional equity award grants we made in response to COVID-19 pandemic.
DividendsStock repurchase program
In MarchNovember 2020, in response to the global COVID-19 pandemic, our Board of Directors rescinded its previously announced policyreauthorized and expanded a stock repurchase program that authorizes us to paypurchase up to $250.0 million of our outstanding shares of common stock. The program does not have an annual dividend at a rateexpiration date. Under the stock repurchase program, we are authorized to repurchase shares from time to time in accordance with applicable laws both on the open market, including under trading plans established pursuant to Rule 10b5-1 under the Securities Exchange Act of $0.48 per share1934, as amended, and in privately negotiated transactions. The timing and amount of repurchases depends on several factors, including market and business conditions, the trading price of our common stock and the nature of other investment opportunities. The repurchase program may be limited, suspended or discontinued at any time without prior notice. Under the declaration and payment2020 Credit Facility, we have restrictions on our ability to repurchase shares of all cash dividends, beginning withour common stock.
We account for purchases of treasury stock under the second quartercost method. During the three months ended March 31, 2021, we purchased 465,821 shares for $28.1 million. The remaining amount available to purchase stock under the stock repurchase program was $180.9 million as of 2020 and thereafter until such time, if any, as it may otherwise determine in its sole discretion.
|
| | | | | | | |
| 18 | | SecondFirst Quarter 20202021 Form 10-Q |
Blackbaud, Inc.
Notes to Condensed Consolidated Financial Statements (Continued)
(Unaudited)
Dividends paid on common stock during the six months ended June 30, 2020, consisted of the following:
|
| | | | | | |
| Declaration Date | Dividend per Share |
| Record Date | | Payable Date |
| February 10, 2020 | $ | 0.12 |
| February 28 | | March 13 |
Changes in accumulated other comprehensive income (loss) by component
The changes in accumulated other comprehensive income (loss) by component, consisted of the following:
|
| | | | | | | | | | | | | |
| | Three months ended
June 30, | | | Six months ended
June 30, | |
| (dollars in thousands) | 2020 |
| 2019 |
| | 2020 |
| 2019 |
|
| Accumulated other comprehensive loss, beginning of period | $ | (14,140 | ) | $ | (1,452 | ) | | $ | (5,290 | ) | $ | (5,110 | ) |
| By component: | | | | | |
| Gains and losses on cash flow hedges: | | | | | |
| Accumulated other comprehensive (loss) income balance, beginning of period | $ | (4,445 | ) | $ | 566 |
| | $ | (1,323 | ) | $ | 1,498 |
|
| Other comprehensive loss before reclassifications, net of tax effects of $71, $628, $1,225 and $904 | (200 | ) | (1,759 | ) | | (3,473 | ) | (2,522 | ) |
| Amounts reclassified from accumulated other comprehensive loss to interest expense | 1,018 |
| (244 | ) | | 1,223 |
| (473 | ) |
| Tax (benefit) expense included in provision for income taxes | (267 | ) | 64 |
| | (321 | ) | 124 |
|
| Total amounts reclassified from accumulated other comprehensive loss | 751 |
| (180 | ) | | 902 |
| (349 | ) |
| Net current-period other comprehensive income (loss) | 551 |
| (1,939 | ) | | (2,571 | ) | (2,871 | ) |
| Accumulated other comprehensive loss balance, end of period | $ | (3,894 | ) | $ | (1,373 | ) | | $ | (3,894 | ) | $ | (1,373 | ) |
| Foreign currency translation adjustment: | | | | | |
| Accumulated other comprehensive loss balance, beginning of period | $ | (9,695 | ) | $ | (2,018 | ) | | $ | (3,967 | ) | $ | (6,608 | ) |
| Translation adjustments | (887 | ) | (6,018 | ) | | (6,615 | ) | (1,428 | ) |
| Accumulated other comprehensive loss balance, end of period | (10,582 | ) | (8,036 | ) | | (10,582 | ) | (8,036 | ) |
| Accumulated other comprehensive loss, end of period | $ | (14,476 | ) | $ | (9,409 | ) | | $ | (14,476 | ) | $ | (9,409 | ) |
| | | | | | | | | | | |
| | | Three months ended March 31, |
| (dollars in thousands) | | | | 2021 | 2020 |
| Accumulated other comprehensive loss, beginning of period | | | | $ | (2,497) | | $ | (5,290) | |
| By component: | | | | | |
| Gains and losses on cash flow hedges: | | | | | |
| Accumulated other comprehensive loss balance, beginning of period | | | | $ | (3,101) | | $ | (1,323) | |
| Other comprehensive income (loss) before reclassifications, net of tax effects of $(1,100) and $1,154 | | | | 3,130 | | (3,273) | |
| | | | | |
| Amounts reclassified from accumulated other comprehensive income (loss) to interest expense | | | | 1,376 | | 205 | |
| Tax benefit included in provision for income taxes | | | | (357) | | (54) | |
| Total amounts reclassified from accumulated other comprehensive income (loss) | | | | 1,019 | | 151 | |
| Net current-period other comprehensive income (loss) | | | | 4,149 | | (3,122) | |
| Accumulated other comprehensive income (loss) balance, end of period | | | | $ | 1,048 | | $ | (4,445) | |
| Foreign currency translation adjustment: | | | | | |
| Accumulated other comprehensive income (loss) balance, beginning of period | | | | $ | 604 | | $ | (3,967) | |
| Translation adjustments | | | | 2,511 | | (5,728) | |
| Accumulated other comprehensive income (loss) balance, end of period | | | | 3,115 | | (9,695) | |
| Accumulated other comprehensive income (loss), end of period | | | | $ | 4,163 | | $ | (14,140) | |
Transaction price allocated to the remaining performance obligations
As of June 30, 2020,March 31, 2021, approximately $854$776 million of revenue is expected to be recognized from remaining performance obligations. We expect to recognize revenue on approximately 60% of these remaining performance obligations over the next 12 months, with the remainder recognized thereafter.
We applied the practical expedient in ASC 606-10-50-14 and have excluded the value of unsatisfied performance obligations for (i) contracts with an original expected length of one year or less (one-time services); and (ii) contracts for which we recognize revenue at the amount to which we have the right to invoice for services performed (payment services and usage)(transactional revenue).
|
| | |
Second Quarter 2020 Form 10-Q | | 19 |
Blackbaud, Inc.
Notes to Condensed Consolidated Financial Statements (Continued)
(Unaudited)
Contract balances
Our contract assets as of June 30, 2020March 31, 2021 and December 31, 20192020 were insignificant. Our opening and closing balances of deferred revenue were as follows:
|
| | | | | | |
| (in thousands) | June 30,
2020 |
| December 31,
2019 |
|
| Total deferred revenue | $ | 337,196 |
| $ | 316,137 |
|
| | | | | | | | |
| (in thousands) | March 31,
2021 | December 31,
2020 |
| | |
| Total deferred revenue | $ | 294,520 | | $ | 316,914 | |
The increasedecrease in deferred revenue during the sixthree months ended June 30, 2020March 31, 2021 was primarily due to a seasonal increasedecrease in customer contract renewals and new subscription sales of our cloud solutions.. Historically, due to the timing of customer budget cycles, we have an increase in customer contract renewals at or near the beginning of our third quarter generally resulting in our lowest balance of deferred revenue at the end of our first quarter. The amount of revenue recognized during the sixthree months ended June 30, 2020March 31, 2021 that was included in the deferred revenuerevenue balance at the beginning of the period was approximately $219
| | | | | | | | |
| First Quarter 2021 Form 10-Q | | 19 |
Blackbaud, Inc.
Notes to Condensed Consolidated Financial Statements (Continued)
(Unaudited)
$134 million. The amount of revenue recognized during the sixthree months ended June 30, 2020March 31, 2021 from performance obligations satisfied in prior periods was insignificant.
Disaggregation of revenue
We sell our cloud solutions and related services in three primary geographical markets: to customers in the United States, to customers in the United Kingdom and to customers located in other countries. The following table presents our revenue by geographic area based on the address of our customers:
|
| | | | | | | | | | | | | |
| | Three months ended
June 30, | | | Six months ended
June 30, | |
| (dollars in thousands) | 2020 |
| 2019 |
| | 2020 |
| 2019 |
|
| United States | $ | 189,304 |
| $ | 190,399 |
| | $ | 383,263 |
| $ | 378,525 |
|
| United Kingdom | 29,535 |
| 19,307 |
| | 45,359 |
| 33,105 |
|
| Other countries | 13,152 |
| 15,928 |
| | 26,990 |
| 29,834 |
|
| Total revenue | $ | 231,991 |
| $ | 225,634 |
| | $ | 455,612 |
| $ | 441,464 |
|
| | | | | | | | | | | |
| | | Three months ended March 31, |
| (dollars in thousands) | | | | 2021 | 2020 |
| United States | | | | $ | 185,327 | | $ | 193,959 | |
| United Kingdom | | | | 22,305 | | 15,825 | |
| Other countries | | | | 11,559 | | 13,837 | |
| Total revenue | | | | $ | 219,191 | | $ | 223,621 | |
The General Markets Group ("GMG"), the Enterprise Markets Group ("EMG"), and the International Markets Group ("IMG") comprisecomprised our go-to-market organizations.organizations as of March 31, 2021. The following is a description of each market group:group as of that date:
•The GMG focuses on sales primarily to all K-12 private schools, faith-basedfaith communities and arts and cultural organizations, as well as emerging and mid-sized prospects in the U.S.;
•The EMG focuses on sales primarily to all healthcare and higher education institutions, corporations and foundations, as well as large and/or strategic prospects in the U.S.; and
•The IMG focuses on sales primarily to all prospects and customers outside of the U.S.
The following table presents our revenue by market group:
|
| | | | | | | | | | | | | |
| | Three months ended
June 30, | | | Six months ended
June 30, | |
| (dollars in thousands) | 2020 |
| 2019 |
| | 2020 |
| 2019 |
|
| GMG | $ | 90,453 |
| $ | 93,259 |
| | $ | 185,906 |
| $ | 185,774 |
|
| EMG | 98,199 |
| 96,710 |
| | 196,322 |
| 191,875 |
|
| IMG | 43,167 |
| 35,614 |
| | 73,248 |
| 63,736 |
|
| Other | 172 |
| 51 |
| | 136 |
| 79 |
|
| Total revenue | $ | 231,991 |
| $ | 225,634 |
| | $ | 455,612 |
| $ | 441,464 |
|
| | | | | | | | | | | |
| | | Three months ended March 31, |
| (dollars in thousands) | | | | 2021 | 2020 |
| GMG | | | | $ | 93,339 | | $ | 95,453 | |
| EMG | | | | 89,527 | | 98,123 | |
| IMG | | | | 36,370 | | 30,081 | |
| Other | | | | (45) | | (36) | |
| Total revenue | | | | $ | 219,191 | | $ | 223,621 | |
| | | | | | | | | | | |
| | | Three months ended March 31, |
| (dollars in thousands) | | | | 2021 | 2020 |
| Contractual recurring | | | | $ | 146,821 | | $ | 147,744 | |
| Transactional recurring | | | | 59,929 | | 57,123 | |
| Total recurring revenue | | | | $ | 206,750 | | $ | 204,867 | |
|
| | | | | | | |
| 20 | | SecondFirst Quarter 20202021 Form 10-Q |
Blackbaud, Inc.
Notes to Condensed Consolidated Financial Statements (Continued)
(Unaudited)
During 2017, in an effort to further our organizational objectives, including improved operating efficiency, customer outcomes and employee satisfaction, we initiated a multi-year plan to consolidate and relocate some of our existing offices to highly modern and more collaborative workspaces with short-term financial commitments. We substantially completed our facilities optimization restructuring plan as of December 2019. During the three and six months ended June 30, 2019, we incurred $0.7 million and $2.7 million, respectively, in before-tax restructuring charges related to these activities. Such charges during the three and six months ended June 30, 2020 were insignificant.
|
|
15. Property and Equipment |
Pending Headquarters Facility Purchase
In June 2020, we entered into a binding purchase and sale agreement with HPBB1, LLC, a Georgia limited liability company (the "Seller"), for the purchase and sale of the building, fixtures and other improvements and parcels of land of our headquarters facility (the "Headquarters Facility") in Charleston, South Carolina (the "Transaction"). We currently lease the Headquarters facility from the Seller. At the closing of the Transaction, we would pay the Seller a purchase price of $76.3 million, which includes the assumption of the Seller's obligations in the aggregate principal amount of $63.0 million and cash, which we expect to fund by borrowings under the 2017 Credit Facility. The Transaction is expected to close during the second half of 2020.
|
| | |
Second Quarter 2020 Form 10-Q | | 21 |
Blackbaud, Inc.
(Unaudited)
ITEM 2. MANAGEMENT'S DISCUSSION AND ANALYSIS OF FINANCIAL CONDITION AND RESULTS OF OPERATIONS
The following discussion and analysis of our financial condition and results of operations should be read in conjunction with our condensed consolidated financial statements and related notes included elsewhere in this Quarterly Report on Form 10-Q. The following discussion and analysis presents financial information denominated in millions of dollars which can lead to differences from rounding when compared to similar information contained in the condensed consolidated financial statements and related notes which are primarily denominated in thousands of dollars.
We are the world’s leading cloud software company powering social good. Serving the entire social good community—nonprofits, higher education institutions, K–12 schools, healthcare organizations, faith communities, arts and cultural organizations, foundations, companies and individual change agents—we connect and empower organizations to increase their impact through cloud software, services, expertise and data intelligence. Our portfolio is tailored to the unique needs of vertical markets, with solutions for fundraising and CRM, marketing, advocacy, peer-to-peer fundraising, corporate social responsibility, school management, ticketing, grantmaking, financial management, payment processing and analytics. Serving the industry for more than threenearly four decades, we are headquartered in Charleston, South Carolina, and have operations in the United States, Australia, Canada, Costa Rica and the United Kingdom.
Our revenue is primarily generated from the following sources: (i) charging for the use of our software solutions in cloud and hosted environments; (ii) providing payment and transactionother transactional-type services; (iii) providing software maintenance and support services; and (iv) providing professional services, including implementation, consulting, training, analytic and other services.
COVID-19 Impact
The outbreak of COVID-19 in numerous countries across the globe, including each country in which we currently operate, has adversely impacted the U.S. and global economies. We began 2020 with strong execution against our financial plan. In March 2020, we began to experience disruptions to our business from COVID-19, and the pandemic continues to impact each of our markets.
To better enable us to weather the extraordinary business challenges brought about by the global COVID-19 pandemic, to protect the safety and welfare of our employees, and to further effect our long-term strategy to deliver the greatest value to our stockholders, we have taken several actions. These initial measures taken are expected to provide us the financial flexibility needed to manage a wide array of outcomes that may result from the pandemic. See Note 2 to our condensed consolidated financial statements in this report for a discussion of some of these actions. In addition to the initial actions we have taken to date, we are continuously evaluating further possible actions in order to respond quickly to rapidly changing conditions, if needed.
The economic impact of COVID-19 on the social good industry remains uncertainuncertain. If our existing and consequently, we expect thatprospective customers remain cautious in their purchase decisions, our operating environment may continue to be challenging for the remainder of 2020,2021 and potentially beyond, as existing and prospective customers remain cautious in their purchase decisions.beyond. Notwithstanding these conditions, we remain focused on continuing to execute our four-point growth strategy and strengthening our leadership position.
|
| | | | | | | | | | | | | |
22 | 1 | Second Quarter 2020 Form 10-Q |
Blackbaud, Inc.
(Unaudited)
Four-Point Growth Strategy
| Expand Total Addressable Market | |
| | | | |
| 12 | | Lead with World Class Teams and Operations | |
| | | | |
| 3 | | Delight Customers with Innovative Cloud Solutions | |
| | | | |
| 2 | | Drive Sales Effectiveness | |
| | | | |
| 3 | | Expand Total Addressable Market | |
| | | | |
| 4 | | Improve Operating Efficiency | |
| |
1. | Delight Customers with Innovative Cloud Solutions4 |
Our solutions are already equipped with features that are lending themselves to the current environment and we have quickly acted upon customer feedback to add enhancements and new functionality to serve our customers, so they can continue to focus on their missions during this time. For example, we built new integration between our peer-to-peer fundraising and donor management solutions simplifying the process of raising donations and acquiring new supporters through pandemic-friendly virtual events and peer-to-peer campaigns. We simplified donation forms to expedite fundraising by allowing organizations to create campaigns quickly and easily, which is critical in the current environment. We also added new financial management capabilities, further easing the transition to working from home with tools that support collaboration and efficient cash flow management and financial operations from the cloud.
| Focus on Employees, Culture and ESG Initiatives | |
2. | Drive Sales Effectiveness |
The investments we have made to enhance our digital footprint are enabling us to be more prescriptive and cost-effective in our marketing efforts and to quickly adapt to changing market conditions, and over the longer term we believe the impact of COVID-19 will accelerate the existing trends driving adoption of modern cloud solutions in our market. 1.Expand Total Addressable Market ("TAM")
We also introduced new pricing and financing offers based on the changing needs of our customers. Despite our optimism over the long-term, the uncertainty of the current environment has created near-term challenges in our ability to build new pipeline and bookings are falling short of budgeted expectations, which we expect to put pressure on near-term revenues. As a result, we have begun shifting investment towards digital marketing aimed at lead generation and put a greater emphasis on selling solutions with the highest lifetime value. In response to the COVID-19 pandemic, we implemented a modest and targeted headcount reduction during the second quarter, including a reduction in our sales headcount with a focus on retaining our most highly productive sales executives. After temporarily freezing our hiring efforts due to COVID-19, we have since began backfilling sales positions with a focus on 2021 bookings.
While we remain active in the evaluation of opportunities to further expand our addressable market through acquisitions and internal product development, our top priority in the near-term is protecting our employees and continuing to support our customers at a very high standard.development. We have significant opportunities in front of us as we are less than 10% penetrated into a total addressable marketTAM of over $10 billion.
| |
4. | Improve Operating Efficiency |
We have made transformational changes to our business over the last several years, which allowed us to immediately switch to a virtual work environment in March and supported our global employees' ability to work effectively from home. We are re-evaluating elements of our workforce strategy based on the lessons learned over the past few months. We have been soliciting feedback from our employees to help shape our approach to the future of work at Blackbaud.
|
| | | | | | | |
SecondFirst Quarter 20202021 Form 10-Q | | 2321 |
Blackbaud, Inc.
(Unaudited)
This strategy expands upon our previous strategies to drive sales effectiveness and improve operating efficiency to include improving overall company performance as measured by the Rule of 40 (see discussion of Non-GAAP Financial Measures below). We have a strong executive team that is delivering on our mission and executing on our strategy. We have talent across our company, at every level, who are aligned with these goals as well.
3.Delight Customers with Innovative Cloud Solutions
2020 required unprecedented speed and scale to support our customers, and we were quick to reprioritize and expedite product enhancements to support our customers' changing needs as they needed to operate more digitally. We have carried that momentum into 2021. For example, we upgraded virtually all of our Blackbaud Grantmaking customers to a new SKY UX version in just one month's time. This helps alleviate our customers' IT burden, improves data security with multi-factor authentication and provides freedom and flexibility to access advanced grant management technology anywhere via any browser on any device. With more veteran grantmakers using mobile technology and a younger generation of grantmakers emerging in the philanthropic community, providing convenient access to grant data and grant management tools will continue to be critical for success. Blackbaud plays a critical role in accelerating our customers' move to the cloud. In higher education, with the COVID-19 pandemic accelerating the need for powerful cloud-based systems that allow for easier collaboration, Blackbaud CRM has been the trusted CRM solution for a growing number of institutions to support their overall advancement needs.
4.Focus on Employees, Culture and ESG Initiatives
During the first quarter of 2021, we elevated a specific strategy focused on employees, culture and ESG initiatives. This is not new for us. It is something that has been in our DNA for a long time and is a big advantage as we look to attract and retain top talent. This is evident in our 2020 social responsibility report, which was released in April 2021, and demonstrates how we responded to the unique challenges the pandemic created for our employees, customers, and communities. We also expanded this year's report to include voluntary ESG reporting disclosures that align with the Sustainability Accounting Standards Board and Global Reporting Initiative. One highlight from the report is that the Company is comprised of 46% female employees and 54% male employees, which is an industry-leading ratio. We are fully committed to continuing to create a diverse and inclusive environment at all levels of the organization.
Financial Summary
|
| | | | | | | |
| Total revenue ($M) | | Income from operations ($M) |
| YoY Growth (%) | | YoY Growth (%) |
| | | | | | | | |
| 22 | | First Quarter 2021 Form 10-Q |
Blackbaud, Inc.
(Unaudited)
Total revenue increaseddecreased by $6.4 million and $14.1$4.4 million during the three and six months ended June 30, 2020, respectively,March 31, 2021, when compared to the same periodsperiod in 2019,2020, driven largely by the following:
|
| | | | | | | | | | |
| +- | | Growth in recurring revenue related to increases in transactional revenue, positive demand from customers across our portfolio of cloud solutions and increases in services embedded in our renewable cloud solution contracts |
| - | | DecreasesDecrease in one-time consulting revenue due primarily fromto less implementation and customization services. We changed our commission plans during the first quarter of 2020 to intentionally shift our sales teams' focus towards selling our cloud solutions. Additionally, the bookings shortfalls during 2020 caused by the COVID-19 pandemic contributed to the decrease in one-time sales related to COVID-19consulting revenue. |
| - | | DecreasesDecrease in one-time analytics revenue as analytics are generally integrated in our cloud solutions |
| + | | Growth in recurring revenue related to an increase in transactional revenue related to charitable giving |
Income from operations increaseddecreased by $6.1 million and $12.3$1.8 million during the three and six months ended June 30, 2020, respectively,March 31, 2021, when compared to the same periodsperiod in 2019,2020, driven largely by the following:
|
| | | | | | | | | | |
| +- | | GrowthIncrease in stock-based compensation costs of $16.4 million due to: •replacement of our annual cash bonus plans with a short-term performance-based equity award plan; •increases in the grant date fair values of our annual equity awards granted to employees; •in response to COVID-19, replacement of our 2020 base salary merit increases with one-year time-based equity awards; •overall Company performance against 2020 goals; and •decrease in the vesting period for our annual long-term incentive time-based equity awards from 4 years (1/4 per year) to 3 years (1/3 per year), beginning in February 2021. |
| - | | Decrease in total revenue, as described above |
| + | | Reduced overall compensation costs primarily associated with the decision to replace our 2020 cash bonus plans with grants of performance-based equity awards |
| + | | Decrease in restructuringcompensation costs other than stock-based compensation of $0.7$12.7 million and $2.6 million, as our facilities optimization plan was largely completed as of December 31, 2019primarily due to a decrease in headcount |
| + | | Decrease in acquisition-related expenses and integrationtravel costs of $0.8$3.6 million and $1.9 milliondue to our restriction on non-essential employee travel in response to the COVID-19 pandemic |
| + | | Decrease in amortization of intangible assets from business combinations of $2.1 million and $3.2$2.0 million |
| - | | Increases in cost of revenue from a $4.3 million impairment charge during the three months ended June 30, 2020, against certain previously capitalized software development costs, resulting from our decision to accelerate the end of customer support for certain solutions |
| - | | Increases in employee severance of $4.1 million and $0.7 million, related to a modest and targeted headcount reduction during the three months ended June 30, 2020, in response to the COVID-19 pandemic |
| - | | Increases in corporate costs of $3.1 million and $3.4 million, primarily related to increases in bad debt expense |
| - | | Other increases in cost of revenue related to increases in data center costs, amortization of software development costs and transaction-based costs |
|
| | |
24 | | Second Quarter 2020 Form 10-Q |
Blackbaud, Inc.
(Unaudited)
There are three primary revenue categories with related business drivers that we continue to monitor closely in light of the COVID-19 pandemic:
| |
1. | Contractual Recurring Revenue (approximately two thirds of total revenue in 2019) |
Recurring subscription contracts are typically for a term of three years at contract inception, billed annually in advance, and we have been for several years successfully shifting our legacy customer base away from annual renewals and moving them onto multi-year renewal contracts. Approximately one-half of our contracted recurring revenue will be up for renewal during 2020, with the seasonal high for renewals and collections during the third quarter driven largely by mid-year fiscal year-ends and timing of the academic school year. While our renewal rates have trended ahead of our expectations through July, our contracted recurring revenue has fallen short of our original plan due to bookings falling short of our budgeted expectations. We are closely monitoring our customer receivable balances, payment terms, and creditworthiness. We have started to experience an increase in our aging of receivables and observed changes in some of our customers' payment behavior associated with the COVID-19 pandemic.
| |
2. | Transactional Revenue (approximately one quarter of total revenue in 2019) |
Transactional revenue is non-contractual and less predictable given the susceptibility to certain drivers such as timing and number of events and marketing campaigns, as well as fluctuations in donation volumes and tuition payments. We have historically experienced seasonal highs during the fourth quarter due to year-end giving campaigns and during the second quarter when a large number of events are held. The early disruptions caused by COVID-19 in the first quarter drove sharp initial declines in our transactional volumes. During the second quarter, many in-person events shifted online, had to be postponed or even canceled. Social good organizations are being forced to employ new strategies to maintain momentum with current supporters while capturing the attention of potential new donors. We saw a rise in virtual campaigns and events and we remain committed to supporting our customers in adapting to the new circumstances.
Given our ratable revenue recognition model for our recurring subscription contracts and implementation periods, we expect that declines in our 2020 bookings performance will have a greater impact on our 2021 revenue than 2020 revenue. Of the three primary revenue categories discussed above, bookings represents the smallest potential impact on recurring revenue in 2020. One-time services and other revenue, which is tied to bookings, would have a more immediate impact on our total revenue. Our first quarter has historically been the seasonal low for bookings, with the second and fourth quarters historically being seasonally higher, and our bookings tend to be back-end loaded within individual quarters given our quarterly quota plans. Although our bookings have performed slightly better than our initial COVID-19 scenario planning, we are currently expecting a significant shortfall in 2020 bookings compared to our original plan for the year as we continue to see challenges in building pipeline. The magnitude of our 2020 bookings shortfall is expected to be impacted by the depth and duration of the COVID-19 pandemic.
Our strategy has historically relied on a balanced approach to growth and profitability. As discussed above, the pandemic has created short-term uncertainty in our revenue outlook and the early impacts on pipeline and bookings will likely limit our ability to drive near-term revenue growth at our originally planned levels. Therefore, in line with our strategy, we have made a pivot to greater emphasis on delivering shareholder value through increased profitability and cash flow, which are more controllable.
|
| | |
Second Quarter 2020 Form 10-Q | | 25 |
Blackbaud, Inc.
(Unaudited)
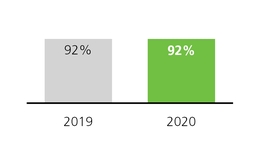
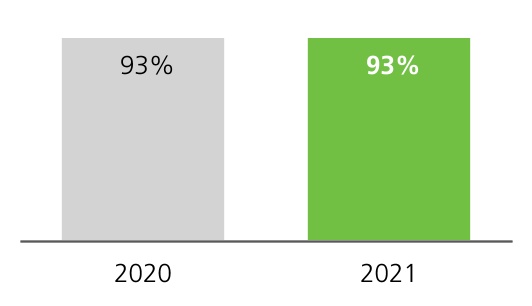
Our recurring revenue contracts are generally for a term of three years at contract inception with one to three-year renewals thereafter. We anticipate a continued decrease in maintenance contract renewals as we transition our solution portfolio and maintenance customers from a perpetual license-based model to a cloud subscription delivery model. In the long term, we also anticipate an increase in recurring subscription contract renewals as we continue focusing on innovation, quality and the integration of our cloud solutions, which we believe will provide value-adding capabilities to better address our customers' needs. Due primarily to these factors, we believe a recurring revenue customer retention measure that combines recurring subscription, maintenance and service customer contracts provides a better representation of our customers' overall behavior. For the twelve months ended June 30, 2020,March 31, 2021, approximately 92%93% of our customers with recurring revenue contracts were retained. This customer retention rate is unchanged from our rate for the full year ended December 31, 2019.2020.
Balance sheet and cash flow
At June 30, 2020,March 31, 2021, our cash and cash equivalents were $30.5$27.8 million and the carrying amount of our debt under the 20172020 Credit Facility was $484.2$488.8 million. Our net leverage ratio was 2.211.79 to 1.00.1.00.
| | | | | | | | |
| First Quarter 2021 Form 10-Q | | 23 |
Blackbaud, Inc.
(Unaudited)
During the six months ended June 30, 2020, we generated $37.5 million in cash from operations, primarily from operating cost reductions put in place in response to COVID-19 and the increased use of stock-based compensation. During the six months ended, June 30, 2020, we had a net increase in our borrowings of $16.9 million, down from a net increase of $58.6 million during the three months ended March 31, 2020. Historically, due to lower revenues2021, we generated $30.1 million in our first quarter, combined with the payment of bonuses from the prior year in our first quarter and the payment of certain annual vendor contracts, our cash flow from operations, has been lowesthad a net increase in our first quarter.
During the six months ended June 30, 2020, we alsoborrowings of $21.0 million, returned $28.1 million to stockholders by way of share repurchases and had aggregate cash outlays of $27.6$12.8 million for purchases of property and equipment and capitalized software development costs.
Recent Developments
Pending headquarters facility purchase
In June 2020, we entered into a binding purchase and sale agreement with HPBB1, LLC, a Georgia limited liability company (the "Seller"), for the purchase and sale of the building, fixtures and other improvements and parcels of land of our headquarters facility (the "Headquarters Facility") in Charleston, South Carolina (the "Transaction"). We currently lease the Headquarters facility from the Seller. At the closing of the Transaction, we would pay the Seller a purchase price of $76.3 million, which includes the assumption of the Seller's obligations in the aggregate principal amount of $63.0 million and cash, which we expect to fund by borrowings under the 2017 Credit Facility. The Transaction is expected to close during the second half of 2020.
|
| | |
26 | | Second Quarter 2020 Form 10-Q |
Blackbaud, Inc.
(Unaudited)
Comparison of the three and six months ended June 30,March 31, 2021 and 2020 and 2019
Revenue and Cost of Revenue
|
| | | | | | | | | | | | | |
| Recurring | | | | |
| Revenue ($M) | | Cost of revenue ($M) | | Gross profit ($M)
and gross margin (%) |
| YoY Growth (%) | | YoY Growth (%) | | |
Recurring revenue is comprised of fees for the use of our subscription-based software solutions, which includes providing access to cloud solutions, hosting services, online training programs, subscription-based analytic services, such as donor acquisitions and data enrichment, and payment services. Recurring revenue also includes fees from maintenance services for our on-premises solutions, services included in our renewable subscription contracts, retained and managed services contracts that we expect to have a term consistent with our cloud solution contracts, and variable transaction revenue associated with the use of our solutions.
Cost of recurring revenue is primarily comprised of compensation costs for customer support and production IT personnel, hosting and data center costs, third-party contractor expenses, third-party royalty and data expenses, allocated depreciation, facilities and IT support costs, amortization of intangible assets from business combinations, amortization of software development costs, transaction-based costs related to payments services including remittances of amounts due to third-parties and other costs incurred in providing support and recurring services to our customers.
We continued to experience growth in sales of our cloud solutions as ourOur customers continue to prefer cloud subscription offerings with integrated analytics, training and payment services. Recurring subscription contracts are typically for a term of three years at contract inception with one to three-year renewals thereafter. We intend to continue focusing on innovation, quality and integration of our cloud solutions, which we believe will drive future revenue growth.
|
| | |
Second Quarter 2020 Form 10-Q | | 27 |
Blackbaud, Inc.
(Unaudited)
Recurring revenue increased by $7.8$1.9 million or 3.7%, and $14.6 million or 3.6%0.9%, during the three and six months ended June 30, 2020, respectively,March 31, 2021, when compared to the same periodsperiod in 2019,2020, driven primarily by the following:
|
| | | | | | | | | | |
| + | | Increases in subscriptions revenue of $11.8 million and $22.4 million related to increasesIncrease in transactional revenue positive demand from customers across our portfolio of cloud solutions$2.8 million, primarily due to the continued shift toward virtual and increases in services embedded in our renewable cloud solution contractsonline fundraising and charitable giving |
| - | | DecreasesDecrease in contractual recurring revenue of $0.9 million largely due to a decrease in maintenance revenue of $4.0 million and $7.9 million primarily related to our continuing efforts to migrate customers from legacy on-premises solutions onto our cloud solutions powered by Blackbaud SKY, our modern cloud platformas well as the bookings shortfalls during 2020 resulting from COVID-19 |
Partially offsetting the increases in subscriptions revenue were decreases in the mix | | | | | | | | |
| 24 | | First Quarter 2021 Form 10-Q |
Blackbaud, Inc.
(Unaudited)
Cost of recurring revenue increaseddecreased by $4.7$0.7 million or 5.4%, and $9.6 million or 5.6%0.8%, during the three and six months ended June 30, 2020, respectively,March 31, 2021, when compared to the same periodsperiod in 2019,2020, driven primarily by the following:
|
| | | | | | | | | | |
| +- | | Impairment chargeDecrease in amortization of $4.3 million during the three months ended June 30, 2020, against certain previously capitalized software development costs that reduced the carrying value of thoseintangible assets to zero. The impairment charge resulted primarily from our decision to accelerate the end of customer support for certain solutions. |
| + | | Increases in hosting and data center costsbusiness combinations of $1.7 million and $2.2 million as we are migrating our cloud infrastructure to leading public cloud service providers |
| +- | | IncreasesDecreases in allocated facilities costs related to efficiencies in our real estate footprint, and third-party contractor costs |
| + | | Increase in compensation costs of $1.3 million primarily related to stock-based compensation due to the factors discussed above on page 23 |
| + | | Increase in amortization of software development costs of $0.8 million and $2.2$1.0 million due to investments made on innovation, quality and the integration of our cloud solutions |
| + | | Increases in transaction-based costs of $0.7 million and $3.0 million related to payment services integrated in our cloud solutions |
| + | | For the six months ended June 30, 2020, increase in third-party contractor costs of $1.2 million related to application security and partners delivering services embedded in our renewable cloud solution contracts |
| - | | Decreases in compensation costs primarily associated with the decision to replace our 2020 cash bonus plans with grants of performance-based equity awards |
| - | | Decreases in costs associated with certain retained and managed services contracts for which revenue is included in one-time services and other revenue beginning January 1, 2020, as discussed above |
The 0.7% and 0.8% decreases in recurringRecurring gross margin increased by 0.7% for the three and six months ended June 30, 2020, respectively,March 31, 2021, when compared to the same periodsperiod in 2019, were2020, primarily due to the result ofincrease in recurring revenue slightly outpacing the impairment of previously capitalized software development costs, and incremental costs associated with our continued shift toward selling cloud solutions, including data center costs and amortization of software developmentdecrease in related costs. We expect continued pressure on recurring gross margin largely driven by duplicate data center costs as we migrate our cloud infrastructure to leading cloud service providers.
|
| | |
28 | | Second Quarter 2020 Form 10-Q |
Blackbaud, Inc.
(Unaudited)
|
| | | | | | | |
| One-time services and other | | | | |
| Revenue ($M) | | Cost of revenue ($M) | | Gross profit ($M)
and gross margin (%)
|
| YoY Growth (%) | | YoY Growth (%) | | |
One-time services and other revenue is comprised of fees for one-time consulting, analytic and onsite training services, fees for retained and managed services contracts that we do not expect to have a term consistent with our cloud solution contracts, revenue from the sale of our software sold under perpetual license arrangements, fees from user conferences and third-party software referral fees.
Cost of one-time services and other is primarily comprised of compensation costs for professional services and onsite training personnel, other costs incurred in providing onsite customer training, third-party contractor expenses, data expense incurred to perform one-time analytic services, third-party software royalties, costs of user conferences, allocated depreciation, facilities and IT support costs and amortization of intangible assets from business combinations.
One-time services and other revenue decreased by $1.4$6.3 million, or 8.4%, and $0.4 million, or 1.2%33.7%, during the three and six months ended June 30, 2020, respectively,March 31, 2021, when compared to the same periodsperiod in 2019,2020, driven primarily by the following:
| | | | | | | | | | | |
| | | |
| +- | | Increases in the mix of retained and managed services contracts we present in one-time services and other. Revenue from retained and managed service contracts that we do not expect to have a term consistent with our cloud solution contracts is included in one-time services and other revenue beginning January 1, 2020. This change in presentation resulted in increases to one-time services and other revenue and offsetting decreases in recurring revenue of $4.2 million and $8.5 million during the three and six months ended June 30, 2020. |
| - | | DecreasesDecrease in one-time consulting revenue of $3.8$4.7 million due primarily to less implementation and $5.5 million, respectively, primarily from lesscustomization services. We changed our commission plans during the first quarter of 2020 to intentionally shift our sales teams' focus towards selling our cloud solutions. Additionally, the bookings shortfalls during 2020 caused by the COVID-19 pandemic contributed to the decrease in one-time sales related to COVID-19 as well as services increasingly being embedded in our renewable cloud solution contracts. Our embedded services are recorded as recurringconsulting revenue. |
| - | | DecreasesDecrease in one-time analytics revenue of $1.2 million and $2.1$1.0 million as analytics are generally integrated in our cloud solutions |
| - | | For the six months ended June 30, 2020, decreases in revenue from one-time training services and license fees |
|
| | | | | | | |
SecondFirst Quarter 20202021 Form 10-Q | | 2925 |
Blackbaud, Inc.
(Unaudited)
Cost of one-time services and other decreased by $0.6$0.8 million, or 4.1%5.2%, during the three months ended June 30, 2020,March 31, 2021, when compared to the same periods in 2019,2020, driven primarily by the following:
|
| | | | | | | | | | |
| +- | | Decrease in compensation costs other than stock-based compensation of $1.3 million largely due to a decrease in headcount |
| - | | Decrease in third-party contractor costs of $0.7 million primarily due to the timing of our spending |
| + | | Increase in stock-based compensation costs of associated with certain retained and managed services contracts for which revenue is included in one-time services and other revenue beginning January 1, 2020, as$2.6 million due to the factors discussed above |
| - | | Reduced amount of compensation costs primarily associated with the decision to replace our 2020 cash bonus plans with grants of performance-based equity awards on page 23 |
Cost of one-timeOne-time services and other remained relatively consistentgross margin decreased by 35.1% during the sixthree months ended June 30, 2020,March 31, 2021, respectively, when compared to the same period in 2019.
The 3.9% and 1.5% decreases in one-time services and other gross margin during the three and six months ended June 30, 2020, respectively, when comparedprimarily due to the same periods in 2019, were primarily the result of thesignificant reductions in one-time consulting and analytics revenue discussed above outpacing declines in the related costs.above.
Operating Expenses
|
| | | | | | | | | | | | | |
Sales, marketing and
customer success ($M)
| | Research and development ($M) | | General and administrative
($M) |
| Percentages indicate expenses as a percentage of total revenue |
Sales, marketing and customer success
Sales, marketing and customer success expense includes compensation costs, variable sales commissions, travel-related expenses, advertising and marketing materials, public relations costs, variable reseller commissions and allocated depreciation, facilities and IT support costs.
We see a large market opportunity in the long-term and will continue to make investments to drive sales effectiveness, which is a component of our four-point growth strategy.effectiveness. We have also implemented software tools to enhance our digital footprint and drive lead generation. In response to the COVID-19 pandemic, we implemented a modest and targeted headcount reduction during the second quarter of 2020, including a reduction in our sales headcount with a focus on retaining our most highly productive sales executives. After temporarily freezingThe enhancements we are making in our hiring efforts duego-to-market approach are expected to COVID-19,significantly reduce the payback period for our customer acquisition costs while increasing sales velocity. As a result, we have since began backfillingdo not expect our sales, positions with a focus on 2021 bookings.
|
| | |
30 | | Second Quarter 2020 Form 10-Q |
Blackbaud, Inc.
(Unaudited)
Sales, marketing and customer success expense decreased by $3.1$9.9 million or 5.6%16.9%, during the three months ended June 30, 2020,March 31, 2021, respectively, when compared to the same period in 2019,2020, primarily driven by the following:
|
| | | | | | | | | | |
| +- | | IncreaseDecrease in employee severancecompensation costs other than stock-based compensation of $8.6 million due to the targeted reduction in sales headcount during the second quarter of 2020, discussed above |
| - | | Decrease in allocated costs of $1.8$2.5 million primarily related to a decrease in rent expense and the impact of the targeted reduction in our sales headcount in response toduring the COVID-19 pandemicsecond quarter of 2020, as discussed above |
| - | | Decrease in travel costs of $1.9$2.2 million due to our restriction on non-essential employee travel in response to the COVID-19 pandemic |
| - | | Decrease |
| + | | Increase in stock-based compensation costs of $1.7$2.9 million primarily relateddue to the decision to replace our 2020 cash bonus plans with grants of performance-based equity awards |
| - | | Decrease in commissions expense of $0.7 million related to a decrease in commissionable sales.factors discussed above on page 23 |
Sales, marketing and customer success expense remained relatively consistent during the six months ended June 30, 2020, when compared to the same period in 2019, primarily driven by the following:
|
| | | | | | | |
| 26 | + | | Increase in employee severance costs of $0.9 million related to a reduction in our sales headcount in response to the COVID-19 pandemic as discussed above |
| + | | Increase in compensation costs of $0.9 million primarily associated with the elevated headcount of our direct sales force and our lead generation teams, beginning in the fourth quarter of 2018. The increase in compensation costs related to elevated headcount was partially offset by the decision to replace our 2020 cash bonus plans with grants of performance-based equity awards |
| - | | Decrease in travel costs of $1.4 million due to our restriction on non-essential employee travel in response to the COVID-19 pandemicFirst Quarter 2021 Form 10-Q |
Blackbaud, Inc.
(Unaudited)
Research and development
Research and development expense includes compensation costs for engineering and product management personnel, third-party contractor expenses, software development tools and other expenses related to developing new solutions or upgrading and enhancing existing solutions that do not qualify for capitalization, and allocated depreciation, facilities and IT support costs.
We continue to make investments to delight our customers with innovative cloud solutions, which is a component of our four-point growth strategy. We increased engineering hiring beginning in the fourth quarter of 2020.
Research and development expenses decreasedincreased by $1.0$4.2 million or 3.9%, and $4.5 million or 8.3%16.8%, during the three and six months ended June 30, 2020, respectively,March 31, 2021, when compared to the same periodsperiod in 2019,2020, primarily driven by decreases in compensation costs of $1.8 million and $3.5 million, respectively, associated with the decision in March 2020 to replace our 2020 cash bonus plans with grants of performance-based equity awards.following:
| | | | | | | | | | | |
| + | | Increase in compensation costs of $3.3 million primarily related to stock-based compensation due to the factors discussed above on page 23 |
| | | |
| + | | Decrease in software development costs of $1.7 million that were required to be capitalized under the internal-use software guidance, primarily due to lower engineering headcount |
Not included in research and development expense for the three months ended June 30,March 31, 2021 and 2020 and 2019 were $10.6$9.1 million and $11.7 million, respectively, and for the six months ended June 30, 2020 and 2019 were $21.4 million and $22.8$10.8 million, respectively, of qualifying costs associated with development activities that are required to be capitalized under the internal-use software accounting guidance such as those for our cloud solutions, as well as development costs associated with acquired companies. Qualifying capitalized software development costs associated with our cloud solutions are subsequently amortized to cost of subscriptions revenue over the related asset's estimated useful life, which generally range from three to seven years. We expect that the amount of software development costs capitalized will be relatively consistent in the near-term as we continue making investments in innovation, quality and the integration of our solutions, which we believe will drive long-term revenue growth.
General and administrative
General and administrative expense consists primarily of compensation costs for general corporate functions, including senior management, finance, accounting, legal, human resources and corporate development, third-party professional fees, insurance, allocated depreciation, facilities and IT support costs, acquisition-related expenses and other administrative expenses.
|
| | |
Second Quarter 2020 Form 10-Q | | 31 |
Blackbaud, Inc.
(Unaudited)
General and administrative expense increased by $1.3$4.7 million or 4.6%18.3%, during the three months ended June 30, 2020 and remained relatively consistent during the six months ended June 30, 2020,March 31, 2021, when compared to the same periodsperiod in 2019,2020, primarily driven by the following:
| | | | | | | | | | | |
| + | | Increase in stock-based compensation costs of $5.1 million due to the factors discussed above on page 23 |
| + | | Increase in corporate costs of $2.2 million primarily related to increases in third-party consulting fees and insurance costs |
| - | | Decrease in rent expense of $3.0 million primarily related to the purchase of our global headquarters facility during the third quarter of 2020 and our exit of certain other office leases globally during the second half of 2020 in-line with our new workforce strategy, discussed above |
| | | |
| | | |
| + | | Increases in corporate costs of $3.1 million and $3.4 million primarily related to increases in bad debt expense |
| - | | Decreases in bonus expense of $1.3 million and $2.8 million primarily related to the decision to replace our 2020 cash bonus plans with grants of performance-based equity awards |
Restructuring
During 2017, in an effort to further our organizational objectives, including improved operating efficiency, customer outcomes and employee satisfaction, we initiated a multi-year plan to consolidate and relocate some of our existing offices to highly modern and more collaborative workspaces with short-term financial commitments, which was substantially completed as of December 2019. During the three and six months ended June 30, 2019, we incurred $0.7 million and $2.7 million, respectively, in before-tax restructuring charges related to these activities. Such charges during the three and six months ended June 30, 2020 were insignificant.
|
| | | | | | | | | | | | | | | | | |
| Interest Expense | | | | | | | |
| | Three months ended
June 30, | | | Six months ended
June 30, | |
| (dollars in millions) | 2020 |
| 2019 |
| Change |
| | 2020 |
| 2019 |
| Change |
|
| Interest expense | $ | 3.9 |
| $ | 5.8 |
| (32.9 | )% | | $ | 8.1 |
| $ | 11.1 |
| (27.6 | )% |
| % of total revenue | 1.7 | % | 2.6 | % | | | 1.8 | % | 2.5 | % | |
| | | | | | | | |
| First Quarter 2021 Form 10-Q | | 27 |
Blackbaud, Inc.
(Unaudited)
Interest Expense
| | | | | | | | |
| Interest expense ($M) | | |
| Percentages indicate expenses as a percentage of total revenue | | |
The decreasesincrease in interest expense in dollars and as a percentage of total revenue during the three and six months ended June 30, 2020,March 31, 2021, when compared to the same periodsperiod in 2019, were2020, was primarily due to decreasesthe Real Estate Loans assumed for the purchase of our global headquarters facility in our average daily borrowingsAugust 2020 and our weighted average effective interest rates.the deferred financing costs and debt discount associated with the 2020 Credit Facility, which was entered into in October 2020.
Deferred Revenue
The table below compares the components of deferred revenue from our consolidated balance sheets:
| | | | | | | | | | | | | | |
| (dollars in millions) | Timing of recognition | March 31,
2021 | December 31,
2020 | Change |
| Recurring | Over the period billed in advance,
generally one year | $ | 278.0 | | $ | 303.8 | | (8.5) | % |
| One-time services and other | As services are delivered | 16.5 | | 13.1 | | 26.4 | % |
Total deferred revenue(1) | | 294.5 | | 316.9 | | (7.1) | % |
| Less: Long-term portion | | 4.5 | | 4.7 | | (3.9) | % |
Current portion(1) | | $ | 290.0 | | $ | 312.2 | | (7.1) | % |
|
| | | | | | | | | |
| (dollars in millions) | Timing of recognition | June 30,
2020 |
| December 31,
2019 |
| Change |
|
| Recurring | Over the period billed in advance, generally one year | $ | 322.1 |
| $ | 302.8 |
| 6.4 | % |
| One-time services and other | As services are delivered | 15.1 |
| 13.4 |
| 12.8 | % |
Total deferred revenue(1) | | 337.2 |
| 316.1 |
| 6.7 | % |
| Less: Long-term portion | | 4.6 |
| 1.8 |
| 156.7 | % |
Current portion(1) | | $ | 332.6 |
| $ | 314.3 |
| 5.8 | % |
| |
(1) | The individual amounts for each year may not sum to total deferred revenue or current portion of deferred revenue due to rounding. |
To the extent that our customers are billed for our solutions and services in advance of delivery, we record such amounts in deferred revenue. Our recurring revenue contracts are generally for a term of three years at contract inception, with one to three-year renewals thereafter, billed annually in advance, and non-cancelable. We have been for several years successfully shifting our legacy customer base away from annual renewals and moving them onto multi-year renewal contracts. We generally invoice our customers with recurring revenue contracts in annual cycles 30 days prior to the end of the contract term.each one-year period.
Deferred revenue from recurring revenue contracts increaseddecreased during the sixthree months ended June 30, 2020,March 31, 2021, primarily due a seasonal increasedecrease in customer contract renewals and new subscription sales of our cloud solutions.renewals. Historically, due to the timing of customer budget cycles, we have an increase in customer contract renewals at or near the beginning of our third quarter, which generally results in our lowest balance of deferred revenue at the end of our first quarter. Deferred revenue from one-time services and other increased during the sixthree months ended June 30, 2020,March 31, 2021, primarily due an increase into increased bookings during the mixfourth quarter of retained2020 and managed services contracts we present in one-time services and other beginning January 1, 2020, as discussed above.
We have acquired businesses whose net tangible assets include deferred revenue. In accordance with GAAP reporting requirements, we recorded write-downsthe first quarter of deferred revenue from customer arrangements predating the acquisition to
|
| | | | | | | |
3228 | | SecondFirst Quarter 20202021 Form 10-Q |
Blackbaud, Inc.
(Unaudited)
fair value, which resulted in lower recorded deferred revenue as of the acquisition date than the actual amounts paid in advance for solutions and services under those customer arrangements. Therefore, our deferred revenue after an acquisition will not reflect the full amount of deferred revenue that would have been reported if the acquired deferred revenue was not written down to fair value. Further explanation of this impact is included below under the caption "Non-GAAP financial measures". | | | | | | | | |
| Income tax provision ($M) | | |
| Percentages indicate effective income tax rates | | |
|
| | | | | | | | | | | | | | | | | |
| Income tax provision | | | | | | | |
| | Three months ended
June 30, | | | Six months ended
June 30, | |
| (dollars in millions) | 2020 |
| 2019 |
| Change |
| | 2020 |
| 2019 |
| Change |
|
| Income tax provision | $ | 4.5 |
| $ | 2.7 |
| 64.5 | % | | $ | 5.2 |
| $ | 0.9 |
| 477.5 | % |
| Effective income tax rate | 27.6 | % | 27.7 | % | | | 24.0 | % | 13.0 | % | |
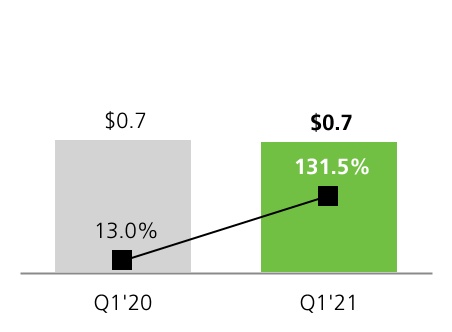
The increase in our effective income tax rate duringfor the sixthree months ended June 30, 2020,March 31, 2021, when compared to the same period in 2019,2020, was primarily attributable to improvedhigher 2021 discrete tax expense against lower pre-tax income. The 2020 profitability and changes in jurisdictional mix and reduced 2020 non-deductible costs. Furthermore, our 2020 effective income tax rate was positively impacted by benefits attributable to stock-based compensation. The 2021 effective income tax rate was negatively impacted by a decrease in the total discrete benefit to income tax expense relatedattributable to stock-based compensation.compensation against lower pre-tax income.
Non-GAAP Financial Measures
The operating results analyzed below are presented on a non-GAAP basis. We use non-GAAP revenue, non-GAAP gross profit, non-GAAP gross margin, non-GAAP income from operations, non-GAAP operating margin, non-GAAP net income and non-GAAP diluted earnings per sharefinancial measures internally in analyzing our operational performance. Accordingly, we believe these non-GAAP measures are useful to investors, as a supplement to GAAP measures, in evaluating our ongoing operational performance. While we believe these non-GAAP measures provide useful supplemental information, non-GAAP financial measures should not be considered in isolation from, or as a substitute for, financial information prepared in accordance with GAAP. In addition, these non-GAAP financial measures may not be completely comparable to similarly titled measures of other companies due to potential differences in the exact method of calculation between companies.
We have acquired businesses whose net tangible assets include deferred revenue. In accordance with GAAP reporting requirements, we recorded write-downs of deferred revenue under arrangements predating the acquisition to fair value, which resulted in lower recognized revenue than the contributed purchase price until the related obligations to provide services under such arrangements are fulfilled. Therefore, our GAAP revenues after the acquisitions will not reflect the full amount of revenue that would have been reported if the acquired deferred revenue was not written down to fair value. The non-GAAP measures described below reverse the acquisition-related deferred revenue write-downs so that the full amount of revenue booked by the acquired companies is included, which we believe provides a more accurate representation of a revenue run-rate in a given period and, therefore, will provide more meaningful comparative results in future periods.
The non-GAAP financial measures discussed below exclude the impact of certain transactions because we believe they are not directly related to our operating performance in any particular period, but are for our long-term benefit over multiple periods. We believe that these non-GAAP financial measures reflect our ongoing business in a manner that allows for meaningful period-to-period comparisons and analysis of trends in our business.
| | | | | | | | | | | | | | | |
| | | Three months ended March 31, |
| (dollars in millions) | | | | | 2021 | 2020 | Change |
| | | | | | | |
| | | | | | | |
| | | | | | | |
| | | | | | | |
| | | | | | | |
| GAAP gross profit | | | | | $ | 115.8 | | $ | 118.8 | | (2.5) | % |
| GAAP gross margin | | | | | 52.8 | % | 53.1 | % | |
| Non-GAAP adjustments: | | | | | | | |
| | | | | | | |
| Add: Stock-based compensation expense | | | | | 5.4 | | 0.9 | | 519.4 | % |
| Add: Amortization of intangibles from business combinations | | | | | 9.1 | | 10.9 | | (16.5) | % |
| | | | | | | |
| | | | | | | |
Subtotal(1) | | | | | 14.5 | | 11.8 | | 22.5 | % |
Non-GAAP gross profit(1) | | | | | $ | 130.3 | | $ | 130.6 | | (0.2) | % |
| Non-GAAP gross margin | | | | | 59.4 | % | 58.4 | % | |
| | | | | | | |
| | | | | | | |
| | | | | | | |
| | | | | | | |
| | | | | | | |
| | | | | | | |
| | | | | | | |
| | | | | | | |
| | | | | | | |
| | | | | | | |
| | | | | | | |
| | | | | | | |
| | | | | | | |
| | | | | | | |
(1)The individual amounts for each year may not sum to non-GAAP revenue, subtotal or non-GAAP gross profit due to rounding.
|
| | | | | | | |
SecondFirst Quarter 20202021 Form 10-Q | | 3329 |
Blackbaud, Inc.
(Unaudited)
| | | | | | | | | | | | | | | |
| | | Three months ended March 31, |
| (dollars in millions, except per share amounts) | | | | | 2021 | 2020 | Change |
| GAAP income from operations | | | | | $ | 6.6 | | $ | 8.4 | | (21.1) | % |
| GAAP operating margin | | | | | 3.0 | % | 3.8 | % | |
| Non-GAAP adjustments: | | | | | | | |
| | | | | | | |
| Add: Stock-based compensation expense | | | | | 30.0 | | 13.6 | | 120.9 | % |
| Add: Amortization of intangibles from business combinations | | | | | 9.7 | | 11.7 | | (17.1) | % |
| Add: Employee severance | | | | | 1.0 | | 0.1 | | 921.6 | % |
| Add: Acquisition-related integration costs | | | | | (0.1) | | — | | 206.3 | % |
| Add: Acquisition-related expenses | | | | | 0.1 | | 0.1 | | (53.2) | % |
| Add: Restructuring and other real estate activities | | | | | (0.1) | | — | | (562.5) | % |
Subtotal(1) | | | | | 40.5 | | 25.5 | | 59.1 | % |
Non-GAAP income from operations(1) | | | | | $ | 47.2 | | $ | 33.9 | | 39.1 | % |
| Non-GAAP operating margin | | | | | 21.5 | % | 15.2 | % | |
| | | | | | | |
| GAAP income before provision for income taxes | | | | | $ | 0.5 | | $ | 5.3 | | (90.3) | % |
| GAAP net (loss) income | | | | | $ | (0.2) | | $ | 4.6 | | (103.5) | % |
| Shares used in computing GAAP diluted earnings per share | | | | | 47,363,197 | | 48,455,751 | | (2.3) | % |
| GAAP diluted earnings per share | | | | | $ | — | | $ | 0.10 | | (100.0) | % |
| Non-GAAP adjustments: | | | | | | | |
| Add: GAAP income tax provision | | | | | 0.7 | | 0.7 | | (1.7) | % |
| Add: Total non-GAAP adjustments affecting income from operations | | | | | 40.5 | | 25.5 | | 59.1 | % |
| | | | | | | |
| | | | | | | |
| Non-GAAP income before provision for income taxes | | | | | 41.0 | | 30.8 | | 33.2 | % |
Assumed non-GAAP income tax provision(2) | | | | | 8.2 | | 6.2 | | 33.2 | % |
Non-GAAP net income(1) | | | | | $ | 32.8 | | $ | 24.7 | | 33.2 | % |
| | | | | | | |
| Shares used in computing non-GAAP diluted earnings per share | | | | | 48,387,042 | | 48,455,751 | | (0.1) | % |
| Non-GAAP diluted earnings per share | | | | | $ | 0.68 | | $ | 0.51 | | 33.3 | % |
(1)The individual amounts for each year may not sum to subtotal, non-GAAP income from operations or non-GAAP net income due to rounding. |
| | | | | | | | | | | | | | | | | |
| | Three months ended
June 30, | | | Six months ended
June 30, | |
| (dollars in millions) | 2020 |
| 2019 |
| Change |
| | 2020 |
| 2019 |
| Change |
|
| GAAP Revenue | $ | 232.0 |
| $ | 225.6 |
| 2.8 | % | | $ | 455.6 |
| $ | 441.5 |
| 3.2 | % |
| Non-GAAP adjustments: | | | | | | | |
| Add: Acquisition-related deferred revenue write-down | — |
| 0.7 |
| (100.0 | )% | | — |
| 1.4 |
| (100.0 | )% |
Non-GAAP revenue(1) | $ | 232.0 |
| $ | 226.4 |
| 2.5 | % | | $ | 455.6 |
| $ | 442.9 |
| 2.9 | % |
| | | | | | | | |
| GAAP gross profit | $ | 127.1 |
| $ | 124.8 |
| 1.8 | % | | $ | 245.8 |
| $ | 241.4 |
| 1.8 | % |
| GAAP gross margin | 54.8 | % | 55.3 | % | | | 54.0 | % | 54.7 | % | |
| Non-GAAP adjustments: | | | | | | | |
| Add: Acquisition-related deferred revenue write-down | — |
| 0.7 |
| (100.0 | )% | | — |
| 1.4 |
| (100.0 | )% |
| Add: Stock-based compensation expense | 2.6 |
| 0.8 |
| 224.9 | % | | 3.4 |
| 1.8 |
| 94.6 | % |
| Add: Amortization of intangibles from business combinations | 9.7 |
| 11.3 |
| (14.5 | )% | | 20.6 |
| 22.7 |
| (9.4 | )% |
| Add: Employee severance | 0.8 |
| — |
| (19,625.0 | )% | | 0.8 |
| 1.1 |
| (27.1 | )% |
Subtotal(1) | 13.0 |
| 12.8 |
| 1.6 | % | | 24.9 |
| 27.1 |
| (8.1 | )% |
Non-GAAP gross profit(1) | $ | 140.1 |
| $ | 137.7 |
| 1.8 | % | | $ | 270.7 |
| $ | 268.4 |
| 0.8 | % |
| Non-GAAP gross margin | 60.4 | % | 60.8 | % | | | 59.4 | % | 60.6 | % | |
| |
(1) | The individual amounts for each year may not sum to non-GAAP revenue, subtotal or non-GAAP gross profit due to rounding. |
|
| | |
34 | | Second Quarter 2020 Form 10-Q |
Blackbaud, Inc.
(Unaudited)
|
| | | | | | | | | | | | | | | | | |
| | Three months ended
June 30, | | | Six months ended
June 30, | |
| (dollars in millions, except per share amounts) | 2020 |
| 2019 |
| Change |
| | 2020 |
| 2019 |
| Change |
|
| GAAP income from operations | $ | 19.6 |
| $ | 13.5 |
| 45.1 | % | | $ | 28.0 |
| $ | 15.7 |
| 78.7 | % |
| GAAP operating margin | 8.4 | % | 6.0 | % | | | 6.1 | % | 3.6 | % | |
| Non-GAAP adjustments: | | | | | | | |
| Add: Acquisition-related deferred revenue write-down | — |
| 0.7 |
| (100.0 | )% | | — |
| 1.4 |
| (100.0 | )% |
| Add: Stock-based compensation expense | 20.1 |
| 15.0 |
| 34.0 | % | | 33.7 |
| 28.8 |
| 17.2 | % |
| Add: Amortization of intangibles from business combinations | 10.4 |
| 12.5 |
| (16.6 | )% | | 22.1 |
| 25.3 |
| (12.6 | )% |
| Add: Employee severance | 4.3 |
| 0.2 |
| 2,132.5 | % | | 4.4 |
| 3.6 |
| 20.7 | % |
| Add: Acquisition-related integration costs | (0.1 | ) | 0.5 |
| (115.3 | )% | | (0.1 | ) | 1.2 |
| (108.7 | )% |
| Add: Acquisition-related expenses | 0.1 |
| 0.4 |
| (76.7 | )% | | 0.2 |
| 0.8 |
| (72.3 | )% |
| Add: Restructuring costs | 0.1 |
| 0.7 |
| (93.2 | )% | | 0.1 |
| 2.7 |
| (97.2 | )% |
Subtotal(1) | 34.9 |
| 30.0 |
| 16.3 | % | | 60.4 |
| 63.7 |
| (5.3 | )% |
Non-GAAP income from operations(1) | $ | 54.5 |
| $ | 43.5 |
| 25.3 | % | | $ | 88.4 |
| $ | 79.4 |
| 11.3 | % |
| Non-GAAP operating margin | 23.5 | % | 19.2 | % | | | 19.4 | % | 17.9 | % | |
| | | | | | | | |
| GAAP income before provision for income taxes | $ | 16.3 |
| $ | 9.9 |
| 65.3 | % | | $ | 21.7 |
| $ | 6.9 |
| 213.1 | % |
| GAAP net income | $ | 11.8 |
| $ | 7.1 |
| 65.6 | % | | $ | 16.5 |
| $ | 6.0 |
| 173.5 | % |
| Shares used in computing GAAP diluted earnings per share | 48,418,378 |
| 48,160,684 |
| 0.5 | % | | 48,465,077 |
| 48,101,212 |
| 0.8 | % |
| GAAP diluted earnings per share | $ | 0.24 |
| $ | 0.15 |
| 60.0 | % | | $ | 0.34 |
| $ | 0.13 |
| 161.5 | % |
| Non-GAAP adjustments: | | | | | | | |
| Add: GAAP income tax provision | 4.5 |
| 2.7 |
| 64.5 | % | | 5.2 |
| 0.9 |
| 477.5 | % |
| Add: Total non-GAAP adjustments affecting income from operations | 34.9 |
| 30.0 |
| 16.3 | % | | 60.4 |
| 63.7 |
| (5.3 | )% |
| Non-GAAP income before provision for income taxes | 51.2 |
| 39.8 |
| 28.5 | % | | 82.0 |
| 70.7 |
| 16.1 | % |
Assumed non-GAAP income tax provision(2) | 10.2 |
| 8.0 |
| 28.5 | % | | 16.4 |
| 14.1 |
| 16.1 | % |
Non-GAAP net income(1) | $ | 41.0 |
| $ | 31.9 |
| 28.5 | % | | $ | 65.6 |
| $ | 56.5 |
| 16.1 | % |
| | | | | | | | |
| Shares used in computing non-GAAP diluted earnings per share | 48,418,378 |
| 48,160,684 |
| 0.5 | % | | 48,465,077 |
| 48,101,212 |
| 0.8 | % |
| Non-GAAP diluted earnings per share | $ | 0.85 |
| $ | 0.66 |
| 28.8 | % | | $ | 1.35 |
| $ | 1.18 |
| 14.4 | % |
| |
(1) | The individual amounts for each year may not sum to subtotal, non-GAAP income from operations or non-GAAP net income due to rounding. |
| |
(2) | We apply a non-GAAP effective tax rate of 20.0% when calculating non-GAAP net income and non-GAAP diluted earnings per share. |
Non-GAAP free cash flow is defined as operating cash flow less capital expenditures, including costs required to be capitalized for software development, and capital expenditures for property and equipment.
|
| | | | | | | | |
| | Six months ended
June 30, | |
| (dollars in millions) | 2020 |
| 2019 |
| Change |
|
| GAAP net cash provided by operating activities | $ | 37.5 |
| $ | 45.1 |
| (16.9 | )% |
| Less: purchase of property and equipment | (5.9 | ) | (6.4 | ) | (7.7 | )% |
| Less: capitalized software development costs | (21.7 | ) | (23.2 | ) | (6.6 | )% |
| Non-GAAP free cash flow | $ | 9.9 |
| $ | 15.5 |
| (36.0 | )% |
| | | | | | | | | | | |
| Three months ended March 31, |
| (dollars in millions) | 2021 | 2020 | Change |
| GAAP net cash provided by (used in) operating activities | $ | 30.1 | | $ | (24.5) | | (222.9) | % |
| Less: purchase of property and equipment | (3.5) | | (2.9) | | 21.0 | % |
| Less: capitalized software development costs | (9.3) | | (10.9) | | (14.9) | % |
| Non-GAAP free cash flow | $ | 17.3 | | $ | (38.3) | | (145.2) | % |
|
| | | | | | | |
Second30 | | First Quarter 20202021 Form 10-Q | | 35 |
Blackbaud, Inc.
(Unaudited)
Non-GAAP organic revenue growth
In addition, we discuss non-GAAP organic revenue growth, non-GAAP organic revenue growth on a constant currency basis and non-GAAP organic recurring revenue growth, in analyzing our operating performance. We believe that these non-GAAP measures are useful to investors, as a supplement to GAAP measures, for evaluating the periodic growth of our business on a consistent basis. Each of these measures of non-GAAP organic revenue growth excludes incremental acquisition-related revenue attributable to companies acquired in the current fiscal year. For companies, if any, acquired in the immediately preceding fiscal year, each of these non-GAAP organic revenue growth measures reflects presentation of full year incremental non-GAAP revenue derived from such companies as if they were combined throughout the prior period, and they include the non-GAAP revenue attributable to those companies, as if there were no acquisition-related write-downs of acquired deferred revenue to fair value as required by GAAP. In addition, each of these non-GAAP organic revenue growth measures excludes prior period revenue associated with divested businesses. The exclusion of the prior period revenue is to present the results of the divested businesses within the results of the combined company for the same period of time in both the prior and current periods. We believe this presentation provides a more comparable representation of our current business’ organic revenue growth and revenue run-rate.
| | | | | | | | | | | |
| (dollars in millions) | | | Three months ended March 31, |
| | | 2021 | 2020 |
| GAAP revenue | | | | $ | 219.2 | | $ | 223.6 | |
| GAAP revenue growth | | | | (2.0) | % | |
Add: Non-GAAP acquisition-related revenue (1) | | | | — | | — | |
Non-GAAP organic revenue (2) | | | | $ | 219.2 | | $ | 223.6 | |
| Non-GAAP organic revenue growth | | | | (2.0) | % | |
| | | | | |
Non-GAAP organic revenue (2) | | | | $ | 219.2 | | $ | 223.6 | |
Foreign currency impact on Non-GAAP organic revenue (3) | | | | (2.0) | | — | |
Non-GAAP organic revenue on constant currency basis (3) | | | | $ | 217.2 | | $ | 223.6 | |
| Non-GAAP organic revenue growth on constant currency basis | | | | (2.9) | % | |
| | | | | |
| GAAP recurring revenue | | | | $ | 206.8 | | $ | 204.9 | |
| GAAP recurring revenue growth | | | | 0.9 | % | |
Add: Non-GAAP acquisition-related revenue (1) | | | | — | | — | |
| Non-GAAP organic recurring revenue | | | | $ | 206.8 | | $ | 204.9 | |
| Non-GAAP organic recurring revenue growth | | | | 0.9 | % | |
|
| | | | | | | | | | | | | |
| (dollars in millions) | Three months ended
June 30, | | | Six months ended
June 30, | |
| 2020 |
| 2019 |
| | 2020 |
| 2019 |
|
| GAAP revenue | $ | 232.0 |
| $ | 225.6 |
| | $ | 455.6 |
| $ | 441.5 |
|
| GAAP revenue growth | 2.8 | % | | | 3.2 | % | |
Add: Non-GAAP acquisition-related revenue (1) | — |
| 0.7 |
| | — |
| 1.4 |
|
Non-GAAP organic revenue (2) | $ | 232.0 |
| $ | 226.4 |
| | $ | 455.6 |
| $ | 442.9 |
|
| Non-GAAP organic revenue growth | 2.5 | % | | | 2.9 | % | |
| | | | | | |
Non-GAAP organic revenue (2) | $ | 232.0 |
| $ | 226.4 |
| | $ | 455.6 |
| $ | 442.9 |
|
Foreign currency impact on Non-GAAP organic revenue (3) | 2.0 |
| — |
| | 2.3 |
| — |
|
Non-GAAP organic revenue on constant currency basis (3) | $ | 234.0 |
| $ | 226.4 |
| | $ | 457.9 |
| $ | 442.9 |
|
| Non-GAAP organic revenue growth on constant currency basis | 3.4 | % | | | 3.4 | % | |
| | | | | | |
| GAAP recurring revenue | $ | 216.3 |
| $ | 208.5 |
| | $ | 421.1 |
| $ | 406.6 |
|
| GAAP recurring revenue growth | 3.7 | % | | | 3.6 | % | |
Add: Non-GAAP acquisition-related revenue (1) | — |
| 0.7 |
| | — |
| 1.4 |
|
| Non-GAAP organic recurring revenue | $ | 216.3 |
| $ | 209.2 |
| | $ | 421.1 |
| $ | 408.0 |
|
| Non-GAAP organic recurring revenue growth | 3.4 | % | | | 3.2 | % | |
| |
(1) | Non-GAAP acquisition-related revenue excludes incremental acquisition-related revenue calculated in accordance with GAAP that is attributable to companies acquired in the current fiscal year. For companies, if any, acquired in the immediately preceding fiscal year, non-GAAP acquisition-related revenue reflects presentation of full-year incremental non-GAAP revenue derived from such companies, as if they were combined throughout the prior period, and it includes the non-GAAP revenue from the acquisition-related deferred revenue write-down attributable to those companies. |
| |
(2) | Non-GAAP organic revenue for the prior year periods presented herein will not agree to non-GAAP organic revenue presented in the respective prior period quarterly financial information solely due to the manner in which non-GAAP organic revenue growth is calculated. |
| |
(3) | To determine non-GAAP organic revenue growth on a constant currency basis, revenues from entities reporting in foreign currencies were translated to U.S. Dollars using the comparable prior period's quarterly weighted average foreign currency exchange rates. The primary foreign currencies creating the impact are the Australian Dollar, British Pound, Canadian Dollar and EURO. |
(2)Non-GAAP organic revenue for the prior year periods presented herein will not agree to non-GAAP organic revenue presented in the respective prior period quarterly financial information solely due to the manner in which non-GAAP organic revenue growth is calculated.
(3)To determine non-GAAP organic revenue growth on a constant currency basis, revenues from entities reporting in foreign currencies were translated to U.S. Dollars using the comparable prior period's quarterly weighted average foreign currency exchange rates. The primary foreign currencies creating the impact are the Australian Dollar, British Pound, Canadian Dollar and EURO.
|
| | | | | | | |
36First Quarter 2021 Form 10-Q | | Second Quarter 2020 Form 10-Q31 |
Blackbaud, Inc.
(Unaudited)
Rule of 40
Rule of 40 is defined as non-GAAP organic revenue growth plus non-GAAP adjusted EBITDA margin. Non-GAAP adjusted EBITDA is defined as GAAP net income plus interest, net; income tax provision (benefit); depreciation; amortization of intangible assets from business combinations; amortization of software development costs; acquisition-related deferred revenue write-down; stock-based compensation; acquisition-related integration costs; acquisition-related expenses; employee severance; and restructuring and other real estate activities.
| | | | | | | | | | | | | | | |
| | | Three months ended March 31, |
| (dollars in millions) | | | | | 2021 | 2020 | Change |
| GAAP net (loss) income | | | | | $ | (0.2) | | $ | 4.6 | | (103.5) | % |
| Non-GAAP adjustments: | | | | | | | |
| Add: Interest, net | | | | | 5.0 | | 3.6 | | 36.4 | % |
| Add: GAAP income tax provision | | | | | 0.7 | | 0.7 | | (1.7) | % |
| Add: Depreciation | | | | | 3.2 | | 3.5 | | (9.3) | % |
| Add: Amortization of intangibles from business combinations | | | | | 9.7 | | 11.7 | | (17.1) | % |
Add: Amortization of software development costs(1) | | | | | 8.0 | | 6.7 | | 19.3 | % |
| Subtotal | | | | | 26.5 | | 26.2 | | 1.1 | % |
| Non-GAAP EBITDA | | | | | $ | 26.3 | | $ | 30.9 | | (14.7) | % |
| Non-GAAP EBITDA margin | | | | | 12.0 | % | 13.8 | % | |
| | | | | | | |
| Non-GAAP adjustments: | | | | | | | |
| | | | | | | |
| Add: Stock-based compensation expense | | | | | 30.0 | | 13.6 | | 120.9 | % |
| Add: Employee severance | | | | | 1.0 | | 0.1 | | 921.6 | % |
| Add: Acquisition-related integration costs | | | | | (0.1) | | — | | 206.3 | % |
| Add: Acquisition-related expenses | | | | | 0.1 | | 0.1 | | (53.2) | % |
| Add: Restructuring and other real estate activities | | | | | (0.1) | | — | | (562.5) | % |
| Subtotal | | | | | 30.9 | | 13.8 | | 123.4 | % |
| Adjusted Non-GAAP EBITDA | | | | | $ | 57.2 | | $ | 44.7 | | 28.0 | % |
| Adjusted Non-GAAP EBITDA margin | | | | | 26.1 | % | | |
| | | | | | | |
Rule of 40(2) | | | | | 24.1 | % | | |
| | | | | | | |
(1)Includes amortization expense related to software development costs and amortization expense from capitalized cloud computing implementation costs.
(2)Measured by non-GAAP organic revenue growth plus non-GAAP adjusted EBITDA margin. See Non-GAAP organic revenue growth table above.
| | | | | | | | |
| 32 | | First Quarter 2021 Form 10-Q |
Blackbaud, Inc.
(Unaudited)
Seasonality
Our revenues normally fluctuate as a result of certain seasonal variations in our business. Our transactionfirst quarter has historically been the seasonal low for bookings, with the second and fourth quarters historically being seasonally higher, and our bookings tend to be back-end loaded within individual quarters given our quarterly quota plans. Transactional revenue is non-contractual and less predictable given the susceptibility to certain drivers such as timing and number of events and marketing campaigns, as well as fluctuations in donation volumes and tuition payments. Our transactional revenue has historically been at its lowest in the first quarter due to the timing of customer fundraising initiatives and events. Our revenue from payment services hasWe have historically increasedexperienced seasonal highs during the fourth quarter due to year-end giving.giving campaigns and during the second quarter when a large number of events are held. Our revenue from professional services has historically been lower in the first quarter when many of those services commence and in the fourth quarter due to the holiday season. As a result of these and other factors, our total revenue has historically been lower in the first quarter than in the remainder of our fiscal year, with the fourth quarter historically achieving the highest total revenue. Our expenses, however, do not vary significantly as a result of these factors, but do fluctuate on a quarterly basis due to varying timing of expenditures.
Our cash flow from operations normally fluctuates quarterly due to the combination of the timing of customer contract renewals including renewals associated with customers of acquired companies, delivery of professional services and occurrence of customer events, the payment of bonuses, as well as merit-based salary increases, among other factors. Historically, due to lower revenues in our first quarter, combined with the payment of bonuses from the prior year in our first quarter and the payment of certain annual vendor contracts, our cash flow from operations has been lowest in our first quarter. Due to the timing of customer contract renewals and student enrollments, many of which take place at or near the beginning of our third quarter, our cash flow from operations has been lower in our second quarter as compared to our third and fourth quarters. Partially offsetting these favorable drivers of cash flow from operations in our third and fourth quarters are merit-basedbase salary merit increases, which were replaced in 2020 with performance-based equity awards due to COVID-19, but are generally effectiveexpected to return in April each year.July 2021. In addition, deferred revenues can vary on a seasonal basis for the same reasons. Our cash flow from financing is negatively impacted in our first quarter when most of our equity awards vest, as we pay taxes on behalf of our employees related to the settlement or exercise of equity awards. During the second quarter of 2021, we expect an increase in the amount taxes we pay on behalf of our employees related to the settlement of equity awards when compared to the same period in 2020, as the equity granted in May 2020 in lieu of cash bonus plans and base salary merit increases will vest. These patterns may change as a result of the continued shift to online giving, growth in volume of transactions for which we process payments, or as a result of acquisitions, new market opportunities, new solution introductions, the COVID-19 pandemic or other factors.
|
| |
| Liquidity and Capital Resources |
The following table presents selected financial information about our financial position:
| | | (dollars in millions) | June 30,
2020 |
| December 31,
2019 |
| Change |
| (dollars in millions) | March 31,
2021 | December 31,
2020 | Change |
| Cash and cash equivalents | $ | 30.5 |
| $ | 31.8 |
| (4.0 | )% | Cash and cash equivalents | $ | 27.8 | | $ | 35.8 | | (22.4) | % |
| Property and equipment, net | 36.5 |
| 35.5 |
| 2.8 | % | Property and equipment, net | 105.1 | | 105.2 | | (0.1) | % |
| Software development costs, net | 106.0 |
| 101.3 |
| 4.7 | % | Software development costs, net | 113.6 | | 111.8 | | 1.6 | % |
| Total carrying value of debt | 488.1 |
| 467.1 |
| 4.5 | % | Total carrying value of debt | 550.8 | | 531.0 | | 3.7 | % |
| Working capital | (191.8 | ) | (254.3 | ) | 24.6 | % | Working capital | (180.9) | | (194.3) | | 6.9 | % |
The following table presents selected financial information about our cash flows:
| | | | | | | | | | | |
| Three months ended March 31, |
| (dollars in millions) | 2021 | 2020 | Change |
| Net cash provided by (used in) operating activities | $ | 30.1 | | $ | (24.5) | | (222.9) | % |
| Net cash used in investing activities | (12.8) | | (13.8) | | (7.5) | % |
| Net cash used in financing activities | (379.6) | | (278.9) | | 36.1 | % |
|
| | | | | | | | |
| | Six months ended June 30, | |
| (dollars in millions) | 2020 |
| 2019 |
| Change |
|
| Net cash provided by operating activities | $ | 37.5 |
| $ | 45.1 |
| (16.9 | )% |
| Net cash used in investing activities | (27.6 | ) | (138.5 | ) | (80.1 | )% |
| Net cash (used in) provided by financing activities | (132.5 | ) | 30.8 |
| (529.7 | )% |
| | | | | | | | |
| First Quarter 2021 Form 10-Q | | 33 |
Blackbaud, Inc.
(Unaudited)
Our principal sources of liquidity are our operating cash flow, funds available under the 20172020 Credit Facility and cash on hand. Our operating cash flow depends on continued customer renewal of our subscription and maintenance arrangements, market acceptance of our solutions and services and our customers' ability to pay. Based on current estimates of revenue and expenses, we believe that the currently available sources of funds and anticipated cash flows from operations will be adequate for at least the next twelve months to finance our operations, fund anticipated capital expenditures and meet our debt obligations. To the extent we undertake future material acquisitions, investments or unanticipated capital expenditures, we may require additional capital. In that context, we regularly evaluate opportunities to enhance our capital structure including through potential debt or equity issuances.
|
| | |
Second Quarter 2020 Form 10-Q | | 37 |
Blackbaud, Inc.
(Unaudited)
To better enable us to weather the extraordinary business challenges brought about by the global COVID-19 pandemic, to protect the safety and welfare of our employees, and to further effect our long-term strategy to deliver the greatest value to our stockholders, we have taken several actions. These initial measures taken are expected to provide us the financial flexibility needed to manage a wide array of outcomes that may result from the pandemic. Some of these actions include the following:
Rescinded our previously announced policy to pay an annual dividend at a rate of $0.48 per share of common stock and discontinued the declaration and payment of all cash dividends, beginning with the second quarter of 2020 and thereafter until such time, if any, as our Board of Directors may otherwise determine in its sole discretion;
Temporarily suspended our 401(k)-match program, whereby we have historically matched 50% of qualified U.S. employees' contributions to our 401(k) plan up to 6% of their salaries, effective with the payroll period commencing April 1, 2020;
Temporarily froze our hiring efforts and implemented a modest and targeted headcount reduction, though we have since began backfilling sales positions;
Michael Gianoni, our President and Chief Executive Officer, elected to forego receipt of all but that portion of his base salary necessary to fund, on a pre-tax basis, his contributions to continue to participate in our health benefits plan, between April 1, 2020 and June 16, 2020;
Restricted non-essential employee travel and put in place other operating cost containment actions;
All of our employees with a base salary equal to or less than $75 thousand received financial support in the form of a one-time bonus of $1 thousand on April 30, 2020;
On May 1, 2020, we granted RSUs to our employees that were eligible for base salary merit increases in lieu of such increases, which will vest on May 1,At March 31, 2021, subject to the recipient's continued employment with us; and
On May 1, 2020, we granted PRSUs to our employees that were eligible for a 2020 cash bonus plan in lieu of such cash bonus, which may be earned and become eligible for vesting on May 1, 2021 subject to meeting certain performance conditions and the recipient's continued employment with us.
In addition to the initial actions we have taken to date, we are continuously evaluating further possible actions in order to respond quickly to rapidly changing conditions, if needed.
We have started to experience an increase in our aging of receivables and observed changes in some of our customers' payment behavior associated with the COVID-19 pandemic. We have received short-term payment relief requests as a result of COVID-19, most often in the form of payment deferral requests. We are evaluating each request on a case-by-case basis to assess the customer's ability to pay. Not all customer requests will ultimately result in modified payment terms, nor are we forgoing our contractual rights under customer agreements. We are continually monitoring our customer receivable balances, payment terms, and creditworthiness for changes that could have a significant impact on the collectability of our accounts receivables, our operating results and financial position.
At June 30, 2020, our total cash and cash equivalents balance included approximately $21.8$16.6 million of cash that was held by operations outside the U.S. While these funds may not be needed to fund our U.S. operations for at least the next twelve months, if we need these funds, we may be required to accrue and pay taxes to repatriate the funds. We currently do not intend nor anticipate a need to repatriate our cash held outside the U.S.
Operating Cash Flow
Net cash provided by operating activities decreasedincreased by $7.6$54.6 million during the sixthree months ended June 30, 2020,March 31, 2021, when compared to the same period in 2019,2020, primarily due to a $28.0$46.6 million decreaseincrease in cash flow from operations associated with working capital partially offset by a $20.4and an $8.0 million increase in net income adjusted for non-cash expenses. Throughout both periods, our cash flows from operations were derived principally from: (i) our earnings from on-going operations prior to non-cash expenses such as depreciation, amortization, stock-based compensation, amortization of deferred financing costs and debt discount and adjustments to our provision for credit losses and sales returns; and (ii) changes in our working capital. The increase in net income adjusted for non-cash expenses was primarily from operating cost reductions put in place in response to COVID-19 and the increased use of stock-based compensation.
|
| | |
38 | | Second Quarter 2020 Form 10-Q |
Blackbaud, Inc.
(Unaudited)
Working capital changes are composed of changes in accounts receivable, prepaid expenses and other assets, trade accounts payable, accrued expenses and other liabilities, and deferred revenue. The decreaseincrease in cash flow from operations associated with working capital during the sixthree months ended June 30, 2020,March 31, 2021, when compared to the samesame period in 2019,2020, was primarily due to:
an increase•the payment of our 2019 cash bonus plans in current period bonus payments as a result2020 and the replacement of an increase in amounts accrued as of December 31, 2019 for over-performance against 2019 targets;
a decrease in the current period bonus accrual due to our decision to replace cash payments for our 2020 cash bonus plans with performance-based equity awards;awards (which we expect will continue going forward);
•an increase in the collection of customer receivable balances; and
•fluctuations in the timing of vendor payments.
Investing Cash Flow
Net cash used in investing activities of $27.6$12.8 million decreased by $110.9$1.0 million during the sixthree months ended June 30, 2020,March 31, 2021, when compared to the same period in 2019.2020.
During the sixthree months ended June 30, 2019,March 31, 2021, we used net cash of $109.4$9.3 million for our acquisition of YourCause and we did not make any similar investments during the same period in 2020. During the six months ended June 30, 2020, we used $21.7 million for software development costs, which was relatively consistent withdown $1.6 million from cash spent during the same period in 2019.2020, primarily due to lower engineering headcount. We increased engineering hiring beginning in the fourth quarter of 2020 and continue to invest in our innovative cloud solutions, as well as development activities for Blackbaud SKY, our modern cloud platform.
We also spent $5.9$3.5 million of cash for purchases of property and equipment during the sixthree months ended June 30, 2020,March 31, 2021, which was relatively consistent with cash spent duringan increase of $0.6 million when compared to the same period in 2019.2020.
Financing Cash Flow
During the sixthree months ended June 30, 2020,March 31, 2021, we had a net increase in borrowings of $16.9 million, down from a net increase of $58.6 million during the three months ended March 31, 2020. Historically, due to lower revenues in our first quarter, combined with the payment of bonuses from prior year in our first quarter and the payment of certain annual vendor contracts, our cash flow from operations has been lowest in our first quarter. $21.0 million.
We paid $21.0$18.4 million to satisfy tax obligations of employees upon settlement of equity awards during the sixthree months ended June 30, 2020March 31, 2021 compared to $19.8 million during the same period in 2019.2020. The amount of taxes paid by us on the behalf of employees related to the settlement of equity awards varies from period to period based upon the timing of grants and vesting, as well as the market price for shares of our common stock at the time of settlement. MostWhile most of our equity awards currently vest in our first quarter. In addition, duringquarter, the sixequity awards that we granted in May 2020 to replace our 2020 cash bonus plans and base salary merit increases will vest in May 2021. During the three months
| | | | | | | | |
| 34 | | First Quarter 2021 Form 10-Q |
Blackbaud, Inc.
(Unaudited)
ended June 30,March 31, 2020, we paid dividends of $6.0 million down from $11.8 millionand we did not pay dividends during the same period of 2019,in 2021, as we discontinued the declaration and payment of all cash dividends, beginning with the second quarter of 2020.
Cash used in financing activities associated with changes in restricted cash due to customers decreased $13.8increased $42.5 million during the sixthree months ended June 30, 2020March 31, 2021 when compared to the same period in 2019,2020, as the amount of restricted cash held and payable by us to customers as of December 31, 20192020 was larger than at the same date in 2018.2019 primarily due to the timing of year-end donations.
2017Stock repurchase program
In November 2020, our Board of Directors reauthorized and expanded a stock repurchase program that authorizes us to purchase up to $250.0 million of our outstanding shares of common stock. The program does not have an expiration date. Under the stock repurchase program, we are authorized to repurchase shares from time to time in accordance with applicable laws both on the open market, including under trading plans established pursuant to Rule 10b5-1 under the Securities Exchange Act of 1934, as amended, and in privately negotiated transactions. The timing and amount of repurchases depends on several factors, including market and business conditions, the trading price of our common stock and the nature of other investment opportunities. The repurchase program may be limited, suspended or discontinued at any time without prior notice. During the three months ended March 31, 2021, we purchased 465,821 shares for $28.1 million.
2020 Credit Facility
WeHistorically, we have drawn on our credit facility from time to time to help us meet financial needs, such asprimarily due to the seasonality of our cash flows from operations and financing for business acquisitions. At June 30, 2020,March 31, 2021, our available borrowing capacity under the 20172020 Credit Facility was $190.7$406.0 million. The 20172020 Credit Facility matures in June 2022. The 2017 Credit Facility includes an option to request additional term loans in an aggregate principal amount of up to $200.0 million.October 2025.
At June 30, 2020,March 31, 2021, the carrying amount of our debt under the 20172020 Credit Facility was $484.2$488.8 million. Our average daily borrowings during the three and six months ended June 30, 2020March 31, 2021 were $526.3 million and $508.9 million, respectively.
|
| | |
Second Quarter 2020 Form 10-Q | | 39 |
Blackbaud, Inc.
(Unaudited)
The following is a summary of the financial covenants under the 20172020 Credit Facility:
|
| | | | | | | |
Financial Covenantcovenant | Requirement | Ratio as of June 30, 2020March 31, 2021 |
Net Leverage Ratioleverage ratio | ≤ 3.504.00 to 1.00 | 2.211.79 to 1.00 |
Interest Coverage Ratiocoverage ratio | ≥ 2.50 to 1.00 | 11.8816.44 to 1.00 |
Under the 20172020 Credit Facility, we also have restrictions on our ability to declare and pay dividends and our ability to repurchase shares of our common stock. In order to pay any cash dividends and/or repurchase shares of stock: (i) no default or event of default shall have occurred and be continuing under the 20172020 Credit Facility, and (ii) our pro forma net leverage ratio, as set forth in the 20172020 Credit Facility, must be 0.25 less than the net leverage ratio requirement at the time of dividend declaration or share repurchase. At June 30, 2020,March 31, 2021, we were in compliance with our debt covenants under the 20172020 Credit Facility.
| | | | | | | | |
| First Quarter 2021 Form 10-Q | | 35 |
Blackbaud, Inc.
(Unaudited)
Commitments and Contingencies
As of June 30, 2020,March 31, 2021, we had contractual obligations with future minimum commitments as follows:
| | | | | | | | | | | | | | | | | |
| Payments due by period |
| (in millions) | Total | Less than 1
year | 1-3 years | 3-5 years | More than 5
years |
| Recorded contractual obligations: | | | | | |
Debt(1) | $ | 553.5 | | $ | 12.9 | | $ | 23.4 | | $ | 464.4 | | $ | 52.9 | |
Interest payments on debt(2) | 2.6 | | 2.2 | | 0.3 | | — | | — | |
Operating leases(3) | 25.6 | | 8.1 | | 9.3 | | 4.6 | | 3.5 | |
| | | | | |
| Unrecorded contractual obligations: | | | | | |
Interest payments on debt(4) | 78.9 | | 11.9 | | 24.9 | | 19.2 | | 22.9 | |
Purchase obligations(5) | 79.0 | | 56.6 | | 22.4 | | — | | — | |
| Total contractual obligations | $ | 739.6 | | $ | 91.8 | | $ | 80.3 | | $ | 488.2 | | $ | 79.3 | |
|
| | | | | | | | | | | | | | | |
| | Payments due by period |
| (in millions) | Total |
| Less than 1 year |
| 1-3 years |
| 3-5 years |
| More than 5 years |
|
| Recorded contractual obligations: | | | | | |
Debt(1) | $ | 489.0 |
| $ | 9.2 |
| $ | 479.8 |
| $ | — |
| $ | — |
|
Interest payments on debt(2) | 5.2 |
| 5.1 |
| 0.1 |
| — |
| — |
|
Operating leases(3) | 148.9 |
| 24.9 |
| 35.6 |
| 17.1 |
| 71.2 |
|
| | | | | | |
| Unrecorded contractual obligations: | | | | | |
Interest payments on debt(4) | 16.1 |
| 8.4 |
| 7.7 |
| — |
| — |
|
Purchase obligations(5) | 90.5 |
| 48.4 |
| 42.1 |
| — |
| — |
|
| Total contractual obligations | $ | 749.8 |
| $ | 96.1 |
| $ | 565.4 |
| $ | 17.1 |
| $ | 71.2 |
|
| |
(1) | Represents principal payments only, under the following assumptions: (i) that the amounts outstanding under the 2017(1)Represents principal payments only, under the following assumptions: (i) that the amounts outstanding under the 2020 Credit Facility, our Real Estate Loans and our other debt at March 31, 2021 will remain outstanding until maturity, with minimum payments occurring as currently scheduled, and (ii) that there are no assumed future borrowings on the 2020 Credit Facility and our other debt at June 30, 2020 will remain outstanding until maturity, with minimum payments occurring as currently scheduled, and (ii) that there are no assumed future borrowings on the 2017 Credit Facility for the purposes of determining minimum commitment amounts.
(2)Represents interest payment obligations related to our interest rate swap agreements. (3)Our commitments related to operating leases have not been reduced by sublease income, incentive payments and reimbursement of leasehold improvements. (4)The actual interest expense recognized in our consolidated statements of comprehensive income will depend on the amount of debt, the length of time the debt is outstanding and the interest rate, which could be different from our assumptions described in (1) above. (5)We have contractual obligations for third-party technology used in our solutions and for other services we purchase as part of our normal operations. In certain cases, these arrangements require a minimum annual purchase commitment by us. |
| |
(2) | Represents interest payment obligations related to our interest rate swap agreements. |
| |
(3) | Our commitments related to operating leases have not been reduced by sublease income, incentive payments and reimbursement of leasehold improvements. |
| |
(4) | The actual interest expense recognized in our consolidated statements of comprehensive income will depend on the amount of debt, the length of time the debt is outstanding and the interest rate, which could be different from our assumptions described in (1) above. |
| |
(5) | We have contractual obligations for third-party technology used in our solutions and for other services we purchase as part of our normal operations. In certain cases, these arrangements require a minimum annual purchase commitment by us. |
The term loan under the 20172020 Credit Facility requiresand our other debt require periodic principal payments. The balance of the term loans and any amounts drawn on the revolving credit loans are due upon maturity of the 20172020 Credit Facility in June 2022.October 2025. The Real Estate Loans also require periodic principal payments and the balance of the Real Estate Loans are due upon maturity in April 2038.
The total liability for uncertain tax positions as of June 30, 2020March 31, 2021 and December 31, 2019,2020, was $4.7$4.6 million and $4.3$4.6 million, respectively. Our accrued interest and penalties related to tax positions taken on our tax returns was $1.1$1.1 million and $1.0$1.1 million as of June 30, 2020March 31, 2021 and December 31, 2019,2020, respectively.
|
| |
| Off-Balance Sheet Arrangements |
As of June 30, 2020,March 31, 2021, we did not have any off-balance sheet arrangements as defined in Item 303(a)(4)(ii) of Regulation S-K promulgated by the SEC that have, or are reasonably likely to have, a current or future effect on our financial condition, changes in our financial condition, revenues or expenses, results of operations, liquidity, capital expenditures or capital resources that is material to investors.
|
| | |
40 | | Second Quarter 2020 Form 10-Q |
Blackbaud, Inc.
(Unaudited)
|
|
| Foreign Currency Exchange Rates |
Approximately 16%15% of our total revenue for the sixthree months ended June 30, 2020March 31, 2021 was generated from operations outside the U.S. We do not have significant operations in countries in which the economy is considered to be highly inflationary. Our consolidated financial statements are denominated in U.S. dollars and, accordingly, changes in the exchange rate between foreign currencies and the U.S. dollar will affect the translation of our subsidiaries’ financial results into U.S. dollars for purposes of reporting our consolidated financial results. The accumulated currency translation adjustment, recorded within accumulated other comprehensive loss as a component of stockholders’ equity, was a lossgain of $10.6$3.1 million as of June 30, 2020March 31, 2021 and a lossgain of $4.0$0.6 million as of December 31, 2019.2020.
| | | | | | | | |
| 36 | | First Quarter 2021 Form 10-Q |
Blackbaud, Inc.
(Unaudited)
The vast majority of our contracts are entered into by our U.S. or U.K. entities. The contracts entered into by the U.S. entity are almost always denominated in U.S. dollars or Canadian dollars, and contracts entered into by our U.K., Australian and Irish subsidiaries are generally denominated in British Pounds, Australian dollars and Euros, respectively. Historically, as the U.S. dollar weakened, foreign currency translation resulted in an increase in our revenues and expenses denominated in non-U.S. currencies. Conversely, as the U.S. dollar strengthened, foreign currency translation resulted in a decrease in our revenue and expenses denominated in non-U.S. currencies. During the sixthree months ended June 30, 2020,March 31, 2021, foreign translation resulted in a decreaseincreases in our revenues and expenses denominated in non-U.S. currencies. Though we have exposure to fluctuations in currency exchange rates, primarily those between the U.S. dollar and both the British Pound and Canadian dollar, the impact has generally not been material to our consolidated results of operations or financial position. For the sixthree months ended June 30, 2020,March 31, 2021, the fluctuation in foreign currency exchange rates reducedincreased our total revenue and our income from operations by $2.3$2.0 million and $0.9$0.7 million, respectively. We will continue monitoring such exposure and take action as appropriate. To determine the impacts on revenue (or income from operations) from fluctuations in currency exchange rates, current period revenues (or income from operations) from entities reporting in foreign currencies were translated into U.S. dollars using the comparable prior year period's weighted average foreign currency exchange rates. These impacts are non-GAAP financial information and are not in accordance with, or an alternative to, information prepared in accordance with GAAP.
|
| |
| Critical Accounting Policies and Estimates |
There have been no significant changes in our critical accounting policies and estimates during the sixthree months ended June 30, 2020March 31, 2021 as compared to those disclosed in “Management’s Discussion and Analysis of Financial Condition and Results of Operations” included in our Annual Report on Form 10-K for the fiscal year ended December 31, 2019.2020.
|
| |
| Recently Issued Accounting Pronouncements |
For a discussion of the impact that recently issued accounting pronouncements are expected to have on our financial position and results of operations when adopted in the future, see Note 2 to our condensed consolidated financial statements in this report.
ITEM 3. QUANTITATIVE AND QUALITATIVE DISCLOSURES ABOUT MARKET RISK
We have market rate sensitivity for interest rates and foreign currency exchange rates.
Our variable rate debt is our primary financial instrument with market risk exposure for changing interest rates. We manage our variable rate interest rate risk through a combination of short-term and long-term borrowings and the use of derivative instruments entered into for hedging purposes. Our interest rate exposure includes LIBOR rates. The Financial Conduct Authority in the U.K. has stated that it plans to phase out LIBOR by the end of calendar year 2021. We do not currently anticipate a significant impact to our financial position or results of operations as a result of this action as we expect that our financial contracts currently indexed to LIBOR will either expire or be modified without significant financial impact before the phase out occurs. Due to
|
| | |
Second Quarter 2020 Form 10-Q | | 41 |
Blackbaud, Inc.
(Unaudited)
the nature of our debt, the materiality of the fair values of the derivative instruments and the highly liquid, short-term nature and level of our cash and cash equivalents as of June 30, 2020,March 31, 2021, we believe that the risk of exposure to changing interest rates for those positions is immaterial. There were no significant changes in how we manage interest rate risk between December 31, 20192020 and June 30, 2020.
For a discussion of our exposure to foreign currency exchange rate fluctuations, see “Management’s Discussion and Analysis of Financial Condition and Results of Operations — Foreign Currency Exchange Rates” in this report.
| | | | | | | | |
| First Quarter 2021 Form 10-Q | | 37 |
Blackbaud, Inc.
(Unaudited)
ITEM 4. CONTROLS AND PROCEDURES
| | |
|
| Evaluation of Disclosure Controls and Procedures |
Disclosure controls and procedures (as defined in Securities Exchange Act Rule 13a-15(e) and 15d-15(e)) are designed only to provide reasonable assurance that they will meet their objectives. As of the end of the period covered by this report, we carried out an evaluation, under the supervision and with the participation of our management, including our Chief Executive Officer (principal executive officer) and Chief Financial Officer (principal financial and accounting officer), of the effectiveness of our disclosure controls and procedures (as defined in Rule 13a-15(e) and 15d-15(e)) pursuant to Securities Exchange Act Rule 13a-15(b). Based upon that evaluation, our Chief Executive Officer and Chief Financial Officer have concluded that our disclosure controls and procedures are effective to provide the reasonable assurance discussed above.
| | |
|
| Changes in Internal Control Over Financial Reporting |
No changes in internal control over financial reporting occurred during the most recent fiscal quarter ended June 30, 2020March 31, 2021 with respect to our operations, which have materially affected, or are reasonably likely to materially affect, our internal control over financial reporting.
|
| | | | | | | |
4238 | | SecondFirst Quarter 20202021 Form 10-Q |
|
| | | | | | | |
| | PART II. OTHER INFORMATION |
ITEM 1. LEGAL PROCEEDINGS
For a discussion of our legal proceedings, see Note 9 to our condensed consolidated financial statements in this report.
ITEM 1A. RISK FACTORS
We are supplementing Item 1A. Risk Factors in our Annual Report on Form 10-K for the year ended December 31, 2019,2020, as filed with the Securities and Exchange Commission on February 20, 202023, 2021 (the “Annual Report”). The following risk factors should be read in conjunction with the risk factors set forth in that Annual Report.
The COVID-19 pandemic (“COVID-19”) has disrupted, and is expected to continue to disrupt, our business, which is likely to adversely affect our operations and financial performance.
The outbreak of COVID-19 in numerous countries across the globe, including each country in which we currently operate, has adversely impacted the U.S. and global economies. We have experienced disruptions to our business thus far from COVID-19, and the pandemic continues to impact each of our markets. Governmental authorities have taken, and continue to take, countermeasures to slow the outbreak, including shelter-in-place and business closure orders and large-scale restrictions on travel. Furthermore, because the pandemic is a rapidly evolving situation, we cannot anticipate with any certainty the length, scope or severity of such restrictions in the jurisdictions in which we operate.
Certain vertical markets we serve are especially vulnerable to the global business disruption. For example, many arts and cultural organizations, including museums, zoos, performing arts centers and theaters, among others, have had to cancel events or have seen a significant decline in attendance due to COVID-19. Many of these organizations have also suspended their operations temporarily. In addition, we believe that a number of K-12 private schools, that would ordinarily consider purchasing our cloud solutions for the 2020-2021 academic school year, have delayed their expenditure decisions due to the uncertainty of COVID-19.
We expect that COVID-19 will impact all of our vertical markets across all of our geographies to some degree, but the significance and duration of the impact on our business cannot be determined at this time due to numerous uncertainties, including the ultimate geographic spread of the disease, the duration of the outbreak, travel restrictions and business closures, the effectiveness of actions taken to contain the disease and other unforeseeable consequences. This impact could include:
changes in customer demand;
our relationship with, and the financial and operational capacities of our service providers, suppliers and business partners, including their ability to fulfill their obligations to us;
further declines in our customers' ability to pay for our solutions and services;
reduced workforce availability and productivity due to working remotely using different technologies and potential health effects and concerns;
risks associated with our indebtedness (including available borrowing capacity, compliance with financial covenants and ability to refinance or repay indebtedness on favorable terms);
the adequacy of our cash flow and earnings and other conditions which may affect our liquidity;
disruptions to our technology network and other critical systems; and
impairment charges against our goodwill and other intangible assets, operating lease right-of-use assets and other long-lived assets.
We believe that business disruption relating to the COVID-19 pandemic will continue to negatively impact the U.S. and global economies and may materially adversely impact our business, financial condition and results of operations.
|
| | |
Second Quarter 2020 Form 10-Q | | 43Operational Risks |
Table of ContentsThe Security Incident could have numerous adverse effects on our business.
Blackbaud, Inc.
If the security of our software is breached, we fail to securely collect, store and transmit customer information, or we fail to safeguard confidential donor data, we could be exposed to liability, litigation, penalties and remedial costs and our reputation and business could suffer.
Fundamental to the use of our solutions is the secure collection, storage and transmission of confidential donor and end user data and transaction data, including in our payment services. Despite the network and application security, internal control measures, and physical security procedures we employ to safeguard our systems, we may still be vulnerable to a security breach, intrusion, loss or theft of confidential donor data and transaction data, which may harm our business, reputation and future financial results.
Like many major businesses, we are, from time to time, a target of cyber-attacks and phishing schemes, and we expect these threats to continue. Because of the numerous and evolving cybersecurity threats, including advanced and persistent cyber-attacks, phishing and social engineering schemes, used to obtain unauthorized access, disable or degrade systems have become increasingly more complex and sophisticated and may be difficult to detect for periods of time, we may not anticipate these acts or respond adequately or timely. As these threats continue to evolve and increase, we may be required to devote significant additional resources in order to modify and enhance our security controls and to identify and remediate any security vulnerabilities.
A compromise of our data security that results in customer or donor personal or payment card data being obtained by unauthorized persons could adversely affect our reputation with our customers and others, as well as our operations, results of operations, financial condition and liquidity and could result in litigation against us or the imposition of penalties. We might be required to expend significant capital and other resources to further protect against security breaches or to rectify problems caused by any security breach, including notification under data privacy laws and regulations and expenses related to remediating our information security systems. Even though we carry cyber-technology insurance policies that may provide insurance coverage under certain circumstances, we might suffer losses as a result of a security breach that exceed the coverage available under our insurance policies or for which we do not have coverage. A security breach and any efforts we make to address such breach could also result in a disruption of our operations, particularly our online sales operations.
Further, the existence of vulnerabilities, even if they do not result in a security breach, may harm client confidence and require substantial resources to address, and we may not be able to discover or remedy such security vulnerabilities before they are exploited, which may harm our business, reputation and future financial results.
Onpreviously disclosed, on July 16, 2020, we contacted certain customers to inform them about a recent security incident. Our communication to these customers included the informationSecurity Incident, including that in May 2020 we discovered and stopped a ransomware attack. In a ransomware attack, cybercriminals attemptPrior to disrupt the business by locking companies out of their own data and servers. After discovering the attack, our cybersecurity team—together with independent forensics experts and law enforcement—successfully preventedpreventing the cybercriminal from blocking our system access and fully encrypting files, and ultimately expelledexpelling them from our system with no significant disruption to our operations. Prior to our locking the cybercriminal out of our system,operations, the cybercriminal removed a copy of a subset of data from our self-hosted environment. This incident did not involve solutions in our public cloud environment (Microsoft Azure, Amazon Web Services), nor did it involve the majority of our self-hosted environment. Based onAlthough the nature of the incident, our research and third party (including law enforcement) investigation we have provided no reason to believe that any data went beyond the cybercriminal, was or will be misused, or will be disseminated or otherwise made available publicly. Mostpublicly, our investigation into the Security Incident remains ongoing and may provide additional information.
To date, we have received approximately 630 claims for reimbursement of expenses from customers or their attorneys related to the Security Incident (none of which have as yet been filed in court or in arbitration) and are in the process of assessing what liability may exist pursuant to such claims. Possible exposure could result from our customers’ costs and expenses associated with notifying their own constituents of the Security Incident and taking steps to assure that personal information has not been compromised as a result of the Security Incident. In addition, presently, we are a defendant in 30 putative consumer class action cases [27 in U.S. federal courts (some of which have been consolidated under multi district litigation to a single federal court), 1 in a U.S. state court and 2 in Canadian courts] alleging harm from the Security Incident. The plaintiffs in these cases, who generally purport to represent various classes of individual constituents of our customers, were not partgenerally claim to have been harmed by alleged actions and/or omissions by us in connection with the Security Incident and assert a variety of common law and statutory claims seeking monetary damages, injunctive relief, costs and attorneys’ fees, and other related relief. To date, we also have received a consolidated, multi-state Civil Investigative Demand issued on behalf of 47 state Attorneys General and the District of Columbia and a separate Civil Investigative Demand from the office of the incident. The subsetIllinois Attorney General’s Office relating to the Security Incident. In addition, we have received communications, inquires and requests from the U.S. Federal Trade Commission, the U.S. Department of customers who were partHealth and Human Services, the U.S. Securities and Exchange Commission, the Information Commissioner’s Office in the United Kingdom (the “ICO”) under the U.K. Data Protection Act 2018, the Office of this incident have been notifiedthe Australian Information Commissioner and supplied with additional information and resources. Our investigation into the incident by our cybersecurity team and third-party forensic advisors remains ongoing. It is expected that we will continue to experience increased costs relatedOffice of the Privacy Commissioner of Canada. (See Note 9 to our responseunaudited, condensed consolidated financial statements included in this report for a more detailed description of the Security Incident and related matters)
We may be named as a party in additional lawsuits, other claims may be asserted by or on behalf of our customers or their constituents, and we may be subject to this incidentadditional governmental inquires, requests or investigations. Responding to and our efforts to further enhance our security measures. In addition, it is possible that the incident mayresolving these current and any future lawsuits, claims and/or investigations could result in loss of customers and partners, harm our reputation, increased costs to maintain insurance coverage, devotion of substantial management time, litigation or regulatory enforcement, claims for indemnification obligations, future cybersecurity attacksmaterial remedial and other expenses that may not be covered by insurance. Governmental authorities also may seek to impose undertakings, injunctive relief, consent decrees, or other civil or criminal penalties, which could, among other things, materially increase our data security costs or otherwise require us to alter how we operate our business. Although we intend to defend ourselves vigorously against the claims asserted against us, we cannot predict the potential liabilities.
|
| | | | | | | |
44First Quarter 2021 Form 10-Q | | Second Quarter 2020 Form 10-Q39 |
Future publicity or developments related to the Security Incident could have a range of other adverse effects on our business or prospects, including causing or contributing to loss of customer confidence, reduced customer demand, reduced customer retention, strategic growth opportunities, and associated retention and recruiting difficulties.
ITEM 2. UNREGISTERED SALES OF EQUITY SECURITIES AND USE OF PROCEEDS
| | |
|
| Issuer Purchases of Equity Securities |
The following table provides information about shares of common stock acquired or repurchased during the three months ended June 30, 2020. All of these acquisitions were ofMarch 31, 2021 under the stock repurchase program then in effect, as well as common stock withheld by us to satisfy the minimum tax obligations of employees due upon vesting of restricted stock awards and units.
| | | | | | | | | | | | | | | | | | | | | | | |
| Period | Total number of shares purchased(1) | | Average
price
paid
per
share | | Total number of shares purchased as part of publicly announced plans or programs(2) | | Approximate
dollar value
of shares
that may yet
be purchased
under the
plans or
programs
(in thousands) |
| Beginning balance, January 1, 2021 | | | | | | | $ | 208,999 | |
| January 1, 2021 through January 31, 2021 | 464,149 | | | $ | 60.23 | | | 464,149 | | | 181,042 | |
| February 1, 2021 through February 28, 2021 | 242,539 | | | 76.42 | | | 1,672 | | | 180,933 | |
| March 1, 2021 through March 31, 2021 | — | | | — | | | — | | | 180,933 | |
| Total | 706,688 | | | $ | 65.79 | | | 465,821 | | | $ | 180,933 | |
(1)Includes 240,867 shares in February withheld by us to satisfy the minimum tax obligations of employees due upon vesting of restricted stock awards and units. The level of this acquisition activity varies from period to period based upon the timing of award grants and vesting as well as employee exercise decisions.vesting.
|
| | | | | | | | | | | | | |
| Period | Total number of shares purchased |
| | Average price paid per share |
| | Total number of shares purchased as part of publicly announced plans or programs(1) |
| | Approximate dollar value of shares that may yet be purchased under the plans or programs (in thousands) |
|
| Beginning balance, April 1, 2020 | | | | | | | $ | 50,000 |
|
| April 1, 2020 through April 30, 2020 | 175 |
| | $ | 80.18 |
| | — |
| | 50,000 |
|
| May 1, 2020 through May 31, 2020 | 12,829 |
| | 53.28 |
| | — |
| | 50,000 |
|
| June 1, 2020 through June 30, 2020 | 8,196 |
| | 63.10 |
| | — |
| | 50,000 |
|
| Total | 21,200 |
| | $ | 57.30 |
| | — |
| | $ | 50,000 |
|
| |
(1) | In August 2010, our Board of Directors approved a stock repurchase program that authorized us to purchase up to $50.0 million of our outstanding shares of common stock. We have not made any repurchases under the program to date, and the program does not have an expiration date. |
|
| | | | | | | |
Second40 | | First Quarter 20202021 Form 10-Q | | 45 |
ITEM 6. EXHIBITS
The exhibits listed below are filed or incorporated by reference as part of this Quarterly Report on Form 10-Q:
| | | | | | | | | | | | | | | | | | | | | | | | | | | | | | | | |
| | | | Filed In |
Exhibit Number | | Description of Document | | Filed Herewith | | Form | | Exhibit Number | | Filing Date |
| | | | X | | | | | | |
| | | | | | 10-Q | | 10.92 | | 8/4/2017 |
| | | | X | | | | | | |
| | | | X | | | | | | |
| | | | X | | | | | | |
| | | | X | | | | | | |
| 101.INS | | Inline XBRL Instance Document - the Instance Document does not appear in the interactive data file because its XBRL tags are embedded within the Inline XBRL Document. | | X | | | | | | |
| 101.SCH | | Inline XBRL Taxonomy Extension Schema Document. | | X | | | | | | |
| 101.CAL | | Inline XBRL Taxonomy Extension Calculation Linkbase Document. | | X | | | | | | |
| 101.DEF | | Inline XBRL Taxonomy Extension Definition Linkbase Document. | | X | | | | | | |
| 101.LAB | | Inline XBRL Taxonomy Extension Label Linkbase Document. | | X | | | | | | |
| 101.PRE | | Inline XBRL Taxonomy Extension Presentation Linkbase Document. | | X | | | | | | |
| 104 | | Cover Page Interactive Data File (formatted as Inline XBRL and contained in Exhibit 101). | | X | | | | | | |
|
| | | | | | | | | | |
| First Quarter 2021 Form 10-Q | | | | Filed In |
Exhibit Number | | Description of Document | | Filed Herewith | | Form | | Exhibit Number | | Filing Date |
| | | | X | | | | | | |
| | | | X | | | | | | |
| | | | X | | | | | | |
| | | | X | | | | | | |
| | | | X | | | | | | |
| | | | X | | | | | | |
| | | | X | | | | | | |
| | | | X | | | | | | |
| | | | X | | | | | | |
| | | | X | | | | | | |
| | | | X | | | | | | |
101.INS | | Inline XBRL Instance Document - the Instance Document does not appear in the interactive data file because its XBRL tags are embedded within the Inline XBRL Document. | | X | | | | | | |
101.SCH | | Inline XBRL Taxonomy Extension Schema Document. | | X | | | | | | |
101.CAL | | Inline XBRL Taxonomy Extension Calculation Linkbase Document. | | X | | | | | | |
101.DEF | | Inline XBRL Taxonomy Extension Definition Linkbase Document. | | X | | | | | | |
101.LAB | | Inline XBRL Taxonomy Extension Label Linkbase Document. | | X | | | | | | |
101.PRE | | Inline XBRL Taxonomy Extension Presentation Linkbase Document. | | X | | | | | | |
104 | | Cover Page Interactive Data File (formatted as Inline XBRL and contained in Exhibit 101). | | X | | | | | | 41 |
|
| | | | | | | |
46 | | Second Quarter 2020 Form 10-Q |
Pursuant to the requirements of the Securities Exchange Act of 1934, the Registrant has duly caused this Report to be signed on its behalf by the undersigned thereunto duly authorized.
| | | | | | | | | | | |
| | BLACKBAUD, INC. |
| | | |
| Date: | May 4, 2021 | BLACKBAUD, INC. |
| By: | | | |
Date: | August 4, 2020 | By: | /s/ Michael P. Gianoni |
| | | Michael P. Gianoni |
| | | President and Chief Executive Officer |
| | | (Principal Executive Officer) |
| | | |
| Date: | AugustMay 4, 20202021 | By: | /s/ Anthony W. Boor |
| | | Anthony W. Boor |
| | | Executive Vice President and Chief Financial Officer |
| | | (Principal Financial and Accounting Officer) |
|
| | | | | | | |
Second42 | | First Quarter 20202021 Form 10-Q | | 47 |