UNITED STATES
SECURITIES AND EXCHANGE COMMISSION
WASHINGTON, D.C. 20549
FORM 10-Q
ý Quarterly Report Pursuant to Section 13 or 15(d) of the Securities Exchange Act of 1934
For the quarterly period ended September 30, 2017.2018.
o Transition Report Pursuant to Section 13 or 15(d) of the Securities Exchange Act of 1934
For the Transition Period From ______________________ to _________________________
Commission file number 001-32265 (American Campus Communities, Inc.)
Commission file number 333-181102-01 (American Campus Communities Operating Partnership, L.P.)
AMERICAN CAMPUS COMMUNITIES, INC.
AMERICAN CAMPUS COMMUNITIES OPERATING PARTNERSHIP, L.P.
(Exact name of registrant as specified in its charter)
|
| | |
Maryland (American Campus Communities, Inc.) Maryland (American Campus Communities Operating Partnership, L.P.) | | 76-0753089 (American Campus Communities, Inc.) 56-2473181 (American Campus Communities Operating Partnership, L.P.) |
(State or Other Jurisdiction of Incorporation or Organization) | | (IRS Employer Identification No.) |
12700 Hill Country Blvd., Suite T-200 Austin, TX (Address of Principal Executive Offices) | | 78738 (Zip Code) |
(512) 732-1000
Registrant'sRegistrant’s telephone number, including area code
Indicate by check mark whether the registrant (1) has filed all reports required to be filed by Section 13 or 15 (d) of the Securities Exchange Act of 1934 during the preceding 12 months (or for such shorter period that the registrant was required to file such reports), and (2) has been subject to such filing requirements for the past 90 days.
|
| |
| American Campus Communities, Inc. | Yes x No o |
|
| |
| American Campus Communities Operating Partnership, L.P. | Yes x No o |
Indicate by check mark whether the registrant has submitted electronically and posted on its corporate Web site, if any, every Interactive Data File required to be submitted and posted pursuant to Rule 405 of Regulation S-T (§232.405 of this chapter) during the preceding 12 months (or for such shorter period that the registrant was required to submit and post such files).
|
| |
| American Campus Communities, Inc. | Yes x No o |
|
| |
| American Campus Communities Operating Partnership, L.P. | Yes x No o |
Indicate by check mark whether the registrant is a large accelerated filer, an accelerated filer, a non-accelerated filer, a smaller reporting company, or an emerging growth company. See the definitions of “large accelerated filer”, “accelerated filer”, “smaller reporting company”, and “emerging growth company” in Rule 12b-2 of the Exchange Act.
American Campus Communities, Inc.
|
| |
Large accelerated filer x | Accelerated Filer o |
|
| |
Non-accelerated filer o (Do not check if a smaller reporting company) | Smaller reporting company o |
|
| |
| | Emerging growth company o |
If an emerging growth company, indicate by check mark if the registrant has elected not to use the extended transition period for complying with any new or revised financial accounting standards provided pursuant to Section 13(a) of the Exchange Act. o
American Campus Communities Operating Partnership, L.P.
|
| |
Large accelerated filer o | Accelerated Filer o |
|
| |
Non-accelerated filer x (Do not check if a smaller reporting company) | Smaller reporting company o |
|
| |
| | Emerging growth company o |
If an emerging growth company, indicate by check mark if the registrant has elected not to use the extended transition period for complying with any new or revised financial accounting standards provided pursuant to Section 13(a) of the Exchange Act. o
Indicate by check mark whether the registrant is a shell company (as defined in Rule 12b-2 of the Exchange Act).
|
| |
| American Campus Communities, Inc. | Yes o No x |
|
| |
| American Campus Communities Operating Partnership, L.P | Yes o No x |
There were 136,426,506137,031,488 shares of the American Campus Communities, Inc.’s common stock with a par value of $0.01 per share outstanding as of the close of business on October 27, 2017.26, 2018.
EXPLANATORY NOTE
This report combines the reports on Form 10-Q for the quarterly period ended September 30, 20172018 of American Campus Communities, Inc. and American Campus Communities Operating Partnership, L.P. Unless stated otherwise or the context otherwise requires, references to “ACC” mean American Campus Communities, Inc., a Maryland corporation that has elected to be treated as a real estate investment trust (“REIT”) under the Internal Revenue Code, and references to “ACCOP” mean American Campus Communities Operating Partnership, L.P., a Maryland limited partnership. References to the “Company,” “we,” “us” or “our” mean collectively ACC, ACCOP and those entities/subsidiaries owned or controlled by ACC and/or ACCOP. References to the “Operating Partnership” mean collectively ACCOP and those entities/subsidiaries owned or controlled by ACCOP. The following chart illustrates the Company’s and the Operating Partnership’s corporate structure:
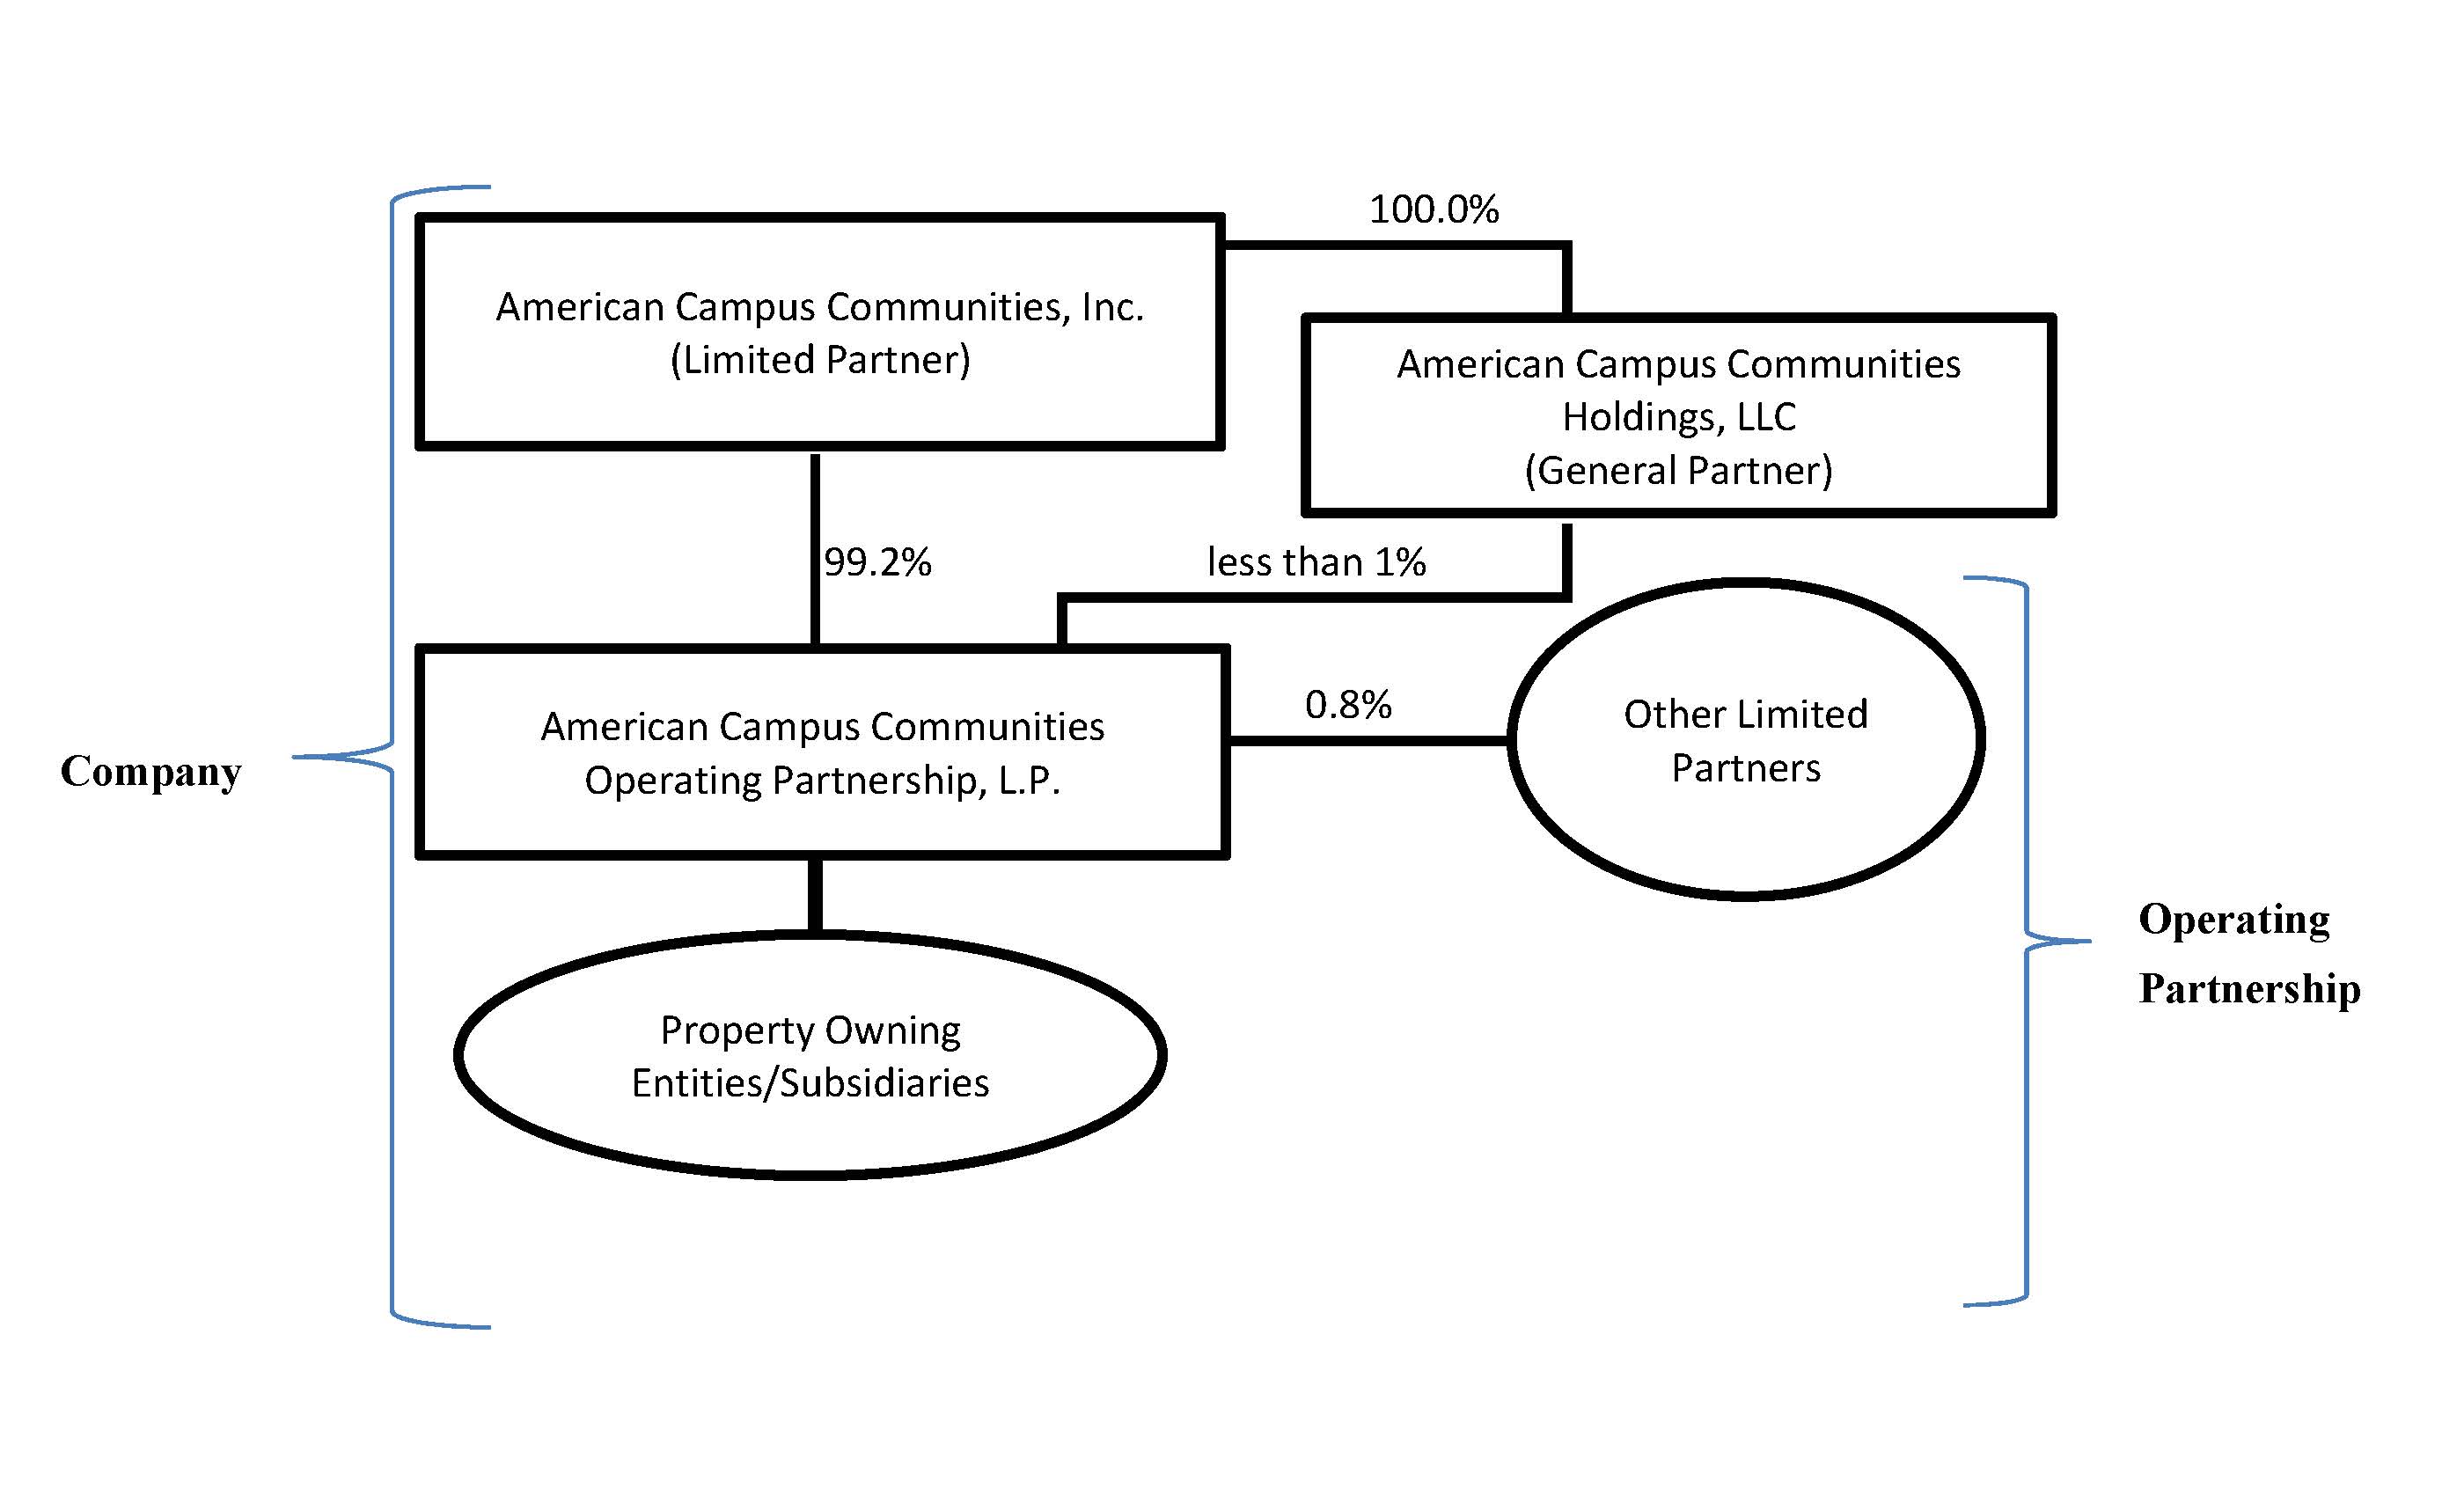
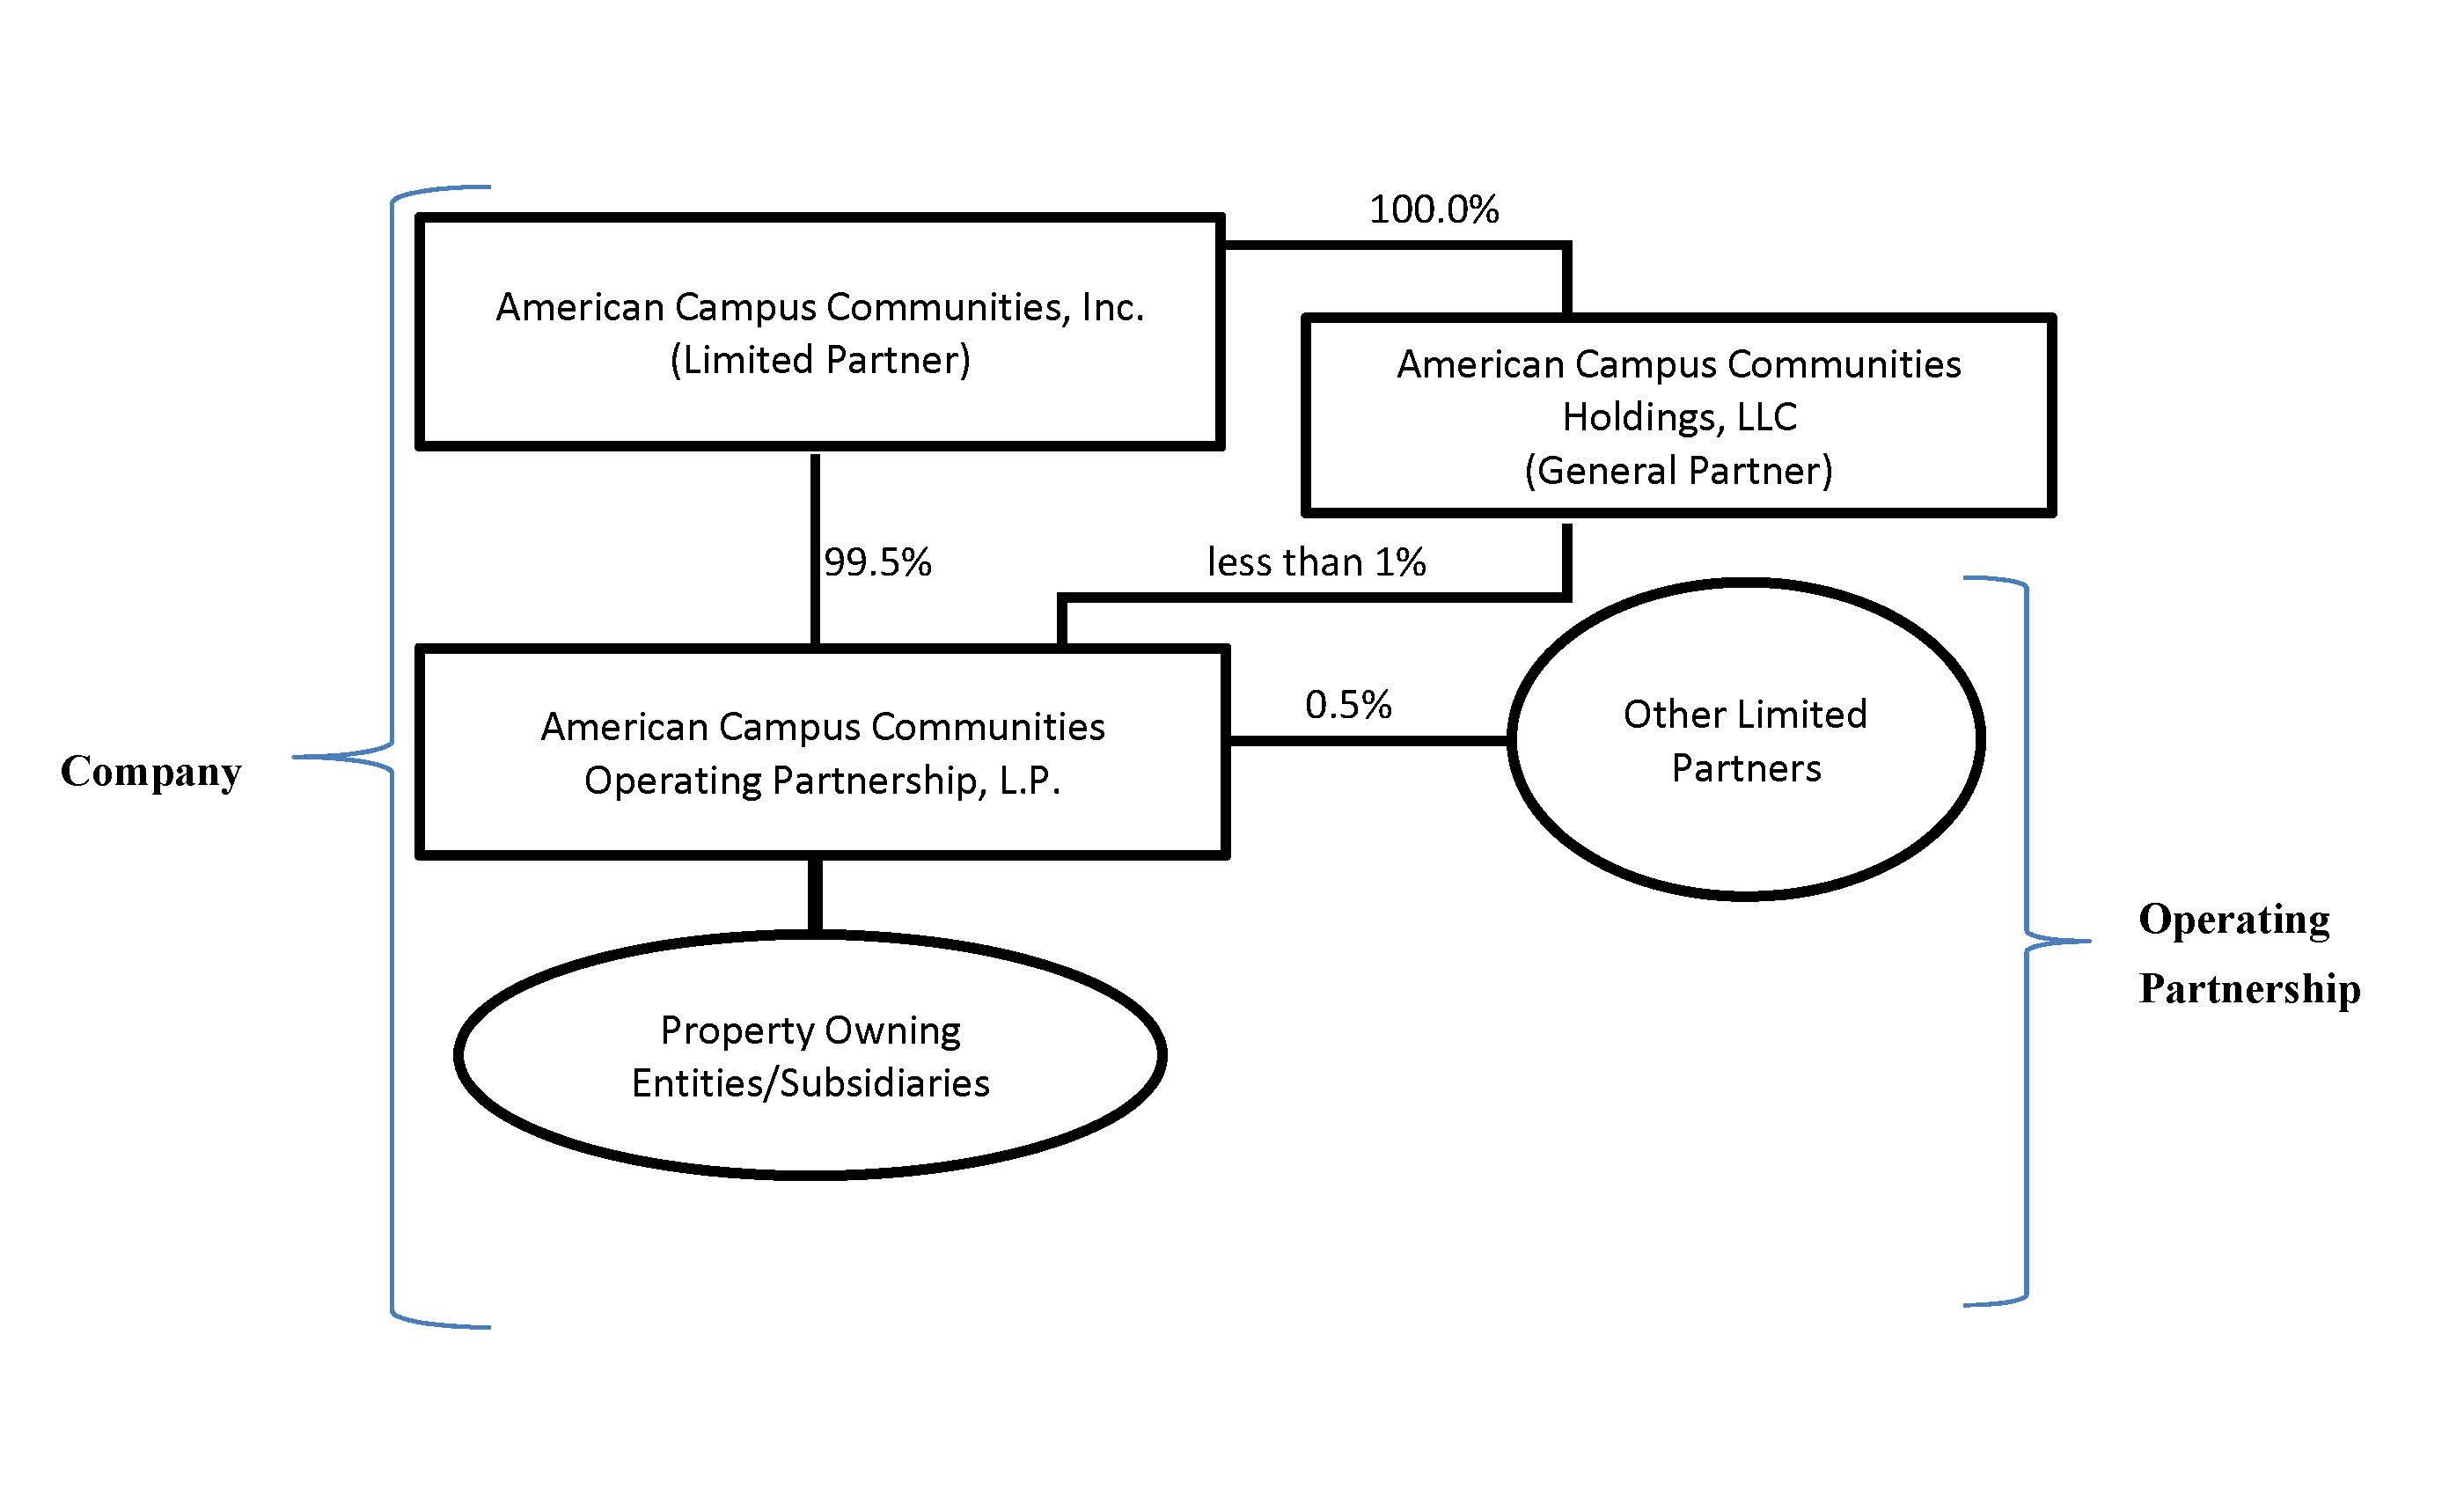
The general partner of ACCOP is American Campus Communities Holdings, LLC (“ACC Holdings”), an entity that is wholly-owned by ACC. As of September 30, 2017,2018, ACC Holdings held an ownership interest in ACCOP of less than 1%. The limited partners of ACCOP are ACC and other limited partners consisting of current and former members of management and nonaffiliated third parties. As of September 30, 2017,2018, ACC owned an approximate 99.2%99.5% limited partnership interest in ACCOP. As the sole member of the general partner of ACCOP, ACC has exclusive control of ACCOP’s day-to-day management. Management operates the Company and the Operating Partnership as one business. The management of ACC consists of the same members as the management of ACCOP. The Company is structured as an umbrella partnership REIT (“UPREIT”) and ACC contributes all net proceeds from its various equity offerings to the Operating Partnership. In return for those contributions, ACC receives a number of units of the Operating Partnership (“OP Units,” see definition below) equal to the number of common shares it has issued in the equity offering. Contributions of properties to the Company can be structured as tax-deferred transactions through the issuance of OP Units in the Operating Partnership. Based on the terms of ACCOP’s partnership agreement, OP Units can be exchanged for ACC’s common shares on a one-for-one basis. The Company maintains a one-for-one relationship between the OP Units of the Operating Partnership issued to ACC and ACC Holdings and the common shares issued to the public. The Company believes that combining the reports on Form 10-Q of ACC and ACCOP into this single report provides the following benefits:
| |
| (1) | enhances investors’ understanding of the Company and the Operating Partnership by enabling investors to view the business as a whole in the same manner as management views and operates the business; |
| |
| (2) | eliminates duplicative disclosure and provides a more streamlined and readable presentation since a substantial portion of the disclosure applies to both the Company and the Operating Partnership; and |
| |
| (3) | creates time and cost efficiencies through the preparation of one combined report instead of two separate reports. |
ACC consolidates ACCOP for financial reporting purposes, and ACC essentially has no assets or liabilities other than its investment in ACCOP. Therefore, the assets and liabilities of the Company and the Operating Partnership are the same on their respective financial statements. However, the Company believes it is important to understand the few differences between the Company and the Operating Partnership in the context of how the entities operate as a consolidated company. All of the Company’s property ownership, development and related business operations are conducted through the Operating Partnership. ACC also issues public equity from time to time and guarantees certain debt of ACCOP, as disclosed in this report. ACC does not have any indebtedness, as all debt is incurred by the Operating Partnership. The Operating Partnership holds substantially all of the assets of the Company, including the Company’s ownership interests in its joint ventures. The Operating Partnership conducts the operations of the business and is structured as a partnership with no publicly traded equity. Except for the net proceeds from ACC’s equity offerings, which are contributed to the capital of ACCOP in exchange for OP Units on a one-for-one common share per OP Unit basis, the Operating Partnership generates all remaining capital required by the Company’s business. These sources include, but are not limited to, the Operating Partnership’s working capital, net cash provided by operating activities, borrowings under its credit facility, the issuance of unsecured notes, and proceeds received from the disposition of certain properties. Noncontrolling interests, stockholders’ equity, and partners’ capital are the main areas of difference between the consolidated financial statements of the Company and those of the Operating Partnership. The noncontrolling interests in the Operating Partnership’s financial statements consist of the interests of unaffiliated partners in various consolidated joint ventures. The noncontrolling interests in the Company’s financial statements include the same noncontrolling interests at the Operating Partnership level and OP Unit holders of the Operating Partnership. The differences between stockholders’ equity and partners’ capital result from differences in the equity issued at the Company and Operating Partnership levels.
To help investors understand the significant differences between the Company and the Operating Partnership, this report provides separate consolidated financial statements for the Company and the Operating Partnership. A single set of consolidated notes to such financial statements is presented that includes separate discussions for the Company and the Operating Partnership when applicable (for example, noncontrolling interests, stockholders’ equity or partners’ capital, earnings per share or unit, etc.). A combined Management’s Discussion and Analysis of Financial Condition and Results of Operations section is also included that presents discrete information related to each entity, as applicable. This report also includes separate Part I, Item 4 Controls and Procedures sections and separate Exhibits 31 and 32 certifications for each of the Company and the Operating Partnership in order to establish that the requisite certifications have been made and that the Company and the Operating Partnership are compliant with Rule 13a-15 or Rule 15d-15 of the Securities Exchange Act of 1934 and 18 U.S.C. §1350.
In order to highlight the differences between the Company and the Operating Partnership, the separate sections in this report for the Company and the Operating Partnership specifically refer to the Company and the Operating Partnership. In the sections that combine disclosure of the Company and the Operating Partnership, this report refers to actions or holdings as being actions or holdings of the Company. Although the Operating Partnership is generally the entity that directly or indirectly enters into contracts and joint ventures and holds assets and debt, reference to the Company is appropriate because the Company operates its business through the Operating Partnership. The separate discussions of the Company and the Operating Partnership in this report should be read in conjunction with each other to understand the results of the Company on a consolidated basis and how management operates the Company.
FORM 10-Q
FOR THE QUARTER ENDED September 30, 20172018
TABLE OF CONTENTS
|
| | |
| | PAGE NO. |
| | |
| PART I. | |
| | | |
| Item 1. | Consolidated Financial Statements of American Campus Communities, Inc. and Subsidiaries: | |
| | | |
| | Consolidated Balance Sheets as of September 30, 20172018 (unaudited) and December 31, 20162017 | |
| | | |
| | Consolidated Statements of Comprehensive Income for the three and nine months ended September 30, 20172018 and 20162017 (all unaudited) | |
| | | |
| | Consolidated Statement of Changes in Equity for the nine months ended September 30, 20172018 (unaudited) | |
| | | |
| | Consolidated Statements of Cash Flows for the nine months ended September 30, 20172018 and 20162017 (all unaudited) | |
| | | |
| | Consolidated Financial Statements of American Campus Communities Operating Partnership, L.P. and Subsidiaries: | |
| | | |
| | Consolidated Balance Sheets as of September 30, 20172018 (unaudited) and December 31, 20162017 | |
| | | |
| | Consolidated Statements of Comprehensive Income for the three and nine months ended September 30, 20172018 and 20162017 (all unaudited) | |
| | | |
| | Consolidated Statement of Changes in Capital for the nine months ended September 30, 20172018 (unaudited) | |
| | | |
| | Consolidated Statements of Cash Flows for the nine months ended September 30, 20172018 and 20162017 (all unaudited) | |
| | | |
| | Notes to Consolidated Financial Statements of American Campus Communities, Inc. and Subsidiaries and American Campus Communities Operating Partnership, L.P. and Subsidiaries (unaudited) | |
| | | |
| Item 2. | Management’s Discussion and Analysis of Financial Condition and Results of Operations | |
| | | |
| Item 3. | Quantitative and Qualitative Disclosure about Market Risk | |
| | | |
| Item 4. | Controls and Procedures | |
| | |
| PART II. | |
| | | |
| Item 1. | Legal Proceedings | |
| | | |
| Item 1A. | Risk Factors | |
| | | |
| Item 2. | Unregistered Sales of Equity Securities and Use of Proceeds | |
| | | |
| Item 3. | Defaults Upon Senior Securities | |
| | | |
| Item 4. | Mine Safety Disclosures | |
| | | |
| Item 5. | Other Information | |
| | | |
| Item 6. | Exhibits | |
| | |
| SIGNATURES | |
AMERICAN CAMPUS COMMUNITIES, INC. AND SUBSIDIARIES
CONSOLIDATED BALANCE SHEETS
(in thousands, except share data)
| | | | | September 30, 2017 | | December 31, 2016 | | September 30, 2018 | | December 31, 2017 |
| | | (Unaudited) | | | | (Unaudited) | | |
| Assets | | | | | | | | |
| | | | | | | | | |
| Investments in real estate: | | | | | | | | |
| Wholly-owned properties, net | | $ | 6,262,077 |
| | $ | 5,427,014 |
| |
| Wholly-owned properties held for sale | | — |
| | 25,350 |
| |
| Owned properties, net | | | $ | 6,521,705 |
| | $ | 6,450,364 |
|
| On-campus participating properties, net | | 83,095 |
| | 85,797 |
| | 78,866 |
| | 81,804 |
|
| Investments in real estate, net | | 6,345,172 |
| | 5,538,161 |
| | 6,600,571 |
| | 6,532,168 |
|
| | | | | | | | | |
| Cash and cash equivalents | | 16,341 |
| | 22,140 |
| | 50,801 |
| | 41,182 |
|
| Restricted cash | | 25,824 |
| | 24,817 |
| | 39,740 |
| | 23,590 |
|
| Student contracts receivable, net | | 15,531 |
| | 8,428 |
| | 45,297 |
| | 9,170 |
|
| Other assets | | 284,023 |
| | 272,367 |
| | 309,639 |
| | 291,260 |
|
| | | | | | | | | |
| Total assets | | $ | 6,686,891 |
| | $ | 5,865,913 |
| | $ | 7,046,048 |
| | $ | 6,897,370 |
|
| | | | | | | | | |
| Liabilities and equity | | |
| | |
| | |
| | |
|
| | | | | | | | | |
| Liabilities: | | |
| | |
| | |
| | |
|
| Secured mortgage, construction and bond debt, net | | $ | 662,874 |
| | $ | 688,195 |
| | $ | 920,345 |
| | $ | 664,020 |
|
| Unsecured notes, net | | 1,190,296 |
| | 1,188,737 |
| | 1,587,796 |
| | 1,585,855 |
|
| Unsecured term loans, net | | 646,675 |
| | 149,065 |
| | 198,681 |
| | 647,044 |
|
| Unsecured revolving credit facility | | 266,440 |
| | 99,300 |
| | 266,900 |
| | 127,600 |
|
| Accounts payable and accrued expenses | | 79,612 |
| | 76,614 |
| | 86,481 |
| | 53,741 |
|
| Other liabilities | | 214,918 |
| | 158,437 |
| | 238,921 |
| | 187,983 |
|
| Total liabilities | | 3,060,815 |
| | 2,360,348 |
| | 3,299,124 |
| | 3,266,243 |
|
| | | | | | | | | |
| Commitments and contingencies (Note 13) | |
|
| |
|
| |
|
| |
|
|
| | | | | | | | | |
| Redeemable noncontrolling interests | | 112,270 |
| | 55,078 |
| | 184,654 |
| | 132,169 |
|
| | | | | | | | | |
| Equity: | | |
| | |
| | |
| | |
|
| American Campus Communities, Inc. and Subsidiaries stockholders' equity: | | |
| | |
| |
| Common stock, $0.01 par value, 800,000,000 shares authorized, 136,362,728 and 132,225,488 shares issued and outstanding at September 30, 2017 and December 31, 2016, respectively | | 1,364 |
| | 1,322 |
| |
| American Campus Communities, Inc. and Subsidiaries stockholders’ equity: | | | |
| | |
|
| Common stock, $0.01 par value, 800,000,000 shares authorized, 136,961,885 and 136,362,728 shares issued and outstanding at September 30, 2018 and December 31, 2017, respectively | | | 1,370 |
| | 1,364 |
|
| Additional paid in capital | | 4,321,228 |
| | 4,118,842 |
| | 4,456,208 |
| | 4,326,910 |
|
| Common stock held in rabbi trust, 63,778 and 20,181 shares at September 30, 2017 and December 31, 2016, respectively | | (2,944 | ) | | (975 | ) | |
| Common stock held in rabbi trust, 69,603 and 63,778 shares at September 30, 2018 and December 31, 2017, respectively | | | (3,092 | ) | | (2,944 | ) |
| Accumulated earnings and dividends | | (816,360 | ) | | (670,137 | ) | | (955,310 | ) | | (837,644 | ) |
| Accumulated other comprehensive loss | | (3,195 | ) | | (4,067 | ) | | (1,975 | ) | | (2,701 | ) |
| Total American Campus Communities, Inc. and Subsidiaries stockholders' equity | | 3,500,093 |
| | 3,444,985 |
| |
| Total American Campus Communities, Inc. and Subsidiaries stockholders’ equity | | | 3,497,201 |
| | 3,484,985 |
|
| Noncontrolling interests - partially owned properties | | 13,713 |
| | 5,502 |
| | 65,069 |
| | 13,973 |
|
| Total equity | | 3,513,806 |
| | 3,450,487 |
| | 3,562,270 |
| | 3,498,958 |
|
| | | | | | | | | |
| Total liabilities and equity | | $ | 6,686,891 |
| | $ | 5,865,913 |
| | $ | 7,046,048 |
| | $ | 6,897,370 |
|
|
| | | | | | | | |
| | | | | |
| Consolidated variable interest entities’ assets and debt included in the above balances: |
| | | | | |
| Investments in real estate, net | | $ | 954,095 |
| | $ | 438,670 |
|
| Cash, cash equivalents and restricted cash | | $ | 58,108 |
| | $ | 12,812 |
|
| Other assets | | $ | 6,968 |
| | $ | 3,134 |
|
| Secured mortgage and construction debt, net | | $ | 378,338 |
| | $ | 50,993 |
|
| Accounts payable, accrued expenses and other liabilities | | $ | 59,740 |
| | $ | 25,200 |
|
See accompanying notes to consolidated financial statements.
1
AMERICAN CAMPUS COMMUNITIES, INC. AND SUBSIDIARIES
CONSOLIDATED STATEMENTS OF COMPREHENSIVE INCOME
(unaudited, in thousands, except share and per share data)
| | | | | Three Months Ended
September 30, | | Nine Months Ended
September 30, | | Three Months Ended
September 30, | | Nine Months Ended
September 30, |
| | | 2017 | | 2016 | | 2017 |
| 2016 | | 2018 | | 2017 | | 2018 |
| 2017 |
| Revenues: | | | | | | | | | | | | | | | | |
| Wholly-owned properties | | $ | 183,569 |
| | $ | 185,694 |
| | $ | 531,556 |
| | $ | 546,078 |
| |
| Owned properties | | | $ | 202,834 |
| | $ | 183,569 |
| | $ | 597,854 |
| | $ | 531,556 |
|
| On-campus participating properties | | 6,799 |
| | 6,758 |
| | 23,128 |
| | 23,018 |
| | 6,980 |
| | 6,799 |
| | 23,605 |
| | 23,128 |
|
| Third-party development services | | 3,566 |
| | 773 |
| | 4,697 |
| | 3,929 |
| | 835 |
| | 3,566 |
| | 3,883 |
| | 4,697 |
|
| Third-party management services | | 2,291 |
| | 2,376 |
| | 7,193 |
| | 7,039 |
| | 2,128 |
| | 2,291 |
| | 7,311 |
| | 7,193 |
|
| Resident services | | 713 |
| | 810 |
| | 2,310 |
| | 2,325 |
| | 692 |
| | 713 |
| | 2,284 |
| | 2,310 |
|
| Total revenues | | 196,938 |
| | 196,411 |
| | 568,884 |
| | 582,389 |
| | 213,469 |
| | 196,938 |
| | 634,937 |
| | 568,884 |
|
| | | | | | | | | | | | | | | | | |
| Operating expenses: | | |
| | |
| | |
| | |
| |
| Wholly-owned properties | | 99,423 |
| | 100,602 |
| | 249,552 |
| | 257,175 |
| |
| Operating expenses (income): | | | |
| | |
| | |
| | |
|
| Owned properties | | | 107,997 |
| | 99,423 |
| | 282,193 |
| | 249,552 |
|
| On-campus participating properties | | 3,923 |
| | 3,784 |
| | 11,080 |
| | 10,125 |
| | 3,875 |
| | 3,923 |
| | 11,030 |
| | 11,080 |
|
| Third-party development and management services | | 3,879 |
| | 3,340 |
| | 11,789 |
| | 10,638 |
| | 3,831 |
| | 3,879 |
| | 11,573 |
| | 11,789 |
|
| General and administrative | | 8,684 |
| | 5,375 |
| | 25,200 |
| | 16,810 |
| | 7,183 |
| | 8,684 |
| | 27,055 |
| | 25,200 |
|
| Depreciation and amortization | | 61,125 |
| | 52,067 |
| | 169,391 |
| | 159,486 |
| | 66,131 |
| | 61,125 |
| | 194,447 |
| | 169,391 |
|
| Ground/facility leases | | 2,329 |
| | 1,965 |
| | 7,151 |
| | 6,736 |
| | 2,951 |
| | 2,329 |
| | 8,526 |
| | 7,151 |
|
| Provision for real estate impairment | | — |
| | — |
| | 15,317 |
| | — |
| | — |
| | — |
| | — |
| | 15,317 |
|
| Other operating income | | | — |
| | — |
| | (2,648 | ) | | — |
|
| Total operating expenses | | 179,363 |
| | 167,133 |
| | 489,480 |
| | 460,970 |
| | 191,968 |
| | 179,363 |
| | 532,176 |
| | 489,480 |
|
| | | | | | | | | | | | | | | | | |
| Operating income | | 17,575 |
| | 29,278 |
| | 79,404 |
| | 121,419 |
| | 21,501 |
| | 17,575 |
| | 102,761 |
| | 79,404 |
|
| | | | | | | | | | | | | | | | | |
| Nonoperating income and (expenses): | | |
| | |
| | |
| | |
| |
| Nonoperating income (expenses): | | | |
| | |
| | |
| | |
|
| Interest income | | 1,259 |
| | 1,272 |
| | 3,723 |
| | 4,026 |
| | 1,274 |
| | 1,259 |
| | 3,740 |
| | 3,723 |
|
| Interest expense | | (18,654 | ) | | (19,016 | ) | | (47,944 | ) | | (61,762 | ) | | (25,185 | ) | | (18,654 | ) | | (72,207 | ) | | (47,944 | ) |
| Amortization of deferred financing costs | | (1,146 | ) | | (1,344 | ) | | (3,197 | ) | | (5,238 | ) | | (1,116 | ) | | (1,146 | ) | | (4,744 | ) | | (3,197 | ) |
| (Loss) gain from disposition of real estate | | — |
| | — |
| | (632 | ) | | 17,409 |
| |
| Total nonoperating expense | | (18,541 | ) | | (19,088 | ) | | (48,050 | ) | | (45,565 | ) | |
| Gain (loss) from disposition of real estate | | | — |
| | — |
| | 42,314 |
| | (632 | ) |
| Loss from early extinguishment of debt | | | — |
| | — |
| | (784 | ) | | — |
|
| Other nonoperating income | | | 570 |
| | — |
| | 570 |
| | — |
|
| Total nonoperating expenses | | | (24,457 | ) | | (18,541 | ) | | (31,111 | ) | | (48,050 | ) |
| | | | | | | | | | | | | | | | | |
| (Loss) income before income taxes | | (966 | ) | | 10,190 |
| | 31,354 |
| | 75,854 |
| | (2,956 | ) | | (966 | ) | | 71,650 |
| | 31,354 |
|
| Income tax provision | | (267 | ) | | (345 | ) | | (791 | ) | | (1,035 | ) | | 219 |
| | (267 | ) | | (2,147 | ) | | (791 | ) |
| Net (loss) income | | (1,233 | ) | | 9,845 |
| | 30,563 |
| | 74,819 |
| | (2,737 | ) | | (1,233 | ) | | 69,503 |
| | 30,563 |
|
| Net income attributable to noncontrolling interests | | (79 | ) | | (201 | ) | | (587 | ) | | (1,150 | ) | |
| Net loss (income) attributable to noncontrolling interests | | | 392 |
| | (79 | ) | | 88 |
| | (587 | ) |
| Net (loss) income attributable to ACC, Inc. and Subsidiaries common stockholders | | $ | (1,312 | ) | | $ | 9,644 |
| | $ | 29,976 |
| | $ | 73,669 |
| | $ | (2,345 | ) | | $ | (1,312 | ) | | $ | 69,591 |
| | $ | 29,976 |
|
| | | | | | | | | | | | | | | | | |
| Other comprehensive income (loss) | | |
| | |
| | |
| | |
| |
| Other comprehensive income | | | |
| | |
| | |
| | |
|
| Change in fair value of interest rate swaps and other | | 233 |
| | 1,271 |
| | 872 |
| | (162 | ) | | 81 |
| | 233 |
| | 726 |
| | 872 |
|
| Comprehensive (loss) income | | $ | (1,079 | ) | | $ | 10,915 |
| | $ | 30,848 |
| | $ | 73,507 |
| | $ | (2,264 | ) | | $ | (1,079 | ) | | $ | 70,317 |
| | $ | 30,848 |
|
| | | | | | | | | | | | | | | | | |
| Net (loss) income per share attributable to ACC, Inc. and Subsidiaries common stockholders | | |
| | |
| | |
| | |
| | |
| | |
| | |
| | |
|
| Basic | | $ | (0.01 | ) | | $ | 0.07 |
| | $ | 0.21 |
| | $ | 0.57 |
| |
| Diluted | | $ | (0.01 | ) | | $ | 0.07 |
| | $ | 0.21 |
| | $ | 0.56 |
| |
| Basic and diluted | | | $ | (0.02 | ) | | $ | (0.01 | ) | | $ | 0.50 |
| | $ | 0.21 |
|
| | | | | | | | | | | | | | | | | |
| Weighted-average common shares outstanding | | |
| | |
| | |
| | |
| | |
| | |
| | |
| | |
|
| Basic | | 136,421,198 |
| | 130,786,985 |
| | 134,708,361 |
| | 128,239,294 |
| | 137,022,012 |
| | 136,421,198 |
| | 136,742,094 |
| | 134,708,361 |
|
| Diluted | | 136,421,198 |
| | 131,568,371 |
| | 135,585,850 |
| | 129,034,401 |
| | 137,022,012 |
| | 136,421,198 |
| | 137,660,802 |
| | 135,585,850 |
|
| | | | | | | | | | | | | | | | | |
| Distributions declared per common share | | $ | 0.44 |
| | $ | 0.42 |
| | $ | 1.30 |
| | $ | 1.24 |
| | $ | 0.46 |
| | $ | 0.44 |
| | $ | 1.36 |
| | $ | 1.30 |
|
See accompanying notes to consolidated financial statements.
2
AMERICAN CAMPUS COMMUNITIES, INC. AND SUBSIDIARIES
CONSOLIDATED STATEMENT OF CHANGES IN EQUITY
(unaudited, in thousands, except share data)
|
| | | | | | | | | | | | | | | | | | | | | | | | | | | | | | | | | | |
| | | Common Shares | | Par Value of Common Shares | | Additional Paid in Capital | | Common Shares Held in Rabbi Trust | | Common Shares Held in Rabbi Trust at Cost | | Accumulated Earnings and Dividends | | Accumulated Other Comprehensive Loss | | Noncontrolling Interests – Partially Owned Properties | | Total |
| Equity, December 31, 2016 | | 132,225,488 |
| | $ | 1,322 |
| | $ | 4,118,842 |
| | 20,181 |
| | $ | (975 | ) | | $ | (670,137 | ) | | $ | (4,067 | ) | | $ | 5,502 |
| | $ | 3,450,487 |
|
| Adjustments to reflect redeemable noncontrolling interests at fair value | | — |
| | — |
| | 5,943 |
| | — |
| | — |
| | — |
| | — |
| | — |
| | 5,943 |
|
| Amortization of restricted stock awards | | — |
| | — |
| | 10,641 |
| | — |
| | — |
| | — |
| | — |
| | — |
| | 10,641 |
|
| Vesting of restricted stock awards and restricted stock units | | 165,884 |
| | 2 |
| | (2,193 | ) | | 43,597 |
| | (1,969 | ) | | — |
| | — |
| | — |
| | (4,160 | ) |
| Distributions to common and restricted stockholders | | — |
| | — |
| | — |
| | — |
| | — |
| | (176,199 | ) | | — |
| | — |
| | (176,199 | ) |
| Distributions to noncontrolling interests - partially owned properties | | — |
| | — |
| | — |
| | — |
| | — |
| | — |
| | — |
| | (212 | ) | | (212 | ) |
| Conversion of common and preferred operating partnership units to common stock | | 22,000 |
| | — |
| | 154 |
| | — |
| | — |
| | — |
| | — |
| | — |
| | 154 |
|
| Net proceeds from sale of common stock | | 3,949,356 |
| | 40 |
| | 187,841 |
| | — |
| | — |
| | — |
| | — |
| | — |
| | 187,881 |
|
| Change in fair value of interest rate swaps and other | | — |
| | — |
| | — |
| | — |
| | — |
| | — |
| | 564 |
| | — |
| | 564 |
|
| Amortization of interest rate swap terminations | | — |
| | — |
| | — |
| | — |
| | — |
| | — |
| | 308 |
| | — |
| | 308 |
|
| Contributions by noncontrolling interest | | — |
| | — |
| | — |
| | — |
| | — |
| | — |
| | — |
| | 8,158 |
| | 8,158 |
|
| Net income | | — |
| | — |
| | — |
| | — |
| | — |
| | 29,976 |
| | — |
| | 265 |
| | 30,241 |
|
| Equity, September 30, 2017 | | 136,362,728 |
|
| $ | 1,364 |
|
| $ | 4,321,228 |
| | 63,778 |
| | $ | (2,944 | ) |
| $ | (816,360 | ) |
| $ | (3,195 | ) |
| $ | 13,713 |
|
| $ | 3,513,806 |
|
|
| | | | | | | | | | | | | | | | | | | | | | | | | | | | | | | | | | |
| | | Common Shares | | Par Value of Common Shares | | Additional Paid in Capital | | Common Shares Held in Rabbi Trust | | Common Shares Held in Rabbi Trust at Cost | | Accumulated Earnings and Dividends | | Accumulated Other Comprehensive Loss | | Noncontrolling Interests – Partially Owned Properties | | Total |
| Equity, December 31, 2017 | | 136,362,728 |
| | $ | 1,364 |
| | $ | 4,326,910 |
| | 63,778 |
| | $ | (2,944 | ) | | $ | (837,644 | ) | | $ | (2,701 | ) | | $ | 13,973 |
| | $ | 3,498,958 |
|
| Adjustments to reflect redeemable noncontrolling interests at fair value | | — |
| | — |
| | (65,857 | ) | | — |
| | — |
| | — |
| | — |
| | — |
| | (65,857 | ) |
| Amortization of restricted stock awards and vesting of restricted stock units | | 27,376 |
| | — |
| | 9,922 |
| |
|
| | — |
| | — |
| | — |
| | — |
| | 9,922 |
|
| Vesting of restricted stock awards | | 165,263 |
| | 2 |
| | (2,758 | ) | |
|
| |
|
| | — |
| | — |
| | — |
| | (2,756 | ) |
| Distributions to common and restricted stockholders | | — |
| | — |
| | — |
| | — |
| | — |
| | (187,257 | ) | | — |
| | — |
| | (187,257 | ) |
| Contributions by noncontrolling interests - partially owned properties | | — |
| | — |
| | — |
| | — |
| | — |
| | — |
| | — |
| | 212,481 |
| | 212,481 |
|
| Distributions to noncontrolling interests - partially owned properties | | — |
| | — |
| | — |
| | — |
| | — |
| | — |
| | — |
| | (151,271 | ) | | (151,271 | ) |
| Change in ownership of consolidated subsidiary | | — |
| | — |
| | 174,515 |
| | — |
| | — |
| | — |
| | — |
| | (9,472 | ) | | 165,043 |
|
| Conversion of common and preferred operating partnership units to common stock | | 412,343 |
| | 4 |
| | 13,328 |
| | — |
| | — |
| | — |
| | — |
| | — |
| | 13,332 |
|
| Change in fair value of interest rate swaps and other | | — |
| | — |
| | — |
| | — |
| | — |
| | — |
| | 726 |
| | — |
| | 726 |
|
| Deposits to deferred compensation plan, net of withdrawals | | (5,825 | ) | | — |
| | 148 |
| | 5,825 |
| | (148 | ) | | — |
| | — |
| | — |
| | — |
|
| Net income (loss) | | — |
| | — |
| | — |
| | — |
| | — |
| | 69,591 |
| | — |
| | (642 | ) | | 68,949 |
|
| Equity, September 30, 2018 | | 136,961,885 |
|
| $ | 1,370 |
|
| $ | 4,456,208 |
| | 69,603 |
| | $ | (3,092 | ) |
| $ | (955,310 | ) |
| $ | (1,975 | ) |
| $ | 65,069 |
|
| $ | 3,562,270 |
|
See accompanying notes to consolidated financial statements.
3
AMERICAN CAMPUS COMMUNITIES, INC. AND SUBSIDIARIES
CONSOLIDATED STATEMENTS OF CASH FLOWS
(unaudited, in thousands)
|
| | | | | | | | |
| | | Nine Months Ended September 30, |
| | | 2017 | | 2016 |
| Operating activities | | | | |
| Net income | | $ | 30,563 |
| | $ | 74,819 |
|
| Adjustments to reconcile net income to net cash provided by operating activities: | | |
| | |
|
| Loss (gain) from disposition of real estate | | 632 |
| | (17,409 | ) |
| Provision for real estate impairment | | 15,317 |
| | — |
|
| Depreciation and amortization | | 169,391 |
| | 159,486 |
|
| Amortization of deferred financing costs and debt premiums/discounts | | (2,691 | ) | | (4,053 | ) |
| Share-based compensation | | 11,401 |
| | 7,820 |
|
| Income tax provision | | 791 |
| | 1,035 |
|
| Amortization of interest rate swap terminations and other | | 308 |
| | 309 |
|
| Changes in operating assets and liabilities: | | |
| | |
|
| Restricted cash | | (566 | ) | | (734 | ) |
| Student contracts receivable, net | | (6,775 | ) | | 1,750 |
|
| Other assets | | (2,536 | ) | | (5,112 | ) |
| Accounts payable and accrued expenses | | (293 | ) | | 2,769 |
|
| Other liabilities | | 29,581 |
| | 22,157 |
|
| Net cash provided by operating activities | | 245,123 |
| | 242,837 |
|
| | | | | |
| Investing activities | | |
| | |
|
| Proceeds from disposition of properties | | 24,462 |
| | 72,640 |
|
| Cash paid for acquisition of operating and under development properties | | (302,318 | ) | | (96,604 | ) |
| Cash paid for land acquisitions | | (8,886 | ) | | (856 | ) |
| Capital expenditures for wholly-owned properties | | (64,464 | ) | | (45,155 | ) |
| Investments in wholly-owned properties under development | | (409,174 | ) | | (284,777 | ) |
| Capital expenditures for on-campus participating properties | | (2,909 | ) | | (2,510 | ) |
| Investment in direct financing lease | | (759 | ) | | (7,837 | ) |
| Change in escrow deposits for real estate investments | | (727 | ) | | 5,141 |
|
| Change in restricted cash related to capital reserves | | (578 | ) | | (1,099 | ) |
| Purchase of corporate furniture, fixtures and equipment | | (4,997 | ) | | (4,681 | ) |
| Net cash used in investing activities | | (770,350 | ) | | (365,738 | ) |
| | | | | |
| Financing activities | | |
| | |
|
| Proceeds from sale of common stock | | 190,912 |
| | 803,189 |
|
| Offering costs | | (2,374 | ) | | (32,912 | ) |
| Pay-off of mortgage and construction loans | | (99,185 | ) | | (152,597 | ) |
| Pay-off of unsecured term loans | | — |
| | (400,000 | ) |
| Proceeds from unsecured term loan | | 500,000 |
| | 150,000 |
|
| Proceeds from revolving credit facility | | 974,300 |
| | 123,400 |
|
| Paydowns of revolving credit facility | | (807,160 | ) | | (172,300 | ) |
| Proceeds from construction loans | | 10,812 |
| | — |
|
| Scheduled principal payments on debt | | (9,718 | ) | | (11,514 | ) |
| Debt issuance and assumption costs | | (7,335 | ) | | (744 | ) |
| Contributions by noncontrolling interests | | 11,526 |
| | — |
|
| Taxes paid on net-share settlements | | (4,920 | ) | | (2,977 | ) |
| Distributions to common and restricted stockholders | | (176,199 | ) | | (162,866 | ) |
| Distributions to noncontrolling interests | | (61,231 | ) | | (2,044 | ) |
| Net cash provided by financing activities | | 519,428 |
| | 138,635 |
|
| | | | | |
| Net change in cash and cash equivalents | | (5,799 | ) | | 15,734 |
|
| Cash and cash equivalents at beginning of period | | 22,140 |
| | 16,659 |
|
| Cash and cash equivalents at end of period | | $ | 16,341 |
| | $ | 32,393 |
|
| | | | | |
| Supplemental disclosure of non-cash investing and financing activities | | |
| | |
|
| Loans assumed in connection with property acquisitions | | $ | (80,296 | ) | | $ | (10,012 | ) |
| Conversion of common and preferred operating partnership units to common stock | | $ | 154 |
| | $ | 5,441 |
|
| Non-cash contribution from noncontrolling interest | | $ | 120,618 |
| | $ | — |
|
| Non-cash consideration exchanged in purchase of land parcel | | $ | (3,071 | ) | | $ | — |
|
| Change in accrued construction in progress | | $ | 24,753 |
| | $ | 32,941 |
|
| Change in fair value of derivative instruments, net | | $ | 564 |
| | $ | (471 | ) |
| Change in fair value of redeemable noncontrolling interests | | $ | 5,943 |
| | $ | (10,481 | ) |
| | | | | |
| Supplemental disclosure of cash flow information | | |
| | |
|
| Cash paid for interest, net of amounts capitalized | | $ | 49,562 |
| | $ | 69,884 |
|
|
| | | | | | | | |
| | | Nine Months Ended September 30, |
| | | 2018 | | 2017 |
| Operating activities | | | | |
| Net income | | $ | 69,503 |
| | $ | 30,563 |
|
| Adjustments to reconcile net income to net cash provided by operating activities: | | |
| | |
|
| (Gain) loss from disposition of real estate | | (42,314 | ) | | 632 |
|
| Loss from early extinguishment of debt | | 784 |
| | — |
|
| Provision for real estate impairment | | — |
| | 15,317 |
|
| Depreciation and amortization | | 194,447 |
| | 169,391 |
|
| Amortization of deferred financing costs and debt premiums/discounts | | 954 |
| | (2,691 | ) |
| Share-based compensation | | 9,922 |
| | 11,401 |
|
| Income tax provision | | 2,147 |
| | 791 |
|
| Amortization of interest rate swap terminations and other | | 308 |
| | 308 |
|
| Changes in operating assets and liabilities: | | |
| | |
|
| Student contracts receivable, net | | (36,584 | ) | | (6,775 | ) |
| Other assets | | (16,739 | ) | | (2,536 | ) |
| Accounts payable and accrued expenses | | 30,214 |
| | (293 | ) |
| Other liabilities | | 54,291 |
| | 29,581 |
|
| Net cash provided by operating activities | | 266,933 |
| | 245,689 |
|
| | | | | |
| Investing activities | | |
| | |
|
| Proceeds from disposition of properties | | 242,284 |
| | 24,462 |
|
| Cash paid for acquisition of operating and under development properties | | — |
| | (302,318 | ) |
| Cash paid for land acquisitions | | (26,534 | ) | | (8,886 | ) |
| Capital expenditures for owned properties | | (55,814 | ) | | (64,464 | ) |
| Investments in owned properties under development | | (372,251 | ) | | (409,174 | ) |
| Capital expenditures for on-campus participating properties | | (2,918 | ) | | (2,909 | ) |
| Investment in direct financing lease, net | | — |
| | (759 | ) |
| Proceeds from insurance settlement | | 1,649 |
| | — |
|
| Purchase of corporate furniture, fixtures and equipment | | (2,527 | ) | | (4,997 | ) |
| Net cash used in investing activities | | (216,111 | ) | | (769,045 | ) |
| | | | | |
| Financing activities | | |
| | |
|
| Proceeds from sale of common stock | | — |
| | 190,912 |
|
| Offering costs | | — |
| | (2,374 | ) |
| Pay-off of mortgage and construction loans | | (146,165 | ) | | (99,185 | ) |
| Defeasance costs related to early extinguishment of debt | | (2,726 | ) | | — |
|
| Pay-off of unsecured term loans | | (450,000 | ) | | — |
|
| Proceeds from unsecured term loans | | — |
| | 500,000 |
|
| Proceeds from revolving credit facility | | 882,800 |
| | 974,300 |
|
| Paydowns of revolving credit facility | | (743,500 | ) | | (807,160 | ) |
| Proceeds from construction loans | | 88,004 |
| | 10,812 |
|
| Proceeds from mortgage loans | | 330,000 |
| | — |
|
| Scheduled principal payments on debt | | (9,728 | ) | | (10,582 | ) |
| Debt issuance and assumption costs | | (656 | ) | | (7,335 | ) |
| Increase in ownership of consolidated subsidiary | | (10,486 | ) | | — |
|
| Contributions by noncontrolling interests | | 379,901 |
| | 11,526 |
|
| Taxes paid on net-share settlements | | (2,756 | ) | | (4,920 | ) |
| Distributions to common and restricted stockholders | | (187,257 | ) | | (176,199 | ) |
| Distributions to noncontrolling interests | | (152,484 | ) | | (61,231 | ) |
| Net cash (used in) provided by financing activities | | (25,053 | ) | | 518,564 |
|
| | | | | |
| Net change in cash, cash equivalents, and restricted cash | | 25,769 |
| | (4,792 | ) |
| Cash, cash equivalents, and restricted cash at beginning of period | | 64,772 |
| | 46,957 |
|
| Cash, cash equivalents, and restricted cash at end of period | | $ | 90,541 |
| | $ | 42,165 |
|
| | | | | |
| Reconciliation of cash, cash equivalents, and restricted cash to the consolidated balance sheets | | | | |
| Cash and cash equivalents | | $ | 50,801 |
| | $ | 16,341 |
|
| Restricted cash | | 39,740 |
| | 25,824 |
|
| Total cash, cash equivalents, and restricted cash at end of period | | $ | 90,541 |
| | $ | 42,165 |
|
| | | | | |
See accompanying notes to consolidated financial statements.
4
AMERICAN CAMPUS COMMUNITIES, INC. AND SUBSIDIARIES
CONSOLIDATED STATEMENTS OF CASH FLOWS
(unaudited, in thousands)
|
| | | | | | | | |
| | | Nine Months Ended September 30, |
| | | 2018 | | 2017 |
| Supplemental disclosure of non-cash investing and financing activities | | |
| | |
|
| Loans assumed in connection with property acquisitions | | $ | — |
| | $ | (80,296 | ) |
| Conversion of common and preferred operating partnership units to common stock | | $ | 13,332 |
| | $ | 154 |
|
| Non-cash contribution from noncontrolling interest | | $ | 8,729 |
| | $ | 120,618 |
|
| Non-cash consideration exchanged in purchase of land parcel | | $ | — |
| | $ | (3,071 | ) |
| Change in accrued construction in progress | | $ | (1,507 | ) | | $ | 24,753 |
|
| Change in fair value of derivative instruments, net | | $ | 418 |
| | $ | 564 |
|
| Change in fair value of redeemable noncontrolling interests | | $ | (65,857 | ) | | $ | 5,943 |
|
| Change in ownership of consolidated subsidiary | | $ | (175,529 | ) | | $ | — |
|
| | | | | |
| Supplemental disclosure of cash flow information | | |
| | |
|
| Cash paid for interest, net of amounts capitalized | | $ | 68,970 |
| | $ | 49,562 |
|
See accompanying notes to consolidated financial statements.
45
AMERICAN CAMPUS COMMUNITIES OPERATING PARTNERSHIP, L.P. AND SUBSIDIARIES
CONSOLIDATED BALANCE SHEETS
(in thousands, except unit data)
|
| | | | | | | | |
| | | September 30, 2018 | | December 31, 2017 |
| | | (Unaudited) | | |
| Assets | | | | |
| | | | | |
| Investments in real estate: | | | | |
| Owned properties, net | | $ | 6,521,705 |
| | $ | 6,450,364 |
|
| On-campus participating properties, net | | 78,866 |
| | 81,804 |
|
| Investments in real estate, net | | 6,600,571 |
| | 6,532,168 |
|
| | | | | |
| Cash and cash equivalents | | 50,801 |
| | 41,182 |
|
| Restricted cash | | 39,740 |
| | 23,590 |
|
| Student contracts receivable, net | | 45,297 |
| | 9,170 |
|
| Other assets | | 309,639 |
| | 291,260 |
|
| | | | | |
| Total assets | | $ | 7,046,048 |
| | $ | 6,897,370 |
|
| | | | | |
| Liabilities and capital | | |
| | |
|
| | | | | |
| Liabilities: | | |
| | |
|
| Secured mortgage, construction and bond debt, net | | $ | 920,345 |
| | $ | 664,020 |
|
| Unsecured notes, net | | 1,587,796 |
| | 1,585,855 |
|
| Unsecured term loans, net | | 198,681 |
| | 647,044 |
|
| Unsecured revolving credit facility | | 266,900 |
| | 127,600 |
|
| Accounts payable and accrued expenses | | 86,481 |
| | 53,741 |
|
| Other liabilities | | 238,921 |
| | 187,983 |
|
| Total liabilities | | 3,299,124 |
| | 3,266,243 |
|
| | | | | |
| Commitments and contingencies (Note 13) | |
|
| |
|
|
| | | | | |
| Redeemable limited partners | | 184,654 |
| | 132,169 |
|
| | | | | |
| Capital: | | |
| | |
|
| Partners’ capital: | | |
| | |
|
| General partner - 12,222 OP units outstanding at both September 30, 2018 and December 31, 2017 | | 56 |
| | 67 |
|
| Limited partner - 137,019,266 and 136,414,284 OP units outstanding at September 30, 2018 and December 31, 2017, respectively | | 3,499,120 |
| | 3,487,619 |
|
| Accumulated other comprehensive loss | | (1,975 | ) | | (2,701 | ) |
| Total partners’ capital | | 3,497,201 |
| | 3,484,985 |
|
| Noncontrolling interests - partially owned properties | | 65,069 |
| | 13,973 |
|
| Total capital | | 3,562,270 |
| | 3,498,958 |
|
| | | | | |
| Total liabilities and capital | | $ | 7,046,048 |
| | $ | 6,897,370 |
|
|
| | | | | | | | |
| | | September 30, 2017 | | December 31, 2016 |
| | | (Unaudited) | | |
| Assets | | | | |
| | | | | |
| Investments in real estate: | | | | |
| Wholly-owned properties, net | | $ | 6,262,077 |
| | $ | 5,427,014 |
|
| Wholly-owned properties held for sale | | — |
| | 25,350 |
|
| On-campus participating properties, net | | 83,095 |
| | 85,797 |
|
| Investments in real estate, net | | 6,345,172 |
| | 5,538,161 |
|
| | | | | |
| Cash and cash equivalents | | 16,341 |
| | 22,140 |
|
| Restricted cash | | 25,824 |
| | 24,817 |
|
| Student contracts receivable, net | | 15,531 |
| | 8,428 |
|
| Other assets | | 284,023 |
| | 272,367 |
|
| | | | | |
| Total assets | | $ | 6,686,891 |
| | $ | 5,865,913 |
|
| | | | | |
| Liabilities and capital | | |
| | |
|
| | | | | |
| Liabilities: | | |
| | |
|
| Secured mortgage, construction and bond debt, net | | $ | 662,874 |
| | $ | 688,195 |
|
| Unsecured notes, net | | 1,190,296 |
| | 1,188,737 |
|
| Unsecured term loans, net | | 646,675 |
| | 149,065 |
|
| Unsecured revolving credit facility | | 266,440 |
| | 99,300 |
|
| Accounts payable and accrued expenses | | 79,612 |
| | 76,614 |
|
| Other liabilities | | 214,918 |
| | 158,437 |
|
| Total liabilities | | 3,060,815 |
| | 2,360,348 |
|
| | | | | |
| Commitments and contingencies (Note 13) | |
|
| |
|
|
| | | | | |
| Redeemable limited partners | | 112,270 |
| | 55,078 |
|
| | | | | |
| Capital: | | |
| | |
|
| Partners' capital: | | |
| | |
|
| General partner - 12,222 OP units outstanding at both September 30, 2017 and December 31, 2016 | | 69 |
| | 82 |
|
| Limited partner - 136,414,284 and 132,233,447 OP units outstanding at September 30, 2017 and December 31, 2016, respectively | | 3,503,219 |
| | 3,448,970 |
|
| Accumulated other comprehensive loss | | (3,195 | ) | | (4,067 | ) |
| Total partners' capital | | 3,500,093 |
| | 3,444,985 |
|
| Noncontrolling interests - partially owned properties | | 13,713 |
| | 5,502 |
|
| Total capital | | 3,513,806 |
| | 3,450,487 |
|
| | | | | |
| Total liabilities and capital | | $ | 6,686,891 |
| | $ | 5,865,913 |
|
|
| | | | | | | | |
| | | | | |
| Consolidated variable interest entities’ assets and debt included in the above balances: |
| | | | | |
| Investments in real estate, net | | $ | 954,095 |
| | $ | 438,670 |
|
| Cash, cash equivalents and restricted cash | | $ | 58,108 |
| | $ | 12,812 |
|
| Other assets | | $ | 6,968 |
| | $ | 3,134 |
|
| Secured mortgage and construction debt, net | | $ | 378,338 |
| | $ | 50,993 |
|
| Accounts payable, accrued expenses and other liabilities | | $ | 59,740 |
| | $ | 25,200 |
|
See accompanying notes to consolidated financial statements.
56
AMERICAN CAMPUS COMMUNITIES OPERATING PARTNERSHIP, L.P. AND SUBSIDIARIES
CONSOLIDATED STATEMENTS OF COMPREHENSIVE INCOME
(unaudited, in thousands, except unit and per unit data)
| | | | | Three Months Ended
September 30, | | Nine Months Ended
September 30, | | Three Months Ended
September 30, | | Nine Months Ended
September 30, |
| | | 2017 | | 2016 | | 2017 | | 2016 | | 2018 | | 2017 | | 2018 | | 2017 |
| Revenues: | | | | | | | | | | | | | | | | |
| Wholly-owned properties | | $ | 183,569 |
| | $ | 185,694 |
| | $ | 531,556 |
| | $ | 546,078 |
| |
| Owned properties | | | $ | 202,834 |
| | $ | 183,569 |
| | $ | 597,854 |
| | $ | 531,556 |
|
| On-campus participating properties | | 6,799 |
| | 6,758 |
| | 23,128 |
| | 23,018 |
| | 6,980 |
| | 6,799 |
| | 23,605 |
| | 23,128 |
|
| Third-party development services | | 3,566 |
| | 773 |
| | 4,697 |
| | 3,929 |
| | 835 |
| | 3,566 |
| | 3,883 |
| | 4,697 |
|
| Third-party management services | | 2,291 |
| | 2,376 |
| | 7,193 |
| | 7,039 |
| | 2,128 |
| | 2,291 |
| | 7,311 |
| | 7,193 |
|
| Resident services | | 713 |
| | 810 |
| | 2,310 |
| | 2,325 |
| | 692 |
| | 713 |
| | 2,284 |
| | 2,310 |
|
| Total revenues | | 196,938 |
| | 196,411 |
| | 568,884 |
| | 582,389 |
| | 213,469 |
| | 196,938 |
| | 634,937 |
| | 568,884 |
|
| | | | | | | | | | | | | | | | | |
| Operating expenses: | | |
| | |
| | |
| | |
| |
| Wholly-owned properties | | 99,423 |
| | 100,602 |
| | 249,552 |
| | 257,175 |
| |
| Operating expenses (income): | | | |
| | |
| | |
| | |
|
| Owned properties | | | 107,997 |
| | 99,423 |
| | 282,193 |
| | 249,552 |
|
| On-campus participating properties | | 3,923 |
| | 3,784 |
| | 11,080 |
| | 10,125 |
| | 3,875 |
| | 3,923 |
| | 11,030 |
| | 11,080 |
|
| Third-party development and management services | | 3,879 |
| | 3,340 |
| | 11,789 |
| | 10,638 |
| | 3,831 |
| | 3,879 |
| | 11,573 |
| | 11,789 |
|
| General and administrative | | 8,684 |
| | 5,375 |
| | 25,200 |
| | 16,810 |
| | 7,183 |
| | 8,684 |
| | 27,055 |
| | 25,200 |
|
| Depreciation and amortization | | 61,125 |
| | 52,067 |
| | 169,391 |
| | 159,486 |
| | 66,131 |
| | 61,125 |
| | 194,447 |
| | 169,391 |
|
| Ground/facility leases | | 2,329 |
| | 1,965 |
| | 7,151 |
| | 6,736 |
| | 2,951 |
| | 2,329 |
| | 8,526 |
| | 7,151 |
|
| Provision for real estate impairment | | — |
| | — |
| | 15,317 |
| | — |
| | — |
| | — |
| | — |
| | 15,317 |
|
| Other operating income | | | — |
| | — |
| | (2,648 | ) | | — |
|
| Total operating expenses | | 179,363 |
| | 167,133 |
| | 489,480 |
| | 460,970 |
| | 191,968 |
| | 179,363 |
| | 532,176 |
| | 489,480 |
|
| | | | | | | | | | | | | | | | | |
| Operating income | | 17,575 |
| | 29,278 |
| | 79,404 |
| | 121,419 |
| | 21,501 |
| | 17,575 |
| | 102,761 |
| | 79,404 |
|
| | | | | | | | | | | | | | | | | |
| Nonoperating income and (expenses): | | |
| | |
| | |
| | |
| |
| Nonoperating income (expenses): | | | |
| | |
| | |
| | |
|
| Interest income | | 1,259 |
| | 1,272 |
| | 3,723 |
| | 4,026 |
| | 1,274 |
| | 1,259 |
| | 3,740 |
| | 3,723 |
|
| Interest expense | | (18,654 | ) | | (19,016 | ) | | (47,944 | ) | | (61,762 | ) | | (25,185 | ) | | (18,654 | ) | | (72,207 | ) | | (47,944 | ) |
| Amortization of deferred financing costs | | (1,146 | ) | | (1,344 | ) | | (3,197 | ) | | (5,238 | ) | | (1,116 | ) | | (1,146 | ) | | (4,744 | ) | | (3,197 | ) |
| (Loss) gain from disposition of real estate | | — |
| | — |
| | (632 | ) | | 17,409 |
| |
| Total nonoperating expense | | (18,541 | ) | | (19,088 | ) | | (48,050 | ) | | (45,565 | ) | |
| Gain (loss) from disposition of real estate | | | — |
| | — |
| | 42,314 |
| | (632 | ) |
| Loss from early extinguishment of debt | | | — |
| | — |
| | (784 | ) | | — |
|
| Other nonoperating income | | | 570 |
| | — |
| | 570 |
| | — |
|
| Total nonoperating expenses | | | (24,457 | ) | | (18,541 | ) | | (31,111 | ) | | (48,050 | ) |
| (Loss) income before income taxes | | (966 | ) | | 10,190 |
| | 31,354 |
| | 75,854 |
| | (2,956 | ) | | (966 | ) | | 71,650 |
| | 31,354 |
|
| Income tax provision | | (267 | ) | | (345 | ) | | (791 | ) | | (1,035 | ) | | 219 |
| | (267 | ) | | (2,147 | ) | | (791 | ) |
| Net (loss) income | | (1,233 | ) | | 9,845 |
| | 30,563 |
| | 74,819 |
| | (2,737 | ) | | (1,233 | ) | | 69,503 |
| | 30,563 |
|
| Net income attributable to noncontrolling interests – partially owned properties | | (57 | ) | | (77 | ) | | (259 | ) | | (285 | ) | |
| Net loss (income) attributable to noncontrolling interests – partially owned properties | | | 413 |
| | (57 | ) | | 665 |
| | (259 | ) |
| Net (loss) income attributable to American Campus Communities Operating Partnership, L.P. | | (1,290 | ) | | 9,768 |
| | 30,304 |
| | 74,534 |
| | (2,324 | ) | | (1,290 | ) | | 70,168 |
| | 30,304 |
|
| Series A preferred unit distributions | | (31 | ) | | (36 | ) | | (93 | ) | | (115 | ) | | (31 | ) | | (31 | ) | | (93 | ) | | (93 | ) |
| Net (loss) income attributable to common unitholders | | $ | (1,321 | ) | | $ | 9,732 |
| | $ | 30,211 |
| | $ | 74,419 |
| | $ | (2,355 | ) | | $ | (1,321 | ) | | $ | 70,075 |
| | $ | 30,211 |
|
| | | | | | | | | | | | | | | | | |
| Other comprehensive income (loss) | | |
| | |
| | |
| | |
| |
| Other comprehensive income | | | |
| | |
| | |
| | |
|
| Change in fair value of interest rate swaps and other | | 233 |
| | 1,271 |
| | 872 |
| | (162 | ) | | 81 |
| | 233 |
| | 726 |
| | 872 |
|
| Comprehensive (loss) income | | $ | (1,088 | ) | | $ | 11,003 |
| | $ | 31,083 |
| | $ | 74,257 |
| | $ | (2,274 | ) | | $ | (1,088 | ) | | $ | 70,801 |
| | $ | 31,083 |
|
| | | | | | | | | | | | | | | | | |
| Net (loss) income per unit attributable to common unitholders | | |
| | |
| | |
| | |
| | |
| | |
| | |
| | |
|
| Basic | | $ | (0.01 | ) | | $ | 0.07 |
| | $ | 0.21 |
| | $ | 0.57 |
| |
| Diluted | | $ | (0.01 | ) | | $ | 0.07 |
| | $ | 0.21 |
| | $ | 0.56 |
| |
| Basic and diluted | | | $ | (0.02 | ) | | $ | (0.01 | ) | | $ | 0.50 |
| | $ | 0.21 |
|
| | | | | | | | | | | | | | | | | |
| Weighted-average common units outstanding | | |
| | |
| | |
| | |
| | |
| | |
| | |
| | |
|
| Basic | | 137,432,872 |
| | 132,008,227 |
| | 135,731,609 |
| | 129,517,442 |
| | 137,624,276 |
| | 137,432,872 |
| | 137,573,422 |
| | 135,731,609 |
|
| Diluted | | 137,432,872 |
| | 132,789,613 |
| | 136,609,098 |
| | 130,312,549 |
| | 137,624,276 |
| | 137,432,872 |
| | 138,492,130 |
| | 136,609,098 |
|
| | | | | | | | | | | | | | | | | |
| Distributions declared per Common Unit | | $ | 0.44 |
| | $ | 0.42 |
| | $ | 1.30 |
| | $ | 1.24 |
| | $ | 0.46 |
| | $ | 0.44 |
| | $ | 1.36 |
| | $ | 1.30 |
|
See accompanying notes to consolidated financial statements.
67
AMERICAN CAMPUS COMMUNITIES OPERATING PARTNERSHIP, L.P. AND SUBSIDIARIES
CONSOLIDATED STATEMENT OF CHANGES IN CAPITAL
(unaudited, in thousands, except unit data)
|
| | | | | | | | | | | | | | | | | | | | | | | | | | |
| | | | | | | | | | | Accumulated | | Noncontrolling | | |
| | | | | | | Other | | Interests - | | |
|
| | | General Partner | | Limited Partner | | Comprehensive | | Partially Owned | | |
|
| | | Units | | Amount | | Units | | Amount | | Loss | | Properties | | Total |
| Capital, December 31, 2016 | | 12,222 |
| | $ | 82 |
| | 132,233,447 |
| | $ | 3,448,970 |
| | $ | (4,067 | ) | | $ | 5,502 |
| | $ | 3,450,487 |
|
| Adjustments to reflect redeemable limited partners' interest at fair value | | — |
| | — |
| | — |
| | 5,943 |
| | — |
| | — |
| | 5,943 |
|
| Amortization of restricted stock awards | | — |
| | — |
| | — |
| | 10,641 |
| | — |
| | — |
| | 10,641 |
|
| Vesting of restricted stock awards and restricted stock units | | — |
| | — |
| | 209,481 |
| | (4,160 | ) | | — |
| | — |
| | (4,160 | ) |
| Distributions | | — |
| | (16 | ) | | — |
| | (176,183 | ) | | — |
| | — |
| | (176,199 | ) |
| Distributions to noncontrolling interests - partially owned properties | | — |
| | — |
| | — |
| | — |
| | — |
| | (212 | ) | | (212 | ) |
| Conversion of common and preferred operating partnership units to common stock | | — |
| | — |
| | 22,000 |
| | 154 |
| | — |
| | — |
| | 154 |
|
| Issuance of units in exchange for contributions of equity offering proceeds | | — |
| | — |
| | 3,949,356 |
| | 187,881 |
| | — |
| | — |
| | 187,881 |
|
| Change in fair value of interest rate swaps and other | | — |
| | — |
| | — |
| | — |
| | 564 |
| | — |
| | 564 |
|
| Amortization of interest rate swap terminations | | — |
| | — |
| | — |
| | — |
| | 308 |
| | — |
| | 308 |
|
| Contributions by noncontrolling interest | | — |
| | — |
| | — |
| | — |
| | — |
| | 8,158 |
| | 8,158 |
|
| Net income | | — |
| | 3 |
| | — |
| | 29,973 |
| | — |
| | 265 |
| | 30,241 |
|
| Capital as of September 30, 2017 | | 12,222 |
| | $ | 69 |
| | 136,414,284 |
| | $ | 3,503,219 |
| | $ | (3,195 | ) | | $ | 13,713 |
| | $ | 3,513,806 |
|
|
| | | | | | | | | | | | | | | | | | | | | | | | | | |
| | | | | | | | | | | Accumulated | | Noncontrolling | | |
| | | | | | | Other | | Interests - | | |
|
| | | General Partner | | Limited Partner | | Comprehensive | | Partially Owned | | |
|
| | | Units | | Amount | | Units | | Amount | | Loss | | Properties | | Total |
| Capital, December 31, 2017 | | 12,222 |
| | $ | 67 |
| | 136,414,284 |
| | $ | 3,487,619 |
| | $ | (2,701 | ) | | $ | 13,973 |
| | $ | 3,498,958 |
|
| Adjustments to reflect redeemable limited partners’ interest at fair value | | — |
| | — |
| | — |
| | (65,857 | ) | | — |
| | — |
| | (65,857 | ) |
| Amortization of restricted stock awards and vesting of restricted stock units | | — |
| | — |
| | 27,376 |
| | 9,922 |
| | — |
| | — |
| | 9,922 |
|
| Vesting of restricted stock awards | | — |
| | — |
| | 165,263 |
| | (2,756 | ) | | — |
| | — |
| | (2,756 | ) |
| Distributions | | — |
| | (17 | ) | | — |
| | (187,240 | ) | | — |
| | — |
| | (187,257 | ) |
| Contributions by noncontrolling interests - partially owned properties | | — |
| | — |
| | — |
| | — |
| | — |
| | 212,481 |
| | 212,481 |
|
| Distributions to noncontrolling interests - partially owned properties | | — |
| | — |
| | — |
| | — |
| | — |
| | (151,271 | ) | | (151,271 | ) |
| Change in ownership of consolidated subsidiary | | — |
| | — |
| | — |
| | 174,515 |
| | — |
| | (9,472 | ) | | 165,043 |
|
| Conversion of common and preferred operating partnership units to common stock | | — |
| | — |
| | 412,343 |
| | 13,332 |
| | — |
| | — |
| | 13,332 |
|
| Change in fair value of interest rate swaps and other | | — |
| | — |
| | — |
| | — |
| | 726 |
| | — |
| | 726 |
|
| Net income (loss) | | — |
| | 6 |
| | — |
| | 69,585 |
| | — |
| | (642 | ) | | 68,949 |
|
| Capital, September 30, 2018 | | 12,222 |
| | $ | 56 |
| | 137,019,266 |
| | $ | 3,499,120 |
| | $ | (1,975 | ) | | $ | 65,069 |
| | $ | 3,562,270 |
|
See accompanying notes to consolidated financial statements.
78
AMERICAN CAMPUS COMMUNITIES OPERATING PARTNERSHIP, L.P. AND SUBSIDIARIES
CONSOLIDATED STATEMENTS OF CASH FLOWS
(unaudited, in thousands)
|
| | | | | | | | |
| | | Nine Months Ended September 30, |
| | | 2017 | | 2016 |
| Operating activities | | | | |
| Net income | | $ | 30,563 |
| | $ | 74,819 |
|
| Adjustments to reconcile net income to net cash provided by operating activities: | | |
| | |
|
| Loss (gain) from disposition of real estate | | 632 |
| | (17,409 | ) |
| Provision for real estate impairment | | 15,317 |
| | — |
|
| Depreciation and amortization | | 169,391 |
| | 159,486 |
|
| Amortization of deferred financing costs and debt premiums/discounts | | (2,691 | ) | | (4,053 | ) |
| Share-based compensation | | 11,401 |
| | 7,820 |
|
| Income tax provision | | 791 |
| | 1,035 |
|
| Amortization of interest rate swap terminations and other | | 308 |
| | 309 |
|
| Changes in operating assets and liabilities: | | |
| | |
|
| Restricted cash | | (566 | ) | | (734 | ) |
| Student contracts receivable, net | | (6,775 | ) | | 1,750 |
|
| Other assets | | (2,536 | ) | | (5,112 | ) |
| Accounts payable and accrued expenses | | (293 | ) | | 2,769 |
|
| Other liabilities | | 29,581 |
| | 22,157 |
|
| Net cash provided by operating activities | | 245,123 |
| | 242,837 |
|
| | | | | |
| Investing activities | | |
| | |
|
| Proceeds from disposition of properties | | 24,462 |
| | 72,640 |
|
| Cash paid for acquisition of operating and under development properties | | (302,318 | ) | | (96,604 | ) |
| Cash paid for land acquisitions | | (8,886 | ) | | (856 | ) |
| Capital expenditures for wholly-owned properties | | (64,464 | ) | | (45,155 | ) |
| Investments in wholly-owned properties under development | | (409,174 | ) | | (284,777 | ) |
| Capital expenditures for on-campus participating properties | | (2,909 | ) | | (2,510 | ) |
| Investment in direct financing lease | | (759 | ) | | (7,837 | ) |
| Change in escrow deposits for real estate investments | | (727 | ) | | 5,141 |
|
| Change in restricted cash related to capital reserves | | (578 | ) | | (1,099 | ) |
| Purchase of corporate furniture, fixtures and equipment | | (4,997 | ) | | (4,681 | ) |
| Net cash used in investing activities | | (770,350 | ) | | (365,738 | ) |
| | | | | |
| Financing activities | | |
| | |
|
| Proceeds from issuance of common units in exchange for contributions, net | | 188,538 |
| | 770,277 |
|
| Pay-off of mortgage and construction loans | | (99,185 | ) | | (152,597 | ) |
| Pay-off of unsecured term loan | | — |
| | (400,000 | ) |
| Proceeds from unsecured term loan | | 500,000 |
| | 150,000 |
|
| Proceeds from revolving credit facility | | 974,300 |
| | 123,400 |
|
| Paydowns of revolving credit facility | | (807,160 | ) | | (172,300 | ) |
| Proceeds from construction loans | | 10,812 |
| | — |
|
| Scheduled principal payments on debt | | (9,718 | ) | | (11,514 | ) |
| Debt issuance and assumption costs | | (7,335 | ) | | (744 | ) |
| Contributions by noncontrolling interests | | 11,526 |
| | — |
|
| Taxes paid on net-share settlements | | (4,920 | ) | | (2,977 | ) |
| Distributions paid to common and preferred unitholders | | (176,404 | ) | | (163,493 | ) |
| Distributions paid on unvested restricted stock awards | | (1,217 | ) | | (1,051 | ) |
| Distributions paid to noncontrolling interests - partially owned properties | | (59,809 | ) | | (366 | ) |
| Net cash provided by financing activities | | 519,428 |
| | 138,635 |
|
| | | | | |
| Net change in cash and cash equivalents | | (5,799 | ) | | 15,734 |
|
| Cash and cash equivalents at beginning of period | | 22,140 |
| | 16,659 |
|
| Cash and cash equivalents at end of period | | $ | 16,341 |
| | $ | 32,393 |
|
| | | | | |
| Supplemental disclosure of non-cash investing and financing activities | | |
| | |
|
| Loans assumed in connection with property acquisitions | | $ | (80,296 | ) | | $ | (10,012 | ) |
| Conversion of common and preferred operating partnership units to common stock | | $ | 154 |
| | $ | 5,441 |
|
| Non-cash contribution from noncontrolling interest | | $ | 120,618 |
| | $ | — |
|
| Non-cash consideration exchanged in purchase of land parcel | | $ | (3,071 | ) | | $ | — |
|
| Change in accrued construction in progress | | $ | 24,753 |
| | $ | 32,941 |
|
| Change in fair value of derivative instruments, net | | $ | 564 |
| | $ | (471 | ) |
| Change in fair value of redeemable noncontrolling interests | | $ | 5,943 |
| | $ | (10,481 | ) |
| | | | | |
| Supplemental disclosure of cash flow information | | |
| | |
|
| Cash paid for interest, net of amounts capitalized | | $ | 49,562 |
| | $ | 69,884 |
|
|
| | | | | | | | |
| | | Nine Months Ended September 30, |
| | | 2018 | | 2017 |
| Operating activities | | | | |
| Net income | | $ | 69,503 |
| | $ | 30,563 |
|
| Adjustments to reconcile net income to net cash provided by operating activities: | | |
| | |
|
| (Gain) loss from disposition of real estate | | (42,314 | ) | | 632 |
|
| Loss from early extinguishment of debt | | 784 |
| | — |
|
| Provision for real estate impairment | | — |
| | 15,317 |
|
| Depreciation and amortization | | 194,447 |
| | 169,391 |
|
| Amortization of deferred financing costs and debt premiums/discounts | | 954 |
| | (2,691 | ) |
| Share-based compensation | | 9,922 |
| | 11,401 |
|
| Income tax provision | | 2,147 |
| | 791 |
|
| Amortization of interest rate swap terminations and other | | 308 |
| | 308 |
|
| Changes in operating assets and liabilities: | | |
| | |
|
| Student contracts receivable, net | | (36,584 | ) | | (6,775 | ) |
| Other assets | | (16,739 | ) | | (2,536 | ) |
| Accounts payable and accrued expenses | | 30,214 |
| | (293 | ) |
| Other liabilities | | 54,291 |
| | 29,581 |
|
| Net cash provided by operating activities | | 266,933 |
| | 245,689 |
|
| | | | | |
| Investing activities | | |
| | |
|
| Proceeds from disposition of properties | | 242,284 |
| | 24,462 |
|
| Cash paid for acquisition of operating and under development properties | | — |
| | (302,318 | ) |
| Cash paid for land acquisitions | | (26,534 | ) | | (8,886 | ) |
| Capital expenditures for owned properties | | (55,814 | ) | | (64,464 | ) |
| Investments in owned properties under development | | (372,251 | ) | | (409,174 | ) |
| Capital expenditures for on-campus participating properties | | (2,918 | ) | | (2,909 | ) |
| Investment in direct financing lease | | — |
| | (759 | ) |
| Proceeds from insurance settlement | | 1,649 |
| | — |
|
| Purchase of corporate furniture, fixtures and equipment | | (2,527 | ) | | (4,997 | ) |
| Net cash used in investing activities | | (216,111 | ) | | (769,045 | ) |
| | | | | |
| Financing activities | | |
| | |
|
| Proceeds from issuance of common units in exchange for contributions, net | | — |
| | 188,538 |
|
| Pay-off of mortgage and construction loans | | (146,165 | ) | | (99,185 | ) |
| Defeasance costs related to early extinguishment of debt | | (2,726 | ) | | — |
|
| Pay-off of unsecured term loans | | (450,000 | ) | | — |
|
| Proceeds from unsecured term loans | | — |
| | 500,000 |
|
| Proceeds from revolving credit facility | | 882,800 |
| | 974,300 |
|
| Paydowns of revolving credit facility | | (743,500 | ) | | (807,160 | ) |
| Proceeds from construction loans | | 88,004 |
| | 10,812 |
|
| Proceeds from mortgage loans | | 330,000 |
| | — |
|
| Scheduled principal payments on debt | | (9,728 | ) | | (10,582 | ) |
| Debt issuance and assumption costs | | (656 | ) | | (7,335 | ) |
| Increase in ownership of consolidated subsidiary | | (10,486 | ) | | — |
|
| Contributions by noncontrolling interests | | 379,901 |
| | 11,526 |
|
| Taxes paid on net-share settlements | | (2,756 | ) | | (4,920 | ) |
| Distributions paid to common and preferred unitholders | | (187,177 | ) | | (176,404 | ) |
| Distributions paid on unvested restricted stock awards | | (1,293 | ) | | (1,217 | ) |
| Distributions paid to noncontrolling interests - partially owned properties | | (151,271 | ) | | (59,809 | ) |
| Net cash (used in) provided by financing activities | | (25,053 | ) | | 518,564 |
|
| | | | | |
| Net change in cash, cash equivalents, and restricted cash | | 25,769 |
| | (4,792 | ) |
| Cash, cash equivalents, and restricted cash at beginning of period | | 64,772 |
| | 46,957 |
|
| Cash, cash equivalents, and restricted cash at end of period | | $ | 90,541 |
| | $ | 42,165 |
|
| | | | | |
| Reconciliation of cash, cash equivalents, and restricted cash to the consolidated balance sheets | | | | |
| Cash and cash equivalents | | $ | 50,801 |
| | $ | 16,341 |
|
| Restricted cash | | 39,740 |
| | 25,824 |
|
| Total cash, cash equivalents, and restricted cash at end of period | | $ | 90,541 |
| | $ | 42,165 |
|
| | | | | |
See accompanying notes to consolidated financial statements.
9
AMERICAN CAMPUS COMMUNITIES OPERATING PARTNERSHIP, L.P. AND SUBSIDIARIES
CONSOLIDATED STATEMENTS OF CASH FLOWS
(unaudited, in thousands)
|
| | | | | | | | |
| | | Nine Months Ended September 30, |
| | | 2018 | | 2017 |
| Supplemental disclosure of non-cash investing and financing activities | | |
| | |
|
| Loans assumed in connection with property acquisitions | | $ | — |
| | $ | (80,296 | ) |
| Conversion of common and preferred operating partnership units to common stock | | $ | 13,332 |
| | $ | 154 |
|
| Non-cash contribution from noncontrolling interest | | $ | 8,729 |
| | $ | 120,618 |
|
| Non-cash consideration exchanged in purchase of land parcel | | $ | — |
| | $ | (3,071 | ) |
| Change in accrued construction in progress | | $ | (1,507 | ) | | $ | 24,753 |
|
| Change in fair value of derivative instruments, net | | $ | 418 |
| | $ | 564 |
|
| Change in fair value of redeemable noncontrolling interests | | $ | (65,857 | ) | | $ | 5,943 |
|
| Change in ownership of consolidated subsidiary | | $ | (175,529 | ) | | $ | — |
|
| | | | | |
| Supplemental disclosure of cash flow information | | |
| | |
|
| Cash paid for interest, net of amounts capitalized | | $ | 68,970 |
| | $ | 49,562 |
|
See accompanying notes to consolidated financial statements.
810
AMERICAN CAMPUS COMMUNITIES, INC. AND SUBSIDIARIES
AMERICAN CAMPUS COMMUNITIES OPERATING PARTNERSHIP, L.P. AND SUBSIDIARIES
NOTES TO CONSOLIDATED FINANCIAL STATEMENTS
(unaudited)
1. Organization and Description of Business
American Campus Communities, Inc. (“ACC”) is a real estate investment trust (“REIT”) that commenced operations effective with the completion of an initial public offering (“IPO”) on August 17, 2004. Through ACC’s controlling interest in American Campus Communities Operating Partnership, L.P. (“ACCOP”), ACC is one of the largest owners, managers and developers of high quality student housing properties in the United States in terms of beds owned and under management. ACC is a fully integrated, self-managed and self-administered equity REIT with expertise in the acquisition, design, financing, development, construction management, leasing and management of student housing properties. ACC’s common stock is publicly traded on the New York Stock Exchange (“NYSE”) under the ticker symbol “ACC.”
The general partner of ACCOP is American Campus Communities Holdings, LLC (“ACC Holdings”), an entity that is wholly-owned by ACC. As of September 30, 2017,2018, ACC Holdings held an ownership interest in ACCOP of less than 1%. The limited partners of ACCOP are ACC and other limited partners consisting of current and former members of management and nonaffiliated third parties. As of September 30, 2017,2018, ACC owned an approximate 99.2%99.5% limited partnership interest in ACCOP. As the sole member of the general partner of ACCOP, ACC has exclusive control of ACCOP’s day-to-day management. Management operates ACC and ACCOP as one business. The management of ACC consists of the same members as the management of ACCOP. ACC consolidates ACCOP for financial reporting purposes, and ACC does not have significant assets other than its investment in ACCOP. Therefore, the assets and liabilities of ACC and ACCOP are the same on their respective financial statements. References to the “Company” means collectively ACC, ACCOP and those entities/subsidiaries owned or controlled by ACC and/or ACCOP. References to the “Operating Partnership” mean collectively ACCOP and those entities/subsidiaries owned or controlled by ACCOP. Unless otherwise indicated, the accompanying Notes to the Consolidated Financial Statements apply to both the Company and the Operating Partnership.
As of September 30, 2017,2018, the Company’s property portfolio contained 166168 properties with approximately 102,500103,500 beds. The Company’s property portfolio consisted of 130131 owned off-campus student housing properties that are in close proximity to colleges and universities, 3132 American Campus Equity (“ACE®”) properties operated under ground/facility leases with 1415 university systems and five on-campus participating properties operated under ground/facility leases with the related university systems. Of the 166168 properties, 12five were under development as of September 30, 2017,2018, and when completed will consist of a total of approximately 8,3003,200 beds. The Company’s communities contain modern housing units and are supported by a resident assistant system and other student-oriented programming, with many offering resort-style amenities.
Through one of ACC’s taxable REIT subsidiaries (“TRSs”), the Company also provides construction management and development services, primarily for student housing properties owned by colleges and universities, charitable foundations, and others. As of September 30, 2017,2018, also through one of ACC’s TRSs, the Company provided third-party management and leasing services for 3834 properties that represented approximately 28,80028,400 beds. Third-party management and leasing services are typically provided pursuant to management contracts that have initial terms that range from one to five years. As of September 30, 2017,2018, the Company’s total owned and third-party managed portfolio included 204202 properties with approximately 131,300131,900 beds.
2. Summary of Significant Accounting Policies
Basis of Presentation and use of Estimates
The accompanying consolidated financial statements, presented in U.S. dollars, are prepared in accordance with U.S. generally accepted accounting principles (“GAAP”). GAAP requires the Company to make estimates and assumptions that affect the reported amounts of assets and liabilities, disclosure of contingent assets and liabilities as of the date of the financial statements, and revenue and expenses during the reporting periods. The Company’s actual results could differ from those estimates and assumptions. All material intercompany transactions among consolidated entities have been eliminated. All dollar amounts in the tables herein, except share, per share, unit and per unit amounts, are stated in thousands unless otherwise indicated.
AMERICAN CAMPUS COMMUNITIES, INC. AND SUBSIDIARIES
AMERICAN CAMPUS COMMUNITIES OPERATING PARTNERSHIP, L.P. AND SUBSIDIARIES
NOTES TO CONSOLIDATED FINANCIAL STATEMENTS
(unaudited)
Principles of Consolidation
The Company’s consolidated financial statements include its accounts and the accounts of other subsidiaries and joint ventures (including partnerships and limited liability companies) over which it has control. Investments acquired or created are evaluated based on the accounting guidance relating to variable interest entities (“VIEs”), which requires the consolidation of VIEs in which the Company is considered to be the primary beneficiary. If the investment is determined not to be a VIE, then the investment is evaluated for consolidation using the voting interest model.
Recently Issued Accounting Pronouncements
In August 2017,February 2016, the Financial Accounting Standards Board (“FASB”) issued Accounting Standards Update 2017-12 (“ASU 2017-12”), “Derivatives and Hedging (Topic 815): Targeted Improvements to Accounting for Hedging Activities.” The purpose of this ASU is to improve the financial reporting of hedging relationships to better portray the economic results of an entity’s risk management activities in its financial statements. In addition to that main objective, the amendments in this update make certain targeted improvements to simplify the application of the hedge accounting guidance in current GAAP. The guidance is effective for public business entities for fiscal years beginning after December 15, 2018, and interim periods within those fiscal years. Early adoption is permitted in any interim period after the issuance date of this update. All transition requirements and elections should be applied to hedging relationships existing on the date of adoption. The effect of adoption should be reflected as of the beginning of the fiscal year of adoption. The Company is currently in the process of assessing the effects of this ASU, but does not anticipate a material impact on its consolidated financial statements.
In February 2017, the FASB issued Accounting Standards Update 2017-05 (“ASU 2017-05”), “Other Income—Gains and Losses from the Derecognition of Nonfinancial Assets (Subtopic 610-20): Clarifying the Scope of Asset Derecognition Guidance and Accounting for Partial Sales of Nonfinancial Assets.” The purpose of this ASU is to eliminate the diversity in practice in accounting for derecognition of a nonfinancial asset and in-substance nonfinancial assets (only when the asset or asset group does not meet the definition of a business or the transaction is not a sale to a customer). The guidance is effective for public business entities for fiscal years beginning after December 15, 2017, and interim periods within those fiscal years. Early adoption for the fiscal years beginning after December 15, 2016 is permitted. This ASU is required to be adopted in conjunction with the Company’s adoption of ASU 2014-09, the new revenue recognition standard, which will be adopted as of January 1, 2018. Upon adoption of this ASU, application must be performed on a retrospective basis for each period presented in the Company’s financial statements or a retrospective basis with a cumulative-effect adjustment to retained earnings at the beginning of the fiscal year of adoption. The Company currently does not anticipate a material impact to its consolidated financial statements for property dispositions given the simplicity of the Company’s historical disposition transactions.
In February 2016, the FASB issued Accounting Standards Update 2016-02 (“ASU 2016-02”), “Leases (Topic 842): Amendments to the FASB Accounting Standards Codification.” ASU 2016-02 amendsoutlines principles for the existing accounting standards for lease accounting, including requiring lessees to recognize most leases on their balance sheetsrecognition, measurement, presentation and making targeted changes to lessor accounting. The new standard requires a modified retrospective transition approach for all leases existing at, or entered into after, the datedisclosure of initial application, with an option to use certain transition relief. The guidance is effective for public business entities for fiscal years beginning after December 15, 2018 and interim periods within those fiscal years. Early adoption is permitted.leases. Subsequent to the issuance of ASU 2016-02, the FASB issued an additional Accounting Standards UpdateASUs clarifying aspects of the new lease accounting standard, which will be effective upon adoption of ASU 2016-02. The Company plans to adopt ASU 2016-02 as of January 1, 2019.2019, utilizing the “modified retrospective” method. While the Company is still evaluatingcompleting its evaluation of the effect that the updatednew standard will have on its consolidated financial statements and related disclosures, it expectsthe anticipated impact of ASU 2016-02 is as follows:
As Lessee:
Under the new standard, lessees will classify leases as either operating or finance leases based on the principle of whether or not the lease is effectively a financed purchase by the lessee. This classification will determine whether lease expense is recognized on a straight-line basis over the term of the lease (operating lease) or on an effective interest method (finance lease). In addition, ASU 2016-02 requires lessees to recognize right-of-use assets and related lease liabilities for leases with a term greater than 12 months regardless of their lease classification. As of September 30, 2018, the Company is a lessee under 24 ground leases and 2 corporate office headquarters leases for which it will recognize a right of use asset and lease liability upon adoption. We are currently determining the appropriate discount rate to utilize in our calculations of the right-of-use asset and lease liability, and, as such, we have not finalized our calculations as of September 30, 2018. Details of the future minimum lease payments for leases in existence as of December 31, 2017 are disclosed in Note 15 to the Company’s Annual Report on its consolidated balance sheets related to groundForm 10-K for the year ended December 31, 2017.
Because the Company’s existing leases under which it is a lessee will continue to be classified as operating leases, the lessee.timing and pattern of lease expense recognition (straight-line basis) will remain unchanged. However, for any leases entered into or modified after the adoption date, the leases will need to be evaluated under the new standard and may be classified as finance leases depending on the terms of the transactions.
As Lessor:
Under the new standard, the accounting for lessors will remain largely unchanged from current GAAP; however, ASU 2016-02 requires that lessors expense, on an as-incurred basis, certain initial direct costs that are not incremental in negotiating a lease. Under existing standards, these costs are capitalizable and therefore the new lease standard will result in certain of these costs being expensed as incurred after adoption. For the Company, these costs include internal leasing payroll costs incurred for owned and presale development projects, as well as legal expenses incurred when negotiating commercial leases.
The new standard provides a practical expedient that allows lessors to not separate certain lease and non-lease components if certain criteria are met. For the Company’s commercial leases under which the tenants pay for common area maintenance charges, the Company assessed the criteria and determined that the timing and pattern of transfer for common area maintenance and the related rental revenue is the same. Therefore, the Company plans to elect the practical expedient which will result in no change to how revenue from commercial leases is currently recorded.
The Company expects to adopt the following additional practical expedients available for implementation:
An entity need not reassess whether any existing or expired contracts are or contain leases;
An entity need not reassess lease classification for any existing or expired leases;
An entity need not reassess initial direct costs for any existing leases; and
Permitted use of hindsight in determining the lease term and in assessing impairment of right of use assets.
AMERICAN CAMPUS COMMUNITIES, INC. AND SUBSIDIARIES
AMERICAN CAMPUS COMMUNITIES OPERATING PARTNERSHIP, L.P. AND SUBSIDIARIES
NOTES TO CONSOLIDATED FINANCIAL STATEMENTS
(unaudited)
In May 2014,addition, the FASB issued Company does not expect the following accounting pronouncements to have a material effect on its consolidated financial statements:
|
| | |
| Accounting Standards Update | | Effective Date |
| | |
| ASU 2018-15, “Intangibles - Goodwill and Other - Internal-Use Software (Subtopic 350-40): Customer’s Accounting for Implementation Costs Incurred in a Cloud Computing Arrangement that is a Service Contract” | | January 1, 2020 |
| ASU 2018-13, “Fair Value Measurement (Topic 820): Disclosure Framework - Changes to the Disclosure Requirements for Fair Value Measurement” | | January 1, 2020 |
| ASU 2018-02, “Income Statement - Reporting Comprehensive Income (Topic 220): Reclassification of Certain Tax Effects from Accumulated Other Comprehensive Income” | | January 1, 2019 |
| ASU 2017-12, “Derivatives and Hedging (Topic 815): Targeted Improvements to Accounting for Hedging Activities” | | January 1, 2019 |
| ASU 2016-13, “Financial Instruments - Credit Losses (Topic 326): Measurement of Credit Losses on Financial Instruments” | | January 1, 2020 |
Recently Adopted Accounting Pronouncements
Accounting Standards Update 2016-18 (“ASU 2016-18”), “Statement of Cash Flows: Restricted Cash”
On January 1, 2018, the Company adopted ASU 2016-18. The amendments in this update require the change in restricted cash to be reported with cash and cash equivalents when reconciling between beginning and ending amounts in the statements of cash flows. The Company applied the amendments retrospectively to each period presented in the consolidated statements of cash flows of the Company.
Prior to the adoption of ASU 2016-18, the Company reported the change in restricted cash within operating, investing, and financing activities in its consolidated statement of cash flows. As a result of the Company’s adoption of this standard and the retrospective application, cash and cash equivalents in the consolidated statements of cash flows as of September 30, 2017 increased by approximately $25.8 million to reflect the inclusion of the restricted cash balance at the end of the period, net cash provided by operating activities for the nine months ended September 30, 2017 increased by approximately $0.6 million, net cash used in investing activities decreased by approximately $1.3 million, and net cash provided by financing activities decreased by approximately $0.9 million.
Accounting Standards Update 2014-09 (“ASU 2014-09”), “Revenue From Contracts With Customers (Topic 606)”.
On January 1, 2018, the Company adopted ASU 2014-09 and all related clarifying Accounting Standards Updates associated with ASU 2014-09. ASU 2014-09 provides a single comprehensive revenue recognition model for contracts with customers (excluding certain contracts, such as lease contracts) to improve comparability within industries. ASU 2014-09 requires an entity to recognize revenue to reflect the transfer of goods or services to customers at an amount the entity expects to be paid in exchange for those goods and services and provide enhanced disclosures, all to provide more comprehensive guidance for transactions such as service revenue and contract modifications. Subsequent
The Company adopted the new revenue standard using the modified retrospective approach, and elected to apply the practical expedient to only assess the recognition of revenue for open contracts during the transition period. The effect of adoption did not have a material impact on the Company’s consolidated financial statements and there was no adjustment to the issuanceopening balance of retained earnings at January 1, 2018. The comparative information has not been restated and continues to be reported under the accounting standards in effect for that period.
Under the new standard there was a change in the way the Company determines the unit of account for its third-party development projects. Under the previous guidance, the Company segmented revenue recognition between the development and construction phases of its contracts, recognizing each using the proportional performance method and the percentage of completion method, respectively. Under the new guidance, the entire development and construction contract represents a single performance obligation comprised of a series of distinct services to be satisfied over time, and a single transaction price to be recognized over the life of the contract using a time-based measure of progress. Any variable consideration included in the transaction price is estimated using the expected value approach and is only included to the extent that a significant revenue reversal is not likely to occur. The adoption of ASU 2014-09 resulted in differences in the FASB has issued multiple Accounting Standards Updates clarifying multiple aspectstiming and pattern of the new revenue recognition standard, which include the deferral of the effective date by one year. ASU 2014-09, as amended by subsequent Accounting Standards Updates, is effective for public entities for interim and annual periods beginning after December 15, 2017 and may be applied using either a full retrospective or modified retrospective approach upon adoption.such third-party development
AMERICAN CAMPUS COMMUNITIES, INC. AND SUBSIDIARIES
AMERICAN CAMPUS COMMUNITIES OPERATING PARTNERSHIP, L.P. AND SUBSIDIARIES
NOTES TO CONSOLIDATED FINANCIAL STATEMENTS
(unaudited)
The Company plans to adoptand construction management contracts; however, the change did not have a material impact on the Company’s consolidated financial statements. Third-party management services revenues consist of base fees earned as a result of managing all aspects of the property’s day-to-day operations, and incentive fees based on the managed property’s operating measures. There was no change in the Company��s recognition of base management fees. Incentive management fees were previously recognized when the incentive criteria had been met. Under the new revenue standardguidance, incentive fees are estimated using the modified retrospectiveexpected value approach as of January 1, 2018 and is currently evaluating each of its revenue streams to identify any differencesare included in the timing, measurement or presentation oftransaction price only to the extent that a significant revenue reversal is not likely to occur; however, the change did not have a material impact on the Company’s consolidated financial statements. There was no change to the Company’s revenue recognition under the new standard. The Company does not expectmethods for ancillary services and other non-lease related revenues as a result of the adoption of this standard to have a significant impact on its consolidated financial statements, as a substantial portion of its revenue consists of rentalASU 2014-09.
Rental income from leasing arrangements which is specifically excluded from ASU 2014-09, and will beis being evaluated withas part of the adoption of the lease accounting standard, ASU 2016-02, discussed above. The Company anticipates the primary effects of the new standard will be associated with the Company’s non-leasing revenue streams, which represent less than 5% of consolidated total revenues.
In addition,Accounting Standards Update 2017-05 (“ASU 2017-05”), “Other Income-Gains and Losses from the Company does not expectDerecognition of Nonfinancial Assets (Subtopic 610-20): Clarifying the following accounting pronouncements to have a material effect on its consolidated financial statements:
ASU 2017-09, “Compensation—Stock Compensation (Topic 718): Scope of Modification Accounting.”
ASU 2016-18, “StatementAsset Derecognition Guidance and Accounting for Partial Sales of Cash Flows (Topic 230): Restricted Cash.”
ASU 2016-15, “Statement of Cash Flows (Topic 230): Classification of Certain Cash Receipts and Cash Payments.”
ASU 2016-13, “Financial Instruments-Credit Losses (Topic 326): Measurement of Credit Losses on Financial Instruments.”
Recently Adopted Accounting Pronouncements
Nonfinancial Assets”
On January 1, 2017,2018, in conjunction with the adoption of ASU 2014-09, discussed above, the Company adopted Accounting Standards Update 2017-01 (“ASU 2017-01”), “Business Combinations (Topic 805): Clarifying2017-05. The purpose of this ASU is to eliminate the Definitiondiversity in practice in accounting for derecognition of a Business.” The amendments in this guidance clarifynonfinancial asset and in-substance nonfinancial assets (only when the asset or asset group does not meet the definition of a business withor the objectivetransaction is not a sale to a customer). The adoption of adding guidance to assist entities with evaluating whether transactions should be accounted for as acquisitions (or disposals) of assets or businesses. The guidance is effective for public business entities for fiscal years beginning after December 15, 2017, and interim periods within those fiscal years; early adoption is permitted. ASU 2017-01 will be applied prospectively to any transactions occurring subsequent to January 1, 2017. Under the new standard, the Company expects that most property acquisitions will be accounted for as asset acquisitions, and as2017-05 did not have a result, most transaction costs will be capitalized rather than expensed. Thematerial impact on the Company’s consolidated financial statements will depend ongiven the size and volumesimplicity of future acquisition activity.the Company’s historical disposition transactions.
Other
In addition, on January 1, 2017,2018, the Company adopted the following accounting pronouncements which did not have a material effect on the Company’s consolidated financial statements:
ASU 2017-03, “Accounting Changes and Error Corrections2017-09, “Compensation—Stock Compensation (Topic 250) and Investments — Equity Method and Joint Ventures (Topic 323)718): Amendments to SEC Paragraphs Pursuant to Staff Announcements at the September 22, 2016 and November 17, 2016 EITF Meetings (SEC Update).”Scope of Modification Accounting”
ASU 2016-05, “Derivatives2016-15, “Statement of Cash Flows (Topic 230): Classification of Certain Cash Receipts and Hedging (Topic 815): Effect of Derivative Contract Novations on Existing Hedge Accounting Relationships.Cash Payments.”
Interim Financial Statements
The accompanying interim financial statements are unaudited, but have been prepared in accordance with GAAP for interim financial information and in conjunction with the rules and regulations of the Securities and Exchange Commission. Accordingly, they do not include all disclosures required by GAAP for complete financial statements. In the opinion of management, all adjustments (consisting solely of normal recurring matters) necessary for a fair presentation of the financial statements of the Company for these interim periods have been included. Because of the seasonal nature of the Company’s operations, the results of operations and cash flows for any interim period are not necessarily indicative of results for other interim periods or for the full year. These financial statements should be read in conjunction with the financial statements and the notes thereto included in the Company’s Annual Report on Form 10-K for the year ended December 31, 2016.2017.
Use of Estimates
The preparation of financial statements in conformity with GAAP requires management to make estimates and assumptions that affect the reported amounts of assets and liabilities, disclosures of contingent assets and liabilities at the date of the financial statements, and the reported amounts of revenues and expenses during the reporting period. Actual results could differ from those estimates.
AMERICAN CAMPUS COMMUNITIES, INC. AND SUBSIDIARIES
AMERICAN CAMPUS COMMUNITIES OPERATING PARTNERSHIP, L.P. AND SUBSIDIARIES
NOTES TO CONSOLIDATED FINANCIAL STATEMENTS
(unaudited)
Investments in Real Estate
Investments in real estate are recorded at historical cost. Major improvements that extend the life of an asset are capitalized and depreciated over the remaining useful life of the asset. The cost of ordinary repairs and maintenance are charged to expense when incurred. Depreciation and amortization are recorded on a straight-line basis over the estimated useful lives of the assets as follows:
|
| | |
| Buildings and improvements | | 7-40 years |
Leasehold interest - on-campus participating properties | | 25-34 years (shorter of useful life or respective lease term) |
| Furniture, fixtures and equipment | | 3-7 years |
Project costs directly associated with the development and construction of an owned real estate project, which include interest, property taxes, and amortization of deferred financefinancing costs, are capitalized as construction in progress. Upon completion of the project, costs are transferred into the applicable asset category and depreciation commences. Interest totaling approximately $3.4$2.6 million and $3.3$3.4 million was capitalized during the three months ended September 30, 20172018 and 2016,2017, respectively, and interest
AMERICAN CAMPUS COMMUNITIES, INC. AND SUBSIDIARIES
AMERICAN CAMPUS COMMUNITIES OPERATING PARTNERSHIP, L.P. AND SUBSIDIARIES
NOTES TO CONSOLIDATED FINANCIAL STATEMENTS
(unaudited)
totaling approximately $13.5$9.6 million and $9.0$13.5 million was capitalized during the nine months ended September 30, 20172018 and 2016,2017, respectively.
Management assesses whether there has been an impairment in the value of the Company’s investments in real estate whenever events or changes in circumstances indicate that the carrying amount of an asset may not be recoverable. Impairment is recognized when estimated expected future undiscounted cash flows are less than the carrying value of the property, or when a property meets the criteria to be classified as held for sale, at which time an impairment charge is recognized for any excess of the carrying value of the property over the expected net proceeds from the disposal. The estimation of expected future net cash flows is inherently uncertain and relies on assumptions regarding current and future economics and market conditions. If such conditions change, then an adjustment to the carrying value of the Company’s long-lived assets could occur in the future period in which the conditions change. To the extent that a property is impaired, the excess of the carrying amount of the property over its estimated fair value is charged to earnings. The Company believes that there were no impairment indicatorsimpairments of the carrying values of its investments in real estate as of September 30, 2017, other than a $15.3 million impairment charge recorded during the second quarter 2017 for one property that is in the process of being transferred to the lender in settlement of the property’s $27.4 million mortgage loan that matured in August 2017 (see Note 7).2018.
The Company evaluates each acquisition to determine if the integrated set of assets and activities acquired meet the definition of a business under ASU 2017-01.business. If either of the following criteria is met, the integrated set of assets and activities acquired would not qualify as a business:
Substantially all of the fair value of the gross assets acquired is concentrated in either a single identifiable asset or a group of similar identifiable assets; or
The integrated set of assets and activities is lacking, at a minimum, an input and a substantive process that together significantly contribute to the ability to create outputs (i.e. revenue generated before and after the transaction).
Property acquisitions deemed to qualify as a business are accounted for as business combinations, and the related acquisition costs are expensed as incurred. The Company allocates the purchase price of properties acquired in business combinations to net tangible and identified intangible assets based on their fair values. Fair value estimates are based on information obtained from a number of sources, including independent appraisals that may be obtained in connection with the acquisition or financing of the respective property, the Company’s own analysis of recently acquired and existing comparable properties in the Company’s portfolio, and other market data. Information obtained about each property, as a result of due diligence, marketing, and leasing activities, is also considered. The value allocated to land is generally based on the actual purchase price if acquired separately, or market research/comparables if acquired as part of an existing operating property. The value allocated to building is based on the fair value determined on an “as-if vacant” basis, which is estimated using a replacement cost approach that relies upon assumptions that the Company believes are consistent with current market conditions for similar properties. The value allocated to furniture, fixtures, and equipment is based on an estimate of the fair value of the appliances and fixtures inside the units. The Company has determined these estimates are primarily based upon unobservable inputs and therefore are considered to be Level 3 inputs within the fair value hierarchy.
AMERICAN CAMPUS COMMUNITIES, INC. AND SUBSIDIARIES
AMERICAN CAMPUS COMMUNITIES OPERATING PARTNERSHIP, L.P. AND SUBSIDIARIES
NOTES TO CONSOLIDATED FINANCIAL STATEMENTS
(unaudited)
Acquisitions of properties that do not meet the definition of a business are accounted for as asset acquisitions. The accounting model for asset acquisitions is similar to the accounting model for business combinations except that the acquisition consideration (including transaction costs) is allocated to the individual assets acquired and liabilities assumed on a relative fair value basis. The relative fair values used to allocate the cost of an asset acquisition are determined using the same methodologies and assumptions as those utilized to determine fair value in a business combination.
Redeemable noncontrolling interestsLong-Lived Assets–Held for Sale
Long-lived assets to be disposed of are classified as held for sale in the period in which all of the following criteria are met:
| |
| a. | Management, having the authority to approve the action, commits to a plan to sell the asset. |
| |
| b. | The asset is available for immediate sale in its present condition subject only to terms that are usual and customary for sales of such assets. |
| |
| c. | An active program to locate a buyer and other actions required to complete the plan to sell the asset have been initiated. |
| |
| d. | The sale of the asset is probable, and transfer of the asset is expected to qualify for recognition as a completed sale, within one year. |
AMERICAN CAMPUS COMMUNITIES, INC. AND SUBSIDIARIES
AMERICAN CAMPUS COMMUNITIES OPERATING PARTNERSHIP, L.P. AND SUBSIDIARIES
NOTES TO CONSOLIDATED FINANCIAL STATEMENTS
(unaudited)
| |
| e. | The asset is being actively marketed for sale at a price that is reasonable in relation to its current fair value. |
| |
| f. | Actions required to complete the plan indicate that it is unlikely that significant changes to the plan will be made or that the plan will be withdrawn. |
Concurrent with this classification, the asset is recorded at the lower of cost or fair value less estimated selling costs, and depreciation ceases. The Company did not have any properties classified as held for sale as of September 30, 2018.
Restricted Cash
Restricted cash consists of funds held in trust and invested in low risk investments, generally consisting of government backed securities, as permitted by the indentures of trusts, which were established in connection with three bond issues for the Company’s on-campus participating properties. Additionally, restricted cash includes escrow accounts held by lenders and resident security deposits, as required by law in certain states. Restricted cash also consists of escrow deposits made in connection with potential property acquisitions and development opportunities. These escrow deposits are invested in interest-bearing accounts at federally-insured banks. Realized and unrealized gains and losses are not material for the periods presented.
Consolidated VIEs
The Company follows guidance issued by the FASB regarding the classificationhas investments in various entities that qualify as VIEs for accounting purposes and measurement of redeemable securities. Under this guidance, securities that are redeemable for cash or other assets, at the option of the holder and not solely within the control of the issuer, must be classified outside of permanent equity as redeemable noncontrolling interests. The Company makes this determination based on terms in the applicable agreements, specifically in relation to redemption provisions. The Company initially records the redeemable noncontrolling interests at fair value. The carrying amount of the redeemable noncontrolling interest is subsequently adjusted to the redemption value (assuming the noncontrolling interest is redeemable at the balance sheet date), with the corresponding offset for changes in fair value recorded in additional paid in capital. Reductions in fair value are recorded only to the extent thatwhich the Company has previously recorded increasesis the primary beneficiary and therefore includes the entities in fair value above the redeemable noncontrolling interests’ initial basis. As the changes in redemption value are based on fair value, there is no effect on the Company’s earnings per share. Redeemable noncontrolling interests on the accompanyingits consolidated balance sheets of ACC are referred to as redeemable limited partners on the consolidated balance sheets offinancial statements. These VIEs include the Operating Partnership. ReferPartnership, six joint ventures that own a total of 15 operating properties, two properties subject to Note 9 for a more detailed discussion of redeemable noncontrolling interests for both ACCpresale arrangements, and five properties owned under the Operating Partnership.on-campus participating property structure.
Pre-development ExpendituresThird-Party Development Services Costs
Pre-development expenditures such as architectural fees, permits, and deposits associated with the pursuit of third-party and owned development projects are expensed as incurred, until such time that management believes it is probable that the contract will be executed and/or construction will commence, at which time the Company capitalizes the costs. Because the Company frequently incurs these pre-development expenditures before a financing commitment and/or required permits and authorizations have been obtained, the Company bears the risk of loss of these pre-development expenditures if financing cannot ultimately be arranged on acceptable terms or the Company is unable to successfully obtain the required permits and authorizations. As such, management evaluates the status of third-party and owned projects that have not yet commenced construction on a periodic basis and expenses any deferred costs related to projects whose current status indicates the commencement of construction is unlikely and/or the costs may not provide future value to the Company in the form of revenues. Such write-offs are included in third-party development and management services expenses (in the case of third-party development projects) or general and administrative expenses (in the case of owned development projects) on the accompanying consolidated statements of comprehensive income. As of September 30, 2017,2018, the Company has deferred approximately $5.6$13.7 million in pre-development costs related to third-party and owned development projects that have not yet commenced construction. Such costs are included in other assets on the accompanying consolidated balance sheets.
Earnings per Share – Company
Basic earnings per share is computed using net income attributable to common stockholders and the weighted average number of shares of the Company’s common stock outstanding during the period. Diluted earnings per share reflects common shares issuable from the assumed conversion of American Campus Communities Operating Partnership Units (“OP Units”) and common share awards granted. Only those items having a dilutive impact on basic earnings per share are included in diluted earnings per share.
AMERICAN CAMPUS COMMUNITIES, INC. AND SUBSIDIARIES
AMERICAN CAMPUS COMMUNITIES OPERATING PARTNERSHIP, L.P. AND SUBSIDIARIES
NOTES TO CONSOLIDATED FINANCIAL STATEMENTS
(unaudited)
The following potentially dilutive securities were outstanding for the three and nine months ended September 30, 20172018 and 2016,2017, but were not included in the computation of diluted earnings per share because the effects of their inclusion would be anti-dilutive.
| | | | | Three Months Ended
September 30, | | Nine Months Ended
September 30, | | Three Months Ended
September 30, | | Nine Months Ended
September 30, |
| | | 2017 | | 2016 | | 2017 | | 2016 | | 2018 | | 2017 | | 2018 | | 2017 |
| Common OP Units (Note 9) | | 1,011,674 |
| | 1,221,242 |
| | 1,023,248 |
| | 1,278,148 |
| | 602,264 |
| | 1,011,674 |
| | 831,328 |
| | 1,023,248 |
|
| Preferred OP Units (Note 9) | | 77,513 |
| | 87,767 |
| | 77,513 |
| | 95,212 |
| | 77,513 |
| | 77,513 |
| | 77,513 |
| | 77,513 |
|
| Unvested restricted stock awards (Note10) | | 818,547 |
| | — |
| | — |
| | — |
| | 883,595 |
| | 818,547 |
| | — |
| | — |
|
| Total potentially dilutive securities | | 1,907,734 |
| | 1,309,009 |
| | 1,100,761 |
| | 1,373,360 |
| | 1,563,372 |
| | 1,907,734 |
| | 908,841 |
| | 1,100,761 |
|
The following is a summary of the elements used in calculating basic and diluted earnings per share:13 |
| | | | | | | | | | | | | | | | |
| | | Three Months Ended
September 30, | | Nine Months Ended
September 30, |
| | | 2018 | | 2017 | | 2018 | | 2017 |
| Numerator – basic and diluted earnings per share: | | | | | | | | |
| Net (loss) income | | $ | (2,737 | ) | | $ | (1,233 | ) | | $ | 69,503 |
| | $ | 30,563 |
|
| Net loss (income) attributable to noncontrolling interests | | 392 |
| | (79 | ) | | 88 |
| | (587 | ) |
| Net (loss) income attributable to common stockholders | | (2,345 | ) | | (1,312 | ) | | 69,591 |
| | 29,976 |
|
| Amount allocated to participating securities | | (408 | ) | | (360 | ) | | (1,291 | ) | | (1,217 | ) |
| Net (loss) income attributable to common stockholders | | $ | (2,753 | ) | | $ | (1,672 | ) | | $ | 68,300 |
| | $ | 28,759 |
|
| | | | | | | | | |
| Denominator: | | |
| | |
| | |
| | |
|
| Basic weighted average common shares outstanding | | 137,022,012 |
| | 136,421,198 |
| | 136,742,094 |
| | 134,708,361 |
|
| Unvested restricted stock awards (Note 10) | | — |
| | — |
| | 918,708 |
| | 877,489 |
|
| Diluted weighted average common shares outstanding | | 137,022,012 |
| | 136,421,198 |
| | 137,660,802 |
| | 135,585,850 |
|
| | | | | | | | | |
| Earnings per share: | | | | | | | | |
| Net (loss) income attributable to common stockholders - basic and diluted | | $ | (0.02 | ) | | $ | (0.01 | ) | | $ | 0.50 |
| | $ | 0.21 |
|
AMERICAN CAMPUS COMMUNITIES, INC. AND SUBSIDIARIES
AMERICAN CAMPUS COMMUNITIES OPERATING PARTNERSHIP, L.P. AND SUBSIDIARIES
NOTES TO CONSOLIDATED FINANCIAL STATEMENTS
(unaudited)
The following is a summary of the elements used in calculating basic and diluted earnings per share: |
| | | | | | | | | | | | | | | | |
| | | Three Months Ended
September 30, | | Nine Months Ended
September 30, |
| | | 2017 | | 2016 | | 2017 | | 2016 |
| Numerator – basic and diluted earnings per share: | | | | | | | | |
| Net (loss) income | | $ | (1,233 | ) | | $ | 9,845 |
| | $ | 30,563 |
| | $ | 74,819 |
|
| Net income attributable to noncontrolling interests | | (79 | ) | | (201 | ) | | (587 | ) | | (1,150 | ) |
| Net (loss) income attributable to common stockholders | | (1,312 | ) | | 9,644 |
| | 29,976 |
| | 73,669 |
|
| Amount allocated to participating securities | | (360 | ) | | (329 | ) | | (1,217 | ) | | (1,051 | ) |
| Net (loss) income attributable to common stockholders | | $ | (1,672 | ) | | $ | 9,315 |
| | $ | 28,759 |
| | $ | 72,618 |
|
| | | | | | | | | |
| Denominator: | | |
| | |
| | |
| | |
|
| Basic weighted average common shares outstanding | | 136,421,198 |
| | 130,786,985 |
| | 134,708,361 |
| | 128,239,294 |
|
| Unvested restricted stock awards (Note 10) | | — |
| | 781,386 |
| | 877,489 |
| | 795,107 |
|
| Diluted weighted average common shares outstanding | | 136,421,198 |
| | 131,568,371 |
| | 135,585,850 |
| | 129,034,401 |
|
| | | | | | | | | |
| Earnings per share: | | | | | | | | |
| Net (loss) income attributable to common stockholders - basic | | $ | (0.01 | ) | | $ | 0.07 |
| | $ | 0.21 |
| | $ | 0.57 |
|
| Net (loss) income attributable to common stockholders - diluted | | $ | (0.01 | ) | | $ | 0.07 |
| | $ | 0.21 |
| | $ | 0.56 |
|
Basic earnings per OP Unit is computed using net income attributable to common unitholders and the weighted average number of common units outstanding during the period. Diluted earnings per OP Unit reflects the potential dilution that could occur if securities or other contracts to issue OP Units were exercised or converted into OP Units or resulted in the issuance of OP Units and then shared in the earnings of the Operating Partnership.
AMERICAN CAMPUS COMMUNITIES, INC. AND SUBSIDIARIES
AMERICAN CAMPUS COMMUNITIES OPERATING PARTNERSHIP, L.P. AND SUBSIDIARIES
NOTES TO CONSOLIDATED FINANCIAL STATEMENTS
(unaudited)
The following is a summary of the elements used in calculating basic and diluted earnings per unit:
| | | | | Three Months Ended
September 30, | | Nine Months Ended
September 30, | | Three Months Ended
September 30, | | Nine Months Ended
September 30, |
| | | 2017 | | 2016 | | 2017 | | 2016 | | 2018 | | 2017 | | 2018 | | 2017 |
| Numerator – basic and diluted earnings per unit: | | | | | | | | | | | | | | | | |
| Net (loss) income | | $ | (1,233 | ) | | $ | 9,845 |
| | $ | 30,563 |
| | $ | 74,819 |
| | $ | (2,737 | ) | | $ | (1,233 | ) | | $ | 69,503 |
| | $ | 30,563 |
|
| Net income attributable to noncontrolling interests – partially owned properties | | (57 | ) | | (77 | ) | | (259 | ) | | (285 | ) | |
| Net loss (income) attributable to noncontrolling interests – partially owned properties | | | 413 |
| | (57 | ) | | 665 |
| | (259 | ) |
| Series A preferred unit distributions | | (31 | ) | | (36 | ) | | (93 | ) | | (115 | ) | | (31 | ) | | (31 | ) | | (93 | ) | | (93 | ) |
| Amount allocated to participating securities | | (360 | ) | | (329 | ) | | (1,217 | ) | | (1,051 | ) | | (408 | ) | | (360 | ) | | (1,291 | ) | | (1,217 | ) |
| Net (loss) income attributable to common unitholders | | $ | (1,681 | ) | | $ | 9,403 |
| | $ | 28,994 |
| | $ | 73,368 |
| | $ | (2,763 | ) | | $ | (1,681 | ) | | $ | 68,784 |
| | $ | 28,994 |
|
| | | | | | | | | | | | | | | | | |
| Denominator: | | |
| | |
| | |
| | |
| | |
| | |
| | |
| | |
|
| Basic weighted average common units outstanding | | 137,432,872 |
| | 132,008,227 |
| | 135,731,609 |
| | 129,517,442 |
| | 137,624,276 |
| | 137,432,872 |
| | 137,573,422 |
| | 135,731,609 |
|
| Unvested restricted stock awards (Note 10) | | — |
| | 781,386 |
| | 877,489 |
| | 795,107 |
| | — |
| | — |
| | 918,708 |
| | 877,489 |
|
| Diluted weighted average common units outstanding | | 137,432,872 |
| | 132,789,613 |
| | 136,609,098 |
| | 130,312,549 |
| | 137,624,276 |
| | 137,432,872 |
| | 138,492,130 |
| | 136,609,098 |
|
|
| | | | | | | | | | | | | | | | |
| Earnings per unit: | | | | | | | | |
| Net (loss) income attributable to common unitholders - basic | | $ | (0.01 | ) | | $ | 0.07 |
| | $ | 0.21 |
| | $ | 0.57 |
|
| Net (loss) income attributable to common unitholders - diluted | | $ | (0.01 | ) | | $ | 0.07 |
| | $ | 0.21 |
| | $ | 0.56 |
|
|
| | | | | | | | | | | | | | | | |
| Earnings per unit: | | | | | | | | |
| Net (loss) income attributable to common unitholders - basic and diluted | | $ | (0.02 | ) | | $ | (0.01 | ) | | $ | 0.50 |
| | $ | 0.21 |
|
3. Acquisitions and Joint Venture Investments
Core Transaction OverviewPresale Development Projects: : During the nine months ended September 30, 2018, the Company entered into two presale agreements to purchase two properties under development. The Company is obligated to purchase the properties for approximately $107.3 million, which includes the contractual purchase price and the cost of elected upgrades, as long as the developer meets certain construction completion deadlines and other closing conditions.
|
| | | | | | | | | | |
| Property | | Location | | Primary University Served | | Project Type | | Beds | | Scheduled Completion |
| The Flex at Stadium Centre | | Tallahassee, FL | | Florida State University | | Off-campus | | 340 | | August 2019 |
959 Franklin (1) | | Eugene, OR | | University of Oregon | | Off-campus | | 443 | | September 2019 |
| | | | | | | | 783 | | |
| |
(1) | As part of the presale agreement, the Company provided $15.6 million of mezzanine financing to the project. |
In August 2018, The Edge - Stadium Centre, a 412-bed off-campus development property subject to a presale agreement, was completed and acquired by the Company for $42.6 million, including $10.0 million related to the purchase of the land on which the property is built. As the property was consolidated by the Company from the time of execution of the presale agreement with the developer, the closing of the transaction was accounted for as an increase in ownership of a consolidated subsidiary.
Property Acquisitions: During the third quarter of 2017, the Company executed an agreement to acquire a portfolio of seven student housing properties from affiliates of Core Spaces and DRW Real Estate Investments (the “Core Transaction”). The transaction included the purchase of 100% of the ownership interests in two operating properties, the purchase of partial ownership interests in two operating properties through a joint venture arrangement (with one property being subject to a purchase option that had not been exercised as of September 30, 2017),completed construction and commenced operations in Fall 2017, and the purchase of partial ownership interests in three in-process development properties that completed construction and commenced operations in Fall 2018. The purchase of partial
AMERICAN CAMPUS COMMUNITIES, INC. AND SUBSIDIARIES
AMERICAN CAMPUS COMMUNITIES OPERATING PARTNERSHIP, L.P. AND SUBSIDIARIES
NOTES TO CONSOLIDATED FINANCIAL STATEMENTS
(unaudited)
ownership interests was made through a joint venture arrangement. In total, the Core Transaction properties contain 3,776 beds. The initial investment made at closing was $265.4$306.0 million and the Company expectsincreased its investment by $83.7 million in September 2018. The purchase of the remaining ownership interests in the properties of approximately $200.9 million is anticipated to invest a total of $590.6 million over a two year period includingbe completed in the initial investment.fourth quarter 2018 and Fall 2019.
Core Transaction Property Acquisitions: In AugustDuring the nine months ended September 30, 2017, the Company purchasedacquired two owned properties containing 982 beds for a total purchase price of approximately $158.5 million, as well as 100% of the ownership interests in two operating properties for a total purchase priceas part of approximatelythe Core Transaction described above for $146.1 million. Total cash consideration was approximately $144.3$302.3 million. The difference between the contracted purchase price and the cash consideration is due to other assets and liabilities that were not part of the contractual purchase price, but were acquired in the transactions, as well as transaction costs capitalized as part of the acquisitions. A list of these two properties acquired as part of the Core Transaction is as follows:
|
| | | | | | | | |
Property | | Location | | Primary University Served | | Acquisition Date | | Beds |
Hub Eugene | | Eugene, OR | | University of Oregon | | August 2017 | | 513 |
State | | Fort Collins, CO | | Colorado State University | | August 2017 | | 665 |
| | | | | | | | 1,178 |
Core Transaction Joint VenturesLand Acquisitions: : As mentioned above, during the third quarter of 2017 as part of the Core Transaction, the Company funded initial investments in two joint ventures. The joint venture transactions involved the joint venture partner making a non-cash contribution of properties and the Company making a cash contribution to the joint ventures in exchange for its membership interests. Both joint ventures were determined to be VIEs, with the Company being the primary beneficiary. As such, both joint ventures are included in the Company’s consolidated financial statements contained herein. Additionally, the partners’ ownership interests in each of the joint ventures are accounted for as redeemable noncontrolling interests. For further discussion, refer to Note 9.
AMERICAN CAMPUS COMMUNITIES, INC. AND SUBSIDIARIES
AMERICAN CAMPUS COMMUNITIES OPERATING PARTNERSHIP, L.P. AND SUBSIDIARIES
NOTES TO CONSOLIDATED FINANCIAL STATEMENTS
(unaudited)
The first joint venture (the “Core JV I”) holds one property (The James) that completed construction and opened for operations inIn August 2017. The Company's initial investment was $95.1 million for an approximate 68% interest in the joint venture, part of which was used to pay off the property's $68.7 million construction loan at closing. The transaction also provided the Company with an option to cause the joint venture partner to contribute a second property, Hub U District Seattle, to the joint venture during the fourth quarter 2017. As mentioned in Note 15, the Company exercised this option and the contribution of the property to the joint venture is anticipated to close during the fourth quarter 2017. The Company's initial investment in the property will be approximately $40.6 million. Additionally, the Company has an option to purchase the remaining ownership interests in the joint venture in the fourth quarter of 2019 under a put/call agreement with the joint venture partner for an amount to be determined by the fair market value of the properties at the date of exercise. The value of the remaining ownership interests upon exercise of the option is anticipated to approximate $68.8 million.
The second joint venture (the “Core JV II”) holds three in-process development properties that are currently under construction and are scheduled to complete construction and open for operations in Fall 2018. The Company's initial investment was $24.2 million for an approximate 58% interest in the joint venture. Upon the initial funding, the Company assumed sole operational control, while the partner retained certain limited decision making abilities, including responsibility for the development and delivery of the properties within an agreed-upon budget and completion timeline. The joint venture partner has also provided a payment guarantee for the construction loans that are partially financing the construction of the properties. Subsequent to the successful completion and delivery of the assets, which is expected to occur in September 2018, the Company anticipates increasing its investment in Core JV II by $130.6 million aspurchased a resultland parcel for a total purchase price of paying off the construction loans. Additionally, the Company has an option to purchase the remaining ownership interests in the joint venture in the third quarter of 2019 under a put/call agreement with the joint venture partner for an amount to be determined by the fair market value of the properties at the date of exercise. The value of the remaining ownership interests upon exercise of the option is anticipated to approximate $85.2 million.
A list of the properties contributed to joint ventures as part of the Core Transaction are as follows:
|
| | | | | | | | |
Property | | Location | | Primary University Served | | Actual or Targeted Completion Date | | Beds |
Core JV I: | | | | | | | | |
The James | | Madison, WI | | University of Wisconsin - Madison | | August 2017 | | 850 |
Hub U District Seattle(1)
| | Seattle, WA | | University of Washington | | September 2017 | | 248 |
| | | | | | | | 1,098 |
Core JV II: | | | | | | | | |
Hub Ann Arbor | | Ann Arbor, MI | | University of Michigan | | September 2018 | | 310 |
Hub Flagstaff | | Flagstaff, AZ | | Northern Arizona University | | September 2018 | | 591 |
Hub West Lafayette | | West Lafayette, IN | | Purdue University | | September 2018 | | 599 |
| | | | | | | | 1,500 |
| | | | | | | | |
| | | | | | | | 2,598 |
| |
(1)
| Subject to an option that had not been exercised as of September 30, 2017 (see Note 15). |
Other 2017 Property Acquisitions: During the nine months ended September 30, 2017, the Company acquired two additional wholly-owned properties containing 982 beds for approximately $158.5$16.6 million. Total cash consideration was approximately $158.0$16.5 million. The difference between the contracted purchase price and the cash consideration is due to other assets and liabilities that were not part of the contractual purchase price, but were acquired in the transactions, as well as transaction costs capitalized as part of the acquisitions.
A list of these properties is outlined below:
|
| | | | | | | | |
Property | | Location | | Primary University Served | | Acquisition Date | | Beds |
The Arlie | | Arlington, TX | | University of Texas Arlington | | April 2017 | | 598 |
TWELVE at U District | | Seattle, WA | | University of Washington | | June 2017 | | 384 |
| | | | | | | | 982 |
AMERICAN CAMPUS COMMUNITIES, INC. AND SUBSIDIARIES
AMERICAN CAMPUS COMMUNITIES OPERATING PARTNERSHIP, L.P. AND SUBSIDIARIES
NOTES TO CONSOLIDATED FINANCIAL STATEMENTS
(unaudited)
2017 Land Acquisitions: During the nine months ended September 30, 2017, the Company purchased five land parcels withfor a fair valuetotal purchase price of approximately $12.0 million for total cashmillion. Total consideration transferred was comprised of approximately $8.9 million. The difference between the fair valuemillion of the land and the cash consideration representsand $3.1 million of non-cash consideration.consideration, primarily related to the forgiveness of a loan made to the seller during the initial option period. In addition, the Company made an initial investment of $9.0 million in a joint venture that holds a land parcel with fair value of $12.0 million.
2016 Acquisition Activity: During the nine months ended September 30, 2016, the Company acquired University Crossings, a wholly-owned property containing 546 beds that is located adjacent to the University of North Carolina in Charlotte, NC for approximately $40.0 million. Also during the nine months ended September 30, 2016, the Company secured three in-process development properties containing 1,593 beds for a combined purchase price of approximately $66.0 million. As part of these transactions, the Company assumed approximately $10.0 million of fixed rate mortgage debt.
4. Property Dispositions
Property Dispositions:
In May 2018, the Company sold the following portfolio of three owned properties for approximately $245.0 million, resulting in net proceeds of approximately $242.3 million. The combined net gain on the portfolio disposition totaled approximately $42.3 million.
|
| | | | | | |
| Property | | Location | | Primary University Served | | Beds |
| Icon Plaza | | Los Angeles, CA | | University of Southern California | | 253 |
| West 27th Place | | Los Angeles, CA | | University of Southern California | | 475 |
| The Standard | | Athens, GA | | University of Georgia | | 610 |
| | | | | | 1,338 |
During the nine months ended September 30, 2017, the Company sold the following wholly-ownedThe Province - Dayton, an owned property located near Wright State University in Dayton, Ohio, containing 657 beds for approximately $25.0 million, resulting in net proceeds of approximately $24.5 million. The net loss on this disposition totaled approximately $0.6 million. Concurrent with the classification of this property as held for sale in December 2016, the Company reduced the property’s carrying amount to its estimated fair value less estimated selling costs, and recorded an impairment charge of $4.9 million:
|
| | | | | | |
Property | | Location | | Primary University Served | | Beds |
The Province - Dayton | | Dayton, OH | | Wright State University | | 657 |
million.
During the nine months ended September 30, 2016,Joint Venture Activity:
In May 2018, the Company sold two wholly-owned properties containing 1,324 beds forexecuted an agreement to enter into a total sales pricejoint venture arrangement with Allianz Real Estate (the “ACC / Allianz Joint Venture Transaction”). The transaction included the sale of approximately $73.8 million, resultinga partial ownership interest in net proceeds of approximately $72.6 million. The combined net gain on these dispositions totaled approximately $17.4 million. Additionally, the Company had a portfolio of 19 wholly-ownedseven owned properties, classified as heldcontaining 4,611 beds, through a joint venture arrangement. The joint venture transaction involved the joint venture partner making a cash contribution of approximately $373.1 million in exchange for sale asa 45% ownership interest. As part of September 30, 2016.the transaction, the joint venture issued $330 million of secured mortgage debt. For further discussion refer to Note 7.
5. Investments in Wholly-Owned Properties
Wholly-owned properties consistedThe joint venture was determined to be a VIE. As the Company retained control of the following:
|
| | | | | | | | | |
| | | September 30, 2017 | | December 31, 2016 | |
Land (1) (2) | | $ | 649,597 |
| | $ | 568,266 |
| |
| Buildings and improvements | | 5,986,682 |
| | 5,065,137 |
| |
| Furniture, fixtures and equipment | | 366,581 |
| | 303,240 |
| |
Construction in progress (2) | | 273,367 |
| | 349,498 |
| |
| | | 7,276,227 |
| | 6,286,141 |
| |
| Accumulated depreciation | | (1,014,150 | ) | | (859,127 | ) | |
| Wholly-owned properties, net | | $ | 6,262,077 |
| | $ | 5,427,014 |
| (3) |
| |
(1)
| The land balance above includes undeveloped land parcels with book values of approximately $45.5 million and $38.5 million as of September 30, 2017 and December 31, 2016, respectively. It also includes land totaling approximately $29.9 million and $61.2 million as of September 30, 2017 and December 31, 2016, respectively, related to properties under development. |
| |
(2)
| Land includes $19.3 million as of September 30, 2017 and construction in progress includes $60.0 million and $1.9 million as of September 30, 2017 and December 31, 2016, respectively, related to in-process development properties, held by entities determined to be VIEs. The entities that own the properties are deemed to be VIEs, and the Company is determined to be the primary beneficiary of the VIEs. |
| |
(3)
| Excludes the net book value of one property classified as held for sale in the accompanying consolidated balance sheets at December 31, 2016. |
properties after the joint venture transaction, it was deemed the primary beneficiary. As such, the Company’s contribution of the properties to the joint venture was recorded at net book value, and the joint venture is included in the Company’s consolidated financial statements contained herein. The joint venture partner’s ownership interest in the joint venture is accounted for as noncontrolling interest. For further discussion refer to Note 9. The difference between the joint venture partner’s cash contribution and its proportional share of the net book value of the properties was recorded in additional paid in capital in the Company’s consolidated balance sheets and consolidated statement of changes in equity.
AMERICAN CAMPUS COMMUNITIES, INC. AND SUBSIDIARIES
AMERICAN CAMPUS COMMUNITIES OPERATING PARTNERSHIP, L.P. AND SUBSIDIARIES
NOTES TO CONSOLIDATED FINANCIAL STATEMENTS
(unaudited)
5. Investments in Owned Properties
Owned properties, both wholly-owned and those owned through investments in VIEs, consisted of the following:
|
| | | | | | | | |
| | | September 30, 2018 | | December 31, 2017 |
Land (1) | | $ | 653,431 |
| | $ | 646,991 |
|
| Buildings and improvements | | 6,478,611 |
| | 6,096,527 |
|
| Furniture, fixtures and equipment | | 380,593 |
| | 348,828 |
|
| Construction in progress | | 191,879 |
| | 393,045 |
|
| | | 7,704,514 |
| | 7,485,391 |
|
| Less accumulated depreciation | | (1,182,809 | ) | | (1,035,027 | ) |
Owned properties, net | | $ | 6,521,705 |
| | $ | 6,450,364 |
|
| |
(1) | The land balance above includes undeveloped land parcels with book values of approximately $54.4 million and $38.0 million as of September 30, 2018 and as of December 31, 2017, respectively. It also includes land totaling approximately $10.3 million and $29.9 million as of September 30, 2018 and December 31, 2017, respectively, related to properties under development. |
6. On-Campus Participating Properties
On-campus participating properties are as follows:
| | | | | | | | | Historical Cost | | | | | | Historical Cost |
| Lessor/University | | Lease Commencement | | Required Debt
Repayment | | September 30, 2017 | | December 31, 2016 | | Lease Commencement | | Required Debt
Repayment | | September 30, 2018 | | December 31, 2017 |
Texas A&M University System / Prairie View A&M University (1) | | 2/1/1996 | | 9/1/2023 | | $ | 46,446 |
| | $ | 45,310 |
| | 2/1/1996 | | 9/1/2023 | | $ | 45,446 |
| | $ | 44,364 |
|
| Texas A&M University System / Texas A&M International | | 2/1/1996 | | 9/1/2023 | | 7,271 |
| | 7,215 |
| | 2/1/1996 | | 9/1/2023 | | 7,077 |
| | 6,923 |
|
Texas A&M University System / Prairie View A&M University (2) | | 10/1/1999 | | 8/31/2025 | | 29,207 |
| | 28,627 |
| | 10/1/1999 | | 8/31/2025 | | 28,758 |
| | 27,802 |
|
| | | 8/31/2028 | | | | 8/31/2028 | |
University of Houston System / University of Houston (3) | | 9/27/2000 | | 8/31/2035 | | 38,328 |
| | 37,960 |
| | 9/27/2000 | | 8/31/2035 | | 36,344 |
| | 36,062 |
|
| West Virginia University System / West Virginia University | | 7/16/2013 | | 7/16/2045 | | 44,597 |
| | 43,817 |
| | 7/16/2013 | | 7/16/2045 | | 45,289 |
| | 44,845 |
|
| | | | | | | 165,849 |
| | 162,929 |
| | | | | | 162,914 |
| | 159,996 |
|
| Accumulated amortization | | | | | | (82,754 | ) | | (77,132 | ) | | | | | | (84,048 | ) | | (78,192 | ) |
| On-campus participating properties, net | On-campus participating properties, net | | | | $ | 83,095 |
| | $ | 85,797 |
| On-campus participating properties, net | | | | $ | 78,866 |
| | $ | 81,804 |
|
| |
(1) | Consists of three phases placed in service between 1996 and 1998. |
| |
(2) | Consists of two phases placed in service in 2000 and 2003. |
| |
(3) | Consists of two phases placed in service in 2001 and 2005. |
AMERICAN CAMPUS COMMUNITIES, INC. AND SUBSIDIARIES
AMERICAN CAMPUS COMMUNITIES OPERATING PARTNERSHIP, L.P. AND SUBSIDIARIES
NOTES TO CONSOLIDATED FINANCIAL STATEMENTS
(unaudited)
7. Debt
A summary of the Company’s outstanding consolidated indebtedness, including unamortized debt premiums and discounts, is as follows:
| | | | | September 30, 2017 | | December 31, 2016 | | | September 30, 2018 | | December 31, 2017 | |
| Debt secured by wholly-owned properties: | | | | | | |
| Debt secured by owned properties: | | | | | | |
| Mortgage loans payable: | | | | | | | | | | |
| Unpaid principal balance | | $ | 523,328 |
| | $ | 559,642 |
| | | $ | 765,922 |
| | $ | 496,557 |
| |
| Unamortized deferred financing costs | | (2,349 | ) | | (3,040 | ) | | | (2,017 | ) | | (2,144 | ) | |
| Unamortized debt premiums | | 20,697 |
| | 26,830 |
| | | 12,813 |
| | 19,006 |
| |
| | | 541,676 |
| | 583,432 |
| | | 776,718 |
| | 513,419 |
| |
Construction loans payable (1) | | 22,422 |
| | — |
| | | 49,511 |
| | 51,780 |
| |
| Unamortized deferred financing costs | | (1,382 | ) | | — |
| | | (697 | ) | | (888 | ) | |
| | | 562,716 |
| | 583,432 |
| | | 825,532 |
| | 564,311 |
| |
| Debt secured by on-campus participating properties: | | |
| | |
| | | |
| | |
| |
Mortgage loans payable | | 70,257 |
| | 71,662 |
| | | 68,337 |
| | 69,776 |
| |
| Bonds payable | | 30,575 |
| | 33,870 |
| | | 27,030 |
| | 30,575 |
| |
| Unamortized deferred financing costs | | (674 | ) | | (769 | ) | | | (554 | ) | | (642 | ) | |
| | | 100,158 |
| | 104,763 |
| | | 94,813 |
| | 99,709 |
| |
| Total secured mortgage, construction and bond debt | | 662,874 |
| | 688,195 |
| | | 920,345 |
| | 664,020 |
| |
Unsecured notes, net of unamortized OID and deferred financing costs (2)(3) | | 1,190,296 |
| | 1,188,737 |
| | | 1,587,796 |
| | 1,585,855 |
| |
Unsecured term loans, net of unamortized deferred financing costs (3)(4) | | 646,675 |
| | 149,065 |
| | | 198,681 |
| | 647,044 |
| |
| Unsecured revolving credit facility | | 266,440 |
| | 99,300 |
| | | 266,900 |
| | 127,600 |
| |
| Total debt, net | | $ | 2,766,285 |
| | $ | 2,125,297 |
| | | $ | 2,973,722 |
| | $ | 3,024,519 |
| |
| |
(1) | Construction loans payable relates to construction loans partially financing the development of four in-processtwo presale development properties.projects. These properties are owned by entities determined to be VIEs for which the Company is the primary beneficiary, including one of the joint ventures formed as part of the Core Transaction discussed in Note 3.beneficiary. The creditors of these construction loans do not have recourse to the assets of the Company. |
| |
(2) | Includes net unamortized original issue discount (“OID”)The creditors of $1.7 million at September 30, 2017 and $1.9 million at December 31, 2016, and net unamortized deferred financing costsmortgage loans payable related to on-campus participating properties do not have recourse to the assets of $8.0 million at September 30, 2017 and $9.3 million at December 31, 2016.the Company. |
| |
(3) | Includes net unamortized original issue discount (“OID”) of $1.7 million and $1.9 million at September 30, 2018 and December 31, 2017, respectively, and net unamortized deferred financing costs of $3.3$10.5 million and $12.2 million at September 30, 2018 and December 31, 2017, respectively. |
| |
(4) | Includes net unamortized deferred financing costs of $1.3 million and $0.9$3.0 million at September 30, 2018 and December 31, 2016.2017, respectively. |
Mortgage and Construction Loans Payable
During the nine months ended September 30, 2018, the Company paid off approximately $55.9 million of fixed rate mortgage debt secured by three owned properties. Additionally, during the nine months ended September 30, 2018, the Company paid $2.7 million in debt defeasance costs associated with the early pay-off of mortgage loans in connection with the sale of one owned property and one owned property included in the ACC / Allianz Joint Venture Transaction (see Note 4). These costs were partially offset by the net write-off of $1.9 million of premiums and deferred financing costs, resulting in a loss from early extinguishment of debt of $0.8 million. During the nine months ended September 30, 2017, the Company paid off approximately $30.5 million ofoff any fixed rate mortgage debt secured by one wholly-owned property.
In the third quarter of 2017, as2018, one of the joint ventures that is part of the Core Transaction discussed in detail in Note 3, Core JV I paid off $68.7approximately $71.0 million of construction debt with proceeds from an additional investment made by the Company's initial investment inCompany to the joint venture. During the nine months ended September 30, 2016,venture (see Note 3). Additionally, in August 2018, upon completion of construction, the Company acquired The Edge - Stadium Centre, a property subject to a presale agreement. Approximately $19.3 million of construction debt used to partially finance the development of the presale project was paid off approximately $152.6upon acquisition.
In May 2018, as part of the ACC / Allianz Joint Venture Transaction, the joint venture issued $330.0 million of fixed rate secured mortgage debt secured by nine wholly-owned properties.with a coupon of 4.07% and the full amount of principal due at maturity in June 2028 (see Note 4).
AMERICAN CAMPUS COMMUNITIES, INC. AND SUBSIDIARIES
AMERICAN CAMPUS COMMUNITIES OPERATING PARTNERSHIP, L.P. AND SUBSIDIARIES
NOTES TO CONSOLIDATED FINANCIAL STATEMENTS
(unaudited)
In May 2017, the lender of the non-recourse mortgage loan secured by Blanton Common, a wholly-owned property located near Valdosta State University which was acquiredinherited as part of the GMH student housing transaction in 2008, sent a formal notice of default and initiated foreclosure proceedings. The property generatesgenerated insufficient cash flow to cover the debt service on the mortgage, which had a balance of $27.4 million at September 30, 2017default and a contractual maturity date of August 2017. In May 2017, the lender began receiving the net operating cash flows of the property each month in lieu of scheduled monthly mortgage payments. In June 2017, the Company recorded an impairment charge for this property of $15.3 million. In August 2017, the property transferred to receivership and a third-party manager began managing the property on behalf of the lender. As of September 30, 2017,2018, the Company was cooperating with the lender to allow for a consensual foreclosure process upon which the property will be surrendered to the lender in satisfaction of the mortgage loan. As discussed in Note 2, in June 2017, the Company recorded an impairment charge for this property of $15.3 million.
AMERICAN CAMPUS COMMUNITIES, INC. AND SUBSIDIARIES
AMERICAN CAMPUS COMMUNITIES OPERATING PARTNERSHIP, L.P. AND SUBSIDIARIES
NOTES TO CONSOLIDATED FINANCIAL STATEMENTS
(unaudited)
Unsecured Notes
The Company has issued the following senior unsecured notes:
| | | Date Issued | | Amount | | % of Par Value | | Coupon | | Yield | | Original Issue Discount | | Term (Years) | | Amount | | % of Par Value | | Coupon | | Yield | | Original Issue Discount | | Term (Years) |
| April 2013 | | $ | 400,000 |
| | 99.659 | | 3.750 | % | | 3.791 | % | | $ | 1,364 |
| | 10 | | $ | 400,000 |
| | 99.659 | | 3.750 | % | | 3.791 | % | | $ | 1,364 |
| | 10 |
| June 2014 | | 400,000 |
| | 99.861 | | 4.125 | % | | 4.269 | % | (1) | 556 |
| | 10 | | 400,000 |
| | 99.861 | | 4.125 | % | | 4.269 | % | (1) | 556 |
| | 10 |
| September 2015 | | 400,000 |
| | 99.811 | | 3.350 | % | | 3.391 | % | | 756 |
| | 5 | | 400,000 |
| | 99.811 | | 3.350 | % | | 3.391 | % | | 756 |
| | 5 |
| October 2017 | | | 400,000 |
| | 99.912 | | 3.625 | % | | 3.635 | % | | 352 |
| | 10 |
| | | $ | 1,200,000 |
| | | | | | $ | 2,676 |
| | | $ | 1,600,000 |
| | | | | | $ | 3,028 |
| |
| |
(1) | The yield includes the effect of the amortization of interest rate swap terminations (see Note 11). |
The notes are fully and unconditionally guaranteed by the Company. Interest on the notes is payable semi-annually. The terms of the unsecured notes include certain financial covenants that require the Operating Partnership to limit the amount of total debt and secured debt as a percentage of total asset value, as defined. In addition, the Operating Partnership must maintain a minimum ratio of unencumbered asset value to unsecured debt, as well as a minimum interest coverage level. As of September 30, 2017,2018, the Company was in compliance with all such covenants.
Unsecured Revolving Credit Facility
In January 2017, theThe Company entered into the Fifth Amended and Restated Credit Agreement (the “Agreement”). Pursuant to the Agreement, the Company increased the size of itshas a $700 million unsecured revolving credit facility, from $500 million to $700 million, which may be expanded by up to an additional $500 million upon the satisfaction of certain conditions. In connection with the Agreement, theThe maturity date of the revolving credit facility was extended from March 2018 tois in March 2022.
The unsecured revolving credit facility bears interest at a variable rate, at the Company’s option, based upon a base rate of one-, two-, three- or six-month LIBOR, plus, in each case, a spread based upon the Company’s investment grade rating from either Moody’s Investor Services, Inc. or Standard & Poor’s Rating Group. Additionally, the Company is required to pay a facility fee of 0.20% per annum on the $700 million revolving credit facility. As of September 30, 2017,2018, the revolving credit facility bore interest at a weighted average annual rate of 2.44% (1.24%3.39% (2.19% + 1.00% spread + 0.20% facility fee), and availability under the revolving credit facility totaled $433.6$433.1 million.
The terms of the unsecured credit facility include certain restrictions and covenants, which limit, among other items, the incurrence of additional indebtedness and liens. The facility contains customary affirmative and negative covenants and also contains financial covenants that, among other things, require the Company to maintain certain maximum leverage ratios and minimum ratios of “EBITDA” (earnings before interest, taxes, depreciation and amortization) to fixed charges. The financial covenants also include a minimum asset value requirement, a maximum secured debt ratio, and a minimum unsecured debt service coverage ratio. As of September 30, 2017,2018, the Company was in compliance with all such covenants.
AMERICAN CAMPUS COMMUNITIES, INC. AND SUBSIDIARIES
AMERICAN CAMPUS COMMUNITIES OPERATING PARTNERSHIP, L.P. AND SUBSIDIARIES
NOTES TO CONSOLIDATED FINANCIAL STATEMENTS
(unaudited)
Unsecured Term Loans
TheIn May 2018, the Company has arepaid the $300 million unsecured term loan (“Term Loan III Facility”) and the $150 million unsecured term loan (“Term Loan I Facility”) which has an accordion feature that allowswere due to mature in September 2018 and March 2021, respectively, using the Company to expandproceeds from the amount by up to an additional $50 million, subject tosale of a partial interest in a portfolio of seven owned properties and the satisfactionportfolio sale of certain conditions. The maturity datethree owned properties (see Note 4). In connection with the pay-off of the Term Loan IIII Facility is March 2021. The weighted average annual rate on theand Term Loan I Facility, was 2.33% (1.23% + 1.10% spread) at September 30, 2017. the Company accelerated the amortization of $0.9 million of deferred financing costs.
In June 2017, the Company entered into an Unsecured Term Loan Credit Agreement (the “New Term“Term Loan II Facility”) totaling $200 million. The maturity date of the New Term Loan II Facility is June 2022. The agreement has an accordion feature that allows the Company to expand the amount by up to an additional $100 million, subject to the satisfaction of certain conditions. The weighted average annual rate on the New Term Loan II Facility was 2.34% (1.24%3.20% (2.10% + 1.10% spread), at September 30, 2017.2018.
In September 2017, the Company entered into an Unsecured Term Loan Credit Agreement (“Term Loan III Facility”) totaling $300 million. The maturity date of the Term Loan III Facility is September 2018, and can be extended for two one-year periods at the Company’s option, subject to the satisfaction of certain conditions. The agreement has an accordion feature that allows the
AMERICAN CAMPUS COMMUNITIES, INC. AND SUBSIDIARIES
AMERICAN CAMPUS COMMUNITIES OPERATING PARTNERSHIP, L.P. AND SUBSIDIARIES
NOTES TO CONSOLIDATED FINANCIAL STATEMENTS
(unaudited)
Company to expand the amount by up to an additional $100 million, subject to the satisfaction of certain conditions. The weighted average annual rate on this term loan was 2.34% (1.24% + 1.10% spread) at September 30, 2017.
The terms of the term loan facilities described above include certain restrictions and covenants consistent with those of the unsecured revolving credit facility discussed above. As of September 30, 2017,2018, the Company was in compliance with all such covenants.
8. Stockholders’ Equity / Partners’ Capital
Stockholders’ Equity - Company
In June 2015,May 2018, the Company established anrenewed its at-the-market share offering program (the “ATM Equity Program”) through which the Company may issue and sell, from time to time, shares of common stock having an aggregate offering price of up to $500 million. The shares that may be sold under this program include shares of common stock of the Company with an aggregate offering price of approximately $233.0 million that were not sold under the Company's previous ATM equity program that expired in May 2018. Actual sales under the program will depend on a variety of factors, including, but not limited to, market conditions, the trading price of the Company’s common stock and determinations of the appropriate sources of funding for the Company.
The following table presentsThere was no activity under the Company’s ATM Equity Program during the three and nine months ended September 30, 20172018. The following table presents activity under the Company’s previous ATM equity program during the three and 2016:nine months ended September 30, 2017:
| | | | | Three Months Ended
September 30, | | Nine Months Ended
September 30, | | | | | |
| | | 2017 | | 2016 | | 2017 | | 2016 | | Three Months Ended
September 30, 2017 | | Nine Months Ended
September 30, 2017 |
| Total net proceeds | | $ | 1,135 |
| | $ | 62,374 |
| | $ | 188,538 |
| | $ | 62,374 |
| | $ | 1,135 |
| | $ | 188,538 |
|
| Commissions paid to sales agents | | $ | 14 |
| | $ | 790 |
| | $ | 2,374 |
| | $ | 790 |
| | $ | 14 |
| | $ | 2,374 |
|
| Weighted average price per share | | $ | 48.09 |
| | $ | 50.98 |
| | $ | 48.34 |
| | $ | 50.98 |
| | $ | 48.09 |
| | $ | 48.34 |
|
| Shares of common stock sold | | 23,900 |
| | 1,239,000 |
| | 3,949,356 |
| | 1,239,000 |
| | 23,900 |
| | 3,949,356 |
|
As of September 30, 2017,2018, the Company had approximately $233.0$500.0 million available for issuance under its ATM Equity Program.
In February 2016, ACC completed an equity offering, consisting of the sale of 17,940,000 shares of ACC’s common stock at a price of $41.25 per share, including 2,340,000 shares issued as a result of the exercise of the underwriters’ overallotment option in full at closing. The offering generated gross proceeds of approximately $740.0 million. The aggregate proceeds to ACC, net of the underwriting discount and expenses of the offering, were approximately $707.3 million.
In 2015, the Company established a Non-Qualified Deferred Compensation Plan (“Deferred Compensation Plan”) maintained for the benefit of certain employees and members of the Company’s Board of Directors, in which vested share awards (see Note 10), salary and other cash amounts earned may be deposited. Deferred Compensation Plan assets are held in a rabbi trust, which is subject to the claims of the Company’s creditors in the event of bankruptcy or insolvency. The shares held in the Deferred Compensation Plan are classified within stockholders’ equity in a manner similar to the manner in which treasury stock is classified. Subsequent changes in the fair value of the shares are not recognized. During the nine months ended September 30, 2017, 43,5972018, 12,956 and 7,131 shares of ACC’s commonvested stock were deposited into and withdrawn from the Deferred Compensation Plan.Plan, respectively. As of September 30, 2017, 63,7782018, 69,603 shares of ACC’s common stock were held in the Deferred Compensation Plan.
Partners’ Capital – Operating Partnership
In connection with the equity offering andissuance of common shares under the ATM Equity Program discussed above, ACCOP issued a number of American Campus Operating Partnership Common OP Units (“Common OP Units”) to ACC equivalent to the number of common shares issued by ACC.
9. Noncontrolling Interests
Interests in Consolidated Real Estate Joint Ventures and Presale Arrangements
Noncontrolling interests - partially owned properties: As of September 30, 2017, the Operating Partnership consolidates three joint ventures that own and operate three owned off-campus properties. Additionally, in December 2016, the Company entered
AMERICAN CAMPUS COMMUNITIES, INC. AND SUBSIDIARIES
AMERICAN CAMPUS COMMUNITIES OPERATING PARTNERSHIP, L.P. AND SUBSIDIARIES
NOTES TO CONSOLIDATED FINANCIAL STATEMENTS
(unaudited)
9. Noncontrolling Interests
Interests in Consolidated Real Estate Joint Ventures and Presale Arrangements
Noncontrolling interests - partially owned properties: As of September 30, 2018, the Operating Partnership consolidates four joint ventures that own and operate ten owned off-campus properties, including the ACC / Allianz Joint Venture Transaction discussed in Note 4. Additionally, the Company has entered into a pre-sale agreementtwo presale agreements to purchase The Edge at Stadium Centre.two in-process development properties. The portion of net assets attributable to the third-party partners in these arrangements is classified as “noncontrolling interests - partially owned properties” within equity and capital on the accompanying consolidated balance sheets of ACC and the Operating Partnership, respectively.
Redeemable noncontrolling interests (ACC) / redeemable limited partners (Operating Partnership): As part of the Core Transaction discussed in detail in Note 3, the Company entered into two joint venture arrangementsventures (the “Core Joint Ventures”) in the third quarter of 2017. The companyCompany is consolidating these joint ventures and the noncontrolling interest holder in each of these consolidated joint ventures has the option to redeem its noncontrolling interest in the entities through the exercise of put options. The options will be exercisable in the third and fourth quarter of 2019, and the redemption price is based on the fair value of the properties at the time of option exercise. As the exercise of the options is outside of the Company’s control, the portion of net assets attributable to the third-party partner in each of the joint venturesCore Joint Ventures is classified as “redeemable noncontrolling interests” and “redeemable limited partners” in the mezzanine section of the accompanying consolidated balance sheets of ACC and the Operating Partnership, respectively. During the nine months ended September 30, 2017, there were no changes in2018, the redemption value of redeemable noncontrolling interests that resulted frominterest increased by $68.7 million due to a change in the fair value of the net assets held by consolidatedthe joint ventures. For further discussion on accountingventures that are part of the Core Transaction primarily as a result of the underlying properties becoming operational during the third quarter and the leasing results for changesthe 2018-2019 academic year. The corresponding offset for the adjustment to the redemption value is recorded in additional paid in capital. The Company’s fair value analysis of the properties incorporates information obtained from a number of sources, including the Company’s analysis of comparable properties in the Company’s portfolio, estimations of net operating results of the properties, capitalization rates, discount rates, and other market data. As the change in redemption value refer to Note 2.is based on fair value, there is no effect on the Company’s earnings per share.
The third-party partners’ share of the income or loss of the joint ventures described above is calculated based on the partners'partners’ economic interest in the joint ventures and is included in “net income attributable to noncontrolling interests” on the consolidated statements of comprehensive income of ACC, and is reported as “net income attributable to noncontrolling interests - partially owned properties” on the consolidated statements of comprehensive income of the Operating Partnership.
Operating Partnership Ownership
Also included in redeemable noncontrolling interests (ACC) / redeemable limited partners (Operating Partnership) are OP Units for which the Operating Partnership is required, either by contract or securities law, to deliver registered common shares of ACC to the exchanging OP unit holder, or for which the Operating Partnership has the intent or history of exchanging such units for cash. The units classified as such include Series A Preferred Units (“Preferred OP Units”) as well as Common OP Units. The value of redeemable noncontrolling interests (ACC) / redeemable limited partners (Operating Partnership) related to OP Units on the accompanying consolidated balance sheets is reported at the greater of fair value, which is based on the closing market value of the Company’s common stock at period end, or historical cost at the end of each reporting period. The OP Unitholders’ share of the income or loss of the Company is included in “net income attributable to noncontrolling interests” on the consolidated statements of comprehensive income of ACC.
As of both September 30, 20172018 and December 31, 2016,2017, respectively, approximately 0.5% and 0.8% of the equity interests of the Operating Partnership were held by owners of Common OP Units and Preferred OP Units not held by ACC or ACC Holdings. During the nine months ended September 30, 2017, 22,0002018, 412,343 Common OP Units were converted into an equal number of shares of ACC’s common stock. During the year ended December 31, 2016, 280,9152017, 22,000 Common OP Units and 31,846 Preferred OP Units were converted into an equal number of shares of ACC’s common stock.
AMERICAN CAMPUS COMMUNITIES, INC. AND SUBSIDIARIES
AMERICAN CAMPUS COMMUNITIES OPERATING PARTNERSHIP, L.P. AND SUBSIDIARIES
NOTES TO CONSOLIDATED FINANCIAL STATEMENTS
(unaudited)
Below is a table summarizing the activity of redeemable noncontrolling interests (ACC) / redeemable limited partners (Operating Partnership) for the nine months ended September 30, 2017,2018, which includes both the redeemable joint venture partners and OP Units discussed above:
|
| | | |
| December 31, 2016 | $ | 55,078 |
|
| Net income | 322 |
|
| Distributions | (61,019 | ) |
| Conversion of redeemable limited partner units into shares of ACC common stock | (154 | ) |
| Contribution of properties from noncontrolling interest | 123,986 |
|
| Adjustments to reflect redeemable limited partner units at fair value | (5,943 | ) |
| September 30, 2017 | $ | 112,270 |
|
|
| | | |
| Balance, December 31, 2017 | $ | 132,169 |
|
| Net income | 554 |
|
| Distributions | (1,213 | ) |
| Conversion of OP Units into shares of ACC common stock | (13,333 | ) |
| Contributions from noncontrolling interests | 620 |
|
| Adjustments to reflect OP Units at fair value | 65,857 |
|
| Balance, September 30, 2018 | $ | 184,654 |
|
10. Incentive Award Plan
In May 2018, the Company’s stockholders approved the American Campus Communities, Inc. 2018 Incentive Award Plan (the “2018 Plan”). The 2018 Plan replaced the Company’s 2010 Incentive Award Plan (the “2010 Plan”). The 2018 Plan provides for the grant of various stock-based incentive awards to selected employees and directors of the Company and the Company’s affiliates. The types of awards that may be granted under the 2018 Plan include incentive stock options, nonqualified stock options, restricted stock awards (“RSAs”), restricted stock units (“RSUs”), profits interest units (“PIUs”) and other stock-based awards. The Company has reserved a total 3.5 million shares of the Company’s common stock for issuance pursuant to the 2018 Plan, subject to certain adjustments for changes in the Company’s capital structure, as defined in the 2018 Plan. Upon approval of the 2018 Plan, all remaining authorized shares that were not granted under the 2010 Plan were forfeited and are no longer available for issuance as new awards.
22
Restricted Stock Units (“RSUs”)
In March and September 2018, the Company appointed two new members to the Board of Directors who were granted RSUs valued at $115,000 each. A compensation charge of approximately $0.2 million was recorded during the nine months ended September 30, 2018 related to these awards.
Upon reelection to the Board of Directors in May 2018, all members of the Company’s Board of Directors were granted RSUs in accordance with the 2018 Plan. These RSUs were valued at $160,000 for the Chairman of the Board of Directors and at $115,000 for all other members. The number of RSUs was determined based on the fair market value of the Company’s stock on the date of grant, as defined in the 2018 Plan. All awards vested and settled immediately on the date of grant, and the Company delivered shares of common stock, as determined by the Compensation Committee of the Board of Directors. A compensation charge of approximately $0.9 million was recorded during the nine months ended September 30, 2018 related to these awards.
A summary of RSUs as of September 30, 2018 and activity during the nine months then ended is presented below:
|
| | |
| Number of RSUs |
| Outstanding at December 31, 2017 | — |
|
| Granted | 27,376 |
|
| Settled in common shares | (27,376 | ) |
| Outstanding at September 30, 2018 | — |
|
AMERICAN CAMPUS COMMUNITIES, INC. AND SUBSIDIARIES
AMERICAN CAMPUS COMMUNITIES OPERATING PARTNERSHIP, L.P. AND SUBSIDIARIES
NOTES TO CONSOLIDATED FINANCIAL STATEMENTS
(unaudited)
10. Incentive Award Plan
Restricted Stock UnitsAwards (“RSUs”RSAs”)
Upon reelection to the Board of Directors in May 2017, all members of the Company’s Board of Directors were granted RSUs in accordance with the American Campus Communities, Inc. 2010 Incentive Award Plan (the “Plan”). These RSUs were valued at $150,000 for the Chairman of the Board of Directors and at $105,000 for all other members. Additionally, effective July 1, 2017, the Board of Directors’ compensation program was revised to reflect an increase in RSUs of $10,000 for all members of the Board of Directors. The number of RSUs was determined based on the fair market value of the Company’s stock on the date of grant, as defined in the Plan. All awards vested and settled immediately on the date of grant, and the Company delivered shares of common stock and cash, as determined by the Compensation Committee of the Board of Directors. A compensation charge of approximately $0.9 million was recorded during the nine months ended September 30, 2017 related to these awards and is included in general and administrative expenses on the Company’s consolidated statements of comprehensive income.
A summary of ACC’s RSUs under the PlanRSAs as of September 30, 20172018 and activity during the nine months then ended is presented below:
|
| | |
| | Number of RSUs |
Outstanding at December 31, 2016 | — |
|
Granted | 18,221 |
|
Settled in common shares | (16,295 | ) |
Settled in cash | (1,926 | ) |
Outstanding at September 30, 2017 | — |
|
Restricted Stock Awards (“RSAs”)
A summary of RSAs under the Plan as of September 30, 2017 and activity during the nine months then ended, is presented below:
|
| | |
| Number of RSAs |
Nonvested balance at December 31, 20162017 | 773,101810,870 |
|
| Granted | 344,688357,387 |
|
Vested | (193,186 | ) |
Forfeited Vested(1)
| (110,875240,845 | ) |
| Forfeited | (48,198 | ) |
Nonvested balance at September 30, 20172018 | 813,728879,214 |
|
(1)Includes shares withheld to satisfy tax obligations upon vesting.
The fair value of RSAs is calculated based on the closing market value of ACC’s common stock on the date of grant. The fair value of these awards is amortized to expense over the vesting periods, which amounted to approximately $2.4 million and $2.2 millionperiods. Amortization expense for the three months ended September 30, 2018 and 2017 amounted to approximately $2.7 million and 2016,$2.4 million, respectively, and $10.6$8.8 million and $7.1$10.6 million for the nine months ended September 30, 20172018 and 2016,2017, respectively. The amortization of restricted stock awards for the nine months ended September 30, 2017 includes $2.4 million of contractual executive separation and retirement charges incurred with regard to the retirement of the Company’s former Chief Financial Officer, representing the June 30, 2017 vesting of 46,976 RSAs, net of shares withheld for taxes, related to the retirement.
11. Derivative Instruments and Hedging Activities
The Company is exposed to certain risks arising from both its business operations and economic conditions. The Company principally manages its exposures to a wide variety of business and operational risks through management of its core business activities. The Company manages economic risks, including interest rate, liquidity, and credit risk primarily by managing the amount, sources, and duration of its debt funding and the use of derivative financial instruments. Specifically, the Company enters into derivative financial instruments to manage exposures that arise from business activities that result in the receipt or payment of future known and uncertain cash amounts, the value of which are determined by interest rates. The Company’s derivative financial instruments are used to manage differences in the amount, timing, and duration of the Company’s known or expected cash receipts and its known or expected cash payments principally related to the Company’s investments and borrowings.
AMERICAN CAMPUS COMMUNITIES, INC. AND SUBSIDIARIES
AMERICAN CAMPUS COMMUNITIES OPERATING PARTNERSHIP, L.P. AND SUBSIDIARIES
NOTES TO CONSOLIDATED FINANCIAL STATEMENTS
(unaudited)
Cash Flow Hedges of Interest Rate Risk
The Company’s objectives in using interest rate derivatives are to add stability to interest expense and to manage its exposure to interest rate movements. To accomplish this objective, the Company primarily uses interest rate swaps and forward starting swaps as part of its interest rate risk management strategy. Interest rate swaps designated as cash flow hedges involve the receipt of variable-rate amounts from a counterparty in exchange for the Company making fixed-rate payments over the life of the agreements without exchange of the underlying notional amount. Forward starting swaps are used to protect the Company against adverse fluctuations in interest rates by reducing its exposure to variability in cash flows relating to interest payments on a forecasted issuance of debt. The effective portion of changes in the fair value of derivatives designated and that qualify as cash flow hedges is recorded in other comprehensive income (outside of earnings) and subsequently reclassified into earnings in the period that the hedged forecasted transaction affects earnings. The ineffective portion of changes in the fair value of the derivative is recognized directly in earnings. Ineffectiveness resulting from the derivative instruments summarized below was immaterial for both the three and nine month periods ended September 30, 20172018 and 2016.
The following table summarizes2017. As of September 30, 2018, the Company’sCompany had outstanding interest rate swap contracts aswith a notional amount of September 30, 2017:
|
| | | | | | | | | | | | | | | | |
| Hedged Debt Instrument | | Effective Date | | Maturity Date | | Pay Fixed Rate | | Receive Floating Rate Index | | Current Notional Amount | | Fair Value |
| Cullen Oaks mortgage loan | | Feb 18, 2014 | | Feb 15, 2021 | | 2.2750% | | LIBOR - 1 month | | $ | 13,830 |
| | $ | (224 | ) |
| Cullen Oaks mortgage loan | | Feb 18, 2014 | | Feb 15, 2021 | | 2.2750% | | LIBOR - 1 month | | 13,973 |
| | (226 | ) |
| Park Point mortgage loan | | Nov 1, 2013 | | Oct 5, 2018 | | 1.5450% | | LIBOR - 1 month | | 70,000 |
| | (60 | ) |
| | | | | | | | | Total | | $ | 97,803 |
| | $ | (510 | ) |
In January 2017, the interest rate swaps on the Term Loan I Facility expired, and the remaining immaterial balance in accumulated other comprehensive income was reclassified into earnings.
approximately $96.7 million. The table below presents the fair value of the Company’s derivative financial instruments as well as their classification on the consolidated balance sheetssuch interest rate swap contracts was immaterial as of both September 30, 20172018 and December 31, 2016:
|
| | | | | | | | | | |
| | | Liability Derivatives |
| | | | | Fair Value as of |
| Description | | Balance Sheet
Location | | September 30, 2017 | | December 31, 2016 |
| Interest rate swaps contracts | | Other liabilities | | $ | 510 |
| | $ | 1,099 |
|
Total derivatives designated as hedging instruments | | | | $ | 510 |
| | $ | 1,099 |
|
AMERICAN CAMPUS COMMUNITIES, INC. AND SUBSIDIARIES
AMERICAN CAMPUS COMMUNITIES OPERATING PARTNERSHIP, L.P. AND SUBSIDIARIES
NOTES TO CONSOLIDATED FINANCIAL STATEMENTS
(unaudited)
12. Fair Value Disclosures
Financial Instruments Carried at Fair Value
The following table presents information about the Company’s financial instruments measured at fair value on a recurring basis as of September 30, 20172018 and December 31, 2016,2017, and indicates the fair value hierarchy of the valuation techniques utilized by the Company to determine such fair value. In general, fair values determined by Level 1 inputs utilize quoted prices (unadjusted) in active markets for identical assets or liabilities the Company has the ability to access. Fair values determined by Level 2 inputs utilize inputs other than quoted prices included in Level 1 that are observable for the asset or liability, either directly or indirectly. Level 2 inputs include quoted prices for similar assets and liabilities in active markets and inputs other than quoted prices observable for the asset or liability, such as interest rates and yield curves observable at commonly quoted intervals. Level 3 inputs are unobservable inputs for the asset or liability, and include situations where there is little, if any, market activity for the asset or liability.
In instances in which the inputs used to measure fair value may fall into different levels of the fair value hierarchy, the level in the fair value hierarchy within which the fair value measurement in its entirety has been determined is based on the lowest level input
AMERICAN CAMPUS COMMUNITIES, INC. AND SUBSIDIARIES
AMERICAN CAMPUS COMMUNITIES OPERATING PARTNERSHIP, L.P. AND SUBSIDIARIES
NOTES TO CONSOLIDATED FINANCIAL STATEMENTS
(unaudited)
significant to the fair value measurement in its entirety. The Company’s assessment of the significance of a particular input to the fair value measurement in its entirety requires judgment, and considers factors specific to the asset or liability.
Disclosures concerning financial instruments measured at fair value are as follows:
|
| | | | | | | | | | | | | | | | | | | | | | | | | | | | | | | | |
| | | Fair Value Measurements as of |
| | | September 30, 2017 | | December 31, 2016 |
| | | Quoted Prices in Active Markets for Identical Assets and Liabilities (Level 1) | | Significant Other Observable Inputs (Level 2) | | Significant Unobservable Inputs (Level 3) | | Total | | Quoted Prices in Active Markets for Identical Assets and Liabilities (Level 1) | | Significant Other Observable Inputs (Level 2) | | Significant Unobservable Inputs (Level 3) | | Total |
| Liabilities: | | |
| | |
| | |
| | |
| | |
| | |
| | |
| | |
|
| Derivative financial instruments | | $ | — |
| | $ | 510 |
| | $ | — |
| | $ | 510 |
| | $ | — |
| | $ | 1,099 |
| | $ | — |
| | $ | 1,099 |
|
| Mezzanine: | | |
| | |
| | |
| | |
| | |
| | |
| | |
| | |
|
| Redeemable noncontrolling interests (Company)/Redeemable limited partners (Operating Partnership) | | $ | — |
| | $ | 50,887 |
| | $ | 61,383 |
| | $ | 112,270 |
| | $ | — |
| | $ | 55,078 |
| | $ | — |
| | $ | 55,078 |
|
The Company uses derivative financial instruments, specifically interest rate swaps and forward starting swaps, for nontrading purposes. The Company uses interest rate swaps to manage interest rate risk arising from previously unhedged interest payments associated with variable rate debt and forward starting swaps to reduce exposure to variability in cash flows relating to interest payments on forecasted issuances of debt. Through September 30, 2017, derivative financial instruments were designated and qualified as cash flow hedges. Derivative contracts with positive net fair values inclusive of net accrued interest receipts or payments are recorded in other assets. Derivative contracts with negative net fair values, inclusive of net accrued interest payments or receipts, are recorded in other liabilities. The valuation of these instruments is determined using widely accepted valuation techniques including discounted cash flow analysis on the expected cash flows of each derivative. This analysis reflects the contractual terms of the derivatives, including the period to maturity, and uses observable market-based inputs, including interest rate curves. The fair values of interest rate swaps are determined using the market standard methodology of netting the discounted future fixed cash receipts (or payments) and the discounted expected variable cash payments (or receipts). The variable cash payments (or receipts) are based on an expectation of future interest rates (forward curves) derived from observable market interest rate curves.
The Company incorporates credit valuation adjustments to appropriately reflect its own nonperformance risk and the respective counterparty’s nonperformance risk in the fair value measurements. In adjusting the fair value of its derivative contracts for the effect of nonperformance risk, the Company has considered the impact of netting and any applicable credit enhancements, such as collateral postings, thresholds and guarantees.
Although the Company has determined the majority of the inputs used to value its derivatives fall within Level 2 of the fair value hierarchy, the credit valuation adjustments associated with its derivatives utilize Level 3 inputs, such as estimates of current credit spreads to evaluate the likelihood of default by the Company and its counterparty. However, as of September 30, 2017 and December 31, 2016, the Company has assessed the significance of the impact of the credit valuation adjustments on the overall valuation of its derivative positions and has determined that the credit valuation adjustments are not significant to the overall valuation of the Company’s derivative financial instruments. As a result, the Company has determined each of its derivative valuations in its entirety is classified in Level 2 of the fair value hierarchy. |
| | | | | | | | | | | | | | | | | | | | | | | | | | | | | | | | |
| | | Fair Value Measurements as of |
| | | September 30, 2018 | | December 31, 2017 |
| | | Quoted Prices in Active Markets for Identical Assets and Liabilities (Level 1) | | Significant Other Observable Inputs (Level 2) | | Significant Unobservable Inputs (Level 3) | | Total | | Quoted Prices in Active Markets for Identical Assets and Liabilities (Level 1) | | Significant Other Observable Inputs (Level 2) | | Significant Unobservable Inputs (Level 3) | | Total |
| Mezzanine: | | |
| | |
| | |
| | |
| | |
| | |
| | |
| | |
|
| Redeemable noncontrolling interests (Company)/Redeemable limited partners (Operating Partnership) | | $ | — |
| | $ | 27,672 |
| | $ | 156,982 |
| | $ | 184,654 |
| | $ | — |
| | $ | 44,503 |
| | $ | 87,666 |
| | $ | 132,169 |
|
The OP Unit component of redeemable noncontrolling interests has a redemption feature, and is marked to its redemption value.value when the redemption value exceeds the original issue price. The redemption value is based on the fair value of the Company’s common stock at the redemption date, and therefore, is calculated based on the fair value of the Company’s common stock at the balance sheet date. Since the valuation is based on observable inputs such as quoted prices for similar instruments in active markets, these instruments are classified in Level 2 of the fair value hierarchy.
As discussed in Note 2 and Note 9, the redeemable noncontrolling interests related to the joint venture partners in the Core Transaction are marked to their redemption value at each balance sheet date. The redemption value is based on the fair value of the underlying properties held by the joint ventures. This analysis incorporates information obtained from a number of sources, including the Company’s analysis of comparable properties in the Company’s portfolio, estimations of net operating results of the properties, capitalization rates, discount rates, and other market data. The Company has determined these estimates are primarily based upon unobservable inputs and therefore are considered to be Level 3 inputs within the fair value hierarchy.
AMERICAN CAMPUS COMMUNITIES, INC. AND SUBSIDIARIES
AMERICAN CAMPUS COMMUNITIES OPERATING PARTNERSHIP, L.P. AND SUBSIDIARIES
NOTES TO CONSOLIDATED FINANCIAL STATEMENTS
(unaudited)
Financial Instruments Not Carried at Fair Value
Cash and Cash Equivalents, Restricted Cash, Student Contracts Receivable, Other Assets, Accounts Payable and Accrued Expenses and Other Liabilities: The Company estimates that the carrying amount approximates fair value, due to the short maturity of these instruments.
Loans Receivable:Receivable: The fair value of loans receivable is based on a discounted cash flow analysis consisting of scheduled cash flows and discount rate estimates to approximate those that a willing buyer and seller might use. These financial instruments utilize Level 3 inputs.
Mortgage Loans Payable:Payable: The fair value of mortgage loans payable is based on the present value of the cash flows at current market interest rates through maturity. The Company has concluded the fair value of these financial instruments utilize Level 2 inputs as the majority of the inputs used to value these instruments fall within Level 2 of the fair value hierarchy.
AMERICAN CAMPUS COMMUNITIES, INC. AND SUBSIDIARIES
AMERICAN CAMPUS COMMUNITIES OPERATING PARTNERSHIP, L.P. AND SUBSIDIARIES
NOTES TO CONSOLIDATED FINANCIAL STATEMENTS
(unaudited)
Bonds Payable:Payable: The fair value of bonds payable is based on quoted prices in markets that are not active due to the unique characteristics of these financial instruments; as such, the Company has concluded the inputs used to measure fair value fall within Level 2 of the fair value hierarchy.
Unsecured Notes:Notes:In calculating the fair value of unsecured notes, interest rate and spread assumptions reflect current creditworthiness and market conditions available for the issuance of unsecured notes with similar terms and remaining maturities. These financial instruments utilize Level 2 inputs.
Construction Loans Payable, Unsecured Revolving Credit Facility, and Unsecured Term Loans: The fair value of these instruments approximates their carrying values due to the variable interest rate feature of these instruments.
The table below contains the estimated fair value and related carrying amounts for the Company’s financial instruments as of September 30, 20172018 and December 31, 2016: 2017:
| | | | | September 30, 2017 | | | December 31, 2016 | | | September 30, 2018 | | | December 31, 2017 | |
| | | Estimated Fair Value | | Carrying Amount | | | Estimated Fair Value | | Carrying Amount | | | Estimated Fair Value | | Carrying Amount | | | Estimated Fair Value | | Carrying Amount | |
| Assets: | | | | | | | | | | | | | | | | | | |
| Loans receivable | | $ | 54,396 |
| | $ | 61,052 |
| | $ | 54,396 |
| | $ | 58,539 |
| | | $ | 54,140 |
| | $ | 60,424 |
| | $ | 54,140 |
| | $ | 57,948 |
| |
| Liabilities: | | | | |
| | |
| | |
| | | | | |
| | |
| | |
| |
| Unsecured notes | | $ | 1,232,338 |
| | $ | 1,190,296 |
| (1) | | $ | 1,211,344 |
| | $ | 1,188,737 |
| (1) | | $ | 1,554,144 |
| | $ | 1,587,796 |
| (1) | | $ | 1,620,839 |
| | $ | 1,585,855 |
| (1) |
Mortgage loans payable | | 603,789 |
| | 611,657 |
| (2) | | 644,617 |
| | 654,794 |
| (2) | | $ | 768,542 |
| | $ | 803,389 |
| (2) | | $ | 571,676 |
| | $ | 582,927 |
| (2) |
| Bonds payable | | 32,983 |
| | 30,177 |
| | 37,066 |
| | 33,401 |
| | | $ | 28,544 |
| | $ | 26,720 |
| (3) | | $ | 32,552 |
| | $ | 30,201 |
| (3) |
| |
(1) | Includes net unamortized OID and net unamortized deferred financing costs (see Note 7). |
| |
(2) | Includes net unamortized debt premiums and discounts and net unamortized deferred financing costs (see Note 7). |
(3) Includes net unamortized deferred financing costs (see Note 7).
(4) In July 2018, the fixed feature of a mortgage loan secured by an on-campus participating property expired, and the mortgage loan became classified as variable rate debt.
13. Commitments and Contingencies
Commitments
Construction Contracts: As of September 30, 2017,2018, excluding fourtwo properties under construction and subject to presale arrangements which are being funded by construction loans, the Company estimates additional costs to complete eight wholly-ownedthree owned development projects under construction to be approximately $383.6$132.9 million.
Joint Ventures: As discussed in Note 3, as part of the Core Transaction, the Company entered into two joint ventures during the third quarter of 2017. As part of this transaction, the Company is obligated to increase its investment in the joint ventures over a two year period, resulting in aperiod. As of September 30, 2018, the remaining funding commitment ofwas approximately $325.2$200.9 million. Of this amount, $46.9 million including the Company's $40.6 million initial investment related to Hub U District Seattle anticipated to close duringwas paid in the fourth quarter of 2017.2018, with the remainder anticipated to be paid in September and October 2019. See Note 3 for further discussion.
Pre-sale Arrangements:Presale Development Projects: In December 2016, theThe Company has entered into a pre-sale agreementtwo presale agreements to purchase The Edge - Stadium Centre, a propertyproperties which will be completed in August 2018.Fall 2019. Total estimated development costs of approximately $42.6$107.3 million include
AMERICAN CAMPUS COMMUNITIES, INC. AND SUBSIDIARIES
AMERICAN CAMPUS COMMUNITIES OPERATING PARTNERSHIP, L.P. AND SUBSIDIARIES
NOTES TO CONSOLIDATED FINANCIAL STATEMENTS
(unaudited)
the purchase price and elected upgrades, and capitalized transaction costs.of which $90.0 million remains to be funded as of September 30, 2018. The Company is obligated to purchase the propertyproperties as long as the developer meets certain construction completion deadlines and other closing conditions are met.conditions. The Company is responsible for leasing, management, and initial operations of the project while the third-party developer retains development risk during the construction period. See Note 9 for further discussion.
The Company expects to fund the commitments mentioned above through a combination of proceeds from cash flows generated from operations, anticipated property dispositions, joint venture activity, and a combination of debt and equity transactions, which may include net proceeds from the ATM Equity Program discussed in Note 8, borrowings under the Company’s existing unsecured credit facilities, and accessing the unsecured bond market.
AMERICAN CAMPUS COMMUNITIES, INC. AND SUBSIDIARIES
AMERICAN CAMPUS COMMUNITIES OPERATING PARTNERSHIP, L.P. AND SUBSIDIARIES
NOTES TO CONSOLIDATED FINANCIAL STATEMENTS
(unaudited)
Development-related Guarantees: For certain of its third-party development projects, the Company commonly provides alternate housing and project cost guarantees, subject to force majeure. These guarantees are typically limited, on an aggregate basis, to the amount of the projects’ related development fees or a contractually agreed-upon maximum exposure amount. Alternate housing guarantees generally require the Company to provide substitute living quarters and transportation for students to and from the university if the project is not complete by an agreed-upon completion date. These guarantees typically expire at the later of five days after completion of the project or once the Company has moved all students from the substitute living quarters into the project.
Under project cost guarantees, the Company is responsible for the construction cost of a project in excess of an approved budget. The budget consists primarily of costs included in the general contractors’ guaranteed maximum price contract (“GMP”). In most cases, the GMP obligates the general contractor, subject to force majeure and approved change orders, to provide completion date guarantees and to cover cost overruns and liquidated damages. In addition, the GMP is typicallyin certain cases secured with payment and performance bonds. Project cost guarantees expire upon completion of certain developer obligations, which are normally satisfied within one year after completion of the project. The Company’s estimated maximum exposure amount under the above guarantees is approximately $4.0$10.3 million as of September 30, 2017.2018. As of September 30, 2017,2018, management did not anticipate any material deviations from schedule or budget related to third-party development projects currently in progress.
In the normal course of business, the Company enters into various development-related purchase commitments with parties that provide development-related goods and services. In the event that the Company was to terminate development services prior to the completion of projects under construction, the Company could potentially be committed to satisfy outstanding purchase orders with such parties.
Conveyance to University: In August 2013, the Company entered into an agreement to convey fee interest in a parcel of land, on which one of the Company’s student housing properties resides (University Crossings), to Drexel University (the “University”). Concurrent with the land conveyance, the Company as lessee entered into a ground lease agreement with the University as lessor for an initial term of 40 years, with three 10-year extensions, at the Company’s option. The Company also agreed to convey the building and improvements to the University at an undetermined date in the future and to pay real estate transfer taxes not to exceed $2.4 million. The Company paid approximately $0.6 million in real estate transfer taxes upon the conveyance of land to the University, leaving approximately $1.8 million to be paid by the Company upon the transfer of the building and improvements.
Other Guarantees: In 2017, as part of the purchase of an undeveloped land parcel, the Company entered into an agreement to construct a commercial retail space within a future development that will be conveyed back to the seller upon construction completion. If the construction of the retail space is not completed in accordance with the agreement, the Company is required to pay liquidated damages of $2.1 million. As of September 30, 2018, management anticipates completing construction of the retail space in accordance with the agreement.
Contingencies
Litigation: The Company is subject to various claims, lawsuits and legal proceedings, as well as other matters that have not been fully resolved and that have arisen in the ordinary course of business. While it is not possible to ascertain the ultimate outcome of such matters, management believes that the aggregate amount of such liabilities, if any, in excess of amounts provided or covered by insurance, will not have a material adverse effect on the consolidated financial position or results of operations of the Company. However, the outcome of claims, lawsuits and legal proceedings brought against the Company is subject to significant uncertainty. Therefore, although management considers the likelihood of such an outcome to be remote, the ultimate results of these matters cannot be predicted with certainty.
Letters of Intent: In the ordinary course of the Company’s business, the Company enters into letters of intent indicating a willingness to negotiate for acquisitions, dispositions or joint ventures. Such letters of intent are non-binding (except with regard to exclusivity and confidentiality), and neither party to the letter of intent is obligated to pursue negotiations unless and until a definitive contract is entered into by the parties. Even if definitive contracts are entered into, the letters of intent relating to the acquisition and disposition of real property and resulting contracts generally contemplate that such contracts will provide the acquirer with time to evaluate the property and conduct due diligence, during which periods the acquirer will have the ability to terminate the contracts without penalty or forfeiture of any material deposit or earnest money. There can be no assurance that definitive contracts will be entered into with respect to any matter covered by letters of intent or that the Company will consummate any transaction contemplated by any definitive contract. Furthermore, due diligence periods for real property are frequently extended as needed. Once the due diligence period expires, the Company is then at risk under a real property acquisition contract, but only to
AMERICAN CAMPUS COMMUNITIES, INC. AND SUBSIDIARIES
AMERICAN CAMPUS COMMUNITIES OPERATING PARTNERSHIP, L.P. AND SUBSIDIARIES
NOTES TO CONSOLIDATED FINANCIAL STATEMENTS
(unaudited)
the extent of any non-refundable earnest money deposits associated with the contract and subject to normal closing conditions being met.
Environmental Matters: The Company is not aware of any environmental liability with respect to the properties that would have a material adverse effect on the Company’s business, assets or results of operations. However, there can be no assurance that such a material environmental liability does not exist. The existence of any such material environmental liability could have an adverse effect on the Company’s results of operations and cash flows.
AMERICAN CAMPUS COMMUNITIES, INC. AND SUBSIDIARIES
AMERICAN CAMPUS COMMUNITIES OPERATING PARTNERSHIP, L.P. AND SUBSIDIARIES
NOTES TO CONSOLIDATED FINANCIAL STATEMENTS
(unaudited)
14. Segments
The Company defines business segments by their distinct customer base and service provided. The Company has identified four reportable segments: Wholly-OwnedOwned Properties, On-Campus Participating Properties, Development Services, and Property Management Services. Management evaluates each segment’s performance based on operating income before depreciation, amortization and minority interests andinterests.
During the year ended December 31, 2017, the Company revised the measure of profit or loss for each segment to include the allocation of costs related to corporate overhead. Intercompany fees are reflected atmanagement and oversight and to exclude intercompany management fee revenue. This was due to a presentation change in the contractually stipulated amounts.information used by the Company’s chief operating decision makers to assess segment and company-wide performance and allocate resources, which was driven by the reorganization of duties within the Company’s executive management team. Prior period amounts have been reclassified to conform to the current period presentation.
|
| | | | | | | | | | | | | | | | |
| | | Three Months Ended
September 30, | | Nine Months Ended
September 30, |
| | | 2017 | | 2016 | | 2017 | | 2016 |
| Wholly-Owned Properties | | | | | | | | |
| Rental revenues and other income | | $ | 184,282 |
| | $ | 186,504 |
| | $ | 533,866 |
| | $ | 548,403 |
|
| Interest income | | 385 |
| | 345 |
| | 1,161 |
| | 878 |
|
| Total revenues from external customers | | 184,667 |
| | 186,849 |
| | 535,027 |
| | 549,281 |
|
| Operating expenses before depreciation, amortization, ground/facility leases and allocation of corporate overhead | | (97,545 | ) | | (99,820 | ) | | (242,315 | ) | | (254,523 | ) |
| Ground/facility leases | | (1,877 | ) | | (1,614 | ) | | (5,163 | ) | | (4,520 | ) |
Interest expense, net (1) | | (1,540 | ) | | (4,078 | ) | | (1,194 | ) | | (16,215 | ) |
| Operating income before depreciation, amortization, and allocation of corporate overhead | | $ | 83,705 |
| | $ | 81,337 |
| | $ | 286,355 |
| | $ | 274,023 |
|
| Depreciation and amortization | | $ | 58,339 |
| | $ | 49,464 |
| | $ | 161,341 |
| | $ | 151,740 |
|
| Capital expenditures | | $ | 196,910 |
| | $ | 119,589 |
| | $ | 473,638 |
| | $ | 329,932 |
|
| Total segment assets at September 30, | | $ | 6,488,259 |
| | $ | 6,062,852 |
| | $ | 6,488,259 |
| | $ | 6,062,852 |
|
| | | | | | | | | |
| On-Campus Participating Properties | | |
| | |
| | |
| | |
|
| Total revenues and other income | | $ | 6,799 |
| | $ | 6,758 |
| | $ | 23,128 |
| | $ | 23,018 |
|
| Interest income | | 24 |
| | 2 |
| | 47 |
| | 4 |
|
| Total revenues from external customers | | 6,823 |
| | 6,760 |
| | 23,175 |
| | 23,022 |
|
| Operating expenses before depreciation, amortization, ground/facility leases and allocation of corporate overhead | | (3,611 | ) | | (3,507 | ) | | (10,109 | ) | | (9,278 | ) |
| Ground/facility leases | | (452 | ) | | (351 | ) | | (1,988 | ) | | (2,216 | ) |
| Interest expense | | (1,312 | ) | | (1,394 | ) | | (3,987 | ) | | (4,231 | ) |
| Operating income before depreciation, amortization and allocation of corporate overhead | | $ | 1,448 |
| | $ | 1,508 |
| | $ | 7,091 |
| | $ | 7,297 |
|
| Depreciation and amortization | | $ | 1,892 |
| | $ | 1,839 |
| | $ | 5,621 |
| | $ | 5,493 |
|
| Capital expenditures | | $ | 2,039 |
| | $ | 1,446 |
| | $ | 2,909 |
| | $ | 2,510 |
|
| Total segment assets at September 30, | | $ | 101,027 |
| | $ | 105,774 |
| | $ | 101,027 |
| | $ | 105,774 |
|
| | | | | | | | | |
| Development Services | | |
| | |
| | |
| | |
|
| Development and construction management fees | | $ | 3,566 |
| | $ | 773 |
| | $ | 4,697 |
| | $ | 3,929 |
|
| Operating expenses | | (4,185 | ) | | (3,434 | ) | | (11,396 | ) | | (10,414 | ) |
| Operating loss before depreciation, amortization and allocation of corporate overhead | | $ | (619 | ) | | $ | (2,661 | ) | | $ | (6,699 | ) | | $ | (6,485 | ) |
| Total segment assets at September 30, | | $ | 4,918 |
| | $ | 2,279 |
| | $ | 4,918 |
| | $ | 2,279 |
|
| | | | | | | | | |
| Property Management Services | | |
| | |
| | |
| | |
|
| Property management fees from external customers | | $ | 2,291 |
| | $ | 2,376 |
| | $ | 7,193 |
| | $ | 7,039 |
|
| Intersegment revenues | | 5,128 |
| | 5,830 |
| | 14,835 |
| | 17,410 |
|
| Total revenues | | 7,419 |
| | 8,206 |
| | 22,028 |
| | 24,449 |
|
| Operating expenses | | (3,034 | ) | | (2,742 | ) | | (9,719 | ) | | (8,542 | ) |
| Operating income before depreciation, amortization and allocation of corporate overhead | | $ | 4,385 |
| | $ | 5,464 |
| | $ | 12,309 |
| | $ | 15,907 |
|
| Total segment assets at September 30, | | $ | 11,067 |
| | $ | 10,692 |
| | $ | 11,067 |
| | $ | 10,692 |
|
| | | | | | | | | |
|
| | | | | | | | | | | | | | | | |
| | | Three Months Ended
September 30, | | Nine Months Ended
September 30, |
| | | 2018 | | 2017 | | 2018 | | 2017 |
| Owned Properties | | | | | | | | |
| Rental revenues and other income | | $ | 203,526 |
| | $ | 184,282 |
| | $ | 600,138 |
| | $ | 533,866 |
|
| Interest income | | 382 |
| | 385 |
| | 1,146 |
| | 1,161 |
|
| Total revenues from external customers | | 203,908 |
| | 184,667 |
| | 601,284 |
| | 535,027 |
|
| Operating expenses before depreciation, amortization, and ground/facility lease expense | | (107,997 | ) | | (99,423 | ) | | (282,193 | ) | | (249,552 | ) |
| Ground/facility lease expense | | (2,306 | ) | | (1,877 | ) | | (6,293 | ) | | (5,163 | ) |
Interest expense, net (1) | | (5,622 | ) | | (1,540 | ) | | (9,011 | ) | | (1,194 | ) |
| Operating income before depreciation and amortization | | $ | 87,983 |
| | $ | 81,827 |
| | $ | 303,787 |
| | $ | 279,118 |
|
| Depreciation and amortization | | $ | 62,909 |
| | $ | 58,339 |
| | $ | 185,171 |
| | $ | 161,341 |
|
| Capital expenditures | | $ | 144,910 |
| | $ | 196,910 |
| | $ | 428,065 |
| | $ | 473,638 |
|
| | | | | | | | | |
| On-Campus Participating Properties | | |
| | |
| | |
| | |
|
| Rental revenues and other income | | $ | 6,980 |
| | $ | 6,799 |
| | $ | 23,605 |
| | $ | 23,128 |
|
| Interest income | | 43 |
| | 24 |
| | 105 |
| | 47 |
|
| Total revenues from external customers | | 7,023 |
| | 6,823 |
| | 23,710 |
| | 23,175 |
|
| Operating expenses before depreciation, amortization, and ground/facility lease expense | | (3,875 | ) | | (3,923 | ) | | (11,030 | ) | | (11,080 | ) |
| Ground/facility lease expense | | (645 | ) | | (452 | ) | | (2,233 | ) | | (1,988 | ) |
| Interest expense | | (1,282 | ) | | (1,312 | ) | | (3,804 | ) | | (3,987 | ) |
| Operating income before depreciation and amortization | | $ | 1,221 |
| | $ | 1,136 |
| | $ | 6,643 |
| | $ | 6,120 |
|
| Depreciation and amortization | | $ | 1,962 |
| | $ | 1,892 |
| | $ | 5,856 |
| | $ | 5,621 |
|
| Capital expenditures | | $ | 1,394 |
| | $ | 2,039 |
| | $ | 2,918 |
| | $ | 2,909 |
|
| | | | | | | | | |
AMERICAN CAMPUS COMMUNITIES, INC. AND SUBSIDIARIES
AMERICAN CAMPUS COMMUNITIES OPERATING PARTNERSHIP, L.P. AND SUBSIDIARIES
NOTES TO CONSOLIDATED FINANCIAL STATEMENTS
(unaudited)
| | | | | Three Months Ended
September 30, | | Nine Months Ended
September 30, | | Three Months Ended
September 30, | | Nine Months Ended
September 30, |
| | | 2017 | | 2016 | | 2017 | | 2016 | | 2018 | | 2017 | | 2018 | | 2017 |
| Development Services | | | |
| | |
| | |
| | |
|
| Development and construction management fees | | | $ | 835 |
| | $ | 3,566 |
| | $ | 3,883 |
| | $ | 4,697 |
|
| Operating expenses | | | (2,056 | ) | | (2,114 | ) | | (5,976 | ) | | (5,971 | ) |
| Operating (loss) income before depreciation and amortization | | | $ | (1,221 | ) | | $ | 1,452 |
| | $ | (2,093 | ) | | $ | (1,274 | ) |
| | | | | | | | | | |
| Property Management Services | | | |
| | |
| | |
| | |
|
| Property management fees from external customers | | | $ | 2,128 |
| | $ | 2,291 |
| | $ | 7,311 |
| | $ | 7,193 |
|
| Operating expenses | | | (1,775 | ) | | (1,765 | ) | | (5,597 | ) | | (5,818 | ) |
| Operating income before depreciation and amortization | | | $ | 353 |
| | $ | 526 |
| | $ | 1,714 |
| | $ | 1,375 |
|
| | | | | | | | | | | | | | | | | |
| Reconciliations | | |
| | |
| | |
| | |
| | |
| | |
| | |
| | |
|
| Total segment revenues and other income | | $ | 202,475 |
| | $ | 202,588 |
| | $ | 584,927 |
| | $ | 600,681 |
| | $ | 213,894 |
| | $ | 197,347 |
| | $ | 636,188 |
| | $ | 570,092 |
|
| Unallocated interest income earned on investments and corporate cash | | 850 |
| | 925 |
| | 2,515 |
| | 3,144 |
| | 849 |
| | 850 |
| | 2,489 |
| | 2,515 |
|
| Elimination of intersegment revenues | | (5,128 | ) | | (5,830 | ) | | (14,835 | ) | | (17,410 | ) | |
| Total consolidated revenues, including interest income | | $ | 198,197 |
| | $ | 197,683 |
| | $ | 572,607 |
| | $ | 586,415 |
| | $ | 214,743 |
| | $ | 198,197 |
| | $ | 638,677 |
| | $ | 572,607 |
|
| | | | | | | | | | | | | | | | | |
| Segment operating income before depreciation, amortization and allocation of corporate overhead | | $ | 88,919 |
| | $ | 85,648 |
| | $ | 299,056 |
| | $ | 290,742 |
| |
| Segment operating income before depreciation and amortization | | | $ | 88,336 |
| | $ | 84,941 |
| | $ | 310,051 |
| | $ | 285,339 |
|
| Depreciation and amortization | | (62,271 | ) | | (53,411 | ) | | (172,588 | ) | | (164,724 | ) | | (67,247 | ) | | (62,271 | ) | | (199,191 | ) | | (172,588 | ) |
| Net unallocated expenses relating to corporate interest and overhead | | (27,614 | ) | | (22,047 | ) | | (79,165 | ) | | (67,573 | ) | | (24,615 | ) | | (23,636 | ) | | (83,958 | ) | | (65,448 | ) |
| (Loss) gain from disposition of real estate | | — |
| | — |
| | (632 | ) | | 17,409 |
| |
| Gain (loss) from disposition of real estate | | | — |
| | — |
| | 42,314 |
| | (632 | ) |
| Other operating and nonoperating income | | | 570 |
| | — |
| | 3,218 |
| | — |
|
| Loss from early extinguishment of debt | | | — |
| | — |
| | (784 | ) | | — |
|
| Provision for real estate impairment | | — |
| | — |
| | (15,317 | ) | | — |
| | — |
| | — |
| | — |
| | (15,317 | ) |
| Income tax provision | | (267 | ) | | (345 | ) | | (791 | ) | | (1,035 | ) | | 219 |
| | (267 | ) | | (2,147 | ) | | (791 | ) |
| Net income | | $ | (1,233 | ) | | $ | 9,845 |
| | $ | 30,563 |
| | $ | 74,819 |
| |
| Net (loss) income | | | $ | (2,737 | ) | | $ | (1,233 | ) | | $ | 69,503 |
| | $ | 30,563 |
|
| | | | | | | | | | | | | | | | | |
| Total segment assets | | $ | 6,605,271 |
| | $ | 6,181,597 |
| | $ | 6,605,271 |
| | $ | 6,181,597 |
| |
| Unallocated corporate assets | | 81,620 |
| | 97,778 |
| | 81,620 |
| | 97,778 |
| |
| Total assets at September 30, | | $ | 6,686,891 |
| | $ | 6,279,375 |
| | $ | 6,686,891 |
| | $ | 6,279,375 |
| |
| | | | | | | | | | | | | | | | | |
| |
(1) | Net of capitalized interest and amortization of debt premiums. |
AMERICAN CAMPUS COMMUNITIES, INC. AND SUBSIDIARIES
AMERICAN CAMPUS COMMUNITIES OPERATING PARTNERSHIP, L.P. AND SUBSIDIARIES
NOTES TO CONSOLIDATED FINANCIAL STATEMENTS
(unaudited)
15. Subsequent Events
Distributions: On November 1, 2017,October 31, 2018, the Board of Directors of the Company declared a distribution per share of $0.44,$0.46, which will be paid on November 27, 201726, 2018 to all common stockholders of record as of November 13, 2017.12, 2018. At the same time, the Operating Partnership will pay an equivalent amount per unit to holders of Common OP Units, as well as the quarterly cumulative preferential distribution to holders of Preferred OP Units (see Note 9).
October 2017 Bond Offering: In October 2017, the Operating Partnership closed a $400 million offering of senior unsecured notes under its existing shelf registration. These 10-year notes were issued at 99.912 percent of par value with a coupon of 3.625 percent and a yield of 3.635 percent, and are fully and unconditionally guaranteed by the Company. Interest on the notes is payable semi-annually on May 15 and November 15, with the first payment beginning on May 15, 2018. The notes will mature on November 15, 2027. Net proceeds from the sale of the senior unsecured notes totaled approximately $395 million, after expenses, and were used to repay the outstanding balance of the Company’s revolving credit facility, with the remaining proceeds available to fund the development pipeline, acquisition activity and for general business purposes.
Property Acquisitions: In October 2017,2018, the Company acquired Bridges @ 11th,increased its investment in a 258-bed wholly-owned property located on university-owned land near the University of Washington campus.
Additionally, in October 2017, asjoint venture that is part of the Core Transaction the Company exercised an option to causeby $46.9 million (See Notes 3 and 13), and the joint venture partner in Core JV I to contribute Hub U District Seattle, a 248-bed property located nearpaid off approximately $40.2 million of construction debt with proceeds from the University of Washington campus, to the joint venture. The Company anticipates the closing of the contribution of the property to Core JV I to occur in the fourth quarter 2017 and the Company's initial investment in the property will be approximately $40.6 million.investment.
Item 2. Management’s Discussion and Analysis of Financial Condition and Results of Operations
Forward-looking Statements
This report contains forward-looking statements within the meaning of the federal securities laws. We caution investors that any forward-looking statements presented in this report, or which management may make orally or in writing from time to time, are based on management’s beliefs and assumptions made by, and information currently available to, management. When used, the words “anticipate,” “believe,” “expect,” “intend,” “may,” “might,” “plan,” “estimate,” ���project,“project,” “should,” “will,” “result” and similar expressions, do not relate solely to historical matters and are intended to identify forward-looking statements. Such statements are subject to risks, uncertainties and assumptions and may be affected by known and unknown risks, trends, uncertainties and factors that are beyond our control. Should one or more of these risks or uncertainties materialize, or should underlying assumptions prove incorrect, actual results may vary materially from those anticipated, estimated or projected. We caution you that forward-looking statements are not guarantees of future performance and will be impacted by actual events when they occur after we make such statements. We expressly disclaim any responsibility to update forward-looking statements, whether as a result of new information, future events or otherwise. Accordingly, investors should use caution in relying on past forward-looking statements, which are based on results and trends at the time they were made, to anticipate future results or trends.
Some of the risks and uncertainties that may cause our actual results, performance or achievements to differ materially from those expressed or implied by forward-looking statements include, among others, the following: general risks affecting the real estate industry; risks associated with changes in University admission or housing policies; risks associated with the availability and terms of financing and the use of debt to fund acquisitions and developments; failure to manage effectively our growth and expansion into new markets or to integrate acquisitions successfully; risks and uncertainties affecting property development and construction; risks associated with downturns in the national and local economies, volatility in capital and credit markets, increases in interest rates, and volatility in the securities markets; costs of compliance with the Americans with Disabilities Act and other similar laws; potential liability for uninsured losses and environmental contamination; risks associated with our Company’s potential failure to qualify as a REIT under the Internal Revenue Code of 1986 (the “Code”), as amended, and possible adverse changes in tax and environmental laws; and the other factors discussed in the “Risk Factors” contained in Item 1A of our Form 10-K for the year ended December 31, 2016.2017.
Our Company and Our Business
Overview
American Campus Communities, Inc. (“ACC”) is a real estate investment trust (“REIT”) that commenced operations effective with the completion of an initial public offering (“IPO”) on August 17, 2004. Through ACC’s controlling interest in American Campus Communities Operating Partnership, L.P. (“ACCOP”), ACC is one of the largest owners, managers and developers of high quality student housing properties in the United States in terms of beds owned and under management. ACC is a fully integrated, self-managed and self-administered equity REIT with expertise in the acquisition, design, financing, development, construction management, leasing and management of student housing properties. ACC’s common stock is publicly traded on the New York Stock Exchange (“NYSE”) under the ticker symbol “ACC.” References to the “Company,” “we,” “us” or “our” mean collectively ACC, ACCOP and those entities/subsidiaries owned or controlled by ACC and/or ACCOP. References to the “Operating Partnership” mean collectively ACCOP and those entities/subsidiaries owned or controlled by ACCOP. Unless otherwise indicated, the accompanying discussion applies to both the Company and the Operating Partnership.
Property Portfolio
As of September 30, 2017,2018, our total owned property portfolio contained 166168 properties, consisting of owned off-campus student housing properties that are in close proximity to colleges and universities, American Campus Equity (“ACE®”) properties operated under ground/facility leases with university systems, and on-campus participating properties operated under ground/facility leases with the related university systems. Of the 166168 properties, 125 were under development as of September 30, 2017.2018. Our communities contain modern housing units and are supported by a resident assistant system and other student-oriented programming, with many offering resort-style amenities.
As of September 30, 2017,2018, through ACC’s taxable REIT subsidiary (“TRS”) entities, we provided third-party management and leasing services for 3834 properties, bringing our total owned and third-party managed portfolio to 204202 properties. Third-party management and leasing services are typically provided pursuant to management contracts that have initial terms that range from one to five years.
Leasing Results
During the third quarter, we finalized our annual leasing process for the 2017/2018 academic year. As of September 30, 2017, occupancy at our 2018 same store properties was 96.6% at a rental rate increase of 2.9% compared to the prior academic year. Our 2018 same store property portfolio consists of properties owned and operating for both of the entire years ended December 31, 2017 and 2018, which are not conducting or planning to conduct substantial development, redevelopment, or repositioning activities, and are not classified as held for sale. Including our 2017 acquisitions and development deliveries, our total wholly-owned portfolio was 95.5% occupied as of September 30, 2017.
Below is a summary of our property portfolio as of September 30, 2017:2018:
| | | Property portfolio: | | Properties | | Beds | | Properties | | Beds |
| Wholly-owned operating properties: | | | | | |
| Owned operating properties: | | | | | |
| Off-campus properties | | 124 |
| | 70,248 |
| | 128 |
| | 71,856 |
|
On-campus ACE (1) | | 25 |
| | 18,847 |
| | 30 |
| | 23,393 |
|
| Subtotal – operating properties | | 149 |
| | 89,095 |
| | 158 |
| | 95,249 |
|
| | | | | | | | | |
| Wholly-owned properties under development: | | |
| | |
| |
| Owned properties under development: | | | |
| | |
|
| Off-campus properties | | 6 |
| | 2,935 |
| | 3 |
| | 1,278 |
|
On-campus ACE | | 6 |
| | 5,371 |
| | 2 |
| | 1,881 |
|
| Subtotal – properties under development | | 12 |
| | 8,306 |
| | 5 |
| | 3,159 |
|
| | | | | | | | | |
| Total wholly-owned properties | | 161 |
| | 97,401 |
| |
| Total owned properties | | | 163 |
| | 98,408 |
|
| | | | | | | | | |
| On-campus participating properties | | 5 |
| | 5,086 |
| | 5 |
| | 5,086 |
|
| | | | | | | | | |
| Total owned property portfolio | | 166 |
| | 102,487 |
| | 168 |
| | 103,494 |
|
| | | | | | | | | |
| Managed properties | | 38 |
| | 28,770 |
| | 34 |
| | 28,361 |
|
| Total property portfolio | | 204 |
| | 131,257 |
| | 202 |
| | 131,855 |
|
| | | | | | | | | |
| |
(1) | Includes three properties at Prairie View A&M University that we ultimately expect to be refinanced under the existing on-campus participating structure. |
Owned development activityLeasing Results
Recently completed projects: Our financial results for the 2018 calendar year are significantly impacted by the results of our annual leasing process for the 2017/2018 and the 2018/2019 academic years. As of September 30, 2017, the beginning of the 2017/2018 academic year, occupancy at our 2018 same store properties was 96.6% at a rental rate increase of 2.9% compared to the prior academic year, and occupancy at our total owned property portfolio (including 2017 acquisitions and development deliveries) was 95.4%. As of September 30, 2018, the beginning of the 2018/2019 academic year, occupancy at our 2018 same store properties was 97.0%, and occupancy at our total owned property portfolio (including 2017 acquisitions and 2017 and 2018 development deliveries) was also 97.0%.
Development
In the third quarter of 2017,2018, the final stages of construction were completed on threefive on-campus ACE properties and sevenone owned off-campus properties.property. These properties are summarized in the following table:
Owned Development Projects Recently Completed:
|
| | | | | | | | | | | | | | | |
Project | | Project Type | | Location | | Primary University Served | | Beds | | Total Project Cost | | Opened for Occupancy |
| | | | | | | | | | | | | |
| Tooker House | | ACE | | Tempe, AZ | | Arizona State University | | 1,594 |
| | $ | 105,500 |
| | August 2017 |
| Sky View | | ACE | | Flagstaff, AZ | | Northern Arizona University | | 626 |
| | 58,200 |
| | August 2017 |
| University Square | | ACE | | Prairie View, TX | | Prairie View A&M University | | 466 |
| | 25,900 |
| | August 2017 |
| U Centre on Turner | | Off-campus | | Columbia, MO | | University of Missouri | | 718 |
| | 69,600 |
| | August 2017 |
| U Pointe on Speight | | Off-campus | | Waco, TX | | Baylor University | | 700 |
| | 51,800 |
| | August 2017 |
| 21Hundred @ Overton Park | | Off-campus | | Lubbock, TX | | Texas Tech University | | 1,204 |
| | 82,700 |
| | August 2017 |
| Suites at 3rd | | Off-campus | | Champaign, IL | | University of Illinois | | 251 |
| | 25,200 |
| | August 2017 |
| U Club Binghamton Phase II | | Off-campus | | Binghamton, NY | | SUNY Binghamton University | | 562 |
| | 56,900 |
| | August 2017 |
| Callaway House Apartments | | Off-campus | | Norman, OK | | University of Oklahoma | | 915 |
| | 90,700 |
| | August 2017 |
| U Centre on College | | Off-campus | | Clemson, SC | | Clemson University | | 418 |
| | 42,700 |
| | August 2017 |
| TOTAL – 2017 DELIVERIES | | 7,454 |
| | $ | 609,200 |
| | |
|
| | | | | | | | | | | | | | |
Project | | Location | | Primary University Served | | Project Type | | Beds | | Total Project Costs | | Opened for Occupancy |
| | | | | | | | | | | | | |
| | | | | | | | | | | | | |
| Gladding Residence Center | | Richmond, VA | | Virginia Commonwealth University | | ACE | | 1,524 | | $ | 94,700 |
| | August 2018 |
| Irvington House | | Indianapolis, IN | | Butler University | | ACE | | 648 | | 36,300 |
| | August 2018 |
| Greek Leadership Village | | Tempe, AZ | | Arizona State University | | ACE | | 957 | | 69,600 |
| | August 2018 |
| David Blackwell Hall | | Berkeley, CA | | University of California, Berkeley | | ACE | | 781 | | 97,800 |
| | August 2018 |
| NAU Honors College | | Flagstaff, AZ | | Northern Arizona University | | ACE | | 636 | | 42,600 |
| | August 2018 |
| U Club Townhomes | | Oxford, MS | | University of Mississippi | | Off-campus | | 528 | | 46,300 |
| | August 2018 |
| | | | | | | | | | | | | |
| | | 5,074 | | $ | 387,300 |
| | |
Projects under construction:
At September 30, 2017,2018, we were in the process of constructing sixtwo on-campus ACE properties and one owned off-campus properties and six on-campus ACE properties.property. These properties are summarized in the table below:
Owned Development Projects Under Construction:
|
| | | | | | | | | | | | | | | | | | | |
Project | | Project Type | |
Location | |
Primary University Served | | Beds | | Estimated Project Cost | | Total Costs Incurred | | Scheduled Completion |
| | | | | | | | | | | | | | | |
| Gladding Residence Center | | ACE | | Richmond, VA | | Virginia Commonwealth Univ. | | 1,524 |
| | $ | 95,700 |
| | $ | 60,215 |
| | August 2018 |
| Irvington House | | ACE | | Indianapolis, IN | | Butler University | | 648 |
| | 38,900 |
| | 16,656 |
| | August 2018 |
| Greek Leadership Village | | ACE | | Tempe, AZ | | Arizona State University | | 957 |
| | 69,600 |
| | 24,032 |
| | August 2018 |
| Bancroft Residence Hall | | ACE | | Berkeley, CA | | University of California, Berkeley | | 781 |
| | 98,700 |
| | 44,570 |
| | August 2018 |
| NAU Honors College | | ACE | | Flagstaff, AZ | | Northern Arizona University | | 636 |
| | 43,400 |
| | 15,037 |
| | August 2018 |
| U Club Townhomes | | Off-campus | | Oxford, MS | | University of Mississippi | | 528 |
| | 44,300 |
| | 16,960 |
| | August 2018 |
The Edge - Stadium Centre (1) | | Off-campus | | Tallahassee, FL | | Florida State University | | 412 |
| | 42,600 |
| | 16,045 |
| | August 2018 |
| | | | | | | | | 5,486 |
| | $ | 433,200 |
| | $ | 193,515 |
| | |
Core Spaces / DRW Portfolio (2) | | | | | | | | | | | | | | |
| Hub Ann Arbor | | Off-campus | | Ann Arbor, MI | | University of Michigan | | | | | | | | September 2018 |
| Hub Flagstaff | | Off-campus | | Flagstaff, AZ | | Northern Arizona University | | | | | | | | September 2018 |
| Hub West Lafayette | | Off-campus | | West Lafayette, IN | | Purdue University | | | | | | | | September 2018 |
| | | | | | | | | 1,500 |
| | $ | 240,000 |
| | $ | 63,957 |
| | |
| SUBTOTAL – 2018 DELIVERIES | | 6,986 |
| | $ | 673,200 |
| | $ | 257,472 |
| | |
| | | | | | | | | | | | | | | |
| Columbus Avenue Student Apts. | | ACE | | Boston, MA | | Northeastern University | | 825 |
| | $ | 153,400 |
| | $ | 30,753 |
| | August 2019 |
| 191 College | | Off-campus | | Auburn, AL | | Auburn University | | 495 |
| | 59,300 |
| | 11,516 |
| | July 2019 |
| SUBTOTAL – 2019 DELIVERIES | | 1,320 |
| | $ | 212,700 |
| | $ | 42,269 |
| | |
| | | | | | | | | | | | | | | |
| TOTAL – ALL PROJECTS | | 8,306 |
| | $ | 885,900 |
| | $ | 299,741 |
| | |
| | | | | | | | | | | | | | | |
|
| | | | | | | | | | | | | | | | | | |
Project | |
Location | |
Primary University Served | | Project Type | | Beds | | Estimated Project Cost | | Total Costs Incurred | | Scheduled Occupancy |
| | | | | | | | | | | | | | | |
| 191 College | | Auburn, AL | | Auburn University | | Off-campus | | 495 | | $ | 59,300 |
| | $ | 30,848 |
| | July 2019 |
| Columbus Avenue Student Apts. | | Boston, MA | | Northeastern University | | ACE | | 825 | | 153,400 |
| | 97,662 |
| | August 2019 |
| University of Arizona Honors College | | Tucson, AZ | | University of Arizona | | ACE | | 1,056 | | 84,700 |
| | 35,973 |
| | August 2019 |
| SUBTOTAL – 2019 DELIVERIES | | 2,376 | | $ | 297,400 |
| | $ | 164,483 |
| | |
| | | | | | | | | | | | | | | |
Presale Development Projects:
Under the terms of a presale transaction, the Company is obligated to purchase the property as long as certain construction completion deadlines and other closing conditions are met. The Company is responsible for leasing, management, and initial operations of the project while the third-party developer retains development risk during the construction period. In accordance with accounting guidance, the Company includes presale properties in its consolidated financial statements upon execution of the presale agreement with the developer.
Presale Development Projects Recently Completed:
|
| | | | | | | | | | | | | | |
Project | | Location | | Primary University Served | | Project Type | | Beds | | Purchase Price | | Opened for Occupancy |
| | | | | | | | | | | | | |
| The Edge - Stadium Centre | | Tallahassee, FL | | Florida State University | | Off-campus | | 412 | | $ | 42,600 |
| | August 2018 |
Core Spaces / DRW Portfolio (1) | | | | | | | | | | | | |
| Hub Ann Arbor | | Ann Arbor, MI | | University of Michigan | | Off-campus | | | | | | August 2018 |
| Hub Flagstaff | | Flagstaff, AZ | | Northern Arizona University | | Off-campus | | | | | | August 2018 |
| Hub West Lafayette | | West Lafayette, IN | | Purdue University | | Off-campus | | | | | | August 2018 |
| | | | | | | | | 1,500 | | 240,000 |
| | |
| | | | | | | | | | | | | |
| | | 1,912 | | $ | 282,600 |
| | |
(1) In December 2016, we entered into a pre-sale agreement to purchase The Edge - Stadium Centre, a property which is scheduled to be completed in August 2018. The estimated project cost includes the purchase price, elected upgrades and transaction costs.
(2) The companyCompany funded an initial investment of $24.2 million through a joint venture with Core Spaces/DRW Real Estate Investments in August 2017. Including the initial investment, the company expects to invest a total of $240 million over a two year period. Refer to Note 3 in the accompanying Notes to the Consolidated Financial Statements contained in Item 1.
Acquisitions and Joint Venture Investments
As discussed in more detail in Notes 3 and 9 in the accompanying Notes to the Consolidated Financial Statements contained in Item 1, duringIn the third quarter of 2017 we executed2018, the assets held by the joint venture were delivered and the Company increased its investment by $83.7 million. Subsequent to quarter end, an agreementadditional investment of $46.9 million was made. The Company expects to acquire a portfolio of seven student housing properties from affiliates of Core Spaces and DRW Real Estate Investments (the “Core Transaction”). The transaction includedexercise its option to purchase the purchase of 100% of theremaining ownership interests in two operatingthe properties in the purchasethird quarter of partial ownership interests in two operating properties through a joint venture arrangement (with one property being2019 for an amount to be determined by fair market value, which is expected to approximate $85.2 million, and is subject to a purchase option that had not been exercised as of September 30, 2017),adjustment based on stabilized property tax assessments and the purchase of partial ownership interests in three in-process development properties through a joint venture arrangement. In total, the Core Transaction properties contain 3,776 beds. The initial investment made at closing was $265.4 million, and the Company expects to invest a total of $590.6 million over a two year period including the initial investment.various earn-out adjustments.
Presale Development Projects Under Construction:
During the nine months ended September 30, 2017,2018, the Company acquiredentered into presale agreements to purchase two additional wholly-owned properties containing 982 beds for approximately $158.5 million.owned properties. Refer to Note 3 in the accompanying Notes to Consolidated Financial Statements contained in Item 1 for a more detailed discussion of our recent acquisitionpresale development activity. As of September 30, 2018, our presale development pipeline consisted of the following properties:
|
| | | | | | | | | | | | | | | | | | |
Project | |
Location | |
Primary University Served | | Project Type | |
Beds | | Purchase Price | | Amount Funded as of September 30, 2018 | | Scheduled Occupancy |
| | | | | | | | | | | | | | | |
| The Flex at Stadium Centre | | Tallahassee, FL | | Florida State University | | Off-campus | | 340 | | $ | 36,700 |
| | $ | 353 |
| | August 2019 |
959 Franklin (1) | | Eugene, OR | | University of Oregon | | Off-campus | | 443 | | 70,600 |
| | 16,939 |
| | September 2019 |
| SUBTOTAL – 2019 DELIVERIES | | 783 | | $ | 107,300 |
| | $ | 17,292 |
| | |
(1) As part of the presale agreement, the Company provided $15.6 million of mezzanine financing to the project.
Joint Venture Activity
As discussed in more detail in Note 4 in the accompanying Notes to the Consolidated Financial Statements contained in Item 1, in May 2018 we executed an agreement to enter into a joint venture arrangement with Allianz Real Estate the “ACC / Allianz Joint Venture Transaction.” The transaction included the sale of a partial ownership interest in a portfolio of seven owned properties, containing 4,611 beds, through a joint venture arrangement. The joint venture transaction involved the joint venture partner making a cash contribution of approximately $373.1 million in exchange for a 45% ownership interest. As part of the transaction, the joint venture issued $330 million of secured mortgage debt. The joint venture will pay the Company a property management fee of 4% of total revenues and a 0.25% asset management fee on total invested equity net of debt. In addition, the Company and the joint venture partner will receive periodic distributions of operating cash flow in accordance to their proportionate ownership interests.
Dispositions
During the nine months ended September 30, 2017,2018, the Company sold one wholly-owned propertya portfolio of three owned properties for approximately $25.0$245.0 million. Refer to Note 4 in the accompanying Notes to Consolidated Financial Statements contained in Item 1 for a more detailed discussion of our recent disposition activity.
Third-Party Development Services
Through ACC’s TRS entities, we provide development and construction management services for student housing properties owned by colleges and universities, charitable foundations and others. During the third quarter 2017 we completed, delivered and
commenced management of Momentum Village Phase II, a 560-bed third party development project on the campus of Texas A&M University Corpus Christi, and Esperanza Hall, a 382-bed third party development project on the campus of Texas A&M University San Antonio. As of September 30, 2017,2018, we were under contract on onefour third-party development projectprojects that isare currently under construction and whose fees total $5.9$15.9 million. As of September 30, 2017,2018, fees of approximately $3.0$5.3 million remained to be earned by the Company with respect to this project,these projects, which has ahave scheduled completion datedates in July and August 2019.
Results of Operations
Comparison of the Three Months Ended September 30, 20172018 and September 30, 20162017
The following table presents our results of operations for the three months ended September 30, 20172018 and 2016,2017, including the amount and percentage change in these results between the two periods.
| | | | | Three Months Ended
September 30, | | | | | | Three Months Ended
September 30, | | | | |
| | | 2017 | | 2016 | | Change ($) | | Change (%) | | 2018 | | 2017 | | Change ($) | | Change (%) |
| Revenues | | | | | | | | | | | | | | | | |
| Wholly-owned properties | | $ | 183,569 |
| | $ | 185,694 |
| | $ | (2,125 | ) | | (1.1 | )% | |
| Owned properties | | | $ | 202,834 |
| | $ | 183,569 |
| | $ | 19,265 |
| | 10.5 | % |
| On-campus participating properties | | 6,799 |
| | 6,758 |
| | 41 |
| | 0.6 | % | | 6,980 |
| | 6,799 |
| | 181 |
| | 2.7 | % |
| Third-party development services | | 3,566 |
| | 773 |
| | 2,793 |
| | 361.3 | % | | 835 |
| | 3,566 |
| | (2,731 | ) | | (76.6 | )% |
| Third-party management services | | 2,291 |
| | 2,376 |
| | (85 | ) | | (3.6 | )% | | 2,128 |
| | 2,291 |
| | (163 | ) | | (7.1 | )% |
| Resident services | | 713 |
| | 810 |
| | (97 | ) | | (12.0 | )% | | 692 |
| | 713 |
| | (21 | ) | | (2.9 | )% |
| Total revenues | | 196,938 |
| | 196,411 |
| | 527 |
| | 0.3 | % | | 213,469 |
| | 196,938 |
| | 16,531 |
| | 8.4 | % |
| | | | | | | | | | | | | | | | | |
| Operating expenses | | |
| | |
| | |
| | |
| |
| Wholly-owned properties | | 99,423 |
| | 100,602 |
| | (1,179 | ) | | (1.2 | )% | |
| Operating expenses (income) | | | |
| | |
| | |
| | |
|
| Owned properties | | | 107,997 |
| | 99,423 |
| | 8,574 |
| | 8.6 | % |
| On-campus participating properties | | 3,923 |
| | 3,784 |
| | 139 |
| | 3.7 | % | | 3,875 |
| | 3,923 |
| | (48 | ) | | (1.2 | )% |
| Third-party development and management services | | 3,879 |
| | 3,340 |
| | 539 |
| | 16.1 | % | | 3,831 |
| | 3,879 |
| | (48 | ) | | (1.2 | )% |
| General and administrative | | 8,684 |
| | 5,375 |
| | 3,309 |
| | 61.6 | % | | 7,183 |
| | 8,684 |
| | (1,501 | ) | | (17.3 | )% |
| Depreciation and amortization | | 61,125 |
| | 52,067 |
| | 9,058 |
| | 17.4 | % | | 66,131 |
| | 61,125 |
| | 5,006 |
| | 8.2 | % |
| Ground/facility leases | | 2,329 |
| | 1,965 |
| | 364 |
| | 18.5 | % | | 2,951 |
| | 2,329 |
| | 622 |
| | 26.7 | % |
| Total operating expenses | | 179,363 |
| | 167,133 |
| | 12,230 |
| | 7.3 | % | | 191,968 |
| | 179,363 |
| | 12,605 |
| | 7.0 | % |
| | | | | | | | | | | | | | | | | |
| Operating income | | 17,575 |
| | 29,278 |
| | (11,703 | ) | | (40.0 | )% | | 21,501 |
| | 17,575 |
| | 3,926 |
| | 22.3 | % |
| | | | | | | | | | | | | | | | | |
| Nonoperating income and (expenses) | | |
| | |
| | |
| | |
| |
| Nonoperating income (expenses) | | | |
| | |
| | |
| | |
|
| Interest income | | 1,259 |
| | 1,272 |
| | (13 | ) | | (1.0 | )% | | 1,274 |
| | 1,259 |
| | 15 |
| | 1.2 | % |
| Interest expense | | (18,654 | ) | | (19,016 | ) | | 362 |
| | (1.9 | )% | | (25,185 | ) | | (18,654 | ) | | (6,531 | ) | | 35.0 | % |
| Amortization of deferred financing costs | | (1,146 | ) | | (1,344 | ) | | 198 |
| | (14.7 | )% | | (1,116 | ) | | (1,146 | ) | | 30 |
| | (2.6 | )% |
| Total nonoperating expense | | (18,541 | ) | | (19,088 | ) | | 547 |
| | (2.9 | )% | |
| Other nonoperating income | | | 570 |
| | — |
| | 570 |
| | 100.0 | % |
| Total nonoperating expenses | | | (24,457 | ) | | (18,541 | ) | | (5,916 | ) | | 31.9 | % |
| | | | | | | | | | | | | | | | | |
| (Loss) income before income taxes | | (966 | ) | | 10,190 |
| | (11,156 | ) | | (109.5 | )% | |
| Loss before income taxes | | | (2,956 | ) | | (966 | ) | | (1,990 | ) | | 206.0 | % |
| Income tax provision | | (267 | ) | | (345 | ) | | 78 |
| | (22.6 | )% | | 219 |
| | (267 | ) | | 486 |
| | (182.0 | )% |
| | | | | | | | | | | | | | | | | |
| Net (loss) income | | (1,233 | ) | | 9,845 |
| | (11,078 | ) | | (112.5 | )% | |
| Net loss | | | (2,737 | ) | | (1,233 | ) | | (1,504 | ) | | 122.0 | % |
| | | | | | | | | | | | | | | | | |
| Net income attributable to noncontrolling interests | | (79 | ) | | (201 | ) | | 122 |
| | (60.7 | )% | |
Net (loss) income attributable to ACC, Inc. and Subsidiaries common stockholders | | $ | (1,312 | ) | | $ | 9,644 |
| | $ | (10,956 | ) | | (113.6 | )% | |
| Net loss (income) attributable to noncontrolling interests | | | 392 |
| | (79 | ) | | 471 |
| | (596.2 | )% |
| Net loss attributable to ACC, Inc. and Subsidiaries common stockholders | | | $ | (2,345 | ) | | $ | (1,312 | ) | | $ | (1,033 | ) | | 78.7 | % |
Same Store and New Property Operations
We define our same store property portfolio as wholly-ownedowned properties that were owned and operating for both of the full years ended December 31, 20172018 and December 31, 2016,2017, which are not conducting or planning to conduct substantial development, redevelopment, or repositioning activities, and are not classified as held for sale as of September 30, 2017.2018.
Same store revenues are defined as revenues generated from our same store portfolio and consist of rental revenue earned from student leases as well as other income items such as utility income, damages, parking income, summer conference rent, application and administration fees, income from retail tenants, and income earned by one of our TRS entities from ancillary activities such as the provision of food services.
Same store operating expenses are defined as operating expenses generated from our same store portfolio and include usual and customary expenses incurred to operate a property such as payroll, maintenance, utilities, marketing, general and administrative costs, insurance, property taxes, and bad debt. Same store operating expenses also include an allocation of payroll and other administrative costs related to corporate management and oversight.
A reconciliation of our same store, new property and sold/held for saleother property operations to our consolidated statements of comprehensive income is set forth below:
| | | | | Same Store Properties | | New Properties | | Sold/Held for Sale Properties (1) | | Total - All Properties | | Same Store Properties | | New Properties | | Sold Properties/Other(1) | | Total - All Properties |
| | | Three Months Ended
September 30, | | Three Months Ended
September 30, | | Three Months Ended
September 30, | | Three Months Ended
September 30, | | Three Months Ended
September 30, | | Three Months Ended
September 30, | | Three Months Ended
September 30, | | Three Months Ended
September 30, |
| | | 2017 | | 2016 | | 2017 | | 2016 | | 2017 (2) | | 2016 (3) | | 2017 | | 2016 | | 2018 | | 2017 | | 2018 | | 2017 | | 2018 (2) | | 2017 (3) | | 2018 | | 2017 |
Number of properties (4) | | 124 |
| | 124 |
| | 24 |
| | 8 |
| | 1 |
| | 22 |
| | 149 |
| | 154 |
| | 130 |
| | 130 |
| | 27 |
| | 15 |
| | 1 |
| | 4 |
| | 158 |
| | 149 |
|
Number of beds (4) | | 73,871 |
| | 73,871 |
| | 14,364 |
| | 3,737 |
| | 860 |
| | 13,600 |
| | 89,095 |
| | 91,208 |
| | 76,433 |
| | 76,433 |
| | 17,956 |
| | 10,464 |
| | 860 |
| | 2,198 |
| | 95,249 |
| | 89,095 |
|
| | | | | | | | | | | | | | | | | | | | | | | | | | | | | | | | | |
Revenues (5) | | $ | 162,776 |
| | $ | 160,636 |
| | $ | 20,637 |
| | $ | 4,187 |
| | $ | 869 |
| | $ | 21,681 |
| | $ | 184,282 |
| | $ | 186,504 |
| | $ | 170,103 |
| | $ | 166,786 |
| | $ | 32,684 |
| | $ | 12,023 |
| | $ | 739 |
| | $ | 5,473 |
| | $ | 203,526 |
| | $ | 184,282 |
|
| Operating expenses | | 87,902 |
| | 85,126 |
| | 11,232 |
| | 2,242 |
| | 289 |
| | 13,234 |
| | 99,423 |
| | 100,602 |
| | 89,771 |
| | 89,931 |
| | 17,375 |
| | 7,299 |
| | 851 |
| | 2,193 |
| | 107,997 |
| | 99,423 |
|
| |
(1) | Does not include the allocation of payroll and other administrative costs related to corporate management and oversight. |
| |
(2) | Includes one property currently in receivership that is in the process of being transferred to the lender in settlement of the property’s $27.4 million mortgage loan that matured in August 2017. Also includes recurring professional fees related to the formation and operation of the ACC / Allianz Joint Venture Transaction. |
| |
(3) | Includes properties sold in 20162018 and 2017, and one property that is in the process of being transferred to the lender as discussed above. |
| |
(4) | Does not include properties under construction or undergoing redevelopment. |
| |
(5) | Includes revenues which are reflected as resident services revenue on the accompanying consolidated statements of comprehensive income. |
Same Store Properties: The increase in revenue from our same store properties was primarily due to an increase in average rental rates for the 2017/20182018/2019 academic year, partially offset by a decrease in our weighted average occupancy from 92.2%91.4% during the three months ended September 30, 20162017 to 91.9%90.7% during the three months ended September 30, 2017.2018. Future revenues will be dependent on our ability to maintain our current leases in effect for the 2017/20182018/2019 academic year and our ability to obtainachieve appropriate rental rates and desired occupancy levels for the 2018/20192019/2020 academic year at our various properties.
The increaseslight decrease in operating expenses from our same store properties was primarily due to: (i) an increaseto a decrease in repairs and maintenance expense of approximately $1.9 millionexpenses due to costs incurred during the three months ended September 30, 2017 related to cleanup and repairs for water intrusion, roofing, and landscaping at the Company’s communities located in Florida and Texas, as a result of hurricanes Harvey and Irma; (ii)hurricanes. This decrease was mostly offset by an increase in property taxes and related consulting fees due to increased property tax assessments in various markets; and (iii) other general inflationary factors.taxes. We anticipate that operating expenses for our same store property portfolio for 20172018 will increase, as compared to 2016 as a result2017, at inflationary levels except in the cases of the reasons discussed above.property taxes, where we have experienced higher tax assessment levels, and marketing due to our efforts to achieve our leasing targets.
New Property Operations: Our new properties for the three and nine months ended September 30, 20172018 are summarized in the table below:
|
| | | | | | | | |
| Property | | Location | | Primary University Served | | Beds | | Acquisition/ Opening Date |
| Acquisitions: | | | | | | | | |
University Crossings | | Charlotte, NC | | University of North Carolina | | 546 | | August 2016 |
U Point | | Syracuse, NY | | Syracuse University | | 163 | | October 2016 |
| The Arlie | | Arlington, TX | | University of Texas at Arlington | | 598 | | April 2017 |
| TWELVE at U District | | Seattle, WA | | University of Washington | | 384 | | June 2017 |
Hub EugeneThe 515 | | Eugene, OR | | University of Oregon | | 513 | | August 2017 |
| State | | Fort Collins, CO | | Colorado State University | | 665 | | August 2017 |
The James (1) | | Madison, WI | | University of Wisconsin - Madison | | 850 | | September 2017 |
| Bridges @ 11th | | Seattle, WA | | University of Washington | | 258 | | October 2017 |
Hub U District Seattle (1) | | Seattle, WA | | University of Washington | | 248 | | November 2017 |
| | | | | SUBTOTAL - Acquisitions | | 3,7193,516 | | |
| Owned Developments: | | | | | | | | |
Currie Hall | | Los Angeles, CA | | University of Southern California | | 456 | | August 2016 |
Fairview House | | Indianapolis, IN | | Butler University | | 633 | | August 2016 |
University Pointe | | Louisville, KY | | University of Louisville | | 531 | | August 2016 |
U Club on 28th | | Boulder, CO | | University of Colorado | | 398 | | August 2016 |
U Club Sunnyside | | Morgantown, WV | | West Virginia University | | 534 | | August 2016 |
The Court at Stadium Centre | | Tallahassee, FL | | Florida State University | | 260 | | August 2016 |
Merwick Stanworth Phase II | | Princeton, NJ | | Princeton University | | 379 | | September 2016 |
| Tooker House | | Tempe, AZ | | Arizona State University | | 1,594 | | August 2017 |
| Sky View | | Flagstaff, AZ | | Northern Arizona University | | 626 | | August 2017 |
| University Square | | Prairie View, TX | | Prairie View A&M University | | 466 | | August 2017 |
| U Centre on Turner | | Columbia, MO | | University of Missouri | | 718 | | August 2017 |
| U Pointe on Speight | | Waco, TX | | Baylor University | | 700 | | August 2017 |
| 21Hundred @ Overton Park | | Lubbock, TX | | Texas Tech University | | 1,204 | | August 2017 |
| Suites at 3rd | | Champaign, IL | | University of Illinois | | 251 | | August 2017 |
| U Club Binghamton Phase II | | Binghamton, NY | | SUNY Binghamton University | | 562 | | August 2017 |
| Callaway House Apartments | | Norman, OK | | University of Oklahoma | | 915 | | August 2017 |
| U Centre on College | | Clemson, SC | | Clemson University | | 418 | | August 2017 |
| Gladding Residence Center | | Richmond, VA | | Virginia Commonwealth University | | 1,524 | | August 2018 |
| Irvington House | | Indianapolis, IN | | Butler University | | 648 | | August 2018 |
| Greek Leadership Village | | Tempe, AZ | | Arizona State University | | 957 | | August 2018 |
| David Blackwell Hall | | Berkeley, CA | | University of California, Berkeley | | 781 | | August 2018 |
| NAU Honors College | | Flagstaff, AZ | | Northern Arizona University | | 636 | | August 2018 |
| U Club Townhomes | | Oxford, MS | | University of Mississippi | | 528 | | August 2018 |
| The Edge - Stadium Centre | | Tallahassee, FL | | Florida State University | | 412 | | August 2018 |
Hub Ann Arbor (1) | | Ann Arbor, MI | | University of Michigan | | 310 | | August 2018 |
Hub Flagstaff (1) | | Flagstaff, AZ | | Northern Arizona University | | 591 | | August 2018 |
Hub West Lafayette (1) | | West Lafayette, IN | | Purdue University | | 599 | | August 2018 |
| | | | | SUBTOTAL - Owned Developments | | 10,64514,440 | | |
| | | | | Total - New Properties | | 14,36417,956 | | |
| |
(1) | The James is a propertyProperties are held by atwo joint ventureventures formed as part of the Core Transaction. Refer to Note 3 in the accompanying Notes to the Consolidated Financial Statements contained in Item 1. |
On-Campus Participating Properties (“OCPP”) Operations
Same Store OCPP Properties: We had five participating properties containing 5,086 beds which were operating during the three months ended September 30, 2018, and 2017. Revenues from these properties increased from $6.8 million during the three months ended September 30, 2017, to $7.0 million during the three months ended September 30, 2018. The increase was due to an increase in average rental rates for the 2018/2019 academic year in addition to a slight increase in average occupancy from 57.3% for the three months ended September 30, 2017, to 57.4% for the three months ended September 30, 2018. Occupancy at our on-campus participating properties is low during the summer months due to the expiration of the 9-month leases concurrent with the end of the spring semester. Operating expenses at these properties remained constant at $3.9 million for the comparable three month periods. Future revenues will be dependent on our ability to maintain our current leases in effect for the 2018/2019 academic year and our ability to obtain appropriate rental rates and desired occupancy for the 2019/2020 academic year. We anticipate that operating expenses for our on-campus participating properties for 2018 will increase slightly, as compared to 2017, as a result of general inflation.
Third-Party Development Services Revenue
Third-party development services revenue increaseddecreased by approximately $2.8 million, from $0.8$3.6 million during the three months ended September 30, 20162017, to $3.6$0.8 million for the three months ended September 30, 2017.2018. This increasedecrease was primarily due to the closing of bond financing and commencement of construction of a fourth phase at the University of California, Irvine during the third quarter 2017. This projectthree months ended September 30, 2017, which contributed approximately $2.9 million in revenue during the three months ended September 30, 2017.revenue.
Development services revenues are dependent on our ability to successfully be awarded such projects, the amount of the contractual fee related to the project and the timing and completion of the development and construction of the project. In addition, to the extent projects are completed under budget, we may be entitled to a portion of such savings, which are recognized as revenue when performance has been agreed upon by all parties, or when performance has been verified by an independent third-party. It is possible that projects for which we have deferred pre-development costs will not close and that we will not be reimbursed for such costs. The pre-development costs associated therewith will ordinarily be charged against income for the then-current period. We anticipate third-party development services revenue to increasedecrease in 20172018, as compared to 2016 as2017, due to a resultdecrease in the volume and timing of the closing and commencement of construction of additional anticipated third-party development projects. However, the commencement of such projects is highly dependent on final determination of feasibility, negotiation, procurement rulesanticipated to close and other applicable law, fluctuationscommence construction in the construction and financing markets, and the availability of project financing.2018.
Third-Party Development and Management Services Expenses
Third-party development and management services expenses increased by approximately $0.6 million, from $3.3 million during the three months ended September 30, 2016 to $3.9 million for the three months ended September 30, 2017. This increase was due to an increase in payroll and other administrative costs related to corporate management and oversight, an increase in the level of pursuits of potential on-campus development projects, and general inflation. We anticipate third-party development and management services expenses will increase in 2017 as compared to 2016 for the reasons discussed above.
General and Administrative
General and administrative expenses increased bydecreased approximately $3.3$1.5 million, from $5.4$8.7 million during the three months ended September 30, 20162017, to $8.7$7.2 million for the three months ended September 30, 2017. This increase was primarily due to the following: (i)2018. Excluding $2.9 million of transaction costs incurred in connection with our initial investment in the Core Transaction in August 2017; (ii) increases in travel2017, general and related pursuit costs of potential acquisition transactions; (iii)administrative expense increased $1.4 million. This increase was primarily due to additional expenses incurred in connection with enhancements to our operating systems platform;platform, additional payroll expenses, and (iv) other general inflationary factors. We anticipate general and administrative expenses will increase in 20172018 as compared to 20162017, for the reasons discussed above.
Depreciation and Amortization
Depreciation and amortization increased by approximately $9.0$5.0 million, from $52.1$61.1 million during the three months ended September 30, 20162017, to $61.1$66.1 million for the three months ended September 30, 2017.2018. This increase was primarily due to the following: (i) a $4.8$5.5 million increase related to the completion of construction and opening of seven owned development properties in August and September of 2016 and ten owned development properties in August 2017;2017, six owned development properties in August 2018, and four presale properties in August 2018; and (ii) a $3.8$1.2 million increase due to property acquisition activity during 2016 and 2017; and (iii) a $2.4 million increase in depreciation expense at our same store properties due to capital improvement projects at various properties.2017. These increases were partially offset by a $2.0$1.6 million decrease in depreciation and amortization expense related to properties sold in 2016 and 2017.May 2018. We anticipate depreciation and amortization expense towill increase in 20172018, as compared to 20162017, for the reasons discussed above.
Ground/Facility Leases
Ground/facility leases expense increased by approximately $0.3$0.7 million, from $2.0$2.3 million during the three months ended September 30, 20162017, to $2.3$3.0 million for the three months ended September 30, 2017.2018. This increase was primarily due to the following: (i) a $0.4 million increase related to ACE development projects that completed construction and opened for operations in Fall 20162017 and 2017.Fall 2018; and (ii) a $0.2 million increase at our on-campus participating properties. We anticipate ground/facility leases expense to increase for the full year 2017in 2018, as compared to 20162017, for the reasons discussed above.
Interest Expense
Interest expense decreasedincreased by approximately $0.3$6.5 million, from $19.0$18.7 million during the three months ended September 30, 20162017, to $18.7$25.2 million for the three months ended September 30, 2017. Interest expense decreased as a result of2018. This increase was primarily due to the following: (i) a $3.6 million increase related to our $400 million offering of unsecured notes in October 2017; (ii) a $3.4 million increase due to the issuance of $330 million in mortgage debt as part of the ACC / Allianz Joint Venture Transaction; (iii) a $0.8 million decrease in capitalized interest due to the timing and volume of approximately $2.2construction activities on our owned development projects during the comparable three month periods; and (iv) $0.5 million in interest expense related to the 2018 presale developments. These increases were partially offset by (i) a $0.8 million decrease in term loan interest expense due to the pay-off of $450.0 million of term loans in 2018; (ii) a $0.4 million decrease due to the timing of borrowings under our unsecured revolving credit facility during the comparable three month periods; (iii) a $0.3 million decrease related to the disposition of properties with outstanding mortgage debt during 2016; (ii)2018; and (iv) a decrease of approximately $0.9 million due to the pay-off of $200 million of our $350 million term loan facility (“Term Loan I Facility”) in November 2016; (iii) a $0.5$0.3 million decrease related to the pay-off of maturing mortgage loans during 2016; and (iv) a $0.2 million decrease related to lower outstanding balances on our mortgage debt due to continued scheduled principal payments. These decreases were partially offset by (i) a $1.7 million increase related to increased borrowings on our revolving credit facility; (ii) an increase of approximately $1.4 million related to the closings of our $300 million term loan facility (“Term Loan III Facility”) in September 2017 and our $200 million term loan (the “New Term Loan II Facility”) in June 2017; and (iii) an increase of $0.4 million in interest related to the property in receivership incurred while working with the lender to finalize the transfer of the property in settlement of the property’s $27.4 million mortgage loan.2018.
We anticipate interest expense will decreaseincrease in 20172018, as compared to 20162017, due to the pay-off of mortgage debt in 2016 and 2017, the disposition of properties with outstanding mortgage debt during 2016, and the 2016 pay-off of $200 million of the Term Loan I Facility. These decreases will be offset by an increase in borrowings underreasons discussed above, increased interest
rates on the Company’s revolving credit facility to fund its development pipeline, an increase related to the closings of the New Term Loan II Facility in June 2017, the Term Loan III Facility in September 2017,variable rate debt, and additional interest incurred from the $400 million offeringany offerings of unsecured notes anticipated during 2018. These increases will be offset by the expected pay-off of outstanding mortgage debt scheduled to mature in October 2017.2018.
Other Income
During the three months ended September 30, 2018, we recognized a $0.6 million gain on an insurance settlement due to hail damage at one of our owned properties. The gain represents insurance proceeds received to date in excess of the net book value of the assets written off as a result of the damage.
Income Tax Provision
Income tax provision decreased by approximately $0.5 million, from $0.3 million in expense during the three months ended September 30, 2017 to a $0.2 million benefit during the three months ended September 30, 2018. The decrease was primarily due to a decrease in the estimated state income tax gain resulting from the ACC / Allianz Joint Venture Transaction in May 2018.
Comparison of the Nine Months Ended September 30, 20172018 and September 30, 20162017
The following table presents our results of operations for the nine months ended September 30, 20172018 and 2016,2017, including the amount and percentage change in these results between the two periods.
| | | | | Nine Months Ended
September 30, | | | | Nine Months Ended
September 30, | | |
| | | 2017 | | 2016 | | Change ($) | | Change (%) | | 2018 | | 2017 | | Change ($) | | Change (%) |
| Revenues | | | | | | | | | | | | | | | | |
| Wholly-owned properties | | $ | 531,556 |
| | $ | 546,078 |
| | $ | (14,522 | ) | | (2.7 | )% | |
| Owned properties | | | $ | 597,854 |
| | $ | 531,556 |
| | $ | 66,298 |
| | 12.5 | % |
| On-campus participating properties | | 23,128 |
| | 23,018 |
| | 110 |
| | 0.5 | % | | 23,605 |
| | 23,128 |
| | 477 |
| | 2.1 | % |
| Third-party development services | | 4,697 |
| | 3,929 |
| | 768 |
| | 19.5 | % | | 3,883 |
| | 4,697 |
| | (814 | ) | | (17.3 | )% |
| Third-party management services | | 7,193 |
| | 7,039 |
| | 154 |
| | 2.2 | % | | 7,311 |
| | 7,193 |
| | 118 |
| | 1.6 | % |
| Resident services | | 2,310 |
| | 2,325 |
| | (15 | ) | | (0.6 | )% | | 2,284 |
| | 2,310 |
| | (26 | ) | | (1.1 | )% |
| Total revenues | | 568,884 |
| | 582,389 |
| | (13,505 | ) | | (2.3 | )% | | 634,937 |
| | 568,884 |
| | 66,053 |
| | 11.6 | % |
| | | | | | | | | | | | | | | | | |
| Operating expenses | | |
| | |
| | |
| | |
| |
| Wholly-owned properties | | 249,552 |
| | 257,175 |
| | (7,623 | ) | | (3.0 | )% | |
| Operating expenses (income) | | | |
| | |
| | |
| | |
|
| Owned properties | | | 282,193 |
| | 249,552 |
| | 32,641 |
| | 13.1 | % |
| On-campus participating properties | | 11,080 |
| | 10,125 |
| | 955 |
| | 9.4 | % | | 11,030 |
| | 11,080 |
| | (50 | ) | | (0.5 | )% |
| Third-party development and management services | | 11,789 |
| | 10,638 |
| | 1,151 |
| | 10.8 | % | | 11,573 |
| | 11,789 |
| | (216 | ) | | (1.8 | )% |
| General and administrative | | 25,200 |
| | 16,810 |
| | 8,390 |
| | 49.9 | % | | 27,055 |
| | 25,200 |
| | 1,855 |
| | 7.4 | % |
| Depreciation and amortization | | 169,391 |
| | 159,486 |
| | 9,905 |
| | 6.2 | % | | 194,447 |
| | 169,391 |
| | 25,056 |
| | 14.8 | % |
| Ground/facility leases | | 7,151 |
| | 6,736 |
| | 415 |
| | 6.2 | % | | 8,526 |
| | 7,151 |
| | 1,375 |
| | 19.2 | % |
| Provision for real estate impairment | | 15,317 |
| | — |
| | 15,317 |
| | 100.0 | % | | — |
| | 15,317 |
| | (15,317 | ) | | (100.0 | )% |
| Other operating income | | | (2,648 | ) | | — |
| | (2,648 | ) | | 100.0 | % |
| Total operating expenses | | 489,480 |
| | 460,970 |
| | 28,510 |
| | 6.2 | % | | 532,176 |
| | 489,480 |
| | 42,696 |
| | 8.7 | % |
| | | | | | | | | | | | | | | | | |
| Operating income | | 79,404 |
| | 121,419 |
| | (42,015 | ) | | (34.6 | )% | | 102,761 |
| | 79,404 |
| | 23,357 |
| | 29.4 | % |
| | | | | | | | | | | | | | | | | |
| Nonoperating income and (expenses) | | |
| | |
| | |
| | |
| |
| Nonoperating income (expenses) | | | |
| | |
| | |
| | |
|
| Interest income | | 3,723 |
| | 4,026 |
| | (303 | ) | | (7.5 | )% | | 3,740 |
| | 3,723 |
| | 17 |
| | 0.5 | % |
| Interest expense | | (47,944 | ) | | (61,762 | ) | | 13,818 |
| | (22.4 | )% | | (72,207 | ) | | (47,944 | ) | | (24,263 | ) | | 50.6 | % |
| Amortization of deferred financing costs | | (3,197 | ) | | (5,238 | ) | | 2,041 |
| | (39.0 | )% | | (4,744 | ) | | (3,197 | ) | | (1,547 | ) | | 48.4 | % |
| (Loss) gain from disposition of real estate | | (632 | ) | | 17,409 |
| | (18,041 | ) | | (103.6 | )% | |
| Total nonoperating expense | | (48,050 | ) | | (45,565 | ) | | (2,485 | ) | | 5.5 | % | |
| Gain (loss) from disposition of real estate | | | 42,314 |
| | (632 | ) | | 42,946 |
| | (6,795.3 | )% |
| Loss from early extinguishment of debt | | | (784 | ) | | — |
| | (784 | ) | | 100.0 | % |
| Other nonoperating income | | | 570 |
| | — |
| | 570 |
| | 100.0 | % |
| Total nonoperating expenses | | | (31,111 | ) | | (48,050 | ) | | 16,939 |
| | (35.3 | )% |
| | | | | | | | | | | | | | | | | |
| Income before income taxes | | 31,354 |
| | 75,854 |
| | (44,500 | ) | | (58.7 | )% | | 71,650 |
| | 31,354 |
| | 40,296 |
| | 128.5 | % |
| Income tax provision | | (791 | ) | | (1,035 | ) | | 244 |
| | (23.6 | )% | | (2,147 | ) | | (791 | ) | | (1,356 | ) | | 171.4 | % |
| Net income | | 30,563 |
| | 74,819 |
| | (44,256 | ) | | (59.2 | )% | | 69,503 |
| | 30,563 |
| | 38,940 |
| | 127.4 | % |
| | | | | | | | | | | | | | | | | |
| Net income attributable to noncontrolling interests | | (587 | ) | | (1,150 | ) | | 563 |
| | (49.0 | )% | |
| Net loss (income) attributable to noncontrolling interests | | | 88 |
| | (587 | ) | | 675 |
| | (115.0 | )% |
Net income attributable to ACC, Inc. and Subsidiaries common stockholders | | $ | 29,976 |
| | $ | 73,669 |
| | $ | (43,693 | ) | | (59.3 | )% | | $ | 69,591 |
| | $ | 29,976 |
| | $ | 39,615 |
| | 132.2 | % |
Same Store and New Property Operations
A reconciliation of our same store, new property and sold/held for saleother property operations to our consolidated statements of comprehensive income is set forth below:
| | | | | Same Store Properties | | New Properties | | Sold/Held for Sale Properties (1) | | Total - All Properties | | Same Store Properties | | New Properties | | Sold Properties/Other (1) | | Total - All Properties |
| | | Nine Months Ended
September 30, | | Nine Months Ended
September 30, | | Nine Months Ended
September 30, | | Nine Months Ended
September 30, | | Nine Months Ended
September 30, | | Nine Months Ended
September 30, | | Nine Months Ended
September 30, | | Nine Months Ended
September 30, |
| | | 2017 | | 2016 | | 2017 | | 2016 | | 2017 (2) | | 2016 (3) | | 2017 | | 2016 | | 2018 | | 2017 | | 2018 | | 2017 | | 2018 (2) | | 2017 (3) | | 2018 | | 2017 |
Number of properties (4) | | 124 |
| | 124 |
| | 24 |
| | 8 |
| | 2 |
| | 24 |
| | 150 |
| (5) | 156 |
| | 130 |
| | 130 |
| | 27 |
| | 15 |
| | 4 |
| | 5 |
| | 161 |
| | 150 |
|
Number of beds (4) | | 73,871 |
| | 73,871 |
| | 14,364 |
| | 3,737 |
| | 1,517 |
| | 14,924 |
| | 89,752 |
| | 92,532 |
| | 76,433 |
| | 76,433 |
| | 17,956 |
| | 10,464 |
| | 2,198 |
| | 2,855 |
| | 96,587 |
| | 13,319 |
|
| | | | | | | | | | | | | | | | | | | | | | | | | | | | | | | | | |
Revenues (6)(5) | | $ | 490,177 |
| | $ | 478,327 |
| | $ | 39,774 |
| | $ | 4,291 |
| | $ | 3,915 |
| | $ | 65,785 |
| | $ | 533,866 |
| | $ | 548,403 |
| | $ | 511,415 |
| | $ | 502,382 |
| | $ | 79,480 |
| | $ | 13,943 |
| | $ | 9,243 |
| | $ | 17,541 |
| | $ | 600,138 |
| | $ | 533,866 |
|
| Operating expenses | | 227,993 |
| | 220,724 |
| | 19,152 |
| | 2,400 |
| | 2,407 |
| | 34,051 |
| | 249,552 |
| | 257,175 |
| | 238,798 |
| | 233,473 |
| | 38,505 |
| | 8,628 |
| | 4,890 |
| | 7,451 |
| | 282,193 |
| | 249,552 |
|
| |
(1) | Does not include the allocation of payroll and other administrative costs related to corporate management and oversight. |
| |
(2) | Includes one property that wasthree properties sold in April 20172018 and one property currently in receivership that is in the process of being transferred to the lender in settlement of the property’s $27.4 million mortgage loan that matured in August 2017. Also includes transaction costs and recurring professional fees related to the formation and operation of the ACC / Allianz Joint Venture Transaction. |
| |
(3) | Includes properties sold in 20162018 and 2017, and one property that is in the process of being transferred to the lender as discussed above. |
| |
(4) | Does not include properties under construction or undergoing redevelopment. |
| |
(5) | Difference from total operating property portfolio represents one property that was sold during the second quarter 2017. |
| |
(6)
| Includes revenues which are reflected as resident services revenue on the accompanying consolidated statements of comprehensive income. |
Same Store Properties: The increase in revenue from our same store properties was primarily due to an increase in average rental rates for the 2016/20172017/2018 and 2017/20182018/2019 academic years, partially offset by a slight decrease in our weighted average occupancy from 93.8%93.2% during the nine months ended September 30, 20162017, to 93.6%92.3% for the nine months ended September 30, 2017.2018.
The increase in operating expenses from our same store properties was primarily due to the same factors that contributed to the increase in operating expenses for the three months ended September 30, 2017, as discussed above, as well the following: (i) an increase in utilities expense as a result of overall rate increases in water and sewageproperty taxes in various markets which was partially offset by increased utility reimbursements from tenants which are included in same store properties revenues; (ii)and increases related to 20152016 development deliveries caused primarily bythat were assessed at full value for the stabilization of property tax assessments in the second year of operations; and (iii) additional marketing expenses incurred due to our efforts to achieve our leasing targets.first time.
New Property Operations: Our new properties for the nine months ended September 30, 20172018 are summarized in the table of new properties contained in the discussion of our results of operations for the three months ended September 30, 20172018 and 2016.2017.
On-Campus Participating Properties (“OCPP”) Operations
Same Store OCPP Properties: We had five participating properties containing 5,086 beds which were operating during the nine months ended September 30, 20172018, and 2016.2017. Revenues from these properties increased by $0.1$0.5 million, from $23.0 million for the nine months ended September 30, 2016 to $23.1 million for the nine months ended September 30, 2017, to $23.6 million for the nine months ended September 30, 2018 as a result of an increase in average rental rates for the 2016/20172017/2018 and 2017/20182018/2019 academic years, offset by a decrease in average occupancy from 69.5%68.5% for the nine months ended September 30, 20162017, to 67.6%68.3% for the nine months ended September 30, 2017.2018. Operating expenses at these properties increased by $1.0 million,decreased slightly from $10.1 million for the nine months ended September 30, 2016 as compared to $11.1 million for the nine months ended September 30, 2017 primarily due to (i) an increase in payroll costs related to recently filled staff positions; (ii) increased maintenance costs related to the annual turn process; (iii) an increase in utilities expense; and (iv) increases in general and administrative costs. Future revenues will be dependent on our ability to maintain our current leases in effect$11.0 million for the 2017/2018 academic year and our ability to obtain appropriate rental rates and desired occupancy for the 2018/2019 academic year. We anticipate that operating expenses for our OCPP properties for 2017 will increase as compared to 2016 for the reasons discussed above.nine months ended September 30, 2018.
Third-Party Development Services Revenue
Third-party development services revenue increaseddecreased by approximately $0.8 million, from $3.9$4.7 million during the nine months ended September 30, 20162017, to $4.7$3.9 million for the nine months ended September 30, 2017.2018. This increasedecrease was primarily due to the closing of bond financing and commencement of construction of a fourth phase at the University of California, Irvine which contributed approximately $2.9 million in revenue forduring the ninethree months ended September 30, 2017. These increases wereThe decrease was partially offset by the closing of bond financing and commencement of construction of two development projects with the Texas A&MDelaware State University System at their Corpus Christi and San Antonio campuses, which contributed approximately $2.0 million of revenue, as well as a $0.5 million fee earned for the performance of various predevelopment activities for the University of Kansas during the nine months ended September 30, 2016.project in May 2018. During the nine months ended September 30, 2018, we had four projects in progress with an average contractual fee of approximately $4.0 million, as compared to the nine months ended September 30, 2017, in which we had three projects in progress with an average contractual fee of approximately $3.1 million, as compared to the nine months ended September 30, 2016 in which we had four projects in progress with an average contractual fee of approximately $1.8 million.
Third-Party Development and Management Services Expenses
Third-party development and management services expenses increased by approximately $1.2 million, from $10.6 million during the nine months ended September 30, 2016 to $11.8 million for the nine months ended September 30, 2017. This increase was due to the same factors that contributed to the increase in third-party development and management services expenses for the three months ended September 30, 2017, as discussed above.
General and Administrative
General and administrative expenses increased by approximately $8.4$1.9 million, from $16.8$25.2 million during the nine months ended September 30, 20162017, to $25.2$27.1 million for the nine months ended September 30, 2017.2018. Excluding $5.8 million in transaction costs incurred in connection with the closing of the ACC / Allianz Joint Venture Transaction in May 2018, $2.9 million of transactions incurred in connection with our initial investment in the Core Transaction in August 2017, and $4.5 million in contractual executive separation and retirement charges incurred in the first and second quarter 2017, general and administrative expense increased $3.5 million. This increase was primarily due to the same factors that contributed to the increase in general and administrative expenses for the three months ended September 30, 2017,2018, as discussed above, as well as $4.5 million in contractual executive separation and retirement charges incurred in the first and second quarter 2017 as a result of the retirement of the former Company’s Chief Financial Officer.above.
Depreciation and Amortization
Depreciation and amortization increased by approximately $9.9$25.0 million, from $159.5$169.4 million during the nine months ended September 30, 20162017, to $169.4$194.4 million for the nine months ended September 30, 2017.2018. This increase was primarily due to the following: (i) a $10.7$16.8 million increase related to the completion of construction and opening of seven owned development properties in August and September of 2016 and ten owned development properties in August 2017;2017, six owned development properties in August 2018, and four presale properties in August 2018; (ii) a $7.0$9.7 million increase due to property acquisition activity during 20162017; and 2017; (iii) a $4.9 million increase in depreciation expense at our same store properties due to capital improvement projects at various properties; and (iv) a $0.2$1.0 million increase in depreciation of corporate assets. These increases were partially offset by a $13.0$2.6 million decrease in depreciation and amortization expense related to properties sold in 20162017 and 2017.2018.
Ground/Facility Leases
Ground/facility leases expense increased by approximately $0.5$1.3 million, from $6.7$7.2 million during the nine months ended September 30, 20162017, to $7.2$8.5 million for the nine months ended September 30, 2017.2018. This increase was due to the same factors that contributed to the increase in ground/facility lease expenses for the three months ended September 30, 2017,2018, as discussed above.
Provision for Real Estate Impairment
During the nine months ended September 30, 2017, we recorded an impairment charge of approximately $15.3 million for one wholly-ownedowned property currently in receivership that is in the process of being transferred to the lender in settlement of the property’s $27.4 million mortgage loan that matured in August 2017. Refer to Note 7 in the accompanying Notes to Consolidated Financial Statements in Item 1 for a detailed discussion of this transaction.
Other Operating Income
During the nine months ended September 30, 2018, we recorded a $2.6 million gain related to cash proceeds received from a litigation settlement.
Interest Expense
Interest expense decreasedincreased by approximately $13.9$24.3 million, from $61.8$47.9 million during the nine months ended September 30, 20162017, to $47.9$72.2 million for the nine months ended September 30, 2017.2018. Interest expense decreasedincreased as a result of the following: (i) a decrease$10.9 million increase related to our $400 million offering of approximately $7.4unsecured notes in October 2017; (ii) a $5.7 million increase related to the dispositionclosing of properties with outstanding mortgage debt during 2016; (ii)a $200 million term loan in June 2017 and a $300 million term loan in September 2017; (iii) a $4.6 million increase due to the issuance of $330 million in mortgage debt as part of the ACC / Allianz Joint Venture Transaction; (iv) a $3.9 million decrease in capitalized interest due to the timing and volume of construction activities on our owned development projects during the comparable nine month periods; (iii)(v) a $3.5$1.0 million increase in accrued default interest on one of our properties that is in the process of being transferred to the lender in settlement of the property’s $27.4 million mortgage loan that matured in August 2017; and (vi) $0.5 million in interest expense related to the 2018 presale developments. These increases were partially offset by (i) a $1.4 million decrease related to the pay-off of maturing mortgage loans during 2016;2017 and (iv)2018; (ii) a $0.5 million decrease related to the disposition of approximately $3.6properties with outstanding debt during 2017 and 2018; and (iii) a $0.3 million decrease due to the pay-off of our $250 million term loan facility (“Term Loan II Facility”) in February 2016 and the pay-off of a portion of the Term Loan I Facility in November 2016. These decreases were partially offset by (i) a $3.6 million increase in interest expense related to increased borrowingsscheduled principal payments on our revolving credit facility; and (ii) a $1.4 million increase in interest related to closings of our Term Loan III Facility in September 2017 and our New Term Loan II Facility in June 2017.debt.
Amortization of Deferred Financing Costs
Amortization of deferred financing costs decreasedincreased by approximately $2.0$1.5 million, from $5.2$3.2 million during the nine months ended September 30, 20162017, to $3.2$4.7 million for the nine months ended September 30, 2017.2018. This decreaseincrease was primarily due to $1.1(i) $0.5 million in amortization expense related to the closing of $500 million in term loans in 2017; (ii) $0.9 million of accelerated amortization related to the pay-off of our Term Loan II Facility$450 million of term loan debt in February 2016, $0.6May 2018; and (iii) $0.3 million in amortization expense related to the pay-off of a portion of the Term Loan I Facility in November 2016, and $0.3our $400 million related to properties with mortgage debt sold in 2016. We anticipate amortization of deferred finance costs will decrease in 2017 for the reasons discussed above, offset by increases related to the New Term Loan II and Term Loan III facilities, and the offering of unsecured notes in October 2017.
Gain (Loss) Gain from Disposition of Real Estate
During the nine months ended September 30, 2018, we sold three owned properties containing 1,338 beds, resulting in a net gain from disposition of real estate of approximately $42.3 million. During the nine months ended September 30, 2017, we sold one wholly-ownedowned property containing 657 beds, resulting in a net loss from disposition of real estate of approximately $0.6 million. During the nine months ended September 30, 2016, we sold two wholly-owned properties containing 1,324 beds, resulting in a net gain from disposition of real estate of approximately $17.4 million. Refer to Note 4 in the accompanying Notes to the Consolidated Financial Statements contained in Item 1.
Noncontrolling InterestsLoss from Early Extinguishment of Debt
Noncontrolling interests represent holdersDuring the nine months ended September 30, 2018, we incurred approximately $0.8 million of commonlosses associated with the early pay-off of mortgage loans in connection with the sale of one owned property and preferred unitsone owned property included in our Operating Partnership not held bythe ACC or ACC Holdings as well as certain third-party partners in joint ventures consolidated by us for financial reporting purposes. Accordingly, these external partners are allocated their share of income/loss during the respective reporting periods./ Allianz Joint Venture Transaction. Refer to Note 94 and Note 7 in the accompanying Notes to Consolidated Financial Statements contained in Item 1 for a detailed discussion of noncontrolling interests.additional details.
Income Tax Provision
Income tax provision increased by approximately $1.3 million from $0.8 million during the nine months ended September 30, 2017, to $2.1 million for the nine months ended September 30, 2018. The increase was primarily due to an estimated state income tax gain resulting from the ACC / Allianz Joint Venture Transaction.
Liquidity and Capital Resources
Cash Balances and Cash Flows
As of September 30, 2017, excluding our on-campus participating properties,2018, we had $29.7$90.5 million in cash and cash equivalents and restricted cash as compared to $32.3$64.8 million in cash and cash equivalents and restricted cash as of December 31, 2016.2017. Restricted cash primarily consists of escrow accounts held by lenders and resident security deposits, as required by law in certain states, and funds held in escrow in connection with potential acquisition and development opportunities. The following discussion relates to changes in cash due to operating, investing and financing activities, which are presented in our consolidated statements of cash flows included in Item 1.
Operating Activities: For the nine months ended September 30, 2017,2018, net cash provided by operating activities was approximately $245.1$266.9 million, as compared to approximately $242.8$245.7 million for the nine months ended September 30, 2016,2017, an increase of $2.3$21.2 million. This increase in cash flows was due to the timing of property tax payments for owned properties, as well as operating cash flows provided by the completion of construction and opening of ten owned development properties in the third quarter of 2017, and the completion of sevensix owned development projectsproperties in the third quarter of 2016, as well asAugust 2018, four presale developments in August 2018, and property acquisitions in 2016 and 2017. The increase was partially2017, offset by the timingproperties disposed of collections of our student accounts receivable as well as a decrease in operating cash flows related to property dispositions during 20162017 and 2017.2018.
Investing Activities: Investing activities utilized approximately $770.4$216.1 million and $365.7$769.0 million for the nine months ended September 30, 20172018 and 2016,2017, respectively. The $404.7$552.9 million increasedecrease in cash utilized in investing activities was primarily a result of the following: (i) a $205.7$302.3 million decrease in cash paid to acquire operating and under development properties; (ii) a $217.8 million increase in cash paid forproceeds from property acquisitions duringdispositions related to the nine months ended September 30, 2017, (ii)sale of a $124.4three property portfolio in May 2018; (iii) a $36.9 million increasedecrease in cash used to fund the construction of our wholly-ownedowned development properties, related
to the timing of construction commencement and completion of our owned development pipeline; (iii) a $48.2(iv) an $8.7 million decrease in proceeds from the disposition of wholly-owned properties, as we sold two properties during the nine months ended September 30, 2016 as compared to the sale of one property during the nine months ended September 30, 2017; (iv) a $19.3 million increase in cash used to fund capital expenditures at our wholly-ownedowned properties; (v) a $2.5 million decrease in cash used to fund corporate capital expenditures; and (v)(vi) $1.6 million in proceeds from an $8.0insurance settlement in 2018. These decreases were partially offset by a $17.6 million increase in cash paid to acquire undeveloped land parcels in 2017.parcels.
Financing Activities: CashFor the nine months ended September 30, 2018, net cash used in financing activities totaled approximately $25.1 million as compared to net cash provided by financing activities totaled approximately $519.4 million and $138.6of $518.6 million for the nine months ended September 30, 2017 and 2016, respectively.2017. The $380.8$543.7 million increasechange in cash provided byused in financing activities was primarily a result of the following: (i) $450.0 million in cash used to pay down the Company’s $300 million and $150 million unsecured term loans in May 2018; (ii) a $750.0$500.0 million net increase
decrease in proceeds from unsecured term loans; (ii) a $216.0 million increase in net proceeds on our revolving credit facility; (iii) a $53.4 million decrease in cash used to pay off mortgage and construction debt during the comparable nine month periods; (iv) $11.5 million in contributions from noncontrolling interests during the nine months ended September 30, 2017; and (v) $10.8 million in proceeds from construction loans. These increases were partially offset by the following: (i) a $581.7$188.5 million decrease in net proceeds from the sale of common stock related to our equity offering in February 2016 as compared to the issuance of common stock under our ATM Equity Program related to activity in 2017; (ii)(iv) a $72.5$91.3 million increase in distributions to noncontrolling interests primarily as a result of the ACC / Allianz Joint Venture Transaction; (v) a $27.8 million decrease in net proceeds on our revolving credit facility; (vi) a $49.7 million increase in cash used to pay off mortgage and construction debt, including defeasance costs, in May 2018; (vii) an $11.1 million increase in distributions to common and restricted stockholdersstockholders; and (viii) $10.5 million paid in 2018 to increase our ownership of a consolidated subsidiary. These decreases were partially offset by the following: (i) a $368.4 million increase in contributions from noncontrolling partnersinterests primarily due to the distribution of $59.6ACC / Allianz Joint Venture Transaction (refer to Note 4 in the accompany Notes to Consolidated Financial Statements contained in Item 1); (ii) $330.0 million ofin proceeds from mortgage debt issued by the Company's initial investment to its joint venture partners; andpreviously mentioned ACC / Allianz Joint Venture Transaction; (iii) $77.2 million in increased proceeds from construction loans; (iv) a $6.6$6.7 million increasedecrease in payments of debt issuance costs due to the amendment of our credit agreementcosts; and (v) a $2.2 million decrease in January 2017 and our New Term Loan II and Term Loan III facilities in June and September 2017.taxes paid on net share settlements.
Liquidity Needs, Sources and Uses of Capital
As of September 30, 2017,2018, our short-term liquidity needs included, but were not limited to, the following: (i) the pay-off of $300 million related to our Term Loan III Facility due to mature in September 2018; (ii) anticipated distribution payments to our common and restricted stockholders totaling approximately $241.5$253.8 million based on an assumed annual cash distribution of $1.76$1.84 per share and based on the number of our shares outstanding as of September 30, 2017; (iii)2018; (ii) anticipated distribution payments to our Operating Partnership unitholders totaling approximately $1.9$1.3 million based on an assumed annual distribution of $1.76$1.84 per common unit and a cumulative preferential per annum cash distribution rate of 5.99% on our Preferred OP Units based on the number of units outstanding as of September 30, 2017; (iv)2018; (iii) the pay-off of approximately $35.5$95.6 million of outstanding fixed rate mortgage debt scheduled to mature during the next 12 months; (v)(iv) estimated development costs over the next 12 months totaling approximately $319.8$132.9 million for our wholly-ownedowned properties currently under construction; (vi)(v) a $42.6$90.0 million obligation to purchase a propertytwo properties subject to presale arrangements (see Note 13 in the accompanying Notes to the Consolidated Financial Statements contained in Item 1); (vi) an obligation to increase our investment in the Core Joint Ventures, resulting in a presale arrangementfunding commitment of approximately $200.9 million (see Note 13 in the accompanying Notes to the Consolidated Financial Statements contained in Item 1); (vii) an obligation to increase our investment in two joint ventures, resulting in a funding commitment of approximately $171.2 million (see Note 3 and Note 13 in the accompanying Notes to the Consolidated Financial Statements contained in Item 1); (viii) funds for other development projects scheduled to commence construction during the next 12 months; and (ix)(viii) potential future property or land acquisitions, including mezzanine financed developments.
We expect to meet our short-term liquidity requirements byby: (i) borrowing under our existing unsecuredrevolving credit facility; (ii) accessing the unsecured bond market; (iii) exercising debt extension options to the extent they are available; (iv) issuing securities, including common stock, under our ATM Equity Program discussed more fully in Note 8 in the accompanying Notes to Consolidated Financial Statements contained in Item 1, or otherwise; (v) potentially disposing of properties and/or entering into joint venture arrangements, depending on market conditions; and (vi) utilizing current cash on hand and net cash provided by operations. Our ability to obtain additional financing will depend on a variety of factors such as market conditions, the general availability of credit, the overall availability of credit to the real estate industry, our credit ratings and credit capacity, as well as the perception of lenders regarding our long or short-term financial prospects.
In January 2017, the Company amended and expanded its senior unsecured revolving credit facility, increasing the facility size to $700 million and extending the maturity date to March 2022. The amended facility has an accordion feature that allows the Company to expand the facility by up to an additional $500 million, subject to the satisfaction of certain conditions. Borrowing rates under the credit facility float at a margin over LIBOR plus an annual facility fee with spreads reflecting current market terms which are more favorable than those contained in the prior facility. Both the margin and the facility fee are priced on a grid that is tied to the Company’s credit rating. Based on the Company’s current Baa2/BBB rating, the annual facility fee is 20 basis points and the LIBOR margin is 100 basis points, a reduction of 10 basis points from the prior facility.
In June 2017, the Company entered into a New Term Loan II Facility totaling $200 million which will mature in June 2022. The agreement has an accordion feature that allows the Company to expand the amount by up to an additional $100 million, subject to the satisfaction of certain conditions. Borrowing rates under this agreement float at a margin over LIBOR and the margin is priced on a grid that is tied to the Company’s credit rating. Based on the Company’s current Baa2/BBB rating, the LIBOR margin is 110 basis points.
In September 2017, the Company entered into a Term Loan III Facility totaling $300 million which will mature in September 2018, and can be extended for two one-year periods at our option, subject to the satisfaction of certain conditions. The agreement has an accordion feature that allows the Company to expand the amount by up to an additional $100 million, subject to the satisfaction of certain conditions. Borrowing rates under this agreement float at a margin over LIBOR and the margin is priced on a grid that is tied to the Company’s credit rating. Based on the Company’s current Baa2/BBB rating, the LIBOR margin is 110 basis points.
As discussed in Note 7 in the accompanying Notes to Consolidated Financial Statements contained in Item 1, in May 2017, the lender of the non-recourse mortgage loan secured by Blanton Common, a wholly-owned property located near Valdosta State University which was acquired as part of the GMH student housing transaction in 2008, sent a formal notice of default and initiated foreclosure proceedings. The property generated insufficient cash flow to cover the debt service on the $27.4 million mortgage loan that matured in August 2017. As of September 30, 2017, the underlying property was in receivership and the Company was cooperating with the lender to allow for a consensual foreclosure process upon which the property will be surrendered to the lender in satisfaction of the mortgage loan.
As discussed in Note 15 in the accompanying Notes to the Consolidated Financial Statements contained in Item 1, in October 2017, we raised $395 million in net proceeds from an unsecured $400 million bond offering. Proceeds from the offering were used to repay the outstanding balance on our revolving credit facility. We intend to use the remaining proceeds for potential repayment of other outstanding debt, to fund our development pipeline, for potential acquisitions of student housing properties and for general corporate purposes.
We may seek additional funds to undertake initiatives not contemplated by our business plan or obtain additional cushion against possible shortfalls. We also may pursue additional financing as opportunities arise. Future financings may include a range of different sizes or types of financing, including the incurrence of additional secured debt and the sale of additional debt or equity securities. These funds may not be available on favorable terms or at all. Our ability to obtain additional financing depends on several factors, including future market conditions, our success or lack of success in penetrating our markets, our future creditworthiness, and restrictions contained in agreements with our investors or lenders, including the restrictions contained in the agreements governing our unsecured credit facility and unsecured notes. These financings could increase our level of indebtedness or result in dilution to our equity holders.
Distributions
We are required to distribute 90% of our REIT taxable income (excluding capital gains) on an annual basis in order to qualify as a REIT for federal income tax purposes. Distributions to common stockholders are at the discretion of the Board of Directors. We may use borrowings under our unsecured revolving credit facility to fund distributions. The Board of Directors considers a number of factors when determining distribution levels, including market factors and our Company’s performance in addition to REIT requirements.
On November 1, 2017, weOctober 31, 2018, our Board of Directors declared a distribution per share of $0.44,$0.46, which will be paid on November 27, 201726, 2018 to all common stockholders of record as of November 13, 2017.12, 2018. At the same time, the Operating Partnership will pay an equivalent amount per unit to holders of Common OP Units, as well as the quarterly cumulative preferential distribution to holders of Preferred OP Units.
Pre-Development Expenditures
Our third-party and owned development activities have historically required us to fund pre-development expenditures such as architectural fees, permits and deposits. The closing and/or commencement of construction of these development projects is subject to a number of risks such as our inability to obtain financing on favorable terms and delays or refusals in obtaining necessary zoning, land use, building, and other required governmental permits and authorizations As such, we cannot always predict accurately the liquidity needs of these activities. We frequently incur these pre-development expenditures before a financing commitment and/or required permits and authorizations have been obtained. Accordingly, we bear the risk of the loss of these pre-development expenditures if financing cannot ultimately be arranged on acceptable terms or we are unable to successfully obtain the required permits and authorizations. Historically, our third-party and owned development projects have been successfully structured and financed; however, these developments have at times been delayed beyond the period initially scheduled, causing revenue to be recognized in later periods. As of September 30, 2017, we have deferred approximately $5.6 million in pre-development costs related to third-party and owned development projects that have not yet commenced construction.
Indebtedness
The amounts below exclude net unamortized debt premiums and discounts related to mortgage loans assumed in connection with property acquisitions, original issue discounts (“OID”s), and deferred financing costs (see Note 7 in the accompanying Notes to the Consolidated Financial Statements contained in Item 1). A summary of our consolidated indebtedness as of September 30, 20172018 is as follows:
| | | | | Amount | | % of Total | | Weighted Average Rates (1) | | Weighted Average Maturities | | Amount | | % of Total | | Weighted Average Rates (1) | | Weighted Average Maturities |
| Secured | | $ | 646,582 |
| | 23.4 | % | | 4.8 | % | | 5.3 Years | | $ | 910,800 |
| | 30.6 | % | | 4.5 | % | | 6.4 Years |
| Unsecured | | 2,116,440 |
| | 76.6 | % | | 3.1 | % | | 4.3 Years | | 2,066,900 |
| | 69.4 | % | | 3.6 | % | | 5.0 Years |
| Total consolidated debt | | $ | 2,763,022 |
| | 100.0 | % | | 3.5 | % | | 4.5 Years | | $ | 2,977,700 |
| | 100.0 | % | | 3.9 | % | | 5.4 Years |
| | | | | | | | | | | | | | | |
| Fixed rate debt | | | | | | | | | | | | | | |
| Secured | | | | | | | | | | | | | | |
| Project-based taxable bonds | | $ | 30,575 |
| | 1.1 | % | | 7.6 | % | | 7.0 Years | | $ | 27,030 |
| | 0.9 | % | | 7.6 | % | | 6.1 Years |
| Mortgage | | 593,585 |
| | 21.4 | % | | 4.7 | % | | 5.4 Years | | 792,651 |
| | 26.7 | % | | 4.4 | % | | 7.2 Years |
| Unsecured | | | | | | | | | | | | | | |
| April 2013 Notes | | 400,000 |
| | 14.5 | % | | 3.8 | % | | 5.5 Years | | 400,000 |
| | 13.4 | % | | 3.8 | % | | 4.5 Years |
| June 2014 Notes | | 400,000 |
| | 14.5 | % | | 4.1 | % | | 6.8 Years | | 400,000 |
| | 13.4 | % | | 4.1 | % | | 5.8 Years |
| September 2015 Notes | | 400,000 |
| | 14.5 | % | | 3.4 | % | | 3.0 Years | | 400,000 |
| | 13.4 | % | | 3.4 | % | | 2.0 Years |
| October 2017 Notes | | | 400,000 |
| | 13.4 | % | | 3.6 | % | | 9.1 Years |
| Total - fixed rate debt | | 1,824,160 |
| | 66.0 | % | | 4.1 | % | | 5.2 Years | | 2,419,681 |
| | 81.2 | % | | 3.5 | % | | 6.0 Years |
| | | | | | | | | | | | | | | |
| Variable rate debt: | | | | | | | | | | | | | | |
| Secured | | | | | | | | | | | | | | |
| Construction | | 22,422 |
| | 0.8 | % | | 4.2 | % | | 2.3 Years | |
Mortgage and construction(2) | | | 91,119 |
| | 3.1 | % | | 4.7 | % | | .1 Years |
| Unsecured | | | | | | | | | | | | | | |
| Term loans | | 650,000 |
| | 23.5 | % | | 2.3 | % | | 2.7 Years | | 200,000 |
| | 6.7 | % | | 3.2 | % | | 3.7 Years |
| Unsecured revolving credit facility | | 266,440 |
| | 9.7 | % | | 2.4 | % | | 4.5 Years | | 266,900 |
| | 9.0 | % | | 3.4 | % | | 3.5 Years |
| Total - variable rate debt | | 938,862 |
| | 34.0 | % | | 2.4 | % | | 4.4 Years | | 558,019 |
| | 18.8 | % | | 3.2 | % | | 3.0 Years |
| Total consolidated debt | | $ | 2,763,022 |
| | 100.0 | % | | 3.5 | % | | 4.5 Years | | $ | 2,977,700 |
| | 100.0 | % | | 3.9 | % | | 5.4 Years |
| | | | | | | | | | | | | | | |
| |
(1) | Represents stated interest rate and does not include the effect of the amortization of deferred financing costs, debt premiums and discounts, OIDs, and interest rate swap terminations. |
(2) In July 2018, the fixed feature of a mortgage loan secured by an on-campus participating property expired, and the mortgage loan became classified as variable rate debt.
Funds From Operations (“FFO”)
The National Association of Real Estate Investment Trusts (“NAREIT”) currently defines FFO as net income or loss attributable to common shares computed in accordance with generally accepted accounting principles (“GAAP”), excluding gains or losses from depreciable operating property sales, impairment charges and real estate depreciation and amortization, and after adjustments for unconsolidated partnerships and joint ventures. We present FFO because we consider it an important supplemental measure of our operating performance and believe it is frequently used by securities analysts, investors and other interested parties in the evaluation of REITs, many of which present FFO when reporting their results. FFO excludes GAAP historical cost depreciation and amortization of real estate and related assets, which assumes that the value of real estate diminishes ratably over time. Historically, however, real estate values have risen or fallen with market conditions. We therefore believe that FFO provides a performance measure that, when compared year over year, reflects the impact to operations from trends in occupancy rates, rental rates, operating costs, and interest costs, among other items, providing perspective not immediately apparent from net income. We compute FFO in accordance with standards established by the Board of Governors of NAREIT in its March 1995 White Paper (as amended in November 1999 and April 2002)subsequently amended), which may differ from the methodology for calculating FFO utilized by other equity REITs and, accordingly, may not be comparable to such other REITs.
We also believe it is meaningful to present a measure we refer to as FFO-Modified, or FFOM, which reflects certain adjustments related to the economic performance of our on-campus participating properties, and the elimination of property acquisitiontransaction costs, contractual executive separation and retirement charges and other non-cash items, as we determine in good faith. Under our
participating ground leases, we and the participating university systems each receive 50% of the properties’ net cash available for distribution after payment of operating expenses, debt service (which includes significant amounts towards repayment of principal) and capital expenditures. A substantial portion of our revenues attributable to these properties is reflective of cash that is required to be used for capital expenditures and for the amortization of applicable property indebtedness. These amounts do not increase our economic interest in these properties or otherwise benefit us since our interest in the properties terminates upon the repayment of the applicable property indebtedness. Therefore, unlike the ownership of our wholly-ownedowned properties, the unique features of our ownership interest in our on-campus participating properties cause the value of these properties to diminish over time. For example, since the ground/facility leases under which we operate the participating properties require the reinvestment from operations of specified amounts for capital expenditures and for the repayment of debt while our interest in these properties terminates upon the repayment of the debt, such capital expenditures do not increase the value of the property to us and mortgage debt amortization only increases the equity of the ground lessor. Accordingly, we believe it is meaningful to modify FFO to exclude the operations of our on-campus participating properties and to consider their impact on our performance by including only that portion of our revenues from those properties that are reflective of our share of net cash flow and the management fees that we receive, both of which increase and decrease with the operating performance of the properties. This narrower measure of performance measures our profitability for these properties in a manner that is similar to the measure of our profitability from our third-party services business where we similarly incur no initial or ongoing capital investment in a property and derive only consequential benefits from capital expenditures and debt amortization. We believe, however, that this narrower measure of performance is inappropriate in traditional real estate ownership structures where debt amortization and capital expenditures enhance the property owner’s long-term profitability from its investment.
Our FFOM may have limitations as an analytical tool because it reflects the contractual calculation of net cash flow from our on-campus participating properties, which is unique to us and is different from that of our owned off-campus properties. Companies that are considered to be in our industry may not have similar ownership structures; and therefore those companies may not calculate FFOM in the same manner that we do, or at all, limiting its usefulness as a comparative measure. We compensate for these limitations by relying primarily on our GAAP and FFO results and using FFOM only supplementally. Further, FFO and FFOM do not represent amounts available for management’s discretionary use because of needed capital replacement or expansion, debt service obligations or other commitments and uncertainties. FFO and FFOM should not be considered as alternatives to net income or loss computed in accordance with GAAP as an indicator of our financial performance, or to cash flow from operating activities computed in accordance with GAAP as an indicator of our liquidity, nor are these measures indicative of funds available to fund our cash needs, including our ability to pay dividends or make distributions.
The following table presents a reconciliation of our net income attributable to common stockholders to FFO and FFOM:
| | | | | Three Months Ended
September 30, | | Nine Months Ended
September 30, | | Three Months Ended
September 30, | | Nine Months Ended
September 30, |
| | | 2017 | | 2016 | | 2017 | | 2016 | | 2018 | | 2017 | | 2018 | | 2017 |
Net (loss) income attributable to ACC, Inc. and Subsidiaries common stockholders | | $ | (1,312 | ) | | $ | 9,644 |
| | $ | 29,976 |
| | $ | 73,669 |
| |
| Net loss attributable to ACC, Inc. and Subsidiaries common stockholders | | | $ | (2,345 | ) | | $ | (1,312 | ) | | $ | 69,591 |
| | $ | 29,976 |
|
| Noncontrolling interests | | 85 |
| | 201 |
| | 593 |
| | 1,150 |
| | 121 |
| | 85 |
| | 896 |
| | 593 |
|
| Loss (gain) from disposition of real estate | | — |
| | — |
| | 632 |
| | (17,409 | ) | |
| (Gain) loss from disposition of real estate | | | — |
| | — |
| | (42,314 | ) | | 632 |
|
Elimination of provision for real estate impairment (1) | | — |
| | — |
| | 15,317 |
| | — |
| | — |
| | — |
| | — |
| | 15,317 |
|
| Real estate related depreciation and amortization | | 60,202 |
| | 51,301 |
| | 166,931 |
| | 157,232 |
| | 62,794 |
| | 60,202 |
| | 187,943 |
| | 166,931 |
|
Funds from operations (“FFO”) attributable to common stockholders and OP unitholders | | 58,975 |
| | 61,146 |
| | 213,449 |
| | 214,642 |
| | 60,570 |
| | 58,975 |
| | 216,116 |
| | 213,449 |
|
| | | | | | | | | | | | | | | | | |
| Elimination of operations of on-campus participating properties: | | |
| | |
| | |
| | |
| | |
| | |
| | |
| | |
|
| Net loss (income) from on-campus participating properties | | 479 |
| | 365 |
| | (1,373 | ) | | (1,702 | ) | | 436 |
| | 479 |
| | (1,715 | ) | | (1,373 | ) |
| Amortization of investment in on-campus participating properties | | (1,892 | ) | | (1,839 | ) | | (5,621 | ) | | (5,493 | ) | | (1,962 | ) | | (1,892 | ) | | (5,856 | ) | | (5,621 | ) |
| | | 57,562 |
| | 59,672 |
| | 206,455 |
| | 207,447 |
| | 59,044 |
| | 57,562 |
| | 208,545 |
| | 206,455 |
|
| Modifications to reflect operational performance of on-campus participating properties: | | |
| | |
| | |
| | |
| | |
| | |
| | |
| | |
|
Our share of net cash flow (2)(1) | | 452 |
| | 351 |
| | 1,987 |
| | 2,216 |
| | 644 |
| | 452 |
| | 2,232 |
| | 1,987 |
|
| Management fees | | 306 |
| | 304 |
| | 1,046 |
| | 1,027 |
| | 302 |
| | 306 |
| | 1,058 |
| | 1,046 |
|
| Contribution from on-campus participating properties | | 758 |
| | 655 |
| | 3,033 |
| | 3,243 |
| | 946 |
| | 758 |
| | 3,290 |
| | 3,033 |
|
Property acquisition costs (3) | | 2,855 |
| | 114 |
| | 2,855 |
| | 114 |
| |
Contractual executive separation and retirement charges (4) | | — |
| | — |
| | 4,515 |
| | — |
| |
| | | | | | | | | | |
Transaction costs (2) | | | (232 | ) | | 2,855 |
| | 7,586 |
| | 2,855 |
|
Elimination of loss from early extinguishment of debt (3) | | | — |
| | — |
| | 784 |
| | — |
|
Elimination of gain from litigation settlement (4) | | | — |
| | — |
| | (2,648 | ) | | — |
|
Elimination of FFO from property in receivership (5) | | | 842 |
| | 895 |
| | 2,037 |
| | 977 |
|
Contractual executive separation and retirement charges (6) | | | — |
| | — |
| | — |
| | 4,515 |
|
Funds from operations – modified (“FFOM”) attributable to common stockholders and OP unitholders | | $ | 61,175 |
| | $ | 60,441 |
| | $ | 216,858 |
| | $ | 210,804 |
| | $ | 60,600 |
| | $ | 62,070 |
| | $ | 219,594 |
| | $ | 217,835 |
|
| | | | | | | | | | | | | | | | | |
| FFO per share – diluted | | $ | 0.43 |
| | $ | 0.46 |
| | $ | 1.56 |
| | $ | 1.65 |
| | $ | 0.44 |
| | $ | 0.43 |
| | $ | 1.56 |
| | $ | 1.56 |
|
| FFOM per share – diluted | | $ | 0.44 |
| | $ | 0.45 |
| | $ | 1.59 |
| | $ | 1.62 |
| | $ | 0.44 |
| | $ | 0.45 |
| | $ | 1.58 |
| | $ | 1.59 |
|
| Weighted-average common shares outstanding – diluted | | 138,328,932 |
| | 132,877,380 |
| | 136,686,611 |
| | 130,407,761 |
| | 138,585,384 |
| | 138,328,932 |
| | 138,569,643 |
| | 136,686,611 |
|
| |
(1) | Represents an impairment charge recorded for a wholly-owned property currently in receivership that is in the process of being transferred to the lender in settlement of the property’s $27.4 million mortgage loan that matured in August 2017. |
| |
(2)
| 50% of the properties’ net cash available for distribution after payment of operating expenses, debt service (including repayment of principal) and capital expenditures. Represents amounts accrued for the interim periods,expenditures which is included in ground/facility leases expense in the consolidated statements of comprehensive income. |
| |
(3)
(2) | The three andmonths ended September 30, 2018 amount represents transaction costs incurred in connection with the closing of a presale transaction in August 2018, net of a decrease in estimated state income tax related to a tax gain resulting from the ACC / Allianz Joint Venture Transaction in May 2018. The nine months ended September 30, 2018 includes the costs discussed above in addition to transaction costs incurred in connection with the closing of the ACC / Allianz Joint Venture Transaction. The nine months ended September 30, 2017 amounts representamount represents transaction costs related to ourthe Company's initial investment in twothe Core/Spaces/DRW joint ventures. Refer to Notes 3 and 9ventures that occurred in the accompanying Notes to Consolidated Financial Statements contained in Item 1 for a more detailed discussion.third quarter of 2017. |
| |
(3) | Represents losses associated with the early extinguishment of mortgage loans due to real estate disposition transactions, including the sale of partial ownership interests in properties. Such costs are excluded from gains from disposition of real estate reported in accordance with GAAP. However, management views these losses as an incremental cost of the transactions because the debt was extinguished in connection with the consummation of the transactions and the Company had no intent to extinguish the debt absent the transactions. |
| |
| (4) | Represents a gain related to cash proceeds received from a litigation settlement in the second quarter 2018. Management believes it is appropriate to exclude this gain from FFOM in order to more accurately present the operating results of the Company on a comparative basis during the periods presented. |
| |
| (5) | Represents FFO for an owned property that has been in receivership since May 2017 that is in the process of being transferred to the lender in settlement of the property's $27.4 million mortgage loan that matured in August 2017. As the property is managed by a third party and the lender receives all cash flow from the property, management believes that excluding the FFO from the property more appropriately reflects the results of the Company's operations. FFOM for the prior year comparable periods has been adjusted to reflect this elimination. |
| |
| (6) | Represents contractual executive separation and retirement charges incurred in the first and second quarter of 2017 with regard to the retirement of the Company’sCompany's former Chief Financial Officer. |
Inflation
Our student leases do not typically provide for rent escalations. However, they typically do not have terms that extend beyond 12 months. Accordingly, although on a short term basis we would be required to bear the impact of rising costs resulting from inflation, we have the opportunity to raise rental rates at least annually to offset such rising costs. However, a weak economic environment or declining student enrollment at our principal universities may limit our ability to raise rental rates.
Item 3. Quantitative and Qualitative Disclosures About Market Risk
Market risk is the risk of loss from adverse changes in market prices and interest rates. Our future earnings and cash flows are dependent upon prevailing market rates. Accordingly, we manage our market risk by matching projected cash inflows from operating, investing and financing activities with projected cash outflows for debt service, acquisitions, capital expenditures, distributions to stockholders and unitholders, and other cash requirements. The majority of our outstanding debt has fixed interest rates, which minimizes the risk of fluctuating interest rates. Our exposure to market risk includes interest rate fluctuations in connection with our revolving credit facilities and variable rate construction loans and our ability to incur more debt without stockholder approval, thereby increasing our debt service obligations, which could adversely affect our cash flows. No material changes have occurred in relation to market risk since our Annual Report on Form 10-K for the year ended December 31, 2016.2017.
Item 4. Controls and Procedures
American Campus Communities, Inc.
| |
| (a) | Evaluation of Disclosure Controls and Procedures |
As required by SEC Rule 13a-15(b), we have carried out an evaluation, under the supervision of and with the participation of management, including our Chief Executive Officer and Chief Financial Officer, of the effectiveness of the design and operation of our disclosure controls and procedures as of the end of the period covered by this report. Based on the foregoing, our Chief Executive Officer and Chief Financial Officer concluded that our disclosure controls and procedures for the quarter covered by this report were effective at the reasonable assurance level.
| |
| (b) | Changes in Internal Control Over Financial Reporting |
There has been no change in our internal control over financial reporting during our most recent fiscal quarter that has materially affected, or is reasonably likely to materially affect, our internal control over financial reporting.
American Campus Communities Operating Partnership, L.P.
| |
| (a) | Evaluation of Disclosure Controls and Procedures |
As required by SEC Rule 13a-15(b), we have carried out an evaluation, under the supervision of and with the participation of management, including our Chief Executive Officer and Chief Financial Officer, of the effectiveness of the design and operation of our disclosure controls and procedures as of the end of the period covered by this report. Based on the foregoing, our Chief Executive Officer and Chief Financial Officer concluded that our disclosure controls and procedures for the quarter covered by this report were effective at the reasonable assurance level.
| |
| (b) | Changes in Internal Control Over Financial Reporting |
There has been no change in our internal control over financial reporting during our most recent fiscal quarter that has materially affected, or is reasonably likely to materially affect, our internal control over financial reporting.
PART II OTHER INFORMATION
Item 1. Legal Proceedings
We are subject to various claims, lawsuits and legal proceedings that arise in the ordinary course of business. While it is not possible to ascertain the ultimate outcome of such matters, management believes that the aggregate amount of such liabilities, if any, in excess of amounts provided or covered by insurance, will not have a material adverse effect on the our consolidated financial position or our results of operations.
Item 1A. Risk Factors
There have been no material changes to the risk factors that were discussed in Part 1, Item 1A of the Company’s and the Operating Partnership’s Annual Report on Form 10-K for the year ended December 31, 2016.2017.
Item 2. Unregistered Sales of Equity Securities and Use of Proceeds
None.
Item 3. Defaults Upon Senior Securities
None.
Item 4. Mine Safety Disclosures
Not applicable.
Item 5. Other Information
None.
Item 6. Exhibits
|
| | |
| Exhibit Number | | Description of Document |
| | Amendment to Bylaws of American Campus Communities, Inc. Incorporated by reference to Exhibit 3.1 to Current Report on Form 8-K of American Campus Communities, Inc. (File No. 001-32265) and American Campus Communities Operating Partnership LP (File No. 333-181102-01) filed on April 21, 2017 |
| | | |
| | American Campus Communities, Inc. - Certification of Chief Executive Officer Pursuant to Section 302 of the Sarbanes-Oxley Act of 2002. |
| | | |
| | American Campus Communities, Inc. - Certification of Chief Financial Officer Pursuant to Section 302 of the Sarbanes-Oxley Act of 2002. |
| | | |
| | American Campus Communities Operating Partnership, L.P. - Certification of Chief Executive Officer Pursuant to Section 302 of the Sarbanes-Oxley Act of 2002. |
| | | |
| | American Campus Communities Operating Partnership, L.P. - Certification of Chief Financial Officer Pursuant to Section 302 of the Sarbanes-Oxley Act of 2002. |
| | | |
| | American Campus Communities, Inc. - Certification of Chief Executive Officer Pursuant to 18 U. S. C. Section 1350, as Adopted Pursuant to Section 906 of the Sarbanes-Oxley Act of 2002. |
| | | |
| | American Campus Communities, Inc. - Certification of Chief Financial Officer Pursuant to 18 U.S.C. Section 1350, as Adopted Pursuant to Section 906 of the Sarbanes-Oxley Act of 2002. |
| | | |
| | American Campus Communities Operating Partnership, L.P. - Certification of Chief Executive Officer Pursuant to 18 U. S. C. Section 1350, as Adopted Pursuant to Section 906 of the Sarbanes-Oxley Act of 2002. |
| | | |
| | American Campus Communities Operating Partnership, L.P. - Certification of Chief Financial Officer Pursuant to 18 U.S.C. Section 1350, as Adopted Pursuant to Section 906 of the Sarbanes-Oxley Act of 2002. |
| | | |
| 101.INS | | XBRL Instance Document |
| | | |
| 101.SCH | | XBRL Taxonomy Extension Schema Document |
| | | |
| 101.CAL | | XBRL Taxonomy Extension Calculation Linkbase Document |
| | | |
| 101.DEF | | XBRL Taxonomy Extension Definition Linkbase Document |
| | | |
| 101.LAB | | XBRL Taxonomy Extension Label Linkbase Document |
| | | |
| 101.PRE | | XBRL Taxonomy Extension Presentation Linkbase Document |
SIGNATURES
Pursuant to the requirements of the Securities Exchange Act of 1934, as amended, the registrant has duly caused this report to be signed on its behalf by the undersigned thereunto duly authorized.
|
| |
| Dated: | November 3, 20172, 2018 |
|
| |
| AMERICAN CAMPUS COMMUNITIES, INC. |
| | |
| By: | /s/ Daniel B. Perry |
| | |
| | Daniel B. Perry
Executive Vice President,
Chief Financial Officer, Treasurer and Secretary |
| | |
| By: | /s/ Kim K. Voss |
| | |
| | Kim K. Voss
Executive Vice President,
Chief Accounting Officer,
and Assistant Secretary |
SIGNATURES
Pursuant to the requirements of the Securities Exchange Act of 1934, as amended, the registrant has duly caused this report to be signed on its behalf by the undersigned thereunto duly authorized.
|
| |
| Dated: | November 3, 20172, 2018 |
|
| | |
AMERICAN CAMPUS COMMUNITIES OPERATING PARTNERSHIP, L.P. |
| By: | American Campus Communities Holdings, LLC, its general partner |
| | By: | American Campus Communities, Inc.,
its sole member |
| | | |
| | By: | /s/ Daniel B. Perry |
| | | |
| | | Daniel B. Perry
Executive Vice President,
Chief Financial Officer,
Treasurer and Secretary |
| | | |
| | By: | /s/ Kim K. Voss |
| | | |
| | | Kim K. Voss
Executive Vice President,
Chief Accounting Officer, and Assistant Secretary |