UNITED STATES
SECURITIES AND EXCHANGE COMMISSION
WASHINGTON, D.C. 20549
FORM 10-Q
(Mark One) | | | | | |
| ☒ | QUARTERLY REPORT PURSUANT TO SECTION 13 OR 15(d) OF THE SECURITIES EXCHANGE ACT OF 1934 |
For the quarterly period ended June 30, 2021March 31, 2022
OR | | | | | |
| ☐ | TRANSITION REPORT PURSUANT TO SECTION 13 OR 15(d) OF THE SECURITIES EXCHANGE ACT OF 1934 FOR THE TRANSITION PERIOD FROM TO |
For the transition period from to
Commission File Number: 001-32236
________________
COHEN & STEERS, INC.
(Exact Name of Registrant as Specified in its Charter)
________________ | | | | | |
| Delaware | 14-1904657 |
(State or Other Jurisdiction of
Incorporation or Organization) | (I.R.S. Employer
Identification No.) |
280 Park Avenue
New York, NY 10017
(Address of Principal Executive Offices and Zip Code)
(212) 832-3232
(Registrant's Telephone Number, Including Area Code)
________________
Securities registered pursuant to Section 12(b) of the Act: | | | | | | | | | | | | | | | | | |
| Title of each class | | Trading Symbol(s) | | Name of each exchange on which registered |
| Common Stock, | $.01 $0.01 par value | | CNS | | New York Stock Exchange |
Indicate by check mark whether the registrant: (1) has filed all reports required to be filed by Section 13 or 15(d) of the Securities Exchange Act of 1934 during the preceding 12 months (or for such shorter period that the registrant was required to file such reports), and (2) has been subject to such filing requirements for the past 90 days. Yes ☒ No o
Indicate by check mark whether the registrant has submitted electronically every Interactive Data File required to be submitted pursuant to Rule 405 of Regulation S-T (§ 232.405 of this chapter) during the preceding 12 months (or for such shorter period that the registrant was required to submit such files). Yes ☒ No o
Indicate by check mark whether the registrant is a large accelerated filer, an accelerated filer, a non-accelerated filer, a smaller reporting company, or an emerging growth company. See the definitions of "large accelerated filer," "accelerated filer," "smaller reporting company," and "emerging growth company" in Rule 12b-2 of the Exchange Act. (Check one): | | | | | | | | | | | | | | | | | | | | |
| Large accelerated filer | | ☒ | | Accelerated filer | | ☐ |
| | | |
| Non-accelerated filer | | ☐ | | Smaller reporting company | | ☐ |
| | | | | | |
| Emerging growth company | | ☐ | | | | |
If an emerging growth company, indicate by check mark if the registrant has elected not to use the extended transition period for complying with any new or revised financial accounting standards provided pursuant to Section 13(a) of the Exchange Act. ☐
Indicate by check mark whether the registrant is a shell company (as defined in Rule 12b-2 of the Exchange Act). Yes ☐ No ☒
The number of shares of the registrant's common stock, par value $0.01 per share, outstanding as of August 2, 2021April 29, 2022 was 48,249,606.48,686,336.
COHEN & STEERS, INC. AND SUBSIDIARIES
Form 10-Q
Index
| | | | | | | | |
| | | Page |
| Part I. | Financial Information | |
| | |
| Item 1. | | |
| | |
| | |
| | |
| | |
| | |
| | |
| | |
| | |
| | |
| | |
| | |
| | |
| | |
| Item 2. | | |
| | |
| Item 3. | | |
| | |
| Item 4. | | |
| | |
| Part II. | Other Information * | |
| | |
| Item 1. | | |
| | |
| Item 1A. | | |
| | |
| Item 2. | | |
| | |
| Item 6. | | |
| |
| |
* Items other than those listed above have been omitted because they are not applicable.
Forward-Looking Statements
This report and other documents filed by us contain forward-looking statements within the meaning of Section 27A of the Securities Act of 1933, as amended, and Section 21E of the Securities Exchange Act of 1934, as amended, which reflect management's current views with respect to, among other things, our operations and financial performance. You can identify these forward-looking statements by the use of words such as "outlook," "believes," "expects," "potential," "continues," "may," "will," "should," "seeks," "approximately," "predicts," "intends," "plans," "estimates," "anticipates" or the negative versions of these words or other comparable words. Such forward-looking statements are subject to various risks and uncertainties. Accordingly, there are or will be important factors that could cause actual outcomes or results to differ materially from those indicated in these forward-looking statements. We believe that these factors include, but are not limited to, the risks described in the Risk Factors section of our Annual Report on Form 10-K for the year ended December 31, 20202021 (the Form 10-K), which is accessible on the Securities and Exchange Commission's website at www.sec.gov and on our website at www.cohenandsteers.com. These factors are not exhaustive and should be read in conjunction with the other cautionary statements that are included in this report, the Form 10-K and our other filings with the Securities and Exchange Commission. We undertake no obligation to publicly update or review any forward-looking statement, whether as a result of new information, future developments or otherwise.
PART I—Financial Information
Item 1. Financial Statements
COHEN & STEERS, INC. AND SUBSIDIARIES
CONDENSED CONSOLIDATED STATEMENTS OF FINANCIAL CONDITION (Unaudited)
(in thousands, except share data) | | | June 30,
2021 | | December 31, 2020 | | March 31,
2022 | | December 31, 2021 |
| Assets: | Assets: | | | | Assets: | | | |
| Cash and cash equivalents | Cash and cash equivalents | $ | 111,229 | | | $ | 41,232 | | Cash and cash equivalents | $ | 84,817 | | | $ | 184,373 | |
Investments ($100,900 and $80,743) (1) | 138,171 | | | 154,978 | | |
Investments ($227,888 and $127,912) (1) | | Investments ($227,888 and $127,912) (1) | 284,503 | | | 154,654 | |
| Accounts receivable | Accounts receivable | 78,752 | | | 69,680 | | Accounts receivable | 89,423 | | | 84,090 | |
Due from brokers ($2,611 and $223) (1) | 7,214 | | | 5,125 | | |
Due from brokers ($59,897 and $1,340) (1) | | Due from brokers ($59,897 and $1,340) (1) | 63,101 | | | 3,567 | |
| Property and equipment—net | Property and equipment—net | 9,040 | | | 10,341 | | Property and equipment—net | 8,618 | | | 8,938 | |
| Operating lease right-of-use assets—net | Operating lease right-of-use assets—net | 26,082 | | | 31,203 | | Operating lease right-of-use assets—net | 19,473 | | | 22,009 | |
| Goodwill and intangible assets—net | Goodwill and intangible assets—net | 20,146 | | | 20,495 | | Goodwill and intangible assets—net | 19,469 | | | 19,696 | |
| Other assets ($540 and $637) (1) | 12,535 | | | 15,399 | | |
| Other assets ($479 and $1,589) (1) | | Other assets ($479 and $1,589) (1) | 13,806 | | | 15,360 | |
| Total assets | Total assets | $ | 403,169 | | | $ | 348,453 | | Total assets | $ | 583,210 | | | $ | 492,687 | |
| | | Liabilities: | Liabilities: | | Liabilities: | |
| Accrued compensation and benefits | Accrued compensation and benefits | $ | 42,940 | | | $ | 56,384 | | Accrued compensation and benefits | $ | 24,750 | | | $ | 79,167 | |
| Distribution and service fees payable | Distribution and service fees payable | 10,237 | | | 7,748 | | Distribution and service fees payable | 9,923 | | | 10,183 | |
| Operating lease liabilities | Operating lease liabilities | 29,202 | | | 34,926 | | Operating lease liabilities | 21,687 | | | 24,525 | |
| Income tax payable | Income tax payable | 15,542 | | | 12,672 | | Income tax payable | 27,207 | | | 22,611 | |
Due to brokers ($3,105 and $128) (1) | 3,403 | | | 501 | | |
Other liabilities and accrued expenses ($184 and $326) (1) | 9,876 | | | 11,318 | | |
Due to brokers ($45,686 and $926) (1) | | Due to brokers ($45,686 and $926) (1) | 45,819 | | | 927 | |
Other liabilities and accrued expenses ($1,286 and $689) (1) | | Other liabilities and accrued expenses ($1,286 and $689) (1) | 13,803 | | | 10,948 | |
| Total liabilities | Total liabilities | 111,200 | | | 123,549 | | Total liabilities | 143,189 | | | 148,361 | |
| Commitments and contingencies (See Note 10) | Commitments and contingencies (See Note 10) | 0 | | 0 | Commitments and contingencies (See Note 10) | 0 | | 0 |
| Redeemable noncontrolling interests | Redeemable noncontrolling interests | 66,081 | | | 50,665 | | Redeemable noncontrolling interests | 184,656 | | | 89,143 | |
| Stockholders' equity: | Stockholders' equity: | | | | Stockholders' equity: | | | |
| Common stock, $0.01 par value; 500,000,000 shares authorized; 54,230,611 and 53,462,621 shares issued at June 30, 2021 and December 31, 2020, respectively | 542 | | | 535 | | |
| Common stock, $0.01 par value; 500,000,000 shares authorized; 54,993,067 and 54,267,309 shares issued at March 31, 2022 and December 31, 2021, respectively | | Common stock, $0.01 par value; 500,000,000 shares authorized; 54,993,067 and 54,267,309 shares issued at March 31, 2022 and December 31, 2021, respectively | 550 | | | 543 | |
| Additional paid-in capital | Additional paid-in capital | 692,719 | | | 670,142 | | Additional paid-in capital | 728,644 | | | 715,847 | |
| Accumulated deficit | Accumulated deficit | (240,744) | | | (291,542) | | Accumulated deficit | (217,453) | | | (231,967) | |
| Accumulated other comprehensive loss | Accumulated other comprehensive loss | (4,530) | | | (4,134) | | Accumulated other comprehensive loss | (7,437) | | | (5,886) | |
| Treasury stock, at cost, 5,984,617 and 5,674,510 shares at June 30, 2021 and December 31, 2020, respectively | (222,099) | | | (200,762) | | |
| Treasury stock, at cost, 6,310,559 and 5,997,239 shares at March 31, 2022 and December 31, 2021, respectively | | Treasury stock, at cost, 6,310,559 and 5,997,239 shares at March 31, 2022 and December 31, 2021, respectively | (248,939) | | | (223,354) | |
| Total stockholders' equity | Total stockholders' equity | 225,888 | | | 174,239 | | Total stockholders' equity | 255,365 | | | 255,183 | |
| Total liabilities, redeemable noncontrolling interests and stockholders' equity | Total liabilities, redeemable noncontrolling interests and stockholders' equity | $ | 403,169 | | | $ | 348,453 | | Total liabilities, redeemable noncontrolling interests and stockholders' equity | $ | 583,210 | | | $ | 492,687 | |
_________________________
(1) Asset and liability amounts in parentheses represent the aggregated balances at June 30, 2021March 31, 2022 and December 31, 20202021 attributable to variable interest entities consolidated by the Company. Refer to Note 4, Investmentsfor further discussion.
See notes to condensed consolidated financial statements
COHEN & STEERS, INC. AND SUBSIDIARIES
CONDENSED CONSOLIDATED STATEMENTS OF OPERATIONS (Unaudited)
(in thousands, except per share data)
| | | | | | | | | | | | | | | | | | | | | | | |
| | Three Months Ended
June 30, | | Six Months Ended
June 30, |
| | 2021 | | 2020 | | 2021 | | 2020 |
| Revenue: | | | | | | | |
| Investment advisory and administration fees | $ | 134,348 | | | $ | 86,648 | | | $ | 251,269 | | | $ | 183,937 | |
| Distribution and service fees | 9,199 | | | 6,930 | | | 17,471 | | | 14,713 | |
| Other | 722 | | | 509 | | | 1,276 | | | 1,267 | |
| Total revenue | 144,269 | | | 94,087 | | | 270,016 | | | 199,917 | |
| Expenses: | | | | | | | |
| Employee compensation and benefits | 53,241 | | | 34,320 | | | 99,003 | | | 72,937 | |
| Distribution and service fees | 18,848 | | | 12,518 | | | 35,354 | | | 26,622 | |
| General and administrative | 11,466 | | | 10,726 | | | 21,840 | | | 34,314 | |
| Depreciation and amortization | 1,017 | | | 1,228 | | | 2,184 | | | 2,380 | |
| Total expenses | 84,572 | | | 58,792 | | | 158,381 | | | 136,253 | |
| Operating income (loss) | 59,697 | | | 35,295 | | | 111,635 | | | 63,664 | |
| Non-operating income (loss): | | | | | | | |
| Interest and dividend income—net | 837 | | | 893 | | | 1,453 | | | 2,042 | |
| Gain (loss) from investments—net | 7,778 | | | 7,317 | | | 12,337 | | | (14,710) | |
| Foreign currency gain (loss)—net | (79) | | | (257) | | | (301) | | | 778 | |
| Total non-operating income (loss) | 8,536 | | | 7,953 | | | 13,489 | | | (11,890) | |
| Income before provision for income taxes | 68,233 | | | 43,248 | | | 125,124 | | | 51,774 | |
| Provision for income taxes | 15,827 | | | 11,086 | | | 20,288 | | | 11,544 | |
| Net income | 52,406 | | | 32,162 | | | 104,836 | | | 40,230 | |
| Net (income) loss attributable to redeemable noncontrolling interests | (5,827) | | | (3,642) | | | (9,405) | | | 8,862 | |
| Net income attributable to common stockholders | $ | 46,579 | | | $ | 28,520 | | | $ | 95,431 | | | $ | 49,092 | |
| | | | | | | |
| Earnings per share attributable to common stockholders: | | | | | | | |
| Basic | $ | 0.96 | | | $ | 0.60 | | | $ | 1.98 | | | $ | 1.03 | |
| Diluted | $ | 0.95 | | | $ | 0.59 | | | $ | 1.95 | | | $ | 1.01 | |
| Dividends declared per share | $ | 0.45 | | | $ | 0.39 | | | $ | 0.90 | | | $ | 0.78 | |
| Weighted average shares outstanding: | | | | | | | |
| Basic | 48,285 | | | 47,826 | | | 48,216 | | | 47,739 | |
| Diluted | 48,951 | | | 48,572 | | | 48,831 | | | 48,549 | |
| | | | | | | | | | | |
| | Three Months Ended
March 31, |
| | 2022 | | 2021 |
| Revenue: | | | |
| Investment advisory and administration fees | $ | 143,669 | | | $ | 116,921 | |
| Distribution and service fees | 9,869 | | | 8,272 | |
| Other | 651 | | | 554 | |
| Total revenue | 154,189 | | | 125,747 | |
| Expenses: | | | |
| Employee compensation and benefits | 54,743 | | | 45,762 | |
| Distribution and service fees | 33,951 | | | 16,506 | |
| General and administrative | 13,510 | | | 10,374 | |
| Depreciation and amortization | 994 | | | 1,167 | |
| Total expenses | 103,198 | | | 73,809 | |
| Operating income | 50,991 | | | 51,938 | |
| Non-operating income (loss): | | | |
| Interest and dividend income—net | 897 | | | 616 | |
| Gain (loss) from investments—net | 3,567 | | | 4,559 | |
| Foreign currency gain (loss)—net | 646 | | | (222) | |
| Total non-operating income (loss) | 5,110 | | | 4,953 | |
| Income before provision for income taxes | 56,101 | | | 56,891 | |
| Provision for income taxes | 9,260 | | | 4,461 | |
| Net income | 46,841 | | | 52,430 | |
| Net (income) loss attributable to redeemable noncontrolling interests | (4,823) | | | (3,578) | |
| Net income attributable to common stockholders | $ | 42,018 | | | $ | 48,852 | |
| | | |
| Earnings per share attributable to common stockholders: | | | |
| Basic | $ | 0.86 | | | $ | 1.01 | |
| Diluted | $ | 0.85 | | | $ | 1.00 | |
| | | |
| Weighted average shares outstanding: | | | |
| Basic | 48,673 | | | 48,145 | |
| Diluted | 49,337 | | | 48,709 | |
See notes to condensed consolidated financial statements
COHEN & STEERS, INC. AND SUBSIDIARIES
CONDENSED CONSOLIDATED STATEMENTS OF COMPREHENSIVE INCOME (Unaudited)
(in thousands)
| | | Three Months Ended
June 30, | | Six Months Ended
June 30, | | Three Months Ended
March 31, |
| | 2021 | | 2020 | | 2021 | | 2020 | | 2022 | | 2021 |
| Net income | Net income | $ | 52,406 | | | $ | 32,162 | | | $ | 104,836 | | | $ | 40,230 | | Net income | $ | 46,841 | | | $ | 52,430 | |
| Net (income) loss attributable to redeemable noncontrolling interests | Net (income) loss attributable to redeemable noncontrolling interests | (5,827) | | | (3,642) | | | (9,405) | | | 8,862 | | Net (income) loss attributable to redeemable noncontrolling interests | (4,823) | | | (3,578) | |
| Net income attributable to common stockholders | Net income attributable to common stockholders | 46,579 | | | 28,520 | | | 95,431 | | | 49,092 | | Net income attributable to common stockholders | 42,018 | | | 48,852 | |
| Other comprehensive income (loss): | Other comprehensive income (loss): | | | | | | | | Other comprehensive income (loss): | |
| Foreign currency translation gain (loss) | Foreign currency translation gain (loss) | 199 | | | 404 | | | (396) | | | (1,096) | | Foreign currency translation gain (loss) | (1,551) | | | (595) | |
| Total comprehensive income attributable to common stockholders | Total comprehensive income attributable to common stockholders | $ | 46,778 | | | $ | 28,924 | | | $ | 95,035 | | | $ | 47,996 | | Total comprehensive income attributable to common stockholders | $ | 40,467 | | | $ | 48,257 | |
See notes to condensed consolidated financial statements
COHEN & STEERS, INC. AND SUBSIDIARIES
CONDENSED CONSOLIDATED STATEMENTS OF CHANGES IN STOCKHOLDERS' EQUITY AND
REDEEMABLE NONCONTROLLING INTERESTS (Unaudited)
(in thousands, except per share data)
| | | Three Months Ended June 30, 2021 | | | Three Months Ended March 31, 2022 | |
| | Common
Stock | | Additional
Paid-In
Capital | | Accumulated Deficit | | Accumulated Other
Comprehensive
Income (Loss) | | Treasury
Stock | | Total
Stockholders'
Equity | | Redeemable
Noncontrolling
Interests | | | Common
Stock | | Additional
Paid-In
Capital | | Accumulated Deficit | | Accumulated Other
Comprehensive
Income (Loss) | | Treasury
Stock | | Total
Stockholders'
Equity | | Redeemable
Noncontrolling
Interests | |
| April 1, 2021 | | $ | 542 | | | $ | 680,466 | | | $ | (265,034) | | | $ | (4,729) | | | $ | (222,018) | | | $ | 189,227 | | | $ | 62,365 | | | |
| January 1, 2022 | | January 1, 2022 | | $ | 543 | | | $ | 715,847 | | | $ | (231,967) | | | $ | (5,886) | | | $ | (223,354) | | | $ | 255,183 | | | $ | 89,143 | | |
| Dividends ($0.55 per share) | | Dividends ($0.55 per share) | | — | | | — | | | (27,504) | | | — | | | — | | | (27,504) | | | — | | |
| Issuance of common stock | | Issuance of common stock | | 7 | | | 435 | | | — | | | — | | | — | | | 442 | | | — | | |
| Repurchase of common stock | | Repurchase of common stock | | — | | | — | | | — | | | — | | | (25,585) | | | (25,585) | | | — | | |
| Issuance of restricted stock units—net | | Issuance of restricted stock units—net | | — | | | 1,250 | | | — | | | — | | | — | | | 1,250 | | | — | | |
| Amortization of restricted stock units—net | | Amortization of restricted stock units—net | | — | | | 11,112 | | | — | | | — | | | — | | | 11,112 | | | — | | |
| | Net income (loss) | | Net income (loss) | | — | | | — | | | 42,018 | | | — | | | — | | | 42,018 | | | 4,823 | | |
| Other comprehensive income (loss) | | Other comprehensive income (loss) | | — | | | — | | | — | | | (1,551) | | | — | | | (1,551) | | | — | | |
| Net contributions (distributions) attributable to redeemable noncontrolling interests | | Net contributions (distributions) attributable to redeemable noncontrolling interests | | — | | | — | | | — | | | — | | | — | | | — | | | 90,690 | | |
| | March 31, 2022 | | March 31, 2022 | | $ | 550 | | | $ | 728,644 | | | $ | (217,453) | | | $ | (7,437) | | | $ | (248,939) | | | $ | 255,365 | | | $ | 184,656 | | |
| | | | Three Months Ended March 31, 2021 | |
| | | Common
Stock | | Additional
Paid-In
Capital | | Accumulated Deficit | | Accumulated Other
Comprehensive
Income (Loss) | | Treasury
Stock | | Total
Stockholders'
Equity | | Redeemable
Noncontrolling
Interests | |
| January 1, 2021 | | January 1, 2021 | | $ | 535 | | | $ | 670,142 | | | $ | (291,542) | | | $ | (4,134) | | | $ | (200,762) | | | $ | 174,239 | | | $ | 50,665 | | |
| Dividends ($0.45 per share) | Dividends ($0.45 per share) | | — | | | — | | | (22,289) | | | — | | | — | | | (22,289) | | | — | | | Dividends ($0.45 per share) | | — | | | (22,344) | | | — | | | — | | | (22,344) | | | — | | |
| Issuance of common stock | Issuance of common stock | | 0 | | | 311 | | | — | | | — | | | — | | | 311 | | | — | | | Issuance of common stock | | 7 | | | 423 | | | — | | | — | | | — | | | 430 | | | — | | |
| Repurchase of common stock | Repurchase of common stock | | — | | | — | | | — | | | — | | | (81) | | | (81) | | | — | | | Repurchase of common stock | | — | | | — | | | — | | | — | | | (21,256) | | | (21,256) | | | — | | |
| Issuance of restricted stock units—net | Issuance of restricted stock units—net | | — | | | 1,640 | | | — | | | — | | | — | | | 1,640 | | | — | | | Issuance of restricted stock units—net | | — | | | 793 | | | — | | | — | | | — | | | 793 | | | — | | |
| Amortization of restricted stock units | | — | | | 10,432 | | | — | | | — | | | — | | | 10,432 | | | — | | | |
| Forfeitures of restricted stock units | | — | | | (130) | | | — | | | — | | | — | | | (130) | | | — | | | |
| Amortization of restricted stock units—net | | Amortization of restricted stock units—net | | — | | | 9,108 | | | — | | | — | | | — | | | 9,108 | | | — | | |
| | Net income (loss) | Net income (loss) | | — | | | — | | | 46,579 | | | — | | | — | | | 46,579 | | | 5,827 | | | Net income (loss) | | — | | | — | | | 48,852 | | | — | | | — | | | 48,852 | | | 3,578 | | |
| Other comprehensive income (loss) | Other comprehensive income (loss) | | — | | | — | | | — | | | 199 | | | — | | | 199 | | | — | | | Other comprehensive income (loss) | | — | | | — | | | — | | | (595) | | | — | | | (595) | | | — | | |
| Net contributions (distributions) attributable to redeemable noncontrolling interests | Net contributions (distributions) attributable to redeemable noncontrolling interests | | — | | | — | | | — | | | — | | | — | | | — | | | (2,111) | | | Net contributions (distributions) attributable to redeemable noncontrolling interests | | — | | | — | | | — | | | — | | | — | | | — | | | 8,122 | | |
| | June 30, 2021 | | $ | 542 | | | $ | 692,719 | | | $ | (240,744) | | | $ | (4,530) | | | $ | (222,099) | | | $ | 225,888 | | | $ | 66,081 | | | |
| | Three Months Ended June 30, 2020 | | |
| Common
Stock | | Additional
Paid-In
Capital | | Accumulated Deficit | | Accumulated Other
Comprehensive
Income (Loss) | | Treasury
Stock | | Total
Stockholders'
Equity | | Redeemable
Noncontrolling
Interests | | |
| April 1, 2020 | | $ | 535 | | | $ | 644,397 | | | $ | (240,930) | | | $ | (7,826) | | | $ | (200,672) | | | $ | 195,504 | | | $ | 41,601 | | | |
| Dividends ($0.39 per share) | | — | | | — | | | (18,999) | | | — | | | — | | | (18,999) | | | — | | | |
| Issuance of common stock | | 0 | | | 305 | | | — | | | — | | | — | | | 305 | | | — | | | |
| Repurchase of common stock | | — | | | — | | | — | | | — | | | (68) | | | (68) | | | — | | | |
| Issuance of restricted stock units—net | | — | | | 516 | | | — | | | — | | | — | | | 516 | | | — | | | |
| Amortization of restricted stock units | | — | | | 7,376 | | | — | | | — | | | — | | | 7,376 | | | — | | | |
| Forfeitures of restricted stock units | | — | | | (15) | | | — | | | — | | | — | | | (15) | | | — | | | |
| Net income (loss) | | — | | | — | | | 28,520 | | | — | | | — | | | 28,520 | | | 3,642 | | | |
| Other comprehensive income (loss) | | — | | | — | | | — | | | 404 | | | — | | | 404 | | | — | | | |
| Net contributions (distributions) attributable to redeemable noncontrolling interests | | — | | | — | | | — | | | — | | | — | | | — | | | (2,170) | | | |
| | June 30, 2020 | | $ | 535 | | | $ | 652,579 | | | $ | (231,409) | | | $ | (7,422) | | | $ | (200,740) | | | $ | 213,543 | | | $ | 43,073 | | | |
| March 31, 2021 | | March 31, 2021 | | $ | 542 | | | $ | 680,466 | | | $ | (265,034) | | | $ | (4,729) | | | $ | (222,018) | | | $ | 189,227 | | | $ | 62,365 | | |
See notes to condensed consolidated financial statements
COHEN & STEERS, INC. AND SUBSIDIARIES
CONDENSED CONSOLIDATED STATEMENTS OF CHANGES IN STOCKHOLDERS' EQUITY AND
REDEEMABLE NONCONTROLLING INTERESTS (Unaudited)—(Continued)
(in thousands, except per share data)
| | | | | | | | | | | | | | | | | | | | | | | | | | | | | | | | | | | | | | | | | | | | | | |
| | Six Months Ended June 30, 2021 | | |
| | Common
Stock | | Additional
Paid-In
Capital | | Accumulated Deficit | | Accumulated Other
Comprehensive
Income (Loss) | | Treasury
Stock | | Total
Stockholders'
Equity | | Redeemable
Noncontrolling
Interests | | |
| January 1, 2021 | | $ | 535 | | | $ | 670,142 | | | $ | (291,542) | | | $ | (4,134) | | | $ | (200,762) | | | $ | 174,239 | | | $ | 50,665 | | | |
| Dividends ($0.90 per share) | | — | | | — | | | (44,633) | | | — | | | — | | | (44,633) | | | — | | | |
| Issuance of common stock | | 7 | | | 734 | | | — | | | — | | | — | | | 741 | | | — | | | |
| Repurchase of common stock | | — | | | — | | | — | | | — | | | (21,337) | | | (21,337) | | | — | | | |
| Issuance of restricted stock units—net | | — | | | 2,433 | | | — | | | — | | | — | | | 2,433 | | | — | | | |
| Amortization of restricted stock units | | — | | | 19,617 | | | — | | | — | | | — | | | 19,617 | | | — | | | |
| Forfeitures of restricted stock units | | — | | | (207) | | | — | | | — | | | — | | | (207) | | | — | | | |
| Net income (loss) | | — | | | — | | | 95,431 | | | — | | | — | | | 95,431 | | | 9,405 | | | |
| Other comprehensive income (loss) | | — | | | — | | | — | | | (396) | | | — | | | (396) | | | — | | | |
| Net contributions (distributions) attributable to redeemable noncontrolling interests | | — | | | — | | | — | | | — | | | — | | | — | | | 6,011 | | | |
| | | | | | | | | | | | | | | | |
| June 30, 2021 | | $ | 542 | | | $ | 692,719 | | | $ | (240,744) | | | $ | (4,530) | | | $ | (222,099) | | | $ | 225,888 | | | $ | 66,081 | | | |
| | | | | | | | | | | | | | | | |
| | Six Months Ended June 30, 2020 | | |
| | Common
Stock | | Additional
Paid-In
Capital | | Accumulated Deficit | | Accumulated Other
Comprehensive
Income (Loss) | | Treasury
Stock | | Total
Stockholders'
Equity | | Redeemable
Noncontrolling
Interests | | |
| January 1, 2020 | | $ | 527 | | | $ | 636,788 | | | $ | (242,461) | | | $ | (6,326) | | | $ | (174,825) | | | $ | 213,703 | | | $ | 53,412 | | | |
| Dividends ($0.78 per share) | | — | | | — | | | (38,040) | | | — | | | — | | | (38,040) | | | — | | | |
| Issuance of common stock | | 8 | | | 602 | | | — | | | — | | | — | | | 610 | | | — | | | |
| Repurchase of common stock | | — | | | — | | | — | | | — | | | (25,915) | | | (25,915) | | | — | | | |
| Issuance of restricted stock units—net | | — | | | 1,069 | | | — | | | — | | | — | | | 1,069 | | | — | | | |
| Amortization of restricted stock units | | — | | | 14,151 | | | — | | | — | | | — | | | 14,151 | | | — | | | |
| Forfeitures of restricted stock units | | — | | | (31) | | | — | | | — | | | — | | | (31) | | | — | | | |
| Net income (loss) | | — | | | — | | | 49,092 | | | — | | | — | | | 49,092 | | | (8,862) | | | |
| Other comprehensive income (loss) | | — | | | — | | | — | | | (1,096) | | | — | | | (1,096) | | | — | | | |
| Net contributions (distributions) attributable to redeemable noncontrolling interests | | — | | | — | | | — | | | — | | | — | | | — | | | (1,477) | | | |
| | | | | | | | | | | | | | | | |
| June 30, 2020 | | $ | 535 | | | $ | 652,579 | | | $ | (231,409) | | | $ | (7,422) | | | $ | (200,740) | | | $ | 213,543 | | | $ | 43,073 | | | |
| | | | | | | | | | | | | | | | |
See notes to condensed consolidated financial statements
COHEN & STEERS, INC. AND SUBSIDIARIES
CONDENSED CONSOLIDATED STATEMENTS OF CASH FLOWS (Unaudited)
(in thousands) | | | | Six Months Ended
June 30, | | Three Months Ended
March 31, |
| | | 2021 | | 2020 | | 2022 | | 2021 |
| Cash flows from operating activities: | Cash flows from operating activities: | | | | Cash flows from operating activities: | | | |
| Net income | Net income | $ | 104,836 | | | $ | 40,230 | | Net income | $ | 46,841 | | | $ | 52,430 | |
| Adjustments to reconcile net income to net cash provided by (used in) operating activities: | Adjustments to reconcile net income to net cash provided by (used in) operating activities: | Adjustments to reconcile net income to net cash provided by (used in) operating activities: |
| Stock-based compensation expense—net | Stock-based compensation expense—net | 20,780 | | | 14,561 | | Stock-based compensation expense—net | 11,757 | | | 9,348 | |
| | Depreciation and amortization | Depreciation and amortization | 8,071 | | | 8,142 | | Depreciation and amortization | 1,368 | | | 1,531 | |
| | Amortization of right-of-use assets | | Amortization of right-of-use assets | 2,682 | | | 2,557 | |
| | (Gain) loss from investments—net | (Gain) loss from investments—net | (12,337) | | | 14,710 | | (Gain) loss from investments—net | (3,567) | | | (4,559) | |
| Deferred income taxes | Deferred income taxes | 4,138 | | | 222 | | Deferred income taxes | 3,486 | | | 4,919 | |
| Foreign currency (gain) loss | Foreign currency (gain) loss | 2,095 | | | (245) | | Foreign currency (gain) loss | 974 | | | 1,059 | |
| Changes in operating assets and liabilities: | Changes in operating assets and liabilities: | | Changes in operating assets and liabilities: | |
| Accounts receivable | Accounts receivable | (11,167) | | | 7,351 | | Accounts receivable | (6,307) | | | (3,336) | |
| Due from brokers | Due from brokers | (2,089) | | | 1,246 | | Due from brokers | (59,429) | | | (956) | |
| Deferred commissions | Deferred commissions | (740) | | | (742) | | Deferred commissions | (180) | | | (358) | |
| Investments within consolidated Company-sponsored funds | Investments within consolidated Company-sponsored funds | (8,687) | | | 568 | | Investments within consolidated Company-sponsored funds | (100,755) | | | (8,695) | |
| | Other assets | Other assets | (116) | | | (6,549) | | Other assets | 4,204 | | | (2,978) | |
| Accrued compensation and benefits | Accrued compensation and benefits | (13,444) | | | (27,576) | | Accrued compensation and benefits | (54,417) | | | (35,492) | |
| Distribution and service fees payable | Distribution and service fees payable | 2,489 | | | 159 | | Distribution and service fees payable | (260) | | | 850 | |
| Operating lease liabilities | Operating lease liabilities | (5,724) | | | (5,633) | | Operating lease liabilities | (2,984) | | | (2,858) | |
| Due to brokers | Due to brokers | 2,902 | | | (304) | | Due to brokers | 44,760 | | | (367) | |
| Income tax payable | Income tax payable | 2,863 | | | 11,435 | | Income tax payable | 4,523 | | | (1,684) | |
| Other liabilities and accrued expenses | Other liabilities and accrued expenses | (3,847) | | | (1,974) | | Other liabilities and accrued expenses | 855 | | | (2,498) | |
| Net cash provided by (used in) operating activities | Net cash provided by (used in) operating activities | 90,023 | | | 55,601 | | Net cash provided by (used in) operating activities | (106,449) | | | 8,913 | |
| Cash flows from investing activities: | Cash flows from investing activities: | | | | Cash flows from investing activities: | | | |
| | Purchases of investments | Purchases of investments | (33,212) | | | (8,755) | | Purchases of investments | (36,478) | | | (17,417) | |
| Proceeds from sales and maturities of investments | Proceeds from sales and maturities of investments | 72,244 | | | 6,735 | | Proceeds from sales and maturities of investments | 6,787 | | | 57,048 | |
| Purchases of property and equipment | Purchases of property and equipment | (884) | | | (1,564) | | Purchases of property and equipment | (681) | | | (431) | |
| Proceeds from sales of property and equipment | 0 | | | 73 | | |
| | Net cash provided by (used in) investing activities | Net cash provided by (used in) investing activities | 38,148 | | | (3,511) | | Net cash provided by (used in) investing activities | (30,372) | | | 39,200 | |
| Cash flows from financing activities: | Cash flows from financing activities: | | | | Cash flows from financing activities: | | | |
| Issuance of common stock—net | Issuance of common stock—net | 629 | | | 518 | | Issuance of common stock—net | 375 | | | 365 | |
| Repurchase of common stock | Repurchase of common stock | (21,337) | | | (25,915) | | Repurchase of common stock | (25,585) | | | (21,256) | |
| Dividends to stockholders | Dividends to stockholders | (43,458) | | | (37,310) | | Dividends to stockholders | (26,832) | | | (21,726) | |
| Distributions to redeemable noncontrolling interests | (5,381) | | | (5,322) | | |
| Contributions from redeemable noncontrolling interests | 11,392 | | | 3,845 | | |
| Net contributions (distributions) from redeemable noncontrolling interests | | Net contributions (distributions) from redeemable noncontrolling interests | 90,690 | | | 8,122 | |
| Net cash provided by (used in) financing activities | Net cash provided by (used in) financing activities | (58,155) | | | (64,184) | | Net cash provided by (used in) financing activities | 38,648 | | | (34,495) | |
| Net increase (decrease) in cash and cash equivalents | Net increase (decrease) in cash and cash equivalents | 70,016 | | | (12,094) | | Net increase (decrease) in cash and cash equivalents | (98,173) | | | 13,618 | |
| Effect of foreign exchange rate changes on cash and cash equivalents | Effect of foreign exchange rate changes on cash and cash equivalents | (19) | | | (1,123) | | Effect of foreign exchange rate changes on cash and cash equivalents | (1,383) | | | (133) | |
| Cash and cash equivalents, beginning of the period | Cash and cash equivalents, beginning of the period | 41,232 | | | 101,352 | | Cash and cash equivalents, beginning of the period | 184,373 | | | 41,232 | |
| Cash and cash equivalents, end of the period | Cash and cash equivalents, end of the period | $ | 111,229 | | | $ | 88,135 | | Cash and cash equivalents, end of the period | $ | 84,817 | | | $ | 54,717 | |
See notes to condensed consolidated financial statements
COHEN & STEERS, INC. AND SUBSIDIARIES
CONDENSED CONSOLIDATED STATEMENTS OF CASH FLOWS—(Continued)
(UNAUDITED)
Supplemental disclosures of cash flow information:
During the sixthree months ended June 30,March 31, 2022 and 2021, the Company paid taxes of approximately $13.3 million. During the six months ended June 30, 2020, the Company paid taxes of approximately $2.5$1.3 million and received tax refunds of approximately $2.7 million. In March 2020, an emergency declaration pursuant to the Stafford Act was issued, which allowed the Company to defer income tax payments of approximately $9.3$1.2 million, to July 15, 2020.respectively.
Supplemental disclosures of non-cash investing and financing activities:
In connection with its stock incentive plan, the Company recordedissued dividend equivalents in the form of restricted stock unit dividend equivalents,units, net of forfeitures, in the amount of approximately $1.2$0.7 million and $0.7$0.6 million for the sixthree months ended June 30,March 31, 2022 and 2021, and 2020, respectively. These amounts are included in the issuance of restricted stock unitsunits—net and in dividends in the condensed consolidated statements of changes in stockholders' equity.
COHEN & STEERS, INC. AND SUBSIDIARIES
NOTES TO CONDENSED CONSOLIDATED FINANCIAL STATEMENTS
(UNAUDITED)
1. Organization and Description of Business
Cohen & Steers, Inc. (CNS) was organized as a Delaware corporation on March 17, 2004. CNS is the holding company for its direct and indirect subsidiaries, including Cohen & Steers Capital Management, Inc. (CSCM), Cohen & Steers Securities, LLC (CSS), Cohen & Steers Asia Limited (CSAL), Cohen & Steers UK Limited (CSUK), Cohen & Steers JapanIreland Limited (CSJL)(CSIL), Cohen & Steers Asia Limited (CSAL) and Cohen & Steers IrelandJapan Limited (CSIL)(CSJL) (collectively, the Company).
The Company is a leading global investment manager specializing in real assets and alternative income, including real estate, preferred securities, infrastructure, resource equities, commodities, as well as multi-strategy solutions. Founded in 1986, the Company is headquartered in New York City, with offices in London, Dublin, Hong Kong and Tokyo.
2. Basis of Presentation and Significant Accounting Policies
The condensed consolidated financial statements have been prepared in accordance with accounting principles generally accepted in the United States of America (GAAP). The condensed consolidated financial statements set forth herein include the accounts of CNS and its direct and indirect subsidiaries. Intercompany balances and transactions have been eliminated in consolidation.
The condensed consolidated financial statements of the Company included herein are unaudited and have been prepared in accordance with the instructions to Form 10-Q pursuant to the rules and regulations of the Securities and Exchange Commission (SEC). In the opinion of management, all adjustments, consisting of normal recurring adjustments, necessary for a fair presentation of the interim results have been made. The Company's condensed consolidated financial statements and the related notes should be read together with the consolidated financial statements and the related notes included in the Company's Annual Report on Form 10-K for the year ended December 31, 2020.
Recently Adopted Accounting Pronouncements—In December 2019, the Financial Accounting Standards Board (FASB) issued Accounting Standards Update 2019-12, Income Taxes (Topic 740): Simplifying the Accounting for Income Taxes. The standard is intended to simplify various aspects related to income taxes and removes certain exceptions to the general principles in Topic 740. This new guidance became effective on January 1, 2021. The Company's adoption of the new standard did not have a material effect on its condensed consolidated financial statements and related disclosures.
Accounting Estimates—The preparation of the condensed consolidated financial statements in conformity with GAAP requires management to make certain estimates and assumptions that affect the reported amounts of assets and liabilities and the disclosures of contingent assets and liabilities at the dates of the condensed consolidated financial statements and the reported amounts of revenue and expenses during the reporting periods. Management believes the estimates used in preparing the condensed consolidated financial statements are reasonable and prudent. Actual results could differ from those estimates.
ReclassificationsReclassifications——The Company reclassified certain prior period amounts in the Company's condensed consolidated statements of cash flows for the three months ended March 31, 2021 to conform with the current period presentation, primarily related to accruedpresentation. Accrued employee benefits which were reclassified from other liabilities and accrued expenses to accrued compensation and benefits on the Company's condensed consolidated statements of financial condition.benefits.
Consolidation of Company-sponsored Funds—Investments in Company-sponsored funds and management fees are evaluated at inception and thereafter, if there is a reconsideration event, in order to determine whether to apply the Variable Interest Entity (VIE) model or the Voting Interest Entity (VOE) model. In performing this analysis, all of the Company's management fees are presumed to be commensurate and at market and are therefore not considered variable interests.
A VIE is an entity in which either (i) the equity investment at risk is not sufficient to permit the entity to finance its own activities without additional financial support or (ii) the group of holders of the equity investment at risk lack certain characteristics of a controlling financial interest. The primary beneficiary is the entity that has (i) the power to direct the activities of the VIE that most significantly affect its performance, and (ii) the obligation to absorb losses of the entity or the right to receive benefits from the entity that could potentially be significant to the VIE. Subscriptions and redemptions or amendments to the governing documents of the respective entities could affect an entity's status as a VIE or the determination of the primary beneficiary. Limited partnerships and similar entities are determined to be a VIE when the Company is the general partner and the limited partners do not hold substantive kick-out or participation rights. The Company assesses whether it is the primary beneficiary of any VIEs identified by evaluating its economic interests in the entity held either directly by the Company and its affiliates or indirectly through employees. VIEs for which the Company is deemed to be the primary beneficiary are consolidated.
Investments in Company-sponsored funds that are determined to be VOEs are consolidated when the Company’s ownership interest is greater than 50% of the outstanding voting interests of the fund.
COHEN & STEERS, INC. AND SUBSIDIARIES
NOTES TO CONDENSED CONSOLIDATED FINANCIAL STATEMENTS—(Continued)
(UNAUDITED)
Investments in Company-sponsored funds that are determined to be VOEs are consolidated when the Company's ownership interest is greater than 50% of the outstanding voting interests of the fund or when the Company is the general partner of the fund and the limited partners do not have substantive kick-out or participating rights in the fund.
The Company records noncontrolling interests in consolidated Company-sponsored funds for which the Company'sCompany’s ownership is less than 100%.
Cash and Cash Equivalents—Cash and cash equivalents are on deposit with several highly rated financial institutions and include short-term, highly-liquidhighly liquid investments, which are readily convertible into cash and have original maturities of three months or less.
Due from/to Brokers—The Company, including the consolidated Company-sponsored funds, may transact with brokers for certain investment activities. The clearing and custody operations for these investment activities are performed pursuant to contractual agreements. The due from/to brokers balance representsbalances represent cash and/or cash collateral balances at brokers/custodians and/or receivables and payables for unsettled securities transactions with brokers.
Investments—Management of the Company determines the appropriate classification of its investments at the time of purchase and re-evaluates such determination no less than on a quarterly basis. The Company's investments are categorized as follows:
•Equity investments at fair value which generally represent listed equity securitiesare comprised of corporate investments and investments held within the consolidated Company-sponsored funds, listed equitywhich generally represent common stocks, limited partnership interests, master limited partnership interests, preferred securities held directly for the purpose of establishing performance track records and other seed investments in Company-sponsored open-end funds where the Company has neither control nor the ability to exercise significant influence.(see Note 5, Fair Value).
•Trading investments which generally represent debt securitiesare comprised of corporate investments and investments held within the consolidated Company-sponsored funds, and listed debt securities held directly for the purpose of establishing performance track records.
•Held-to-maturity investmentswhich generally represent corporate investments in U.S. Treasury securities recorded at amortized cost. Under the current expected credit loss model, any expected credit losses are recognized as an allowance, which represents an adjustment to the amortized costs basis. The Company did not hold any held-to-maturity investments at June 30, 2021.and debt securities.
•Equity method investments, which generally represent seed investments in Company-sponsored funds infor which the Company owns between 20-50% of the outstanding voting interests or when it is determined that the Company is able to exercise significant influence but not control over the investments. When using the equity method, the Company recognizes its respective share of net income or loss for the period which is recorded in gain (loss) from investments—net in the Company's condensed consolidated statements of operations.
Realized and unrealized gains and losses on equity investments at fair value, trading investments and equity method investments are recorded in gain (loss) from investments—net in the Company's condensed consolidated statements of operations.
From time to time, the Company, including the consolidated Company-sponsored funds, may enter into derivative contracts, including options, futures and swaps contracts, to gain exposure to the underlying commodities markets or to economically hedge market risk of the underlying portfolios. Gains and losses on derivative contracts are recorded in gain (loss) from investments—net in the Company's condensed consolidated statements of operations. The fair values of these instruments are recorded in other assets or other liabilities and accrued expenses on the Company's condensed consolidated statements of financial condition.
Additionally, from time to time, the Company, including the consolidated Company-sponsored funds, may enter into forward foreign exchange contracts to economically hedge currency exposure. These instruments are measured at fair value based on the prevailing forward exchange rate with gains and losses recorded in foreign currency gain (loss)—net in the Company’s condensed consolidated statements of operations. The fair values of these contracts are recorded in other assets or other liabilities and accrued expenses on the Company’s condensed consolidated statements of financial condition.
COHEN & STEERS, INC. AND SUBSIDIARIES
NOTES TO CONDENSED CONSOLIDATED FINANCIAL STATEMENTS—(Continued)
(UNAUDITED)
Leases—The Company determines if an arrangement is a lease at inception. The Company has operating leases for corporate offices and certain information technology equipment and these leaseswhich are included in operating lease right-of-use (ROU) assets and operating lease liabilities on the Company’s condensed consolidated statements of financial condition.
ROU assets represent the right to use an underlying asset for the lease term and lease liabilities represent obligations to make lease payments arising from the lease. Operating lease ROU assets and lease liabilities are recognized at commencement date based on the net present value of lease payments over the life of the lease. The majority of the Company’s lease agreements do not provide an implicit rate. As a result, the Company used anits estimated incremental borrowing rate based on the information available as of lease commencement dates in determining the present value of lease payments. The operating lease ROU assets reflect any upfront lease payments made as well as lease incentives received. The lease terms may include options to extend or terminate the lease and these are factored into the determination of the ROU
COHEN & STEERS, INC. AND SUBSIDIARIES
NOTES TO CONDENSED CONSOLIDATED FINANCIAL STATEMENTS—(Continued)
(UNAUDITED)
asset and lease liability at lease inception when and if it is reasonably certain that the Company will exercise that option. Lease expense for fixed lease payments is recognized on a straight-line basis over the lease term.
The Company has certain lease agreements with non-lease components such as maintenance and executory costs, which are accounted for separately and not included in ROU assets.
ROU assets are tested for impairment whenever changes in facts or circumstances indicate that the carrying amount of an asset may not be recoverable. Modification of a lease term would result in re-measurementremeasurement of the lease liability and a corresponding adjustment to the ROU asset.assets.
Redeemable Noncontrolling Interests—Redeemable noncontrolling interests represent third-party interests in the consolidated Company-sponsored funds. These interests are redeemable at the option of the investors and therefore are not treated as permanent equity. Redeemable noncontrolling interests are recorded at fair value which approximates the redemption value at each reporting period.
Investment Advisory and Administration Fees—The Company earns revenue by providing asset management services to institutional accounts, Company-sponsored open-end and closed-end funds as well as model-based portfolios. Investment advisory fees are earned pursuant to the terms of investment management agreements and are generally based on a contractual fee rate applied to the average assets under management. The Company also earns administration fees from certain Company-sponsored open-end and closed-end funds pursuant to the terms of underlying administration contracts. Administration fees are based on the average daily assets under management of such funds. Investment advisory and administration fee revenue is recognized when earned and is recorded net of any fund reimbursements. The investment advisory and administration contracts each include a single performance obligation as the services provided are not separately identifiable and are accounted for as a series satisfied over time using a time-based method (days elapsed). Additionally, investment advisory and administration fees represent variable consideration, as fees are based on average assets under management which fluctuate daily.
In certain instances, the Company may earn performance fees when specified performance hurdles are met during the performance period. Performance fees are forms of variable consideration and are not recognized until it becomes probable that there will not be a significant reversal of the cumulative revenue recognized.
Distribution and Service Fee Revenue—Distribution and service fee revenue is based on the average daily net assets of certain share classes of the Company's sponsored open-end funds distributed by CSS. Distribution and service fee revenue is earned daily and is recorded gross of any third-party distribution and service fee expense for applicable share classes.
Distribution fee agreements include a single performance obligation that is satisfied at a point in time when an investor purchases shares in a Company-sponsored open-end fund. Distribution fees represent variable consideration, as fees are based on average assets under management which fluctuate daily. For all periods presented, a portion of the distribution fee revenue recognized in the period may relate to performance obligations satisfied (or partially satisfied) in prior periods. Service fee agreements include a single performance obligation as the services provided are not separately identifiable and are accounted for as a series satisfied over time using a time-based method (days elapsed). ServiceAdditionally, distribution and service fees represent variable consideration, as fees are based on average assets under management which fluctuate daily.
Distribution and Service Fee Expense—Distribution and service fee expense includes distribution fees, shareholder servicing fees and intermediary assistance payments.
COHEN & STEERS, INC. AND SUBSIDIARIES
NOTES TO CONDENSED CONSOLIDATED FINANCIAL STATEMENTS—(Continued)
(UNAUDITED)
Distribution fees represent payments made to qualified intermediaries for (i) assistance in connection with the distribution of the Company's sponsored open-end funds' shares and (ii) for other expenses such as advertising, printing and distribution of prospectuses to investors. Such amounts may also be used to pay financial intermediaries for services as specified in the terms of written agreements complying with Rule 12b-1 of the Investment Company Act of 1940. Distribution fees are based on the average daily net assets under management of certain share classes of certain of the funds.
COHEN & STEERS, INC. AND SUBSIDIARIES
NOTES TO CONDENSED CONSOLIDATED FINANCIAL STATEMENTS—(Continued)
(UNAUDITED)
Shareholder servicing fees represent payments made to qualified intermediaries for shareholder account service and maintenance. These services are provided pursuant to written agreements with such qualified institutions. Shareholder servicing fees are generally based on the average daily net assets under management.
Intermediary assistance payments represent payments to qualified intermediaries for activities related to distribution, shareholder servicing as well as marketing and support of the Company's sponsored open-end funds and are incremental to those described above. Intermediary assistance payments are generally based on the average daily net assets under management.
Stock-based Compensation—The Company recognizes compensation expense for the grant-date fair value of restricted stock unit awards to certain employees. This expense is recognized over the period during which employees are required to provide service. Forfeitures are recorded as incurred. Any change to the key terms of an employee’s award subsequent to the grant date is evaluated and, if necessary, accounted for as a modification. If the modification results in the remeasurement of the fair value of the award, the remeasured compensation cost is recognized over the remaining service period.
Income Taxes—The Company records the current and deferred tax consequences of all transactions that have been recognized in the condensed consolidated financial statements in accordance with the provisions of the enacted tax laws. Deferred tax assets are recognized for temporary differences that will result in deductible amounts in future years at tax rates that are expected to apply in those years. Deferred tax liabilities are recognized for temporary differences that will result in taxable income in future years at tax rates that are expected to apply in those years. The Company records a valuation allowance, when necessary, to reduce deferred tax assets to an amount that more likely than not will be realized. The effective tax rate for interim periods is based on the Company's best estimate of the effective tax rate expected to be applied
to the full fiscal year adjusted for discrete tax items during the period.
The calculation of tax liabilities involves uncertainties in the application of complex tax laws and regulations across the Company's global operations. A tax benefit from an uncertain tax position is recognized when it is more likely than not that the position will be sustained upon examination, including resolution of any related appeals or litigation processes, on the basis of the technical merits. The Company records potential interest and penalties related to uncertain tax positions in the provision for income taxes in the condensed consolidated statements of operations.
Currency Translation and Transactions—Assets and liabilities of subsidiaries having non-U.S. dollar functional currencies are translated at exchange rates at the applicable condensed consolidated statement of financial condition date. Revenue and expenses of such subsidiaries are translated at average exchange rates during the period. The gains or losses resulting from translating non-U.S. dollar functional currency into U.S. dollars are included in the Company's condensed consolidated statements of comprehensive income. The cumulative translation adjustment was $(4.5)$(7.4) million and $(4.1)$(5.9) million at June 30, 2021March 31, 2022 and December 31, 2020, respectively.2021, respectively, and was reported within accumulated other comprehensive income (loss) on the condensed consolidated statements of financial condition. Gains or losses resulting from transactions denominated in currencies other than the U.S. dollar within certain foreign subsidiaries are included in foreign currency gain (loss)-net within non-operating income (loss) in the condensed consolidated statements of operations. Gainsand gains and losses arising on revaluation of U.S. dollar-denominated assets and liabilities held by certain foreign subsidiaries are also included in foreign currency gain (loss)-net within non-operating income (loss) in the Company’s condensed consolidated statements of operations.
Comprehensive Income—The Company reports all changes in comprehensive income in the condensed consolidated statements of comprehensive income. Comprehensive income generally includes net income or loss attributable to common stockholders and amounts attributable to foreign currency translation gain (loss).
COHEN & STEERS, INC. AND SUBSIDIARIES
NOTES TO CONDENSED CONSOLIDATED FINANCIAL STATEMENTS—(Continued)
(UNAUDITED)
3. Revenue
The following tables summarize revenue recognized from contracts with customers by client domicile and by investment vehicle:
| | | | | | | | | | | | | | | | | | | | | | | |
| Three Months Ended
June 30, | | Six Months Ended
June 30, |
| (in thousands) | 2021 | | 2020 | | 2021 | | 2020 |
| Client domicile: | | | | | | | |
| North America | $ | 124,126 | | | $ | 81,407 | | | $ | 234,442 | | | $ | 172,414 | |
| Japan | 9,529 | | | 7,486 | | | 18,061 | | | 15,902 | |
| Europe, Middle East and Africa | 7,295 | | | 2,658 | | | 11,276 | | | 5,993 | |
| Asia Pacific excluding Japan | 3,319 | | | 2,536 | | | 6,237 | | | 5,608 | |
| Total | $ | 144,269 | | | $ | 94,087 | | | $ | 270,016 | | | $ | 199,917 | |
| | | | | | | |
| | | | | | | |
| | | | | | | |
| | | | | | | |
| | | | | | | |
| | | | | | | |
| | | | | | | |
| | | | | | | |
| | | | | | | |
| | | | | | | |
| | | | | | | |
| | | | | | | |
| | | | | | | | | | | |
| Three Months Ended
March 31, |
| (in thousands) | 2022 | | 2021 |
| Client domicile: | | | |
| North America | $ | 135,200 | | | $ | 110,316 | |
| Japan | 9,523 | | | 8,532 | |
| Europe, Middle East and Africa | 5,953 | | | 3,981 | |
| Asia Pacific excluding Japan | 3,513 | | | 2,918 | |
| Total | $ | 154,189 | | | $ | 125,747 | |
| | | |
| | | |
| | | |
| | | |
| | | |
| | | |
| | | |
| | | |
| | | |
| | | |
| | | |
| | | |
| | | Three Months Ended
June 30, | | Six Months Ended
June 30, | | Three Months Ended
March 31, |
| (in thousands) | (in thousands) | 2021 | | 2020 | | 2021 | | 2020 | (in thousands) | 2022 | | 2021 |
| | Investment vehicle: | Investment vehicle: | | | | | | | | Investment vehicle: | | | |
Open-end funds (1) | Open-end funds (1) | $ | 79,627 | | | $ | 52,075 | | | $ | 149,056 | | | $ | 110,424 | | Open-end funds (1) | $ | 90,185 | | | $ | 69,429 | |
| Institutional accounts | Institutional accounts | 37,381 | | | 24,500 | | | 68,368 | | | 52,359 | | Institutional accounts | 36,683 | | | 30,987 | |
| Closed-end funds | Closed-end funds | 27,261 | | | 17,512 | | | 52,592 | | | 37,134 | | Closed-end funds | 27,321 | | | 25,331 | |
| | Total | Total | $ | 144,269 | | | $ | 94,087 | | | $ | 270,016 | | | $ | 199,917 | | Total | $ | 154,189 | | | $ | 125,747 | |
________________________
(1) Included distribution and service fees and other revenue for the periods presented.
revenue.
4. Investments
The following table summarizes the Company's investments -investments: | | | | | | | | | | | |
| (in thousands) | June 30,
2021 | | December 31,
2020 |
| Equity investments at fair value | $ | 111,677 | | | $ | 94,089 | |
| Trading | 26,480 | | | 18,700 | |
Held-to-maturity carried at amortized cost (1) | 0 | | | 41,648 | |
| Equity method | 14 | | | 541 | |
| Total investments | $ | 138,171 | | | $ | 154,978 | |
_________________________
(1) At December 31, 2020, held-to-maturity investments comprised of U.S. Treasury securities had a fair value of approximately $41.7 million. These securities would have been classified as level 2 within the fair value hierarchy if carried at fair value.
There were 0 new funds seeded for either the six months ended June 30, 2021 or 2020.
| | | | | | | | | | | |
| (in thousands) | March 31,
2022 | | December 31, 2021 |
| Equity investments at fair value | $ | 217,821 | | | $ | 130,930 | |
| Trading | 66,671 | | | 23,711 | |
| | | |
| Equity method | 11 | | | 13 | |
| Total investments | $ | 284,503 | | | $ | 154,654 | |
COHEN & STEERS, INC. AND SUBSIDIARIES
NOTES TO CONDENSED CONSOLIDATED FINANCIAL STATEMENTS—(Continued)
(UNAUDITED)
The following table summarizes gain (loss) from investments—net, including derivative financial instruments, the majority of which are used to economically hedge certain exposures (see Note 6)6, Derivatives):
| | | | | | | | | | | | | | | | | | | | | | | |
| | Three Months Ended
June 30, | | Six Months Ended
June 30, |
| (in thousands) | 2021 | | 2020 | | 2021 | | 2020 |
| Net realized gains (losses) during the period | $ | 2,567 | | | $ | (4,191) | | | $ | 4,456 | | | $ | (5,421) | |
Net unrealized gains (losses) during the period on investments still held at the end of the period | 5,211 | | | 11,508 | | | 7,881 | | | (9,289) | |
Gain (loss) from investments—net (1) | $ | 7,778 | | | $ | 7,317 | | | $ | 12,337 | | | $ | (14,710) | |
| | | | | | | | | | | |
| | Three Months Ended
March 31, |
| (in thousands) | 2022 | | 2021 |
| Net realized gains (losses) during the period | $ | 8,181 | | | $ | 1,889 | |
Net unrealized gains (losses) during the period on investments still held at the end of the period | (4,614) | | | 2,670 | |
Gain (loss) from investments—net (1) | $ | 3,567 | | | $ | 4,559 | |
________________________
(1) Included net incomegain (loss) attributable to redeemable noncontrolling interests.
At June 30, 2021March 31, 2022 and December 31, 2020,2021, the Company's consolidated VIEs included the Cohen & Steers SICAV Global Listed Infrastructure Fund (GLI SICAV), the Cohen & Steers SICAV Global Real Estate Fund (SICAV GRE), the
COHEN & STEERS, INC. AND SUBSIDIARIES
NOTES TO CONDENSED CONSOLIDATED FINANCIAL STATEMENTS—(Continued)
(UNAUDITED)
Cohen & Steers SICAV Diversified Real Assets Fund (SICAV RAP) and, the Cohen & Steers Co-Investment Partnership, L.P. (GRP-CIP) and the Cohen & Steers Real Estate Opportunities Fund, L.P. (REOF).
The following tables summarize the condensed consolidated statements of financial condition attributable to the Company's consolidated VIEs: | | | June 30, 2021 | | March 31, 2022 |
| (in thousands) | (in thousands) | GLI SICAV | | SICAV GRE | | SICAV RAP | | GRP-CIP | | Total | (in thousands) | GLI SICAV | | SICAV GRE | | SICAV RAP | | GRP-CIP | | REOF | | Total |
Assets (1) | Assets (1) | | | | | | | | | | Assets (1) | | | | | | | | | | | |
| Investments | Investments | $ | 7,669 | | | $ | 51,682 | | | $ | 41,285 | | | $ | 264 | | | $ | 100,900 | | Investments | $ | 24,517 | | | $ | 84,219 | | | $ | 100,133 | | | $ | 161 | | | $ | 18,858 | | | $ | 227,888 | |
| Due from brokers | Due from brokers | 103 | | | 1,730 | | | 732 | | | 46 | | | 2,611 | | Due from brokers | 49 | | | 52,240 | | | 7,573 | | | 35 | | | — | | | 59,897 | |
| Other assets | Other assets | 38 | | | 169 | | | 333 | | | 0 | | | 540 | | Other assets | 38 | | | 177 | | | 264 | | | — | | | — | | | 479 | |
| Total assets | Total assets | $ | 7,810 | | | $ | 53,581 | | | $ | 42,350 | | | $ | 310 | | | $ | 104,051 | | Total assets | $ | 24,604 | | | $ | 136,636 | | | $ | 107,970 | | | $ | 196 | | | $ | 18,858 | | | $ | 288,264 | |
| Liabilities (1) | Liabilities (1) | | Liabilities (1) | |
| Due to brokers | Due to brokers | $ | 38 | | | $ | 2,339 | | | $ | 728 | | | $ | 0 | | | $ | 3,105 | | Due to brokers | $ | — | | | $ | 37,750 | | | $ | 7,936 | | | $ | — | | | $ | — | | | $ | 45,686 | |
| Other liabilities and accrued expenses | Other liabilities and accrued expenses | 25 | | | 82 | | | 72 | | | 5 | | | 184 | | Other liabilities and accrued expenses | 38 | | | 105 | | | 716 | | | 5 | | | 422 | | | 1,286 | |
| Total liabilities | Total liabilities | $ | 63 | | | $ | 2,421 | | | $ | 800 | | | $ | 5 | | | $ | 3,289 | | Total liabilities | $ | 38 | | | $ | 37,855 | | | $ | 8,652 | | | $ | 5 | | | $ | 422 | | | $ | 46,972 | |
| | | December 31, 2020 | | December 31, 2021 |
| (in thousands) | (in thousands) | GLI SICAV | | SICAV GRE | | SICAV RAP | | GRP-CIP | | Total | (in thousands) | GLI SICAV | | SICAV GRE | | SICAV RAP | | GRP-CIP | | REOF | | Total |
Assets (1) | Assets (1) | | | | | | | | | | Assets (1) | | | | | | | | | | | |
| Investments | Investments | $ | 7,140 | | | $ | 39,672 | | | $ | 33,654 | | | $ | 277 | | | $ | 80,743 | | Investments | $ | 8,266 | | | $ | 57,354 | | | $ | 59,493 | | | $ | 150 | | | $ | 2,649 | | | $ | 127,912 | |
| Due from brokers | Due from brokers | 69 | | | 45 | | | 52 | | | 57 | | | 223 | | Due from brokers | — | | | 1,107 | | | 86 | | | 147 | | | — | | | 1,340 | |
| Other assets | Other assets | 44 | | | 359 | | | 234 | | | 0 | | | 637 | | Other assets | 42 | | | 214 | | | 740 | | | — | | | 593 | | | 1,589 | |
| Total assets | Total assets | $ | 7,253 | | | $ | 40,076 | | | $ | 33,940 | | | $ | 334 | | | $ | 81,603 | | Total assets | $ | 8,308 | | | $ | 58,675 | | | $ | 60,319 | | | $ | 297 | | | $ | 3,242 | | | $ | 130,841 | |
| Liabilities (1) | Liabilities (1) | | Liabilities (1) | |
| Due to brokers | Due to brokers | $ | 27 | | | $ | 40 | | | $ | 61 | | | $ | 0 | | | $ | 128 | | Due to brokers | $ | — | | | $ | 347 | | | $ | 579 | | | $ | — | | | $ | — | | | $ | 926 | |
| Other liabilities and accrued expenses | Other liabilities and accrued expenses | 29 | | | 211 | | | 81 | | | 5 | | | 326 | | Other liabilities and accrued expenses | 35 | | | 126 | | | 108 | | | 5 | | | 415 | | | 689 | |
| Total liabilities | Total liabilities | $ | 56 | | | $ | 251 | | | $ | 142 | | | $ | 5 | | | $ | 454 | | Total liabilities | $ | 35 | | | $ | 473 | | | $ | 687 | | | $ | 5 | | | $ | 415 | | | $ | 1,615 | |
_________________________
(1) The assets may only be used to settle obligations of each VIE and the liabilities are the sole obligation of each VIE, for which creditors do not have recourse to the general credit of the Company.
COHEN & STEERS, INC. AND SUBSIDIARIES
NOTES TO CONDENSED CONSOLIDATED FINANCIAL STATEMENTS—(Continued)
(UNAUDITED)
5. Fair Value
Accounting Standards Codification Topic 820, Fair Value Measurement (ASC 820) specifies a hierarchy of valuation classifications based on whether the inputs to the valuation techniques used in each valuation classification are observable or unobservable. These classifications are summarized in the three broad levels listed below:
•Level 1—Unadjusted quoted prices for identical instruments in active markets.
•Level 2—Quoted prices for similar instruments in active markets; quoted prices for identical or similar instruments in markets that are not active; and model-derived valuations in which all significant inputs and significant value drivers are observable.
•Level 3—Valuations derived from valuation techniques in which significant inputs or significant value drivers are unobservable.
Inputs used to measure fair value might fall in different levels of the fair value hierarchy, in which case the Company defaults to the lowest level input that is significant to the fair value measurement in its entirety. These levels are not necessarily an indication of the risk or liquidity associated with the investments.
COHEN & STEERS, INC. AND SUBSIDIARIES
NOTES TO CONDENSED CONSOLIDATED FINANCIAL STATEMENTS—(Continued)
(UNAUDITED)
The following tables present fair value measurements: | | | June 30, 2021 | | March 31, 2022 |
| (in thousands) | (in thousands) | Level 1 | | Level 2 | | Level 3 | | Investments Measured at NAV (1) | | | Total | (in thousands) | Level 1 | | Level 2 | | Level 3 | | Investments Measured at NAV (1) | | | Total |
| Cash equivalents | Cash equivalents | $ | 91,186 | | | $ | — | | | $ | — | | | $ | — | | | | $ | 91,186 | | Cash equivalents | $ | 36,380 | | | $ | — | | | $ | — | | | $ | — | | | | $ | 36,380 | |
| Equity investments at fair value: | Equity investments at fair value: | | | | | | | | | | | Equity investments at fair value: | | | | | | | | | | |
| Common stocks | Common stocks | $ | 108,547 | | | $ | 199 | | | $ | — | | | $ | 0 | | | | $ | 108,746 | | Common stocks | $ | 195,661 | | | $ | 482 | | | $ | — | | | $ | — | | | | $ | 196,143 | |
| Company-sponsored funds | 93 | | | 0 | | | — | | | 0 | | | | 93 | | |
| Limited partnership interests | Limited partnership interests | 1,158 | | | 0 | | | — | | | 264 | | | | 1,422 | | Limited partnership interests | — | | | — | | | 17,753 | | | 1,253 | | | | 19,006 | |
| Master limited partnership interests | | Master limited partnership interests | 1,126 | | | — | | | — | | | — | | | | 1,126 | |
| Preferred securities | Preferred securities | 1,269 | | | 14 | | | — | | | 0 | | | | 1,283 | | Preferred securities | 1,211 | | | — | | | — | | | — | | | | 1,211 | |
| Other | Other | 0 | | | 0 | | | — | | | 133 | | | | 133 | | Other | 209 | | | — | | | — | | | 126 | | | | 335 | |
| Total | Total | $ | 111,067 | | | $ | 213 | | | $ | — | | | $ | 397 | | | | $ | 111,677 | | Total | $ | 198,207 | | | $ | 482 | | | $ | 17,753 | | | $ | 1,379 | | | | $ | 217,821 | |
| Trading investments: | Trading investments: | | | | | | | | | | | Trading investments: | | | | | | | | | | |
| Fixed income | Fixed income | $ | 0 | | | $ | 26,480 | | | $ | — | | | $ | 0 | | | | $ | 26,480 | | Fixed income | $ | — | | | $ | 66,671 | | | $ | — | | | $ | — | | | | $ | 66,671 | |
| | Equity method investments | Equity method investments | $ | — | | | $ | 0 | | | $ | — | | | $ | 14 | | | | $ | 14 | | Equity method investments | $ | — | | | $ | — | | | $ | — | | | $ | 11 | | | | $ | 11 | |
| | Total investments | Total investments | $ | 111,067 | | | $ | 26,693 | | | $ | — | | | $ | 411 | | | | $ | 138,171 | | Total investments | $ | 198,207 | | | $ | 67,153 | | | $ | 17,753 | | | $ | 1,390 | | | | $ | 284,503 | |
| | Derivatives - assets: | Derivatives - assets: | | | | Derivatives - assets: | | | |
| Futures - commodities | $ | 839 | | | $ | — | | | $ | — | | | $ | — | | | | $ | 839 | | |
| Total return swaps - commodities (2) | | Total return swaps - commodities (2) | $ | — | | | $ | 38 | | | $ | — | | | $ | — | | | | $ | 38 | |
| Forward contracts - foreign exchange | | Forward contracts - foreign exchange | — | | | 1,064 | | | — | | | — | | | | 1,064 | |
| Total | | Total | $ | — | | | $ | 1,102 | | | $ | — | | | $ | — | | | | $ | 1,102 | |
| Derivatives - liabilities: | | Derivatives - liabilities: | | | | | | | | | | |
| Total return swaps - commodities (2) | Total return swaps - commodities (2) | 0 | | | 113 | | | — | | | — | | | | 113 | | Total return swaps - commodities (2) | $ | — | | | $ | 762 | | | $ | — | | | $ | — | | | | $ | 762 | |
| Total return swaps - equities | Total return swaps - equities | — | | | 24 | | | — | | | — | | | | 24 | | Total return swaps - equities | — | | | 1,141 | | | — | | | — | | | | 1,141 | |
| Forward contracts - foreign exchange | Forward contracts - foreign exchange | — | | | 149 | | | — | | | — | | | | 149 | | Forward contracts - foreign exchange | — | | | 49 | | | — | | | — | | | | 49 | |
| Total | Total | $ | 839 | | | $ | 286 | | | $ | — | | | $ | — | | | | $ | 1,125 | | Total | $ | — | | | $ | 1,952 | | | $ | — | | | $ | — | | | | $ | 1,952 | |
| Derivatives - liabilities: | | | | | | | | | | | |
| Futures - commodities | $ | 259 | | | $ | 0 | | | $ | — | | | $ | — | | | | $ | 259 | | |
| Total return swaps - commodities | — | | | 363 | | | — | | | — | | | | 363 | | |
| Total return swaps - equities | — | | | 487 | | | — | | | — | | | | 487 | | |
| Forward contracts - foreign exchange | 0 | | | 17 | | | — | | | — | | | | 17 | | |
| Total | $ | 259 | | | $ | 867 | | | $ | — | | | $ | — | | | | $ | 1,126 | | |
________________________
(1) Comprised of certain investments measured at fair value using net asset value (NAV) as a practical expedient.
(2) Included total return swaps - commodities held by consolidated Company-sponsored funds.
COHEN & STEERS, INC. AND SUBSIDIARIES
NOTES TO CONDENSED CONSOLIDATED FINANCIAL STATEMENTS—(Continued)
(UNAUDITED)
| | | December 31, 2020 | | December 31, 2021 |
| (in thousands) | (in thousands) | Level 1 | | Level 2 | | Level 3 | | Investments Measured at NAV (1) | | Investments
Carried at
Amortized Cost | | Total | (in thousands) | Level 1 | | Level 2 | | Level 3 | | Investments Measured at NAV (1) | | | Total |
| Cash equivalents | Cash equivalents | $ | 23,372 | | | $ | — | | | $ | — | | | $ | — | | | $ | — | | | $ | 23,372 | | Cash equivalents | $ | 104,591 | | | $ | — | | | $ | — | | | $ | — | | | | $ | 104,591 | |
| Equity investments at fair value: | Equity investments at fair value: | | | | | | | | | | | | Equity investments at fair value: | | | | | | | | | | |
| Common stocks | Common stocks | $ | 91,614 | | | $ | — | | | $ | — | | | $ | — | | | $ | — | | | $ | 91,614 | | Common stocks | $ | 126,301 | | | $ | 116 | | | $ | — | | | $ | — | | | | $ | 126,417 | |
| Company-sponsored funds | 246 | | | — | | | — | | | — | | | — | | | 246 | | |
| Limited partnership interests | Limited partnership interests | 831 | | | — | | | — | | | 277 | | | — | | | 1,108 | | Limited partnership interests | — | | | — | | | — | | | 1,816 | | | | 1,816 | |
| Master limited partnership interests | | Master limited partnership interests | 986 | | | — | | | — | | | — | | | | 986 | |
| Preferred securities | Preferred securities | 983 | | | 12 | | | — | | | — | | | — | | | 995 | | Preferred securities | 1,465 | | | — | | | — | | | — | | | | 1,465 | |
| Other | Other | — | | | — | | | — | | | 126 | | | — | | | 126 | | Other | 103 | | | — | | | — | | | 143 | | | | 246 | |
| Total | Total | $ | 93,674 | | | $ | 12 | | | $ | — | | | $ | 403 | | | $ | — | | | $ | 94,089 | | Total | $ | 128,855 | | | $ | 116 | | | $ | — | | | $ | 1,959 | | | | $ | 130,930 | |
| Trading investments: | Trading investments: | | | | | | | | | | | | Trading investments: | | | | | | | | | | |
| Fixed income | Fixed income | $ | — | | | $ | 18,700 | | | $ | — | | | $ | 0 | | | $ | — | | | $ | 18,700 | | Fixed income | $ | — | | | $ | 23,711 | | | $ | — | | | $ | — | | | | $ | 23,711 | |
| Held-to-maturity investments | $ | — | | | $ | — | | | $ | — | | | $ | — | | | $ | 41,648 | | | $ | 41,648 | | |
| | Equity method investments | Equity method investments | $ | — | | | $ | 0 | | | $ | — | | | $ | 541 | | | $ | — | | | $ | 541 | | Equity method investments | $ | — | | | $ | — | | | $ | — | | | $ | 13 | | | | $ | 13 | |
| | Total investments | Total investments | $ | 93,674 | | | $ | 18,712 | | | $ | — | | | $ | 944 | | | $ | 41,648 | | | $ | 154,978 | | Total investments | $ | 128,855 | | | $ | 23,827 | | | $ | — | | | $ | 1,972 | | | | $ | 154,654 | |
| | Derivatives - assets: | Derivatives - assets: | | Derivatives - assets: | | | |
| Futures - commodities | $ | 1,012 | | | $ | — | | | $ | — | | | $ | — | | | $ | — | | | $ | 1,012 | | |
Total return swaps - commodities (2) | | Total return swaps - commodities (2) | $ | — | | | $ | 481 | | | $ | — | | | $ | — | | | | $ | 481 | |
| | Forward contracts - foreign exchange | | Forward contracts - foreign exchange | — | | | 209 | | | — | | | — | | | | 209 | |
| | Total | | Total | $ | — | | | $ | 690 | | | $ | — | | | $ | — | | | | $ | 690 | |
| Derivatives - liabilities: | | Derivatives - liabilities: | | | | | | | | | | |
| | Derivatives - liabilities: | | | | | | | | | | | | |
| Futures - commodities | $ | 416 | | | $ | — | | | $ | — | | | $ | — | | | $ | — | | | $ | 416 | | |
| Total return swaps - commodities | Total return swaps - commodities | — | | | 136 | | | — | | | — | | | — | | | 136 | | Total return swaps - commodities | $ | — | | | $ | 17 | | | $ | — | | | $ | — | | | | $ | 17 | |
| Total return swaps - equities | Total return swaps - equities | — | | | 1,562 | | | — | | | — | | | — | | | 1,562 | | Total return swaps - equities | — | | | 867 | | | — | | | — | | | | 867 | |
| Forward contracts - foreign exchange | Forward contracts - foreign exchange | — | | | 345 | | | — | | | — | | | — | | | 345 | | Forward contracts - foreign exchange | — | | | 3 | | | — | | | — | | | | 3 | |
| Total | Total | $ | 416 | | | $ | 2,043 | | | $ | — | | | $ | — | | | $ | — | | | $ | 2,459 | | Total | $ | — | | | $ | 887 | | | $ | — | | | $ | — | | | | $ | 887 | |
________________________
(1) Comprised of certain investments measured at fair value using net asset value (NAV)NAV as a practical expedient.
(2) Included total return swaps - commodities held by consolidated Company-sponsored funds.
Cash equivalents were comprised of investments in actively traded U.S. Treasury money market funds measured at NAV.
Equity investments at fair value classified as level 2 were comprised of common stocks and preferred securities with predominately equity-like characteristics for which quoted prices in active markets are not available. Fair values for the common stocks classified as level 2 were generally based on quoted prices for similar instruments in active markets. Fair values for the preferred securities
Equity investments at fair value classified as level 23 as of March 31, 2022 were generallycomprised of a limited partnership interest in a joint venture that holds an investment in private real estate. As of March 31, 2022, it was determined using third-party pricing services. The pricing services may utilize pricing models, and inputs into those models may include reported trades, executable bid and ask prices, broker-dealer quotations, prices or yields of similar securities, benchmark curves and other market information. The pricing services may use a matrix approach, which considers information regarding securities with similar characteristics to determine the valuation for a security.that cost approximates fair value.
Trading investments classified as level 2 were comprised of U.S. Treasury securities and corporate debt securities. The fair value amounts were generally determined using third-party pricing services. The pricing services may utilize evaluated pricing models that vary by asset class and incorporate available trade, bid and other market information.
COHEN & STEERS, INC. AND SUBSIDIARIES
NOTES TO CONDENSED CONSOLIDATED FINANCIAL STATEMENTS—(Continued)
(UNAUDITED)
Investments measured at NAV were comprised of certain investments measured at fair value using NAV (or its equivalent) as a practical expedient. These investments were comprised of:expedient as follows:
•Equity investments at fair value - included included:
◦limited partnerpartnership interests in limited partnership vehicles that invest in non-registeredprivate real estate funds held by the Company's consolidated funds; and
◦the Company's co-investment in a Cayman trust invested in global listed infrastructure securities (which is included in "Other" in the leveling table), both of.
•Equity method investments included the Company's partnership interest in Cohen & Steers Global Realty Partners III-TE, L.P. (GRP-TE) which are valued based on the NAVs of the underlying investments. invests in non-registered real estate funds. The Company's ownership interest was approximately 0.2% .
At June 30, 2021March 31, 2022 and December 31, 2020,2021, the Company did not have the ability to redeem theits limited partnership interests in private real estate funds held by the limited partnership vehicles; thereCompany's consolidated funds or its interest in GRP-TE. There were no contractual restrictions on the Company's ability to redeem its interest in the Cayman trust.
•Equity method investments - included the Company's partnership interest in the Cohen & Steers Global Realty Partners III-TE, L.P. (GRP-TE) at June 30, 2021 and December 31, 2020. GRP-TE invests in non-registered real estate funds. The Company's ownership interest was approximately 0.2% and the Company did not have the ability to redeem the investment at either June 30, 2021 or December 31, 2020. In addition, at December 31, 2020, the Cohen & Steers Global Realty Focus Fund (GRF), a series of Cohen & Steers Series LP was included. During the first quarter of 2021, GRF was redeemed.
Held-to-maturity investments at December 31, 2020 were comprised of U.S. Treasury securities, which were directly issued by the U.S. government. These securities were purchased with the intent to hold to maturity and were recorded at amortized cost.
Investments measured at NAV as a practical expedient and investments carried at amortized cost have not been classified in the fair value hierarchy. The amounts presented in the above tables are intended to permit reconciliation of the fair value hierarchy to the amounts presented on the condensed consolidated statements of financial condition.
Swap contracts classified as level 2 were valued based on the underlying futures contracts or equity indices.
Foreign currency exchange contracts classified as level 2 were valued based on the prevailing forward exchange rate, which is an input that is observable in active markets.
The following table summarizes the changes in level 3 investments measured at fair value on a recurring basis:
| | | | | |
| (in thousands) | March 31,
2022 |
| Balance at beginning of period | $ | — | |
| Purchases/contributions | 17,753 | |
| |
| |
| |
| |
| Balance at end of period | $ | 17,753 | |
Valuation Techniques
In certain instances, debt equity and preferredequity securities are valued on the basis of prices from an orderly transaction between market participants provided by reputable broker-dealers or independent pricing services. In determining the value of a particular investment, independent pricing services may use information with respect to transactions in such investments, broker quotes, pricing matrices, market transactions in comparable investments and various relationships between investments. As part of its independent price verification process, the Company generally performs reviews of valuations provided by broker-dealers or independent pricing services. Investments in Company-sponsored funds are valued at their closing price or NAV (or its equivalent) as a practical expedient.
In the absence of observable market prices, the Company values its investments using valuation methodologies applied on a consistent basis. For some investments, little market activity may exist; management's determination of fair value is then based on the best information available in the circumstances, and may incorporate management's own assumptions and involve a significant degree of judgment, taking into consideration a combination of internal and external factors. Such investments which are generally immaterial, are valued no less than on a quarterly basis, taking into consideration any changes in key inputs and changes in economic and other relevant conditions, and valuation models are updated accordingly. The valuation process also includes a review and approval by the Company's valuation committee which is comprised of senior members from various departments within the Company, including investment management. The valuation committee provides independent oversight of the valuation policies and procedures.
COHEN & STEERS, INC. AND SUBSIDIARIES
NOTES TO CONDENSED CONSOLIDATED FINANCIAL STATEMENTS—(Continued)
(UNAUDITED)
6. Derivatives
The following tables summarize the notional amount and fair value of the outstanding derivative financial instruments none of which were designated in a formal hedging relationship: | | | As of June 30, 2021 | | As of March 31, 2022 |
| | Notional Amount | | Fair Value (1) | | Notional Amount | | Fair Value (1) |
| (in thousands) | (in thousands) | Long | | Short | | Assets | | Liabilities | (in thousands) | Long | | Short | | Assets | | Liabilities |
| Corporate derivatives: | Corporate derivatives: | | | | | | | | Corporate derivatives: | | | | | | | |
| Futures - commodities | $ | 15,181 | | | $ | 3,590 | | | $ | 839 | | | $ | 259 | | |
| Total return swaps - commodities | Total return swaps - commodities | 0 | | | 11,014 | | | 0 | | | 363 | | Total return swaps - commodities | $ | 2,929 | | | $ | 4,208 | | | $ | 38 | | | $ | 142 | |
| Total return swaps - equities | Total return swaps - equities | 0 | | | 21,281 | | | 24 | | | 487 | | Total return swaps - equities | — | | | 22,400 | | | — | | | 1,141 | |
| Forward contracts - foreign exchange | Forward contracts - foreign exchange | 0 | | | 11,183 | | | 149 | | | 17 | | Forward contracts - foreign exchange | — | | | 20,061 | | | 1,064 | | | 49 | |
| Total corporate derivatives | Total corporate derivatives | $ | 15,181 | | | $ | 47,068 | | | $ | 1,012 | | | $ | 1,126 | | Total corporate derivatives | $ | 2,929 | | | $ | 46,669 | | | $ | 1,102 | | | $ | 1,332 | |
| Derivatives held by consolidated Company-sponsored funds: | Derivatives held by consolidated Company-sponsored funds: | | | | | | | | Derivatives held by consolidated Company-sponsored funds: | | | | | | | |
| Total return swaps - commodities | Total return swaps - commodities | 9,341 | | | — | | | 113 | | | — | | Total return swaps - commodities | 17,306 | | | — | | | — | | | 620 | |
| | | Total | Total | $ | 24,522 | | | $ | 47,068 | | | $ | 1,125 | | | $ | 1,126 | | Total | $ | 20,235 | | | $ | 46,669 | | | $ | 1,102 | | | $ | 1,952 | |
| | | As of December 31, 2020 | | As of December 31, 2021 |
| | Notional Amount | | Fair Value (1) | | Notional Amount | | Fair Value (1) |
| (in thousands) | (in thousands) | Long | | Short | | Assets | | Liabilities | (in thousands) | Long | | Short | | Assets | | Liabilities |
| Corporate derivatives: | Corporate derivatives: | | | | | | | | Corporate derivatives: | | | | | | | |
| Futures - commodities | $ | 13,624 | | | $ | 4,257 | | | $ | 1,012 | | | $ | 416 | | |
| Total return swaps - commodities | Total return swaps - commodities | 0 | | | 9,598 | | | 0 | | | 136 | | Total return swaps - commodities | $ | 2,549 | | | $ | 3,810 | | | $ | 94 | | | $ | 17 | |
| Total return swaps - equities | Total return swaps - equities | — | | | 17,688 | | | — | | | 1,562 | | Total return swaps - equities | — | | | 22,899 | | | — | | | 867 | |
| Forward contracts - foreign exchange | Forward contracts - foreign exchange | 0 | | | 14,061 | | | 0 | | | 345 | | Forward contracts - foreign exchange | — | | | 11,969 | | | 209 | | | 3 | |
| Total corporate derivatives | | Total corporate derivatives | $ | 2,549 | | | $ | 38,678 | | | $ | 303 | | | $ | 887 | |
| Derivatives held by consolidated Company-sponsored funds: | | Derivatives held by consolidated Company-sponsored funds: | | | | | | | |
| Total return swaps - commodities | | Total return swaps - commodities | 10,931 | | | — | | | 387 | | | — | |
| Total | Total | $ | 13,624 | | | $ | 45,604 | | | $ | 1,012 | | | $ | 2,459 | | Total | $ | 13,480 | | | $ | 38,678 | | | $ | 690 | | | $ | 887 | |
________________________
(1)The fair value of derivative financial instruments is recorded in other assets and other liabilities and accrued expenses on the Company's condensed consolidated statements of financial condition.
OurThe Company's corporate derivatives include:
•FutureTotal return equity and commodity swap contracts which are utilized to economically hedge a portion of the market risk of certain seed investments and to gain exposure in the commodities market for the purpose of establishing a performance track record;
•Total return swap commodity contracts utilized as economic hedges to reduce the overall risk of the Company's market exposure to seed investments in commodity futures;
•Total return swap equity contracts utilized to economically hedge a portion of the market risk of certain other seed investments; and
•Forward foreign exchange contracts which are utilized to economically hedge currency exposure arising from certain non-U.S. dollar investment advisory fees.
Non-corporate derivatives are comprised of commodity swap contracts that are utilized by certain of the consolidated Company-sponsored funds to gain exposure in the commodities market as part of the funds' investment strategies.
CashFor corporate derivatives, cash included in due from brokers on the condensed consolidated statements of financial condition of $4.6$3.1 million and $4.9$2.2 million at June 30, 2021March 31, 2022 and December 31, 2020,2021, respectively, was held as collateral for corporate derivatives including futures, forward and swap contracts. U.S. Treasury securities included in investments on the condensed consolidated statements of financial condition of $1.2 million and $1.5$0.2 million at June 30, 2021both March 31, 2022 and December 31, 2020,2021, respectively, were held as collateral for corporate derivatives including futuresforward and swap contracts. There was no collateral required for the
For non-corporate derivatives, due from brokers included $0.7 million of cash collateral due from trade counterparties at June 30, 2021.March 31, 2022. At December 31, 2021, due to brokers included $0.5 million of cash collateral payable to trade counterparties.
COHEN & STEERS, INC. AND SUBSIDIARIES
NOTES TO CONDENSED CONSOLIDATED FINANCIAL STATEMENTS—(Continued)
(UNAUDITED)
The following table summarizes net gains (losses) from derivative financial instruments: | | | | Three Months Ended
June 30, | | Six Months Ended
June 30, | | Three Months Ended
March 31, |
| (in thousands) | (in thousands) | 2021 | | 2020 | | 2021 | | 2020 | (in thousands) | 2022 | | 2021 |
| Corporate derivatives: | Corporate derivatives: | | | | | | | | Corporate derivatives: | | | |
| Futures - commodities | Futures - commodities | $ | 1,463 | | | $ | 412 | | | $ | 2,168 | | | $ | (1,689) | | Futures - commodities | $ | — | | | $ | 705 | |
| Total return swaps - commodities | Total return swaps - commodities | (1,335) | | | (381) | | | (1,993) | | | 1,760 | | Total return swaps - commodities | (307) | | | (658) | |
| Total return swaps - equities | Total return swaps - equities | (1,440) | | | 0 | | | (2,508) | | | 0 | | Total return swaps - equities | 226 | | | (1,068) | |
| Forward contracts - foreign exchange | Forward contracts - foreign exchange | (657) | | | (164) | | | 477 | | | (67) | | Forward contracts - foreign exchange | 810 | | | 1,134 | |
| Total corporate derivatives | Total corporate derivatives | $ | (1,969) | | | $ | (133) | | | $ | (1,856) | | | $ | 4 | | Total corporate derivatives | $ | 729 | | | $ | 113 | |
| Derivatives held by consolidated Company-sponsored funds: | Derivatives held by consolidated Company-sponsored funds: | | | | | | | | Derivatives held by consolidated Company-sponsored funds: | | | |
| Total return swaps - commodities | Total return swaps - commodities | 1,193 | | | — | | | 1,072 | | | — | | Total return swaps - commodities | 4,312 | | | (121) | |
| Total (1) | Total (1) | $ | (776) | | | $ | (133) | | | $ | (784) | | | $ | 4 | | Total (1) | $ | 5,041 | | | $ | (8) | |
________________________
(1) Gains and losses on futures and total return swap contracts are recordedincluded in gain (loss) from investments—net in the Company's condensed consolidated statements of operations. Gains and losses on forward foreign exchange contracts are recordedincluded in foreign currency gain (loss)—net in the Company's condensed consolidated statements of operations.
7. Earnings Per Share
Basic earnings per share is calculated by dividing net income attributable to common stockholders by the weighted average shares outstanding. Diluted earnings per share is calculated by dividing net income attributable to common stockholders by the total weighted average shares of common stock outstanding and common stock equivalents determined using the treasury stock method. Common stock equivalents are comprised of dilutive potential shares from restricted stock unit awards and are excluded from the computation if their effect is anti-dilutive.
The following table reconciles income and share data used in the basic and diluted earnings per share computations: | | | | Three Months Ended
June 30, | | Six Months Ended
June 30, | | Three Months Ended
March 31, |
| (in thousands, except per share data) | (in thousands, except per share data) | 2021 | | 2020 | | 2021 | | 2020 | (in thousands, except per share data) | 2022 | | 2021 |
| Net income | Net income | $ | 52,406 | | | $ | 32,162 | | | $ | 104,836 | | | $ | 40,230 | | Net income | $ | 46,841 | | | $ | 52,430 | |
| Net (income) loss attributable to redeemable noncontrolling interests | Net (income) loss attributable to redeemable noncontrolling interests | (5,827) | | | (3,642) | | | (9,405) | | | 8,862 | | Net (income) loss attributable to redeemable noncontrolling interests | (4,823) | | | (3,578) | |
| Net income attributable to common stockholders | Net income attributable to common stockholders | $ | 46,579 | | | $ | 28,520 | | | $ | 95,431 | | | $ | 49,092 | | Net income attributable to common stockholders | $ | 42,018 | | | $ | 48,852 | |
| Basic weighted average shares outstanding | Basic weighted average shares outstanding | 48,285 | | | 47,826 | | | 48,216 | | | 47,739 | | Basic weighted average shares outstanding | 48,673 | | | 48,145 | |
| Dilutive potential shares from restricted stock units | Dilutive potential shares from restricted stock units | 666 | | | 746 | | | 615 | | | 810 | | Dilutive potential shares from restricted stock units | 664 | | | 564 | |
| Diluted weighted average shares outstanding | Diluted weighted average shares outstanding | 48,951 | | | 48,572 | | | 48,831 | | | 48,549 | | Diluted weighted average shares outstanding | 49,337 | | | 48,709 | |
| | Basic earnings per share attributable to common stockholders | Basic earnings per share attributable to common stockholders | $ | 0.96 | | | $ | 0.60 | | | $ | 1.98 | | | $ | 1.03 | | Basic earnings per share attributable to common stockholders | $ | 0.86 | | | $ | 1.01 | |
| Diluted earnings per share attributable to common stockholders | Diluted earnings per share attributable to common stockholders | $ | 0.95 | | | $ | 0.59 | | | $ | 1.95 | | | $ | 1.01 | | Diluted earnings per share attributable to common stockholders | $ | 0.85 | | | $ | 1.00 | |
| | Anti-dilutive common stock equivalents excluded from the calculation | Anti-dilutive common stock equivalents excluded from the calculation | 0 | | | 63 | | | 0 | | | 0 | | Anti-dilutive common stock equivalents excluded from the calculation | 2 | | | — | |
COHEN & STEERS, INC. AND SUBSIDIARIES
NOTES TO CONDENSED CONSOLIDATED FINANCIAL STATEMENTS—(Continued)
(UNAUDITED)
8. Income Taxes
The provision for income taxes included U.S. federal, state, local and foreign taxes. The effective tax rate for the three months ended June 30, 2021March 31, 2022 was approximately 25.4%18.1%, compared with approximately 28.0%8.4% for the three months ended June 30, 2020. The effectiveMarch 31, 2021.
A reconciliation of the Company’s statutory federal income tax rate for the three months ended June 30, 2021 and 2020 differed from the U.S. federal statutory rate of 21.0% primarily due to state, local and foreign income taxes and limitations on the deductibility of executive
COHEN & STEERS, INC. AND SUBSIDIARIES
NOTES TO CONDENSED CONSOLIDATED FINANCIAL STATEMENTS—(Continued)
(UNAUDITED)
compensation. In addition, the effective income tax rate for the three months ended June 30, 2021 included the cumulative effect of a changeis summarized in the Company’s estimated effective tax rate for the year.following table:
The effective tax rate for the six months ended June 30, 2021 was approximately 17.5%, compared with approximately 19.0% for the six months ended June 30, 2020. The effective tax rate for the six months ended June 30, 2021 differed from the U.S. federal statutory rate of 21.0% primarily due to state, local and foreign income taxes and limitations on the deductibility of executive compensation. These were more than offset by the reversal of certain liabilities associated with unrecognized tax benefits and the tax effect associated with the appreciated value of the restricted stock units delivered in January 2021. The effective tax rate for the six months ended June 30, 2020 differed from the U.S. federal statutory rate of 21.0% primarily due to state, local and foreign income taxes and limitations on the deductibility of executive compensation. These were more than offset by the tax effect associated with the appreciated value of the restricted stock units delivered in January 2020. | | | | | | | | | | | |
| Three Months Ended
March 31, |
| 2022 | | 2021 |
| U.S. statutory tax rate | 21.0 | % | | 21.0 | % |
| State and local income taxes, net of federal benefit | 3.5 | | | 4.1 | |
| Non-deductible executive compensation | 5.2 | | | 3.4 | |
| Excess tax benefits related to the vesting and delivery of restricted stock units | (11.5) | | | (10.4) | |
| Unrecognized tax benefit adjustments | — | | | (10.2) | |
| Other | (0.1) | | | 0.5 | |
| Effective income tax rate | 18.1 | % | | 8.4 | % |
Deferred income taxes represent the tax effects of the temporary differences between book and tax bases and are measured using enacted tax rates that will be in effect when such items are expected to reverse. The Company's net deferred tax asset wasis primarily comprised of future income tax deductions attributable to the delivery of unvested restricted stock units. The Company records a valuation allowance, when necessary, to reduce deferred tax assets to an amount that more likely than not will be realized.
The Company's net deferred tax asset is included in other assets on the condensed consolidated statements of financial condition.
9. Related Party Transactions
The Company is an investment adviser to, and has administration agreements with, Company-sponsored funds for which certain employees are officers and/or directors.
The following table summarizes the amount of revenue the Company earned from these affiliated funds: | | | | Three Months Ended
June 30, | | Six Months Ended
June 30, | | Three Months Ended
March 31, |
| (in thousands) | (in thousands) | 2021 | | 2020 | | 2021 | | 2020 | (in thousands) | 2022 | | 2021 |
Investment advisory and administration fees (1) | Investment advisory and administration fees (1) | $ | 95,542 | | | $ | 61,035 | | | $ | 180,190 | | | $ | 129,377 | | Investment advisory and administration fees (1) | $ | 104,237 | | | $ | 84,648 | |
| Distribution and service fees | Distribution and service fees | 9,199 | | | 6,930 | | | 17,471 | | | 14,713 | | Distribution and service fees | 9,869 | | | 8,272 | |
| Total | Total | $ | 104,741 | | | $ | 67,965 | | | $ | 197,661 | | | $ | 144,090 | | Total | $ | 114,106 | | | $ | 92,920 | |
_________________________
(1) Investment advisory and administration fees are reflected net of fund reimbursements of $3.7$4.4 million and $2.9$3.5 million for the three months ended June 30,March 31, 2022 and 2021, and 2020, respectively, and $7.2 million and $6.1 million for the six months ended June 30, 2021 and 2020, respectively.
Included in accounts receivable at June 30, 2021March 31, 2022 and December 31, 20202021 are receivables due from Company-sponsored funds of $36.6$40.2 million and $30.2$40.8 million, respectively. Included in accounts payable at June 30, 2021March 31, 2022 and December 31, 20202021 are payables due to Company-sponsored funds of $0.4$0.2 million and $0.6$1.1 million, respectively.
10. Commitments and Contingencies
From time to time, the Company is involved in legal matters relating to claims arising in the ordinary course of business. There are currently no such matters pending that the Company believes could have a material adverse effect on its condensed consolidated results of operations, cash flows or financial position.
The Company periodically commits to fund a portion of the equity in certain of its sponsored investment products. The Company has committed to co-invest up to $5.1 million alongside GRP-TE, a portion of which is made through GRP-TE and the remainder of which is made through GRP-CIP for up to 12 years through the life of GRP-TE. As of June 30, 2021, the Company has funded approximately $3.8 million with respect to this commitment. The actual timing for funding the unfunded portion of this commitment is currently unknown, as the drawdown of the Company's unfunded commitment is contingent on the timing of drawdowns by the underlying funds in which GRP-TE and GRP-CIP invest. The unfunded commitment was not recorded on the Company's condensed consolidated statements of financial condition.
COHEN & STEERS, INC. AND SUBSIDIARIES
NOTES TO CONDENSED CONSOLIDATED FINANCIAL STATEMENTS—(Continued)
(UNAUDITED)
The Company has committed to invest up to $50.0 million in REOF. As of March 31, 2022, the Company had funded $21.1 million of this commitment. The timing for funding the remaining portion of the Company's commitment is determined by the fund.
11. Concentration of Credit Risk
The Company's cash and cash equivalents are principally on deposit with major financial institutions. The Company is subject to credit risk should these financial institutions be unable to fulfill their obligations.
12. Subsequent Events
The Company has evaluated the need for disclosures and/or adjustments resulting from subsequent events through the date the condensed consolidated financial statements were issued. Other than the items described below, the Company determined that there were no additional subsequent events that require disclosure and/or adjustment.
On AugustMay 5, 2021,2022, the Company declared a quarterly dividend on its common stock in the amount of $0.45$0.55 per share. TheThis dividend will be payable on AugustMay 26, 20212022 to stockholders of record at the close of business on AugustMay 16, 2021.2022.
Item 2. Management's Discussion and Analysis of Financial Condition and Results of Operations
Set forth on the following pages is management's discussion and analysis of our financial condition and results of operations for the three and six months ended June 30, 2021March 31, 2022 and 2020.2021. Such information should be read in conjunction with our condensed consolidated financial statements and the related notes included herein. The condensed consolidated financial statements of the Company are unaudited. When we use the terms "Cohen & Steers," the "Company," "we," "us," and "our," we mean Cohen & Steers, Inc., a Delaware corporation, and its consolidated subsidiaries.
Executive Overview
General
We are a leading global investment manager specializing in real assets and alternative income, including real estate, preferred securities, infrastructure, resource equities, commodities, as well as multi-strategy solutions. Founded in 1986, we are headquartered in New York City, with offices in London, Dublin, Hong Kong and Tokyo.
Our primary investment strategies include U.S. real estate, preferred securities and low duration preferred securities, global/international real estate, global listed infrastructure, real assets multi-strategy, midstream energy and MLPs, as well as global natural resource equities. Our strategies seek to achieve a variety of investment objectives for different risk profiles and are actively managed by specialist teams of investment professionals who employ fundamental-driven research and portfolio management processes. We offer our strategies through a variety of investment vehicles, including U.S. and non-U.S. registered funds and other commingled vehicles, separate accounts and subadvised portfolios.
Our distribution network encompasses two major channels, wealth management and institutional. Our wealth management channel includes registered investment advisers, wirehouses, independent and regional broker dealers and bank trusts. Our institutional channel includes sovereign wealth funds, corporate plans, insurance companies and public funds, including defined benefit and defined contribution plans, as well as other financial institutions that access our investment management services directly or through consultants and other intermediaries.
Our revenue from the wealth channel is derived from investment advisory, administration, distribution and service fees from Company-sponsored open-end and closed-end funds. Our revenue from the institutional channel is derived from fees received from our clients including fees for managing or subadvising client accounts as well as investment advisory, administration, distributionadvised and service fees received from Company-sponsored open-end and closed-end funds.subadvised accounts. Our fees are based on contractually specified rates applied to the value of the assets we manage and, in certain cases, investment performance.may include a performance-based fee. Our revenue fluctuates with changes in the total value of our assets under management, which may occur as a result of market appreciation orand depreciation, contributions or withdrawals from investor accounts and distributions. This revenue is recognized over the period that the assets are managed.
The Russian invasion of Ukraine has impacted global financial markets, introducing new threats to global economic growth and adding to inflationary pressures. We have taken measures to ensure ongoing compliance with all applicable sanctions and guidance issued by authorities globally against certain regions, entities, or individuals. Our overall exposure to Russian and Ukrainian securities is limited and we do not expect a material impact to our financial results.
Assets Under Management
By Investment Vehicle
(in millions) | | | Three Months Ended
June 30, | | Six Months Ended
June 30, | | Three Months Ended
March 31, |
| | 2021 | | 2020 | | 2021 | | 2020 | | 2022 | | 2021 |
| Institutional Accounts | | | | | | | | |
| Open-end Funds | | Open-end Funds | | | |
| Assets under management, beginning of period | Assets under management, beginning of period | $ | 36,538 | | | $ | 25,045 | | | $ | 33,255 | | | $ | 31,813 | | Assets under management, beginning of period | $ | 50,911 | | | $ | 35,160 | |
| Inflows | Inflows | 1,826 | | | 1,904 | | | 4,161 | | | 4,167 | | Inflows | 4,886 | | | 5,070 | |
| Outflows | Outflows | (1,454) | | | (523) | | | (2,202) | | | (1,984) | | Outflows | (4,678) | | | (2,906) | |
| Net inflows (outflows) | Net inflows (outflows) | 372 | | | 1,381 | | | 1,959 | | | 2,183 | | Net inflows (outflows) | 208 | | | 2,164 | |
| Market appreciation (depreciation) | Market appreciation (depreciation) | 3,555 | | | 2,775 | | | 5,555 | | | (4,479) | | Market appreciation (depreciation) | (2,735) | | | 1,537 | |
| Distributions | Distributions | (309) | | | (334) | | | (613) | | | (650) | | Distributions | (279) | | | (238) | |
| | Total increase (decrease) | Total increase (decrease) | 3,618 | | | 3,822 | | | 6,901 | | | (2,946) | | Total increase (decrease) | (2,806) | | | 3,463 | |
| Assets under management, end of period | Assets under management, end of period | $ | 40,156 | | | $ | 28,867 | | | $ | 40,156 | | | $ | 28,867 | | Assets under management, end of period | $ | 48,105 | | | $ | 38,623 | |
| Percentage of total assets under management | Percentage of total assets under management | 41.7 | % | | 43.5 | % | | 41.7 | % | | 43.5 | % | Percentage of total assets under management | 47.1 | % | | 44.4 | % |
| Average assets under management | Average assets under management | $ | 39,103 | | | $ | 27,111 | | | $ | 36,877 | | | $ | 28,524 | | Average assets under management | $ | 48,055 | | | $ | 36,620 | |
| | Open-end Funds | | |
| Institutional Accounts | | Institutional Accounts | |
| Assets under management, beginning of period | Assets under management, beginning of period | $ | 38,623 | | | $ | 24,561 | | | $ | 35,160 | | | $ | 30,725 | | Assets under management, beginning of period | $ | 42,727 | | | $ | 33,255 | |
| Inflows | Inflows | 4,577 | | | 5,163 | | | 9,647 | | | 9,540 | | Inflows | 2,060 | | | 2,335 | |
| Outflows | Outflows | (2,490) | | | (3,124) | | | (5,396) | | | (7,434) | | Outflows | (2,066) | | | (748) | |
| Net inflows (outflows) | Net inflows (outflows) | 2,087 | | | 2,039 | | | 4,251 | | | 2,106 | | Net inflows (outflows) | (6) | | | 1,587 | |
| Market appreciation (depreciation) | Market appreciation (depreciation) | 3,134 | | | 2,898 | | | 4,671 | | | (3,106) | | Market appreciation (depreciation) | (1,494) | | | 2,000 | |
| Distributions | Distributions | (312) | | | (577) | | | (550) | | | (804) | | Distributions | (271) | | | (304) | |
| | Total increase (decrease) | Total increase (decrease) | 4,909 | | | 4,360 | | | 8,372 | | | (1,804) | | Total increase (decrease) | (1,771) | | | 3,283 | |
| Assets under management, end of period | Assets under management, end of period | $ | 43,532 | | | $ | 28,921 | | | $ | 43,532 | | | $ | 28,921 | | Assets under management, end of period | $ | 40,956 | | | $ | 36,538 | |
| Percentage of total assets under management | Percentage of total assets under management | 45.2 | % | | 43.6 | % | | 45.2 | % | | 43.6 | % | Percentage of total assets under management | 40.1 | % | | 42.0 | % |
| Average assets under management | Average assets under management | $ | 41,469 | | | $ | 26,799 | | | $ | 39,064 | | | $ | 28,329 | | Average assets under management | $ | 40,631 | | | $ | 34,622 | |
| | Closed-end Funds | Closed-end Funds | | Closed-end Funds | |
| Assets under management, beginning of period | Assets under management, beginning of period | $ | 11,879 | | | $ | 7,763 | | | $ | 11,493 | | | $ | 9,644 | | Assets under management, beginning of period | $ | 12,991 | | | $ | 11,493 | |
| Inflows | Inflows | 103 | | | 1 | | | 168 | | | 404 | | Inflows | 554 | | | 65 | |
| Outflows | Outflows | — | | | — | | | — | | | (88) | | Outflows | — | | | — | |
| Net inflows (outflows) | Net inflows (outflows) | 103 | | | 1 | | | 168 | | | 316 | | Net inflows (outflows) | 554 | | | 65 | |
| Market appreciation (depreciation) | Market appreciation (depreciation) | 703 | | | 903 | | | 1,172 | | | (1,165) | | Market appreciation (depreciation) | (337) | | | 469 | |
| Distributions | Distributions | (148) | | | (128) | | | (296) | | | (256) | | Distributions | (147) | | | (148) | |
| Total increase (decrease) | Total increase (decrease) | 658 | | | 776 | | | 1,044 | | | (1,105) | | Total increase (decrease) | 70 | | | 386 | |
| Assets under management, end of period | Assets under management, end of period | $ | 12,537 | | | $ | 8,539 | | | $ | 12,537 | | | $ | 8,539 | | Assets under management, end of period | $ | 13,061 | | | $ | 11,879 | |
| Percentage of total assets under management | Percentage of total assets under management | 13.0 | % | | 12.9 | % | | 13.0 | % | | 12.9 | % | Percentage of total assets under management | 12.8 | % | | 13.6 | % |
| Average assets under management | Average assets under management | $ | 12,372 | | | $ | 8,322 | | | $ | 11,989 | | | $ | 8,804 | | Average assets under management | $ | 12,550 | | | $ | 11,601 | |
| | Total | Total | | Total | |
| Assets under management, beginning of period | Assets under management, beginning of period | $ | 87,040 | | | $ | 57,369 | | | $ | 79,908 | | | $ | 72,182 | | Assets under management, beginning of period | $ | 106,629 | | | $ | 79,908 | |
| Inflows | Inflows | 6,506 | | | 7,068 | | | 13,976 | | | 14,111 | | Inflows | 7,500 | | | 7,470 | |
| Outflows | Outflows | (3,944) | | | (3,647) | | | (7,598) | | | (9,506) | | Outflows | (6,744) | | | (3,654) | |
| Net inflows (outflows) | Net inflows (outflows) | 2,562 | | | 3,421 | | | 6,378 | | | 4,605 | | Net inflows (outflows) | 756 | | | 3,816 | |
| Market appreciation (depreciation) | Market appreciation (depreciation) | 7,392 | | | 6,576 | | | 11,398 | | | (8,750) | | Market appreciation (depreciation) | (4,566) | | | 4,006 | |
| Distributions | Distributions | (769) | | | (1,039) | | | (1,459) | | | (1,710) | | Distributions | (697) | | | (690) | |
| | Total increase (decrease) | Total increase (decrease) | 9,185 | | | 8,958 | | | 16,317 | | | (5,855) | | Total increase (decrease) | (4,507) | | | 7,132 | |
| Assets under management, end of period | Assets under management, end of period | $ | 96,225 | | | $ | 66,327 | | | $ | 96,225 | | | $ | 66,327 | | Assets under management, end of period | $ | 102,122 | | | $ | 87,040 | |
| Average assets under management | Average assets under management | $ | 92,944 | | | $ | 62,232 | | | $ | 87,930 | | | $ | 65,657 | | Average assets under management | $ | 101,236 | | | $ | 82,843 | |
Assets Under Management - Institutional Accounts
By Account Type
(in millions) | | | | | | | | | | | |
| Three Months Ended
March 31, |
| 2022 | | 2021 |
| Advisory | | | |
| Assets under management, beginning of period | $ | 24,599 | | | $ | 17,628 | |
| Inflows | 1,573 | | | 1,937 | |
| Outflows | (1,615) | | | (243) | |
| Net inflows (outflows) | (42) | | | 1,694 | |
| Market appreciation (depreciation) | (831) | | | 957 | |
| | | |
| Total increase (decrease) | (873) | | | 2,651 | |
| Assets under management, end of period | $ | 23,726 | | | $ | 20,279 | |
| Percentage of institutional assets under management | 57.9 | % | | 55.5 | % |
| Average assets under management | $ | 23,861 | | | $ | 18,900 | |
| | | |
| Japan Subadvisory | | | |
| Assets under management, beginning of period | $ | 11,329 | | | $ | 9,720 | |
| Inflows | 219 | | | 98 | |
| Outflows | (103) | | | (302) | |
| Net inflows (outflows) | 116 | | | (204) | |
| Market appreciation (depreciation) | (482) | | | 712 | |
| Distributions | (271) | | | (304) | |
| | | |
| Total increase (decrease) | (637) | | | 204 | |
| Assets under management, end of period | $ | 10,692 | | | $ | 9,924 | |
| Percentage of institutional assets under management | 26.1 | % | | 27.2 | % |
| Average assets under management | $ | 10,351 | | | $ | 9,661 | |
| | | |
| Subadvisory Excluding Japan | | | |
| Assets under management, beginning of period | $ | 6,799 | | | $ | 5,907 | |
| Inflows | 268 | | | 300 | |
| Outflows | (348) | | | (203) | |
| Net inflows (outflows) | (80) | | | 97 | |
| Market appreciation (depreciation) | (181) | | | 331 | |
| | | |
| Total increase (decrease) | (261) | | | 428 | |
| Assets under management, end of period | $ | 6,538 | | | $ | 6,335 | |
| Percentage of institutional assets under management | 16.0 | % | | 17.3 | % |
| Average assets under management | $ | 6,419 | | | $ | 6,061 | |
| | | |
| Total Institutional Accounts | | | |
| Assets under management, beginning of period | $ | 42,727 | | | $ | 33,255 | |
| Inflows | 2,060 | | | 2,335 | |
| Outflows | (2,066) | | | (748) | |
| Net inflows (outflows) | (6) | | | 1,587 | |
| Market appreciation (depreciation) | (1,494) | | | 2,000 | |
| Distributions | (271) | | | (304) | |
| | | |
| | | |
| Total increase (decrease) | (1,771) | | | 3,283 | |
| Assets under management, end of period | $ | 40,956 | | | $ | 36,538 | |
| Average assets under management | $ | 40,631 | | | $ | 34,622 | |
Assets Under Management - Institutional Accounts
By Account TypeInvestment Strategy
(in millions) | | | Three Months Ended
June 30, | | Six Months Ended
June 30, | | Three Months Ended
March 31, |
| | 2021 | | 2020 | | 2021 | | 2020 | | 2022 | | 2021 |
| Advisory | | | | | | | | |
| Assets under management, beginning of period | $ | 20,279 | | | $ | 13,048 | | | $ | 17,628 | | | $ | 15,669 | | |
| Inflows | 1,512 | | | 1,103 | | | 3,449 | | | 2,537 | | |
| Outflows | (493) | | | (252) | | | (736) | | | (989) | | |
| Net inflows (outflows) | 1,019 | | | 851 | | | 2,713 | | | 1,548 | | |
| Market appreciation (depreciation) | 1,817 | | | 1,352 | | | 2,774 | | | (1,966) | | |
| | Total increase (decrease) | 2,836 | | | 2,203 | | | 5,487 | | | (418) | | |
| Assets under management, end of period | $ | 23,115 | | | $ | 15,251 | | | $ | 23,115 | | | $ | 15,251 | | |
| Percentage of institutional assets under management | 57.6 | % | | 52.8 | % | | 57.6 | % | | 52.8 | % | |
| Average assets under management | $ | 22,084 | | | $ | 14,366 | | | $ | 20,501 | | | $ | 14,601 | | |
| | Japan Subadvisory | | |
| U.S. Real Estate | | U.S. Real Estate | | | |
| Assets under management, beginning of period | Assets under management, beginning of period | $ | 9,924 | | | $ | 7,792 | | | $ | 9,720 | | | $ | 10,323 | | Assets under management, beginning of period | $ | 49,915 | | | $ | 32,827 | |
| Inflows | Inflows | 22 | | | 418 | | | 120 | | | 976 | | Inflows | 3,293 | | | 3,126 | |
| Outflows | Outflows | (294) | | | (100) | | | (596) | | | (378) | | Outflows | (2,736) | | | (1,391) | |
| Net inflows (outflows) | Net inflows (outflows) | (272) | | | 318 | | | (476) | | | 598 | | Net inflows (outflows) | 557 | | | 1,735 | |
| Market appreciation (depreciation) | Market appreciation (depreciation) | 1,160 | | | 960 | | | 1,872 | | | (1,535) | | Market appreciation (depreciation) | (2,792) | | | 2,837 | |
| Distributions | Distributions | (309) | | | (334) | | | (613) | | | (650) | | Distributions | (412) | | | (415) | |
| | Total increase (decrease) | Total increase (decrease) | 579 | | | 944 | | | 783 | | | (1,587) | | Total increase (decrease) | (2,647) | | | 4,157 | |
| Assets under management, end of period | Assets under management, end of period | $ | 10,503 | | | $ | 8,736 | | | $ | 10,503 | | | $ | 8,736 | | Assets under management, end of period | $ | 47,268 | | | $ | 36,984 | |
| Percentage of institutional assets under management | 26.2 | % | | 30.3 | % | | 26.2 | % | | 30.3 | % | |
| Percentage of total assets under management | | Percentage of total assets under management | 46.3 | % | | 42.5 | % |
| Average assets under management | Average assets under management | $ | 10,306 | | | $ | 8,128 | | | $ | 9,985 | | | $ | 8,866 | | Average assets under management | $ | 46,462 | | | $ | 34,512 | |
| | Subadvisory Excluding Japan | | |
| Assets under management, beginning of period | $ | 6,335 | | | $ | 4,205 | | | $ | 5,907 | | | $ | 5,821 | | |
| Inflows | 292 | | | 383 | | | 592 | | | 654 | | |
| Outflows | (667) | | | (171) | | | (870) | | | (617) | | |
| Net inflows (outflows) | (375) | | | 212 | | | (278) | | | 37 | | |
| Market appreciation (depreciation) | 578 | | | 463 | | | 909 | | | (978) | | |
| | Total increase (decrease) | 203 | | | 675 | | | 631 | | | (941) | | |
| Assets under management, end of period | $ | 6,538 | | | $ | 4,880 | | | $ | 6,538 | | | $ | 4,880 | | |
| Percentage of institutional assets under management | 16.3 | % | | 16.9 | % | | 16.3 | % | | 16.9 | % | |
| Average assets under management | $ | 6,713 | | | $ | 4,617 | | | $ | 6,391 | | | $ | 5,057 | | |
| | Total Institutional Accounts | | |
| Preferred Securities | | Preferred Securities | |
| Assets under management, beginning of period | Assets under management, beginning of period | $ | 36,538 | | | $ | 25,045 | | | $ | 33,255 | | | $ | 31,813 | | Assets under management, beginning of period | $ | 26,987 | | | $ | 23,185 | |
| Inflows | Inflows | 1,826 | | | 1,904 | | | 4,161 | | | 4,167 | | Inflows | 1,964 | | | 2,406 | |
| Outflows | Outflows | (1,454) | | | (523) | | | (2,202) | | | (1,984) | | Outflows | (2,872) | | | (1,596) | |
| Net inflows (outflows) | Net inflows (outflows) | 372 | | | 1,381 | | | 1,959 | | | 2,183 | | Net inflows (outflows) | (908) | | | 810 | |
| Market appreciation (depreciation) | Market appreciation (depreciation) | 3,555 | | | 2,775 | | | 5,555 | | | (4,479) | | Market appreciation (depreciation) | (1,400) | | | 2 | |
| Distributions | Distributions | (309) | | | (334) | | | (613) | | | (650) | | Distributions | (213) | | | (207) | |
| | Total increase (decrease) | | Total increase (decrease) | (2,521) | | | 605 | |
| Assets under management, end of period | | Assets under management, end of period | $ | 24,466 | | | $ | 23,790 | |
| Percentage of total assets under management | | Percentage of total assets under management | 24.0 | % | | 27.3 | % |
| Average assets under management | | Average assets under management | $ | 25,649 | | | $ | 23,526 | |
| | Global/International Real Estate | | Global/International Real Estate | |
| Assets under management, beginning of period | | Assets under management, beginning of period | $ | 19,380 | | | $ | 15,214 | |
| Inflows | | Inflows | 1,556 | | | 1,079 | |
| Outflows | | Outflows | (780) | | | (567) | |
| Net inflows (outflows) | | Net inflows (outflows) | 776 | | | 512 | |
| Market appreciation (depreciation) | | Market appreciation (depreciation) | (775) | | | 709 | |
| Distributions | | Distributions | (19) | | | (14) | |
| | Total increase (decrease) | Total increase (decrease) | 3,618 | | | 3,822 | | | 6,901 | | | (2,946) | | Total increase (decrease) | (18) | | | 1,207 | |
| Assets under management, end of period | Assets under management, end of period | $ | 40,156 | | | $ | 28,867 | | | $ | 40,156 | | | $ | 28,867 | | Assets under management, end of period | $ | 19,362 | | | $ | 16,421 | |
| Percentage of total assets under management | | Percentage of total assets under management | 19.0 | % | | 18.9 | % |
| Average assets under management | Average assets under management | $ | 39,103 | | | $ | 27,111 | | | $ | 36,877 | | | $ | 28,524 | | Average assets under management | $ | 18,867 | | | $ | 15,588 | |
Assets Under Management
By Investment Strategy - continued
(in millions) | | | Three Months Ended
June 30, | | Six Months Ended
June 30, | | Three Months Ended
March 31, |
| | 2021 | | 2020 | | 2021 | | 2020 | | 2022 | | 2021 |
| U.S. Real Estate | | | | | | | | |
| Global Listed Infrastructure | | Global Listed Infrastructure | | | |
| Assets under management, beginning of period | Assets under management, beginning of period | $ | 36,984 | | | $ | 23,794 | | | $ | 32,827 | | | $ | 31,024 | | Assets under management, beginning of period | $ | 8,763 | | | $ | 6,729 | |
| Inflows | Inflows | 2,592 | | | 3,596 | | | 5,718 | | | 6,083 | | Inflows | 464 | | | 679 | |
| Outflows | Outflows | (1,723) | | | (1,522) | | | (3,114) | | | (3,453) | | Outflows | (299) | | | (74) | |
| Net inflows (outflows) | Net inflows (outflows) | 869 | | | 2,074 | | | 2,604 | | | 2,630 | | Net inflows (outflows) | 165 | | | 605 | |
| Market appreciation (depreciation) | Market appreciation (depreciation) | 4,419 | | | 3,035 | | | 7,256 | | | (4,342) | | Market appreciation (depreciation) | 314 | | | 315 | |
| Distributions | Distributions | (407) | | | (784) | | | (822) | | | (1,224) | | Distributions | (45) | | | (45) | |
| Transfers | — | | | — | | | — | | | 31 | | |
| Total increase (decrease) | Total increase (decrease) | 4,881 | | | 4,325 | | | 9,038 | | | (2,905) | | Total increase (decrease) | 434 | | | 875 | |
| Assets under management, end of period | Assets under management, end of period | $ | 41,865 | | | $ | 28,119 | | | $ | 41,865 | | | $ | 28,119 | | Assets under management, end of period | $ | 9,197 | | | $ | 7,604 | |
| Percentage of total assets under management | Percentage of total assets under management | 43.5 | % | | 42.4 | % | | 43.5 | % | | 42.4 | % | Percentage of total assets under management | 9.0 | % | | 8.7 | % |
| Average assets under management | Average assets under management | $ | 40,269 | | | $ | 25,642 | | | $ | 37,408 | | | $ | 27,595 | | Average assets under management | $ | 8,609 | | | $ | 7,137 | |
| | Preferred Securities | | |
| Assets under management, beginning of period | $ | 23,790 | | | $ | 14,872 | | | $ | 23,185 | | | $ | 17,581 | | |
| Inflows | 2,254 | | | 2,075 | | | 4,660 | | | 4,531 | | |
| Outflows | (1,081) | | | (1,319) | | | (2,677) | | | (3,895) | | |
| Net inflows (outflows) | 1,173 | | | 756 | | | 1,983 | | | 636 | | |
| Market appreciation (depreciation) | 750 | | | 1,653 | | | 752 | | | (742) | | |
| Distributions | (215) | | | (165) | | | (422) | | | (328) | | |
| Transfers | — | | | — | | | — | | | (31) | | |
| Total increase (decrease) | 1,708 | | | 2,244 | | | 2,313 | | | (465) | | |
| Assets under management, end of period | $ | 25,498 | | | $ | 17,116 | | | $ | 25,498 | | | $ | 17,116 | | |
| Percentage of total assets under management | 26.5 | % | | 25.8 | % | | 26.5 | % | | 25.8 | % | |
| Average assets under management | $ | 24,546 | | | $ | 16,422 | | | $ | 24,043 | | | $ | 16,856 | | |
| | Global/International Real Estate | | |
| Other | | Other | |
| Assets under management, beginning of period | Assets under management, beginning of period | $ | 16,421 | | | $ | 11,005 | | | $ | 15,214 | | | $ | 13,509 | | Assets under management, beginning of period | $ | 1,584 | | | $ | 1,953 | |
| Inflows | Inflows | 1,111 | | | 1,108 | | | 2,190 | | | 2,855 | | Inflows | 223 | | | 180 | |
| Outflows | Outflows | (890) | | | (482) | | | (1,457) | | | (1,380) | | Outflows | (57) | | | (26) | |
| Net inflows (outflows) | Net inflows (outflows) | 221 | | | 626 | | | 733 | | | 1,475 | | Net inflows (outflows) | 166 | | | 154 | |
| Market appreciation (depreciation) | Market appreciation (depreciation) | 1,664 | | | 1,059 | | | 2,373 | | | (2,286) | | Market appreciation (depreciation) | 87 | | | 143 | |
| Distributions | Distributions | (86) | | | (31) | | | (100) | | | (39) | | Distributions | (8) | | | (9) | |
| | Total increase (decrease) | Total increase (decrease) | 1,799 | | | 1,654 | | | 3,006 | | | (850) | | Total increase (decrease) | 245 | | | 288 | |
| Assets under management, end of period | Assets under management, end of period | $ | 18,220 | | | $ | 12,659 | | | $ | 18,220 | | | $ | 12,659 | | Assets under management, end of period | $ | 1,829 | | | $ | 2,241 | |
| Percentage of total assets under management | Percentage of total assets under management | 18.9 | % | | 19.1 | % | | 18.9 | % | | 19.1 | % | Percentage of total assets under management | 1.8 | % | | 2.6 | % |
| Average assets under management | Average assets under management | $ | 17,697 | | | $ | 11,799 | | | $ | 16,660 | | | $ | 12,288 | | Average assets under management | $ | 1,649 | | | $ | 2,080 | |
| | Total | | Total | |
| Assets under management, beginning of period | | Assets under management, beginning of period | $ | 106,629 | | | $ | 79,908 | |
| Inflows | | Inflows | 7,500 | | | 7,470 | |
| Outflows | | Outflows | (6,744) | | | (3,654) | |
| Net inflows (outflows) | | Net inflows (outflows) | 756 | | | 3,816 | |
| Market appreciation (depreciation) | | Market appreciation (depreciation) | (4,566) | | | 4,006 | |
| Distributions | | Distributions | (697) | | | (690) | |
| | Total increase (decrease) | | Total increase (decrease) | (4,507) | | | 7,132 | |
| Assets under management, end of period | | Assets under management, end of period | $ | 102,122 | | | $ | 87,040 | |
| Average assets under management | | Average assets under management | $ | 101,236 | | | $ | 82,843 | |
Assets Under Management
By Investment Strategy - continued
(in millions) | | | | | | | | | | | | | | | | | | | | | | | |
| Three Months Ended
June 30, | | Six Months Ended
June 30, |
| 2021 | | 2020 | | 2021 | | 2020 |
| Global Listed Infrastructure | | | | | | | |
| Assets under management, beginning of period | $ | 7,604 | | | $ | 6,175 | | | $ | 6,729 | | | $ | 8,076 | |
| Inflows | 480 | | | 252 | | | 1,159 | | | 542 | |
| Outflows | (141) | | | (279) | | | (215) | | | (668) | |
| Net inflows (outflows) | 339 | | | (27) | | | 944 | | | (126) | |
| Market appreciation (depreciation) | 355 | | | 670 | | | 670 | | | (1,078) | |
| Distributions | (52) | | | (50) | | | (97) | | | (104) | |
| Total increase (decrease) | 642 | | | 593 | | | 1,517 | | | (1,308) | |
| Assets under management, end of period | $ | 8,246 | | | $ | 6,768 | | | $ | 8,246 | | | $ | 6,768 | |
| Percentage of total assets under management | 8.6 | % | | 10.2 | % | | 8.6 | % | | 10.2 | % |
| Average assets under management | $ | 8,051 | | | $ | 6,763 | | | $ | 7,595 | | | $ | 7,189 | |
| | | | | | | |
| Other | | | | | | | |
| Assets under management, beginning of period | $ | 2,241 | | | $ | 1,523 | | | $ | 1,953 | | | $ | 1,992 | |
| Inflows | 69 | | | 37 | | | 249 | | | 100 | |
| Outflows | (109) | | | (45) | | | (135) | | | (110) | |
| Net inflows (outflows) | (40) | | | (8) | | | 114 | | | (10) | |
| Market appreciation (depreciation) | 204 | | | 159 | | | 347 | | | (302) | |
| Distributions | (9) | | | (9) | | | (18) | | | (15) | |
| | | | | | | |
| Total increase (decrease) | 155 | | | 142 | | | 443 | | | (327) | |
| Assets under management, end of period | $ | 2,396 | | | $ | 1,665 | | | $ | 2,396 | | | $ | 1,665 | |
| Percentage of total assets under management | 2.5 | % | | 2.5 | % | | 2.5 | % | | 2.5 | % |
| Average assets under management | $ | 2,381 | | | $ | 1,606 | | | $ | 2,224 | | | $ | 1,729 | |
| | | | | | | |
| Total | | | | | | | |
| Assets under management, beginning of period | $ | 87,040 | | | $ | 57,369 | | | $ | 79,908 | | | $ | 72,182 | |
| Inflows | 6,506 | | | 7,068 | | | 13,976 | | | 14,111 | |
| Outflows | (3,944) | | | (3,647) | | | (7,598) | | | (9,506) | |
| Net inflows (outflows) | 2,562 | | | 3,421 | | | 6,378 | | | 4,605 | |
| Market appreciation (depreciation) | 7,392 | | | 6,576 | | | 11,398 | | | (8,750) | |
| Distributions | (769) | | | (1,039) | | | (1,459) | | | (1,710) | |
| Total increase (decrease) | 9,185 | | | 8,958 | | | 16,317 | | | (5,855) | |
| Assets under management, end of period | $ | 96,225 | | | $ | 66,327 | | | $ | 96,225 | | | $ | 66,327 | |
| Average assets under management | $ | 92,944 | | | $ | 62,232 | | | $ | 87,930 | | | $ | 65,657 | |
Investment Performance at June 30, 2021March 31, 2022
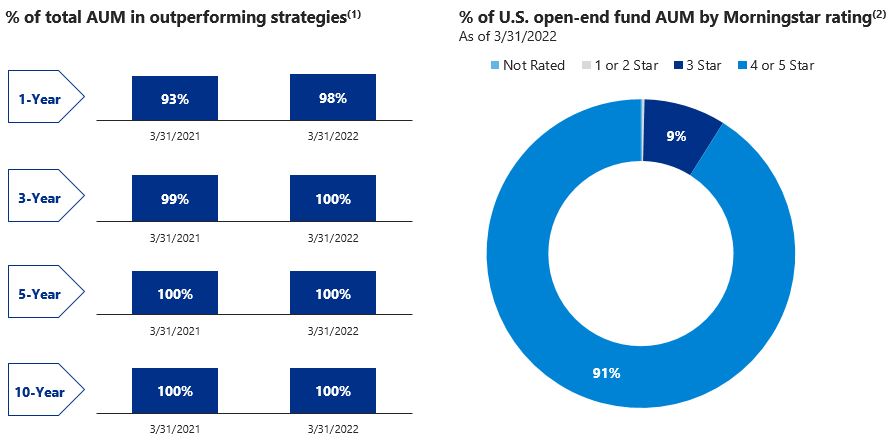 _________________________
(1) Past performance is no guarantee of future results. Outperformance is determined by comparing the annualized investment performance of each investment strategy to the performance of specified reference benchmarks. Investment performance in excess of the performance of the benchmark is considered outperformance. The investment performance calculation of each investment strategy is based on all active accounts and investment models pursuing similar investment objectives. For accounts, actual investment performance is measured gross of fees and net of withholding taxes. For investment models, for which actual investment performance does not exist, the investment performance of a composite of accounts pursuing comparable investment objectives is used as a proxy for actual investment performance. The performance of the specified reference benchmark for each account and investment model is measured net of withholding taxes, where applicable. This is not investment advice and may not be construed as sales or marketing material for any financial product or service sponsored or provided by Cohen & Steers.
(2) © 20212022 Morningstar, Inc. All Rights Reserved. The information contained herein: (1) is proprietary to Morningstar and/or its content providers; (2) may not be copied or distributed; and (3) is not warranted to be accurate, complete, or timely. Neither Morningstar nor its content providers are responsible for any damages or losses arising from any use of this information. Morningstar calculates its ratings based on a risk-adjusted return measure that accounts for variation in a fund's monthly performance (including the effects of sales charges, loads, and redemption fees), placing more emphasis on downward variations and rewarding consistent performance. The top 10% of funds in each category receive five stars, the next 22.5% receive four stars, the next 35% receive three stars, the next 22.5% receive two stars and the bottom 10% receive one star. Past performance is no guarantee of future results. Based on independent rating by Morningstar, Inc. of investment performance of each Cohen & Steers-sponsored open-end U.S.-registered mutual fund for all share classes for the overall period at June 30, 2021.March 31, 2022. Overall Morningstar rating is a weighted average based on the 3-year, 5-year and 10-year Morningstar rating. Each share class is counted as a fraction of one fund within this scale and rated separately, which may cause slight variations in the distribution percentages. This is not investment advice and may not be construed as sales or marketing material for any financial product or service sponsored or provided by Cohen & Steers.
Overview
Assets under management at June 30, 2021March 31, 2022 increased 45.1%17.3% to $96.2$102.1 billion from $66.3$87.0 billion at June 30, 2020.March 31, 2021. The increase was due to net inflows of $12.5$6.4 billion and market appreciation of $20.4$12.4 billion, partially offset by distributions of $3.0$3.7 billion. Net inflows included $6.5 billion into preferred securities, $4.6$3.9 billion into U.S. real estate and $944 million$2.0 billion into global/international real estate.preferred securities. Market appreciation included $11.0 billion from U.S. real estate, $4.8 billion from global/international real estate, $2.7 billion from preferred securities and $1.3 billion from global listed infrastructure. Distributions included $1.9$8.8 billion from U.S. real estate and $790 million$2.4 billion from global/international real estate. Distributions included $2.3 billion from U.S. real estate and $1.0 billion from preferred securities. Our organic growth rate for the twelve months ended June 30, 2021March 31, 2022 was 18.9%7.3%. The organic growth/decaygrowth rate represents the ratio of net flows for the period to the beginning assets under management.
Average assets under management for the three months ended June 30, 2021March 31, 2022 increased 49.4%22.2% to $92.9$101.2 billion from $62.2$82.8 billion for the three months ended June 30, 2020.March 31, 2021.
Open-end funds
Assets under management in open-end funds at March 31, 2022, which represented 47.1% of total assets under management, increased 24.6% to $48.1 billion from $38.6 billion at March 31, 2021. The increase was due to net inflows of $6.8 billion and market appreciation of $4.7 billion, partially offset by distributions of $2.0 billion. Net inflows included $3.6 billion into U.S. real estate and $1.6 billion into preferred securities. Market appreciation included $4.6 billion from U.S. real estate. Distributions included $1.0 billion from U.S. real estate ($966 million of which was reinvested and included
in net inflows) and $769 million from preferred securities ($581 million of which was reinvested and included in net inflows). Our organic growth rate for open-end funds for the twelve months ended March 31, 2022 was 17.7%.
Average assets under management for open-end funds for the three months ended March 31, 2022 increased 31.2% to $48.1 billion from $36.6 billion for the three months ended March 31, 2021.
Institutional accounts
Assets under management in institutional accounts at June 30, 2021,March 31, 2022, which represented 41.7%40.1% of total assets under management, increased 39.1%12.1% to $40.2$41.0 billion from $28.9$36.5 billion at June 30, 2020.March 31, 2021. The increase was due to net inflows of $2.5 billion and market appreciation of $10.1$6.5 billion, partially offset by net outflows of $1.0 billion and distributions of $1.3$1.2 billion. Net inflowsoutflows included $1.6$1.0 billion into U.S.from real estateassets multi-strategy (included in "Other" in the table on pages 23 and $519 million into global/international real estate.24). Market appreciation included $4.5$3.5 billion from U.S. real estate, and $4.1$2.2 billion from global/international real estate.estate and $635 million from global listed infrastructure. Distributions included $1.3$1.1 billion from U.S. real estate. Our organic growthdecay rate for institutional accounts for the twelve months ended June 30, 2021March 31, 2022 was 8.8%(2.7%).
Average assets under management for institutional accounts for the three months ended June 30, 2021March 31, 2022 increased 44.2%17.4% to $39.1$40.6 billion from $27.1$34.6 billion for the three months ended June 30, 2020.March 31, 2021.
Assets under management in institutional advisory accounts at June 30, 2021,March 31, 2022, which represented 57.6%57.9% of institutional assets under management, increased 51.6%17.0% to $23.1$23.7 billion from $15.3$20.3 billion at June 30, 2020.March 31, 2021. The increase was due to net inflows of $2.7 billion$210 million and market appreciation of $5.1$3.2 billion. Net inflows included $1.4 billion$485 million into global listed infrastructure, $308 million into preferred securities, $290 million into U.S. real estate, $713$172 million into global/international real estate, partially offset by net outflows of $1.0 billion from real assets multi-strategy (included in "Other" in the table on pages 23 and $587 million into preferred securities.24). Market appreciation included $2.3$1.4 billion from U.S. real estate, $1.2 billion from global/international real estate and $1.7 billionand $447 million from U.S. real estate.global listed infrastructure. Our organic growth rate for institutional advisory accounts for the twelve months ended June 30, 2021March 31, 2022 was 17.8%1.0%.
Average assets under management for institutional advisory accounts for the three months ended June 30, 2021March 31, 2022 increased 53.7%26.2% to $22.1$23.9 billion from $14.4$18.9 billion for the three months ended June 30, 2020.March 31, 2021.
Assets under management in Japan subadvisory accounts at June 30, 2021,March 31, 2022, which represented 26.2%26.1% of institutional assets under management, increased 20.2%7.7% to $10.5$10.7 billion from $8.7$9.9 billion at June 30, 2020.March 31, 2021. The increase was due to market appreciation of $3.2$2.4 billion, partially offset by net outflows of $99$450 million and distributions of $1.3$1.2 billion. Net outflows included $219$448 million from global/international real estate and $147 million from preferred securities, partially offset by net inflows of $273 million into U.S. real estate. Market appreciation included $2.5$1.9 billion from U.S. real estate and $643$444 million from global/international real estate. Distributions included $1.3$1.1 billion from U.S. real estate. Our organic decay rate for Japan subadvisory accounts for the twelve months ended June 30, 2021March 31, 2022 was 1.1%(4.5%).
Average assets under management for Japan subadvisory accounts for the three months ended June 30, 2021March 31, 2022 increased 26.8%7.1% to $10.3$10.4 billion from $8.1$9.7 billion for the three months ended June 30, 2020.March 31, 2021.
Assets under management in institutional subadvisory accounts excluding Japan at June 30, 2021,March 31, 2022, which represented 16.3%16.0% of institutional assets under management, increased 34.0%3.2% to $6.5 billion from $4.9$6.3 billion at June 30, 2020.March 31, 2021. The increase was due to market appreciation of $1.7 billion,$968 million, partially offset by net outflows of $69$765 million. Net outflows included $401 million primarily from U.S. real estate. Market appreciation included $1.2 billion from global/international real estate and $270$283 million from global listed infrastructure. Market appreciation included $550 million from global/international real estate and $217 million from U.S. real estate. Our organic decay rate for institutional subadvisory accounts excluding Japan for the twelve months ended June 30, 2021March 31, 2022 was 1.4%(12.1%).
Average assets under management for institutional subadvisory accounts excluding Japan for the three months ended June 30, 2021March 31, 2022 increased 45.4%5.9% to $6.7$6.4 billion from $4.6$6.1 billion for the three months ended June 30, 2020.March 31, 2021.
Open-end funds
Assets under management in open-end funds at June 30, 2021, which represented 45.2% of total assets under management, increased 50.5% to $43.5 billion from $28.9 billion at June 30, 2020. The increase was due to net inflows of $7.6 billion and market appreciation of $8.2 billion, partially offset by distributions of $1.1 billion. Net inflows included $4.0 billion into preferred securities and $2.8 billion into U.S. real estate. Market appreciation included $5.6 billion from U.S. real estate, $1.7 billion from preferred securities and $637 million from global/international real estate. Distributions included $629 million from preferred securities ($463 million of which was reinvested) and $403 million from U.S. real estate ($372 million of which was reinvested). Our organic growth rate for open-end funds for the twelve months ended June 30, 2021 was 26.2%.
Average assets under management for open-end funds for the three months ended June 30, 2021 increased 54.7% to $41.5 billion from $26.8 billion for the three months ended June 30, 2020.
Closed-end funds
Assets under management in closed-end funds at June 30, 2021,March 31, 2022, which represented 13.0%12.8% of total assets under management, increased 46.8%10.0% to $12.5$13.1 billion from $8.5$11.9 billion at June 30, 2020.March 31, 2021. The increase was due to net inflows of $2.4 billion$576 million and market appreciation of $2.1$1.2 billion, partially offset by distributions of $556$621 million. Net inflowsInflows of $482 million, which included $2.1 billion fromleverage, were attributable to the Company's initial public offering of the Cohen & Steers Tax-Advantaged Preferred SecuritiesReal Estate Opportunities and
Income Fund (PTA)(RLTY). Our organic growth rate for closed-end funds for the twelve months ended June 30, 2021March 31, 2022 was 28.3%4.8%.
Average assets under management for closed-end funds for the three months ended June 30, 2021March 31, 2022 increased 48.7%8.2% to $12.4$12.6 billion from $8.3$11.6 billion for the three months ended June 30, 2020.March 31, 2021.
Summary of Operating InformationResults | | | Three Months Ended
June 30, | | Six Months Ended
June 30, | | Three Months Ended
March 31, |
| (in thousands, except percentages and per share data) | (in thousands, except percentages and per share data) | 2021 | | 2020 | | 2021 | | 2020 | (in thousands, except percentages and per share data) | 2022 | | 2021 |
| U.S. GAAP | U.S. GAAP | | | | | | | | U.S. GAAP | | | |
| Revenue | Revenue | $ | 144,269 | | | $ | 94,087 | | | $ | 270,016 | | | $ | 199,917 | | Revenue | $ | 154,189 | | | $ | 125,747 | |
| Expenses | Expenses | $ | 84,572 | | | $ | 58,792 | | | $ | 158,381 | | | $ | 136,253 | | Expenses | $ | 103,198 | | | $ | 73,809 | |
| Operating income | Operating income | $ | 59,697 | | | $ | 35,295 | | | $ | 111,635 | | | $ | 63,664 | | Operating income | $ | 50,991 | | | $ | 51,938 | |
| Non-operating income (loss) | Non-operating income (loss) | $ | 8,536 | | | $ | 7,953 | | | $ | 13,489 | | | $ | (11,890) | | Non-operating income (loss) | $ | 5,110 | | | $ | 4,953 | |
| Net income attributable to common stockholders | Net income attributable to common stockholders | $ | 46,579 | | | $ | 28,520 | | | $ | 95,431 | | | $ | 49,092 | | Net income attributable to common stockholders | $ | 42,018 | | | $ | 48,852 | |
| Diluted earnings per share | Diluted earnings per share | $ | 0.95 | | | $ | 0.59 | | | $ | 1.95 | | | $ | 1.01 | | Diluted earnings per share | $ | 0.85 | | | $ | 1.00 | |
| Operating margin | Operating margin | 41.4 | % | | 37.5 | % | | 41.3 | % | | 31.8 | % | Operating margin | 33.1 | % | | 41.3 | % |
| As Adjusted (1) | As Adjusted (1) | | As Adjusted (1) | |
| Net income attributable to common stockholders | Net income attributable to common stockholders | $ | 45,917 | | | $ | 26,154 | | | $ | 84,546 | | | $ | 55,593 | | Net income attributable to common stockholders | $ | 51,152 | | | $ | 38,629 | |
| Diluted earnings per share | Diluted earnings per share | $ | 0.94 | | | $ | 0.54 | | | $ | 1.73 | | | $ | 1.15 | | Diluted earnings per share | $ | 1.04 | | | $ | 0.79 | |
| Operating margin | Operating margin | 43.4 | % | | 37.7 | % | | 42.9 | % | | 38.0 | % | Operating margin | 44.7 | % | | 42.3 | % |
_________________________
(1) These amounts represent the Company’s as adjusted results. Please refer to pages 34-3531-32 for reconciliations of U.S. GAAP to as adjusted results.
U.S. GAAP
Three Months Ended June 30, 2021March 31, 2022 Compared with Three Months Ended June 30, 2020March 31, 2021
Revenue | | | Three Months Ended
June 30, | | | Three Months Ended
March 31, | |
| (in thousands) | (in thousands) | 2021 | | 2020 | | $ Change | | % Change | (in thousands) | 2022 | | 2021 | | $ Change | | % Change |
| Open-end funds | Open-end funds | $ | 69,706 | | | $ | 44,636 | | | $ | 25,070 | | | 56.2 | % | Open-end funds | $ | 79,665 | | | $ | 60,603 | | | $ | 19,062 | | | 31.5 | % |
| Institutional accounts | Institutional accounts | 37,381 | | | 24,500 | | | 12,881 | | | 52.6 | % | Institutional accounts | 36,683 | | | 30,987 | | | $ | 5,696 | | | 18.4 | % |
| Closed-end funds | Closed-end funds | 27,261 | | | 17,512 | | | 9,749 | | | 55.7 | % | Closed-end funds | 27,321 | | | 25,331 | | | $ | 1,990 | | | 7.9 | % |
| Investment advisory and administration fees | Investment advisory and administration fees | 134,348 | | | 86,648 | | | 47,700 | | | 55.1 | % | Investment advisory and administration fees | 143,669 | | | 116,921 | | | $ | 26,748 | | | 22.9 | % |
| Distribution and service fees | Distribution and service fees | 9,199 | | | 6,930 | | | 2,269 | | | 32.7 | % | Distribution and service fees | 9,869 | | | 8,272 | | | $ | 1,597 | | | 19.3 | % |
| Other | Other | 722 | | | 509 | | | 213 | | | 41.8 | % | Other | 651 | | | 554 | | | $ | 97 | | | 17.5 | % |
| Total revenue | Total revenue | $ | 144,269 | | | $ | 94,087 | | | $ | 50,182 | | | 53.3 | % | Total revenue | $ | 154,189 | | | $ | 125,747 | | | $ | 28,442 | | | 22.6 | % |
Revenue forInvestment advisory and administration fees increased from the three months ended June 30,March 31, 2021, increased primarily due to higher average assets under management across all three investment vehicles and the recognition of $2.3 million of performance fees from certain institutional accounts.vehicles.
•Total investment advisory and administration revenue from open-end funds compared with average assets under management in open-end funds implied an annualized effective fee rate of 67.467.2 bps and 67.067.1 bps for the three months ended June 30,March 31, 2022 and 2021, and 2020, respectively.
•Total investment advisory revenue from institutional accounts compared with average assets under management in institutional accounts implied an annualized effective fee rate of 38.336.6 bps and 36.3 bps for the three months ended June 30,March 31, 2022 and 2021, and 2020, respectively. The increase in the implied annualized effective fee rate was primarily due to the recognition of performance fees for the three months ended June 30, 2021. Excluding the performance fees, the implied annualized effective fee rate for the three months ended June 30, 2021 would have been 36.0 bps.
•Total investment advisory and administration revenue from closed-end funds compared with average assets under management in closed-end funds implied an annualized effective fee rate of 88.488.3 bps and 84.688.6 bps for the three months ended June 30,March 31, 2022 and 2021, and 2020, respectively. The increase in the implied annualized effective fee rate was primarily due to the initial public offering of PTA, which concluded on October 27, 2020.
Expenses | | | Three Months Ended
June 30, | | | Three Months Ended
March 31, | |
| (in thousands) | (in thousands) | 2021 | | 2020 | | $ Change | | % Change | (in thousands) | 2022 | | 2021 | | $ Change | | % Change |
| Employee compensation and benefits | Employee compensation and benefits | $ | 53,241 | | | $ | 34,320 | | | $ | 18,921 | | | 55.1 | % | Employee compensation and benefits | $ | 54,743 | | | $ | 45,762 | | | $ | 8,981 | | | 19.6 | % |
| Distribution and service fees | Distribution and service fees | 18,848 | | | 12,518 | | | 6,330 | | | 50.6 | % | Distribution and service fees | 33,951 | | | 16,506 | | | $ | 17,445 | | | 105.7 | % |
| General and administrative | General and administrative | 11,466 | | | 10,726 | | | 740 | | | 6.9 | % | General and administrative | 13,510 | | | 10,374 | | | $ | 3,136 | | | 30.2 | % |
| Depreciation and amortization | Depreciation and amortization | 1,017 | | | 1,228 | | | (211) | | | (17.2) | % | Depreciation and amortization | 994 | | | 1,167 | | | $ | (173) | | | (14.8) | % |
| Total expenses | Total expenses | $ | 84,572 | | | $ | 58,792 | | | $ | 25,780 | | | 43.8 | % | Total expenses | $ | 103,198 | | | $ | 73,809 | | | $ | 29,389 | | | 39.8 | % |
Employee compensation and benefits expenses forincreased from the three months ended June 30,March 31, 2021, increased primarily due to higher incentive compensation of $12.5$3.4 million, and higher accelerated vestingan increase in amortization of certain restricted stock units of $2.7$2.3 million and higher salaries of $1.2 million.
Distribution and service fees expense forincreased from the three months ended June 30,March 31, 2021, increased primarily due to costs of $14.2 million associated with the initial public offering of RLTY and higher average assets under management in U.S. open-end funds and a shift in the composition of assets under management into a higher cost intermediary.funds.
General and administrative expenses forincreased from the three months ended June 30,March 31, 2021, increased primarily due to higher professional feesinformation technology and market data expenses of $893,000, $387,000$1.1 million, an increase in organizational and offering costs associated with RLTY of which was attributable to recruitment fees.$658,000 and higher travel and entertainment of $386,000.
Operating Margin
Operating margin for the three months ended June 30, 2021 increasedMarch 31, 2022 decreased to 41.4%33.1% from 37.5%41.3% for the three months ended June 30, 2020.March 31, 2021. The three months ended March 31, 2022 included costs associated with the initial public offering of RLTY. Operating margin represents the ratio of operating income to revenue.
Non-operating Income (Loss) | | | Three Months Ended | | Three Months Ended |
| | June 30, 2021 | | June 30, 2020 | | March 31, 2022 | | March 31, 2021 |
| (in thousands) | (in thousands) | Seed Investments | | Other | | Total | | Seed Investments | | Other | | Total | (in thousands) | Seed Investments (1) | | Other | | Total | | Seed Investments (1) | | Other | | Total |
| Interest and dividend income—net | Interest and dividend income—net | $ | 817 | | | $ | 20 | | | $ | 837 | | | $ | 604 | | | $ | 289 | | | $ | 893 | | Interest and dividend income—net | $ | 901 | | | $ | (4) | | | $ | 897 | | | $ | 604 | | | $ | 12 | | | $ | 616 | |
| Gain (loss) from investments—net | Gain (loss) from investments—net | 7,778 | | | — | | | 7,778 | | | 7,317 | | | — | | | 7,317 | | Gain (loss) from investments—net | 3,565 | | | 2 | | | 3,567 | | | 4,485 | | | 74 | | | 4,559 | |
| Foreign currency gains (losses)—net | 223 | | | (302) | | | (79) | | | (225) | | | (32) | | | (257) | | |
| Foreign currency gain (loss)—net | | Foreign currency gain (loss)—net | (295) | | | 941 | | | 646 | | | 191 | | | (413) | | | (222) | |
| Total non-operating income (loss) | Total non-operating income (loss) | $ | 8,818 | | (1) | $ | (282) | | | $ | 8,536 | | | $ | 7,696 | | (1) | $ | 257 | | | $ | 7,953 | | Total non-operating income (loss) | $ | 4,171 | | | $ | 939 | | | $ | 5,110 | | | $ | 5,280 | | | $ | (327) | | | $ | 4,953 | |
_________________________
(1) Seed investments included net income of $5.8$4.8 million and $3.6 million attributable to third-party interests in consolidated Company-sponsored funds for the three months ended June 30,March 31, 2022 and 2021, and 2020, respectively.
Income Taxes | | | | | | | | | | | | | | | | | | | | | | | |
| Three Months Ended
June 30, | | | | |
| (in thousands, except percentages) | 2021 | | 2020 | | $ Change | | % Change |
| | | | | | | |
| Income tax expense | $ | 15,827 | | | $ | 11,086 | | | $ | 4,741 | | | 42.8 | % |
| Effective tax rate | 25.4 | % | | 28.0 | % | | | | |
The effectiveA reconciliation of the Company’s statutory federal income tax rate for the three months ended June 30, 2021 and 2020 differed from the U.S. federal statutory rate of 21.0% primarily due to state, local and foreign income taxes and limitations on the deductibility of executive compensation. In addition, the effective income tax rate for the three months ended June 30, 2021 included the cumulative effect of a changeis summarized in the Company’s estimated effective tax rate for the year.following table:
| | | | | | | | | | | |
| Three Months Ended
March 31, |
| 2022 | | 2021 |
| U.S. statutory tax rate | 21.0 | % | | 21.0 | % |
| State and local income taxes, net of federal benefit | 3.5 | | | 4.1 | |
| Non-deductible executive compensation | 5.2 | | | 3.4 | |
| Excess tax benefits related to the vesting and delivery of restricted stock units | (11.5) | | | (10.4) | |
| Unrecognized tax benefit adjustments | — | | | (10.2) | |
| Other | (0.1) | | | 0.5 | |
| Effective income tax rate | 18.1 | % | | 8.4 | % |
Six Months Ended June 30, 2021 Compared with Six Months Ended June 30, 2020
Revenue | | | | | | | | | | | | | | | | | | | | | | | |
| Six Months Ended
June 30, | | | | |
| (in thousands) | 2021 | | 2020 | | $ Change | | % Change |
| | | | | | | |
| Open-end funds | $ | 130,309 | | | $ | 94,444 | | | $ | 35,865 | | | 38.0 | % |
| Institutional accounts | 68,368 | | | 52,359 | | | 16,009 | | | 30.6 | % |
| Closed-end funds | 52,592 | | | 37,134 | | | 15,458 | | | 41.6 | % |
| Investment advisory and administration fees | 251,269 | | | 183,937 | | | 67,332 | | | 36.6 | % |
| Distribution and service fees | 17,471 | | | 14,713 | | | 2,758 | | | 18.7 | % |
| Other | 1,276 | | | 1,267 | | | 9 | | | 0.7 | % |
| Total revenue | $ | 270,016 | | | $ | 199,917 | | | $ | 70,099 | | | 35.1 | % |
Revenue for the six months ended June 30, 2021 increased primarily due to higher average assets under management across all three investment vehicles and higher performance fees from certain institutional accounts of $1.3 million.
•Total investment advisory and administration revenue compared with average assets under management in open-end funds implied an annualized effective fee rate of 67.3 bps and 67.0 bps for the six months ended June 30, 2021 and 2020, respectively.
•Total investment advisory revenue compared with average assets under management in institutional accounts implied an annualized effective fee rate of 37.4 bps and 36.9 bps for the six months ended June 30, 2021 and 2020, respectively. The increase in the implied annualized effective fee rate was primarily due to higher performance fees recognized for the six months ended June 30, 2021. Excluding the performance fees, the implied annualized effective fee rates for the six months ended June 30, 2021 and 2020, respectively, would have been 36.1 bps and 36.2 bps.
•Total investment advisory and administration revenue compared with average assets under management in closed-end funds implied an annualized effective fee rate of 88.5 bps and 84.8 bps for the six months ended June 30, 2021 and 2020, respectively. The increase in the implied annualized effective fee rate was primarily due to the initial public offering of PTA, which concluded on October 27, 2020.
Expenses | | | | | | | | | | | | | | | | | | | | | | | |
| Six Months Ended
June 30, | | | | |
| (in thousands) | 2021 | | 2020 | | $ Change | | % Change |
| Employee compensation and benefits | $ | 99,003 | | | $ | 72,937 | | | $ | 26,066 | | | 35.7 | % |
| Distribution and service fees | 35,354 | | | 26,622 | | | 8,732 | | | 32.8 | % |
| General and administrative | 21,840 | | | 34,314 | | | (12,474) | | | (36.4) | % |
| Depreciation and amortization | 2,184 | | | 2,380 | | | (196) | | | (8.2) | % |
| Total expenses | $ | 158,381 | | | $ | 136,253 | | | $ | 22,128 | | | 16.2 | % |
Employee compensation and benefits expenses for the six months ended June 30, 2021 increased primarily due to higher incentive compensation of $19.0 million and higher accelerated vesting of certain restricted stock units of $3.8 million.
Distribution and service fees expense for the six months ended June 30, 2021 increased primarily due to higher average assets under management in U.S. open-end funds and a shift in the composition of assets under management into a higher cost intermediary.
General and administrative expenses for the six months ended June 30, 2021 decreased $12.5 million. The six months ended June 30, 2020 included costs associated with the Cohen & Steers Quality Income Realty Fund, Inc. (RQI) rights offering of approximately $12.0 million.
Operating Margin
Operating margin for the six months ended June 30, 2021 increased to 41.3% from 31.8% for the six months ended June 30, 2020. The six months ended June 30, 2020 included costs associated with the RQI rights offering.
Non-operating Income (Loss) | | | | | | | | | | | | | | | | | | | | | | | | | | | | | | | | | | | |
| Six Months Ended |
| June 30, 2021 | | June 30, 2020 |
| (in thousands) | Seed Investments | | Other | | Total | | Seed Investments | | Other | | Total |
| Interest and dividend income—net | $ | 1,421 | | | $ | 32 | | | $ | 1,453 | | | $ | 1,211 | | | $ | 831 | | | $ | 2,042 | |
| Gain (loss) from investments—net | 12,263 | | | 74 | | | 12,337 | | | (14,710) | | | — | | | (14,710) | |
| Foreign currency gains (losses)—net | 414 | | | (715) | | | (301) | | | (698) | | | 1,476 | | | 778 | |
| Total non-operating income (loss) | $ | 14,098 | | (1) | $ | (609) | | | $ | 13,489 | | | $ | (14,197) | | (1) | $ | 2,307 | | | $ | (11,890) | |
_________________________
(1) Seed investments included net income of $9.4 million and net loss of $8.9 million attributable to third-party interests for the six months ended June 30, 2021 and 2020, respectively.
Income Taxes | | | | | | | | | | | | | | | | | | | | | | | |
| Six Months Ended
June 30, | | | | |
| (in thousands, except percentages) | 2021 | | 2020 | | $ Change | | % Change |
| | | | | | | |
| Income tax expense | $ | 20,288 | | | $ | 11,544 | | | $ | 8,744 | | | 75.7 | % |
| Effective tax rate | 17.5 | % | | 19.0 | % | | | | |
The effective tax rate for the six months ended June 30, 2021 differed from the U.S. federal statutory rate of 21.0% primarily due to state, local and foreign income taxes and limitations on the deductibility of executive compensation. These were more than offset by the reversal of certain liabilities associated with unrecognized tax benefits and the tax effect associated with the appreciated value of the restricted stock units delivered in January 2021. The effective tax rate for the six months ended June 30, 2020 differed from the U.S. federal statutory rate of 21.0% primarily due to state, local and foreign income taxes and limitations on the deductibility of executive compensation. These were more than offset by the tax effect associated with the appreciated value of the restricted stock units delivered in January 2020.
As Adjusted
This section discusses as adjusted results. Please refer to pages 34-3531-32 for reconciliations of U.S. GAAP to as adjusted results.
Three Months Ended June 30, 2021March 31, 2022 Compared with Three Months Ended June 30, 2020March 31, 2021
Revenue
Revenue, as adjusted, for the three months ended June 30, 2021March 31, 2022 was $144.4$154.3 million, compared with $94.0$125.8 million, as adjusted, for the three months ended June 30, 2020.March 31, 2021.
Revenue, as adjusted, excluded the consolidation of certain of our seed investments for both periods.
Expenses
Expenses, as adjusted, for the three months ended June 30, 2021March 31, 2022 were $81.8$85.4 million, compared with $58.6$72.6 million, as adjusted, for the three months ended June 30, 2020.March 31, 2021.
Expenses, as adjusted, excluded the following:
•The consolidation of certain of our seed investments for both periods;
•Amounts related to the accelerated vesting of certain restricted stock units for both periods; and
•Costs associated with the initial public offering of RLTY for the three months ended June 30, 2021.March 31, 2022.
Operating Margin
Operating margin, as adjusted, for the three months ended June 30, 2021March 31, 2022 was 43.4%44.7%, compared with 37.7%42.3%, as adjusted, for the three months ended June 30, 2020.March 31, 2021.
Non-operating Income (Loss)
Non-operating loss, as adjusted, for the three months ended June 30, 2021March 31, 2022 was $120,000,$273,000, compared with non-operating income,loss, as adjusted, of $140,000$118,000 for the three months ended June 30, 2020.
Non-operating income (loss), as adjusted, excluded the following for both periods:
•Results from our seed investments; and
•Net foreign currency exchange gains and losses associated with U.S. dollar-denominated assets held by certain foreign subsidiaries.
Income Taxes
The effective tax rate, as adjusted, for the three months ended June 30, 2021 and 2020, respectively, was 26.5%.
The effective tax rate, as adjusted, excluded the tax effects associated with items noted above, as well as discrete tax items for both periods.
Six Months Ended June 30, 2021 Compared with Six Months Ended June 30, 2020
Revenue
Revenue, as adjusted, for the six months ended June 30, 2021 was $270.2 million, compared with $199.8 million for the six months ended June 30, 2020.
Revenue, as adjusted, excluded the consolidation of certain of our seed investments for both periods.
Expenses
Expenses, as adjusted, for the six months ended June 30, 2021 were $154.4 million, compared with $123.9 million for the six months ended June 30, 2020.
Expenses, as adjusted, excluded the following:
•The consolidation of certain of our seed investments for both periods;
•Amounts related to the accelerated vesting of certain restricted stock units for the six months ended June 30, 2021; and
•Costs associated with the RQI rights offering for the six months ended June 30, 2020.
Operating Margin
Operating margin, as adjusted, for the six months ended June 30, 2021 was 42.9%, compared with 38.0% for the six months ended June 30, 2020.
Non-operating Income (Loss)
Non-operating loss, as adjusted, for the six months ended June 30, 2021 was $238,000, compared with non-operating income, as adjusted, of $263,000 for the six months ended June 30, 2020.March 31, 2021.
Non-operating income (loss), as adjusted, excluded the following for both periods:
•Results from our seed investments; and
•Net foreign currency exchange gains and losses associated with U.S. dollar-denominated assets held by certain foreign subsidiaries.
Income Taxes
The effective tax rate, as adjusted, for the sixthree months ended June 30, 2021March 31, 2022 was 26.9%25.5%, compared with 27.0%27.3%, as adjusted, for the sixthree months ended June 30, 2020.March 31, 2021.
The effective tax rate, as adjusted, excluded the taxfollowing for both periods:
•Tax effects associated with items noted above, as well as discreteabove; and
•Discrete tax items for both periods.items.
Reconciliations of U.S. GAAP to As Adjusted Financial Results
Management believes that use of the following as adjusted (non-GAAP) financial results provides greater transparency into the Company’s operating performance. In addition, these as adjusted financial results are used to prepare the Company's internal management reports which are used in evaluating its business.
While we believe that these as adjusted financial results are useful in evaluating operating performance, this information should be considered as supplemental in nature and not as a substitute for the related financial information prepared in accordance with U.S. GAAP.
Reconciliation of U.S. GAAP to As Adjusted Financial Results
Net Income Attributable to Common Stockholders and Diluted Earnings per Share | | | Three Months Ended
June 30, | | Six Months Ended
June 30, | | Three Months Ended
March 31, |
| (in thousands, except per share data) | (in thousands, except per share data) | 2021 | | 2020 | | 2021 | | 2020 | (in thousands, except per share data) | 2022 | | 2021 |
| Net income attributable to common stockholders, U.S. GAAP | Net income attributable to common stockholders, U.S. GAAP | $ | 46,579 | | | $ | 28,520 | | | $ | 95,431 | | | $ | 49,092 | | Net income attributable to common stockholders, U.S. GAAP | $ | 42,018 | | | $ | 48,852 | |
Seed investments (1) | Seed investments (1) | (2,752) | | | (3,885) | | | (4,264) | | | 5,703 | | Seed investments (1) | 1,051 | | | (1,512) | |
| Accelerated vesting of restricted stock units | Accelerated vesting of restricted stock units | 2,664 | | | — | | | 3,752 | | | — | | Accelerated vesting of restricted stock units | 2,305 | | | 1,088 | |
Rights offering costs (2) | — | | | — | | | — | | | 11,859 | | |
Initial public offering costs (2) | | Initial public offering costs (2) | 15,239 | | | — | |
| Foreign currency exchange (gains) losses—net (3) | Foreign currency exchange (gains) losses—net (3) | 162 | | | (117) | | | 371 | | | (2,044) | | Foreign currency exchange (gains) losses—net (3) | (1,212) | | | 209 | |
Tax adjustments (4) | Tax adjustments (4) | (736) | | | 1,636 | | | (10,744) | | | (9,017) | | Tax adjustments (4) | (8,249) | | | (10,008) | |
| Net income attributable to common stockholders, as adjusted | Net income attributable to common stockholders, as adjusted | $ | 45,917 | | | $ | 26,154 | | | $ | 84,546 | | | $ | 55,593 | | Net income attributable to common stockholders, as adjusted | $ | 51,152 | | | $ | 38,629 | |
| | Diluted weighted average shares outstanding | Diluted weighted average shares outstanding | 48,951 | | | 48,572 | | | 48,831 | | | 48,549 | | Diluted weighted average shares outstanding | 49,337 | | | 48,709 | |
| Diluted earnings per share, U.S. GAAP | Diluted earnings per share, U.S. GAAP | $ | 0.95 | | | $ | 0.59 | | | $ | 1.95 | | | $ | 1.01 | | Diluted earnings per share, U.S. GAAP | $ | 0.85 | | | $ | 1.00 | |
| Seed investments | Seed investments | (0.06) | | | (0.08) | | | (0.09) | | | 0.12 | | Seed investments | 0.02 | | | (0.03) | |
| Accelerated vesting of restricted stock units | Accelerated vesting of restricted stock units | 0.06 | | | — | | | 0.08 | | | — | | Accelerated vesting of restricted stock units | 0.05 | | | 0.02 | |
| Rights offering costs | — | | | — | | | — | | | 0.25 | | |
| Initial public offering costs | | Initial public offering costs | 0.31 | | | — | |
| | Foreign currency exchange (gains) losses—net | Foreign currency exchange (gains) losses—net | 0.01 | | | — | | * | 0.01 | | | (0.04) | | Foreign currency exchange (gains) losses—net | (0.02) | | | 0.01 | |
| Tax adjustments | Tax adjustments | (0.02) | | | 0.03 | | | (0.22) | | | (0.19) | | Tax adjustments | (0.17) | | | (0.21) | |
| Diluted earnings per share, as adjusted | Diluted earnings per share, as adjusted | $ | 0.94 | | | $ | 0.54 | | | $ | 1.73 | | | $ | 1.15 | | Diluted earnings per share, as adjusted | $ | 1.04 | | | $ | 0.79 | |
_________________________
* Amounts round to less than $0.01 per share.
(1) Represents amounts related to the deconsolidation of seed investments in Company-sponsored funds as well as non-operating
(income) loss from seed investments that were not consolidated.
(2) Represents costs associated with the Cohen & Steers Quality Income Realty Fund, Inc. (RQI) rightsinitial public offering which were recorded in general and administrative expenseof RLTY. Costs are summarized in the first quarter of 2020.following table:
| | | | | | | | | | | |
| Three Months Ended
March 31, |
| (in thousands) | 2022 | | 2021 |
| Employee compensation and benefits | $ | 357 | | | $ | — | |
| Distribution and service fees | 14,224 | | | — | |
| General and administrative | 658 | | | — | |
| Initial public offering costs | $ | 15,239 | | | $ | — | |
(3) Represents net foreign currency exchange (gains) losses associated with U.S. dollar-denominated assets held by certain foreign subsidiaries.
(4) Tax adjustments are summarized in the following table:
| | | | | | | | | | | | | | | | | | | | | | | |
| | | |
| | | | | | | |
| Discrete tax items | $ | (10) | | | $ | 13 | | | $ | (10,249) | | | $ | (5,807) | |
| Tax effect of adjustments included above | (726) | | | 1,623 | | | (495) | | | (3,210) | |
| Total tax adjustments | $ | (736) | | | $ | 1,636 | | | $ | (10,744) | | | $ | (9,017) | |
| | | | | | | | | | | |
| Three Months Ended
March 31, |
| (in thousands) | 2022 | | 2021 |
| Exclusion of tax effects associated with items noted above | $ | (4,281) | | | $ | 231 | |
| Exclusion of discrete tax items | (3,968) | | | (10,239) | |
| Total tax adjustments | $ | (8,249) | | | $ | (10,008) | |
Reconciliation of U.S. GAAP to As Adjusted Financial Results
Revenue, Expenses, Operating Income and Operating Margin | | | Three Months Ended
June 30, | | Six Months Ended
June 30, | | Three Months Ended
March 31, |
| (in thousands, except percentages) | (in thousands, except percentages) | 2021 | | 2020 | | 2021 | | 2020 | (in thousands, except percentages) | 2022 | | 2021 |
| Revenue, U.S. GAAP | Revenue, U.S. GAAP | $ | 144,269 | | | $ | 94,087 | | | $ | 270,016 | | | $ | 199,917 | | Revenue, U.S. GAAP | $ | 154,189 | | | $ | 125,747 | |
Seed investments (1) | Seed investments (1) | 105 | | | (60) | | | 199 | | | (89) | | Seed investments (1) | 123 | | | 94 | |
| Revenue, as adjusted | Revenue, as adjusted | $ | 144,374 | | | $ | 94,027 | | | $ | 270,215 | | | $ | 199,828 | | Revenue, as adjusted | $ | 154,312 | | | $ | 125,841 | |
| | Expenses, U.S. GAAP | Expenses, U.S. GAAP | $ | 84,572 | | | $ | 58,792 | | | $ | 158,381 | | | $ | 136,253 | | Expenses, U.S. GAAP | $ | 103,198 | | | $ | 73,809 | |
Seed investments (1) | Seed investments (1) | (134) | | | (229) | | | (230) | | | (457) | | Seed investments (1) | (276) | | | (96) | |
| Accelerated vesting of restricted stock units | Accelerated vesting of restricted stock units | (2,664) | | | — | | | (3,752) | | | — | | Accelerated vesting of restricted stock units | (2,305) | | | (1,088) | |
Rights offering costs (2) | — | | | — | | | — | | | (11,859) | | |
Initial public offering costs (2) | | Initial public offering costs (2) | (15,239) | | | — | |
| | Expenses, as adjusted | Expenses, as adjusted | $ | 81,774 | | | $ | 58,563 | | | $ | 154,399 | | | $ | 123,937 | | Expenses, as adjusted | $ | 85,378 | | | $ | 72,625 | |
| | Operating income, U.S. GAAP | Operating income, U.S. GAAP | $ | 59,697 | | | $ | 35,295 | | | $ | 111,635 | | | $ | 63,664 | | Operating income, U.S. GAAP | $ | 50,991 | | | $ | 51,938 | |
Seed investments (1) | Seed investments (1) | 239 | | | 169 | | | 429 | | | 368 | | Seed investments (1) | 399 | | | 190 | |
| Accelerated vesting of restricted stock units | Accelerated vesting of restricted stock units | 2,664 | | | — | | | 3,752 | | | — | | Accelerated vesting of restricted stock units | 2,305 | | | 1,088 | |
Rights offering costs (2) | — | | | — | | | — | | | 11,859 | | |
Initial public offering costs (2) | | Initial public offering costs (2) | 15,239 | | | — | |
| | Operating income, as adjusted | Operating income, as adjusted | $ | 62,600 | | | $ | 35,464 | | | $ | 115,816 | | | $ | 75,891 | | Operating income, as adjusted | $ | 68,934 | | | $ | 53,216 | |
| | Operating margin, U.S. GAAP | Operating margin, U.S. GAAP | 41.4 | % | | 37.5 | % | | 41.3 | % | | 31.8 | % | Operating margin, U.S. GAAP | 33.1 | % | | 41.3 | % |
| Operating margin, as adjusted | Operating margin, as adjusted | 43.4 | % | | 37.7 | % | | 42.9 | % | | 38.0 | % | Operating margin, as adjusted | 44.7 | % | | 42.3 | % |
_________________________
(1) Represents amounts related to the deconsolidation of seed investments in Company-sponsored funds.
(2) Represents costs associated with the RQI rightsinitial public offering which were recorded in general and administrative expensesof RLTY. Costs are summarized in the first quarter of 2020.following table:
| | | | | | | | | | | |
| Three Months Ended
March 31, |
| (in thousands) | 2022 | | 2021 |
| Employee compensation and benefits | $ | 357 | | | $ | — | |
| Distribution and service fees | 14,224 | | | — | |
| General and administrative | 658 | | | — | |
| Initial public offering costs | $ | 15,239 | | | $ | — | |
Reconciliation of U.S. GAAP to As Adjusted Financial Results
Non-operating Income (Loss) | | | Three Months Ended
June 30, | | Six Months Ended
June 30, | | Three Months Ended
March 31, |
| (in thousands) | (in thousands) | 2021 | | 2020 | | 2021 | | 2020 | (in thousands) | 2022 | | 2021 |
| Non-operating income (loss), U.S. GAAP | Non-operating income (loss), U.S. GAAP | $ | 8,536 | | | $ | 7,953 | | | $ | 13,489 | | | $ | (11,890) | | Non-operating income (loss), U.S. GAAP | $ | 5,110 | | | $ | 4,953 | |
Seed investments (1) | Seed investments (1) | (8,818) | | | (7,696) | | | (14,098) | | | 14,197 | | Seed investments (1) | (4,171) | | | (5,280) | |
Foreign currency exchange (gains) losses—net (2) | Foreign currency exchange (gains) losses—net (2) | 162 | | | (117) | | | 371 | | | (2,044) | | Foreign currency exchange (gains) losses—net (2) | (1,212) | | | 209 | |
| Non-operating income (loss), as adjusted | Non-operating income (loss), as adjusted | $ | (120) | | | $ | 140 | | | $ | (238) | | | $ | 263 | | Non-operating income (loss), as adjusted | $ | (273) | | | $ | (118) | |
_________________________
(1) Represents amounts related to the deconsolidation of seed investments in Company-sponsored funds as well as non-operating (income) loss from seed investments that were not consolidated.
(2) Represents net foreign currency exchange (gains) losses associated with U.S. dollar-denominated assets held by certain foreign subsidiaries.
Changes in Financial Condition, Liquidity and Capital Resources
We seek to maintain a capital structure that supports our business strategies and to maintainmaintains the appropriate amount of liquidity at all times. Furthermore, we currently expect cash flows from operations to be more than adequate to fund our present and reasonably foreseeable future commitments for investing and financing activities.
Net Liquid Assets
Our current financial condition is highly liquid and is primarily comprisingcomprised of cash and cash equivalents, U.S. Treasury securities, if any, liquid seed investments and other current assets. Liquid assets are reduced by current liabilities, which are generally defined as obligations due within one year (together, net liquid assets). The Company does not currently have any outstanding debt.
The table below summarizes our net liquid assets: | | (in thousands) | (in thousands) | June 30,
2021 | | December 31,
2020 | (in thousands) | March 31,
2022 | | December 31,
2021 |
| Cash and cash equivalents | Cash and cash equivalents | $ | 111,229 | | | $ | 41,232 | | Cash and cash equivalents | $ | 84,817 | | | $ | 184,373 | |
| U.S. Treasury securities | U.S. Treasury securities | — | | | 41,648 | | U.S. Treasury securities | 29,945 | | | — | |
| Seed investments—net | 70,142 | | | 60,083 | | |
| Current assets | 79,422 | | | 70,208 | | |
| Liquid seed investments—net | | Liquid seed investments—net | 63,432 | | | 62,679 | |
| Other current assets | | Other current assets | 90,178 | | | 84,533 | |
| Current liabilities | Current liabilities | (76,207) | | | (93,870) | | Current liabilities | (71,559) | | | (118,888) | |
| Net liquid assets | Net liquid assets | $ | 184,586 | | | $ | 119,301 | | Net liquid assets | $ | 196,813 | | | $ | 212,697 | |
Cash and cash equivalents
Cash and cash equivalents are on deposit with several highly ratedhighly-rated financial institutions and include short-term, highly-liquidhighly liquid investments, which are readily convertible into cash and have original maturities of three months or less.
During the three months ended March 31, 2022, we paid aggregate costs of $15.2 million associated with the initial public offering of RLTY. We also funded an additional $18.0 million of our up to $50.0 million investment commitment in the Cohen & Steers Real Estate Opportunities Fund, L.P. (REOF) during the quarter. Refer to Investment Commitments, Contractual Obligations, Commitments and Contingencies for further discussion.
U.S. Treasury securities
U.S. Treasury securities are directly issued by the U.S. government and were classified as held to maturity.trading investments.
SeedLiquid seed investments—net
SeedLiquid seed investments are primarily comprised of investments in Company-sponsored funds that we do not consolidate, our pro-rata share of the net assets of the funds that we do consolidate, and listed securities held directly for the purpose of establishing performance track records. Seed investments are recorded at fair value, are generally traded in active markets on major exchanges and can typically be liquidated within a normal settlement cycle. SeedLiquid seed investments are presented net of redeemable noncontrolling interests.
CurrentOther current assets
CurrentOther current assets primarily represent investment advisory and administration fees receivable. At June 30, 2021,March 31, 2022, institutional accounts comprised 52.0% of total accounts receivable, while open-end and closed-end funds, together, comprised 47.5%47.1% of total accounts receivable. Open-end and closed-end fund receivables are generally collected on the first business day of the following month. We perform a review of our receivables on an ongoing basis in order to assess collectibility and, based on our analysis at June 30, 2021,March 31, 2022, there was no allowance for uncollectible accounts required.
Current liabilities
Current liabilities are generally defined as obligations due within one year, which includeincluded accrued compensation and benefits, distribution and service fees payable, operating lease obligations due within 12 months, certain income taxes payable, and other liabilities and accrued expenses.
Cash flows
Our cash flows generally result from the operating activities of our business, with investment advisory and administration fees being the most significant contributor.
The table below summarizes our cash flows: | | | Six Months Ended
June 30, | | Three Months Ended
March 31, |
| (in thousands) | (in thousands) | 2021 | | 2020 | (in thousands) | 2022 | | 2021 |
| Cash Flow Data: | Cash Flow Data: | | | | Cash Flow Data: | | | |
| Net cash provided by (used in) operating activities | Net cash provided by (used in) operating activities | $ | 90,023 | | | $ | 55,601 | | Net cash provided by (used in) operating activities | $ | (106,449) | | | $ | 8,913 | |
| Net cash provided by (used in) investing activities | Net cash provided by (used in) investing activities | 38,148 | | | (3,511) | | Net cash provided by (used in) investing activities | (30,372) | | | 39,200 | |
| Net cash provided by (used in) financing activities | Net cash provided by (used in) financing activities | (58,155) | | | (64,184) | | Net cash provided by (used in) financing activities | 38,648 | | | (34,495) | |
| Net increase (decrease) in cash and cash equivalents | Net increase (decrease) in cash and cash equivalents | 70,016 | | | (12,094) | | Net increase (decrease) in cash and cash equivalents | (98,173) | | | 13,618 | |
| Effect of foreign exchange rate changes on cash and cash equivalents | Effect of foreign exchange rate changes on cash and cash equivalents | (19) | | | (1,123) | | Effect of foreign exchange rate changes on cash and cash equivalents | (1,383) | | | (133) | |
| Cash and cash equivalents, beginning of the period | Cash and cash equivalents, beginning of the period | 41,232 | | | 101,352 | | Cash and cash equivalents, beginning of the period | 184,373 | | | 41,232 | |
| Cash and cash equivalents, end of the period | Cash and cash equivalents, end of the period | $ | 111,229 | | | $ | 88,135 | | Cash and cash equivalents, end of the period | $ | 84,817 | | | $ | 54,717 | |
We expect that cash flows provided by operating activities will provide sufficient liquidity to meet our obligations and continue to serve as our principal source of working capital for the foreseeable future.
Cash and cash equivalents increaseddecreased by $70.0$98.2 million, excluding the effect of foreign exchange rate changes, for the sixthree months ended June 30, 2021.March 31, 2022. Cash flows from operating activities primarily consisted of net income adjusted for certain non-cash items and changes in assets and liabilities. Net cash used in operating activities was $106.4 million for the three months ended March 31, 2022, which included net investment purchases of $100.8 million resulting from the consolidation of certain Company-sponsored funds and costs of $15.2 million associated with the initial public offering of RLTY. Net cash used in investing activities was $30.4 million, which included purchases of U.S. Treasury securities held for corporate purposes of $29.9 million. Net cash provided by operatingfinancing activities was $90.0$38.6 million, including net contributions from redeemable noncontrolling interests of $90.7 million, partially offset by dividends paid to stockholders of $26.8 million and repurchases of common stock to satisfy employee withholding tax obligations on the vesting and delivery of restricted stock units of $25.6 million.
Cash and cash equivalents increased by $13.6 million, excluding the effect of foreign exchange rate changes, for the sixthree months ended June 30,March 31, 2021. Cash flows from operating activities primarily consisted of net income adjusted for certain non-cash items and changes in assets and liabilities. Net cash provided by operating activities was $8.9 million for the three months ended March 31, 2021. Net cash provided by investing activities was $38.1$39.2 million, which included $72.2$41.7 million of proceeds from the salesales and maturities of investments, primarily attributable to U.S. Treasury securities of $41.7 million held for corporate purposes, and $24.4 million held directly for the purpose of establishing performance track records, partially offset by $33.2 millionnet purchases of investment purchases, primarily attributable to securities held directly for the purpose of establishing performance track records of $23.6$2.3 million. Net cash used in financing activities was $58.2$34.5 million, including dividends paid to stockholders of $43.5$21.7 million and repurchases of common stock to satisfy employee withholding tax obligations on the vesting and delivery of restricted stock units of $21.3 million, as well as distributions to redeemable noncontrolling interests of $5.4 million, partially offset by net contributions from redeemable noncontrolling interests of $11.4$8.1 million.
CashContractual Obligations, Commitments and cash equivalents decreased by $12.1Contingencies
The following table summarizes our contractual obligations at March 31, 2022: | | | | | | | | | | | | | | | | | | | | | | | | | | | | | | | | | | | | | |
| (in thousands) | 2022 | | 2023 | | 2024 | | 2025 | | 2026
and after | | | | Total |
| Operating leases | $ | 9,245 | | | $ | 11,885 | | | $ | 1,121 | | | $ | — | | | $ | — | | | | | $ | 22,251 | |
Purchase obligations (1) | 4,306 | | | 4,744 | | | 3,088 | | | 2,474 | | | 2,385 | | | | | 16,997 | |
Other liability (2) | 665 | | | 1,246 | | | 1,662 | | | 2,077 | | | — | | | | | 5,650 | |
| Total | $ | 14,216 | | | $ | 17,875 | | | $ | 5,871 | | | $ | 4,551 | | | $ | 2,385 | | | | | $ | 44,898 | |
_________________________
(1) Represents contracts which are either noncancellable or cancellable with a penalty. The Company’s obligations primarily reflected software licenses and standard service contracts for market data.
(2) Consists of the transition tax liability based on the cumulative undistributed earnings and profits of our foreign subsidiaries in connection with the enactment of the Tax Cuts and Jobs Act in 2017.
Investment Commitments
We have committed to invest up to $50.0 million excluding the effectin REOF. As of foreign exchange rate changes, for the six months ended June 30, 2020. Net cash provided by operating activities was $55.6 million for the six months ended June 30, 2020. Cash flows from operating activities primarily consisted of net income adjusted for certain non-cash items and changes in assets and liabilities. Net cash used in investing activities was $3.5 million, which included $8.8March 31, 2022, we had funded $21.1 million of investment purchases, partially offsetthis commitment. The timing for funding the remaining portion of our commitment is determined by $6.7 million of proceeds from the sale and maturities of investments. Net cash used in financing activities was $64.2 million, including dividends paid to stockholders of $37.3 million, repurchases of common stock to satisfy employee withholding tax obligations on the vesting and delivery of restricted stock units of $25.9 million, as well as distributions to redeemable noncontrolling interests of $5.3 million, partially offset by contributions from redeemable noncontrolling interests of $3.8 million.fund.
We believe that our cash and cash equivalents and cash flows from operations will be more than adequate to meet our anticipated capital requirements and other obligations as they become due.
Dividends
Subject to the approval of our Board of Directors, we anticipate paying dividends. When determining whether to pay a dividend, we take into account general economic and business conditions, our strategic plans, our results of operations and financial condition, contractual, legal and regulatory restrictions on the payment of dividends, if any, by us and our subsidiaries and such other factors deemed relevant.
On AugustMay 5, 2021, the Company2022, we declared a quarterly dividend on itsour common stock in the amount of $0.45$0.55 per share. TheThis dividend will be payable on AugustMay 26, 20212022 to stockholders of record at the close of business on AugustMay 16, 2021.
Investment Commitments
We have committed to co-invest up to $5.1 million alongside Cohen & Steers Global Realty Partners III-TE, L.P. (GRP-TE). As of June 30, 2021, we have funded approximately $3.8 million of this commitment. Our co-investment alongside GRP-TE is illiquid and is anticipated to be invested for the life of the fund. The timing of the funding of the unfunded portion of our commitment is currently unknown, as the drawdown of our commitment is contingent on the timing of drawdowns by the underlying funds in which GRP-TE invests. The unfunded portion of this commitment was not recorded on our condensed consolidated statements of financial condition at June 30, 2021.
Contractual Obligations and Contingencies
We have future obligations under various operating leases, purchase obligations and a transition tax liability in connection with the enactment of the Tax Cuts and Jobs Act in 2017. During the six months ended June 30, 2021, there were no material changes to the Company’s contractual obligations.
Off-Balance Sheet Arrangements
Our off-balance sheet arrangements do not currently have a material effect on our financial condition, results of operations, liquidity or capital resources.
Critical Accounting Policies and Estimates
A complete discussion of our critical accounting policiesestimates is included in Management's Discussion and Analysis of Financial Condition and Results of Operations in our Annual Report on Form 10-K for the year ended December 31, 2020.2021. There were no changes to the Company’s accounting estimates for the three months ended March 31, 2022.
Recently Issued Accounting Pronouncements
See discussionDuring the preparation of Recently Issued Accounting Pronouncements in Note 2our condensed consolidated financial statements, we evaluated all newly issued accounting guidance and concluded none of the Notesnew guidance is applicable to Condensed Consolidated Financial Statements contained in Part I, Item 1our financial position or results of this report.operations as of March 31, 2022.
Item 3. Quantitative and Qualitative Disclosures About Market Risk
In the normal course of our business, we are exposed to risk as a result of changes in interest and currency rates,
securities markets and general economic conditions, which may have an adverse impact on the value of our assets under management and our seed investments. The majority of our revenue is derived from investment advisory and administration fees which are based on average assets under management. Accordingly, where there are changes in the value of the assets we manage as a result of market fluctuations, our revenue and the value of our seed investments may change.
Seed investments—net
Our seed investments are primarily comprised of investments in Company-sponsored funds that we do not consolidate, our pro-rata share of the net assets of the funds that we do consolidate,both liquid and listed securities held directly for the purpose of establishing performance track records. Seedilliquid holdings. Liquid seed investments are recorded at fair value, are generally traded in active markets on major exchanges and can typically be liquidated within a normal settlement cycle. Illiquid seed investments are generally comprised of limited partnership interests in private real estate vehicles for which there may be contractual restrictions on redemption.
Our seed investments are subject to pricemarket risk. We may mitigate this risk by entering into derivative contracts designed to economically hedge a portioncertain portions of our risk. The following table summarizes the effect that a ten percent increase or decrease in prices would have on the carrying value of our seed investments, which isare presented net of redeemable noncontrolling interests, if any, as of June 30, 2021March 31, 2022 (in thousands):
| | | | | | | | | | | | | | | | | | | | | | | | | | | | | | | | |
| | Carrying Value | | Notional Value - Hedges | | Net Carrying Value | | Net Carrying Value Assuming a 10% increase | | Net Carrying Value Assuming a 10% decrease |
| Seed investments—net | | $ | 70,142 | | | $ | (32,295) | | | $ | 37,847 | | | $ | 41,632 | | | $ | 34,062 | |
| | | | | | | | | | | | | | | | | | | | | | | | | | | | | | | | |
| | Carrying Value | | Notional Value - Hedges | | Net Carrying Value | | Net Carrying Value Assuming a 10% increase | | Net Carrying Value Assuming a 10% decrease |
| Liquid seed investments—net | | $ | 63,432 | | | $ | (26,608) | | | $ | 36,824 | | | $ | 40,506 | | | $ | 33,142 | |
| Illiquid seed investments—net | | $ | 18,637 | | | $ | — | | | $ | 18,637 | | | $ | 20,501 | | | $ | 16,773 | |
A majority of our revenue—93.1% and 92.0% for the six months ended June 30, 2021 and 2020, respectively—was derived from investment advisory and administration agreements with our clients. Under these agreements, the investment advisory and administration fee we receive is based on the market value of the assets we manage. Accordingly, a decline in the prices of securities generally, and real estate securities in particular, attributable to market conditions including inflation, interest rate changes and a general economic downturn, may cause our revenue and income to decline by causing the value of the assets we manage to decrease, which would result in lower investment advisory and administration fees; or by causing our clients to withdraw funds in favor of investments that they perceive as offering greater opportunity or lower risk or cost, which would also result in lower investment advisory and administration fees.
The economic environment may also preclude us from increasing the assets we manage in closed-end funds. The market conditions for these offerings may not be as favorable in the future, which could adversely impact our ability to grow the assets we manage and realize higher fee revenue associated with such growth. Depending on market conditions, the closed-end funds we manage may increase or decrease their leverage in order to maintain the funds’ target leverage ratios, thereby increasing or decreasing the assets we manage.
As of June 30, 2021, 62.4% and 26.5% of the assets we managed were concentrated in real estate and preferred securities, respectively. A change in interest rates or prolonged economic downturn could have a negative impact on the valuation of real estate and preferred securities in our clients’ portfolios, reduce our revenue, and impact our ability to increase assets in our open-end funds or offer new funds.
Item 4. Controls and Procedures
We maintainInternal Control over Financial Reporting
There has been no change in our internal control over financial reporting that occurred during the three months ended March 31, 2022 that has materially affected, or is reasonably likely to materially affect, our internal control over financial reporting.
Disclosure Controls and Procedures
Under the direction of our Chief Executive Officer and Chief Financial Officer, we have evaluated the effectiveness of our disclosure controls and procedures (as thatsuch term is defined in Rules 13a-15(e) and 15d-15(e) under the Securities Exchange Act of 1934, as amended (the Exchange Act)), that are designed to ensure that information required to be disclosed in our reports under as of the Exchange Act is recorded, processed, summarized and reported withinend of the time periods specified in the Securities and Exchange Commission's rules and forms, and that such information is accumulated and communicated to our management, includingperiod covered by this quarterly report on Form 10-Q. Based on this evaluation, our Chief Executive Officer and our Chief Financial Officer, as appropriate, to allow timely decisions regarding required disclosures. Any controls and procedures, no matter how well designed and operated can provide only reasonable assurance of achieving the desired control objectives.
Our management, including our Chief Executive Officer and our Chief Financial Officer, has evaluated the effectiveness of our disclosure controls and procedures (as defined in Rule 13a-15(e) under the Exchange Act) as of June 30, 2021. Based on that evaluation and subject to the foregoing, our Chief Executive Officer and our Chief Financial Officer have concluded that our disclosure controls and procedures as of June 30, 2021 were effective to accomplish their objectives at a reasonable assurance level.
There has been no change in our internal control over financial reporting that occurred during the three months ended June 30, 2021 that has materially affected, or is reasonably likely to materially affect, our internal control over financial reporting.effective.
PART II—Other Information
Item 1. Legal Proceedings
From time to time, we may become involved inFor information regarding our legal matters relating to claims arisingproceedings, see Note 10, Commitments and Contingencies, in the ordinary courseNotes to Condensed Consolidated Financial Statements contained in Part I, Item 1 of our business. There are currently no such matters pending that we believe could have a material effect on our condensed consolidated results of operations, cash flows or financial condition. In addition, from time to time, we may receive subpoenas or other requests for information from various U.S. federal and state governmental authorities, domestic and international regulatory authorities and third parties in connection with certain industry-wide inquiries or other investigations or legal proceedings. It is our policy to cooperate fully with such requests.this report.
Item 1A. Risk Factors
For a discussion of the potential risks and uncertainties associated with our business, please see Part I, Item 1A of our
Annual Report on Form 10-K for the year ended December 31, 20202021 (the Form 10-K). There have been no material changes to the risk factors disclosed in Part 1, Item 1A of the Form 10-K.
Item 2. Unregistered Sales of Equity Securities and Use of Proceeds
During the three months ended June 30, 2021,March 31, 2022, we made the following purchases of our equity securities that are registered pursuant to Section 12(b) of the Securities Exchange Act of 1934.Act.
| | | | | | | | | | | | | | | | | |
| Period | Total Number of Shares Purchased (1) | | Average Price
Paid Per Share | Total Number of
Shares Purchased
as Part of Publicly
Announced Plans
or Programs | Maximum Number
of Shares that May
Yet Be Purchased
Under the Plans or
Programs |
| April 1 through April 30, 2021 | 194 | | | $ | 67.01 | | — | | — | |
| May 1 through May 31, 2021 | 949 | | | $ | 72.05 | | — | | — | |
| June 1 through June 30, 2021 | — | | | $ | — | | — | | — | |
| Total | 1,143 | | | $ | 71.19 | | — | | — | |
| | | | | | | | | | | | | | | | | |
| Period | Total Number of Shares Purchased (1) | | Average Price
Paid Per Share | Total Number of
Shares Purchased
as Part of Publicly
Announced Plans
or Programs | Maximum Number
of Shares that May
Yet Be Purchased
Under the Plans or
Programs |
| January 1 through January 31, 2022 | 311,932 | | | $ | 81.66 | | — | | — | |
| February 1 through February 28, 2022 | 1,361 | | | $ | 80.77 | | — | | — | |
| March 1 through March 31, 2022 | 27 | | | $ | 77.45 | | — | | — | |
| Total | 313,320 | | | $ | 81.66 | | — | | — | |
_________________________
(1)Purchases made to satisfy the income tax withholding obligations of certain employees upon the vesting and delivery of restricted stock units issued under the Company's Amended and Restated Stock Incentive Plan.
Item 6. Exhibits
Any agreements or other documents filed as exhibits to this report are not intended to provide factual information or other disclosure other than with respect to the terms of the agreements or other documents themselves, and should not be relied upon for that purpose. In particular, any representations and warranties made by the Company in these agreements or other documents were made solely within the specific context of the relevant agreement or document and may not describe the actual state of affairs at the date they were made or at any other time.
| | | | | | | | |
| Exhibit No. | | Description |
| | |
| 3.1 | | — | |
| | |
| 3.2 | | — | |
| | |
| 4.1 | | — | |
| | |
| 4.2 | | — | |
| | |
| 31.1 | | — | Certification of the Chief Executive Officer pursuant to Section 302 of the Sarbanes-Oxley Act of 2002 (filed herewith) |
| | |
| 31.2 | | — | Certification of the Chief Financial Officer pursuant to Section 302 of the Sarbanes-Oxley Act of 2002 (filed herewith) |
| | |
| 32.1 | | — | Certification of the Chief Executive Officer pursuant to Section 906 of the Sarbanes-Oxley Act of 2002 (furnished herewith) |
| | |
| 32.2 | | — | Certification of the Chief Financial Officer pursuant to Section 906 of the Sarbanes-Oxley Act of 2002 (furnished herewith) |
| | |
| 101 | | — | The following financial statements from the Company's Quarterly Report on Form 10-Q for the quarter ended June 30, 2021March 31, 2022 formatted in inline XBRL (eXtensible Business Reporting Language): (i) the Condensed Consolidated Statements of Financial Condition (unaudited), (ii) the Condensed Consolidated Statements of Operations (unaudited), (iii) the Condensed Consolidated Statements of Comprehensive Income (unaudited), (iv) the Condensed Consolidated Statements of Changes in Stockholders' Equity and Redeemable Noncontrolling Interests (unaudited), (v) the Condensed Consolidated Statements of Cash Flows (unaudited), and (vi) the Notes to the Condensed Consolidated Financial Statements (unaudited). |
| | |
| 104 | | — | Cover Page Interactive Data File (formatted as inline XBRL and contained in Exhibit 101). |
_________________________
(1)Incorporated by reference to the Company's Registration Statement on Form S-1, as amended, originally filed with the Securities and Exchange Commission on March 30, 2004.
(2)Incorporated by reference to the Company's Quarterly Report on Form 10-Q for the quarter ended June 30, 2008.
(3)Incorporated by reference to the Company's Quarterly Report on Form 10-Q for the quarter ended June 30, 2015.
SIGNATURES
Pursuant to the requirements of the Securities Exchange Act of 1934, the Company has duly caused this report to be signed on its behalf by the undersigned thereunto duly authorized.
| | | | | | | | | | | | | | |
| Date: | AugustMay 6, 20212022 | | | Cohen & Steers, Inc. |
| | | | |
| | | | /s/ Matthew S. Stadler |
| | | | Name: Matthew S. Stadler |
| | | | Title: Executive Vice President & Chief Financial Officer |
| | | | | | | | | | | | | | |
| Date: | AugustMay 6, 20212022 | | | Cohen & Steers, Inc. |
| | | | |
| | | | /s/ Elena Dulik |
| | | | Name: Elena Dulik |
| | | | Title: Senior Vice President & Chief Accounting Officer |