UNITED STATES
SECURITIES AND EXCHANGE COMMISSION
Washington, D.C. 20549
____________________________________________
FORM 10-Q
____________________________________________
(Mark One)
x QUARTERLY REPORT PURSUANT TO SECTION 13 OR 15(d) OF THE SECURITIES EXCHANGE ACT OF 1934
For the quarterly period ended September 30, 2014March 31, 2015
or
o TRANSITION REPORT PURSUANT TO SECTION 13 OR 15(d) OF THE SECURITIES EXCHANGE ACT OF 1934
For the transition period from to
Commission File Number: 001-35551
____________________________________________
FACEBOOK, INC.
(Exact name of registrant as specified in its charter)
____________________________________________
|
| |
| Delaware | 20-1665019 |
| (State or other jurisdiction of incorporation or organization) | (I.R.S. Employer Identification Number) |
1601 Willow Road, Menlo Park, California 94025
(Address of principal executive offices and Zip Code)
(650) 543-4800
(Registrant's telephone number, including area code)
____________________________________________
Indicate by check mark whether the registrant (1) has filed all reports required to be filed by Section 13 or 15(d) of the Securities Exchange Act of 1934 (Exchange Act) during the preceding 12 months (or for such shorter period that the registrant was required to file such reports), and (2) has been subject to such filing requirements for the past 90 days. Yes x No ¨
Indicate by check mark whether the registrant has submitted electronically and posted on its corporate Web site, if any, every Interactive Data File required to be submitted and posted pursuant to Rule 405 of Regulation S-T during the preceding 12 months (or for such shorter period that the registrant was required to submit and post such files). Yes x No ¨
Indicate by check mark whether the registrant is a large accelerated filer, an accelerated filer, a non-accelerated filer, or a smaller reporting company. See definition of "large accelerated filer," "accelerated filer" and "smaller reporting company" in Rule 12b-2 of the Exchange Act. (Check one):
|
| | | | | |
| Large accelerated filer | | x | Accelerated filer | | ¨ |
| | | | | |
| Non-accelerated filer | | ¨ (Do not check if a smaller reporting company) | Smaller reporting company | | ¨ |
Indicate by check mark whether the registrant is a shell company (as defined in Rule 12b-2 of the Exchange Act). Yes ¨ No x
Indicate the number of shares outstanding of each of the issuer's classes of Common Stock, as of the latest practicable date.
|
| |
| Class | Number of Shares Outstanding |
| Class A Common Stock $0.000006 par value | 2,223,936,2682,248,896,523 shares outstanding as of October 27, 2014April 21, 2015 |
| Class B Common Stock $0.000006 par value | 563,911,667559,339,723 shares outstanding as of October 27, 2014April 21, 2015 |
FACEBOOK, INC.
TABLE OF CONTENTS
|
| | |
| | | Page No. |
| | |
| |
| | |
| |
| | |
| |
| | | |
| Item 1. | | |
| | | |
| | | |
| | | |
| | | |
| | | |
| | | |
| | | |
| | | |
| | | |
| | | |
| | | |
| Item 2. | | |
| | | |
| Item 3. | | |
| | | |
| Item 4. | | |
| | |
| |
| | | |
| Item 1. | | |
| | | |
| Item 1A. | | |
| | | |
| Item 2. | | |
| | | |
| Item 6. | | |
| | |
| |
NOTE ABOUT FORWARD-LOOKING STATEMENTS
This Quarterly Report on Form 10-Q contains forward-looking statements within the meaning of the Private Securities Litigation Reform Act of 1995. All statements contained in this Quarterly Report on Form 10-Q other than statements of historical fact, including statements regarding our future results of operations and financial position, our business strategy and plans, and our objectives for future operations, are forward-looking statements. The words "believe," "may," "will," "estimate," "continue," "anticipate," "intend," "expect," and similar expressions are intended to identify forward-looking statements. We have based these forward-looking statements largely on our current expectations and projections about future events and trends that we believe may affect our financial condition, results of operations, business strategy, short-term and long-term business operations and objectives, and financial needs. These forward-looking statements are subject to a number of risks, uncertainties and assumptions, including those described in Part II, Item 1A, "Risk Factors" in this Quarterly Report on Form 10-Q. Moreover, we operate in a very competitive and rapidly changing environment. New risks emerge from time to time. It is not possible for our management to predict all risks, nor can we assess the impact of all factors on our business or the extent to which any factor, or combination of factors, may cause actual results to differ materially from those contained in any forward-looking statements we may make. In light of these risks, uncertainties and assumptions, the future events and trends discussed in this Quarterly Report on Form 10-Q may not occur and actual results could differ materially and adversely from those anticipated or implied in the forward-looking statements.
We undertake no obligation to revise or publicly release the results of any revision to these forward-looking statements, except as required by law. Given these risks and uncertainties, readers are cautioned not to place undue reliance on such forward-looking statements.
Unless expressly indicated or the context requires otherwise, the terms "Facebook," "company," "we," "us," and "our" in this document refer to Facebook, Inc., a Delaware corporation, and, where appropriate, its wholly owned subsidiaries. The term "Facebook" may also refer to our products, regardless of the manner in which they are accessed. For references to accessing Facebook on the "web" or via a "website," such terms refer to accessing Facebook on desktop or personal computers. For references to accessing Facebook on "mobile," such term refers to accessing Facebook via a mobile application or via a mobile-optimized version of our website such as m.facebook.com, whether on a mobile phone or tablet.
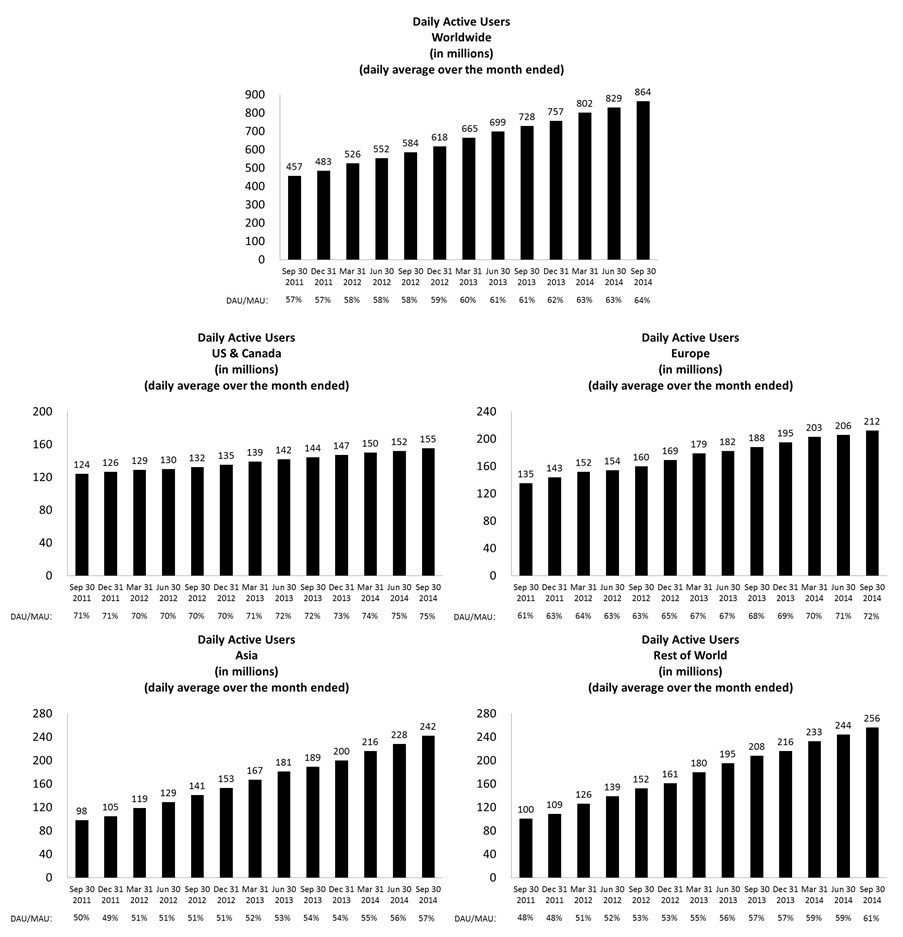
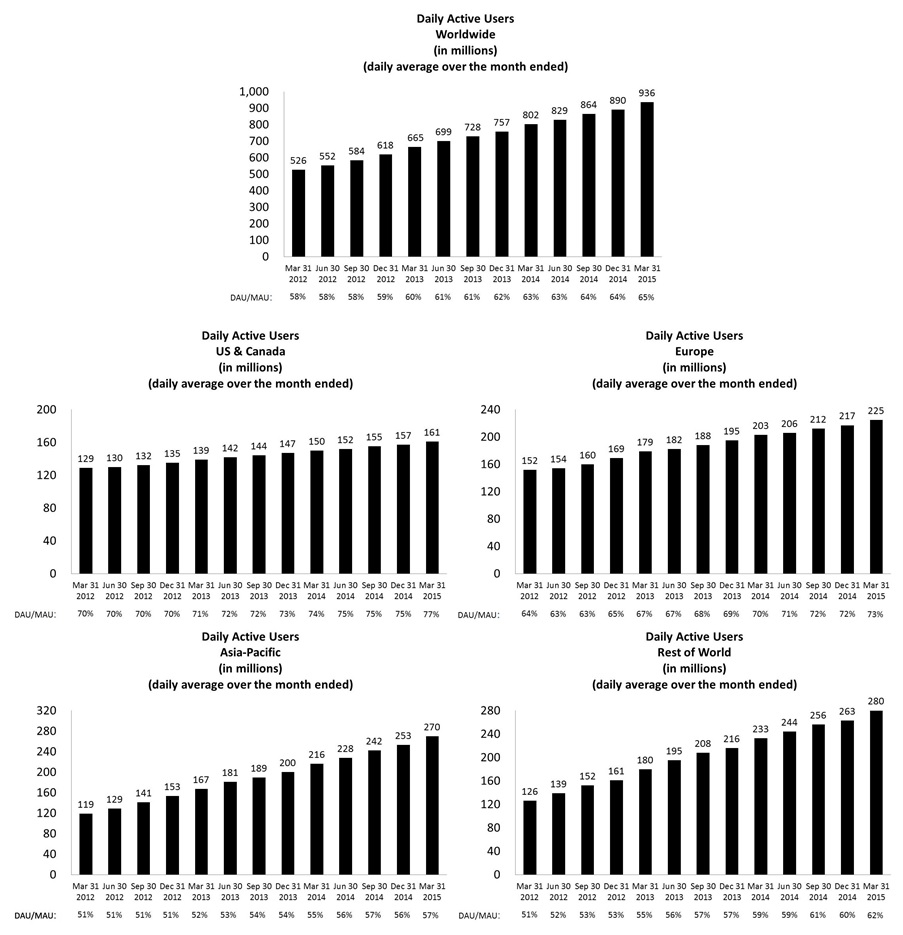
LIMITATIONS OF KEY METRICS AND OTHER DATA
The numbers for our key metrics, which include our daily active users (DAUs), mobile DAUs, monthly active users (MAUs), mobile MAUs, and average revenue per user (ARPU), as well as certain other metrics such as mobile-only DAUs and mobile-only MAUs, are calculated using internal company data based on the activity of user accounts. While these numbers are based on what we believe to be reasonable estimates of our user base for the applicable period of measurement, there are inherent challenges in measuring usage of our products across large online and mobile populations around the world.
For example, there may be individuals who maintain one or more Facebook accounts in violation of our terms of service. We estimate, for example, that "duplicate" accounts (an account that a user maintains in addition to his or her principal account) may have represented between approximately 4.3% and 7.9%less than 5% of our worldwide MAUs in 2013.2014. We also seek to identify "false" accounts, which we divide into two categories: (1) user-misclassified accounts, where users have created personal profiles for a business, organization, or non-human entity such as a pet (such entities are permitted on Facebook using a Page rather than a personal profile under our terms of service); and (2) undesirable accounts, which represent user profiles that we determine are intended to be used for purposes that violate our terms of service, such as spamming. In 2013,2014, for example, we estimate user-misclassified accounts may have represented between approximately 0.8% and 2.1% of our worldwide MAUs and undesirable accounts may have represented between approximately 0.4% and 1.2%less than 2% of our worldwide MAUs. We believe the percentage of accounts that are duplicate or false is meaningfully lower in developed markets such as the United States or United Kingdom and higher in developing markets such as India and Turkey. However, these estimates are based on an internal review of a limited sample of accounts and we apply significant judgment in making this determination, such as identifying names that appear to be fake or other behavior that appears inauthentic to the reviewers. As such, our estimation of duplicate or false accounts may not accurately represent the actual number of such accounts. We are continually seeking to improve our ability to identify duplicate or false accounts and estimate the total number of such accounts, and such estimates may change due to improvements or changes in our methodology. Due to inherent variability in such estimates at particular dates of measurement, we disclose these estimates as a range over a recent period.
Our data limitations may affect our understanding of certain details of our business. For example, while user-provided data indicates a decline in usage among younger users, this age data is unreliable because a disproportionate number of our younger users register with an inaccurate age. Accordingly, our understanding of usage by age group may not be complete.
Some of our metrics have also been affected by applications on certain mobile devices that automatically contact our servers for regular updates with no user action involved, and this activity can cause our system to count the user associated with such a device as an active user on the day such contact occurs. For example, we estimate that less than 5% of our estimated worldwide DAUs as of December 31, 2011 resulted from this type of automatic mobile activity, and that this type of activity had a substantially smaller effect on our estimate of worldwide MAUs and mobile MAUs. The impact of this automatic activity on our metrics varies by geography because mobile usage varies in different regions of the world. In addition, our data regarding the geographic location of our users is estimated based on a number of factors, such as the user's IP address and self-disclosed location. These factors may not always accurately reflect the user's actual location. For example, a mobile-only user may appear to be accessing Facebook from the location of the proxy server that the user connects to rather than from the user's actual location. The methodologies used to measure user metrics may also be susceptible to algorithm or other technical errors. For example, in early June 2012, we discovered an error in the algorithm we used to estimate the geographic location of our users that affected our attribution of certain user locations for the period ended March 31, 2012. While this issue did not affect our overall worldwide DAU and MAU numbers, it did affect our attribution of users across different geographic regions. We estimate that the number of MAUs as of March 31, 2012 for the United States & Canada region was overstated as a result of the error by approximately 3% and this overstatement was offset by understatements in other regions. The number of such users for the period ended March 31, 2012 disclosed in "Management's Discussion and Analysis of Financial Condition and Results of Operations — Trends in Our User Metrics" reflects the reclassification to more correctly attribute users by geographic region. Our estimates for revenue by user location and revenue by user device are also affected by these factors.
We regularly review our processes for calculating these metrics, and from time to time we may discover inaccuracies in our metrics or make adjustments to improve their accuracy, including adjustments that may result in the recalculation of our historical metrics. We believe that any such inaccuracies or adjustments are immaterial unless otherwise stated. In addition, our DAU and MAU estimates will differ from estimates published by third parties due to differences in methodology. For example, some third parties are not able to accurately measure mobile users or do not count mobile users for certain user groups or at all in their analyses.
The numbers of DAUs, mobile DAUs, MAUs, mobile MAUs, mobile-only DAUs and mobile-only MAUs discussed in this Quarterly Report on Form 10-Q, as well as ARPU, do not include users of Instagram or WhatsApp unless they would otherwise qualify as such users, respectively, based on their other activities on Facebook. In addition, other user engagement metrics included herein do not include Instagram or WhatsApp unless otherwise specifically stated.
PART I—FINANCIAL INFORMATION
| |
| Item 1. | Financial Statements |
FACEBOOK, INC.
CONDENSED CONSOLIDATED BALANCE SHEETS
(In millions, except for number of shares and par value)
(Unaudited)
| | | | September 30,
2014 | | December 31,
2013 | March 31,
2015 | | December 31,
2014 |
| Assets | | | | | | |
| Current assets: | | | | | | |
| Cash and cash equivalents | $ | 8,999 |
| | $ | 3,323 |
| $ | 3,419 |
| | $ | 4,315 |
|
| Marketable securities | 5,251 |
| | 8,126 |
| 8,994 |
| | 6,884 |
|
| Accounts receivable, net of allowances for doubtful accounts of $35 and $38 as of September 30, 2014 and December 31, 2013, respectively | 1,363 |
| | 1,109 |
| |
| Accounts receivable, net of allowances for doubtful accounts of $42 and $39 as of March 31, 2015 and December 31, 2014, respectively | | 1,508 |
| | 1,678 |
|
| Prepaid expenses and other current assets | 502 |
| | 512 |
| 1,083 |
| | 793 |
|
| Total current assets | 16,115 |
| | 13,070 |
| 15,004 |
| | 13,670 |
|
| Property and equipment, net | 3,703 |
| | 2,882 |
| 4,619 |
| | 3,967 |
|
| Intangible assets, net | 1,317 |
| | 883 |
| 3,774 |
| | 3,929 |
|
| Goodwill | 2,612 |
| | 839 |
| 18,005 |
| | 17,981 |
|
| Other assets | 441 |
| | 221 |
| 605 |
| | 637 |
|
| Total assets | $ | 24,188 |
| | $ | 17,895 |
| $ | 42,007 |
| | $ | 40,184 |
|
| Liabilities and stockholders' equity | | | | | | |
| Current liabilities: | | | | | | |
| Accounts payable | $ | 120 |
| | $ | 87 |
| $ | 129 |
| | $ | 176 |
|
| Partners payable | 208 |
| | 181 |
| 189 |
| | 202 |
|
| Accrued expenses and other current liabilities | 709 |
| | 555 |
| 1,300 |
| | 866 |
|
| Deferred revenue and deposits | 48 |
| | 38 |
| 55 |
| | 66 |
|
| Current portion of capital lease obligations | 149 |
| | 239 |
| 73 |
| | 114 |
|
| Total current liabilities | 1,234 |
| | 1,100 |
| 1,746 |
| | 1,424 |
|
| Capital lease obligations, less current portion | 129 |
| | 237 |
| 113 |
| | 119 |
|
| Other liabilities | 1,587 |
| | 1,088 |
| 2,647 |
| | 2,545 |
|
| Total liabilities | 2,950 |
| | 2,425 |
| 4,506 |
| | 4,088 |
|
| Stockholders' equity: | | | | | | |
| Common stock, $0.000006 par value; 5,000 million Class A shares authorized, 2,044 million and 1,970 million shares issued and outstanding, including 4 million and 6 million outstanding shares subject to repurchase, as of September 30, 2014 and December 31, 2013, respectively; 4,141 million Class B shares authorized, 564 million and 577 million shares issued and outstanding, including 8 million and 6 million outstanding shares subject to repurchase, as of September 30, 2014 and December 31, 2013, respectively | — |
| | — |
| |
| Common stock, $0.000006 par value; 5,000 million Class A shares authorized, 2,247 million and 2,234 million shares issued and outstanding, including 12 million and 13 million outstanding shares subject to repurchase, as of March 31, 2015 and December 31, 2014, respectively; 4,141 million Class B shares authorized, 559 million and 563 million shares issued and outstanding, including 5 million and 6 million outstanding shares subject to repurchase, as of March 31, 2015 and December 31, 2014, respectively | | — |
| | — |
|
| Additional paid-in capital | 15,949 |
| | 12,297 |
| 31,337 |
| | 30,225 |
|
| Accumulated other comprehensive (loss) income | (109 | ) | | 14 |
| |
| Accumulated other comprehensive loss | | (447 | ) | | (228 | ) |
| Retained earnings | 5,398 |
| | 3,159 |
| 6,611 |
| | 6,099 |
|
| Total stockholders' equity | 21,238 |
| | 15,470 |
| 37,501 |
| | 36,096 |
|
| Total liabilities and stockholders' equity | $ | 24,188 |
| | $ | 17,895 |
| $ | 42,007 |
| | $ | 40,184 |
|
FACEBOOK, INC.
CONDENSED CONSOLIDATED STATEMENTS OF INCOME
(In millions, except per share amounts)
| | | | Three Months Ended September 30, | | Nine Months Ended September 30, | Three Months Ended March 31, |
| | 2014 | | 2013 | | 2014 | | 2013 | 2015 | | 2014 |
| Revenue | $ | 3,203 |
| | $ | 2,016 |
| | $ | 8,615 |
| | $ | 5,286 |
| $ | 3,543 |
| | $ | 2,502 |
|
| Costs and expenses: | | | | | | | | | | |
| Cost of revenue | 565 |
| | 507 |
| | 1,501 |
| | 1,384 |
| 654 |
| | 462 |
|
| Research and development | 608 |
| | 369 |
| | 1,555 |
| | 1,006 |
| 1,062 |
| | 455 |
|
| Marketing and sales | 374 |
| | 233 |
| | 1,055 |
| | 704 |
| 620 |
| | 323 |
|
| General and administrative | 259 |
| | 171 |
| | 643 |
| | 520 |
| 274 |
| | 187 |
|
| Total costs and expenses | 1,806 |
| | 1,280 |
| | 4,754 |
| | 3,614 |
| 2,610 |
| | 1,427 |
|
| Income from operations | 1,397 |
| | 736 |
| | 3,861 |
| | 1,672 |
| 933 |
| | 1,075 |
|
| Interest and other income/(expense), net | (61 | ) | | (10 | ) | | (65 | ) | | (48 | ) | (1 | ) | | — |
|
| Income before provision for income taxes | 1,336 |
| | 726 |
| | 3,796 |
| | 1,624 |
| 932 |
| | 1,075 |
|
| Provision for income taxes | 530 |
| | 301 |
| | 1,557 |
| | 647 |
| 420 |
| | 433 |
|
| Net income | $ | 806 |
| | $ | 425 |
| | $ | 2,239 |
| | $ | 977 |
| $ | 512 |
| | $ | 642 |
|
| Less: Net income attributable to participating securities | 4 |
| | 3 |
| | 10 |
| | 6 |
| 3 |
| | 3 |
|
| Net income attributable to Class A and Class B common stockholders | $ | 802 |
| | $ | 422 |
| | $ | 2,229 |
| | $ | 971 |
| $ | 509 |
| | $ | 639 |
|
| Earnings per share attributable to Class A and Class B common stockholders: | | | | | | | | | | |
| Basic | $ | 0.31 |
| | $ | 0.17 |
| | $ | 0.87 |
| | $ | 0.40 |
| $ | 0.18 |
| | $ | 0.25 |
|
| Diluted | $ | 0.30 |
| | $ | 0.17 |
| | $ | 0.86 |
| | $ | 0.39 |
| $ | 0.18 |
| | $ | 0.25 |
|
| Weighted average shares used to compute earnings per share attributable to Class A and Class B common stockholders: | | | | | | | | | | |
| Basic | 2,587 |
| | 2,430 |
| | 2,565 |
| | 2,408 |
| 2,784 |
| | 2,545 |
|
| Diluted | 2,644 |
| | 2,528 |
| | 2,616 |
| | 2,504 |
| 2,836 |
| | 2,609 |
|
| Share-based compensation expense included in costs and expenses: | | | | | | | | | | |
| Cost of revenue | $ | 16 |
| | $ | 12 |
| | $ | 44 |
| | $ | 31 |
| $ | 17 |
| | $ | 12 |
|
| Research and development | 243 |
| | 164 |
| | 643 |
| | 432 |
| 566 |
| | 181 |
|
| Marketing and sales | 53 |
| | 34 |
| | 146 |
| | 91 |
| 72 |
| | 43 |
|
| General and administrative | 41 |
| | 29 |
| | 108 |
| | 79 |
| 48 |
| | 38 |
|
| Total share-based compensation expense | $ | 353 |
| | $ | 239 |
| | $ | 941 |
| | $ | 633 |
| $ | 703 |
| | $ | 274 |
|
See Accompanying Notes to Condensed Consolidated Financial Statements.
FACEBOOK, INC.
CONDENSED CONSOLIDATED STATEMENTS OF COMPREHENSIVE INCOME
(In millions)
| | | | Three Months Ended September 30, | | Nine Months Ended September 30, | Three Months Ended March 31, |
| | 2014 | | 2013 | | 2014 | | 2013 | 2015 | | 2014 |
| Net income | $ | 806 |
| | $ | 425 |
| | $ | 2,239 |
| | $ | 977 |
| $ | 512 |
| | $ | 642 |
|
| Other comprehensive income (loss): | | | | | | | | | | |
| Change in foreign currency translation adjustment | (102 | ) | | 38 |
| | (123 | ) | | 7 |
| (223 | ) | | (1 | ) |
| Change in unrealized gain/loss on available-for-sale investments, net of tax | (2 | ) | | 4 |
| | — |
| | 1 |
| 4 |
| | 2 |
|
| Change in unrealized gain/loss on derivative, net of tax | — |
| | (1 | ) | | — |
| | 3 |
| |
| Comprehensive income | $ | 702 |
| | $ | 466 |
| | $ | 2,116 |
| | $ | 988 |
| $ | 293 |
| | $ | 643 |
|
See Accompanying Notes to Condensed Consolidated Financial Statements.
FACEBOOK, INC.
CONDENSED CONSOLIDATED STATEMENTS OF CASH FLOWS
(In millions)
(Unaudited)
| | | | Nine Months Ended September 30, | Three Months Ended March 31, |
| | 2014 | | 2013 | 2015 | | 2014 |
| Cash flows from operating activities | | | | | | |
| Net income | $ | 2,239 |
| | $ | 977 |
| $ | 512 |
| | $ | 642 |
|
| Adjustments to reconcile net income to net cash provided by operating activities: | | | | | | |
| Depreciation and amortization | 810 |
| | 737 |
| 457 |
| | 264 |
|
| Lease abandonment | (31 | ) | | 108 |
| |
| Share-based compensation | 941 |
| | 633 |
| 694 |
| | 274 |
|
| Deferred income taxes | (30 | ) | | 21 |
| (223 | ) | | (1 | ) |
| Tax benefit from share-based award activity | 1,354 |
| | 277 |
| 423 |
| | 345 |
|
| Excess tax benefit from share-based award activity | (1,365 | ) | | (285 | ) | (423 | ) | | (348 | ) |
| Other | 5 |
| | 39 |
| 6 |
| | (4 | ) |
| Changes in assets and liabilities: | | | | | | |
| Accounts receivable | (264 | ) | | (145 | ) | 84 |
| | 105 |
|
| Prepaid expenses and other current assets | (45 | ) | | 433 |
| (43 | ) | | (4 | ) |
| Other assets | (158 | ) | | (35 | ) | (32 | ) | | 16 |
|
| Accounts payable | 12 |
| | (17 | ) | (15 | ) | | (10 | ) |
| Partners payable | (22 | ) | | 2 |
| (13 | ) | | 7 |
|
| Accrued expenses and other current liabilities | 198 |
| | (105 | ) | 134 |
| | (27 | ) |
| Deferred revenue and deposits | 3 |
| | 6 |
| (10 | ) | | — |
|
| Other liabilities | 227 |
| | 345 |
| 149 |
| | 26 |
|
| Net cash provided by operating activities | 3,874 |
| | 2,991 |
| 1,700 |
| | 1,285 |
|
| Cash flows from investing activities | | | | | | |
| Purchases of property and equipment | (1,314 | ) | | (879 | ) | (502 | ) | | (363 | ) |
| Purchases of marketable securities | (6,215 | ) | | (4,364 | ) | (3,055 | ) | | (2,974 | ) |
| Sales of marketable securities | 7,391 |
| | 2,433 |
| 608 |
| | 847 |
|
| Maturities of marketable securities | 1,710 |
| | 2,954 |
| 339 |
| | 619 |
|
| Acquisitions of businesses, net of cash acquired, and purchases of intangible assets | (754 | ) | | (237 | ) | (257 | ) | | — |
|
| Change in restricted cash and deposits | (113 | ) | | 4 |
| 23 |
| | — |
|
| Other investing activities, net | (2 | ) | | (1 | ) | — |
| | (1 | ) |
| Net cash provided by (used in) investing activities | 703 |
| | (90 | ) | |
| Net cash used in investing activities | | (2,844 | ) | | (1,872 | ) |
| Cash flows from financing activities | | | | | | |
| Taxes paid related to net share settlement of equity awards | (3 | ) | | (706 | ) | |
| Taxes paid related to net share settlement | | (5 | ) | | (3 | ) |
| Proceeds from exercise of stock options | 7 |
| | 20 |
| — |
| | 1 |
|
| Repayment of long-term debt | — |
| | (1,500 | ) | |
| Principal payments on capital lease obligations | (199 | ) | | (291 | ) | (47 | ) | | (84 | ) |
| Excess tax benefit from share-based award activity | 1,365 |
| | 285 |
| 423 |
| | 348 |
|
| Net cash provided by (used in) financing activities | 1,170 |
| | (2,192 | ) | |
| Net cash provided by financing activities | | 371 |
| | 262 |
|
| Effect of exchange rate changes on cash and cash equivalents | (71 | ) | | 7 |
| (123 | ) | | — |
|
| Net increase in cash and cash equivalents | 5,676 |
| | 716 |
| |
| Net decrease in cash and cash equivalents | | (896 | ) | | (325 | ) |
| Cash and cash equivalents at beginning of period | 3,323 |
| | 2,384 |
| 4,315 |
| | 3,323 |
|
| Cash and cash equivalents at end of period | $ | 8,999 |
| | $ | 3,100 |
| $ | 3,419 |
| | $ | 2,998 |
|
FACEBOOK, INC.
CONDENSED CONSOLIDATED STATEMENTS OF CASH FLOWS
(In millions)
(Unaudited)
| | | | Nine Months Ended September 30, | Three Months Ended March 31, |
| | 2014 | | 2013 | 2015 | | 2014 |
| Supplemental cash flow data | | | | | | |
| Cash paid during the period for: | | | | | | |
| Interest | $ | 11 |
| | $ | 33 |
| $ | 3 |
| | $ | 4 |
|
| Income taxes | $ | 107 |
| | $ | 61 |
| |
| Cash received during the period for: | | | | |
| Income taxes | $ | 6 |
| | $ | 419 |
| |
| Income taxes, net | | $ | 119 |
| | $ | 37 |
|
| Non-cash investing and financing activities: | | | | | | |
| Net change in accounts payable and accrued expenses and other current liabilities related to property and equipment additions | $ | 38 |
| | $ | 31 |
| $ | 186 |
| | $ | (3 | ) |
| Property and equipment acquired under capital leases | $ | — |
| | $ | 11 |
| |
| Fair value of shares issued related to acquisitions of businesses | $ | 1,368 |
| | $ | 77 |
| |
| Promissory note payable issued in connection with an acquisition | | $ | 198 |
| | $ | — |
|
See Accompanying Notes to Condensed Consolidated Financial Statements.
FACEBOOK, INC.
NOTES TO CONDENSED CONSOLIDATED FINANCIAL STATEMENTS
(Unaudited)
| |
| Note 1. | Summary of Significant Accounting Policies |
Basis of Presentation
The accompanying unaudited condensed consolidated financial statements have been prepared in accordance with generally accepted accounting principles in the United States (GAAP) and applicable rules and regulations of the Securities and Exchange Commission regarding interim financial reporting. Certain information and note disclosures normally included in the financial statements prepared in accordance with GAAP have been condensed or omitted pursuant to such rules and regulations. As such, the information included in this quarterly report on Form 10-Q should be read in conjunction with the consolidated financial statements and accompanying notes included in our Annual Report on Form 10-K for the fiscal year ended December 31, 2013.2014.
The condensed consolidated balance sheet as of December 31, 20132014 included herein was derived from the audited financial statements as of that date, but does not include all disclosures including notes required by GAAP.
The condensed consolidated financial statements include the accounts of Facebook, Inc. and its wholly owned subsidiaries. All intercompany balances and transactions have been eliminated.
The accompanying condensed consolidated financial statements reflect all normal recurring adjustments necessary to present fairly the financial position, results of operations, and cash flows for the interim periods, but are not necessarily indicative of the results of operations to be anticipated for the full year ending December 31, 2014.2015.
There have been no changes to our significant accounting policies described in our Annual Report on Form 10-K for the fiscal year ended December 31, 20132014 that have had a material impact on our condensed consolidated financial statements and related notes.
Use of Estimates
Conformity with GAAP requires the use of estimates and judgments that affect the reported amounts in the condensed consolidated financial statements and accompanying notes. These estimates form the basis for judgments we make about the carrying values of our assets and liabilities, which are not readily apparent from other sources. We base our estimates and judgments on historical information and on various other assumptions that we believe are reasonable under the circumstances. GAAP requires us to make estimates and judgments in several areas, including, but not limited to, those related to revenue recognition, collectability of accounts receivable, contingent liabilities, fair value of financial instruments, fair value of acquired intangible assets and goodwill, useful lives of intangible assets and property and equipment, and income taxes. These estimates are based on management's knowledge about current events and expectations about actions we may undertake in the future. Actual results could differ materially from those estimates.
Recent Accounting Pronouncements
In May 2014, the Financial Accounting Standards Board issued guidance related to revenue from contracts with customers. Under this guidance, revenue is recognized when promised goods or services are transferred to customers in an amount that reflects the consideration that is expected to be received for those goods or services. The updated standard will replace most existing revenue recognition guidance under GAAP when it becomes effective and permits the use of either the retrospective or cumulative effect transition method. Early adoption is not permitted. The updated standard will be effective for us in the first quarter of 2017. We have not yet selected a transition method and we are currently evaluating the effect that the updated standard will have on our consolidated financial statements and related disclosures.
In July 2014,the three months ended March 31, 2015, we completed our acquisitionseveral business acquisitions for total consideration of Oculus VR, Inc. (Oculus), a privately-held company developing virtual reality technology that is expected to expand our platform. Pursuant to$433 million, the merger agreement, we issued 23 million sharessubstantial majority of our Class B common stock and paid $400 million in cash. Furthermore, up to an additional three million shares of our Class B common stock and $60 million in cash will be payable contingent upon the completion of certain milestones. We determined the acquisition-date fair value of the contingent consideration liability, based on the likelihood of payment related to the contingent earn-out clauses, as part of the consideration transferred. For contingent consideration to be settled in common stock, we use the fair value of the shares as of the acquisition date, which is remeasured on each reporting date until settlement. See Note 5 “Fair Value Measurements" for subsequent measurements of this contingent liability. The earn-out portion that would be payablerelated to employee equityholders is subject to continuous employment through the applicable payment dates and as such has been excluded from
purchase consideration transferred and accounted for as share-based compensation and other compensation expense.
We have accounted for this acquisition as a business combination. This method requires, among other things, that assets acquired and liabilities assumed in a business combination be recognized at their fair values as of the acquisition dateinvolving land and that in-process research and development (IPR&D) be recorded at fair value on the balance sheet regardless of the likelihood of success of the related product or technology.
The following table summarizes the components of the purchase consideration transferred based on the closing price ofbuildings adjacent to our common stock as of the acquisition date (in millions):
|
| | | |
| Cash | $ | 400 |
|
| Common stock | 1,601 |
|
| Less: post-acquisition share-based compensation and other compensation expense | (297 | ) |
| Less: cash acquired on acquisition date | (20 | ) |
| Total purchase consideration, excluding contingent consideration | $ | 1,684 |
|
| Contingent consideration | 169 |
|
| Purchase consideration | $ | 1,853 |
|
Of the $297headquarters in Menlo Park. Included in this amount is a $198 million of share-based compensationpromissory note payable issued in connection with this particular acquisition. This promissory note payable is classified under accrued expenses and other compensation expense excluded from the purchase consideration above, approximately $13 million was recognized as share-based compensation at closing as a result of the vesting provisions of employee replacement awards on the acquisition date. The remaining $284 million is subject to continuous employment and will be recognized as share-based compensation and other compensation expense over the required service period of four years.
The fair value of assets acquired andcurrent liabilities assumed from our acquisition of Oculus was based on a preliminary valuation and our estimates and assumptions are subject to change within the measurement period. The primary areas of the purchase price that are not yet finalized are related to income taxes and residual goodwill. Measurement period adjustments that we determine to be material will be applied retrospectively to the period of acquisition in our condensed consolidated financial statements and, depending on the nature of the adjustments, other periods subsequent to the period of acquisition could also be affected.
In the nine months ended September 30, 2014, we also completed other business acquisitions for total cash consideration of $456 million.balance sheets. These acquisitions were not material to our condensed consolidated financial statements, either individually or in the aggregate. We have included the financial results of Oculus and the otherthese business acquisitions, which are not material, in our condensed consolidated financial statements from their respective dates of acquisition. Pro forma historical results of operations related to our acquisitions of Oculus and the otherthese business acquisitions during the ninethree months ended September 30, 2014March 31, 2015 have not been presented because they are not material to our condensed consolidated statements of income, either individually or in the aggregate.
The following table summarizes the allocation of the fair values of thenet assets acquired and liabilities assumed,during the three months ended March 31, 2015, including those items that are still preliminary, and the related useful lives, where applicable:
|
| | | | | | | | | | | |
| | Oculus | | Other |
| | (in millions) | | Useful lives (in years) | | (in millions) | | Useful lives (in years) |
| Finite-lived intangible assets: | | | | | | | |
| Acquired technology | $ | 235 |
| | 5 | | $ | 62 |
| | 3 - 5 |
| Tradename and other | 132 |
| | 2 - 7 | | 87 |
| | 3 - 5 |
| IPR&D intangible assets | 60 |
| | | | — |
| | |
| Net assets acquired | — |
| | | | 104 |
| | |
| Deferred tax liabilities | (107 | ) | | | | (41 | ) | | |
| Net assets acquired | $ | 320 |
| | | | $ | 212 |
| | |
| Goodwill | 1,533 |
| | | | 244 |
| | |
| Total fair value | $ | 1,853 |
| | | | $ | 456 |
| | |
IPR&D intangible assets represent the value assigned to acquired research and development projects that, as of the acquisition date had not established technological feasibility and had no alternative future use. The IPR&D intangible assets are capitalized and accounted for as indefinite-lived intangible assets and will be subject to impairment testing until completion or abandonment
of the projects. Upon successful completion of each project and launch of the product, we will make a separate determination of useful life of the IPR&D intangible assets and the related amortization will be recorded as an expense over the estimated useful life of the specific projects. |
| | | | | |
| | (in millions) | | Useful lives (in years) |
| Finite-lived intangible assets: | | | |
| Acquired technology | $ | 14 |
| | 3 |
| Other | 5 |
| | 3 |
| Land acquired | 379 |
| | |
| Other net tangible assets acquired | 11 |
| | |
| Deferred tax liabilities | (2 | ) | | |
| Net assets acquired | $ | 407 |
| | |
| Goodwill | 26 |
| | |
| Total fair value consideration | $ | 433 |
| | |
Goodwill generated from all business acquisitions completed during the ninethree months ended September 30, 2014March 31, 2015 is primarily attributable to expected synergies from future growth fromand potential monetization opportunities and, also for Oculus, as a potential to expand our platform. All goodwillopportunities. Goodwill generated during this period is not deductible for tax purposes.
| |
| Note 3. | Earnings per Share |
We compute earnings per share (EPS) of Class A and Class B common stock using the two-class method required for participating securities. We consider restricted stock awards to be participating securities because holders of such shares have non-forfeitable dividend rights in the event of our declaration of a dividend for common shares.
Undistributed earnings allocated to participating securities are subtracted from net income in determining net income attributable to common stockholders. Basic EPS is computed by dividing net income attributable to common stockholders by the weighted-average number of shares of our Class A and Class B common stock outstanding, adjusted for outstanding shares that are subject to repurchase.
For the calculation of diluted EPS, net income attributable to common stockholders for basic EPS is adjusted by the effect of dilutive securities, including awards under our equity compensation plans.plans and inducement awards under a separate non-plan RSU award agreement. In addition, the computation of the diluted EPS of Class A common stock assumes the conversion of our Class B common stock to Class A common stock, while the diluted EPS of Class B common stock does not assume the conversion of those shares to Class A common stock. Diluted EPS attributable to common stockholders is computed by dividing the resulting net income attributable to common stockholders by the weighted-average number of fully diluted common shares outstanding.
Basic and dilutive securities in our basic and diluted EPS calculation for the three and nine months ended September 30, 2014March 31, 2015 do not include contingent earn-out shares resulting from our acquisition of Oculus.shares. Issuance of these earn-out shares is dependent upon the completion of certain milestones. These milestones were not met as of September 30, 2014March 31, 2015 and accordingly, these shares are excluded from the effect of basic and dilutive securities.
We have also excluded 15 millionThere were no restricted stock units (RSUs) excluded from the EPS calculation for the ninethree months ended September 30, 2013March 31, 2015. There were 3 million RSUs excluded from the calculation for the three months ended March 31, 2014 because the impact would be anti-dilutive. Shares excluded from the calculation were not material for the three and nine months ended September 30, 2014 and the three months ended September 30, 2013.
Basic and diluted EPS are the same for each class of common stock because they are entitled to the same liquidation and dividend rights.
The numerators and denominators of the basic and diluted EPS computations for our common stock wereare calculated as follows (in millions, except per share amounts):
| | | | Three Months Ended September 30, | | Nine Months Ended September 30, | Three Months Ended March 31, |
| | 2014 | | 2013 | | 2014 | | 2013 | 2015 | | 2014 |
| | Class A | | Class B | | Class A | | Class B | | Class A | | Class B | | Class A | | Class B | Class A | | Class B | | Class A | | Class B |
| Basic EPS: | | | | | | | | | | | | | | | | | | | | | | |
| Numerator | | | | | | | | | | | | | | | | | | | | | | |
| Net income | $ | 632 |
| | $ | 174 |
| | $ | 320 |
| | $ | 105 |
| | $ | 1,747 |
| | $ | 492 |
| | $ | 717 |
| | $ | 260 |
| $ | 410 |
| | $ | 102 |
| | $ | 498 |
| | $ | 144 |
|
| Less: Net income attributable to participating securities | 3 |
| | 1 |
| | 2 |
| | 1 |
| | 8 |
| | 2 |
| | 4 |
| | 2 |
| 2 |
| | 1 |
| | 2 |
| | 1 |
|
| Net income attributable to common stockholders | $ | 629 |
| | $ | 173 |
| | $ | 318 |
| | $ | 104 |
| | $ | 1,739 |
| | $ | 490 |
| | $ | 713 |
| | $ | 258 |
| $ | 408 |
| | $ | 101 |
| | $ | 496 |
| | $ | 143 |
|
| Denominator | | | | | | | | | | | | | | | | | | | | | | |
| Weighted average shares outstanding | 2,032 |
| | 567 |
| | 1,833 |
| | 611 |
| | 2,006 |
| | 570 |
| | 1,773 |
| | 649 |
| 2,241 |
| | 561 |
| | 1,982 |
| | 574 |
|
| Less: Shares subject to repurchase | 4 |
| | 8 |
| | 6 |
| | 8 |
| | 5 |
| | 6 |
| | 5 |
| | 9 |
| 12 |
| | 6 |
| | 5 |
| | 6 |
|
| Number of shares used for basic EPS computation | 2,028 |
| | 559 |
| | 1,827 |
| | 603 |
| | 2,001 |
| | 564 |
| | 1,768 |
| | 640 |
| 2,229 |
| | 555 |
| | 1,977 |
| | 568 |
|
| Basic EPS | $ | 0.31 |
| | $ | 0.31 |
| | $ | 0.17 |
| | $ | 0.17 |
| | $ | 0.87 |
| | $ | 0.87 |
| | $ | 0.40 |
| | $ | 0.40 |
| $ | 0.18 |
| | $ | 0.18 |
| | $ | 0.25 |
| | $ | 0.25 |
|
| Diluted EPS: | | | | | | | | | | | | | | | | | | | | | | |
| Numerator | | | | | | | | | | | | | | | | | | | | | | |
| Net income attributable to common stockholders | $ | 629 |
| | $ | 173 |
| | $ | 318 |
| | $ | 104 |
| | $ | 1,739 |
| | $ | 490 |
| | $ | 713 |
| | $ | 258 |
| $ | 408 |
| | $ | 101 |
| | $ | 496 |
| | $ | 143 |
|
| Reallocation of net income attributable to participating securities | 4 |
| | — |
| | 3 |
| | — |
| | 10 |
| | — |
| | 6 |
| | — |
| 3 |
| | — |
| | 3 |
| | — |
|
| Reallocation of net income as a result of conversion of Class B to Class A common stock | 173 |
| | — |
| | 104 |
| | — |
| | 490 |
| | — |
| | 258 |
| | — |
| 101 |
| | — |
| | 143 |
| | — |
|
| Reallocation of net income to Class B common stock | — |
| | 7 |
| | — |
| | 13 |
| | — |
| | 18 |
| | — |
| | 29 |
| — |
| | 3 |
| | — |
| | 7 |
|
| Net income attributable to common stockholders for diluted EPS | $ | 806 |
| | $ | 180 |
| | $ | 425 |
| | $ | 117 |
| | $ | 2,239 |
| | $ | 508 |
| | $ | 977 |
| | $ | 287 |
| $ | 512 |
| | $ | 104 |
| | $ | 642 |
| | $ | 150 |
|
| Denominator | | | | | | | | | | | | | | | | | | | | | | |
| Number of shares used for basic EPS computation | 2,028 |
| | 559 |
| | 1,827 |
| | 603 |
| | 2,001 |
| | 564 |
| | 1,768 |
| | 640 |
| 2,229 |
| | 555 |
| | 1,977 |
| | 568 |
|
| Conversion of Class B to Class A common stock | 559 |
| | — |
| | 603 |
| | — |
| | 564 |
| | — |
| | 640 |
| | — |
| 555 |
| | — |
| | 568 |
| | — |
|
| Weighted average effect of dilutive securities: | | | | | | | | | | | | | | | | | | | | | | |
| Employee stock options | 13 |
| | 13 |
| | 59 |
| | 59 |
| | 13 |
| | 13 |
| | 69 |
| | 69 |
| 9 |
| | 9 |
| | 15 |
| | 15 |
|
| RSUs | 36 |
| | 14 |
| | 33 |
| | 33 |
| | 32 |
| | 13 |
| | 21 |
| | 21 |
| 37 |
| | 11 |
| | 41 |
| | 20 |
|
| Shares subject to repurchase | 8 |
| | 5 |
| | 6 |
| | 6 |
| | 6 |
| | 3 |
| | 6 |
| | 6 |
| 6 |
| | 3 |
| | 8 |
| | 5 |
|
| Number of shares used for diluted EPS computation | 2,644 |
| | 591 |
| | 2,528 |
| | 701 |
| | 2,616 |
| | 593 |
| | 2,504 |
| | 736 |
| 2,836 |
| | 578 |
| | 2,609 |
| | 608 |
|
| Diluted EPS | $ | 0.30 |
| | $ | 0.30 |
| | $ | 0.17 |
| | $ | 0.17 |
| | $ | 0.86 |
| | $ | 0.86 |
| | $ | 0.39 |
| | $ | 0.39 |
| $ | 0.18 |
| | $ | 0.18 |
| | $ | 0.25 |
| | $ | 0.25 |
|
| |
| Note 4. | Cash and Cash Equivalents, and Marketable Securities |
The following table sets forth the cash and cash equivalents, and marketable securities (in millions):
| | | | September 30, 2014 | | December 31, 2013 | March 31, 2015 | | December 31, 2014 |
| Cash and cash equivalents: | | | | | | |
| Cash | $ | 1,344 |
| | $ | 1,044 |
| $ | 2,644 |
| | $ | 2,162 |
|
| Cash equivalents: |
| |
| |
| Money market funds | 7,655 |
| | 2,279 |
| 775 |
| | 2,153 |
|
| Total cash and cash equivalents | 8,999 |
| | 3,323 |
| 3,419 |
| | 4,315 |
|
| Marketable securities: | | | | | | |
| U.S. government securities | 2,062 |
| | 5,687 |
| 3,670 |
| | 2,830 |
|
| U.S. government agency securities | 2,330 |
| | 2,439 |
| 3,575 |
| | 2,710 |
|
| Corporate debt securities | 859 |
| | — |
| 1,749 |
| | 1,344 |
|
| Total marketable securities | 5,251 |
| | 8,126 |
| 8,994 |
| | 6,884 |
|
| Total cash, cash equivalents and marketable securities | $ | 14,250 |
| | $ | 11,449 |
| |
| Total cash and cash equivalents, and marketable securities | | $ | 12,413 |
| | $ | 11,199 |
|
The gross unrealized gains or losses on our marketable securities as of September 30, 2014March 31, 2015 and December 31, 20132014 were not significant. In addition, there were no securities in a continuous loss position for 12 months or longer as of September 30, 2014March 31, 2015 and December 31, 20132014.
The following table classifies our marketable securities by contractual maturities (in millions):
| | | | September 30, 2014 | March 31, 2015 |
| Due in one year | $ | 2,747 |
| $ | 4,631 |
|
| Due in one to two years | 2,504 |
| 4,363 |
|
| Total | $ | 5,251 |
| $ | 8,994 |
|
| |
| Note 5. | Fair Value MeasurementsMeasurement |
Assets andThe following table summarizes, for assets or liabilities measured at fair value, on a recurring basis are summarized belowthe respective fair value and the classification by level of input within the fair value hierarchy (in millions):
| | | | | | Fair Value Measurement at Reporting Date Using | | | Fair Value Measurement at Reporting Date Using |
| Description | September 30, 2014 | | Quoted Prices in Active Markets for Identical Assets (Level 1) | | Significant Other Observable Inputs (Level 2) | | Significant Unobservable Inputs (Level 3) | March 31, 2015 | | Quoted Prices in Active Markets for Identical Assets (Level 1) | | Significant Other Observable Inputs (Level 2) | | Significant Unobservable Inputs (Level 3) |
| Cash equivalents: | | | | | | | | | | | | | | |
| Money market funds | $ | 7,655 |
| | $ | 7,655 |
| | $ | — |
| | $ | — |
| $ | 775 |
| | $ | 775 |
| | $ | — |
| | $ | — |
|
| Marketable securities: | | | | | | | | | | | | | | |
| U.S. government securities | 2,062 |
| | 2,062 |
| | — |
| | — |
| 3,670 |
| | 3,670 |
| | — |
| | — |
|
| U.S. government agency securities | 2,330 |
| | 2,330 |
| | — |
| | — |
| 3,575 |
| | 3,575 |
| | — |
| | — |
|
| Corporate debt securities | 859 |
| | — |
| | 859 |
| | — |
| 1,749 |
| | — |
| | 1,749 |
| | — |
|
| Total cash equivalents and marketable securities | $ | 12,906 |
| | $ | 12,047 |
| | $ | 859 |
| | $ | — |
| $ | 9,769 |
| | $ | 8,020 |
| | $ | 1,749 |
| | $ | — |
|
| | | | | | | | | | | | | | | |
| Other liabilities: | | | | | | | | | | | | | | |
| Contingent consideration liability | $ | 192 |
| | $ | — |
| | $ | — |
| | $ | 192 |
| $ | 203 |
| | $ | — |
| | $ | — |
| | $ | 203 |
|
| | | | | | Fair Value Measurement at Reporting Date Using | | | Fair Value Measurement at Reporting Date Using |
| Description | December 31, 2013 | | Quoted Prices in Active Markets for Identical Assets (Level 1) | | Significant Other Observable Inputs (Level 2) | | Significant Unobservable Inputs (Level 3) | December 31, 2014 | | Quoted Prices in Active Markets for Identical Assets (Level 1) | | Significant Other Observable Inputs (Level 2) | | Significant Unobservable Inputs (Level 3) |
| Cash equivalents: | | | | | | | | | | | | | | |
| Money market funds | $ | 2,279 |
| | $ | 2,279 |
| | $ | — |
| | $ | — |
| $ | 2,153 |
| | $ | 2,153 |
| | $ | — |
| | $ | — |
|
| Marketable securities: | | | | | | | | | | | | | | |
| U.S. government securities | 5,687 |
| | 5,687 |
| | — |
| | — |
| 2,830 |
| | 2,830 |
| | — |
| | — |
|
| U.S. government agency securities | 2,439 |
| | 2,439 |
| | — |
| | — |
| 2,710 |
| | 2,710 |
| | — |
| | — |
|
| Corporate debt securities | | 1,344 |
| | — |
| | 1,344 |
| | — |
|
| Total cash equivalents and marketable securities | $ | 10,405 |
| | $ | 10,405 |
| | $ | — |
| | $ | — |
| $ | 9,037 |
| | $ | 7,693 |
| | $ | 1,344 |
| | $ | — |
|
| | | | | | | | | |
| Other liabilities: | | | | | | | | |
| Contingent consideration liability | | $ | 191 |
| | $ | — |
| | $ | — |
| | $ | 191 |
|
We classify our cash equivalents and marketable securities within Level 1 or Level 2 because we use quoted market prices or alternative pricing sources and models utilizing market observable inputs to determine their fair value.
We classify our contingent consideration liability in connection with ouran acquisition of Oculusin 2014 within Level 3 as factors used to develop the estimated fair value are unobservable inputs that are not supported by market activity. We estimate the fair value of our contingent consideration liability based on the present value of probability-weighted future cash flows related to the contingent earn-out criteria and the fair value of our common stock on each reporting date. Our fair value estimate of this liability was $169 million at the date of acquisition and changesChanges in the fair value of the contingent consideration liability subsequent to the acquisition date, such as changes in the probability assessment and the fair value of our common stock, are recognized in earnings in the period when the change in the estimated fair value occurs. During the three and nine months ended September 30, 2014,March 31, 2015, we recognized a $23$12 million changeincrease in the fair value of our contingent consideration liability in research and development expense in our condensed consolidated statements of income primarily due to the changean increase in the fair value of our common stock.
| |
| Note 6. | Property and Equipment |
Property and equipment consistedconsists of the following (in millions):
| | | | September 30,
2014 | | December 31,
2013 | March 31,
2015 | | December 31,
2014 |
| Land | $ | 153 |
| | $ | 45 |
| $ | 562 |
| | $ | 153 |
|
| Buildings | 1,347 |
| | 1,071 |
| 1,792 |
| | 1,420 |
|
| Leasehold improvements | 279 |
| | 203 |
| 330 |
| | 304 |
|
| Network equipment | 2,704 |
| | 2,351 |
| 3,118 |
| | 3,020 |
|
| Computer software, office equipment and other | 134 |
| | 95 |
| 183 |
| | 149 |
|
| Construction in progress | 702 |
| | 377 |
| 589 |
| | 738 |
|
| Total | 5,319 |
| | 4,142 |
| 6,574 |
| | 5,784 |
|
| Less: Accumulated depreciation | (1,616 | ) | | (1,260 | ) | (1,955 | ) | | (1,817 | ) |
| Property and equipment, net | $ | 3,703 |
| | $ | 2,882 |
| $ | 4,619 |
| | $ | 3,967 |
|
Construction in progress includes costs primarily related to the expansion of our corporate headquarters in Menlo Park, California, construction of data centers and network equipment infrastructure to support our data centers around the world. No interest was capitalized during the three months ended September 30, 2014 and 2013, and the nine months ended September 30, 2014March 31, 2015. Interest capitalized during the nine months ended September 30, 2013 was not material. and 2014.
| |
| Note 7. | Goodwill and Intangible Assets |
The changechanges in the carrying amount of goodwill for the ninethree months ended September 30, 2014March 31, 2015 isare as follows (in millions):
| | | Balance as of December 31, 2013 | $ | 839 |
| |
| Balance as of December 31, 2014 | | $ | 17,981 |
|
| Goodwill acquired | 1,777 |
| 26 |
|
| Effect of currency translation adjustment | (4 | ) | (2 | ) |
| Balance as of September 30, 2014 | $ | 2,612 |
| |
| Balance as of March 31, 2015 | | $ | 18,005 |
|
Intangible assets consistedconsist of the following (in millions):
| | | | | | September 30, 2014 | | December 31, 2013 | |
| | Useful lives from date of acquisitions (in years) | | Gross Carrying Amount | | Accumulated Amortization | | Net Carrying Amount | | Gross Carrying Amount | | Accumulated Amortization | | Net Carrying Amount | | | | | | | | | | | | | | |
| | | | | | | | | | | | | | | | March 31, 2015 | | December 31, 2014 |
| | | | | | | | | | | | | | Useful lives from date of acquisitions (in years) | | Gross Carrying Amount | | Accumulated Amortization | | Net Carrying Amount | | Gross Carrying Amount | | Accumulated Amortization | | Net Carrying Amount |
| Finite-lived intangible assets: | | | | | | | | | | | | | | | | | | | | | | | | |
| Acquired users | | 3 - 7 | | $ | 2,056 |
| | $ | (159 | ) | | $ | 1,897 |
| | $ | 2,056 |
| | $ | (85 | ) | | $ | 1,971 |
|
| Acquired technology | | 2 - 10 | | 827 |
| | (187 | ) | | 640 |
| | 813 |
| | (144 | ) | | 669 |
|
| Acquired patents | 2 - 18 | | $ | 773 |
| | $ | (215 | ) | | $ | 558 |
| | $ | 773 |
| | $ | (142 | ) | | $ | 631 |
| 2 - 18 | | 778 |
| | (262 | ) | | 516 |
| | 773 |
| | (239 | ) | | 534 |
|
| Acquired technology | 2 - 10 | | 518 |
| | (104 | ) | | 414 |
| | 227 |
| | (65 | ) | | 162 |
| |
| Tradename and other | 2 - 10 | | 357 |
| | (72 | ) | | 285 |
| | 138 |
| | (48 | ) | | 90 |
| |
| Total finite-lived intangible assets: | | $ | 1,648 |
| | $ | (391 | ) | | $ | 1,257 |
| | $ | 1,138 |
| | $ | (255 | ) | | $ | 883 |
| |
| Trade names | | 2 - 7 | | 632 |
| | (75 | ) | | 557 |
| | 632 |
| | (46 | ) | | 586 |
|
| Other | | 2 - 10 | | 169 |
| | (65 | ) | | 104 |
| | 164 |
| | (55 | ) | | 109 |
|
| Total finite-lived intangible assets | | | $ | 4,462 |
| | $ | (748 | ) | | $ | 3,714 |
| | $ | 4,438 |
| | $ | (569 | ) | | $ | 3,869 |
|
| | | | | | | | | | | | | | | | | | | | | | | | | |
| Indefinite-lived intangible assets: | | | | | | | | | | | | | | | | | | | | | | | | |
| IPR&D | | $ | 60 |
| | $ | — |
| | $ | 60 |
| | $ | — |
| | $ | — |
| | $ | — |
| |
| In-process research and development (IPR&D) | | | $ | 60 |
| | $ | — |
| | $ | 60 |
| | $ | 60 |
| | $ | — |
| | $ | 60 |
|
| | | | | | | | | | | | | | | | | | | | | | | | | |
| Total intangible assets | | $ | 1,708 |
| | $ | (391 | ) | | $ | 1,317 |
| | $ | 1,138 |
| | $ | (255 | ) | | $ | 883 |
| | $ | 4,522 |
| | $ | (748 | ) | | $ | 3,774 |
| | $ | 4,498 |
| | $ | (569 | ) | | $ | 3,929 |
|
As of March 31, 2015, technological feasibility has not been established for our IPR&D intangible assets. They have no alternative future use and, as such, continue to be accounted for as indefinite-lived intangible assets.
Amortization expense of intangible assets was $59$179 million and $141$41 million for the three and nine months ended September 30,March 31, 2015 and 2014,, respectively, and $37 million and $106 million for the three and nine months ended September 30, 2013, respectively.
As of September 30, 2014, estimatedMarch 31, 2015, expected amortization expense for the unamortized acquired intangible assets for the next five years and thereafter is as follows (in millions):
| | | The remainder of 2014 | $ | 66 |
| |
| 2015 | 260 |
| |
| The remainder of 2015 | | $ | 537 |
|
| 2016 | 244 |
| 698 |
|
| 2017 | 209 |
| 655 |
|
| 2018 | 163 |
| 601 |
|
| 2019 | | 519 |
|
| Thereafter | 315 |
| 704 |
|
| | $ | 1,257 |
| |
| Total | | $ | 3,714 |
|
In August 2013, we entered into a five-year senior unsecured revolving credit facility (2013 Revolving Credit Facility) that allows us to borrow up to $6.5 billion to fund working capital and general corporate purposes with interest payable on the borrowed amounts set at LIBOR plus 1.0%, as well as an annual commitment fee of 0.10% on the daily undrawn balance of the facility. We paid origination fees at closing of the 2013 Revolving Credit Facility, which fees are being amortized over the term of the facility. Any amounts outstanding under this facility will be due and payable on August 15, 2018. As of September 30, 2014March 31, 2015, no amounts had been drawn down and we were in compliance with the covenants under this facility.
| |
| Note 9. | Commitments and Contingencies |
Commitments
Leases
We entered into various capital lease arrangements to obtain property and equipment for our operations. Additionally, on occasion we have purchased property and equipment for which we have subsequently obtained capital financing under sale-leaseback transactions. These agreements are typically for three years,, except for a building lease which is for 15 years,, with interest rates ranging from 1% to 13%. The leases are secured by the underlying leased buildings, leasehold improvements, and equipment. We have also entered into various non-cancelable operating lease agreements for certain of our offices, equipment, land and data centers with original lease periods expiring between 20142015 and 2029.2030. We are committed to pay a portion of the related actual operating expenses under certain of these lease agreements. Certain of these arrangements have free rent periods or escalating rent payment provisions, and we recognize rent expense under such arrangements on a straight-line basis.
Operating lease expense was $31$39 million and $94$29 million for the three and nine months ended September 30,March 31, 2015 and 2014,, respectively, and $28 million and $101 million for the three and nine months ended September 30, 2013, respectively.
Other Agreement
In April 2014, we entered into a non-cancelable contractual commitment to spend a minimum of $140 million on network services over a period of 10 years.
Contingencies
Legal Matters
Beginning on May 22, 2012, multiple putative class actions, derivative actions, and individual actions were filed in state and federal courts in the United States and in other jurisdictions against us, our directors, and/or certain of our officers alleging violation of securities laws or breach of fiduciary duties in connection with our initial public offering (IPO) and seeking unspecified damages. We believe these lawsuits are without merit, and we intend to continue to vigorously defend them. The vast majority of the cases in the United States, along with multiple cases filed against The NASDAQ OMX Group, Inc. and The Nasdaq Stock Market LLC (collectively referred to herein as NASDAQ) alleging technical and other trading-related errors by NASDAQ in connection with our IPO, were ordered centralized for coordinated or consolidated pre-trial proceedings in the U.S. District Court for the Southern District of New York. In a series of rulings in 2013 and 2014, the court denied our motion to dismiss the consolidated securities class action and granted our motions to dismiss the derivative actions against our directors and certain of our officers. The plaintiffs in four of these derivative actions have filed notices of appeal. The appeals have been fully briefed. On December 23, 2014, the plaintiffs in the consolidated securities class action filed their motion for class certification. On April 10, 2015, we filed our opposition to class certification. In addition, the events surrounding our IPO became the subject of various state and federal government inquiries. In May 2014, the Securities and Exchange Commission (SEC) notified us that it had terminated its inquiry and that no enforcement action had been recommended by the SEC.
We are also party to various legal proceedings and claims that arise in the ordinary course of business. With respect to our outstanding legal matters, we believe that the amount or estimable range of reasonably possible loss will not, either individually or in the aggregate, have a material adverse effect on our business, consolidated financial position, results of operations, or cash
flows. However, the outcome of litigation is inherently uncertain. Therefore, if one or more of these legal matters were resolved against us for amounts in excess of management's expectations, our results of operations and financial condition, including in a particular reporting period, could be materially adversely affected.
| |
| Note 10. | Stockholders' Equity |
Share-based Compensation Plans
We maintain two share-based employee compensation plans: the 2012 Equity Incentive Plan (2012 Plan) and the 2005 Stock Plan (collectively, Stock Plans). Our 2012 Plan serves as the successor to our 2005 Stock Plan and provides for the issuance of incentive and nonstatutory stock options, restricted stock awards, stock appreciation rights, RSUs, performance shares and stock bonuses to qualified employees, directors and consultants. Outstanding awards under the 2005 Stock Plan continue to be subject to the terms and conditions of the 2005 Stock Plan. The maximum term for stock options granted under the 2012 Plan may not exceed ten years from the date of grant. Our 2012 Plan will terminate ten years from the date of approval unless it is terminated earlier by our compensation committee.
We have initially reserved 25,000,000 shares of our Class A common stock for issuance under our 2012 Plan. The number of shares reserved for issuance under our 2012 Plan which amount increasesincrease automatically on the first day of January of each yearof 2013 through 2022 based onby a formulanumber of shares of Class A common stock equal to the lesser of (i) 2.5% of the total outstanding shares of our common stock as of the immediately preceding December 31st or as(ii) a number of shares determined by the board of directors. Our board of directors elected not to increase the number of shares reserved for issuance in 2014.2015. In addition, shares available for grant under the 2005 Stock Plan, which were reserved but not issued, forfeited or repurchased at their original issue price, or subject to outstanding awards under the 2005 Stock Plan as of the effective date of our IPO, were added to the reserves of the 2012 Plan and shares that were withheld in connection with the net settlement of RSUs were also added to the reserves ofPlan. The maximum term for stock options granted under the 2012 Plan. In January 2014, we began requiring that employees sell a portionPlan may not exceed ten years from the date of grant. Our 2012 Plan will terminate ten years from the shares that they receive upon the vestingdate of RSUs in order to cover any required withholding taxes, rather thanapproval unless it is terminated earlier by our previous approach of net share settlement.compensation committee.
In February 2014, we terminated our 2005 Officers' Plan as the only outstanding option issued under this plan had been exercised in full.
The following table summarizes the activities of stock option activityawards under the Stock Plans duringfor the ninethree months ended September 30, 2014March 31, 2015:
|
| | | | | | | | | | | | |
| | Shares Subject to Options Outstanding |
| | Number of Shares | | Weighted Average Exercise Price | | Weighted- Average Remaining Contractual Term | | Aggregate Intrinsic Value(1) |
| | (in thousands) | | | | (in years) | | (in millions) |
| Balance as of December 31, 2013 | 22,102 |
| | $ | 3.56 |
| | | | |
| Stock options exercised | (5,015 | ) | | 0.91 |
| | | | |
| Balance as of September 30, 2014 | 17,087 |
| | $ | 4.34 |
| | 3.22 | | $ | 1,276 |
|
| Stock options vested and expected to vest as of September 30, 2014 | 17,071 |
| | $ | 4.33 |
| | 3.22 | | $ | 1,275 |
|
| Stock options exercisable as of September 30, 2014 | 13,719 |
| | $ | 2.48 |
| | 2.56 | | $ | 1,050 |
|
|
| | | | | | | | | | | | |
| | Shares Subject to Options Outstanding |
| | Number of Shares | | Weighted Average Exercise Price | | Weighted- Average Remaining Contractual Term | | Aggregate Intrinsic Value(1) |
| | (in thousands) | | | | (in years) | | (in millions) |
| Balance as of December 31, 2014 | 12,984 |
| | $ | 4.78 |
| | | | |
| Stock options exercised | (829 | ) | | 0.49 |
| | | | |
| Balance as of March 31, 2015 | 12,155 |
| | $ | 5.08 |
| | 3.64 | | $ | 938 |
|
| Stock options vested and expected to vest as of March 31, 2015 | 12,152 |
| | $ | 5.08 |
| | 3.64 | | $ | 937 |
|
| Stock options exercisable as of March 31, 2015 | 9,257 |
| | $ | 2.88 |
| | 3.09 | | $ | 734 |
|
| |
| (1) | The aggregate intrinsic value is calculated as the difference between the exercise price of the underlying stock option awards and the closing price of our Class A common stock of $79.0482.22 on September 30, 2014March 31, 2015. |
The aggregate intrinsic value of options exercised was $117 million and $321 million for the three and nine months ended September 30, 2014, respectively, and $586 million and $1.17 billion for the three and nine months ended September 30, 2013, respectively.
The following table summarizes the activities for our unvested RSUs for the ninethree months ended September 30, 2014:March 31, 2015:
| | | | Unvested RSUs | Unvested RSUs(1) |
| | Number of Shares | | Weighted Average Grant Date Fair Value | Number of Shares | | Weighted Average Grant Date Fair Value |
| | (in thousands) | | | (in thousands) | | |
| Unvested at December 31, 2013 | 103,971 |
| | $ | 27.30 |
| |
| Unvested at December 31, 2014 | | 138,055 |
| | $ | 55.89 |
|
| Granted | 33,844 |
| | 70.04 |
| 22,334 |
| | 77.82 |
|
| Vested | (33,450 | ) | | 24.77 |
| (10,745 | ) | | 42.63 |
|
| Forfeited | (7,948 | ) | | 33.87 |
| (1,425 | ) | | 46.14 |
|
| Unvested at September 30, 2014 | 96,417 |
| | $ | 42.64 |
| |
| Unvested at March 31, 2015 | | 148,219 |
| | $ | 60.25 |
|
| |
| (1) | Unvested shares include inducement awards issued in connection with an acquisition in 2014 and are subject to the terms, restrictions, and conditions of a separate non-plan RSU award agreement. |
The fair value as of the respective vesting dates of RSUs that vested during the three and nine months ended September 30,March 31, 2015 and 2014 was $652$814 million and $2.19 billion, respectively, and $326$952 million, and $1.15 billion, respectively, during the three and nine months ended September 30, 2013.respectively.
As of September 30, 2014,March 31, 2015, there was $4.17$8.93 billion of unrecognized share-based compensation expense, of which $3.71$8.06 billion is related to RSUs and $464$875 million is related to restricted shares, shares with performance conditions related to our contingent consideration liability, and stock options. This unrecognized compensation expense is expected to be recognized over a weighted-average period of approximately three years.years.
Our tax provision for interim periods is determined using an estimate of our annual effective tax rate, adjusted for discrete items arising in that quarter. In each quarter we update our estimate of the annual effective tax rate, and if our estimated annual tax rate changes, we make a cumulative adjustment in that quarter. Our quarterly tax provision, and our quarterly estimate of our annual effective tax rate, are subject to significant volatility due to several factors, including our ability to accurately predict our income (loss) before provision for income taxes in multiple jurisdictions, including the portions of our share-based compensation that will not generate tax benefits, and the effects of acquisitions and the integration of those acquisitions. In addition, our effective tax rate can be more or less volatile based on the amount of income before provision for income taxes.
Our effective tax rate has exceeded the U.S. statutory rate primarily because of the effect of non-deductible share-based compensation and the impact of acquiring intellectual property and integrating it into our business. Our effective tax rate in the future will depend on the portion of our profits earned within and outside the United States, which will also be affected by our methodologies for valuing our intellectual property and intercompany transactions.
We are subject to taxation in the United States and various other state and foreign jurisdictions. The material jurisdictions in which we are subject to potential examination include the United States and Ireland. We are under examination by the Internal Revenue Service (IRS) for our 2008 2009 andthrough 2010 tax years. We believe that adequate amounts have been reserved for any adjustments that may ultimately result from these examinations and we do not anticipate a significant impact to our gross unrecognized tax benefits within the next 12 months related to these years. Our 2011 and subsequentthrough 2015 tax years remain subject to potential examination by the IRS and all tax years starting in 2008 remain subject to potential examination in Ireland. We remain subject to possible examinations or are undergoing audits in various other jurisdictions that are not anticipated to be material to our financial statements.
Our gross unrecognized tax benefits were $1.51$1.83 billion and $1.32$1.68 billion as of September 30, 2014March 31, 2015 and December 31, 2013,2014, respectively. If the gross unrecognized tax benefits as of September 30, 2014March 31, 2015 were realized in a future period, this would result in a tax benefit of $1.03$1.29 billion within our provision of income taxes at such time. Our existing tax positions will continue to generate an increase in unrecognized tax benefits in future periods.
Although the timing of the resolution, settlement, and closure of any auditaudits is highly uncertain, it is reasonably possible that the balance of gross unrecognized tax benefits could significantly change in the next 12 months. However, given the number of years remaining that are subject to examination, we are unable to estimate the full range of possible adjustments to the balance of gross unrecognized tax benefits.
| |
| Note 12. | Geographical Information |
Revenue by geography is based on the billing address of the marketeradvertiser or developer. The following tables set forth revenue and property and equipment, net by geographic area (in millions):
| | | | Three Months Ended September 30, | | Nine Months Ended September 30, | Three Months Ended March 31, |
| | 2014 | | 2013 | | 2014 | | 2013 | 2015 | | 2014 |
| Revenue: | | | | | | | | | | |
| United States | $ | 1,468 |
| | $ | 940 |
| | $ | 3,857 |
| | $ | 2,438 |
| $ | 1,652 |
| | $ | 1,129 |
|
Rest of the world (1) | 1,735 |
| | 1,076 |
| | 4,758 |
| | 2,848 |
| 1,891 |
| | 1,373 |
|
| Total revenue | $ | 3,203 |
| | $ | 2,016 |
| | $ | 8,615 |
| | $ | 5,286 |
| $ | 3,543 |
| | $ | 2,502 |
|
| |
| (1) | No individual country, other than disclosed above, exceeded 10% of our total revenue for any period presented. |
| | | | September 30,
2014 | | December 31,
2013 | March 31,
2015 | | December 31,
2014 |
| Property and equipment, net: | | | | | | |
| United States | $ | 3,023 |
| | $ | 2,368 |
| $ | 3,900 |
| | $ | 3,256 |
|
| Sweden | 513 |
| | 415 |
| 509 |
| | 514 |
|
| Rest of the world | 167 |
| | 99 |
| 210 |
| | 197 |
|
| Total property and equipment, net | $ | 3,703 |
| | $ | 2,882 |
| $ | 4,619 |
| | $ | 3,967 |
|
| |
Note 13. | Subsequent Events |
On October 6, 2014, we completed our acquisition of WhatsApp Inc. (WhatsApp), a privately-held cross-platform mobile messaging company that is expected to provide us with strategic advantages in the mobile ecosystem and expand our mobile messaging offerings. Pursuant to the merger agreement, we issued approximately 178 million shares of our Class A common stock and paid $4.59 billion in cash. We will also grant 46 million RSUs to WhatsApp employees.
Upon acquisition, WhatsApp became a wholly-owned subsidiary of Facebook. The acquisition will be accounted for as a business combination. The following table summarizes the components of the preliminary purchase consideration transferred based on the closing price of $77.56 per share of our Class A common stock on the acquisition close date (in millions):
|
| | | | |
| Cash | $ | 4,589 |
|
| Common stock | 13,787 |
|
| Less: post-acquisition share-based compensation and other compensation expense | (1,067 | ) |
| Less: cash and promissory notes acquired on acquisition date | (116 | ) |
| Purchase consideration | $ | 17,193 |
|
Of the $1.07 billion of share-based compensation and other compensation expense excluded from the purchase consideration above, approximately $188 million will be accounted for as share-based compensation expense at closing as a result of the vesting provisions of WhatsApp employee awards on the acquisition date. The remaining $879 million (approximately 8.5 million shares of Class A common stock and $219 million in cash) is subject to continuous employment and will be recognized as share-based compensation and other compensation expense over the required service period of up to three years.
The following table summarizes the preliminary allocation of the assets acquired and liabilities assumed based on their fair values as of the acquisition date and related estimated useful lives of the finite-lived intangible assets acquired (in millions, except estimated useful life):
|
| | | | |
| | | Estimated useful life (in years) |
| Finite-lived intangible assets: | | |
| Acquired users | $ | 2,026 |
| 7 years |
| Tradename | 448 |
| 5 years |
| Acquired technology | 288 |
| 5 years |
| Other | 21 |
| 2 years |
| Net liabilities assumed | (33 | ) | |
| Deferred tax liabilities | (916 | ) | |
| Net assets acquired | $ | 1,834 |
| |
| Goodwill | 15,359 |
| |
| | $ | 17,193 |
| |
The $15.36 billion of goodwill is primarily attributable to expected synergies from future growth, from potential monetization opportunities, from strategic advantages provided in the mobile ecosystem and from expansion of our mobile messaging offerings. Goodwill is not expected to be deductible for tax purposes.
The following unaudited pro forma information presents the combined results of operations as if the acquisition had been completed on January 1, 2013, the beginning of the comparable prior annual reporting period. The unaudited pro forma results include: (i) amortization associated with preliminary estimates for the acquired intangible assets; (ii) recognition of the post-acquisition share-based compensation and other compensation expense; (iii) share-based compensation expense related to the 46 million RSUs we will grant to WhatsApp employees; and (iv) the associated tax impact on these unaudited pro forma adjustments.
The unaudited pro forma results do not reflect any cost saving synergies from operating efficiencies or the effect of the incremental costs incurred in integrating the two companies. Accordingly, these unaudited pro forma results are presented for informational purpose only and are not necessarily indicative of what the actual results of operations of the combined company would have been if the acquisition had occurred at the beginning of the period presented, nor are they indicative of future results of operations (in millions):
|
| | | | | | | | | | | | | | | |
| | Three Months Ended September 30, | | Nine Months Ended September 30, |
| | 2014 | | 2013 | | 2014 | | 2013 |
| Revenue | $ | 3,210 |
| | $ | 2,019 |
| | $ | 8,637 |
| | $ | 5,292 |
|
| Net income (loss) | $ | 526 |
| | $ | 136 |
| | $ | 1,289 |
| | $ | (106 | ) |
The unaudited pro forma combined net loss for the nine months ended September 30, 2013 includes a non-recurring pro forma adjustment of $188 million of share-based compensation expense recognized at closing as a result of the vesting provisions of WhatsApp employee awards on the acquisition date.
| |
| Item 2. | Management's Discussion and Analysis of Financial Condition and Results of Operations |
You should read the following discussion of our financial condition and results of operations in conjunction with the condensed consolidated financial statements and the related notes thereto included elsewhere in this Quarterly Report on Form 10-Q and with our audited consolidated financial statements included in our Annual Report on Form 10-K for the year ended December 31, 2013,2014, as filed with the Securities and Exchange Commission. In addition to historical condensed consolidated financial information, the following discussion contains forward-looking statements that reflect our plans, estimates, and beliefs. Our actual results could differ materially from those discussed in the forward-looking statements. Factors that could cause or contribute to these differences include those discussed below and elsewhere in this Quarterly Report on Form 10-Q, particularly in Part II, Item 1A. "Risk Factors." For a discussion of limitations in the measurement of certain of our user metrics, see the section entitled "Limitations of Key Metrics and Other Data" in this Quarterly Report on Form 10-Q.
Certain revenue information in the section entitled "—Three Months Ended March 31, 2015 and 2014—Revenue—Foreign Exchange Impact on Revenue" is presented on a constant currency basis. This information is a non-GAAP financial measure. To calculate revenue on a constant currency basis, we translated revenue for the three months ended March 31, 2015 using the prior year's monthly exchange rates for our settlement currencies other than the U.S. dollar. This non-GAAP financial measure is not intended to be considered in isolation or as a substitute for, or superior to, financial information prepared and presented in accordance with GAAP. This measure may be different from non-GAAP financial measures used by other companies, limiting its usefulness for comparison purposes. Moreover, presentation of revenue on a constant currency basis is provided for year-over-year comparison purposes, and investors should be cautioned that the effect of changing foreign currency exchange rates has an actual effect on our operating results. We believe this non-GAAP financial measure provides investors with useful supplemental information about the financial performance of our business, enable comparison of financial results between periods where certain items may vary independent of business performance, and allow for greater transparency with respect to key metrics used by management in operating our business.
Overview
Our mission is to give people the power to share and make the world more open and connected.
We build products that support our mission byOur business focuses on creating utilityvalue for people, marketers, and developers:
People.We enable people to stay connected with their friendsconnect and family,share through mobile devices and personal computers, to discover what is going on in the world around them, and to share and express what matters to them to audiences ranging from their closest friends to the people they care about.public at large.
Marketers. We enable marketers to engage with more than 1.3 billionour monthly active users (MAUs) on Facebook or subsets of our usersMAUs based on information they have chosen to share with us such as theira variety of factors including age, gender, location, gender, orand interests.
Developers. We enable developers to use Facebook's developer services to build, grow and monetize their mobile and web applications more rapidly and successfully.
We generate substantially all of our revenue from advertising and from fees associated with our Payments infrastructure that enables userspeople who use Facebook to purchase virtual and digital goods from developers. DuringIn the three and nine months ended September 30, 2014,first quarter of 2015, we recorded revenue of $3.20$3.54 billion, and $8.62 billion, respectively, income from operations of $1.40 billion and $3.86 billion, respectively,$933 million, and net income of $806 million and $2.24 billion, respectively.$512 million.
Trends in Our User Metrics
The numbers for our key metrics, our daily active users (DAUs), mobile DAUs, MAUs, mobile MAUs, and average revenue per user (ARPU), and certain other metrics such as mobile-only DAUs and mobile-only MAUs, do not include Instagram or WhatsApp users unless they would otherwise qualify as such users, respectively, based on their other activities on Facebook. In addition, other user engagement metrics do not include Instagram or WhatsApp unless otherwise specifically stated.
Trends in the number of users affect our revenue and financial results by influencing the number of ads we are able to show, the value of our ads to marketers, the volume of Payments transactions, as well as our expenses and capital expenditures.
Daily Active Users (DAUs). We define a daily active user as a registered Facebook user who logged in and visited Facebook through our website or a mobile device, used our Messenger app, or took an action to share content or activity with his or her Facebook friends or connections via a third-party website or application that is integrated with Facebook, on a given day. We view DAUs, and DAUs as a percentage of MAUs, as measures of user engagement.
Note: For purposes of reporting DAUs, MAUs, and ARPU by geographic region, Europe includes all users in Russia and Turkey Asia includes all users in Australia and New Zealand, and Rest of World includes all users in Africa, Latin America, and the Middle East.
Worldwide DAUs increased 19%17% to 864936 million on average during SeptemberMarch 20142015 from 728802 million during SeptemberMarch 20132014. We experienced growth in DAUs across major markets including India, Brazil, and the United States.States, and Brazil. Overall growth in DAUs was driven by increased mobile usage of Facebook, and the number of DAUs accessing Facebook on personal computers decreased in SeptemberMarch 20142015 compared to the same period in 2013.2014. We believe that use of Facebook through personal computers will continue to decline worldwide, including in key markets such as the United States and other developed markets in Europe and Asia.all regions.
Mobile DAUs. We define a mobile DAU as a user who accessed Facebook via a mobile application or via mobile versions of our website such as m.facebook.com, whether on a mobile phone or tablet, or used our Messenger app on a given day.
Worldwide mobile DAUs increased 39%31% to 703798 million on average during September 2014March 2015 from 507609 million during September 2013.March 2014. In all regions, an increasing number of our DAUs are accessingaccessed Facebook through mobile devices on average during March 2015 as compared to the same period during 2014, with users in Brazil, India, and the United States representing key sources of mobile DAU growth on average during September 2014 as compared to the same period during 2013.March 2015. On average during the month ended September 30, 2014,March 2015, there were 536636 million DAUs who accessed Facebook solely through mobile applications or our mobile website, increasing 54%45% from 347439 million mobile-only DAUs during the same period in 2013.2014. The remaining mobile DAUs accessed Facebook from both mobile devices and personal computers and mobile devices.computers. We anticipate that growth in mobile users will continue to be the driver of our user growth for the foreseeable future.

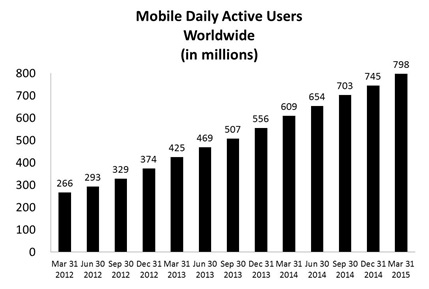
Monthly Active Users (MAUs). We define a monthly active user as a registered Facebook user who logged in and visited Facebook through our website or a mobile device, used our Messenger app, or took an action to share content or activity with his or her Facebook friends or connections via a third-party website or application that is integrated with Facebook, in the last 30 days as of the date of measurement. MAUs are a measure of the size of our global active user community.
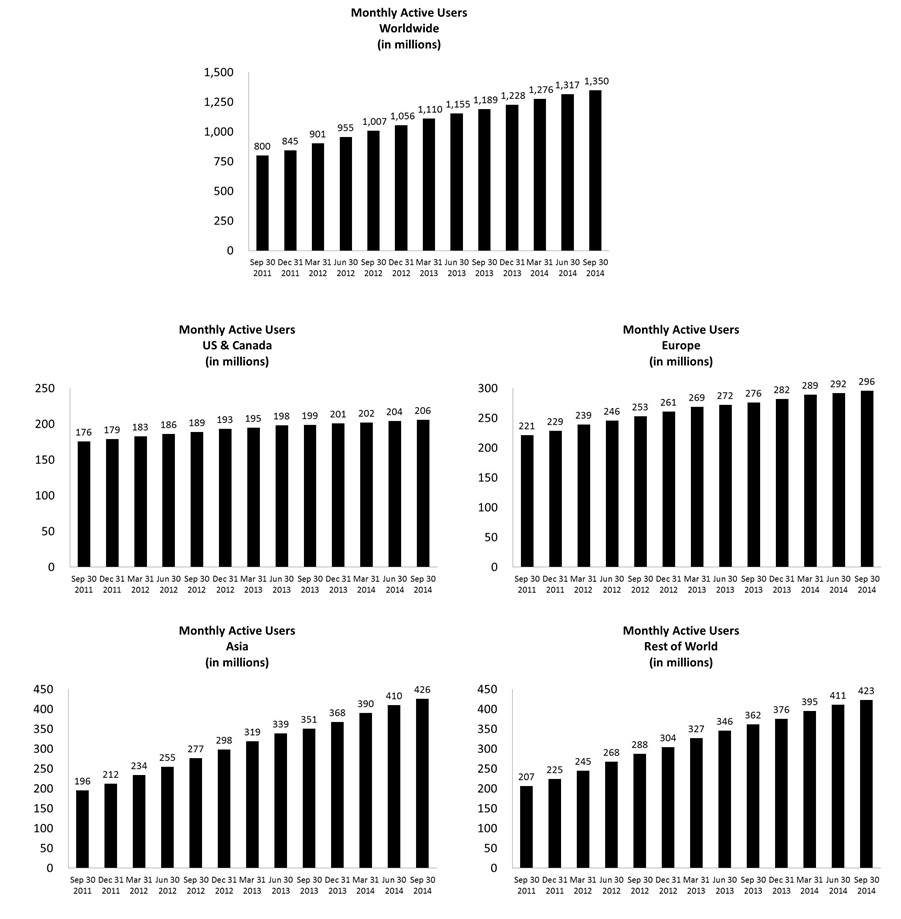

As of September 30, 2014March 31, 2015, we had 1.351.44 billion MAUs, an increase of 14%13% from September 30, 2013March 31, 2014. Users in India, Brazil, and BrazilThailand represented key sources of growth in the thirdfirst quarter of 20142015 relative to the same period in 2013.2014. Overall growth in MAUs was driven by increased mobile usage of Facebook, and the number of MAUs accessing Facebook on personal computers decreased in September2014March 2015 compared to the same period in 2013.2014. We believe that use of Facebook through personal computers will continue to decline worldwide, including in key markets such as the United States and other developed markets in Europe and Asia.all regions.
Mobile MAUs. We define a mobile MAU as a user who accessed Facebook via a mobile application or via mobile versions of our website such as m.facebook.com, whether on a mobile phone or tablet, or used our Messenger app during the period of measurement.
Worldwide mobile MAUs increased 29%24% to 1.121.25 billion as of September 30, 2014March 31, 2015 from 874 million1.01 billion as of September 30, 2013March 31, 2014. In all regions, an increasing number of our MAUs are accessingaccessed Facebook through mobile devices in the first quarter of 2015 as compared to the same period in 2014, with users in India, Brazil, and the United States representing key sources of mobile MAU growth overin the thirdfirst quarter of 20142015 as compared to the same period in 2013.. There were 456581 million mobile MAUs who accessed Facebook solely through mobile applications or our mobile website during the month endedas of September 30, 2014March 31, 2015, increasing 80%70% from 254341 million during, compared to the same period in 2013.2014. The remaining 668667 million mobile MAUs accessed Facebook from both mobile devices and personal computers and mobile devices during SeptemberMarch 20142015. We anticipate that growth in mobile users will continue to be the driver of our user growth for the foreseeable future.
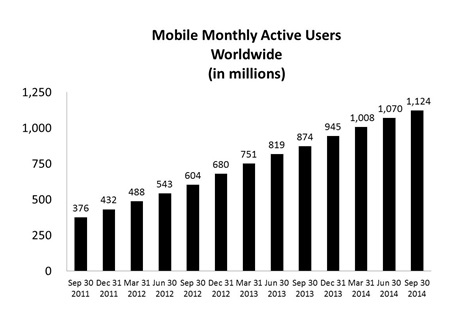

Trends in Our Monetization by User Geography
We calculate our revenue by user geography based on our estimate of the geography in which ad impressions are delivered or virtual and digital goods are purchased. We define ARPU as our total revenue in a given geography during a given quarter, divided by the average of the number of MAUs in the geography at the beginning and end of the quarter. The geography of our users affects our revenue and financial results because we currently monetize users in different geographies at different average rates. Our revenue and ARPU in regions such as United States & Canada and Europe are relatively higher due to the size and maturity of those advertising markets as well as our greater sales presence and the number of payment methods that we make available to marketers and users. For example, ARPU for an average user in the thirdfirst quarter of 20142015 in United States & Canada was more than sixseven times higher than for an average user in Asia. Asia-Pacific.
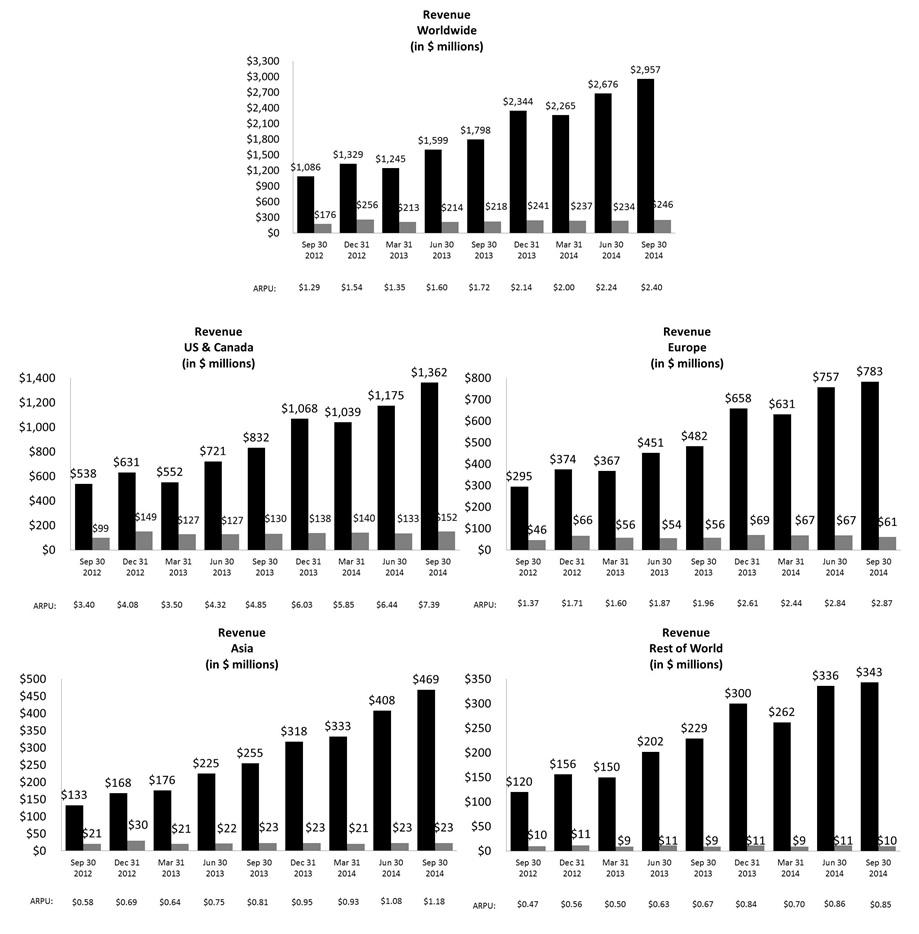


Note: Our revenue by user geography in the charts above is geographically apportioned based on our estimation of the geographic location of our users when they perform a revenue-generating activity. This allocation differs from our revenue by geography disclosure in our condensed consolidated financial statements where revenue is geographically apportioned based on the location of the marketer or developer.
During the thirdfirst quarter of 2014,2015, worldwide ARPU was $2.40,$2.50, an increase of 40%25% from the thirdfirst quarter of 2013.2014. Over this period, ARPU increased by approximately 52%42% in United States & Canada, 46%27% in Asia-Pacific, 23% in Europe, and Asia, and 27%14% in Rest of World. ARPU in the first quarter of 2015 declined 11% from the fourth quarter of 2014. We believe the sequential quarterly decline was driven by seasonal trends, which also affected ARPU trends from the fourth quarter of 2013 to the first quarter of 2014, during which period ARPU declined by 7%. User growth was more rapid in geographies with relatively lower ARPU, such as AsiaAsia-Pacific and Rest of World. We expect that user growth in the future will be primarily concentrated in those regions where ARPU is relatively lower, such as AsiaAsia-Pacific and Rest of World, such that worldwide ARPU may continue to increase at a slower rate relative to ARPU in any geographic region, or potentially decrease even if ARPU increases in each geographic region.
Components of Results of Operations
Revenue
We generate substantially all of our revenue from advertising and from fees associated with our Payments infrastructure that enables userspeople to purchase virtual and digital goods from our developers with applications on the Facebook website.developers.
Advertising. Our advertising revenue is generated by displaying ad products on Facebook properties, including our mobile applications, and third-party affiliated websites or mobile applications. Marketers pay for ad products either directly or through their relationships with advertising agencies, based on the number of clicks made by our users,people, the number of actions taken by our users,people, or the number of impressions delivered. We recognize revenue from the delivery of click-based ads in the period in which a userperson clicks on the content, and action-based ads in the period in which a userperson takes the action the marketer contracted for. We recognize revenue from the display of impression-based ads in the contracted period in which the impressions are delivered. Impressions are considered delivered when an ad is displayed to users.people. The number of ads we show is subject to methodological changes as we continue to evolve our ads business and the structure of our ads products. We calculate price per ad as total ad revenue divided by the number of ads delivered, representing the effective price paid per impression by a marketer regardless of their desired objective such as impression, click, or action.
Payments and other fees. We enable Payments from our userspeople to purchase virtual and digital goods from our developers with applications on the Facebook website. Our usersdevelopers. People can transact and make payments on the Facebook website by using debit and credit cards, PayPal, mobile phone payments, gift cards, or other methods. We receive a fee from developers when userspeople make purchases in these applications using our Payments infrastructure. We recognize revenue net of amounts remitted to our developers. We have mandated the use of our Payments infrastructure for game applications on Facebook, and fees related to Payments are generated almost exclusively from games. Our other fees revenue, which has not been significant in recent periods, consists primarily of revenue from our ad serving and measurement products and the delivery of virtual reality platform devices.
Cost of Revenue and Operating Expenses
Cost of revenue. Our cost of revenue consists primarily of expenses associated with the delivery and distribution of our products. These include expenses related to the operation of our data centers such as facility and server equipment depreciation, facility and server equipment rent expense, energy and bandwidth costs, support and maintenance costs, and salaries, benefits, amortization of intangible assets, and share-based compensation for employees on our operations teams. Cost of revenue also includes credit card and other transaction fees related to processing customer transactions, amortization of intangible assets, and cost of virtual reality platform device inventory sold and traffic acquisition costs (TAC). TAC consists of payments made to third-party entities that have integrated our advertising offerings into their websites or mobile applications.sold.
Research and development. Research and development expenses consist primarily of salaries, benefits, and share-based compensation, salaries, and benefits for employees on our engineering and technical teams who are responsible for building new products as well as improving existing products. We expense all of our research and development costs as they are incurred.
Marketing and sales. Our marketing and sales expenses consist primarily of salaries, benefits, and share-based compensation for our employees engaged in sales, sales support, marketing, business development, and customer service functions. Our marketing and sales expenses also include user-people-, marketer-, and developer-facing marketing and promotional expenditures.expenditures, as well as amortization of intangible assets.
General and administrative. Our general and administrative expenses consist primarily of salaries, benefits, and share-based compensation for our executives as well as our legal, finance, human resources, corporate communications and policy, and other administrative employees. In addition, general and administrative expenses include outside consulting fees,professional and legal and accounting services. General and administrative expenses also include legal settlementsdepreciation of property and equipment and amortization of patentsintangible assets we have acquired.
Results of Operations
The following tables set forth our condensed consolidated statements of income data:
| | | | Three Months Ended September 30, | | Nine Months Ended September 30, | Three Months Ended March 31, |
| | 2014 | | 2013 | | 2014 | | 2013 | 2015 | | 2014 |
| | (in millions) | (in millions) |
| Revenue | $ | 3,203 |
| | $ | 2,016 |
| | $ | 8,615 |
| | $ | 5,286 |
| $ | 3,543 |
| | $ | 2,502 |
|
| Costs and expenses: | | | | | | | | | | |
| Cost of revenue | 565 |
| | 507 |
| | 1,501 |
| | 1,384 |
| 654 |
| | 462 |
|
| Research and development | 608 |
| | 369 |
| | 1,555 |
| | 1,006 |
| 1,062 |
| | 455 |
|
| Marketing and sales | 374 |
| | 233 |
| | 1,055 |
| | 704 |
| 620 |
| | 323 |
|
| General and administrative | 259 |
| | 171 |
| | 643 |
| | 520 |
| 274 |
| | 187 |
|
| Total costs and expenses | 1,806 |
| | 1,280 |
| | 4,754 |
| | 3,614 |
| 2,610 |
| | 1,427 |
|
| Income from operations | 1,397 |
| | 736 |
| | 3,861 |
| | 1,672 |
| 933 |
| | 1,075 |
|
| Interest and other income/(expense), net | (61 | ) | | (10 | ) | | (65 | ) | | (48 | ) | (1 | ) | | — |
|
| Income before provision for income taxes | 1,336 |
| | 726 |
| | 3,796 |
| | 1,624 |
| 932 |
| | 1,075 |
|
| Provision for income taxes | 530 |
| | 301 |
| | 1,557 |
| | 647 |
| 420 |
| | 433 |
|
| Net income | $ | 806 |
| | $ | 425 |
| | $ | 2,239 |
| | $ | 977 |
| $ | 512 |
| | $ | 642 |
|
Share-based compensation expense included in costs and expenses:
| | | | Three Months Ended September 30, | | Nine Months Ended September 30, | Three Months Ended March 31, |
| | 2014 | | 2013 | | 2014 | | 2013 | 2015 | | 2014 |
| | (in millions) | (in millions) |
| Cost of revenue | $ | 16 |
| | $ | 12 |
| | $ | 44 |
| | $ | 31 |
| $ | 17 |
| | $ | 12 |
|
| Research and development | 243 |
| | 164 |
| | 643 |
| | 432 |
| 566 |
| | 181 |
|
| Marketing and sales | 53 |
| | 34 |
| | 146 |
| | 91 |
| 72 |
| | 43 |
|
| General and administrative | 41 |
| | 29 |
| | 108 |
| | 79 |
| 48 |
| | 38 |
|
| Total share-based compensation expense | $ | 353 |
| | $ | 239 |
| | $ | 941 |
| | $ | 633 |
| $ | 703 |
| | $ | 274 |
|
The following tabletables set forth our condensed consolidated statements of income data (as a percentage of revenue):
| | | | Three Months Ended September 30, | | Nine Months Ended September 30, | Three Months Ended March 31, |
| | 2014 | | 2013 | | 2014 | | 2013 | 2015 | | 2014 |
| Revenue | 100 | % | | 100 | % | | 100 | % | | 100 | % | 100 | % | | 100 | % |
| Costs and expenses: | | | | | | | | | | |
| Cost of revenue | 18 |
| | 25 |
| | 17 |
| | 26 |
| 18 |
| | 18 |
|
| Research and development | 19 |
| | 18 |
| | 18 |
| | 19 |
| 30 |
| | 18 |
|
| Marketing and sales | 12 |
| | 12 |
| | 12 |
| | 13 |
| 17 |
| | 13 |
|
| General and administrative | 8 |
| | 8 |
| | 7 |
| | 10 |
| 8 |
| | 7 |
|
| Total costs and expenses | 56 |
| | 63 |
| | 55 |
| | 68 |
| 74 |
| | 57 |
|
| Income from operations | 44 |
| | 37 |
| | 45 |
| | 32 |
| 26 |
| | 43 |
|
| Interest and other income/(expense), net | (2 | ) | | — |
| | (1 | ) | | (1 | ) | — |
| | — |
|
| Income before provision for income taxes | 42 |
| | 36 |
| | 44 |
| | 31 |
| 26 |
| | 43 |
|
| Provision for income taxes | 17 |
| | 15 |
| | 18 |
| | 12 |
| 12 |
| | 17 |
|
| Net income | 25 | % | | 21 | % | | 26 | % | | 18 | % | 14 | % | | 26 | % |
Share-based compensation expense included in costs and expenses (as a percentage of revenue):
| | | | Three Months Ended September 30, | | Nine Months Ended September 30, | Three Months Ended March 31, |
| | 2014 | | 2013 | | 2014 | | 2013 | 2015 | | 2014 |
| Cost of revenue | — | % | | 1 | % | | 1 | % | | 1 | % | — | % | | — | % |
| Research and development | 8 |
| | 8 |
| | 7 |
| | 8 |
| 16 |
| | 7 |
|
| Marketing and sales | 2 |
| | 2 |
| | 2 |
| | 2 |
| 2 |
| | 2 |
|
| General and administrative | 1 |
| | 1 |
| | 1 |
| | 1 |
| 1 |
| | 2 |
|
| Total share-based compensation expense | 11 | % | | 12 | % | | 11 | % | | 12 | % | 20 | % | | 11 | % |
Three and Nine Months Ended September 30,March 31, 20142015 and 20132014
| | | | Three Months Ended September 30, | | | | Nine Months Ended September 30, | | | Three Months Ended March 31, | | |
| | 2014 | | 2013 | | % change | | 2014 | | 2013 | | % change | 2015 | | 2014 | | % change |
| | (in millions, except for percentages) | (in millions, except for percentages) |
| Revenue: | | | | | | | | | | | | |
| Advertising | $ | 2,957 |
| | $ | 1,798 |
| | 64 | % | | $ | 7,898 |
| | $ | 4,641 |
| | 70 | % | $ | 3,317 |
| | $ | 2,265 |
| | 46 | % |
| Payments and other fees | 246 |
| | 218 |
| | 13 | % | | 717 |
| | 645 |
| | 11 | % | 226 |
| | 237 |
| | (5 | )% |
| Total revenue | $ | 3,203 |
| | $ | 2,016 |
| | 59 | % | | $ | 8,615 |
| | $ | 5,286 |
| | 63 | % | $ | 3,543 |
| | $ | 2,502 |
| | 42 | % |
Revenue in the thirdfirst quarter and the first nine months of 20142015 increased $1.19$1.04 billion, or 59%42%, and $3.33 billion, or 63%, respectively, compared to the same periodsperiod in 2013.2014. The increases wereincrease was primarily due to increasesan increase in advertising revenue.
Advertising revenue increased $1.16 billion, or 64%, and $3.26 billion, or 70%, in the third quarter and the first nine months of 2014, respectively, compared to the same periods in 2013. The primarymost important factor driving advertising revenue growth in this period was an increase in revenue from ads in News Feed on both mobile devices and personal computers. For the third quarter and the first nine months of 2014, we estimate that advertising revenue fromdevices. News Feed ads on mobile devices represented approximately 66% and 62%, respectively, of total advertising revenue, as compared with approximately 49% and 41% in the same periods in 2013.
Factors that influenced our advertising revenue growth in these periods included: (i) an increase in the number of News Feed adsare displayed which are more prominent,prominently, have significantly higher levels of engagement, and a higher price per ad relative to our other ad placements; (ii) other product changes to increaseplacements. For the value and performancefirst quarter of 2015, we estimate that mobile advertising revenue represented 73% of total advertising revenue, as compared with 59% in the first quarter of 2014.
Other factors that influenced our ads; (iii)advertising revenue growth in the first quarter of 2015 included (i) an increase in the number
of marketers actively advertising on Facebook, which we believe increased demand for our ads;ad inventory, (ii) certain product changes to increase the value and (iv) 19%performance of our ads, and (iii) an increase in user growth in average DAUs and 14% growth in MAUs from September 30, 2013 to September 30, 2014.engagement.
During the thirdfirst quarter and the first nine months of 2014,2015, as compared to the same periodsperiod in 2013,2014, the average price per ad increased by 274% and 150%, respectively,285% and the number of ads delivered decreased by 56% and 32%, respectively.62%. The increase in average price per ad was driven by a product change related to certain non-News Feed ads during the third quarter of 2014, which decreased the number of ads displayed but increased the prominence of each ad. Average price per ad was also driven by a mix shift towards a greater percentage of our ads being shown
in News Feed. The reduction in ads delivered was driven by factors including the product change described above as well as the shift in usage towards mobile devices where userspeople are shown fewer ads as compared to personal computers.
Payments and other fees revenue in the thirdfirst quarter and the first nine months of 2014 increased $282015 decreased $11 million, or 13%5%, and $72 million, or 11%, respectively, compared to the same periodsperiod in 2013.2014. Payments and other fees revenue is currently based predominantly on Payments revenue from games played on personal computers. We expect Facebook usage on personal computers towill continue to decline in the future, which we expect to result in a decline of our Payments revenue.
Foreign Exchange Impact on Revenue
The general strengthening of the U.S. dollar relative to certain foreign currencies (primarily the Euro) from the first quarter of 2014 to the same period in 2015 had an unfavorable impact on our revenue. If we had translated revenue for the three months ended March 31, 2015 using the prior year's monthly exchange rates for our settlement currencies other than the U.S. dollar, our total revenue and advertising revenue would have been $3.73 billion and $3.51 billion, respectively, both of which are $188 million higher than actual total revenue and advertising revenue for the first quarter of 2015.
Cost of revenue
| | | | Three Months Ended September 30, | | | | Nine Months Ended September 30, | | | Three Months Ended March 31, | | |
| | 2014 | | 2013 | | % change | | 2014 | | 2013 | | % change | 2015 | | 2014 | | % change |
| | (in millions, except for percentages) | (in millions, except for percentages) |
| Cost of revenue | $ | 565 |
| | $ | 507 |
| | 11 | % | | $ | 1,501 |
| | $ | 1,384 |
| | 8 | % | $ | 654 |
| | $ | 462 |
| | 42 | % |
| Percentage of revenue | 18 | % | | 25 | % | | | | 17 | % | | 26 | % | | | 18 | % | | 18 | % | | |
Cost of revenue in the thirdfirst quarter and the first nine months of 20142015 increased $58$192 million, or 11%42%, and $117 million, or 8%, respectively, compared to the same periodsperiod in 2013.2014. The increases in both periods wereincrease was primarily due to a $122 million increase in operational expenses related to our data centers and technical infrastructure, and to a lesser extent, increased amortization of our intangible assets. These increases were partially offset by items related to data center lease abandonment: we reversed $5 million and $34 million of lease abandonment expense in the third quarter and the first nine months of 2014, respectively, due to our decision to re-occupy and utilize a previously exited data center, compared to a recognition of $43 million and $108 million of lease abandonment expense in the same periods of 2013, respectively.
Research and development
| | | | Three Months Ended September 30, | | | | Nine Months Ended September 30, | | | Three Months Ended March 31, | | |
| | 2014 | | 2013 | | % change | | 2014 | | 2013 | | % change | 2015 | | 2014 | | % change |
| | (in millions, except for percentages) | (in millions, except for percentages) |
| Research and development | $ | 608 |
| | $ | 369 |
| | 65 | % | | $ | 1,555 |
| | $ | 1,006 |
| | 55 | % | $ | 1,062 |
| | $ | 455 |
| | 133 | % |
| Percentage of revenue | 19 | % | | 18 | % | | | | 18 | % | | 19 | % | | | 30 | % | | 18 | % | | |
Research and development expenses in the thirdfirst quarter and the first nine months of 20142015 increased $239$607 million, or 65%133%, and $549 million, or 55%, respectively, compared to the same periodsperiod in 2013.2014. The increases in both periods wereincrease was primarily due to increasesa $385 million increase in share-based compensation expense, compared to the first quarter of 2014. Other payroll and benefits expenses also increased as a result of a 55% growth in employee headcount from March 31, 2014 to March 31, 2015 in engineering and other technical functions. Additionally, we also recognized a $12 million increase in the fair value of our contingent consideration liability in research and development expense primarily due to an increase in the fair value of our common stock.
Marketing and sales
|
| | | | | | | | | |
| | Three Months Ended March 31, | | |
| | 2015 | | 2014 | | % change |
| | (in millions, except for percentages) |
| Marketing and sales | $ | 620 |
| | $ | 323 |
| | 92% |
| Percentage of revenue | 17 | % | | 13 | % | | |
Marketing and sales expenses in the first quarter of 2015 increased $297 million, or 92%, compared to the same period in 2014. The increase was primarily due to an increase of $101 million in amortization of our intangible assets and an increase of $93 million in our people-, marketer-, and developer-facing marketing expenses in the first quarter of 2015, compared to the same period in 2014. Payroll and benefits expenses also increased as a result of a 40% increase in employee headcount from March 31,
2014 to March 31, 2015 to support global sales, business development, and customer service. Additionally, share-based compensation expenses increased $29 million in the first quarter of 2015, compared to the same period in 2014.
General and administrative
|
| | | | | | | | | | |
| | Three Months Ended March 31, | | |
| | 2015 | | 2014 | | % change |
| | (in millions, except for percentages) |
| General and administrative | $ | 274 |
| | $ | 187 |
| | 47 | % |
| Percentage of revenue | 8 | % | | 7 | % | | |
General and administrative expenses in the first quarter of 2015 increased $87 million, or 47%, compared to the same period in 2014. The increase was primarily due to an increase in payroll and benefits expenses as a result of a 49% growth in employee headcount from September 30, 2013 to September 30, 2014 in engineering and other technical functions. Share-based compensation expenses increased $79 million and $211 million in the third quarter and the first nine months of 2014, respectively. Additionally, we also recognized a $23 million change in the fair value of contingent consideration liability in research and development expense due to the change in the fair value of our common stock.
Marketing and sales
|
| | | | | | | | | | | | | | | | | | | |
| | Three Months Ended September 30, | | | | Nine Months Ended September 30, | | |
| | 2014 | | 2013 | | % change | | 2014 | | 2013 | | % change |
| | (in millions, except for percentages) |
| Marketing and sales | $ | 374 |
| | $ | 233 |
| | 61% | | $ | 1,055 |
| | $ | 704 |
| | 50% |
| Percentage of revenue | 12 | % | | 12 | % | | | | 12 | % | | 13 | % | | |
Marketing and sales expenses in the third quarter and the first nine months of 2014 increased $141 million, or 61%, and $351 million, or 50%, respectively, compared to the same periods in 2013. The increases in both periods were primarily due to increases in payroll and benefits expenses as a result of a 44%63% increase in employee headcount from September 30, 2013 to September 30,March 31, 2014 to support global sales, business development,March 31, 2015, and customer service. Our user-, marketer-, and developer-facing marketing expenses also increased $28 million and $61 million in the third quarter and the first nine months of 2014, respectively, compared to the same periods in 2013. Additionally, share-based compensation expenses also increased $19 million and $55 million in the third quarter and the first nine months of 2014, respectively, compared to the same periods in 2013.
General and administrative
|
| | | | | | | | | | | | | | | | | | | | | |
| | Three Months Ended September 30, | | | | Nine Months Ended September 30, | | |
| | 2014 | | 2013 | | % change | | 2014 | | 2013 | | % change |
| | (in millions, except for percentages) |
| General and administrative | $ | 259 |
| | $ | 171 |
| | 51 | % | | $ | 643 |
| | $ | 520 |
| | 24 | % |
| Percentage of revenue | 8 | % | | 8 | % | | | | 7 | % | | 10 | % | | |
General and administrative expenses in the third quarter and the first nine months of 2014 increased $88 million, or 51%, and $123 million, or 24%, respectively, compared to the same periods in 2013. The increases in both periods were primarily due to increases in payroll and benefits expenses as a result of a 41% increase in employee headcount from September 30, 2013 to September 30, 2014. Professional services expense in the third quarter and the first nine months of 2014 also increased $17 million and $39 million, respectively, primarily due tolesser extent, higher consultinglegal fees. Additionally, share-based compensation expenses increased $12 million and $29$10 million in the thirdfirst quarter andof 2015, compared to the first nine months of 2014, respectively.same period in 2014.
Interest and other income/(expense), net
| | | | Three Months Ended September 30, | | | | Nine Months Ended September 30, | | | Three Months Ended March 31, | | |
| | 2014 | | 2013 | | % change | | 2014 | | 2013 | | % change | 2015 | | 2014 | | % change |
| | (in millions, except for percentages) | (in millions, except for percentages) |
| Interest income/(expense), net | $ | 4 |
| | $ | (16 | ) | | (125 | )% | | $ | 4 |
| | $ | (35 | ) | | (111 | )% | $ | 2 |
| | $ | — |
| | 100 | % |
| Other income/(expense), net | (65 | ) | | 6 |
| | (1,183 | )% | | (69 | ) | | (13 | ) | | 431 | % | (3 | ) | | — |
| | (100 | )% |
| Interest and other income/(expense), net | $ | (61 | ) | | $ | (10 | ) | | 510 | % | | $ | (65 | ) | | $ | (48 | ) | | 35 | % | $ | (1 | ) | | $ | — |
| | (100 | )% |
Interest and other income/(expense), net was not material in the thirdfirst quarter of 2015 and the first nine months of 2014 decreased $51 million, or 510%, and $17 million, or 35%, respectively, as compared to the same periods in 2013.2014. Other income/(expense), net decreased in both periods primarily due to $65 million and $68$5 million in foreign exchange losses resulting from the periodic re-measurement of our foreign currency balances recognized in the thirdfirst quarter and the first nine months of 2014, respectively.2015. The decreasesdecrease in other income/(expense), net werewas partially offset by decreasesan increase in interest expense due to the repayment of our long-term debt in August 2013 and lower capital lease payments.income driven by larger invested cash balances.
Provision for income taxes
| | | | Three Months Ended September 30, | | | | Nine Months Ended September 30, | | | Three Months Ended March 31, | | |
| | 2014 | | 2013 | | % change | | 2014 | | 2013 | | % change | 2015 | | 2014 | | % change |
| | (in millions, except for percentages) | (in millions, except for percentages) |
| Provision for income taxes | $ | 530 |
| | $ | 301 |
| | 76 | % | | $ | 1,557 |
| | $ | 647 |
| | 141 | % | $ | 420 |
| | $ | 433 |
| | (3 | )% |
| Effective tax rate | 40 | % | | 41 | % | | | | 41 | % | | 40 | % | | | 45 | % | | 40 | % | | |
Our provision for income taxes in the thirdfirst quarter and the first nine months of 20142015 increased $229decreased $13 million, and $910 million, respectively, compared to the same periodsperiod in 20132014, primarily due to increasesa decrease in income before provision for income taxes in both periods.
taxes. Our effective tax rate decreasedincreased in the thirdfirst quarter of 20142015 compared to the same period in 20132014, primarily due to a changean increase in our geographic mix of pre-tax income. Our effective tax rate increased for the first nine months of 2014 compared to the same period in 2013 due to a non-recurring tax benefitnon-deductible share-based compensation related to the reinstatement of the federal credit for research and development activities applicable to the year ended December 31, 2012 that was recorded in the first quarter of 2013.acquisitions.
Our effective tax rate has exceeded the U.S. statutory rate primarily because of the effect of non-deductible share-based compensation and the impact of acquiring intellectual property and integrating it into our business. Our effective tax rate in the future will depend on the portion of our profits earned within and outside the United States, which will also be affected by our methodologies for valuing our intellectual property and intercompany transactions. Our future effective tax rate will also be affected by the timing, size, and integration of any acquisitions we make.
Liquidity and Capital Resources
Our principal sources of liquidity are our cash and cash equivalents, marketable securities, and cash generated from operations. Cash and cash equivalents and marketable securities consist primarily of cash on deposit with banks, investments in money market funds, and investments in U.S. government securities, U.S. government agency securities, and corporate debt securities. Cash and cash equivalents and marketable securities were $14.25$12.41 billion as of September 30, 2014,March 31, 2015, an increase of $2.80$1.21 billion from December 31, 2013,2014, primarily due to $3.87$1.70 billion of cash generated from operations and $1.37 billion$423 million in excess tax benefits from share-based award activity, partially offset by $1.31 billion$502 million for purchases of property and equipment $754and $257 million for acquisitions of businesses and $199 million for principal payments on capital lease transactions.other assets.
In October 2014, we completed our acquisition of WhatsApp Inc. (WhatsApp), a privately-held cross-platform mobile messaging company, for 178 million of our Class A common stock and $4.59 billion in cash. The tax withholdings related to the WhatsApp vested merger consideration were funded by net share settlement. After closing, we will also grant 46 million RSUs to WhatsApp employees.
In January 2014, we began requiring that employees sell a portion of the shares that they receive upon the vesting of RSUs in order to cover any required withholding taxes ("sell-to-cover"), rather than our previous approach of net share settlement. This sell-to-cover approach reduces our cash outflows compared to the net share settlement approach.
In August 2013, we entered into a five-yearfive-year senior unsecured revolving credit facility (2013 Revolving Credit Facility) that allows us to borrow up to $6.5$6.5 billion to fund working capital and general corporate purposes with interest payable on the borrowed amounts set at LIBOR plus 1.0%, as well as an annual commitment fee of 0.10% on the daily undrawn balance of the facility. We paid origination fees at closing of the 2013 Revolving Credit Facility, which fees are being amortized over the term of the facility. Any amounts outstanding under this facility will be due and payable on August 15, 2018. As of September 30, 2014,March 31, 2015, no amounts had been drawn down and we were in compliance with the covenants under this credit facility.
As of September 30, 2014, $1.01March 31, 2015, $1.51 billion of the $14.25$12.41 billion in cash and cash equivalents and marketable securities was held by our foreign subsidiaries. Substantially all of these funds are in jurisdictions for which we are indefinitely reinvesting the earnings of the local subsidiary. These subsidiaries have historically incurred losses; as such, repatriating the funds will likely incur no residual tax liability. We have provided for residual taxes in jurisdictions where we do not intend to indefinitely reinvest the earnings of the local subsidiary, however the amount of taxes provided has been insignificant.
We currently anticipate that our available funds, credit facilities,facility, and cash flow from operations will be sufficient to meet our operational cash needs for the foreseeable future.
Cash Provided by Operating Activities
Cash flow from operating activities during the first nine monthsquarter of 20142015 primarily consisted of net income, adjusted for certain non-cash items, including share-based compensation expense of $941$694 million and total depreciation and amortization of $810 million.$457 million. The increase in cash flow from operating activities during the first nine monthsquarter of 20142015 compared to the same period in 20132014 was mainlymostly due to an increase in net income, as adjusted for certain non-cash items described above, partially offset by a $413 million decrease in income tax refunds.above.
Cash Provided by (Used in)Used in Investing Activities
Cash provided byflow from investing activities was $703 million during the first nine monthsquarter of 20142015 primarily resulted from $2.89 billionconsisted of netpurchases, sales, and maturities of marketable securities, partially offset by $1.31 billion forpurchases of property and equipment, and acquisitions of businesses and purchases of intangible assets. The increase in cash used in investing activities during the first quarter of 2015, compared to the same period in 2014 was primarily due to $600 million increase in net purchases of marketable securities, and to a lesser extent, an increase in acquisition of businesses and other assets. In addition, there was an increase in capital expenditures related to the purchase of servers, network infrastructure, and the construction of data centers and office buildings, and $754 million for acquisition of businesses.
Cash used in investing activities was $90 million during the first nine months of 2013 primarily resulted from $879 million for capital expenditures related to the purchase of servers, network and storage infrastructure, and the construction of data centers and buildings, $237 million for acquisitions of businesses and other assets, such as patents, partially offset by $1.02 billion of net sales and maturities of marketable securities.
In October 2014, upon closing of our acquisition of WhatsApp, we used $4.59 billion of our cash and cash equivalent balance for the cash portion of the purchase consideration.buildings.
We anticipate making capital expenditures in 20142015 of approximately $1.9$2.7 billion to $2.2$3.2 billion.
Cash Provided by (Used in) Financing Activities
Cash flow from financing activities during the first quarter of 2015 primarily consisted of excess tax benefits from share-based award activity and principal payments on capital lease obligations. The increase in cash provided by financing activities was $1.17 billion for the first nine months of 2014, which primarily resulted from $1.37 billion ofmostly due to increased excess tax benefit from stock award activities partially offset by $199 million ofand lower principal payments related to our capital lease transactions.
Cash used in financing activities was $2.19 billion for the first nine months of 2013, which primarily resulted from $1.5 billion for repayment of debt and $706 million of tax payments related to the net share settlement of equity awards.
Off-Balance Sheet Arrangements
We did not have any off-balance sheet arrangements as of September 30, 2014.March 31, 2015.
Contractual Obligations
In April 2014, we entered into a non-cancelable contractual commitment to spend a minimum of $140 million on network services over a period of 10 years.
There were no other material changes in our commitments under contractual obligations, as disclosed in our Annual Report on Form 10-K for the fiscal year ended December 31, 2013.2014.
Contingencies
We are involved in claims, lawsuits, government investigations, and other legal proceedings. We record a provision for a liability when we believe that it is both probable that a liability has been incurred, and that the amount can be reasonably estimated. Significant judgment is required to determine both probability and the estimated amount. Such legal proceedings are inherently unpredictable and subject to significant uncertainties, some of which are beyond our control. Should any of these estimates and assumptions change or prove to be incorrect, it could have a material impact on our results of operations, financial position, and cash flows.
See Note 9 in the notes to the condensed consolidated financial statements included in Part I, Item 1 and "Legal Proceedings" contained in Part II, Item 1 of this Quarterly Report on Form 10-Q for additional information regarding contingencies.
Recent Accounting Pronouncements
In May 2014, the Financial Accounting Standards Board issued guidance related to revenue from contracts with customers. Under this guidance, revenue is recognized when promised goods or services are transferred to customers in an amount that reflects the consideration that is expected to be received for those goods or services. The updated standard will replace most existing revenue recognition guidance under U.S. generally accepted accounting principles (GAAP) when it becomes effective and permits
the use of either the retrospective or cumulative effect transition method. Early adoption is not permitted. The updated standard will be effective for us in the first quarter of 2017. We have not yet selected a transition method and we are currently evaluating the effect that the updated standard will have on our consolidated financial statements and related disclosures.
Critical Accounting Policies and Estimates
Our condensed consolidated financial statements are prepared in accordance with GAAP. The preparation of these condensed consolidated financial statements requires us to make estimates and assumptions that affect the reported amounts of assets, liabilities, revenue, costs and expenses, and related disclosures. These estimates form the basis for judgments we make about the carrying values of our assets and liabilities, which are not readily apparent from other sources. We base our estimates and judgments on historical experience and on various other assumptions that we believe are reasonable under the circumstances. On an ongoing basis, we evaluate our estimates and assumptions. Our actual results may differ from these estimates under different assumptions or conditions.
We believe that the assumptions and estimates associated with revenue recognition for Payments and other fees, income taxes, and share-based compensation, loss contingencies, and business combinations and valuation of goodwill and other acquired intangible assets have the greatest potential impact on our condensed consolidated financial statements. Therefore, we consider these to be our critical accounting policies and estimates.
There have been no material changes to our critical accounting policies and estimates as compared to the critical accounting policies and estimates described in our Annual Report on Form 10-K for the fiscal year ended December 31, 2013.2014.
| |
| Item 3. | Quantitative and Qualitative Disclosures About Market Risk |
We are exposed to market risks, including changes to foreign currency exchange rates, interest rates, and inflation.
Foreign Currency Exchange Risk
We have foreign currency risks related to our revenue and operating expenses denominated in currencies other than the U.S. dollar, primarily the Euro. In general, we are a net receiver of currencies other than the U.S. dollar. Accordingly, changes in exchange rates, and in particular a strengthening of the U.S. dollar, willhave negatively affectaffected our revenue and other operating results as expressed in U.S. dollars.
We have experienced and will continue to experience fluctuations in our net income as a result of transaction gains or losses related to revaluing certain current asset and current liability balances that are denominated in currencies other than the functional currency of the entities in which they are recorded. At this time we have not entered into, but in the future we may enter into, derivatives or other financial instruments in an attempt to hedge our foreign currency exchange risk. It is difficult to predict the effect hedging activities would have on our results of operations. We recognized foreign currency lossesloss of $65 million and $68$5 million in the three and nine months ended September 30, 2014, respectively, and $13 millionfirst quarter of 2015. Foreign currency gain recognized in the nine months ended September 30, 2013. We recognized foreign currency gainsfirst quarter of $6 million in the three months ended September 30, 2013.2014 was not material.
Interest Rate Sensitivity
Our exposure to changes in interest rates relates primarily to interest earned and market value on our cash and cash equivalents and marketable securities.
Our cash and cash equivalents and marketable securities consist of cash, certificates of deposit, time deposits, money market funds, U.S. government securities, U.S. government agency securities, and corporate debt securities. Our investment policy and strategy are focused on preservation of capital and supporting our liquidity requirements. Changes in U.S. interest rates affect the interest earned on our cash and cash equivalents and marketable securities and the market value of those securities. A hypothetical 100 basis point increase in interest rates would result in a decrease of approximately $48$77 million and $73$63 million in the market value of our available-for-sale debt securities as of September 30, 2014March 31, 2015 and December 31, 2013,2014, respectively. Any realized gains or losses resulting from such interest rate changes would only occur if we sold the investments prior to maturity.
| |
| Item 4. | Controls and Procedures |
Evaluation of Disclosure Controls and Procedures
Our management, with the participation of our chief executive officer (CEO) and chief financial officer (CFO), has evaluated the effectiveness of our disclosure controls and procedures (as defined in Rules 13a-15(e) and 15d-15(e) under the Securities Exchange Act of 1934, as amended (Exchange Act)), as of the end of the period covered by this Quarterly Report on Form 10-Q. Based on such evaluation, our CEO and CFO have concluded that as of September 30, 2014,March 31, 2015, our disclosure controls and procedures
are designed at a reasonable assurance level and are effective to provide reasonable assurance that information we are required to disclose in reports that we file or submit under the Exchange Act is recorded, processed, summarized, and reported within the time periods specified in the rules and forms of the Securities and Exchange Commission (SEC), and that such information is accumulated and communicated to our management, including our CEO and CFO, as appropriate, to allow timely decisions regarding required disclosure.
Changes in Internal Control
There were no changes in our internal control over financial reporting identified in management's evaluation pursuant to Rules 13a-15(d) or 15d-15(d) of the Exchange Act during the period covered by this Quarterly Report on Form 10-Q that materially affected, or are reasonably likely to materially affect, our internal control over financial reporting.
Limitations on Effectiveness of Controls and Procedures
In designing and evaluating the disclosure controls and procedures and internal control over financial reporting, management recognizes that any controls and procedures, no matter how well designed and operated, can provide only reasonable assurance of achieving the desired control objectives. In addition, the design of disclosure controls and procedures and internal control over financial reporting must reflect the fact that there are resource constraints and that management is required to apply judgment in evaluating the benefits of possible controls and procedures relative to their costs.
PART II—OTHER INFORMATION
Paul D. Ceglia filed suit against us and Mark Zuckerberg on or about June 30, 2010, in the Supreme Court of the State of New York for the County of Allegheny, claiming substantial ownership of our company based on a purported contract between Mr. Ceglia and Mr. Zuckerberg allegedly entered into in April 2003. We removed the case to the U.S. District Court for the Western District of New York where the case is now pending. In his first amended complaint, filed on April 11, 2011, Mr. Ceglia revised his claims to include an alleged partnership with Mr. Zuckerberg, he revised his claims for relief to seek a substantial share of Mr. Zuckerberg's ownership in us, and he included quotations from supposed emails that he claims to have exchanged with Mr. Zuckerberg in 2003 and 2004. On March 26, 2012, we filed a motion to dismiss Mr. Ceglia's complaint and a motion for judgment on the pleadings. On March 26, 2013, the magistrate judge overseeing the matter issued a report recommending that the court grant our motion to dismiss and that it deny as moot our motion for judgment on the pleadings.. On March 25, 2014, the district judge adopted the magistrate judge’s report and recommendation andcourt granted our motion to dismiss, and denied our motion for judgment on the pleadings as moot. On April 24, 2014, Mr. Ceglia filed a notice of appeal. We continue to believe that Mr. Ceglia is perpetrating a fraud on20, 2015, the court and we intend to continue to defend the case vigorously.of appeals affirmed.
Beginning on May 22, 2012, multiple putative class actions, derivative actions, and individual actions were filed in state and federal courts in the United States and in other jurisdictions against us, our directors, and/or certain of our officers alleging violation of securities laws or breach of fiduciary duties in connection with our initial public offering (IPO) and seeking unspecified damages. We believe these lawsuits are without merit, and we intend to continue to vigorously defend them. The vast majority of the cases in the United States, along with multiple cases filed against The NASDAQ OMX Group, Inc. and The Nasdaq Stock Market LLC (collectively referred to herein as NASDAQ) alleging technical and other trading-related errors by NASDAQ in connection with our IPO, were ordered centralized for coordinated or consolidated pre-trial proceedings in the U.S. District Court for the Southern District of New York. In a series of rulings in 2013 and 2014, the court denied our motion to dismiss the consolidated securities class action and granted our motions to dismiss the derivative actions against our directors and certain of our officers. The plaintiffs in four of these derivative actions have filed notices of appeal. The appeals have been fully briefed. On December 23, 2014, the plaintiffs in the consolidated securities class action filed their motion for class certification. On April 10, 2015, we filed our opposition to class certification. In addition, the events surrounding our IPO became the subject of various state and federal government inquiries. In May 2014, the Securities and Exchange Commission (SEC) notified us that it had terminated its inquiry and that no enforcement action had been recommended by the SEC.
In addition, we are also currently parties to multiple other lawsuits related to our products, including other patent infringementintellectual property lawsuits as well as class action lawsuits brought by users and marketers, and we may in the future be subject to additional lawsuits and disputes. We are also involved in other claims, government investigations, and proceedings arising from the ordinary course of our business.
Certain factors may have a material adverse effect on our business, financial condition, and results of operations. You should consider carefully the risks and uncertainties described below, in addition to other information contained in this Quarterly Report on Form 10-Q, including our condensed consolidated financial statements and related notes. The risks and uncertainties described below are not the only ones we face. Additional risks and uncertainties that we are unaware of, or that we currently believe are not material, may also become important factors that adversely affect our business. If any of the following risks actually occurs, our business, financial condition, results of operations, and future prospects could be materially and adversely affected. In that event, the trading price of our Class A common stock could decline, and you could lose part or all of your investment.
Risks Related to Our Business and Industry
If we fail to retain existing users or add new users, or if our users decrease their level of engagement with our products, our revenue, financial results, and business may be significantly harmed.
The size of our user base and our users' level of engagement are critical to our success. Our financial performance has been and will continue to be significantly determined by our success in adding, retaining, and engaging active users. We anticipate that our active user growth rate will continue to decline over time as the size of our active user base increases, and as we achieve higher market penetration rates. If people do not perceive our products to be useful, reliable, and trustworthy, we may not be able to attract or retain users or otherwise maintain or increase the frequency and duration of their engagement. A number of other social networking companies that achieved early popularity have since seen their active user bases or levels of engagement decline, in some cases precipitously. There is no guarantee that we will not experience a similar erosion of our active user base or engagement levels. Our user engagement patterns have changed over time, and user engagement can be difficult to measure, particularly as users continue to engage increasingly via mobile devices and as we introduce new and different products and services. Any number of factors could potentially negatively affect user retention, growth, and engagement, including if:
users increasingly engage with other products or activities;services;
we fail to introduce new products or services that users find engaging or if we introduce new products or services that are not favorably received;
users feel that their Facebook experience is diminished as a result of the decisions we make with respect to the frequency, prominence, and size of ads that we display, or the quality of the ads displayed;
users have difficulty installing, updating, or otherwise accessing our products on mobile devices as a result of actions by us or third parties that we rely on to distribute our products and deliver our services;
user behavior on any of our products changes, as a resultincluding decreases in the quality and frequency of increasing use of mobile devices;content shared on our products and services;
we are unable to continue to develop products for mobile devices that users find engaging, that work with a variety of mobile operating systems and networks, and that achieve a high level of market acceptance;
there are changesdecreases in user sentiment about the quality or usefulness of our products or concerns related to privacy and sharing, safety, security, or other factors;
we are unable to manage and prioritize information to ensure users are presented with content that is interesting, useful, and relevant to them;
users adopt new technologies where our products may be displaced in favor of other products or services, or may not be featured or otherwise available;
there are adverse changes in our products that are mandated by legislation, regulatory authorities, or litigation, including settlements or consent decrees;
technical or other problems prevent us from delivering our products in a rapid and reliable manner or otherwise affect the user experience, such as anysecurity breaches or failure to prevent or limit spam or similar content;
we adopt policies or procedures related to areas such as sharing or user data that are perceived negatively by our users or the general public;
we elect to focus our user growth and engagement efforts more on longer-term initiatives, or if initiatives designed to attract and retain users and engagement are unsuccessful or discontinued, whether as a result of actions by us,
third parties, or otherwise;
we fail to provide adequate customer service to users, marketers, or developers;
we, developers whose products are integrated with Facebook, or other companies in our industry are the subject of adverse media reports or other negative publicity; or
our current or future products, such as our development tools and application programming interfaces that enable developers to build, grow, and monetize mobile and web applications, reduce user activity on Facebook by making it easier for our users to interact and share on third-party mobile and web applications.
If we are unable to maintain or increase our user base and user engagement, our revenue and financial results may be adversely affected. Any decrease in user retention, growth, or engagement could render our products less attractive to users, marketers, and developers, which mayis likely to have a material and adverse impact on our revenue, business, financial condition, and results of operations. If our active user growth rate continues to slow, we will become increasingly dependent on our ability to maintain or increase levels of user engagement and monetization in order to drive revenue growth.
We generate a substantial majoritysubstantially all of our revenue from advertising. The loss of marketers, or reduction in spending by marketers with Facebook, could seriously harm our business.
The substantial majoritySubstantially all of our revenue is currently generated from third parties advertising on Facebook. For the nine months ended September 30,first quarter of 2015 and 2014, and 2013, advertising accounted for 92%94% and 88%91%, respectively, of our revenue. As is common in the industry, our marketers do not have long-term advertising commitments with us. Many of our marketers spend only a relatively small portion of their overall advertising budget with us. We expect our ability to grow advertising revenue will continue to be dependent on our ability to generate revenue from ads displayed on mobile devices. In addition, marketers may view some of our products as experimental and unproven. Marketers will not continue to do business with us, or they will reduce the prices they are willing to pay to advertise with us or the budgets they are willing to commit to us, if we do not deliver ads in an effective manner, or if they do not believe that their investment in advertising with us will generate a competitive return relative to other alternatives. Our advertising revenue could be adversely affected by a number of other factors, including:
decreases in user engagement, including time spent on Facebook;
our abilityinability to continue to increase user access to and engagement with Facebook through our mobile products;
product changes or inventory management decisions we may make that change the size, frequency, or relative prominence of ads displayed on Facebook or of other unpaid content shared by marketers on Facebook;
our inability to maintain or increase marketer demand, the pricing of our ads, or both;
differences between the pricing of our ads displayed on personal computers and mobile devices;
our inability to maintain or increase the quality of ads shown to users, particularly on mobile devices;
changes to third-party policies that limit our ability to deliver or target advertising on mobile devices;
the availability, accuracy, and utility of analytics and measurement solutions offered by us or third parties that demonstrate the value of our ads to marketers, or our ability to further improve such tools;
decisions by marketers to use our free products, such as Facebook Pages, instead of advertising on Facebook;
loss of advertising market share to our competitors, including if prices for purchasing ads on Facebook increase or if competitors offer lower priced or more integrated products;
adverse legal developments relating to advertising, including legislative and regulatory developments and developments in litigation;
decisions by marketers to reduce their advertising as a result of adverse media reports or other negative publicity involving us, content on Facebook, developers with Facebook-integrated mobile and web applications, or other companies in our industry;
our inability to improve our existing products or create new products that sustain or increase the value of our ads or marketers' ability to analyze and measure the value of our ads;
the degree to which users opt out of social ads;ads or certain types of ad targeting;
the degree to which users cease or reduce the number of times they click on our ads;
changes in the way advertising on personal computersmobile devices or on mobile devicespersonal computers is measured or priced;
the impact of new technologies that could block or obscure the display of our ads; and
the impact of macroeconomic conditions, or conditionswhether in the advertising industry in general.general, or among specific types of marketers or within particular geographies.
The occurrence of any of these or other factors could result in a reduction in demand for our ads, which may reduce the prices we receive for our ads, or cause marketers to stop advertising with us altogether, either of which would negatively affect our revenue and financial results.
We generate a significant portion of our revenue from mobile advertising. Mobile advertising is evolving and growth in the use of Facebook through our mobile products as a substitute for use on personal computers may negatively affect our revenue and financial results.
WeFacebook had 1.121.25 billion mobile monthly active users (MAUs) in September 2014. While most of our mobile users also access Facebook through personal computers, weMarch 2015. We anticipate that growth in mobile users will continue to be the driver of our growth for the foreseeable future and that usage through personal computers will continue to decline worldwide, includingworldwide. We generate over two-thirds of our revenue from mobile advertising, which comprised approximately 73% of our overall advertising revenue in key markets such as the United States and other developed markets in Europe and Asia. For example, during the fourthfirst quarter of 2013, the number of mobile MAUs exceeded the number of MAUs using personal computers for the first time, and during the third quarter of 2014, the number of MAUs using personal computers continued to decline compared to the prior quarter.2015. While our mobile advertising revenue continues to grow, and comprised over half of our overall advertising revenue in the third quarter of 2014, the mobile advertising market remains an evolving market. In addition, we do not currently offer our Payments infrastructure to applications on mobile devices. If users continue to access Facebook mobile products as a substitute for access through personal computers, and if we are unable to continue to grow mobile revenuesrevenue or unable to continue to successfully monetize mobile users, or if we incur excessive expenses in these efforts, our financial performance and ability to grow revenue would be negatively affected.
Our user growth, engagement, and monetization on mobile devices depend upon effective operation with mobile operating systems, networks, and standards that we do not control.
There is no guarantee that popular mobile devices will continue to feature Facebook or our other products, or that mobile device users will continue to use Facebookour products rather than competing products. We are dependent on the interoperability of Facebook and our other products with popular mobile operating systems, networks, and standards that we do not control, such as the Android and iOS operating systems, and any changes in such systems, andour relationships with mobile operating system partners, handset manufacturers, or mobile carriers, or in their terms of service or policies that degrade our products' functionality, reduce or eliminate our ability to distribute our products, give preferential treatment to competitive products, limit our ability to deliver, target, or measure the effectiveness of ads, or impose fees or other charges related to our delivery of ads could adversely affect Facebook usage and monetization on mobile devices. Additionally, in order to deliver high quality mobile products, it is important that our products work well with a range of mobile technologies, systems, networks, and standards that we do not control.control, and that we have good relationships with handset manufacturers and mobile carriers. We may not be successful in maintaining or developing relationships with key participants in the mobile industry or in developing products that operate effectively with these technologies, systems, networks, or standards. In the event that it is more difficult for our users to access and use Facebook or our other products on their mobile devices, or if our users choose not to access or use Facebook or our other products on their mobile devices or use mobile products that do not offer access to Facebook or our other products, our user growth and user engagement could be harmed. From time to time, we may also take actions regarding the distribution of our products or the operation of our business based on what we believe to be in our long-term best interests. Such actions may adversely affect our users and our relationships with the operators of mobile operating systems, handset manufacturers, mobile carriers, or other business partners, and there is no assurance that these actions will result in the anticipated long-term benefits. In the event that our users are adversely affected by these actions or if our relationships with operators of mobile operating systems or other business partnerssuch third parties deteriorate, our user growth, engagement, and monetization could be adversely affected and our business could be harmed.
Our business is highly competitive. Competition presents an ongoing threat to the success of our business.
We face significant competition in every aspect of our business, including from companies that provide tools to facilitate communication and the sharing of information, companies that enable marketers to display advertising and companies that provide development platforms for applications developers. We compete with companies that offer full-featured products that replicate the range of communications and related capabilities we provide. These offerings include, for example, Google+, which Google has integrated with certain of its products, including search and Android, as well as other, largely regional, social networks that have strong positions in particular countries. We also compete with companies that develop applications, particularly mobile applications, that provide social or other communications functionality, such as messaging, photo- and video-sharing, and micro-blogging, and companies that provide web- and mobile-based information and entertainment products and services that are designed to engage users and capture time spent online and on mobile devices. In addition, we face competition from traditional, online, and onlinemobile businesses that provide media for marketers to reach their audiences and/or develop tools and systems for managing and optimizing advertising campaigns.
Some of our current and potential competitors may have significantly greater resources or better competitive positions in
certain product segments, geographic regions or user demographics than we do. These factors may allow our competitors to respond more effectively than us to new or emerging technologies and changes in market conditions. We believe that some of our users, particularly our younger users, are aware of and actively engaging with other products and services similar to, or as a substitute
for, Facebook products and services, and we believe that some of our users have reduced their engagement with Facebook in favor of increased engagement with these other products and services. In the event that our users increasingly engage with other products and services, we may experience a decline in user engagement in key user demographics or more broadly, andin which our business couldwould likely be harmed.
Our competitors may develop products, features, or services that are similar to ours or that achieve greater acceptance, may undertake more far-reaching and successful product development efforts or marketing campaigns, or may adopt more aggressive pricing policies. In addition, developers whose mobile and web applications are integrated with Facebook may use information shared by our users through Facebook in order to develop products or features that compete with us. Certain competitors, including Google, could use strong or dominant positions in one or more markets to gain competitive advantage against us in areas where we operate, including: by integrating competing social networking platforms or features into products they control such as search engines, web browsers, or mobile device operating systems;systems, search engines, or web browsers; by making acquisitions; by limiting or denying our access to advertising measurement or delivery systems; by limiting our ability to deliver, target, or measure the effectiveness of ads; by imposing fees or other charges related to our delivery of ads; or by making access to our products more difficult. As a result, our competitors may acquire and engage users or generate advertising or other revenue at the expense of our own efforts, which may negatively affect our business and financial results. In addition, from time to time, we may take actions in response to competitive threats, but we cannot assure you that these actions will be successful or that they will not negatively affect our business and financial results.
We believe that our ability to compete effectively depends upon many factors both within and beyond our control, including:
the popularity, usefulness, ease of use, performance, and reliability of our products compared to our competitors' products, particularly with respect to mobile products;
the size and composition of our user base;
the engagement of our users with our products and competing products;
the timing and market acceptance of products, including developments and enhancements to our or our competitors' products;
our ability to distribute our products to new and existing users;
our ability to monetize our products;
the frequency, size, quality, and relative prominence of the ads displayed by us or our competitors;
customer service and support efforts;
marketing and selling efforts, including our ability to measure the effectiveness of our ads and to provide marketers with a compelling return on their investments;
our ability to establish and maintain developers' interest in building mobile and web applications that integrate with Facebook;
changes mandated by legislation, regulatory authorities, or litigation, including settlements and consent decrees, some of which may have a disproportionate effect on us;
acquisitions or consolidation within our industry, which may result in more formidable competitors;
our ability to attract, retain, and motivate talented employees, particularly software engineers, designers, and product managers;
our ability to cost-effectively manage and grow our operations; and
our reputation and brand strength relative to those of our competitors.
If we are not able to compete effectively, our user base and level of user engagement may decrease, we may become less attractive to developers and marketers, and our revenue and results of operations may be materially and adversely affected.
We may not be successful in our efforts to grow usage of and engagement with mobile and web applications that integrate with Facebook.
We have made and are continuing to make investments to enable developers to build mobile and web applications that integrate with Facebook. Such existing and prospective developers may not be successful in building mobile and/or web applications that create and maintain user engagement. Additionally, developers may choose to build on other platforms, including mobile platforms controlled by third parties, rather than building products that integrate with Facebook. We are continuously seeking to balance the distribution objectives of our developers with our desire to provide an optimal user experience, and we may not be successful in achieving a balance that continues to attract and retain such developers. For example, from time to time, we have taken actions to reduce the volume of communications from these developers to users on Facebook with the objective of enhancing the user experience, and such actions have reduced distribution from, user engagement with, and our monetization opportunities from, Facebook-integrated mobile and web applications. In some instances, these actions, as well as other actions to enforce our policies applicable to developers, have adversely affected our relationships with such developers. If we are not successful in our efforts to grow the number of developers that choose to build products that integrate with Facebook or if we are unable to build and maintain good relations with such developers, our user growth and user engagement and our financial results may be adversely affected.
We may not be successful in our efforts to further monetize how developers use Facebook, and we expect that our Payments revenue will decline in the future as usage of Facebook on personal computers continues to decline.
We currently generate revenue from developers that use Facebook in several ways, including ads on pages generated by developers' applications on the Facebook website, direct advertising on Facebook purchased by developers to drive traffic to their mobile and web applications, and fees from developers' use of our Payments infrastructure to sell virtual and digital goods to users accessing Facebook via personal computers. Applications built by developers of social games are currently responsible for substantially all of our revenue derived from Payments, and the majority of the revenue from these applications has historically been generated by a limited number of the most popular games. In addition, a relatively small percentage of our users have transacted with Facebook Payments. We also have experienced declines in usage of Facebook on personal computers, which declines we expect to continue for the foreseeable future. We expect this trend will result in a decline in Payments revenue in the future. If the Facebook-integrated applications that currently generate revenue fail to grow or maintain their users and engagement, whether as a result of the continued decline in the usage of Facebook on personal computers or otherwise, if developers do not continue to introduce new applications that attract users and create engagement on Facebook, if developers reduce their advertising on Facebook, if we fail to maintain good relationships with existing developers or to attract new developers who build products that integrate with Facebook, or if Facebook-integrated applications outside of social games do not gain popularity and generate significant revenue for us, our financial performance could be adversely affected.
Additionally, we are actively supporting developers' efforts to develop their own mobile and web applications that integrate with Facebook. Unlike applications that run within the Facebook website which enable us to show ads and offer Payments, we generally do not directly monetize from developers' integrating their own mobile and web applications with Facebook. Therefore, our developers' efforts to prioritize their own mobile or web applications may reduce or slow the growth of our user activity that generates advertising and Payments opportunities, which could negatively affect our revenue. Although we believe that there are significant long-term benefits to Facebook resulting from increased engagement on Facebook-integrated mobile and web applications, these benefits may not offset the possible loss of revenue, in which case our business could be harmed.
Action by governments to restrict access to Facebook or our other products in their countries could substantially harm our business and financial results.
It is possible that governments of one or more countries may seek to censor content available on Facebook or our other products in their country, restrict access to our products from their country entirely, or impose other restrictions that may affect the accessibility of our products in their country for an extended period of time or indefinitely. For example, access to Facebook has been or is currently restricted in whole or in part in China, Iran, and North Korea. In addition, governmentsgovernment authorities in other countries may seek to restrict access to our products if they consider us to be in violation of their laws. In the event that content shown on Facebook or our other products is subject to censorship, access to our products is restricted, in whole or in part, in one or more countries, or other restrictions are imposed on our products, or our competitors are able to successfully penetrate geographic markets that we cannot access or where we face other restrictions, our ability to retain or increase our user base and user engagement may be adversely affected, we may not be able to maintain or grow our revenue as anticipated, and our financial results could be adversely affected.
Our new products and changes to existing products could fail to attract or retain users or generate revenue.
Our ability to retain, increase, and engage our user base and to increase our revenue depends heavily on our ability to create successful new products, both independently and in conjunction with developers or other third parties. We may introduce significant changes to our existing products, or acquire or introduce new and unproven products, including using technologies with which we have little or no prior development or operating experience. For example, in July 2014 we completed our acquisition of Oculus VR, Inc. (Oculus), a company developing virtual reality technology. We do not have prior experience with consumer hardware products or virtual reality technology, which may adversely affect our ability to successfully develop and market Oculus' products or technology. In addition, in October 2014, we acquired WhatsApp Inc. (WhatsApp), a cross-platform mobile messaging company. We currently monetize WhatsApp in only a very limited fashion, and we may not be successful in our efforts to generate meaningful revenue from WhatsApp over the long term. If these or other new or enhanced products fail to engage users, marketers, or developers, or if we are unsuccessful in our monetization efforts, we may fail to attract or retain users or to generate sufficient revenue, operating margin, or other value to justify our investments, and our business may be adversely affected.
We prioritize user growth and engagement and the user experience over short-term financial results.
We frequently make product decisions that may reduce our short-term revenue or profitability if we believe that the decisions are consistent with our mission and benefit the aggregate user experience and will thereby improve our financial performance over the long term. For example, from time to time we may change the size, frequency, or relative prominence of ads in order to improve ad quality and overall user experience. Similarly, from time to time we update our News Feed ranking algorithm to deliver the most relevant content to our users, which may adversely affect the distribution of content of marketers and developers and could reduce their incentive to invest in their development and marketing efforts on Facebook. We also may introduce changes to existing products, or introduce new stand-alone products, that direct users away from properties where we have a proven means of monetization. For example, we have taken action to redirect users who send messages from within the Facebook application to our stand-alone Messenger application, although we currently do not monetize the stand-alone Messenger application. In addition, we plan to focus on growing the user base for Instagram, WhatsApp, and potentially other stand-alone applications that may have limited or no near-term monetization, and it is possible that these efforts may reduce engagement with the core Facebook application. We also may take steps that result in limiting distribution of mobile products and services in the short term in order to attempt to ensure the availability of our products and services to users over the long term. These decisions may not produce the long-term benefits that we expect, in which case our user growth and engagement, our relationships with marketers and developers, and our business and results of operations could be harmed.
If we are not able to maintain and enhance our brand,brands, or if events occur that damage our reputation and brand,brands, our ability to expand our base of users, marketers, and developers may be impaired, and our business and financial results may be harmed.
We believe that the Facebook brand hasour brands have significantly contributed to the success of our business. We also believe that maintaining and enhancing our brandbrands is critical to expanding our base of users, marketers, and developers. Many of our new users are referred by existing users. Maintaining and enhancing our brandbrands will depend largely on our ability to continue to provide useful, reliable, trustworthy, and innovative products, which we may not do successfully. We may introduce new products or terms of service or policies that users do not like, which may negatively affect our brand.brands. Additionally, the actions of our developers may affect our brand if users do not have a positive experience using third-party mobile and web applications integrated with Facebook. We will also continue to experience media, legislative, or regulatory scrutiny of our decisions regarding user privacy orand other issues, which may adversely affect our reputation and brand.brands. We also may fail to provide adequate customer service, which could erode confidence in our brand.brands. Our brandbrands may also be negatively affected by the actions of users that are deemed to be hostile or inappropriate to other users, or by users acting under false or inauthentic identities, or by perceived or actual efforts by governments to obtain access to user information for security-related purposes.purposes, or by the use of our products or services for illicit, objectionable, or illegal ends. Maintaining and enhancing our brandbrands may require us to make substantial investments and these investments may not be successful. Certain of our past actions have eroded confidence in our brand,brands, and if we fail to successfully promote and maintain the Facebook brandour brands or if we incur excessive expenses in this effort, our business and financial results may be adversely affected.
ImproperSecurity breaches and improper access to or disclosure of our data or user information,data, or violation ofother hacking and phishing attacks on our terms of service or policies,systems, could harm our reputation and adversely affect our business.
Our Data Use Policy governsindustry is prone to cyber attacks, with third parties seeking unauthorized access to our data or users’ data.Any failure to prevent or mitigate security breaches and improper access to or disclosure of our data or user data could result in the collectionloss or misuse of such data, which could harm our business and usereputation and diminish our competitive position. In addition, computer malware, viruses, and hacking and phishing attacks by third parties have become more prevalent in our industry, have occurred on our systems in the past, and may occur on our systems in the future. As a result of informationour prominence, we receivebelieve that we are a particularly attractive target for such breaches and attacks. Such attacks may cause interruptions to the services we provide, degrade the user experience, or cause users to lose confidence in connection with our services.products. Our efforts to protect our company data or the information we receive may also be unsuccessful due to the actions of third parties, software bugs or other technical malfunctions, employee error or malfeasance, government surveillance, or other factors. In addition, third parties may attempt to fraudulently induce employees or users to disclose information in order to gain access to our data or our users' data. If any of these events occur,Although we have developed systems and processes that are designed to protect our users' information could be accessed or disclosed improperly. Somedata and user data and to prevent data loss and other security breaches, we cannot assure you that such measures will provide absolute security.
In addition, some of our developers or other partners, such as those that help us measure the effectiveness of ads, may receive or store information provided by us or by our users through mobile or web applications integrated with Facebook. IfWe provide limited information to such third parties based on the scope of services provided to us. However, if these third parties or developers fail to adopt or adhere to adequate data security practices, or fail to comply with our terms and policies, or in the event of a breach of their networks, our users' data may be improperly accessed, used, or disclosed.
Any incidents involving unauthorized access to or improper use of user information or incidents involving violation of our terms of service or policies, including our Data Use Policy, could damage our reputation and our brand and diminish our competitive position. In addition, the affectedAffected users or government authorities could initiate legal or regulatory actions against us in connection with such incidents,any security breaches, which could cause us to incur significant expense and liability or result in orders or consent decrees forcing us to modify our business practices. Any of these events could have a material and adverse effect on our business, reputation, or financial results.
Unfavorable media coverage could negatively affect our business.
We receive a high degree of media coverage around the world. Unfavorable publicity regarding, for example, our privacy practices, terms of service, product changes, product quality, litigation or regulatory activity, government surveillance, the actions of our developers whose products are integrated with Facebook, the use of our products or services for illicit, objectionable, or illegal ends, the actions of our users, or the actions of other companies that provide similar services to us, could adversely affect our reputation. Such negative publicity also could have an adverse effect on the size, engagement, and loyalty of our user base and result in decreased revenue, which could adversely affect our business and financial results.
Our financial results will fluctuate from quarter to quarter and are difficult to predict.
Our quarterly financial results have fluctuated in the past and will fluctuate in the future. Additionally, we have a limited operating history with the current scale of our business, which makes it difficult to forecast our future results. As a result, you should not rely upon our past quarterly financial results as indicators of future performance. You should take into account the risks and uncertainties frequently encountered by companies in rapidly evolving markets. Our financial results in any given quarter can be influenced by numerous factors, many of which we are unable to predict or are outside of our control, including:
our ability to maintain and grow our user base and user engagement;
our ability to attract and retain marketers in a particular period;
fluctuations in spending by our marketers due to seasonality, such as historically strong spending in the fourth quarter of each year, or other factors;
the number and quality of ads shown to users;
the pricing of our ads and other products;
our ability to continue to scale monetization through our mobile products;
our ability to maintain or increase Payments and other fees revenue;
the diversification and growth of revenue sources beyond advertising and Payments;
the development and introduction of new products or services by us or our competitors;
increases in marketing, sales, and other operating expenses that we will incur to grow and expand our operations and to remain competitive;
our ability to maintain gross margins and operating margins;
costs related to the acquisitions of businesses, talent, technologies, or intellectual property, including potentially significant amortization costs and impairment loss;loss and additional investments to further develop the acquired technologies;
our ability to obtain equipment and components for our data centers and other technical infrastructure in a timely and cost-effective manner;
system failures, which could prevent us from serving ads for any period of time, or breaches of security or privacy, and the costs associated with remediating any such failures or breaches;
changes in the manner in which we distribute our products or inaccessibility of our products due to third-party actions;
share-based compensation expense, including acquisition-related expense;
adverse litigation judgments, settlements, or other litigation-related costs;
changes in the legislative or regulatory environment, including with respect to privacy, or enforcement by government regulators, including fines, orders, or consent decrees;
the overall tax rate for our business, which may be affected by a number of factors, including the financial results of our international subsidiaries and the timing, size, and integration of acquisitions we may make from time to time;
tax obligations that may arise from changes in laws or resolutions of tax examinations that materially differ from the amounts we have anticipated;
fluctuations in currency exchange rates and changes in the proportion of our revenue and expenses denominated in foreign currencies;
fluctuations in the market values of our portfolio investments and in interest rates;
changes in U.S. generally accepted accounting principles; and
changes in global business or macroeconomic conditions.
We expect our rates of growth to decline in the future.
We expect that our user growth and revenue growth rates will decline over time as the size of our active user base increases and as we achieve greater market penetration. For example, the growth rate of ourFacebook's MAUs declined from 39% from 2010 to 2011, to 25% from 2011 to 2012, to 16% from 2012 to 2013.2013, to 13% from 2013 to 2014. Historically, our user growth has been a primary driver of growth in our revenue. In addition, we expect our revenue growth rate will generally decline over time as our revenue increases to higher levels. As our growth rates decline, investors' perceptions of our business may be adversely affected and the trading price of our Class A common stock could decline.
Our costs are continuing to grow, which could harm our business and profitability.
Operating our business is costly and we expect our expenses to continue to increase in the future as we broaden our user base, as users increase the number of connections and amount of data they share with us, and as we develop and implement new products.products, and as we continue to hire additional employees to support our expanding operations. Historically, our costs have increased each year due to these factors and we expect to continue to incur increasing costs, in particular for servers, storage, power, and data centers, security systems, and talent to support our anticipated future growth. We expect to continue to invest in these and other efforts to operate and expand our business around the world, including in countries and/or projects where we may not have a clear path to monetization, such as our commitment to the Internet.org initiative to increase global Internet access. In addition, ourOur costs will increase as a result of integrating and operating larger and more complex business acquisitions, including our recent acquisitions of Oculus and WhatsApp. Our costs will also increase as we hire additional employees, particularly as a result of the significant competition that we face to attract and retain technical talent. In addition, we intend to increase marketing, sales, and other operating expenses in order to continue to grow and expand our operations and to remain competitive. Increases in our costs may adversely affect our business and profitability. Our expenses are expected to grow faster than our revenue in the near term and may be greater than we anticipate, and our investments may not be successful.
Our business is subject to complex and evolving U.S. and foreign laws and regulations regarding privacy, data protection, and other matters. Many of these laws and regulations are subject to change and uncertain interpretation, and could result in claims, changes to our business practices, monetary penalties, increased cost of operations, or declines in user growth or engagement, or otherwise harm our business.
We are subject to a variety of laws and regulations in the United States and abroad that involve matters central to our business, including privacy and data protection, rights of publicity, content, intellectual property, advertising, marketing, distribution, data security, data retention and deletion, personal information, electronic contracts and other communications, competition, protection of minors, consumer protection, telecommunications, product liability, taxation, economic or other trade prohibitions or sanctions, securities law compliance, and online payment services. The introduction of new products or expansion of our activities in certain jurisdictions may subject us to additional laws and regulations. In addition, foreign data protection, privacy, and other laws and regulations can be more restrictive than those in the United States. These U.S. federal and state and foreign laws and regulations, which can be enforced by private parties or government entities, are constantly evolving and can be subject to significant change. In addition, the application, interpretation, and interpretationenforcement of these laws and regulations are often uncertain, particularly in the new and rapidly evolving industry in which we operate, and may be interpreted and applied inconsistently from country to country and inconsistently with our current policies and practices. For example, the interpretation of some laws and regulations that govern the use of names and likenesses in connection with advertising and marketing activities is unsettled, and developments in this area could affect the manner in which we design our products and offer services. Similarly, any regulatory or legislative action affecting the manner in which we display content to our users could adversely affect user growth and engagement. A number of proposals are pending before federal, state, and foreign legislative and regulatory bodies that could significantly affect our business. For example, the European Commission is currently considering a data protection regulation that may include operational requirements for companies that receive personal data that are different than those currently in place in the European Union, and that may also include significant penalties for non-compliance. Similarly, there are a number of legislative proposals in the United States, at both the federal and state level, that could impose new obligations in areas affecting our business, such as privacy or liability for copyright infringement by third parties. In addition, some countries are considering or have passed legislation requiring local storage and processing of data or similar requirements that if enacted, could increase the cost and complexity of delivering our services. These existing and proposed laws and regulations can be costly to comply with and can delay or impede the development of new products, result in negative publicity, increase our operating costs, require significant management time and attention, and subject us to inquiries or investigations, claims or other remedies, including fines or demands that we modify or cease existing business practices.
We have been subject to regulatory investigations and settlements and we expect to continue to be subject to such proceedings and other inquires in the future, which could cause us to incur substantial costs or require us to change our business practices in a manner materially adverse to our business.
From time to time, we receive formal and informal inquiries from government authorities and regulators regarding our compliance with laws and other matters. In 2012, the Federal Trade Commission approved a settlement agreement with us that, among other things, requires usregulations, many of which are evolving and subject to complete bi-annual independent privacy assessmentsinterpretation. We are and to establish and refine certain practices with respect to treatment of user information and the privacy settings we offer. In 2011 and 2012, the Irish Data Protection Commissioner audited the data, security, and privacy practices and policies of Facebook Ireland. We expect to continue to be the subject of regulatory investigations, inquiries, and audits in the future by theseUnited States, Europe, and other regulators throughoutaround the world.
Violationworld, particularly in the areas of existing or future regulatory orders or consent decrees could subject usconsumer and data protection, as we continue to substantial monetary finesgrow and other penalties that could negatively affectexpand our financial condition and results of operations. In addition, it is possible that future ordersOrders issued by, or inquiries or enforcement actions initiated by, government or regulatory authorities could cause us to incur substantial costs, expose us to unanticipated civil and criminal liability or penalties (including substantial monetary fines), or require us to change our business practices in a manner materially adverse to our business.
If we are unable to protect our intellectual property, the value of our brandbrands and other intangible assets may be diminished, and our business may be adversely affected.
We rely and expect to continue to rely on a combination of confidentiality, assignment, and license agreements with our employees, consultants, and third parties with whom we have relationships, as well as trademark, copyright, patent, trade secret, and domain name protection laws, to protect our proprietary rights. In the United States and internationally, we have filed various applications for protection of certain aspects of our intellectual property, and we currently hold a number of issued patents in multiple jurisdictions and have acquired patents and patent applications from third parties. In addition, in the future we may acquire additional patents or patent portfolios, which could require significant cash expenditures. Third parties may knowingly or unknowingly infringe our proprietary rights, third parties may challenge proprietary rights held by us, and pending and future trademark and patent applications may not be approved. In addition, effective intellectual property protection may not be available in every country in which we operate or intend to operate our business. In any or all of these cases, we may be required to expend significant time and expense in order to prevent infringement or to enforce our rights. Although we have generally taken measures to protect our proprietary rights, there can be no assurance that others will not offer products or concepts that are substantially similar to ours and compete with our business. In addition, we regularly contribute software source code under open source licenses and have made other technology we developed available under other open licenses, and we include open source software in our products. For example, we have contributed certain specifications and designs related to our data center equipment to the Open Compute Project Foundation, a non-profit entity that shares and develops such information with the technology community, under the Open Web Foundation License. As a result of our open source contributions and the use of open source in our products, we may license or be required to license or disclose code and/or innovations that turn out to be material to our business and may also be exposed to increased litigation risk. If the protection of our proprietary rights is inadequate to prevent unauthorized use or appropriation by third parties, the value of our brandbrands and other intangible assets may be diminished and competitors may be able to more effectively mimic our serviceproducts, services, and methods of operations. Any of these events could have an adverse effect on our business and financial results.
We are currently, and expect to be in the future, party to patent lawsuits and other intellectual property rights claims that are expensive and time consuming, and, if resolved adversely, could have a significant impact on our business, financial condition, or results of operations.
Companies in the Internet, technology, and media industries own large numbers of patents, copyrights, trademarks, and trade secrets, and frequently enter into litigation based on allegations of infringement, misappropriation, or other violations of intellectual property or other rights. In addition, various "non-practicing entities" that own patents and other intellectual property rights often attempt to aggressively assert their rights in order to extract value from technology companies. Furthermore, from time to time we may introduce or acquire new products, including in areas where we historically have not competed, which could increase our exposure to patent and other intellectual property claims from competitors and non-practicing entities.
From time to time, we receive notice letters from patent holders alleging that certain of our products and services infringe their patent rights. We presently are involved in a number of intellectual property lawsuits, and as we face increasing competition and gain an increasingly high profile, we expect the number of patent and other intellectual property claims against us to grow. Defending patent and other intellectual property litigation is costly and can impose a significant burden on management and employees, and there can be no assurances that favorable final outcomes will be obtained in all cases. In addition, plaintiffs may seek, and we may become subject to, preliminary or provisional rulings in the course of any such litigation, including potential preliminary injunctions requiring us to cease some or all of our operations. We may decide to settle such lawsuits and disputes on terms that are unfavorable to us. Similarly, if any litigation to which we are a party is resolved adversely, we may be subject to an unfavorable judgment that may not be reversed upon appeal. The terms of such a settlement or judgment may require us to cease some or all of our operations or pay substantial amounts to the other party. In addition, we may have to seek a license to continue practices found to be in violation of a third party's rights, which may not be available on reasonable terms, or at all, and may significantly increase our operating costs and expenses. As a result, we may also be required to develop alternative non-infringing
technology or practices or discontinue the practices. The development of alternative non-infringing technology or practices could require significant effort and expense or may not be feasible. Our business, financial condition, and results of operations could be adversely affected as a result of an unfavorable resolution of the disputes and litigation referred to above.
We are involved in numerous class action lawsuits and other litigation matters that are expensive and time consuming, and, if resolved adversely, could harm our business, financial condition, or results of operations.
In addition to intellectual property claims, we are also involved in numerous other lawsuits, including putative class action lawsuits, brought by users and marketers, many of whomwhich claim statutory damages and/or seek significant changes to our business operations, and we anticipate that we will continue to be a target for numerous lawsuits in the future. Because Facebook has over a billion users, the plaintiffs in class action cases filed against us typically claim enormous monetary damages even if the alleged per-user harm is small or non-existent. In addition, following our acquisition of Oculus, we may be subject to additional class
action lawsuits based on product performance or other claims related to the use of consumer hardware and software, as well as virtual reality technology and products, which are new and unproven. Any negative outcome from any such lawsuits could result in payments of substantial monetary damages or fines, or undesirable changes to our products or business practices, and accordingly our business, financial condition, or results of operations could be materially and adversely affected. Although the results of such lawsuits and claims cannot be predicted with certainty, we do not believe that the final outcome of those matters relating to our products that we currently face will have a material adverse effect on our business, financial condition, or results of operations. In addition, we are currently the subject of stockholder class action suits in connection with our IPO. We believe these lawsuits are without merit and are vigorously defending these lawsuits.
There can be no assurances that a favorable final outcome will be obtained in all our cases, and defending any lawsuit is costly and can impose a significant burden on management and employees. Any litigation to which we are a party may result in an onerous or unfavorable judgment that may not be reversed upon appeal or in payments of substantial monetary damages or fines, or we may decide to settle lawsuits on similarly unfavorable terms, which could adversely affect our business, financial conditions, or results of operations.
We may incur liability as a result of information retrieved from or transmitted over the Internet or published using our products or as a result of claims related to our products.
We have faced, currently face, and will continue to face claims relating to information that is published or made available on our products. In particular, the nature of our business exposes us to claims related to defamation, intellectual property rights, rights of publicity and privacy, and personal injury torts. This risk is enhanced in certain jurisdictions outside the United States where our protection from liability for third-party actions may be unclear and where we may be less protected under local laws than we are in the United States. We could incur significant costs investigating and defending such claims and, if we are found liable, significant damages. If any of these events occur, our business and financial results could be adversely affected.
Our CEO has control over key decision making as a result of his control of a majority of our voting stock.
Mark Zuckerberg, our founder, Chairman, and CEO, is able to exercise voting rights with respect to a majority of the voting power of our outstanding capital stock and therefore has the ability to control the outcome of matters submitted to our stockholders for approval, including the election of directors and any merger, consolidation, or sale of all or substantially all of our assets. This concentrated control could delay, defer, or prevent a change of control, merger, consolidation, or sale of all or substantially all of our assets that our other stockholders support, or conversely this concentrated control could result in the consummation of such a transaction that our other stockholders do not support. This concentrated control could also discourage a potential investor from acquiring our Class A common stock due to the limited voting power of such stock relative to the Class B common stock and might harm the trading price of our Class A common stock. In addition, Mr. Zuckerberg has the ability to control the management and major strategic investments of our company as a result of his position as our CEO and his ability to control the election or replacement of our directors. In the event of his death, the shares of our capital stock that Mr. Zuckerberg owns will be transferred to the persons or entities that he designates. As a board member and officer, Mr. Zuckerberg owes a fiduciary duty to our stockholders and must act in good faith in a manner he reasonably believes to be in the best interests of our stockholders. As a stockholder, even a controlling stockholder, Mr. Zuckerberg is entitled to vote his shares, and shares over which he has voting control as governed by a result of voting agreements,agreement, in his own interests, which may not always be in the interests of our stockholders generally.
We plan to continue to make acquisitions, which could require significant management attention, disrupt our business, result in dilution to our stockholders, and adversely affectharm our financial condition andor results of operations.operations and may adversely affect the price of our common stock.
As part of our business strategy, we have made and intend to continue to make acquisitions to add specialized employees and complementary companies, products, or technologies. In some cases, these acquisitions may be substantial. For example, we completed our acquisitions of Oculus and WhatsApp in July and October 2014, respectively. Each of these companies is larger and more complex than any previous acquisitions we have made. Our ability to acquire and integrate such companies in a successful manner is unproven. In addition, we plan to make significant financial investments to support product development from these recent acquisitions, but we cannot assure you that these investments will be successful.
Any acquisitions we announce could be viewed negatively by users, marketers, developers, or investors. In addition, we may not successfully evaluate, integrate, or utilize the products, technology, operations, or personnel we acquire. The integration of acquisitions may require significant time and resources, and we may not manage these integrations successfully. In addition, we may discover liabilities or deficiencies that we did not identify in advance associated with the companies or assets we acquire. The effectiveness of our due diligence with respect to acquisitions, and our ability to evaluate the results of such due diligence, is dependent upon the accuracy and completeness of statements and disclosures made or actions taken by the companies we acquire or their representatives. We may also fail to accurately forecast the financial impact of an acquisition transaction, including tax and accounting charges. In the future, we may not be able to find suitable acquisition candidates, and we may not be able to complete acquisitions on favorable terms, if at all. IfIn some cases, the costs of such acquisitions may be substantial. For example, in 2014 we are not successfulpaid approximately $4.6 billion in identifyingcash and closing acquisitions, integrating acquired businesses, products, technologyissued 178 million shares of our Class A common stock in connection with our acquisition of WhatsApp, and we paid approximately $400 million in cash and issued 23 million shares of our Class B common stock in connection with our acquisition of Oculus. We also issued a substantial number of RSUs to help retain the employees of these companies. There is no assurance that we will receive a favorable return on investment for these or people, or identifying and addressing liabilities and financial impacts associated with acquisitions, our business, operating results, and financial condition could be adversely affected.other acquisitions.
We may also incur substantial costs in makingIn the future, acquisitions. Wewe may pay substantial amounts of cash or incur debt to pay for acquisitions, which could adversely affect our liquidity. The incurrence of indebtedness would also result in increased fixed obligations, increased interest expense, and could also include covenants or other restrictions that would impede our ability to manage our operations. Additionally, weWe may also issue equity securities to pay for acquisitions orand we regularly grant RSUs to retain the employees of the acquired company,companies, which could increase our expenses, adversely affect our financial results, and result in dilution to our stockholders. For example,In addition, any acquisitions we paid $4.59 billion in cash and issued 178 million sharesannounce could be viewed negatively by users, marketers, developers, or investors, which may adversely affect our business or the price of our Class A common stockstock.
We may also discover liabilities or deficiencies associated with the companies or assets we acquire that were not identified in connection withadvance, which may result in significant unanticipated costs. The effectiveness of our acquisitiondue diligence review and our ability to evaluate the results of WhatsApp,such due diligence are dependent upon the accuracy and completeness of statements and disclosures made or actions taken by the companies we also agreed to issue 46 million RSUs to help retain WhatsApp employees.acquire or their representatives, as well as the limited amount of time in which acquisitions are executed. In addition, acquisitionswe may fail to accurately forecast the financial impact of an acquisition transaction, including tax and accounting charges. Acquisitions may also result in our recording of significant additional expenses to our results of operations and recording of substantial finite-lived intangible assets on our balance sheet upon closing, which can be significant in connection with larger acquisitions such as WhatsApp and could adversely affect our future financial results and financial condition. Theseclosing. Any of these factors related to acquisitions may require significant management attention, disrupt our business, result in dilution to our stockholders, and adversely affect our financial condition or results of operations.
We may not be able to successfully integrate our acquisitions, and financial condition.we may incur significant costs to integrate and support the companies we acquire.
The integration of acquisitions requires significant time and resources, and we may not manage these processes successfully. Our ability to successfully integrate complex acquisitions is unproven, particularly with respect to companies that have significant operations or that develop products where we do not have prior experience. For example, Oculus and WhatsApp are larger and more complex than previous companies we have acquired. In particular, Oculus builds technology and products that are new to Facebook, and accordingly we did not have significant experience or structure in place to support this business prior to the acquisition. We plan to make substantial investments of resources to support these acquisitions, which will result in significant ongoing operating expenses and may divert resources and management attention from other areas of our business. We cannot assure you that these investments will be successful. If we fail to successfully integrate the companies we acquire, we may not realize the benefits expected from the transaction and our business may be harmed.
If our goodwill or finite-lived intangible assets become impaired, we may be required to record a significant charge to earnings.
We review our finite-lived intangible assets for impairment when events or changes in circumstances indicate the carrying value may not be recoverable, such as a decline in stock price and market capitalization. We test goodwill for impairment at least annually. If such goodwill or finite-lived intangible assets are deemed to be impaired, an impairment loss equal to the amount by which the carrying amount exceeds the fair value of the assets would be recognized. We may be required to record a significant charge in our financial statements during the period in which any impairment of our goodwill or finite-lived intangible assets is determined, which would negatively affect our results of operations.
Our business is dependent on our ability to maintain and scale our technical infrastructure, and any significant disruption in our service could damage our reputation, result in a potential loss of users and engagement, and adversely affect our financial results.
Our reputation and ability to attract, retain, and serve our users is dependent upon the reliable performance of our products and our underlying technical infrastructure. Our systems may not be adequately designed with the necessary reliability and redundancy to avoid performance delays or outages that could be harmful to our business. If Facebook isour products are unavailable when users attempt to access it,them, or if it doesthey do not load as quickly as they expect,expected, users may not use our products as often in the future, or at all. As our user base and engagement continue to grow, and the amount and types of information shared on Facebook and our other products continue to grow and evolve, such as increased engagement with video, we will need an increasing amount of technical infrastructure, including network capacity and computing power, to continue to satisfy the needs of our users. It is possible that we may fail to effectively scale and grow our technical infrastructure to accommodate these increased demands. In addition, our business may be subject to interruptions, delays, or failures resulting from earthquakes, adverse weather conditions, other natural disasters, power loss, terrorism, or other catastrophic events. If such an event were to occur, users may be subject to service disruptions or outages and we may not be able to recover our technical infrastructure and user data in a timely manner to restart or provide our services, which may adversely affect our financial results.
A substantial portion of our network infrastructure is provided by third parties. Any disruption or failure in the services we receive from these providers could harm our ability to handle existing or increased traffic and could significantly harm our business. Any financial or other difficulties these providers face may adversely affect our business, and we exercise little control over these providers, which increases our vulnerability to problems with the services they provide.
We could experience unforeseen difficulties in building and operating key portions of our technical infrastructure.
We have designed and built our own data centers and key portions of our technical infrastructure through which we serve our products, and we plan to continue to significantly expand the size of our infrastructure primarily through data centers and other projects. The infrastructure expansion we are undertaking is complex, and unanticipated delays in the completion of these projects or availability of components may lead to increased project costs, operational inefficiencies, or interruptions in the delivery or degradation of the quality of our products. In addition, there may be issues related to this infrastructure that are not identified during the testing phases of design and implementation, which may only become evident after we have started to fully utilize the underlying equipment, that could further degrade the user experience or increase our costs.
Our products and internal systems rely on software that is highly technical, and if it contains undetected errors, our business could be adversely affected.
Our products and internal systems rely on software, including software developed or maintained internally and/or by third parties, that is highly technical and complex. In addition, our products and internal systems depend on the ability of such software to store, retrieve, process, and manage immense amounts of data. The software on which we rely has contained, and may now or in the future contain, undetected errors, bugs, or vulnerabilities. Some errors may only be discovered after the code has been released for external or internal use. Errors or other design defects within the software on which we rely may result in a negative experience for users and marketers who use our products, delay product introductions or enhancements, result in measurement or billing errors, or compromise our ability to protect the data of our users and/or our intellectual property. Any errors, bugs, or defects
discovered in the software on which we rely could result in damage to our reputation, loss of users, loss of revenue, or liability for damages, any of which could adversely affect our business and financial results.
Certain of our user metrics are subject to inherent challenges in measurement, and real or perceived inaccuracies in such metrics may harm our reputation and negatively affect our business.
The numbers for our key metrics, which include our DAUs, mobile DAUs, MAUs, mobile MAUs, and average revenue per user (ARPU), as well as certain other metrics such as mobile-only DAUs and mobile-only MAUs, are calculated using internal company data based on the activity of user accounts. While these numbers are based on what we believe to be reasonable estimates of our user base for the applicable period of measurement, there are inherent challenges in measuring usage of our products across large online and mobile populations around the world.
For example, there may be individuals who maintain one or more Facebook accounts in violation of our terms of service. We estimate, for example, that "duplicate" accounts (an account that a user maintains in addition to his or her principal account) may have represented between approximately 4.3% and 7.9%less than 5% of our worldwide MAUs in 2013.2014. We also seek to identify "false" accounts, which we divide into two categories: (1) user-misclassified accounts, where users have created personal profiles for a business, organization, or non-human entity such as a pet (such entities are permitted on Facebook using a Page rather than a personal profile under our terms of service); and (2) undesirable accounts, which represent user profiles that we determine are intended to be used for purposes that violate our terms of service, such as spamming. In 2013,2014, for example, we estimate that such user-misclassified and undesirable
accounts may have represented between approximately 0.8% and 2.1% of our worldwide MAUs and undesirable accounts may have represented between approximately 0.4% and 1.2% ofless than 2% our worldwide MAUs. We believe the percentage of accounts that are duplicate or false is meaningfully lower in developed markets such as the United States or United Kingdom and higher in developing markets such as India and Turkey. However, these estimates are based on an internal review of a limited sample of accounts and we apply significant judgment in making this determination, such as identifying names that appear to be fake or other behavior that appears inauthentic to the reviewers. As such, our estimation of duplicate or false accounts may not accurately represent the actual number of such accounts. We are continually seeking to improve our ability to identify duplicate or false accounts and estimate the total number of such accounts, and such estimates may change due to improvements or changes in our methodology. Due to inherent variability in such estimates at particular dates of measurement, we disclose these estimates as a range over a recent period.
Our data limitations may affect our understanding of certain details of our business. For example, while user-provided data indicates a decline in usage among younger users, this age data is unreliable because a disproportionate number of our younger users register with an inaccurate age. Accordingly, our understanding of usage by age group may not be complete.
Some of our metrics have also been affected by applications on certain mobile devices that automatically contact our servers for regular updates with no user action involved, and this activity can cause our system to count the user associated with such a device as an active user on the day such contact occurs. For example, we estimate that less than 5% of our estimated worldwide DAUs as of December 31, 2011 resulted from this type of automatic mobile activity, and that this type of activity had a substantially smaller effect on our estimate of worldwide MAUs and mobile MAUs. The impact of this automatic activity on our metrics varied by geography because mobile usage varies in different regions of the world. In addition, our data regarding the geographic location of our users is estimated based on a number of factors, such as the user's IP address and self-disclosed location. These factors may not always accurately reflect the user's actual location. For example, a mobile-only user may appear to be accessing Facebook from the location of the proxy server that the user connects to rather than from the user's actual location. The methodologies used to measure user metrics may also be susceptible to algorithm or other technical errors. For example, in early June 2012, we discovered an error in the algorithm we use to estimate the geographic location of our users that affected our attribution of certain user locations for the period ended March 31, 2012. While this issue did not affect our overall worldwide DAU and MAU numbers, it did affect our attribution of users across different geographic regions. We estimate that the number of MAUs as of March 31, 2012 for the United States & Canada region was overstated as a result of the error by approximately 3% and this overstatement was offset by understatements in other regions. The number of such users for the period ended March 31, 2012 disclosed in "Management's Discussion and Analysis of Financial Condition and Results of Operations — Trends in Our User Metrics" reflects the reclassification to more correctly attribute users by geographic region. Our estimates for revenue by user location and revenue by user device are also affected by these factors.
We regularly review our processes for calculating these metrics, and from time to time we may discover inaccuracies in our metrics or make adjustments to improve their accuracy, including adjustments that may result in the recalculation of our historical metrics. We believe that any such inaccuracies or adjustments are immaterial unless otherwise stated. In addition, our DAU and MAU estimates will differ from estimates published by third parties due to differences in methodology. For example, some third parties are not able to accurately measure mobile users or do not count mobile users for certain user groups or at all in their analyses.
If marketers, developers, or investors do not perceive our user metrics to be accurate representations of our user base, or if we discover material inaccuracies in our user metrics, our reputation may be harmed and marketers and developers may be less willing to allocate their budgets or resources to Facebook, which could negatively affect our business and financial results.
We cannot assure you that we will effectively manage our growth.
Our employee headcount and the scope and complexity of our business have increased significantly, with the number of employees increasing to 8,34810,082 as of September 30, 2014March 31, 2015 from 5,7946,818 as of September 30, 2013,March 31, 2014, and we expect headcount growth to continue for the foreseeable future. The growth and expansion of our business and products create significant challenges for our management, operational, and financial resources, including managing multiple relations with users, marketers, developers, and other third parties. In the event of continued growth of our operations or in the number of our third-party relationships, our information technology systems or our internal controls and procedures may not be adequate to support our operations. In addition, some members of our management do not have significant experience managing a large global business operation, so our management may not be able to manage such growth effectively. To effectively manage our growth, we must continue to improve our operational, financial, and management processes and systems and to effectively expand, train, and manage our employee base. As our organization continues to grow, and we are required to implement more complex organizational management structures, we may find it increasingly difficult to maintain the benefits of our corporate culture, including our ability to quickly develop and launch new and innovative products. This could negatively affect our business performance.
The loss of one or more of our key personnel, or our failure to attract and retain other highly qualified personnel in the future, could harm our business.
We currently depend on the continued services and performance of our key personnel, including Mark Zuckerberg and Sheryl K. Sandberg. Although we have entered into employment agreements with Mr. Zuckerberg and Ms. Sandberg, the agreements have no specific duration and constitute at-will employment. In addition, many of our key technologies and systems are custom-made for our business by our personnel. The loss of key personnel, including members of management as well as key engineering, product development, marketing, and sales personnel, could disrupt our operations and have an adverse effect on our business.
As we continue to grow, we cannot guarantee we will continue to attract the personnel we need to maintain our competitive position. In particular, we intend to continue to hire a significant number of technical personnel in the foreseeable future, and we expect to face significant competition from other companies in hiring such personnel, particularly in the San Francisco Bay Area.Area, where our headquarters are located and where the cost of living is high. As we mature, the incentives to attract, retain, and motivate employees provided by our equity awards or by future arrangements may not be as effective as in the past, and if we issue significant
equity to attract additional employees, the ownership of our existing stockholders may be further diluted. Additionally, we have a number of current employees whose equity ownership in our company has provided them a substantial amount of personal wealth, which could affect their decisions about whether or not to continue to work for us. As a result of these factors, it may be difficult for us to continue to retain and motivate our employees. If we do not succeed in attracting, hiring, and integrating excellent personnel, or retaining and motivating existing personnel, we may be unable to grow effectively.
We may incur liabilitynot be able to continue to successfully grow usage of and engagement with mobile and web applications that integrate with Facebook.
We have made and are continuing to make investments to enable developers to build, grow, and monetize mobile and web applications that integrate with Facebook. Such existing and prospective developers may not be successful in building, growing, or monetizing mobile and/or web applications that create and maintain user engagement. Additionally, developers may choose to build on other platforms, including mobile platforms controlled by third parties, rather than building products that integrate with Facebook. We are continuously seeking to balance the distribution objectives of our developers with our desire to provide an optimal user experience, and we may not be successful in achieving a balance that continues to attract and retain such developers. For example, from time to time, we have taken actions to reduce the volume of communications from these developers to users on Facebook with the objective of enhancing the user experience, and such actions have reduced distribution from, user engagement with, and our monetization opportunities from, Facebook-integrated mobile and web applications. In some instances, these actions, as well as other actions to enforce our policies applicable to developers, have adversely affected our relationships with such developers. If we are not successful in our efforts to continue to grow the number of developers that choose to build products that integrate with Facebook or if we are unable to continue to build and maintain good relations with such developers, our user growth and user engagement and our financial results may be adversely affected.
We generate all of our Payments revenue from developers that use Facebook on personal computers, and we expect that our Payments revenue will decline in the future as usage of Facebook on personal computers continues to decline.
We currently generate all of our Payments revenue from developers that use Facebook on personal computers. Specifically, applications built by developers of social games are currently responsible for substantially all of our revenue derived from Payments, and the majority of the revenue from these applications has historically been generated by a limited number of the most popular games. We have experienced and expect to continue to see the continued decline in usage of Facebook on personal computers for the foreseeable future, which we expect will result in a decline in Payments revenue. In addition, a relatively small percentage of our users have transacted with Facebook Payments. If the Facebook-integrated applications fail to grow or maintain their users and engagement, whether as a result of information retrieved fromthe continued decline in the usage of Facebook on personal computers or transmitted over the Internet or posted to Facebook and claims related to our products.
We have faced, currently face, and willotherwise, if developers do not continue to face claims relating to informationintroduce new applications that is publishedattract users and create engagement on Facebook, or made available on Facebook. In particular, the natureif Facebook-integrated applications outside of social games do not gain popularity and generate significant revenue for us, our business exposes us to claims related to defamation, intellectual property rights, rights of publicity and privacy, and personal injury torts. This risk is enhanced in certain jurisdictions outside the United States where our protection from liability for third-party actions may be unclear and where we may be less protected under local laws than we are in the United States. We could incur significant costs investigating and defending such claims and, if we are found liable, significant damages. If any of these events occur, our business and financial resultsperformance could be adversely affected.
Computer malware, viruses, hacking and phishing attacks, and spamming could harm our business and results of operations.
Computer malware, viruses, and computer hacking and phishing attacks have become more prevalent in our industry, have occurred on our systems in the past, and may occur on our systems in the future. Because of our prominence, we believe that we are a particularly attractive target for such attacks. Though it is difficult to determine what, if any, harm may directly result from any specific interruption or attack, any failure to maintain performance, reliability, security, and availability of our products and technical infrastructure. Any such failure may harm our reputation, our ability to retain existing users and attract new users, and our results of operations.
In addition, spammers attempt to use our products to send targeted and untargeted spam messages to users, which may embarrass or annoy users and make Facebook less user-friendly. We cannot be certain that the technologies and employees that
we have to attempt to defeat spamming attacks will be able to curb spam messages from being sent on our platform. As a result of spamming activities, our users may use Facebook less or stop using our products altogether.
Payment transactions on Facebook may subject us to additional regulatory requirements and other risks that could be costly and difficult to comply with or that could harm our business.
Our users can use Facebook to purchase virtual and digital goods from developers that offer applications on the Facebook website using our Payments infrastructure. Our users can also use Messenger to send money to other users and use Facebook to make donations to certain charitable organizations. We are subject to a variety of laws and regulations in the United States, Europe, and elsewhere, including those governing anti-money laundering and counter-terrorist financing, money transmission, gift cards and other prepaid access instruments, electronic funds transfer, charitable fundraising, and import and export restrictions. Depending on how our Payments product evolves, we may also be subject to other laws and regulations including those governing electronic funds transfers, gambling, banking, and lending. In some jurisdictions, the application or interpretation of these laws and regulations is not clear. To increase flexibility in how our use of Payments may evolve and to mitigate regulatory uncertainty, we have received certain money transmitter licenses in the United States and are applying for certain regulatory licenses in Europe, which will generally require us to demonstrate compliance with many domestic and foreign laws in these areas. Our efforts to comply with these laws and regulations could be costly and result in diversion of management time and effort and may still not guarantee compliance. In the event that we are found to be in violation of any such legal or regulatory requirements, we may be subject to monetary fines or other penalties such as a cease and desist order, or we may be required to make product changes, any of which could have an adverse effect on our business and financial results.
In addition, we may be subject to a variety of additional risks as a result of Payments on Facebook, including:
increased costs and diversion of management time and effort and other resources to deal with bad transactions or customer disputes;
potential fraudulent or otherwise illegal activity by users, developers, employees, or third parties;
restrictions on the investment of consumer funds used to transact Payments; and
additional disclosure and reporting requirements.
We have significant international operations and plan to continue expanding our operations abroad where we have limited operating experience, and this may be subject us to increased business and economic risks that could affect our financial results.
We have significant international operations and plan to continue the international expansion of our business operations and the translation of our products. We currently make Facebook available in more than 7080 different languages, and we have offices or data centers in more than 25 different countries. We may enter new international markets where we have limited or no experience in marketing, selling, and deploying our products. Our products are generally available globally through the web and on mobile, but some or all of our products or functionality may not be available in certain markets due to legal and regulatory complexities. For example, Facebook is not generally available in China. If we fail to deploy or manage our operations in international markets successfully, our business may suffer. In addition, we are subject to a variety of risks inherent in doing business internationally, including:
political, social, or economic instability;
risks related to the legal and regulatory environment in foreign jurisdictions, including with respect to privacy, and tax, law enforcement, content, intellectual property, and terrestrial infrastructure matters, and unexpected changes in laws, regulatory requirements, and enforcement;matters;
potential damage to our brand and reputation due to compliance with local laws, including potential censorship or requirements to provide user information to local authorities;
fluctuations in currency exchange rates and compliance with currency controls;
foreign exchange controls that might prevent us from repatriating cash earned in countries outside the United States;
higher levels of credit risk and payment fraud;
enhanced difficulties of integrating any foreign acquisitions;
burdens of complying with a variety of foreign laws;
reduced protection for intellectual property rights in some countries;
difficulties in staffing and managing global operations and the increased travel, infrastructure, and legal compliance costs associated with multiple international locations;
compliance with the U.S. Foreign Corrupt Practices Act, the U.K. Bribery Act, and similar laws in other jurisdictions; and
compliance with statutory equity requirements and management of tax consequences.
If we are unable to expand internationally and manage the complexity of our global operations successfully, our financial results could be adversely affected.
We may incur a substantial amount of indebtedness, which could adversely affect our financial condition.
In August 2013, we entered into a five-year senior unsecured revolving credit facility under which we may borrow up to $6.5 billion to fund working capital and general corporate purposes. As of September 30, 2014,March 31, 2015, no amounts were outstanding under this facility. If we draw down on this facility in the future, our interest expense and principal repayment requirements will increase significantly, which could have an adverse effect on our financial results.
We may require additional capital to support our business growth, and this capital may not be available on acceptable terms, if at all.
We may require additional capital to support our business growth or to respond to business opportunities, challenges or unforeseen circumstances. Our ability to obtain additional capital, if and when required, will depend on our business plans, investor demand, our operating performance, the condition of the capital markets, and other factors. If we raise additional funds through the issuance of equity, equity-linked or debt securities, those securities may have rights, preferences, or privileges senior to the rights of our Class A common stock, and our existing stockholders may experience dilution. If we are unable to obtain additional capital when required, or are unable to obtain additional capital on satisfactory terms, our ability to continue to support our business growth or to respond to business opportunities, challenges, or unforeseen circumstances could be adversely affected, and our
business may be harmed.
If we default on our leasing and credit obligations, our operations may be interrupted and our business and financial results could be adversely affected.
We finance a significant portion of our expenditures through leasing arrangements, some of which are not required to be reflected on our balance sheet, and we may enter into additional similar arrangements in the future. In particular, we have used these types of arrangements to finance some of our equipment, offices, and data centers. In addition, we have a $6.5 billion revolving credit facility that we may draw upon to finance our operations or other corporate purposes. If we default on these leasing and credit obligations, our leasing partners and lenders may, among other things:
require repayment of any outstanding lease obligations or amounts drawn on our credit facility;
terminate our leasing arrangements and credit facilities;
terminate our access to the leased data centers and offices we utilize;
stop delivery of ordered equipment;
sell or require us to return our leased equipment; or
require us to pay significant damages.
If some or all of these events were to occur, our operations may be interrupted and our ability to fund our operations or obligations, as well as our business, financial results, and financial condition, could be adversely affected.
We may have exposure to greater than anticipated tax liabilities.
Our income tax obligations are based in part on our corporate operating structure and intercompany arrangements, including the manner in which we develop, value, and use our intellectual property and the valuations of our intercompany transactions. The tax laws applicable to our business, including the laws of the United States and other jurisdictions, are subject to interpretation and certain jurisdictions are aggressively interpreting their laws in new ways in an effort to raise additional tax proceedsrevenue from companies such as Facebook. The taxing authorities of the jurisdictions in which we operate may challenge our methodologies for valuing developed technology or intercompany arrangements, which could increase our worldwide effective tax rate and harm our financial position and results of operations. We are subject to regular review and audit by U.S. federal and state and foreign tax authorities. Tax authorities may disagree with certain positions we have taken and any adverse outcome of such a review or audit could have a negative effect on our financial position and results of operations. In addition, the determination of our worldwide provision for income taxes and other tax liabilities requires significant judgment by management, and there are many transactions
where the ultimate tax determination is uncertain. Although we believe that our estimates are reasonable, the ultimate tax outcome may differ from the amounts recorded in our financial statements and may materially affect our financial results in the period or periods for which such determination is made. In addition, our future income taxes could be adversely affected by earnings being lower than anticipated in jurisdictions that have lower statutory tax rates and higher than anticipated in jurisdictions that have higher statutory tax rates, by changes in the valuation of our deferred tax assets and liabilities, or by changes in tax laws, regulations, or accounting principles. For example, we have previously incurred losses in certain international subsidiaries that resulted in an effective tax rate that is significantly higher than the statutory tax rate in the United States and this could continue to happen in the future.
Changes in tax laws or tax rulings could materially affect our financial position and results of operations.
Changes in tax laws or tax rulings could materially affect our financial position and results of operations. For example, the current U.S. administration and key members of Congress have made public statements indicating that tax reform is a priority. Certain changes to U.S. tax laws, including limitations on the ability to defer U.S. taxation on earnings outside of the United States until those earnings are repatriated to the United States, could affect the tax treatment of our foreign earnings. In addition, many countries in the European Union, as well as a number of other countries and organizations such as the Organization for Economic Cooperation and Development, are actively considering changes to existing tax laws or have enacted new laws. Certain proposals couldor newly enacted laws include recommendationsprovisions that wouldcould significantly increase our tax obligations in many countries where we do business. Due to the large and expanding scale of our international business activities, any changes in the taxation of such activities may increase our worldwide effective tax rate and harm our financial position and results of operations.
Risks Related to Ownership of Our Class A Common Stock
The trading price of our Class A common stock has been and will likely continue to be volatile.
The trading price of our Class A common stock has been, and is likely to continue to be, volatile. Since shares of our Class A common stock were sold in our IPO in May 2012 at a price of $38.00 per share, our stock price has ranged from $17.55 to $79.71$86.07 through September 30, 2014.March 31, 2015. In addition to the factors discussed in this Quarterly Report on Form 10-Q, the trading price of our Class A common stock may fluctuate significantly in response to numerous factors, many of which are beyond our control, including:
actual or anticipated fluctuations in our revenue and other operating results;
the financial projections we may provide to the public, any changes in these projections or our failure to meet these projections;
actions of securities analysts who initiate or maintain coverage of us, changes in financial estimates by any securities analysts who follow our company, or our failure to meet these estimates or the expectations of investors;
additional shares of our Class A common stock being sold into the market by us, our existing stockholders, or in connection with acquisitions, including shares sold by our employees to cover tax liabilities in connection with RSU vesting events, or the anticipation of such sales;
investor sentiment with respect to our competitors, our business partners, and our industry in general;
announcements by us or our competitors of significant products or features, technical innovations, acquisitions, strategic partnerships, joint ventures, or capital commitments;
announcements by us or estimates by third parties of actual or anticipated changes in the size of our user base, the level of user engagement, or the effectiveness of our ad products;
changes in operating performance and stock market valuations of technology companies in our industry, including our developers and competitors;
price and volume fluctuations in the overall stock market, including as a result of trends in the economy as a whole;
the inclusion or deletion of our Class A common stock from any trading indices, such as the S&P 500 Index;
media coverage of our business and financial performance;
lawsuits threatened or filed against us;
developments in anticipated or new legislation and pending lawsuits or regulatory actions, including interim or final
rulings by tax, judicial, or regulatory bodies; and
other events or factors, including those resulting from war or incidents of terrorism, or responses to these events.
In addition, the stock markets have experienced extreme price and volume fluctuations that have affected and continue to affect the market prices of equity securities of many technology companies. Stock prices of many technology companies have fluctuated in a manner unrelated or disproportionate to the operating performance of those companies. We are currently subject to securities litigation in connection with our IPO. We may experience more such litigation following future periods of volatility. Any securities litigation could subject us to substantial costs, divert resources and the attention of management from our business, and adversely affect our business.
If securities or industry analysts publish inaccurate or unfavorable research about our business, our stock price could decline.
The trading market for our Class A common stock depends in part on the research and reports that securities or industry analysts publish about us or our business. If one or more of the analysts who cover us downgrade the rating of our Class A common stock or publish inaccurate or unfavorable research about our business, our Class A common stock price could decline.
We do not intend to pay dividends for the foreseeable future.
We have never declared or paid cash dividends on our capital stock. We currently intend to retain any future earnings to finance the operation and expansion of our business, and we do not expect to declare or pay any dividends in the foreseeable future. As a result, you may only receive a return on your investment in our Class A common stock if the trading price of our Class A common stock increases. In addition, our credit facility contains restrictions on our ability to pay dividends.
If we are unable to maintain effective internal control over financial reporting in the future, investors may lose confidence in the accuracy and completeness of our financial reports and the trading price of our Class A common stock may be negatively affected.
We are subject to Section 404 of the Sarbanes-Oxley Act (SOX), which requires us to maintain internal controls over financial reporting and to report any material weaknesses in such internal controls. We have consumed and will continue to consume management resources and incur expenses for SOX compliance on an ongoing basis. If we identify material weaknesses in our internal control over financial reporting, or if we are unable to comply with the requirements of Section 404 in a timely manner or assert that our internal control over financial reporting is effective, investors may lose confidence in the accuracy and completeness of our financial reports and the trading price of our Class A common stock could be negatively affected. We also could become subject to investigations by the stock exchange on which our securities are listed, the Securities and Exchange Commission (SEC), or other regulatory authorities, which could require additional financial and management resources.
The requirements of being a public company may strain our resources and divert management's attention.
We are subject to the reporting requirements of the Securities Exchange Act of 1934, as amended, the Dodd-Frank Act, the listing requirements of the NASDAQ Global Select Market, and other applicable securities rules and regulations. Compliance with these rules and regulations has increased and likely will continue to increase our legal and financial compliance costs, make some activities more difficult, time-consuming, or costly, and increase demand on our systems and resources. As a result, management's attention may be diverted from other business concerns, which could harm our business and operating results.
In addition, complying with public disclosure rules makes our business more visible, which we believe may result in threatened or actual litigation, including by competitors and other third parties. If such claims are successful, our business and operating results could be harmed, and even if the claims do not result in litigation or are resolved in our favor, these claims, and the time and resources necessary to resolve them, could divert the resources of our management and harm our business and operating results.
The dual class structure of our common stock and thea voting agreements amongagreement between certain stockholders have the effect of concentrating voting control with our CEO and certain other holders of our Class B common stock; this will limit or preclude your ability to influence corporate matters.
Our Class B common stock has ten votes per share, and our Class A common stock has one vote per share. Stockholders who hold shares of Class B common stock, including certain of our executive officers, employees, and directors and their affiliates, together hold a substantial majority of the voting power of our outstanding capital stock. Because of the ten-to-one voting ratio between our Class B and Class A common stock, the holders of our Class B common stock collectively control a majority of the combined voting power of our common stock and therefore are able to control all matters submitted to our stockholders for approval so long as the shares of Class B common stock represent at least 9.1% of all outstanding shares of our Class A and Class B common stock. This concentrated control will limit or preclude your ability to influence corporate matters for the foreseeable future.
Transfers by holders of Class B common stock will generally result in those shares converting to Class A common stock, subject to limited exceptions, such as certain transfers effected for estate planning or charitable purposes. The conversion of Class B common stock to Class A common stock will have the effect, over time, of increasing the relative voting power of those holders of Class B common stock who retain their shares in the long term. If, for example, Mr. Zuckerberg retains a significant portion of his holdings of Class B common stock for an extended period of time, he could, in the future, continue to control a majority of the combined voting power of our Class A common stock and Class B common stock.
We have elected to take advantage of the "controlled company" exemption to the corporate governance rules for NASDAQ-listed companies, which could make our Class A common stock less attractive to some investors or otherwise harm our stock price.
Because we qualify as a "controlled company" under the corporate governance rules for NASDAQ-listed companies, we are not required to have a majority of our board of directors be independent, nor are we required to have a compensation committee or an independent nominating function. In light of our status as a controlled company, our board of directors determined not to have an independent nominating function and chose to have the full board of directors be directly responsible for nominating members of our board, and in the future we could elect not to have a majority of our board of directors be independent or not to have a compensation committee. Accordingly, should the interests of our controlling stockholder differ from those of other stockholders, the other stockholders may not have the same protections afforded to stockholders of companies that are subject to all of the corporate governance rules for NASDAQ-listed companies. Our status as a controlled company could make our Class A common stock less attractive to some investors or otherwise harm our stock price.
Delaware law and provisions in our restated certificate of incorporation and bylaws could make a merger, tender offer, or proxy contest difficult, thereby depressing the trading price of our Class A common stock.
Our status as a Delaware corporation and the anti-takeover provisions of the Delaware General Corporation Law may discourage, delay, or prevent a change in control by prohibiting us from engaging in a business combination with an interested stockholder for a period of three years after the person becomes an interested stockholder, even if a change of control would be beneficial to our existing stockholders. In addition, our restated certificate of incorporation and bylaws contain provisions that may make the acquisition of our company more difficult, including the following:
until the first date on which the outstanding shares of our Class B common stock represent less than 35% of the combined voting power of our common stock, any transaction that would result in a change in control of our company requires the approval of a majority of our outstanding Class B common stock voting as a separate class;
we have a dual class common stock structure, which provides Mr. Zuckerberg with the ability to control the outcome of matters requiring stockholder approval, even if he owns significantly less than a majority of the shares of our outstanding Class A and Class B common stock;
when the outstanding shares of our Class B common stock represent less than a majority of the combined voting power of common stock, certain amendments to our restated certificate of incorporation or bylaws will require the approval of two-thirds of the combined vote of our then-outstanding shares of Class A and Class B common stock;
when the outstanding shares of our Class B common stock represent less than a majority of the combined voting power of our common stock, vacancies on our board of directors will be able to be filled only by our board of directors and not by stockholders;
when the outstanding shares of our Class B common stock represent less than a majority of the combined voting power of our common stock, our board of directors will be classified into three classes of directors with staggered three-year terms and directors will only be able to be removed from office for cause;
when the outstanding shares of our Class B common stock represent less than a majority of the combined voting power of our common stock, our stockholders will only be able to take action at a meeting of stockholders and not by written consent;
only our chairman, our chief executive officer, our president, or a majority of our board of directors are authorized to call a special meeting of stockholders;
advance notice procedures apply for stockholders to nominate candidates for election as directors or to bring matters before an annual meeting of stockholders;
our restated certificate of incorporation authorizes undesignated preferred stock, the terms of which may be established, and shares of which may be issued, without stockholder approval; and
certain litigation against us can only be brought in Delaware.
| |
| Item 2. | Unregistered Sales of Equity Securities and Use of Proceeds. |
| |
a) | a) Sales of Unregistered Securities |
On July 21, 2014, we issued 23,071,365sharesNone.
c) Issuer Purchases of our Class B common stock as consideration to 14 individuals and 13 entities in connection with our acquisition of all the outstanding shares of a company. The sales of these securities were exempt from registration under theEquity Securities Act in reliance upon Section 3(a)(10) of the Securities Act.
| |
b) | Issuer Purchases of Equity Securities The table below provides information with respect to repurchases of unvested shares of our Class A common stock.
|
|
| | | | | | | | | |
| Period | Total Number of Shares Purchased (1) | Weighted Average Price Paid per Share | Total Number of Shares Purchased as Part of Publicly Announced Plans or Programs | Maximum Number of Shares that May Yet Be Purchased Under the Plans or Programs |
| July 1 – July 31, 2014 | — |
| — |
| — |
| — |
|
| August 1 – August 31, 2014 | 70,484 |
| $ | 0.000006 |
| — |
| — |
|
| September 1 – September 30, 2014 | — |
| — |
| — |
| — |
|
(1) Unvested shares are subject to a right of repurchase by us in the event the recipient of such unvested acquisition shares is no longer employed by us. All shares in the above table were shares repurchased as a result of us exercising this right and not pursuant to a publicly announced plan or program.
None.
|
| | | | | | | | | | | | | |
| Exhibit | | | | Incorporated by Reference | | Filed Herewith |
| Number | | Exhibit Description | | Form | | File No. | | Exhibit | | Filing Date | |
| | | | | | | |
| 2.1 | | Agreement and Plan of Merger and Reorganization, dated as of February 19, 2014, among the Registrant, Rhodium Acquisition Sub II, Inc., Rhodium Merger Sub, Inc., WhatsApp Inc., and Fortis Advisors LLC. | | 10-Q | | 001-35551 | | 2.1 |
| | April 25, 2014 | | |
| 2.2 | | Amended and Restated Agreement and Plan of Merger, dated as of April 21, 2014, among the Registrant, Inception Acquisition Sub, Inc., Inception Acquisition Sub II, LLC, Oculus VR, Inc., and Shareholder Representative Services LLC. | | 10-Q | | 001-35551 | | 2.2 |
| | April 25, 2014 | | |
| 4.1 | | Registration Rights Agreement, dated as of October 6, 2014, among the Registrant and the parties thereto. | | S-3 | | 333-199678 | | 4.9 |
| | October 29, 2014 | | |
| 10.1 | | Offer Letter, dated as of October 6, 2014, between Registrant and Jan Koum. | | | | | | | | | | X |
| 10.2 | | Form of Non-Plan Restricted Stock Unit Award Notice and Award Agreement | | S-8 | | 333-199172 | | 99.1 |
| | October 6, 2014 | | |
| 31.1 | | Certification of Mark Zuckerberg, Chief Executive Officer, pursuant to Rule 13a-14(a)/15d-14(a), as adopted pursuant to Section 302 of the Sarbanes-Oxley Act of 2002. | | | | | | | | | | X |
| | | | | | | |
| 31.2 | | Certification of David M. Wehner, Chief Financial Officer, pursuant to Rule 13a-14(a)/15d-14(a), as adopted pursuant to Section 302 of the Sarbanes-Oxley Act of 2002. | | | | | | | | | | X |
| | | | | | | |
| 32.1# | | Certification of Mark Zuckerberg, Chief Executive Officer, pursuant to 18 U.S.C. Section 1350, as adopted pursuant to Section 906 of the Sarbanes-Oxley Act of 2002. | | | | | | | | | | X |
| | | | | | | |
| 32.2# | | Certification of David M. Wehner, Chief Financial Officer, pursuant to 18 U.S.C. Section 1350, as adopted pursuant to Section 906 of the Sarbanes-Oxley Act of 2002. | | | | | | | | | | X |
| | | | | | | |
| 101.INS | | XBRL Instance Document. | | | | | | | | | | X |
| | | | | | | |
| 101.SCH | | XBRL Taxonomy Extension Schema Document. | | | | | | | | | | X |
| | | | | | | |
| 101.CAL | | XBRL Taxonomy Extension Calculation Linkbase Document. | | | | | | | | | | X |
| | | | | | | |
| 101.DEF | | XBRL Taxonomy Extension Definition Linkbase Document. | | | | | | | | | | X |
| | | | | | | |
| 101.LAB | | XBRL Taxonomy Extension Labels Linkbase Document. | | | | | | | | | | X |
| | | | | | | |
| 101.PRE | | XBRL Taxonomy Extension Presentation Linkbase Document. | | | | | | | | | | X |
|
| | | | | | | | | | | | |
| Exhibit | | | | Incorporated by Reference | | Filed Herewith |
| Number | | Exhibit Description | | Form | | File No. | | Exhibit | | Filing Date | |
| | | | | | |
| 31.1 | | Certification of Mark Zuckerberg, Chief Executive Officer, pursuant to Rule 13a-14(a)/15d-14(a), as adopted pursuant to Section 302 of the Sarbanes-Oxley Act of 2002. | | | | | | | | | | X |
| | | | | | |
| 31.2 | | Certification of David M. Wehner, Chief Financial Officer, pursuant to Rule 13a-14(a)/15d-14(a), as adopted pursuant to Section 302 of the Sarbanes-Oxley Act of 2002. | | | | | | | | | | X |
| | | | | | |
| 32.1# | | Certification of Mark Zuckerberg, Chief Executive Officer, pursuant to 18 U.S.C. Section 1350, as adopted pursuant to Section 906 of the Sarbanes-Oxley Act of 2002. | | | | | | | | | | X |
| | | | | | |
| 32.2# | | Certification of David M. Wehner, Chief Financial Officer, pursuant to 18 U.S.C. Section 1350, as adopted pursuant to Section 906 of the Sarbanes-Oxley Act of 2002. | | | | | | | | | | X |
| | | | | | |
| 101.INS | | XBRL Instance Document. | | | | | | | | | | X |
| | | | | | |
| 101.SCH | | XBRL Taxonomy Extension Schema Document. | | | | | | | | | | X |
| | | | | | |
| 101.CAL | | XBRL Taxonomy Extension Calculation Linkbase Document. | | | | | | | | | | X |
| | | | | | |
| 101.DEF | | XBRL Taxonomy Extension Definition Linkbase Document. | | | | | | | | | | X |
| | | | | | |
| 101.LAB | | XBRL Taxonomy Extension Labels Linkbase Document. | | | | | | | | | | X |
| | | | | | |
| 101.PRE | | XBRL Taxonomy Extension Presentation Linkbase Document. | | | | | | | | | | X |
# This certification is deemed not filed for purposes of Section 18 of the Securities Exchange Act of 1934, as amended (Exchange Act), or otherwise subject to the liability of that section, nor shall it be deemed incorporated by reference into any filing under the Securities Act of 1933, as amended (Securities Act), or the Exchange Act.
SIGNATURES
Pursuant to the requirements of the Securities Exchange Act of 1934, the Registrant has duly caused this Quarterly Report on Form 10-Q to be signed on its behalf by the undersigned, thereunto duly authorized, in the City of Menlo Park, State of California, on this 30th23rd day of October 2014.April 2015.
|
| | |
| | | FACEBOOK, INC. |
| | |
Date: October 30, 2014April 23, 2015 | | /s/ DAVID M. WEHNER |
| | | David M. Wehner Chief Financial Officer (Principal Financial Officer) |
| | |
Date: October 30, 2014April 23, 2015 | | /s/ JAS ATHWAL |
| | | Jas Athwal Chief Accounting Officer (Principal Accounting Officer) |