UNITED STATES
SECURITIES AND EXCHANGE COMMISSION
Washington, D.C. 20549
____________________________________________
FORM 10-Q
____________________________________________
(Mark One)
x QUARTERLY REPORT PURSUANT TO SECTION 13 OR 15(d) OF THE SECURITIES EXCHANGE ACT OF 1934
For the quarterly period ended June 30, 2017March 31, 2018
or
o TRANSITION REPORT PURSUANT TO SECTION 13 OR 15(d) OF THE SECURITIES EXCHANGE ACT OF 1934
For the transition period from to
Commission File Number: 001-35551
____________________________________________
FACEBOOK, INC.
(Exact name of registrant as specified in its charter)
____________________________________________
|
| |
| Delaware | 20-1665019 |
| (State or other jurisdiction of incorporation or organization) | (I.R.S. Employer Identification Number) |
1601 Willow Road, Menlo Park, California 94025
(Address of principal executive offices and Zip Code)
(650) 543-4800
(Registrant's telephone number, including area code)
____________________________________________
Indicate by check mark whether the registrant (1) has filed all reports required to be filed by Section 13 or 15(d) of the Securities Exchange Act of 1934 (Exchange Act) during the preceding 12 months (or for such shorter period that the registrant was required to file such reports), and (2) has been subject to such filing requirements for the past 90 days. Yes x No ¨��
Indicate by check mark whether the registrant has submitted electronically and posted on its corporate Web site, if any, every Interactive Data File required to be submitted and posted pursuant to Rule 405 of Regulation S-T during the preceding 12 months (or for such shorter period that the registrant was required to submit and post such files). Yes x No ¨
Indicate by check mark whether the registrant is a large accelerated filer, an accelerated filer, a non-accelerated filer, smaller reporting company, or an emerging growth company. See definition of "large accelerated filer," "accelerated filer," "smaller reporting company," and "emerging growth company" in Rule 12b-2 of the Exchange Act. (Check one):
|
| | | | | |
| Large accelerated filer | | x | Accelerated filer | | ¨ |
| | | | | |
| Non-accelerated filer | | ¨ (Do not check if a smaller reporting company) | Smaller reporting company | | ¨ |
| | | | | | |
| | | | Emerging growth company | | ¨
|
| | | | | | |
| If an emerging growth company, indicate by check mark if the registrant has elected not to use the extended transition period for complying with any new or revised financial accounting standards provided pursuant to Section 13(a) of the Exchange Act. | | ¨
|
Indicate the number of shares outstanding of each of the issuer's classes of Common Stock, as of the latest practicable date.
|
| |
| Class | Number of Shares Outstanding |
| Class A Common Stock $0.000006 par value | 2,370,333,0982,398,606,201 shares outstanding as of July 24, 2017April 23, 2018 |
| Class B Common Stock $0.000006 par value | 533,863,486496,021,547 shares outstanding as of July 24, 2017April 23, 2018 |
FACEBOOK, INC.
TABLE OF CONTENTS
|
| | |
| | | Page No. |
| | |
| |
| | |
| |
| | |
| |
| | | |
| Item 1. | | |
| | | |
| | | |
| | | |
| | | |
| | | |
| | | |
| | | |
| | | |
| | | |
| | | |
| | | |
| Item 2. | | |
| | | |
| Item 3. | | |
| | | |
| Item 4. | | |
| | |
| |
| | | |
| Item 1. | | |
| | | |
| Item 1A. | | |
| | | |
| Item 2. | | |
| | | |
| Item 6. | | |
| | |
| |
NOTE ABOUT FORWARD-LOOKING STATEMENTS
This Quarterly Report on Form 10-Q contains forward-looking statements within the meaning of the Private Securities Litigation Reform Act of 1995. All statements contained in this Quarterly Report on Form 10-Q other than statements of historical fact, including statements regarding our future results of operations and financial position, our business strategy and plans, and our objectives for future operations, are forward-looking statements. The words "believe," "may," "will," "estimate," "continue," "anticipate," "intend," "expect," and similar expressions are intended to identify forward-looking statements. We have based these forward-looking statements largely on our current expectations and projections about future events and trends that we believe may affect our financial condition, results of operations, business strategy, short-term and long-term business operations and objectives, and financial needs. These forward-looking statements are subject to a number of risks, uncertainties and assumptions, including those described in Part II, Item 1A, "Risk Factors" in this Quarterly Report on Form 10-Q. Moreover, we operate in a very competitive and rapidly changing environment. New risks emerge from time to time. It is not possible for our management to predict all risks, nor can we assess the impact of all factors on our business or the extent to which any factor, or combination of factors, may cause actual results to differ materially from those contained in any forward-looking statements we may make. In light of these risks, uncertainties and assumptions, the future events and trends discussed in this Quarterly Report on Form 10-Q may not occur and actual results could differ materially and adversely from those anticipated or implied in the forward-looking statements.
We undertake no obligation to revise or publicly release the results of any revision to these forward-looking statements, except as required by law. Given these risks and uncertainties, readers are cautioned not to place undue reliance on such forward-looking statements.
Unless expressly indicated or the context requires otherwise, the terms "Facebook," "company," "we," "us," and "our" in this document refer to Facebook, Inc., a Delaware corporation, and, where appropriate, its wholly owned subsidiaries. The term "Facebook" may also refer to our products, regardless of the manner in which they are accessed. For references to accessing Facebook on the "web" or via a "website," such terms refer to accessing Facebook on personal computers. For references to accessing Facebook on "mobile," such term refers to accessing Facebook via a mobile application or via a mobile-optimized version of our website such as m.facebook.com, whether on a mobile phone or tablet.
LIMITATIONS OF KEY METRICS AND OTHER DATA
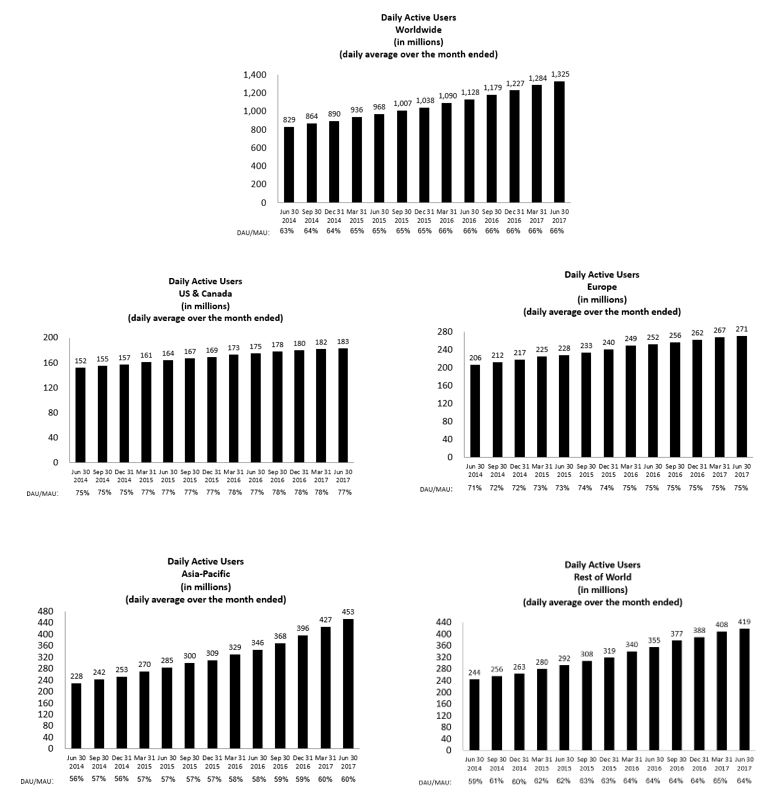
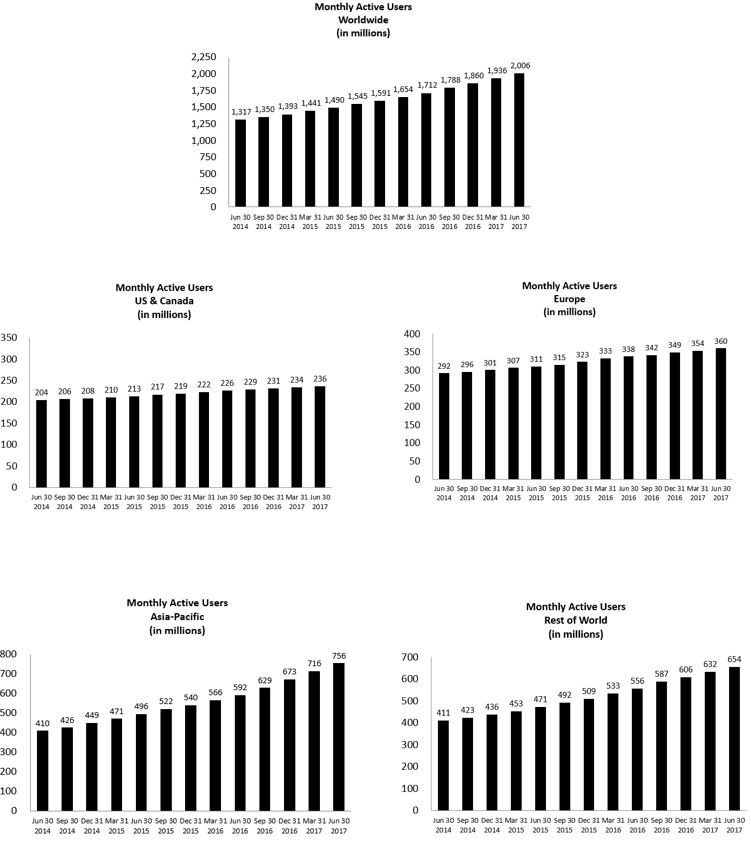
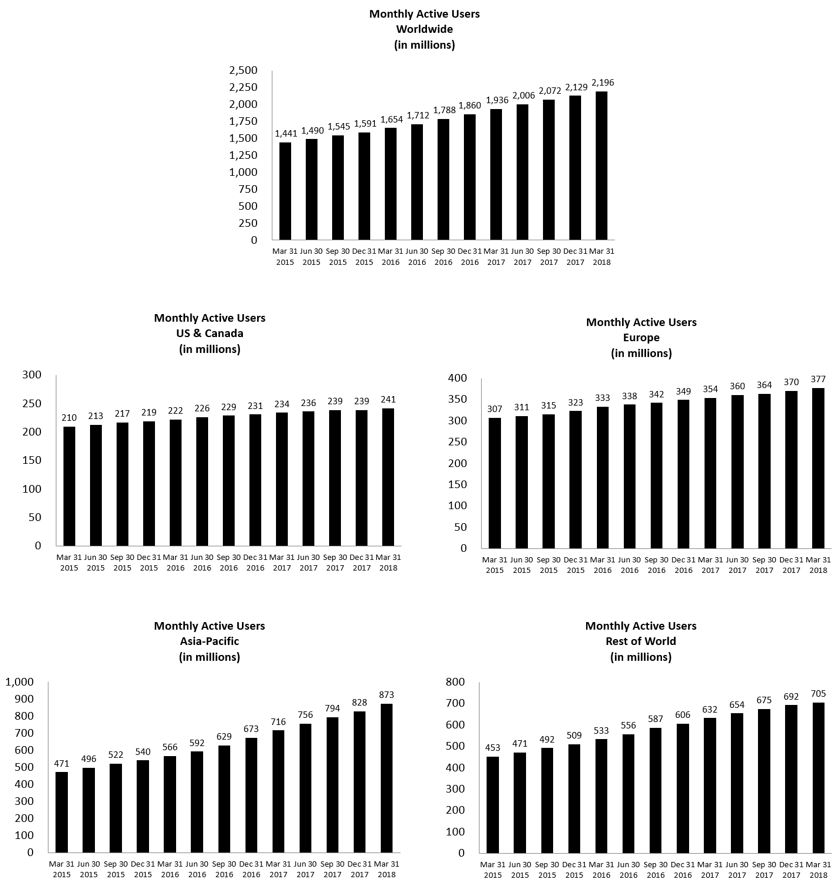
The numbers for our key metrics, which include our daily active users (DAUs), monthly active users (MAUs), and average revenue per user (ARPU), are calculated using internal company data based on the activity of user accounts. While these numbers are based on what we believe to be reasonable estimates of our user base for the applicable period of measurement, there are inherent challenges in measuring usage of our products across large online and mobile populations around the world. In addition, we are continually seeking to improve our estimates of our user base, and such estimates may change due to improvements or changes in our methodology. In 2016, we
We regularly evaluate these metrics to estimate thatthe number of "duplicate" and "false" accounts (anamong our MAUs. A duplicate account is one that a user maintains in addition to his or her principal account) may have represented approximately 6% of our worldwide MAUs.account. We also seek to identifydivide "false" accounts which we divide into two categories: (1) user-misclassified accounts, where users have created personal profiles for a business, organization, or non-human entity such as a pet (such entities are permitted on Facebook using a Page rather than a personal profile under our terms of service); and (2) undesirable accounts, which represent user profiles that we determine are intended to be used for purposes that violate our terms of service, such as spamming. In 2016, for example, we estimate user-misclassifiedThe estimates of duplicate and undesirablefalse accounts may have represented approximately 1% of our worldwide MAUs. However, these estimates are based on an internal review of a limited sample of accounts, and we apply significant judgment in making this determination,determination. For example, to identify duplicate accounts we use data signals such as identifyingsimilar IP addresses or user names, and to identify false accounts we look for names that appear to be fake or other behavior that appears inauthentic to the reviewers. Our estimates may change as our methodologies evolve, including through the application of new data signals or technologies, which may allow us to identify previously undetected falseduplicate or duplicatefalse accounts and may improve our ability to evaluate a broader population of our users. AsDuplicate and false accounts are very difficult to measure at our scale, and it is possible that the actual number of duplicate and false accounts may vary significantly from our estimates.
In the fourth quarter of 2017, we estimate that duplicate accounts may have represented approximately 10% of our worldwide MAUs. We believe the percentage of duplicate accounts is meaningfully higher in developing markets such as India, Indonesia, and the Philippines, as compared to more developed markets. In the fourth quarter of 2017, we estimate that false accounts may have represented approximately 3-4% of our worldwide MAUs. Our estimation of false accounts can vary as a result of episodic spikes in the creation of such accounts, which we have seen originate more frequently in specific countries such as Indonesia, Turkey, and Vietnam. From time to time, we may make product changes or take other actions to reduce the number of duplicate or false accounts among our users, which may not accurately represent the actual number of such accounts. also reduce our DAU and MAU estimates in a particular period.
Our data limitations may affect our understanding of certain details of our business. For example, while user-provided data indicates a decline in usage among younger users, this age data is unreliable because a disproportionate number of our younger users register with an inaccurate age. Accordingly, our understanding of usage by age group may not be complete.
In addition, our data regarding the geographic location of our users is estimated based on a number of factors, such as the user's IP address and self-disclosed location. These factors may not always accurately reflect the user's actual location. For example, a user may appear to be accessing Facebook from the location of the proxy server that the user connects to rather than from the user's actual location. The methodologies used to measure user metrics may also be susceptible to algorithm or other technical errors. Our estimates for revenue by user location and revenue by user device are also affected by these factors. For example, in late 2015, we discovered an error in the algorithm we used to attribute our revenue by user geography. While this issue did not affect our overall worldwide revenue, it did affect our attribution of revenue to different geographic regions. The fourth quarter of 2015 revenue by user geography and ARPU amounts were adjusted to reflect this reclassification.
We regularly review our processes for calculating these metrics, and from time to time we may discover inaccuracies in our metrics or make adjustments to improve their accuracy, including adjustments that may result in the recalculation of our historical metrics. We believe that any such inaccuracies or adjustments are immaterial unless otherwise stated. We intend to disclose our estimates of the number of duplicate and false accounts among our MAUs on an annual basis. In addition, our DAU and MAU estimates will differ from estimates published by third parties due to differences in methodology.
The numbers of DAUs and MAUs discussed in this Quarterly Report on Form 10-Q, as well as ARPU, do not include Instagram, WhatsApp, or Oculus users unless they would otherwise qualify as such users, respectively, based on their other activities on Facebook. In addition, other user engagement metrics included herein do not include Instagram, WhatsApp, or Oculus unless otherwise specifically stated.
PART I—FINANCIAL INFORMATION
| |
| Item 1. | Financial Statements |
FACEBOOK, INC.
CONDENSED CONSOLIDATED BALANCE SHEETS
(In millions, except for number of shares and par value)
(Unaudited)
| | | | June 30,
2017 | | December 31,
2016 | March 31,
2018 | | December 31,
2017 |
| Assets | | | | | | |
| Current assets: | | | | | | |
| Cash and cash equivalents | $ | 6,252 |
| | $ | 8,903 |
| $ | 12,082 |
| | $ | 8,079 |
|
| Marketable securities | 29,200 |
| | 20,546 |
| 31,874 |
| | 33,632 |
|
| Accounts receivable, net of allowances for doubtful accounts of $90 and $94 as of June 30, 2017 and December 31, 2016, respectively | 3,897 |
| | 3,993 |
| |
| Accounts receivable, net of allowances of $204 and $189 as of March 31, 2018 and December 31, 2017, respectively | | 5,115 |
| | 5,832 |
|
| Prepaid expenses and other current assets | 1,455 |
| | 959 |
| 1,341 |
| | 1,020 |
|
| Total current assets | 40,804 |
| | 34,401 |
| 50,412 |
| | 48,563 |
|
| Property and equipment, net | 10,628 |
| | 8,591 |
| 16,211 |
| | 13,721 |
|
| Intangible assets, net | 2,186 |
| | 2,535 |
| 1,735 |
| | 1,884 |
|
| Goodwill | 18,129 |
| | 18,122 |
| 18,268 |
| | 18,221 |
|
| Other assets | 2,096 |
| | 1,312 |
| 2,319 |
| | 2,135 |
|
| Total assets | $ | 73,843 |
| | $ | 64,961 |
| $ | 88,945 |
| | $ | 84,524 |
|
| | | | | | | |
| Liabilities and stockholders' equity | | | | | | |
| Current liabilities: | | | | | | |
| Accounts payable | $ | 323 |
| | $ | 302 |
| $ | 593 |
| | $ | 380 |
|
| Partners payable | 278 |
| | 280 |
| 396 |
| | 390 |
|
| Accrued expenses and other current liabilities | 2,626 |
| | 2,203 |
| 4,003 |
| | 2,892 |
|
| Deferred revenue and deposits | 88 |
| | 90 |
| 94 |
| | 98 |
|
| Total current liabilities | 3,315 |
| | 2,875 |
| 5,086 |
| | 3,760 |
|
| Other liabilities | 4,047 |
| | 2,892 |
| 6,239 |
| | 6,417 |
|
| Total liabilities | 7,362 |
| | 5,767 |
| 11,325 |
| | 10,177 |
|
| Stockholders' equity: | | | | | | |
| Common stock, $0.000006 par value; 5,000 million Class A shares authorized, 2,371 million and 2,354 million shares issued and outstanding, including 2 million and 4 million outstanding shares subject to repurchase, as of June 30, 2017 and December 31, 2016, respectively; 4,141 million Class B shares authorized, 532 million and 538 million shares issued and outstanding, including 1 million and 2 million outstanding shares subject to repurchase, as of June 30, 2017 and December 31, 2016, respectively | — |
| | — |
| |
| Common stock, $0.000006 par value; 5,000 million Class A shares authorized, 2,404 million and 2,397 million shares issued and outstanding, as of March 31, 2018 and December 31, 2017, respectively; 4,141 million Class B shares authorized, 498 million and 509 million shares issued and outstanding, as of March 31, 2018 and December 31, 2017, respectively. | | — |
| | — |
|
| Additional paid-in capital | 39,291 |
| | 38,227 |
| 41,134 |
| | 40,584 |
|
| Accumulated other comprehensive loss | (370 | ) | | (703 | ) | (294 | ) | | (227 | ) |
| Retained earnings | 27,560 |
| | 21,670 |
| 36,780 |
| | 33,990 |
|
| Total stockholders' equity | 66,481 |
| | 59,194 |
| 77,620 |
| | 74,347 |
|
| Total liabilities and stockholders' equity | $ | 73,843 |
| | $ | 64,961 |
| $ | 88,945 |
| | $ | 84,524 |
|
FACEBOOK, INC.
CONDENSED CONSOLIDATED STATEMENTS OF INCOME
(In millions, except per share amounts)
| | | | Three Months Ended June 30, | | Six Months Ended June 30, | Three Months Ended March 31, |
| | 2017 | | 2016 | | 2017 | | 2016 | 2018 | | 2017 |
| Revenue | $ | 9,321 |
| | $ | 6,436 |
| | $ | 17,353 |
| | $ | 11,818 |
| $ | 11,966 |
| | $ | 8,032 |
|
| Costs and expenses: | | | | | | | | | | |
| Cost of revenue | 1,237 |
| | 917 |
| | 2,395 |
| | 1,755 |
| 1,927 |
| | 1,159 |
|
| Research and development | 1,919 |
| | 1,471 |
| | 3,753 |
| | 2,814 |
| 2,238 |
| | 1,834 |
|
| Marketing and sales | 1,124 |
| | 901 |
| | 2,181 |
| | 1,728 |
| 1,595 |
| | 1,057 |
|
| General and administrative | 640 |
| | 413 |
| | 1,295 |
| | 778 |
| 757 |
| | 655 |
|
| Total costs and expenses | 4,920 |
| | 3,702 |
| | 9,624 |
| | 7,075 |
| 6,517 |
| | 4,705 |
|
| Income from operations | 4,401 |
| | 2,734 |
| | 7,729 |
| | 4,743 |
| 5,449 |
| | 3,327 |
|
| Interest and other income, net | 87 |
| | 20 |
| | 168 |
| | 78 |
| 161 |
| | 81 |
|
| Income before provision for income taxes | 4,488 |
| | 2,754 |
| | 7,897 |
| | 4,821 |
| 5,610 |
| | 3,408 |
|
| Provision for income taxes | 594 |
| | 471 |
| | 938 |
| | 800 |
| 622 |
| | 344 |
|
| Net income | $ | 3,894 |
| | $ | 2,283 |
| | $ | 6,959 |
| | $ | 4,021 |
| $ | 4,988 |
| | $ | 3,064 |
|
| Less: Net income attributable to participating securities | 4 |
| | 7 |
| | 10 |
| | 13 |
| 1 |
| | 5 |
|
| Net income attributable to Class A and Class B common stockholders | $ | 3,890 |
| | $ | 2,276 |
| | $ | 6,949 |
| | $ | 4,008 |
| $ | 4,987 |
| | $ | 3,059 |
|
| Earnings per share attributable to Class A and Class B common stockholders: | | | | | | | | | | |
| Basic | $ | 1.34 |
| | $ | 0.80 |
| | $ | 2.40 |
| | $ | 1.41 |
| $ | 1.72 |
| | $ | 1.06 |
|
| Diluted | $ | 1.32 |
| | $ | 0.78 |
| | $ | 2.36 |
| | $ | 1.38 |
| $ | 1.69 |
| | $ | 1.04 |
|
| Weighted average shares used to compute earnings per share attributable to Class A and Class B common stockholders: | | | | | | | | | | |
| Basic | 2,900 |
| | 2,856 |
| | 2,895 |
| | 2,850 |
| 2,906 |
| | 2,891 |
|
| Diluted | 2,951 |
| | 2,921 |
| | 2,950 |
| | 2,912 |
| 2,945 |
| | 2,944 |
|
| Share-based compensation expense included in costs and expenses: | | | | | | | | | | |
| Cost of revenue | $ | 47 |
| | $ | 29 |
| | $ | 81 |
| | $ | 51 |
| $ | 56 |
| | $ | 34 |
|
| Research and development | 787 |
| | 631 |
| | 1,457 |
| | 1,217 |
| 718 |
| | 670 |
|
| Marketing and sales | 120 |
| | 95 |
| | 216 |
| | 177 |
| 109 |
| | 96 |
|
| General and administrative | 78 |
| | 62 |
| | 145 |
| | 118 |
| 72 |
| | 67 |
|
| Total share-based compensation expense | $ | 1,032 |
| | $ | 817 |
| | $ | 1,899 |
| | $ | 1,563 |
| $ | 955 |
| | $ | 867 |
|
See Accompanying Notes to Condensed Consolidated Financial Statements.
FACEBOOK, INC.
CONDENSED CONSOLIDATED STATEMENTS OF COMPREHENSIVE INCOME
(In millions)
| | | | Three Months Ended June 30, | | Six Months Ended June 30, | Three Months Ended March 31, |
| | 2017 | | 2016 | | 2017 | | 2016 | 2018 | | 2017 |
| Net income | $ | 3,894 |
| | $ | 2,283 |
| | $ | 6,959 |
| | $ | 4,021 |
| $ | 4,988 |
| | $ | 3,064 |
|
| Other comprehensive income (loss): | | | | | | | | | | |
| Change in foreign currency translation adjustment, net of tax | 246 |
| | (116 | ) | | 306 |
| | 20 |
| 94 |
| | 60 |
|
| Change in unrealized gain/loss on available-for-sale investments and other, net of tax | 10 |
| | 19 |
| | 27 |
| | 61 |
| (161 | ) | | 17 |
|
| Comprehensive income | $ | 4,150 |
| | $ | 2,186 |
| | $ | 7,292 |
| | $ | 4,102 |
| $ | 4,921 |
| | $ | 3,141 |
|
See Accompanying Notes to Condensed Consolidated Financial Statements.
FACEBOOK, INC.
CONDENSED CONSOLIDATED STATEMENTS OF CASH FLOWS
(In millions)
(Unaudited)
| | | | Six Months Ended June 30, | Three Months Ended March 31, |
| | 2017 | | 2016 | 2018 | | 2017 |
| Cash flows from operating activities | | | | | | |
| Net income | $ | 6,959 |
| | $ | 4,021 |
| $ | 4,988 |
| | $ | 3,064 |
|
| Adjustments to reconcile net income to net cash provided by operating activities: | | | | | | |
| Depreciation and amortization | 1,400 |
| | 1,137 |
| 949 |
| | 671 |
|
| Share-based compensation | 1,899 |
| | 1,563 |
| 955 |
| | 867 |
|
| Deferred income taxes | (58 | ) | | (178 | ) | (47 | ) | | (84 | ) |
| Other | 12 |
| | 19 |
| 8 |
| | 5 |
|
| Changes in assets and liabilities: | | | | | | |
| Accounts receivable | 223 |
| | (225 | ) | 788 |
| | 609 |
|
| Prepaid expenses and other current assets | (577 | ) | | (257 | ) | (365 | ) | | (365 | ) |
| Other assets | 82 |
| | 4 |
| 22 |
| | 31 |
|
| Accounts payable | (38 | ) | | (39 | ) | 1 |
| | (10 | ) |
| Partners payable | (10 | ) | | 14 |
| 2 |
| | (3 | ) |
| Accrued expenses and other current liabilities | 157 |
| | 414 |
| 707 |
| | 61 |
|
| Deferred revenue and deposits | (4 | ) | | 23 |
| (5 | ) | | (10 | ) |
| Other liabilities | 373 |
| | 646 |
| (143 | ) | | 222 |
|
| Net cash provided by operating activities | 10,418 |
| | 7,142 |
| 7,860 |
| | 5,058 |
|
| Cash flows from investing activities | | | | | | |
| Purchases of property and equipment | (2,715 | ) | | (2,127 | ) | (2,812 | ) | | (1,271 | ) |
| Purchases of marketable securities | (14,137 | ) | | (9,635 | ) | (4,022 | ) | | (6,992 | ) |
| Sales of marketable securities | 3,998 |
| | 4,158 |
| 4,330 |
| | 1,762 |
|
| Maturities of marketable securities | 1,498 |
| | 903 |
| 1,267 |
| | 599 |
|
| Acquisitions of businesses, net of cash acquired, and purchases of intangible assets | (8 | ) | | (20 | ) | (49 | ) | | — |
|
| Change in restricted cash and deposits | 33 |
| | 74 |
| |
| Other investing activities, net | | (1 | ) | | (18 | ) |
| Net cash used in investing activities | (11,331 | ) | | (6,647 | ) | (1,287 | ) | | (5,920 | ) |
| Cash flows from financing activities | | | | | | |
| Taxes paid related to net share settlement of equity awards | (1,495 | ) | | — |
| (832 | ) | | (771 | ) |
| Principal payments on capital lease and other financing obligations | — |
| | (312 | ) | |
| Repurchases of Class A common stock | (378 | ) | | — |
| (1,774 | ) | | (228 | ) |
| Other financing activities, net | 12 |
| | 6 |
| 3 |
| | 7 |
|
| Net cash used in financing activities | (1,861 | ) | | (306 | ) | (2,603 | ) | | (992 | ) |
| Effect of exchange rate changes on cash and cash equivalents | 123 |
| | 12 |
| |
| Net (decrease) increase in cash and cash equivalents | (2,651 | ) | | 201 |
| |
| Cash and cash equivalents at beginning of period | 8,903 |
| | 4,907 |
| |
| Cash and cash equivalents at end of period | $ | 6,252 |
| | $ | 5,108 |
| |
| Effect of exchange rate changes on cash, cash equivalents, and restricted cash | | 36 |
| | 28 |
|
| Net increase (decrease) in cash, cash equivalents, and restricted cash | | 4,006 |
| | (1,826 | ) |
| Cash, cash equivalents, and restricted cash at beginning of year | | 8,204 |
| | 9,109 |
|
| Cash, cash equivalents, and restricted cash at end of the period | | $ | 12,210 |
| | $ | 7,283 |
|
| | | | | |
| Reconciliation of cash, cash equivalents, and restricted cash to the condensed consolidated balance sheets | | | | |
| Cash and cash equivalents | | $ | 12,082 |
| | $ | 7,104 |
|
| Restricted cash, included in prepaid expenses and other current assets | | 14 |
| | 85 |
|
| Restricted cash, included in other assets | | 114 |
| | 94 |
|
| Total cash, cash equivalents, and restricted cash | | $ | 12,210 |
| | $ | 7,283 |
|
See Accompanying Notes to Condensed Consolidated Financial Statements.
FACEBOOK, INC.
CONDENSED CONSOLIDATED STATEMENTS OF CASH FLOWS
(In millions)
(Unaudited)
| | | | Six Months Ended June 30, | Three Months Ended March 31, |
| | 2017 | | 2016 | 2018 | | 2017 |
| Supplemental cash flow data | | | | | | |
| Cash paid during the period for: | | | | | | |
| Interest | $ | — |
| | $ | 11 |
| |
| Income taxes, net | $ | 1,359 |
| | $ | 407 |
| $ | 736 |
| | $ | 664 |
|
| Non-cash investing and financing activities: | | | | | | |
| Net change in accounts payable, accrued expenses and other current liabilities, and other liabilities related to property and equipment additions | $ | 157 |
| | $ | 89 |
| $ | 450 |
| | $ | (26 | ) |
| Change in unsettled repurchases of Class A common stock | $ | 30 |
| | $ | — |
| $ | 141 |
| | $ | — |
|
See Accompanying Notes to Condensed Consolidated Financial Statements.
FACEBOOK, INC.
NOTES TO CONDENSED CONSOLIDATED FINANCIAL STATEMENTS
(Unaudited)
| |
| Note 1. | Summary of Significant Accounting Policies |
Basis of Presentation
The accompanying unaudited condensed consolidated financial statements have been prepared in accordance with generally accepted accounting principles in the United States (GAAP) and applicable rules and regulations of the Securities and Exchange Commission regarding interim financial reporting. Certain information and note disclosures normally included in the financial statements prepared in accordance with GAAP have been condensed or omitted pursuant to such rules and regulations. As such, the information included in this quarterly report on Form 10-Q should be read in conjunction with the consolidated financial statements and accompanying notes included in our Annual Report on Form 10-K for the fiscal year ended December 31, 2016.2017.
The condensed consolidated balance sheet as of December 31, 20162017 included herein was derived from the audited financial statements as of that date, but does not include all disclosures including notes required by GAAP.
The condensed consolidated financial statements include the accounts of Facebook, Inc. and its wholly owned subsidiaries. All intercompany balances and transactions have been eliminated.
The accompanying condensed consolidated financial statements reflect all normal recurring adjustments necessary to present fairly the financial position, results of operations, and cash flows for the interim periods, but are not necessarily indicative of the results of operations to be anticipated for the full year ending December 31, 2017.
There have been no changes to our significant accounting policies described in our Annual Report on Form 10-K for the fiscal year ended December 31, 2016 that have had a material impact on our condensed consolidated financial statements and related notes.
In the fourth quarter of 2016, we elected to early adopt Accounting Standards Update No. 2016-09, Compensation - Stock Compensation (Topic 718): Improvement to Employee Share-based Payment Accounting (ASU 2016-09). We were required to reflect any adoption adjustments as of January 1, 2016, the beginning of the annual period that included the interim period of adoption. As such, our condensed consolidated statements of income and statements of comprehensive income for the three and six months ended June 30, 2016 and statements of cash flows for the six months ended June 30, 2016 had been adjusted to reflect the impact of ASU 2016-09 adoption. See "Note 1—Summary of Significant Accounting Policies" in the notes to our consolidated financial statements in our Annual Report on Form 10-K for the fiscal year ended December 31, 2016 for detailed adoption information.2018.
Use of Estimates
Conformity with GAAP requires the use of estimates and judgments that affect the reported amounts in the condensed consolidated financial statements and accompanying notes. These estimates form the basis for judgments we make about the carrying values of our assets and liabilities, which are not readily apparent from other sources. We base our estimates and judgments on historical information and on various other assumptions that we believe are reasonable under the circumstances. GAAP requires us to make estimates and judgments in several areas, including, but not limited to, those related to revenue recognition, collectability of accounts receivable, losscommitments and contingencies, fair value of financial instruments, fair value of acquired intangible assets and goodwill, useful lives of intangible assets and property and equipment, leases, and income taxes. These estimates are based on management's knowledge about current events and expectations about actions we may undertake in the future. Actual results could differ materially from those estimates.
Recently Issued Accounting Pronouncements
In May 2014,February 2016, the Financial Accounting Standards Board (FASB) issued Accounting Standards Update No. 2014-09, Revenue from Contracts with Customers (Topic 606) (ASU 2014-09), which amends the existing accounting standards for revenue recognition. In August 2015, the FASB issued ASU No. 2015-14, Revenue from Contracts with Customers (Topic 606): Deferral of the Effective Date, which delays the effective date of ASU 2014-09 by one year. The FASB also agreed to allow entities to choose to adopt the standard as of the original effective date. In March 2016, the FASB issued Accounting Standards Update No. 2016-08, Revenue from Contracts with Customers (Topic 606): Principal versus Agent Considerations (Reporting Revenue Gross versus Net) (ASU 2016-08) which clarifies the implementation guidance on principal versus agent considerations. The guidance includes indicators to assist an entity in determining whether it controls a specified good or service before it is transferred to the customers. The new standard further requires new disclosures about contracts with customers, including the significant judgments the registrant has made when applying the guidance. We will be adopting the new standard effective January 1, 2018. The new
standard also permits two methods of adoption: retrospectively to each prior reporting period presented (full retrospective method), or retrospectively with the cumulative effect of initially applying the guidance recognized at the date of initial application (the modified retrospective method). We currently anticipate adopting the standard using the modified retrospective method. While we are still in the process of completing our analysis on the impact this guidance will have on our consolidated financial statements, related disclosures, and our internal controls over financial reporting, we do not expect the impact to be material.
In February 2016, the FASB issued Accounting Standards Update No. 2016-02, Leases (Topic 842) (ASU 2016-02), which generally requires companies to recognize operating and financing lease liabilities and corresponding right-of-use assets on the balance sheet. This guidance will be effective for us in the first quarter of 2019 on a modified retrospective basis and early adoption is permitted. We currently anticipate adoptingwill adopt the new standard effective January 1, 2019. We have selected a lease accounting system. Our implementation of the system remains on schedule and our evaluation of the use of optional practical expedients is ongoing. While we continue to evaluate the effect of adopting this guidance on our consolidated financial statements and related disclosures, we expect our operating leases, as disclosed in Note 8 — Commitments and Contingencies, will be subject to the new standard. We will recognize right-of-use assets and operating lease liabilities on our consolidated balance sheets upon adoption, which will increase our total assets and liabilities.
In February 2018, the FASB issued Accounting Standards Update No. 2018-02, Income Statement—Reporting Comprehensive Income (Topic 220): Reclassification of Certain Tax Effects from Accumulated Other Comprehensive Income (ASU 2018-02),which allows companies to reclassify stranded tax effects resulting from the 2017 Tax Cuts and Jobs Act (the Tax Act), from accumulated other comprehensive income to retained earnings. The new standard is effective for us beginning January 1, 2019, with early adoption permitted. We are currently evaluating the effects that the adoption of this guidance will have on our consolidated financial statements and the related disclosures.
Recently Adopted Accounting Pronouncements
In May 2014, the FASB issued Accounting Standards Update No. 2014-09, Revenue from Contracts with Customers (Topic 606), which supersedes the revenue recognition requirements in Accounting Standards Codification (ASC) Topic 605, Revenue Recognition (Topic 605). We adopted Topic 606 as of January 1, 2018 using the modified retrospective transition method applied to those contracts which were not completed as of January 1, 2018. See Revenue Recognition below for further details.
In October 2016, the FASB issued Accounting Standards Update No. 2016-16, Income Taxes (Topic 740): Intra-Entity Transfers Other than Inventory (ASU 2016-16), which requires companies to recognize the income-tax consequences of an intra-entity transfer of an asset other than inventory when the transfer occurs, rather than when the asset has been sold to an outside party. We adopted the new standard effective January 1, 2018, using the modified retrospective transition approach through a cumulative-effect adjustment to retained earnings as of the effective date, which was not material to our condensed consolidated financial statements.
In November 2016, the FASB issued Accounting Standards Update No. 2016-18, Statement of Cash Flows (Topic 230): Restricted Cash (ASU 2016-18), which requires companies to include amounts generally described as restricted cash and restricted cash equivalents in cash and cash equivalents when reconciling beginning-of-period and end-of-period total amounts shown on the statements of cash flows. We adopted the new standard effective January 1, 2018, using the retrospective transition approach. The reclassified restricted cash balances from investing activities to changes in cash, cash equivalents and restricted cash on the condensed consolidated statements of cash flows were not material for all periods presented.
In January 2017, the FASB issued Accounting Standards Update No. 2017-01, Business Combinations (Topic 805): Clarifying the Definition of a Business (ASU 2017-01), which revises the definition of a business and provides new guidance in evaluating when a set of transferred assets and activities is a business. This guidance will beWe adopted the new standard effective for us in the first quarter ofJanuary 1, 2018 on a prospective basis, and early adoption is permitted. We dobasis. The new standard did not expect the standard to have a material impact on our condensed consolidated financial statements.
InRevenue Recognition
On January 1, 2018, we adopted Topic 606, using the modified retrospective transition method applied to those contracts which were not completed as of January 1, 2018. Results for reporting periods beginning after January 1, 2018 are presented under Topic 606, while prior period amounts have not been adjusted and continue to be reported in accordance with our historic accounting under Topic 605. The impact to revenue and to cost of revenue for the three months ended March 31, 2018 compared to the same period in 2017 was an increase of approximately $130 million due to a change from net to gross presentation for advertising revenue from Instant Articles. There was no adjustment to beginning retained earnings on January 1, 2018.
Under Topic 606, revenue is recognized when control of the FASB issued Accounting Standards Update No. 2017-04,promised goods or services is transferred to our customers, in an amount that reflects the consideration we expect to be entitled to in exchange for those goods or services.
We determine revenue recognition through the following steps:
identification of the contract, or contracts, with a customer;
identification of the performance obligations in the contract;
determination of the transaction price;
allocation of the transaction price to the performance obligations in the contract; and
recognition of revenue when, or as, we satisfy a performance obligation.
Revenue disaggregated by revenue source for the three months ended March 31, 2018 and 2017, consists of the following (in millions). Revenue excludes sales and usage-based taxes where it has been determined that we are acting as a pass-through agent.
|
| | | | | | | |
| | Three Months Ended March 31, |
| | 2018 | | 2017(1) |
| Advertising | $ | 11,795 |
| | $ | 7,857 |
|
| Payments and other fees | 171 |
| | 175 |
|
| Total revenue | $ | 11,966 |
| | $ | 8,032 |
|
(1) As noted above, prior period amounts have not been adjusted under the modified retrospective method.
Revenue disaggregated by geography, based on the billing address of our customer (in millions):
|
| | | | | | | |
| | Three Months Ended March 31, |
| | 2018 | | 2017(1) |
| Revenue: | | | |
US & Canada(2) | $ | 5,442 |
| | $ | 3,790 |
|
Europe(3) | 3,027 |
| | 1,968 |
|
| Asia-Pacific | 2,475 |
| | 1,576 |
|
Rest of World (3) | 1,022 |
| | 698 |
|
| Total revenue | $ | 11,966 |
| | $ | 8,032 |
|
Intangibles - Goodwill(1) As noted above, prior period amounts have not been adjusted under the modified retrospective method.
(2) United States revenue was $5.09 billion and Other (Topic 350): Simplifying$3.53 billion for the Testthree months ended March 31, 2018 and 2017, respectively.
(3) Europe includes Russia and Turkey, and Rest of World includes Africa, Latin America, and the Middle East.
Advertising
Advertising revenue is generated by displaying ad products on Facebook, Instagram, Messenger, and third-party affiliated websites or mobile applications. Marketers pay for Goodwill Impairment (ASU 2017-04), which eliminates step twoad products either directly or through their relationships with advertising agencies, based on the number of impressions delivered or the number of actions, such as clicks, taken by our users.
Revenue is recognized when control of the promised goods or services is transferred to our customers, in an amount that reflects the consideration we expect to be entitled to in exchange for those goods or services. We recognize revenue from the goodwill impairment test. Under ASU 2017-04,display of impression-based ads in the contracted period in which the impressions are delivered. Impressions are considered delivered when an entity shouldad is displayed to users. We recognize an impairment charge forrevenue from the delivery of action-based ads in the period in which a user takes the action the marketer contracted for. For advertising revenue arrangements where we are not the principal, we recognize revenue on a net basis.
We may accept a lower consideration than the amount bypromised per the contract for certain revenue transactions and certain customers may receive cash-based incentives or credits, which the carrying amount of a reporting unit exceeds its fair value up toare accounted for as variable consideration when estimating the amount of goodwill allocatedrevenue to recognize. We believe that reporting unit. This guidancethere will not be effectivesignificant changes to our estimates of variable consideration.
Payments and Other Fees
Payments revenue is comprised of the net fee we receive from developers using our Payments infrastructure.
Other fees revenue, which was not material for usall periods presented in our financial statements, consists primarily of revenue from the delivery of virtual reality platform devices and various other sources.
Revenue is recognized net of applicable sales and other taxes.
Deferred Revenue and Deposits
Deferred revenue consists of billings and payments from marketers in advance of revenue recognition. Deposits relate to unused balances held on behalf of our users. Once this balance is utilized by a user, approximately 70% of this amount would then be payable to the developer and the balance would be recognized as revenue. The decrease in the first quarterdeferred revenue balance for the three months ended March 31, 2018 was driven by revenue recognized that was included in the deferred revenue balance at the beginning of 2020 on a prospective basis,the period.
Our payment terms vary by the products or services offered. The term between billings and early adoptionwhen payment is permitted. due is not significant.For certain products or services and customer types, we require payment before the products or services are delivered to the customer.
Deferred revenue and deposits consists of the following (in millions):
|
| | | | | | | |
| | March 31, 2018 | | December 31, 2017 |
| Deferred revenue | $ | 64 |
| | $ | 68 |
|
| Deposits | 30 |
| | 30 |
|
| Total deferred revenue and deposits | $ | 94 |
| | $ | 98 |
|
Practical Expedients and Exemptions
We generally expense sales commissions when incurred because the amortization period would have been one year or less. These costs are recorded within sales and marketing expenses.
We do not expectdisclose the standardvalue of unsatisfied performance obligations for (i) contracts with an original expected length of one year or less and (ii) contracts for which we recognize revenue at the amount to which we have a material impact on our consolidated financial statements.the right to invoice for services performed.
| |
| Note 2. | Earnings per Share |
We compute earnings per share (EPS) of Class A and Class B common stock using the two-class method required for participating securities. We consider restricted stock awards to be participating securities because holders of such shares have non-forfeitable dividend rights in the event of our declaration of a dividend for common shares.
Undistributed earnings allocated to participating securities are subtracted from net income in determining net income attributable to common stockholders. Basic EPS is computed by dividing net income attributable to common stockholders by the weighted-average number of shares of our Class A and Class B common stock outstanding, adjusted for outstanding shares that are subject to repurchase.
For the calculation of diluted EPS, net income attributable to common stockholders for basic EPS is adjusted by the effect of dilutive securities, such as awards under our equity compensation plans and inducement awards under separate non-plan restricted stock unit (RSU) award agreements. In addition, the computation of the diluted EPS of Class A common stock assumes the conversion of our Class B common stock to Class A common stock, while the diluted EPS of Class B common stock does not assume the conversion of those shares to Class A common stock. Diluted EPS attributable to common stockholders is computed by dividing the resulting net income attributable to common stockholders by the weighted-average number of fully diluted common shares outstanding.
Certain RSUs with anti-dilutive effect were excluded from the EPS calculation because the impact would be anti-dilutive. These excluded RSUsand they were not material for the three and six months ended June 30,March 31, 2018 and 2017, and 2016, respectively.
Basic and diluted EPS are the same for each class of common stock because they are entitled to the same liquidation and dividend rights.
The numerators and denominators of the basic and diluted EPS computations for our common stock are calculated as follows (in millions, except per share amounts):
| | | | Three Months Ended June 30, | | Six Months Ended June 30, | Three Months Ended March 31, |
| | 2017 | | 2016 | | 2017 | | 2016 | 2018 | | 2017 |
| | Class A | | Class B | | Class A | | Class B | | Class A | | Class B | | Class A | | Class B | Class A | | Class B | | Class A | | Class B |
| Basic EPS: | | | | | | | | | | | | | | | | | | | | | | |
| Numerator | | | | | | | | | | | | | | | | | | | | | | |
| Net income | $ | 3,177 |
| | $ | 717 |
| | $ | 1,846 |
| | $ | 437 |
| | $ | 5,673 |
| | $ | 1,286 |
| | $ | 3,250 |
| | $ | 771 |
| $ | 4,123 |
| | $ | 865 |
| | $ | 2,497 |
| | $ | 567 |
|
| Less: Net income attributable to participating securities | 4 |
| | — |
| | 5 |
| | 2 |
| | 8 |
| | 2 |
| | 11 |
| | 2 |
| 1 |
| | — |
| | 4 |
| | 1 |
|
| Net income attributable to common stockholders | $ | 3,173 |
| | $ | 717 |
| | $ | 1,841 |
| | $ | 435 |
| | $ | 5,665 |
| | $ | 1,284 |
| | $ | 3,239 |
| | $ | 769 |
| $ | 4,122 |
| | $ | 865 |
| | $ | 2,493 |
| | $ | 566 |
|
| Denominator | | | | | | | | | | | | | | | | | | | | | | |
| Weighted average shares outstanding | 2,368 |
| | 535 |
| | 2,317 |
| | 548 |
| | 2,363 |
| | 536 |
| | 2,310 |
| | 549 |
| 2,402 |
| | 504 |
| | 2,359 |
| | 537 |
|
| Less: Shares subject to repurchase | 2 |
| | 1 |
| | 7 |
| | 2 |
| | 3 |
| | 1 |
| | 7 |
| | 2 |
| — |
| | — |
| | 3 |
| | 2 |
|
| Number of shares used for basic EPS computation | 2,366 |
| | 534 |
| | 2,310 |
| | 546 |
| | 2,360 |
| | 535 |
| | 2,303 |
| | 547 |
| 2,402 |
| | 504 |
| | 2,356 |
| | 535 |
|
| Basic EPS | $ | 1.34 |
| | $ | 1.34 |
| | $ | 0.80 |
| | $ | 0.80 |
| | $ | 2.40 |
| | $ | 2.40 |
| | $ | 1.41 |
| | $ | 1.41 |
| $ | 1.72 |
| | $ | 1.72 |
| | $ | 1.06 |
| | $ | 1.06 |
|
| Diluted EPS: | | | | | | | | | | | | | | | | | | | | | | |
| Numerator | | | | | | | | | | | | | | | | | | | | | | |
| Net income attributable to common stockholders | $ | 3,173 |
| | $ | 717 |
| | $ | 1,841 |
| | $ | 435 |
| | $ | 5,665 |
| | $ | 1,284 |
| | $ | 3,239 |
| | $ | 769 |
| $ | 4,122 |
| | $ | 865 |
| | $ | 2,493 |
| | $ | 566 |
|
| Reallocation of net income attributable to participating securities | 4 |
| | — |
| | 7 |
| | — |
| | 10 |
| | — |
| | 13 |
| | — |
| 1 |
| | — |
| | 5 |
| | — |
|
| Reallocation of net income as a result of conversion of Class B to Class A common stock | 717 |
| | — |
| | 435 |
| | — |
| | 1,284 |
| | — |
| | 769 |
| | — |
| 865 |
| | — |
| | 566 |
| | — |
|
| Reallocation of net income to Class B common stock | — |
| | (2 | ) | | — |
| | 6 |
| | — |
| | (1 | ) | | — |
| | 9 |
| — |
| | (5 | ) | | — |
| | 2 |
|
| Net income attributable to common stockholders for diluted EPS | $ | 3,894 |
| | $ | 715 |
| | $ | 2,283 |
| | $ | 441 |
| | $ | 6,959 |
| | $ | 1,283 |
| | $ | 4,021 |
| | $ | 778 |
| $ | 4,988 |
| | $ | 860 |
| | $ | 3,064 |
| | $ | 568 |
|
| Denominator | | | | | | | | | | | | | | | | | | | | | | |
| Number of shares used for basic EPS computation | 2,366 |
| | 534 |
| | 2,310 |
| | 546 |
| | 2,360 |
| | 535 |
| | 2,303 |
| | 547 |
| 2,402 |
| | 504 |
| | 2,356 |
| | 535 |
|
| Conversion of Class B to Class A common stock | 534 |
| | — |
| | 546 |
| | — |
| | 535 |
| | — |
| | 547 |
| | — |
| 504 |
| | — |
| | 535 |
| | — |
|
| Weighted average effect of dilutive securities: | | | | | | | | | | | | | | | | | | | | | | |
| Employee stock options | 4 |
| | 4 |
| | 7 |
| | 7 |
| | 4 |
| | 4 |
| | 7 |
| | 7 |
| 3 |
| | 3 |
| | 5 |
| | 5 |
|
| RSUs | 45 |
| | 3 |
| | 50 |
| | 7 |
| | 47 |
| | 3 |
| | 48 |
| | 7 |
| 36 |
| | 1 |
| | 44 |
| | 3 |
|
| Shares subject to repurchase | 2 |
| | 1 |
| | 5 |
| | 1 |
| | 3 |
| | 1 |
| | 5 |
| | 1 |
| |
| Earn-out shares | — |
| | — |
| | 3 |
| | 3 |
| | 1 |
| | 1 |
| | 2 |
| | 2 |
| |
| Shares subject to repurchase and other | | — |
| | — |
| | 4 |
| | 2 |
|
| Number of shares used for diluted EPS computation | 2,951 |
| | 542 |
| | 2,921 |
| | 564 |
| | 2,950 |
| | 544 |
| | 2,912 |
| | 564 |
| 2,945 |
| | 508 |
| | 2,944 |
| | 545 |
|
| Diluted EPS | $ | 1.32 |
| | $ | 1.32 |
| | $ | 0.78 |
| | $ | 0.78 |
| | $ | 2.36 |
| | $ | 2.36 |
| | $ | 1.38 |
| | $ | 1.38 |
| $ | 1.69 |
| | $ | 1.69 |
| | $ | 1.04 |
| | $ | 1.04 |
|
| |
| Note 3. | Cash and Cash Equivalents, and Marketable Securities |
The following table sets forth the cash and cash equivalents, and marketable securities (in millions):
| | | | June 30, 2017 | | December 31, 2016 | March 31, 2018 | | December 31, 2017 |
| Cash and cash equivalents: | | | | | | |
| Cash | $ | 1,452 |
| | $ | 1,364 |
| $ | 2,728 |
| | $ | 2,212 |
|
| Money market funds | 4,421 |
| | 5,409 |
| 6,937 |
| | 5,268 |
|
| U.S. government securities | 25 |
| | 1,463 |
| 1,385 |
| | 66 |
|
| U.S. government agency securities | 90 |
| | 667 |
| 179 |
| | 25 |
|
| Certificate of deposits and time deposits | 264 |
| | — |
| 853 |
| | 440 |
|
| Corporate debt securities | | — |
| | 68 |
|
| Total cash and cash equivalents | 6,252 |
| | 8,903 |
| 12,082 |
| | 8,079 |
|
| Marketable securities: | | | | | | |
| U.S. government securities | 11,061 |
| | 7,130 |
| 13,088 |
| | 12,766 |
|
| U.S. government agency securities | 9,623 |
| | 7,411 |
| 9,855 |
| | 10,944 |
|
| Corporate debt securities | 8,516 |
| | 6,005 |
| 8,931 |
| | 9,922 |
|
| Total marketable securities | 29,200 |
| | 20,546 |
| 31,874 |
| | 33,632 |
|
| Total cash and cash equivalents, and marketable securities | $ | 35,452 |
| | $ | 29,449 |
| $ | 43,956 |
| | $ | 41,711 |
|
The gross unrealized gains or losses on our marketable securities as of June 30, 2017March 31, 2018 and December 31, 20162017 were not significant. In addition, the gross unrealized loss that had been in a continuous loss position for 12 months or longer was not significant as of June 30, 2017March 31, 2018 and December 31, 2016.2017. As of June 30, 2017,March 31, 2018, we considered the decreases in market value on our marketable securities to be temporary in nature and did not consider any of our investments to be other-than-temporarily impaired.
The following table classifies our marketable securities by contractual maturities (in millions):
| | | | June 30, 2017 | March 31, 2018 |
| Due in one year | $ | 7,739 |
| $ | 7,748 |
|
| Due in one to five years | 21,461 |
| 24,126 |
|
| Total | $ | 29,200 |
| $ | 31,874 |
|
| |
| Note 4. | Fair Value Measurement |
The following table summarizes forour assets or liabilities measured at fair value, the respective fair value and the classification by level of input within the fair value hierarchy (in millions):
| | | | | | | Fair Value Measurement at Reporting Date Using | | | | Fair Value Measurement at Reporting Date Using |
| Description | | June 30, 2017 | | Quoted Prices in Active Markets for Identical Assets (Level 1) | | Significant Other Observable Inputs (Level 2) | | Significant Unobservable Inputs (Level 3) | | March 31, 2018 | | Quoted Prices in Active Markets for Identical Assets (Level 1) | | Significant Other Observable Inputs (Level 2) | | Significant Unobservable Inputs (Level 3) |
| Cash equivalents: | | | | | | | | | | | | | | | | |
| Money market funds | | $ | 4,421 |
| | $ | 4,421 |
| | $ | — |
| | $ | — |
| | $ | 6,937 |
| | $ | 6,937 |
| | $ | — |
| | $ | — |
|
| U.S. government securities | | 25 |
| | 25 |
| | — |
| | — |
| | 1,385 |
| | 1,385 |
| | — |
| | — |
|
| U.S. government agency securities | | 90 |
| | 90 |
| | — |
| | — |
| | 179 |
| | 179 |
| | — |
| | — |
|
| Certificate of deposits and time deposits | | 264 |
| | — |
| | 264 |
| | — |
| | 853 |
| | — |
| | 853 |
| | — |
|
| Marketable securities: | | | | | | | | | | | | | | | | |
| U.S. government securities | | 11,061 |
| | 11,061 |
| | — |
| | — |
| | 13,088 |
| | 13,088 |
| | — |
| | — |
|
| U.S. government agency securities | | 9,623 |
| | 9,623 |
| | — |
| | — |
| | 9,855 |
| | 9,855 |
| | — |
| | — |
|
| Corporate debt securities | | 8,516 |
| | — |
| | 8,516 |
| | — |
| | 8,931 |
| | — |
| | 8,931 |
| | — |
|
| Total cash equivalents and marketable securities | | $ | 34,000 |
| | $ | 25,220 |
| | $ | 8,780 |
| | $ | — |
| | $ | 41,228 |
| | $ | 31,444 |
| | $ | 9,784 |
| | $ | — |
|
| | | | | | | | | | |
| Accrued expenses and other current liabilities: | | | | | | | | | |
| Contingent consideration liability | | $ | 347 |
| | $ | — |
| | $ | 347 |
| | $ | — |
| |
| | | | | | | Fair Value Measurement at Reporting Date Using | | | | Fair Value Measurement at Reporting Date Using |
| Description | | December 31, 2016 | | Quoted Prices in Active Markets for Identical Assets (Level 1) | | Significant Other Observable Inputs (Level 2) | | Significant Unobservable Inputs (Level 3) | | December 31, 2017 | | Quoted Prices in Active Markets for Identical Assets (Level 1) | | Significant Other Observable Inputs (Level 2) | | Significant Unobservable Inputs (Level 3) |
| Cash equivalents: | | | | | | | | | | | | | | | | |
| Money market funds | | $ | 5,409 |
| | $ | 5,409 |
| | $ | — |
| | $ | — |
| | $ | 5,268 |
| | $ | 5,268 |
| | $ | — |
| | $ | — |
|
| U.S. government securities | | 1,463 |
| | 1,463 |
| | — |
| | — |
| | 66 |
| | 66 |
| | — |
| | — |
|
| U.S. government agency securities | | 667 |
| | 667 |
| | — |
| | — |
| | 25 |
| | 25 |
| | — |
| | — |
|
Certificate of deposits and time deposits
| | | 440 |
| | — |
| | 440 |
| | — |
|
| Corporate debt securities | | | 68 |
| | — |
| | 68 |
| | — |
|
| Marketable securities: | | | | | | | | | | | | | | | | |
| U.S. government securities | | 7,130 |
| | 7,130 |
| | — |
| | — |
| | 12,766 |
| | 12,766 |
| | — |
| | — |
|
| U.S. government agency securities | | 7,411 |
| | 7,411 |
| | — |
| | — |
| | 10,944 |
| | 10,944 |
| | — |
| | — |
|
| Corporate debt securities | | 6,005 |
| | — |
| | 6,005 |
| | — |
| | 9,922 |
| | — |
| | 9,922 |
| | — |
|
| Total cash equivalents and marketable securities | | $ | 28,085 |
| | $ | 22,080 |
| | $ | 6,005 |
| | $ | — |
| | $ | 39,499 |
| | $ | 29,069 |
| | $ | 10,430 |
| | $ | — |
|
| | | | | | | | | | |
| Accrued expenses and other current liabilities: | | | | | | | | | |
| Contingent consideration liability | | $ | 242 |
| | $ | — |
| | $ | 242 |
| | $ | — |
| |
We classify our cash equivalents and marketable securities within Level 1 or Level 2 because we use quoted market prices or alternative pricing sources and models utilizing market observable inputs to determine their fair value.
We classify our contingent consideration liability within Level 2 as the valuation inputs are based on quoted market prices and market observable data. During the three and six months ended June 30, 2017, we recognized an increase in the fair value of our contingent consideration liability of $21 million and $105 million, respectively, primarily due to the increase in the fair value of our common stock.
| |
| Note 5. | Property and Equipment |
Property and equipment consists of the following (in millions):
| | | | June 30,
2017 | | December 31,
2016 | March 31,
2018 | | December 31,
2017 |
| Land | $ | 720 |
| | $ | 696 |
| $ | 825 |
| | $ | 798 |
|
| Buildings | 4,013 |
| | 3,109 |
| 4,957 |
| | 4,909 |
|
| Leasehold improvements | 742 |
| | 531 |
| 1,197 |
| | 959 |
|
| Network equipment | 6,685 |
| | 5,179 |
| 9,227 |
| | 7,998 |
|
| Computer software, office equipment and other | 517 |
| | 398 |
| 770 |
| | 681 |
|
| Construction in progress | 1,991 |
| | 1,890 |
| 4,316 |
| | 2,992 |
|
| Total | 14,668 |
| | 11,803 |
| 21,292 |
| | 18,337 |
|
| Less: Accumulated depreciation | (4,040 | ) | | (3,212 | ) | (5,081 | ) | | (4,616 | ) |
| Property and equipment, net | $ | 10,628 |
| | $ | 8,591 |
| $ | 16,211 |
| | $ | 13,721 |
|
Construction in progress includes costs related to construction of data centers, office buildings, and network equipment infrastructure to support our data centers around the world. No interest was capitalized during the three and six months ended June 30, 2017March 31, 2018 and 2016.2017.
| |
| Note 6. | Goodwill and Intangible Assets |
During the three months ended March 31, 2018, we completed business acquisitions that were not material to our condensed consolidated financial statements, either individually or in the aggregate. Accordingly, pro forma historical results of operations related to these business acquisitions during the three months ended March 31, 2018 have not been presented. We have included the financial results of these business acquisitions in our condensed consolidated financial statements from their respective dates of acquisition.
The changes in the carrying amount of goodwill for the sixthree months ended June 30, 2017March 31, 2018 are as follows (in millions):
|
| | | |
| Balance as of December 31, 2016 | $ | 18,122 |
|
| Effect of currency translation adjustment | 7 |
|
| Balance as of June 30, 2017 | $ | 18,129 |
|
|
| | | |
| Balance as of December 31, 2017 | $ | 18,221 |
|
| Goodwill acquired | 47 |
|
| Balance as of March 31, 2018 | $ | 18,268 |
|
Intangible assets consist of the following (in millions):
| | | | | | June 30, 2017 | | December 31, 2016 | | | March 31, 2018 | | December 31, 2017 |
| | Weighted-Average Remaining Useful Lives (in years) | | Gross Carrying Amount | | Accumulated Amortization | | Net Carrying Amount | | Gross Carrying Amount | | Accumulated Amortization | | Net Carrying Amount | Weighted-Average Remaining Useful Lives (in years) | | Gross Carrying Amount | | Accumulated Amortization | | Net Carrying Amount | | Gross Carrying Amount | | Accumulated Amortization | | Net Carrying Amount |
| Acquired users | 4.3 | | $ | 2,056 |
| | $ | (826 | ) | | $ | 1,230 |
| | $ | 2,056 |
| | $ | (678 | ) | | $ | 1,378 |
| 3.5 | | $ | 2,056 |
| | $ | (1,043 | ) | | $ | 1,013 |
| | $ | 2,056 |
| | $ | (971 | ) | | $ | 1,085 |
|
| Acquired technology | 2.0 | | 931 |
| | (614 | ) | | 317 |
| | 931 |
| | (518 | ) | | 413 |
| 1.7 | | 992 |
| | (759 | ) | | 233 |
| | 972 |
| | (711 | ) | | 261 |
|
| Acquired patents | 6.0 | | 785 |
| | (461 | ) | | 324 |
| | 785 |
| | (420 | ) | | 365 |
| 5.6 | | 785 |
| | (516 | ) | | 269 |
| | 785 |
| | (499 | ) | | 286 |
|
| Trade names | 2.7 | | 629 |
| | (350 | ) | | 279 |
| | 629 |
| | (293 | ) | | 336 |
| 2.0 | | 629 |
| | (433 | ) | | 196 |
| | 629 |
| | (406 | ) | | 223 |
|
| Other | 3.0 | | 162 |
| | (126 | ) | | 36 |
| | 162 |
| | (119 | ) | | 43 |
| 2.5 | | 162 |
| | (138 | ) | | 24 |
| | 162 |
| | (133 | ) | | 29 |
|
| Total intangible assets | 4.0 | | $ | 4,563 |
| | $ | (2,377 | ) | | $ | 2,186 |
| | $ | 4,563 |
| | $ | (2,028 | ) | | $ | 2,535 |
| 3.4 | | $ | 4,624 |
| | $ | (2,889 | ) | | $ | 1,735 |
| | $ | 4,604 |
| | $ | (2,720 | ) | | $ | 1,884 |
|
Amortization expense of intangible assets was $174$169 million and $349$175 million for the three and six months ended June 30,March 31, 2018 and 2017, respectively, and $193 million and $373 million for the three and six months ended June 30, 2016, respectively.
As of June 30, 2017,March 31, 2018, expected amortization expense for the unamortized acquired intangible assets for the next five years and thereafter is as follows (in millions):
| | | The remainder of 2017 | $ | 338 |
| |
| 2018 | 619 |
| |
| The remainder of 2018 | | $ | 471 |
|
| 2019 | 526 |
| 546 |
|
| 2020 | 357 |
| 371 |
|
| 2021 | 265 |
| 266 |
|
| 2022 | | 29 |
|
| Thereafter | 81 |
| 52 |
|
| Total | $ | 2,186 |
| $ | 1,735 |
|
In May 2016, we entered into a five-year$2.0 billion senior unsecured revolving credit facility, that allows us to borrow up to $2.0 billion. Anyand any amounts outstanding under this facility will be due and payable on May 20, 2021. As of June 30, 2017March 31, 2018, no amounts had been drawn down, and we were in compliance with the covenants under this facility.
| |
| Note 8. | Commitments and Contingencies |
Commitments
Leases
During the sixthree months ended June 30, 2017,March 31, 2018, we entered into additional non-cancelable operating lease agreements, mostly related to office buildings.agreements. Our various non-cancelable operating lease agreements, forwhich include among others, certain of our offices, land, facilities,data center, and data centerscolocation leases, have original lease periods expiring between 2018 and 2040. Operating lease expense was $129 million and $74 million for the three months ended March 31, 2018 and 2017, and 2038 and our totalrespectively.
The following is a schedule, by years, of the future minimum lease payments related to theserequired under non-cancelable operating leases as of June 30, 2017 was $2.7 billion. March 31, 2018 (in millions):
|
| | | | | | | |
| | Operating Leases | | Financing obligation, building in progress - leased facilities(1) |
| The remainder of 2018 | $ | 351 |
| | $ | — |
|
| 2019 | 558 |
| | 2 |
|
| 2020 | 645 |
| | 14 |
|
| 2021 | 656 |
| | 15 |
|
| 2022 | 642 |
| | 15 |
|
| Thereafter | 4,717 |
| | 149 |
|
| Total minimum lease payments | $ | 7,569 |
| | $ | 195 |
|
| |
| (1) | We entered into agreements to lease office buildings that are under construction. As a result of our involvement during these construction periods, we are considered for accounting purposes to be the owner of the construction projects. Financing obligation, building in progress - leased facilities represent the total expected financing and lease obligations associated with these leases and will be settled through monthly lease payments to the landlords when we occupy the office spaces upon completion. This amount includes $98 million that is included in property and equipment, net and other liabilities on our condensed consolidated balance sheets as of March 31, 2018. |
Other contractual commitments
We are committedalso have $3.49 billion of non-cancelable contractual commitments as of March 31, 2018, primarily related to pay a portion of the related actual operating expenses under certainnetwork infrastructure and our data center operations. The majority of these lease agreements. Certain of these arrangements have free rent periods or escalating rent payment provisions, and we recognize rent expense under such arrangements oncommitments are due within a straight-line basis. Operating lease expense was $81 million and $156 million for the three and six months ended June 30, 2017, respectively, and $66 million and $129 million for the three and six months ended June 30, 2016, respectively.year.
Contingencies
Beginning on May 22, 2012, multiple putative class actions, derivative actions, and individual actions were filed in state and federal courts in the United States and in other jurisdictions against us, our directors, and/or certain of our officers alleging violation of securities laws or breach of fiduciary duties in connection with our initial public offering (IPO) and seeking unspecified damages. We believe these lawsuits are without merit, and we intend to continue to vigorously defend them. The vast majority of the cases in the United States, along with multiple cases filed against The NASDAQ OMX Group,
Inc. and The Nasdaq Stock Market LLC (collectively referred to herein as NASDAQ) alleging technical and other trading-related errors by NASDAQ in connection with our IPO, were ordered centralized for coordinated or consolidated pre-trial proceedings in the U.S. District Court for the Southern District of New York. In a series of rulings in 2013 and 2014, the court denied our motion to dismiss the consolidated securities class action and granted our motions to dismiss the derivative actions against our directors and certain of our officers. On July 24, 2015, the court of appeals affirmed the dismissal of the derivative actions. On December 11, 2015, the court granted plaintiffs' motion for class certification in the consolidated securities action. On April 14, 2017, we filed a motion for summary judgment. Trial is scheduled to beginOn February 26, 2018, the parties entered into a settlement agreement resolving all claims in the consolidated securities action.
Beginning on October 23, 2017.
On April 27, 2016, we announced a proposal to create a newMarch 20, 2018, multiple putative class of non-voting capital stock (Class C capital stock)actions and our intention to declare and pay a dividend of two shares of Class C capital stock for each outstanding share of Class A and Class B common stock (the Reclassification). Following our announcement of the Reclassification, beginning on April 29, 2016, multiple purported class action lawsuitsderivative actions were filed on behalf of our stockholdersin state and federal courts in the Delaware Court of ChanceryUnited States and elsewhere against us and certain of our board of directors and Mark Zuckerberg. The lawsuits have been consolidated under the caption In re Facebook, Inc. Class C Reclassification Litig., C.A. No. 12286-VCL,officers alleging violations of securities laws, breach of fiduciary duties, and the consolidated complaint generally alleges that the defendants breached their fiduciary dutiesother causes of action in connection with the Reclassification. Among other remedies, these lawsuits seek to enjoin the Reclassification as well asmisuse of certain data by a developer that shared such data with third parties in violation of our terms and policies, and seeking unspecified money damages costs, and attorneys’ fees. Trial is scheduled to begin on September 26, 2017.injunctive relief. We believe that thethese lawsuits are without merit, and we are vigorously defending them. In addition, the events surrounding this misuse of data became the subject of U.S. Federal Trade Commission and other government inquiries in the United States, Europe, and other jurisdictions. It is reasonably possible that some of these actions or inquiries could subject us to substantial losses, although we are currently unable to estimate the amount of such losses.
In addition, from time to time, we are subject to litigation and other proceedings involving law enforcement and other regulatory agencies, including in particular in Brazil and Europe, in order to ascertain the precise scope of our legal obligations to comply with the requests of those agencies, including our obligation to disclose user information in particular circumstances. A number of such instances have resulted in the assessment of fines and penalties against us. We believe we have multiple legal grounds to satisfy these requests or prevail against associated fines and penalties, and we intend to vigorously defend against all claims asserted.
such fines and penalties. Although we believe that it is reasonably possible that we may incur a loss in some of these cases, we are currently unable to estimate the amount of such losses or a range of possible losses.
We are also party to various other legal proceedings, claims, and regulatory, tax or government inquiries and investigations that arise in the ordinary course of business. With respect to these matters, we evaluate the developments on a regular basis and accrue a liability when we believe a loss is probable and the amount can be reasonably estimated.
We believe that the amount or any estimable range of reasonably possible or probable loss will not, either individually or in the aggregate, have a material adverse effect on our business, consolidated financial position, results of operations, or cash flows. However, the outcome of these matters is inherently uncertain. Therefore, if one or more of these matters were resolved against us for amounts in excess of management's expectations, our results of operations and financial condition, including in a particular reporting period in which any such outcome becomes probable and estimable, could be materially adversely affected.
For information regarding income tax contingencies, see Note 10 — Income Taxes.
| |
| Note 9. | Stockholders' Equity |
Reclassification
In April 2016, our board of directors approved the Reclassification by approving amendments to our restated certificate of incorporation (the New Certificate) that would, among other things, create a new non-voting Class C capital stock. The Class C capital stock will have the same rights and powers, rank equally (including as to dividends and distributions, mergers or similar business combinations, and in connection with any liquidation, dissolution, or winding up of the corporation), share ratably and be identical in all other respects and as to all matters to the shares of Class A and Class B common stock, except for voting rights and as expressly provided in the New Certificate. The New Certificate was approved by our stockholders on June 20, 2016. As of June 30, 2017, the New Certificate was not yet effective.
As part of the Reclassification, we announced that our board of directors intends to issue two shares of the Class C capital stock as a one-time stock dividend for each share of Class A and Class B common stock outstanding. The record and payment dates for this dividend will be determined by our board of directors in its discretion and there can be no assurance as to the timing of such dates. For accounting purposes, we expect this dividend will be treated as a stock split in the form of a dividend.
Share Repurchase Program
In November 2016, our board of directors authorized a $6.0 billion share repurchase program of our Class A common stock, which commenced in 2017 and does not have an expiration date. During the three months ended March 31, 2018, we repurchased and subsequently retired approximately 11 million shares of our Class A common stock for an aggregate amount of approximately $1.91 billion. As of March 31, 2018, approximately $2.0 billion remained available under this authorization. In April 2018, this authorization for the repurchase of our Class A common stock was increased by an additional $9.0 billion. The timing and actual number of shares repurchased under this program depend on a variety of factors, including price, general business and market conditions, and other investment opportunities, and shares may be repurchased through open market purchases or privately negotiated transactions, including through the use of trading plans intended to qualify under Rule 10b5-1 under the Securities Exchange Act. During the six months ended June 30, 2017, we repurchased and subsequently retired approximately 3 million sharesAct of our Class A common stock for an aggregate amount of approximately $408 million.1934, as amended.
Share-based Compensation Plans
We maintain two share-based employee compensation plans: the 2012 Equity Incentive Plan, (2012which was amended and restated in June 2016, and amended in February 2018 (Amended 2012 Plan), and the 2005 Stock Plan (collectively, Stock Plans). Our Amended 2012 Plan serves as the successor to our 2005 Stock Plan and provides for the issuance of incentive and nonstatutory stock options, restricted stock awards, stock appreciation rights, RSUs, performance shares, and stock bonuses to qualified employees, directors and consultants. Outstanding awards under the 2005 Stock Plan continue to be subject to the terms and conditions of the 2005 Stock Plan. Our board of directors approved the amendment and restatement of our 2012 Plan (the Amended 2012 Plan), which was approved by our stockholders and adopted by us in June 2016.
We initially reserved 25
Effective January 1, 2018, there were 67 million shares of our Class A common stock for issuance under our 2012 Plan. Following the date of the contemplated stock dividend of Class C capital stock described above, if it is declared and paid, the shares reserved and available for issuance under our Amended 2012 Plan will be shares of the new Class C capital stock, except for shares reserved for awards outstanding immediately prior to the payment of the dividend.Plan. The number of shares reserved for issuance under our Amended 2012 Plan increases automatically on January 1 of each of the calendar years during the term of the Amended 2012 Plan, which will continue through and including April 2026 unless terminated earlier by our board of directors or a committee thereof, by a number of shares of Class C capital stock (and prior to the date of the payment of the stock dividend described above, Class A common stock)stock equal to the lesser of (i) 2.5% of the total issued and outstanding shares of our Class A common stock and Class C capital stock as of the immediately preceding December 31st or (ii) a number of shares determined by our board of directors. Our board of directors elected not to increase the number of shares reserved for issuance in 2017.
The following table summarizes the activities of stock option awards under the Stock Plans for the sixthree months ended June 30, 2017March 31, 2018:
|
| | | | | | | | | | | | |
| | Shares Subject to Options Outstanding |
| | Number of Shares | | Weighted Average Exercise Price | | Weighted Average Remaining Contractual Term | | Aggregate Intrinsic Value(1) |
| | (in thousands) | | | | (in years) | | (in millions) |
| Balance as of December 31, 2016 | 5,687 |
| | $ | 7.78 |
| | | | |
| Stock options exercised | (2,154 | ) | | 5.67 |
| | | | |
| Balance as of June 30, 2017 | 3,533 |
| | $ | 9.07 |
| | 2.7 | | $ | 501 |
|
| Stock options exercisable as of June 30, 2017 | 2,749 |
| | $ | 7.38 |
| | 2.6 | | $ | 395 |
|
|
| | | | | | | | | | | | |
| | Shares Subject to Options Outstanding |
| | Number of Shares | | Weighted Average Exercise Price | | Weighted Average Remaining Contractual Term | | Aggregate Intrinsic Value(1) |
| | (in thousands) | | | | (in years) | | (in millions) |
| Balance as of December 31, 2017 | 3,078 |
| | $ | 10.06 |
| | | | |
| Stock options exercised | (391 | ) | | $ | 7.97 |
| | | | |
| Balance as of March 31, 2018 | 2,687 |
| | $ | 10.36 |
| | 2.2 | | $ | 402 |
|
| Stock options exercisable as of March 31, 2018 | 2,609 |
| | $ | 10.22 |
| | 2.2 | | $ | 390 |
|
| |
| (1) | The aggregate intrinsic value is calculated as the difference between the exercise price of the underlying stock option awards and the official closing price of our Class A common stock of $150.98,$159.79, as reported on the NASDAQNasdaq Global Select Market on June 30, 2017.March 31, 2018. |
The following table summarizes the activities for our unvested RSUs for the sixthree months ended June 30, 2017:March 31, 2018:
| | | | Unvested RSUs(1) | Unvested RSUs(1) |
| | Number of Shares | | Weighted Average Grant Date Fair Value | Number of Shares | | Weighted Average Grant Date Fair Value |
| | (in thousands) | | | (in thousands) | | |
| Unvested at December 31, 2016 | 98,586 |
| | $ | 82.99 |
| |
| Unvested at December 31, 2017 | | 81,214 |
| | $ | 110.49 |
|
| Granted | 28,565 |
| | 140.14 |
| 24,814 |
| | $ | 169.29 |
|
| Vested | (22,810 | ) | | 79.72 |
| (10,883 | ) | | $ | 90.86 |
|
| Forfeited | (3,719 | ) | | 95.32 |
| (1,203 | ) | | $ | 120.31 |
|
| Unvested at June 30, 2017 | 100,622 |
| | $ | 99.49 |
| |
| Unvested at March 31, 2018 | | 93,942 |
| | $ | 128.16 |
|
| |
| (1) | Unvested shares includeincludes an inducement awardsaward issued in connection with anthe WhatsApp acquisition in 2014 and arewhich is subject to the terms, restrictions, and conditions of a separate non-plan RSU award agreements.agreement. |
The fair value as of the respective vesting dates of RSUs that vested during the three and six months ended June 30,March 31, 2018 and 2017 was $1.51$1.95 billion and $3.21$1.70 billion, respectively, and $1.18 billion and $2.63 billion during the three and six months ended June 30, 2016, respectively.
As of June 30, 2017,March 31, 2018, there was $8.78$10.82 billion of unrecognized share-based compensation expense, substantially all of which (i) $8.68 billion was related to RSUs, and (ii) $100 million was related to restricted shares, shares related to our contingent consideration with performance conditions that were met in the second quarter of 2016 but are still subject to a service condition, and stock options.RSUs. This unrecognized compensation expense is expected to be recognized over a weighted-average period of approximately three years.years based on vesting under the award service conditions. Included in this unrecognized share-based compensation expense are 7.0 million unvested shares as of March 31, 2018, related to a RSU inducement award granted to an employee in connection with the WhatsApp acquisition in 2014. This award is subject to acceleration if the recipient's employment is terminated without "cause" or if the recipient resigns for "good reason".
Our tax provision for interim periods is determined using an estimate of ourestimated annual effective tax rate, adjusted for discrete items arising in that quarter. In each quarter, we update our estimate of the estimated annual effective tax rate and if ourmake a year-to-date adjustment to the provision. The estimated annual effective tax rate changes, we make a cumulative adjustment in that quarter. Our quarterly tax provision and our quarterly estimate of our annual effective tax rate areis subject to significant volatility due to several factors, including our ability to accurately predict the proportion of our income (loss) before provision for income taxes in multiple jurisdictions, the tax effects of our share-based compensation, and the effects of acquisitions, and the integration of those acquisitions.
Our 20172018 effective tax rate differs from the U.S. statutory rate of 21% primarily due to a portion of our income before provision for income taxes being earned in jurisdictions withsubject to tax rates lower than the U.S. statutory rate where we plan to indefinitely reinvest a certain portion of those earnings, as well as21%, and the recognition of excess tax benefits from share-based compensation.
In December 2017, the SEC staff issued Staff Accounting Bulletin No. 118, Income Tax Accounting Implications of the Tax Cuts and Jobs Act (SAB 118), which allows us to record provisional amounts for the Tax Act during a measurement period not to extend beyond one year of the enactment date. Through March 31, 2018, we did not have any significant adjustments to our provisional amounts. We will continue our analysis of these provisional amounts, which are still subject to change during the measurement period, and we anticipate further guidance on accounting interpretations from the FASB and application of the law from the Department of the Treasury.
Our gross unrecognized tax benefits were $3.45$3.87 billion and $3.31 billion as of June 30, 2017for both March 31, 2018 and December 31, 2016, respectively.2017. If the gross unrecognized tax benefits as of June 30, 2017March 31, 2018 were realized in a subsequent period, this would result in a tax benefit of $2.68$2.53 billion within our provision of income taxes at such time. Our existing tax positions willThe amount of interest and penalties accrued as of March 31, 2018 and December 31, 2017 was $205 million and $154 million, respectively. We expect to continue to generate an increase inaccrue unrecognized tax benefits for certain recurring tax positions and anticipate that the amount for future quarters accrued will be similar to amounts accrued by quarter in 2017.
We are subject to taxation in the United States and various other state and foreign jurisdictions. The material jurisdictions in which we are subject to potential examination include the United States and Ireland. We are under examination by the Internal Revenue Service (IRS) for our 2014 through 2016 tax years and Ireland for our 2012 through 2015 tax years. Our 2017 tax year remains open to examination by the IRS. Our 2016 and subsequent periods. tax years remain open to examination in Ireland.
In July 2016, we received a Statutory Notice of Deficiency (Notice) from the IRS related to transfer pricing with our foreign subsidiaries in conjunction with the examination of the 2010 tax year. While the Notice applies only to the 2010 tax year, the IRS states that it will also apply its position tofor tax years subsequent to 2010, which, if the IRS prevails in its position, could result in
an additional federal tax liability of an estimated, aggregate amount of up to approximately $3.0 billion to $5.0 billion in excess of the amounts in our originally filed U.S. return, plus interest and any penalties asserted. We do not agree with the position of the IRS and have filed a petition in the United States Tax Court challenging the Notice. As of March 31, 2018, we have not resolved this matter, and proceedings continue in the United States Tax Court. In March 2018, we received a second Notice from the IRS in conjunction with the examination of our 2011 through 2013 tax years. The IRS applied its position from the 2010 tax year to each of these years and also proposed new adjustments related to other transfer pricing with our foreign subsidiaries and certain tax credits that we claimed. If the IRS prevails in its position for these new adjustments, this could result in an additional federal tax liability of up to approximately $680 million in excess of the amounts in our originally filed U.S. return, plus interest and any penalties asserted. We do not agree with the positions of the IRS in the second Notice and we will file a petition in the United States Tax Court challenging the Notice. We have previously accrued an estimated unrecognized tax benefit consistent with the guidance in ASC 740 that is lower than the potential additional federal tax liability of $3.0 billion to $5.0 billionfrom the positions taken by the IRS in excess of the amounts in our originally filed U.S. return, plus interest and penalties. Iftwo Notices. In addition, if the IRS prevails in its positions related to transfer pricing with our foreign subsidiaries, the assessment of additional tax due based on its position, the assessed tax, interest and penalties, if any, could havethat we would owe would be partially offset by a material adverse impact on our financial position, results of operations or cash flows. As of June 30, 2017, we have not resolved this matter and proceedings continuereduction in the United Statestax that we owe under the mandatory transition tax on accumulated foreign earnings from the Tax Court.
We are subject to taxation in the United States and various other state and foreign jurisdictions. The material jurisdictions in which we are subject to potential examination include the United States and Ireland. We are under examination by the Internal Revenue Service (IRS) for our 2011 through 2013 tax years. Our 2014 and subsequent years remain open to examination by the IRS. Our 2012 and subsequent years remain open to examination in Ireland.Act.
We believe that adequate amounts have been reserved in accordance with ASC 740 for any adjustments to the provision for income taxes or other tax items that may ultimately result from these examinations. Although the timing of the resolution, settlement, and closure of any audits is highly uncertain, it is reasonably possible that the balance of gross unrecognized tax benefits could significantly change in the next 12 months. Given the number of years remaining that are subject to examination, we are unable to estimate the full range of possible adjustments to the balance of gross unrecognized tax benefits. However, we do not anticipateIf the taxing authorities prevail in the assessment of additional tax due, the assessed tax, interest, and penalties, if any, could have a significantmaterial adverse impact to such amounts within the next 12 months.on our financial position, results of operations, and cash flows.
| |
| Note 11. | Geographical Information |
Revenue by geography is based on the billing address of the marketer or developer. The following tables settable sets forth revenue and property and equipment, net by geographic area (in millions):
|
| | | | | | | | | | | | | | | |
| | Three Months Ended June 30, | | Six Months Ended June 30, |
| | 2017 | | 2016 | | 2017 | | 2016 |
| Revenue: | | | | | | | |
| United States | $ | 4,048 |
| | $ | 2,852 |
| | $ | 7,574 |
| | $ | 5,361 |
|
Rest of the world (1) | 5,273 |
| | 3,584 |
| | 9,779 |
| | 6,457 |
|
| Total revenue | $ | 9,321 |
| | $ | 6,436 |
| | $ | 17,353 |
| | $ | 11,818 |
|
| |
(1) | No individual country, other than disclosed above, exceeded 10% of our total revenue for any period presented. |
| | | | June 30,
2017 | | December 31,
2016 | March 31,
2018 | | December 31,
2017 |
| Property and equipment, net: | | | | | | |
| United States | $ | 8,215 |
| | $ | 6,793 |
| $ | 12,200 |
| | $ | 10,406 |
|
Rest of the world (1) | 2,413 |
| | 1,798 |
| 4,011 |
| | 3,315 |
|
| Total property and equipment, net | $ | 10,628 |
| | $ | 8,591 |
| $ | 16,211 |
| | $ | 13,721 |
|
| |
| (1) | No individual country, other than disclosed above, exceeded 10% of our total property and equipment, net for any period presented. |
For information regarding revenue disaggregated by geography, see Note 1 — Summary of Significant Accounting Policies, Revenue Recognition.
| |
| Item 2. | Management's Discussion and Analysis of Financial Condition and Results of Operations |
You should read the following discussion of our financial condition and results of operations in conjunction with our condensed consolidated financial statements and the related notes included elsewhere in this Quarterly Report on Form 10-Q and with our audited consolidated financial statements included in our Annual Report on Form 10-K for the year ended December 31, 2016,2017, as filed with the Securities and Exchange Commission. In addition to our historical condensed consolidated financial information, the following discussion contains forward-looking statements that reflect our plans, estimates, and beliefs. Our actual results could differ materially from those discussed in the forward-looking statements. Factors that could cause or contribute to these differences include those discussed below and elsewhere in this Quarterly Report on Form 10-Q, particularly in Part II, Item 1A, "Risk Factors." For a discussion of limitations in the measurement of certain of our user metrics, see the section entitled "Limitations of Key Metrics and Other Data" in this Quarterly Report on Form 10-Q.
Certain revenue information in the section entitled "—Three and Six Months Ended June 30, 2017March 31, 2018 and 2016—2017—Revenue—Foreign Exchange Impact on Revenue" is presented on a constant currency basis. This information is a non-GAAP financial measure. To calculate revenue on a constant currency basis, we translated revenue for the three and six months ended June 30, 2017March 31, 2018 using the prior year's monthly exchange rates for our settlement currencies other than the U.S. dollar. This non-GAAP financial measure is not intended to be considered in isolation or as a substitute for, or superior to, financial information prepared and presented in accordance with GAAP. This measure may be different from non-GAAP financial measures used by other companies, limiting its usefulness for comparison purposes. Moreover, presentation of revenue on a constant currency basis is provided for year-over-year comparison purposes, and investors should be cautioned that the effect of changing foreign currency exchange rates has an actual effect on our operating results. We believe this non-GAAP financial measure provides investors with useful supplemental information about the financial performance of our business, enables comparison of financial results between periods where certain items may vary independent of business performance, and allows for greater transparency with respect to key metrics used by management in operating our business.
Executive Overview of SecondFirst Quarter Results
Our key user metrics and financial results for the secondfirst quarter of 20172018 are as follows:
User growth:
Daily active users (DAUs) were 1.321.45 billion on average for June 2017,March 2018, an increase of 17%13% year-over-year.
Monthly active users (MAUs) were 2.012.20 billion as of June 30, 2017,March 31, 2018, an increase of 17%13% year-over-year.
Financial results:
Revenue was $9.32$11.97 billion, up 45%49% year-over-year, and ad revenue was $9.16$11.8 billion, up 47%50% year-over-year.
Total costs and expenses were $4.92$6.52 billion.
Income from operations was $4.40$5.45 billion.
Net income was $3.89$4.99 billion with diluted earnings per share of $1.32.$1.69.
Capital expenditures were $1.44$2.81 billion.
Effective tax rate was 13%11%.
Cash and cash equivalents and marketable securities were $35.45$43.96 billion as of June 30, 2017.March 31, 2018.
Headcount was 20,65827,742 as of June 30, 2017,March 31, 2018, an increase of 43%48% year-over-year.
In the secondfirst quarter of 2017,2018, we announced our new mission, which is to give people the power to build community and bring the world closer together. We also continued to focus on our three main revenue growth priorities: (i) helping businesses expand their use of our mobile products, (ii) developing innovative ad products that help businesses get the most of their ad campaigns, and (iii) making our ads more relevant and effective through our targeting capabilities and outcome-based measurement.
We continued to invest, based on our roadmap, in: (i) our most developed ecosystem, the Facebook app and platform, as well as video, (ii) driving growth and building ecosystems around our products and features that already have significant user bases, such as Instagram, Messenger, and WhatsApp, as well as features like Stories, and (iii) long-term technology initiatives, such as connectivity, artificial intelligence, connectivity,and augmented and virtual and augmented reality, that we believe will further our mission to give people the power to build community and bring the world closer together. We intend to continue to invest based on this roadmap and we expect theseanticipate that additional investments and our increasingly global scalein the following areas will drive significant overall year-over-year expense growth compared to 2016. In addition, we anticipate our expenses in 2017 will continue to grow as we execute on priorities such as2018: (i) hiring top engineering talent, (ii) investingincreased investments in researchsafety and development,security, video content, and salesour long-term technology initiatives, and marketing efforts,(ii) scaling our headcount and (iii) expanding our data center capacity and office facilities to support our growth.
Trends in Our User Metrics
The numbers for our key metrics, our DAUs, MAUs, and average revenue per user (ARPU), do not include Instagram, WhatsApp, or Oculus users unless they would otherwise qualify as such users, respectively, based on their other activities on Facebook. In addition, other user engagement metrics do not include Instagram, WhatsApp, or Oculus unless otherwise specifically stated.
Trends in the number of users affect our revenue and financial results by influencing the number of ads we are able to show, the value of our ads to marketers, the volume of Payments transactions, as well as our expenses and capital expenditures. Substantially all of our daily and monthly active users (as defined below) access Facebook on mobile devices.
Daily Active Users (DAUs). We define a daily active user as a registered Facebook user who logged in and visited Facebook through our website or a mobile device, or used our Messenger application (and is also a registered Facebook user), on a given day. We view DAUs, and DAUs as a percentage of MAUs, as measures of user engagement.
Note: For purposes of reporting DAUs, MAUs, and ARPU by geographic region, Europe includes all users in Russia and Turkey and Rest of World includes all users in Africa, Latin America, and the Middle East.
Worldwide DAUs increased 17%13% to 1.321.45 billion on average during June 2017March 2018 from 1.131.28 billion during June 2016. We experiencedMarch 2017. Users in India, Indonesia, and Vietnam represented key sources of growth in DAUs across major markets, including India, Indonesia, and Brazil.during March 2018, relative to the same period in 2017.
Monthly Active Users (MAUs). We define a monthly active user as a registered Facebook user who logged in and visited Facebook through our website or a mobile device, or used our Messenger application (and is also a registered Facebook user), in the last 30 days as of the date of measurement. MAUs are a measure of the size of our global active user community.
As of June 30, 2017,March 31, 2018, we had 2.012.2 billion MAUs, an increase of 17%13% from June 30, 2016.March 31, 2017. Users in India, Indonesia, and BrazilVietnam represented key sources of growth in the secondfirst quarter of 2017,2018, relative to the same period in 2016.2017.
Trends in Our Monetization by User Geography
We calculate our revenue by user geography based on our estimate of the geography in which ad impressions are delivered, virtual and digital goods are purchased, or virtual reality platform devices are shipped. We define ARPU as our total revenue in a given geography during a given quarter, divided by the average of the number of MAUs in the geography at the beginning and end of the quarter. While ARPU includes all sources of revenue, the number of MAUs used in this calculation only includes users of Facebook and Messenger as described in the definition of MAU above. Revenue from users who are not also Facebook or Messenger MAUs was not material. The geography of our users affects our revenue and financial results because we currently monetize users in different geographies at different average rates. Our revenue and ARPU in regions such as United States & Canada and Europe are relatively higher primarily due to the size and maturity of those online and mobile advertising markets. For example, ARPU in the secondfirst quarter of 20172018 in the United States & Canada region was more than nine times higher than in the Asia-Pacific region.
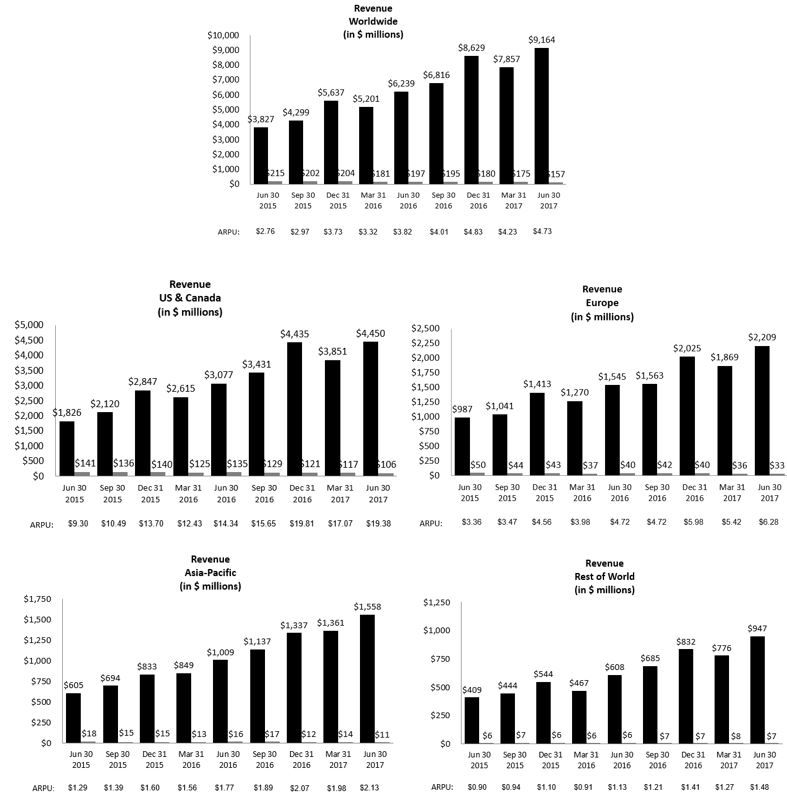
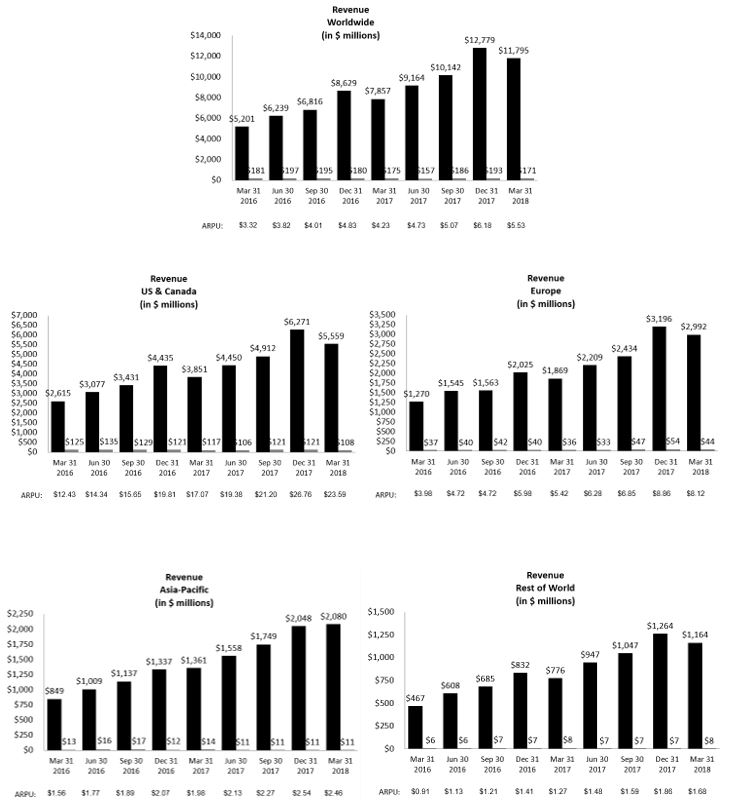

Note: Our revenue by user geography in the charts above is geographically apportioned based on our estimation of the geographic location of our users when they perform a revenue-generating activity. This allocation differs from our revenue disaggregated by geography disclosure in our condensed consolidated financial statements where revenue is geographically apportioned based on the location of the marketer or developer. In late 2015, we discovered an error in the algorithm we used to attribute our revenue by user geography. While this issue did not affect our overall worldwide revenue, it did affect our attribution of revenue to different geographic regions. The fourth quarter of 2015 revenue by user geography and ARPU amounts for all regions were adjusted to reflect this reclassification.customer.
During the secondfirst quarter of 2017,2018, worldwide ARPU was $4.73,$5.53, an increase of 24%31% from the secondfirst quarter of 2016.2017. Over this period, ARPU increased by 35%50% in Europe, 38% in United States & Canada, 33% in Europe, 31%32% in Rest of World, and 20%24% in Asia-Pacific. In addition, user growth was more rapid in geographies with relatively lower ARPU, such as Asia-Pacific and Rest of World. We expect that user growth in the future will be primarily concentrated in those regions where ARPU is relatively lower, such that worldwide ARPU may continue to increase at a slower rate relative to ARPU in any geographic region, or potentially decrease even if ARPU increases in each geographic region.
Components of Results of Operations
Revenue
Advertising. We generate substantially all of our revenue from advertising. Our advertising revenue is generated by displaying ad products on Facebook, Instagram, Messenger, and third-party affiliated websites or mobile applications. Marketers pay for ad products either directly or through their relationships with advertising agencies, based on the number of clicks made by people,impressions delivered or the number of actions, such as clicks, taken by people, or the number of impressions delivered. We recognize revenue from the delivery of click-based ads in the period in which a person clicks on the content, and action-based ads in the period in which a person takes the action the marketer contracted for.users. We recognize revenue from the display of impression-based ads in the contracted period in which the impressions are delivered. Impressions are considered delivered when an ad is displayed to people.a user. We recognize revenue from the delivery of action-based ads in the period in which a user takes the action the marketer contracted for. The number of ads we show is subject to methodological changes as we continue to evolve our ads business and the structure of our ads products. We calculate price per ad as total ad revenue divided by the number of ads delivered, representing the effective price paid per impression by a marketer regardless of their desired objective such as impression click, or action. For advertising revenue arrangements where we are not the primary obligor,principal, we recognize revenue on a net basis.
Payments and other fees. We enable Payments from people to purchase virtual and digital goods from our developers. People can transact and make payments onrevenue is comprised of the Facebook website by using debit and credit cards, PayPal, mobile phone payments, gift cards, or other methods. Wenet fee we receive a fee from developers when people make purchases in these applications using our Payments infrastructure. We recognize revenue net of amounts remitted to our developers. We have mandated the use of our Payments infrastructure for game applications on Facebook, and fees related to Payments are generated almost exclusively from games. Our other fees revenue, which has not been significant in recent periods, consists primarily of revenue from the delivery of virtual reality platform devices, and related platform sales.various other sources.
Cost of Revenue and Operating Expenses
Cost of revenue. Our cost of revenue consists primarily of expenses associated with the delivery and distribution of our products. These include expenses related to the operation of our data centers, such as facility and server equipment depreciation, salaries, benefits, and share-based compensation for employees on our operations teams, and energy and bandwidth costs. Cost of revenue also includes costs associated with partner arrangements, including traffic acquisition and content acquisition costs, credit card and other transaction fees related to processing customer transactions, costs associated with partner arrangements, amortization of intangible assets, and cost of virtual reality platform device inventory sold.sold, and amortization of intangible assets.
Research and development. Research and development expenses consist primarily of share-based compensation, salaries, and benefits for employees on our engineering and technical teams who are responsible for building new products as well as improving existing products. We expense all of our research and development costs as they are incurred.
Marketing and sales. Our marketing and sales expenses consist of salaries, share-based compensation, and benefits for our employees engaged in sales, sales support, marketing, business development, and customer service functions. Our marketing and sales expenses also include marketing and promotional expenditures, professional services such as content reviewers, as well as amortization of intangible assets.
General and administrative. The majority of our general and administrative expenses consist of salaries, benefits, and share-based compensation for certain of our executives as well as our legal, finance, human resources, corporate communications and policy, and other administrative employees. In addition, general and administrative expenses include legal-related costs and professional services.
Results of Operations
The following tables set forth our condensed consolidated statements of income data:
| | | | Three Months Ended June 30, | | Six Months Ended June 30, | Three Months Ended March 31, |
| | 2017 | | 2016 | | 2017 | | 2016 | 2018 | | 2017 |
| | (in millions) | (in millions) |
| Revenue | $ | 9,321 |
| | $ | 6,436 |
| | $ | 17,353 |
| | $ | 11,818 |
| $ | 11,966 |
| | $ | 8,032 |
|
| Costs and expenses: | | | | | | | | | | |
| Cost of revenue | 1,237 |
| | 917 |
| | 2,395 |
| | 1,755 |
| 1,927 |
| | 1,159 |
|
| Research and development | 1,919 |
| | 1,471 |
| | 3,753 |
| | 2,814 |
| 2,238 |
| | 1,834 |
|
| Marketing and sales | 1,124 |
| | 901 |
| | 2,181 |
| | 1,728 |
| 1,595 |
| | 1,057 |
|
| General and administrative | 640 |
| | 413 |
| | 1,295 |
| | 778 |
| 757 |
| | 655 |
|
| Total costs and expenses | 4,920 |
| | 3,702 |
| | 9,624 |
| | 7,075 |
| 6,517 |
| | 4,705 |
|
| Income from operations | 4,401 |
| | 2,734 |
| | 7,729 |
| | 4,743 |
| 5,449 |
| | 3,327 |
|
| Interest and other income, net | 87 |
| | 20 |
| | 168 |
| | 78 |
| 161 |
| | 81 |
|
| Income before provision for income taxes | 4,488 |
| | 2,754 |
| | 7,897 |
| | 4,821 |
| 5,610 |
| | 3,408 |
|
| Provision for income taxes | 594 |
| | 471 |
| | 938 |
| | 800 |
| 622 |
| | 344 |
|
| Net income | $ | 3,894 |
| | $ | 2,283 |
| | $ | 6,959 |
| | $ | 4,021 |
| $ | 4,988 |
| | $ | 3,064 |
|
Share-based compensation expense included in costs and expenses:
| | | | Three Months Ended June 30, | | Six Months Ended June 30, | Three Months Ended March 31, |
| | 2017 | | 2016 | | 2017 | | 2016 | 2018 | | 2017 |
| | (in millions) | | | |
| Cost of revenue | $ | 47 |
| | $ | 29 |
| | $ | 81 |
| | $ | 51 |
| $ | 56 |
| | $ | 34 |
|
| Research and development | 787 |
| | 631 |
| | 1,457 |
| | 1,217 |
| 718 |
| | 670 |
|
| Marketing and sales | 120 |
| | 95 |
| | 216 |
| | 177 |
| 109 |
| | 96 |
|
| General and administrative | 78 |
| | 62 |
| | 145 |
| | 118 |
| 72 |
| | 67 |
|
| Total share-based compensation expense | $ | 1,032 |
| | $ | 817 |
| | $ | 1,899 |
| | $ | 1,563 |
| $ | 955 |
| | $ | 867 |
|
The following tables set forth our condensed consolidated statements of income data (as a percentage of revenue):
| | | | Three Months Ended June 30, | | Six Months Ended June 30, | Three Months Ended March 31, |
| | 2017 | | 2016 | | 2017 | | 2016 | 2018 | | 2017 |
| Revenue | 100 | % | | 100 | % | | 100 | % | | 100 | % | 100 | % | | 100 | % |
| Costs and expenses: | | | | | | | | | | |
| Cost of revenue | 13 |
| | 14 |
| | 14 |
| | 15 |
| 16 |
| | 14 |
|
| Research and development | 21 |
| | 23 |
| | 22 |
| | 24 |
| 19 |
| | 23 |
|
| Marketing and sales | 12 |
| | 14 |
| | 13 |
| | 15 |
| 13 |
| | 13 |
|
| General and administrative | 7 |
| | 6 |
| | 7 |
| | 7 |
| 6 |
| | 8 |
|
| Total costs and expenses | 53 |
| | 58 |
| | 55 |
| | 60 |
| 54 |
| | 59 |
|
| Income from operations | 47 |
| | 42 |
| | 45 |
| | 40 |
| 46 |
| | 41 |
|
| Interest and other income, net | 1 |
| | — |
| | 1 |
| | 1 |
| 1 |
| | 1 |
|
| Income before provision for income taxes | 48 |
| | 43 |
| | 46 |
| | 41 |
| 47 |
| | 42 |
|
| Provision for income taxes | 6 |
| | 7 |
| | 5 |
| | 7 |
| 5 |
| | 4 |
|
| Net income | 42 | % | | 35 | % | | 40 | % | | 34 | % | 42 | % | | 38 | % |
Share-based compensation expense included in costs and expenses (as a percentage of revenue):
| | | | Three Months Ended June 30, | | Six Months Ended June 30, | Three Months Ended March 31, |
| | 2017 | | 2016 | | 2017 | | 2016 | 2018 | | 2017 |
| Cost of revenue | 1 | % | | — | % | | — | % | | — | % | — | % | | — | % |
| Research and development | 8 |
| | 10 |
| | 8 |
| | 10 |
| 6 |
| | 8 |
|
| Marketing and sales | 1 |
| | 1 |
| | 1 |
| | 1 |
| 1 |
| | 1 |
|
| General and administrative | 1 |
| | 1 |
| | 1 |
| | 1 |
| 1 |
| | 1 |
|
| Total share-based compensation expense | 11 | % | | 13 | % | | 11 | % | | 13 | % | 8 | % | | 11 | % |
Three and Six Months Ended June 30,March 31, 20172018 and 20162017
| | | | Three Months Ended June 30, | | | | Six Months Ended June 30, | | | Three Months Ended March 31, | | |
| | 2017 | | 2016 | | % change | | 2017 | | 2016 | | % change | 2018 | | 2017 | | % change |
| | (in millions, except for percentages) | (in millions, except for percentages) |
| Advertising | $ | 9,164 |
| | $ | 6,239 |
| | 47 | % | | $ | 17,021 |
| | $ | 11,440 |
| | 49 | % | $ | 11,795 |
| | $ | 7,857 |
| | 50 | % |
| Payments and other fees | 157 |
| | 197 |
| | (20 | )% | | 332 |
| | 378 |
| | (12 | )% | 171 |
| | 175 |
| | (2 | )% |
| Total revenue | $ | 9,321 |
| | $ | 6,436 |
| | 45 | % | | $ | 17,353 |
| | $ | 11,818 |
| | 47 | % | $ | 11,966 |
| | $ | 8,032 |
| | 49 | % |
Revenue in the secondfirst quarter and the first six months of 20172018 increased $2.89$3.93 billion, or 45%, and $5.54 billion, or 47%, respectively,49% compared to the same periodsperiod in 2016.2017. The increases wereincrease was mostly due to increasesan increase in advertising revenue.
The most important factor driving advertising revenue growth was an increase in revenue from ads in News Feed.on mobile devices. For the secondfirst quarter and the first six months of 2017,2018, we estimate that mobile advertising revenue represented approximately 87% and 86%, respectively,91% of total advertising revenue, as compared with approximately 84% and 83%, respectively,85% in the same periodsperiod in 2016.2017. Factors that influenced our advertising revenue growth in the secondfirst quarter and the first six months of 20172018 included (i) an increase in demand for ouraverage price per ad, inventory, in part driven by an increase in the number of marketers actively advertising on Facebook, (ii) an increase in users and their engagement, and (iii) an increase in the number and frequency of ads displayed in News Feed, as well as the quality, relevance,on mobile devices. We anticipate that future advertising revenue growth will be driven by a combination of price and performance of those ads. However, we anticipate increasesgrowth in the number and frequency of ads displayed in News Feed will be a less significant driver of our revenue growth in the future.
displayed.
During the secondfirst quarter and first six months of 2017, as compared to the same periods in 2016,2018, the average price per ad increased by 24% and 19%, respectively,39% as compared with approximately 14% in the same period in 2017, and the number of ads delivered increased by 19% and 25%, respectively.8% as compared with approximately 32% in the same period in 2017. The increase in average price per ad was driven by an increase in demand for our ad inventory.inventory; factors contributing to this include an increase in spend from existing marketers and an increase in the number of marketers actively advertising on our platform as well as the quality, relevance, and performance of those ads. The increase in the ads delivered was driven by the same factors that influenced our advertising revenue growth, partially offset by increasing useran increase in users and their engagement, with video content and other product changes.
Payments and other fees revenuean increase in the second quarternumber and the first six monthsfrequency of 2017 decreased $40 million, or 20%, and $46 million, or 12%, respectively, compared to the same periods in 2016. The decreases in Payments and other fees revenue were mostly due to decreased Payments revenue from games played on personal computers. We anticipate Payments and other fees
revenue will continue to decline in 2017.ads displayed across our products.
Foreign Exchange Impact on Revenue
The general strengtheningweakening of the U.S. dollar relative to certain foreign currencies from the second quarter andin the first six monthsquarter of 20162018 compared to the same periodsperiod in 2017 had an unfavorablea favorable impact on our revenue.
If we had translated revenue for the secondfirst quarter ended June 30, 2017March 31, 2018 using the prior year's monthly exchange rates for our settlement currencies other than the U.S. dollar, our total revenue and advertising revenue would have been $9.46$11.43 billion and $9.31$11.26 billion, respectively. Using these constant rates, both total revenue and advertising revenue would have been $141 million higher than actual total revenue and advertising revenue for the second quarter of 2017. If we had translated revenue for the six months ended June 30, 2017 using the prior year's monthly exchange rates for our settlement currencies other than the U.S. dollar, our total revenue and advertising revenue would have been $17.52 billion and $17.18 billion, respectively. Using these constant rates, total revenue and advertising revenue would have been $164$536 million and $163$535 million higherlower than actual total revenue and advertising revenue, respectively, for the first six monthsquarter of 2017.2018.
Cost of revenue
| | | | Three Months Ended June 30, | | | | Six Months Ended June 30, | | | Three Months Ended March 31, | | |
| | 2017 | | 2016 | | % change | | 2017 | | 2016 | | % change | 2018 | | 2017 | | % change |
| | (in millions, except for percentages) | (in millions, except for percentages) |
| Cost of revenue | $ | 1,237 |
| | $ | 917 |
| | 35 | % | | $ | 2,395 |
| | $ | 1,755 |
| | 36 | % | $ | 1,927 |
| | $ | 1,159 |
| | 66 | % |
| Percentage of revenue | 13 | % | | 14 | % | | | | 14 | % | | 15 | % | | | 16 | % | | 14 | % | | |
Cost of revenue in the secondfirst quarter and the first six months of 20172018 increased $320$768 million, or 35%66%, and $640 million, or 36%, respectively, compared to the same periodsperiod in 2016.2017. The majority of the increases in both periods wereincrease was mostly due to increasesan increase in operational expenses related to our data centers and technical infrastructure, and, to a lesser extent, higher costs associated with partnership agreements, including traffic acquisition and content acquisition costs, and ads payment processing and partnership arrangements.processing.
Research and development
| | | | Three Months Ended June 30, | | | | Six Months Ended June 30, | | | Three Months Ended March 31, | | |
| | 2017 | | 2016 | | % change | | 2017 | | 2016 | | % change | 2018 | | 2017 | | % change |
| | (in millions, except for percentages) | (in millions, except for percentages) |
| Research and development | $ | 1,919 |
| | $ | 1,471 |
| | 30 | % | | $ | 3,753 |
| | $ | 2,814 |
| | 33 | % | $ | 2,238 |
| | $ | 1,834 |
| | 22 | % |
| Percentage of revenue | 21 | % | | 23 | % | | | | 22 | % | | 24 | % | | | 19 | % | | 23 | % | | |
Research and development expenses in the secondfirst quarter and the first six months of 20172018 increased $448$404 million, or 30%22%, and $939 million, or 33%, respectively, compared to the same periodsperiod in 2016.2017. The substantial majority of the increases in both periods wereincrease was due to increasesan increase in payroll and benefits as a result of a 48% increase50% growth in employee headcount from June 30, 2016March 31, 2017 to June 30, 2017March 31, 2018 in engineering and other technical functions. In addition, our equipment and related expenses to support our research and development efforts increasedThis increase was partially offset by lower acquisition-related share-based compensation in both the second quarter and the first six monthsquarter of 2017,2018, compared to the same periodsperiod in 2016.
2017. The increase was also offset by the change in fair value of our contingent consideration liability that only impacted the first quarter of 2017.
Marketing and sales
| | | | Three Months Ended June 30, | | | | Six Months Ended June 30, | | | Three Months Ended March 31, | | |
| | 2017 | | 2016 | | % change | | 2017 | | 2016 | | % change | 2018 | | 2017 | | % change |
| | (in millions, except for percentages) | (in millions, except for percentages) |
| Marketing and sales | $ | 1,124 |
| | $ | 901 |
| | 25 | % | | $ | 2,181 |
| | $ | 1,728 |
| | 26 | % | $ | 1,595 |
| | $ | 1,057 |
| | 51 | % |
| Percentage of revenue | 12 | % | | 14 | % | | | | 13 | % | | 15 | % | | | 13 | % | | 13 | % | | |
Marketing and sales expenses in the secondfirst quarter and the first six months of 20172018 increased $223$538 million, or 25%51%, and $453 million, or 26%, respectively, compared to the same periodsperiod in 2016.2017. The majority of the increase was due to $345 million increases in both periodsour marketing as well as other professional services expenses in the first quarter of 2018 compared to the same period in 2017. Our payroll and benefits expenses also increased as a result of a 36% increase in employee headcount from March 31, 2017 were partiallyto March 31, 2018 in our marketing and sales functions.
General and administrative
|
| | | | | | | | | | |
| | Three Months Ended March 31, | | |
| | 2018 | | 2017 | | % change |
| | (in millions, except for percentages) |
| General and administrative | $ | 757 |
| | $ | 655 |
| | 16 | % |
| Percentage of revenue | 6 | % | | 8 | % | | |
General and administrative expenses in the first quarter of 2018 increased $102 million, or 16%, compared to the same period in 2017. The increase was due to increasesan increase in payroll and benefits expenses as a result of a 30%61% increase in employee headcount from June 30, 2016March 31, 2017 to June 30, 2017March 31, 2018 in our marketinggeneral and sales functions. Additionally,administrative functions, offset by lower legal-related costs in the secondfirst quarter and the first six months of 2017, our marketing expenses increased $61 million and $124 million, respectively, and our professional services expense increased $50 million and $114 million, respectively, due to higher consulting and other professional service fees,2018 compared to the same periodsperiod in 2016.2017.
General and administrative
|
| | | | | | | | | | | | | | | | | | | | | |
| | Three Months Ended June 30, | | | | Six Months Ended June 30, | | |
| | 2017 | | 2016 | | % change | | 2017 | | 2016 | | % change |
| | (in millions, except for percentages) |
| General and administrative | $ | 640 |
| | $ | 413 |
| | 55 | % | | $ | 1,295 |
| | $ | 778 |
| | 66 | % |
| Percentage of revenue | 7 | % | | 6 | % | | | | 7 | % | | 7 | % | | |
General and administrative expenses in the second quarter and the first six months of 2017 increased $227 million, or 55%, and $517 million, or 66%, respectively, compared to the same periods in 2016. The majority of the increases in both periods were due to increases in legal-related costs, and to a lesser extent, payroll and benefits expenses as a result of a 47% increase in employee headcount from June 30, 2016 to June 30, 2017 in general and administrative functions.
Interest and other income, net
| | | | Three Months Ended June 30, | | | | Six Months Ended June 30, | | | Three Months Ended March 31, | | |
| | 2017 | | 2016 | | % change | | 2017 | | 2016 | | % change | 2018 | | 2017 | | % change |
| | (in millions, except for percentages) | (in millions, except for percentages) |
| Interest income, net | $ | 91 |
| | $ | 32 |
| | 184 | % | | $ | 158 |
| | $ | 60 |
| | 163 | % | $ | 145 |
| | $ | 67 |
| | 116 | % |
| Other (expense) income, net | (4 | ) | | (12 | ) | | (67 | )% | | 10 |
| | 18 |
| | (44 | )% | |
| Other income, net | | 16 |
| | 14 |
| | 14 | % |
| Interest and other income, net | $ | 87 |
| | $ | 20 |
| | NM | | $ | 168 |
| | $ | 78 |
| | 115 | % | $ | 161 |
| | $ | 81 |
| | 99 | % |
Interest and other income, net in the secondfirst quarter and the first six months of 20172018 increased $67$80 million and $90 million, respectively, compared to the same periodsperiod in 2016.2017. The increases in both periods were primarilysubstantial majority of the increase was due to increasesan increase in interest income driven by higher invested cash balances and interest rates. In addition, for the first six months, such increase was partially offset by the foreign exchange impact resulting from the periodic re-measurement of our foreign currency monetary assets and liabilities.
Provision for income taxes
| | | | Three Months Ended June 30, | | | | Six Months Ended June 30, | | | Three Months Ended March 31, | | |
| | 2017 | | 2016 | | % change | | 2017 | | 2016 | | % change | 2018 | | 2017 | | % change |
| | (in millions, except for percentages) | (in millions, except for percentages) |
| Provision for income taxes | $ | 594 |
| | $ | 471 |
| | 26 | % | | $ | 938 |
| | $ | 800 |
| | 17 | % | $ | 622 |
| | $ | 344 |
| | 81 | % |
| Effective tax rate | 13 | % | | 17 | % | | | | 12 | % | | 17 | % | | | 11 | % | | 10 | % | | |
Our provision for income taxes in the secondfirst quarter and the first six months of 20172018 increased $123$278 million, or 26%81%, and $138 million, or 17%, respectively, compared to the same periodsperiod in 2016, mostly2017, primarily due to increasesan increase in income before provision for income taxes, partially offset by decreasestaxes.
The increase in our effective tax rate in the effective tax rates.
Our effective tax rates in the secondfirst quarter and the first six months of 2017 decreased2018 compared to the same periodsperiod in 2016, primarily2017 was mostly due to increases in income before provision for income taxes being earned in jurisdictions with a new minimum tax rate lower than that of the U.S. statutory rate where we plan to indefinitely reinvest aon certain portion of thoseforeign earnings, partially offset by decreasesa decrease in the U.S. statutory tax rate benefit from share-based compensation. In35% to 21%, both of which were changes resulting from the second quarterenactment of the 2017 Tax Cuts and the first six months of 2017, excess tax benefits recognized from share-based compensation decreased our provision for income taxes by $275 million and $577 million, respectively, and our effective tax rates by six and seven percentage points, respectively, as compared to the tax rate without such benefits. For comparison, in the second quarter and the first six months of 2016, excess tax benefits recognized from share-based compensation decreased our provision for income taxes by $236 million and $462 million, respectively, and our effective tax rates by nine and ten percentage points, respectively, as compared to the tax rate without such benefits.Jobs Act (the Tax Act).
Effective Tax Rate Items. Our effective tax rate in the future will depend upon the proportion of our income before provision for income taxes earned in the United States and in jurisdictions with a tax rate lower than the U.S. statutory rate, where we plan to indefinitely reinvest a certain portion of those earnings, as well as a number of other factors, including excess tax benefits from share-based compensation, tax effects of integrating intellectual property from acquisitions, settlement of tax contingency items, tax effects of changes in our business, and the impact of new legislation, and timing and amount of discrete items.legislation.
The portion of our income before provision for income taxes earned in jurisdictions with a tax rate lower than the U.S. statutory rate will depend upon the proportion of revenue and costs associated with the respective jurisdictions. Our ability to indefinitely reinvest those future earnings will depend upon the amount, location, and cost of deploying those earnings to where they are needed by the business.
Integrating intellectual property from acquisitions into our business generally involves intercompany transactions that have the impact of increasing our provision for income taxes. Consequently, our provision for income taxes and our effective tax rate may initially increase followingin the period of an acquisition and integration. The magnitude of this impact will depend upon the specific type, size, and taxing jurisdictions of the intellectual property as well as the relative contributionscontribution to income in subsequent periods.
The tax effects of the accounting for share-based compensation will increase or decrease our effective tax rate based upon the difference between our share-based compensation expense and the deductions taken on our tax return which depends upon the stock price at the time of employee award vesting.
WeAbsent unanticipated events and unexpected effects of the Tax Act, we anticipate our effective tax rate in 2018 will be lower than it was in 2017. Our 2017 effective tax rate was significantly affected by the Tax Act. In addition, since we recognize excess tax benefits on a discrete basis, and we anticipate that our effective tax rate will vary from quarter to quarter depending on our stock price in each period. If our stock price remains constant to the July 24, 2017April 23, 2018 price, we expectanticipate that our third quartereffective tax rate for the remaining quarters of the year and the full year rates will be similar to the ratehigher than it was in the second quarter.first quarter of 2018.
Unrecognized Tax Benefits. As of June 30, 2017, ourMarch 31, 2018, we had net unrecognized tax benefits of $2.65 billion which were accrued as current liabilities of $25 million and other liabilities of $2.63 billion,liabilities. These unrecognized tax benefits were predominantly accrued for uncertainties related to transfer pricing with our foreign subsidiaries, which includes licensing of intellectual property, providing services and other transactions, as well as for uncertainties with our research tax credits. The ultimate settlement of the liabilities will depend upon resolution of tax audits, litigation, or events that would otherwise change the assessment of such items. Based upon the status of litigation described below
and the current status of tax audits in various jurisdictions, we do not anticipate a significant impact to such amounts within the next 12 months.
In July 2016, we received a Statutory Notice of Deficiency (Notice) from the IRS related to transfer pricing with our foreign subsidiaries in conjunction with the examination of the 2010 tax year. While the Notice applies only to the 2010 tax year, the IRS states that it will also apply its position for tax years subsequent to 2010, which, if the IRS prevails in its position, could result in an additional federal tax liability of an estimated, aggregatedaggregate amount of up to approximately $3.0 billion to $5.0 billion in excess of the amounts in our originally filed U.S. return, plus interest and any penalties asserted. We do not agree with the position of the IRS and have filed a petition in the United States Tax Court challenging the Notice. As of March 31, 2018, we have not resolved this matter, and proceedings continue in the United States Tax Court. In March 2018, we received a second Notice from the IRS in conjunction with the examination of our 2011 through 2013 tax years. The IRS applied its position from the 2010 tax year to each of these years and also proposed new adjustments related to other transfer pricing with our foreign subsidiaries and certain tax credits that we claimed. If the IRS prevails in its position for these new adjustments, this could result in an additional federal tax liability of up to approximately $680 million in excess of the amounts in our originally filed U.S. return, plus interest and any penalties asserted. We do not agree with the positions of the IRS in the second Notice and we will file a petition in the United States Tax Court challenging the Notice. We have previously accrued an estimated unrecognized tax benefit consistent with the guidance in ASC 740 that is lower than the potential additional federal tax liability of $3.0 billionfrom the positions taken by the IRS in the two Notices. In addition, if the IRS prevails in its positions, related to $5.0 billiontransfer pricing with our foreign subsidiaries, the additional tax that we would owe would be partially offset by a reduction in excessthe tax that we owe under the mandatory transition tax on accumulated foreign earnings from the Tax Act.
We believe that adequate amounts have been reserved in accordance with ASC 740 for any adjustments to the provision for income taxes or other tax items that may ultimately result from these examinations. Although the timing of the amountsresolution, settlement, and closure of any audits is highly uncertain, it is reasonably possible that the balance of gross unrecognized tax benefits could significantly change in our originally filed U.S. return, plus interest and penalties.the next 12 months. Given the number of years remaining that are subject to examination, we are unable to estimate the full range of possible adjustments to the balance of gross unrecognized tax benefits. If the IRS prevailstaxing authorities prevail in the assessment of additional tax due, based on its position, the assessed tax, interest, and penalties, if any, could have a material adverse impact on our financial position, results of operations, orand cash flows. As of June 30, 2017, we have not resolved this matter and proceedings continue in the United States Tax Court. We believe that adequate amounts have been reserved for any adjustments that may ultimately result from these examinations.
We expect to continue to accrue unrecognized tax benefits for certain recurring tax positions and anticipate that the amount for future quarters accrued will be similar to the second quarter and the first six months of 2017. Absent any unanticipated event, we do not expect our unrecognized tax benefits will have a significant impact on our effective tax rate in 2017.
Liquidity and Capital Resources
Our principal sources of liquidity are our cash and cash equivalents, marketable securities, and cash generated from operations. Cash and cash equivalents, and marketable securities consist mostlyprimarily of cash on deposit with banks, investments in money market funds, and investments in U.S. government agency securities, U.S. government agency securities, and corporate debt securities. Cash and cash equivalents, and marketable securities were $35.45$43.96 billion as of June 30, 2017,March 31, 2018, an increase of $6.00$2.25 billion from December 31, 2016,2017, mostly due to $10.42$7.86 billion of cash generated from operations, partially offset by $2.72$2.81 billion for purchases of property and equipment, $1.50$1.77 billion for repurchases of our Class A common stock, and $832 million of taxes paid related to net share settlement of equity awards, and $378 million for repurchases of our Class A common stock.awards.
Cash paid for income taxes (net of refunds) was $1.36 billion$736 million for the first six monthsquarter of 2017.2018. As of June 30, 2017,March 31, 2018, our federal net operating loss carryforward was $3.74$5.76 billion, and we anticipate that none of this amount will be utilized to offset our federal taxable income in 2017.2018. As of June 30, 2017,March 31, 2018, we had $104$158 million of federal tax credits, of which none will be available to offset our federal tax liabilities in 2017.2018.
In May 2016, we entered into a five-year$2.0 billion senior unsecured revolving credit facility, that allows us to borrow up to $2.0 billion. Anyand any amounts outstanding under thisthe facility will be due and payable on May 20, 2021. As of June 30, 2017,March 31, 2018, no amounts had been drawn down and we were in compliance with the covenants under this credit facility.
In November 2016, our board of directors authorized a $6.0 billion share repurchase program of our Class A common stock that commenced in 2017 and does not have an expiration date. The timing and actual number of shares repurchased depend on a variety of factors, including price, general business and market conditions, and other investment opportunities, and shares may be repurchased through open market purchases or privately negotiated transactions, including through the use of trading plans intended to qualify under Rule 10b5-1 under the Securities Exchange Act of 1934 (Exchange Act).stock. During the sixthree months ended June 30, 2017,March 31, 2018, we repurchased and subsequently retired approximately 311 million shares of our Class A common stock for an aggregate amount of approximately $408 million.
$1.91 billion. As of March 31, 2018, approximately $2.0 billion remained available under this authorization. In January 2017, we began funding withholding taxes due on employee equity awards by net share settlement, rather than our previous approach of requiring employees to sell sharesApril 2018, this authorization for the repurchase of our Class A common stock to cover taxes upon vesting of such awards. was increased by an additional $9.0 billion.
In the first six monthsquarter of 2017,2018, we paid $1.50 billion$832 million of taxes related to the net share settlement of equity awards.
As of June 30, 2017, $9.91March 31, 2018, $20.14 billion of the $35.45$43.96 billion in cash and cash equivalents and marketable securities was held by our foreign subsidiaries. We have provided residualThe Tax Act imposed a mandatory transition tax on accumulated foreign earnings and eliminated U.S. taxes for the portion ofon foreign subsidiary distributions. As a result, earnings in foreign jurisdictions where we do not intendare available for distribution to indefinitely reinvest such earnings of the local subsidiary.U.S. without incremental U.S. taxes.
We currently anticipate that our available funds, credit facility, and cash flow from operations will be sufficient to meet our operational cash needs for the foreseeable future.
Cash Provided by Operating Activities
Cash flow from operating activities during the first six monthsquarter of 2017 mostly2018 primarily consisted of net income, adjusted for certain non-cash items, such as share-based compensation expense of $1.90 billion$955 million and total depreciation and amortization of $1.40 billion.$949 million. The increase in cash flow from operating activities during the first six monthsquarter of 2017,2018, compared to the same period in 2016,2017, was mostlyprimarily due to an increase in net income, as adjusted for certain non-cash items, such as depreciation and amortization and share-based compensation expense and depreciation and amortization.expense.
Cash Used in Investing Activities
Cash used in investing activities was $11.33$1.29 billion for the first six monthsquarter of 2017, mostly due to $8.642018 and consisted of $2.81 billion for net purchases of marketable securities, and $2.72 billion for capital expenditures as we continued to invest in servers, data centers, servers, network infrastructure and office buildings, offset by $1.58 billion of net sales and network infrastructure.maturities of marketable securities. The increasedecrease in cash used in investing activities during the first six monthsquarter of 2017,2018, compared to the same period in 2016,2017, was primarily due to a decrease in net purchases of marketable securities.securities, partially offset by an increase in capital expenditures.
We anticipate making capital expenditures in 20172018 of approximately $7.0 billion to $7.5$15.0 billion.
Cash Used in Financing Activities
Cash used in financing activities during the first six monthsquarter of 20172018 mostly consisted of $1.50$1.77 billion for repurchases of our Class A common stock, and $832 million of taxes paid related to net share settlement of equity awards, and $378 million for repurchasesawards. The substantial majority of our Class A common stock. Thethe increase in cash used in financing activities during the first six monthsquarter of 2017,2018, compared to the same period in 2016,2017, was mostly due to taxes paid related to net share settlement of equity awards andan increase in repurchases of our Class A common stock that commenced in 2017, partially offset by the reduction in payments on capital lease and other financing obligations.
stock.
Off-Balance Sheet Arrangements
We did not have any off-balance sheet arrangements as of June 30, 2017.March 31, 2018.
Contractual Obligations
ExceptOur principal commitments consist of obligations under operating leases, which include among others, certain of our offices, data center, and colocation leases, as disclosedwell as contractual commitments related to network infrastructure and data center operations. The following table summarizes our commitments to settle contractual obligations in Note 8 — Commitmentscash as of March 31, 2018 (in millions):
|
| | | | | | | | | | | | | | | | | | | |
| | | | Payment Due by Period |
| | Total | | The remainder of 2018 | | 2019-2020 | | 2021-2022 | | Thereafter |
| Operating lease obligations | $ | 7,569 |
| | $ | 351 |
| | $ | 1,203 |
| | $ | 1,298 |
| | $ | 4,717 |
|
Financing obligation - building in progress - leased facility(1) | 195 |
| | — |
| | 16 |
| | 30 |
| | 149 |
|
Other contractual commitments(2) | 3,491 |
| | 1,901 |
| | 593 |
| | 135 |
| | 862 |
|
| Total contractual obligations | $ | 11,255 |
| | $ | 2,252 |
| | $ | 1,812 |
| | $ | 1,463 |
| | $ | 5,728 |
|
| |
| (1) | Financing obligation - building in progress - leased facility represents our commitments to lease certain office buildings that are currently under construction. As of March 31, 2018, $98 million of the total obligation was recorded as a liability and is included in other liabilities on our condensed consolidated balance sheets. See Note 8 of the accompanying notes to our condensed consolidated financial statements for additional information related to this financing obligation. |
| |
| (2) | Other contractual commitments primarily relate to network infrastructure and our data center operations. |
As part of the normal course of the business, we may enter into multi-year agreements to purchase certain network components that do not specify a fixed or minimum price commitment or to purchase renewable energy that do not specify a fixed or minimum volume commitment. These agreements are generally entered into in order to secure either volume or price. Using projected market prices or expected volume consumption, the total estimated spend is approximately $7.0 billion. The ultimate spend under these agreements may vary and Contingencieswill be based on prevailing market prices or actual volume purchased.
In addition, our other liabilities include $2.65 billion related to uncertain tax positions as of March 31, 2018. Due to uncertainties in the notestiming of the completion of tax audits, the timing of the resolution of these positions is uncertain and we are unable to make a reasonably reliable estimate of the condensed consolidated financial statementstiming of payments in individual years beyond 12 months. As a result, this amount is not included in Part I, Item 1, there were no material changes in our commitments underthe above contractual obligations as disclosed in our Annual Report on Form 10-K for the fiscal year ended December 31, 2016.table.
Contingencies
We are involved in legal proceedings, claims, and regulatory, tax or government inquiries and investigations. We record a provision for a liability when we believe that it is both probable that a liability has been incurred, and that the amount can be reasonably estimated. If we determine that a loss is reasonably possible and the loss or range of loss can be estimated, we disclose the possible loss in the accompanying notes to the consolidated financial statements. Significant judgment is required to determine both probability and the estimated amount.amount of loss. Such matters are inherently unpredictable and subject to significant uncertainties, some of which are beyond our control. Should any of these estimates and assumptions change or prove to be incorrect, it could have a material impact on our results of operations, financial position, and cash flows.
See Note 8 — Commitments and Contingencies and Note 10 — Income Taxes in the notes to the condensed consolidated financial statements included in Part I, Item 1, and "Legal Proceedings" contained in Part II, Item 1 of this Quarterly Report on Form 10-Q for additional information regarding contingencies.
Recently Issued Accounting Pronouncements
In May 2014, the Financial Accounting Standards Board (FASB) issued Accounting Standards Update No. 2014-09, Revenue from Contracts with Customers (Topic 606) (ASU 2014-09), which amends the existing accounting standards for revenue recognition. In August 2015, the FASB issued ASU No. 2015-14, Revenue from Contracts with Customers (Topic 606): Deferral of the Effective Date, which delays the effective date of ASU 2014-09 by one year. The FASB also agreed to allow entities to choose to adopt the standard as of the original effective date. In March 2016, the FASB issued Accounting Standards Update No. 2016-08, Revenue from Contracts with Customers (Topic 606): Principal versus Agent Considerations (Reporting Revenue Gross versus Net) (ASU 2016-08) which clarifies the implementation guidance on principal versus agent considerations. The guidance includes indicators to assist an entity in determining whether it controls a specified good or service before it is transferred to the customers. The new standard further requires new disclosures about contracts with customers, including the significant judgments the registrant has made when applying the guidance. We will be adopting the new standard effective January 1, 2018. The new standard also permits two methods of adoption: retrospectively to each prior reporting period presented (full retrospective method), or retrospectively with the cumulative effect of initially applying the guidance recognized at the date of initial application (the modified retrospective method). We currently anticipate adopting the standard using the modified retrospective method. While we are still in the process of completing our analysis on the impact this guidance will have on our consolidated financial statements, related disclosures, and our internal controls over financial reporting, we do not expect the impact to be material.
In February 2016, the FASB issued Accounting Standards Update No. 2016-02, Leases (Topic 842) (ASU 2016-02), which generally requires companies to recognize operating and financing lease liabilities and corresponding right-of-use assets on the balance sheet. This guidance will be effective for us in the first quarter of 2019 on a modified retrospective basis and early adoption is permitted. We currently anticipate adoptingwill adopt the new standard effective January 1, 2019. We have selected a lease accounting system. Our implementation of the system remains on schedule and our evaluation of the use of optional practical expedients is ongoing. While we continue to evaluate the effect of adopting this guidance on our consolidated financial statements and related disclosures, we expect our operating leases, as disclosed in Note 8 — Commitments and Contingencies in the notes to the condensed consolidated financial statements included in Part I, Item 1, will be subject to the new standard. We will recognize right-of-use assets and operating lease liabilities on our consolidated balance sheets upon adoption, which will increase our total assets and liabilities.
In January 2017,In February 2018, the FASB issued Accounting Standards Update No. 2017-01, 2018-02,Business Combinations Income Statement—Reporting Comprehensive Income (Topic 805)220): Clarifying the DefinitionReclassification of a BusinessCertain Tax Effects from Accumulated Other Comprehensive Income (ASU 2017-01)2018-02),which revisesallows companies to reclassify stranded tax effects resulting from the definition of a business and providesTax Act, from accumulated other comprehensive income to retained earnings. The new guidance in evaluating when a set of transferred assets and activitiesstandard is a business. This guidance will be effective for us in the first quarter of 2018 on a prospective basis, andbeginning January 1, 2019, with early
adoption is permitted. We do not expectare currently evaluating the standard toeffects that the adoption of this guidance will have a material impact on our consolidated financial statements.
In January 2017,statements and the FASB issued Accounting Standards Update No. 2017-04, Intangibles - Goodwill and Other (Topic 350): Simplifying the Test for Goodwill Impairment (ASU 2017-04), which eliminates step two from the goodwill impairment test. Under ASU 2017-04, an entity should recognize an impairment charge for the amount by which the carrying amount of a reporting unit exceeds its fair value up to the amount of goodwill allocated to that reporting unit. This guidance will be
effective for us in the first quarter of 2020 on a prospective basis, and early adoption is permitted. We do not expect the standard to have a material impact on our consolidated financial statements.related disclosures.
Critical Accounting Policies and Estimates
Our condensed consolidated financial statements are prepared in accordance with GAAP. The preparation of these condensed consolidated financial statements requires us to make estimates and assumptions that affect the reported amounts of assets, liabilities, revenue, costs and expenses, and related disclosures. These estimates form the basis for judgments we make about the carrying values of our assets and liabilities, which are not readily apparent from other sources. We base our estimates and judgments on historical experience and on various other assumptions that we believe are reasonable under the circumstances. On an ongoing basis, we evaluate our estimates and assumptions. Our actual results may differ from these estimates under different assumptions or conditions.
We believe that the assumptions and estimates associated with income taxes, loss contingencies, and business combinations and valuation of goodwill and other acquired intangible assets have the greatest potential impact on our condensed consolidated financial statements. Therefore, we consider these to be our critical accounting policies and estimates.
There have been no material changes to our critical accounting policies and estimates as compared to the critical accounting policies and estimates described in our Annual Report on Form 10-K for the fiscal year ended December 31, 2016.2017.
On January 1, 2018, we adopted Accounting Standards Update No. 2014-09, Revenue from Contracts with Customers (Topic 606) (ASU 2014-09), using the modified retrospective transition method applied to those contracts which were not completed as of January 1, 2018. Results for reporting periods beginning after January 1, 2018 are presented under Topic 606, while prior period amounts have not been adjusted and continue to be reported in accordance with our historic accounting under Topic 605. The impact to revenue and to cost of revenue for the first quarter of 2018 compared to the same period in 2017 was an increase of approximately $130 million due to a change from net to gross presentation for advertising revenue from Instant Articles. There was no adjustment to beginning retained earnings on January 1, 2018. See Note 1 — Summary of Significant Accounting Policies in the notes to the condensed consolidated financial statements included in Part I, Item 1, of this Quarterly Report on Form 10-Q for additional information regarding the adoption.
| |
| Item 3. | Quantitative and Qualitative Disclosures About Market Risk |
We are exposed to market risks, including changes to foreign currency exchange rates, interest rates, and inflation.
Foreign Currency Exchange Risk
We have foreign currency risks related to our revenue and operating expenses denominated in currencies other than the U.S. dollar, primarily the Euro. In general, we are a net receiver of currencies other than the U.S. dollar. Accordingly, changes in exchange rates, and in particular a strengthening of the U.S. dollar, have in the past, and may in the future, negatively affectedaffect our revenue and other operating results as expressed in U.S. dollars.
We have experienced and will continue to experience fluctuations in our net income as a result of transaction gains or losses related to revaluing certain current asset and current liability balances that are denominated in currencies other than the functional currency of the entities in which they are recorded. At this time, we have not entered into, but in the future we may enter into, derivatives or other financial instruments in an attempt to hedge our foreign currency exchange risk. It is difficult to predict the effect hedging activities would have on our results of operations. WeForeign currency gains recognized foreign currency losses of $3 million and $13 million in the three months ended June 30,March 31, 2018 and 2017 and 2016, respectively, and foreign currency gains of $11 million and $16 million in the six months ended June 30, 2017 and 2016, respectively.were not material.
Interest Rate Sensitivity
Our exposure to changes in interest rates relates primarily to interest earned and market value on our cash and cash equivalents and marketable securities.
Our cash and cash equivalents, and marketable securities consist of cash, certificates of deposit, time deposits, money market funds, U.S. government securities, U.S. government agency securities, and corporate debt securities. Our investment policy and strategy are focused on preservation of capital and supporting our liquidity requirements. Changes in U.S. interest rates affect the interest earned on our cash and cash equivalents and marketable securities, and the market value of those securities. A hypothetical 100 basis point increase in interest rates would have resulted in a decrease of $534$579 million and $403$611 million in the market value of our available-for-sale debt securities as of June 30, 2017March 31, 2018 and December 31, 2016,2017, respectively. Any realized gains or losses resulting from such interest rate changes would only occur if we sold the investments prior to maturity.
| |
| Item 4. | Controls and Procedures |
Evaluation of Disclosure Controls and Procedures
Our management, with the participation of our chief executive officer (CEO) and chief financial officer (CFO), has evaluated the effectiveness of our disclosure controls and procedures (as defined in Rules 13a-15(e) and 15d-15(e) under the Securities Exchange Act of 1934, as amended (Exchange Act)), as of the end of the period covered by this Quarterly Report on Form 10-Q. Based on such evaluation, our CEO and CFO have concluded that as of June 30, 2017,March 31, 2018, our disclosure controls and procedures are designed at a reasonable assurance level and are effective to provide reasonable assurance that information we are required to disclose in reports that we file or submit under the Exchange Act is recorded, processed, summarized, and reported within the time periods specified in the rules and forms of the Securities and Exchange Commission (SEC), and that such information is accumulated and communicated to our management, including our CEO and CFO, as appropriate, to allow timely decisions regarding required disclosure.
Changes in Internal Control
There were no changes in our internal control over financial reporting identified in management's evaluation pursuant to Rules 13a-15(d) or 15d-15(d) of the Exchange Act during the period covered by this Quarterly Report on Form 10-Q that materially affected, or are reasonably likely to materially affect, our internal control over financial reporting.
Limitations on Effectiveness of Controls and Procedures
In designing and evaluating the disclosure controls and procedures and internal control over financial reporting, management recognizes that any controls and procedures, no matter how well designed and operated, can provide only reasonable assurance of achieving the desired control objectives. In addition, the design of disclosure controls and procedures and internal control over financial reporting must reflect the fact that there are resource constraints and that management is required to apply judgment in evaluating the benefits of possible controls and procedures relative to their costs.
PART II—OTHER INFORMATION
Beginning on May 22, 2012, multiple putative class actions, derivative actions, and individual actions were filed in state and federal courts in the United States and in other jurisdictions against us, our directors, and/or certain of our officers alleging violation of securities laws or breach of fiduciary duties in connection with our initial public offering (IPO) and seeking unspecified damages. We believe these lawsuits are without merit, and we intend to continue to vigorously defend them. The vast majority of the cases in the United States, along with multiple cases filed against The NASDAQ OMX Group, Inc. and The Nasdaq Stock Market LLC (collectively referred to herein as NASDAQ) alleging technical and other trading-related errors by NASDAQ in connection with our IPO, were ordered centralized for coordinated or consolidated pre-trial proceedings in the U.S. District Court for the Southern District of New York. In a series of rulings in 2013 and 2014, the court denied our motion to dismiss the consolidated securities class action and granted our motions to dismiss the derivative actions against our directors and certain of our officers. On July 24, 2015, the court of appeals affirmed the dismissal of the derivative actions. On December 11, 2015, the court granted plaintiffs' motion for class certification in the consolidated securities action. On April 13,14, 2017, we filed a motion for summary judgment. Trial is scheduled to begin on October 23, 2017.
On April 27, 2016, we announced a proposal to create a new class of non-voting capital stock (Class C capital stock) and our intention to declare and pay a dividend of two shares of Class C capital stock for each outstanding share of Class A and Class B common stock (the Reclassification). Following our announcement of the Reclassification, beginning on April 29, 2016, multiple purported class action lawsuits were filed on behalf of our stockholders in the Delaware Court of Chancery against us, certain of our board of directors, and Mark Zuckerberg. The lawsuits have been consolidated under the caption In re Facebook, Inc. Class C Reclassification Litig., C.A. No. 12286-VCL, and the consolidated complaint generally alleges that the defendants breached their fiduciary duties in connection with the Reclassification. Among other remedies, these lawsuits seek to enjoin the Reclassification as well as unspecified money damages, costs, and attorneys’ fees. Trial is scheduled to begin on SeptemberFebruary 26, 2017. We believe that the lawsuits are without merit and intend to vigorously defend against all claims asserted.
On December 29, 2014, an entity named Social Ranger LLC sued us for alleged violations of the United States antitrust laws in connection with virtual currency services. On May 24, 2017,2018, the parties entered into a settlement agreement resolving all claims.claims in the consolidated securities action.
Beginning on March 20, 2018, multiple putative class actions and derivative actions were filed in state and federal courts in the United States and elsewhere against us and certain of our directors and officers alleging violations of securities laws, breach of fiduciary duties, and other causes of action in connection with the misuse of certain data by a developer that shared such data with third parties in violation of our terms and policies, and seeking unspecified damages and injunctive relief. We believe these lawsuits are without merit, and we are vigorously defending them. In addition, the events surrounding this misuse of data became the subject of U.S. Federal Trade Commission and other government inquiries in the United States, Europe, and other jurisdictions. Any such inquiries could subject us to substantial fines and costs, divert resources and the attention of management from our business, or adversely affect our business.
In addition, from time to time, we are subject to litigation and other proceedings involving law enforcement and other regulatory agencies, including in particular in Brazil and Europe, in order to ascertain the precise scope of our legal obligations to comply with the requests of those agencies, including our obligation to disclose user information in particular circumstances. A number of such instances have resulted in the assessment of fines and penalties against us. We believe we have multiple legal grounds to satisfy these requests or prevail against associated fines and penalties, and we intend to vigorously defend such fines and penalties.
We are also involved inparty to various other legal proceedings, claims, and regulatory, tax or government inquiries and investigations arising fromthat arise in the ordinary course of our business, and we may in the future be subject to additional lawsuitslegal proceedings and disputes.
Certain factors may have a material adverse effect on our business, financial condition, and results of operations. You should consider carefully the risks and uncertainties described below, in addition to other information contained in this Quarterly Report on Form 10-Q, including our condensed consolidated financial statements and related notes. The risks and uncertainties described below are not the only ones we face. Additional risks and uncertainties that we are unaware of, or that we currently believe are not material, may also become important factors that adversely affect our business. If any of the following risks actually occurs, our business, financial condition, results of operations, and future prospects could be materially and adversely affected. In that event, the trading price of our Class A common stock could decline, and you could lose part or all of your investment.
Risks Related to Our Business and Industry
If we fail to retain existing users or add new users, or if our users decrease their level of engagement with our products, our revenue, financial results, and business may be significantly harmed.
The size of our user base and our users' level of engagement are critical to our success. Our financial performance has been and will continue to be significantly determined by our success in adding, retaining, and engaging active users of our products, particularly for Facebook and Instagram. We anticipate that our active user growth rate will continue to decline over time as the size of our active user base increases, and asit is possible that the size of our active user base may fluctuate or decline in one or more markets, particularly in markets where we achievehave achieved higher market penetration rates. For example, in the fourth quarter of 2017, we experienced a slight decline on a quarter-over-quarter basis in the number of daily active users on Facebook in the United States & Canada region. If people do not perceive our products to be useful, reliable, and trustworthy, we may not be able to attract or retain users or otherwise maintain or increase the frequency and duration of their engagement. A number of other social networking companies that achieved early popularity have since seen their active user bases or levels of engagement decline, in some cases precipitously. There is no guarantee that we will not experience a similar erosion of our active user base or engagement levels. Our user engagement patterns have changed over time, and user engagement can be difficult to measure, particularly as we introduce new and different products and services. Any number of factors could potentially negatively affect user retention, growth, and engagement, including if:
users increasingly engage with other competitive products or services;
we fail to introduce new features, products or services that users find engaging or if we introduce new products or services, or make changes to existing products and services, that are not favorably received;
users feel that their experience is diminished as a result of the decisions we make with respect to the frequency, prominence, format, size, and quality of ads that we display;
users have difficulty installing, updating, or otherwise accessing our products on mobile devices as a result of actions by us or third parties that we rely on to distribute our products and deliver our services;
user behavior on any of our products changes, including decreases in the quality and frequency of content shared on our products and services;
we are unable to continue to develop products for mobile devices that users find engaging, that work with a variety of mobile operating systems and networks, and that achieve a high level of market acceptance;
there are decreases in user sentiment due to questions about the quality or usefulness of our products or our user data practices, or concerns related to privacy and sharing, safety, security, or other factors;
we are unable to manage and prioritize information to ensure users are presented with content that is appropriate, interesting, useful, and relevant to them;
we are unable to obtain or attract engaging third-party content;
we are unable to successfully maintain or grow usage of and engagement with mobile and web applications that integrate with Facebook and our other products;
users adopt new technologies where our products may be displaced in favor of other products or services, or may not be featured or otherwise available;
there are adverse changes in our products that are mandated by legislation, regulatory authorities, or litigation including settlementsthat adversely affect our products or consent decrees;users;
there is decreased engagement with our products, or failure to accept our terms of service, as part of changes that may be implemented in connection with the General Data Protection Regulation (GDPR) in Europe or other similar changes that we plan to implement in the United States and around the world;
technical or other problems prevent us from delivering our products in a rapid and reliable manner or otherwise affect the user experience, such as security breaches or failure to prevent or limit spam or similar content;
we adopt terms, policies, or procedures related to areas such as sharing, content, or user data, or advertising that are perceived negatively by our users or the general public;
we elect to focus our product decisions on longer-term initiatives that do not prioritize near-term user growth and engagement efforts more on longer-term initiatives, or if engagement;
initiatives designed to attract and retain users and engagement are unsuccessful or discontinued, whether as a result of actions by us, third parties, or otherwise;
third-party initiatives that may enable greater use of our products, including low-cost or discounted data plans, are discontinued;
we fail to provide adequate customer service to users, marketers, developers, or other partners;
we, developers whose products are integrated with our products, or other partners and companies in our industry are the subject of adverse media reports or other negative publicity;publicity, including as a result of our or their user data practices; or
our current or future products, such as our development tools and application programming interfaces that enable developers to build, grow, and monetize mobile and web applications, reduce user activity on our products by making it easier for our users to interact and share on third-party mobile and web applications.
If we are unable to maintain or increase our user base and user engagement, our revenue and financial results may be adversely affected. Any decrease in user retention, growth, or engagement could render our products less attractive to users, marketers, and developers, which is likely to have a material and adverse impact on our revenue, business, financial condition, and results of operations. If our active user growth rate continues to slow, we will become increasingly dependent on our ability to maintain or increase levels of user engagement and monetization in order to drive revenue growth.
We generate substantially all of our revenue from advertising. The loss of marketers, or reduction in spending by marketers, could seriously harm our business.
Substantially all of our revenue is currently generated from third parties advertising on Facebook and Instagram. For the first six monthsquarter of 20172018 and 2016,2017, advertising accounted for 98%99% and 97%98%, respectively, of our revenue. As is common in the industry, our marketers do not have long-term advertising commitments with us. Many of our marketers spend only a relatively small portion of their overall advertising budget with us. In addition, marketers may view some of our products as experimental and unproven. Marketers will not continue to do business with us, or they will reduce the prices they are willing to pay to advertise with us or the budgets they are willing to commit to us, if we do not deliver ads in an effective manner, or if they do not believe that their investment in advertising with us will generate a competitive return relative to other alternatives. We have recently implemented, and we may continue to implement, changes to our user data practices, and some of these changes will reduce marketers’ ability to effectively target their ads, which will adversely affect our advertising business. If we are unable to provide marketers with a suitable return on investment, the pricing of our ads may not increase, or may decline, in which case our revenue and financial results may be harmed.
Our advertising revenue could also be adversely affected by a number of other factors, including:
decreases in user engagement, including time spent on our products;
our inability to continue to increase user access to and engagement with our mobile products;
product changes or inventory management decisions we may make that change the size, format, frequency, or relative prominence of ads displayed on our products or of other unpaid content shared by marketers on our products;
our inability to maintain or increase marketer demand, the pricing of our ads, or both;
our inability to maintain or increase the quantity or quality of ads shown to users;users, including as a result of technical infrastructure constraints;
reductions of advertising by marketers due to our efforts to implement advertising policies that protect the security and integrity of our platform;
changes to third-party policies that limit our ability to deliver or target advertising on mobile devices;
the availability, accuracy, and utility of analytics and measurement solutions offered by us or third parties that demonstrate the value of our ads to marketers, or our ability to further improve such tools;
loss of advertising market share to our competitors, including if prices for purchasing ads increase or if competitors offer lower priced or more integrated products;
adverse government actions or legal developments relating to advertising, including legislative and regulatory developments and developments in litigation;
decisions by marketers to reduce their advertising as a result of adverse media reports or other negative publicity involving us, our user data practices, our advertising metrics or tools, content on our products, developers with mobile and web applications that are integrated with our products, or other companies in our industry;
reductions of advertising by marketers due to objectionable content published on our products by third parties;parties or questions about our user data practices;
the effectiveness of our ad targeting or degree to which users opt out of certain types of ad targeting;targeting, including as a result of product changes and controls that may be implemented in connection with the GDPR or other regulation or regulatory action, or other similar changes that we plan to implement in the United States and around the world;
the degree to which users cease or reduce the number of times they click onengage with our ads;
changes in the way advertising on mobile devices or on personal computers is measured or priced; and
the impact of macroeconomic conditions, whether in the advertising industry in general, or among specific types of marketers or within particular geographies.
The occurrence of any of these or other factors could result in a reduction in demand for our ads, which may reduce the prices we receive for our ads, or cause marketers to stop advertising with us altogether, either of which would negatively affect our revenue and financial results.
Our user growth, engagement, and monetization on mobile devices depend upon effective operation with mobile operating systems, networks, and standards that we do not control.
The substantial majority of our revenue is generated from advertising on mobile devices. There is no guarantee that popular mobile devices will continue to feature Facebook or our other products, or that mobile device users will continue to use our products rather than competing products. We are dependent on the interoperability of Facebook and our other products with popular mobile operating systems, networks, and standards that we do not control, such as the Android and iOS operating systems. Any changes, bugs, or technical issues in such systems, or changes in our relationships with mobile operating system partners, handset manufacturers, or mobile carriers, or in their terms of service or policies that degrade our products' functionality, reduce or eliminate our ability to distribute our products, give preferential treatment to competitive products, limit our ability to deliver, target, or measure the effectiveness of ads, or charge fees related to the distribution of our products or our delivery of ads could adversely affect the usage of Facebook or our other products and monetization on mobile devices. Additionally, in order to deliver high quality mobile products, it is important that our products work well with a range of mobile technologies, systems, networks, and standards that we do not control, and that we have good relationships with handset manufacturers and mobile carriers. We may not be successful in maintaining or developing relationships with key participants in the mobile ecosystem or in developing products that operate effectively with these technologies, systems, networks, or standards. In the event that it is more difficult for our users to access and use Facebook or our other products on their mobile devices, or if our users choose not to access or use Facebook or our other products on their mobile devices or use mobile products that do not offer access to Facebook or our other products, our user growth and user engagement could be harmed. From time to time, we may also take actions regarding the distribution of our products or the operation of our business based on what we believe to be in our long-term best interests. Such actions may adversely affect our users and our relationships with the operators of mobile operating systems, handset manufacturers, mobile carriers, or other business partners, and there is no assurance that these actions will result in the anticipated long-term benefits. In the event that our users are adversely affected by these actions or if our relationships with such third parties deteriorate, our user growth, engagement, and monetization could be adversely affected and our business could be harmed.
Our business is highly competitive. Competition presents an ongoing threat to the success of our business.
We compete with companies that sell advertising, as well as with companies that provide social, media, and communication products and services that are designed to engage users and capture time spent on the web, mobile devices and online.online generally. We face significant competition in every aspect of our business, including from companies that facilitate communication and the sharing of content and information, companies that enable marketers to display advertising, companies that distribute video and other forms of media content, and companies that provide development platforms for applications developers. We compete with companies that offer products across broad platforms that replicate capabilities we provide. For example, among other areas, we compete with Apple in messaging (iMessage), Google has integratedin advertising (Google search) and video (YouTube), and Tencent in messaging and social functionality into a number of its products, including search, video, and Android.media (WeChat). We also compete with companies that develop applications, particularly mobile applications, that provide social or other communications functionality, such as messaging, photo- and video-sharing, and micro-blogging, as well as companies that provide regional social networks, thatmany of whom have strong positions in particular countries. Some of our competitors may be domiciled in different countries and subject to political, legal, and regulatory regimes that enable them to compete more effectively than us. In addition, we face competition from traditional, online, and mobile businesses that provide media for marketers to reach their audiences and/ordevelop tools and systems for managing and optimizing advertising campaigns. We also compete with companies that develop and deliver virtual reality products and services.
Some of our current and potential competitors may have significantly greater resources or betterstronger competitive positions in certain product segments, geographic regions, or user demographics than we do. These factors may allow our competitors to respond more effectively than us to new or emerging technologies and changes in market conditions. We believe that some users, particularly younger users, are aware of and actively engaging with other products and services similar to, or as a substitute for, Facebook products and services, and we believe that some users have reduced their use of and engagement with our products and services in favor of these other products and services. In the event that users increasingly engage with other products and services, we may experience a decline in use and engagement in key user demographics or more broadly, in which case our business would likely be harmed.
Our competitors may develop products, features, or services that are similar to ours or that achieve greater acceptance, may undertake more far-reaching and successful product development efforts or marketing campaigns, or may adopt more aggressive pricing policies. In addition, developers whose mobile and web applications are integrated with Facebook or our other products may use information shared by our users through our products in order to develop products or features that compete with us. Some
competitors may gain a competitive advantage against us in areas where we operate, including: by integrating competing platforms, applications, or features into products they control such as mobile device operating systems, search engines, or web browsers; by making acquisitions; by limiting or denying our access to advertising measurement or delivery systems; by limiting our ability to deliver, target, or measure the effectiveness of ads; by imposing fees or other charges related to our delivery of ads; by making access to our products more difficult;difficult or impossible; by making it more difficult to communicate with our users.users; or by integrating competing platforms, applications, or features into products they control such as mobile device operating systems, search engines, or web browsers. For example, each of Apple and Google have integrated competitive products with iOS and Android, respectively. As a result, our competitors may acquire and engage users or generate advertising or other revenue at the expense of our own efforts, which may negatively affect our business and financial results. In addition, from time to time, we may take actions in response to competitive threats, but we cannot assure you that these actions will be successful or that they will not negatively affect our business and financial results.
We believe that our ability to compete effectively depends upon many factors both within and beyond our control, including:
the popularity, usefulness, ease of use, performance, and reliability of our products compared to our competitors' products;
the size and composition of our user base;
the engagement of users with our products and competing products;
the timing and market acceptance of products, including developments and enhancements to our or our competitors' products;
our ability to protect user data and to provide users with control over their data;
our ability to distribute our products to new and existing users;
our ability to monetize our products;
the frequency, size, format, quality, and relative prominence of the ads displayed by us or our competitors;
customer service and support efforts;
marketing and selling efforts, including our ability to measure the effectiveness of our ads and to provide marketers with a compelling return on their investments;
our ability to establish and maintain developers' interest in building mobile and web applications that integrate with Facebook and our other products;
our ability to establish and maintain publisher interest in integrating their content with Facebook and our other products;
changes mandated by legislation, regulatory authorities, or litigation, including settlements and consent decrees, some of which may have a disproportionate effect on us;
acquisitions or consolidation within our industry, which may result in more formidable competitors;
our ability to attract, retain, and motivate talented employees, particularly software engineers, designers, and product managers;
our ability to cost-effectively manage and grow our operations; and
our reputation and brand strength relative to those of our competitors.
If we are not able to compete effectively, our user base and level of user engagement may decrease, we may become less attractive to developers and marketers, and our revenue and results of operations may be materially and adversely affected.
Action by governments to restrict access to Facebook or our other products in their countries could substantially harm our business and financial results.
It is possible that governments of one or more countries may seek to censor content available on Facebook or our other products in their country, restrict access to our products from their country entirely, or impose other restrictions that may affect the accessibility of our products in their country for an extended period of time or indefinitely. For example, user access to Facebook and certain of our other products has been or is currently restricted in whole or in part in China, Iran, and North Korea. In addition, government authorities in other countries may seek to restrict user access to our products if they consider us to be in violation of their laws or a threat to public safety or for other reasons, and certain of our products have been restricted by governments in other countries from time to time. It is also possible that government authorities could take action to restrict our ability to sell advertising, including in countries where access to our consumer-facing products may be blocked or restricted. For example, we generate meaningful revenue from resellers representing advertisers based in China. In the event that content shown on Facebook or our other products is subject to censorship, access to our products is restricted, in whole or in part, in one or more countries, or other restrictions are imposed on our products, or our competitors are able to successfully penetrate new geographic markets or capture a greater share of existing geographic markets that we cannot access or where we face other restrictions, our ability to retain or increase our user base, user engagement, or the level of advertising by marketers may be adversely affected, we may not be able to maintain or grow our revenue as anticipated, and our financial results could be adversely affected.
Our new products and changes to existing products could fail to attract or retain users or generate revenue and profits.
Our ability to retain, increase, and engage our user base and to increase our revenue depends heavily on our ability to continue to evolve our existing products and to create successful new products, both independently and in conjunction with developers or other third parties. We may introduce significant changes to our existing products or acquire or introduce new and unproven products, including using technologies with which we have little or no prior development or operating experience. For example, in March 2016, we shipped our first virtual reality hardware product, the Oculus Rift. In addition, we have announced plans to develop augmented reality technology and products. We do not have significant experience with consumer hardware products or virtual or augmented reality technology, which may adversely affect our ability to successfully develop and market these products and technologies, and we will incur increased costs in connection with the development and marketing of such products and technologies. We have also invested, and expect to continue to invest, significant resources in growing our WhatsApp and Messenger products. We have historically monetized messaging in only a very limited fashion, and we may not be successful in our efforts to generate meaningful revenue from messaging over the long term. If these or other new or enhanced products fail to engage users, marketers, or developers, or if we are unsuccessful in our monetization efforts, we may fail to attract or retain users or to generate sufficient revenue, operating margin, or other value to justify our investments, and our business may be adversely affected.
We make product and investment decisions that may not prioritize short-term financial results and may not produce the long-term benefits that we expect.
We frequently make product and investment decisions that may not prioritize short-term financial results if we believe that the decisions are consistent with our mission and benefit the aggregate user experience and will thereby improve our financial performance over the long term. For example, fromwe have recently implemented, and we may continue to implement, changes to our user data practices, and some of these changes will reduce marketers’ ability to effectively target their ads, which will adversely affect our advertising business. Similarly, we previously announced changes to our News Feed ranking algorithm to help our users have more meaningful interactions, and these changes have had, and we expect will continue to have, the effect of reducing time spent and some measures of user engagement with Facebook, which could adversely affect our financial results. From time to time, we may also change the size, frequency, or relative prominence of ads in order to improve ad quality and overall user experience. Similarly, from timeIn addition, we have made, and we expect to time we update our News Feed ranking algorithmcontinue to deliver the most relevant contentmake, other changes to our users,products which may adversely affect the distribution of content of publishers, marketers, and developers, and could reduce their incentive to invest in their development and marketing efforts on Facebook. We also may introduce new features or other changes to existing products, or introduce new stand-alone products, that attract users away from properties, formats, or use cases where we have more proven means of monetization. For example, we have made, and expect to continue to make, changes tothe Stories format is becoming increasingly popular for sharing content across our products, to provide usersbut our advertising efforts with greater access to video content,this format are still under development and some of these changes have had, or will have,we do not currently monetize Stories at the effect of reducing user engagement withsame rate as News Feed, which could adversely affect our financial results.Feed. In addition, we plan to continue focusing on growing users and engagement on Instagram, Messenger, and WhatsApp, and we may also introduce other stand-alone applications in the future. These efforts may reduce engagement with the core Facebook application, where we have the most proven means of monetization and which serves as the platform for many of our new user experiences. These decisions may adversely affect our business and results of operations and may not produce the long-term benefits that we expect.
If we are not able to maintain and enhance our brands, or if events occur that damage our reputation and brands, our ability to expand our base of users, marketers, and developers may be impaired, and our business and financial results may be harmed.
We believe that our brands have significantly contributed to the success of our business. We also believe that maintaining and enhancing our brands is critical to expanding our base of users, marketers, and developers. Many of our new users are referred by existing users. Maintaining and enhancing our brands will depend largely on our ability to continue to provide useful, reliable, trustworthy, and innovative products, which we may not do successfully. We may introduce new products or terms of service or policies that users do not like, which may negatively affect our brands. Additionally, the actions of our developers or advertisers may affect our brands if users do not have a positive experience using third-party mobile and web applications integrated with our products or interacting with parties that advertise through our products. We will also continue to experience media, legislative, or regulatory scrutiny of our decisions regarding user privacy, content, advertising, and other issues, which may adversely affect our reputation and brands. For example, we previously announced our discovery of certain ads and other content previously displayed on our products that may be relevant to government investigations relating to Russian interference in the 2016 U.S. presidential election. In addition, in March 2018, we announced developments regarding the misuse of certain data by a developer that shared such data with third parties in violation of our terms and policies. We also may fail to respond expeditiously to the sharing of objectionable content on our services or objectionable practices by advertisers or developers, or to otherwise address user concerns, which could erode confidence in our brands. Our brands may also be negatively affected by the actions of users that are deemed to be hostile or inappropriate to other users, by the actions of users acting under false or inauthentic identities, by the use of our products or services to disseminate information that is deemed to be misleading (or intended to manipulate opinions), by perceived or actual efforts by governments to obtain access to user information for security-related purposes or to censor certain content on our platform, or by the use of our products or services for illicit, objectionable, or illegal ends. Maintaining and enhancing our brands may require us to make substantial investments and these investments may not be successful. Certain of our past actions, such as the foregoing matter regarding developer misuse of data, have eroded confidence in our brands, and if we fail to successfully promote and maintain our brands or if we incur excessive expenses in this effort, our business and financial results may be adversely affected.
Security breaches and improper access to or disclosure of our data or user data, or other hacking and phishing attacks on our systems, could harm our reputation and adversely affect our business.
Our industry is prone to cyber-attacks by third parties seeking unauthorized access to our data or users’ data or to disrupt our ability to provide service.Any failure to prevent or mitigate security breaches and improper access to or disclosure of our data or user data, including personal information, content, or payment information from users, could result in the loss or misuse of such data, which could harm our business and reputation and diminish our competitive position. In addition, computer malware, viruses, social engineering (predominantly spear phishing attacks), and general hacking have become more prevalent in our industry, have occurred on our systems in the past, and will occur on our systems in the future. We also regularly encounter attempts to create false or undesirable user accounts, purchase ads, or take other actions on our platform for purposes such as spamming, spreading misinformation, or other objectionable ends. As a result of our prominence, the size of our user base, and the types and volume of personal data on our systems, we believe that we are a particularly attractive target for such breaches and attacks. Such attacks
may cause interruptions to the services we provide, degrade the user experience, cause users to lose confidence and trust in our products, impair our internal systems, or result in financial harm to us. Our efforts to protect our company data or the information we receive may also be unsuccessful due to software bugs or other technical malfunctions; employee, contractor, or vendor error or malfeasance; government surveillance; or other threats that evolve. In addition, third parties may attempt to fraudulently induce employees or users to disclose information in order to gain access to our data or our users' data. Cyber-attacks continue to evolve in sophistication and volume, and inherently may be difficult to detect for long periods of time. Although we have developed systems and processes that are designed to protect our data and user data, to prevent data loss, to disable undesirable accounts and activities on our platform, and to prevent or detect security breaches, we cannot assure you that such measures will provide absolute security.security, and we may incur significant costs in protecting against or remediating cyber-attacks.
In addition, some of our developers or other partners, such as those that help us measure the effectiveness of ads, may receive or store information provided by us or by our users through mobile or web applications integrated with Facebook. We provide limited information to such third parties based on the scope of services provided to us. However, if these third parties or developers fail to adopt or adhere to adequate data security practices, or in the event of a breach of their networks, our data or our users' data may be improperly accessed, used, or disclosed.
Affected users or government authorities could initiate legal or regulatory actions against us in connection with any actual or perceived security breaches or improper disclosure of data, which could cause us to incur significant expense and liability or result in orders or consent decrees forcing us to modify our business practices. Such incidents may also result in a decline in our active user base or engagement levels. Any of these events could have a material and adverse effect on our business, reputation, or financial results.
We anticipate that our ongoing investments in safety, security, and content review will identify additional instances of misuse of user data or other undesirable activity by third parties on our platform.
In addition to our efforts to mitigate cybersecurity risks, we are making significant investments in safety, security, and content review efforts to combat misuse of our services and user data by third parties, including investigations and audits of platform applications that previously accessed information of a large number of users of our services. As a result of these efforts we anticipate that we will discover and announce additional incidents of misuse of user data or other undesirable activity by third parties. We may also be notified of such incidents or activity via the media or other third parties. Such incidents and activities may include the use of user data in a manner inconsistent with our terms or policies, the existence of false or undesirable user accounts, election interference, improper ad purchases, activities that threaten people’s safety on- or offline, or instances of spamming, scraping, or spreading misinformation. The discovery of the foregoing may negatively affect user trust and engagement, harm our reputation and brands, and adversely affect our business and financial results. Any such discoveries may also subject us to additional litigation and regulatory inquiries, which could subject us to monetary penalties and damages, divert management’s time and attention, and lead to enhanced regulatory oversight.
Unfavorable media coverage could negatively affect our business.
We receive a high degree of media coverage around the world. Unfavorable publicity regarding, for example, our privacy practices, terms of service, product changes, product quality, litigation or regulatory activity, government surveillance, the actions of our advertisers, the actions of our developers whose products are integrated with our products, the use of our products or services for illicit, objectionable, or illegal ends, the actions of our users, the quality and integrity of content shared on our platform, or the actions of other companies that provide similar services to us, has in the past, and could in the future, adversely affect our reputation. For example, beginning in March 2018, we were the subject of intense media coverage involving the misuse of certain data by a developer that shared such data with third parties in violation of our terms and policies. Such negative publicity also could have an adverse effect on the size, engagement, and loyalty of our user base and result in decreased revenue, which could adversely affect our business and financial results.
Our financial results will fluctuate from quarter to quarter and are difficult to predict.
Our quarterly financial results have fluctuated in the past and will fluctuate in the future. Additionally, we have a limited operating history with the current scale of our business, which makes it difficult to forecast our future results. As a result, you should not rely upon our past quarterly financial results as indicators of future performance. You should take into account the risks and uncertainties frequently encountered by companies in rapidly evolving markets. Our financial results in any given quarter can be influenced by numerous factors, many of which we are unable to predict or are outside of our control, including:
our ability to maintain and grow our user base and user engagement;
our ability to attract and retain marketers in a particular period;
fluctuations in spending by our marketers due to seasonality, such as historically strong spending in the fourth quarter of each year, episodic regional or global events, or other factors;
the frequency, prominence, size, format, and quality of ads shown to users;
the success of technologies designed to block the display of ads;
the pricing of our ads and other products;
the diversification and growth of revenue sources beyond advertising on Facebook and Instagram;
our ability to generate revenue from Payments, or the sale of Oculus products and services or other products we may introduce in the future;
the development and introduction of new products or services by us or our competitors;
user behavior or product changes that may reduce traffic to features or products that we successfully monetize;
increases in marketing, sales, and other operating expenses that we will incur to grow and expand our operations and to remain competitive;
costs and expenses related to the development and delivery of Oculus products and services;
our ability to maintain gross margins and operating margins;
costs related to acquisitions, including costs associated with amortization and additional investments to develop the acquired technologies;
charges associated with impairment of any assets on our balance sheet;
our ability to obtain equipment, components, and labor for our data centers and other technical infrastructure in a timely and cost-effective manner;
system failures or outages, which could prevent us from serving ads for any period of time;
breaches of security or privacy, and the costs associated with any such breaches and remediation;
changes in the manner in which we distribute our products or inaccessibility of our products due to third-party actions;
fees paid to third parties for content or the distribution of our products;
share-based compensation expense, including acquisition-related expense;
adverse litigation judgments, settlements, or other litigation-related costs;
changes in the legislative or regulatory environment, including with respect to privacy and data protection, or enforcement by government regulators, including fines, orders, or consent decrees;
the overall tax rate for our business, which may be affected by the mix of income we earn in the U.S. and in jurisdictions with comparatively lower tax rates, the tax effects of share-based compensation, the effects of integrating intellectual property from acquisitions, and the effects of changes in our business;
the impact of new legislation;changes in tax law, which are recorded in the period enacted and may significantly affect the effective tax rate of that period;
tax obligations that may arise from changes in laws or resolutions of tax examinations, including the examination
we are currently under by the Internal Revenue Service (IRS), that materially differ from the amounts we have anticipated;
fluctuations in currency exchange rates and changes in the proportion of our revenue and expenses denominated in foreign currencies;
fluctuations in the market values of our portfolio investments and in interest rates;
changes in U.S. generally accepted accounting principles; and
changes in global business or macroeconomic conditions.
We expect our rates of growth to decline in the future.
We expect that our user growth and revenue growth rates will decline over time as the size of our active user base increases, and it is possible that the size of our active user base may fluctuate or decline in one or more markets, particularly as we achieve greater market penetration. We expect our revenue growth rate will generally decline over time as our revenue increases to higher levels. As our growth rates decline, investors' perceptions of our business may be adversely affected and the trading price of our Class A common stock could decline.
Our costs are continuing to grow, which could reduce our operating margin and profitability. If our investments are not successful, our business and financial performance could be harmed.
Operating our business is costly, and we expect our expenses to continue to increase in the future as we broaden our user base, as users increase the amount and types of content they consume and the data they share with us, for example with respect to video, as we develop and implement new products, as we continue to expand our technical infrastructure, as we continue to invest in new and unproven technologies, and as we continue to hire additional employees and contractors to support our expanding operations.operations, including our efforts to focus on safety, security, and content review. We will continue to invest in our messaging, video content, and global connectivity efforts, as well as other initiatives that may not have clear paths to monetization. In addition, we will incur increased costs in connection with the development and marketing of our Oculus products and services. Any such investments may not be successful, and any such increases in our costs may reduce our operating margin and profitability. In addition, if our investments are not successful, our ability to grow revenue will be harmed, which could adversely affect our business and financial performance.
Given our levels of share-based compensation, our tax rate may vary significantly depending on our stock price.
The tax effects of the accounting for share-based compensation may significantly impact our effective tax rate from period to period. In periods in which our stock price is higher than the grant price of the share-based compensation vesting in that period, we will recognize excess tax benefits that will decrease our effective tax rate. For example, in the first six monthsquarter of 2017,2018, excess tax benefits recognized from share-based compensation decreased our provision for income taxes by $577$227 million and our effective tax rate by sevenfour percentage points as compared to the tax rate without such benefits. In future periods in which our stock price is lower than the grant price of the share-based compensation vesting in that period, our effective tax rate may increase. The amount and value of share-based compensation issued relative to our earnings in a particular period will also affect the magnitude of the impact of share-based compensation on our effective tax rate. These tax effects are dependent on our stock price, which we do not control, and a decline in our stock price could significantly increase our effective tax rate and adversely affect our financial results.
Our business is subject to complex and evolving U.S. and foreign laws and regulations regarding privacy, data protection, content, competition, consumer protection, and other matters. Many of these laws and regulations are subject to change and uncertain interpretation, and could result in claims, changes to our business practices, monetary penalties, increased cost of operations, or declines in user growth or engagement, or otherwise harm our business.
We are subject to a variety of laws and regulations in the United States and abroad that involve matters central to our business, including privacy, data protection and personal information, rights of publicity, content, intellectual property, advertising, marketing, distribution, data security, data retention and deletion, personal information, electronic contracts and other communications, competition, protection of minors, consumer protection, telecommunications, product liability, taxation, economic or other trade prohibitions or sanctions, securities law compliance, and online payment services. The introduction of new products, expansion of our activities in certain jurisdictions, or other actions that we may take may subject us to additional laws, regulations, or other government scrutiny. In addition, foreign data protection, privacy, content, competition, and other laws and regulations can impose different obligations or be more restrictive than those in the United States.
These U.S. federal and state and foreign laws and regulations, which in some cases can be enforced by private parties in addition to government entities, are constantly evolving and can be subject to significant change. As a result, the application, interpretation, and enforcement of these laws and regulations are often uncertain, particularly in the new and rapidly evolving industry in which we operate, and may be interpreted and applied inconsistently from country to country and inconsistently with our current policies and practices. For example, regulatory or legislative actions affecting the manner in which we display content to our users or obtain consent to various practices could adversely affect user growth and engagement. Such actions could affect the manner in which we provide our services or adversely affect our financial results.
We are also subject to laws and regulations that dictate whether, how, and under what circumstances we can transfer, process and/or receive certain data that is critical to our operations, including data shared between countries or regions in which we operate and data shared among our products and services. For example, in 2016, the European Union and United States agreed to an alternative transfer framework for data transferred from the European Union to the United States, called the Privacy Shield, but this new framework is subject to an annual review that could result in changes to our obligations and also may be challenged by national regulators or private parties. In addition, the other bases upon which Facebook relies to legitimize the transfer of such data, such as standard ModelStandard Contractual Clauses (MCCs)(SCCs), have been subjected to regulatory orand judicial scrutiny. For example, the Irish Data Protection Commissioner is investigating and has challenged the legal grounds for transfers of user data to Facebook, Inc., and the Irish High Court has agreed to refer this challenge to the Court of Justice of the European Union for decision. We also face multiple inquiries, investigations, and lawsuits in Europe, India, and other jurisdictions regarding the August 2016 update to WhatsApp’s terms of service and privacy policy and its sharing of certain data with other Facebook products and services, including a lawsuit currently pending before the Supreme Court of India. If one or more of the legal bases for transferring data from Europe to the United States is invalidated, if we are unable to transfer data between and among countries and regions in which we operate, or if we are prohibited from sharing data among our products and services, it could affect the manner in which we provide our services or adversely affect our financial results.
Proposed or new legislation and regulations could also significantly affect our business. There currently are a number of proposals pending before federal, state, and foreign legislative and regulatory bodies. In addition, the European Commission has approved a data protection regulation, known as the General Data Protection Regulation (GDPR), which has been finalized will take effect in May 2018 and is duewill apply to come into forceall of our products and services that provide service in or around May 2018.Europe. The GDPR will include operational requirements for companies that receive or process personal data of residents of the European Union that are different than those currently in place in the European Union,Union. For example, we will be required to implement measures to change our service or limit access to our service for minors under the age of 16 for certain countries in Europe that maintain the minimum age of 16 under the GDPR. We will also be required to obtain consent and/or offer new controls to existing and thatnew users in Europe before processing data for certain aspects of our service. In addition, the GDPR will include significant penalties for non-compliance. Similarly, there are a number of legislative proposals in the United States, at both the federal and state level, that could impose new obligations in areas affecting our business, such as liability for copyright infringement by third parties. In addition, some countries are considering or have passed legislation implementing data protection requirements or requiring local storage and processing of data or similar requirements that could increase the cost and complexity of delivering our services.
These laws and regulations, as well as any associated inquiries or investigations or any other government actions, may be costly to comply with and may delay or impede the development of new products, result in negative publicity, increase our operating costs, require significant management time and attention, and subject us to remedies that may harm our business, including fines or demands or orders that we modify or cease existing business practices.
We have been subject to regulatory and other government investigations, enforcement actions, and settlements, and we expect to continue to be subject to such proceedings and other inquires in the future, which could cause us to incur substantial costs or require us to change our business practices in a manner materially adverse to our business.
From time to time, we receive formal and informal inquiries from government authorities and regulators regarding our compliance with laws and regulations, many of which are evolving and subject to interpretation. We are and expect to continue to be the subject of investigations, inquiries, data requests, actions, and audits in the United States, Europe, and around the world, particularly in the areas of privacy, data protection, law enforcement, consumer protection, and competition, as we continue to grow and expand our operations. For example, several data protection authorities in the European Union have initiated actions, investigations, or administrative orders seeking to assert jurisdiction over Facebook, Inc. and our subsidiaries and to restrict the ways in which we collect and use information, and other data protection authorities may do the same. In addition, beginning in March 2018, we became subject to U.S. Federal Trade Commission and other government inquiries in the United States, Europe, and other jurisdictions in connection with the misuse of certain data by a developer that shared such data with third parties in violation of our terms and policies and related matters. Orders issued by, or inquiries or enforcement actions initiated by, government or regulatory authorities could cause us to incur substantial costs, expose us to unanticipated civil and criminal liability or penalties (including substantial monetary fines), or require us to change our business practices in a manner materially adverse to our business.
If we are unable to protect our intellectual property, the value of our brands and other intangible assets may be diminished, and our business may be adversely affected.
We rely and expect to continue to rely on a combination of confidentiality, assignment, and license agreements with our employees, consultants, and third parties with whom we have relationships, as well as trademark, copyright, patent, trade secret, and domain name protection laws, to protect our proprietary rights. In the United States and internationally, we have filed various applications for protection of certain aspects of our intellectual property, and we currently hold a significant number of issuedregistered trademarks and issued patents in multiple jurisdictions and have acquired patents and patent applications from third parties. In addition, in the future we may acquire additional patents or patent portfolios, which could require significant cash expenditures. Third parties may knowingly or unknowingly infringe our proprietary rights, third parties may challenge proprietary rights held by us, and pending and future trademark and patent applications may not be approved. In addition, effective intellectual property protection may not be available in every country in which we operate or intend to operate our business. In any or all of these cases, we may be required to expend significant time and expense in order to prevent infringement or to enforce our rights. Although we have generally taken measures to protect our proprietary rights, there can be no assurance that others will not offer products or concepts that are substantially similar to ours and compete with our business. In addition, we regularly contribute software source code under open source licenses and have made other technology we developed available under other open licenses, and we include open source software in our products. For example, we have contributed certain specifications and designs related to our data center equipment to the Open Compute Project Foundation, a non-profit entity that shares and develops such information with the technology community, under the Open Web Foundation License. As a result of our open source contributions and the use of open source in our products, we may license or be required to license or disclose code and/or innovations that turn out to be material to our business and may also be exposed to increased litigation risk. If the protection of our proprietary rights is inadequate to prevent unauthorized use or appropriation by third parties, the value of our brands and other intangible assets may be diminished and competitors may be able to more effectively mimic our products, services, and methods of operations. Any of these events could have an adverse effect on our business and financial results.
We are currently, and expect to be in the future, party to patent lawsuits and other intellectual property rights claims that are expensive and time consuming and, if resolved adversely, could have a significant impact on our business, financial condition, or results of operations.
Companies in the Internet, technology, and media industries own large numbers of patents, copyrights, trademarks, and trade secrets, and frequently enter into litigation based on allegations of infringement, misappropriation, or other violations of intellectual property or other rights. In addition, various "non-practicing entities" that own patents and other intellectual property rights often attempt to aggressively assert their rights in order to extract value from technology companies. Furthermore, from time to time we may introduce or acquire new products, including in areas where we historically have not competed, which could increase our exposure to patent and other intellectual property claims from competitors and non-practicing entities.
From time to time, we receive notice from patent holders and other parties alleging that certain of our products and services, or user content, infringe their intellectual property rights. We presently are involved in a number of intellectual property lawsuits, and as we face increasing competition and gain an increasingly high profile, we expect the number of patent and other intellectual property claims against us to grow. Defending patent and other intellectual property litigation is costly and can impose a significant burden on management and employees, and there can be no assurances that favorable final outcomes will be obtained in all cases. In addition, plaintiffs may seek, and we may become subject to, preliminary or provisional rulings in the course of any such litigation, including potential preliminary injunctions requiring us to cease some or all of our operations. We may decide to settle such lawsuits and disputes on terms that are unfavorable to us. Similarly, if any litigation to which we are a party is resolved adversely, we may be subject to an unfavorable judgment that may not be reversed upon appeal. The terms of such a settlement or judgment may require us to cease some or all of our operations or pay substantial amounts to the other party. In addition, we may have to seek a license to continue practices found to be in violation of a third party's rights, which may not be available on reasonable terms, or at all, and may significantly increase our operating costs and expenses. As a result, we may also be required to develop alternative non-infringing technology or practices or discontinue the practices. The development of alternative non-infringing technology or practices could require significant effort and expense or may not be feasible. Our business, financial condition, and results of operations could be adversely affected as a result of an unfavorable resolution of the disputes and litigation referred to above.
We are involved in numerous class action lawsuits and other litigation matters that are expensive and time consuming, and, if resolved adversely, could harm our business, financial condition, or results of operations.
In addition to intellectual property claims, we are also involved in numerous other lawsuits, including putative class action lawsuits, many of which claim statutory damages and/or seek significant changes to our business operations, and we anticipate that we will continue to be a target for numerous lawsuits in the future. Because of the scale of our user base, the plaintiffs in class action cases filed against us typically claim enormous monetary damages even if the alleged per-user harm is small or non-
existent.non-existent. In addition, we may be subject to additional class action lawsuits based on employment claims, product performance or other
claims related to the use of consumer hardware and software, as well as virtual reality technology and products, which are new and unproven. For example, we are currently the subject of multiple putative class action suits in connection with the misuse of certain data by a developer that shared such data with third parties in violation of our terms and policies and related matters. We believe these lawsuits are without merit and are vigorously defending them. Any negative outcome from any such lawsuits could result in payments of substantial monetary damages or fines, or undesirable changes to our products or business practices, and accordingly our business, financial condition, or results of operations could be materially and adversely affected. Although the results of such lawsuits and claims cannot be predicted with certainty, we do not believe that the final outcome of those matters relating to our products that we currently face will have a material adverse effect on our business, financial condition, or results of operations. In addition, we are currently the subject of stockholder class action suits in connection with our IPO and with our intention to create a new class of capital stock (Class C capital stock) and to declare and pay a dividend of two shares of Class C capital stock for each outstanding share of Class A and Class B common stock (the Reclassification). We believe these lawsuits are without merit and are vigorously defending these lawsuits.
There can be no assurances that a favorable final outcome will be obtained in all our cases, and defending any lawsuit is costly and can impose a significant burden on management and employees. Any litigation to which we are a party may result in an onerous or unfavorable judgment that may not be reversed upon appeal or in payments of substantial monetary damages or fines, or we may decide to settle lawsuits on similarly unfavorable terms, which could adversely affect our business, financial conditions, or results of operations.
We may incur liability as a result of information retrieved from or transmitted over the Internet or published using our products or as a result of claims related to our products.
We have faced, currently face, and will continue to face claims relating to information that is published or made available on our products. In particular, the nature of our business exposes us to claims related to defamation, dissemination of misinformation or news hoaxes, discrimination, intellectual property rights, rights of publicity and privacy, personal injury torts, or local laws regulating hate speech or other types of content. This risk is enhanced in certain jurisdictions outside the United States where our protection from liability for third-party actions may be unclear andor where we may be less protected under local laws than we are in the United States. In addition, there have been various Congressional efforts to restrict the scope of the protections available to online platforms under Section 230 of the Communications Decency Act, and our current protections from liability for third-party content in the United States could decrease or change. We could incur significant costs investigating and defending such claims and, if we are found liable, significant damages. We could also face fines or orders restricting or blocking our services in particular geographies as a result of content hosted on our services. For example, we will be subject to recently enacted legislation in Germany that may impose significant fines for failure to comply with certain content removal and disclosure obligations. If any of these events occur, our business and financial results could be adversely affected.
Our CEO has control over key decision making as a result of his control of a majority of the voting power of our outstanding capital stock.
Mark Zuckerberg, our founder, Chairman, and CEO, is able to exercise voting rights with respect to a majority of the voting power of our outstanding capital stock and therefore has the ability to control the outcome of matters submitted to our stockholders for approval, including the election of directors and any merger, consolidation, or sale of all or substantially all of our assets. This concentrated control could delay, defer, or prevent a change of control, merger, consolidation, or sale of all or substantially all of our assets that our other stockholders support, or conversely this concentrated control could result in the consummation of such a transaction that our other stockholders do not support. This concentrated control could also discourage a potential investor from acquiring our Class A common stock, which has limited voting power relative to the Class B common stock, or if issued, our Class C capital stock, which will generally have no voting power, and might harm the trading price of our Class A common stock and, if issued, our Class C capital stock. In addition, Mr. Zuckerberg has the ability to control the management and major strategic investments of our company as a result of his position as our CEO and his ability to control the election or replacement of our directors. In the event of his death, the shares of our capital stock that Mr. Zuckerberg owns will be transferred to the persons or entities that he has designated. As a board member and officer, Mr. Zuckerberg owes a fiduciary duty to our stockholders and must act in good faith in a manner he reasonably believes to be in the best interests of our stockholders. As a stockholder, even a controlling stockholder, Mr. Zuckerberg is entitled to vote his shares, and shares over which he has voting control as governed by a voting agreement, in his own interests, which may not always be in the interests of our stockholders generally.
Moreover, since our Class C capital stock, if issued, will generally have no voting power, the issuance of the Class C capital stock, including in connection with future financings, acquisitions, or the issuance of future equity awards, could have the effect of prolonging the duration of Mr. Zuckerberg's ability to exercise voting rights with respect to a majority of the voting power of our outstanding capital stock and therefore his ability to control the outcome of matters submitted to our stockholders for approval, including the election of directors, and any merger, consolidation, or sale of all or substantially all of our assets. We believe that Mr. Zuckerberg's continued control of a majority of the voting power of our outstanding capital stock is beneficial to us and is in the best interests of our stockholders. In the event that Mr. Zuckerberg no longer controls a majority of the voting power, whether as a result of the disposition of some or all of his shares of Class A or Class B common stock or otherwise, our business or the trading price of our Class A common stock and, if issued, our Class C capital stock may be adversely affected.
We plan to continue to make acquisitions, which could harm our financial condition or results of operations and may adversely affect the price of our common stock.
As part of our business strategy, we have made and intend to continue to make acquisitions to add specialized employees and complementary companies, products, or technologies. We may not be able to find suitable acquisition candidates, and we may not be able to complete acquisitions on favorable terms, if at all. In some cases, the costs of such acquisitions may be substantial. For example, in 2014 we paid approximately $4.6 billion in cash and issued 178 million shares of our Class A common stock in connection with our acquisition of WhatsApp, and we paid approximately $400 million in cash and issued 23 million shares of our Class B common stock in connection with our acquisition of Oculus. We also issued a substantial number of RSUs to help retain the employees of these companies. There is no assurance that we will receive a favorable return on investment for these or other acquisitions.
We may pay substantial amounts of cash or incur debt to pay for acquisitions, which could adversely affect our liquidity. The incurrence of indebtedness would also result in increased fixed obligations and increased interest expense, and could also include covenants or other restrictions that would impede our ability to manage our operations. We may also issue equity securities to pay for acquisitions and we regularly grant RSUs to retain the employees of acquired companies, which could increase our expenses, adversely affect our financial results, and result in dilution to our stockholders. In addition, any acquisitions we announce could be viewed negatively by users, marketers, developers, or investors, which may adversely affect our business or the price of our Class A common stock.
In the future, if issued, we may use shares of Class C capital stock as consideration in connection with acquisitions. However, we may not be able to use shares of Class C capital stock as consideration because companies that we are interested in acquiring may not agree to accept shares that carry no voting rights, or for other reasons. If the Class C capital stock trades at a discount to the Class A common stock, companies that we seek to acquire may also demand more shares of Class C capital stock in exchange for accepting such stock as consideration. In such instances, we may need to pay cash, issue shares of our Class A or Class B common stock as consideration, or issue a relatively greater number of shares of Class C capital stock to consummate the acquisitions.
We may also discover liabilities or deficiencies associated with the companies or assets we acquire that were not identified in advance, which may result in significant unanticipated costs. The effectiveness of our due diligence review and our ability to evaluate the results of such due diligence are dependent upon the accuracy and completeness of statements and disclosures made or actions taken by the companies we acquire or their representatives, as well as the limited amount of time in which acquisitions are executed. In addition, we may fail to accurately forecast the financial impact of an acquisition transaction, including tax and accounting charges. Acquisitions may also result in our recording of significant additional expenses to our results of operations and recording of substantial finite-lived intangible assets on our balance sheet upon closing. Any of these factors may adversely affect our financial condition or results of operations.
We may not be able to successfully integrate our acquisitions, and we may incur significant costs to integrate and support the companies we acquire.
The integration of acquisitions requires significant time and resources, and we may not manage these processes successfully. Our ability to successfully integrate complex acquisitions is unproven, particularly with respect to companies that have significant operations or that develop products where we do not have prior experience. For example, Oculus and WhatsApp are larger and more complex than companies we have historically acquired. In particular, Oculus builds technology and products that are relatively new to Facebook and with which we did not have significant experience or structure in place to support prior to the acquisition. We continue to make substantial investments of resources to support these acquisitions, which will result in significant ongoing operating expenses and may divert resources and management attention from other areas of our business. We cannot assure you that these investments will be successful. If we fail to successfully integrate the companies we acquire, we may not realize the benefits expected from the transaction and our business may be harmed.
If our goodwill or finite-lived intangible assets become impaired, we may be required to record a significant charge to earnings.
We review our finite-lived intangible assets for impairment when events or changes in circumstances indicate the carrying value may not be recoverable, such as a decline in stock price and market capitalization. We test goodwill for impairment at least annually. If such goodwill or finite-lived intangible assets are deemed to be impaired, an impairment loss equal to the amount by which the carrying amount exceeds the fair value of the assets would be recognized. We may be required to record a significant charge in our financial statements during the period in which any impairment of our goodwill or finite-lived intangible assets is determined, which would negatively affect our results of operations.
Our business is dependent on our ability to maintain and scale our technical infrastructure, and any significant disruption in our service could damage our reputation, result in a potential loss of users and engagement, and adversely affect our financial results.
Our reputation and ability to attract, retain, and serve our users is dependent upon the reliable performance of our products and our underlying technical infrastructure. We have in the past experienced, and may in the future experience, interruptions in the availability or performance of our products from time to time. Our systems may not be adequately designed with the necessary reliability and redundancy to avoid performance delays or outages that could be harmful to our business. If our products are unavailable when users attempt to access them, or if they do not load as quickly as expected, users may not use our products as often in the future, or at all, and our ability to serve ads may be disrupted. As our user base and engagement continue to grow, and the amount and types of information shared on Facebook and our other products continue to grow and evolve, such as increased engagement with video, we will need an increasing amount of technical infrastructure, including network capacity and computing power, to continue to satisfy the needs of our users.users and advertisers. It is possible that we may fail to continue to effectively scale and grow our technical infrastructure to accommodate these increased demands.demands, which may adversely affect our user engagement and advertising revenue growth. In addition, our business may be subject to interruptions, delays, or failures resulting from earthquakes, adverse weather conditions, other natural disasters, power loss, terrorism, geopolitical conflict, cyber-attacks, or other catastrophic events. If such an event were to occur, users may be subject to service disruptions or outages and we may not be able to recover our technical infrastructure and user data in a timely manner to restart or provide our services, which may adversely affect our financial results.
A substantial portion of our network infrastructure is provided by third parties. Any disruption or failure in the services we receive from these providers could harm our ability to handle existing or increased traffic and could significantly harm our business. Any financial or other difficulties these providers face may adversely affect our business, and we exercise little control over these providers, which increases our vulnerability to problems with the services they provide.
We could experience unforeseen difficulties in building and operating key portions of our technical infrastructure.
We have designed and built our own data centers and key portions of our technical infrastructure through which we serve our products, and we plan to continue to significantly expand the size of our infrastructure primarily through data centers and other projects. The infrastructure expansion we are undertaking is complex and involves projects in multiple locations, and unanticipated delays in the completion of these projects, including due to any shortage of labor necessary in building portions of such projects, or availability of components, may lead to increased project costs, operational inefficiencies, or interruptions in the delivery or degradation of the quality of our products. In addition, there may be issues related to this infrastructure that are not identified during the testing phases of design and implementation, which may only become evident after we have started to fully utilize the underlying equipment, that could further degrade the user experience or increase our costs.
Our products and internal systems rely on software that is highly technical, and if it contains undetected errors or vulnerabilities, our business could be adversely affected.
Our products and internal systems rely on software, including software developed or maintained internally and/or by third parties, that is highly technical and complex. In addition, our products and internal systems depend on the ability of such software to store, retrieve, process, and manage immense amounts of data. The software on which we rely has contained, and will in the future contain, undetected errors, bugs, or vulnerabilities. Some errors may only be discovered after the code has been released for external or internal use. Errors, vulnerabilities, or other design defects within the software on which we rely have in the past, and may in the future, result in a negative experience for users and marketers who use our products, delay product introductions or enhancements, result in targeting, measurement, or billing errors, compromise our ability to protect the data of our users and/or our intellectual property or lead to reductions in our ability to provide some or all of our services. In addition, any errors, bugs, vulnerabilities, or defects discovered in the software on which we rely, and any associated degradations or interruptions of service, could result in damage to our reputation, loss of users, loss of revenue, or liability for damages, any of which could adversely affect our business and financial results.
Technologies have been developed that can block the display of our ads, which could adversely affect our financial results.
Technologies have been developed, and will likely continue to be developed, that can block the display of our ads or block our ad measurement tools, particularly for advertising displayed on personal computers. We generate substantially all of our revenue from advertising, including revenue resulting from the display of ads on personal computers. Revenue generated from the display of ads on personal computers has been impacted by these technologies from time to time. As a result, these technologies have had an adverse effect on our financial results and, if such technologies continue to proliferate, in particular with respect to mobile platforms, our future financial results may be harmed.
Real or perceived inaccuracies in our user and other metrics may harm our reputation and negatively affect our business.
The numbers for our key metrics, which include our DAUs, MAUs, and average revenue per user (ARPU), are calculated
using internal company data based on the activity of user accounts. While these numbers are based on what we believe to be reasonable estimates of our user base for the applicable period of measurement, there are inherent challenges in measuring usage of our products across large online and mobile populations around the world. In addition, we are continually seeking to improve our estimates of our user base, and such estimates may change due to improvements or changes in our methodology.
In 2016, weWe regularly evaluate these metrics to estimate thatthe number of "duplicate" and "false" accounts (anamong our MAUs. A duplicate account is one that a user maintains in addition to his or her principal account) may have represented approximately 6% of our worldwide MAUs.account. We also seek to identifydivide "false" accounts which we divide into two categories: (1) user-misclassified accounts, where users have created personal profiles for a business, organization, or non-human entity such as a pet (such entities are permitted on Facebook using a Page rather than a personal profile under our terms of service); and (2) undesirable accounts, which represent user profiles that we determine are intended to be used for purposes that violate our terms of service, such as spamming. In 2016, for example, we estimate that such user-misclassifiedThe estimates of duplicate and undesirablefalse accounts may have represented approximately 1% of our worldwide MAUs. However, these estimates are based on an internal review of a limited sample of accounts, and we apply significant judgment in making this determination,determination. For example, to identify duplicate accounts we use data signals such as identifyingsimilar IP addresses or user names, and to identify false accounts we look for names that appear to be fake or other behavior that appears inauthentic to the reviewers. Our estimates may change as our methodologies evolve, including through the application of new data signals or technologies, which may allow us to identify previously undetected falseduplicate or duplicatefalse accounts and may improve our ability to evaluate a broader population of our users. AsDuplicate and false accounts are very difficult to measure at our scale, and it is possible that the actual number of duplicate and false accounts may vary significantly from our estimates.
In the fourth quarter of 2017, we estimate that duplicate accounts may have represented approximately 10% of our worldwide MAUs. We believe the percentage of duplicate accounts is meaningfully higher in developing markets such as India, Indonesia, and the Philippines, as compared to more developed markets. In the fourth quarter of 2017, we estimate that false accounts may have represented approximately 3-4% of our worldwide MAUs. Our estimation of false accounts can vary as a result of episodic spikes in the creation of such accounts, which we have seen originate more frequently in specific countries such as Indonesia, Turkey, and Vietnam. From time to time, we may make product changes or take other actions to reduce the number of duplicate or false accounts among our users, which may not accurately represent the actual number of such accounts. also reduce our DAU and MAU estimates in a particular period.
Our data limitations may affect our understanding of certain details of our business. For example, while user-provided data indicates a decline in usage among younger users, this age data is unreliable because a disproportionate number of our younger users register with an inaccurate age. Accordingly, our understanding of usage by age group may not be complete.
In addition, our data regarding the geographic location of our users is estimated based on a number of factors, such as the user's IP address and self-disclosed location. These factors may not always accurately reflect the user's actual location. For example, a user may appear to be accessing Facebook from the location of the proxy server that the user connects to rather than from the user's actual location. The methodologies used to measure user metrics may also be susceptible to algorithm or other technical errors. Our estimates for revenue by user location and revenue by user device are also affected by these factors. For example, in late 2015, we discovered an error in the algorithm we used to attribute our revenue by user geography. While this issue did not affect our overall worldwide revenue, it did affect our attribution of revenue to different geographic regions. The fourth quarter of 2015 revenue by user geography and ARPU amounts were adjusted to reflect this reclassification.
We regularly review our processes for calculating these metrics, and from time to time we may discover inaccuracies in our metrics or make adjustments to improve their accuracy, including adjustments that may result in the recalculation of our historical metrics. We believe that any such inaccuracies or adjustments are immaterial unless otherwise stated. We intend to disclose our estimates of the number of duplicate and false accounts among our MAUs on an annual basis. In addition, our DAU and MAU estimates will differ from estimates published by third parties due to differences in methodology.
In addition, from time to time we provide, or rely on, certain other metrics, including those relating to the reach and effectiveness of our ads. All of our metrics are subject to software bugs, inconsistencies in our systems, and human error. If marketers, developers, or investors do not perceive our metrics to be accurate, or if we discover material inaccuracies in our metrics, we may be subject to liability, our reputation may be harmed, and marketers and developers may be less willing to allocate their budgets or resources to Facebook, which could negatively affect our business and financial results.
We cannot assure you that we will effectively manage our growth.
Our employee headcount and the scope and complexity of our business have increased significantly, with the number of employees increasing to 20,65827,742 as of June 30, 2017March 31, 2018 from 14,49518,770 as of June 30, 2016,March 31, 2017, and we expect such headcount growth to continue for the foreseeable future. In addition, we have recently announced our plans to hire a significant number of employees and contractors in order to address various safety, security, and content review initiatives. The growth and expansion of our business and products create significant challenges for our management, operational, and financial resources, including managing multiple relationships with users, marketers, developers, and other third parties. As our operations and the number of our third-party relationships continue to grow, our information technology systems or our internal controls and procedures may not be adequate to support such growth. In addition, some members of our management do not have significant experience managing a large global business operation, so our management may not be able to manage such growth effectively. To effectively manage our growth, we must continue to improve our operational, financial, and management processes and systems and to effectively expand, train, and manage our employee base.personnel. As our organization continues to grow, and we are required to implement more complex organizational management structures, we may find it increasingly difficult to maintain the benefits of our corporate culture, including our ability to quickly develop and launch new and innovative products. This could negatively affect our business performance.
The loss of one or more of our key personnel, or our failure to attract and retain other highly qualified personnel in the future, could harm our business.
We currently depend on the continued services and performance of our key personnel, including Mark Zuckerberg and Sheryl K. Sandberg. Although we have entered into employment agreements with Mr. Zuckerberg and Ms. Sandberg, the agreements have no specific duration and constitute at-will employment. In addition, many of our key technologies and systems are custom-made for our business by our personnel. The loss of key personnel, including members of management as well as key engineering, product development, marketing, and sales personnel, could disrupt our operations and have an adverse effect on our business.
As we continue to grow, we cannot guarantee we will continue to attract and retain the personnel we need to maintain our competitive position. In particular, we intend to continue to hire a significant number of technical personnel in the foreseeable future, and we expect to continue to face significant competition from other companies in hiring such personnel, particularly in the San Francisco Bay Area, where our headquarters are located and where the cost of living is high. As we continue to mature, the incentives to attract, retain, and motivate employees provided by our equity awards or by future arrangements may not be as effective as in the past, and if we issue significant equity to attract additional employees or to retain our existing employees, we would incur substantial additional share-based compensation expense and the ownership of our existing stockholders would be further diluted. Our ability to attract, retain, and motivate employees may also be adversely affected by stock price volatility. Additionally, we have a number of current employees whose equity ownership in our company has provided them a substantial amount of personal wealth, which could affect their decisions about whether or not to continue to work for us. As a result of these factors, it may be difficult for us to continue to retain and motivate our employees. If we do not succeed in attracting, hiring, and integrating excellent personnel, or retaining and motivating existing personnel, we may be unable to grow effectively.
We may not be able to continue to successfully maintain or grow usage of and engagement with mobile and web applications that integrate with Facebook and our other products.
We have made and are continuing to make investments to enable developers to build, grow, and monetize mobile and web applications that integrate with Facebook and our other products. Such existing and prospective developers may not be successful in building, growing, or monetizing mobile and/or web applications that create and maintain user engagement. Additionally, developers may choose to build on other platforms, including mobile platforms controlled by third parties, rather than building products that integrate with Facebook and our other products. We are continuously seeking to balance the distribution objectives of our developers with our desire to provide an optimal user experience, and we may not be successful in achieving a balance that continues to attract and retain such developers. For example, from time to time, we have taken actions to reduce the volume of communications from these developers to users on Facebook and our other products with the objective of enhancing the user experience, and such actions have reduced distribution from, user engagement with, and our monetization opportunities from, mobile and web applications integrated with our products. In addition, as part of our investment in safety and security, we are conducting investigations and audits of a large number of platform applications, and we also recently announced several product changes that restrict developer access to certain user data. In some instances, these actions, as well as other actions to enforce our policies applicable to developers, have adversely affected, or will adversely affect, our relationships with such developers. If we are not successful in our efforts to continue tomaintain or grow the number of developers that choose to build products that integrate with Facebook and our other products or if we are unable to continue to build and maintain good relations with such developers, our user growth and user engagement and our financial results may be adversely affected.
We currently generate substantially all of our Payments revenue from developers that use Facebook on personal computers, and we expect that our Payments revenue will continue to decline as usage of Facebook on personal computers continues to decline.
We currently generate substantially all of our Payments revenue from developers that use Facebook on personal computers. Specifically, applications built by developers of social games are currently responsible for substantially all of our revenue derived from Payments, and the majority of the revenue from these applications has historically been generated by a limited number of the most popular games. We have experienced and expect to see the continued decline in usage of Facebook on personal computers, which we expect will result in a continuing decline in Payments revenue. In addition, only a relatively small percentage of our users have transacted with Facebook Payments. If the Facebook-integrated applications fail to grow or maintain their users and engagement, whether as a result of the continued decline in the usage of Facebook on personal computers or otherwise, if developers do not continue to introduce new applications that attract users and create engagement on Facebook, or if Facebook-integrated applications outside of social games do not gain popularity and generate significant revenue for us, our financial performance could be adversely affected.
Payment transactions may subject us to additional regulatory requirements and other risks that could be costly and difficult to comply with or that could harm our business.
Our users can purchase virtual and digital goods from developers that offer applications using our Payments infrastructure on the Facebook website. In addition, certain of our users can use our Payments infrastructure, including on Messenger, for other activities, such as sending money to other users and making donations to certain charitable organizations. We are subject to a variety of laws and regulations in the United States, Europe, and elsewhere, including those governing anti-money laundering and counter-terrorist financing, money transmission, gift cards and other prepaid access instruments, electronic funds transfer, charitable fundraising, and import and export restrictions. Depending on how our Payments product evolves, we may also be subject to other laws and regulations including those governing gambling, banking, and lending. In some jurisdictions, the application or interpretation of these laws and regulations is not clear. To increase flexibility in how our use of Payments may evolve and to mitigate regulatory uncertainty, we have received certain money transmitter licenses in the United States and an Electronic Money (E-Money) license that allows us to conduct certain regulated payment activities in the participating member countries of the European Economic Area, which will generally require us to demonstrate compliance with many domestic and foreign laws in these areas. Our efforts to comply with these laws and regulations could be costly and result in diversion of management time and effort and may still not guarantee compliance. In the event that we are found to be in violation of any such legal or regulatory requirements, we may be subject to monetary fines or other penalties such as a cease and desist order, or we may be required to make product changes, any of which could have an adverse effect on our business and financial results.
In addition, we may be subject to a variety of additional risks as a result of Payments transactions, including:
increased costs and diversion of management time and effort and other resources to deal with bad transactions or customer disputes;
potential fraudulent or otherwise illegal activity by users, developers, employees, or third parties;
restrictions on the investment of consumer funds used to transact Payments; and
additional disclosure and reporting requirements.
We have significant international operations and plan to continue expanding our operations abroad where we have more limited operating experience, and this may subject us to increased business and economic risks that could affect our financial results.
We have significant international operations and plan to continue the international expansion of our business operations and the translation of our products. We currently make Facebook available in more than 100 different languages, and we have offices or data centers in more than 30 different countries. We may enter new international markets where we have limited or no experience in marketing, selling, and deploying our products. Our products are generally available globally through the web and on mobile, but some or all of our products or functionality may not be available in certain markets due to legal and regulatory complexities. For example, Facebook isand certain of our other products are not generally available in China. We also outsource certain operational functions to third-party vendors globally. If we fail to deploy, manage, or oversee our international operations successfully, our business may suffer. In addition, we are subject to a variety of risks inherent in doing business internationally, including:
political, social, or economic instability;
risks related to legal, regulatory, and other government scrutiny applicable to U.S. companies with sales and operations
in foreign jurisdictions, including with respect to privacy, tax, law enforcement, content, trade compliance, intellectual
property, and terrestrial infrastructure matters;
potential damage to our brand and reputation due to compliance with local laws, including potential censorship or requirements to provide user information to local authorities;
fluctuations in currency exchange rates and compliance with currency controls;
foreign exchange controls and tax and other regulations and orders that might prevent us from repatriating cash earned in countries outside the United States or otherwise limit our ability to move cash freely, and impede our ability to invest such cash efficiently;
higher levels of credit risk and payment fraud;
enhanced difficulties of integrating any foreign acquisitions;
burdens of complying with a variety of foreign laws;
reduced protection for intellectual property rights in some countries;
difficulties in staffing, managing, and overseeing global operations and the increased travel, infrastructure, and legal compliance costs associated with multiple international locations;
compliance with the U.S. Foreign Corrupt Practices Act, the U.K. Bribery Act, and similar laws in other jurisdictions; and
compliance with statutory equity requirements and management of tax consequences.
If we are unable to expand internationally and manage the complexity of our global operations successfully, our financial results could be adversely affected.
We face design, manufacturing, and supply chain risks that, if not properly managed, could adversely impact our financial results.
We face a number of risks related to design, manufacturing, and supply chain management with respect to our Oculus products. For example, the Oculus products we sell may have quality issues resulting from the design or manufacture of the products, or from the software used in the products. Sometimes, these issues may be caused by components we purchase from other manufacturers or suppliers. If the quality of our Oculus products does not meet our customers' expectations or such products are found to be defective, then our brand and financial results could be adversely affected.
We rely on third parties to manufacture our Oculus products. We may experience supply shortages or other supply chain disruptions in the future that could result in shipping delays and negatively impact our operations. We could be negatively affected if we are not able to engage third parties with the necessary capabilities or capacity on reasonable terms, or if those we engage with fail to meet their obligations (whether due to financial difficulties or other reasons), or make adverse changes in the pricing or other material terms of such arrangements with them.
We also require the suppliers and business partners of our Oculus products to comply with laws and certain company policies regarding sourcing practices and standards on labor, health and safety, the environment, and business ethics, but we do not control them or their practices.practices and standards. If any of them violates laws or implements practices or standards regarded as unethical, corrupt, or corrupt,non-compliant, we could experience supply chain disruptions, canceled orders, or damage to our reputation.
In addition, the Securities and Exchange Commission’s (SEC)SEC’s conflict minerals rule requires disclosure by public companies of information relating to the origin, source and chain of custody of specified minerals, known as conflict minerals, that are necessary to the functionality or production of products manufactured or contracted to be manufactured. Although the SEC has recently provided guidance with respect to a portion of the conflict minerals filing requirements that will somewhat relax the reporting required, weWe may incur significant costs associated with complying with the other portions of the rule, such as costs related to the determination of the origin, source and chain of custody of the minerals used in Oculus products, the adoption of conflict minerals-related governance policies, processes and controls, and possible changes to products or sources of supply as a result of such activities.
We may face inventory risk with respect to our Oculus products.
We may be exposed to inventory risks with respect to our Oculus products as a result of rapid changes in product cycles and pricing, unsafe or defective merchandise, changes in consumer demand and consumer spending patterns, changes in consumer tastes with respect to Oculus products, and other factors. We endeavor to accurately predict these trends and avoid overstocking
or understocking products Oculus may sell. Demand for products, however, can change significantly between the time inventory or components are ordered and the date of sale. In addition, when we begin selling or manufacturing a new Oculus product, it may be difficult to establish vendor relationships, determine appropriate product or component selection, and accurately forecast demand. The acquisition of certain types of inventory or components may require significant lead-time and prepayment and they may not be returnable. Any one of these factors may adversely affect our operating results.
We may have exposure to greater than anticipated tax liabilities.
Our income tax obligations, including income and non-income taxes, are based in part on our corporate operating structure and intercompany arrangements, including the manner in which we operate our business, develop, value, manage, protect, and use our intellectual property, and the valuations of our intercompany transactions. We may also be subject to additional indirect or non-income taxes. The tax laws applicable to our business, including the laws of the United States and other jurisdictions, are subject to interpretation and certain jurisdictions are aggressively interpreting their laws in new ways in an effort to raise additional tax revenue from companies such as Facebook. The taxingWe are subject to regular review and audit by U.S. federal, state, and foreign tax authorities. Tax authorities of the jurisdictions in whichmay disagree with certain positions we operate may challengehave taken, including our methodologies for valuing developed technology or intercompany arrangements, whichand any adverse outcome of such a review or audit could increase our worldwide effective tax rate, increase the amount of non-income taxes imposed on our business, and harm our financial position, and results of operations.operations, and cash flows. For example, in 2016 and 2018, the IRS recently issued us a formal assessmentassessments relating to transfer pricing with our foreign subsidiaries in conjunction with the examination of the 2010 through 2013 tax year, and althoughyears. Although we disagree with the IRS's position and are contesting this issue, the ultimate resolution is uncertain and, if resolved in a manner unfavorable to us, may adversely affect our financial results. We are subject to regular review and audit by U.S. federal and state, and foreign tax authorities. Tax authorities may disagree with certain positions we have taken and any adverse outcome of such a review or audit could have a negative effect on our financial position and results of operations. In addition, the
The determination of our worldwide provision for income taxes and other tax liabilities requires significant judgment by management, and there are many transactions where the ultimate tax determination is uncertain. Our provision for income taxes is also determined by the manner in which we operate our business, and any changes to such operations or laws applicable to such operations may affect our effective tax rate. Although we believe that our provision for income taxes isand estimates of our non-income tax liabilities are reasonable, the ultimate tax outcomesettlement may differ from the amounts recorded in our financial statements and may materially affect our financial results in the period or periods for which such determination is made.In addition, our
Our future income taxestax rates could be adversely affected by earnings being lower than anticipatedvolatile and difficult to predict due to changes in jurisdictions that have lower statutory tax rates and higher than anticipated in jurisdictions that have higher statutory tax rates, byjurisdictional profit split, changes in the valuationamount and recognition of our deferred tax assets and liabilities, or by changes in tax laws, regulations, or accounting principles. For example, we have previously incurred losses in certain international subsidiaries that resulted in an effective tax rate that is significantly higher than the statutory tax rate in the United States and this could continue to happen in the future.
Changes in tax laws or tax rulings could materially affect our financial position, and results of operations.operations, and cash flows.
The income and non-income tax regimes we are subject to or operate under, including income and non-income taxes, are unsettled and may be subject to significant change. Changes in tax laws or tax rulings, or changes in interpretations of existing laws, could materially affect our financial position, and results of operations. Manyoperations, and cash flows. For example, changes to U.S. tax laws enacted in December 2017 had a significant impact on our tax obligations and effective tax rate for the fourth quarter of 2017. In addition, many countries in Europe, as well as a number of other countries and organizations, have recently proposed or recommended changes to existing tax laws or have enacted new laws that could significantly increase our tax obligations in many countries where we do business or require us to change the manner in which we operate our business.
The Organization for Economic Cooperation and Development has been working on a Base Erosion and Profit SharingShifting Project, and issued a report in 2015, an interim report in 2018, and is expected to continue to issue guidelines and proposals that may change various aspects of the existing framework under which our tax obligations are determined in many of the countries in which we do business. Similarly, in 2018, the European Commission issued proposals that would change various aspects of the current tax framework under which we are taxed. These proposals include changes to the existing framework to calculate income tax, as well as proposals to change or impose new types of non-income taxes, including taxes based on a percentage of revenue.
The European Commission has conducted investigations in multiple countries focusing on whether local country tax rulings or tax legislation provides preferential tax treatment that violates European Union state aid rules and concluded that certain countries, including Ireland, have provided illegal state aid in certain cases. These investigations may result in changes to the tax treatment of our foreign operations. In addition, the current U.S. administration and key members of Congress have made public statements indicating that tax reform is a priority. Certain changes to U.S. tax laws, including limitations on the ability to defer U.S. taxation on earnings outside of the United States until those earnings are repatriated to the United States, could affect the tax treatment of our foreign earnings.
Due to the large and expanding scale of our international business activities, many of these types of changes to the taxation of our activities described above could increase our worldwide effective tax rate, increase the amount of non-income taxes imposed on our business, and harm our financial position, and results of operations.operations, and cash flows.
Uncertainties in the interpretation and application of the 2017 Tax Cuts and Jobs Act could materially affect our tax obligations and effective tax rate.
The 2017 Tax Cuts and Jobs Act (the Tax Act) was enacted on December 22, 2017, and significantly affected U.S. tax law by changing how the U.S. imposes income tax on multinational corporations. The U.S. Department of Treasury has broad authority to issue regulations and interpretative guidance that may significantly impact how we will apply the law and impact our results of operations in the period issued.
The Tax Act requires complex computations not previously provided in U.S. tax law. As such, the application of accounting guidance for such items is currently uncertain. Further, compliance with the Tax Act and the accounting for such provisions require accumulation of information not previously required or regularly produced. As a result, we have provided a provisional estimate on the effect of the Tax Act in our financial statements. As additional regulatory guidance is issued by the applicable taxing authorities, as accounting treatment is clarified, as we perform additional analysis on the application of the law, and as we refine estimates in calculating the effect, our final analysis, which will be recorded in the period completed, may be different from our current provisional amounts, which could materially affect our tax obligations and effective tax rate.
We cannot guarantee that our share repurchase program will be fully consummated or that it will enhance long-term stockholder value. Share repurchases could also increase the volatility of the trading price of our stock and could diminish our cash reserves.
In November 2016, our board of directors authorized a share repurchase program of up to $6.0 billion of our Class A common stock that commenced in 2017 and does not have an expiration date. In April 2018, this authorization for the repurchase of our Class A common stock was increased by an additional $9.0 billion. Although our board of directors has authorized this share repurchase program, the program does not obligate us to repurchase any specific dollar amount or to acquire any specific number of shares. We cannot guarantee that the program will be fully consummated or that it will enhance long-term stockholder value. The program could affect the trading price of our stock and increase volatility, and any announcement of a termination of this program may result in a decrease in the trading price of our stock. In addition, this program could diminish our cash reserves.
Risks Related to Ownership of Our Class A Common Stock
The trading price of our Class A common stock has been and will likely continue to be volatile, and if the creation and dividend of Class C capital stock is effected, the trading price of that class will likely be volatile and may impact the trading price for the Class A common stock.volatile.
The trading price of our Class A common stock has been, and is likely to continue to be, volatile. Since shares of our Class A common stock were sold in our IPOinitial public offering in May 2012 at a price of $38.00 per share, our stock price has ranged from $17.55 to $156.50$195.32 through June 30, 2017.March 31, 2018. In addition to the factors discussed in this Quarterly Report on Form 10-Q, the trading price of our Class A common stock may fluctuate significantly in response to numerous factors, many of which are beyond our control, including:
actual or anticipated fluctuations in our revenue and other operating results;
the financial projections we may provide to the public, any changes in these projections or our failure to meet these projections;
actions of securities analysts who initiate or maintain coverage of us, changes in financial estimates by any securities analysts who follow our company, or our failure to meet these estimates or the expectations of investors;
additional shares of our stock being sold into the market by us, our existing stockholders, or in connection with acquisitions, or the anticipation of such sales;
investor sentiment with respect to our competitors, our business partners, and our industry in general;
announcements by us or our competitors of significant products or features, technical innovations, acquisitions, strategic partnerships, joint ventures, or capital commitments;
announcements by us or estimates by third parties of actual or anticipated changes in the size of our user base, the level of user engagement, or the effectiveness of our ad products;
changes in operating performance and stock market valuations of technology companies in our industry, including our developers and competitors;
price and volume fluctuations in the overall stock market, including as a result of trends in the economy as a whole;
the inclusion, exclusion, or deletion of our stock from any trading indices, such as the S&P 500 Index;
media coverage of our business and financial performance;
lawsuits threatened or filed against us;
developments in anticipated or new legislation and pending lawsuits or regulatory actions, including interim or final rulings by tax, judicial, or regulatory bodies;
trading activity in our share repurchase program; and
other events or factors, including those resulting from war or incidents of terrorism, or responses to these events.
In addition, in 2016 we announced a proposal to create a new class of non-voting capital stock, known as Class C capital stock, and to distribute two shares of Class C capital stock as a dividend to the holders of our Class A and Class B common stock for each share of Class A and Class B common stock held by them. While this proposal has been approved by our stockholders, the record and payment dates for this dividend will be determined by our board of directors in its discretion and there can be no assurance as to the timing of such dates. Once the dividend is distributed, we expect that the market price for the shares of our Class A common stock will generally reflect the effect of a three-for-one stock split. The pending Reclassification is currently subject to class action lawsuits that were filed on behalf of our stockholders.
If issued, we plan to list the Class C capital stock on the NASDAQ Stock Market LLC. The trading price for the Class C capital stock may be volatile and affected by the factors noted with respect to our Class A common stock above. The trading price of the Class C capital stock may also be affected by the difference in voting rights compared to our Class A and Class B common shares, the liquidity of the market for Class C capital stock, and investor demand for Class C capital stock, including that of institutional investors that may be unwilling, unable, or choose not to hold non-voting shares of our capital stock.
In addition, the stock markets have experienced extreme price and volume fluctuations that have affected and continue to affect the market prices of equity securities of many technology companies. Stock prices of many technology companies have
fluctuated in a manner unrelated or disproportionate to the operating performance of those companies. We are currently subject to securities litigation in connection with the misuse of certain data by a developer that shared such data with third parties in violation of our IPO.terms and policies and related matters. We may experience more such litigation following future periods of volatility. Any securities litigation could subject us to substantial costs, divert resources and the attention of management from our business, and adversely affect our business.
We do not intend to pay cash dividends for the foreseeable future.
We have never declared or paid cash dividends on our capital stock. We currently intend to retain any future earnings to finance the operation and expansion of our business and fund our share repurchase program, and we do not expect to declare or pay any cash dividends in the foreseeable future. As a result, you may only receive a return on your investment in our Class A common stock and, if issued, our Class C capital stock if the trading price of your shares increases.
The dual class structure of our common stock and a voting agreement between certain stockholders have the effect of concentrating voting control with our CEO and certain other holders of our Class B common stock; this will limit or preclude your ability to influence corporate matters.
Our Class B common stock has ten votes per share and our Class A common stock has one vote per share, and we intend to create Class C capital stock that generally has no voting rights.share. Stockholders who hold shares of Class B common stock, including certain of our executive officers, employees, and directors and their affiliates, together hold a substantial majority of the voting power of our outstanding capital stock. Because of the ten-to-one voting ratio between our Class B and Class A common stock, the holders of our Class B common stock collectively control a majority of the combined voting power of our common stock and therefore are able to control all matters submitted to our stockholders for approval so long as the shares of Class B common stock represent at least 9.1% of all outstanding shares of our Class A and Class B common stock. This concentrated control will limit or preclude your ability to influence corporate matters for the foreseeable future.
Transfers by holders of Class B common stock will generally result in those shares converting to Class A common stock, subject to limited exceptions, such as certain transfers effected for estate planning or charitable purposes. The conversion of Class B common stock to Class A common stock will have the effect, over time, of increasing the relative voting power of those holders of Class B common stock who retain their shares in the long term. If, for example, Mr. Zuckerberg retains a significant portion of his holdings of Class B common stock for an extended period of time, he could, in the future, continue to control a majority of the combined voting power of our outstanding capital stock.
Our status as a "controlled company" could make our Class A common stock less attractive to some investors or otherwise harm our stock price.
Because we qualify as a "controlled company" under the corporate governance rules for NASDAQ-listedNasdaq-listed companies, we are not required to have a majority of our board of directors be independent, nor are we required to have a compensation committee or an independent nominating function. In connection with the pending Reclassification, contingent uponlight of our paymentstatus as a controlled company, our board of a dividend of Class C capital stock as described in last year's proxy statement, our corporate governance guidelines will be amendeddirectors determined not to provide that our compensation & governance committee will be comprised solely of independent directors. We do not have a separate and independent nominating function and will continuechose to have the full board of directors be directly responsible for nominating members of our board. In addition,board, and in the future we could elect not to have a majority of our board of directors be independent or not to have a compensation committee. Accordingly, should the interests of our controlling stockholder differ from those of other stockholders, the other stockholders may not have the same protections afforded to stockholders of companies that are subject to all of the corporate governance rules for NASDAQ-listedNasdaq-listed companies. Our status as a controlled company could make our Class A common stock and, if issued, our Class C capital stock less attractive to some investors or otherwise harm our stock price.
Delaware law and provisions in our restated certificate of incorporation and bylaws could make a merger, tender offer, or proxy contest difficult, thereby depressing the trading price of our Class A common stock.
Our status as a Delaware corporation and the anti-takeover provisions of the Delaware General Corporation Law may discourage, delay, or prevent a change in control by prohibiting us from engaging in a business combination with an interested stockholder for a period of three years after the person becomes an interested stockholder, even if a change of control would be beneficial to our existing stockholders. In addition, our current restated certificate of incorporation and bylaws contain provisions that may make the acquisition of our company more difficult, including the following:
until the first date on which the outstanding shares of our Class B common stock represent less than 35% of the combined voting power of our common stock, any transaction that would result in a change in control of our company requires the approval of a majority of our outstanding Class B common stock voting as a separate class;
we currently have a dual class common stock structure, which provides Mr. Zuckerberg with the ability to control
the outcome of matters requiring stockholder approval, even if he owns significantly less than a majority of the shares of our outstanding Class A and Class B common stock;
when the outstanding shares of our Class B common stock represent less than a majority of the combined voting power of common stock, certain amendments to our restated certificate of incorporation or bylaws will require the approval of two-thirds of the combined vote of our then-outstanding shares of Class A and Class B common stock;
when the outstanding shares of our Class B common stock represent less than a majority of the combined voting power of our common stock, vacancies on our board of directors will be able to be filled only by our board of directors and not by stockholders;
when the outstanding shares of our Class B common stock represent less than a majority of the combined voting power of our common stock, our board of directors will be classified into three classes of directors with staggered three-year terms and directors will only be able to be removed from office for cause;
when the outstanding shares of our Class B common stock represent less than a majority of the combined voting power of our common stock, our stockholders will only be able to take action at a meeting of stockholders and not by written consent;
only our chairman, our chief executive officer, our president, or a majority of our board of directors are authorized to call a special meeting of stockholders;
advance notice procedures apply for stockholders to nominate candidates for election as directors or to bring matters before an annual meeting of stockholders;
our restated certificate of incorporation authorizes undesignated preferred stock, the terms of which may be established, and shares of which may be issued, without stockholder approval; and
certain litigation against us can only be brought in Delaware.
We intend to amend and restate our restated certificate of incorporation to create, as further described above, a new class of non-voting capital stock which may prolong Mr. Zuckerberg’s ability to control the outcome of matters submitted to our stockholders for approval, including the election of directors and any merger, consolidation, or sale of all or substantially all of our assets.
| |
| Item 2. | Unregistered Sales of Equity Securities and Use of Proceeds |
a) Sales of Unregistered Securities
None.
c) Issuer Purchases of Equity Securities
The following table summarizes the share repurchase activity for the three months ended June 30, 2017:March 31, 2018: |
| | | | | | | | | | | | | |
| | Total Number of Shares Purchased (1) | | Average Price Paid Per Share (2) | | Total Number of Shares Purchased as Part of Publicly Announced Programs (1) | | Approximate Dollar Value of Shares that May Yet Be Purchased Under the Plans or Programs |
| | (in thousands) | | | | (in thousands) | | (in millions) |
| April 1 – 30, 2017 | — |
| | $ | — |
| | — |
| | $ | 5,772 |
|
| May 1 – 31, 2017 | — |
| | $ | — |
| | — |
| | $ | 5,772 |
|
| June 1 – 30, 2017 | 1,185 |
| | $ | 151.91 |
| | 1,185 |
| | $ | 5,592 |
|
| | 1,185 |
| | | | 1,185 |
| | |
|
| | | | | | | | | | | | | |
| | Total Number of Shares Purchased (1) | | Average Price Paid Per Share (2) | | Total Number of Shares Purchased as Part of Publicly Announced Programs (1) | | Approximate Dollar Value of Shares that May Yet Be Purchased Under the Plans or Programs |
| | (in thousands) | | | | (in thousands) | | (in millions) |
| January 1 – 31, 2018 | 1,706 |
| | $ | 184.67 |
| | 1,706 |
| | $ | 3,615 |
|
| February 1 – 28, 2018 | 1,576 |
| | $ | 180.83 |
| | 1,576 |
| | $ | 3,330 |
|
| March 1 – 31, 2018 | 7,838 |
| | $ | 167.77 |
| | 7,838 |
| | $ | 2,015 |
|
| | 11,120 |
| | | | 11,120 |
| | |
| |
| (1) | In November 2016, our board of directors authorized a share repurchase program of up to $6.0 billion of our Class A common stock, which commenced in January 2017 and does not have an expiration date. In April 2018, this authorization for the repurchase of our Class A common stock was increased by an additional $9.0 billion. The timing and actual number of shares repurchased depend on a variety of factors, including price, general business and market conditions, and other investment opportunities, and shares may be repurchased through open market purchases or privately negotiated transactions, including through the use of trading plans intended to qualify under Rule 10b5-1 under the Exchange Act. |
| |
| (2) | Average price paid per share includes costs associated with the repurchases. |
|
| | | | | | | | | | | | |
| Exhibit | | | | Incorporated by Reference | | Filed Herewith |
| Number | | Exhibit Description | | Form | | File No. | | Exhibit | | Filing Date | |
| | | | | | | |
| | | | | | | | | | | | | |
| 10.1 | | | | | | | | | | | | X |
| 10.2 | | | | | | | | | | | | X |
| 10.3 | | | | | | | | | | | | X |
| 10.4 | | | | | | | | | | | | X |
| 31.1 | | | | | | | | | | | | X |
| | | | | | | |
| 31.2 | | | | | | | | | | | | X |
| | | | | | | |
| 32.1# | | | | | | | | | | | | X |
| | | | | | | |
| 32.2# | | | | | | | | | | | | X |
| | | | | | | |
| 101.INS | | XBRL Instance Document. | | | | | | | | | | X |
| | | | | | | |
| 101.SCH | | XBRL Taxonomy Extension Schema Document. | | | | | | | | | | X |
| | | | | | | |
| 101.CAL | | XBRL Taxonomy Extension Calculation Linkbase Document. | | | | | | | | | | X |
| | | | | | | |
| 101.DEF | | XBRL Taxonomy Extension Definition Linkbase Document. | | | | | | | | | | X |
| | | | | | | |
| 101.LAB | | XBRL Taxonomy Extension Labels Linkbase Document. | | | | | | | | | | X |
| | | | | | | |
| 101.PRE | | XBRL Taxonomy Extension Presentation Linkbase Document. | | | | | | | | | | X |
# This certification is deemed not filed for purposes of Section 18 of the Securities Exchange Act of 1934, as amended (Exchange Act), or otherwise subject to the liability of that section, nor shall it be deemed incorporated by reference into any filing under the Securities Act of 1933, as amended (Securities Act), or the Exchange Act.
SIGNATURES
Pursuant to the requirements of the Securities Exchange Act of 1934, the Registrant has duly caused this Quarterly Report on Form 10-Q to be signed on its behalf by the undersigned, thereunto duly authorized, in the City of Menlo Park, State of California, on this 27th26th day of July 2017.April 2018.
|
| | |
| | | FACEBOOK, INC. |
| | |
Date: July 27, 2017April 26, 2018 | | /s/ DAVID M. WEHNER
|
| | | David M. Wehner
Chief Financial Officer
(Principal Financial Officer) |
| | |
Date: July 27, 2017April 26, 2018 | | /s/ SUSAN J.S. TAYLOR |
| | | Susan J.S. Taylor
Chief Accounting Officer
(Principal Accounting Officer) |