UNITED STATES
SECURITIES AND EXCHANGE COMMISSION
WASHINGTON, DC 20549
FORM 10-Q
(Mark One)
| | | | | |
| ☒ | QUARTERLY REPORT PURSUANT TO SECTION 13 OR 15(d) OF THE SECURITIES EXCHANGE ACT OF 1934 |
For the quarterly period ended March 31,June 30, 2020
OR
| | | | | |
| ☐ | TRANSITION REPORT PURSUANT TO SECTION 13 OR 15(d) OF THE SECURITIES EXCHANGE ACT OF 1934 |
For the transition period from to
Commission File Number: 001-35518
SUPERNUS PHARMACEUTICALS, INC.
(Exact name of registrant as specified in its charter)
| | | | | | | | | | | | |
| Delaware | | | | 20-2590184 |
(State or other jurisdiction of
incorporation or organization) | | | | (I.R.S. Employer
Identification No.) |
| | | | |
| 9715 Key West Avenue | Rockville | MD | | 20850 |
| (Address of principal executive offices) | | | | (Zip Code) |
(301) 838-2500
(Registrant’s telephone number, including area code)
Indicate by check mark whether the registrant: (1) has filed all reports required to be filed by Section 13 or 15(d) of the Securities Exchange Act of 1934 during the preceding 12 months (or for such shorter period that the registrant was required to file such reports), and (2) has been subject to such filing requirements for the past 90 days. ☒ Yes ☐ No
Indicate by check mark whether the registrant has submitted electronically pursuant to Rule 405 of Regulation S-T (§232.405 of this chapter) during the preceding 12 months (or for such shorter period that the registrant was required to submit such files).
☒ Yes No ☐
Indicate by check mark whether the registrant is a large accelerated filer, an accelerated filer, a non-accelerated filer, a smaller reporting company, or an emerging growth company. See the definitions of “large accelerated filer,” “accelerated filer,” “smaller reporting company,” and “emerging growth company” in Rule 12b-2 of the Exchange Act.
| | | | | | | | | | | | |
| Large accelerated filer | ☒
| | Accelerated filer | ☐ |
| | | | |
| Non-accelerated filer | ☐ | | Smaller reporting company | ☐ |
| | | | |
| | | Emerging growth company | ☐ |
If an emerging growth company, indicate by check mark if the registrant has elected not to use the extended transition period for complying with any new or revised financial accounting standards provided pursuant to Section 13(a) of the Exchange Act. o
Indicate by check mark whether the registrant is a shell company (as defined in Rule 12b-2 of the Exchange Act). ☐ Yes ☒ No
Securities registered pursuant to Section 12(b) of the Exchange Act
| | | | | | | | | | | | | | | | | | | | |
| Title of each class | | Outstanding at April 29,July 31, 2020 | | Trading Symbol | | Name of each exchange on which registered |
| Common Stock, $0.001 par value per share | | 52,538,65952,664,084 | | SUPN | | The Nasdaq Global Market |
SUPERNUS PHARMACEUTICALS, INC.
FORM 10-Q — QUARTERLY REPORT
FOR THE QUARTERLY PERIOD ENDED March 31,June 30, 2020
PART I — FINANCIAL INFORMATION
Supernus Pharmaceuticals, Inc.
Condensed Consolidated Balance Sheets
(in thousands, except share data)
| | | | | | | | | | | |
| March 31, | | December 31, |
| 2020 | | 2019 |
| (unaudited) | | |
| Assets | | | |
| Current assets | | | |
| Cash and cash equivalents | $ | 225,767 | | | $ | 181,381 | |
| Marketable securities | 175,104 | | | 165,692 | |
| Accounts receivable, net | 119,195 | | | 87,332 | |
| Inventories, net | 24,418 | | | 26,628 | |
| Prepaid expenses and other current assets | 12,564 | | | 11,611 | |
| Total current assets | 557,048 | | | 472,644 | |
| Long term marketable securities | 534,712 | | | 591,773 | |
| Property and equipment, net | 18,011 | | | 17,068 | |
| Intangible assets, net | 23,579 | | | 24,840 | |
| Lease assets | 21,911 | | | 21,279 | |
| Deferred income taxes | 34,067 | | | 32,063 | |
| Other assets | 538 | | | 615 | |
| | | |
| Total assets | $ | 1,189,866 | | | $ | 1,160,282 | |
| | | |
| Liabilities and stockholders’ equity | | | |
| Current liabilities | | | |
| Accounts payable | $ | 3,124 | | | $ | 10,141 | |
| Accrued product returns and rebates | 119,453 | | | 107,629 | |
| Accrued expenses and other current liabilities | 33,003 | | | 37,130 | |
| Income taxes payable | 9,097 | | | 2,443 | |
| Nonrecourse liability related to sale of future royalties, current portion | 3,658 | | | 3,244 | |
| Total current liabilities | 168,335 | | | 160,587 | |
| Convertible notes, net | 349,232 | | | 345,170 | |
| Nonrecourse liability related to sale of future royalties, long term | 18,369 | | | 19,248 | |
| Lease liabilities, long term | 30,804 | | | 30,440 | |
| Other liabilities | 9,743 | | | 9,409 | |
| Total liabilities | 576,483 | | | 564,854 | |
| | | |
| Stockholders’ equity | | | |
| Common stock, $0.001 par value; 130,000,000 shares authorized; 52,537,159 and 52,533,348 shares issued and outstanding as of March 31, 2020 and December 31, 2019, respectively | 53 | | | 53 | |
| Additional paid-in capital | 392,430 | | | 388,410 | |
| Accumulated other comprehensive earnings (loss), net of tax | (166) | | | 7,417 | |
| Retained earnings | 221,066 | | | 199,548 | |
| Total stockholders’ equity | 613,383 | | | 595,428 | |
| | | |
| Total liabilities and stockholders’ equity | $ | 1,189,866 | | | $ | 1,160,282 | |
| | | | | | | | | | | |
| June 30, | | December 31, |
| 2020 | | 2019 |
| (unaudited) | | |
| Assets | | | |
| Current assets | | | |
| Cash and cash equivalents | $ | 210,975 | | | $ | 181,381 | |
| Marketable securities | 163,839 | | | 165,692 | |
| Accounts receivable, net | 126,559 | | | 87,332 | |
| Inventories, net | 35,338 | | | 26,628 | |
| Prepaid expenses and other current assets | 20,442 | | | 11,611 | |
| Total current assets | 557,153 | | | 472,644 | |
| Long term marketable securities | 358,673 | | | 591,773 | |
| Property and equipment, net | 17,941 | | | 17,068 | |
| Operating lease assets | 21,289 | | | 21,279 | |
| Finance lease asset | 22,479 | | | — | |
| Intangible assets, net | 408,272 | | | 24,840 | |
| Goodwill | 88,095 | | | — | |
| Deferred income tax assets | — | | | 32,063 | |
| Other assets | 17,118 | | | 615 | |
| Total assets | $ | 1,491,020 | | | $ | 1,160,282 | |
| | | |
| Liabilities and stockholders’ equity | | | |
| Current liabilities | | | |
| Accounts payable | $ | 5,515 | | | $ | 10,141 | |
| Accrued product returns and rebates | 144,105 | | | 107,629 | |
| Accrued expenses and other current liabilities | 58,818 | | | 34,305 | |
| Contingent consideration, current portion | 23,500 | | | — | |
| Income taxes payable | 25,052 | | | 2,443 | |
| Operating lease liabilities, current portion | 3,560 | | | 2,825 | |
| Finance lease liability, current portion | 4,201 | | | — | |
| Nonrecourse liability related to sale of future royalties, current portion | 4,525 | | | 3,244 | |
| Total current liabilities | 269,276 | | | 160,587 | |
| Convertible notes, net | 353,349 | | | 345,170 | |
| Contingent consideration, long term | 92,200 | | | — | |
| Nonrecourse liability related to sale of future royalties, long term | 16,455 | | | 19,248 | |
| Operating lease liabilities, long term | 30,108 | | | 30,440 | |
| Finance lease liability, long term | 18,382 | | | — | |
| Deferred income tax liabilities | 35,716 | | | — | |
| Other liabilities | 9,560 | | | 9,409 | |
| Total liabilities | 825,046 | | | 564,854 | |
| | | |
| Stockholders’ equity | | | |
| Common stock, $0.001 par value; 130,000,000 shares authorized; 52,624,084 and 52,533,348 shares issued and outstanding as of June 30, 2020 and December 31, 2019, respectively | 53 | | | 53 | |
| Additional paid-in capital | 398,829 | | | 388,410 | |
| Accumulated other comprehensive earnings, net of tax | 11,359 | | | 7,417 | |
| Retained earnings | 255,733 | | | 199,548 | |
| Total stockholders’ equity | 665,974 | | | 595,428 | |
| | | |
| Total liabilities and stockholders’ equity | $ | 1,491,020 | | | $ | 1,160,282 | |
See accompanying notes.
Supernus Pharmaceuticals, Inc.
Condensed Consolidated Statements of Earnings
(in thousands, except share and per share data)
| | | | | | | | | | | | | | | |
| Three Months ended March 31, | | | | | | |
| 2020 | | 2019 | | | | |
| (unaudited) | | | | | | |
| Revenues | | | | | | | |
| Net product sales | $ | 92,490 | | | $ | 83,099 | | | | | |
| Royalty revenues | 2,486 | | | 2,375 | | | | | |
| Total revenues | 94,976 | | | 85,474 | | | | | |
| | | | | | | |
| Costs and expenses | | | | | | | |
| Cost of goods sold | 4,152 | | | 3,684 | | | | | |
| Research and development | 18,937 | | | 15,394 | | | | | |
| Selling, general and administrative | 42,875 | | | 40,968 | | | | | |
| | | | | | | |
| Total costs and expenses | 65,964 | | | 60,046 | | | | | |
| | | | | | | |
| Operating earnings | 29,012 | | | 25,428 | | | | | |
| | | | | | | |
| Other income (expense) | | | | | | | |
| Interest expense | (5,755) | | | (5,870) | | | | | |
| Interest income, net | 5,777 | | | 4,681 | | | | | |
| Total other income (expense) | 22 | | | (1,189) | | | | | |
| | | | | | | |
| Earnings before income taxes | 29,034 | | | 24,239 | | | | | |
| | | | | | | |
| Income tax expense | 7,516 | | | 5,899 | | | | | |
| Net earnings | $ | 21,518 | | | $ | 18,340 | | | | | |
| | | | | | | |
| Earnings per share | | | | | | | |
| Basic | $ | 0.41 | | | $ | 0.35 | | | | | |
| Diluted | $ | 0.40 | | | $ | 0.34 | | | | | |
| | | | | | | |
| Weighted-average shares outstanding | | | | | | | |
| Basic | 52,534,787 | | | 52,336,443 | | | | | |
| Diluted | 53,581,051 | | | 53,985,385 | | | | | |
| | | | | | | | | | | | | | | | | | | | | | | |
| Three Months ended June 30, | | | | Six Months ended
June 30, | | |
| 2020 | | 2019 | | 2020 | | 2019 |
| (unaudited) | | | | (unaudited) | | |
| Revenues | | | | | | | |
| Net product sales | $ | 123,984 | | | $ | 102,358 | | | $ | 216,474 | | | $ | 185,457 | |
| Royalty revenues | 2,745 | | | 2,337 | | | 5,231 | | | 4,712 | |
| Total revenues | 126,729 | | | 104,695 | | | 221,705 | | | 190,169 | |
| | | | | | | |
| Costs and expenses | | | | | | | |
Cost of goods sold(a) | 8,386 | | | 4,044 | | | 12,538 | | | 7,728 | |
| Research and development | 22,247 | | | 16,970 | | | 41,184 | | | 32,364 | |
| Selling, general and administrative | 48,103 | | | 39,777 | | | 89,717 | | | 79,439 | |
| Amortization of intangible assets | 2,445 | | | 1,306 | | | 3,706 | | | 2,612 | |
| | | | | | | |
| Total costs and expenses | 81,181 | | | 62,097 | | | 147,145 | | | 122,143 | |
| | | | | | | |
| Operating earnings | 45,548 | | | 42,598 | | | 74,560 | | | 68,026 | |
| | | | | | | |
| Other income (expense) | | | | | | | |
| Interest income | 4,151 | | | 5,448 | | | 9,726 | | | 10,137 | |
| Interest expense | (5,815) | | | (5,389) | | | (11,570) | | | (11,268) | |
| Other income, net | 3,326 | | | 89 | | | 3,528 | | | 90 | |
| Total other income (expense) | 1,662 | | | 148 | | | 1,684 | | | (1,041) | |
| | | | | | | |
| Earnings before income taxes | 47,210 | | | 42,746 | | | 76,244 | | | 66,985 | |
| | | | | | | |
| Income tax expense | 12,543 | | | 10,019 | | | 20,059 | | | 15,918 | |
| Net earnings | $ | 34,667 | | | $ | 32,727 | | | $ | 56,185 | | | $ | 51,067 | |
| | | | | | | |
| Earnings per share | | | | | | | |
| Basic | $ | 0.66 | | | $ | 0.62 | | | $ | 1.07 | | | $ | 0.98 | |
| Diluted | $ | 0.65 | | | $ | 0.61 | | | $ | 1.05 | | | $ | 0.95 | |
| | | | | | | |
| Weighted-average shares outstanding | | | | | | | |
| Basic | 52,557,035 | | | 52,385,590 | | | 52,545,910 | | | 52,361,149 | |
| Diluted | 53,645,828 | | | 53,912,977 | | | 53,611,418 | | | 53,947,834 | |
(a)
See accompanying notes.
Supernus Pharmaceuticals, Inc.
Condensed Consolidated Statements of Comprehensive Earnings
(in thousands)
| | | | | | | | | | | | | | | |
| Three Months ended March 31, | | | | | | |
| 2020 | | 2019 | | | | |
| (unaudited) | | | | | | |
| Net earnings | $ | 21,518 | | | $ | 18,340 | | | | | |
| Other comprehensive (loss) earnings | | | | | | | |
| Unrealized (loss) gain on marketable securities, net of tax | (7,583) | | | 4,585 | | | | | |
| Other comprehensive (loss) earnings | (7,583) | | | 4,585 | | | | | |
| | | | | | | |
| Comprehensive earnings | $ | 13,935 | | | $ | 22,925 | | | | | |
| | | | | | | | | | | | | | | | | | | | | | | |
| Three Months ended June 30, | | | | Six Months ended
June 30, | | |
| 2020 | | 2019 | | 2020 | | 2019 |
| (unaudited) | | | | (unaudited) | | |
| Net earnings | $ | 34,667 | | | $ | 32,727 | | | $ | 56,185 | | | $ | 51,067 | |
| Other comprehensive earnings | | | | | | | |
| Unrealized gain on marketable securities, net of tax | 11,525 | | | 4,497 | | | 3,942 | | | 9,082 | |
| Other comprehensive earnings | 11,525 | | | 4,497 | | | 3,942 | | | 9,082 | |
| | | | | | | |
| Comprehensive earnings | $ | 46,192 | | | $ | 37,224 | | | $ | 60,127 | | | $ | 60,149 | |
See accompanying notes.
Supernus Pharmaceuticals, Inc.
Condensed Consolidated Statements of Changes in Stockholders’ Equity
ThreeSix Months ended March 31,June 30, 2020 and 2019
(unaudited, in thousands, except share data)
| | | | | | | | | | | | | | | | | | | | | | | | | | | | | | | | | | | |
| j | Common Stock | | | | Additional
Paid-in Capital | | Accumulated Other
Comprehensive
Earnings (Loss) | | Retained
Earnings | | Total
Stockholders’
Equity |
| Shares | | Amount | | | | | | | | |
| Balance, December 31, 2019 | 52,533,348 | | | $ | 53 | | | $ | 388,410 | | | $ | 7,417 | | | $ | 199,548 | | | $ | 595,428 | |
| Share-based compensation | — | | | — | | | 3,988 | | | — | | | — | | | 3,988 | |
| Exercise of stock options | 3,811 | | | — | | | 32 | | | — | | | — | | | 32 | |
| Net earnings | — | | | — | | | — | | | — | | | 21,518 | | | 21,518 | |
| Unrealized loss on marketable securities, net of tax | — | | | — | | | — | | | (7,583) | | | — | | | (7,583) | |
| Balance, March 31, 2020 | 52,537,159 | | | $ | 53 | | | $ | 392,430 | | | $ | (166) | | | $ | 221,066 | | | $ | 613,383 | |
| | | | | | | | | | | |
| | | | | | | | | | | |
| | | | | | | | | | | |
| | | | | | | | | | | |
| | | | | | | | | | | |
| | | | | | | | | | | |
| | | | | | | | | | | |
| | | | | | | | | | | |
| | | | | | | | | | | |
| | | | | | | | | | | |
| | | | | | | | | | | |
| | | | | | | | | | | |
| | | | | | | | | | | |
| | | | | | | | | | | | | | | | | | | | | | | | | | | | | | | | | | | |
| j | Common Stock | | | | Additional
Paid-in Capital | | Accumulated Other
Comprehensive
Earnings (Loss) | | Retained
Earnings | | Total
Stockholders’
Equity |
| Shares | | Amount | | | | | | | | |
| Balance, December 31, 2019 | 52,533,348 | | | $ | 53 | | | $ | 388,410 | | | $ | 7,417 | | | $ | 199,548 | | | $ | 595,428 | |
| Share-based compensation | — | | | — | | | 3,988 | | | — | | | — | | | 3,988 | |
| Exercise of stock options | 3,811 | | | — | | | 32 | | | — | | | — | | | 32 | |
| Net earnings | — | | | — | | | — | | | — | | | 21,518 | | | 21,518 | |
| Unrealized loss on marketable securities, net of tax | — | | | — | | | — | | | (7,583) | | | — | | | (7,583) | |
| Balance, March 31, 2020 | 52,537,159 | | | $ | 53 | | | $ | 392,430 | | | $ | (166) | | | $ | 221,066 | | | $ | 613,383 | |
| Share-based compensation | — | | | — | | | 4,962 | | | — | | | — | | | 4,962 | |
| Issuance of ESPP shares | 48,650 | | | — | | | 981 | | | — | | | — | | | 981 | |
| Exercise of stock options | 38,275 | | | — | | | 456 | | | — | | | — | | | 456 | |
| Net earnings | — | | | — | | | — | | | — | | | 34,667 | | | 34,667 | |
| Unrealized gain on marketable securities, net of tax | — | | | — | | | — | | | 11,525 | | | — | | | 11,525 | |
| Balance, June 30, 2020 | 52,624,084 | | | $ | 53 | | | $ | 398,829 | | | $ | 11,359 | | | $ | 255,733 | | | $ | 665,974 | |
| | | | | | | | | | | |
| | | | | | | | | | | |
| | | | | | | | | | | |
| | | | | | | | | | | |
| | | | | | | | | | | |
| | | | | | | | | | | |
| | | | | | | | | | | |
| | | Common Stock | | | Additional
Paid-in Capital | | Accumulated Other
Comprehensive
Earnings (Loss) | | Retained
Earnings | | Total
Stockholders’
Equity | | Common Stock | | | Additional
Paid-in Capital | | Accumulated Other
Comprehensive
Earnings (Loss) | | Retained
Earnings | | Total
Stockholders’
Equity |
| | Shares | | Amount | | | | | | | | | | Shares | | Amount | | | | | Total
Stockholders’
Equity | | |
| Balance, December 31, 2018 | Balance, December 31, 2018 | 52,316,583 | | | $ | 52 | | | $ | 369,637 | | | $ | (3,158) | | | $ | 86,492 | | | $ | 453,023 | | Balance, December 31, 2018 | 52,316,583 | | | $ | 52 | | | $ | 369,637 | | | $ | (3,158) | | | $ | 86,492 | | | $ | 453,023 | |
| Share-based compensation | Share-based compensation | — | | | — | | | 3,287 | | | — | | | — | | | 3,287 | | Share-based compensation | — | | | — | | | 3,287 | | | — | | | — | | | 3,287 | |
| Exercise of stock options | Exercise of stock options | 57,665 | | | — | | | 783 | | | — | | | — | | | 783 | | Exercise of stock options | 57,665 | | | — | | | 783 | | | — | | | — | | | 783 | |
| Net earnings | Net earnings | — | | | — | | | — | | | — | | | 18,340 | | | 18,340 | | Net earnings | — | | | — | | | — | | | — | | | 18,340 | | | 18,340 | |
| Unrealized gain on marketable securities, net of tax | Unrealized gain on marketable securities, net of tax | | — | | | — | | | — | | | 4,585 | | | — | | | 4,585 | | Unrealized gain on marketable securities, net of tax | — | | | — | | | — | | | 4,585 | | | — | | | 4,585 | |
| Balance, March 31, 2019 | Balance, March 31, 2019 | 52,374,248 | | | $ | 52 | | | $ | 373,707 | | | $ | 1,427 | | | $ | 104,832 | | | $ | 480,018 | | Balance, March 31, 2019 | 52,374,248 | | | $ | 52 | | | $ | 373,707 | | | $ | 1,427 | | | $ | 104,832 | | | $ | 480,018 | |
| Share-based compensation | | Share-based compensation | — | | | — | | | 4,022 | | | — | | | — | | | 4,022 | |
| Issuance of ESPP shares | | Issuance of ESPP shares | 48,950 | | | — | | | 1,377 | | | — | | | — | | | 1,377 | |
| Exercise of stock options | | Exercise of stock options | 25,838 | | | — | | | 263 | | | — | | | — | | | 263 | |
| Net earnings | | Net earnings | — | | | — | | | — | | | — | | | 32,727 | | | 32,727 | |
| Unrealized gain on marketable securities, net of tax | | Unrealized gain on marketable securities, net of tax | — | | | — | | | — | | | 4,497 | | | — | | | 4,497 | |
| Balance, June 30, 2019 | | Balance, June 30, 2019 | 52,449,036 | | | $ | 52 | | | $ | 379,369 | | | $ | 5,924 | | | $ | 137,559 | | | $ | 522,904 | |
|
See accompanying notes.
Supernus Pharmaceuticals, Inc.
Condensed Consolidated Statements of Cash Flows
(in thousands)
| | | | | | | | | | | |
| Three Months ended March 31, | | |
| 2020 | | 2019 |
| (unaudited) | | |
| Cash flows from operating activities | | | |
| Net earnings | $ | 21,518 | | | $ | 18,340 | |
| | | |
| Adjustments to reconcile net earnings to net cash provided by operating activities: | | | |
| Share-based compensation expense | 3,988 | | | 3,287 | |
| Depreciation and amortization | 1,732 | | | 1,679 | |
| Amortization of premium/discount on marketable securities | (451) | | | (1,102) | |
| Amortization of deferred financing costs and debt discount | 4,061 | | | 3,848 | |
| Noncash interest expense | 1,366 | | | 1,437 | |
| Noncash royalty revenue | (1,567) | | | (1,576) | |
| Noncash operating lease cost | 991 | | | 879 | |
| Deferred income tax benefit | 538 | | | 279 | |
| Changes in operating assets and liabilities: | | | |
| Accounts receivable | (31,823) | | | 23,013 | |
| Inventories | 2,210 | | | (859) | |
| Prepaid expenses and other current assets | (454) | | | (1,799) | |
| Other noncurrent assets | — | | | (196) | |
| Accounts payable | (7,017) | | | 4,045 | |
| Accrued product returns and rebates | 11,824 | | | (18,863) | |
| Accrued expenses and other current liabilities | (3,634) | | | (3,177) | |
| Income taxes payable | 6,654 | | | 4,856 | |
| Other liabilities | (1,020) | | | (1,098) | |
| Net cash provided by operating activities | 8,916 | | | 32,993 | |
| | | |
| Cash flows from investing activities | | | |
| Purchases of marketable securities | (15,382) | | | (150,167) | |
| Sales and maturities of marketable securities | 53,357 | | | 47,143 | |
| Purchases of property and equipment | (2,537) | | | (221) | |
| Deferred legal fees | — | | | (1) | |
| Net cash provided by (used in) investing activities | 35,438 | | | (103,246) | |
| | | |
| Cash flows from financing activities | | | |
| | | |
| | | |
| | | |
| | | |
| Proceeds from issuance of common stock | 32 | | | 783 | |
| Net cash provided by financing activities | 32 | | | 783 | |
| | | |
| Net change in cash and cash equivalents | 44,386 | | | (69,470) | |
| Cash and cash equivalents at beginning of year | 181,381 | | | 192,248 | |
| Cash and cash equivalents at end of period | $ | 225,767 | | | $ | 122,778 | |
| | | |
| Supplemental cash flow information | | | |
| Cash paid for interest on convertible notes | $ | 1,258 | | | $ | 1,258 | |
| Income taxes paid | $ | 324 | | | $ | 800 | |
| | | |
| Noncash investing and financing activities | | | |
| Deferred legal fees and fixed assets included in accounts payable and accrued expenses | $ | 708 | | | $ | 250 | |
| Property and equipment additions from utilization of tenant improvement allowance | $ | — | | | $ | 282 | |
| | | | | | | | | | | |
| Six Months ended June 30, | | |
| 2020 | | 2019 |
| (unaudited) | | |
| Cash flows from operating activities | | | |
| Net earnings | $ | 56,185 | | | $ | 51,067 | |
| Adjustments to reconcile net earnings to net cash provided by operating activities: | | | |
| Share-based compensation expense | 8,950 | | | 7,309 | |
| Depreciation and amortization | 5,044 | | | 3,355 | |
| Amortization of premium/discount on marketable securities | 984 | | | (1,625) | |
| Amortization of deferred financing costs and debt discount | 8,179 | | | 7,748 | |
| Realized gains from sales of marketable securities | (3,316) | | | (93) | |
| Noncash interest expense | 2,870 | | | 2,851 | |
| Noncash royalty revenue | (3,918) | | | (3,368) | |
| Noncash operating lease cost | 1,842 | | | 1,230 | |
| Deferred income tax benefit | (3,062) | | | 861 | |
| Changes in operating assets and liabilities: | | | |
| Accounts receivable | (20,431) | | | 18,439 | |
| Inventories | 1,689 | | | (365) | |
| Prepaid expenses and other current assets | (4,767) | | | (3,581) | |
| Other noncurrent assets | (1,176) | | | (140) | |
| Accounts payable | (7,199) | | | 886 | |
| Accrued product returns and rebates | 28,298 | | | (11,129) | |
| Accrued expenses and other current liabilities | 10,913 | | | (1,307) | |
| Income taxes payable | 22,513 | | | (9,703) | |
| Other liabilities | (2,731) | | | (755) | |
| Net cash provided by operating activities | 100,867 | | | 61,680 | |
| | | |
| Cash flows from investing activities | | | |
| Acquisition of USWM, net of cash acquired | (297,200) | | | — | |
| Investment in Navitor Pharmaceuticals, Inc. | (15,000) | | | — | |
| Purchases of marketable securities | (15,382) | | | (264,926) | |
| Sales and maturities of marketable securities | 257,936 | | | 96,165 | |
| Purchases of property and equipment | (3,072) | | | (245) | |
| Deferred legal fees | (24) | | | (1) | |
| Net cash used in investing activities | (72,742) | | | (169,007) | |
| | | |
| Cash flows from financing activities | | | |
| Proceeds from issuance of common stock | 1,469 | | | 2,423 | |
| Net cash provided by financing activities | 1,469 | | | 2,423 | |
| | | |
| Net change in cash and cash equivalents | 29,594 | | | (104,904) | |
| Cash and cash equivalents at beginning of year | 181,381 | | | 192,248 | |
| Cash and cash equivalents at end of period | $ | 210,975 | | | $ | 87,344 | |
| | | |
| Supplemental cash flow information | | | |
| Cash paid for interest on convertible notes | $ | 1,258 | | | $ | 1,258 | |
| Income taxes paid | 607 | | | 24,795 | |
| | | |
| Noncash investing and financing activities | | | |
| Contingent consideration liability accrued in USWM Acquisition | $ | 115,700 | | | $ | — | |
| Deferred legal fees and fixed assets included in accounts payable and accrued expenses | 365 | | | 280 | |
| Property and equipment additions from utilization of tenant improvement allowance | — | | | 431 | |
| Lease assets and tenant receivable obtained for new leases | 24,738 | | | 31,727 | |
See accompanying notes.
Supernus Pharmaceuticals, Inc.
Notes to Condensed Consolidated Financial Statements (unaudited)
1. Organization and Business
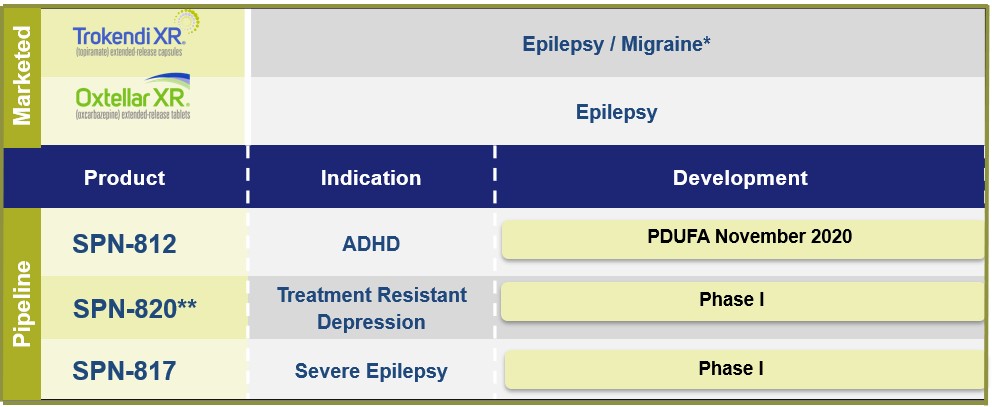
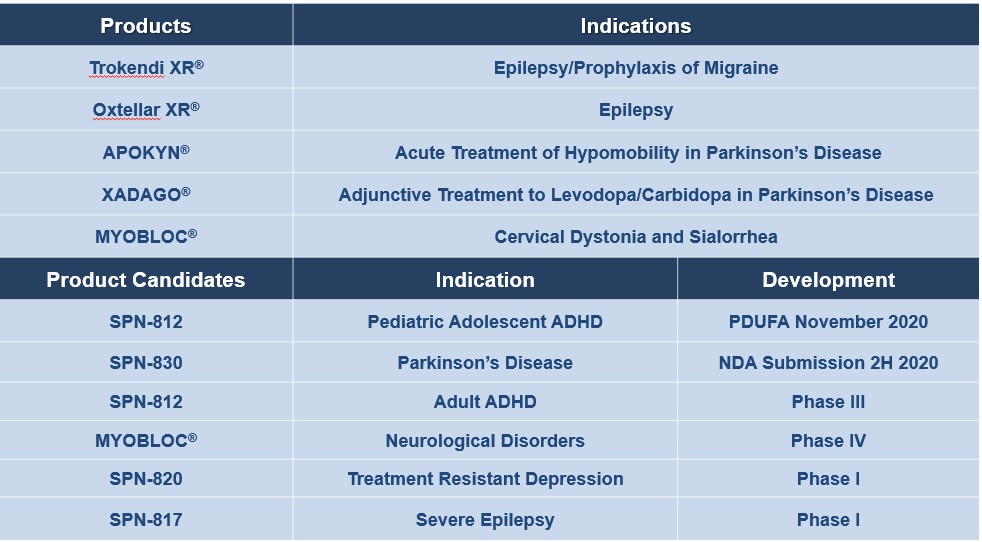
Supernus Pharmaceuticals, Inc. (the Company) was incorporated in Delaware, and commencedcommencing operations in 2005. The Company is a pharmaceutical company focused on developing and commercializing products for the treatment of central nervous system (CNS) diseases. The Company markets 2diseases, marketing 5 products: Oxtellar XR for the treatment of epilepsy andepilepsy; Trokendi XR for the prophylaxis of migraine headache and the treatment of epilepsy.epilepsy; APOKYN and XADAGO for the treatment of Parkinson's disease and MYOBLOC for the treatment of cervical dystonia and sialorrhea. The Company is also developing multiple proprietary CNS product candidates to address significant unmet medical needs and market opportunities.
The Company launched Oxtellar XR and Trokendi XR for the treatment of epilepsy in 2013, followed by the launch of Trokendi XR for the prophylaxis of migraine headache in adolescents and adults in 2017. The Company launched Oxtellar XR with an expanded indication to include monotherapy for partial seizures in January 2019. On June 9, 2020, the Company completed the previously announced acquisition of the CNS portfolio of US WorldMeds Partners, LLC (USWM Acquisition). With the acquisition, the Company acquired the right to further develop and commercialize 3 marketed products and a product candidate in late-stage development. Refer to Note 3 for further discussion on the USWM Acquisition.
COVID-19 Impact
The Company is closely monitoring the impact of the COVID-19 pandemic on all aspects of its business operations, and has assessed the impact of the COVID-19 pandemic on its condensed consolidated financial statements as of March 31,June 30, 2020. Through the first six months of 2020, the impact of the pandemic has had limited effect on the Company's business operations, and no material impact on its condensed consolidated financial statements.
Since the situation surrounding the COVID-19 pandemic remains fluid and the long term duration is uncertain, the long-term nature and extent of the effectsimpacts of the pandemic on the Company's business operations and financial position cannot be reasonably estimated at this time.
2. Summary of Significant Accounting Policies
Basis of Presentation
The Company’s condensed consolidated financial statements include the accounts of: Supernus Pharmaceuticals, Inc.; Supernus Europe Ltd.; Biscayne Neurotherapeutics, Inc.; and Biscayne Neurotherapeutics Australia Pty Ltd. These are collectively referred to herein as “Supernus” or “the Company.” All significant intercompany transactions and balances have been eliminated in consolidation.
The Company’s unaudited condensed consolidated financial statements have been prepared in accordance with the requirements of the U.S. Securities and Exchange Commission (SEC) for interim financial information. As permitted under Generally Accepted Accounting Principles in the United States (U.S. GAAP), certain notes and other information have been omitted from the interim unaudited condensed consolidated financial statements presented in this Quarterly Report on Form 10-Q. Therefore, these financial statements should be read in conjunction with the Company’s most recent Annual Report on Form 10-K, for the year ended December 31, 2019, filed with the SEC.
In management’s opinion, the condensed consolidated financial statements include all normal and recurring adjustments necessary for a fair presentation of the Company’s financial position, results of operations and cash flows. The results of operations for any interim period are not necessarily indicative of the Company’s future quarterly or annual results.
The Company, which is primarily located in the United States (U.S.), operates in 1 operating segment.
Reclassifications
Certain prior year amounts on the condensed consolidated statements of earnings have been reclassified to conform to the current year presentation, including a reclassification made to separately present amortization of intangible assets, previously included in Selling, general and administrative expenses, to the Amortization of intangible assets on the condensed consolidated statements of earnings. These reclassifications had no effect on operating earnings or our other condensed consolidated financial statements for the three and six months ended June 30, 2020 and 2019.
Consolidation
The Company’s condensed consolidated financial statements include the accounts of: Supernus Pharmaceuticals, Inc.; Supernus Europe Ltd.; Biscayne Neurotherapeutics, Inc.; Biscayne Neurotherapeutics Australia Pty Ltd; MDD US Enterprises,
LLC (formerly USWM Enterprises, LLC) and MDD US Enterprises, LLC's wholly owned subsidiaries. These are collectively referred to herein as “Supernus” or “the Company.” All significant intercompany transactions and balances have been eliminated in consolidation.
The condensed consolidated financial statements reflect the consolidation of entities in which the Company has a controlling financial interest. In determining whether there is a controlling financial interest, the Company considers if it has a majority of the voting interests of the entity, or if the entity is a variable interest entity (VIE) and whether the Company is the primary beneficiary. In determining the primary beneficiary of a VIE, the Company evaluates whether it has both (1) the power to direct the activities of the VIE that most significantly impact the VIE’s economic performance and (2) the obligation to absorb losses of, or the right to receive benefits from, the VIE that could potentially be significant to that VIE. The Company's judgment with respect to its level of influence or control of an entity involves the consideration of various factors including the form of ownership interest, representation in the entity’s governance, the size of the investment, estimates of future cash flows, the ability to participate in policy making decisions and the rights of the other investors to participate in the decision making process and to liquidate the entity, if applicable. If the Company is not the primary beneficiary and an ownership interest is held in the entity, the interest is accounted for under the equity or cost methods of accounting, as appropriate. The Company continuously assesses whether it is the primary beneficiary of a VIE as changes to existing relationships or future transactions may result in changing conclusions.
Use of Estimates
The Company bases its estimates on: historical experience; various forecasts; information received from its service providers; information from other sources; and other assumptions that the Company believes are reasonable under the circumstances. Actual results could differ materially from the Company’s estimates. The Company evaluates the methodologies employed in making its estimates on an ongoing basis.
Business Combinations and Contingent Considerations
To determine whether acquisitions should be accounted for as a business combination or as an asset acquisition, the Company makes certain judgments as to determine whether the acquired set of activities and assets meets the definition of a business. Significant judgment is required in making the assessment as to whether the acquired processes or activities along with their inputs would be substantive so as to constitute a business, as defined by U.S. GAAP.
If the acquired set of activities and assets meets the definition of a business, the Company applies the acquisition method of accounting to that transaction. Otherwise, the transaction is recorded as an asset acquisition and not a business combination. In an asset acquisition, any acquired in-process research and development (IPR&D) that does not have an alternative future use is charged to expense at the acquisition date, and no goodwill is recorded.
Under the acquisition method of accounting, assets acquired and liabilities assumed are required to be recorded at their respective fair values as of the acquisition date. The excess of the purchase price over the fair value of the acquired net assets, where applicable, is recorded as goodwill. The operating results of the acquired business is included in the Company’s condensed consolidated statement of earnings beginning on the effective acquisition date. Acquisition-related expenses are recognized separately from the business combination, and are expensed as incurred.
Significant judgment is involved in determining the fair values assigned to assets acquired and liabilities assumed in a business combination, as well as the estimated asset lives. These can materially affect our consolidated results of operations. The fair values of intangible assets, including acquired IPR&D, are determined using information available near the acquisition date, based on estimates and assumptions that are deemed reasonable by management. Significant estimates and assumptions include, but are not limited to, probability of technical success, revenue growth and discount rate. Depending on the facts and circumstances, the Company may deem it necessary to engage an independent valuation expert to assist in valuing significant assets and liabilities.
While the Company uses its best estimates and assumptions to accurately value assets acquired and liabilities assumed at the acquisition date, estimates are inherently uncertain and subject to refinement. As a result, during the measurement period, which may be up to one year from the acquisition date, the Company may record adjustments to the assets acquired and liabilities assumed, with the corresponding offset to goodwill. In addition, uncertain tax positions and tax-related valuation allowances are initially recorded in connection with a business combination as of the acquisition date. The Company continues to collect information and re-evaluate these estimates and assumptions on a quarterly basis. The Company records any adjustments to the Company’s preliminary estimates to goodwill, provided these adjustments are within the one year measurement period from the
acquisition date. Upon the conclusion of the measurement period or subsequent to the final determination of the values of assets acquired or liabilities assumed, whichever comes first, any subsequent adjustments are recorded to our condensed consolidated statements of earnings in the period that these adjustments are identified.
Contingent Considerations
Certain of the Company’s business combinations involve the potential for future payment of consideration that is contingent upon the achievement of certain milestones related to the development and sale of its products; for example, product development milestones and royalty payments on future product sales. The fair value of contingent consideration liabilities is determined at the acquisition date using unobservable inputs. These inputs include the estimated amount and timing of projected cash flows, volatility, the probability of milestone achievement (i.e., achievement of the contingent event) and the estimated discount rates and risk-free rate used to present value the probability-weighted cash flows. Subsequent to the acquisition date, at each reporting period until the contingency is resolved, the contingent consideration liability is remeasured at current fair value, with changes recorded in earnings in the period of remeasurement.
Similarly, the determination of initial and subsequent fair value of the contingent consideration liability requires significant judgment by management. Changes in any of the inputs may result in a significantly different fair value adjustment and can impact the results of operations.
Additional information regarding the Company's recent business combination and contingent consideration arrangement is included in Note 3, USWM Acquisition.
Revenuefrom Product Sales
The Company’s customers are primarily pharmaceutical wholesalers, specialty pharmacies, and distributors. Customers purchase product to fulfill orders from retail pharmacy chains and independent pharmacies of varying size and purchasing power. The Company recognizes gross revenue when its products are physically received by its customers, upon shipment from a third party fulfillment center. The Company's customers take control of its products, including title and ownership, upon physical receipt of its products at their facilities. Customer orders are generally fulfilled within a few days of receipt, resulting in minimal order backlog. The Company does not adjust revenue for any financing effects, for those transactions where the Company expects the period between the transfer of the goods or services and collection to be less than one year. There are no minimum product purchase requirements with our customers.
The Company recognizes revenue from product sales in an amount that reflects the consideration the Company expects to receive in exchange for those goods. Product sales are recorded net of various forms of variable consideration, including: provision for estimated rebates; provision for estimated future product returns; and an estimated allowance for discounts. These are collectively considered "sales deductions."
As described below, variability in the net transaction price for the Company’s products arises primarily from the aforementioned sales deductions. Significant judgment is required in estimating certain sales deductions. In making these estimates, the Company considers: historical experience; product price increases; current contractual arrangements under applicable payor programs; unbilled claims; processing time lags; inventory levels in the wholesale, specialty pharmacy, and retail distribution channel and product life cycle. The Company adjusts its estimates of revenue either when the most likely amount of consideration it expects to receive changes, or when the consideration becomes fixed. Variable consideration on product sales is only recognized when it is probable that a significant reversal will not occur.
If actual results in the future vary from our estimates, the Company adjusts its estimates in that calendar period. These adjustments could materially affect net product sales and earnings in the period that such adjustments are recorded.
Sales Deductions
The Company records product sales net of the following sales deductions:
•Rebates: Rebates are discounts which the Company pays under either public sector or private sector health care programs. Public sector rebate programs encompass: various Medicaid drug rebate programs; Medicare gap coverage programs; programs covering public health service institutions; and programs covering government entities. All federal employees and agencies purchase drugs under the Federal Supply Schedule. Private sector rebate programs include: contractual agreements with managed care providers, under which the Company pays fees to gain access to that provider’s patient drug formulary; and Company sponsored programs, under which the Company defrays or eliminates
patient co-payment charges that the patient would otherwise be obligated to pay to their managed care provider in order to fill their prescription.
Rebates paid under public sector programs are generally mandated under law, whereas private sector rebates are generally contractually negotiated by the Company with managed care providers. Both types of rebates vary over time.
Rebates are owed upon dispensing our product to a patient; i.e., filling a prescription. The accrual balance for rebates consists of the following three components. First, because rebates are generally invoiced and paid quarterly in arrears, the accrual balance consists of an estimate of the amount expected to be incurred for prescriptions dispensed in the current quarter. Second, the accrual balance also includes an estimate for known or estimated prior quarters’ unpaid rebates, covering those prescriptions dispensed in past quarters but for which no invoice has yet been received. Third, the accrual balance includes an estimate for rebates that will be prospectively owed, for prescriptions filled in future quarters. This estimate pertains to product that has been sold by the Company to wholesalers or distributors, and which resides either as wholesaler/distributor inventory or as inventory held at pharmacies. As of the end of the reporting period, this product has not been dispensed to a patient.
The Company’s estimates of expected rebate claims vary by program and by type of customer, because the period from the date at which the prescription is filled and the date at which the Company receives and pays the invoice varies substantially. For each of its products, the Company bases its estimates of expected rebate claims on multiple factors, including: historical levels of deductions; contractual terms with managed care providers; actual and anticipated changes in product price; prospective changes in managed care fee for service contracts; prospective changes in co-pay assistance programs; and anticipated changes in program utilization rates; i.e., patient participation rates under each specific program.
The Company records an estimated liability for rebates at the time the customer takes title to the product (i.e., at the time of sale to wholesalers/distributors), and records this liability as a reduction to gross product sales. This liability is recorded as an increase in Accrued product returns and rebates, and is reflected in current liabilities on our condensed consolidated balance sheets.
The sensitivity of the Company’s estimates varies by program and by type of customer. If actual rebates vary from estimated amounts, the Company will adjust the balances of such accrued rebates to reflect actual experience. These adjustments could materially affect the estimated liability balance, net product sales and earnings in the period in which the adjustment(s) is made.
•Returns: Sales of the Company’s products are not subject to a general right of return. Product that has been used to fill patient prescriptions is no longer subject to any right of return. However, the Company will accept return of product that is damaged or defective when shipped from its third party fulfillment center.
The Company will accept return of expired product six months prior to and up to 12 months subsequent to the product’s expiry date. Expired or defective returned product cannot be re-sold and is therefore destroyed.
The Company records an estimated liability for product returns at the time the customer takes title to the product (i.e., at time of sale). The liability is reflected as a reduction to gross product sales. This liability is recorded as an increase in Accrued product returns and rebates, in current liabilities on our condensed consolidated balance sheets. The Company estimates the liability for returns based primarily on the actual returns experience for its 5 commercial products.
Because the Company’s products have a shelf life up to 60 months from date of manufacture, and because the Company accepts return of product up to 12 months post expiry, there is a significant time lag of several years between the time when the product is sold and the time when the Company issues credit on expired product. The Company’s returns policy generally permits product returns to be processed at current wholesaler price rather than at historical acquisition price. Hence, the Company’s estimated liability for product returns is affected by price increases taken subsequent to the date of sale.
When the Company adjusts its estimates for product returns, the adjustment affects the estimated liability, product sales and earnings in the period of adjustment. Those adjustments may be material to our financial results.
•Sales discounts: Distributors and wholesalers of the Company's pharmaceutical products are generally offered various forms of consideration, including allowances, service fees and prompt payment discounts, for distributing our
products. Distributor and wholesaler allowances and service fees arise from contractual agreements, and are estimated as a percentage of the price at which the Company sells product to them. In addition, distributors and wholesalers are offered a prompt pay discount for payment within a specified period.
The Company accounts for these discounts at the time of sale, as a reduction to gross product sales, recording these discounts as a valuation allowance against Accounts receivable on the condensed consolidated balance sheets.
Royalty Revenues
The Company recognizes noncash royalty revenue for amounts earned pursuant to its royalty agreement with United Therapeutics Corporation (United Therapeutics), based on estimated product sales by United Therapeutics (see Note 4). This agreement includes the right to use the Company’s intellectual property as a functional license. In 2014, the Company sold certain of these royalty rights to Healthcare Royalty Partners III, L.P. (HC Royalty) (see Note 19). Sales of Orenitram by United Therapeutics result in payments made by United Therapeutics to HC Royalty, in accordance with these agreements. Consequent to this agreement, the Company recorded a nonrecourse liability related to this transaction, and amortizes this liability as noncash royalty revenue.
The Company also recognizes noncash interest expense related to this liability, and accrues interest expense at an effective interest rate (see Note 18). This interest rate is determined based on projections of HC Royalty’s rate of return.
Royalty revenue also includes cash royalty amounts received from other collaboration partners, including from Shire Plc (Shire, a subsidiary of Takeda Pharmaceutical Company Ltd), based on net product sales of Shire's product, Mydayis, in the current period. Royalty revenue is only recognized when the underlying product sale by Shire occurs. The Shire arrangement also includes Shire's right to use the Company’s intellectual property as a functional license.
There are 0 guaranteed minimum amounts owed to the Company related to any of these royalty revenue agreements.
Research and Development Expenses and Related Accrued Research and Development Expenses
Research and development expenditures are expensed as incurred. These expenses include: employee salaries, benefits and share-based compensation; cost of contract research and development services provided by third parties; costs for conducting preclinical and clinical studies; cost of acquiring or manufacturing clinical trial materials; regulatory costs; facilities costs; depreciation expense and allocated expenses; and license fees and milestone payments related to in-licensed products and technologies. Assets acquired that are used for research and development and that have no future alternative use are expensed as in-process research and development as incurred.
The Company estimates preclinical and clinical trial expenses based on services performed pursuant to contracts with research institutions, clinical investigators, clinical research organizations (CROs) and other service providers that provide services on the Company’s behalf. In recording service fees, the Company estimates the cost of those services which have been performed on behalf of the Company during the current period, and compares those costs with the cumulative expenses recorded and cumulative payments made for such services. As appropriate, the Company accrues additional service fees for services that have been delivered, or defers nonrefundable advance payments until the related services are performed. If the actual timing of the performance of services or the level of effort varies from the estimate, the Company adjusts its accrued expenses or its deferred advance payments, accordingly. If the Company subsequently determines that it no longer expects the services associated with a nonrefundable advance payment to be rendered, the remaining portion of that advance payment is charged to expense in the period in which such a determination is made.
Marketable Securities
Marketable securities consist of investments in: U.S. Treasury bills and notes; bank certificates of deposit; various U.S. governmental agency debt securities; corporate and municipal bonds; and other fixed income securities. The Company places all investments with governmental, industrial or financial institutions whose debt is rated as investment grade.
The Company's investments are classified as available-for-sale and are carried at fair value. The Company classifies all available-for-sale marketable securities with maturities greater than one year from the balance sheet date as non-current assets.
Any unrealized holding gains or losses on debt securities are reported, net of any tax effects, as a component of other comprehensive earnings (loss) in the condensed consolidated statement of comprehensive earnings. Realized gains and losses,
included in Other income (expense), net in the condensed consolidated statement of earnings, are determined using the specific identification method for determining the cost of securities sold.
The Company adopted Accounting Standards Update (ASU) No. 2016-13, Financial Instruments - Credit Losses (Topic 326) on January 1, 2020, using the allowance approach. Declines in fair value below amortized cost related to credit losses (i.e., impairment due to credit losses), if any, are included in the condensed consolidated statement of earnings, with a corresponding allowance established. If the estimate of expected credit losses decreases in subsequent periods, the Company will reverse the credit losses through current period earnings, and accordingly adjust the allowance (see Recently Issued Accounting Pronouncements).
Inventories
Inventories, which are recorded at the lower of cost or net realizable value, include materials, labor, direct costs and indirect costs. These are valued using the first-in, first-out method. The Company writes down inventory that has become obsolete, or has a cost basis in excess of its expected net realizable value. Expired inventory is disposed of, and the related costs are recognized as Cost of goods sold in the condensed consolidated statement of earnings.
Inventories Produced in Preparation of Product Launches
The Company capitalizes inventories produced in preparation for product launches when future commercialization of a product is probable and when future economic benefit is expected to be realized. The determination to capitalize is based on the particular facts and circumstances relating to the product. Capitalization of such inventory begins when the Company determines that (i) positive results have been obtained for the clinical trials that are necessary to support regulatory approval; (ii) uncertainties regarding regulatory approval have been significantly reduced; and (iii) it is probable that these capitalized costs will provide future economic benefit in excess of capitalized costs.
In evaluating whether these conditions are met, the Company considers the following factors: the product candidate’s current status in the regulatory approval process; results from the related pivotal clinical trials; results from meetings with relevant regulatory agencies prior to the filing of regulatory applications; compilation of the regulatory applications; consequent acceptance by the regulatory body; potential impediments to the approval process, such as product safety or efficacy concerns, potential labeling restrictions, and other impediments; historical experience with manufacturing and commercializing similar products as well as the relevant product candidate; and the resilience of the Company’s manufacturing environment, including its supply chain, in determining logistical constraints that could hamper approval or commercialization. In assessing the economic benefit that the Company is likely to realize, the Company considers: the shelf life of the product in relation to the expected timeline for approval; patent related or contract issues that may prevent or delay commercialization; product stability data of all pre-approval production to determine whether there is adequate expected shelf life; viability of commercialization, taking into account competitive dynamics in the marketplace and market acceptance; anticipated future sales; and anticipated reimbursement strategies that may prevail with respect to the product, if approved.
In applying the lower of cost or net realizable value to pre-launch inventory, the Company estimates a range of likely commercial prices based on comparable commercial products and pre-launch discussions with managed care providers.
The Company could be required to write down previously capitalized costs related to pre-launch inventories upon a change in such judgment(s), due to, among other potential factors, a denial or significant delay of approval by regulatory bodies, a delay in commercialization, or other adverse factors.
Revenuefrom Product SalesIntangible Assets
The Company’s customers, who are primarily pharmaceutical wholesalersIntangible assets consist of definite-lived intangible assets, including: acquired developed technology and distributors, purchase product to fulfill orders from retail pharmacy chainsrights intangible, and independent pharmaciespatent defense costs. They also consist of varying sizeindefinite-lived intangible assets, such as acquired IPR&D and purchasing power. The Company recognizes gross revenue when its products are physically received by its customers, upon shipment from a third party fulfillment center. Customers take control of our products, including title and ownership, upon physical receipt of our products at the customers' facilities. Customer orders are generally fulfilled within a few days of receipt, resulting in minimal order backlog. The Company does not adjust revenue for any financing effects, in transactions where the Company expects the period between the transfer of the goods or services and collection to be less than one year. There are no minimum product purchase requirements with customers.goodwill.
The Company recognizes revenue from product salesPatent defense costs are deferred legal fees that have been incurred in connection with legal proceedings related to the defense of patents for Oxtellar XR and Trokendi XR. Patent defense costs are charged to expense in the event of an amount that reflectsunsuccessful outcome of the consideration the Company expects to receive in exchange for those goods or services. Product sales are recorded net of various forms of variable consideration, including: provision for estimated rebates; provision for estimated future product returns; and an estimated allowance for discounts. These are collectively considered "sales deductions."litigation.
As described below, variability inDefinite-lived intangible assets are carried at cost less accumulated amortization, with amortization calculated on a straight line basis over the net transaction price for the Company’s products arises primarily from the aforementioned sales deductions. Variable consideration on product sales is only recognized when it is probable that a significant reversal will not occur. Significant judgment is required in estimating certain sales deductions. In making these estimates, the Company considers: historical experience; product price increases; current contractual arrangements under applicable payor programs; unbilled claims; processing time lags; and inventory levels in the wholesale and retail distribution channel.estimated useful lives. The Company adjustsevaluates the estimated remaining useful lives of its estimates of revenue either when the most likely amount of consideration it expects to receive changes,intangible assets annually or when events or changes in circumstances warrant a revision to the consideration becomes fixed.
If actual results in the future vary from our estimates, the Company adjusts these estimates. These adjustments could materially affect net product sales and earnings in the period that such adjustments are recorded.
Sales Deductions
The Company records product sales netremaining periods of the following sales deductions:
•Rebates: Rebates are discounts which the Company pays under either public sector or private sector health care programs. Public sector rebate programs encompass: various Medicaid drug rebate programs; Medicare gap coverageamortization.
programs; programs covering public health service institutions; and government entities. All federal employees and agencies purchase drugs under the Federal Supply Schedule. Private sector rebate programs include: contractual agreements with managed care providers, under which the Company pays fees to gain access to that provider’s patient drug formulary; and Company sponsored programs, under which the Company defrays or eliminates patient co-payment charges that the patient would otherwise be obligated to pay to their managed care provider in order to fill their prescription.
Rebates paid under public sector programs are generally mandated under law, whereas private sector rebates are generally contractually negotiated by the Company with managed care providers. Both types of rebates vary over time.
Rebates are owed upon dispensing our product to a patient; i.e., filling a prescription. The accrual balance for rebates consists of the following three components. First, because rebates are generally invoiced and paid quarterly in arrears, the accrual balance consists of an estimate of the amount expected to be incurred for prescriptions dispensed in the current quarter. Second, the accrual balance also includes an estimate for known or estimated prior quarters’ unpaid rebates, to cover prescriptions dispensed in past quarters, but for which no invoice has yet been received. Third, the accrual balance includes an estimate for rebates that will be prospectively owed, for prescriptions filled in future quarters. This pertains to product that has been sold by the Company to wholesalers or distributors, and which resides either as wholesaler/distributor inventory or as inventory held at pharmacies, but as of the end of the reporting period, this product has not been dispensed to a patient.
The Company’s estimates of expected rebate claims vary by program and by type of customer, because the period from the date at which the prescription is filled and the date at which the Company receives and pays the invoice varies substantially. For each of its products, the Company bases its estimates of expected rebate claims on multiple factors, including: historical levels of deductions; contractual terms with managed care providers; actual and anticipated changes in product price; prospective changes in managed care fee for service contracts; prospective changes in co-pay assistance programs; and anticipated changes in program utilization rates i.e., patient participation rates under each specific program. The Company records an estimated liability for rebates at the time the customer takes title to the product (i.e., at the time of sale to wholesalers/distributors), and records this liability as a reduction to gross product sales. This liability is recorded as an increase in Accrued product returns and rebates, in current liabilities on our condensed consolidated balance sheets.
The sensitivity of the Company’s estimates varies by program and by type of customer. If actual rebates vary from estimated amounts, the Company will adjust the balances of such accrued rebates to reflect actual experience with respect to these programs. These adjustments could materially affect the estimated liability balance, net product sales and earnings in the period in which the adjustment(s) is made.
•Returns: Sales of the Company’s products are not subject to a general right of return. Product that has been used to fill patient prescriptions is no longer subject to any right of return. However, the Company will accept return of product that is damaged or defective when shipped from its third party fulfillment center.
The Company will accept return of expired product six months prior to and up to 12 months subsequent to the product’s expiry date. Expired or defective returned product cannot be re-sold and is therefore destroyed.
The Company records an estimated liability for product returns at the time the customer takes title to the product (i.e., at time of sale) as a reduction to gross product sales. This liability is recorded as an increase in Accrued product returns and rebates, in current liabilities on our condensed consolidated balance sheets. The Company estimates the liability for returns based primarily on the actual returns experience for its 2 commercial products.
Because the Company’s products have a shelf life of 48 months from date of manufacture, and because the Company accepts return of product up to 12 months post expiry, there is a significant time lag of several years between the time when the product is sold and the time when the Company issues credit on expired product. The Company’s returns policy generally permits product returns to be processed at current wholesaler price rather than at historical acquisition price. Hence, the Company’s estimated liability for product returns is affected by price increases taken subsequent to the date of sale.
When the Company adjusts its estimates for product returns, the adjustment affects the estimated liability, product sales and earnings in the period of adjustment. Those adjustments may be material to our financial results.
•
Sales discounts: Distributors and wholesalers
Indefinite-lived intangible assets are not amortized but tested for impairment annually. Acquired IPR&D in a business combination is considered to be indefinite-lived until the completion or abandonment of the Company's pharmaceutical products are generally offered various forms of consideration, including allowances, service feesassociated research and prompt payment discounts for distributing our products. Distributor and wholesaler allowances and service fees arise from contractual agreements, and are estimated as a percentagedevelopment efforts. Upon successful completion of the price atproject, the Company will make a determination as to the then-useful life of the intangible asset, generally determined by the period in which the Company sells productsubstantial majority of the cash flows are expected to them. In addition, distributors and wholesalersbe generated. The capitalized amount is then amortized over its estimated useful life. If a project is abandoned, all remaining capitalized amounts are offered a prompt pay discountwritten off immediately. During the period prior to completion or abandonment, the IPR&D asset will not be amortized but will be tested for payment within a specified period. The Company accounts for these discounts at the time of sale, as a reduction to gross product sales, and records these discounts as a valuation allowance against Accounts receivable impairment on the condensed consolidated balance sheets.an annual basis.
License Revenues
License and Collaboration AgreementsGoodwill Impairment Assessment
The Company has entered into collaboration agreementsevaluates goodwill for possible impairment at least annually during the fourth quarter of each fiscal year, or more often, if and when circumstances indicate that goodwill may be impaired. This includes but is not limited to facilitate commercialization of both Oxtellar XR and Trokendi XR outsidesignificant adverse changes in the business climate, market conditions, or other events that indicate that it is more likely than not that the fair value of the U.S. Those agreements include the right to use the Company’s intellectual property as a functional license, and generally include an up-front license fee and ongoing milestone payments upon the achievement of certain specific events. These agreements may also require minimum royalty payments based on sales of products which use the applicable intellectual property.
Up-front license fees are recognized once the license has been executed betweenreporting unit is less than its carrying value. In performing its annual goodwill assessment, the Company andfirst performs a qualitative test. If necessary, the Company then performs a quantitative test. To conduct the quantitative impairment test of goodwill, the Company compares the fair value of a reporting unit to its licensee.
Milestones are a form of variable consideration that are recognized when either the underlying events have transpired (i.e., event-based milestone) or when the sales-based targets have been met by the collaborative partner (i.e., sales-based milestone). Both types of milestone payments are nonrefundable.carrying value. Evaluating for impairment requires judgment, including estimating future cashflows. The Company estimates the amountfair values of its reporting unit using discounted cash flow models or other valuation models, such as comparative transactions and market multiples. If the milestone to be included inreporting unit’s carrying value exceeds its fair value, the transaction price by using the most likely amount method. The Company includes in the transaction price some or all of the amount of variable consideration (i.e., the value of the associated milestone), but includes this onlyrecords an impairment loss to the extent that it is probable that a significant revenue reversal will not occur when the uncertainty associated with the variable consideration is subsequently resolved. Assessing whether it is probable that a significant revenue reversal will not occur once the uncertainty related to the variable consideration is subsequently resolved requires management judgment, and may require assessing factors that are outsidecarrying value of the Company’s influence, such as: likelihood of regulatory success; availability of third party information; and expected time period until achievement of the event. These factors are evaluated based on the specific facts and circumstances.
Event-based milestones are recognized in the period that the related event, such as regulatory approval, occurs. Sales-based milestones are recognized as revenue only when the sales-based target is achieved.
There are 0 guaranteed minimum amounts owed to the Company related to license and collaboration agreements.
Royalty Revenues
The Company recognizes noncash royalty revenue for amounts earned pursuant togoodwill exceeds its royalty agreement with United Therapeutics Corporation (United Therapeutics), based on estimated product sales by United Therapeutics (see Note 3). This agreement includes the right to use the Company’s intellectual property as a functional license. In 2014, the Company sold certain of these royalty rights to Healthcare Royalty Partners III, L.P. (HC Royalty) (see Note 17, Commitments and Contingencies). Sales of Orenitram by United Therapeutics result in payments made by United Therapeutics to HC Royalty, in accordance with these agreements. Consequent to this agreement, the Company recorded a nonrecourse liability related to this transaction, and amortizes this amount as noncash royalty revenue.
The Company also recognizes noncash interest expense related to this liability, and accrues interest expense at an effective interest rate (see Note 16). The interest rate is determined based on projections of HC Royalty’s rate of return.
Royalty revenue also includes cash royalty amounts received from collaboration partners, including from Shire Plc (Shire, a subsidiary of Takeda Pharmaceutical Company Ltd), based on net product sales in the current period of Shire’s product, Mydayis. Royalty revenue is only recognized when the underlying product sale by Shire occurs. The Shire arrangement also includes Shire's right to use the Company’s intellectual property as a functional license.
There are 0 guaranteed minimum amounts owed to the Company related to any of these royalty revenue agreements.
Research and Development Expense and Related Accrued Research and Development Expenses
Research and development expenditures are expensed as incurred. These expenses include: salaries, benefits and share-based compensation; contract research and development services provided by third parties; costs for conducting preclinical and clinical studies; cost of acquiring or manufacturing clinical trial materials; regulatory costs; facilities costs; depreciation expense and other allocated expenses; and license fees and milestone payments related to in-licensed products and technologies. Assets acquired that are used for research and development and that have no future alternative use are expensed as in-process research and development.
The Company estimates preclinical and clinical trial expenses based on services performed pursuant to contracts with research institutions, clinical investigators, clinical research organizations (CROs) and other service providers that provide services on the Company’s behalf. In recording service fees, the Company estimates the cost of those services which have been performed on behalf of the Company during the current period, and compares those costs with the cumulative expenses recorded and cumulative payments made for such services. As appropriate, the Company accrues additional service fees, or defers nonrefundable advance payments, until the related services are performed. If the actual timing of the performance of services or the level of effort varies from the estimate, the Company adjusts its accrued expenses, or its deferred advance payments, accordingly. If the Company subsequently determines that it no longer expects the services associated with a nonrefundable advance payment to be rendered, the remaining portion of that advance payment is charged to expense in the period in which such a determination is made.
Marketable Securities
Marketable securities consist of investments in: U.S. Treasury bills and notes; certificates of deposit; various U.S. governmental agency debt securities; corporate and municipal bonds; and other fixed income securities. The Company places all investments with governmental, industrial or financial institutions whose debt is rated as investment grade.
The Company classifies all available-for-sale marketable securities with maturities greater than one year from the balance sheet date as non-current assets. The Company's investments are classified as available-for-sale and are carried atimplied fair value.
Any unrealized holding gains or losses on debt securities are reported, netImpairment of any tax effects, as a component of other comprehensive earnings (loss) in the condensed consolidated statement of comprehensive earnings. Realized gains and losses are included in interest income, and are determined using the specific identification method for determining the cost of securities sold.Long Lived Assets
Long-lived assets consist primarily of property and equipment, operating lease assets and intangible assets. The carrying value of intangible assets is assessed for impairment annually during the fourth quarter of each year, or more frequently if impairment indicators exist. Impairment indicators include but are not limited to adverse changes in circumstances or other events that indicate the carrying amount of an asset may not be recoverable. Evaluating for impairment requires judgment, including estimating future cash flows, future growth rates and profitability, and the expected life over which cash flows will occur.
For IPR&D assets, the Company adopted Accounting Standards Update (ASU) No. 2016-13, Financial Instruments - Credit Losses (Topic 326) on January 1, 2020, usingalso considers various factors and risks for potential impairment, including the allowance approach. Declinescurrent legal and regulatory environment and the competitive landscape. Adverse clinical trial results, significant delays, or inability to obtain governmental approval, inability to commercialize the product candidate, and the introduction or advancement of competitor products and product candidates could result in partial or full impairment of the related intangible asset. Consequently, the eventual realized value of the IPR&D asset may vary from its fair value below amortized cost related to credit losses (i.e.,at the date of acquisition, and impairment due to credit losses), if any, are includedcharges may occur in future periods. Changes in the condensed consolidated statementCompany's business strategy or adverse changes in market conditions could adversely affect impairment analyses. If indications of earnings. A corresponding allowanceimpairment exist, projected future undiscounted cash flows associated with the asset are compared to the carrying value of the asset, to determine whether the asset's value is established.recoverable. If the estimate of expected credit losses decreases in subsequent periods,impairment is determined, the Company will reversewrites down the credit losses through current period earnings, and adjust accordinglyasset to its estimated fair value; i.e., the allowance (see Note 2 - Recently Issued Accounting Pronouncements).Company recognizes an impairment charge equal to the excess of the carrying value of the long-lived asset over its estimated fair value at the time at which a determination is made.
Share-Based Compensation
Stock Options
The Company recognizes share-based compensation expense over the service period, using the straight-line method. Employee share-based compensation for stock options is measured based on estimated fair value as of the grant date, using the Black-Scholes option-pricing model, in calculatingto compute the fair value of option grants as of the grant date. Forfeitures are accounted for as they occur. The Company uses the following assumptions for estimating the fair value of option grants:
Fair Value of Common Stock—The fair value of common stock underlying the option grants is determined based on observable market prices of the Company’s common stock.
Expected Volatility—Volatility is a measure of the amount by which the Company’s share price has historically fluctuated orand is expected to fluctuate (i.e., expected volatility) during a period. Beginning in the first quarter of 2019, the Company began using the historical volatility of its common stock to measure expected volatility. Prior to the first quarter of 2019, volatility was estimated using the observed volatility of the common stock of several public entities of similar size, complexity, and stage of development, as well as taking into consideration the Company’s actual volatility since the Company’s IPO in 2012.future.
Dividend Yield—The Company has never declared or paid dividends, and has no plans to do so in the foreseeable future. Dividend yield is therefore 0.
Expected Term—This is the period of time during which options are expected to remain unexercised. Options have a maximum contractual term of ten years. Beginning in the first quarter of 2019, the Company began estimating the average expected life of stock options using its historical experience. Prior to the first quarter of 2019, the Company determined the average expected life of stock options according to the “simplified method”, as described in Staff Accounting Bulletin 110, which is the mid-point between the vesting date and the end of the contractual term.
Risk-Free Interest Rate—This is the observed U.S. Treasury Note rate, as of the week each option grant is issued, with a term that most closely resembles the expected term of the option.
Expected Forfeiture Rate—Forfeitures are accounted for as they occur.
Restricted Stock Units (RSUs)
Compensation expense is recorded based on amortizing the fair market value as of the date of the grant over the implied service period. RSUs generally vest one year from the date of the grant and are subject to continued service requirements.
Performance Stock Units (PSUs)
Performance-Based Awards
Compensation expense for performance-based awards is recognized based on amortizing the fair market value as of the grant date over the periods during which the achievement of the performance is probable. Performance-based PSU awards require certain performance targets to be achieved in order for these awards to vest. These awards vestEach award vests on the date of achievement of the performance target.
Market-Based Awards
Compensation expense for market-based awards is recognized on a straight-line basis over the requisite service period, regardless of whether the market condition is satisfied. Market-based PSU awards subject to market-based performance targets require achievement of the performance target in order for these units to vest. The Company estimates the fair value of these awards as of the grant date and expected term using a Monte Carlo simulation that incorporates option-pricing inputs coveringinputs. This simulation covers the period from the grant date through the end of the derived requisite service period. The expected volatility as of the grant date is estimated based on historical daily volatility of the Company's common stock over the expected term of the award. The risk-free interest rate is based on the U.S. Treasury Note rate, as of the week the award is issued, with a term that most closely resembles the expected term of the award.
Advertising Expense
Advertising expense includes the cost of promotional materials and activities, such as printed and digital marketing materials, marketing programs and speaker programs. The cost of the Company's advertising efforts are expensed as incurred.
The Company incurred approximately $11.6$10.9 million and $9.9$22.5 million in advertising costs for the three and six months ended March 31,June 30, 2020, respectively, and approximately $11.2 million and $21.2 million in advertising costs for the three and six months ended June 30, 2019, respectively. These expenses are recorded as a component of Selling, general and administrative expenses in the condensed consolidated statements of earnings.
Income Taxes
The Company utilizes the asset and liability method of accounting for income taxes. Under this method, deferred tax assets and liabilities are determined based on differences between financial reporting and tax reporting bases for assets and liabilities, andliabilities. These differences are measured using enacted tax rates and laws that are expected to be in effect when the differences are expected to reverse. When appropriate, valuation allowances are established to reduce deferred tax assets to the amounts expected to be realized.
The Company accounts for uncertain tax positions in its consolidated financial statements when it is more-likely-than-not that the position will be sustained upon examination by the tax authorities. Such tax positions must initially and subsequently be estimated as the largest amount of tax benefit that has a greater than 50% likelihood of being realized upon ultimate settlement with the tax authorities, based on full knowledge of the position and relevant facts. The Company's policy is to recognize any interest and penalties related to income taxes as income tax expense in the relevant period.
Recently Issued Accounting Pronouncements
Accounting Pronouncements Adopted
ASU 2016-13, Financial Instruments—Credit Losses (Topic 326) - The new standard, issued in July 2016, requires credit losses on financial assets to be measured as the net amount expected to be collected, rather than based on incurred losses. For available-for-sale debt securities, the new standard did not revise the definition of impairment; i.e., the investment is impaired if the fair value of the investment is less than its cost. It also did not revise the requirement under ASC 320 for an entity to recognize, in net income, only the impairment amount related to credit risk, and to recognize, in other comprehensive income, the noncredit impairment amount.
The new standard made certain targeted changes to the impairment of available-for-sale debt securities, to eliminate the concept of "other than temporary" from the impairment model. Targeted changes to the impairment model included recognition of credit losses on available-for-sale debt securities using the allowance method, and limiting the allowance to the amount by which fair value is below amortized cost. The new standard also requires enhanced disclosure of credit risk associated with respective assets.
The Company adopted the new standard effective January 1, 2020.2020 using the modified retrospective approach. The adoption of the standard did not have a material impact on its condensed consolidated financial statements.
ASU 2018-15, Customer’s Accounting for Implementation Costs Incurred in a Cloud Computing Arrangement That Is a Service Contract - The new standard, issued in August 2018, aligns the requirements for capitalizing implementation costs incurred in a hosting arrangement that is a service contract with the requirements for capitalizing implementation costs incurred to develop or to obtain internal-use software. This includes hosting arrangements that include an internal-use software license. This ASU also requires that the implementation costs of a hosting arrangement that is a service contract are expensed over the term of the hosting arrangement, which includes reasonably certain renewals.
The Company adopted the new standard effective January 1, 2020.2020 using the prospective transition approach. The adoption of the standard did not have a material impact on its condensed consolidated financial statements.
ASU 2018-18, Clarifying the Interaction Between Topic 808 and Topic 606 - The new standard, issued in November 2018, clarifies when transactions between participants in a collaborative arrangement are within the scope of Topic 606.
The Company adopted the new standard effective January 1, 2020. The adoption of the standard did not have a material impact on its condensed consolidated financial statements.
ASU 2018-13, Changes to Disclosure Requirements for Fair Value Measurements (Topic 820) - The new standard, issued in August 2018, improved the effectiveness of disclosure requirements for recurring and nonrecurring fair value measurements. The standard removes, modifies and adds certain disclosure requirements.
The Company adopted the new standard effective January 1, 2020. The adoption of the standard did not have a material impact on its condensed consolidated financial statements.
New Accounting Pronouncements Not Yet Adopted
ASU 2019-12, Income Taxes (Topic 740): Simplifying the Accounting for Income Taxes - The new standard, issued in December 2019, simplifies the accounting for income taxes. This guidance will be effective on January 1, 2021 on a prospective basis, with early adoption permitted.
14The Company is currently evaluating the impact of the new guidance on its consolidated financial statements. It will adopt the new standard effective January 1, 2021.
Table of ContentsASU 2020-06, Debt - Debt with Conversion and Other Options (Subtopic 470-20) and Derivatives and Hedging - Contracts in Entity's Own Equity (Subtopic 815-40): Accounting for Convertible Instruments and Contracts in an Entity's Own Equity - The new standard, issued in August 2020, simplifies the accounting and disclosures for convertible instruments and contracts in an entity's own equity. This guidance will be effective on January 1, 2022 on a prospective basis, with early adoption permitted but no earlier than January 1, 2021.
The Company is currently evaluating the impact of the new guidance on its consolidated financial statements andstatements. It will adopt the new standard effective January 1, 2021.2022.
3.USWM Acquisition
On June 9, 2020 (the Closing Date), the Company completed its acquisition of all of the outstanding equity of USWM Enterprises, LLC (USWM Enterprises), a privately-held biopharmaceutical company, pursuant to a Sale and Purchase Agreement with US WorldMeds Partners, LLC (Seller), dated April 28, 2020 (the Agreement). Under the terms of the Agreement, the Company specifically acquired the right to further develop and commercialize APOKYN, XADAGO and the Apomorphine Infusion Pump in the U.S. and MYOBLOC worldwide (the Products). The Company paid the Seller $297.2 million in cash. For the three and six months ended June 30, 2020, the Company incurred transaction costs of $7.4 million and $8.3 million, respectively, to complete the acquisition which were included in Selling, general and administrative expense in the condensed consolidated statements of earnings.
Contingent payments of up to $230.0 million are due to the Seller upon the achievement of certain milestones related to the development and sale of the Products. In connection therewith, the Company recorded a contingent consideration liability of $115.7 million as of the date of acquisition to reflect the estimated fair value of the contingent consideration. The estimated fair value of the contingent consideration was determined using the Monte Carlo simulation for the sales-based milestones and income approach for the other milestones. The key assumptions considered include the estimated amount and timing of projected cash flows, probability of milestone achievement, volatility, estimated discount rates and risk-free interest rate. In each reporting period after the acquisition, the Company will revalue the contingent consideration liability and will record increases or decreases in the fair value of the liability in its consolidated statements of earnings. Changes in fair value will result from changes in actual and projected milestone achievement, as well as changes to forecasts. The inputs and assumptions may not be observable in the market, but reflect the assumptions the Company believes would be made by a market participant. The possible outcomes for the contingent consideration range from $0 to $230.0 million on an undiscounted basis.
The acquisition is being accounted for as a business combination under the acquisition method of accounting, in accordance with ASC 805, Business Combinations. The allocation of the purchase price to the assets acquired and liabilities assumed, including the residual amount allocated to goodwill, is based upon preliminary information. The allocation of the purchase price is subject to change within the measurement period (up to one year from the Closing Date) as additional information concerning final asset and liability valuations is obtained. During the measurement period, if the Company obtains new information about facts and circumstances that existed as of the Closing Date that, if known, would have resulted in revised estimated values of those assets or liabilities, the Company will revise the preliminary purchase price allocation. The effect of measurement period adjustments on the estimated fair value elements will be reflected as if the adjustments had been completed as of the Closing Date. Any changes to the initial estimates of the fair value of assets and liabilities will be recorded as adjustments to those assets and liabilities. Residual amounts will be allocated to goodwill. The impact of all changes that do not qualify as measurement period adjustments will be included in current period earnings.
The Company expects to finalize its purchase price allocation within one year of the Closing Date. In addition, The Company continues to analyze and assess relevant information necessary to determine, recognize and record at fair value the assets acquired and liabilities assumed in the following areas: intangible assets, lease assets and liabilities, tax assets and liabilities, and certain existing or potential reserves, including those for legal or contract-related matters. The activities the Company is currently undertaking, include but are not limited to the following: review of acquired contracts and other contract-related and legal matters; review and evaluation of the accounting policies, tax positions, and other tax-related matters. Further, the Company is in the process of obtaining input from third party valuation firms with respect to the fair value of the acquired tangible and intangible assets, and other information necessary to record and measure the assets acquired and liabilities assumed. Accordingly, the preliminary recognition and measurement of assets acquired and liabilities assumed as of Closing Date are subject to change.
The following preliminary purchase price allocation table presents the Company’s preliminary estimates of the fair value of the assets acquired and liabilities assumed at the Closing Date (dollars in thousands):
| | | | | | | | |
| Cash and cash equivalents | | $ | 6,994 | |
| Accounts receivable | | 18,474 | |
| Inventories | | 10,400 | |
| Prepaid expenses and other current assets | | 3,564 | |
| Property and equipment | | 454 | |
Finance lease asset(1) | | 22,747 | |
| Intangible assets | | 387,000 | |
| Other assets | | 340 | |
| Total fair value of assets acquired | | 449,973 | |
| Accounts payable | | (2,573) | |
| Accrued expenses and other current liabilities | | (23,339) | |
Finance lease liability(1) | | (22,747) | |
| Deferred income tax liabilities | | (69,515) | |
| Total fair value of liabilities assumed | | (118,174) | |
| Total identifiable net assets | | $ | 331,799 | |
| Goodwill | | 88,095 | |
| Total purchase price | | $ | 419,894 | |
| | |
Cash consideration paid(2) | | $ | 297,200 | |
(1)Refer to Note 10 for further discussion of the acquired finance lease asset and assumed lease liability.
(2)Represents total purchase price, less cash and cash equivalents acquired and contingent consideration liabilities recorded at the Closing Date
The Company determined the fair value of the inventory using the comparative sales method, which estimates the expected sales price of the product, reduced by all costs expected to be incurred to complete or dispose of the inventory, with a profit on sale.
The acquired intangible assets include an intangible asset associated with the IPR&D related to an infusion pump product candidate and intangible assets associated with the acquired developed technology and product rights. The Company determined the estimated fair values for the acquired intangible assets as of the Closing Date using the income approach. This is a valuation technique that provides an estimate of fair value of the assets, based on the market participant's expectations of the cash flows that the assets are forecasted to generate. The cash flows were discounted at a rate commensurate with the level of risk associated with its projected cash flows. The projected cash flows from these intangible assets were based on various assumptions, including: estimates of revenues, expenses, and operating profits; and risks related to the viability of and potential alternative treatments for any future target markets. In addition to the aforementioned factors, the Company also considered the following factors specific to the valuation of the IPR&D: the stage of development as of the Closing Date; the time and resources needed to complete the development and regulatory approval of the product candidate; the inherent difficulties and uncertainties in developing a product candidate, such as obtaining marketing approval from the U.S. Food and Drug Administration and other regulatory agencies; the economic life of the potential commercialized product; and associated commercialization risks. The Company believes the assumptions are representative of those a market participant would use in estimating fair value.
Acquired intangible assets, excluding the acquired IPR&D, will be amortized over their estimated useful lives on a straight-line basis. IPR&D assets are considered to be indefinite-lived until the completion or abandonment of the associated research and development efforts. The following table summarizes the preliminary purchase price allocation, and the preliminary average remaining useful lives, for identifiable intangible assets acquired (dollars in thousands):
| | | | | | | | | | | |
| Estimated Fair Value | | Estimated Useful Lives
(in years) |
| Acquired In-process Research & Development | $ | 150,000 | | | n/a |
| Acquired Developed Technology and Product Rights | 237,000 | | | 10.5 - 12.5 |
| Total intangible assets | $ | 387,000 | | | |
Goodwill was calculated as the excess of the consideration transferred over the net assets recognized and represents the future economic benefits arising from the other assets acquired that could not be individually identified and separately recognized. Goodwill is primarily attributable to the additional growth platforms and an expanded revenue base with the addition of the commercial and late-stage CNS assets from the USWM Acquisition. The goodwill is not expected to be deductible for tax purposes.
The operations of MDD US Enterprises and its subsidiaries have been included in the Company's condensed consolidated statements of earnings for the period subsequent to the Closing Date, and through June 30, 2020. Total revenues of $10.6 million and net earnings of $1.7 million were recorded for the three and six months ended June 30, 2020.
The following table presents the unaudited pro forma combined financial information for each of the periods presented, as if the USWM Acquisition had occurred on January 1, 2019 (dollars in thousands):
| | | | | | | | | | | | | | | | | | | | | | | |
| Three Months ended June 30, | | | | Six Months ended June 30, | | |
| 2020 | | 2019 | | 2020 | | 2019 |
| (unaudited) | | | | (unaudited) | | |
| Pro forma total revenues | $ | 151,803 | | | $ | 142,238 | | | $ | 284,965 | | | $ | 260,542 | |
| Pro forma net earnings | 38,841 | | | 34,940 | | | 61,959 | | | 44,254 | |
The unaudited pro forma combined financial information is based on historical financial information and the Company's preliminary allocation of purchase price; therefore, it is subject to subsequent adjustment upon finalization of the purchase price allocation. In order to reflect the occurrence of the acquisition on January 1, 2019, the unaudited pro forma combined financial information reflects the adoption of ASC 842, Leases; the recognition of additional amortization expense, net of removal of historical amortization charges, related to the acquired intangible assets; and the elimination of non-recurring acquisition-related transaction costs of $10.1 million incurred from the fourth quarter of 2019 through the second quarter of 2020. The unaudited pro forma combined financial information should not necessarily be considered indicative of the results that would have occurred if the acquisition had been consummated on the assumed completion date, nor are they indicative of future results.
4. Disaggregated Revenues
The following table summarizes the disaggregation of revenues by nature, (dollars in thousands):
| | | Three Months ended March 31, | | | Three Months ended June 30, | | | Six Months ended
June 30, | |
| | 2020 | | 2019 | | | 2020 | | 2019 | | 2020 | | 2019 |
| | (unaudited) | | | (unaudited) | | | (unaudited) | |
| Net product sales | Net product sales | | | Net product sales | |
| Trokendi XR | Trokendi XR | $ | 68,551 | | | $ | 63,693 | | | Trokendi XR | $ | 89,674 | | | $ | 78,964 | | | $ | 158,225 | | | $ | 142,657 | |
| Oxtellar XR | Oxtellar XR | 23,939 | | | 19,406 | | | Oxtellar XR | 23,680 | | | 23,394 | | | 47,619 | | | 42,800 | |
| APOKYN | | APOKYN | 8,600 | | | — | | | 8,600 | | | — | |
| XADAGO | | XADAGO | 801 | | | — | | | 801 | | | — | |
| MYOBLOC | | MYOBLOC | 1,229 | | | — | | | 1,229 | | | — | |
| Total net product sales | Total net product sales | $ | 92,490 | | | $ | 83,099 | | | Total net product sales | $ | 123,984 | | | $ | 102,358 | | | $ | 216,474 | | | $ | 185,457 | |
| Royalty revenues | Royalty revenues | 2,486 | | | 2,375 | | | Royalty revenues | 2,745 | | | 2,337 | | | 5,231 | | | 4,712 | |
| Total revenues | Total revenues | $ | 94,976 | | | $ | 85,474 | | | Total revenues | $ | 126,729 | | | $ | 104,695 | | | $ | 221,705 | | | $ | 190,169 | |
Trokendi XR accounted for 74%73% and 77% of the Company’s total net product sales for the threesix months ended March 31,June 30, 2020 and 2019, respectively.
The Company recognized noncash royalty revenue of $1.6$2.3 million and $3.9 million for the three and six months ended March 31,June 30, 2020, respectively. The Company recognized noncash royalty revenue of $1.8 million and $3.4 million, for the three and six months ended June 30, 2019, respectively, consequent to the Company's agreement with HC Royalty (see Note 2).respectively.
The Company ceased production and distribution of all commercial blister pack configurations for Trokendi XR in 2017. Subsequent to ceasing blister pack production and distribution in 2017, the observed rate of product return for all blister pack configurations of Trokendi XR steadily declined over time. This return rate trend was firmly established over a multi-year period. However, in the first quarter of 2020, the return rate for the final blister pack lots of Trokendi XR produced in 2017 exhibited a return rate significantly higher than had been experienced with all previous lots. The lots for which a higher return rate was observed are the last lots which were produced and distributed.
distributed commercially. As a result, the Company changed its estimate of the provision for product returns, based on the most recent experience. This change in estimate resulted in an increase to the provision for product returns of $8.0 million, decreaseda decrease in net product sales of $8.0 million and decreaseda decrease in net earnings of $5.9 million, or $0.11 per basic and per diluted share for the three months ended March 31, 2020.
4.
5. Fair Value of Financial Instruments
The fair value of an asset or liability represents the price that would be received to sell an asset or paid to transfer a liability in an orderly transaction between market participants.
The Company reports assets and liabilities measured at fair value using a three level hierarchy that prioritizes the inputs used to measure fair value. The three levels of inputs used to measure fair value are as follows:
•Level 1—Inputs are unadjusted, quoted prices in active markets for identical assets. The Company has the ability to access these prices as of the measurement date.
Level 1 assets include: cash held at banks; certificates of deposit; money market funds; investment grade corporate debt securities and U.S. government agency and municipal debt securities.
•Level 2—Level 2 securities are valued using third-party pricing sources that apply relevant inputs and data in their models to estimate fair value. Inputs are quoted prices for similar assets and liabilities in active markets; quoted prices for identical or similar assets and liabilities in markets that are not active; inputs other than quoted prices but that are observable for the asset or liability (e.g., interest rates; yield curves); and inputs that are derived principally from or corroborated by observable market data, by correlation, or by other means (i.e., market corroborated inputs).
Level 2 assets include: investment grade corporate debt securities, U.S. government agency and municipal debt securities; other fixed income securities; and SERP (Supplemental Executive Retirement Plan) assets. The fair
value of the restricted marketable securities is recorded in Other assets on the condensed consolidated balance sheets.
•Level 3—Unobservable inputs that reflect the Company’s own assumptions. These are based on the best information available, including the Company’s own data.
There were 0 level 3 assets as
Financial Assets
The Company’s financial assets that are required to be measured at fair value on a recurring basis are as follows (dollars in thousands):
| | | Fair Value Measurements at March 31, 2020 (unaudited) | | | Fair Value Measurements at June 30, 2020 (unaudited) | |
| | Total Fair Value at March 31,
2020 | | Quoted Prices
in Active Markets
for Identical Assets
(Level 1) | | Significant
Other
Observable
Inputs
(Level 2) | | Total Fair Value at June 30,
2020 | | Quoted Prices
in Active Markets
for Identical Assets
(Level 1) | | Significant
Other
Observable
Inputs
(Level 2) |
| Assets: | Assets: | | | | | | Assets: | | | | | |
| Cash and cash equivalents | Cash and cash equivalents | | Cash and cash equivalents | |
| Cash | Cash | $ | 19,911 | | | $ | 19,911 | | | $ | — | | Cash | $ | 183,703 | | | $ | 183,703 | | | $ | — | |
| Money market funds | Money market funds | 205,856 | | | 205,856 | | | | | Money market funds | 27,272 | | | 27,272 | | | — | |
| Marketable securities | Marketable securities | | | | | Marketable securities | | |
| Corporate debt securities | Corporate debt securities | 174,939 | | | — | | | 174,939 | | Corporate debt securities | 163,839 | | | — | | | 163,839 | |
| Municipal debt securities | Municipal debt securities | 165 | | | — | | | 165 | | Municipal debt securities | — | | | — | | | — | |
| Long term marketable securities | Long term marketable securities | | | | | Long term marketable securities | | |
| Corporate debt securities | Corporate debt securities | 524,683 | | | 255 | | | 524,428 | | Corporate debt securities | 353,659 | | | 259 | | | 353,400 | |
| U.S. government agency debt securities | U.S. government agency debt securities | 10,029 | | | — | | | 10,029 | | U.S. government agency debt securities | 5,014 | | | — | | | 5,014 | |
| Other noncurrent assets | Other noncurrent assets | | | | | Other noncurrent assets | | |
| Marketable securities - restricted (SERP) | Marketable securities - restricted (SERP) | 342 | | | 8 | | | 334 | | Marketable securities - restricted (SERP) | 431 | | | 1 | | | 430 | |
| Total assets at fair value | Total assets at fair value | $ | 935,925 | | | $ | 226,030 | | | $ | 709,895 | | Total assets at fair value | $ | 733,918 | | | $ | 211,235 | | | $ | 522,683 | |
| | | | | | | | | | | | | | | | | |
| | | Fair Value Measurements at December 31, 2019 (unaudited) | | |
| Total Fair Value at December 31,
2019 | | Quoted Prices
in Active Markets
for Identical Assets
(Level 1) | | Significant
Other
Observable
Inputs
(Level 2) |
| Assets: | | | | | |
| Cash and cash equivalents | | | | | | | | |
| Cash | $ | 78,912 | | | $ | 78,912 | | | $ | — | |
| Money market funds | 102,469 | | | 102,469 | | | — | |
| Marketable securities | | | | | |
| Corporate debt securities | 165,527 | | | — | | | 165,527 | |
| Municipal debt securities | 165 | | | — | | | 165 | |
| Long term marketable securities | | | | | |
| Corporate debt securities | 571,828 | | | 254 | | | 571,574 | |
| U.S. government agency and municipal debt securities | 19,945 | | | — | | | 19,945 | |
| Other noncurrent assets | | | | | |
| Marketable securities - restricted (SERP) | 418 | | | 3 | | | 415 | |
| Total assets at fair value | $ | 939,264 | | | $ | 181,638 | | | $ | 757,626 | |
Table of Contents | | | | | | | | | | | | | | | | | |
| | | Fair Value Measurements at December 31, 2019 | | |
| Total Fair Value at December 31,
2019 | | Quoted Prices
in Active Markets
for Identical Assets
(Level 1) | | Significant
Other
Observable
Inputs
(Level 2) |
| Assets: | | | | | |
| Cash and cash equivalents | | | | | |
| Cash | $ | 78,912 | | | $ | 78,912 | | | $ | — | |
| Money market funds | 102,469 | | | 102,469 | | | — | |
| Marketable securities | | | | | |
| Corporate debt securities | 165,527 | | | — | | | 165,527 | |
| Municipal debt securities | 165 | | | — | | | 165 | |
| Long term marketable securities | | | | | |
| Corporate debt securities | 571,828 | | | 254 | | | 571,574 | |
| U.S. government agency and municipal debt securities | 19,945 | | | — | | | 19,945 | |
| Other noncurrent assets | | | | | |
| Marketable securities - restricted (SERP) | 418 | | | 3 | | | 415 | |
| Total assets at fair value | $ | 939,264 | | | $ | 181,638 | | | $ | 757,626 | |
There were 0 level 3 assets as of June 30, 2020 or December 31, 2019.
The carrying amounts of other financial instruments, including accounts receivable, accounts payable and accrued expenses approximate fair value due to their short-term maturities.
Unrestricted available-for-sale marketable securities held by the Company are as follows, (dollars in thousands):
| | | | | | | | | | | |
| March 31,
2020 | | December 31, 2019 |
| (unaudited) | | |
| Corporate and U.S. government agency and municipal debt securities | | | |
| Amortized cost | $ | 710,072 | | | $ | 747,598 | |
| Gross unrealized gains | 5,362 | | | 10,031 | |
| Gross unrealized losses | (5,618) | | | (164) | |
| Total fair value | $ | 709,816 | | | $ | 757,465 | |
| | | | | | | | | | | |
| June 30,
2020 | | December 31, 2019 |
| (unaudited) | | |
| Corporate and U.S. government agency and municipal debt securities | | | |
| Amortized cost | $ | 507,375 | | | $ | 747,598 | |
| Gross unrealized gains | 15,525 | | | 10,031 | |
| Gross unrealized losses | (388) | | | (164) | |
| Total fair value | $ | 522,512 | | | $ | 757,465 | |
The contractual maturities of the unrestricted available-for-sale marketable securities held by the Company are as follows, (dollars in thousands):
| | | | | |
| March 31,June 30,
2020 |
| (unaudited) |
| Less than 1 year | $ | 175,104163,839 | |
| 1 year to 2 years | 181,141143,987 | |
| 2 years to 3 years | 199,207149,688 | |
| 3 years to 4 years | 154,36464,998 | |
| Greater than 4 years | — | |
| Total | $ | 709,816522,512 | |
As of March 31,June 30, 2020, there was 0 impairment due to credit loss on any available-for-sale marketable securities.
Financial Liabilities
As of June 30, 2020, the Company had Level 3 liabilities related to contingent consideration from the USWM Acquisition. The contingent consideration liabilities are required to be measured at fair value on a recurring basis. Refer to Note 3 for further discussion of significant inputs and assumptions used for the valuation of the contingent consideration at acquisition date. The fair value of the contingent consideration at June 30, 2020 was $115.7 million.
The following table sets forth the Company’s financial liabilities that are not carried at fair value, (dollars in thousands):
| | | | | | | | | | | | | | | | | | | | | | | |
| March 31, 2020 | | | | December 31, 2019 | | |
| (unaudited) | | | | | | |
| Carrying Value | | Fair Value (Level 2) | | Carrying Value | | Fair Value (Level 2) |
| 2023 Notes | $ | 349,232 | | | $ | 328,038 | | | $ | 345,170 | | | $ | 366,023 | |
| | | | | | | | | | | | | | | | | | | | | | | |
| June 30, 2020 | | | | December 31, 2019 | | |
| (unaudited) | | | | | | |
| Carrying Value | | Fair Value (Level 2) | | Carrying Value | | Fair Value (Level 2) |
| Convertible notes, net | $ | 353,349 | | | $ | 356,213 | | | $ | 345,170 | | | $ | 366,023 | |
The fair value is estimated based on actual trading information, as well as quoted prices provided by bond traders.
5.
6. Convertible Senior Notes Due 2023
The 0.625% Convertible Senior Notes Due 2023 (2023 Notes), which were issued in March 2018, bear interest at an annual rate of 0.625%, payable semi-annually in arrears on April 1 and October 1 of each year. The 2023 Notes will mature on April 1, 2023, unless earlier converted or repurchased by the Company. The Notes are being amortized to interest expense at an effective interest rate of 5.41% over the contractual term of the 2023 Notes. The Company may not redeem the 2023 Notes at its option before maturity. The total principal amount of 2023 Notes is $402.5 million.
The 2023 Notes were issued pursuant to an Indenture between the Company and Wilmington Trust, National Association, as trustee. The Indenture includes customary terms and covenants, including certain events of default upon which the 2023 Notes may be due and payable immediately. The Indenture does not contain any financial or operating covenants or restrictions on the payment of dividends, the issuance of other indebtedness or the issuance or repurchase of securities by the Company.
The Company will settle conversions by paying or delivering, as applicable, cash, shares of the Company’s common stock, or a combination of cash and shares of the Company’s common stock, at its election, based on the applicable conversion rate. The initial conversion rate is 16.8545 shares per $1,000 principal amount of the 2023 Notes, which represents an initial conversion price of approximately $59.33 per share, and is subject to adjustment as specified in the Indenture. In the event of
conversion, if converted in cash, the holders would forgo all future interest payments, any unpaid accrued interest and the possibility of further stock price appreciation.
If a “make-whole fundamental change,” as defined in the Indenture, occurs, then the Company will in certain circumstances increase the conversion rate for a specified period of time. If a “fundamental change,” as defined in the Indenture occurs, then noteholders may require the Company to repurchase their 2023 Notes at a cash repurchase price equal to the principal amount of the 2023 Notes to be repurchased, plus accrued and unpaid interest, if any.
Contemporaneous with the issuance of the 2023 Notes, the Company also entered into separate privately negotiated convertible note hedge transactions (collectively, the Convertible Note Hedge Transactions) with each of the call spread counterparties. The Company issued 402,500 convertible note hedge options. In the event that shares or cash are deliverable to holders of the 2023 Notes upon conversion at limits defined in the Indenture, counterparties to the convertible note hedges will be required to deliver up to approximately 6.8 million shares of the Company’s common stock, or to pay cash to the Company in a similar amount as the value that the Company delivers to the holders of the 2023 Notes, based on a conversion price of $59.33 per share.
Concurrently with entering into the Convertible Note Hedge Transactions, the Company also entered into separate privately negotiated warrant transactions (collectively, the Warrant Transactions) with each of the call spread counterparties. The Company issued a total of 6,783,939 warrants. The warrants entitle the holder to 1 share per warrant. The strike price of the Warrant Transactions will initially be $80.9063 per share of the Company’s common stock, and is subject to adjustment.
The Convertible Note Hedge Transactions are expected to reduce the potential dilution of the Company’s common stock upon conversion of the 2023 Notes, and/or offset any potential cash payments the Company is required to make in excess of the principal amount of converted 2023 Notes, as the case may be. The Warrant Transactions are intended to partially offset the cost to the Company of the purchased Convertible Note Hedge Transactions; however, the Warrant Transactions could have a dilutive effect with respect to the Company’s common stock to the extent that the market price per share of the Company’s common stock, as measured under the terms of the Warrant Transactions, exceeds the strike price of the warrants.
The liability component of the 2023 Notes consists of the following, (dollars in thousands):
| | | March 31,
2020 | | December 31,
2019 | | June 30,
2020 | | December 31,
2019 |
| | (unaudited) | | | | (unaudited) | | |
| 2023 Notes | 2023 Notes | $ | 402,500 | | | $ | 402,500 | | 2023 Notes | $ | 402,500 | | | $ | 402,500 | |
| Unamortized debt discount and deferred financing costs | Unamortized debt discount and deferred financing costs | (53,268) | | | (57,330) | | Unamortized debt discount and deferred financing costs | (49,151) | | | (57,330) | |
| Total carrying value | Total carrying value | $ | 349,232 | | | $ | 345,170 | | Total carrying value | $ | 353,349 | | | $ | 345,170 | |
NaN 2023 Notes were converted as of March 31,June 30, 2020 or December 31, 2019.
6.
7. Share-Based Payments
Share-based compensation expense is as follows (dollars in thousands):
| | | Three Months ended
March 31, | | | Three Months ended
June 30, | | | Six Months ended
June 30, | |
| | 2020 | | 2019 | | | 2020 | | 2019 | | 2020 | | 2019 |
| | (unaudited) | | | (unaudited) | | | (unaudited) | |
| Research and development | Research and development | $ | 681 | | | $ | 574 | | | Research and development | $ | 818 | | | $ | 700 | | | $ | 1,499 | | | $ | 1,274 | |
| Selling, general and administrative | Selling, general and administrative | 3,307 | | | 2,713 | | | Selling, general and administrative | 4,144 | | | 3,322 | | | 7,451 | | | 6,035 | |
| Total | Total | $ | 3,988 | | | $ | 3,287 | | | Total | $ | 4,962 | | | $ | 4,022 | | | $ | 8,950 | | | $ | 7,309 | |
Stock Option and Stock Appreciation Rights
The following table summarizes stock option and stock appreciation rights (SAR) activities:
| | | Number of
Options | | Weighted-
Average
Exercise Price
(per share) | | Weighted-
Average
Remaining
Contractual
Term (in years) | | Number of
Options | | Weighted-
Average
Exercise Price
(per share) | | Weighted-
Average
Remaining
Contractual
Term (in years) |
| Outstanding, December 31, 2019 | Outstanding, December 31, 2019 | 4,606,559 | | | $ | 23.05 | | | 6.66 | Outstanding, December 31, 2019 | 4,606,559 | | | $ | 23.05 | | | 6.66 |
| Granted | Granted | 1,105,925 | | | $ | 23.99 | | | Granted | 1,126,525 | | | $ | 23.98 | | |
| Exercised | Exercised | (3,811) | | | $ | 8.33 | | | Exercised | (42,086) | | | $ | 11.58 | | |
| Forfeited | Forfeited | (25,275) | | | $ | 28.12 | | | Forfeited | (41,800) | | | $ | 26.66 | | |
| Outstanding, March 31, 2020 (unaudited) | 5,683,398 | | | $ | 23.22 | | | 7.08 | |
| Outstanding, June 30, 2020 (unaudited) | | Outstanding, June 30, 2020 (unaudited) | 5,649,198 | | | $ | 23.30 | | | 6.86 |
| | As of December 31, 2019: | As of December 31, 2019: | | As of December 31, 2019: | |
| Vested and expected to vest | Vested and expected to vest | 4,606,559 | | | $ | 23.05 | | | 6.66 | Vested and expected to vest | 4,606,559 | | | $ | 23.05 | | | 6.66 |
| Exercisable | Exercisable | 2,598,112 | | | $ | 15.68 | | | 5.48 | Exercisable | 2,598,112 | | | $ | 15.68 | | | 5.48 |
| | As of March 31, 2020: | | |
| As of June 30, 2020: | | As of June 30, 2020: | |
| Vested and expected to vest | Vested and expected to vest | 5,683,398 | | | $ | 23.22 | | | 7.08 | Vested and expected to vest | 5,649,198 | | | $ | 23.30 | | | 6.86 |
| Exercisable | Exercisable | 3,394,315 | | | $ | 18.71 | | | 5.75 | Exercisable | 3,354,282 | | | $ | 18.85 | | | 5.53 |
Restricted Stock Units
During the threesix months ended March 31,June 30, 2020, the Company granted 26,055 RSUs with a weighted average grant date fair value per share of $23.99, which generally vest one year from the date of grant.
Performance Stock Units
Performance-Based Awards
During the threesix months ended March 31,June 30, 2020, the Company granted 15,62531,250 performance-based awards, with a weighted average grant date fair value per share of $23.99,$21.35, which require certain performance targets to be achieved in order for these awards to vest. Vesting is subject to continued service requirements through the date that the achievement of the performance target is certified.
Market-Based Awards
During the threesix months ended March 31,June 30, 2020, the Company granted 15,625 market-based awards, with a weighted average grant date fair value per share of $23.41, which are subject to market-based performance targets in order for these awards to vest.
7.
8. Earnings per Share
Basic earnings per share (EPS) is calculated using the weighted-average number of common shares outstanding. Diluted EPS is calculated using the weighted-average number of common shares outstanding, including the dilutive effect of the Company’s stock option grants, SARs, RSUs, PSUs, warrants, employee stock purchase plan (ESPP) awards and the 2023 Notes, as determined per the treasury stock method.
Effect of Convertible Notes and Related Convertible Note Hedges and Warrants
In connection with the issuance of the 2023 Notes, the Company entered into Convertible Note Hedge and Warrant Transactions as described further in Note 5,6, Convertible Senior Notes Due 2023. The expected collective impact of the Convertible Note Hedge and Warrant Transactions is to reduce the potential dilution that may occur between the conversion price of $59.33 per share and the strike price of the warrants of $80.9063 per share.
The 2023 Notes and related Convertible Note Hedge and Warrant Transactions are excluded in the calculation of diluted EPS because inclusion would be anti-dilutive. Specifically, the denominator of the diluted EPS calculation excludes the additional shares related to the 2023 Notes and warrants because the average price of the Company's common stock was less than the conversion price of the 2023 Notes of $59.33 per share, as well as less than the strike price of the warrants of $80.9063 per share. Prior to actual conversion, the Convertible Note Hedge Transactions are not considered in calculating diluted earnings per share, as their impact would be anti-dilutive.
In addition to the above described effect of the 2023 Notes and the related Convertible Note Hedge and Warrant Transactions, the Company also excluded the common stock equivalents of the following outstanding stock-based awards in the calculation of diluted EPS, because their inclusion would be anti-dilutive:
| | | | | | | | | | | | | | |
| Three Months ended
March 31, | | | | | |
| 2020 | | 2019 | | | |
| (unaudited) | | | | | |
| | | | | | |
| | | | | | |
| | | | | | |
| Stock options, RSUs, PSUs | 3,034,099 | | | 608,948 | | | | |
| | | | | | | | | | | | | | | | | | | | |
| Three Months ended
June 30, | | | Six Months ended
June 30, | | |
| 2020 | | 2019 | 2020 | | 2019 |
| (unaudited) | | | (unaudited) | | |
| | | | | | |
| | | | | | |
| | | | | | |
| Stock options, RSUs, PSUs | 2,999,885 | | | 1,030,370 | | 3,022,165 | | | 300,342 | |
The following table sets forth the computation of basic and diluted net earnings per share for the three and six months ended March 31,June 30, 2020 and 2019 (dollars in thousands, except share and per share amounts):
| | | Three Months ended March 31, | | | Three Months ended June 30, | | | Six Months ended
June 30, | |
| | 2020 | | 2019 | | | 2020 | | 2019 | | 2020 | | 2019 |
| | (unaudited) | | | (unaudited) | | | (unaudited) | |
| Numerator, dollars in thousands: | Numerator, dollars in thousands: | | | Numerator, dollars in thousands: | |
| Net earnings | Net earnings | $ | 21,518 | | | $ | 18,340 | | | Net earnings | $ | 34,667 | | | $ | 32,727 | | | $ | 56,185 | | | $ | 51,067 | |
| | Denominator: | Denominator: | | | Denominator: | |
| Weighted average shares outstanding, basic | Weighted average shares outstanding, basic | 52,534,787 | | | 52,336,443 | | | Weighted average shares outstanding, basic | 52,557,035 | | | 52,385,590 | | | 52,545,910 | | | 52,361,149 | |
| | Effect of dilutive securities: | Effect of dilutive securities: | | | Effect of dilutive securities: | |
| Stock options, PSU, RSU and SAR | 1,046,264 | | | 1,648,942 | | | |
| Stock options, RSU and SAR | | Stock options, RSU and SAR | 1,088,793 | | | 1,527,387 | | | 1,065,508 | | | 1,586,685 | |
| Weighted average shares outstanding, diluted | Weighted average shares outstanding, diluted | 53,581,051 | | | 53,985,385 | | | Weighted average shares outstanding, diluted | 53,645,828 | | | 53,912,977 | | | 53,611,418 | | | 53,947,834 | |
| | | | | | | | | | | | | |
| Earnings per share, basic | Earnings per share, basic | $ | 0.41 | | | $ | 0.35 | | | Earnings per share, basic | $ | 0.66 | | | $ | 0.62 | | | $ | 1.07 | | | $ | 0.98 | |
| Earnings per share, diluted | Earnings per share, diluted | $ | 0.40 | | | $ | 0.34 | | | Earnings per share, diluted | $ | 0.65 | | | $ | 0.61 | | | $ | 1.05 | | | $ | 0.95 | |
8.9. Income Tax Expense
The following table provides information regarding the Company’s income tax expense for the three and six months ended March 31,June 30, 2020 and 2019, (dollars in thousands):
| | | Three Months ended
March 31, | | | Three Months ended
June 30, | | | Six Months ended
June 30, | |
| | 2020 | | 2019 | | | 2020 | | 2019 | | 2020 | | 2019 |
| | (unaudited) | | | (unaudited) | | | (unaudited) | |
| Income tax expense | Income tax expense | $ | 7,516 | | | $ | 5,899 | | | Income tax expense | $ | 12,543 | | | $ | 10,019 | | | $ | 20,059 | | | $ | 15,918 | |
| Effective tax rate | Effective tax rate | 25.9 | % | | 24.3 | % | | Effective tax rate | 26.6 | % | | 23.4 | % | | 26.3 | % | | 23.8 | % |
The increasesincrease in income tax expense and in the effective tax rate for the three and six months ended March 31,June 30, 2020, as compared to the same period in the prior year, arewas primarily attributable to higher income before taxes, an increase in the number of states in which we owethe Company owes taxes, and an increase in non-deductible expenses.expenses as a result of the USWM Acquisition.
On March 27, 2020, President Trump signed into law the Coronavirus Aid, Relief and Economic Security Act (CARES Act). The CARES Act is an emergency economic stimulus package that includes spending and tax breaks to strengthen the U.S. economy and fund a nationwide effort to curtail the effect of the COVID-19 pandemic. While the CARES Act provides sweeping tax changes in response to the COVID-19 pandemic, some of the more significant provisions which are expected to impact the
Company’s financial statements include removal of certain limitations on utilization of net operating losses and increasing the ability to deduct interest expense, as well as amending certain provisions of the previously enacted Tax Cuts and Jobs Act.
As of March 31,June 30, 2020, the Company expects that these provisions will not have a material impact as the Company does not have net operating losses that would fall under these provisions and does not expect interest expense to be limited. The ultimate impact of the CARES Act may differ from this estimate due to changes in interpretations and assumptions, guidance that may be issued and actions the Company may take in response to the CARES Act. The CARES Act is highly detailedtechnical and complex and the Company will continue to assess the impact that various provisions will have on its business.
9.
10. Leases
The Company has entered into operating leases for its new headquarters office at 9715 Key West Ave, Rockville, MD; its former headquarters office and lab space at 1550 East Gude Drive in Rockville, MD;MD, and for its fleet vehicles. The Company’s existing leases for its former headquarters office and lab space run through April 2020. With respect to the fleet vehicle leases, given the volume of individual leases involved in the overall arrangement, the Company applies a portfolio approach to effectively account for the operating lease assets and liabilities.
New Headquarters Lease
Contemporaneous with the USWM Acquisition, USWM Enterprises adopted ASC 842, Leases. USWM Enterprises had an existing contract manufacturing agreement with Merz Pharma GmbH & Co. KGaA (Merz), for the manufacture and supply of MYOBLOC (Merz Agreement). Pursuant to the Merz Agreement, Merz agreed to provide a dedicated manufacturing facility that included a stand-alone building, dedicated clean room suites, manufacturing and purification equipment, and production lines (collectively, the manufacturing facility) to manufacture MYOBLOC. The Merz Agreement will expire in July 2027, unless the Company and Merz mutually agree to extend the terms. The Merz Agreement may not be terminated for convenience. The Company concluded that the Merz Agreement contains an embedded lease, because the Company controls the use of the dedicated manufacturing facility.
The Company entered into a new lease agreement, effective January 31, 2019, with Advent Key West, LLC (Landlord), for its new headquarters office in Rockville, MD (Premises). The term of the new headquarters lease commenced on February 1, 2019 (the Commencement Date) and will continue until April 30, 2034, unless earlier terminated in accordance with the terms of the lease. The lease includes options to extend the lease for up to 10 years, beyond 2034. Fixed rent with respect to the Premises began on the Commencement Date. However, the Landlord agreed to a rent abatement from the Commencement Date through April 30, 2020.
The initial fixed rental rate is approximately $195,000 per month for the first 12 months, and will automatically increase by 2% on each anniversary of the Commencement Date. Under the terms of the Lease,agreement, the Company provided a security deposit of approximately $195,000, and beis required to pay all utility charges forpurchase a minimum quantity of MYOBLOC on an annual basis, which represents the Premises, in additionin-substance fixed contract consideration associated with the dedicated manufacturing facility. The in-substance fixed contract consideration was allocated to its pro rata share of any operating expensesthe lease component, since the Company has elected not to separate lease and real estate taxes.non-lease components.
At Closing Date, the finance right of use (ROU) lease asset and corresponding lease liability relating to the dedicated manufacturing facility was $22.7 million. The finance ROU lease also providesasset and lease liability were calculated as the present value of estimated future payments; i.e. the minimum purchase obligations as of the Closing Date, applying an incremental borrowing rate of 2.5%. The embedded lease is preliminarily classified as a finance lease. The Company recognized $0.3 million of fixed lease cost for a tenant improvement allowancethe three and six months ended June 30, 2020. Purchases of approximately $10.2 millionMYOBLOC in excess of the aggregate. As of December 31, 2019, the tenant improvement allowance was fully utilized andannual minimum purchase obligations will be recorded as leasehold improvements within Property and equipment onvariable lease cost. Refer to Note 3 for further discussion of the condensed consolidated balance sheets.
Supplemental balance sheet information related to leases is as follows (dollars in thousands):
| | | | | | | | | | | |
| March 31,
2020 | | December 31,
2019 |
| (unaudited) | | |
| Assets | | | |
| Lease assets | $ | 21,911 | | | $ | 21,279 | |
| | | |
| Liabilities | | | |
| Accrued expenses and other current liabilities | | | |
| Lease liabilities, current | $ | 3,456 | | | $ | 2,825 | |
| Non-current | | | |
| Lease liabilities, long term | 30,804 | | | 30,440 | |
| Total lease liabilities | $ | 34,260 | | | $ | 33,265 | |
| | | |
| Weighted-average remaining lease term (years) | 12.1 | | 12.5 |
| Weighted-average discount rate | 4.3 | % | | 4.4 | % |
Operating lease costs are as follows (dollars in thousands):
| | | | | | | | | | | | | | | | | |
| Three Months ended
March 31, | | | | | | | | |
| 2020 | | 2019 | | | | | | |
| (unaudited) | | | | | | | | |
| Fixed lease cost | $ | 1,497 | | | $ | 1,032 | | | | | | | |
| Variable lease cost | 627 | | | 465 | | | | | | | |
| Total operating lease cost | $ | 2,124 | | | $ | 1,497 | | | | | | | |
Supplemental cash flow information related to leases is as follows (dollars in thousands):
| | | | | | | | | | | |
| Three Months ended March 31, | | |
| 2020 | | 2019 |
| (unaudited) | | |
| Cash paid for operating leases | $ | 1,261 | | | $ | 1,313 | |
| Lease assets and tenant receivables obtained for new operating leases | $ | 1,715 | | | $ | 17,136 | |
Future minimum lease payments under noncancellable operating leases, as of March 31, 2020, are as follows (dollars in thousands, unaudited):
| | | | | |
| 2020 (remaining) | $ | 3,672 | |
| 2021 | 4,760 | |
| 2022 | 4,226 | |
| 2023 | 2,537 | |
| 2024 | 2,587 | |
| Thereafter | 26,784 | |
| Total future minimum lease payments | $ | 44,566 | |
Less: Imputed interest (1) | (10,306) | |
| Present value of lease liabilities | $ | 34,260 | |
(1) Calculated using the interest rate for each lease.
10.11. Accounts Receivable
As of March 31,June 30, 2020 and December 31, 2019, the Company recorded allowances of approximately $10.3$12.4 million and $11.0 million, respectively, for prompt pay discounts and contractual service fees paid to the Company’s customers.
11.12. Inventories
Inventories consist of the following (dollars in thousands):
| | | March 31,
2020 | | December 31,
2019 | | June 30,
2020 | | December 31,
2019 |
| | (unaudited) | | | | (unaudited) | | |
| Raw materials | Raw materials | $ | 4,331 | | | $ | 4,582 | | Raw materials | $ | 7,262 | | | $ | 4,582 | |
| Work in process | Work in process | 8,221 | | | 11,428 | | Work in process | 10,658 | | | 11,428 | |
| Finished goods | Finished goods | 11,866 | | | 10,618 | | Finished goods | 17,418 | | | 10,618 | |
| Total | Total | $ | 24,418 | | | $ | 26,628 | | Total | $ | 35,338 | | | $ | 26,628 | |
As of March 31,June 30, 2020, andthe Company capitalized $3.3 million of pre-launch inventory costs. As of December 31, 2019, the Company did not capitalizehad 0t capitalized any pre-launch inventory costs. Inventories include acquired inventory from the USWM Acquisition. Refer to Note 3 for further discussion of the USWM Acquisition.
13. Investments in Unconsolidated VIEs
In April 2020, the Company entered into a Development and Option Agreement (Development Agreement) with Navitor Pharmaceuticals, Inc. (Navitor). The Company can terminate the Development Agreement upon 30 days’ notice.
Under the terms of the Development Agreement, the Company and Navitor will jointly conduct a Phase II clinical program for NV-5138 (SPN-820) for treatment-resistant depression. The Company will bear all development costs incurred by either party up to a maximum of $50 million for Phase I and Phase II development, in addition to the costs that the Company will incur for other research and development support activities. There are certain additional payment amounts which could be incurred by the Company that are contingent upon Navitor achieving defined development milestones. The Company has an option to acquire or license NV-5138 (SPN-820), for which additional payments would be required. The Company paid Navitor a one time, nonrefundable, and non-creditable fee of $10 million for this option to acquire or license NV-5138 (SPN-820). This cost is included in Research and development expense in the condensed consolidated statement of earnings for the three and six months ended June 30, 2020.
In addition to entering into the Development Agreement, the Company acquired Series D Preferred Shares of Navitor for $15 million, representing approximately a 13% ownership position in Navitor. The Company has determined that Navitor is a VIE. The Company has not consolidated this VIE because the Company lacks the power to direct the activities that most significantly impact Navitor’s economic performance and, therefore, have accounted for the investment under the cost method of accounting and included in Other assets in the condensed consolidated balance sheets.
As of June 30, 2020, the carrying value of our investment in Navitor was approximately $15 million. The maximum exposure to losses related to Navitor is limited to the $15 million carrying value of the investment, a maximum of approximately $50 million for Phase I and Phase II development of NV-5138 (SPN-820), and the cost of other development and formulation activities provided by the Company until the date of termination of the Development Agreement.
We have provided no financing to Navitor other than amounts required under the Development Agreement.
12.14. Property and Equipment
Property and equipment consists of the following (dollars in thousands):
| | | March 31,
2020 | | December 31,
2019 | | June 30,
2020 | | December 31,
2019 |
| | (unaudited) | | | | (unaudited) | | |
| Lab equipment and furniture | Lab equipment and furniture | $ | 11,538 | | | $ | 11,053 | | Lab equipment and furniture | $ | 12,252 | | | $ | 11,053 | |
| Leasehold improvements | Leasehold improvements | 14,974 | | | 14,217 | | Leasehold improvements | 15,183 | | | 14,217 | |
| Software | Software | 2,225 | | | 2,225 | | Software | 2,225 | | | 2,225 | |
| Computer equipment | Computer equipment | 2,013 | | | 1,839 | | Computer equipment | 2,065 | | | 1,839 | |
| Construction-in-progress | Construction-in-progress | 431 | | | 433 | | Construction-in-progress | 15 | | | 433 | |
| | 31,181 | | | 29,767 | | | 31,740 | | | 29,767 | |
| Less accumulated depreciation and amortization | Less accumulated depreciation and amortization | (13,170) | | | (12,699) | | Less accumulated depreciation and amortization | (13,799) | | | (12,699) | |
| Total | Total | $ | 18,011 | | | $ | 17,068 | | Total | $ | 17,941 | | | $ | 17,068 | |
Depreciation and amortization expense on property and equipment was approximately $0.5$0.6 million and $0.4$1.1 million for the three and six months ended March 31,June 30, 2020, respectively, and 2019, respectively.approximately $0.4 million and $0.7 million for the three and six months ended June 30, 2019.
As of March 31,June 30, 2020, there were no identified indicators of impairment.
13.
15. Goodwill and Intangible Assets, net
Goodwill represents the excess of the USWM Acquisition purchase price over the fair value of the tangible and identifiable intangible net assets acquired. Refer to Note 3 for further discussion on the USWM Acquisition.
Intangible assets consist ofalso includes: patent defense costs, which are deferred legal fees incurred in conjunction with defending patents for Oxtellar XR and Trokendi XR. TheXR; an acquired IPR&D asset; and acquired developed technology and product rights. For
intangible assets, excluding the acquired IPR&D asset, the Company amortizes these costs over the useful life of the respective patents.
The following table sets forth the gross carrying amount and related accumulated amortization of thegoodwill and intangible assets (dollars in thousands):
| | | Weighted-
Average Life
(Years) | | March 31,
2020 | | December 31,
2019 | | Weighted-
Average Life
(Years) | | June 30,
2020 | | December 31,
2019 |
| | (unaudited) | | | (unaudited) | |
| Goodwill | | Goodwill | | $ | 88,095 | | | $ | — | |
| Acquired In-process Research & Development | | Acquired In-process Research & Development | | 150,000 | | | — | |
| Intangible assets subject to amortization: | | Intangible assets subject to amortization: | |
| Acquired Developed Technology and Product Rights | | Acquired Developed Technology and Product Rights | 10.50 - 12.50 | | $ | 237,000 | | | $ | — | |
| Capitalized patent defense costs | Capitalized patent defense costs | 2.76 - 7.01 years | | $ | 43,375 | | | $ | 43,375 | | Capitalized patent defense costs | 2.50 - 6.80 | | 43,514 | | | 43,375 | |
| Less accumulated amortization | Less accumulated amortization | | (19,796) | | | (18,535) | | Less accumulated amortization | | (22,242) | | | (18,535) | |
| Total | | $ | 23,579 | | | $ | 24,840 | | |
| Total intangible assets, net | | Total intangible assets, net | | $ | 408,272 | | | $ | 24,840 | |
U.S. patents covering Oxtellar XR and Trokendi XR will expire no earlier than 2027. As regards Trokendi XR, the Company entered into settlement agreements that allow third parties to enter the market by January 1, 2023, or earlier under certain circumstances.
Amortization expense on intangible assets was approximately $1.3$2.4 million and $3.7 million for boththe three and six month periods ended March 31,June 30, 2020, respectively, and 2019, respectively.approximately $1.3 million and $2.6 million for the three and six month periods ended June 30, 2019.
As of March 31,June 30, 2020, there were no identified indicators of impairment.
14.
16. Accrued Expenses and Other Current Liabilities
Accrued expenses and other current liabilities consist of the following (dollars in thousands):
| | | March 31,
2020 | | December 31,
2019 | | June 30,
2020 | | December 31,
2019 |
| | (unaudited) | | | | (unaudited) | | |
Accrued clinical trial costs (1) | Accrued clinical trial costs (1) | $ | 11,224 | | | $ | 13,285 | | Accrued clinical trial costs (1) | $ | 10,735 | | | $ | 13,285 | |
| Accrued compensation | Accrued compensation | 9,549 | | | 11,223 | | Accrued compensation | 11,995 | | | 11,223 | |
| Accrued professional fees | Accrued professional fees | 4,706 | | | 3,936 | | Accrued professional fees | 10,090 | | | 3,936 | |
| Lease liabilities, current | 3,456 | | | 2,825 | | |
| Accrued royalties | | Accrued royalties | 12,957 | | | — | |
| Other accrued expenses | Other accrued expenses | 4,068 | | | 5,861 | | Other accrued expenses | 13,041 | | | 5,861 | |
| Total | Total | $ | 33,003 | | | $ | 37,130 | | Total | $ | 58,818 | | | $ | 34,305 | |
(1) Includes preclinical and all clinical trial-related costs.
15.
17. Accrued Product Returns and Rebates
Accrued product returns and rebates consist of the following (dollars in thousands):
| | | March 31,
2020 | | December 31,
2019 | | June 30,
2020 | | December 31,
2019 |
| | (unaudited) | | | | (unaudited) | | |
| Accrued product rebates | Accrued product rebates | $ | 94,612 | | | $ | 88,811 | | Accrued product rebates | $ | 118,335 | | | $ | 88,811 | |
| Accrued product returns | Accrued product returns | 24,841 | | | 18,818 | | Accrued product returns | 25,770 | | | 18,818 | |
| Total | Total | $ | 119,453 | | | $ | 107,629 | | Total | $ | 144,105 | | | $ | 107,629 | |
16. Other Income (Expense)
Other income (expense) consist
18. Interest Expense
Interest expense consists of the following (dollars in thousands):
| | | Three Months ended March 31, | | | Three Months ended June 30, | | | Six Months ended
June 30, | |
| | 2020 | | 2019 | | | 2020 | | 2019 | | 2020 | | 2019 |
| | (unaudited) | | | (unaudited) | | | (unaudited) | |
| Interest income | $ | 5,777 | | | $ | 4,681 | | | |
| Interest expense | Interest expense | (4,693) | | | (4,710) | | | Interest expense | $ | (4,792) | | | $ | (4,253) | | | $ | (9,485) | | | $ | (8,972) | |
| Interest expense on nonrecourse liability related to sale of future royalties | Interest expense on nonrecourse liability related to sale of future royalties | (1,062) | | | (1,160) | | | Interest expense on nonrecourse liability related to sale of future royalties | (1,023) | | | (1,136) | | | (2,085) | | | (2,296) | |
| | Total | Total | $ | 22 | | | $ | (1,189) | | | Total | $ | (5,815) | | | $ | (5,389) | | | $ | (11,570) | | | $ | (11,268) | |
Interest expense includes noncash interest expense related to amortization of deferred financing costs and amortization of the debt discount on the 2023 Notes of $4.1$4.2 million and $3.8$8.2 million for the three and six months ended March 31,June 30, 2020, respectively, and $3.9 million and $7.7 million for the three and six months ended June 30, 2019, respectively.
17.19. Commitments and Contingencies
Product Licenses
The Company has obtained exclusive licenses from third parties for proprietary rights to support the product candidates in the Company’s neurology and psychiatry portfolio. Under these license agreements, the Company may be required to pay certain amounts upon the achievement of defined milestones. If these products are ultimately commercialized, the Company is also obligated to pay royalties to third parties, as percentage of net product sales, for each respective product under a license agreement.
Through the USWM Acquisition, the Company acquired licensing agreements with other pharmaceutical companies for APOKYN, XADAGO and MYOBLOC. The Company is obligated to pay to royalties to third party parties, as a percentage of net product sales, for each of the products under the respective license agreement. Royalties expense incurred are recognized as Cost of goods sold in the condensed consolidated statement of earnings.
Royalty Agreement
In the third quarter of 2014, the Company received $30.0 million pursuant to a Royalty Interest Acquisition Agreement related to the purchase by HC Royalty of certain of the Company’s rights under the Company’s agreement with United Therapeutics, related to the commercialization of Orenitram (treprostinil) Extended-Release Tablets. FullPer the terms of the agreement full ownership of the royalty rights will revert to the Company if and when a certain cumulative payment threshold is reached per the terms of the agreement (see Note 2, Note 34 and Note 16)18).
USWM Enterprise Commitments Assumed
As part of the USWM acquisition, the Company assumed the remaining commitments of USWM Enterprises and its subsidiaries, which are discussed below. In addition to the annual minimum purchase quantity requirements, amounting to an estimated €3.0 million annually, under the contract manufacturing agreement with Merz for the manufacture and supply of MYOBLOC, USWM Enterprises had an existing license and distribution agreement for XADAGO, which included an annual minimum promotional spend to support the marketing of XADAGO for the first five years of the agreement. As of June 30, 2020, the remaining contractual commitments was $4.5 million, of which $2.5 million is for the period July 2020 to June 2021. (See Note 3 for further discussion on the USWM Acquisition and Note 10 for further discussion on the Merz Agreement).
18. Subsequent Events
Joint Development and Option Agreement with Navitor
On April 21, 2020, the Company entered into a Development and Option Agreement (Development Agreement) with Navitor Pharmaceuticals, Inc. (Navitor). Under the terms of the Development Agreement, the Company and Navitor will jointly conduct a Phase II clinical program for NV-5138 in treatment-resistant depression. In addition, Navitor has granted the Company an exclusive option to license or acquire NV-5138 in all world territories, excluding Greater China, prior to initiation of a Phase III clinical program.
In consideration of the rights granted under the Development Agreement, the Company will acquire Series D Preferred Shares of Navitor for $15 million, representing approximately 13% ownership in Navitor. In addition, the Company will pay to Navitor a one time, non-refundable and non-creditable option issue fee of $10 million. Total payments, exclusive of royalty payments on net sales of NV-5138 and development costs under the Development Agreement, have the potential to reach $410 million to $475 million, which include the upfront cash payment of $25 million described above, an additional license or acquisition fee depending on whether the Company ultimately licenses or acquires NV-5138, and subsequent clinical, regulatory and sales milestone payments. The Company will bear all development costs incurred by either the Company or Navitor up to a maximum of $50 million. The Development Agreement provides Navitor an option to request that the Company pay certain development costs in excess of $50 million once expenses reach this threshold and grants the Company a right of first refusal to negotiate for rights to develop and commercialize any composition of matter that has a similar mechanism of action as NV-5138.
CNS Portfolio Acquisition from US WorldMeds
On April 28, 2020, the Company entered into a definitive Sales and Purchase Agreement with US WorldMeds Partners, LLC, pursuant to which the Company will purchase all of the outstanding equity of USWM Enterprises, LLC (USWM Enterprises), comprising the entire issued share capital of USWM Enterprises, for total consideration of $530 million, consisting of an upfront cash payment of $300 million and additional cash payments of up to $230 million upon the achievement of certain commercial milestones. With the acquisition, the Company will add 3 established, marketed products and 1 product candidate in late-stage development to its CNS portfolio. The transaction is expected to close in the second quarter of 2020, subject to certain conditions, including the expiration of the waiting period under the Hart-Scott-Rodino Antitrust Improvements Act and other customary conditions.
Paragraph IV Filing for Oxtellar XR
On May 14, 2020, the Company received a Paragraph IV Notice Letter from Apotex Inc. and Apotex Corp advising Supernus of the submission by Apotex of an Abbreviated New Drug Application to the U.S. Food and Drug Administration (FDA) seeking approval for oxcarbazepine extended-release tablets. The Company is currently reviewing the details of this Notice Letter and intends to vigorously enforce its intellectual property rights relating to Oxtellar XR.
Item 2. Management’s Discussion and Analysis of Financial Condition and Results of Operations
Management’s Discussion and Analysis of Financial Condition and Results of Operations is intended to help the reader understand the results of operations and the financial condition of Supernus Pharmaceuticals, Inc. (the Company, we, us, or our). The interim financial statements included in this report and this Management’s Discussion and Analysis of Financial Condition and Results of Operations should be read in conjunction with our audited consolidated financial statements and notes thereto for the year ended December 31, 2019 and the related Management’s Discussion and Analysis of Financial Condition and Results of Operations, both of which are contained in our Annual Report on Form 10-K, filed with the Securities and Exchange Commission on February 28, 2020.
In addition to historical information, this Quarterly Report on Form 10-Q contains forward-looking statements within the meaning of Section 27A of the Securities Act of 1933, as amended, and Section 21E of the Securities Exchange Act of 1934, as amended, which are intended to be covered by the safe harbors created thereby. These forward-looking statements may include declarations regarding the Company’s belief or current expectations of management, such as statements including the words “budgeted,” “anticipate,” “project,” “forecast,” “estimate,” “expect,” “may,” “believe,” “potential,” and similar statements or expressions, which are intended to be among the statements that are forward-looking statements, as such statements reflect the reality of risk and uncertainty that is inherent in our business. Actual results may differ materially from those expressed or implied by such forward-looking statements. Readers are cautioned not to place undue reliance on these forward-looking statements, which are made as of the date this report was filed with the Securities and Exchange Commission. Our actual results and the timing of events could differ materially from those discussed in our forward-looking statements as a result of many factors, including those set forth under the “Risk Factors” section of our Annual Report on Form 10-K and elsewhere in this report as well as in other reports and documents we file with the Securities and Exchange Commission from time to time. Except as required by law, we undertake no obligation to update any forward-looking statements to reflect events or circumstances occurring after the date of this Quarterly Report on Form 10-Q.
Solely for convenience, in this Quarterly Report on Form 10-Q, the trade names are referred to without the TM symbols and the trademark registrations are referred to without the circled R, but such references should not be construed as any indicator that the Company will not assert, to the fullest extent under applicable law, our rights thereto.
Overview
We are a pharmaceutical company focused on developing and commercializing products for the treatment of central nervous system (CNS) diseases. We have a portfolio of commercial products and product candidates.
On April 21, 2020, the Company entered into a Development and Option Agreement (Development Agreement) with Navitor Pharmaceuticals, Inc. (Navitor). Under the terms of the Development Agreement, the Company and Navitor will jointly conduct a Phase II clinical program for NV-5138 (SPN-820) in treatment-resistant depression.depression (TRD).
On April 28, 2020, the Company entered into a Sales and Purchase Agreement to acquire the CNS portfolio of US WorldMeds Partners, LLC.LLC (USWM Acquisition). With the acquisition, the Company will addadded to its portfolio three established, marketedcommercial products and a product candidate in late-stage development to its portfolio.development. These products are primarily for the treatment of Parkinson's disease. This acquisition was completed on June 9, 2020.
COVID-19 Impact
The Company isWe are closely monitoring the impact of the COVID-19 pandemic on all aspects of our business operations, and hashave assessed the impact of the COVID-19 pandemic on our condensed consolidated financial statements. Although the COVID-19 pandemic has not significantly impacted our condensed consolidated financial statements as of March 31,June 30, 2020 and during the three month period thenand six months ended June 30, 2020, it may have future impact, especially if the severity worsens, the duration lengthens or the nature of the impactseffects changes.
The full impact of the COVID-19 pandemic is highlyremains uncertain and subject to change. SuchThe effects of the pandemic may vary significantly across different aspects of our business operations. The CompanyWe do not and cannot yet know the full extent of potential delays on execution of clinical trials, new product launches or related impacts on itsour business, financial conditions,condition or the healthcare systems, or the economy.system. These effects could have material impact on the Company’s liquidity, capital resources, operations and business. See “Risk Factors” in Part II, Item 1A of this Quarterly Report on Form 10-Q for additional information on risk factors that could impact our business and results.
The risks and uncertainties resulting from the COVID-19 pandemic may affect our future earnings, cash flows and financial condition. These effects include: adverse impact on research and development activities as a result of temporarily halting additional enrollment in the SPN-812 adult trial; adverse impact on selling and marketing efforts as a result of temporarily halting in-person interactions by our sales force with healthcare providers; adverse impact on net product sales as a result of decreased new prescriptions due to fewer patient visits to physician’sphysicians' offices to begin or to maintain treatment; potential changes in payer segment mix; and increased use of co-pay programs due to rising unemployment.
These effects could have a material impact on the Company’s liquidity, cash flows, capital resources and business operations. Financial effects could include impairment of intangible and long-lived assets, increased reserves for sales deductions that could impact our net product sales;sales and adjustments for market volatility for items subject to fair value measurement, such as marketable securities. See “Risk Factors” in Part II, Item 1A of this Quarterly Report on Form 10-Q for additional information on risk factors that could impact our business and our results.
For the three and six months ended March 31June 30, 2020, with the exception of the effects already cited, we were able to largely maintain our normal operations. Because the COVID-19 pandemicthere has not materially impactedbeen no material impact on our operations, or demand for our products, it has also not negatively impacted our liquidity and financial position in a material way.has likewise not been materially affected. We expect to continue to generate positive cash flows and to meet our short-term liquidity needs and have access to liquidity.needs.
Products and Product Candidates
The table below summarizes our current portfolio of novel products and product candidates:
APOKYN Pen and apomorphine infusion pump product candidate are under a license from Britannia Pharmaceuticals Limited.
XADAGO is under a license from Zambon S.p.A. * ProphylaxisAll trademarks are the property of migraine headache in adults and adolescents.
** SPN-820 = NV-5138 (Navitor Partnership)their respective owners.
We have devoted and continue to devote significant resources to research and development of product candidates and proprietary drug technologies.activities. We expect to incur significant expenses as we: invest in research and development related to the continued development ofwe continue developing each of our product candidates through U.S. Food and Drug Administration (FDA) approval, or until the program terminates; expand product indications for approved products; invest in sales and marketing resources forto support our existing and new products; enter into agreements to in-license, purchase products, product candidates or other companies; and invest in the support of our business, technology, regulatory and intellectual property portfolio.
Our Neurology Portfolio
Our neurology portfolio includes twoWe market and sell the following commercial products and one product candidate for the treatment of neurological diseases.in our neurology portfolio:
Commercial Products
•Trokendi XR, is a once-daily extended release topiramate product for the prophylaxis of migraine headache and for the treatment of epilepsy. We believe a once-daily dosing regimen improves compliance, making it more probable that patients take their medication and maintain sufficient levels of medication in their bloodstream. Trokendi XR's unique smooth pharmacokinetic profile results in lower peak plasma concentrations, higher trough plasma concentrations, and slower plasma uptake rates. This results in smoother and more consistent plasma concentrations than immediate release topiramate formulations. We believe that such a profile mitigates blood level fluctuations that are frequently associated with many side effects, thereby reducing the likelihood of breakthrough seizures or migraine headaches that patients can suffer when taking immediate release products. Side effects associated with immediate release products may lead patients to skip doses, which could place them at higher risk for breakthrough seizures or migraine headaches.
•Oxtellar XR, is a once-daily extended release oxcarbazepine product that was initially approved for adjunctive treatment of partial onset seizures of epilepsy.
Acquired CNS Portfolio
On June 9, 2020, the Company completed the USWM Acquisition. With the acquisition, the Company added the following established, commercial products and a product candidate in late-stage development to its novel pharmacokinetic profile showing lower peak plasma concentrations,neurology portfolio.
•APOKYN (apomorphine hydrochloride injection) is a slower ratedrug/device combination product (injectable pen) indicated for the acute, intermittent treatment of plasma input, and smoother and more consistent blood levels as compared to immediate release products, we believe Oxtellar XR improves the tolerability of oxcarbazepine and thereby reduces side effects. In addition, Oxtellar XR once-per-day dosinghypomobility, or “OFF” episodes associated with advanced Parkinson’s disease (PD). APOKYN’s adjustable dose subcutaneous injection pen is designed to improve patient compliance compared toquickly and reliably reverse the current immediate release products that must be taken multiple times per day.
Product Prescriptionsalternative of immobility and inability to function, we believe the rapid and reliable reduction of OFF episode symptoms is of utmost importance to patients.
•XADAGO (safinamide) is a once-daily medication indicated as adjunctive treatment to levodopa/carbidopa in patients with Parkinson’s disease who are experiencing “OFF” episodes. XADAGO is a monoamine oxidase B (MAO-B) inhibitor that works by blocking the catabolism of dopamine, which is believed to result in an increase in dopamine levels, and therefore a subsequent increase in dopaminergic activity in the brain. Well-controlled studies have shown XADAGO® may provide a decrease in OFF time of up to 1 hour per day when combined with appropriate L-dopa therapy.
•MYOBLOC (rimabotulonumtoxinB) is indicated for the treatment of cervical dystonia and sialorrhea. It is the only Type B toxin available on the market. MYOBLOC injections offer patients struggling with painful cervical dystonia symptoms pain relief in as soon as two weeks, with effects persisting up to 16 weeks post-dosing. In Sialorrhea, MYOBLOC reduces problematic hyper salivation by cleaving synaptic vesicle-associated membrane protein (VAMP) at the site of injection. Patients on MYOBLOC generally experienced symptom relief for three months post-dosing in well-controlled studies. MYOBLOC must be administered by a physician.
Prior to June 2020, US WorldMeds Partners, LLC received Special Protocol Assessment from the FDA to conduct a clinical program for potential expansion for new indications for MYOBLOC.
Overview of Acquired CNS Portfolio
Market Overview
Parkinson’s disease
Parkinson’s disease affects about one million patients in the U.S. per year. Parkinson’s is a progressive neurological disorder that is characterized by a loss of dopamine producing neurons in certain regions of the brain, causing symptoms like tremor, slowness of movement, stiffness, loss of balance, and lack of coordination. Patients with PD can also be affected with psychological symptoms such as anxiety and depression, as well as problems with cognition and memory. As the disease progresses, some patients may lose the ability to independently perform the tasks of daily living.
Parkinson’s patients are frequently prescribed levodopa (L-dopa) to help replace the dopamine no longer produced in the brain. However, motor disabilities as a result of L-dopa wearing off remain a significant problem for over half of PD patients. Patients in an OFF state (“end-of-dose wearing off” and unpredictable “on/off” episodes), including those whose last dose of oral L-dopa has worn off, and whose next oral dose has not yet begun to take effect, can suffer from a lack of coordination or mobility for several hours per day.
In well controlled clinical studies, APOKYN (apomorphine) injections are effective in treating OFF periods, as measured by the motor function subset of the Unified Parkinson's Disease Rating Scale (UPDRS). For patients for whom oral L-dopa will not sufficiently control OFF periods, the Company has commercialized APOKYN, delivered via an injection pen. For patients who experience significant OFF time each day, we are developing a continuous infusion pump to deliver apomorphine subcutaneously. The following table provides data regardinginfusion may reduce the variability in motor symptoms of PD, and offer improved tolerability versus the injection route. For patients not ready to try a parenteral therapy, oral monoamine oxidase complex B (MAO-B) inhibitors, such as XADAGO (safinamide), may provide a decrease in OFF time of up to 1 hour per day when combined with appropriate L-dopa therapy.
Cervical Dystonia
Cervical dystonia, also known as spasmodic torticollis, is a condition characterized by involuntary muscle contractions in the neck, which cause the head to twist uncontrollably into an abnormal, often painful position. It is a rare disorder, most often presenting in middle age, whose symptoms begin gradually, worsen, and then plateau over a period of months. Estimates of the prevalence of cervical dystonia vary considerably, from 28 to 4,100 per million individuals. Injections of botulinum toxin into affected neck muscles can create temporary relief from symptoms.
In well controlled studies, botulinum toxins like MYOBLOC (rimabotulonumtoxinB) have been shown to improve symptoms as measured on the Toronto Western Spasmodic Torticollis Rating Scale, including pain.
Sialorrhea
Sialorrhea can occur in conjunction with several neurologic disorders, such as amyotrophic lateral sclerosis (ALS), cerebral palsy (CP), PD, or as a side effect of some medications. It is characterized by overactive salivary glands. In adults, PD is the most common cause of sialorrhea, with 70%–80% of PD patients experiencing symptoms. In 30%–80% of schizophrenic patients taking clozapine, sialorrhea is evident. In addition to being embarrassing, complications of sialorrhea include aspiration, infection, skin breakdown, and bad odor.
In well controlled studies, injections of MYOBLOC have been shown to reduce the unstimulated salivary flow rate (USFR) by 0.3g/minute, as compared to placebo.
Manufacturing
APOKYN is manufactured by our prescriptions,licensing partner, Britannia Pharmaceuticals Ltd (Britannia) for the U.S. market. Britannia also supplies injectable apomorphine to the European market for Stada Pharmaceuticals, under the brand name Apo-go. MYOBLOC is manufactured and packaged by Merz GmbH & Co. KGaA. XADAGO is provided to us as reportedfinished product by IQVIA, duringZambon S.p.A.
Sales and Marketing
We have acquired the periods indicated,U.S. WorldMeds neurology sales force of approximately 45 representatives to continue to promote the acquired product portfolio. This sales force calls on movement disorder specialists and selected other health care providers to support our commercialization and sale of APOKYN, MYOBLOC and XADAGO.
Competition
APOKYN is given PRN (on-demand) as an adjunct to Levadopa/Carbidopa therapy in PD patients who experience OFF episodes, competing with other PRN therapies such a INBRIJA and recently approved sublingual apomorphine (KYNMOBI).
XADAGO competes with other monoamine oxidase inhibitors (MAO-B) used to treat OFF episodes in PD, including percentage changesrasagiline (AZILECT) and selegiline.
MYOBLOC is the only available botulinum toxin B, whereas other available toxins are type A. MYOBLOC competes with type A toxins such as Botox, Dysport, and Xeomin. MYOBLOC also competes with oral agents used to treat cervical dystonia, including generic baclofen, anticholinergics, benzodiazepines, and tetrabenazine.
MYOBLOC competes with Xeomin (incobotulinumtoxinA) for the treatment of sialorrhea in volume:adults, although the other A toxins, including Botox and Dysport, are also utilized by physicians off label for sialorrhea. Other pharmacologic treatments used to treat sialorrhea include generic glycopyrrolate tablets as well as behavior modification.
| | | | | | | | | | | | | | | | | | | | | | | | | | | | | | | |
| Three Months ended
March 31, | | | | Change | | | | | | | | | | |
| 2020 | | 2019 | | Volume | | Percent | | | | | | | | |
| Prescriptions | | | | | | | | | | | | | | | |
| Trokendi XR | 160,315 | | | 160,940 | | | (625) | | | —% | | | | | | | | |
| Oxtellar XR | 43,089 | | | 38,580 | | | 4,509 | | | 12% | | | | | | | | |
| Total prescriptions | 203,404 | | | 199,520 | | | 3,884 | | | 2% | | | | | | | | |
Product CandidateCandidates
SPN-817 (huperzine A)
SPN-817 will have new chemical entity status (NCE) in the U.S. market. We expect to develop intellectual property (IP) protecting this product candidate through our own research and development efforts, as well as through in-licensed IP.
SPN-817 represents a novel mechanism of action for an anticonvulsant. Development will initially focus on the drug's anticonvulsant activity, which has been shown in preclinical models for treatment of partial seizures and Dravet Syndrome. SPN-817 is in clinical development, and has received an Orphan Drug designation for Dravet Syndrome and Lennox-Gastaut Syndrome from the FDA. SPN-817 will have new chemical entity status (NCE) in the U.S. market. We expect to develop intellectual property (IP) protecting this product candidate through our own research and development efforts, as well as through in-licensed IP.
SPN-817 Development Program
We plan on initially studying SPN-817 initially in severe epilepsy disorders. A Phase I proof-of-concept trial is currently underway outside of the U.S. in adult patients with refractory complex partial seizures,seizures. We are studying the safety and pharmacokinetic profile of a new extended release formulation of non-synthetic huperzine A. The Company has initiated preclinical Investigational New Drug (IND) enabling activities in the U.S.
We will focus on completing and optimizing the synthesis process of the synthetic drug andas well as developing a novel dosage form. Given the potency of huperzine A, a novel extended release oral dosage form is critical to the success of this
program, because initial studies with the immediate release formulations of non-synthetic huperzine A have shown serious dose-limiting, serious side effects.
SPN-830 (Apomorphine Infusion Pump)
SPN-830 is a late-stage product candidate acquired in the USWM Acquisition. SPN-830 is under investigation for the continuous prevention of OFF episodes in PD. If approved, it would be the only continuous infusion of apomorphine available in the U.S., and an important, less invasive step for PD patients that would have otherwise been candidates for potentially invasive surgical procedures, such as deep brain stimulation. Continuous infusion may also limit some of the side effects of a subcutaneous injection of apomorphine, such as nausea.
SPN-830 Development Program
Based on pre-New Drug Application (NDA) discussions with the FDA, an NDA submission for SPN-830 is expected in the fourth quarter of 2020. Final activities include the conduct of a Human Factors study to evaluate this drug-device combination product, and the completion of a safety report on the components of the device.
Our Psychiatry Portfolio
Our psychiatry portfolio includes two product candidates, SPN-812 and SPN-820, for the treatment of psychiatric disorders.
Product CandidateCandidates
SPN-812 (extended release viloxazine hydrochloride)
SPN-812 is a serotonin norepinephrine modulating agent (SNMA), which we are developing as a novel non-stimulant for the treatment of ADHD.ADHD in children, adolescents, and adults. We believe SPN-812 could be well-differentiated as compared to other non-stimulant treatments, due to its different pharmacological and pharmacokinetic profile. The active ingredient in SPN-812, viloxazine hydrochloride, has an extensive safety record in Europe, where it was previously marketed for many years as an antidepressant, albeit at much higher dosage levels. Viloxazine hydrochloride is a structurally distinct, bicyclic, SNMA with NCE status in the U.S.
The FDA accepted the review of the NDA for SPN-812 for the treatment of children and adolescents with ADHD in January 2020, and assigned a PDUFAPrescription Drug User Fee Act (PDUFA) target action date of November 8, 2020. We plan to launch it,SPN-812, pending FDA approval, early in the fourthfirst quarter of 2020.2021. We expect SPN-812, if approved, to have five-year market exclusivity due to its NCE status in the U.S. Furthermore, we are pursuing IP covering the novel synthesis process for the active ingredient in SPN-812, its novel use in ADHD, and its novel extended release product profile.
SPN-812 Development Program
We continue to prepare for the commercial launch of SPN-812 atwith expected shipments to the end oftrade in December 2020. The Company remains engaged with the FDA regarding the review of the NDA for SPN-812 for the treatment of ADHD.
We initiated a Phase III program for the treatment of ADHD in adults in the third quarter of 2019. The SPN-812 adult trial reached approximately 75% of the targeted enrollment before additional enrollment was put on hold in March 2020 due to the impactCOVID-19 pandemic. In the second quarter of COVID-19.2020, we resumed enrollment efforts. We are employing virtual effortsvisits to ensure that currently enrolled subjects can progress to completion of treatment. The trial is expected to complete enrollment this year with topline data available in the first quarter of 2021.
SPN-820 (NV-5138)
SPN-820 is a first-in-class, orally active small molecule that directly activates brain mTORC1, the gatekeeper of cellular metabolism and renewal. This receptor is often suppressed in people suffering from depression. The Phase I trial was aheaddemonstrated early proof of schedule priorconcept, in which a single dose of SPN-820 showed rapid and sustained improvement in core symptoms of depression, with favorable safety and tolerability in patients with TRD. We believe the novel mechanism of action in depression may improve symptoms of depression in patients who have failed other agents.
SPN-820 Development Program
In April 2020, we entered into a Development and Option Agreement with Navitor to collaborate on a comprehensive development program for SPN-820 through Phase II, including formulation development, preclinical toxicology, and clinical pharmacology. Pre-clinical and development activities are ongoing, with the COVID-19 pandemic,initiation of the Phase II clinical program in patients with a potential data release inTRD targeted for the second half of this year. Depending on when2021. See Part I, Item 1, Financial Statements, Note 13, Investments in Unconsolidated VIEs, in the Company can restart enrollment and completeNotes to the study, data from the trial may be pushed out into 2021.Condensed Consolidated Financial Statements.
Patents
We currently have ten U.S. patents that cover Trokendi XR. We have one patent issued for extended release topiramate in each of the following countries: Mexico; Australia; Japan; and Canada. We have two patents issued in Europe. The ten issued U.S. patents covering Trokendi XR will expire no earlier than 2027. We own all of the issued patents.
The Company has entered into settlement agreements with third parties, permitting sale of a generic version of Trokendi XR on January 1, 2023, or earlier under certain circumstances.
Our extended release oxcarbazepine patent portfolio currently includes twelve U.S. patents, nine of which cover Oxtellar XR. The nine issued U.S. patents covering Oxtellar XR will expire no earlier than 2027. We have two issued patents for extended release oxcarbazepine in both Europe and Australia, and one patent issued in each of the following countries: Canada; Japan; China and Mexico. In addition, we have a pending U.S. patent application that covers various extended release formulations containing oxcarbazepine. We own all of the issued patents and the pending U.S. patent application.
For our pipeline product, SPN-812, we have three families of pending U.S. non-provisional and foreign counterpart patent applications. Patents, if issued, could expire from 2029 to 2033. We have one patent issued each in Europe and Canada, covering a method of treating ADHD using viloxazine hydrochloride. In another family, covering the novel synthesis process of active ingredient, we have four patents issued in the U.S., five patents issued in Mexico, two patents issued in Japan, and one patent issued each in Europe, Canada and Australia. We have four patents issued in the U.S. covering modified release formulations of viloxazine hydrochloride, two patents issued in Japan and Australia and one patent issued in Mexico. We own all of the issued patents and the pending patent applications.
We continue to build our intellectual property portfolio to provide additional protection for our technologies, products and product candidates.
To protect our competitive position, it may be necessary to enforce our patent rights through litigation against infringing third parties. See Part II, Item 1—Legal Proceedings for additional information.
Critical Accounting Policies and the Use of Estimates
The significant accounting policies and basis of presentation for our condensed consolidated financial statements are described in Part I, Item 1, Financial Statements, Note 2, Summary of Significant Accounting Policies, in the Notes to the Condensed Consolidated Financial Statements. Our condensed consolidated financial statements are prepared in accordance with U.S. generally accepted accounting principles (U.S. GAAP), requiring us to make estimates and assumptions that affect the reported amounts of assets, liabilities, revenues, and expenses, and to disclose material contingent assets and liabilities. Actual results could differ materially from our estimates.
We believe the following accounting policies and estimates to be critical:
Revenue Recognition
Revenue from product sales is recognized when physical control of our products is transferred to our customers, who are primarily pharmaceutical wholesalers, specialty pharmacies, and distributors. Product sales are recorded net of various forms of variable consideration, including: estimated rebates; sales discounts; and an estimated liability for future product returns (collectively, “sales deductions”). We adjust our estimates at the earlier of when the most likely amount of consideration we expect to receive changes, or when the consideration becomes fixed. For a complete description of our revenue recognition policy, see Part I, Item 1, Financial Statements, Note 2, Revenue from Product Sales, in the Notes to Condensed Consolidated Financial Statements. In addition, see Results of Operations,Sales deductions and related accruals for more information.
The Company completed the USWM Acquisition on June 9, 2020. Refer to Note 2 for discussion regarding the accounting policy for business combinations and contingent consideration and to Note 3 for discussion regarding the USWM Acquisition.
Research and Development Expenses and Related Accrued Research and Development Expenses
Research and development expenditures are expensed as incurred. We estimate preclinical and clinical trial expenses based on services performed pursuant to contracts with research institutions, clinical investigators, clinical research organizations (CROs) and other service providers that conduct activities on the Company’s behalf. If the actual timing of the performance of services or the level of effort varies from our estimate, we adjust our accrued expenses or our deferred advance payments accordingly. For a complete description of our research and development expense, preclinical trial, and clinical trial accrual policies, see Part I, Item 1, Financial Statements, Note 2, Summary of Significant Accounting Policies—Research and Development Expense and Related Accrued Research and Development Expenses, in the Notes to Condensed Consolidated Financial Statements.
Preclinical and clinical trials are inherently complex and often involve multiple service providers. Because billing for services often lags by a month or several months, we are often required to estimate, and therefore accrue, a significant portion of the incurred expenses. This process involves reviewing open contracts and communicating with our subject matter expert personnel, as well as with the appropriate service provider personnel, to identify services that have been performed on our behalf but for which no invoice has been received. This includes services provided by CROs, as well as services provided by clinical
investigators and other service providers. We accrue the cost for unbilled services performed, whether partially or fully completed.
Payments to service providers can either be based on hourly rates for service, or based on achievement of performance driven milestones. We work with each service provider to obtain an estimate for services provided but are unbilled as of the end of the calendar quarter, including estimates for payments to site investigators. When accruing clinical trial expenses, we estimate the time period over which services will be performed during the life of the entire clinical program, the total cost of the program, and the level of effort to be expended in each intervening period.
We work diligently to minimize, if not eliminate, estimates based solely on Company generated calculations by relying primarily on estimates provided by our vendors. If we and/or the service provider underestimates or overestimates the costs associated with a service at any given point in time, adjustments to research and development expenses would be necessary in the following periods. Historically, our estimated accrued clinical expenses have closely approximated the actual expenses incurred, with minimal adjustments to expense in the subsequent periods.
Results of Operations
Comparison of the Three and Six Months ended March 31,June 30, 2020 and 2019
Revenues
Revenues consist primarily of net product sales of Trokendi XR and Oxtellar XR in the U.S., andsupplemented by royalty and licensing revenues from our collaborative licensing arrangements. The following table provides information regarding our revenues during the three and six month periods indicated,ended June 30, 2020, (dollars in thousands):
| | | | | | | | | | | | | | | | | | | | | | | | | | | | | | | |
| Three Months ended
March 31, | | | | Change | | | | | | | | | | |
| 2020 | | 2019 | | Amount | | Percent | | | | | | | | |
| Net product sales | | | | | | | | | | | | | | | |
| Trokendi XR | $ | 68,551 | | | $ | 63,693 | | | $ | 4,858 | | | 8% | | | | | | | | |
| Oxtellar XR | 23,939 | | | 19,406 | | | 4,533 | | | 23% | | | | | | | | |
| Total net product sales | $ | 92,490 | | | $ | 83,099 | | | $ | 9,391 | | | 11% | | | | | | | | |
| Royalty revenues | 2,486 | | | 2,375 | | | 111 | | | 5% | | | | | | | | |
| Total revenues | $ | 94,976 | | | $ | 85,474 | | | $ | 9,502 | | | 11% | | | | | | | | |
| | | | | | | | | | | | | | | | | | | | | | | | | | | | | | | | | | | | | | | | | | | | | | | |
| Three Months ended
June 30, | | | | Change | | | | Six Months ended
June 30, | | | | Change | | |
| 2020 | | 2019 | | Amount | | Percent | | 2020 | | 2019 | | Dollar | | Percent |
| Net product sales | | | | | | | | | | | | | | | |
| Trokendi XR | $ | 89,674 | | | $ | 78,964 | | | $ | 10,710 | | | 14% | | $ | 158,225 | | | $ | 142,657 | | | $ | 15,568 | | | 11% |
| Oxtellar XR | 23,680 | | | 23,394 | | | 286 | | | 1% | | 47,619 | | | 42,800 | | | 4,819 | | | 11% |
| APOKYN | 8,600 | | | — | | | 8,600 | | | 100% | | 8,600 | | | — | | | 8,600 | | | 100% |
| XADAGO | 801 | | | — | | | 801 | | | 100% | | 801 | | | — | | | 801 | | | 100% |
| MYOBLOC | 1,229 | | | — | | | 1,229 | | | 100% | | 1,229 | | | — | | | 1,229 | | | 100% |
| Total net product sales | $ | 123,984 | | | $ | 102,358 | | | $ | 21,626 | | | 21% | | $ | 216,474 | | | $ | 185,457 | | | $ | 31,017 | | | 17% |
| Royalty revenues | 2,745 | | | 2,337 | | | 408 | | | 17% | | 5,231 | | | 4,712 | | | 519 | | | 11% |
| Total revenues | $ | 126,729 | | | $ | 104,695 | | | $ | 22,034 | | | 21% | | $ | 221,705 | | | $ | 190,169 | | | $ | 31,536 | | | 17% |
Basis for Net product salesProduct Sales
Net product sales are computed as gross revenue generated from our product shipments to our customers, which are primarily pharmaceutical wholesalers, specialty pharmacies, and distributors, less various forms of variable consideration, including: estimated liability
for rebates; estimated liability for future product returns; and estimated allowance for discounts. These are collectively considered "sales deductions."
Total Net Product Sales
The increase in net product sales for the three months ended March 31,June 30, 2020, as compared to the prior year, is primarily due to the favorable impact of the 8% price increase for Trokendi XR and Oxtellar XR taken in January 1, 2020, favorable unit prescription growth for Oxtellar XR, and favorable changes in sales deductions for Trokendi XR. In addition, for both Trokendi XR and Oxtellar XR, we have seen a shift in prescription mix from 30-count prescriptions to 90-count prescriptions. The Company believes this has been an effect of the COVID-19 pandemic, primarily due to patients have reduced the frequency of office visits with physicians. This shift towards 90-count prescriptions has caused our net product sales growth to outpace the
growth in prescriptions. Finally, the Company completed the USWM Acquisition on June 9, 2020. Accordingly, we recognized $10.6 million, collectively, for the three acquired products for the period June 9, 2020 through June 30, 2020.
The increase in net product sales for the six months ended June 30, 2020, as compared to the prior year, is primarily due to the aforementioned favorable impact of the January 2020 price increase, the newly acquired products, coupled with prescription unit growth for Oxtellar XR. In addition, the adverse impact of the pipeline inventory reduction in 2019. These effects were partially offset by unfavorable changesthe first quarter of 2019 contributed to the increase in net product sales deductions.
for the six months ended June 30, 2020. In the fourth quarter of 2018, wholesalers, distributors and pharmacies increased their inventory holdings, as compared to the prevailing inventory levels in the preceding quarter. This action was effectively reversed in the first quarter of 2019. As a result, both gross sales and net product sales in the first quarter of 2019 were adversely impacted, with the impact onreducing net product sales ofby approximately $10 million.
As regards toThese favorable effects were partially offset by deteriorating sales deductions patienton a year over year comparative basis. Patient reimbursement challenges and increased contracting pressure from managed care providers resulted in higher patient program participation rates, increased per patient costs for our co-pay programs, and higher per patient rebate payments to managed care providers. As a result, this increased the provision for sales deductions, and reducedthereby reducing net product sales.sales for the six months ended June 30, 2020 as compared to the prior year.
Trokendi XR
Trokendi XR net product sales increased by $4.9$10.7 million, or 8%14%, for the three months ended March 31,June 30, 2020, as compared to the same period in 2019. This increase was driven by the aforementioned favorable impact of an 8% price increase in 2020. The adverse impact inJanuary 2020 coupled with reduced sales deductions year over yearresultant from co-pay program enhancements. While prescription volume was essentially offsetdown sequentially for the three months ended June 30, 2020 as compared to the same period in 2019, volume measured in units (i.e., number of capsules) was relatively flat due to the aforementioned shift to 90-count prescriptions.
For the six months ended June 30, 2020 Trokendi XR net product sales increased by $15.6 million, or 11%, as compared to the same period in 2019. This increases was driven by the negativefavorable impact of the aforementioned price increase in January 2020, the growth in prescription volume, and coupled with the impact in the first quarter of 2019 of the aforementioned channelpipeline inventory reduction. These favorable effects were partially offset by an increase in sales deductions. In the first quarter of 2020, product returns for discontinued Trokendi XR blister pack configurations exceeded our forecast, resulting in an increase in the provision for returns.
Oxtellar XR
Oxtellar XR net product sales increased by $4.5$0.3 million, or 23%1%, and $4.8 million, or 11%, for the three and six months ended March 31,June 30, 2020, as compared to the same periodperiods in 2019. The increase was primarily attributable to growth in prescription unit volume and the favorable impact fromof the aforementioned January 2020 price increase of 8%. These effectsfavorable impacts were partially offset by increased net product sales deductions due to higher per patient payments under both Medicaid and managed care programs, as well as higher co-payment program expenditures.
Sales deductionsDeductions and related accrualsRelated Accruals
The Company records accrued product rebates and accrued product returns as current liabilities in Accrued product returns and rebates, as current liabilities on our condensed consolidated balance sheets. We record sales discounts as a valuation allowance against Accounts receivable on the condensed consolidated balance sheets. These outstandingBoth amounts are generally affected by changes in the level of gross product sales, changes in the provision for net product sales deductions, and the timing of payments/credits.
The following table provides a summary of activitiesactivity with respect to sales deductions and related accruals during the periods indicated (dollars in thousands):
| | | Accrued Product Returns and Rebates | | | | Accrued Product Returns and Rebates | | |
| | Product
Rebates | | Product
Returns | | Allowance for
Sales Discounts | | Total | | Product
Rebates | | Product
Returns | | Allowance for
Sales Discounts | | Total |
| Balance at December 31, 2019 | Balance at December 31, 2019 | $ | 88,811 | | | $ | 18,818 | | | $ | 11,013 | | | $ | 118,642 | | Balance at December 31, 2019 | $ | 88,811 | | | $ | 18,818 | | | $ | 11,013 | | | $ | 118,642 | |
| USWM Acquisition liabilities assumed | | USWM Acquisition liabilities assumed | 5,112 | | | 3,072 | | | 293 | | | 8,477 | |
| Provision | Provision | | Provision | |
| Provision for sales in current year | Provision for sales in current year | 87,114 | | | 2,681 | | | 15,524 | | | 105,319 | | Provision for sales in current year | 168,506 | | | 5,463 | | | 32,449 | | | 206,418 | |
| Adjustments relating to prior year sales | Adjustments relating to prior year sales | 3,716 | | | 7,951 | | | 147 | | | 11,814 | | Adjustments relating to prior year sales | 3,633 | | | 7,468 | | | 147 | | | 11,248 | |
| Total provision | Total provision | $ | 90,830 | | | $ | 10,632 | | | $ | 15,671 | | | $ | 117,133 | | Total provision | $ | 172,139 | | | $ | 12,931 | | | $ | 32,596 | | | $ | 217,666 | |
| Less: Actual payments/credits | Less: Actual payments/credits | (85,029) | | | (4,609) | | | (16,398) | | | (106,036) | | Less: Actual payments/credits | (147,727) | | | (9,051) | | | (31,535) | | | (188,313) | |
| Balance at March 31, 2020 | $ | 94,612 | | | $ | 24,841 | | | $ | 10,286 | | | $ | 129,739 | | |
| Balance at June 30, 2020 | | Balance at June 30, 2020 | $ | 118,335 | | | $ | 25,770 | | | $ | 12,367 | | | $ | 156,472 | |
Table of Contents | | | | | | | | | | | | | | | | | | | | | | | |
| Balance at December 31, 2018 | $ | 85,003 | | | $ | 22,060 | | | $ | 11,548 | | | $ | 118,611 | |
| Provision | | | | | | | |
| Provision for sales in current year | 139,376 | | | 4,068 | | | 27,394 | | | 170,838 | |
| Adjustments relating to prior year sales | (888) | | | (730) | | | (43) | | | (1,661) | |
| Total provision | $ | 138,488 | | | $ | 3,338 | | | $ | 27,351 | | | $ | 169,177 | |
| Less: Actual payments/credits | (149,129) | | | (3,826) | | | (26,940) | | | (179,895) | |
| Balance at June 30, 2019 | $ | 74,362 | | | $ | 21,572 | | | $ | 11,959 | | | $ | 107,893 | |
| | | | | | | | | | | | | | | | | | | | | | | |
| Balance at December 31, 2018 | $ | 85,003 | | | $ | 22,060 | | | $ | 11,548 | | | $ | 118,611 | |
| Provision | | | | | | | |
| Provision for sales in current year | 63,941 | | | 1,724 | | | 11,214 | | | 76,879 | |
| Adjustments relating to prior year sales | (844) | | | (42) | | | (43) | | | (929) | |
| Total provision | $ | 63,097 | | | $ | 1,682 | | | $ | 11,171 | | | $ | 75,950 | |
| Less: Actual payments/credits | (82,010) | | | (1,632) | | | (14,909) | | | (98,551) | |
| Balance at March 31, 2019 | $ | 66,090 | | | $ | 22,110 | | | $ | 7,810 | | | $ | 96,010 | |
TheFrom 2019 to 2020, the total provision for sales deductions on gross product sales increased by $41.2$48.5 million, from $76.0$169.2 million in 2019 to $117.1$217.7 million in 2020. Approximately 67%69% of this increase, or $27.7$33.7 million, was attributable to the year over year increaseincreases in the provision for product rebates, from $63.1$138.5 million in 2019 to $90.8$172.1 million in 2020.
The year over year increase in the provision for Increased product rebates iswere primarily attributable to greater utilization of our patient co-payment programs, as well as higher per patient payments under both Medicaid and managed care programs. GrowthTo a lesser extent, growth in prescriptions, and the impact of the aforementioned 8% price increase taken in January 2020, also contributed to the increase in product rebates.
The $9.0 millionApproximately 20% of the increase in the total provision for sales deductions was attributable to increases in the provision for product returns,returns. Specifically, this provision increased, from $1.7$3.3 million to $10.6$12.9 million for the threesix months ended March 31,June 30, 2019 and 2020, respectively, wasprimarily due primarily to the aforementioned unfavorable actual returns experience in the first quarter of 2020 for discontinued Trokendi XR commercial blister pack Trokendi XR configurations.
The Company ceased production and distribution of all blister pack configurations for Trokendi XR in 2017. Subsequent to ceasing blister pack production and distribution in 2017, the observed rate of product return for all blister pack configurations of Trokendi XR steadily declined over time. This return rate trend was firmly established over a multi-year period. However, in the first quarter of 2020, the return rate for the final blister pack lots of Trokendi XR produced in 2017 unexpectedly exhibited a return rate significantly higher than had been experienced with all previous lots. The lots for which a higher return rate was observed are the last lots which were produced and distributed.
As a result, the Company changed its estimate of the provision for product returns, based onto reflect the most recent experience. This change in estimate resulted in an increase to the provision for product returns of $8.0 million, decreased net product sales of $8.0 million and decreased net earnings of $5.9 million, or $0.11 per basic and per diluted share, for the three months ended March 31, 2020.
TheApproximately 11% of the increase in the total provision for sales deductions was due to increases in the provision for sales discounts increased by $4.5of $5.2 million, from $11.2$27.4 million to $15.7$32.6 million, for the threesix months ended March 31,June 30, 2019 and 2020.2020, respectively. This increase was driven by prescription volume growth.growth as well as the aforementioned 8% price increase in January 2020.
Royalty Revenues
Royalty revenue for the three month period ended June 30, 2020, includes royalties from the following products (dollars in thousands):
| | | | | | | | | | | | | | | | | | | | | | | | | | | | | | | |
| Three Months ended
March 31, | | | | Change | | | | | | | | | | |
| 2020 | | 2019 | | Amount | | Percent | | | | | | | | |
Mydayis (1) | $ | 919 | | | $ | 800 | | | $ | 119 | | | 15% | | | | | | | | |
Orenitram (2) | 1,567 | | | 1,575 | | | (8) | | | (1)% | | | | | | | | |
| Total | $ | 2,486 | | | $ | 2,375 | | | $ | 111 | | | 5% | | | | | | | | |
| | | | | | | | | | | | | | | | | | | | | | | | | | | | | | | | | | | | | | | | | | | | | | | |
| Three Months ended
June 30, | | | | Change | | | | Six Months ended June 30, | | | | Change | | |
| 2020 | | 2019 | | Amount | | Percent | | 2020 | | 2019 | | Amount | | Percent |
Mydayis (1) | $ | 394 | | | $ | 545 | | | $ | (151) | | | (28)% | | $ | 1,313 | | | $ | 1,345 | | | $ | (32) | | | (2)% |
Orenitram (2) | 2,351 | | | 1,792 | | | 559 | | | 31% | | 3,918 | | | 3,367 | | | 551 | | | 16% |
| Total | $ | 2,745 | | | $ | 2,337 | | | $ | 408 | | | 17% | | $ | 5,231 | | | $ | 4,712 | | | $ | 519 | | | 11% |
(1) Royalty from net product sales of Mydayis, a product of Shire Plc, a subsidiary of Takeda Pharmaceuticals Company Ltd.
(2) NoncashSupernus records noncash royalty revenue pursuant to our agreement with Healthcare Royalty Partners III, L.P. (HC Royalty). HC Royalty receives royalty payments from United Therapeutics Corporation (United Therapeutics) based on net product sales of United Therapeutics’ product Orenitram. Supernus records noncash royalty based on these product sales.
Royalty revenues were essentially flatincreased for the three and six months ended March 31,June 30, 2020, respectively, compared to the same period in 2019.
Cost of Goods Sold
The following table provides information regarding our cost of goods sold during the periods indicated (dollars in thousands):
| | | | | | | | | | | | | | | | | | | | | | | | | | | | | | | |
| Three Months ended
March 31, | | | | Change | | | | | | | | | | |
| 2020 | | 2019 | | Amount | | Percent | | | | | | | | |
| Cost of goods sold | $ | 4,152 | | | $ | 3,684 | | | $ | 468 | | | 13% | | | | | | | | |
| | | | | | | | | | | | | | | | | | | | | | | | | | | | | | | | | | | | | | | | | | | | | | | |
| Three Months ended
June 30, | | | | Change | | | | Six Months ended
June 30, | | | | Change | | |
| 2020 | | 2019 | | Amount | | Percent | | 2020 | | 2019 | | Amount | | Percent |
| Cost of goods sold | $ | 8,386 | | | $ | 4,044 | | | $ | 4,342 | | | 107% | | $ | 12,538 | | | $ | 7,728 | | | $ | 4,810 | | | 62% |
Cost of goods sold during the three months ended March 31,June 30, 2020 was $4.2were $8.4 million, $0.5$4.3 million higher than the $3.7$4.0 million incurred for the same period in 2019. The increase was primarily attributable to quarter over quarter increase in prescription unit volume, as well as cost of goods sold for acquired products.
Cost of goods sold increased by $4.8 million during the six months ended June 30, 2020 from $7.7 million to $12.5 million. This increase was primarily attributable to year over year increase in prescriptions,increased prescription unit volume, costs of goods sold for acquired products, as well as the aforementioned reduction in channel level inventory, which occurred in the first quarter of 2019.
Research and Development Expenses
The following table provides information regarding our research and development (R&D) expenses during the periods indicated (dollars in thousands):
| | | | | | | | | | | | | | | | | | | | | | | | | | | | | | | |
| Three Months ended
March 31, | | | | Change | | | | | | | | | | |
| 2020 | | 2019 | | Amount | | Percent | | | | | | | | |
| Research and development | $ | 18,937 | | | $ | 15,394 | | | $ | 3,543 | | | 23% | | | | | | | | |
| | | | | | | | | | | | | | | | | | | | | | | | | | | | | | | | | | | | | | | | | | | | | | | |
| Three Months ended
June 30, | | | | Change | | | | Six Months ended
June 30, | | | | Change | | |
| 2020 | | 2019 | | Amount | | Percent | | 2020 | | 2019 | | Amount | | Percent |
| Research and development | $ | 22,247 | | | $ | 16,970 | | | $ | 5,277 | | | 31% | | $ | 41,184 | | | $ | 32,364 | | | $ | 8,820 | | | 27% |
R&D expenses increased by $3.5$5.3 million inand $8.8 million, respectively, during the three and six months ended March 31,June 30, 2020, as compared to the same period in 2019. The increase quarter over quarterin both periods was primarily driven by enrollmentdue to the $10 million option fee paid in conjunction with the Navitor collaboration for SPN-820, coupled with expenses incurred in the SPN-812 Phase III program for adults, that was initiatedpartially offset by reduced spending on SPN-810 Phase III trials, and by the decrease in late 2019.clinical trial manufacturing costs for SPN-812 as a result of the capitalization of pre-launch inventory.
Selling, General and Administrative Expenses
The following table provides information regarding our selling, general and administrative (SG&A) expenses during the periods indicated (dollars in thousands):
| | | Three Months ended
March 31, | | | Change | | | Three Months ended
June 30, | | | Change | | | Six Months ended
June 30, | | | Change | |
| | 2020 | | 2019 | | Amount | | Percent | | | 2020 | | 2019 | | Amount | | Percent | | 2020 | | 2019 | | Amount | | Percent |
| Selling and marketing | Selling and marketing | $ | 29,041 | | | $ | 30,749 | | | $ | (1,708) | | | (6)% | | Selling and marketing | $ | 29,950 | | | $ | 30,219 | | | $ | (269) | | | (1)% | | $ | 58,991 | | | $ | 60,968 | | | $ | (1,977) | | | (3)% |
| General and administrative | General and administrative | 13,834 | | | 10,219 | | | 3,615 | | | 35% | | General and administrative | 18,153 | | | 9,558 | | | 8,595 | | | 90% | | 30,726 | | | 18,471 | | | 12,255 | | | 66% |
| Total | Total | $ | 42,875 | | | $ | 40,968 | | | $ | 1,907 | | | 5% | | Total | $ | 48,103 | | | $ | 39,777 | | | $ | 8,326 | | | 21% | | $ | 89,717 | | | $ | 79,439 | | | $ | 10,278 | | | 13% |
Selling and Marketing. Selling and marketing expenses decreased by $1.7$0.3 million in the three months ended March 31,June 30, 2020, as compared to the same period in 2019, primarily due to $1.4 million lower employee related expenses due to reduced travel expenses because of the COVID-19 pandemic, decreased marketing expense for commercial products and lower professional consulting spending of $1.0 million, offset by higher compensation from increased headcount and contract services as a result of the USWM Acquisition.
Selling and marketing expenses decreased by $2.0 million in the six months ended June 30, 2020, as compared to the same period in 2019. The changedecrease was attributable to $2.6 million in savings for employee related expenses due to decreased employee-relatedreduced travel expenses because of $0.5 million and marketing expense for commercial products of $2.3 million,the COVID-19 pandemic, partially offset by increased professionalthe aforementioned additional selling and consulting spending for SPN-812 pre-launch activitiesmarketing expenses of $1.0 million.the acquired business from the USWM Acquisition.
General and Administrative.Administrative. General and administrative expenses increased by $3.6$8.6 million for the three months ended March 31,June 30, 2020, as compared to the same period in 2019. The change was primarily due to $7.7 million in increased professional and consulting spending for business development activities, including acquisition-related transaction costs, coupled with $1.1 million in higher employee compensation expense. These increases in cost were offset by a non-recurring $3.1 million PDUFA fees refund from the $1.4FDA.
General and administrative expenses increased by $12.3 million for the six months ended June 30, 2020, as compared to the same period in 2019. The increase was primarily due to $8.8 million in increased professional and consulting spending for business development activities, including acquisition-related transaction costs, $2.5 million increase in employee-related expensesemployee compensation expense, partially offset by the non-recurring PDFUA fees refund from the FDA.
Amortization of Intangible Assets
The following table provides information regarding our amortization of intangible assets during the periods indicated (dollars in thousands):
| | | | | | | | | | | | | | | | | | | | | | | | | | | | | | | | | | | | | | | | | | | | | | | |
| Three Months ended
June 30, | | | | Change | | | | Six Months ended
June 30, | | | | Change | | |
| 2020 | | 2019 | | Amount | | Percent | | 2020 | | 2019 | | Amount | | Percent |
| Amortization of intangible assets | $ | 2,445 | | | $ | 1,306 | | | $ | 1,139 | | | 87% | | $ | 3,706 | | | $ | 2,612 | | | $ | 1,094 | | | 42% |
Amortization of intangible assets increases for the three and six months ended June 30, 2020 are primary due to increased headcount and higher share-based compensation expense, $1.3 million increase in higher occupancy-related costs, and $0.9 million increase in professional and consulting fees.amortization of the acquired intangible assets of the USWM Acquisition.
Other Income (Expense)
The following table provides the components of other income (expense) during the periods indicated (dollars in thousands):
| | | Three Months ended
March 31, | | | Change | | | Three Months ended
June 30, | | | Change | | | Six Months ended
June 30, | | | Change | |
| | 2020 | | 2019 | | Amount | | Percent | | | 2020 | | 2019 | | Amount | | Percent | | 2020 | | 2019 | | Amount | | Percent |
| Interest income | Interest income | $ | 5,777 | | | $ | 4,681 | | | $ | 1,096 | | | 23% | | Interest income | $ | 4,151 | | | $ | 5,448 | | | $ | (1,297) | | | (24)% | | $ | 9,726 | | | $ | 10,137 | | | $ | (411) | | | (4)% |
| Interest expense | Interest expense | (4,693) | | | (4,710) | | | 17 | | | —% | | Interest expense | (4,792) | | | (4,253) | | | (539) | | | 13% | | (9,485) | | | (8,972) | | | (513) | | | 6% |
| Interest expense on nonrecourse liability related to sale of future royalties | Interest expense on nonrecourse liability related to sale of future royalties | (1,062) | | | (1,160) | | | 98 | | | (8)% | | Interest expense on nonrecourse liability related to sale of future royalties | (1,023) | | | (1,136) | | | 113 | | | (10)% | | (2,085) | | | (2,296) | | | 211 | | | (9)% |
| Other income, net | | Other income, net | 3,326 | | | 89 | | | 3,237 | | | 3637% | | 3,528 | | | 90 | | | 3,438 | | | 3820% |
| Total | Total | $ | 22 | | | $ | (1,189) | | | $ | 1,211 | | | (102)% | | Total | $ | 1,662 | | | $ | 148 | | | $ | 1,514 | | | 1023% | | $ | 1,684 | | | $ | (1,041) | | | $ | 2,725 | | | (262)% |
Interest income increaseddecreased by $1.1$1.3 million and $0.4 million for the three and six months ended March 31,June 30, 2020, respectively, primarily due to gains from sales and maturity ofdecreases in marketable securities.securities holdings.
Interest expense for the three and six months ended March 31,June 30, 2020 remained essentially unchanged,increased by approximately $0.5 million compared to the same periodperiods in 2019.2019, primarily due to increased amortization of debt discount.
Noncash interest expense related to our nonrecourse royalty liability for the three and six months ended March 31,June 30, 2020 remained relatively unchanged, as compared to the same periodperiods in 2019.
Other income, net for the three and six months ended June 30, 2020 increased by approximately $3.2 million and $3.4 million, respectively, compared to the same periods in 2019, primarily due to gains generated by sales of our marketable securities.
Income Tax Expense
The following table provides information regarding our income tax expense during the periods indicated (dollars in thousands):
| | | Three Months ended
March 31, | | | Change | | | Three Months ended
June 30, | | | Change | | | Six Months ended
June 30, | | | Change | |
| | 2020 | | 2019 | | Amount | | Percent | | | 2020 | | 2019 | | Amount | | Percent | | 2020 | | 2019 | | Amount | | Percent |
| Income tax expense | Income tax expense | $7,516 | | $5,899 | | $1,617 | | 27% | | Income tax expense | $12,543 | | $10,019 | | $2,524 | | 25% | | $20,059 | | $15,918 | | $4,141 | | 26% |
| Effective tax rate | Effective tax rate | 25.9% | | 24.3% | | | | | | Effective tax rate | 26.6% | | 23.4% | | 26.3% | | 23.8% | | | | |
The increasesincrease in income tax expense and in the effective tax rate for the three and six months ended March 31,June 30, 2020, as compared to the same period in the prior year, was primarily attributable to higher income before taxes, an increase in the number of states in which we owe taxes, and an increase in non-deductible expenses.expenses as a result of the USWM Acquisition.
Net Earnings
The following table provides information regarding our net earnings during the periods indicated (dollars in thousands):
| | | | | | | | | | | | | | | | | | | | | | | | | | | | | | | |
| Three Months ended March 31, | | | | Change | | | | | | | | | | |
| 2020 | | 2019 | | Amount | | Percent | | | | | | | | |
| Net earnings | $ | 21,518 | | | $ | 18,340 | | | $ | 3,178 | | | 17% | | | | | | | | |
| | | | | | | | | | | | | | | | | | | | | | | | | | | | | | | | | | | | | | | | | | | | | | | |
| Three Months ended June 30, | | | | Change | | | | Six Months ended June 30, | | | | Change | | |
| 2020 | | 2019 | | Amount | | Percent | | 2020 | | 2019 | | Amount | | Percent |
| Net earnings | $ | 34,667 | | | $ | 32,727 | | | $ | 1,940 | | | 6% | | $ | 56,185 | | | $ | 51,067 | | | $ | 5,118 | | | 10% |
The increase in net earnings in the three month and six month periods ended June 30, 2020 was primarily due to increased revenuenet product sales generated from our two commercial products, Trokendi XR and Oxtellar XR.offset by period over period increased operating expenses, including transaction costs related to the USWM Acquisition.
Liquidity and Capital Resources
We have financed our operations primarily with cash generated from product sales, supplemented by cash generated by revenue from royalty and licensing arrangements, as well as proceeds from the sale of equity and debt securities. Continued cash generation is highly dependent on the continued commercial success of our twofive commercial products, Trokendi XR, Oxtellar XR, APOKYN, MYOBLOC, and Oxtellar XR.XADAGO. We were cash flow positive and profitable from operations in 2019.2019 and 2020.
While we expect continued profitability forin future years, we anticipate there may be significant variability from year to year in the level of our profits, particularly as we move forward with the anticipated commercial launch of SPN-812, late in 2020, assuming FDA approval.
We believe our existing cash and cash equivalents, marketable securities and cash received from product sales will be sufficient to finance ongoing operations, develop and launch our new products, and fund label expansions for existing products. To continue to grow our business over the long-term, we plan to commit substantial resources to: product development and clinical trials of product candidates; product acquisition; andproduct in-licensing; and supportive functions such as compliance, finance, management of
our intellectual property portfolio, information technology systems, and personnel. In each case, spending would be commensurate with the growth and needs of the business.
We may, from time to time, consider raising additional capital through: new collaborative arrangements; strategic alliances; additional equity and/or debt financings; or financing from other sources, especially in conjunction with opportunistic business development initiatives. We will continue to actively manage our capital structure and to consider all financing opportunities that could strengthen our long-term financial profile. Any such capital raises may or may not be similar to transactions in which we have engaged in the past. There can be no assurance that any such financing opportunities will be available on acceptable terms, if at all.
Financial Condition
Cash and cash equivalents, marketable securities, long term marketable securities, working capital, convertible notes and total stockholder’s equity, as of the periods presented below, are as follows (dollars in thousands):
| | | March 31 | | December 31 | | Change | | | June 30 | | December 31 | | Change | |
| | 2020 | | 2019 | | Amount | | Percent | | 2020 | | 2019 | | Amount | | Percent |
| | Cash and cash equivalents | Cash and cash equivalents | $ | 225,767 | | | $ | 181,381 | | | $ | 44,386 | | | 24% | Cash and cash equivalents | $ | 210,975 | | | $ | 181,381 | | | $ | 29,594 | | | 16% |
| Marketable securities | Marketable securities | 175,104 | | | 165,692 | | | 9,412 | | | 6% | Marketable securities | 163,839 | | | 165,692 | | | (1,853) | | | (1)% |
| Long term marketable securities | Long term marketable securities | 534,712 | | | 591,773 | | | (57,061) | | | (10)% | Long term marketable securities | 358,673 | | | 591,773 | | | (233,100) | | | (39)% |
| Total | Total | $ | 935,583 | | | $ | 938,846 | | | $ | (3,263) | | | —% | Total | $ | 733,487 | | | $ | 938,846 | | | $ | (205,359) | | | (22)% |
| | Working capital | Working capital | 388,713 | | | 312,057 | | | 76,656 | | | 25% | Working capital | 287,877 | | | 312,057 | | | (24,180) | | | (8)% |
| | Convertible notes, net (2023 Notes) | Convertible notes, net (2023 Notes) | 349,232 | | | 345,170 | | | 4,062 | | | 1% | Convertible notes, net (2023 Notes) | 353,349 | | | 345,170 | | | 8,179 | | | 2% |
| | Total stockholder's equity | Total stockholder's equity | 613,383 | | | 595,428 | | | 17,955 | | | 3% | Total stockholder's equity | 665,974 | | | 595,428 | | | 70,546 | | | 12% |
The total cash and cash equivalents, marketable securities and long term marketable securities decreased by $3.3$205.4 million in the first threesix months of 2020, primarily due to decreasescash outlays related to the USWM Acquisition as well as the investment in Navitor. These were offset by increases in cash flow from ongoing operations and increases in the valuation of long term marketable securities resultant from market volatility.securities.
Our workingWorking capital at March 31,June 30, 2020 was $388.7$287.9 million, an increasea decrease of $76.7$24.2 million as compared to $312.1 million at December 31, 2019. The increasedecrease was primarily due tothe net of increased accounts receivable of $31.9$39.2 million, and increased cash, cash equivalents, and marketable securities of $53.8$27.7 million, offset by increases in current liabilities of $7.7$108.7 million during the threesix months ended March 31,June 30, 2020.
As of March 31,June 30, 2020 and December 31, 2019, the outstanding principal on our 0.625% Convertible Senior Notes Due 2023 (2023 Notes) was $402.5 million. No 2023 Notes have been converted as of March 31,June 30, 2020. Contemporaneous with the issuance of the 2023 Notes, the Company also entered into separate convertible note hedge transactions (collectively, the Convertible Note Hedge Transactions), issuing 402,500 convertible note hedge options. The Convertible Note Hedge Transactions are expected to reduce the potential dilution of the Company's common stock upon conversion of the 2023 Notes. Concurrently with entering into the Convertible Note Hedge Transactions, the Company also entered into separate warrant transactions, issuing a total of 6,783,939 warrants (the Warrant Transactions). See Part I, Item 1, Financial Statements, Note 5,6, Convertible Senior Notes Due 2023, in the Notes to the Condensed Consolidated Financial Statements, for further discussion of the 2023 Notes and our other indebtedness.
Stockholders’ equity increased by $18.0 million during the three months ended March 31, 2020, primarily as a result of net earnings of $21.5 million coupled with share-based compensation of $4.0 million. These increases were offset by unrealized losses on marketable securities, net of tax of $7.6 million.
Stockholders’ equity increased by $70.5 million during the six months ended June 30, 2020, the net effect of net earnings of $56.2 million, share-based compensation of $9.0 million and $3.9 million of unrealized gains on marketable securities, net of tax.
Summary of Cash Flows
The following table sets forthsummarizes the major sources and uses of cash for the periods set forth below (summarized, dollars(dollars in thousands):
| | | Three Months ended March 31, | | | Change | | Six Months ended June 30, | | | Change |
| | 2020 | | 2019 | | Amount | | 2020 | | 2019 | | Amount |
| Net cash provided by (used in): | Net cash provided by (used in): | | | | | | Net cash provided by (used in): | | | | | |
| | Operating activities | Operating activities | | Operating activities | |
| Operating earnings | Operating earnings | $ | 32,176 | | | $ | 27,071 | | | $ | 5,105 | | Operating earnings | $ | 73,758 | | | $ | 69,335 | | | $ | 4,423 | |
| Working capital | Working capital | (23,260) | | | 5,922 | | | (29,182) | | Working capital | 27,109 | | | (7,655) | | | 34,764 | |
| Total operating activities | Total operating activities | 8,916 | | | 32,993 | | | (24,077) | | Total operating activities | 100,867 | | | 61,680 | | | 39,187 | |
| | Investing activities | Investing activities | 35,438 | | | (103,246) | | | 138,684 | | Investing activities | (72,742) | | | (169,007) | | | 96,265 | |
| | Financing activities | Financing activities | 32 | | | 783 | | | (751) | | Financing activities | 1,469 | | | 2,423 | | | (954) | |
| | Net change in cash and cash equivalents | Net change in cash and cash equivalents | $ | 44,386 | | | $ | (69,470) | | | $ | 113,856 | | Net change in cash and cash equivalents | $ | 29,594 | | | $ | (104,904) | | | $ | 134,498 | |
Operating Activities
Net cash provided by operating activities is comprised of two components: cash provided by operating earnings; and cash provided by (used in) changes in working capital. The net cash provided by operating activities, $8.9$100.9 million, was primarily driven by increased operating earnings but reduced by increasedand a decrease in net working capital.
Cash utilized in working capital primarily reflects the timing impacts of cash collections on receivables and settlement of payables, as described below.
The changes in certain operating assets and liabilities are as follows (dollars in thousands):
| | | | | | | | | | | | | | | | | |
| | Three Months ended March 31, | | | | |
| | 2020 | | 2019 | | Explanation of Change |
| (Increase) Decrease in: | | | | | |
| Accounts receivable | $ | (31,823) | | | $ | 23,013 | | | Receivables increase in 2020 is due to increase in prescription volume and timing of receivable collections. Receivables decreased in 2019 because of sequential decline in prescription volume, coupled with channel inventory reduction in first quarter 2019. |
| Inventories | 2,210 | | | (859) | | | Decreased inventory due to increased product demand; timing of inventory production. |
| Prepaid expenses, other current assets and other assets | (454) | | | (1,995) | | | Timing differences related to deposits for equipment purchases in 2019 and prepaid clinical trial costs. |
| Increase (Decrease) in: | | | | | | | |
| Accounts payable and accrued expenses and noncurrent liabilities | (10,651) | | | 868 | | | Timing of vendor payments.
|
| Accrued product returns and rebates | 11,824 | | | (18,863) | | | Timing of rebate payments; increased provision for rebates due to growth in prescriptions; growth in Medicaid and managed care rebates; higher expenditures for patient co-pay programs; higher provision for returns in 2020; impact of channel inventory reduction in first quarter 2019. |
| Income taxes payable | 6,654 | | | 4,856 | | | Increased current tax provision due to higher taxable income. |
| Other | (1,020) | | | (1,098) | | | Decreased employee-related costs.
|
| Total | $ | (23,260) | | | $ | 5,922 | | | |
| | | | | | | | | | | | | | | | | |
| | Six Months ended June 30, | | | | |
| | 2020 | | 2019 | | Explanation of Change |
| (Increase) Decrease in: | | | | | |
| Accounts receivable | $ | (20,431) | | | $ | 18,439 | | | Receivables increase in 2020 was due to increased prescription volume and timing of receivable collections. Receivables decrease in 2019 was attributed to sequential decline in prescription volume, amplified by channel inventory reduction in first quarter 2019. |
| Inventories | 1,689 | | | (365) | | | Decreased inventory in 2020 and increase in 2019 were due to timing of inventory production. |
| Prepaid expenses, other current assets and other assets | (5,943) | | | (3,721) | | | The increase in 2020 was primarily due to a refund of PDUFA Fees. The increase in 2019 was due to timing differences related to deposits for equipment purchases and prepaid clinical costs. |
| Increase (Decrease) in: | | | | | |
| Accounts payable and accrued expenses and noncurrent liabilities | 3,714 | | | (421) | | | The change in both periods was due to timing of receipt of vendor invoices and vendor payments. |
| Accrued product returns and rebates | 28,298 | | | (11,129) | | | The increase in 2020 was due to: increased provision for rebates due to growth in prescription; growth in Medicaid and managed care rebates; higher expenditures for patient co-pay programs; and higher provision for returns.
The decrease in 2019 was primarily due to impact of channel inventory reduction in first quarter of 2019 and timing of rebate payments. |
| Income taxes payable | 22,513 | | | (9,703) | | | The increase in 2020 was primarily due to higher income before taxes, higher effective rate and deferral of income tax payments to Q3 due to the COVID-19 pandemic. The decrease in 2019 is primarily due to higher income tax payments made. |
| Other | (2,731) | | | (755) | | | The decrease in both periods is due to decreased employee-related costs.
|
| Total | $ | 27,109 | | | $ | (7,655) | | | |
Investing Activities
Net cash provided byused in investing activities was $35.4$72.7 million for the threesix months ended March 31,June 30, 2020, as compared to net cash used in investing activities of $103.2$169.0 million for the same period in 2019. The change is primarily due to higher levelsin 2020 reflects sale of purchasesmarketable securities of $257.9 million in 2020, offset by outlays for the USWM Acquisition of $297.2 million and the investment in Navitor of $15.0 million. Purchases of marketable securities in 2019. These purchases reflect2019 are resultant from investment of excess cash in long term marketable securities.
Financing Activities
Net cash provided by financing activities for the threesix months ended March 31,June 30, 2020 remained essentially unchanged as compared to the same period in 2019.
Contractual Obligations and Commitments
Refer to the “Contractual Obligations and Commitments” section in “Part II, Item 7 — Management’s Discussion and Analysis of Liquidity and Capital Resources” of our Annual Report on Form 10-K for the year ended December 31, 2019, for a discussion of our contractual obligations.
On April 21, 2020, the Company entered into a Development and Option Agreement (Development Agreement) with Navitor Pharmaceuticals, Inc. (Navitor). Under the terms of the Development Agreement, the Company and Navitor will jointly conduct a Phase II clinical program for NV-5138 in treatment-resistant depression. In addition, Navitor has granted the Company an exclusive option to license or acquire NV-5138 in all world territories, excluding Greater China, prior to initiation of a Phase III clinical program. In consideration of the rights granted under the Development Agreement, the Company will make a one time, non-refundable and non-creditable cash payment of $25 million to Navitor Refer Note 19 in the second quarterNotes to the Condensed Consolidated Financial Statements in Part I, Item 1 of 2020, comprisedthis Quarterly Report on Form 10-Q for a discussion of an option feecommitments assumed in connection with the USWM Acquisition.
On April 28, 2020, the Company entered into a definitive Sales and Purchase Agreement with US WorldMeds Partners, LLC, pursuant to which the Company will purchase all of the outstanding equity of USWM Enterprises, LLC (USWM Enterprises), comprising the entire issued share capital of USWM Enterprises, for total consideration of $530 million, consisting of an upfront cash payment of $300 million and additional cash payments of up to $230 million upon the achievement of certain commercial milestones. With the acquisition, the Company will add three established, marketed products and a product candidate in late-stage development to its CNS portfolio. The transaction is expected to close in the second quarter of 2020, subject to certain conditions, including the expiration of the waiting period under the Hart-Scott-Rodino Antitrust Improvements Act and other customary conditions.
Off-Balance Sheet Arrangements
WeOther than the unconsolidated variable interest entities discussed in Part I, Item 1 of this Quarterly Report on Form 10-Q, we do not currently have, nor have we ever had, any relationships with unconsolidated entities or financial partnerships, such entities often referred to as structured finance or special purpose entities. These would have been established for the purpose of facilitating off-balance sheet arrangements or for other contractually narrow or limited purposes.
In addition, we do not engage in trading activities involving non-exchange traded contracts.
Recently Issued Accounting Pronouncements
For a discussion of new accounting pronouncements, see Note 2 in the Notes to the Condensed Consolidated Financial Statements in Part I, Item 1 of this Quarterly Report on Form 10-Q.
Item 3. Quantitative and Qualitative Disclosures About Market Risk
We are subject to certain risks that may affect our results of operations, cash flows and fair value of assets and liabilities, including market risk, interest rate risk, foreign exchange risk, credit risk and liquidity risk. The primary objective of our investment activities is to preserve our capital so as to be able to fund operations and to facilitate business development activities. We also seek to maximize income from our investments, without assuming significant interest rate risk, liquidity risk or risk of default, by investing in investment grade securities with maturities of four years or less. We do not enter into financial instruments for trading or speculative purposes.
Our exposure to market risk is confined to investments in cash, cash equivalents, marketable securities and long term marketable securities. As of March 31,June 30, 2020 and December 31, 2019, we had unrestricted cash, cash equivalents, marketable securities and long term marketable securities of $935.6$733.5 million and $938.8 million, respectively. Our cash and cash equivalents consist primarily of cash held at banks, certificates of deposit and money market funds, all of which have short-term maturities.
Our marketable securities consist of investments in commercial paper, investment grade corporate debt securities, andinvestment in U.S. government agency and municipal debt securities, all of which are reported at fair value. The fair value of our marketable securities is subject to changecan be volatile as a result of potential changes in market interest rates and liquidity conditions in the financial markets, including volatility in trading prices resulting from the impact of the COVID-19 pandemic.
In addition, we generally hold our marketable securities to maturity withinin four years.years or less. Because of the relatively short period that we hold our investments, and because we generally hold these securities to maturity, we do not believe that an increase in interest rates would have a significant impact on the realizable value of our investments.
In connection with the 2023 Notes, we have separately entered into Convertible Note Hedge Transactions and Warrant Transactions to reduce the potential dilution of the Company’s common stock upon conversion of the 2023 Notes. Issuance of warrants was intendedWarrants were issued to partially offsetmitigate the cost to purchase the Convertible Note Hedge Transactions.
We do not have any currency or other derivative financial instruments, other than the outstanding warrants to purchase common stock and the convertible note hedges.
Financial instruments that potentially subject the Company to concentrations of credit risk consist principally of cash, cash equivalents, marketable securities and accounts receivable. The counterparties are various corporations, governmental institutions and financial institutions of high credit standing. Substantially all of the Company's cash, cash equivalents and marketable securities are maintained in U.S. government agency debt, and debt of well-known, investment grade corporations. Deposits held with banks may exceed the amount of governmental insurance provided on such deposits. Generally,
these deposits may be redeemed upon demand and, therefore, these bear minimal default risk.
Credit risk from our accounts receivable is related toarises from our product sales. Three wholesale pharmaceutical distributors, AmerisourceBergen Drug Corporation, Cardinal Health, Inc. and McKesson Corporation, each individually accounted for more than 20% of our total netgross product sales and accounts receivable, respectively.respectively for the six months ended June 30, 2020. They also collectively accounted for more than 90% of our total net product sales and accounts receivable.
We monitor the financial performance and creditworthiness of our customers so that we can properly assess and respond to changes in their credit profile. Weakness in economic conditions in the U.S., including the impact of the COVID-19 pandemic, can result in extended collection periods. We continue to monitor these conditions, including volatility of the financial markets, and continually assess their possible impact on our business. To date, we have not experienced any significant losses with respect to the collection of our accounts receivable.
We may contract with CROs and investigational sites globally. Currently, we have only one ongoing trial, for SPN-817, outside the U.S.
We do not hedge our foreign currency exchange rate risk. Transactions denominated in currencies other than the U.S. dollar are recorded based on exchange rates at the time such transactions arise. As of March 31,June 30, 2020 and December 31, 2019, substantially all of our liabilities were denominated in the U.S. dollar.dollar denominated.
Inflation generally affects us by increasing our cost of labor and the cost of services provided by our vendors. We do not believe that inflation and changing prices over the threesix months ended March 31,June 30, 2020 and 2019 had a significant impact on our condensed consolidated results of operations.
Item 4. Controls and Procedures
Evaluation of Disclosure Controls and Procedures
We maintain disclosure controls and procedures over financial reporting, as defined in Rule 13a-15(e) of the Securities Exchange Act of 1934, as amended, or the Exchange Act. Our disclosure controls and procedures are designed to provide reasonable assurance that the information required to be disclosed by us in the reports we file or submit under the Exchange Act has been appropriately recorded, processed, summarized and reported within the time periods specified in the Securities and Exchange Commission’s rules and forms. Moreover, such information is accumulated and communicated to our management, including our CEO and CFO, to allow timely decisions regarding required disclosure.
As discussed in Note 3 in the Notes to the Condensed Consolidated Financial Statements in Part I, Item 1 of this Quarterly Report on Form 10-Q, the Company completed its acquisition of USWM Enterprises, LLC, a privately-held biopharmaceutical company (USWM Acquisition). Accordingly, pursuant to the Securities and Exchange Commission's general guidance that an assessment of a recently acquired business may be omitted from the scope of an assessment in the year of acquisition, the scope of our assessment of the effectiveness of disclosure controls and procedures does not include internal control over financial reporting related to the recent acquisition. Since the date of acquisition, financial results of the acquired business have been included in the Company's condensed consolidated financial statements. The acquired business contributed 36.7% of the total assets as of June 30, 2020 and 4.8% and 3.1% of total revenues and net earnings, respectively, for the six months ended June 30, 2020.
We conducted an evaluation of the effectiveness of the design and operation of our disclosure controls and procedures over financial reporting as of March 31,June 30, 2020, the end of the period covered by this report. Based on that evaluation, under the supervision and with the participation of our management, including our CEO and CFO, we concluded that our disclosure controls and procedures were effective as of March 31,June 30, 2020.
Changes in Internal Control over Financial Reporting
There were
Other than the implementation of controls related to the accounting of the USWM Acquisition, and the related financial statement reporting, there has been no changeschange in our internal control over financial reporting that occurred during the most recent fiscal quarter ended March 31, 2020 that havehas materially affected, or that is reasonably likely to materially affect, our internal control over financial reporting. We are currently in the process of evaluating MDD US Enterprises, LLC’s (formerly USWM Enterprises, LLC) internal control over financial reporting as part of the ongoing integration of the acquired business. Any changes resulting from this evaluation and ongoing integration activities that materially affect or are reasonably likely to materially affect our internal control over financial reporting.reporting will be disclosed as required by applicable law.
As a result of the COVID-19 pandemic, certain employees of the Company began working remotely in March 2020, but these2020. These changes to the working environment have not had a material impact on our internal controls over financial reporting. We are continually monitoring and assessing the COVID-19 situation for possible impact on our internal controls, in order to assess and to minimize the pandemic's impact on their design and operating effectiveness.
PART II — OTHER INFORMATION
Item 1. Legal Proceedings
From time to time and in the ordinary course of business, we may be subject to various claims, charges and litigation. We may be required to file infringement claims against third parties for the infringement of our patents.
On May 14, 2020, theThe Company received a Paragraph IV Notice Letter from generic drug makers Apotex Inc. and Apotex Corp advising SupernusCorp. (collectively “Apotex”) dated May 13, 2020 directed to nine of its Oxtellar XR Orange Book patents. Supernus’s U.S. Patent Nos. 7,722,898, 7,910,131, 8,617,600, 8,821,930, 9,119,791, 9,351,975, 9,370,525, 9,855,278, and 10,220,042 generally cover once-a-day oxcarbazepine formulation and methods of treating seizures using those formulations. The FDA Orange Book lists all nine of our Oxtellar XR patents as expiring on April 13, 2027.
On June 26, 2020, the Company filed a lawsuit against Apotex alleging infringement of the submissionCompany’s nine patents. The Complaint—filed in the U.S. District Court for the District of New Jersey—alleges, inter alia, that Apotex infringed our Oxtellar XR patents by Apotex ofsubmitting to the FDA an Abbreviated New Drug Application (ANDA), seeking to market a generic version of Oxtellar XR prior to the U.S. Food and Drug Administration (FDA) seeking approvalexpiration of its patents. Filing its June 26, 2020 Complaint within 45 days of receiving Apotex’s Paragraph IV certification notice entitles Supernus to an automatic stay, preventing the FDA from approving Apotex’s ANDA for oxcarbazepine extended-release tablets. The Company is currently reviewing30 months from the detailsdate of the Company's receipt of the Paragraph IV Notice Letter. Apotex has not responded to Supernus’s Complaint as of the date of this Notice Letter and intends to vigorously enforce its intellectual property rights relating to Oxtellar XR.filing.
Item 1A. Risk Factors
Any investment in our business involves a high degree of risk. Before making an investment decision, you should carefully consider the information we include in this Quarterly Report on Form 10-Q, including our condensed consolidated financial statements and related notes; the additional information in the other reports we file with the Securities and Exchange Commission; and the risks described in our Annual Report on Form 10-K for the year ended December 31, 2019. These risks may result in material harm to our business and our financial condition and results of operations. If a material, adverse event were to occur, the market price of our common stock may decline and you could lose part or all of your investment.
The risks described below reflect substantive changes from, or additions to, the risks described in our Annual Report on Form 10-K for the year ended December 31, 2019.
The Company’s financial condition2019 and results of operationsour Quarterly Report on Form 10-Q for fiscal year 2020 and beyond may be materially and adversely affected by the ongoing COVID-19 outbreak.quarter ended March 31, 2020.
The Company is currently followingIf other products including generics containing apomorphine hydrochloride for the recommendationstreatment of localParkinson’s Disease are approved and federal health authorities to minimize exposure risk for its various stakeholders, including employees. The full extent of the impact of COVID-19 onare successfully commercialized, our business and operating results will depend on future developments that are highly uncertain and cannotcould be accurately predicted, including new information that may emerge concerning COVID-19 and the actions required to contain COVID-19, or treat its impact, among others.materially harmed.
AlthoughThird parties have and in the Company currently continuesfuture may receive approval to have uninterrupted wholesalemanufacture and retail distributionmarket their own products, including generics, containing apomorphine hydrochloride or for the treatment of itsParkinson’s Disease in the U.S. For example, Acorda Therapeutics, Inc. launched Inbrija, an inhalable form of levodopa in 2019. Additionally, the FDA approved Sunovion/Sumitomo Daniappon Pharma’s Kynmobi, a sublingual film formulation of apomorphine, in May 2020. The success of these products and the Company does not anticipate a shortageentry of its commercialnew products due to COVID-19 at this time, disruptions may occur for the Company’s customers or suppliers that may materially affect the Company’s ability to obtain supplies or components for its products, manufacture additional product, or deliver inventory in a timely manner. This would result in lost sales, additional costs, penalties, or damage to the Company’s reputation.
Workforce limitations and travel restrictions resulting from related government actions taken to contain spread of the disease may impact many aspects of our business. If a significant percentage of our workforce is unable to work, including because of illness or travel or government restrictions in connection with the COVID-19 outbreak, our operations may be negatively impacted. As a result of government restrictions and social distancing guidelines in the United States, there is an increased reliance on working from home for our employees. For example, the Company’s sales force is currently functioning largely utilizing digital engagement tools, tactics and virtual detailing, which may be less effective than the Company’s ordinary course sales and marketing programs. In addition, patients may not be able to get their prescriptions, or visit their physicians which in turn could adversely impact the prescription volumessales of prescriptions for APOKYN.
We are subject to uncertainty relating to payment or managed care reimbursement policies which, if not favorable for our products or product candidates, could hinder or prevent our commercial success.
Our business is operating in an ever more challenging environment, with significant economic pressures exerted by federal and state governments, insurers and private payors on the pricing of our marketed products, Oxtellar XRaffecting our ability to obtain and/or maintain satisfactory rates of reimbursement for our products. The U.S. federal and Trokendi XR. Similarly, investigative sites, subjectsstate governments and private payors are under intense pressure to control healthcare spending even more tightly than in clinical trials,the past. These pressures are further compounded by consolidation among distributors, retailers, private insurers, managed care organizations and vendors that includeother private payors, resulting in an increase in their negotiating power, particularly with respect to our contract researchproducts. In addition, these pressures are intensified by intense, negative publicity about pricing for pharmaceuticals. These prices are sometimes characterized as excessive, leading to government investigations and legal proceedings regarding pharmaceutical pricing practices.
Our ability, or our collaborators' ability, to successfully commercialize our product and our product candidates, including SPN-812, will depend in part on the coverage and reimbursement levels set by governmental authorities, private health insurers, managed care organizations may beand other third-party payors.
subject to the same workforce limitations and travel restrictions.
As a result, we may experience delaysthreshold for coverage and reimbursement, third-party payors require that drug products be approved for marketing by the FDA. Third-party payors are increasingly challenging the effectiveness of and prices charged for medical products and services. Government authorities and third-party payors have attempted to control costs, in some instances, by limiting coverage, by limiting the amount of reimbursement for particular medications, or disruptions in our preclinical studies, clinical studies, and non-clinical experiments due to unforeseen circumstances including but not limited to, interruptionby encouraging the use of key clinical trial activities, such as clinical trial site data monitoring, and interruption of clinical trial subject visits and study procedures.lower-cost generic products.
The Company may also experience other unknown impacts from COVID-19 thatWe cannot be predicted. While there has been no specific notice of delay from the federal authorities, potential interruptions, delay or changes to the operationssure that reimbursement will be available for any of the U.S. Foodproducts that we develop and, Drug Administration may impactif reimbursement is available, the approval of SPN-812. We may also experience delays in receiving supplies of our product candidates from our contract manufacturing organizations due to staffing shortages, production slowdowns, stoppages, disruptions in delivery systems.
The Company may also require an increased level of working capital if it experiences extended billing and collection cyclesreimbursement. Moreover, that level of reimbursement may change over time, as a result of displaced employeesrequests from payors for higher levels of fees. Reduced or partial payment, or reduced reimbursement coverage, could make our products or product candidates, including Oxtellar XR, Trokendi XR and APOKYN, less attractive to patients and prescribing physicians. We also may be required to sell our products or product candidates at a significant discount, which would adversely affect our ability to realize an appropriate return on our investment in our products or product candidates or to maintain profitability.
We expect that private insurers and managed care organizations will consider the Company, payors, revenue cycle management contractors,efficacy, cost effectiveness and safety of our products or otherwise.product candidates, including Oxtellar XR, Trokendi XR and APOKYN, in determining whether to approve reimbursement for such products or product candidates, and to what extent they will provide reimbursement. Moreover, they will consider the efficacy and cost effectiveness of comparable or competitive products, including generic products, in making reimbursement decisions for our products. Because each third-party payor individually approves payment or reimbursement, obtaining these approvals can be a time consuming and expensive process, requiring us to provide scientific or clinical support for the use of each of our products or product candidates separately to each third-party payor. In some cases, it could take months or years before a particular private insurer or managed care organization reviews a particular product. Prior to that time, reimbursement may be negligible. We may ultimately be unsuccessful in obtaining coverage. In addition, the disease outbreak could result in a widespread health crisisour competitors may have more extensive existing business relationships with third-party payors that could adversely affectimpact the U.S. economycoverage for our products.
Our business would be materially and financial markets, resulting in an economic downturn that could affect customers’ demandadversely affected if we do not receive reimbursement for our products or product candidates from private insurers in a timely fashion or on a satisfactory basis. Our products and product candidates may not be considered cost-effective, and coverage and reimbursement may not be available or economically sufficient to allow us to sell our ability to raise additional capitalproducts or obtain financingproduct candidates on favorable terms.a profitable basis.
The Company may experience delays in receipt of financial information,Our business would also be adversely affected if private insurers, managed care organizations, the Medicare program, or other reimbursing bodies or payors limit the indications for which may preclude timely reporting of financial results to investors and to the U.S. Securities and Exchange Commission.our products or product candidates will be reimbursed.
Accordingly, disruptionsMoreover, increasing efforts by governmental and third-party payors in the U.S. to cap or reduce healthcare costs may cause such organizations to limit both coverage and the level of reimbursement for newly approved products. As a result, they may not cover or provide adequate reimbursement for our products or product candidates.
There has been increasing legislative and enforcement interest in the U.S. with respect to specialty drug pricing practices. Specifically, there have been several recent U.S. Congressional inquiries and proposed federal and state legislative initiatives designed to, among other things, bring more transparency to drug pricing, reduce the cost of prescription drugs under the Medicare program, to review the relationship between pricing and manufacturer patient programs, and to reform government reimbursement methodologies for drugs. We expect to experience pricing pressures in connection with the sale of any of our products and product candidates due to the Company’strend toward managed healthcare, the increasing influence of health maintenance organizations, additional cost containment initiatives and additional legislative changes.
In some foreign jurisdictions, particularly Canada and Europe, the pricing of prescription pharmaceuticals is subject to strict governmental control. In these countries, pricing negotiations with governmental authorities can take 6 to 12 months, or longer, after the receipt of regulatory approval and product launch. To obtain favorable reimbursement for the indications sought, or to obtain pricing approval in some countries, we may be required to conduct a clinical trial that compares the cost-effectiveness of our products or product candidates, if approved, to other available therapies. If reimbursement for our products or product candidates is unavailable in any country in which reimbursement is sought, or is limited in scope or amount, or if pricing is set at unsatisfactory levels, our business ascould be materially harmed, and could be unprofitable.
In addition, many managed care organizations negotiate the reimbursement price of products through the use of formularies, which establish reimbursement levels. Exclusion of a resultproduct from a formulary can lead to sharply reduced usage in the managed care organization's patient population, because reimbursement is limited, and/or negligible. If our products or product candidates are not included within an adequate number of COVID-19managed care formularies, or reimbursed at adequate levels, or
if those policies increasingly favor generic products, our market share and gross margins could result inbe negatively affected. This would have a material adverse effect on our overall business and financial condition.
We expect these challenges to continue and to potentially intensify in 2020 and following years, as political pressures mount, and healthcare payors, including government-controlled health authorities, insurance companies and managed care organizations, step up initiatives to reduce the Company’soverall cost of healthcare, restrict access to higher-priced new medicines, increase the use of generic products and impose overall price cuts. Such pressures could have a material adverse impact on our business, financial condition, and results of operations, as well as on our reputation.
We depend on wholesalers, distributors and specialty pharmacies for retail distribution of our products. If we lose any of our significant wholesalers, distributors or specialty pharmacies, our business could be harmed.
The majority of the sales of Oxtellar XR, Trokendi XR and XADAGO are made to wholesalers and distributors who, in turn, sell our products to pharmacies, hospitals and other customers. For the year ended December 31, 2019, three wholesale pharmaceutical distributors, AmerisourceBergen Drug Corporation, Cardinal Health, Inc. and McKesson Corporation, each individually accounted for more than 30% of our total revenue from sales of Oxtellar XR and Trokendi XR in 2019, and collectively accounted for more than 90% of our total revenue from sales of these products in 2019.
The majority of the sales of APOKYN and MYOBLOC are made to distributors, including McKesson Corporation and Cardinal Health, Inc., and to specialty pharmacies. The loss of any of these wholesale pharmaceutical distributors or wholesale and specialty pharmacy accounts, or a material reduction in their purchases, could have a material adverse effect on our business, results of operations, financial condition, and prospectsprospects. In addition, these wholesale customers comprise a significant part of the distribution network for pharmaceutical products in the near-termU.S.. This distribution network has undergone, and beyond 2020.may continue to undergo, significant consolidation marked by mergers and acquisitions. As a result, a small number of large wholesale distributors control a significant share of the market.
While the CompanyConsolidation of drug wholesalers has developed a comprehensive COVID-19 contingency plan designedincreased. This may result in increased competitive and pricing pressures on pharmaceutical products. We cannot assure you that we can manage these pricing pressures, or that wholesaler purchases will not fluctuate unexpectedly from period to potentially address the challenges and risks presented by this pandemic, thereperiod.
Sales of our products can be no assurancegreatly affected by the inventory levels that our respective wholesalers and distributors carry. We monitor wholesaler and distributor inventory of our products, using a combination of methods. Pursuant to distribution service agreements with our three largest wholesale customers, we receive product inventory reports. For other wholesalers where we do not receive inventory reports, our estimates of wholesaler inventories may differ significantly from actual inventory levels. Significant differences between actual and estimated inventory levels may result in excessive stocking, resulting in our holding substantial quantities of unsold inventory, or, alternatively, inadequate supplies of product in the distribution channels. This could result in our inability to support sales at the retail level. These changes may cause our revenues to fluctuate significantly from quarter to quarter, and, in some cases, may cause our operating results for a particular quarter to be below our expectations, the expectations of securities analysts, and/or the expectations of investors.
At times, wholesalers and distributors may increase inventory levels in response to anticipated price increases, resulting in both greater wholesaler purchases prior to the anticipated price increase and in reduced wholesaler purchases in later quarters. Accordingly, this may cause substantial fluctuations in our results of operations from period to period. If our financial results are below expectations for a particular period, the market price of our common stock may drop significantly.
We may not be able to effectively market and sell our product candidates, if approved, in the U.S.
We plan on building or expanding our sales and marketing capabilities in the U.S. to commercialize our product candidates, if approved. This will require investing significant amounts of financial and management resources. If we are unable to establish and maintain adequate sales and marketing capabilities for our product candidates, or do so in a timely manner, we may not be able to generate sufficient product revenues from our product candidates to be profitable. The cost of establishing and maintaining such plan willmarketing and sales capabilities may not be effectiveeconomically justifiable, in mitigating the effectslight of the COVID-19 pandemicrevenues generated by any of our product candidates.
In addition, we intend to complete the development of an infusion-pump delivery system containing apomorphine and to submit the NDA to the FDA. We are investing significant amounts of resources into the development of the infusion-pump delivery system. If we are unable to gain FDA approval for the infusion-pump delivery system, or are unable to successfully commercialize the infusion-pump delivery system, we may not be able to generate revenue from the infusion-pump delivery
system to justify the cost of invested company resources. In addition, as discussed further below, failure to gain FDA approval could have an adverse effect on the infusion-pump product’s commercial potential, or could require additional costly studies.
Final marketing approval of any of our product candidates, or approval of additional indications for existing products by the FDA or by other regulatory authorities may be delayed, limited, or denied, any of which would adversely affect our ability to generate operating revenues.
We are dependent on obtaining regulatory approval of our product candidates and approval for additional indications for existing products. Our business depends on the successful clinical development; i.e., successful completion of clinical trials and completion of requisite manufacturing information. We are not permitted to market any of our product candidates in the U.S. until we receive approval of an NDA from the FDA, or to market in any foreign jurisdiction, until we receive approval from the requisite authority. Satisfaction of regulatory requirements typically takes many years, is dependent upon the type, complexity and novelty of the product, and requires the expenditure of substantial resources. We cannot predict whether or when we will obtain regulatory approval to commercialize our product candidates. We cannot, therefore, predict the timing of any future revenues from these product candidates.
The FDA has substantial discretion in the drug approval process, including the ability to delay, limit or deny approval of a product candidate or deny a prior approval supplement(1) for many reasons. For example, the FDA:
•Could reject or delay the marketing application for an NCE;
•Could determine that we cannot rely on Section 505(b)(2) for any approval of our product candidates;
•Could determine that the information provided by us was inadequate, contained clinical deficiencies, or otherwise failed to demonstrate the safety and effectiveness of any of our product candidates for a specific indication;
•May not find the data from bioequivalence studies and/or clinical trials sufficient to support the submission of an NDA, or to obtain marketing approval in the U.S.. They may find the clinical and other benefits of our product candidates do not outweigh their safety risks;
•May disagree with our trial design or our interpretation of data from preclinical studies, bioequivalence studies and/or clinical trials, or may change the requirements for approval even after they have reviewed and commented on the design for our trials; the outcome and measurement scale used in the trials; or the clinical protocols whether with or without a special protocol assessment process;
•May determine that we have identified the wrong reference listed drug or drugs, or that approval of our Section 505(b)(2) application of our product candidate is blocked by patent or non-patent exclusivity of the reference listed drug or drugs;
•May identify deficiencies in the manufacturing processes or facilities of third-party manufacturers with which we enter into agreements for the supply of raw materials, including the active pharmaceutical ingredient (API) or formulated product used in our product candidates, wherein those deficiencies may result in interruption in the ability to supply product;
•May approve our product candidates for fewer or more limited indications than we request, or may grant approval contingent on the performance of costly post-approval clinical trials;
•May change their approval policies or adopt new regulations;
•May not approve the labeling claims that we believe are necessary or desirable for the successful commercialization of our product candidates, or may approve them with warnings and precautions that could limit the acceptance of our product candidates and their commercial success; or
•May not approve the addition of new indications to the label of our existing products.
______________________
(1) Changes that have a substantial potential to have an adverse effect on product quality, identity strength, purity or potency (i.e., major changes) require submission of a "prior approval supplement" and approval by the FDA prior to distribution of the drug product made using the change.
Notwithstanding the approval of many products by the FDA pursuant to Sections 505(b)(1) and 505(b)(2), over the last few years, some pharmaceutical companies and others have objected to the FDA's interpretation of Section 505(b)(2). If the FDA changes its interpretation of Section 505(b)(2), or if the FDA's interpretation is successfully challenged in court, this could delay or even prevent the FDA from approving any Section 505(b)(2) application that we submit. Any failure to obtain regulatory approval of our product candidates would eliminate our ability to generate revenues for that candidate. Any failure to obtain such approval for all of the indications and labeling claims we deem desirable could reduce our potential revenues.
The process of obtaining regulatory clearances or approvals to market a medical device can be costly and time consuming. We may not be able to obtain these clearances or approvals on a timely basis, if at all. The FDA exercises significant discretion over the regulation of combination products, including drug and device components in a combination product.
The FDA could in the future require additional regulation under the medical device provisions of the Federal Food, Drug and Cosmetic Act, or FDCA. We must comply with the Quality Systems Regulation, or QSR, which sets forth the FDA’s current good manufacturing practice, (cGMP), requirements for medical devices, and other applicable government regulations and corresponding foreign standards for drug cGMPs. If we fail to comply with these regulations, it could have a material adverse effect on our business and financial condition.
We depend on collaborators to work with us to develop, manufacture and commercialize their and our products and product candidates.
We have a license agreement with United Therapeutics Corporation to use one of our proprietary technologies in an oral formulation of treprostinil diethanolamine, or treprostinil, for the treatment of pulmonary arterial hypertension, and for other indications. United Therapeutics Corporation launched Orenitram (treprostinil) in 2014, which triggered payment of a milestone payment to us of $2.0 million. In the third quarter of 2014, we received a cash payment of $30.0 million from HealthCare Royalty Partners III, L.P.'s (HC Royalty), for the purchase of certain of our rights under our license agreement with United Therapeutics Corporation related to the commercialization of Orenitram. Ownership of the royalty rights will return to us if/when a certain cumulative threshold payment to HC Royalty is reached.
We are entitled to receive milestones and royalties for use of this formulation in indications other than arterial hypertension. If we materially breach any of our obligations under the license agreement, we could lose the right to receive any future royalty payments thereunder, which could be financially significant to us.
We have a Distribution, Development, Commercialization and Supply Agreement (Supply Agreement) with Britannia Pharmaceuticals Limited (Britannia) that grants us certain intellectual property and product rights in relation to APOKYN, including the right to use and market APOKYN in the United States. Additionally, the Supply Agreement grants Britannia certain intellectual property and product rights in relation to the APOKYN, including the right to use and market APOKYN in the rest of the world, excluding the United States. Per the Agreement, Britannia has an obligation to supply us with the APOKYN for our marketing and sale.
Britannia may terminate its obligation to supply APOKYN for cause, or at any time, by giving at least twenty-four (24) months’ written notice. The Supply Agreement does not provide for technology transfer assistance from Britannia to any new suppliers we might engage following termination. In addition, the Supply Agreement is silent in providing us with an explicit license grant to any intellectual property, or to access know-how necessary or useful for manufacturing APOKYN. If we materially breach the Supply Agreement, or Britannia chooses to terminate the Supply Agreement for convenience, we could lose the right and resources necessary for the manufacture of APOKYN, or could incur significant costs implementing technology transfer assistance.
We intend to rely on third-party collaborators to market and commercialize our products and product candidates outside the U.S.. We utilize strategic partners outside the U.S., where appropriate, to assist in the commercialization of our products and product candidates. We currently possess limited resources, and may not be successful in establishing collaborations or licensing arrangements on acceptable terms, if at all. We also face competition in our search for collaborators and licensing partners. By entering into strategic collaborations or similar arrangements, we rely on third parties to financially support their local operations, including support required for development, commercialization, sales, marketing and consequentlyregulatory activities, as well as expertise in each of those subject areas.
Our future collaboration agreements may limit the areas of research and development that we may pursue, either alone or in collaboration with third parties. Much of the potential revenues from these future collaborations may consist of contingent payments, such as payments for achieving certain development milestones, and royalties payable on product sales. The milestones and royalty revenues that we may receive under these collaborations will depend upon our collaborators' ability to successfully develop, introduce, market and sell new products. Future collaboration partners may fail to develop or effectively commercialize products, product candidates or technologies because they, among other things, may:
•Change the focus of their development and commercialization efforts, or may have insufficient resources to effectively develop our product candidates;
•Pharmaceutical and biotechnology companies historically have re-evaluated their development and commercialization priorities following mergers and consolidations, which have been common in recent years. The ability of some of our product candidates to reach their potential could be limited if our future collaborators fail to apply sufficient development or commercialization efforts related to those product candidates;
•Decide not to devote the necessary resources due to internal constraints, such as limited personnel with the requisite scientific expertise, limited cash resources, or in the belief that other internal drug development programs may have a higher likelihood of obtaining marketing approval, or may potentially generate a greater return on investment;
•Develop and commercialize, either alone or with others, drugs that are similar to or competitive with the product candidates that are the subject of their collaboration with us;
•Not have necessary and sufficient resources to develop the product candidate through clinical development, marketing approval and commercialization;
•Fail to comply with applicable regulatory requirements;
•Are unable to obtain the necessary marketing approvals; or
•Breach or terminate their arrangement with us.
If collaboration partners fail to develop or fail to effectively commercialize our products for any of these reasons, we may not be able to replace the collaboration partner with another partner to develop and commercialize the product under the terms of the collaboration, if at all. Further, even if we are able to replace the collaboration partner, we may not be able to do so on commercially favorable terms. As a result, the development and commercialization of the affected product or product candidate could be delayed, impaired, or terminated because we may not have sufficient financial resources or capabilities to continue development and commercialization of the product candidate on our own. Failure of our third-party collaborators to successfully market and commercialize our products or product candidates within and outside the U.S. could materially diminish our revenues and harm our results of operations.
Our products and product candidates may cause undesirable side effects or have other characteristics that limit their commercial potential, delay, or prevent their regulatory approval.
Undesirable side effects caused by any of our product candidates could cause us or regulatory authorities to interrupt, delay or halt development. This could result in the denial of regulatory approval by the FDA or other regulatory authorities, and result in potential product liability claims. Undesirable side effects caused by any of our products could cause regulatory authorities to temporarily or permanently halt product sales, which could have a material adverse impacteffect on our anticipated revenue, earningsbusiness.
Immediate release oxcarbazepine and liquidity.topiramate products, which use the same APIs as Oxtellar XR and Trokendi XR, are known to cause various side effects, including but not limited to: dizziness; paresthesia; headaches and cognitive deficiencies such as memory loss and speech impediment; digestive problems; somnolence; double vision; gingival enlargement; nausea; weight gain; oral malformation birth defects; visual field defects; infants small for gestational age; and fatigue. The use of Oxtellar XR and Trokendi XR may cause similar side effects as compared to their reference products, or may cause additional or different side effects.
Products that were or are currently on the market and use the same API as our product candidates, including SPN-812, and SPN-817 (dietary supplements) were known to cause various side effects, including but not limited to: drowsiness; depression; hyperactivity; euphoria; extrapyramidal reactions; nausea; headache; diarrhea; vomiting; sleep difficulties; agitation; exacerbation of anxiety; sleepiness; mouth dryness; tachycardia; constipation and urinary difficulties. The labels for those products also included precautions and warnings about, among other things: tardive dyskinesia; neuroleptic malignant syndrome; elevation of prolactin levels; convulsive events in patients that are treated for or have a prior history of epilepsy; inhibition of hepatic metabolism of certain drugs; risk of suicide before antidepressant clinical improvement; need for monitoring patients with cardiac, hepatic or renal insufficiency; or patients at risk for angle-closure glaucoma. The use of SPN-812, and SPN-817 may cause similar side effects as compared to these reference products, or may cause additional or different side effects.
Botulinum toxin products, which use the same API as MYOBLOC, are known to cause various side effects due to spread of botulinum toxins from the area of injections. These may include: asthenia; generalized muscle weakness; diplopia; blurred vision; ptosis; dysphagia; dysphonia; dysarthria; urinary incontinence; and breathing difficulties. These symptoms have been reported hours to weeks after injection. Swallowing and breathing difficulties can be life threatening. There have been reports of death. The use of MYOBLOC may cause similar side effects as compared to its reference products, or may cause additional or different side effects.
If our products cause side effects, or if any of our product candidates receive marketing approval, and we or others later identify undesirable side effects caused by our products or product candidates, a number of potentially significant negative consequences could result, including:
•Regulatory authorities may withdraw approval of the product candidate or otherwise require us to take the approved product off the market;
•Regulatory authorities may require additional warnings, or a narrowing of the indication on the product label;
•We may be required to create a medication guide outlining the proper use of the medication and the risks of side effects, for distribution to patients;
•We may be required to modify the product in some way;
•Regulatory authorities may require us to conduct additional clinical trials, or costly post-marketing testing and surveillance, to monitor the safety or efficacy of the product;
•Sales of approved products may decrease significantly;
•We could be sued and be held liable for harm caused to patients; or
•Our reputation may suffer.
Any of these events could prevent us from achieving or maintaining the commercial success of our products and product candidates, and could substantially increase commercialization costs.
Item 2. Unregistered Sales of Equity Securities and Use of Proceeds
(a) Sales of Unregistered Securities.
During the three months ended March 31,June 30, 2020, the Company granted options to employees to purchase an aggregate of 1,105,92520,600 shares of common stock at a weighted-average exercise price of $23.99$23.22 per share. Once vested, the options are exercisable for a period of ten years from the grant date. In addition, the Company granted restrictedperformance stock units of 26,05515,625 shares at a weighted-average fair value grant date of $23.99 per share and performance stock units of 31,250 shares at a weighted-average fair value grant date of $23.70$18.70 per share. These issuances are exempt from registration in reliance on Section 4(a)(2) of the Securities Act as transactions not involving a public offering.
Item 3. Defaults Upon Senior Securities
None
Item 4. Mine Safety Disclosures
None
Item 5. Other Information
None
Item 6. Exhibits
The following exhibits are filed or furnished as part of this Quarterly Report on Form 10-Q:
| | | | | | | | |
31.1 2.1
| †* | | |
| | |
31.2 10.1
| †* | | |
| | |
32.1 10.2
| †* | | |
| | |
32.2 10.3
| † | | |
| | |
10110.4†*
| | The following financial information from the Company’s Quarterly Report on Form 10-QLetter Agreement Re: Memorandum of Understanding for the quarter ended March 31, 2020, formatted in Inline XBRL: (i) Cover Page, (ii) Consolidated Condensed StatementsSupply of Income, (iii) Consolidated Condensed Statements of Comprehensive Income, (iv) Consolidated Condensed Balance Sheets, (v) Consolidated Condensed Statements of Shareholders' Equity, (vi) Consolidated Condensed Statements of Cash Flows, and (vii) the Notes to Consolidated Condensed Financial Statements, tagged in summary and detail.Pens, effective February 25, 2019. |
| | |
10410.5†
| | The cover page |
| | |
| | |
| | |
| | |
| | |
| | |
| | |
| | |
| | |
| | |
Pens, effective September 23, 2019.EXHIBIT INDEX
| | | | | | | | |
Number | | Description |
| | |
| 31.1 | | |
| | |
| 31.2 | | |
| | |
| 32.1 | | |
| | |
| 32.2 | | |
| | |
| 101 | | The following financial information from the Company’s Quarterly Report on Form 10-Q for the quarter ended March 31,June 30, 2020, formatted in Inline XBRL: (i) Cover Page, (ii) Consolidated Condensed Statements of Income, (iii) Consolidated Condensed Statements of Comprehensive Income, (iv) Consolidated Condensed Balance Sheets, (v) Consolidated Condensed Statements of Shareholders' Equity, (vi) Consolidated Condensed Statements of Cash Flows, and (vii) the Notes to Consolidated Condensed Financial Statements, tagged in summary and detail.
|
| | |
| 104 | | The cover page of the Company’s Quarterly Report on Form 10-Q for the quarter ended March 31,June 30, 2020, formatted in Inline XBRL (included with the Exhibit 101 attachments). |
| | |
| | †
|
| | * Exhibits and schedules have been omitted pursuant to Regulation S-K Item 601(a)(5) and will be furnished on a supplemental basis to the Securities and Exchange Commission upon request. |
| | |
| | |
| | |
| | |
| | |
| | |
| | |
| | |
| | |
SIGNATURES
Pursuant to the requirements of the Securities Exchange Act of 1934, the registrant has duly caused this report to be signed on its behalf by the undersigned thereunto duly authorized.
| | | | | | | | |
| SUPERNUS PHARMACEUTICALS, INC. | |
| | |
DATED: May 15,August 17, 2020 | By: | /s/ Jack A. Khattar |
| | Jack A. Khattar
President, Secretary and Chief Executive Officer |
| | |
DATED: May 15,August 17, 2020 | By: | /s/ Gregory S. Patrick |
| | Gregory S. Patrick
Senior Vice President and Chief Financial Officer |