SECURITIES AND EXCHANGE COMMISSION
| |
☒ | |
| |
☒ | QUARTERLY REPORT PURSUANT TO SECTION 13 OR 15(d) OF THE SECURITIES EXCHANGE ACT OF 1934 |
For the quarterly period ended September 30, 2017
| |
☐ | |
☐ | TRANSITION REPORT PURSUANT TO SECTION 13 OR 15(d) OF THE SECURITIES EXCHANGE ACT OF 1934 |
For the transition period from to
Commission file number: 001-34774
Cboe Global Markets, Inc.
(Exact Name of Registrant as Specified in Its Charter)
Delaware | 20-5446972 |
(State or Other Jurisdiction of | |
Incorporation or Organization) | |
400 South LaSalle Street, Chicago, Illinois | |
(Address of Principal Executive Offices) | |
(312) 786-5600
(Registrant’s telephone number, including area code)
Securities registered pursuant to Section 12(b) of the Act:
|
| | | |
Title of each class: |
| Trading Symbol |
| Name of each exchange on which registered: |
Delaware
Common Stock, par value $0.01 per share | 20-5446972 |
(State or Other Jurisdiction of
| (I.R.S. Employer |
Incorporation or Organization)CBOE | Identification No.) | CboeBZX |
|
| |
400 South LaSalle Street Chicago, Illinois | 60605 |
(Address of Principal Executive Offices) | (Zip Code) |
(312) 786-5600
(Registrant's telephone number, including area code)
CBOE Holdings, Inc.
(Former name, former address and former fiscal year, if changed since last report)
Indicate by check mark whether the registrant (1) has filed all reports required to be filed by Section 13 or 15(d) of the Securities Exchange Act of 1934 during the preceding 12 months (or for such shorter period that the registrant was required to file such reports), and (2) has been subject to such filing requirements for the past 90 days. Yes ☒⌧ No ☐
◻
Indicate by check mark whether the registrant has submitted electronically and posted on its corporate Web site, if any, every Interactive Data File required to be submitted and posted pursuant to Rule 405 of Regulation S-T (§232.405 of this chapter) during the preceding 12 months (or for such shorter period that the registrant was required to submit and post such files). Yes ☒ No ☐
◻
Indicate by check mark whether the registrant is a large accelerated filer, an accelerated filer, a non-accelerated filer, or a smaller reporting company, or an emerging growth company. See the definitions of “large accelerated filer,” “accelerated filer,” and “smaller reporting company,” and “emerging growth company” in Rule 12b-2 of the Exchange Act.
| | | | | |
Large Accelerated filer | ☒ | Accelerated Filer | ◻ | Non-accelerated Filer | ◻ |
Large accelerated filer | ☒ | Accelerated filer | ☐ | | |
Smaller Reporting Company | ☐ | Emerging Growth Company | |
Non-accelerated filer☐ | ☐ | Smaller reporting company | ☐ |
If an emerging growth company, indicate by check mark if the registrant has elected not to use the extended transition period for complying with any new or revised financial accounting standards provided pursuant to Section 13(a) of the Exchange Act. ◻
Indicate by check mark whether the registrant is a shell company (as defined in Rule 12b-212b-2 of the Exchange Act).
Yes ☐ No ☒
⌧
Indicate the number of shares outstanding of each of the registrant’s classes of common stock, as of the latest practicable date:
| | |
Class | | April 24, 2020 |
Class | | October 31, 2017 |
Common Stock, par value $0.01 per share | | 113,457,824109,720,335 shares |
Throughout this document, unless otherwise specified or the context so requires:
| ● | “Cboe,” “we,” “us,” “our” or “the Company” refers to Cboe Global Markets, Inc. and its subsidiaries. |
| ● | “ADV” means average daily volume. |
| ● | “ADNV” means average daily notional value. |
| ● | “AFM” refers to the Netherlands Authority for the Financial Markets. |
| ● | “Bats Global Markets” and “Bats” refer to our wholly-owned subsidiary Bats Global Markets, Inc., now known as Cboe Bats, LLC, and its subsidiaries. |
| ● | “BYX” refers to Cboe BYX Exchange, Inc., a wholly-owned subsidiary of Cboe Global Markets, Inc. |
| ��� | “BZX” refers to Cboe BZX Exchange, Inc., a wholly-owned subsidiary of Cboe Global Markets, Inc. |
| ● | “C2” refers to Cboe C2 Exchange, Inc. a wholly-owned subsidiary of Cboe Global Markets, Inc. |
| ● | “Cboe Chi-X Europe” refers to Cboe Chi-X Europe Limited, a wholly-owned subsidiary of Cboe Global Markets, Inc. |
| ● | “Cboe Europe Equities” refers to the combined businesses of Cboe Europe and Cboe NL. |
| ● | “Cboe Europe” refers to Cboe Europe Limited, a wholly-owned subsidiary of Cboe Global Markets, Inc., the U.K. operator of our Multilateral Trading Facility (“MTF”), our Regulated Market (“RM”), and our Approved Publication Arrangement (“APA”) under its Recognized Investment Exchange (“RIE”) status. |
| ● | “Cboe FX” refers to Cboe FX Markets, LLC, a wholly-owned subsidiary of Cboe Global Markets, Inc. |
| ● | “Cboe NL” refers to Cboe Europe BV, a wholly-owned subsidiary of Cboe Global Markets, Inc., the Netherlands operator of our MTF, RM, and APA. |
| ● | “Cboe Options” refers to Cboe Exchange, Inc., a wholly-owned subsidiary of Cboe Global Markets, Inc. |
| ● | “Cboe SEF” refers to Cboe SEF, LLC, a wholly-owned subsidiary of Cboe Global Markets, Inc. |
| ● | “Cboe Trading” refers to Cboe Trading, Inc., a wholly-owned subsidiary of Cboe Global Markets, Inc., operated in the United States. |
| ● | “CFE” refers to Cboe Futures Exchange, LLC, a wholly-owned subsidiary of Cboe Global Markets, Inc. |
| ● | “CFTC” refers to the U.S. Commodity Futures Trading Commission. |
| ● | “EDGA” refers to Cboe EDGA Exchange, Inc., a wholly-owned subsidiary of Cboe Global Markets, Inc. |
| ● | “EDGX” refers to Cboe EDGX Exchange, Inc., a wholly-owned subsidiary of Cboe Global Markets, Inc. |
| ● | “ESMA” refers to the European Securities and Markets Authority. |
| ● | “Exchanges” refers to Cboe Options, C2, BZX, BYX, EDGX, and EDGA. |
| ● | “FASB” refers to the Financial Accounting Standards Board. |
| ● | “FCA” refers to the U.K. Financial Conduct Authority. |
| ● | “FINRA” refers to the Financial Industry Regulatory Authority. |
| ● | “GAAP” refers to Generally Accepted Accounting Principles in the United States. |
| ● | “Merger” refers to our acquisition of Bats Global Markets, completed on February 28, 2017. |
| ● | “OCC” refers to The Options Clearing Corporation. |
| ● | “OPRA” refers to Options Price Reporting Authority, LLC. |
| ● | “SEC” refers to the U.S. Securities and Exchange Commission. |
| ● | “SPX” refers to our S&P 500 Index exchange-traded options products. |
| ● | “TPH” refers to either a Trading Permit Holder or a Trading Privilege Holder. |
| ● | “VIX” refers to our Cboe Volatility Index exchange traded options and futures products. |
"Cboe," "we," "us," "our" or "the Company" refers to Cboe Global Markets, Inc. and its subsidiaries.3
“Bats Global Markets” and “Bats” refer to our wholly-owned subsidiary Bats Global Markets, Inc., now known as Cboe Bats, LLC, and its subsidiaries.
“BYX” refers to Cboe BYX Exchange, Inc., a wholly-owned subsidiary“BZX” refers to Cboe BZX Exchange, Inc., a wholly-owned subsidiary of Cboe Global Markets, Inc.
"C2" refers to Cboe C2 Exchange, Inc. a wholly-owned subsidiary of Cboe Global Markets, Inc.
“Cboe Chi-X Europe” refers to our broker-dealer entity, Cboe Chi-X Europe Limited, a wholly-owned subsidiary of Cboe Global Markets, Inc.,operated in the United Kingdom.
“Cboe Europe Equities” refers to Cboe Europe Limited, a wholly-owned subsidiary of Cboe Global Markets, Inc., the U.K. operator of our Multilateral Trading Facility ("MTF"), and our Regulated Market ("RM"), under its Recognized Investment Exchange ("RIE") status.
"Cboe FX" refers to our foreign currency electronic communications network that is a wholly-owned subsidiary of Cboe Global Markets, Inc. Cboe FX operates in the United States and has an additional matching engine in the United Kingdom.
"Cboe Options" refers to Cboe Exchange, Inc., a wholly-owned subsidiary of Cboe Global Markets, Inc.
"Cboe SEF" refers to Cboe SEF, LLC, our swap execution facility that is a wholly-owned subsidiary of Cboe Global Markets, Inc.
"CFE" refers to Cboe Futures Exchange, LLC, a wholly-owned subsidiary of Cboe Global Markets, Inc.
"CFTC" refers to the U.S. Commodity Futures Trading Commission.
“EDGA” refers to Cboe EDGA Exchange, Inc., a wholly-owned subsidiary of Cboe Global Markets, Inc.
“EDGX” refers to Cboe EDGX Exchange, Inc., a wholly-owned subsidiary of Cboe Global Markets, Inc.
"Exchanges" refers to Cboe Options, C2, BZX, BYX, EDGX, and EDGA.
"FASB" refers to the Financial Accounting Standards Board.
"FCA" refers to the U.K. Financial Conduct Authority.
"GAAP" refers to Generally Accepted Accounting Principles in the United States.
"Merger" refers to our acquisition of Bats Global Markets, completed on February 28, 2017.
"OCC" refers to The Options Clearing Corporation, which is the issuer and registered clearing agency for all U.S. exchange-listed options and is the designated clearing organization for futures traded on CFE.
"SEC" refers to the U.S. Securities and Exchange Commission.
"SPX" refers to our S&P 500 Index exchange-traded options products.
“Trading” refers to our broker-dealer entity, Cboe Trading, Inc., a wholly-owned subsidiary of Cboe Global Markets, Inc., operated in the United States.
"VIX" refers to the Cboe Volatility Index methodology.
TRADEMARK AND OTHER INFORMATION
Cboe®Cboe®, CFE®Cboe Global Markets®, Bats®Bats®, BZX®BYX®, BYX®BZX®, EDGX®Cboe Options Institute®, EDGA®Cboe Vest®, Cboe Volatility Index®Index®, CFE®, EDGA®, EDGX®, Hybrid®, LiveVol®, Silexx® and VIX®VIX® are registered trademarks, and Cboe Global Markets
Futures ExchangeSM, C2SM, SPXSM, and Cboe Futures ExchangeC2SM are service marks of Cboe Global Markets, Inc. and its subsidiaries. Standard & Poor's®Poor's®, S&P®&P®, S&P 100®100®, S&P 500® and S&P 500®SPX® are registered trademarks of Standard & Poor's Financial Services LLC and have been licensed for use by Cboe Exchange, Inc. Dow Jones®Jones®, Dow Jones Industrial Average®Average®, DJIA®DJIA® and Dow Jones IndexesIndices are registered trademarks or service marks of Dow Jones Trademark Holdings, LLC, used under license. MSCI, and the MSCI index names are service marks of MSCI Inc., used under license. Russell®Russell® and the Russell index names are registered trademarks of Frank Russell Company, used under license. FTSE®FTSE® and the FTSE indexesindices are trademarks and service marks of FTSE International Limited, used under license. All other trademarks and service marks are the property of their respective owners.
MSCI and the MSCI index names are service marks of MSCI Inc. (“MSCI”) or its affiliates and have been licensed for use by us. Any derivative indices and any financial products based on the derivative indices (“MCSI-Based Products”) are not sponsored, guaranteed or endorsed by MSCI, its affiliates or any other party involved in, or related to, making or compiling such MSCI index. Neither MSCI, its affiliates nor any other party involved in, or related to, making or compiling any MSCI index makes any representations regarding the advisability of investing in such MSCI-Based Products; makes any warranty, express or implied; or bears any liability as to the results to be obtained by any person or any entity from the use of any such MSCI index or any data included therein. No purchaser, seller or holder of any MSCI-Based Product, or any other person or entity, should use or refer to any MSCI trade name, trademark or service mark to sponsor, endorse, market or promote any security without first contacting MSCI to determine whether MSCI’s permission is required.
This Quarterly Report on Form 10-Q includes market share and industry data that we obtained from industry publications and surveys, reports of governmental agencies and internal company surveys. Industry publications and surveys generally state that the information they contain has been obtained from sources believed to be reliable, but we cannot assure you that this information is accurate or complete. We have not independently verified any of the data from third-party sources nor have we ascertained the underlying economic assumptions relied upon therein. Statements as to our market position are based on the most currently available market data. While we are not aware of any misstatements regarding industry data presented herein, our estimates involve risks and uncertainties and are subject to change based on various factors. We refer you to the “Risk Factors” in Part II, Item 1A of this Quarterly Report on Form 10-Q and our other filings with the SEC.
FORWARD-LOOKING STATEMENTS
This Quarterly Report on Form 10-Q contains forward-looking statements within the meaning of the Private Securities Litigation Reform Act of 1995 that involve a number of risks and uncertainties. You can identify these statements by forward-looking words such as "may," "might," "should," "expect," "plan," "anticipate," "believe," "estimate," "predict," "potential"“may,” “might,” “should,” “expect,” “plan,” “anticipate,” “believe,” “estimate,” “predict,” “potential” or "continue,"“continue,” and the negative of these terms and other comparable terminology. All statements that reflect our expectations, assumptions or projections about the future other than statements of historical fact are forward-looking statements, including statements in the "Management's“Management’s Discussion and Analysis of Financial Condition and Results of Operations"Operations” section of this report.Report. These forward-looking statements, which are subject to known and unknown risks, uncertainties and assumptions about us, may include projections of our future financial performance based on our growth strategies and anticipated trends in our business. These statements are only predictions based on our current expectations and projections about future events. There are important factors that could cause our actual results, level of activity, performance or achievements to differ materially from thatthose expressed or implied by the forward-looking statements. In particular, you should consider the risks and uncertainties described under “Risk Factors” in Part II, Item 1A of this Quarterly Report on Form 10-Q and our other filings with the SEC.
While we believe we have identified thematerial risks, that are material to us, these risks and uncertainties are not exhaustive. Moreover, we operate in a very competitive and rapidly changing environment. New risks and uncertainties emerge from time to time, and it is not possible to predict all risks and uncertainties, nor can we assess the impact of all factors on our business or the extent to which any factor, or combination of factors, may cause actual results to differ materially from those contained in any forward-looking statements.
Some factors that could cause actual results to differ include:
| ● | the impact of the novel coronavirus (“COVID-19”) pandemic including changes to trading behavior broadly in the market as well as due to the temporary suspension of open outcry trading in response to COVID-19; |
| ● | the loss of our right to exclusively list and trade certain index options and futures products; |
| ● | economic, political and market conditions; |
| ● | compliance with legal and regulatory obligations; |
| ● | price competition and consolidation in our industry; |
| ● | decreases in trading volumes, market data fees or a shift in the mix of products traded on our exchanges; |
| ● | legislative or regulatory changes; |
| ● | our ability to protect our systems and communication networks from security risks, cybersecurity risks, insider threats and unauthorized disclosure of confidential information; |
| ● | increasing competition by foreign and domestic entities; |
| ● | our dependence on and exposure to risk from third parties; |
| ● | fluctuations to currency exchange rates; |
| ● | our index providers' ability to maintain the quality and integrity of their indices and to perform under our agreements; |
| ● | our ability to operate our business without violating the intellectual property rights of others and the costs associated with protecting our intellectual property rights; |
| ● | our ability to attract and retain skilled management and other personnel; |
| ● | our ability to accommodate trading volume and transaction traffic, including significant increases, without failure or degradation of performance of our systems; |
| ● | misconduct by those who use our markets or our products; |
| ● | challenges to our use of open source software code; |
| ● | our ability to meet our compliance obligations, including managing potential conflicts between our regulatory responsibilities and our for-profit status; |
| ● | damage to our reputation; |
| ● | the ability of our compliance and risk management methods to effectively monitor and manage our risks; |
| ● | our ability to manage our growth and strategic acquisitions or alliances effectively; |
| ● | restrictions imposed by our debt obligations; |
| ● | our ability to maintain an investment grade credit rating; |
| ● | impairment of our goodwill, long-lived assets, investments or intangible assets; and |
| ● | the accuracy of our estimates and expectations. |
economic, political and market conditions;
compliance with legal and regulatory obligations;
price competition and consolidation in our industry;
decreases in trading volumes, market data fees or a shift in the mix of products traded on our exchanges;
legislative or regulatory changes;
increasing competition by foreign and domestic entities;
our dependence on and exposure to risk from third parties;
our index providers' ability to maintain the quality and integrity of their indexes and to perform under our agreements;
our ability to operate our business without violating the intellectual property rights of others and the costs associated with protecting our intellectual property rights;
our ability to attract and retain skilled management and other personnel, including those experienced with post-acquisition integration;
our ability to accommodate trading volume and transaction traffic, including significant increases, without failure or degradation of performance of our systems;
our ability to protect our systems and communication networks from security risks, including cyber-attacks and unauthorized disclosure of confidential information;
challenges to our use of open source software code;
our ability to meet our compliance obligations, including managing potential conflicts between our regulatory responsibilities and our for-profit status;
damage to our reputation;
the ability of our compliance and risk management methods to effectively monitor and manage our risks;
our ability to manage our growth and strategic acquisitions or alliances effectively;
unanticipated difficulties or expenditures relating to the Merger, including, without limitation, difficulties that result in the failure to realize expected synergies, accretion, efficiencies and cost savings from the Merger within the expected time period (if at all), whether in connection with integration, migrating trading platforms, broadening distribution of product offerings or otherwise;
restrictions imposed by our debt obligations;
our ability to maintain an investment grade credit rating;
potential difficulties in our migration of trading platforms and our ability to retain employees as a result of the Merger; and
the accuracy of our estimates and expectations.
For a detailed discussion of these and other factors that might affect our performance, see Part II, Item 1A of this Report. We do not undertake, and expressly disclaim, any duty to update any forward-looking statement whether as a result of new information, future events or otherwise, except as required by law. We caution you not to place undue reliance on the forward-looking statements, which speak only as of the date of this filing.
PART I—FINANCIAL INFORMATION
Item 1. Financial Statements.
Cboe Global Markets, Inc. and Subsidiaries
Condensed Consolidated Balance Sheets
(in millions, except par value data share and per share amounts)
|
| | | | | | | |
| | September 30, 2017 | | December 31, 2016 |
| Assets | | | |
| Current Assets: | | | |
| Cash and cash equivalents | $ | 124.8 |
| | $ | 97.3 |
|
| Financial investments | 2.4 |
| | — |
|
| Accounts receivables, net | 195.8 |
| | 76.7 |
|
| Income taxes receivable | 35.2 |
| | 53.7 |
|
| Other current assets | 16.1 |
| | 7.4 |
|
| Total Current Assets | 374.3 |
| | 235.1 |
|
| Investments | 83.2 |
| | 72.9 |
|
| Land | 4.9 |
| | 4.9 |
|
| Property and equipment, net | 77.2 |
| | 55.9 |
|
| Goodwill | 2,696.3 |
| | 26.5 |
|
| Intangible assets, net | 1,940.2 |
| | 8.7 |
|
| Other assets, net | 52.0 |
| | 72.7 |
|
| Total Assets | $ | 5,228.1 |
| | $ | 476.7 |
|
| Liabilities, Redeemable Noncontrolling Interests and Stockholders’ Equity | | | |
| Current Liabilities: | | | |
| Accounts payable and accrued liabilities | $ | 140.4 |
| | $ | 82.4 |
|
| Section 31 fees payable | 25.4 |
| | 4.4 |
|
| Deferred revenue | 11.4 |
| | 3.1 |
|
| Income taxes payable | 4.2 |
| | — |
|
| Contingent consideration liability | 56.6 |
| | — |
|
| Total Current Liabilities | 238.0 |
| | 89.9 |
|
| | | | |
| Long-term debt | 1,312.4 |
| | — |
|
| Income tax liability | 67.2 |
| | 52.1 |
|
| Deferred income taxes | 715.7 |
| | — |
|
| Other non-current liabilities | 7.5 |
| | 4.2 |
|
| Commitments and Contingencies |
| |
|
| | | | |
| Redeemable Noncontrolling Interest | 9.4 |
| | 12.6 |
|
| | | | |
| Stockholders’ Equity: | | | |
| Preferred stock, $0.01 par value: 20,000,000 shares authorized, no shares issued and outstanding at September 30, 2017 and December 31, 2016 | — |
| | — |
|
| Common stock, $0.01 par value: 325,000,000 shares authorized, 125,332,691 and 113,457,824 shares issued and outstanding, respectively at September 30, 2017 and 92,950,065 and 81,285,307 shares issued and outstanding, respectively at December 31, 2016 | 1.2 |
| | 0.9 |
|
| Treasury stock, at cost: 11,874,867 shares at September 30, 2017 and 11,664,758 shares at December 31, 2016 | (550.2 | ) | | (532.2 | ) |
| Additional paid-in capital | 2,610.0 |
| | 139.2 |
|
| Retained earnings | 766.9 |
| | 710.8 |
|
| Accumulated other comprehensive income (loss), net | 50.0 |
| | (0.8 | ) |
| Total Stockholders’ Equity | 2,877.9 |
| | 317.9 |
|
| Total Liabilities, Redeemable Noncontrolling Interest and Stockholders’ Equity | $ | 5,228.1 |
| | $ | 476.7 |
|
| | | | | | | |
| | March 31, | | December 31, | |
| | 2020 | | 2019 | |
Assets | | | | | | |
Current assets: | | | | | | | |
Cash and cash equivalents | | $ | 165.2 | | $ | 229.3 | |
Financial investments | | | 43.6 | | | 71.0 | |
Accounts receivable, net of $1.2 allowance for credit losses at March 31, 2020 and $0.7 at December 31, 2019 | | | 396.5 | | | 234.7 | |
Income taxes receivable | | | 11.5 | | | 56.8 | |
Other current assets | | | 15.3 | | | 15.8 | |
Total current assets | | | 632.1 | | | 607.6 | |
| | | | | | | |
Investments | | | 62.3 | | | 61.2 | |
Property and equipment, net | | | 70.7 | | | 47.0 | |
Property held for sale | | | 21.1 | | | 21.1 | |
Operating lease right of use assets | | | 114.0 | | | 53.4 | |
Goodwill | | | 2,725.4 | | | 2,682.1 | |
Intangible assets, net | | | 1,555.5 | | | 1,589.9 | |
Other assets, net | | | 56.4 | | | 51.6 | |
Total assets | | $ | 5,237.5 | | $ | 5,113.9 | |
Liabilities and Stockholders’ Equity | | | | | | | |
Current liabilities: | | | | | | | |
Accounts payable and accrued liabilities | | $ | 208.1 | | $ | 171.9 | |
Section 31 fees payable | | | 129.1 | | | 99.0 | |
Deferred revenue | | | 17.2 | | | 4.5 | |
Income taxes payable | | | 2.9 | | | 4.0 | |
Current portion of contingent consideration liability | | | 0.8 | | | 2.2 | |
Total current liabilities | | | 358.1 | | | 281.6 | |
| | | | | | | |
Long-term debt | | | 868.1 | | | 867.6 | |
Unrecognized tax benefits | | | 142.1 | | | 135.9 | |
Deferred income taxes | | | 392.2 | | | 399.7 | |
Non-current operating lease liabilities | | | 128.3 | | | 46.7 | |
Contingent consideration liabilities | | | 16.7 | | | — | |
Other non-current liabilities | | | 21.9 | | | 26.8 | |
Total liabilities | | | 1,927.4 | | | 1,758.3 | |
Commitments and contingencies | | | | | | | |
| | | | | | | |
Stockholders’ equity: | | | | | | | |
Preferred stock, $0.01 par value: 20,000,000 shares authorized, 0 shares issued and outstanding at March 31, 2020 and December 31, 2019 | | | — | | | — | |
Common stock, $0.01 par value: 325,000,000 shares authorized, 125,944,478 and 109,719,823 shares issued and outstanding, respectively at March 31, 2020 and 125,701,889 and 110,656,892 shares issued and outstanding, respectively at December 31, 2019 | | | 1.2 | | | 1.2 | |
Common stock in treasury, at cost, 16,224,655 shares at March 31, 2020 and 15,044,997 shares at December 31, 2019 | | | (1,020.5) | | | (887.1) | |
Additional paid-in capital | | | 2,699.7 | | | 2,691.3 | |
Retained earnings | | | 1,629.6 | | | 1,512.6 | |
Accumulated other comprehensive income, net | | | 0.1 | | | 37.6 | |
Total stockholders’ equity | | | 3,310.1 | | | 3,355.6 | |
Total liabilities and stockholders’ equity | | $ | 5,237.5 | | $ | 5,113.9 | |
See accompanying notes to condensed consolidated financial statements.
Cboe Global Markets, Inc. and Subsidiaries
Condensed Consolidated Statements of Income
(in millions, except per share data)
|
| | | | | | | | | | | | | | | |
| | Three Months Ended
September 30, | | Nine Months Ended
September 30, |
| | 2017 | | 2016 | | 2017 | | 2016 |
| Revenues: | | | | | | | |
| Transaction fees | $ | 423.3 |
| | $ | 124.5 |
| | $ | 1,133.6 |
| | $ | 378.3 |
|
| Access fees | 30.1 |
| | 13.0 |
| | 77.6 |
| | 39.4 |
|
| Exchange services and other fees | 20.0 |
| | 11.4 |
| | 55.3 |
| | 34.2 |
|
| Market data fees | 46.8 |
| | 8.3 |
| | 117.3 |
| | 24.5 |
|
| Regulatory fees | 83.5 |
| | 9.1 |
| | 205.1 |
| | 27.4 |
|
| Other revenue | 7.7 |
| | 2.4 |
| | 19.5 |
| | 8.5 |
|
| Total Revenues | 611.4 |
| | 168.7 |
| | 1,608.4 |
| | 512.3 |
|
| Cost of Revenues: | | | | | | | |
| Liquidity payments | 234.3 |
| | 9.5 |
| | 606.1 |
| | 23.2 |
|
| Routing and clearing | 9.4 |
| | 3.6 |
| | 27.9 |
| | 7.9 |
|
| Section 31 fees | 75.9 |
| | — |
| | 180.5 |
| | — |
|
| Royalty fees | 22.1 |
| | 19.4 |
| | 63.9 |
| | 57.8 |
|
| Total Cost of Revenues | 341.7 |
| | 32.5 |
| | 878.4 |
| | 88.9 |
|
| Revenues Less Cost of Revenues | 269.7 |
| | 136.2 |
| | 730.0 |
| | 423.4 |
|
| Operating Expenses: | | | | | | | |
| Compensation and benefits | 50.4 |
| | 28.3 |
| | 148.2 |
| | 83.9 |
|
| Depreciation and amortization | 55.4 |
| | 10.2 |
| | 136.3 |
| | 34.4 |
|
| Technology support services | 11.4 |
| | 5.6 |
| | 30.9 |
| | 17.0 |
|
| Professional fees and outside services | 17.6 |
| | 12.7 |
| | 48.9 |
| | 41.0 |
|
| Travel and promotional expenses | 4.5 |
| | 2.6 |
| | 12.0 |
| | 7.6 |
|
| Facilities costs | 2.9 |
| | 1.3 |
| | 7.7 |
| | 4.2 |
|
| Acquisition-related costs | 5.5 |
| | 8.6 |
| | 75.4 |
| | 8.6 |
|
| Change in contingent consideration | 0.4 |
| | — |
| | 1.1 |
| | — |
|
| Other expenses | 2.3 |
| | 1.1 |
| | 6.3 |
| | 3.4 |
|
| Total Operating Expenses | 150.4 |
| | 70.4 |
| | 466.8 |
| | 200.1 |
|
| Operating Income | 119.3 |
| | 65.8 |
| | 263.2 |
| | 223.3 |
|
| Non-operating (Expenses) Income: | | | | | | | |
| Interest expense, net | (10.5 | ) | | (0.2 | ) | | (30.9 | ) | | (0.2 | ) |
| Other (expense) income | (2.9 | ) | | 1.8 |
| | (2.0 | ) | | 8.6 |
|
| Income Before Income Tax Provision | 105.9 |
| | 67.4 |
| | 230.3 |
| | 231.7 |
|
| Income tax provision | 45.6 |
| | 26.9 |
| | 86.8 |
| | 91.1 |
|
| Net income | 60.3 |
| | 40.5 |
| | 143.5 |
| | 140.6 |
|
| Net loss attributable to redeemable noncontrolling interest | 0.2 |
| | 0.3 |
| | 0.8 |
| | 0.8 |
|
| Net Income Excluding Noncontrolling Interest | 60.5 |
| | 40.8 |
| | 144.3 |
| | 141.4 |
|
| Change in redemption value of noncontrolling interest | (0.2 | ) | | (0.3 | ) | | (0.8 | ) | | (0.8 | ) |
| Net income allocated to participating securities | (0.6 | ) | | (0.2 | ) | | (1.4 | ) | | (0.6 | ) |
| Net Income Allocated to Common Stockholders | $ | 59.7 |
| | $ | 40.3 |
| | $ | 142.1 |
| | $ | 140.0 |
|
| Net Income Per Share Allocated to Common Stockholders: | | | | | | | |
| Basic earnings per share | $ | 0.53 |
| | $ | 0.50 |
| | $ | 1.35 |
| | $ | 1.72 |
|
| Diluted earnings per share | 0.53 |
| | 0.50 |
| | 1.34 |
| | 1.72 |
|
| | | | | | | | |
| Basic weighted average shares outstanding | 112.3 |
| | 81.3 |
| | 105.5 |
| | 81.5 |
|
| Diluted weighted average shares outstanding | 112.6 |
| | 81.3 |
| | 105.8 |
| | 81.5 |
|
| | | | | | | |
| | Three Months Ended March 31, | |
| | 2020 | | 2019 | |
Revenues: | | | | | | | |
Transaction fees | | $ | 661.5 | | $ | 430.4 | |
Access and capacity fees | | | 57.7 | | | 54.4 | |
Market data fees | | | 56.2 | | | 51.6 | |
Regulatory fees | | | 136.8 | | | 58.7 | |
Other revenue | | | 9.3 | | | 7.5 | |
Total revenues | | | 921.5 | | | 602.6 | |
Cost of revenues: | | | | | | | |
Liquidity payments | | | 392.4 | | | 243.7 | |
Routing and clearing | | | 16.0 | | | 9.2 | |
Section 31 fees | | | 127.4 | | | 48.2 | |
Royalty fees | | | 27.4 | | | 21.0 | |
Total cost of revenues | | | 563.2 | | | 322.1 | |
Revenues less cost of revenues | | | 358.3 | | | 280.5 | |
Operating expenses: | | | | | | | |
Compensation and benefits | | | 53.3 | | | 48.1 | |
Depreciation and amortization | | | 40.5 | | | 47.2 | |
Technology support services | | | 11.9 | | | 11.9 | |
Professional fees and outside services | | | 14.9 | | | 16.2 | |
Travel and promotional expenses | | | 2.1 | | | 2.6 | |
Facilities costs | | | 4.1 | | | 2.1 | |
Acquisition-related costs | | | 0.8 | | | 2.3 | |
Other expenses | | | 4.3 | | | 3.6 | |
Total operating expenses | | | 131.9 | | | 134.0 | |
Operating income | | | 226.4 | | | 146.5 | |
Non-operating expenses: | | | | | | | |
Interest expense, net | | | (7.3) | | | (9.9) | |
Other expense, net | | | (1.6) | | | (8.8) | |
Income before income tax provision | | | 217.5 | | | 127.8 | |
Income tax provision | | | 60.1 | | | 32.6 | |
Net income | | | 157.4 | | | 95.2 | |
Net loss attributable to redeemable noncontrolling interest | | | — | | | 0.2 | |
Net income excluding redeemable noncontrolling interest | | | 157.4 | | | 95.4 | |
Change in redemption value of redeemable noncontrolling interest | | | — | | | (0.2) | |
Net income allocated to participating securities | | | (0.4) | | | (0.6) | |
Net income allocated to common stockholders | | $ | 157.0 | | $ | 94.6 | |
Basic earnings per share | | $ | 1.42 | | $ | 0.85 | |
Diluted earnings per share | | $ | 1.42 | | $ | 0.85 | |
| | | | | | | |
Basic weighted average shares outstanding | | | 110.4 | | | 111.5 | |
Diluted weighted average shares outstanding | | | 110.6 | | | 111.7 | |
See accompanying notes to condensed consolidated financial statements.
Cboe Global Markets, Inc. and Subsidiaries
Condensed Consolidated Statements of Comprehensive Income
|
| | | | | | | | | | | | | | |
| | Three Months Ended
September 30, | | Nine Months Ended
September 30, |
| | 2017 | | 2016 | | 2017 | 2016 |
| Net Income | $ | 60.3 |
| | $ | 40.5 |
| | $ | 143.5 |
| $ | 140.6 |
|
| Foreign currency translation adjustments | 20.5 |
| | — |
| | 50.7 |
| — |
|
| Unrealized holding (losses) gains on available-for-sale investments | (0.1 | ) | | — |
| | 0.1 |
| — |
|
| Comprehensive Income | 80.7 |
| | 40.5 |
| | 194.3 |
| 140.6 |
|
| Comprehensive loss attributable to noncontrolling interest | 0.2 |
| | 0.3 |
| | 0.8 |
| 0.8 |
|
| Comprehensive Income Excluding Noncontrolling Interest | 80.9 |
| | 40.8 |
| | 195.1 |
| 141.4 |
|
| Change in redemption value of noncontrolling interest | (0.2 | ) | | (0.3 | ) | | (0.8 | ) | (0.8 | ) |
| Comprehensive income allocated to participating securities | (0.3 | ) | | (0.2 | ) | | (1.4 | ) | (0.6 | ) |
| Comprehensive Income Allocated to Common Stockholders | $ | 80.4 |
| | $ | 40.3 |
| | $ | 192.9 |
| $ | 140.0 |
|
| | | | | | | |
| | Three Months Ended March 31, | |
| | 2020 | | 2019 | |
Net income | | $ | 157.4 | | $ | 95.2 | |
Other comprehensive (loss) income, net of income tax: | | | | | | | |
Foreign currency translation adjustments | | | (37.5) | | | 14.7 | |
Comprehensive income | | | 119.9 | | | 109.9 | |
Comprehensive loss attributable to redeemable noncontrolling interest | | | — | | | 0.2 | |
Comprehensive income excluding redeemable noncontrolling interest | | | 119.9 | | | 110.1 | |
Change in redemption value of redeemable noncontrolling interest | | | — | | | (0.2) | |
Comprehensive income allocated to participating securities | | | (0.4) | | | (0.6) | |
Comprehensive income allocated to common stockholders, net of income tax | | $ | 119.5 | | $ | 109.3 | |
See accompanying notes to condensed consolidated financial statements.
Cboe Global Markets, Inc. and Subsidiaries
Condensed Consolidated StatementStatements of Changes in Stockholders’ Equity
NineThree months ended September 30, 2017
March 31, 2020 and March 31, 2019(unaudited)
(in millions, except per share amount)
| | | | | | | | | | | | | | | | | | | | | | | | | |
| | | | | | | | | | | | | | | | | Accumulated | | | | | | | |
| | | | | | | | | Additional | | | | other | | Total | | Redeemable | |
| | Preferred | | Common | | Treasury | | paid-in | | Retained | | comprehensive | | stockholders’ | | Noncontrolling | |
| | Stock | | Stock | | Stock | | capital | | earnings | | income, net | | equity | | Interest | |
Balance at December 31, 2019 | | $ | — | | $ | 1.2 | | $ | (887.1) | | $ | 2,691.3 | | $ | 1,512.6 | | $ | 37.6 | | $ | 3,355.6 | | $ | — | |
Transition adjustment for adoption of Current Expected Credit Losses standard at January 1, 2020 | | | — | | | — | | | — | | | — | | | (0.4) | | | — | | | (0.4) | | | — | |
Cash dividends on common stock of $0.36 per share | | | — | | | — | | | — | | | — | | | (40.0) | | | — | | | (40.0) | | | — | |
Stock-based compensation | | | — | | | — | | | — | | | 8.3 | | | — | | | — | | | 8.3 | | | — | |
Repurchases of common stock from employee stock plans | | | — | | | — | | | (13.9) | | | — | | | — | | | — | | | (13.9) | | | — | |
Purchase of common stock | | | — | | | — | | | (119.5) | | | — | | | — | | | — | | | (119.5) | | | — | |
Shares issued under employee stock purchase plan | | | — | | | — | | | — | | | 0.1 | | | — | | | — | | | 0.1 | | | — | |
Net income | | | — | | | — | | | — | | | — | | | 157.4 | | | — | | | 157.4 | | | — | |
Other comprehensive loss | | | — | | | — | | | — | | | — | | | — | | | (37.5) | | | (37.5) | | | — | |
Balance at March 31, 2020 | | $ | — | | $ | 1.2 | | $ | (1,020.5) | | $ | 2,699.7 | | $ | 1,629.6 | | $ | 0.1 | | $ | 3,310.1 | | $ | — | |
| | | | | | | | | | | | | | | | | | | | | | | | | |
| | | | | | | | | | | | | | | | | Accumulated | | | | | | | |
| | | | | | | | | Additional | | | | other | | Total | | Redeemable | |
| | Preferred | | Common | | Treasury | | paid-in | | Retained | | comprehensive | | stockholders’ | | Noncontrolling | |
| | Stock | | Stock | | Stock | | capital | | earnings | | income, net | | equity | | Interest | |
Balance at December 31, 2018 | | $ | — | | $ | 1.2 | | $ | (720.1) | | $ | 2,660.2 | | $ | 1,288.2 | | $ | 11.5 | | $ | 3,241.0 | | $ | 9.4 | |
Cash dividends on common stock of $0.31 per share | | | — | | | — | | | — | | | — | | | (34.8) | | | — | | | (34.8) | | | — | |
Stock-based compensation | | | — | | | — | | | — | | | 5.4 | | | — | | | — | | | 5.4 | | | — | |
Exercise of common stock options | | | — | | | — | | | — | | | 8.1 | | | — | | | — | | | 8.1 | | | — | |
Repurchases of common stock from employee stock plans | | | — | | | — | | | (10.0) | | | — | | | — | | | — | | | (10.0) | | | — | |
Purchase of common stock | | | — | | | — | | | (35.0) | | | — | | | — | | | — | | | (35.0) | | | — | |
Shares issued under employee stock purchase plan | | | — | | | — | | | 0.8 | | | — | | | — | | | — | | | 0.8 | | | — | |
Net income excluding noncontrolling interest | | | — | | | — | | | — | | | — | | | 95.4 | | | — | | | 95.4 | | | — | |
Other comprehensive income | | | — | | | — | | | — | | | — | | | — | | | 14.7 | | | 14.7 | | | — | |
Net loss attributable to redeemable noncontrolling interest | | | — | | | — | | | — | | | — | | | — | | | — | | | — | | | (0.2) | |
Redemption value adjustment of redeemable noncontrolling interest | | | — | | | — | | | — | | | — | | | (0.2) | | | — | | | (0.2) | | | 0.2 | |
Balance at March 31, 2019 | | $ | — | | $ | 1.2 | | $ | (764.3) | | $ | 2,673.7 | | $ | 1,348.6 | | $ | 26.2 | | $ | 3,285.4 | | $ | 9.4 | |
See accompanying notes to condensed consolidated financial statements.
|
| | | | | | | | | | | | | | | | | | | | | | | | | | | | | | | |
| | Preferred Stock | | Common Stock | | Treasury Stock | | Additional Paid-In Capital | | Retained Earnings | | Accumulated Other Comprehensive (Loss) Income | | Total Stockholders’ Equity | | Redeemable Noncontrolling Interests |
| Balance at December 31, 2016 | $ | — |
| | $ | 0.9 |
| | $ | (532.2 | ) | | $ | 139.2 |
| | $ | 710.8 |
| | $ | (0.8 | ) | | $ | 317.9 |
| | $ | 12.6 |
|
| Issuance of stock for acquisition of Bats Global Markets, Inc. | — |
| | 0.3 |
| | — |
| | 2,424.4 |
| | — |
| | — |
| | 2,424.7 |
| | — |
|
| Issuance of vested restricted stock granted to employees | — |
| | — |
| | (12.0 | ) | | — |
| | — |
| | — |
| | (12.0 | ) | | — |
|
| Common stock issued from employee stock plans | — |
| | — |
| | (6.0 | ) | | 4.1 |
| | — |
| | — |
| | (1.9 | ) | | — |
|
| Stock-based compensation | — |
| | — |
| | — |
| | 39.1 |
| | — |
| | — |
| | 39.1 |
| | — |
|
| Net income excluding noncontrolling interest | — |
| | — |
| | — |
| | — |
| | 144.3 |
| | — |
| | 144.3 |
| | — |
|
| Cash dividends on common stock of $0.77 per share | — |
| | — |
| | — |
| | — |
| | (87.4 | ) | | — |
| | (87.4 | ) | | — |
|
| Purchase of additional equity interest from noncontrolling interest | — |
| | — |
| | — |
| | 3.2 |
| | — |
| | — |
| | 3.2 |
| | (3.2 | ) |
| Other comprehensive income | — |
| | — |
| | — |
| | — |
| | — |
| | 50.8 |
| | 50.8 |
| | — |
|
| Net loss attributable to redeemable noncontrolling interest | — |
| | — |
| | — |
| | — |
| | — |
| | — |
| | — |
| | (0.8 | ) |
| Redemption value adjustment | — |
| | — |
| | — |
| | — |
| | (0.8 | ) | | — |
| | (0.8 | ) | | 0.8 |
|
| Balance at September 30, 2017 | $ | — |
| | $ | 1.2 |
| | $ | (550.2 | ) |
| $ | 2,610.0 |
| | $ | 766.9 |
| | $ | 50.0 |
| | $ | 2,877.9 |
| | $ | 9.4 |
|
Cboe Global Markets, Inc. and Subsidiaries
Condensed Consolidated Statements of Cash Flows
(unaudited)
(in millions)
| | | | | | | |
| | Three Months Ended March 31, | |
| | 2020 | | 2019 | |
Cash flows from operating activities: | | | | | | | |
Net income | | $ | 157.4 | | $ | 95.2 | |
Adjustments to reconcile net income to net cash provided by operating activities: | | | | | | | |
Depreciation and amortization | | | 40.5 | | | 47.2 | |
Amortization of debt issuance cost and debt discount | | | 0.5 | | | 0.6 | |
Change in fair value of contingent consideration | | | — | | | 0.8 | |
Realized gain on available-for-sale securities | | | (0.4) | | | (0.2) | |
Provision for credit losses | | | 0.7 | | | 0.3 | |
Provision for deferred income taxes | | | (3.8) | | | (5.4) | |
Stock-based compensation expense | | | 8.3 | | | 5.4 | |
Loss on disposition of property | | | — | | | 0.4 | |
Equity in investments | | | (0.5) | | | (0.5) | |
Changes in assets and liabilities: | | | | | | | |
Accounts receivable | | | (164.1) | | | 37.5 | |
Income taxes receivable | | | 45.3 | | | 30.1 | |
Other current assets | | | 0.8 | | | (4.3) | |
Other assets | | | (6.2) | | | — | |
Accounts payable and accrued liabilities | | | 37.4 | | | (67.0) | |
Section 31 fees payable | | | 30.1 | | | (32.4) | |
Deferred revenue | | | 11.4 | | | 9.7 | |
Income taxes payable | | | (0.8) | | | (1.6) | |
Unrecognized tax benefits | | | 6.2 | | | 6.3 | |
Other liabilities | | | 0.5 | | | (4.1) | |
Net cash provided by operating activities | | | 163.3 | | | 118.0 | |
Cash flows from investing activities: | | | | | | | |
Acquisitions, net of cash acquired | | | (61.6) | | | — | |
Purchases of available-for-sale financial investments | | | (24.5) | | | (29.5) | |
Proceeds from maturities of available-for-sale financial investments | | | 47.3 | | | 35.3 | |
Return of capital from investments | | | — | | | 22.0 | |
Contributions to investments | | | (1.6) | | | — | |
Purchases of property and equipment | | | (10.6) | | | (5.8) | |
Net cash (used in) provided by investing activities | | | (51.0) | | | 22.0 | |
Cash flows from financing activities: | | | | | | | |
Cash dividends paid on common stock | | | (40.0) | | | (34.8) | |
Repurchases of common stock from employee stock plans | | | (13.9) | | | (10.0) | |
Exercise of common stock options | | | — | | | 8.1 | |
Payment of contingent consideration from acquisition | | | (2.3) | | | — | |
Purchase of common stock | | | (119.5) | | | (35.0) | |
Net cash used in financing activities | | | (175.7) | | | (71.7) | |
Effect of foreign currency exchange rates on cash and cash equivalents | | | (0.7) | | | 2.8 | |
(Decrease) increase in cash and cash equivalents | | | (64.1) | | | 71.1 | |
Cash and cash equivalents: | | | | | | | |
Beginning of period | | | 229.3 | | | 275.1 | |
End of period | | $ | 165.2 | | $ | 346.2 | |
Supplemental disclosure of cash transactions: | | | | | | | |
Cash paid for income taxes | | $ | 13.5 | | $ | 2.2 | |
Cash paid for interest | | | 1.6 | | | 14.3 | |
Supplemental disclosure of noncash investing activities: | | | | | | | |
Accounts receivable acquired | | $ | 0.7 | | | — | |
Goodwill acquired | | | 60.4 | | | — | |
Intangible assets acquired | | | 20.3 | | | — | |
Accounts payable and accrued expenses assumed | | | (1.4) | | | — | |
Deferred revenue acquired | | | (1.3) | | | — | |
Contingent consideration related to acquisitions | | | (17.5) | | | — | |
See accompanying notes to condensed consolidated financial statements.
Cboe Global Markets, Inc. and Subsidiaries
Condensed Consolidated Statements of Cash Flows
(unaudited)
(in millions)
|
| | | | | | | |
| | Nine Months Ended September 30, |
| | 2017 | | 2016 |
| Cash Flows from Operating Activities: | | | |
| Net income | $ | 143.5 |
| | $ | 140.6 |
|
| Adjustments to reconcile net income to net cash provided by operating activities: | | | |
| Depreciation and amortization | 136.3 |
| | 34.4 |
|
| Amortization of debt issuance cost | 3.1 |
| | — |
|
| Change in fair value of contingent consideration | 1.1 |
| | — |
|
| Gain on settlement of contingent consideration | — |
| | (1.4 | ) |
| Realized gain on available-for-sale securities | (0.4 | ) | | — |
|
Provision for uncollectable convertible notes receivable
| 3.8 |
| | — |
|
| Provision for deferred income taxes | (6.3 | ) | | 0.4 |
|
| Stock-based compensation expense | 39.1 |
| | 10.9 |
|
| Impairment of data processing software | 14.9 |
| | — |
|
| Equity in investments | (0.3 | ) | | (0.8 | ) |
| Excess tax benefit from stock-based compensation | 7.1 |
| | — |
|
| Changes in assets and liabilities: | | | |
| Accounts receivable | (2.1 | ) | | (0.1 | ) |
| Income taxes receivable | 24.1 |
| | (24.3 | ) |
| Trading financial investment | (1.9 | ) | | — |
|
| Other prepaid expenses | (8.7 | ) | | (3.4 | ) |
| Other current assets | — |
| | 0.4 |
|
| Accounts payable and accrued liabilities | (1.1 | ) | | 8.2 |
|
| Section 31 fees payable | (122.7 | ) | | — |
|
| Deferred revenue | 3.9 |
| | 2.8 |
|
| Income taxes payable | (50.2 | ) | | (1.6 | ) |
| Income tax liability | (5.3 | ) | | 8.0 |
|
| Other liabilities | 1.0 |
| | — |
|
| Net Cash Flows provided by Operating Activities | 178.9 |
| | 174.1 |
|
| Cash Flows from Investing Activities: | | | |
| Acquisitions, net of cash acquired | (1,405.4 | ) | | (14.3 | ) |
| Purchases of available-for-sale financial investments | (89.2 | ) | | — |
|
| Proceeds from maturities of available-for-sale financial investments | 155.1 |
| | — |
|
| Investments | (4.0 | ) | | (24.6 | ) |
| Payment of contingent consideration from acquisition | — |
| | (2.0 | ) |
| Purchases of property and equipment | (26.1 | ) | | (36.4 | ) |
| Net Cash Flows used in Investing Activities | (1,369.6 | ) | | (77.3 | ) |
| Cash Flows from Financing Activities: | | | |
| Proceeds from long-term debt | 1,944.2 |
| | — |
|
| Principal payments of long term debt | (625.0 | ) | | — |
|
| Debt issuance costs | (1.3 | ) | | (4.7 | ) |
| Dividends paid | (87.4 | ) | | (58.1 | ) |
| Purchase of unrestricted stock from employees | (18.0 | ) | | (4.1 | ) |
| Proceeds from exercise of stock-based compensation | 1.8 |
| | — |
|
| Excess tax benefit from stock-based compensation | — |
| | 1.1 |
|
| Purchase of common stock under announced program | — |
| | (60.5 | ) |
| Net Cash Flows provided by (used in) Financing Activities | 1,214.3 |
| | (126.3 | ) |
| Effect of Foreign Currency Exchange Rate Changes on Cash and Cash equivalents | 3.9 |
| | — |
|
| Increase (Decrease) in Cash and Cash Equivalents | 27.5 |
| | (29.5 | ) |
| Cash and Cash Equivalents: | | | |
| Beginning of Period | 97.3 |
| | 102.3 |
|
| End of Period | $ | 124.8 |
| | $ | 72.8 |
|
| Supplemental disclosure of noncash transactions: | | | |
| Forfeiture of common stock for payment of exercise of stock options | $ | 2.3 |
| | $ | — |
|
| Supplemental disclosure of noncash investing activities: | | | |
| Accounts receivable acquired | $ | 117.8 |
| | $ | — |
|
| Financial investments | 66.0 |
| | — |
|
| Property and equipment acquired | 21.8 |
| | — |
|
| Goodwill acquired | 2,651.0 |
| | — |
|
| Intangible assets acquired | 2,000.0 |
| | — |
|
| Other assets acquired | 32.8 |
| | — |
|
| Accounts payable and accrued expenses assumed | (59.9 | ) | | — |
|
| Section 31 fees payable acquired | (143.6 | ) | | — |
|
| Deferred tax liability acquired | (720.3 | ) | | — |
|
| Other liabilities assumed | (135.5 | ) | | — |
|
| Issuance of common stock related to acquisition | (2,424.7 | ) | | — |
|
See accompanying notes to condensed consolidated financial statements.
Cboe Global Markets, Inc. and Subsidiaries
Notes to Condensed Consolidated Financial Statements (unaudited)
1. ORGANIZATION AND BASIS OF PRESENTATION
Cboe Global Markets, Inc. is one of the world’s largest exchange holding companies, offering cutting-edge trading and investment solutions to investors around the world. The Company is committed to relentlessdefining markets to benefit its participants and drive the global marketplace forward through product innovation, connecting global markets with world-classleading edge technology, and providing seamless solutions that enhance the customer experience.
trading solutions.Cboe offers trading across a diverse range of products in multiple asset classes and geographies, including options, futures, U.S. and European equities, exchange-traded products (ETPs)(“ETPs”), global foreign exchange (FX)(“FX”) and multi-asset volatility products based on the VIX Index, recognized as the world’s barometer forpremier gauge of U.S. equity market volatility.
Cboe’s trading venuessubsidiaries include the largest options exchange and the third largest stock exchange operator in the U.S. by volume andIn addition, the Company operates one of the largest equities stock exchangeexchanges by value traded in Europe. In addition, the CompanyEurope and is the second-largest stock exchange operator by volume in the U.S. and a leading market globally for ETP listings and trading.
The Company is headquartered in Chicago with offices in Kansas City, New York, London, San Francisco, Amsterdam, Singapore, Hong Kong, and Ecuador.
In October 2017, the Company changed its legal name from CBOE Holdings, Inc. to Cboe Global Markets, Inc. The amendment to effect the name change was filed and became effective with the State of Delaware on October 16, 2017.
These interim unaudited condensed consolidated financial statements have been prepared in accordance with GAAP for interim financial information and with the instructions to Form 10-Q and should be read in conjunction with the consolidated financial statements and notes thereto contained in the Company’s Annual Report on Form 10-K for the year ended December 31, 2016.
2019.The preparation of condensed consolidated financial statements in conformity with GAAP requires management to make estimates and assumptions that affect the reported amounts of assets and liabilities, disclosures of contingent assets and liabilities, valuation of redeemable noncontrolling interests and reported amounts of revenues and expenses. On an ongoing basis, management evaluates its estimates based upon historical experience, observance of trends, information available from outside sources and various other assumptions that management believes to be reasonable under the circumstances. Actual results may differ from these estimates under different conditions or assumptions.
In the opinion of management, all adjustments (consisting of normal recurring adjustments) considered necessary for a fair presentation of financial position, results of operations and cash flows at the dates and for the periods presented have been included.
The results of operations for interim periods are not necessarily indicative of the results of operations for the full year.
For those consolidated subsidiaries in which the Company'sCompany’s ownership is less than 100% and for which the Company has control over the assets and liabilities and the management of the entity, the outside stockholders'stockholders’ interest areis shown as non-controlling interests.
In 2017, the Company changed the presentation of liquidity payments to be a cost of revenues, which historically had been netted against transaction fees. noncontrolling interest.Segment information
The Company also changed the presentation of royalty fees to be a cost of revenues. The presentation of routing fees and costs were also changed. Routing fees were presented in transaction fees in total revenues and routing and clearing costs in total cost of revenues. These fees were previously presented as a net operating expense. These changes were made to conform to current presentation and the changes have been reflected in all periods presented.
Segment information
The Company previously operated as a single reportable business segment. As a result of the Bats acquisition on February 28, 2017 (Note 3), the Company is reporting fivehas 5 business segments: Options, U.S. Equities, Futures, European Equities, and
Cboe Global Markets, Inc. and Subsidiaries
Notes to Condensed Consolidated Financial Statements (unaudited)
Global FX, which is reflective of how the Company'sCompany’s chief operating decision-maker reviews and operates the business (Note 15). Thisbusiness. See Note 14 (“Segment Reporting”) for more information.
Significant Accounting Policies
With the exception of the change hasin the accounting for expected credit losses as a result of the adoption of Accounting Standards Update (“ASU”) 2016-13 (as discussed below in “Recent Accounting Pronouncements Adopted”), there have been reflectedno new or material changes to the significant accounting policies discussed in all periods presented.
the Company’s Annual Report on Form 10-K for the fiscal year ended December 31, 2019, that are of significance, or potential significance, to the Company.Accounts Receivable, net
Accounts receivable are concentrated with the Company’s member firms and market data distributors and are carried at amortized cost. The Company nets transaction fees and liquidity payments for each member firm on a monthly basis and recognizes the total owed from a member firm as accounts receivable, net, and the total owed to a member firm as accounts payable and accrued liabilities in the condensed consolidated balance sheets. On a periodic basis, management evaluates the Company’s accounts receivable and records an allowance for expected credit losses using an aging schedule. The aging schedule applies loss rates based on historical loss information and, as deemed necessary, is adjusted for differences in the nature of the receivables that exist at the reporting date from the historical period. Due to the short-term nature of the accounts receivable, changes in future economic conditions are not expected to have a significant impact on the expected credit losses.
The accounts receivable are presented net of allowance for credit losses on the condensed consolidated balance sheets and the associated losses are presented in other operating expenses on the condensed consolidated statements of income.
Recent Accounting Pronouncements - Adopted
In the first quarter of 2017, the Company adopted Accounting Standards Update (ASU) 2014-09,
Revenue from Contracts with Customers (Topic 606). Under the ASU, revenue is recognized when a customer obtains control of promised goods or services in an amount that reflects the consideration the entity expects to receive in exchange for those goods or services. In addition, the standard requires disclosure of the nature, amount, timing, and uncertainty of revenue and cash flows arising from contracts with customers. The Company applied the five-step method outlined in the ASU to all revenue streams and elected the full retrospective implementation method. The additional disclosures required by the ASU have been included in Note 2.
In the first quarter of 2017, the Company adopted ASU 2016-09, Compensation — Stock Compensation. This ASU simplifies several aspects of the accounting for stock-based payment transactions, including the recognition of excess tax benefits and deficiencies, the classification of those excess tax benefits on the statement of cash flows, an accounting policy election for forfeitures, the amount an employer can withhold to cover income taxes and still qualify for equity classification and the classification of those taxes paid on the statement of cash flows. The Company has chosen to use the actual forfeiture rate and applied the prospective transition method for excess tax benefits and employees taxes paid. As of the adoption date,the Company did not have any awards classified as a liability under the previous guidance.
In the first quarter of 2017, the Company adopted ASU 2016-16, Accounting for Income Taxes:Intra-Entity Transfers of Assets other than Inventory. The ASU requires that the income tax impact of intra-entity sales and transfers of property, except for inventory, be recognized when the transfer occurs. The Company applied the full retrospective application which did not result in any impact to the financial statements.
Recent Accounting Pronouncements - Issued, not yet Adopted
In May 2017,June 2016, the FASB issued ASU 2017-09, Compensation - Stock Compensation (Topic 718)2016-13, Credit Losses. This update replaces the incurred loss impairment methodology in GAAP with a methodology that provides additional guidance aroundrequires management to estimate an expected lifetime credit loss on financial assets. This includes accounts receivable and notes receivable, which changes to a share-based payment award requires an entity to apply modification accounting. Specifically, an entity is to accountincluded in other assets, net on the condensed consolidated balance sheets. The update also amends the impairment model for the effects of a modification, unless all of the following are satisfied: (1) the fair value (or calculated value or intrinsic value, if such an alternative measurement method is used) of the modified award is the same as the fair value (or calculated value or intrinsic value, if such an alternative measurement method is used) of the original award immediately before the original award is modified; (2) the vesting conditions of the modified award are the same as the vesting conditions of the original award immediately before the original award is modified; and (3) the classification of the modified award as an equity instrument or as a liability instrument is the same as the classification of the original award immediately before the original award is modified. For public entities, the update is effective beginning after December 15, 2017. Early adoption is permitted.available-for-sale debt securities. The Company isforward-looking expected lifetime credit loss model generally will result in the processearlier recognition of evaluating this guidance and assessing the impact the ASU could have on the consolidated financial statements.
In March 2017, the FASB issued ASU 2017-07, Compensation - Retirement Benefits (Topic 715). This ASU requires an employer to report the service cost component in the same line item or items as other compensation costs arising from services rendered by the pertinent employees during the period. The other components are required to be presented in the income statement separately from the service cost component and outside a subtotal of income from operations. For public entities, the update is effective beginning after December 15, 2017. Early adoption is permitted. The Company is in the process of evaluating this guidance and assessing the impact the ASU could have on the consolidated financial statements.
In January 2017, the FASB issued ASU 2017-01, Business Combinations (Topic 805)-Clarifying the Definition of a Business. ASU No. 2017-01 clarifies the definition of a business with the objective of adding guidance to assist entities with evaluating whether transactions should be accounted for as acquisitions (or disposals) of assets or businesses. There are three elements of a business: inputs, processes, and outputs. While an integrated set of assets and activities (collectively, a “set”) that is a business usually has outputs, outputs are not required to be present. Additionally, all of the inputs and processes that a seller uses in operating a set are not required if market participants can acquire the set and continue to produce outputs. ASU No. 2017-01 provides a screen to determine when a set is not a business. The screen requires that when substantially all of the fair value of the gross assets acquired (or disposed of) is concentrated in a single identifiable asset or a group of similar identifiable assets, the set
Cboe Global Markets, Inc. and Subsidiaries
Notes to Condensed Consolidated Financial Statements (unaudited)
is not a business. This screen reduces the number of transactions that need to be further evaluated. If, however, the screen is not met, then the amendments in this ASU (1) require that to be considered a business, a set must include, at a minimum, an input and a substantive process that together significantly contribute to the ability to create output and (2) remove the evaluation of whether a market participant could replace missing elements. Finally, the amendments in this ASU narrow the definition of the term “output” so that it is consistent with the manner in which outputs are described in Topic 606 - Revenue from Contracts with Customers.credit losses. For public entities, the update is effective for annual or anyfiscal years and interim goodwill impairment tests inperiods within those fiscal years, beginning after December 15, 2018. Early2019, with early adoption is permitted under certain circumstances.permitted. The Company isadopted this ASU on January 1, 2020 using the modified retrospective approach and will not restate comparative periods. Upon the adoption of the standard, the Company recognized an immaterial cumulative-effect adjustment to retained earnings for the expected lifetime credit loss on the financial instruments within the scope of the standard, including accounts receivable, net. Based on the Company’s high turnover and collectability of accounts receivable, as well as the monthly billing process for the majority of revenue, there was not a significant variance in the processrecognized loss between the incurred loss impairment methodology under the prior standard and the expected lifetime credit loss model under this ASU. The financial instruments other than accounts receivable, net that are within the scope of evaluating this guidancethe standard were not materially impacted by the standard. The impact to the condensed consolidated balance sheets was immaterial in nature and assessingthere was no impact to the impact the ASU could have on thecondensed consolidated financial statements.
statements of income and cash flows.In January 2017,August 2018, the FASB issued ASU 2017-04,
Intangibles-Goodwill and Other2018-13, Fair Value Measurement (Topic 350): Simplifying820) - Disclosure Framework - Changes to the TestDisclosure Requirements for Goodwill Impairment. Fair Value Measurement. This ASU simplifies the manner in which an entity is requiredremoves certain disclosure requirements related to test goodwill for impairment by eliminating Step 2 from the goodwill impairment test. Step 2 measures a goodwill impairment loss by comparing the implied fair value of a reporting unit’s goodwill with the carrying amount of that goodwill. In computing the implied fair value of goodwill under Step 2, an entity, prior to the amendments in ASU No. 2017-04, had to perform procedures to determine the fair value hierarchy, modifies existing disclosure requirements related to measurement uncertainty and adds new disclosure requirements. The new disclosure requirements include disclosing the changes in unrealized gains and losses for the period included in other comprehensive income for recurring Level 3 fair value measurements held at the impairment testing dateend of its assetsthe reporting period and liabilities, including unrecognized assetsthe range and liabilities, in accordance with the procedure that would be required in determining theweighted average of significant unobservable inputs used to develop Level 3 fair value of assets acquired and liabilities assumed in a business combination. However, under this ASU, an entity should (1) perform its annual or interim goodwill impairment test by comparing the fair value of a reporting unit with its carrying amount, and (2) recognize an impairment charge for the amount by which the carrying amount exceeds the reporting unit’s fair value, with the understanding that the loss recognized should not exceed the total amount of goodwill allocated to that reporting unit. Additionally, ASU No. 2017-04 removes the requirements for any reporting unit with a zero or negative carrying amount to perform a qualitative assessment and, if it fails such qualitative test, to perform Step 2 of the goodwill impairment test.measurements. For public entities, the update is effective for annual or anyfiscal years and interim goodwill impairment tests inperiods within those fiscal years, beginning after December 15, 2019. Early adoption is permitted for interim or annual goodwill impairment tests performedThe Company prospectively adopted the update on testing dates after January 1, 2017. The Company is2020, which did not result in a material impact to the process of evaluating this guidance and assessing the impact the ASU could have on thecondensed consolidated financial statements. In February 2016, the FASB
Recent Accounting Pronouncements - Issued, not yet Adopted
There are no applicable material accounting pronouncements that have been issued ASU 2016-02, Leases. This update requires a lessee to recognize on the balance sheet a liability to make lease payments and a corresponding right-of-use asset. The guidance also requires certain qualitative and quantitative disclosures about the amount, timing and uncertaintybut are not yet adopted as of cash flows arising from leases. This update is effective for annual and interim periods beginning after December 15, 2018. Early adoption is permitted. The Company is in the process of evaluating this guidance and assessing the impact the ASU could have on the consolidated financial statements.
In September 2016, the FASB issued ASU 2016-15, Statement of Cash Flows (Topic 230) — Classification of Certain Cash Receipts and Cash Payments (a consensus of the FASB Emerging Issues Task Force). ASU No. 2016-15 addresses eight specific cash flow issues in an effort to reduce diversity in practice: (1) debt prepayment or debt extinguishment costs; (2) settlement of zero-coupon bonds; (3) contingent consideration payments made after a business combination; (4) proceeds from the settlement of insurance claims; (5) proceeds from the settlement of corporate-owned life insurance policies, including bank-owned life insurance policies; (6) distributions received from equity method investees; (7) beneficial interests in securitization transactions; and (8) separately identifiable cash flows and application of the predominance principle. The ASU is effective for the Company for fiscal years beginning after December 15, 2017, and for the interim periods within that fiscal year. Early adoption is permitted, including adoption during an interim period. The Company is in the process of evaluating this guidance and assessing the impact the ASU could have on the consolidated financial statements.
March 31, 2020.2. REVENUE RECOGNITION
As of January 1, 2017, the Company adopted ASU 2014-09 Revenue from Contracts with Customers - Topic 606 and all subsequent ASUs that modified ASC 606. The Company has elected to apply the ASU and all related ASUs retrospectively to each prior reporting period presented. The implementation of the guidance had no material impact on the measurement or recognition of revenue of prior periods, however, additional disclosures have been added in accordance with the ASU.
TheCompany’s main types of revenue contracts are:
| ● | Transaction fees - Transaction fees represent fees charged by the Company for meeting the point-in-time performance obligation of executing a trade on its markets. These fees can be variable based on trade volume tiered discounts, however, as all tiered discounts are calculated monthly, the actual discount is recorded on a monthly basis. Transaction fees, as well as any tiered volume discounts, are calculated and billed monthly in accordance with the Company’s published fee schedules. Transaction fees are recognized across all segments. |
| ● | Access and capacity fees - Access and capacity fees represent fees assessed for the opportunity to trade, including fees for trading-related functionality across all segments, terminal and other equipment rights, maintenance services, trading floor space and telecommunications services. Facilities, systems services and other fees are generally monthly fee-based. These fees are billed monthly in accordance with the Company’s published fee schedules and recognized on a monthly basis when the performance obligations are met. All access and capacity fees associated with the trading floor are recognized over time in the Options segment, as the performance obligations are met. |
| ● | Market data fees - Market data fees represent the fees received by the Company from the U.S. tape plans and fees charged to customers for proprietary market data. Fees from the U.S. tape plans are collected monthly based on published fee schedules and distributed quarterly to the U.S. Exchanges based on a known formula. A contract for proprietary market data is entered into and charged on a monthly basis in accordance with the Company’s published fee schedules as the service is provided. Both types of market data are satisfied over time, and revenue is recognized on a monthly basis as the customer receives and consumes the benefit as the Company provides the data to meet its performance obligation. U.S. tape plan market data is recognized in the U.S. Equities and Options segments. Proprietary market data fees are recognized across all segments. |
| ● | Regulatory fees - There are 2 types of regulatory fees that the Company recognizes. The first type represents fees collected by the Company to cover the Section 31 fees charged to the Exchanges by the SEC for meeting the point-in-time performance obligation of executing a trade on its markets. The fees charged to customers are based on the fee set by the SEC per notional value of the transaction executed on the Company’s U.S. securities markets. These fees are calculated and billed monthly and are recognized in the U.S. Equities and Options segments. As the Exchanges are responsible for the ultimate payment to the SEC, the Exchanges are considered the principal in these transactions. Regulatory fees also include the options regulatory fee (“ORF”) which supports the Company’s regulatory oversight function in the Options segment, along with other miscellaneous regulatory fees, and neither can be used for non-regulatory purposes. The ORF and miscellaneous fees are recognized when the performance obligation is fulfilled. |
| ● | Other revenue - Other revenue primarily includes revenue from various licensing agreements, all fees related to the trade reporting facility operated in the European Equities segment, and revenue associated with advertisements through the Company’s websites. |
Cboe Global Markets, Inc. and Subsidiaries
Notes to Condensed Consolidated Financial Statements (unaudited)
on its published fee schedules. The Company uses these payments to improve the liquidity on its markets and therefore recognizes those payments as a cost of revenue.
Access fees - Access fees represent fees assessed for the opportunity to trade, including fees for trading-related functionality across all segments. These fees are billed monthly in accordance with the Company’s published fee schedules and recognized on a monthly basis when the performance obligation is met. There is no remaining performance obligation after revenue is recognized.
Exchange services and other fees - To facilitate trading, the Company offers technology services, terminal and other equipment rights, maintenance services, trading floor space and telecommunications services. Trading floor and equipment rights are generally on a month-to-month basis. Facilities, systems services and other fees are generally monthly fee-based, although certain services are influenced by trading volume or other defined metrics, while others are based solely on demand. All fees associated with the trading floor are recognized in the Options segment.
Market data fees - Market data fees represent the fees received by the Company from the U.S. tape plans and fees charged to customers for proprietary market data. Fees from the U.S. tape plans are collected monthly based on published fee schedules and distributed quarterly to the U.S. exchanges based on a known formula. A contract for proprietary market data is entered into and charged on a monthly basis in accordance with the Company’s published fee schedules as the service is provided. Both types of market data are satisfied over time, and revenue is recognized on a monthly basis as the customer receives and consumes the benefit as the Company provides the data. U.S. tape plan market data is recognized in the U.S. Equities and Options segments. Proprietary market data fees are recognized across all segments.
Regulatory fees- There are two types of regulatory fees that the Company recognizes. The first type represents fees collected by the Company to cover the Section 31 fees charged to the Exchanges by the SEC. The fees charged to customers are based on the fee set by the SEC per notional value of the transaction executed on the Company’s U.S. securities markets. These fees are calculated and billed monthly and are recognized in the U.S. Equities and Options segments. As the Exchanges are responsible for the ultimate payment to the SEC, the exchanges are considered the principal in these transactions. Regulatory fees also includes the options regulatory fee (ORF) which supports the Company’s regulatory oversight function in the Options segment and other miscellaneous regulatory fees.
Other revenue - Other revenueprimarily includes revenue from various licensing agreements, all fees related to the trade reporting facility operated in the European Equities segment, and revenue associated with advertisements through the Company’s website.
Cboe Global Markets, Inc. and Subsidiaries
Notes to Condensed Consolidated Financial Statements (unaudited)
All revenue recognized in the condensed consolidated statements of income statement is considered to be revenue from contracts with customers. The following table depicts the disaggregation of revenue according to product line and segment (in millions):
|
| | | | | | | | | | | | | | | | | | | | | | | | | | | |
| | | | | | | | | | | | Corporate | | |
| | | | U.S. | | | | European | | Global | | Items and | | |
| | Options | | Equities | | Futures | | Equities | | FX | | Eliminations | | Total |
| Three months ended September 30, 2017 | | | | | | | | | | | | | |
| Transaction fees | $ | 172.3 |
| | $ | 185.5 |
| | $ | 36.6 |
| | $ | 19.0 |
| | $ | 9.9 |
| | $ | — |
| | $ | 423.3 |
|
| Access fees | 14.4 |
| | 12.5 |
| | 0.4 |
| | 2.0 |
| | 0.8 |
| | — |
| | 30.1 |
|
| Exchange services and other fees | 10.0 |
| | 5.7 |
| | 2.5 |
| | 1.3 |
| | 0.5 |
| | — |
| | 20.0 |
|
| Market data fees | 10.0 |
| | 33.1 |
| | 0.8 |
| | 2.8 |
| | 0.1 |
| | — |
| | 46.8 |
|
| Regulatory fees | 13.7 |
| | 69.8 |
| | — |
| | — |
| | — |
| | — |
| | 83.5 |
|
| Other revenue | 4.4 |
| | 1.9 |
| | — |
| | 1.2 |
| | — |
| | 0.2 |
| | 7.7 |
|
| | $ | 224.8 |
| | $ | 308.5 |
| | $ | 40.3 |
| | $ | 26.3 |
| | $ | 11.3 |
| | $ | 0.2 |
| | $ | 611.4 |
|
| | | | | | | | | | | | | | |
| Timing of revenue recognition | | | | | | | | | | | | | |
| Services transferred at a point in time | $ | 190.4 |
| | $ | 257.2 |
| | $ | 36.6 |
| | $ | 20.2 |
| | $ | 9.9 |
| | $ | 0.2 |
| | $ | 514.5 |
|
| Services transferred over time | 34.4 |
| | 51.3 |
| | 3.7 |
| | 6.1 |
| | 1.4 |
| | — |
| | 96.9 |
|
| | $ | 224.8 |
| | $ | 308.5 |
| | $ | 40.3 |
| | $ | 26.3 |
| | $ | 11.3 |
| | $ | 0.2 |
| | $ | 611.4 |
|
| | | | | | | | | | | | | | |
| Three months ended September 30, 2016 | | | | | | | | | | | | | |
| Transaction fees | $ | 97.9 |
| | $ | — |
| | $ | 26.6 |
| | $ | — |
| | $ | — |
| | $ | — |
| | $ | 124.5 |
|
| Access fees | 12.8 |
| | — |
| | 0.2 |
| | — |
| | — |
| | — |
| | 13.0 |
|
| Exchange services and other fees | 9.4 |
| | — |
| | 2.0 |
| | — |
| | — |
| | — |
| | 11.4 |
|
| Market data fees | 7.6 |
| | — |
| | 0.7 |
| | — |
| | — |
| | — |
| | 8.3 |
|
| Regulatory fees | 9.1 |
| | — |
| | — |
| | — |
| | — |
| | — |
| | 9.1 |
|
| Other revenue | 2.4 |
| | — |
| | — |
| | — |
| | — |
| | — |
| | 2.4 |
|
| | $ | 139.2 |
| | $ | — |
| | $ | 29.5 |
| | $ | — |
| | $ | — |
| | $ | — |
| | $ | 168.7 |
|
Cboe Global Markets, Inc. and Subsidiaries
Notes to Condensed Consolidated Financial Statements (unaudited)
|
| | | | | | | | | | | | | | | | | | | | | | | | | | | | |
| | | | | | | | | | | | | Corporate | | |
| | | | | U.S. | | | | European | | Global | | Items and | | |
| | | Options | | Equities | | Futures | | Equities | | FX | | Eliminations | | Total |
| Nine months ended September 30, 2017 | | | | | | | | | | | | | | |
| Transaction fees | | $ | 493.7 |
| | $ | 470.5 |
| | $ | 99.3 |
| | $ | 47.0 |
| | $ | 23.1 |
| | $ | — |
| | $ | 1,133.6 |
|
| Access fees | | 40.6 |
| | 29.4 |
| | 1.4 |
| | 4.4 |
| | 1.8 |
| | — |
| | 77.6 |
|
| Exchange services and other fees | | 33.0 |
| | 13.6 |
| | 4.7 |
| | 2.9 |
| | 1.1 |
| | — |
| | 55.3 |
|
| Market data fees | | 30.9 |
| | 78.1 |
| | 1.6 |
| | 6.5 |
| | 0.2 |
| | — |
| | 117.3 |
|
| Regulatory fees | | 41.1 |
| | 164.0 |
| | — |
| | — |
| | — |
| | — |
| | 205.1 |
|
| Other revenue | | 11.7 |
| | 4.2 |
| | 0.7 |
| | 2.4 |
| | — |
| | 0.5 |
| | 19.5 |
|
| | | $ | 651.0 |
| | $ | 759.8 |
| | $ | 107.7 |
| | $ | 63.2 |
| | $ | 26.2 |
| | $ | 0.5 |
| | $ | 1,608.4 |
|
| | | | | | | | | | | | | | | |
| Timing of revenue recognition | | | | | | | | | | | | | | |
| Services transferred at a point in time | | $ | 546.5 |
| | $ | 638.7 |
| | $ | 100.0 |
| | $ | 49.4 |
| | $ | 23.1 |
| | $ | 0.5 |
| | $ | 1,358.2 |
|
| Services transferred over time | | 104.5 |
| | 121.1 |
| | 7.7 |
| | 13.8 |
| | 3.1 |
| | — |
| | 250.2 |
|
| | | $ | 651.0 |
| | $ | 759.8 |
| | $ | 107.7 |
| | $ | 63.2 |
| | $ | 26.2 |
| | $ | 0.5 |
| | $ | 1,608.4 |
|
| | | | | | | | | | | | | | | |
| | | | | | | | | | | | | | | |
| Nine months ended September 30, 2016 | | | | | | | | | | | | | | |
| Transaction fees | | $ | 302.2 |
| | $ | — |
| | $ | 76.1 |
| | $ | — |
| | $ | — |
| | $ | — |
| | $ | 378.3 |
|
| Access fees | | 38.8 |
| | — |
| | 0.6 |
| | — |
| | — |
| | — |
| | 39.4 |
|
| Exchange services and other fees | | 28.3 |
| | — |
| | 5.9 |
| | — |
| | — |
| | — |
| | 34.2 |
|
| Market data fees | | 22.2 |
| | — |
| | 2.3 |
| | — |
| | — |
| | — |
| | 24.5 |
|
| Regulatory fees | | 27.4 |
| | — |
| | — |
| | — |
| | — |
| | — |
| | 27.4 |
|
| Other revenue | | 7.9 |
| | — |
| | 0.6 |
| | — |
| | — |
| | ��� |
| | 8.5 |
|
| | | $ | 426.8 |
| | $ | — |
| | $ | 85.5 |
| | $ | — |
| | $ | — |
| | $ | — |
| | $ | 512.3 |
|
| | | | | | | | | | | | | | | | | | |
| | | | | | | | | | | | | | | | | | |
| | | | | U.S. | | | | | European | | Global | | | |
| | Options | | Equities | | Futures | | Equities | | FX | | Total |
Three Months Ended March 31, 2020 | | | | | | | | | | | | | | | | | | |
Transaction fees | | $ | 284.2 | | $ | 304.0 | | $ | 35.9 | | $ | 22.3 | | $ | 15.1 | | $ | 661.5 |
Access and capacity fees | | | 27.2 | | | 20.0 | | | 4.0 | | | 4.9 | | | 1.6 | | | 57.7 |
Market data fees | | | 17.2 | | | 34.0 | | | 1.6 | | | 3.2 | | | 0.2 | | | 56.2 |
Regulatory fees | | | 22.3 | | | 114.5 | | | — | | | — | | | — | | | 136.8 |
Other revenue | | | 5.6 | | | 1.2 | | | — | | | 2.5 | | | — | | | 9.3 |
| | $ | 356.5 | | $ | 473.7 | | $ | 41.5 | | $ | 32.9 | | $ | 16.9 | | $ | 921.5 |
Timing of revenue recognition | | | | | | | | | | | | | | | | | | |
Services transferred at a point in time | | $ | 312.1 | | $ | 419.7 | | $ | 35.9 | | $ | 24.8 | | $ | 15.1 | | $ | 807.6 |
Services transferred over time | | | 44.4 | | | 54.0 | | | 5.6 | | | 8.1 | | | 1.8 | | | 113.9 |
| | $ | 356.5 | | $ | 473.7 | | $ | 41.5 | | $ | 32.9 | | $ | 16.9 | | $ | 921.5 |
| | | | | | | | | | | | | | | | | | |
Three Months Ended March 31, 2019 | | | | | | | | | | | | | | | | | | |
Transaction fees | | $ | 173.8 | | $ | 198.9 | | $ | 24.6 | | $ | 21.1 | | $ | 12.0 | | $ | 430.4 |
Access and capacity fees | | | 26.0 | | | 19.0 | | | 3.7 | | | 4.0 | | | 1.7 | | | 54.4 |
Market data fees | | | 13.7 | | | 32.9 | | | 1.7 | | | 3.2 | | | 0.1 | | | 51.6 |
Regulatory fees | | | 14.5 | | | 43.7 | | | 0.5 | | | — | | | — | | | 58.7 |
Other revenue | | | 4.1 | | | 1.3 | | | — | | | 2.0 | | | 0.1 | | | 7.5 |
| | $ | 232.1 | | $ | 295.8 | | $ | 30.5 | | $ | 30.3 | | $ | 13.9 | | $ | 602.6 |
Timing of revenue recognition | | | | | | | | | | | | | | | | | | |
Services transferred at a point in time | | $ | 192.4 | | $ | 243.9 | | $ | 25.1 | | $ | 23.1 | | $ | 12.1 | | $ | 496.6 |
Services transferred over time | | | 39.7 | | | 51.9 | | | 5.4 | | | 7.2 | | | 1.8 | | | 106.0 |
| | $ | 232.1 | | $ | 295.8 | | $ | 30.5 | | $ | 30.3 | | $ | 13.9 | | $ | 602.6 |
Contract liabilities for the nine months ended September 30, 2017as of March 31, 2020 primarily represent prepayments of transaction fees and certain access and capacity and market data fees to the Exchanges. The revenue recognized from contract liabilities and the remaining balance is shown below (in millions):
| | | | | | | | | | | | |
| | Balance at January 1, 2020 | | Cash
Additions | | Revenue
Recognition | | Balance at
March 31, 2020 |
Liquidity provider sliding scale (1) | | $ | — | | $ | 9.6 | | $ | (2.4) | | $ | 7.2 |
Other, net | | | 4.5 | | | 13.2 | | | (7.6) | | | 10.1 |
Total deferred revenue | | $ | 4.5 | | $ | 22.8 | | $ | (10.0) | | $ | 17.3 |
|
| | | | | | | | | | | | | | | |
| | January 1, 2017 | | Cash Additions | | Revenue Recognition | | September 30, 2017 |
| Liquidity provider sliding scale (1) | $ | — |
| | $ | 12.0 |
| | $ | (9.0 | ) | | $ | 3.0 |
|
| Other, net | 3.1 |
| | 12.9 |
| | (7.6 | ) | | 8.4 |
|
| Total deferred revenue | $ | 3.1 |
| | $ | 24.9 |
| | $ | (16.6 | ) | | $ | 11.4 |
|
(1) | (1) | Liquidity providers are eligible to participate in the sliding scale program, which involves prepayment of transaction fees, and to receive reduced fees based on the achievement of certain volume thresholds within a calendar month. These transaction fees are amortized and recorded ratably as the transactions occur over the period. |
3.ACQUISITIONS
Acquisition-related costs relate to participate inacquisitions and other strategic opportunities, including the sliding scale program, which involves prepayment of transaction fees, and to receive reduced fees based on the achievement of certain volume thresholds within a calendar month. These transaction fees are amortized and recorded ratably as the transactions occur over the period.
3. ACQUISITIONS
Bats Global Markets, Inc.
On February 28, 2017, pursuant to the Agreement and Plan of Merger, dated as of September 25, 2016 (the “Merger Agreement”), by and among Cboe, Bats, CBOE Corporation, a Delaware corporation and a wholly-owned subsidiary of Cboe (“Merger Sub”), and Cboe Bats, LLC (formerly CBOE V, LLC), a Delaware limited liability company and a wholly-owned subsidiary of Cboe (“Merger LLC”), Cboe completed the merger of Merger Sub with and into Bats and the subsequent merger of Bats with and into Merger LLC. As a result of the Merger, Bats became a wholly-owned subsidiary of Cboe.
Cboe Global Markets, Inc. and Subsidiaries
Notes to Condensed Consolidated Financial Statements (unaudited)
The acquisition-date fair value of the consideration transferred totaled $4.0 billion, which consisted of the following (in millions):
|
| | | | |
| Cash | | $ | 955.5 |
|
| Common stock issued | | 2,387.3 |
|
| Equity awards issued | | 37.4 |
|
| | | 3,380.2 |
|
| Debt extinguished | | 580.0 |
|
| Total consideration paid | | $ | 3,960.2 |
|
As a result of the Merger, each share of voting common stock of Bats, par value of $0.01 per share (“Bats Voting Common Stock”), and each share of non-voting common stock of Bats, par value of $0.01 per share (“Bats Non-Voting Common Stock” and, together with the Bats Voting Common Stock, “Bats Common Stock”), issued and outstanding immediately prior to the effective time of the Merger (the “Effective Time”) (other than shares held by Cboe, Bats or any of their respective subsidiaries, shares held by any holder of Bats Common Stock who was entitled to demand and properly demanded appraisal of such shares under Delaware law and unvested restricted shares of Bats Common Stock granted under any Bats equity incentive plan (all such shares described in this parenthetical, “Excluded Shares”)) was converted into, at the election of the holder of such share, either (i) 0.3201 of a share of common stock, par value of $0.01 per share, of Cboe (“Cboe Common Stock”) and $10.00 in cash (the “Mixed Consideration”), (ii) $14.99 in cash and 0.2577 of a share of Cboe Common Stock (the “Cash Election Consideration”) or (iii) 0.4452 of a share of Cboe Common Stock (the “Stock Election Consideration”). Pursuant to the terms of the Merger Agreement, the Cash Election Consideration and Stock Election Consideration payable in the Merger were calculated based on the volume-weighted average price (rounded to four decimal places) of shares of Cboe Common Stock on The Nasdaq Stock Market LLC for the period of ten consecutive trading days ended on February 24, 2017, which was $79.9289. The Cash Election Consideration and the Stock Election Consideration were subject to automatic adjustment, as described in the Merger Agreement and in the definitive joint proxy statement/prospectus dated December 9, 2016, filed by Cboe with the SEC on December 12, 2016, as amended and supplemented from time to time (the “Prospectus”), to ensure that the total amount of cash paid and the total number of shares of Cboe Common Stock issued in the Merger were the same as what would have been paid and issued if all holders of Bats Common Stock received the Mixed Consideration at the Effective Time.
The amounts in the table below represent the allocation of the purchase price and are subject to revision during the remainder of the measurement period, a period not to exceed twelve months from the acquisition date. Adjustments to the provisional values during the measurement period will be recorded in the reporting period in which the adjustment amounts are determined. The following table summarizes the estimated fair values of the assets acquired and liabilities assumed at the acquisition date (in millions):
|
| | | |
| Cash and cash equivalents | $ | 130.1 |
|
| Accounts receivable | 117.8 |
|
| Financial investments | 66.0 |
|
| Property and equipment | 21.8 |
|
| Other assets | 32.8 |
|
| Goodwill | 2,651.0 |
|
| Intangibles | 2,000.0 |
|
| Accounts payable | (33.7 | ) |
| Accrued expenses | (26.2 | ) |
| Section 31 fees payable | (143.6 | ) |
| Income tax payable | (52.9 | ) |
| Deferred tax liability | (720.3 | ) |
| Other liabilities | (82.6 | ) |
| | $ | 3,960.2 |
|
For tax purposes, no tax deductible goodwill was generated as a result of this acquisition. Goodwill was assigned to the Options, U.S. Equities, European Equities, and Global FX segments as further described in Note 9 and is attributable to the expansion of asset classes, broadening of geographic reach, and expected synergies of the combined workforce, products and
Cboe Global Markets, Inc. and Subsidiaries
Notes to Condensed Consolidated Financial Statements (unaudited)
technologies of the Company and Bats. The intangible assets were assigned to the Options, U.S. Equities, European Equities, and Global FX segments in the following manner and will be amortized over the following useful lives:
|
| | | | | | | | | | | | | | | | | | |
| | | | | U.S. | | European | | | | Useful life |
| (amounts in millions) | | Options | | Equities | | Equities | | Global FX | | (years) |
| Trading registrations and licenses | | $ | 95.5 |
| | $ | 572.7 |
| | $ | 171.8 |
| | $ | — |
| | indefinite |
| Customer relationships | | 37.1 |
| | 222.9 |
| | 160.0 |
| | 140.0 |
| | 20 |
| Market data customer relationships | | 53.6 |
| | 322.0 |
| | 60.0 |
| | 64.4 |
| | 15 |
| Technology | | 22.5 |
| | 22.5 |
| | 22.5 |
| | 22.5 |
| | 7 |
| Trademarks and trade names | | 1.0 |
| | 6.0 |
| | 1.8 |
| | 1.2 |
| | 2 |
| Goodwill | | 226.4 |
| | 1,738.1 |
| | 419.3 |
| | 267.2 |
| |
|
| | | $ | 436.1 |
| | $ | 2,884.2 |
| | $ | 835.4 |
| | $ | 495.3 |
| |
|
There were no goodwill or intangible assets assigned to the Futures segment as a result of this transaction as Bats did not operate a Futures business and no synergies are attributable to this segment.
The fair value of accounts receivable acquired was $117.8 million. The gross amount of accounts receivable was $118.0 million of which $0.2 million was deemed uncollectable.
Merger. The Company expensed $5.5$0.8 million of acquisition-related costs during the three months ended September 30, 2017March 31, 2020 that included $3.4$0.7 million of professional fees, and $0.1 million of compensation-related costs. The Company expensed $2.3 million of acquisition-related costs during the three months ended March 31, 2019 that included $1.3 million of compensation-related costs and $2.1$1.0 million of professional fees. These acquisition-related expenses are included in acquisition-related costs in the condensed consolidated statements of income.
The
On February 3, 2020, the Company expensed $75.4 millionpurchased Hanweck Associates, LLC (“Hanweck”) and the assets of acquisition-related costs during the nine months ended September 30, 2017 that included $36.9 millionFT Providers, LLC (“FT Options”). Hanweck and FT Options are both providers of compensation-related costs, $22.7 million of professional fees, $14.9 million of an impairment of capitalizedrisk analytics market data processing software, and $0.9 million of facilities expenses. These expenses are included in acquisition-related coststhe Company’s Options segment. Of the acquisitions’ purchase price, $60.4 million was allocated to goodwill, $20.3 million was allocated to intangible assets, and $0.4 million was allocated to working capital. In connection with these acquisitions, approximately $17.5 million in the condensed consolidated statements of income.
The amounts of revenue, operating income and net income of Bats are includedcontingent consideration related to developmental milestones has been recorded in the Company’s condensed consolidated statements of income from the acquisition date to the three and nine months ended September 30, 2017 and are as follows (in millions):
|
| | | | | | | | |
| | | | | |
| | | Three Months Ended September 30, | | Nine Months Ended September 30, |
| | 2017 | | 2017 |
| Revenue | | $ | 411.6 |
| | $ | 1,017.4 |
|
| Operating income | | 27.1 |
| | 53.7 |
|
| Net income | | 15.7 |
| | 33.7 |
|
The financial information in the table below summarizes the combined results of operations of the Company and Bats, on a pro forma basis, as though the companies had been combined as of January 1, 2016. The pro forma financial information is presented for informational purposes only and is not indicative of the results of operations that would have been achieved if the acquisition had taken place at the beginning of the period presented. Such pro forma financial information is based on the historical financial statements of the Company and Bats. This pro forma financial information is based on estimates and assumptions that have been made solely for purposes of developing such pro forma information, including, without limitation, preliminary purchase accounting adjustments. The pro forma financial information does not reflect any synergies or operating cost reductions that may be achieved from the combined operations. The pro forma financial information combines the historical results for the Company and Bats for the three months ended September 30, 2016 and nine months ended September 30, 2017 and 2016 in the following table (in millions, except per share amounts):
Cboe Global Markets, Inc. and Subsidiaries
Notes to Condensed Consolidated Financial Statements (unaudited)
|
| | | | | | | | | | |
| | Three Months Ended September 30, | Nine Months Ended September 30, |
| | 2016 | 2017 | | 2016 |
| Revenue | $ | 610.3 |
| $ | 1,881.3 |
| | $ | 1,930.9 |
|
| Operating income | 98.2 |
| 354.2 |
| | 306.1 |
|
| Net income allocated to common stockholders | 52.6 |
| 201.3 |
| | 170.1 |
|
| Earnings per share: | | | | |
| Basic | $ | 0.47 |
| $ | 1.79 |
| | $ | 1.51 |
|
| Diluted | $ | 0.47 |
| $ | 1.79 |
| | $ | 1.51 |
|
The supplemental 2017 and 2016 pro forma amounts have been calculated after applying the Company's accounting policies and adjusting the results to reflect the additional amortization that would have been charged assuming the adjusted fair values of acquired intangible assets had been applied on January 1, 2017 and on January 1, 2016. The supplemental 2017 pro forma financial information includes pro forma adjustments of $61.7 million for acquisition-related costs, such as fees to investment bankers, attorneys, accountants and other professional advisors, as well as severance to employees.
Subsequent to the Bats acquisition, the Company determined that certain employees' positions were redundant. As such, the Company communicated employee termination benefits to these employees.
The following is a summary of the employee termination benefits recognized within acquisition costs in the Corporate Items and Eliminations unit in the condensed consolidated statements of income (in millions):
|
| | | |
| | Employee Termination Benefits |
| Balance at December 31, 2016 | $ | 0.4 |
|
| Termination benefits accrued | 20.7 |
|
| Termination payments made | (19.7 | ) |
| Balance at September 30, 2017 | $ | 1.4 |
|
Cboe Global Markets, Inc. and Subsidiaries
Notes to Condensed Consolidated Financial Statements (unaudited)
5. INVESTMENTS
As of September 30, 2017March 31, 2020 and December 31, 2016,2019, the Company'sCompany’s investments were comprised of the following (in millions):
|
| | | | | | | |
| | September 30, 2017 | | December 31, 2016 |
| Equity Method: | | | |
| Investment in Signal Trading Systems, LLC | $ | 13.4 |
| | $ | 12.4 |
|
| Investment in EuroCCP | 9.2 |
| | — |
|
| Total equity method investments | 22.6 |
| | 12.4 |
|
| | | | |
| Cost Method: | | | |
| Investment in OCC | 30.3 |
| | 30.3 |
|
| Other cost method investments | 30.3 |
| | 30.2 |
|
| Total cost method investments | 60.6 |
| | 60.5 |
|
| | | | |
| Total Investments | $ | 83.2 |
| | $ | 72.9 |
|
| | | | | | |
| | March 31, | | December 31, |
| | 2020 | | 2019 |
Equity Method Investments: | | | | | | |
Investment in Signal Trading Systems, LLC | | $ | 13.5 | | $ | 12.6 |
Investment in EuroCCP | | | 9.8 | | | 10.3 |
Total equity method investments | | | 23.3 | | | 22.9 |
| | | | | | |
Other Equity Investments: | | | | | | |
Investment in Eris Exchange Holdings, LLC | | | 20.8 | | | 20.8 |
Investment in American Financial Exchange, LLC | | | 8.6 | | | 8.6 |
Investment in Cboe Vest Financial Group, Inc. | | | 2.9 | | | 2.9 |
Investment in OCC | | | 0.3 | | | 0.3 |
Other equity investments | | | 6.4 | | | 5.7 |
Total other equity investments | | | 39.0 | | | 38.3 |
| | | | | | |
Total investments | | $ | 62.3 | | $ | 61.2 |
Equity Method
InvestmentsEquity method investments include investments in Signal Trading Systems, LLC, ("Signal")a 50% joint venture with FlexTrade System, Inc. to develop and market a multi-asset front-end order entry system, and EuroCCP, a Dutch domiciled clearing house. EuroCCP is one of three3 interoperable central counterparties, or CCPs, used to clear trades conducted on Cboe Europe Equities'Limited’s and Cboe Europe NL’s markets. Cboe Europe EquitiesLimited owns 20% of EuroCCP and can exercise significant influence over the entity as an equal shareholder with four4 other investors.
Cost Method
As announced on December 10, 2019, the Company plans to acquire the remaining 80% interest in EuroCCP. The closing of the transaction is subject to various conditions, including the receipt of regulatory approvals. As a result, the timing of the closing is uncertain but the Company presently anticipates a closing in the second quarter of 2020.Other Equity Investments
The carrying amount of cost methodother equity investments totaled $60.6$39.0 million as of September 30, 2017March 31, 2020 and $60.5$38.3 million as of December 31, 2016,2019, respectively, and is included in investments in the condensed consolidated balance sheets. The Company accounts for these investments using the cost-method of accountingmeasurement alternative primarily as a result of the Company'sCompany’s inability to exercise significant influence as the Company is a smaller shareholder of these investments.investments and without readily determinable fair values. As of September 30, 2017, cost methodMarch 31, 2020, other equity investments primarily reflect a 20% investment in OCC and minority investments in American Financial Exchange, LLC, CurveGlobal, Cboe Vest Financial Group, Inc. (“Vest”), and Eris Exchange Holdings, LLC.
In December 2014,The Company’s contributed capital to OCC announced a newly-formed capital plan. The OCC capital plan was designed to strengthen OCC's capital base and facilitate its compliance with proposed SEC regulations for Systemically Important Financial Market Utilities ("SIFMUs") as well as international standards applicable to financial market infrastructures. On February 26, 2015, the SEC issued a notice of no objection to OCC's advance notice filing regarding the capital plan, and OCC and OCC's existing exchange stockholders, which include Cboe Options, subsequently executed agreements effecting the capital plan. Under the plan, each of OCC's existing exchange stockholders agreed to contribute its pro-rata share, based on ownership percentage, of $150 million in equity capital, which would increase OCC's shareholders' equity, and to provide its pro rata share in replenishment capital, up to a maximum of $40 million per exchange stockholder, if certain capital thresholds are breached. OCC also adopted policies under the plan with respect to fees, customer refunds, and stockholder dividends, which envision an annual dividend payment to the exchange stockholders equal to the portion of OCC's after-tax income that exceeds OCC's capital requirements after payment of refunds to OCC's clearing members (with such customer refunds generally to constitute 50% of the portion of OCC's pre-tax income that exceeds OCC's capital requirements). On March 3, 2015, in accordance with the plan, Cboe Options contributed $30 million to OCC. That contribution has been recorded under investments in the condensed consolidated balance sheets as of September 30, 2017.
On March 6, 2015, OCC informed Cboe Options that31, 2020 and December 31, 2019. Under OCC’s current capital management policy, which was approved by the SEC acting though delegated authority, had approved OCC's proposed rule filingon January 24, 2020, if OCC’s equity capital falls below certain defined thresholds, OCC can access additional capital through an operational loss fee charged to clearing members. None of OCC’s shareholders
(including Cboe Options) has any obligation to contribute capital to OCC under the capital management policy, nor does any shareholder have the right to receive dividends from OCC under such policy. As such, the Company reversed the $8.8 million OCC dividend declared in 2018, which was to be paid in 2019, in other expense, net in the condensed consolidated statement of income for the capital plan. Following petitionsthree months ended March 31, 2019.
In August 2019, the Company’s ownership in Vest was restructured, including a partial sale of its interest to reviewa third-party. As a result of the approval based on delegated authority,restructuring, the SEC conducted its own reviewCompany’s ownership and then approvedvoting interests decreased to less than 20% and less than 5%, respectively, and the proposed rule change implementing OCC's capital plan. Certain petitioners subsequently appealedCompany deconsolidated Vest and changed the SEC approval orderaccounting methodology to be in line with the other equity investments. The deconsolidation resulted in a reduction of net assets of $14.5 million and noncontrolling interest of $5.8 million, as well as recognition of $2.9 million investment for the OCC capital plan toCompany’s remaining ownership interest. Additionally, the U.S. CourtCompany recorded an interest-bearing note receivable of Appeals$3.7 million for the D.C. Circuitconsideration received from the third-party, which was recorded in other assets, net in the condensed consolidated balance sheets as of March 31, 2020 and moved to stay the SEC approval order. On February 23, 2016, the Court denied the petitioners' motion to stay. On August 8,
Cboe Global Markets, Inc. and Subsidiaries
Notes to Condensed Consolidated Financial Statements (unaudited)
2017, the Court held that the SEC’s approval order lacked reasoned decision-making sufficient to support the SEC’s conclusion that the OCC capital plan complied with applicable statutory requirements. The Court declined to vacate the SEC’s approval order or to require the unwinding of actions taken under the OCC capital plan, but instead remanded the matter to the SEC for further proceedings concerning whether that capital plan complies with those statutory requirements. Petitioners requested a stay of dividend payments to the exchange stockholders until the SEC made a final decision about the OCC capital plan, but the SEC denied that request on September 14, 2017. On that date, the SEC also established a schedule for interested parties to provide information for the SEC’s consideration on the merits of the proposed capital plan, and that schedule presently calls for the last submissions to be made by November 13, 2017.
December 31, 2019, respectively. 6.5. FINANCIAL INVESTMENTS
The Company’s financial investments with original or acquired maturities longer than three months, but that mature in less than one year from the condensed consolidated balance sheet date and any money market funds that are considered cash and cash equivalents are classified as current assets. The Company’s marketable securities are also classified as current assets andwithin financial investments. The Company’s financial investments are summarized as follows (in millions):
| | | | | | | | | | | | |
| | March 31, 2020 |
| | Cost basis | | Unrealized gains | | Unrealized losses | | Fair value |
Available-for-sale securities: | | | | | | | | | | | | |
U.S. Treasury securities | | $ | 25.2 | | $ | — | | $ | — | | $ | 25.2 |
Trading securities: | | | | | | | | | | | | |
Marketable securities (1) | | | 18.4 | | | — | | | — | | | 18.4 |
Total financial investments | | $ | 43.6 | | $ | — | | $ | — | | $ | 43.6 |
| | | | | | | | | | | | |
| | December 31, 2019 |
| | Cost basis | | Unrealized gains | | Unrealized losses | | Fair value |
Available-for-sale securities: | | | | | | | | | | | | |
U.S. Treasury securities | | $ | 47.6 | | $ | — | | $ | — | | $ | 47.6 |
Trading securities: | | | | | | | | | | | | |
Marketable securities (1) | | | 23.4 | | | — | | | — | | | 23.4 |
Total financial investments | | $ | 71.0 | | $ | — | | $ | — | | $ | 71.0 |
|
| | | | | | | | | | | | |
| | September 30, 2017 |
| Cost basis | Unrealized gains | Unrealized losses | Fair value |
| Trading securities: | | | | |
| U.S. Treasury securities | $ | 0.5 |
| $ | — |
| $ | — |
| $ | 0.5 |
|
| Other securities | 1.9 |
| — |
| — |
| 1.9 |
|
| Money market funds | 1.5 |
| — |
| — |
| 1.5 |
|
| Total | $ | 3.9 |
| $ | — |
| $ | — |
| $ | 3.9 |
|
|
| | | | | | | | | | | | |
| | December 31, 2016 |
| Cost basis | Unrealized gains | Unrealized losses | Fair value |
| Money market funds | $ | 67.5 |
| $ | — |
| $ | — |
| $ | 67.5 |
|
| Total | $ | 67.5 |
| $ | — |
| $ | — |
| $ | 67.5 |
|
| (1) | The marketable securities are primarily mutual funds maintained for non-qualified retirement and benefit plans, also referred to as deferred compensation plan assets. See Note 15 (“Employee Benefit Plans”) for more information. |
7.6. PROPERTY AND EQUIPMENT, NET
Property and equipment, net consisted of the following as of September 30, 2017March 31, 2020 and December 31, 20162019 (in millions):
| | | | | | |
| | March 31, | | December 31, |
| | 2020 | | 2019 |
Construction in progress | | $ | 26.0 | | $ | 1.2 |
Furniture and equipment | | | 166.4 | | | 164.4 |
Total property and equipment | | | 192.4 | | | 165.6 |
Less accumulated depreciation | | | (121.7) | | | (118.6) |
Property and equipment, net | | $ | 70.7 | | $ | 47.0 |
|
| | | | | | | | |
| | | September 30, | | December 31, |
| | 2017 | | 2016 |
| Construction in progress | | $ | 11.5 |
| | $ | 0.2 |
|
| Building | | 77.4 |
| | 77.0 |
|
| Furniture and equipment | | 168.2 |
| | 138.8 |
|
| Total property and equipment | | 257.1 |
| | 216.0 |
|
| Less accumulated depreciation | | (179.9 | ) | | (160.1 | ) |
| Total property and equipment, net | | $ | 77.2 |
| | $ | 55.9 |
|
Depreciation expense using the straight-line method was $7.9 million and $6.0$6.2 million for the three months ended September 30, 2017March 31, 2020 and 2016, respectively,2019, respectively.
As a result of the Merger, there is a reduction in employee workspace needed in Chicago, which led to the decision to market for sale the headquarters location. The Company classified the associated land, building, and $23.2 millioncertain furniture and $17.9 millionequipment of the headquarters location as held for sale, performed an impairment assessment, and ceased depreciation effective May 1, 2019, as the nineCompany anticipates selling the property held for sale. As of March 31, 2020, the total value of the property classified as property held for sale on the condensed consolidated balance sheet was $21.1 million. The impact of ceasing depreciation of the property held for sale did not result in a material impact to the condensed consolidated financial statements.
7. CREDIT LOSSES
Current expected credit losses are estimated for accounts receivable and notes receivable. The notes receivable included within other assets, net on the condensed consolidated balance sheets primarily relate to the consolidated audit trail (“CAT”), which involves the creation of an audit trail that strives to enhance regulators’ ability to monitor trading activity in the U.S. markets through a phased implementation. While the funding of the CAT is ultimately expected to be provided by both SROs (which includes the Exchanges) and industry members, until fee filings associated with the funding model are effective with or approved by the SEC, the funding to date has solely been provided by the SROs. The funding by the SROs has been done in exchange for promissory notes, which are expected to be repaid once such industry member fees are collected. Until the fee filings associated with the funding model are effective with or approved by the SEC, the SROs may continue to incur additional significant costs. The allowance for notes receivable credit losses associated with the CAT is calculated using a probability of default methodology. Accounts receivable represent amounts due from the Company’s member firms. The allowance for accounts receivable credit losses is calculated using an aging schedule. The following represents the changes in allowance for credit losses during the three months ended September 30, 2017 and 2016, respectively.
Cboe Global Markets, Inc. and Subsidiaries
Notes to Condensed Consolidated Financial Statements (unaudited)
March 31, 2020:
| | | | | | | | | | | | | | | |
| | Balance at January 1, 2020 | | Current period provision for expected credit losses | | Writeoffs charged against the allowance | | Recoveries collected | | Balance at March 31, 2020 |
Allowance for notes receivable credit losses | | $ | 23.4 | | $ | — | | $ | — | | $ | — | | $ | 23.4 |
Allowance for accounts receivable credit losses | | | 1.1 | | | 0.1 | | | — | | | — | | | 1.2 |
Total allowance for credit losses | | $ | 24.5 | | $ | 0.1 | | $ | — | | $ | — | | $ | 24.6 |
8. OTHER ASSETS, NET
Other assets, net consisted of the following as of September 30, 2017March 31, 2020 and December 31, 20162019 (in millions):
| | | | | | |
| | March 31, | | December 31, |
| | 2020 | | 2019 |
Software development work in progress | | $ | 0.3 | | $ | 2.6 |
Data processing software | | | 85.9 | | | 84.3 |
Less accumulated depreciation and amortization | | | (57.9) | | | (57.2) |
Data processing software, net | | | 28.3 | | | 29.7 |
Other assets (1) | | | 28.1 | | | 21.9 |
Other assets, net | | $ | 56.4 | | $ | 51.6 |
|
| | | | | | | |
| | September 30, | | December 31, |
| | 2017 | | 2016 |
| Software development work in progress | $ | 5.9 |
| | $ | 12.3 |
|
| Data processing software | 217.0 |
| | 222.6 |
|
| Less accumulated depreciation | (184.9 | ) | | (172.0 | ) |
| Data processing software, net | 38.0 |
| | 62.9 |
|
| | | | |
| Other assets (1) | 14.0 |
| | 9.8 |
|
| Data processing software and other assets, net | $ | 52.0 |
| | $ | 72.7 |
|
| (1) | At March 31, 2020 and December 31, 2019, the majority of the balance included long-term prepaid assets and notes receivable. See Note 7 (“Credit Losses”) for more information on the notes receivable included within other assets, net on the condensed consolidated balance sheets. As of March 31, 2020 and December 31, 2019, the notes receivable balance net of allowance for notes receivable credit losses was $15.3 million and $9.2 million, respectively. |
(1) At December 31, 2016, other assets included $6.2 million18
Amortization expense related to data processing software was $4.9$1.8 million and $3.7$3.5 million for the three months ended September 30, 2017March 31, 2020 and 2016, respectively, and $13.2 million and $15.1 million for the nine months ended September 30, 2017 and 2016,2019, respectively.
9. GOODWILL AND INTANGIBLE ASSETS, NET
The following table presents the details of goodwill by segment (in millions):
|
| | | | | | | | | | | | | | | | | | | | | | | | |
| | | | | U.S. | | European | | Global | | Corporate Items | | |
| | | Options | | Equities | | Equities | | FX | | and Eliminations | | Total |
| Balance as of December 31, 2016 | | $ | 7.7 |
| | $ | — |
| | $ | — |
| | $ | — |
| | $ | 18.8 |
| | $ | 26.5 |
|
| Additions | | 226.4 |
| | 1,738.1 |
| | 419.3 |
| | 267.2 |
| | — |
| | 2,651.0 |
|
| Dispositions | | (1.4 | ) | | — |
| | — |
| | — |
| | — |
| | (1.4 | ) |
| Changes in foreign currency exchange rates | | — |
| | — |
| | 20.2 |
| | — |
| | — |
| | 20.2 |
|
| Balance as of September 30, 2017 | | $ | 232.7 |
| | $ | 1,738.1 |
| | $ | 439.5 |
| | $ | 267.2 |
| | $ | 18.8 |
| | $ | 2,696.3 |
|
| | | | | | | | | | | | | | | |
| | | | U.S. | | European | | | | | | |
| | Options | | Equities | | Equities | | Global FX | | Total |
Balance as of December 31, 2019 | | $ | 239.4 | | $ | 1,740.4 | | $ | 435.1 | | $ | 267.2 | | $ | 2,682.1 |
Additions | | | 60.4 | | | — | | | — | | | — | | | 60.4 |
Changes in foreign currency exchange rates | | | — | | | — | | | (17.1) | | | — | | | (17.1) |
Balance as of March 31, 2020 | | $ | 299.8 | | $ | 1,740.4 | | $ | 418.0 | | $ | 267.2 | | $ | 2,725.4 |
Goodwill has been allocated to specific reporting units for purposes of impairment testing - Options, U.S. Equities, European Equities and Global FX. NoNaN goodwill has been allocated to Futures. Goodwill impairment testing is performed annually in the fiscal fourth quarter or more frequently if conditions exist that indicate that the asset may be impaired. The allocation of the new goodwill did not impact the existing goodwill assignment to reporting units and there are no aggregate impairments of goodwill.
The following table presents the details of the intangible assets (in millions):
|
| | | | | | | | | | | | | | | | | | | | | | | | |
| | | | | U.S. | | European | | Global | | Corporate Items | | |
| | | Options | | Equities | | Equities | | FX | | and Eliminations | | Total |
| Balance as of December 31, 2016 | | $ | 2.0 |
| | $ | — |
| | $ | — |
| | $ | — |
| | $ | 6.7 |
| | $ | 8.7 |
|
| Additions | | 209.7 |
| | 1,146.1 |
| | 416.1 |
| | 228.1 |
| | — |
| | 2,000.0 |
|
| Dispositions | | (0.2 | ) | | — |
| | — |
| | — |
| | — |
| | (0.2 | ) |
| Amortization | | (10.5 | ) | | (52.0 | ) | | (16.5 | ) | | (20.0 | ) | | (0.9 | ) | | (99.9 | ) |
| Changes in foreign currency exchange rates | | — |
| | — |
| | 31.6 |
| | — |
| | — |
| | 31.6 |
|
| Balance as of September 30, 2017 | | $ | 201.0 |
| | $ | 1,094.1 |
| | $ | 431.2 |
| | $ | 208.1 |
| | $ | 5.8 |
| | $ | 1,940.2 |
|
| | | | | | | | | | | | | | | |
| | | | U.S. | | European | | | | | | |
| | Options | | Equities | | Equities | | Global FX | | Total |
Balance as of December 31, 2019 | | $ | 166.6 | | $ | 921.4 | | $ | 363.7 | | $ | 138.2 | | $ | 1,589.9 |
Additions | | | 20.3 | | | — | | | — | | | — | | | 20.3 |
Amortization | | | (3.9) | | | (16.0) | | | (5.9) | | | (6.7) | | | (32.5) |
Changes in foreign currency exchange rates | | | — | | | — | | | (22.2) | | | — | | | (22.2) |
Balance as of March 31, 2020 | | $ | 183.0 | | $ | 905.4 | | $ | 335.6 | | $ | 131.5 | | $ | 1,555.5 |
For the three months ended September 30, 2017March 31, 2020 and 2016,2019, amortization expense was $42.8$32.5 million and $0.4 million, respectively. For the nine months ended September 30, 2017 and 2016, amortization expense was $99.9 million and $1.3
Cboe Global Markets, Inc. and Subsidiaries
Notes to Condensed Consolidated Financial Statements (unaudited)
$37.5 million, respectively. The estimated future amortization expense is $42.4$89.9 million for the remainder of 2017, $158.1 million for 2018, $137.2 million for 2019, $120.8 million for 2020, $105.6$107.9 million for 2021, and $93.4$95.4 million for 2022.
The amounts in the table below represent the preliminary allocation of the purchase price2022, $84.7 million for 2023, $63.8 million for 2024, and are subject to revision during the remainder of the measurement period, a period not to exceed 12 months from the acquisition date. Adjustments to the provisional values during the measurement period will be recorded in the reporting period in which the adjustment amounts are determined.
$53.6 million for 2025.The following tables present the categories of intangible assets as of September 30, 2017March 31, 2020 and December 31, 20162019 (in millions):
| | | | | | | | | | | | | | |
| | | | | | | | | | | | | | Weighted |
| | March 31, 2020 | | Average |
| | | | U.S. | | European | | | | | Amortization |
| | Options | | Equities | | Equities | | Global FX | | Period (in years) |
Trading registrations and licenses | | $ | 95.5 | | $ | 572.7 | | $ | 171.0 | | $ | — | | Indefinite |
Customer relationships | | | 45.9 | | | 222.9 | | | 159.3 | | | 140.0 | | 17 |
Market data customer relationships | | | 53.6 | | | 322.0 | | | 59.7 | | | 64.4 | | 12 |
Technology | | | 27.8 | | | 22.5 | | | 22.4 | | | 22.5 | | 4 |
Trademarks and tradenames | | | 11.9 | | | 6.0 | | | 1.8 | | | 1.2 | | 10 |
Accumulated amortization | | | (51.7) | | | (240.7) | | | (78.6) | | | (96.6) | | |
| | $ | 183.0 | | $ | 905.4 | | $ | 335.6 | | $ | 131.5 | | |
|
| | | | | | | | | | | | | | | | | | | | | | |
| | | | | | | | | | | | | Remaining |
| | | September 30, 2017 | | Weighted Average |
| | | | | U.S. | | European | | | | Corporate Items | | Amortization |
| | | Options | | Equities | | Equities | | Global FX | | and Eliminations | | Period (in years) |
| Trading registrations and licenses | | $ | 95.5 |
| | $ | 572.7 |
| | $ | 185.1 |
| | $ | — |
| | $ | — |
| | Indefinite |
| Customer relationships | | 37.9 |
| | 222.9 |
| | 172.4 |
| | 140.0 |
| | 3.0 |
| | 19 |
| Market data customer relationships | | 53.6 |
| | 322.0 |
| | 64.6 |
| | 64.4 |
| | — |
| | 14 |
| Technology | | 23.4 |
| | 22.5 |
| | 24.2 |
| | 22.5 |
| | 4.0 |
| | 6 |
| Trademarks and tradenames | | 1.4 |
| | 6.0 |
| | 1.9 |
| | 1.2 |
| | 1.0 |
| | 2 |
| Other | | 0.2 |
| | — |
| | — |
| | — |
| | — |
| | 2 |
| Accumulated amortization | | (11.0 | ) | | (52.0 | ) | | (17.0 | ) | | (20.0 | ) | | (2.2 | ) | |
|
| | | $ | 201.0 |
| | $ | 1,094.1 |
| | $ | 431.2 |
| | $ | 208.1 |
| | $ | 5.8 |
| | |
|
| | | | | | | | | | | | | | | | | | | | | | |
| | | | | | | | | | | | | Remaining |
| | | December 31, 2016 | | Weighted Average |
| | |
| | U.S. | | European | | | | Corporate | | Amortization |
| | | Options | | Equities | | Equities | | Global FX | | and Other | | Period (in years) |
| Trading registrations and licenses | | $ | — |
| | $ | — |
| | $ | — |
| | $ | — |
| | $ | — |
| | — |
| Customer relationships | | 0.9 |
| | — |
| | — |
| | — |
| | 3.0 |
| | 9 |
| Market data customer relationships | | — |
| | — |
| | — |
| | — |
| | — |
| | — |
| Technology | | 1.1 |
| | — |
| | — |
| | — |
| | 4.0 |
| | 4 |
| Trademarks and tradenames | | 0.4 |
| | — |
| | — |
| | — |
| | 1.0 |
| | 6 |
| Other | | 0.2 |
| | — |
| | — |
| | — |
| | — |
| | 2 |
| Accumulated amortization | | (0.6 | ) | | — |
| | — |
| | — |
| | (1.3 | ) | | |
| | | $ | 2.0 |
| | $ | — |
| | $ | — |
| | $ | — |
| | $ | 6.7 |
| | |
Table of Contents
Cboe Global Markets, Inc. and Subsidiaries
Notes to Condensed Consolidated Financial Statements (unaudited)
| | | | | | | | | | | | | | |
| | | | | | | | | | | | | | Weighted |
| | December 31, 2019 | | Average |
| | | | U.S. | | European | | | | | Amortization |
| | Options | | Equities | | Equities | | Global FX | | Period (in years) |
Trading registrations and licenses | | $ | 95.5 | | $ | 572.7 | | $ | 182.2 | | $ | — | | Indefinite |
Customer relationships | | | 38.8 | | | 222.9 | | | 169.7 | | | 140.0 | | 17 |
Market data customer relationships | | | 53.6 | | | 322.0 | | | 63.6 | | | 64.4 | | 12 |
Technology | | | 24.8 | | | 22.5 | | | 23.9 | | | 22.5 | | 4 |
Trademarks and tradenames | | | 1.7 | | | 6.0 | | | 1.9 | | | 1.2 | | 6 |
Accumulated amortization | | | (47.8) | | | (224.7) | | | (77.6) | | | (89.9) | | |
| | $ | 166.6 | | $ | 921.4 | | $ | 363.7 | | $ | 138.2 | | |
10. ACCOUNTS PAYABLE AND ACCRUED LIABILITIES
Accounts payable and accrued liabilities consisted of the following as of September 30, 2017March 31, 2020 and December 31, 20162019 (in millions):
|
| | | | | | | |
| | September 30, 2017 | | December 31, 2016 |
| |
| Compensation and benefit-related liabilities | $ | 13.9 |
| | $ | 25.1 |
|
| Termination benefits | 1.4 |
| | 0.4 |
|
| Royalties | 19.7 |
| | 17.8 |
|
| Accrued liabilities | 58.4 |
| | 25.4 |
|
| Marketing fee payable | 8.1 |
| | 7.2 |
|
| Accounts payable | 38.9 |
| | 6.5 |
|
| Total accounts payable and accrued liabilities | $ | 140.4 |
| | $ | 82.4 |
|
| | | | | | |
| | March 31, 2020 | | December 31, 2019 |
Compensation and benefit-related liabilities | | $ | 14.9 | | $ | 35.2 |
Termination benefits | | | 1.2 | | | 6.7 |
Royalties | | | 24.9 | | | 18.6 |
Accrued liabilities | | | 143.7 | | | 77.8 |
Marketing fee payable | | | 14.2 | | | 12.6 |
Accounts payable | | | 9.2 | | | 21.0 |
Total accounts payable and accrued liabilities | | $ | 208.1 | | $ | 171.9 |
The Company's long-termCompany’s debt consisted of the following as of September 30, 2017March 31, 2020 and December 31, 20162019 (in millions):
|
| | | | | | | | |
| | | September 30, | | December 31, |
| | | 2017 | | 2016 |
| Term Loan Agreement | | $ | 369.6 |
| | $ | — |
|
| 3.650% Senior Notes | | 643.8 |
| | — |
|
| 1.950% Senior Notes | | 299.0 |
| | — |
|
| Revolving Credit Agreement | | — |
| | — |
|
| Total long-term debt | | $ | 1,312.4 |
| | $ | — |
|
In connection with the Merger, on December 15, 2016, the Company entered into the | | | | | | |
| | March 31, 2020 | | December 31, 2019 |
$300 million Term Loan Agreement due December 2021, floating rate | | $ | 222.7 | | $ | 222.4 |
$650 million fixed rate Senior Notes due January 2027, stated rate of 3.650% | | | 645.4 | | | 645.2 |
Revolving Credit Agreement | | | — | | | — |
Total debt | | $ | 868.1 | | $ | 867.6 |
Term Loan Agreement (as defined below) providing for a $1.0 billion senior unsecured delayed draw term loan facility and on January 12, 2017, the Company issued $650 million aggregate principal amount of 3.650% Senior Notes due 2027 ("3.650% Senior Notes"). The proceeds from this delayed draw term loan facility and issuance of our senior notes, in addition to using cash on hand at Cboe and Bats, were used to finance a portion of the cash component of the Merger consideration, to refinance existing indebtedness of Bats and its subsidiaries and to pay related fees and expenses. In addition, on December 15, 2016, the Company entered into a $150 million
revolving credit facility to be used for working capital and other general corporate purposes.
On June 29, 2017, Cboe refinanced approximately $300 million of the amounts outstanding under the Term Loan Agreement through the issuance of $300 million in aggregate principal amount of 1.950% Senior Notes due 2019 ("1.950% Senior Notes" and, together with the 3.650% Senior Notes, the "Notes").
Term Loan Agreement
On December 15, 2016,March 22, 2018, the Company, as borrower, entered into a new Term Loan Credit Agreement (the “Term Loan Agreement”) with Bank of America, N.A. (“Bank of America”), as administrative agent certain lenders named therein (the “Term Lenders”), Merrill Lynch, Pierce, Fenner & Smith Incorporated,and initial lender, and the several banks and other financial institutions from time to time party thereto as lenders. Bank of America also acted as sole lead arranger and sole bookrunner Morgan Stanley MUFGwith respect to the Term Loan Partners, LLC, as syndication agent, and Citibank, N.A., PNC Bank, National Association and JPMorgan Chase Bank, N.A., as co-documentation agents.Agreement. The Term Loan Agreement providedprovides for a senior unsecured delayed draw term loan facility (the “Term Loan Facility”) in an aggregate principal amount of $1.0 billion.
Cboe Global Markets, Inc. and Subsidiaries
Notes$300 million. The proceeds of the loan under the Term Loan Agreement were used to Condensed Consolidated Financial Statements (unaudited)
repay the $300 million of outstanding indebtedness under the prior term loan agreement entered into on December 15, 2016.Loans under the Term Loan Agreement bear interest, at ourthe Company’s option, at either (i) the London Interbank Offered Rate (“LIBOR”) periodically fixed for an interest period (as selected by us)the Company) of one, two, three or six months plus a margin (based on our public debt ratings) ranging from 1.00 percent per annum to 1.751.50 percent per annum or (ii) a daily floating rate based on the agent’s prime rate (subject to certain minimums based upon the federal funds effective rate or LIBOR) plus a margin (based on our public debt ratings) ranging from zero0 percent per
annum to 0.750.50 percent per annum. The Company was required to pay a tickingan up-front fee of 0.05 percent to the agent for the account of the Term Lenders which initially accrued at a rate (based on our public debt ratings) ranging from 0.10 percent per annum to 0.30 percent per annum multiplied by the undrawn aggregate commitments of the Term Lenders in respect ofentry into the Term Loan Facility, accruing during the period commencingAgreement.
The Term Loan Agreement, which matures on December 15, 2016 and ending on the earlier of the date on which the loans are drawn.
The Term Loan Agreement2021, contains customary representations, warranties and affirmative and negative covenants for facilities of its type, including financial covenants, events of default and indemnification provisions in favor of the Term Lenders.lenders thereunder. The negative covenants include restrictions regarding the incurrence of liens, the incurrence of indebtedness by ourthe Company’s subsidiaries and fundamental changes, subject to certain exceptions in each case. The financial covenants require usthe Company to meet a quarterly financial test with respect to a minimum consolidated interest coverage ratio of not less than 4.00 to 1.00 and a maximum consolidated leverage ratio of not greater than 3.50 to 1.00. At September 30, 2017,March 31, 2020, the Company was in compliance with these covenants.
On February 28, 2017, Cboe made a draw under the Term Loan Agreement in the amount of $1.0 billion. Cboe used the proceeds to finance a portion of the cash component of the aggregate consideration for the Merger, repaid certain existing indebtedness of Bats, paid fees and expenses incurred in connection with the transactions contemplated by the Merger Agreement, funded working capital needs, and for other general corporate purposes. Loans under the Term Loan Agreement mature five years following the closing date of the Merger.
On June 29, 2017, Cboe refinanced approximately $300 million of the amounts outstanding under the Term Loan Agreement through the issuance of $300 million in aggregate principal amount of 1.950% Senior Notes.
1.950% Senior Notes due 2019
On June 29, 2017, the Company issued $300 million aggregate principal amount of 1.950% Senior Notes. The form and terms of the 1.950% Senior Notes were established pursuant to an Officer’s Certificate, dated as of June 29, 2017, supplementing the Indenture (as defined below). Underwriter fees of $0.8 million were also capitalized and netted against long-term debt in the consolidated balance sheet, while other issuance fees of $0.9 million were expensed and are included in debt issuance costs on the consolidated statement of income for the nine months ended September 30, 2017.
The Company used the net proceeds from the 1.950% Senior Notes to repay amounts under the Term Loan Agreement. The 1.950% Senior Notes mature on June 28, 2019 and bear interest at the rate of 1.950% per annum, payable semi-annually in arrears on June 28 and December 28 of each year, commencing December 28, 2017. The 1.950% Senior Notes are unsecured obligations of the Company and rank equally with all of the Company’s other existing and future unsecured, senior indebtedness, but are effectively junior to the Company’s secured indebtedness, to the extent of the value of the assets securing such indebtedness, and will be structurally subordinated to the secured and unsecured indebtedness of the Company’s subsidiaries.
The Company has the option to redeem some or all of the 1.950% Senior Notes, at any time in whole or from time to time in part, at the redemption prices set forth in the Officer’s Certificate. The Company may also be required to offer to repurchase the 1.950% Senior Notes upon the occurrence of a Change of Control Triggering Event (as such term is defined in the Officer’s Certificate) at a repurchase price equal to 101% of the aggregate principal amount of 1.950% Senior Notes to be repurchased.
3.650% Senior Notes due 2027
On January 12, 2017, the Company entered into an indenture (the “Indenture”), by and between the Company and Wells Fargo Bank, National Association, as trustee, in connection with the issuance of $650 million aggregate principal amount of the Company’s 3.650% Senior Notes.Notes due 2027 (“3.650% Senior Notes”). The form and terms of the 3.650% Senior Notes were established pursuant to an Officer’s Certificate, dated as of January 12, 2017, supplementing the Indenture.
Cboe Global Markets, Inc. and Subsidiaries
Notes to Condensed Consolidated Financial Statements (unaudited)
The Company used a portion of the net proceeds from the 3.650% Senior Notes to fund, in part, the Merger, including the payment of related fees and expenses and the repayment of Bats’ existing indebtedness, and the remainder for general corporate purposes. The 3.650% Senior Notes mature on January 12, 2027 and bear interest at the rate of 3.650% per annum, payable semi-annually in arrears on January 12 and July 12 of each year, commencing July 12, 2017.
The 3.650% Senior Notes are unsecured obligations of the Company and rank equally with all of the Company’s other existing and future unsecured, senior indebtedness, but are effectively junior to the Company’s secured indebtedness, to the extent of the value of the assets securing such indebtedness, and will be structurally subordinated to the secured and unsecured indebtedness of the Company’s subsidiaries.
The Company has the option to redeem some or all of the 3.650% Senior Notes, at any time in whole or from time to time in part, at the redemption prices set forth in the Officer’s Certificate. The Company may also be required to offer to repurchase the 3.650% Senior Notes upon the occurrence of a Change of Control Triggering Event (as such term is defined in the Officer’s Certificate) at a repurchase price equal to 101% of the aggregate principal amount of 3.650% Senior Notes to be repurchased.
Under the Indenture, the Company may issue debt securities, which includes the 3.650% Senior Notes, at any time and from time to time, in one or more series without limitation on the aggregate principal amount. The Indenture governing the 3.650% Senior Notes contains customary restrictions, including a limitation that restricts ourthe Company’s ability and the ability of certain of ourthe Company’s subsidiaries to create or incur secured debt. Such Indenture also limits certain sale and leaseback transactions and contains customary events of default. At September 30, 2017,March 31, 2020, the Company was in compliance with these covenants.
Revolving Credit Agreement
On December 15, 2016, the Company, as borrower, entered into a syndicated Credit Agreement (the “Revolving Credit Agreement”) with Bank of America, N.A., as administrative agent and as swing line lender, as well as certain lenders named therein (the “Revolving Lenders”), Merrill Lynch, Pierce, Fenner & Smith Incorporated, as sole lead arranger and sole bookrunner, Morgan Stanley MUFG Loan Partners, LLC, as syndication agent, and Citibank, N.A., PNC Bank, National Association and JPMorgan Chase Bank, N.A., as co-documentation agents.
.The Revolving Credit Agreement provides for a senior unsecured $150 million five-year revolving credit facility (the “Revolving Credit Facility”) that includes a $25 million swing line sub-facility. The Company may also, subject to the agreement of the applicable lenders, increase the commitments under the Revolving Credit Facility by up to $100 million, for a total of $250 million. Subject to specified conditions, the Company may designate one1 or more of
its subsidiaries as additional borrowers under the Revolving Credit Agreement provided that itthe Company guarantees all borrowings and other obligations of any such subsidiaries. As of September 30, 2017, noMarch 31, 2020, 0 subsidiaries were designated as additional borrowers.
Funds borrowed under the Revolving Credit Agreement may be used to fund working capital and for other general corporate purposes. As of September 30, 2017, noMarch 31, 2020, 0 borrowings were outstanding under the Revolving Credit Agreement. Accordingly, at September 30, 2017,March 31, 2020, $150 million of borrowing capacity was available for the purposes permitted by the Revolving Credit Agreement.
Loans under the Revolving Credit Agreement will bear interest, at ourthe Company’s option, at either (i) LIBOR periodically fixed for an interest period (as selected by us)the Company) of one, two, three or six months plus a margin (based on ourthe Company’s public debt ratings) ranging from 1.00 percent per annum to 1.75 percent per annum or (ii) a daily floating rate based on ourthe prime rate (subject to certain minimums based upon the federal funds effective rate or LIBOR) plus a margin (based on ourthe Company’s public debt ratings) ranging from zero0 percent per annum to 0.75 percent per annum.
Subject to certain conditions stated in the Revolving Credit Agreement, the Company may borrow, prepay and reborrow amounts under the Revolving Credit Facility at any time during the term of the Revolving Credit Agreement. The Revolving Credit Agreement will terminate and all amounts owing thereunder will be due and payable on December 15, 2021, unless the commitments are terminated earlier, either at ourthe Company’s request or, if an event of default occurs, by the Revolving Lenders (or automatically in the case of certain bankruptcy-related events). The Revolving Credit Agreement contains customary representations, warranties and affirmative and negative covenants for facilities of its type, including financial covenants, events of default and indemnification provisions in favor of the Revolving Lenders. The negative covenants include restrictions regarding the incurrence of liens, the incurrence of indebtedness by ourthe Company’s subsidiaries and fundamental changes, subject to certain
Cboe Global Markets, Inc. and Subsidiaries
Notes to Condensed Consolidated Financial Statements (unaudited)
exceptions in each case. The financial covenants require usthe Company to meet a quarterly financial test with respect to a minimum consolidated interest coverage ratio of not less than 4.00 to 1.00 and a maximum consolidated leverage ratio of not greater than 3.50 to 1.00. At September 30, 2017,March 31, 2020, the Company was in compliance with these covenants.
Bridge Facility
In connection with entering into the Merger Agreement, the Company entered into a commitment letter with Bank of America, N.A. and Merrill Lynch, Pierce, Fenner & Smith Incorporated (or any of its designated affiliates) (Bank of America, N.A., and other such financial institutions that accede as lender to such debt commitment letter in accordance with its terms are referred to herein as the “Lenders”), which provides that, subject to the satisfaction and waiver of certain conditions which are usual and customary for financing of this type, the Lenders are committed to provide debt financing for the purposes of funding (i) the cash consideration to be paid in the transactions contemplated by the Merger Agreement, (ii) the refinancing of certain existing indebtedness of Bats and its subsidiaries and (iii) related fees and expenses, which debt financing consists of a senior unsecured 364-day bridge loan facility in an aggregate principal amount of up to $1.65 billion to the extent the Company fails to generate gross cash proceeds in an aggregate principal amount of up to $1.65 billion from permanent financing including in the form of a senior unsecured term loan facility and the issuance of senior unsecured notes on or prior to the consummation of the transaction contemplated by the Merger Agreement. The Company paid commitment and structuring fees of $6.0 million. Through September 30, 2017, the Company has amortized $6.0 million of these fees as a result of the Company entering into more permanent debt arrangements. The Company entered into a term loan agreement and completed a notes offering, as described below, securing $1.65 billion to finance the cash portion of its acquisition of Bats as well as the repayment of Bats' existing indebtedness. As a result of securing the financing discussed above, the bridge facility was terminated.
Loan and Notes Payments and Contractual Interest
The future expected loan repayments related to the Term Loan Agreement and the 3.650% Senior Notes as of September 30, 2017 isMarch 31, 2020 are as follows (in millions):
| | | |
Remainder of 2020 | | $ | — |
2021 | | | 225.0 |
2022 | | | — |
2023 | | | — |
2024 | | | — |
Thereafter | | | 650.0 |
Principal amounts repayable | | | 875.0 |
Debt issuance cost | | | (3.0) |
Unamortized discounts on notes | | | (3.9) |
Total debt outstanding | | $ | 868.1 |
|
| | | |
| 2017 | $ | — |
|
| 2018 | — |
|
| 2019 | 300.0 |
|
| 2020 | — |
|
| 2021 | — |
|
| Thereafter | 1,025.0 |
|
| Principal amounts repayable | 1,325.0 |
|
| Debt issuance cost | (7.1 | ) |
| Unamortized discount on Notes | (5.5 | ) |
| Total debt outstanding | $ | 1,312.4 |
|
Interest expense recognized on the Term Loan Agreement and the 3.650% Senior Notes is included in interest expense, net in the condensed consolidated statements of income, for the three and nine months ended September 30, 2017March 31, 2020 and 20162019 is as follows (in millions):
|
| | | | | | | | | | | | | | | | |
| | | Three Months Ended September 30, | | Nine Months Ended September 30, |
| | | 2017 | | 2016 | | 2017 | | 2016 |
| Components of interest expense: | | | | | | | | |
| Contractual interest | | $ | 10.5 |
| | $ | 0.2 |
| | $ | 29.0 |
| | $ | 0.2 |
|
| Amortization of debt discount | | 0.3 |
| | — |
| | 0.6 |
| | — |
|
| Amortization of debt issuance cost | | 0.2 |
| | — |
| | 2.5 |
| | — |
|
| Interest expense | | 11.0 |
| | 0.2 |
| | 32.1 |
| | 0.2 |
|
| Interest income | | (0.5 | ) | | — |
| | (1.2 | ) | | — |
|
| Interest expense, net | | $ | 10.5 |
| | $ | 0.2 |
| | $ | 30.9 |
| | $ | 0.2 |
|
Cboe Global Markets, Inc. and Subsidiaries
Notes to Condensed Consolidated Financial Statements (unaudited)
| | | | | | | |
| | Three Months Ended | |
| | March 31, | |
| | 2020 | | 2019 | |
Components of interest expense: | | | | | | | |
Contractual interest | | $ | 7.5 | | $ | 9.8 | |
Amortization of debt discount | | | 0.1 | | | 0.2 | |
Amortization of debt issuance costs | | | 0.4 | | | 0.4 | |
Interest expense | | $ | 8.0 | | $ | 10.4 | |
Interest income | | | (0.7) | | | (0.5) | |
Interest expense, net | | $ | 7.3 | | $ | 9.9 | |
12. ACCUMULATED OTHER COMPREHENSIVE INCOME, NET
The following represents the changes in accumulated other comprehensive income, net by component (in millions):
|
| | | | | | | | | | | | |
| | | | | |
| | Foreign | Unrealized | | Total Other |
| | Currency | Investment | Post-Retirement | Comprehensive |
| | Translation | Gain/Loss | Benefits | Income |
| Balance at December 31, 2016 | $ | — |
| $ | — |
| $ | (0.8 | ) | $ | (0.8 | ) |
| Other comprehensive income | 50.7 |
| 0.1 |
| — |
| 50.8 |
|
| Balance at September 30, 2017 | $ | 50.7 |
| $ | 0.1 |
| $ | (0.8 | ) | $ | 50.0 |
|
| | | | | | | | | | | | |
| | Foreign | | | | | | | | Total Accumulated |
| | Currency | | Unrealized | | | | Other |
| | Translation | | Investment | | Post-Retirement | | Comprehensive |
| | Adjustment | | Gain (Loss) | | Benefits | | Income (Loss) |
Balance at December 31, 2019 | | $ | 38.2 | | $ | 0.2 | | $ | (0.8) | | $ | 37.6 |
Other comprehensive loss | | | (37.5) | | | — | | | — | | | (37.5) |
Balance at March 31, 2020 | | $ | 0.7 | | $ | 0.2 | | $ | (0.8) | | $ | 0.1 |
13. FAIR VALUE MEASURMENTS
MEASUREMENTFair value is the price that would be received upon the sale of an asset or paid upon the transfer of a liability in an orderly transaction between market participants at the measurement date and in the principal or most advantageous market for that asset or liability. The fair value should be calculated based on assumptions that market participants would use in pricing the asset or liability, not on assumptions specific to the entity. In addition, the fair value of liabilities should include consideration of non-performance risk, including the Company’s own credit risk.
The Company applied Financial Accounting Standards BoardFASB ASC 820,
Fair Value Measurement, and Disclosure, which provides guidance for using fair value to measure assets and liabilities by defining fair value and establishing the framework for measuring fair value. ASC 820 applies to financial and nonfinancial instruments that are measured and reported on a fair value basis. The three-level hierarchy of fair value measurements is based on whether the inputs to those measurements are observable or unobservable. Observable inputs reflect market data obtained from independent sources, while unobservable inputs reflect the Company’s market assumptions. The fair-value hierarchy requires the use of observable market data when available and consists of the following levels: | ● | Level 1—Unadjusted inputs based on quoted markets for identical assets or liabilities. |
| ● | Level 2—Observable inputs, either direct or indirect, not including Level 1 measurements, corroborated by market data or based upon quoted prices in non-active markets. |
| ● | Level 3—Unobservable inputs that reflect management’s best assumptions of what market participants would use in valuing the asset or liability. |
Level 1—Unadjusted inputs based on quoted markets for identical assets or liabilities.
Level 2—Observable inputs, either direct or indirect, not including Level 1, corroborated by market data or based upon quoted prices in non-active markets.
Level 3—Unobservable inputs that reflect management’s best assumptions of what market participants would use in valuing the asset or liability.
The Company has included a tabular disclosure for financial assets and liabilities that are measured at fair value on a recurring basis in the condensed consolidated balance sheetsheets as of September 30, 2017March 31, 2020 and December 31, 2016.2019.
Assets and Liabilities Measured at Fair Value on a Recurring Basis
The following tables presentspresent the Company’s fair value hierarchy for those assets and liabilities measured at fair value on a recurring basis as of September 30, 2017March 31, 2020 and December 31, 20162019 (in millions):
|
| | | | | | | | | | | | |
| | September 30, 2017 |
| Total | Level 1 | Level 2 | Level 3 |
| Assets: | | | | |
| Trading securities: | | | | |
| U.S. Treasury securities | $ | 0.5 |
| $ | 0.5 |
| $ | — |
| $ | — |
|
| Other securities | 1.9 |
| 1.9 |
| — |
| — |
|
| Money market funds | 1.5 |
| 1.5 |
| — |
| — |
|
| Total assets | $ | 3.9 |
| $ | 3.9 |
| $ | — |
| $ | — |
|
| Liabilities: | | | |
| |
|
| Contingent consideration liability | $ | 56.6 |
| $ | — |
| $ | — |
| $ | 56.6 |
|
| Total liabilities | $ | 56.6 |
| $ | — |
| $ | — |
| $ | 56.6 |
|
Cboe Global Markets, Inc. and Subsidiaries
Notes to Condensed Consolidated Financial Statements (unaudited)
|
| | | | | | | | | | | | | | | |
| | December 31, 2016 |
| Total | | Level 1 | | Level 2 | | Level 3 |
| Assets: | | | | | | | |
| Money market funds | $ | 67.5 |
| | $ | 67.5 |
| | $ | — |
| | $ | — |
|
| Total assets | $ | 67.5 |
| | $ | 67.5 |
| | $ | — |
| | $ | — |
|
| | | | | | | | | | | | |
| | March 31, 2020 |
| | Total | | Level 1 | | Level 2 | | Level 3 |
Assets: | | | | | | | | | | | | |
U.S. Treasury securities | | $ | 25.2 | | $ | 25.2 | | $ | — | | $ | — |
Marketable securities: | | | | | | | | | | | | |
Mutual funds | | | 11.8 | | | 11.8 | | | — | | | — |
Money market funds | | | 6.6 | | | 6.6 | | | — | | | — |
Total assets | | $ | 43.6 | | $ | 43.6 | | $ | — | | $ | — |
Liabilities: | | | | | | | | | | | | |
Contingent consideration liabilities | | $ | 17.5 | | $ | — | | $ | — | | $ | 17.5 |
Total Liabilities | | $ | 17.5 | | $ | — | | $ | — | | $ | 17.5 |
| | | | | | | | | | | | |
| | December 31, 2019 |
| | Total | | Level 1 | | Level 2 | | Level 3 |
Assets: | | | | | | | | | | | | |
U.S. Treasury securities | | $ | 47.6 | | $ | 47.6 | | $ | — | | $ | — |
Marketable securities: | | | | | | | | | | | | |
Mutual funds | | | 15.7 | | | 15.7 | | | — | | | — |
Money market funds | | | 7.7 | | | 7.7 | | | — | | | — |
Total assets | | $ | 71.0 | | $ | 71.0 | | $ | — | | $ | — |
Liabilities: | | | | | | | | | | | | |
Contingent consideration liabilities | | $ | 2.2 | | $ | — | | $ | — | | $ | 2.2 |
Total Liabilities | | $ | 2.2 | | $ | — | | $ | — | | $ | 2.2 |
The following is a description of the Company’s valuation methodologies used for instruments measured at fair value on a recurring basis:
Available-for-sale and trading securities
Financial Investments
Financial investments classified as trading and available‑for‑sale consist of highly liquid U.S. Treasury securities.securities and marketable securities held in a rabbi trust for the Company’s non-qualified retirement and benefit plans, also referred to as deferred compensation plan assets. The deferred compensation plan assets have an equal and offsetting deferred compensation plan liability based on the value of the deferred compensation plan assets. These securities are valued by obtaining feeds from a number of live data sources, including active market makers and inter‑dealerinter-dealer brokers and therefore categorized as Level 1.
See Note 15 (“Employee Benefit Plans”) for more information.Contingent consideration liability
Consideration LiabilitiesIn connection with the acquisition of Bats,Hanweck and acquisition of assets of FT Options, the Company acquired aentered into contingent consideration arrangementarrangements with the former owners of Cboe FX.owners. The total fair value of this liabilitythe liabilities at September 30, 2017March 31, 2020 was $56.6$17.5 million. That value is based on estimatesthe Company’s estimate of the likelihood that certain performance targets in the respective acquisition agreements will be accomplished. Because the fair value measurements relating to the contingent consideration liabilities are subject to management judgment, measurement uncertainty is inherent in the valuation of the contingent consideration liabilities as of the reporting date. Based on the recorded balance of the liabilities, any measurement uncertainty related to this Level 3 measurement is immaterial as of March 31, 2020.
Assets and Liabilities Measured at Fair Value on a Nonrecurring Basis
Certain assets, such as goodwill and intangible assets, are measured at fair value on a non-recurring basis. For goodwill, the process involves using a market approach and income approach (using discounted futureestimated cash payments,flows) to determine the fair value of each reporting unit on a significant unobservable input,stand-alone basis. That fair value is compared to the carrying amount of the reporting unit, including its recorded goodwill. In connection with the annual impairment evaluation of goodwill and indefinite life intangibles, impairment is considered to have occurred if the fair value of the reporting unit is lower than the carrying amount of the reporting unit. For the intangible assets, the process also involves using a discounted cash flow method to determine the fair value of each intangible asset. Impairment is considered to have occurred if the fair value of the intangible asset is lower than its carrying amount. The Company did not perform an impairment test during the three months ended March 31, 2020, as there were no market events that would indicate it was more likely than not that these assets were impaired. These measurements are considered Level 3 measurement.
and these assets are recognized at fair value if they are deemed to be impaired. In addition, property held for sale as of March 31, 2020 was also measured at fair value, less selling costs at March 31, 2020. See Note 6 (“Property and Equipment, Net”) for more information on property held for sale.Fair Value of Financial Instruments
Assets and LiabilitiesThe following table presents the Company’s fair value hierarchy for those financial instrumentscertain assets and liabilities held by the Company as of September 30, 2017March 31, 2020 and December 31, 20162019 (in millions):
|
| | | | | | | | | | | | |
| | September 30, 2017 |
| Total | Level 1 | Level 2 | Level 3 |
| Assets: | | | | |
| Cash and cash equivalents | $ | 124.8 |
| $ | 124.8 |
| $ | — |
| $ | — |
|
| Trading investments | 2.4 |
| 2.4 |
| — |
| — |
|
| Available-for-sale investments | — |
| — |
| — |
| — |
|
| Accounts receivable | 195.8 |
| 195.8 |
| — |
| — |
|
| Income tax receivable | 35.2 |
| 35.2 |
| — |
| — |
|
| Total assets | $ | 358.2 |
| $ | 358.2 |
| $ | — |
| $ | — |
|
| Liabilities: | | | | |
| Accounts payable | $ | 38.9 |
| $ | — |
| $ | 38.9 |
| $ | — |
|
| Section 31 fees payable | 25.4 |
| — |
| 25.4 |
| — |
|
| Contingent consideration liability | 56.6 |
| — |
| — |
| 56.6 |
|
| Long-term debt | 1,312.4 |
| — |
| 1,312.4 |
| — |
|
| Total liabilities | $ | 1,433.3 |
| $ | — |
| $ | 1,376.7 |
| $ | 56.6 |
|
Cboe Global Markets, Inc. | | | | | | | | | | | | |
| | March 31, 2020 |
| | Total | | Level 1 | | Level 2 | | Level 3 |
Assets: | | | | | | | | | | | | |
U.S. Treasury securities | | $ | 25.2 | | $ | 25.2 | | $ | — | | $ | — |
Deferred compensation plan assets | | | 18.4 | | | 18.4 | | | — | | | — |
Total assets | | $ | 43.6 | | $ | 43.6 | | $ | — | | $ | — |
Liabilities: | | | | | | | | | | | | |
Contingent consideration liabilities | | $ | 17.5 | | $ | — | | $ | — | | $ | 17.5 |
Deferred compensation plan liabilities | | | 18.4 | | | 18.4 | | | — | | | — |
Debt | | | 868.1 | | | — | | | 868.1 | | | — |
Total liabilities | | $ | 904.0 | | $ | 18.4 | | $ | 868.1 | | $ | 17.5 |
| | | | | | | | | | | | |
| | December 31, 2019 |
| | Total | | Level 1 | | Level 2 | | Level 3 |
Assets: | | | | | | | | | | | | |
U.S. Treasury securities | | $ | 47.6 | | $ | 47.6 | | $ | — | | $ | — |
Deferred compensation plan assets | | | 23.4 | | | 23.4 | | | — | | | — |
Total assets | | $ | 71.0 | | $ | 71.0 | | $ | — | | $ | — |
Liabilities: | | | | | | | | | | | | |
Contingent consideration liabilities | | $ | 2.2 | | $ | — | | $ | — | | $ | 2.2 |
Deferred compensation plan liabilities | | | 23.4 | | | 23.4 | | | — | | | — |
Debt | | | 867.6 | | | — | | | 867.6 | | | — |
Total liabilities | | $ | 893.2 | | $ | 23.4 | | $ | 867.6 | | $ | 2.2 |
Certain financial assets and Subsidiaries
Notes to Condensed Consolidated Financial Statements (unaudited)
|
| | | | | | | | | | | | |
| | December 31, 2016 |
| Total | Level 1 | Level 2 | Level 3 |
| Assets: | | | | |
| Cash and cash equivalents | $ | 97.3 |
| $ | 97.3 |
| $ | — |
| $ | — |
|
| Accounts receivable | 76.7 |
| 76.7 |
| — |
| — |
|
| Income tax receivable | 53.7 |
| 53.7 |
| — |
| — |
|
| Total assets | $ | 227.7 |
| $ | 227.7 |
| $ | — |
| $ | — |
|
| Liabilities: |
|
|
|
|
| Accounts payable | $ | 6.5 |
| $ | — |
| $ | 6.5 |
| $ | — |
|
| Total liabilities | $ | 6.5 |
| $ | — |
| $ | 6.5 |
| $ | — |
|
The carrying amounts ofliabilities, including cash and cash equivalents, accounts receivable, income tax receivable, accounts payable and Section 31 fees payable, are not measured at fair value on a recurring basis, but the carrying values approximate fair value due to their liquid or short-term nature.
Long-term debt
Debt
The carrying amount of long-term debt approximates its fair value based on quoted LIBOR or using a fixed rate at September 30, 2017March 31, 2020 and is considered a Level 2 measurement.
Information on Level 3 Financial Liabilities
The following table sets forth a summary of changes in the fair value of the Company’s Level 3 financial liabilities during the ninethree months ended September 30, 2017.
|
| | | | | | | | | | | | | |
| | | Level 3 Financial Liabilities for the Nine Months Ended September 30, 2017 |
| | Balance at Beginning of Period | Acquired During Period | Settlements | Balances at end of period |
| |
| |
| | Liabilities | | | | |
| | Contingent consideration liability | $ | — |
| $ | 56.6 |
| $ | — |
| $ | 56.6 |
|
| | Total Liabilities | $ | — |
| $ | 56.6 |
| $ | — |
| $ | 56.6 |
|
March 31, 2020. | | | | | | | | | | | | | | | |
| | Level 3 Financial Liabilities for the Three Months Ended March 31, 2020 |
| | Balance at | | Realized (gains) | | | | | | | |
| | Beginning of | | losses during | | | | | | Balance at |
| | Period | | period | | Additions | | Settlements | | End of Period |
Liabilities | | | | | | | | | | | | | | | |
Contingent consideration liabilities | | $ | 2.2 | | $ | — | | $ | 17.5 | | $ | (2.2) | | $ | 17.5 |
Total Liabilities | | $ | 2.2 | | $ | — | | $ | 17.5 | | $ | (2.2) | | $ | 17.5 |
14. REDEEMABLE NONCONTROLLING INTEREST
Redeemable noncontrolling interest are reported on the consolidated balance sheets in mezzanine equity in Redeemable Noncontrolling Interest. SEGMENT REPORTINGThe Company recognizes changes to the redemption value of redeemable noncontrolling interest as they occur and adjust the carrying value to equal the redemption value at the end of each reporting period. The resulting increases or decreases in the estimated redemption amount are affected by corresponding charges or credits against retained earnings, or in the absence of retained earnings, additional paid in capital. The redemption amounts have been estimated based on the fair value of the majority-owned subsidiary, determined based on a weighting of the discounted cash flow and other economic factors.
For the nine months ended September 30, 2017, the following reflects changes in our redeemable noncontrolling interest (in millions):
|
| | | |
| | Redeemable Noncontrolling Interest |
| Balance as at December 31, 2016 | $ | 12.6 |
|
| Decrease due to acquiring additional equity in Vest | (3.2 | ) |
| Net loss attributable to redeemable noncontrolling interest | (0.8 | ) |
| Redemption value adjustment | 0.8 |
|
| Balance as at September 30, 2017 | $ | 9.4 |
|
Cboe Global Markets, Inc. and Subsidiaries
Notes to Condensed Consolidated Financial Statements (unaudited)
15. SEGMENT REPORTING
The Company previously operated as a single reportablereports 5 business segment as of December 31, 2016. As a result of the Bats acquisition, beginning in 2017, the Company is reporting five segments: Options, U.S. Equities, Futures, European Equities, and Global FX, which is reflective of how the Company's chief operating decision-maker reviews and operates the business, (Note 1). This change has been reflectedas discussed in all periods presented.Note 1 (“Organization and Basis of Presentation”). Segment performance is primarily evaluated based on operating income (loss). The Company’s chief operating decision-maker does not use segment-level assets or income and expenses below operating income (loss) as key performance metrics; therefore, such information is not presented below. The Company has aggregated all of its corporate costs, acquisition-related costs, as well as other business ventures, within the Corporate Items and Eliminations unittotals based on the decision that those activities should not be used to evaluate the segment's operating performance;performance of the segments; however, operating expenses that relate to activities of a specific segment have been allocated to that segment.
Options.The Options segment includes our options exchange business, which lists for tradinglisted options on market indexes (index options)indices (“index options”), mostly on an exclusive basis, as well as on non-exclusive "multiply-listed"“multi-listed” options, such as options on the stocks of individual corporations (equity options)(“equity options”) and options on other exchange-traded products (ETP options),ETPs, such as exchange-traded funds (ETF options)(“ETFs”) and exchange-traded notes (ETN options) that occur(“ETNs”). These options trade on Cboe Options, C2, BZX, and EDGX. ItCboe Options is the Company’s primary options market and offers trading in listed options through a single system, known as the Hybrid trading model, which integrates electronic trading and traditional open outcry trading on the Cboe Options trading floor in Chicago. There is a temporary suspension of open outcry trading in response to the COVID-19 pandemic. C2, BZX, and EDGX are all-electronic options exchanges, and typically operate with different market models and fee structures than Cboe Options. The Options segment also includes applicable market data revenue generated from the listed equity options routed transaction services that occur on Trading.
U.S. tape plan, the sale of proprietary market data, index licensing, and access and capacity services.U.S. Equities.The U.S. Equities segment includes listed cash equities and ETP transaction services that occur on BZX, BYX, EDGX, and EDGA. ItThis segment also includes ETP listings on BZX, the Cboe Global Markets, Inc. common stock listing, applicable market data feesrevenue generated from the U.S. tape plans, the sale of proprietary market data, routing services, access and capacity services and advertising activity from ETF.com.
Futures. The Futures segment includes the business of the Company’s futures exchange, CFE, which includes offerings for trading VIX futures and other futures products, as well as feesrevenue generated from the sale of proprietary market data of these exchanges. It also includes the listed cash equities and ETPs routed transaction services, the listings business where ETPs are listed on BZX,from access and advertising activity from ETF.com.
The Futures segment includes the business of our futures exchange, CFE, which includes offering for trading futures on the VIX Index and other futures products.
capacity services.European Equities.The European Equities segment includes the pan‑Europeanpan-European listed cash equities transaction services, ETPs, exchange‑exchange traded commodities, and international depository receipts that occur on the Recognised Investment Exchange,MTFs operated by Cboe Europe Equities. It also includes the listed cash equities and ETPs routed transaction services that occur on Cboe Chi-X Europe, as well as the listings business where ETPs can be listed on RMs. Cboe Europe Equities.Equities operates lit and dark books, a periodic auctions book, and a Large-in-Scale (“LIS”) trading negotiation facility. Cboe NL, launched in October 2019, operates similar business functionality that is offered by Cboe Europe, other than LIS, and provides for trading only in European Economic Area symbols. Cboe Europe Equities also includes revenue generated from the sale of proprietary market data and from access and capacity services.
Global FX.The Global FX segment includes institutional FX trading services that occur on the Cboe FX platform, as well as non-deliverable forward FX transactions executedoffered for execution on Cboe SEF.
SEF, as well as revenue generated from the sale of proprietary market data and from access and capacity services.Summarized financial data of reportable segments was as follows (in millions):
|
| | | | | | | | | | | | | | | | | | | | | | | | | | | | |
| | | | | | | | | | | | | Corporate | | |
| | | | | U.S. | | | | European | | | | items and | | |
| | | Options | | Equities | | Futures | | Equities | | Global FX | | eliminations | | Total |
| Three months ended September 30, 2017 | | | | | | | | | | | | | | |
| Revenues | | $ | 224.8 |
| | $ | 308.5 |
| | $ | 40.3 |
| | $ | 26.3 |
| | $ | 11.3 |
| | $ | 0.2 |
| | $ | 611.4 |
|
| Operating income (loss) | | 64.3 |
| | 29.9 |
| | 35.4 |
| | 2.7 |
| | (3.5 | ) | | (9.5 | ) | | 119.3 |
|
| Three months ended September 30, 2016 | | | | | | | | | | | | | | |
| Revenues | | $ | 139.2 |
| | $ | — |
| | $ | 29.5 |
| | $ | — |
| | $ | — |
| | $ | — |
| | $ | 168.7 |
|
| Operating income (loss) | | 42.6 |
| | — |
| | 25.5 |
| | — |
| | — |
| | (2.3 | ) | | 65.8 |
|
|
| | | | | | | | | | | | | | | | | | | | | | | | | | | | |
| | | | | | | | | | | | | Corporate | | |
| | | | | U.S. | | | | European | | | | items and | | |
| | | Options | | Equities | | Futures | | Equities | | Global FX | | eliminations | | Total |
| Nine Months Ended September 30, 2017 | | | | | | | | | | | | | | |
| Revenues | | $ | 651.0 |
| | $ | 759.8 |
| | $ | 107.7 |
| | $ | 63.2 |
| | $ | 26.2 |
| | $ | 0.5 |
| | $ | 1,608.4 |
|
| Operating income (loss) | | 190.5 |
| | 75.4 |
| | 94.7 |
| | 7.8 |
| | (8.8 | ) | | (96.4 | ) | | 263.2 |
|
| Nine Months Ended September 30, 2016 | | | | | | | | | | | | | | |
| Revenues | | $ | 426.8 |
| | $ | — |
| | $ | 85.5 |
| | $ | — |
| | $ | — |
| | $ | — |
| | $ | 512.3 |
|
| Operating income (loss) | | 158.5 |
| | — |
| | 72.2 |
| | — |
| | — |
| | (7.4 | ) | | 223.3 |
|
| | | | | | | | | | | | | | | |
Cboe Global Markets, Inc. and Subsidiaries
Notes to Condensed Consolidated Financial Statements (unaudited)
16. | | | | | | | | | | | | | | | | | | | | | |
| | | | | | | | | | | | | | | | | Corporate | | | |
| | | | | | | | | | European | | | | | Items and | | | |
| | Options | | U.S. Equities | | Futures | | Equities | | Global FX | | Eliminations | | Total |
Three Months Ended March 31, 2020 | | | | | | | | | | | | | | | | | | | | | |
Revenues | | $ | 356.5 | | $ | 473.7 | | $ | 41.5 | | $ | 32.9 | | $ | 16.9 | | $ | — | | $ | 921.5 |
Operating income (loss) | | | 143.4 | | | 49.0 | | | 26.9 | | | 9.5 | | | 3.0 | | | (5.4) | | | 226.4 |
Three Months Ended March 31, 2019 | | | | | | | | | | | | | | | | | | | | | |
Revenues | | $ | 232.1 | | $ | 295.8 | | $ | 30.5 | | $ | 30.3 | | $ | 13.9 | | $ | — | | $ | 602.6 |
Operating income (loss) | | | 88.1 | | | 37.6 | | | 18.3 | | | 5.8 | | | (0.4) | | | (2.9) | | | 146.5 |
15. EMPLOYEE BENEFITS
Legacy Cboe and new employeesBENEFIT PLANSEmployees are eligible to participate in the Cboe Options SMART Plan (“SMART Plan”). The SMART Plan is a defined contribution plan, which is qualified under Internal Revenue Code Section 401(k). In addition, eligible employees may participate in the Supplemental Employee Retirement Plan, Executive Retirement Plan and Deferred Compensation Plan. Effective January 1, 2017, the Executive Retirement Plan is closed to new executive officers and employees. Each plan is a defined contribution plan that is non-qualified under the Internal Revenue Code. The Deferred Compensation Plan assets, held in a rabbi trust, are subject to the claims of general creditors of the Company and totaled $18.4 million at March 31, 2020. Although the value of the plans are recorded in financial investments on the condensed consolidated balance sheets, there are equal and offsetting liabilities in other non-current liabilities. The investment results of these plans have no impact on net income as the investment results are recorded in equal amounts to both other expense, net and compensation and benefits expense in the condensed consolidated statements of income. The Company contributed $1.3$1.5 million and $1.5 million$1.6 million to the defined contribution plans for the three months ended September 30, 2017March 31, 2020 and 2016, respectively, and $5.1 million and $4.2 million, respectively, to the defined contribution plans for the nine months ended September 30, 2017 and 2016, respectively. For the nine months ended September 30, 2017, $1.2 million of this expense was related to the acquisition of Bats and is included in acquisition-related costs in the condensed consolidated statements of income. The remaining expense is included in compensation and benefits in the condensed consolidated statements of income.
Upon completion of the Merger, the Company assumed Bats' defined contribution plan that offers a 401(k) retirement plan eligible to legacy Bats U.S. employees. Under the plan, the Company matches participating employee contributions dollar for dollar of up to five percent of salary. The Company’s contribution amounted to $0.6 million and $1.1 million for the three and nine months ended September 30, 2017,2019, respectively. This expense is included in compensation and benefits in the condensed consolidated statements of income.
The Company also assumed the Cboe Europe Equities employee‑selected stakeholder contribution plan upon completion of the Merger. The Company matches participating employee contributions of up to five percent of salary. EmployeesFor employees of Cboe Europe Equities are eligibleLimited, the Company contributes to participate.an employee-selected stakeholder contribution plan. The Company’s contribution amounted to $0.1 million and $0.3$0.2 million for the three and nine months ended September 30, 2017,March 31, 2020 and 2019, respectively. This expense is included in compensation and benefits in the condensed consolidated statements of income.
17.16. REGULATORY CAPITAL
As a broker‑dealerbroker-dealer registered with the SEC, Cboe Trading is subject to the SEC’s Uniform Net Capital Rule (Rule 15c3‑1)(“Rule 15c3-1”), which requires the maintenance of minimum net capital, as defined therein. The SEC’s requirement also provides that equity capital may not be withdrawn or a cash dividend paid if certain minimum net capital requirements are not met. Cboe Trading computes the net capital requirements under the basic method provided for in Rule 15c3‑1.
15c3-1.As of September 30, 2017,March 31, 2020, Cboe Trading is required to maintain net capital equal to the greater of 6.67% of aggregate indebtedness items, as defined, or $0.1 million. At September 30, 2017,March 31, 2020, Cboe Trading had net capital of $11.9$7.1 million, which was $11.5$6.1 million in excess of its required net capital of $0.4$1.0 million.
As entities regulated by the FCA, Cboe Europe EquitiesLimited is subject to the Financial Resource Requirement ("FRR"(“FRR”) and Cboe Chi-X Europe is subject to the Capital Resources Requirement ("CRR"(“CRR”). As a RIE, Cboe Europe EquitiesLimited computes its FRR in accordance with its Financial Risk Assessment, as agreed by the FCA. This FRR was $20.1$20.4 million at September 30, 2017.March 31, 2020. At September 30, 2017,March 31, 2020, Cboe Europe EquitiesLimited had capital in excess of its required FRR of $23.9$56.7 million.
As a Banks, Investment firms, PRUdential (BIPRU) 50k firm, as defined by the Markets in Financial Instruments Directive of the FCA, Cboe Chi‑XChi-X Europe computes its CRR as the greater of the base requirement of $0.1 million at September 30, 2017,March 31, 2020, or the summation of the credit risk, market risk and fixed overheads requirements, as defined. At September 30, 2017,March 31, 2020, Cboe Chi‑XChi-X Europe had capital in excess of its required CRR of $0.4$0.5 million.
Cboe Chi-X Europe Limited is currently dormant having ceased offering its routing service in November 2018.On March 8, 2019, Cboe Europe NL received approval from the Dutch Ministry of Finance to operate a RM, a MTF, and an approved publication arrangement in the Netherlands. As a RM, Cboe Europe NL is subject to minimum capital requirements, as established by the Dutch Ministry of Finance in the license dated March 8, 2019. As of March 31, 2020, the minimum capital requirement calculated in accordance with the license was $1.5 million. At March 31, 2020, Cboe Europe NL had capital in excess of its requirement of $4.1 million.
As a designated contract market regulated by the CFTC, CFE is required to meet two capital adequacy tests: (i) its financial resources must be equal to at least twelve months of its projected operating costs and (ii) its unencumbered, liquid financial assets, which may include a line of credit, must be equal to at least six months of its projected operating costs. As of March 31, 2020, CFE had annual projected operating expenses of $58.2 million and had financial resources that exceeded this amount. Additionally, as of March 31, 2020, CFE had projected operating expenses for the upcoming six months of $29.1 million and had unencumbered, liquid financial assets, including a line of credit from Cboe, that exceeded this amount.
As a swap execution facility regulated by the CFTC, Cboe SEF is required to meet two capital adequacy tests: (i) its financial resources must be equal to at least twelve months of its projected operating costs and (ii) its unencumbered, liquid financial assets must be equal to at least six months of its projected operating costs. As of September 30, 2017,March 31, 2020, Cboe SEF had annual projected operating expenses of $1.4$0.7 million and had financial resources that exceeded this amount. Additionally, as of September 30, 2017,March 31, 2020, Cboe SEF had projected operating expenses fromfor the upcoming six months of $0.7$0.4 million and had unencumbered, liquid financial assets that exceeded this amount.
As a designated contract market regulated by the CFTC, CFE is required to meet two capital adequacy tests: (i) its financial resources must be equal to at least twelve months of its projected operating costs and (ii) its unencumbered, liquid financial assets must be equal to at least six months of its projected operating costs. As of September 30, 2017, CFE had annual
Cboe Global Markets, Inc. and Subsidiaries
Notes to Condensed Consolidated Financial Statements (unaudited)
projected operating expenses of $19.2 million and had financial resources that exceeded this amount. Additionally, as of September 30, 2017, CFE had projected operating expenses for six months of $9.6 million and had unencumbered, liquid financial assets that exceeded this amount.
18.17. STOCK-BASED COMPENSATION
Stock-based compensation is based on the fair value of the award on the date of grant, which is recognized over the related service period, net of actual forfeitures. The service period is the period over which the related service is performed, which is generally the same as the vesting period. In the first quarter of 2017, the Company adopted ASU 2016-09,
Compensation — Stock Compensation. This ASU simplifies several aspects of the accountingVesting may be accelerated for stock-based payment transactions (See Note 1).On February 19, 2017, the Company granted 251,273 restricted stock units ("RSUs"), each of which entitles the holder to one share of common stock upon vesting, to certain officers and employees
atas a
fairresult of attaining certain age and service based requirements in the Company’s long-term incentive plan and award agreements.The Company recognized stock-based compensation expense of $8.3 million and $5.4 million for the three months ended March 31, 2020 and 2019, respectively. Stock-based compensation expense is included in compensation and benefits and acquisition-related costs in the condensed consolidated statements of income.
The activity in the Company’s stock options and restricted stock, consisting of restricted stock awards (“RSAs”), restricted stock units (“RSUs”), and performance-based restricted stock units (“PSUs”) for the three months ended March 31, 2020 was as follows:
Stock Options
The following table summarizes stock options activity during the three months ended March 31, 2020:
| | | | | | | | | | |
| | | | | | | Weighted | | | |
| | | | Weighted | | Average | | | |
| | | | Average | | Remaining | | Aggregate |
| | Number of | | Exercise | | Contractual | | Intrinsic Value |
| | Shares | | Price | | Term (years) | | (in millions) |
Outstanding and exercisable, December 31, 2019 | | 10,834 | | $ | 18.59 | | | | | |
Exercised | | 1,510 | | | 21.15 | | | | | |
Outstanding and exercisable, March 31, 2020 | | 9,324 | | $ | 18.17 | | 0.2 | | $ | 0.7 |
The total intrinsic value of $80.40 per share. stock options exercised was $0.2 million and $20.7 million for the three months ended March 31, 2020 and 2019, respectively.
RSAs and RSUs
The RSUs vest ratably overfollowing table summarizes RSA and RSU activity during the three years, with one-third vesting on each anniversarymonths ended March 31, 2020:
| | | | | |
| | | | Weighted |
| | Number of | | Average Grant |
| | Shares | | Date Fair Value |
Nonvested stock at December 31, 2019 | | 436,013 | | $ | 92.47 |
Granted | | 164,925 | | | 119.65 |
Vested | | (246,850) | | | 86.92 |
Forfeited | | (10,674) | | | 104.90 |
Nonvested stock at March 31, 2020 | | 343,414 | | $ | 109.12 |
RSAs granted to non-employee members of the grant date,board of directors have a one-year vesting period and vesting accelerates upon the occurrence of a change in control of the Company. Unvested portions of the RSAs will be forfeited if the director leaves the board of directors prior to the applicable vesting date. The RSAs have voting rights and entitle the holder to receive dividends.
RSUs entitle the holder to 1 share of common stock upon vesting, typically vest over a three year period, and vesting accelerates upon the occurrence of a change in control or a termination of employment following a change in control. Vesting will also accelerate upon a qualified retirement. Qualified retirement eligibility occurs once a holder is at least 55 years of age and has completed at least 10 years of service for grants awarded in and after 2017. Unvested RSUs will be forfeited if the officer, or employee, leaves the Company prior to the applicable vesting date, except in limited circumstances. The RSUs have no voting rights but entitle the holder to receive dividend equivalents.
On February 28, 2017,In connection with the Company granted 68,254 RSUs, each of which entitles the holder to one share of common stock upon vesting, to certain officers and employees at a fair value of $78.05 per share. The RSUs vest ratably over three years, with one-third vesting on each anniversary of the grant date, and vesting accelerates upon the occurrence of a change in control. Unvested RSUs will be forfeited if the officer or employee leaves the Company prior to the applicable vesting date, except in limited circumstances. The RSUs have no voting rights but entitle the holder to receive dividend equivalents.
On February 28, 2017, the Company granted 49,703 RSUs, each of which entitles the holder to one share of common stock upon vesting, to certain officers and employees at a fair value of $78.05 per share. The RSUs vest on the third anniversary of the grant date, and vesting accelerates upon the occurrence of a change in control. Unvested RSUs will be forfeited if the officer or employee leaves the Company prior to the applicable vesting date, except in limited circumstances. The RSUs have no voting rights but entitle the holder to receive dividend equivalents.
The Merger, Agreement provided that the number of shares of Cboe common stock into which each such award of Cboe Restricted Shares is converted will be equal to the number of shares of Bats common stock subject to the corresponding Bats Restricted Share award multiplied by the exchange ratio, which is the sum of (a) 0.3201 of a share of Cboe common stock and (b) the quotient obtained by dividing $10.00 by the volume-weighted average price, rounded to four decimal places, of shares of Cboe common stock on NASDAQ for the ten consecutive trading day period ending on the second full trading day prior to the effective time of the merger. The remaining service period will be completed post-merger and future vesting and expense will be recognized accordingly. Pursuant to the Merger Agreement, each award of restricted Bats common stock (“Bats restricted shares”) granted under any of the Bats Plans that was unvested immediately prior to the Effective Timeeffective time of the Merger was assumed by the RegistrantCompany and converted into awardsan award of restricted shares totaling 622,527 of Common Stock at a fair valueour common stock, subject to the same terms and conditions (including vesting schedule) that applied to the applicable Bats restricted shares immediately prior to the effective time of $78.05 per share.
Cboe Global Markets, Inc. and Subsidiaries
Notesthe Merger (but taking into account any changes, including any acceleration of vesting of such Bats restricted shares, occurring by reason provided for in the agreement related to Condensed Consolidated Financial Statements (unaudited)
In addition, on February 19, 2017 and February 28, 2017,the Merger).During the three months ended March 31, 2020, to satisfy employees’ tax obligations upon the vesting of restricted stock, the Company granted 41,481 and 19,255 RSUs, respectively,purchased 97,321 shares of common stock totaling $11.5 million as the result of the vesting of 246,850 shares of restricted stock.
PSUs
The following table summarizes restricted stock units contingent on theupon achievement of performance conditions, at a fair valuealso known as PSUs, activity during the three months ended March 31, 2020:
| | | | | |
| | | | Weighted |
| | Number of | | Average Grant |
| | Shares | | Date Fair Value |
Nonvested stock at December 31, 2019 | | 132,248 | | $ | 105.75 |
Granted | | 72,975 | | | 125.62 |
Vested | | (48,053) | | | 108.91 |
Forfeited | | (34,504) | | | 109.85 |
Nonvested stock at March 31, 2020 | | 122,666 | | $ | 115.18 |
PSUs include awards related to earnings per RSU,share during the performance period as well as awards related to total shareholder return during the performance period. The Company used the Monte Carlo valuation model method to estimate the fair value of the total shareholder return RSUsPSUs which incorporated the following assumptions: risk-free interest rate (0.90)(1.36)%, three-year volatility (21.1)(21.0)% and three yearthree-year correlation with S&P 500 Index (0.41)(0.25). Each of these performance shares has a performance condition under which the number of units ultimately awarded will vary from 0% to 200% of the original grant, with each unit representing the contingent right to receive one1 share of ourthe Company’s common stock. The vesting period for the RSUsPSUs contingent on the achievement of performance conditions is three years. For each of the performance awards, the RSUsPSUs will be settled in shares of ourthe Company’s common stock following vesting of the RSUPSU assuming that the participant has been continuously employed during the vesting period, subject to acceleration in the event of a change in control of the Company, or a termination of employment following a change in control, or in the event of a participant’s earlier death or disability. Participants have no voting rights with respect to the RSUsPSUs until the issuance of the shares of common stock. Dividends are accrued by the Company and will be paid onceafter the RSUs contingent on the achievement ofassociated performance conditions vest.
On May 18, 2017,are achieved and the Company granted 15,405PSUs are settled in shares of stock, at a fair value of $84.41 per share, to non employee
members of the board of directors. The shares have a one-year vesting period and vesting accelerates upon the occurrence of a
change in control of the Company. Unvested portions of the stock will be forfeited if the director leaves the Company prior to
the applicable vesting date.
On May 15, 2017, the Company granted 2,655 RSUs, each of which entitles the holder to one share ofCompany’s common stock upon vesting, to certain officers and employees at a fair value $85.00 per share. On August 15, 2017, the Company granted 1,612 RSUs at a fair value of $97.54 per share. The RSUs vest ratably over three-years , with one-third vesting on each anniversary of the grant date, and vesting accelerates upon the occurrence of a change in control. Unvested RSUs will be forfeited if the officer or employee leaves the Company prior to the applicable vesting date, except in limited circumstances. The RSUs have no voting rights but entitle the holder to receive dividend equivalents.
The Company recognized stock-based compensation expense of $9.1 million and $3.8 million forstock.In the three months ended September 30, 2017 and 2016, respectively, and $39.1 million and $10.9 million forMarch 31, 2020, to satisfy employees’ tax obligations upon the nine months ended September 30, 2017 and 2016. Stock-based compensation expense includes $9.1 million of accelerated expense recorded in the first quarter for certain officers and employees as a result of attaining certain age and service based requirements in our long-term incentive plan and award agreements. Stock-based compensation expense is included in compensation and benefits and acquisition-related costs in the condensed consolidated statements of income.
Pursuant to the Merger Agreement, each outstanding option to purchase Bats common stock (each, a “Bats stock option”) granted under any of the Bats Global Markets, Inc. 2009 Stock Option Plan, the Bats Global Markets, Inc. Third Amended and Restated 2012 Equity Incentive Plan and the Bats Global Markets, Inc. 2016 Omnibus Incentive Plan (collectively, the “Bats Plans”) that was outstanding immediately prior to the effective time of the Merger (the “Effective Time”) was converted into an option to purchase Common Stock, on the same terms and conditions (including vesting schedule) as were applicable to such Bats stock option (but taking into account any changes, including any acceleration of vesting of such Bats stock option occurring by reason of the transactions contemplated by the Merger Agreement). The number of shares of Common Stock subject to each such converted stock option equals the number of shares of Bats common stock subject to the corresponding Bats stock option immediately prior to the Effective Time, multiplied by the exchange ratio (as defined below) (subject to certain adjustments and rounding). The exercise price per share for each such converted stock option equals the per share exercise price specified in the corresponding Bats stock option divided by the exchange ratio (rounded up to the nearest cent). The “exchange ratio” is equal to 0.4452, which equals the sum of 0.3201 plus the fraction obtained by dividing $10.00 by the volume-weighted average price, rounded to four decimal points, of a share of Common Stock on NASDAQ for the ten consecutive trading days ended February 24, 2017.
Pursuant to the Merger Agreement, each award of restricted Bats common stock (“Bats restricted shares”) granted under any of the Bats Plans that was unvested immediately prior to the Effective Time was assumed by the Company and converted into an award of restricted shares of Common Stock, subject to the same terms and conditions (including vesting schedule) that applied to the applicable Bats restricted shares immediately prior to the Effective Time (but taking into account any changes, including any acceleration of vesting of such Bats restricted shares, occurring by reason provided for in the Merger Agreement). The number of shares of Common Stock subject to each such converted award of Bats restricted shares equals the number of shares of Bats common stock subject to the corresponding Bats restricted share award multiplied by the exchange ratio (as defined above).
Cboe Global Markets, Inc. and Subsidiaries
Notes to Condensed Consolidated Financial Statements (unaudited)
The activity in the Company's stock options, restricted stock and restricted stock units for the nine months ended September 30, 2017 was as follows:
Stock Options
Summary stock option activity is presented below:
|
| | | | | | | | | | |
| | | Number of Shares | Weighted Average Exercise Price | Weighted Average Remaining Contractual Term (years) | Aggregate Intrinsic Value (in millions) |
| |
| |
| |
| | Outstanding, December 31, 2016 |
|
|
|
| — |
|
| | Granted | 683,390 |
| $ | 22.45 |
| 4.8 years | $ | 40.1 |
|
| | Exercised | (231,003 | ) | $ | 18.50 |
| | |
| | Outstanding and expected to vest at September 30, 2017 | 452,387 |
| $ | 25.13 |
| 5.4 years | $ | 37.3 |
|
| | Exercisable at September 30, 2017 | 371,318 |
| $ | 24.48 |
| 5.0 years | $ | 31.8 |
|
The Company estimated the grant date fair value of options awarded during 2017 using the Black-Scholes valuation
model with the following assumptions:
|
| |
| 2017 |
Expected term (in years) | 4.2 |
Expected volatility | 19.8% |
Expected dividend yield | 1.3% |
Risk-free rate | 1.78% |
Forfeiture rate | —% |
Summary of the status of nonvested options is presented below:
|
| | | | | | |
| | Nonvested Options | Options | Weighted Average Grant-Date Fair Value |
| |
| |
| | January 1, 2017 - Nonvested | — |
| $ | — |
|
| | Vested | — |
| — |
|
| | Granted | 81,068 |
| 49.17 |
|
| | Forfeited | — |
| — |
|
| | September 30, 2017 - Nonvested | 81,068 |
| $ | 49.17 |
|
In the nine months ended September 30, 2017, to satisfy employee's tax obligations and cash exercise payment due upon the election to exercise 231,003 stock options,PSUs, the Company purchased 65,30219,456 shares at a cost of $6.0 million.
common stock totaling $2.4 million as the result of the vesting of 48,053 PSUs.As of September 30, 2017,March 31, 2020, there were $2.3$34.1 million in total unrecognized compensation costs related to restricted stock, options.RSUs, and PSUs. These costs are expected to be recognized over a weighted average period of 1.2 years as2.3 years.
Employee Stock Purchase Plan
In May 2018, the Company’s stockholders approved an Employee Stock Purchase Plan, (“ESPP”), under which a total of 750,000 shares of the Company’s common stock was made available for purchase to employees. The ESPP is a broad-based plan that permits employees to contribute up to 10% of wages and base salary to purchase shares of the Company’s common stock at a discount, subject to applicable annual Internal Revenue Service limitations. Under the ESPP, a participant may not purchase more than a maximum of 312 shares of the Company’s common stock during any single offering period. No participant may accrue options to purchase shares of the Company’s common stock at a rate that exceeds $25,000 in fair market value of the Company’s common stock (determined at the time such options are granted) for each calendar year in which such rights are outstanding at any time. The exercise price per share of common stock shall be 90% (for eligible U.S. employees) or 85% (for eligible international employees) of the lesser of the fair value of the stock options vest.
Cboe Global Markets, Inc. and Subsidiaries
Noteson the first day of the applicable offering period or the applicable exercise date.The Company records compensation expense over the offering period related to Condensed Consolidated Financial Statements (unaudited)
Restricted Stock and Restricted Stock Units
Summary restricted stock activitythe discount that is presented below:
|
| | | | | | |
| | | Number of Shares | Weighted Average Grant Date Fair Value |
| |
| |
| |
| | Nonvested stock at December 31, 2016 | 480,595 |
| $ | 63.64 |
|
| | Granted | 1,091,843 |
| 78.94 |
|
| | Vested | (386,717 | ) | 64.88 |
|
| | Forfeited | (5,442 | ) | 73.43 |
|
| | Nonvested stock at September 30, 2017 | 1,180,279 |
| $ | 77.26 |
|
Ingiven to employees, which totaled $0.1 million for the
ninethree months ended
September 30, 2017,March 31, 2020 and 2019, respectively. As of March 31, 2020, 710,103 shares were reserved for future issuance under the ESPP.18. EQUITY
Common Stock
The Company’s common stock is listed on Cboe BZX under the trading symbol CBOE. As of March 31, 2020, 325,000,000 shares of common stock were authorized, $0.01 par value, and 125,944,478 and 109,719,823 shares were issued and outstanding, respectively. As of December 31, 2019, 325,000,000 shares of common stock were authorized, $0.01 par value, and 125,701,889 and 110,656,892 shares were issued and outstanding, respectively. The holders of common stock are entitled to satisfy employees' tax obligations uponone vote per share.
Common Stock in Treasury, at Cost
The Company accounts for the purchase of treasury stock under the cost method with the shares of stock repurchased reflected as a reduction to Cboe stockholders’ equity and included in common stock in treasury, at cost in the condensed consolidated balance sheets. Shares repurchased under the Company’s share repurchase program are available to be redistributed. When treasury shares are redistributed, they are recorded at the average cost of the treasury
shares acquired. The Company held 16,224,655 and 15,044,997 shares of common stock in treasury as of March 31, 2020 and December 31, 2019, respectively.
Share Repurchase Program
In 2011, the board of directors approved an initial authorization for the Company to repurchase shares of its outstanding common stock of $100 million and approved additional authorizations of $100 million in each of 2012, 2013, 2014, 2015 and 2016, $150 million in February 2018, $100 million in August 2018, and $250 million in October 2019 for a total authorization of $1.1 billion. The Company expects to fund repurchases primarily through the use of existing cash balances. The program permits the Company to purchase shares, through a variety of methods, including in the open market or through privately negotiated transactions, in accordance with applicable securities laws. It does not obligate the Company to make any repurchases at any specific time or situation.
The table below shows the repurchased shares of common stock under the Company’s share repurchase program during the periods presented as follows:
| | | | | | |
| | | Three Months Ended March 31, |
| | 2020 | | 2019 |
Number of shares of common stock repurchased | | | 1,062,881 | | | 366,793 |
Average price paid per share | | $ | 112.46 | | $ | 95.36 |
Total purchase price (in millions) | | $ | 119.5 | | $ | 35.0 |
Since inception of the program through March 31, 2020, the Company has repurchased 14,778,890 shares of common stock at an average cost per share of $62.27, totaling $920.3 million.
As of March 31, 2020 and 2019, the Company had $179.7 million and $171.1 million of availability remaining under its existing share repurchase authorizations, respectively.
Purchase of Common Stock from Employees
The Company purchased 116,777 and 118,563 shares that were not part of the publicly announced share repurchase authorization from employees for an average price paid per share of $119.53 and $94.59 during the three months ended March 31, 2020 and 2019, respectively. These shares consisted of shares retained to cover payroll withholding taxes or option costs in connection with the vesting of restrictedRSAs, RSUs, PSUs, and stock option exercises.
Preferred Stock
The Company has authorized the issuance of 20,000,000 shares of preferred stock, par value $0.01 per share, issuable from time to time in one or more series. As of March 31, 2020, and December 31 2019, the Company purchased 144,807had 0 shares totaling $12.0 millionof preferred stock issued or outstanding.
Dividends
During the three months ended March 31, 2020, the Company declared and paid cash dividends per share of $0.36 for an aggregate payout of $40.0 million. During the three months ended March 31, 2019, the Company declared and paid cash dividends per share of $0.31 for an aggregate payout of $34.8 million.
Each share of common stock, including RSAs, RSUs, and PSUs, is entitled to receive dividend and dividend equivalents, respectively, if, as and when declared by the resultboard of directors of the vestingCompany. The Company’s expectation is to continue to pay dividends. The decision to pay a dividend, however, remains within the discretion of 386,717 sharesthe Company’s board of restricted stock.directors and may be affected by various factors, including our earnings, financial condition, capital requirements, level of indebtedness and other considerations our board of directors deems relevant. Future debt obligations and statutory provisions, among other things, may limit, or in some cases prohibit, our ability to pay dividends.
As a holding company, the Company’s ability to declare and continue to pay dividends in the future with respect to its common stock will also be dependent upon the ability of September 30, 2017, there were $55.6 million in total unrecognized compensation costs relatedits subsidiaries to restricted stock and restricted stock units. These costs are expectedpay dividends to be recognized over a weighted average period of 2.0 years.
it under applicable corporate law.
The Company records income tax expense during interim periods based on the best estimate of the full year’s income tax rate as adjusted for discrete items, if any, that are taken into account in the relevant interim period. Each quarter, the Company updates its estimate of the annual effective income tax rate and any change in the estimated rate is recorded on a cumulative basis.
The effective income tax rate from continuing operations was 43.1%27.6% and 39.9%25.5% for the three months ended September 30, 2017March 31, 2020 and 2016,2019, respectively. The increase in thelower effective income tax rate for the three months ended September 30, 2017 against the comparable period in the prior yearMarch 31, 2019 was primarily due to a re-measurement of our deferred tax assets and liabilities as a result of a 1.75% corporate income tax rate increase in Illinois enacted on July 6, 2017.
The effective tax rate from continuing operations was 37.7% and 39.3% for the nine months ended September 30, 2017 and 2016, respectively. The decrease in the effective tax rate for the nine months ended September 30, 2017 against the comparable period in the prior year was primarily due to discrete events during the nine-month period, mainly the re-measurement of tax reserves and excess tax benefits
associatedrelated to equity awards.The Company petitioned the U.S. Tax Court on January 13, 2017, May 7, 2018 and November 29, 2018 for a redetermination of Internal Revenue Service notices of deficiency for Cboe and certain of its subsidiaries for tax years 2011 through 2015 related to its Section 199 claims. The Company also filed a complaint on October 5, 2018 with the exerciseCourt of Federal Claims for a refund of Section 199 claims related to tax years 2008 through 2010. The Company believes the aggregate amount of any additional liabilities that may result from these examinations, if any, will not have a material adverse effect on the financial position, results of operations, or cash flows of the Company. As of March 31, 2020, the Company has not resolved these matters, and vestingproceedings continue in the U.S. Tax Court and the Court of stock-based compensation.
20. NET INCOMEEARNINGS PER COMMON SHARE
The computation of basic net income allocated toper common stockholdersshare is calculated by reducing net income for the period by dividends paid or declared and undistributed net income for the period that are allocated to participating securities to arrive at net income allocated to common stockholders. Net income allocated to common stockholders is divided by the weighted average number of common shares outstanding during the period to determine net income per share allocated to common stockholders.
The computation of diluted earningsnet income per share is calculated by dividing net income allocated to common stockholders by the sum of the weighted average number of common shares outstanding plus all additional common shares that would have been outstanding if the potentially dilutive common shares had been issued. The dilutive effect is calculated using the more dilutive of the two-class or treasury stock method.
Additionally, the change in the redemption value for the noncontrolling interest reduces net income allocated to common shareholders.stockholders.
Cboe Global Markets, Inc. and Subsidiaries
Notes to Condensed Consolidated Financial Statements (unaudited)
The following table reconciles net income allocated to common stockholders andsets forth the numbercomputation of shares used to calculate the basic and diluted net incomeearnings per common share (in millions, except per share data) for the three and nine months ended September 30, 2017March 31, 2020 and 2016:
|
| | | | | | | | | | | | | | | | |
| | | Three Months Ended
September 30, | | Nine Months Ended
September 30, |
| (in millions, except per share amounts) | | 2017 | | 2016 | | 2017 | | 2016 |
| Basic EPS Numerator: | | | | | | | | |
| Net Income | | $ | 60.3 |
| | $ | 40.5 |
| | $ | 143.5 |
| | $ | 140.6 |
|
| Loss attributable to noncontrolling interest | | 0.2 |
| | 0.3 |
| | 0.8 |
| | 0.8 |
|
| Net Income Excluding Noncontrolling Interest | | 60.5 |
| | 40.8 |
| | 144.3 |
| | 141.4 |
|
| Change in redemption value of noncontrolling interest | | (0.2 | ) | | (0.3 | ) | | (0.8 | ) | | (0.8 | ) |
| Earnings allocated to participating securities | | (0.6 | ) | | (0.2 | ) | | (1.4 | ) | | (0.6 | ) |
| Net Income Allocated to Common Stockholders | | $ | 59.7 |
| | $ | 40.3 |
| | $ | 142.1 |
| | $ | 140.0 |
|
| Basic EPS Denominator: | | | | | | | | |
| Weighted average shares outstanding | | 112.3 |
| | 81.3 |
| | 105.5 |
| | 81.5 |
|
| Basic Net Income Per Common Share | | $ | 0.53 |
| | $ | 0.50 |
| | $ | 1.35 |
| | $ | 1.72 |
|
| | | | | | | | | |
| Diluted EPS Numerator: | | | | | | | | |
| Net Income | | $ | 60.3 |
| | $ | 40.5 |
| | $ | 143.5 |
| | $ | 140.6 |
|
| Loss attributable to noncontrolling interest | | 0.2 |
| | 0.3 |
| | 0.8 |
| | 0.8 |
|
| Net Income Excluding Noncontrolling Interest | | 60.5 |
| | 40.8 |
| | 144.3 |
| | 141.4 |
|
| Change in redemption value of noncontrolling interest | | (0.2 | ) | | (0.3 | ) | | (0.8 | ) | | (0.8 | ) |
| Earnings allocated to participating securities | | (0.6 | ) | | (0.2 | ) | | (1.4 | ) | | (0.6 | ) |
| Net Income Allocated to Common Stockholders | | $ | 59.7 |
| | $ | 40.3 |
| | $ | 142.1 |
| | $ | 140.0 |
|
| Diluted EPS Denominator: | | | | | | | | |
| Weighted average shares outstanding | | 112.3 |
| | 81.3 |
| | 105.5 |
| | 81.5 |
|
| Dilutive common shares issued under stock program | | 0.3 |
| | — |
| | 0.3 |
| | — |
|
| Total Dilutive Weighted Average Shares | | 112.6 |
| | 81.3 |
| | 105.8 |
| | $ | 81.5 |
|
| Diluted Net Income Per Common Share | | $ | 0.53 |
| | $ | 0.50 |
| | $ | 1.34 |
| | $ | 1.72 |
|
2019:
| | | | | | | |
| | Three Months Ended March 31, | |
(in millions, except per share amounts) | | 2020 | | 2019 | |
Basic earnings per share numerator: | | | | | | | |
Net income | | $ | 157.4 | | $ | 95.2 | |
Loss attributable to noncontrolling interest | | | — | | | 0.2 | |
Net income excluding noncontrolling interest | | | 157.4 | | | 95.4 | |
Change in redemption value of noncontrolling interest | | | — | | | (0.2) | |
Earnings allocated to participating securities | | | (0.4) | | | (0.6) | |
Net income allocated to common stockholders | | $ | 157.0 | | $ | 94.6 | |
Basic earnings per share denominator: | | | | | | | |
Weighted average shares outstanding | | | 110.4 | | | 111.5 | |
Basic earnings per share | | $ | 1.42 | | $ | 0.85 | |
| | | | | | | |
Diluted earnings per share numerator: | | | | | | | |
Net income | | $ | 157.4 | | $ | 95.2 | |
Loss attributable to noncontrolling interest | | | — | | | 0.2 | |
Net income excluding noncontrolling interest | | | 157.4 | | | 95.4 | |
Change in redemption value of noncontrolling interest | | | — | | | (0.2) | |
Earnings allocated to participating securities | | | (0.4) | | | (0.6) | |
Net income allocated to common stockholders | | $ | 157.0 | | $ | 94.6 | |
Diluted earnings per share denominator: | | | | | | | |
Weighted average shares outstanding | | | 110.4 | | | 111.5 | |
Dilutive potential common shares outstanding | | | 0.2 | | | 0.2 | |
Total dilutive weighted average shares | | | 110.6 | | | 111.7 | |
Diluted earnings per share | | $ | 1.42 | | $ | 0.85 | |
For the periods presented, the Company did not have shares of stock-based compensation that would have an anti-dilutive effect on the computation of diluted net income per common share.
21. COMMITMENTS, CONTINGENCIES AND CONTINGENCIES
GUARANTEESLegal Proceedings
As of September 30, 2017,March 31, 2020, the Company was subject to the various legal proceedings and claims discussed below, as well as certain other legal proceedings and claims that have not been fully resolved and that have arisen in the ordinary course of business.
The Company reviews its legal proceedings and claims, regulatory reviews and inspections and other legal proceedings on an ongoing basis and follows appropriate accounting guidance when making accrual and disclosure decisions. The Company establishes accruals for those contingencies where the incurrence of a loss is probable and can be reasonably estimated, and the Company discloses the amount accrued and the amount of a reasonably possible loss in excess of the amount accrued, if such disclosure is necessary for ourthe condensed consolidated financial statements to not be misleading. The Company does not record liabilities when the likelihood that the liability has been incurred is probable, but the amount cannot be reasonably estimated, or when the liability is believed to be only reasonably possible or remote. The Company'sCompany’s assessment of whether a loss is remote, reasonably possible, or probable is based on its assessment of the ultimate outcome of the matter following all appeals.
As of September 30, 2017,March 31, 2020, the Company does not believe that there is a reasonable possibility that any material loss exceeding the amounts already recognized for these legal proceedings and claims, regulatory reviews, inspections or
other legal proceedings, if any, has been incurred. While the consequences of certain unresolved proceedings are not presently determinable, the outcome of any litigationproceeding is inherently uncertain and an adverse outcome from certain matters could have a material effect on our earningsthe financial position, results of operations, or cash flows of the Company in any given
Cboe Global Markets, Inc. and Subsidiaries
Notes to Condensed Consolidated Financial Statements (unaudited)
reporting period. However, in the opinion of management, the ultimate liability is not expected to have a material effect on our financial position, liquidity or capital resources.
ThereExcept as set forth herein, there have been no material changes during the period covered by this Form 10-Q from the legal proceedings disclosures in ourthe Annual Report on Form 10-K for the year ended December 31, 2016.2019.
SIFMA
Securities Industry Financial Markets Association (“SIFMA”) has filed a number of denial of access applications with the SEC to set aside proposed rule changes to establish or modify fees for Cboe Options, C2, BZX, BYX, EDGX and EDGA (the “Exchanges”) market data products and related services (the “Challenged Fees”). The Challenged Fees were held in abeyance pending a decision, which was issued by the SEC on October 16, 2018, on a separate SIFMA denial of access application regarding fees proposed by Nasdaq and the NYSE for their respective market data products. In a second order entered on October 16, 2018, the SEC issued an order (the “Order”) that remanded the stayed Challenged Fees and ordered the Exchanges to: (i) within six months of the Order, provide notice to the SEC of developed or identified fair procedures for assessing the Challenged Fees (the “Procedures”) and (ii) within one year of the Order, apply the Procedures to the Challenged Fees and submit to the SEC a record explaining the Exchanges’ conclusions. On October 26, 2018, the Exchanges filed a motion to reconsider the Order with the SEC. On November 21, 2018, the Exchanges filed with the SEC a joinder motion to NYSE’s prior motion for stay of the Order. On December 3, 2018, SIFMA filed a response to NYSE’s motion for stay. Nasdaq withdrew its motion to reconsider the Order with the SEC on December 4, 2018, and on December 5, 2018, filed a Petition for Review with the Court of Appeals for the D.C. Circuit (the “D.C. Circuit”). On December 14, 2018, the SEC denied the motion for stay but tolled the compliance date set forth in the remand order until ruling is made on the motion to reconsider. The Exchanges and NYSE filed on January 4, 2019 a motion to intervene in the Nasdaq Petition for Review to ensure the ability to participate in the case; the motion to intervene was granted on January 25, 2019. On the same day, SIFMA filed a motion with the D.C. Circuit moving to dismiss or hold in abeyance the Petition for Review. The Exchanges and NYSE submitted on February 6, 2019 a statement of issues for consideration in connection with the Petition for Review pending before the D.C. Circuit. On March 29, 2019, the D.C. Circuit issued an order indicating that SIFMA’s motion to dismiss will be considered with the underlying merits of the Petition for Review. On May 7, 2019, the SEC denied the Exchanges and NYSE’s motion for reconsideration of the Order. The SEC also further tolled the effectiveness of the remand order subject to the resolution of the substantive SIFMA case against Nasdaq and NYSE Arca that is already before the D.C. Circuit. On June 17, 2019, the Exchanges filed a petition for review of the May 7, 2019 SEC order denying reconsideration of the Order with the D.C. Circuit and of the Order. The Exchanges’ joint opening brief was filed on October 23, 2019, the SEC’s response was filed on November 22, 2019, the Exchanges’ joint reply was filed on December 20, 2019 and final briefs were filed on January 10, 2020. Oral arguments were held on February 18, 2020. An adverse ruling in that matter or a subsequent appeal could adversely affect exchange market data fees. However, the Company believes that the claims are without merit and intends to litigate the matter vigorously. The Company is unable to estimate what, if any, liability may result from this litigation.
VIX Litigation
On March 20, 2018, a putative class action complaint captioned Tomasulo v. Cboe Exchange, Inc., et al., No. 18-cv-02025 was filed in federal district court for the Northern District of Illinois alleging that the Company intentionally designed its products, operated its platforms, and formulated the method for calculating VIX and the Special Opening Quotation, (i.e., the special VIX value designed by the Company and calculated on the settlement date of VIX derivatives prior to the opening of trading), in a manner that could be collusively manipulated by a group of entities named as John Doe defendants. A number of similar putative class actions, some of which do not name the Company as a party, were filed in federal court in Illinois and New York on behalf of investors in certain volatility-related products. On June 14, 2018, the Judicial Panel on Multidistrict Litigation centralized the putative class actions in the federal district court for the Northern District of Illinois. On September 28, 2018, plaintiffs filed a master, consolidated complaint that is a putative class action alleging various claims against the Company and John Doe defendants in the federal district court for the Northern District of Illinois. The claims asserted against the Company
consist of a Securities Exchange Act fraud claim, three Commodity Exchange Act claims and a state law negligence claim. Plaintiffs request a judgment awarding class damages in an unspecified amount, as well as punitive or exemplary damages in an unspecified amount, prejudgment interest, costs including attorneys’ and experts’ fees and expenses and such other relief as the court may deem just and proper. On November 19, 2018, the Company filed a motion to dismiss the master consolidated complaint and the plaintiffs filed their response on January 7, 2019. The Company filed its reply on January 28, 2019. On May 29, 2019, the federal district court for the Northern District of Illinois granted the Company’s motion to dismiss plaintiffs’ entire complaint against the Company. The state law negligence claim was dismissed with prejudice and the other claims were dismissed without prejudice with leave to file an amended complaint, which plaintiffs filed on July 19, 2019. On August 28, 2019, the Company filed its second motion to dismiss the amended consolidated complaint and plaintiffs filed their response on October 8, 2019. On January 27, 2020, the federal district court for the Northern District of Illinois granted the Company’s second motion to dismiss and all counts against the Company were dismissed with prejudice. On April 21, 2020, the federal district court for the Northern District of Illinois granted plaintiffs’ motion to certify the January 27, 2020 dismissal order for an immediate appeal. The Company currently believes that the claims are without merit and intends to litigate the matter vigorously. The Company is unable to estimate what, if any, liability may result from this litigation.
Other
As self-regulatory organizations under the jurisdiction of the SEC, Cboe Options, C2, BZX, BYX, EDGX and EDGA are subject to routine reviews and inspections by the SEC. As a designated contract market under the jurisdiction of the CFTC, CFE is subject to routine reviews and inspections by the CFTC. Cboe SEF, LLC is a swap execution facility registered with the CFTC and subject to routine reviews and inspections by the CFTC. Cboe Trading is subject to reviews and inspections by FINRA. The Company has from time to time received inquiries and investigative requests from the SEC’s Office of Compliance Inspections and Examinations as well as the Division of Enforcement seeking information about the Company’s compliance with its obligations as a self-regulatory organization, the federal securities laws as well as members’ compliance with the federal securities laws. In addition, while Cboe Europe Limited and Cboe Chi-X Europe have not been the subject of any material litigation or regulatory investigation in the past, there is always the possibility of such action in the future. As both companies are domiciled in the U.K., it is likely that any action would be taken in the U.K. courts in relation to litigation or by the FCA in relation to any regulatory enforcement action.
The Company is also currently a party to various other legal proceedings in addition to those already mentioned. Management does not believe that the likely outcome of any of these other reviews, inspections, investigations or other legal proceedings is expected to have a material impact on the Company’s financial position, results of operations, liquidity or capital resources.
See also Note 7 (“Credit Losses”) for information on promissory notes related to the CAT.
See also Note 19 (“Income Taxes”).
Contractual Obligations
See Note 22 (“Leases”) for information on lease obligations.
22. LEASES
The Company currently leases office space, data centers, and remote network operations centers, and equipment under non-cancelable operating leases with lease terms remaining ranging from three months to one hundred monthsthird parties as of September 30, 2017. Total rentMarch 31, 2020. Leases with an initial term of 12 months or less are not recorded on the condensed consolidated balance sheets and the Company recognizes lease expense related to these lease obligations, reflected in technology support services and facilities costs line items onwithin the condensed consolidated statements of income for these leases on a straight-line basis over the lease term. Certain leases include one or more options to renew, with renewal terms that can extend the lease term from one to five years or more, and some of which include the Company’s option to terminate the leases within one year. As the implicit rate in the Company’s leases are generally not reasonably determinable, the Company applies an incremental borrowing rate based on the information available at the lease commencement date in determining the present value of lease payments. During the three months ended March 31, 2020, an additional $64.2 million of right of use assets and
$84.7 million of lease liabilities were added related to new operating leases. Additionally, the Company recognized $20.4 million related to leasehold improvement incentives paid by the lessor.
In September 30, 20172019, the Company signed a new lease to secure approximately 185,000 square feet of office space within the Old Post Office building in Chicago, Illinois, which will serve as the Company’s new global headquarters. The initial term of the lease will be 187 months from the accounting commencement date, January 13, 2020. The Company has the option to renew the lease term for an additional 60 months. The total legally binding minimum lease payments for this lease are approximately $98.8 million. See Note 6 (“Property and 2016 were $2.2 millionEquipment, Net”) for information on the current headquarters location.
Additionally, in September 2019, the Company signed a new lease to secure approximately 40,000 square feet of office space within the Chicago Board of Trade Building in Chicago, Illinois, where the Company plans to build a new trading floor and $0.4 million,office space. The initial term of the lease will be 150 months from the accounting commencement date, May 1, 2020. The Company has the option to renew the lease term for an additional 60 months. The total legally binding minimum lease payments for this lease are approximately $17.1 million.
The following table presents the supplemental balance sheet information related to leases as of March 31, 2020 and December 31, 2019, respectively (in millions):
| | | | | |
| March 31, | | December 31, |
| 2020 | | 2019 |
Operating lease right of use assets | $ | 114.0 | | $ | 53.4 |
Total leased assets | $ | 114.0 | | $ | 53.4 |
| | | | | |
Accrued liabilities | $ | 9.6 | | $ | 8.7 |
Non-current operating lease liabilities | | 128.3 | | | 46.7 |
Total leased liabilities | $ | 137.9 | | $ | 55.4 |
The following table presents operating lease costs and $5.7 millionother information as of and $1.0 million, for the ninethree months ended September 30, 2017March 31, 2020 and 2016, respectively.
| | | | | | |
| Three Months Ended March 31, |
| 2020 | 2019 |
Operating lease costs (1) | $ | 4.9 | | $ | 3.5 | |
| | | | | | |
Lease term and discount rate information: | | | | | | |
Weighted average remaining lease term (years) | | 13.2 | | | 9.5 | |
Weighted average discount rate | | 3.5 | % | | 3.1 | % |
| | | | | | |
Supplemental cash flow information and non-cash activity: | | | | | | |
Cash paid for amounts included in the measurement of lease liabilities | $ | 2.8 | | $ | 2.1 | |
Lease incentive for leasehold improvements | | 20.4 | | | — | |
Right-of-use assets obtained in exchange for lease liabilities (2) | | 64.2 | | | 18.9 | |
|
| (1) | | | | | |
| | | | | Includes short-term lease and variable lease costs, which are immaterial. |
| (2) | Excludes right-of-use assets and lease liabilities recognized upon adoption of the lease accounting standard in 2019 of $40.3 million and $42.8 million, respectively. |
The maturities of the lease liabilities are as follows as of March 31, 2020 (in millions):
| | | |
| | March 31, |
| | 2020 |
Remainder of 2020 | | $ | 10.1 |
2021 | | | 16.3 |
2022 | | | 15.6 |
2023 | | | 14.3 |
2024 | | | 10.1 |
After 2024 | | | 108.7 |
Total lease payments (1) | | $ | 175.1 |
Less: Interest | | | (37.2) |
Present value of lease liabilities | | $ | 137.9 |
22.
| (1) | Total lease payments include $20.4 million related to options to extend lease terms that are reasonably certain of being exercised and exclude $17.1 million of legally binding lease payments for leases signed but will commence after March 31, 2020. |
23. SUBSEQUENT EVENTS
On October 27, 2017, the Company announced that its board of directors declared a quarterly cash dividend of $0.27 per share. The dividend is payable December 15, 2017 to stockholders of record at the close of business on December 1, 2017.
There have been no additional subsequent events that would require disclosure in, or adjustment to, the condensed consolidated financial statements as of and for the ninethree months ended September 30, 2017.March 31, 2020.
Item 2. Management'sManagement’s Discussion and Analysis of Financial Condition and Results of Operations
The following discussion should be read in conjunction with the accompanying unaudited condensed consolidated financial statements and the notes thereto, included in Item 1 in this Quarterly Report on Form 10-Q, and the audited consolidated financial statements in the Company’s Annual Report on Form 10-K for the year ended December 31, 2016,2019, and as contained in that report, the information under the heading “Management’s Discussion and Analysis of Financial Condition and Results of Operations.” This discussion contains forward-looking information. Please see
“Forward-Looking “Forward-Looking Statements” for a discussion of the uncertainties, risks and assumptions associated with these statements.
Cboe Global Markets, Inc. is one of the world’s largest exchange holding companies, offering cutting-edge trading and investment solutions to investors around the world. The companyCompany is committed to relentlessdefining markets to benefit its participants and drive the global marketplace forward through product innovation, connecting global markets with world-classleading edge technology and providing seamless solutions that enhance the customer experience.
trading solutions.Cboe offers trading across a diverse range of products in multiple asset classes and geographies, including options, futures, U.S. and European equities, exchange-traded products (ETPs)(“ETPs”), global foreign exchange (FX)(“FX”) and multi-asset volatility products based on the VIX Index, recognized as the world’s barometer forpremier gauge of U.S. equity market volatility.
Cboe’s trading venuessubsidiaries include the largest options exchange in the U.S. by volume and the third largest stock exchange by value traded in Europe. In addition, the Company is the second-largest stock exchange operator in the U.S. In addition, the Company operates one of the largest equities stock exchanges by volumevalue traded in Europe and is a leading market globally for ETP listings and trading.
The Company is headquartered in Chicago with offices in Kansas City, New York, London, San Francisco, Amsterdam, Singapore, Hong Kong, and Ecuador.
In October 2017,Business Segments
The Company reports five business segments: Options, U.S. Equities, Futures, European Equities, and Global FX. Segment performance is primarily based on operating income (loss). The Company has aggregated all of its corporate costs and eliminations, as well as other business ventures, within Corporate Items and Eliminations; however, operating expenses that relate to activities of a specific segment have been allocated to that segment. Our management allocates resources, assesses performance and manages our business according to these segments:
Options. Our options segment includes listed options on market indices (“index options”), mostly on an exclusive basis, as well as on non-exclusive “multi-listed” options, such as options on the Company changed its legal namestocks of individual corporations (“equity options”) and options on ETPs, such as exchange-traded funds (“ETFs”) and exchange-traded notes (“ETNs”). These options trade on Cboe Options, C2, BZX, and EDGX. Cboe Options is our primary options market and offers trading in listed options through a single system, known as our Hybrid trading model, which integrates electronic trading and traditional open outcry trading on our trading floor in Chicago. There is a temporary suspension of open outcry trading in response to the COVID-19 pandemic. C2, BZX, and EDGX are our all-electronic options exchanges, and typically operate with different market models and fee structures than Cboe Options. The Options segment also includes applicable market data revenue generated from CBOE Holdings, Inc. tothe U.S. tape plan, the sale of proprietary market data, index licensing, and access and capacity services.
U.S. Equities. The U.S. Equities segment includes listed equities and ETP transaction services that occur on BZX, BYX, EDGX, and EDGA. This segment also includes ETP listings on BZX, the Cboe Global Markets, Inc. common stock listing, applicable market data revenue generated from the U.S. tape plans, the sale of proprietary market data, routing services, access and capacity services and advertising activity from ETF.com.
Futures. Our Futures segment includes the business of our futures exchange, CFE, which includes offerings for trading VIX futures and other futures products, as well as revenue generated from the sale of proprietary market data and from access and capacity services.
European Equities.The amendmentEuropean Equities segment includes the pan-European listed equities transaction services, ETPs, exchange traded commodities, and international depository receipts that occur on MTFs operated by Cboe Europe Equities. It also includes the listings business where ETPs can be listed on RMs. Cboe Europe Equities operates lit and dark books, a periodic auctions book, and a Large-in-Scale (“LIS”) trading negotiation facility. Cboe NL, launched in October 2019, operates similar business functionality that is offered by Cboe Europe, other than LIS, and provides for trading only in European Economic Area symbols. Cboe Europe Equities also includes revenue generated from the sale of proprietary market data and from access and capacity services.
Global FX. Our Global FX segment includes institutional FX trading services that occur on the Cboe FX platform, as well as non-deliverable forward FX transactions offered for execution on Cboe SEF, as well as revenue generated from the sale of proprietary market data and from access and capacity services.
General Factors Affecting Results of Operations
In broad terms, our business performance is impacted by a number of drivers, including macroeconomic events affecting the risk and return of financial assets, investor sentiment, the regulatory environment for capital markets, geopolitical events, central bank policies and changing technology, particularly in the financial services industry. Our future revenues and net income will continue to be influenced by a number of domestic and international economic trends, including:
| ● | trading volumes on our proprietary products such as VIX options and futures and SPX options; |
| ● | trading volumes in listed equity securities and ETPs in both the U.S. and Europe, volumes in listed equity options, and volumes in institutional FX trading; |
| ● | the demand for and the pricing structure of the U.S. tape plan market data distributed by the Securities Information Processors (SIPs), which determines the pool size of the industry market data revenue we receive based on our market share; |
| ● | consolidation and expansion of our customers and competitors in the industry; |
| ● | the demand for information about, or access to, our markets, which is dependent on the products we trade, our importance as a liquidity center and the quality and pricing of our data and access and capacity services; |
| ● | continuing pressure in transaction fee pricing due to intense competition in the United States and Europe; |
| ● | significant fluctuations in foreign currency translation rates or weakened value of currencies; and |
| ● | regulatory changes relating to market structure and increased capital requirements, and those which affect certain types of instruments, transactions, pricing structures, capital market participants or reporting or compliance requirements, including any changes resulting from Brexit. |
A number of significant structural, political and monetary issues and the COVID-19 pandemic continue to confront the global economy, and instability could continue, resulting in an increased or subdued level of market volatility, changes in trading volumes and greater uncertainty.
On March 11, 2020, the World Health Organization declared COVID-19 a global pandemic. We are closely monitoring developments around COVID-19 and following guidance provided by governmental and public health agencies. In response to COVID-19, we have provided frequent communications to employees, customers, regulators, critical vendors, technology equipment suppliers, data and disaster recovery centers, and other service providers and instructed non-essential employees to work from home on a temporary basis, implemented travel restrictions, and after the close of business on March 13, 2020, temporarily suspended open outcry trading, without any significant disruptions to our business or control processes. We will continue to take further actions as necessary in response to addressing COVID-19. As of the date of this report, it is too early to determine the full impact this virus may have on the global financial markets and the overall economy. Our business and operations could be materially and adversely affected by the effects of COVID-19, however, the extent to which our results could be affected by COVID-19 largely depends on future developments which cannot be accurately predicted and are uncertain. Further, changes in trading behavior,
market disruptions and other future developments caused by the effects of COVID-19 could impact trading volumes and the demand for our products, market data, and services, which could have a material adverse effect the name change was filedon our business, financial condition, operating results and became effective with the State of Delaware on October 16, 2017.
On February 28, 2017, pursuant to the Agreement and Plan of Merger, dated as of September 25, 2016, Cboe acquired Bats Global Markets, Inc. The three months ended September 30, 2017 includes financial results for Batscash flows for the entire period. The nine months ended September 30, 2017 includes financial results for Bats for theremainder of fiscal year 2020 and could be material during any future period from March 1, 2017 through September 30, 2017, respectively.
impacted either directly or indirectly by this pandemic.Components of Revenues
Transaction fees represent fees charged by the Company for the performance obligation of executing a trade on its markets. These fees can be variable based on trade volume tiered discounts, however as all tiered discounts are calculated monthly, the actual discount is recorded on a monthly basis. Transaction fees, as well as any tiered volume discounts, are calculated and billed monthly in accordance with the Company’s published fee schedules. Transaction fees are recognized across all segments. The Company also pays liquidity payments to customers based on its published fee schedules. The Company uses these payments to improve the liquidity on its markets
Access and therefore recognizes those payments as a cost of revenue.
Accessand capacity fees represent fees assessed for the opportunity to trade, including fees for trading-related functionality across all segments. Theysegments, terminal and other equipment rights, maintenance services, trading floor space and telecommunications services. Facilities, systems services and other fees are generally monthly fee-based. These fees are billed monthly in accordance with the Company’s published fee schedules and recognized on a monthly basis when the performance obligation is met. There is no remaining performance obligation after revenue is recognized.
Exchange ServicesAll access and Other Fees
To facilitate trading, the Company offers technology services, terminal and other equipment rights, maintenance services, trading floor space and telecommunications services. Trading floor and equipment rights are generally on a month-to-month basis. Facilities, systems services and other fees are generally monthly fee-based, although certain services are influenced by trading volume or other defined metrics, others are based solely on demand. Allcapacity fees associated with the trading floor are recognized in the Options segment.
There is no remaining performance obligation after revenue is recognized.Market Data Fees
Market data fees represent the fees from the U.S. tape plans and fees from customers for proprietary market data. Fees from the U.S. tape plans are collected monthly based on published fee schedules and distributed quarterly to the U.S. exchangesExchanges based on a known formula using trading and/or quoting activity. A contract aroundfor proprietary market data is entered into and charged on a monthly basis in accordance with the Company’s published fee schedules as the service is provided. Both types of market data are satisfied over time, and revenue is recognized on a monthly basis as the customer receives and consumes the benefit as the Company provides the data. U.S. tape plan market data is recognized in the U.S. Equities and Options segments. Proprietary market data fees are recognized across all segments.
Regulatory fees primarily represent fees collected by the Company to cover the Section 31 fees charged to the Exchanges under the authority of the SEC (Cboe Options, C2, BZX, BYX, EDGX, and EDGA) and are charged by the SEC. Consistent with industry practice, the fees charged to customers are based on the fee set by the SEC per notional value of the transaction executed on the Company’s markets andmarkets. These fees are calculated and billed monthly. These feesmonthly and are recognized in the U.S. Equities and Options segments and assegments. As the exchangesExchanges are responsible for the ultimate payment to the SEC, the exchangesExchanges are considered the principals in these transactions. Regulatory fees also include the options regulatory fee (ORF)(“ORF”) which supports the Company’s regulatory oversight function in the Options segment.
segment, along with other miscellaneous regulatory fees, and neither can be used for non-regulatory purposes. The ORF and miscellaneous fees are recognized when the performance obligation is fulfilled.Other Revenue
Other revenue primarily includes among other items, revenue from various licensing agreements, all fees related to the trade reporting facility operated in the European Equities segment, and revenue associated with advertisements through the Company’s website.websites.
Components of Cost of Revenues
Liquidity payments are directly correlated to the volume of securities traded on our markets. As mentionedstated above, we record the liquidity rebaterebates paid to market participants providing liquidity, in the case of C2, BZX, EDGX, and Cboe Europe Equities, as cost of revenue. BYX and EDGA offer a pricing model pursuant to which we rebate liquidity takers for executing against an order resting on our book, which is also recorded as a cost of revenue.
ClearingVarious rules require that U.S. options and cash equities trade executions occur at the National Best Bid/Offer (NBBO)(“NBBO”) displayed by any exchange. Linkage order routing consists of the cost incurred to provide a service whereby Cboe equityequities and options exchanges deliver orders to other execution venues when there is a potential for obtaining a better execution price or when instructed to directly route an order to another venue by the order provider. The service affords exchange order flow providers an opportunity to obtain the best available execution price and may also result in cost benefits to those clients. Such an offering improves our competitive position and provides an opportunity to attract orders which would otherwise bypass our exchanges. We utilize third-party brokers or our broker-dealer, Cboe Trading, to facilitate such delivery.
Exchanges under the authority of the SEC (Cboe Options, C2, BZX, BYX, EDGX, and EDGA) are assessed fees pursuant to the Exchange Act designed to recover the costs to the U.S. government of supervision and regulation of securities markets and securities professionals. We treat these fees as a pass-through charge to customers executing eligible listed cash equities and listed equity options trades. Accordingly, we recognize the amount that we are charged under Section 31 as a cost of revenues and the corresponding amount that we charge our customers as regulatory transaction fees revenue. Since the regulatory transaction fees recorded in revenues are equal to the Section 31 fees recorded in cost of revenues, there is no impact on our operating income. CFE, Cboe Europe EquitiesLimited and Cboe FX are not U.S. national securities exchanges, and accordingly doare not paycharged Section 31 fees.
Royalty fees primarily consist of license fees paid by us for the use of underlying indexesindices in our proprietary products usually based on contracts traded. The Company has licenses with the owners of the S&P 500 Index, S&P 100 Index and certain other S&P indexes,indices, FTSE Russell indices, the DJIA, MSCI, FTSE Russell indexes and certain other index products. This category also includes fees related to the dissemination of market data related to S&P indexes.
indices and PULse system terminal fees.Components of Operating Expenses
Compensation and Benefits
Compensation and benefits represent our largest expense category and tend to be driven by both our staffing requirements, financial performance, and the general dynamics of the employment market. Stock-based compensation is a non-cash expense related to equity awards. Stock-based compensation can vary depending on the quantity and fair value of the award on the date of grant and the related service period.
Depreciation and Amortization
Depreciation and amortization expense results from the depreciation of long-lived assets purchased, and the amortization of purchased and internally developed software, and the amortization of intangible assets.
Technology Support Services
Technology support services expense consists primarily of costs related to the maintenance of computer equipment supporting our system architecture, circuits supporting our wide area network, support for production software, fees paid to information vendors for displaying data and off-site system hosting fees.
Professional Fees and Outside Services
Professional fees and outside services consist primarily of consulting services, which include: the supplementation ofsupplemental staff for activities primarily related to systems development and maintenance, legal, regulatory and audit, and tax advisory services.
Travel and Promotional Expenses
Travel and promotional expenses primarily consist of advertising, costs for special events, sponsorship of industry conferences, options education seminars and travel-related expenses.
Facilities costs primarily consist of expenses related to owned and leased properties including rent, maintenance, utilities, real estate taxes and telecommunications costs.
Acquisition-Related Costs
Acquisition-related costs relate to acquisitions and other strategic opportunities, including the Merger. The acquisition-related transaction costs include fees for investment banking advisors, lawyers, accountants, tax advisors, public relations firms, severance write-offsand retention costs, impairment of obsolete systemsgoodwill, capitalized software and facilities, and other external costs directly related to the mergers and acquisitions.
acquisitions, as well as compensation-related expenses.Other Expenses
Other expenses represent costs necessary to support our operations that are not already included in the above categories.
Other Income (Expense)
Non-Operating Expense
Income and expenses incurred through activities outside of our core operations are considered non-operating and are classified as other income/(expense).expense. These activities primarily include interest earned on the investing of excess cash, interest expense related to outstanding debt facilities, dividend income, income and unrealized gains and losses related to investments held in a rabbi trust for the Company’s non-qualified retirement and benefit plans, and equity earnings or losses from our investments in other business ventures.
The Company previously operated as a single reportable business segment as
Table of December 31, 2016. As a result of the Merger, beginning in 2017, the Company is reporting five segments: Options, U.S. Equities, Futures, European Equities, and Global FX. Segment performance is primarily based on operating income (loss). The Company has aggregated all of its corporate costs and eliminations, as well as other business ventures, within Corporate Items and Eliminations; however, operating expenses that relate to activities of a specific segment have been allocated to that segment. Our management allocates resources, assesses performance and manages our business according to these segments:Contents
Options. Our Options segment includes listed market indexes (index options), mostly on an exclusive basis, as well as on non-exclusive "multiply-listed" options, such as options on the stocks of individual corporations (equity options) and options on other exchange-traded products (ETP options), such as exchange-traded funds (ETF options) and exchange-traded notes (ETN options) that occur on Cboe Options, C2, BZX and EDGX. It also includes the listed equity and ETP options routed transaction services that occur on Trading.
U.S. Equities. Our U.S. Equities segment includes listed cash equities and ETP transaction services that occur on BZX, BYX, EDGX and EDGA. It also includes the listings business where ETPs and the Company are listed on BZX.
Futures. Our Futures segment includes trading of futures on the VIX Index and other products that occur on CFE, our all-electronic futures exchange.
European Equities. Our European Equities segment includes pan‑European listed equities transaction services, ETPs, exchange‑traded commodities, and international depository receipts that occur on our MTF, and a listing and trading venue on our RM, which together we refer to as Cboe Europe Equities. It also includes the listed cash equities and exchange-traded products routed transaction services that occur on Cboe Chi-X Europe, as well as the listings business where ETPs can be listed on Cboe Europe Equities.
Global FX. Our Global FX segment includes institutional FX trading services that occur on the Cboe FX platform, as well as non-deliverable forward FX transactions executed on Cboe SEF.
General Factors Affecting Results of Operations
In broad terms, our business performance is impacted by a number of drivers, including macroeconomic events affecting the risk and return of financial assets, investor sentiment, the regulatory environment for capital markets, geopolitical events, central bank policies and changing technology, particularly in the financial services industry. Our future revenues and net income will continue to be influenced by a number of domestic and international economic trends, including:
trading volumes on our proprietary products such as the VIX options and futures and SPX options;
trading volumes in listed cash equity securities and ETPs in both the U.S. and Europe, volumes in listed equity options, and volumes in institutional FX trading, all of which are driven primarily by overall macroeconomic conditions;
the demand for the U.S. tape plan market data distributed by the Securities Information Processors (SIPs), which determines the pool size of the industry market data revenue we receive based on our market share;
the demand for information about, or access to, our markets, which is dependent on the products we trade, our importance as a liquidity center and the quality and pricing of our data and access services;
continuing pressure in transaction fee pricing due to intense competition in the United States and Europe; and
regulatory changes relating to market structure, increased capital requirements or affecting certain types of instruments, transactions, pricing structures, capital market participants or reporting or compliance requirements, including any changes resulting from Brexit.
A number of significant structural, political and monetary issues continue to confront the global economy, and instability could return at any time, resulting in an increased level of market volatility, increased trading volumes and a return of uncertainty. In contrast, many of the largest customers of our transactional businesses continue to adapt their business models as they address the implementation of regulatory changes initiated following the global financial crisis.
The comparability of our results of operations between reported periods is impacted by the acquisition of Bats on February 28, 2017. Operating results and other financial metrics for U.S. Equities, European Equities and Global FX represent activity for the seven months ended September 30, 2017. The following summarizes changes in financial performance for the three and nine months ended September 30, 2017March 31, 2020 and 20162019 and certain non-GAAP financial measures. These non-GAAP financials measures assist management in comparing our performance on a consistent basis for purposes of business decision making by removing the impact of certain items management believes do not reflect our underlying operations. Please see the footnotes below for additional information and reconciliations from our condensed consolidated financial statements.
|
| | | | | | | | | | | | | | | | | | | | | | | | | | | | | | |
| | Three Months Ended September 30, | | Increase/ | | Percent | | | Nine Months Ended September 30, | | Increase/ | | Percent |
| 2017 | 2016 | | (Decrease) | | Change | | | 2017 | | 2016 | | (Decrease) | | Change |
| (in millions, except trading days, percentages and as noted below) | | | (in millions, except trading days, percentages and as noted below) |
| Total revenues | $ | 611.4 |
| | $ | 168.7 |
| | $ | 442.7 |
| | 262.4 | % | | | $ | 1,608.4 |
| | $ | 512.3 |
| | $ | 1,096.1 |
| | 214.0 | % |
| Total cost of revenues | 341.7 |
| | 32.5 |
| | 309.2 |
| | 951.4 | % | | | 878.4 |
| | 88.9 |
| | 789.5 |
| | 888.1 | % |
| Revenues less cost of revenues | 269.7 |
| | 136.2 |
| | 133.5 |
| | 98.0 | % | | | 730.0 |
| | 423.4 |
| | 306.6 |
| | 72.4 | % |
| Total operating expenses | 150.4 |
| | 70.4 |
| | 80.0 |
| | 113.6 | % | | | 466.8 |
| | 200.1 |
| | 266.7 |
| | 133.3 | % |
| Operating income | 119.3 |
| | 65.8 |
| | 53.5 |
| | 81.3 | % | | | 263.2 |
| | 223.3 |
| | 39.9 |
| | 17.9 | % |
| Income before income tax provision | 105.9 |
| | 67.4 |
| | 38.5 |
| | 57.1 | % | | | 230.3 |
| | 231.7 |
| | (1.4 | ) | | (0.6 | )% |
| Income tax provision | 45.6 |
| | 26.9 |
| | 18.7 |
| | 69.5 | % | | | 86.8 |
| | 91.1 |
| | (4.3 | ) | | (4.7 | )% |
| Net income | 60.3 |
| | 40.5 |
| | 19.8 |
| | 48.9 | % | | | 143.5 |
| | 140.6 |
| | 2.9 |
| | 2.1 | % |
| Net income allocated to common stockholders | $ | 59.7 |
| | $ | 40.3 |
| | $ | 19.4 |
| | 48.1 | % | | | $ | 142.1 |
| | $ | 140.0 |
| | $ | 2.1 |
| | 1.5 | % |
| Basic earnings per share | $ | 0.53 |
| | $ | 0.50 |
| | $ | 0.03 |
| | 6.0 | % | | | $ | 1.35 |
| | $ | 1.72 |
| | $ | (0.37 | ) | | (21.5 | )% |
| Diluted earnings per share | 0.53 |
| | 0.50 |
| | 0.03 |
| | 6.0 | % | | | 1.34 |
| | 1.72 |
| | (0.38 | ) | | (22.1 | )% |
| Organic net revenue (1) | 157.1 |
| | 136.2 |
| | 20.9 |
| | 15.3 | % | | | 463.3 |
| | 423.4 |
| | 39.9 |
| | 9.4 | % |
| EBITDA(2) | 171.2 |
| | 77.6 |
| | 93.6 |
| | 120.6 | % | | | 396.1 |
| | 265.7 |
| | 130.4 |
| | 49.1 | % |
| EBITDA margin(3) | 63.5 | % | | 57 | % | | 6.5 | % | | * |
| | | 54.3 | % | | 62.8 | % | | (8.5 | )% | | * |
|
| Adjusted EBITDA(2) | $ | 180.9 |
| | $ | 85.0 |
| | $ | 95.9 |
| | 112.8 | % | | | $ | 485.5 |
| | $ | 269.7 |
| | $ | 215.8 |
| | 80.0 | % |
| Adjusted EBITDA margin(4) | 67.1 | % | | 62.4 | % | | 4.7 | % | | * |
| | | 66.5 | % | | 63.7 | % | | 2.8 | % | | * |
|
| Adjusted earnings(5) | $ | 100.1 |
| | $ | 47.2 |
| | $ | 52.9 |
| | 112.1 | % | | | $ | 270.3 |
| | $ | 145.6 |
| | $ | 124.7 |
| | 85.6 | % |
| Diluted weighted average shares outstanding | 112.6 |
| | 81.3 |
| | 31.3 |
| | 38.5 | % | | | 105.8 |
| | 81.5 |
| | 24.3 |
| | 29.8 | % |
| Diluted adjusted earnings per share | $ | 0.89 |
| | $ | 0.58 |
| | $ | 0.31 |
| | 53.4 | % | | | $ | 2.56 |
| | $ | 1.79 |
| | $ | 0.77 |
| | 43.0 | % |
| Options: | | | | | | | | | | | | | | | | |
| Average Daily Volume (ADV): | | | | | | | | | | | | | | | | |
| Total touched contracts | 6.8 |
| | 6.1 |
| | 0.7 |
| | 11.5 | % | | | 6.9 |
| | 6.2 |
| | 0.7 |
| | 11.3 | % |
| Market ADV | 16.2 |
| | 15.4 |
| | 0.8 |
| | 5.2 | % | | | 16.5 |
| | 16.1 |
| | 0.4 |
| | 2.5 | % |
| Index contract ADV | 2.1 |
| | 1.7 |
| | 0.4 |
| | 23.5 | % | | | 2.0 |
| | 1.7 |
| | 0.3 |
| | 17.6 | % |
| Trading days | 63 |
| | 64 |
| | (1 | ) | | (1.6 | )% | | | 188 |
| | 189 |
| | (1 | ) | | (0.5 | )% |
| U.S. Equities: | | | | | | | | | | | | | | | | |
| ADV: | | | | | | | | | | | | | | | | |
| Total touched shares ADV (in billions) | 1.2 |
| | — |
| | 1.2 |
| | * |
| | | 1.3 |
| | — |
| | 1.3 |
| | * |
|
| Market ADV (in billions) | 6.1 |
| | — |
| | 6.1 |
| | * |
| | | 6.5 |
| | — |
| | 6.5 |
| | * |
|
| Trading days | 63 |
| | — |
| | 63 |
| | * |
| | | 149 |
| | — |
| | 149 |
| | * |
|
| U.S. ETPs: launches (number of launches) | 23 |
| | — |
| | 23 |
| | * |
| | | 64 |
| | — |
| | 64 |
| | * |
|
| U.S. ETPs: listings (number of listings) | 234 |
| | — |
| | 234 |
| | * |
| | | 234 |
| | — |
| | 234 |
| | * |
|
| Futures: | | | | | | | | | | | | | | | | |
| ADV (in thousands) | 331.1 |
| | 243.6 |
| | 87.5 |
| | 35.9 | % | | | 311.1 |
| | 239.8 |
| | 71.3 |
| | 29.7 | % |
| Trading days | 63 |
| | 64 |
| | (1 | ) | | (1.6 | )% | | | 188 |
| | 189 |
| | (1 | ) | | (0.5 | )% |
| European Equities: | | | | | | | | | | | | | | | | |
| Average Daily Notional Value (ADNV): | | | | | | | | | | | | | | | | |
| Matched and touched ADNV (in billions) | € | 8.7 |
| | € | — |
| | € | 8.7 |
| | * |
| | | € | 9.6 |
| | € | — |
| | € | 9.6 |
| | * |
|
| Market ADNV (in billions) | € | 41.1 |
| | € | — |
| | € | 41.1 |
| | * |
| | | € | 45.2 |
| | € | — |
| | € | 45.2 |
| | * |
|
| Trading days | 65 |
| | — |
| | 65 |
| | * |
| | | 151 |
| | — |
| | 151 |
| | * |
|
| Average Euro/British pound exchange rate | £ | 0.898 |
| | £ | 0.848 |
| | £ | 0.050 |
| | 5.9 | % | | | £ | 0.873 |
| | £ | 0.800 |
| | £ | 0.073 |
| | 9.1 | % |
| Global FX: | | | | | | | | | | | | | | | | |
| ADNV (in billions) | $ | 29.0 |
| | $ | — |
| | $ | 29.0 |
| | * |
| | | $ | 28.7 |
| | $ | — |
| | $ | 28.7 |
| | * |
|
| Trading days | 65 |
| | — |
| | 65 |
| | * |
| | | 153 |
| | — |
| | 153 |
| | * |
|
| Market share: | | | | | | | | | | | | | | | | |
| Options | 41.7 | % | | 28.4 | % | | 13.3 | % | | * |
| | | 40.3 | % | | 27.4 | % | | 12.9 | % | | * |
|
| U.S. Equities | 19.2 | % | | — | % | | 19.2 | % | | * |
| | | 19.2 | % | | — | % | | 19.2 | % | | * |
|
| ETPs: launches | 37.1 | % | | — | % | | 37.1 | % | | * |
| | | 37.9 | % | | — | % | | 37.9 | % | | * |
|
| ETPs: listings | 11.5 | % | | — | % | | 11.5 | % | | * |
| | | 11.5 | % | | — | % | | 11.5 | % | | * |
|
|
| | | | | | | | | | | | | | | | | | | | | | | | | | | | | | |
| European Equities | 21.1 | % | | — | % | | 21.1 | % | | * |
| | | 21.2 | % | | — | % | | 21.2 | % | | * |
|
| Net capture: | | | | | | | | | | | | | | | | |
| Total Options (revenue per contract)(6) | $ | 0.247 |
| | $ | 0.302 |
| | $ | (0.055 | ) | | (18.2 | )% | | | $ | 0.245 |
| | $ | 0.325 |
| | $ | (0.080 | ) | | (24.6 | )% |
| Multiply Listed Options | 0.061 |
| | 0.064 |
| | (0.003 | ) | | (4.7 | )% | | | 0.060 |
| | 0.083 |
| | (0.023 | ) | | (27.7 | )% |
| Index Options | 0.669 |
| | 0.707 |
| | (0.038 | ) | | (5.4 | )% | | | 0.690 |
| | 0.709 |
| | (0.019 | ) | | (2.7 | )% |
| U.S. Equities (net capture per one hundred touched shares)(7) | 0.022 |
| | — |
| | 0.022 |
| | * |
| | | 0.023 |
| | — |
| | 0.023 |
| | * |
|
| Futures | 1.752 |
| | 1.709 |
| | 0.043 |
| | 2.5 | % | | | 1.759 |
| | 1.680 |
| | 0.079 |
| | 4.7 | % |
| European Equities (net capture per matched notional value in basis points)(8) | 0.168 |
| | — |
| | 0.168 |
| | * |
| | | 0.164 |
| | — |
| | 0.164 |
| | * |
|
| Global FX (net capture per one million dollars traded) (9) | $ | 2.63 |
| | $ | — |
| | $ | 2.63 |
| | * |
| | | $ | 2.63 |
| | $ | — |
| | $ | 2.63 |
| | * |
|
| Average British pound/U.S. dollar exchange rate | $ | 1.309 |
| | $ | 1.313 |
| | $ | (0.004 | ) | | (0.3 | )% | | | $ | 1.274 |
| | $ | 1.393 |
| | $ | (0.119 | ) | | (8.5 | )% |
* Not meaningful
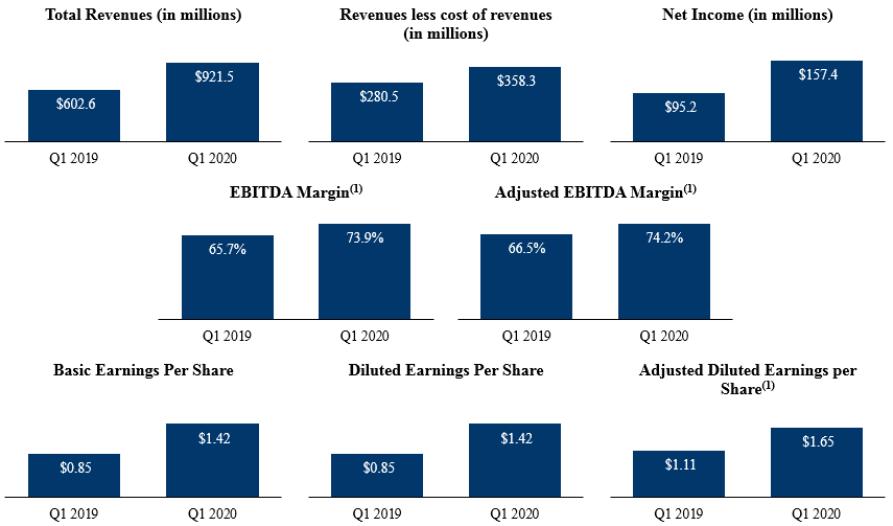
| (1) | These are Non-GAAP figures for which reconciliations are provided below. |
| | | | | | | | | | | | | |
| | Three Months Ended March 31, | | Increase/ | | Percent | | |
| | 2020 | | 2019 | | (Decrease) | | Change | | |
| | (in millions, except percentages, earnings per share, and as noted below) | | |
Total revenues | | $ | 921.5 | | $ | 602.6 | | $ | 318.9 | | 52.9 | % | |
Total cost of revenues | | | 563.2 | | | 322.1 | | | 241.1 | | 74.9 | % | |
Revenues less cost of revenues | | | 358.3 | | | 280.5 | | | 77.8 | | 27.7 | % | |
Total operating expenses | | | 131.9 | | | 134.0 | | | (2.1) | | (1.6) | % | |
Operating income | | | 226.4 | | | 146.5 | | | 79.9 | | 54.5 | % | |
Income before income tax provision | | | 217.5 | | | 127.8 | | | 89.7 | | 70.2 | % | |
Income tax provision | | | 60.1 | | | 32.6 | | | 27.5 | | 84.4 | % | |
Net income | | | 157.4 | | | 95.2 | | | 62.2 | | 65.3 | % | |
Basic earnings per share | | $ | 1.42 | | $ | 0.85 | | $ | 0.57 | | 67.1 | % | |
Diluted earnings per share | | | 1.42 | | | 0.85 | | | 0.57 | | 67.1 | % | |
EBITDA(1) | | | 264.9 | | | 184.3 | | | 80.6 | | 43.7 | % | |
EBITDA margin(2) | | | 73.9 | % | | 65.7 | % | | 8.2 | % | | * | |
Adjusted EBITDA(1) | | $ | 265.7 | | $ | 186.6 | | $ | 79.1 | | 42.4 | % | |
Adjusted EBITDA margin(3) | | | 74.2 | % | | 66.5 | % | | 7.7 | % | | * | |
Adjusted earnings(4) | | $ | 182.3 | | $ | 124.5 | | $ | 57.8 | | 46.4 | % | |
Adjusted earnings margin(5) | | | 50.9 | % | | 44.4 | % | | 6.5 | % | | * | |
Diluted weighted average shares outstanding | | | 110.6 | | | 111.7 | | | (1.1) | | (1.0) | % | |
Adjusted Diluted earnings per share(5) | | $ | 1.65 | | $ | 1.11 | | $ | 0.54 | | 48.6 | % | |
The following summarizes changes in certain operational and financial metrics for the three months ended March 31, 2020 compared to the three months ended March 31, 2019:
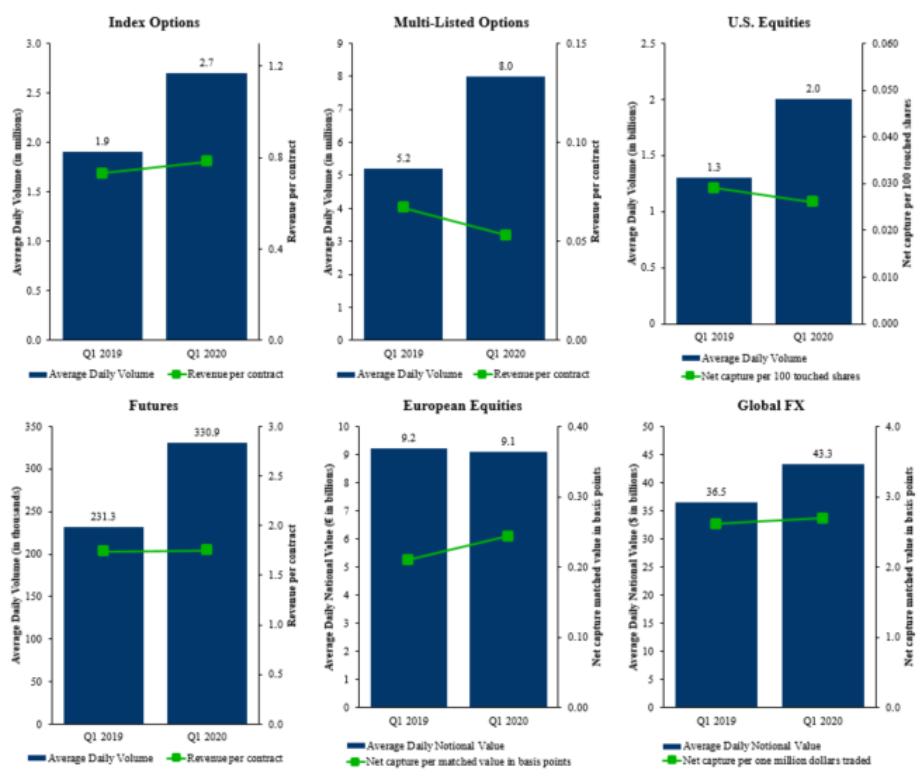
| | | | | | | | | | | | | |
| | | | | | | | | |
| | Three Months Ended March 31, | | Increase/ | | Percent | | |
| | 2020 | | 2019 | | (Decrease) | | Change | | |
| | (in millions, except percentages, trading days, and as noted below) | | |
Options: | | | | | | | | | | | | | |
Average daily volume (ADV) (in millions of contracts): | | | | | | | | | | | | | |
Total touched contracts | | | 10.7 | | | 7.1 | | | 3.6 | | 50.7 | % | |
Market ADV | | | 28.0 | | | 19.2 | | | 8.8 | | 45.8 | % | |
Index contract ADV | | | 2.7 | | | 1.9 | | | 0.8 | | 42.1 | % | |
Multi-Listed contract ADV | | | 8.0 | | | 5.2 | | | 2.8 | | 53.8 | % | |
Number of trading days | | | 62 | | | 61 | | | 1 | | 1.6 | % | |
Total Options revenue per contract (RPC) (6) | | $ | 0.234 | | $ | 0.240 | | $ | (0.006) | | (2.5) | % | |
Multi-Listed Options RPC (6) | | | 0.053 | | | 0.067 | | | (0.014) | | (20.9) | % | |
Index Options RPC (6) | | | 0.781 | | | 0.730 | | | 0.051 | | 7.0 | % | |
Market share | | | 38.3 | % | | 36.8 | % | | 1.5 | % | | * | |
U.S. Equities: | | | | | | | | | | | | | |
ADV: | | | | | | | | | | | | | |
Total touched shares (in billions) | | | 2.0 | | | 1.3 | | | 0.7 | | 53.8 | % | |
Market ADV (in billions) | | | 11.0 | | | 7.5 | | | 3.5 | | 46.7 | % | |
Trading days | | | 62 | | | 61 | | | 1 | | 1.6 | % | |
Market share | | | 16.7 | % | | 16.0 | % | | 0.7 | % | | * | |
U.S. Equities (net capture per one hundred touched shares)(7) | | $ | 0.026 | | $ | 0.029 | | $ | (0.003) | | (10.3) | % | |
U.S. ETPs: launches (number of launches) | | | 18 | | | 11 | | | 7 | | 63.6 | % | |
U.S. ETPs: listings (number of listings) | | | 351 | | | 294 | | | 57 | | 19.4 | % | |
Futures: | | | | | | | | | | | | | |
ADV (in thousands) | | | 330.9 | | | 231.3 | | | 99.6 | | 43.1 | % | |
Trading days | | | 62 | | | 61 | | | 1 | | 1.6 | % | |
Revenue per contract | | $ | 1.750 | | $ | 1.739 | | $ | 0.011 | | 0.6 | % | |
European Equities: | | | | | | | | | | | | | |
ADNV: | | | | | | | | | | | | | |
Matched and touched ADNV (in billions) | | € | 9.1 | | € | 9.2 | | € | (0.1) | | (1.1) | % | |
Market ADNV (in billions) | | | 51.5 | | | 41.7 | | | 9.8 | | 23.5 | % | |
Trading days | | | 64 | | | 63 | | | 1 | | 1.6 | % | |
Market share | | | 17.7 | % | | 22.1 | % | | (4.4) | % | | * | |
European Equities (net capture per matched notional value in basis points)(8) | | | 0.244 | | | 0.210 | | | 0.034 | | 16.2 | % | |
Average Euro/British pound exchange rate | | £ | 0.861 | | £ | 0.872 | | £ | (0.011) | | (1.2) | % | |
Global FX: | | | | | | | | | | | | | |
ADNV (in billions) | | $ | 43.3 | | $ | 36.5 | | $ | 6.8 | | 18.6 | % | |
Trading days | | | 64 | | | 63 | | | 1 | | 1.6 | % | |
Global FX (net capture per one million dollars traded)(9) | | | 2.69 | | | 2.61 | | | 0.08 | | 3.1 | % | |
Average British pound/U.S. dollar exchange rate | | $ | 1.281 | | $ | 1.302 | | $ | (0.021) | | (1.6) | % | |
| (1) | Organic net revenue is defined as revenues less cost of revenues excluding revenues less cost of revenues of any acquisition for the quarter the business was acquired and the following year comparable quarter. Organic net revenue does not represent, and should not be considered as, an alternative to revenues less cost of revenues, or net revenue, as determined in accordance with GAAP. We have presented organic net revenue because we consider it an important supplemental measure of our performance and we use it as the basis for monitoring our operating financial performance before the effects of acquisitions. We also believe that it is frequently used by analysts, investors and other interested parties in the evaluation of companies. We believe that investors may find this non-GAAP measure useful in evaluating our performance compared to that of peer companies in our industry. Other companies may calculate organic net revenue differently than we do. Organic net revenue has limitations as an analytical tool, and you should not consider it in isolation or as a substitute for analysis of our results as reported under GAAP. |
The following is a reconciliation of revenues less cost of revenues to organic net revenue (in millions):
|
| | | | | | | | | | | | | | | |
| | Three Months Ended
September 30, | | Nine Months Ended
September 30, |
| 2017 | | 2016 | | 2017 | | 2016 |
| Revenues less cost of revenues | $ | 269.7 |
| | $ | 136.2 |
| | $ | 730.0 |
| | $ | 423.4 |
|
| Recent acquisitions: | | | | | | | |
| Bats revenues less cost of revenues (since acquisition) | $ | (112.6 | ) | | $ | — |
| | $ | (266.7 | ) | | $ | — |
|
| Organic net revenue | $ | 157.1 |
| | $ | 136.2 |
| | $ | 463.3 |
| | $ | 423.4 |
|
| |
(2) | EBITDA is defined as income before interest, income taxes, depreciation and amortization. Adjusted EBITDA is defined as EBITDA before acquisition-related costs, accelerated stock-based compensation, and a legal settlement.costs. EBITDA and adjusted EBITDA do not represent, and should not be considered as, alternatives to net income or cash flows from operations, each as determined in accordance with GAAP. We have presented EBITDA and adjusted EBITDA because we consider them important supplemental measures of our performance and believe that they are frequently used by analysts, investors and other interested parties in the evaluation of companies. In addition, we use adjusted EBITDA as a measure of operating performance for preparation of our forecasts and evaluating our leverage ratio for the debt to earnings covenant included in our outstanding credit facility. Other companies may calculate EBITDA and adjusted EBITDA differently than we do. EBITDA and adjusted EBITDA have limitations as analytical tools, and you should not consider them in isolation or as substitutes for analysis of our results as reported under GAAP. |
The following tables are reconciliations of net income allocated to common stockholders to EBITDA and adjusted EBITDA (in millions):
|
| | | | | | | | | | | | | | | | | | | | | |
| | Three Months Ended September 30, 2017 |
| Options | U.S. Equities | Futures | European Equities | Global FX | Corporate Items and Eliminations | Total |
| Net income (loss) allocated to common stockholders | $ | 60.6 |
| $ | 29.6 |
| $ | 35.1 |
| $ | 2.9 |
| $ | (3.5 | ) | $ | (65.0 | ) | $ | 59.7 |
|
| Interest | — |
| — |
| — |
| — |
| — |
| 10.5 |
| 10.5 |
|
| Income tax provision | — |
| — |
| — |
| — |
| — |
| 45.6 |
| 45.6 |
|
| Depreciation and amortization | 14.0 |
| 23.9 |
| 0.4 |
| 7.7 |
| 9.1 |
| 0.3 |
| 55.4 |
|
| EBITDA | 74.6 |
| 53.5 |
| 35.5 |
| 10.6 |
| 5.6 |
| (8.6 | ) | 171.2 |
|
| Acquisition-related costs | — |
| — |
| — |
| — |
| — |
| 5.5 |
| 5.5 |
|
| Change in contingent consideration | — |
| — |
| — |
| — |
| 0.4 |
| — |
| 0.4 |
|
Provision for uncollectable convertible notes receivable
| 3.8 |
| — |
| — |
| — |
| — |
| — |
| 3.8 |
|
| Adjusted EBITDA | $ | 78.4 |
| $ | 53.5 |
| $ | 35.5 |
| $ | 10.6 |
| $ | 6.0 |
| $ | (3.1 | ) | $ | 180.9 |
|
|
| | | | | | | | | | | | | | | | | | | | | |
| Three Months Ended September 30, 2016 |
| Options | U.S. Equities | Futures | European Equities | Global FX | Corporate Items and Eliminations | Total |
| Net income (loss) allocated to common stockholders | $ | 17.2 |
| $ | — |
| $ | 25.5 |
| $ | — |
| $ | — |
| $ | (2.4 | ) | $ | 40.3 |
|
| Interest | 0.3 |
| — |
| — |
| — |
| — |
| (0.1 | ) | 0.2 |
|
| Income tax provision | 26.9 |
| — |
| — |
| — |
| — |
| — |
| 26.9 |
|
| Depreciation and amortization | 9.3 |
| — |
| 0.6 |
| — |
| — |
| 0.3 |
| 10.2 |
|
| EBITDA | 53.7 |
| — |
| 26.1 |
| — |
| — |
| (2.2 | ) | 77.6 |
|
| Acquisition-related costs | — |
| — |
| — |
| — |
| — |
| 8.6 |
| 8.6 |
|
| Gain on settlement of contingent consideration | — |
| — |
| — |
| — |
| — |
| (1.4 | ) | (1.4 | ) |
| Accelerated stock-based compensation | — |
| — |
| — |
| — |
| — |
| 0.2 |
| 0.2 |
|
| Adjusted EBITDA | $ | 53.7 |
| $ | — |
| $ | 26.1 |
| $ | — |
| $ | — |
| $ | 5.2 |
| $ | 85.0 |
|
|
| | | | | | | | | | | | | | | | | | | | | |
| | Nine Months Ended September 30, 2017 |
| | Options | U.S. Equities | Futures | European Equities | Global FX | Corporate Items and Eliminations | Total |
| Net income (loss) allocated to common stockholders | $ | 149.1 |
| $ | 74.2 |
| $ | 94.4 |
| $ | 5.5 |
| $ | (8.9 | ) | $ | (172.2 | ) | $ | 142.1 |
|
| Interest | — |
| — |
| — |
| — |
| — |
| 30.9 |
| 30.9 |
|
| Income tax provision | 37.7 |
| 0.9 |
| — |
| 2.5 |
| 0.1 |
| 45.6 |
| 86.8 |
|
| Depreciation and amortization | 39.1 |
| 56.4 |
| 1.1 |
| 17.6 |
| 21.2 |
| 0.9 |
| 136.3 |
|
| EBITDA | 225.9 |
| 131.5 |
| 95.5 |
| 25.6 |
| 12.4 |
| (94.8 | ) | 396.1 |
|
| Acquisition-related costs | — |
| — |
| — |
| — |
| — |
| 75.4 |
| 75.4 |
|
| Change in contingent consideration | — |
| — |
| — |
| — |
| 1.1 |
| — |
| 1.1 |
|
Provision for uncollectable convertible notes receivable
| 3.8 |
| — |
| — |
| — |
| — |
| — |
| 3.8 |
|
| Accelerated stock-based compensation | — |
| — |
| — |
| — |
| — |
| 9.1 |
| 9.1 |
|
| Adjusted EBITDA | $ | 229.7 |
| $ | 131.5 |
| $ | 95.5 |
| $ | 25.6 |
| $ | 13.5 |
| $ | (10.3 | ) | $ | 485.5 |
|
|
| | | | | | | | | | | | | | | | | | | | | |
| Nine Months Ended September 30, 2016 |
| Options | U.S. Equities | Futures | European Equities | Global FX | Corporate Items and Eliminations | Total |
| Net income (loss) allocated to common stockholders | $ | 70.2 |
| $ | — |
| $ | 72.2 |
| $ | — |
| $ | — |
| $ | (2.4 | ) | $ | 140.0 |
|
| Interest | 0.3 |
| — |
| — |
| — |
| — |
| (0.1 | ) | 0.2 |
|
| Income tax provision | 91.1 |
| — |
| — |
| — |
| — |
| — |
| 91.1 |
|
| Depreciation and amortization | 31.0 |
| — |
| 2.4 |
| — |
| — |
| 1.0 |
| 34.4 |
|
| EBITDA | 192.6 |
| — |
| 74.6 |
| — |
| — |
| (1.5 | ) | 265.7 |
|
| Acquisition-related costs | — |
|
|
|
|
| — |
| — |
| 9.3 |
| 9.3 |
|
| Legal settlement | — |
| — |
| — |
| — |
| — |
| (5.5 | ) | (5.5 | ) |
| Assessment of computer-based lease taxes for prior period use | — |
| — |
| — |
| — |
| — |
| 0.3 |
| 0.3 |
|
| Accelerated stock-based compensation | — |
| — |
| — |
| — |
| — |
| 1.3 |
| 1.3 |
|
| Gain on settlement of contingent consideration | — |
| — |
| — |
| — |
| — |
| (1.4 | ) | (1.4 | ) |
| Adjusted EBITDA | $ | 192.6 |
| $ | — |
| $ | 74.6 |
| $ | — |
| $ | — |
| $ | 2.5 |
| $ | 269.7 |
|
| (2) | |
(3) | EBITDA margin represents EBITDA divided by revenues less cost of revenues. |
| (3) | |
(4) | Adjusted EBITDA margin represents adjusted EBITDA divided by revenues less cost of revenues. |
| (4) | |
(5) | Adjusted earnings is defined as net income adjusted for amortization of purchased intangibles, acquisition-related costs, legal settlements,change in redemption value of noncontrolling interest, and accelerated stock-based compensation, net income allocated to participating securities, net |
| of the income tax effects of these adjustments. Adjusted earnings does not represent, and should not be considered as, an alternative to net income, as determined in accordance with GAAP. We have presented adjusted earnings because we consider it an important supplemental measure of our performance and we use it as the basis for monitoring our own core operating financial performance relative to other operators of exchanges. We also believe that it is frequently used by analysts, investors and other interested parties in the evaluation of companies. We believe that investors may find this non-GAAP measure useful in evaluating our performance compared to that of peer companies in our industry. Other companies may calculate adjusted earnings differently than we do. Adjusted earnings has limitations as an analytical tool, and you should not consider it in isolation or as a substitute for analysis of our results as reported under GAAP. |
The following is a reconciliation of net income to adjusted earnings (in millions):
|
| | | | | | | | | | | | | | | |
| | Three Months Ended
September 30, | | Nine Months Ended
September 30, |
| 2017 | | 2016 | | 2017 | | 2016 |
| Net income allocated to common stockholders | $ | 59.7 |
| | $ | 40.3 |
| | $ | 142.1 |
| | $ | 140.0 |
|
| Amortization | 42.6 |
| | 0.3 |
| | 99.6 |
| | 0.9 |
|
| Acquisition-related costs | 5.5 |
| | 8.6 |
| | 75.4 |
| | 9.3 |
|
Provision for uncollectable convertible notes receivable
| 3.8 |
| | — |
| | 3.8 |
| | — |
|
| Debt issuance cost | — |
| | — |
| | 0.9 |
| | — |
|
| Assessment of computer-based lease taxes | — |
| | — |
| | — |
| | 0.3 |
|
| Acceleration of stock based compensation | — |
| | — |
| | 9.1 |
| | — |
|
| Other compensation related items | — |
| | 0.2 |
| | — |
| | 1.3 |
|
| Legal settlement | — |
| | — |
| | — |
| | (5.5 | ) |
| Interest and other borrowing costs | — |
| | 0.2 |
| | 4.3 |
| | 0.2 |
|
| Change in contingent consideration | 0.4 |
| | — |
| | 1.1 |
| | — |
|
| Gain on settlement of contingent consideration | — |
| | (1.4 | ) | | — |
| | (1.4 | ) |
| Change in redemption value of noncontrolling interest | 0.2 |
| | 0.3 |
| | 0.8 |
| | 0.8 |
|
| Tax effects of adjustments | (19.1 | ) | | (1.3 | ) | | (73.1 | ) | | (0.3 | ) |
| Re-measurement of deferred tax assets and liabilities as a result of corporate rate increases in Illinois | 7.4 |
| | — |
| | 7.4 |
| | — |
|
| Net income allocated to participating securities | (0.4 | ) | | — |
| | (1.1 | ) | | — |
|
| Adjusted earnings | $ | 100.1 |
| | $ | 47.2 |
| | $ | 270.3 |
| | $ | 145.6 |
|
| (5) | Adjusted diluted earnings per share represents Adjusted earnings divided by diluted weighted average shares outstanding. |
| (6) | Revenue per contract represents transaction fees less liquidity payments and routing and clearing costs divided by total contracts traded during the period. |
divided by total touched contracts.
| |
| (7) | Net capture per one hundred touched shares refers to transaction fees less liquidity payments and routing and clearing costs divided by the product of one-hundredth ADV of touched shares on BZX, BYX, EDGX, and EDGA and the number of trading days for the period. |
| |
| (8) | Net capture per matched notional value in basis points refers to transaction fees less liquidity payments in British pounds divided by the product of ADNV in British pounds of shares matched on Cboe Europe EquitiesLimited and the number of trading days for the period. |
| |
| (9) | Net capture per one million dollars traded refers to net transaction fees, less liquidity payments, if any, divided by the product of one-thousandthone-millionth of ADNV traded on the Cboe FX market, and the number of trading days, divided byand two, which represents the buyer and seller that are both charged on the transaction for the period. |
Revenues
The following tables are reconciliations of net income allocated to common stockholders to EBITDA and adjusted EBITDA (in millions):
| | | | | | | | | | | | | | | | | | | | | |
| | Three Months Ended March 31, |
| | 2020 |
| | Options | | U.S. Equities | | Futures | | European Equities | | Global FX | | Corporate | | Total |
| | (in millions) |
Net income (loss) allocated to common stockholders | | $ | 143.3 | | $ | 47.7 | | $ | 26.8 | | $ | 6.8 | | $ | 3.0 | | $ | (70.6) | | $ | 157.0 |
Interest expense, net | | | — | | | — | | | — | | | (0.1) | | | — | | | 7.4 | | | 7.3 |
Income tax provision | | | — | | | 1.2 | | | — | | | 2.9 | | | — | | | 56.0 | | | 60.1 |
Depreciation and amortization | | | 7.7 | | | 17.8 | | | 0.8 | | | 7.2 | | | 7.0 | | | — | | | 40.5 |
EBITDA | | | 151.0 | | | 66.7 | | | 27.6 | | | 16.8 | | | 10.0 | | | (7.2) | | | 264.9 |
Acquisition-related costs | | | (5.5) | | | — | | | — | | | — | | | — | | | 6.3 | | | 0.8 |
Adjusted EBITDA | | $ | 145.5 | | $ | 66.7 | | $ | 27.6 | | $ | 16.8 | | $ | 10.0 | | $ | (0.9) | | $ | 265.7 |
| | | | | | | | | | | | | | | | | | | | | |
| | Three Months Ended March 31, |
| | 2019 |
| | Options | | U.S. Equities | | Futures | | European Equities | | Global FX | | Corporate | | Total |
| | (in millions) |
Net income (loss) allocated to common stockholders | | $ | 79.2 | | $ | 37.0 | | $ | 18.2 | | $ | 3.0 | | $ | (0.4) | | $ | (42.4) | | $ | 94.6 |
Interest expense, net | | | — | | | — | | | — | | | (0.1) | | | — | | | 10.0 | | | 9.9 |
Income tax provision | | | — | | | 0.4 | | | — | | | 2.5 | | | — | | | 29.7 | | | 32.6 |
Depreciation and amortization | | | 9.9 | | | 19.9 | | | 0.4 | | | 7.5 | | | 7.8 | | | 1.7 | | | 47.2 |
EBITDA | | | 89.1 | | | 57.3 | | | 18.6 | | | 12.9 | | | 7.4 | | | (1.0) | | | 184.3 |
Acquisition-related costs | | | 0.8 | | | — | | | — | | | 0.3 | | | 0.3 | | | 0.9 | | | 2.3 |
Adjusted EBITDA | | $ | 89.9 | | $ | 57.3 | | $ | 18.6 | | $ | 13.2 | | $ | 7.7 | | $ | (0.1) | | $ | 186.6 |
The following is a reconciliation of net income allocated to common stockholders to adjusted earnings (in millions):
| | | | | | | |
| | Three Months Ended | |
| | March 31, | |
| | 2020 | | 2019 | |
| | (in millions) | |
Net income allocated to common stockholders | | $ | 157.0 | | $ | 94.6 | |
Amortization | | | 32.5 | | | 37.6 | |
Acquisition-related costs | | | 0.8 | | | 2.3 | |
Change in redemption value of noncontrolling interest | | | — | | | 0.2 | |
Tax effect of adjustments | | | (7.6) | | | (10.0) | |
Net income allocated to participating securities | | | (0.4) | | | (0.2) | |
Adjusted earnings | | $ | 182.3 | | $ | 124.5 | |
Revenues
Total revenues increased infor the three and nine months ended September 30, 2017,March 31, 2020 increased $318.9 million, or 52.9%, compared to the prior period, primarily due to a $231.1 million, or 53.7% increase in transaction fees as a result of our acquisition of Bats that contributed $411.6 millionincreased market volumes in Options, U.S. Equities and $1,017.4 million, respectively.
Futures, coupled with an increase in regulatory fees. The following summarizes changes in revenues for the three and nine months ended September 30, 2017,March 31, 2020 compared to the three and nine months ended September 30, 2016:
|
| | | | | | | | | | | | | | | | | | | | | | | |
| | Three Months Ended
September 30, | Increase/ (Decrease) | Percent Change | | Nine Months Ended
September 30, | Increase/ (Decrease) | Percent Change |
| 2017 | 2016 | | 2017 | 2016 |
| (in millions, except percentages) | | (in millions, except percentages) |
| Transaction fees | $ | 423.3 |
| $ | 124.5 |
| $ | 298.8 |
| 240.0 | % | | $ | 1,133.6 |
| $ | 378.3 |
| $ | 755.3 |
| 199.7 | % |
| Access fees | 30.1 |
| 13.0 |
| 17.1 |
| 131.5 | % | | 77.6 |
| 39.4 |
| 38.2 |
| 97.0 | % |
| Exchange services and other fees | 20.0 |
| 11.4 |
| 8.6 |
| 75.4 | % | | 55.3 |
| 34.2 |
| 21.1 |
| 61.7 | % |
| Market data fees | 46.8 |
| 8.3 |
| 38.5 |
| 463.9 | % | | 117.3 |
| 24.5 |
| 92.8 |
| 378.8 | % |
| Regulatory fees | 83.5 |
| 9.1 |
| 74.4 |
| 817.6 | % | | 205.1 |
| 27.4 |
| 177.7 |
| 648.5 | % |
| Other revenue | 7.7 |
| 2.4 |
| 5.3 |
| 220.8 | % | | 19.5 |
| 8.5 |
| 11.0 |
| 129.4 | % |
| Total revenues | $ | 611.4 |
| $ | 168.7 |
| $ | 442.7 |
| 262.4 | % | | $ | 1,608.4 |
| $ | 512.3 |
| $ | 1,096.1 |
| 214.0 | % |
March 31, 2019: | | | | | | | | | | | | | |
| | Three Months Ended | | | | | | | |
| | March 31, | | Increase/ | | Percent | | |
| | 2020 | | 2019 | | (Decrease) | | Change | | |
| | (in millions, except percentages) | | |
Transaction fees | | $ | 661.5 | | $ | 430.4 | | $ | 231.1 | | 53.7 | % | |
Access and capacity fees | | | 57.7 | | | 54.4 | | | 3.3 | | 6.1 | % | |
Market data fees | | | 56.2 | | | 51.6 | | | 4.6 | | 8.9 | % | |
Regulatory fees | | | 136.8 | | | 58.7 | | | 78.1 | | 133.0 | % | |
Other revenue | | | 9.3 | | | 7.5 | | | 1.8 | | 24.0 | % | |
Total revenues | | $ | 921.5 | | $ | 602.6 | | $ | 318.9 | | 52.9 | % | |
Transaction Fees
Transaction fees increased for the three and nine months ended September 30, 2017March 31, 2020 compared to the same periodsperiod in 20162019 primarily driven by the acquisition of Bats that contributed $271.1 million and $689.3 million, respectively. The remainingdue to a 45.8% increase was primarily driven by increasedin overall options market ADV, including a 42.1% increase in index options of 23.5%ADV, a 46.7% increase in U.S. Equities market ADV, and a 43.1% increase in Futures ADV when compared to the same period in 2019.
Access Fees and Capacity Fees
Access and capacity fees increased for the three months ended September 30, 2017 and 17.6% in the nine months ended September 30, 2017. Also contributing to the increase was an increased futures ADV of 35.9% for the three months ended September 30, 2017 and 29.7% for the nine months ended September 30, 2017.
Access fees
Access fees increased for the three and nine months ended September 30, 2017March 31, 2020 compared to the same periodsperiod in 20162019 primarily driven by the Bats acquisition that contributed $18.5 million and $42.4 million, respectively. This was offset by decreases driven by pricing decreases for market maker permits and floor broker permits effectivedue to an increase in logical port units in the first quarter of 2017.
Exchange servicesOptions and other fees
Exchange services and other fees increased for the three and nine months ended September 30, 2017 compared to the same periods in 2016 primarily driven by the Bats acquisition that contributed $7.5 million and $17.6 million, respectively.
European Equities segments.Market Data Fees
Market data fees increased for the three and nine months ended September 30, 2017March 31, 2020 compared to the same periodsperiod in 20162019 primarily due to additional revenue attributed to the Bats acquisition that contributed $38.1 millionacquisitions of Hanweck and $90.2 million, respectively.
FT Options during the first quarter of 2020, coupled with an increase in tape plan market data revenue within the U.S. Equities segment related to audit recoveries.Regulatory Fees
Regulatory transaction fees increased for the three and nine months ended September 30, 2017March 31, 2020 compared to the same periodsperiod in 20162019 primarily due to an increase in Section 31 fees as a result of higher volumes in the acquisitionU.S. Equities and Options segments, coupled with increases in the Section 31 fee rate from $13.00 per million dollars of Bats that contributed $72.6covered sales for the three months ended March 31, 2019 to an average rate of $21.40 per million and $170.7 million, respectively.
dollars of covered sales during the three months ended March 31, 2020.Other Revenue
Other revenue increased for the three and nine months ended September 30, 2017March 31, 2020 compared to the same period in 20162019 primarily due to the Bats acquisition that contributed $3.7 millionadditional index licensing and $7.2 million, respectively.trade reporting services revenue in 2020.
Cost of revenues increased infor the three and nine months ended September 30, 2017March 31, 2020 compared to the same periodsperiod in 20162019 primarily due to higher liquidity payments as a result of an increase in volumes traded on the acquisition of Bats.
U.S. Equities and Options exchanges, which increased $148.7 million, coupled with an increase in Section 31 fees within the U.S. Equities and Options segments, which increased $70.6 million and $8.6 million, respectively.The following summarizes changes in cost of revenues for the three and nine months ended September 30, 2017March 31, 2020 compared to the three months ended September 30, 2016:
|
| | | | | | | | | | | | | | | | | | | | | | | |
| | Three Months Ended
September 30, | Increase/ (Decrease) | Percent Change | | Nine Months Ended
September 30, | Increase/ (Decrease) | Percent Change |
| 2017 | 2016 | | 2017 | 2016 |
| | (in millions, except percentages) | | (in millions, except percentages) |
| Liquidity payments | $ | 234.3 |
| $ | 9.5 |
| $ | 224.8 |
| * |
| | $ | 606.1 |
| $ | 23.2 |
| $ | 582.9 |
| * |
|
| Routing and clearing | 9.4 |
| 3.6 |
| 5.8 |
| 161.1 | % | | 27.9 |
| 7.9 |
| 20.0 |
| 253.2 | % |
| Section 31 fees | 75.9 |
| — |
| 75.9 |
| * |
| | 180.5 |
| — |
| 180.5 |
| * |
|
| Royalty fees | 22.1 |
| 19.4 |
| 2.7 |
| 13.9 | % | | 63.9 |
| 57.8 |
| 6.1 |
| 10.6 | % |
| Total cost of revenues | $ | 341.7 |
| $ | 32.5 |
| $ | 309.2 |
| 951.4 | % | | $ | 878.4 |
| $ | 88.9 |
| $ | 789.5 |
| 888.1 | % |
*Not meaningful
March 31, 2019: | | | | | | | | | | | | | |
| | Three Months Ended | | | | | | | |
| | March 31, | | Increase/ | | Percent | | |
| | 2020 | | 2019 | | (Decrease) | | Change | | |
| | (in millions, except percentages) | | |
Liquidity payments | | $ | 392.4 | | $ | 243.7 | | $ | 148.7 | | 61.0 | % | |
Routing and clearing | | | 16.0 | | | 9.2 | | | 6.8 | | 73.9 | % | |
Section 31 fees | | | 127.4 | | | 48.2 | | | 79.2 | | 164.3 | % | |
Royalty fees | | | 27.4 | | | 21.0 | | | 6.4 | | 30.5 | % | |
Total | | $ | 563.2 | | $ | 322.1 | | $ | 241.1 | | 74.9 | % | |
Liquidity Payments
Liquidity payments increased for the three and nine months ended September 30, 2017March 31, 2020 compared to the same periodsperiod in 20162019 primarily driven bydue to higher liquidity payments as a result of an increase in volumes traded on the Bats acquisition that contributed $219.3 millionU.S. Equities and $561.7 million, respectively.
Options exchanges.Routing and Clearing
The increase in routing and clearing fees for the three and nine months ended September 30, 2017March 31, 2020 compared to the same periodsperiod in 20162019 was primarily driven bydue to an increase in routed trades in the Bats acquisition that contributed $7.7 million and $19.7 million, respectively.
U.S. Equities segment.Section 31 Fees
Section 31 fees increased for the three and nine months ended September 30, 2017March 31, 2020 compared to the same periodsperiod in 20162019 primarily driven bydue to an increase in Section 31 fees as a result of higher volumes in the Bats acquisition that contributed $71.9U.S. Equities and Options segments, coupled with increases in the Section 31 fee rate from $13.00 per million and $169.0dollars of covered sales for the three months ended March 31, 2019 to an average rate of $21.40 per million respectively.
dollars of covered sales during the three months ended March 31, 2020.Royalty Fees
Royalty fees increased for the three and nine months ended September 30, 2017March 31, 2020 compared to the same periodsperiod in 20162019 primarily due to higheran increase in trading volume in licensed products.
Revenues Less Cost of Revenues
Revenues less cost of revenues increased in$77.8 million, or 27.7%, for the three and nine months ended September 30, 2017March 31, 2020 compared to the same periodsperiod in 20162019 primarily due to the acquisition of Bats.
a $75.6 million, or 42.6%, increase in transaction fees less liquidity payments and routing and clearing costs.The following tables summarize the components of revenues less cost of revenues for the three and nine months ended September 30, 2017, presented as a percentage of revenues less cost of revenues andMarch 31, 2020 compared to the three and nine months ended September 30, 2016:
|
| | | | | | | | | | | | | | | | | | | | | | | |
| | Three Months Ended
September 30, | Increase/ | Percent | | Nine Months Ended
September 30, | Increase/ | Percent |
| | 2017 | 2016 | (Decrease) | Change | | 2017 | 2016 | (Decrease) | Change |
| | (in millions, except percentages) | | (in millions, except percentages) |
| Transaction fees less liquidity payments and routing and clearing costs | $ | 179.6 |
| $ | 111.4 |
| $ | 68.2 |
| 61.2 | % | | $ | 499.6 |
| $ | 347.2 |
| $ | 152.4 |
| 43.9 | % |
| Access fees | 30.1 |
| 13.0 |
| 17.1 |
| 131.5 | % | | 77.6 |
| 39.4 |
| 38.2 |
| 97.0 | % |
| Exchange services and other fees | 20.0 |
| 11.4 |
| 8.6 |
| 75.4 | % | | 55.3 |
| 34.2 |
| 21.1 |
| 61.7 | % |
| Market data fees | 46.8 |
| 8.3 |
| 38.5 |
| 463.9 | % | | 117.3 |
| 24.5 |
| 92.8 |
| 378.8 | % |
| Regulatory fees, less Section 31 fees | 7.6 |
| 9.1 |
| (1.5 | ) | (16.5 | )% | | 24.6 |
| 27.4 |
| (2.8 | ) | (10.2 | )% |
| Royalty fees | (22.1 | ) | (19.4 | ) | (2.7 | ) | 13.9 | % | | (63.9 | ) | (57.8 | ) | (6.1 | ) | 10.6 | % |
| Other | 7.7 |
| 2.4 |
| 5.3 |
| 220.8 | % | | 19.5 |
| 8.5 |
| 11.0 |
| 129.4 | % |
| Revenues less cost of revenues | $ | 269.7 |
| $ | 136.2 |
| $ | 133.5 |
| 98.0 | % | | $ | 730.0 |
| $ | 423.4 |
| $ | 306.6 |
| 72.4 | % |
March 31, 2019: | | | | | | | | | | | | | |
| | Three Months Ended | | | | | | | |
| | March 31, | | Increase/ | | Percent | | |
| | 2020 | | 2019 | | (Decrease) | | Change | | |
| | (in millions, except percentages) | | |
Transaction fees less liquidity payments and routing and clearing costs | | $ | 253.1 | | $ | 177.5 | | $ | 75.6 | | 42.6 | % | |
Access and capacity fees | | | 57.7 | | | 54.4 | | | 3.3 | | 6.1 | % | |
Market data fees | | | 56.2 | | | 51.6 | | | 4.6 | | 8.9 | % | |
Regulatory fees, less Section 31 fees | | | 9.4 | | | 10.5 | | | (1.1) | | (10.5) | % | |
Royalty fees | | | (27.4) | | | (21.0) | | | (6.4) | | 30.5 | % | |
Other | | | 9.3 | | | 7.5 | | | 1.8 | | 24.0 | % | |
Revenues less cost of revenues | | $ | 358.3 | | $ | 280.5 | | $ | 77.8 | | 27.7 | % | |
Transaction Fees Less Liquidity Payments and Routing and Clearing Costs
Transaction fees less liquidity payments and routing and clearing costs (“Net Transaction Fees”) increased infor the three and nine months ended September 30, 2017March 31, 2020 compared to the same periodsperiod in 2016 primarily driven by the acquisition of Bats that contributed $44.2 million and $107.9 million, respectively. The remaining increase was2019 primarily due to higher trading volumesa 42.1% increase in index options ADV, coupled with a 43.1% increase in Futures ADV and futuresa 46.7% increase in bothU.S. Equities market ADV compared to the threesame period in 2019.
Access and nine months ended September 30, 2017.
Accessand capacity fees increased for the three and nine months ended September 30, 2017March 31, 2020 compared to the same periodsperiod in 20162019 primarily driven by the Bats acquisition that contributed $18.5 million and $42.4 million, respectively. This was partially offset by decreases driven by pricing decreases for market maker permits and floor broker permits effectivedue to an increase in logical port units in the first quarter of 2017.
Exchange servicesOptions and other fees
Exchange services and other fees increased for the three and nine months ended September 30, 2017 compared to the same periods in 2016 primarily driven by the Bats acquisition that contributed $7.5 million and $17.6 million, respectively.
European Equities segments.Market Data Fees
Market data fees increased for the three and nine months ended September 30, 2017March 31, 2020 compared to the same periodsperiod in 20162019 primarily due to additional revenue attributed to the Bats acquisition that contributed $38.1 millionacquisitions of Hanweck and $90.2 million, respectively.
FT Options during the first quarter of 2020, coupled with an increase in tape plan market data revenue within the U.S. Equities segment related to audit recoveries.Regulatory Fees, less Section 31 Fees
Regulatory fees, less Section 31 Fees, decreased in the three and nine months ended September 30, 2017March 31, 2020 compared to the same periodsperiod in 20162019 primarily due to a decrease in options regulatory fees reflecting lower regulatory costs to oversee the options markets.
fines and assessment fees.Royalty Fees
Royalty fees increased for the three and nine months ended September 30, 2017March 31, 2020 compared to the same periodsperiod in 20162019 primarily due to higheran increase in trading volume in licensed products.
Other
Other revenue increased in the three and nine months ended September 30, 2017 compared to the same periods in 2016 primarily due the Bats acquisition that contributed $3.6 million and $6.8 million, respectively.
Operating Expenses
Total operating expenses increased 114% for the three months ended
September 30, 2017March 31, 2020 compared to
the same period in 2019 primarily due to additional index licensing and trade reporting services revenue in 2020.Operating Expenses
Total operating expenses decreased $2.1 million, or 1.6%, for the three months ended September 30, 2016March 31, 2020 primarily due to incremental operating expenses of Bats in 2017. For the nine months ended September 30, 2017 compared to the nine months ended September 30, 2016 acquisition-related costs of $75.4 million for the Bats acquisition drove the increase in operating expenses. Incremental operating expenses of Bats from the acquisition date to September 30, 2017 also contributed to the increase primarilya decline in depreciation and amortization, andoffset by an increase in compensation and benefits.benefits expense. The following summarizes changes in operating expenses for the three and nine months ended September 30, 2017,March 31, 2020 compared to the three and nine months ended September 30, 2016:
|
| | | | | | | | | | | | | | | | | | | | | | | |
| | Three Months Ended
September 30, | Increase/ | Percent | | Nine Months Ended
September 30, | Increase/ | Percent |
| 2017 | 2016 | (Decrease) | Change | | 2017 | 2016 | (Decrease) | Change |
| (in millions, except percentages) | | (in millions, except percentages) |
| Operating expenses: | | | | | | | | | |
| Compensation and benefits | $ | 50.4 |
| $ | 28.3 |
| $ | 22.1 |
| 78.1 | % | | $ | 148.2 |
| $ | 83.9 |
| $ | 64.3 |
| 76.6 | % |
| Depreciation and amortization | 55.4 |
| 10.2 |
| 45.2 |
| 443.1 | % | | 136.3 |
| 34.4 |
| 101.9 |
| 296.2 | % |
| Technology support services | 11.4 |
| 5.6 |
| 5.8 |
| 103.6 | % | | 30.9 |
| 17.0 |
| 13.9 |
| 81.8 | % |
| Professional fees and outside services | 17.6 |
| 12.7 |
| 4.9 |
| 38.6 | % | | 48.9 |
| 41.0 |
| 7.9 |
| 19.3 | % |
| Travel and promotional expenses | 4.5 |
| 2.6 |
| 1.9 |
| 73.1 | % | | 12.0 |
| 7.6 |
| 4.4 |
| 57.9 | % |
| Facilities costs | 2.9 |
| 1.3 |
| 1.6 |
| 123.1 | % | | 7.7 |
| 4.2 |
| 3.5 |
| 83.3 | % |
| Acquisition-related costs | 5.5 |
| 8.6 |
| (3.1 | ) | (36.0 | )% | | 75.4 |
| 8.6 |
| 66.8 |
| 776.7 | % |
| Change in contingent consideration | 0.4 |
| — |
| 0.4 |
| * |
| | 1.1 |
| — |
| 1.1 |
| * |
|
| Other expenses | 2.3 |
| 1.1 |
| 1.2 |
| 109.1 | % | | 6.3 |
| 3.4 |
| 2.9 |
| 85.3 | % |
| Total operating expenses | $ | 150.4 |
| $ | 70.4 |
| $ | 80.0 |
| 113.6 | % | | $ | 466.8 |
| $ | 200.1 |
| $ | 266.7 |
| 133.3 | % |
* Not meaningful
March 31, 2019: | | | | | | | | | | | | | |
| | Three Months Ended | | | | | | | |
| | March 31, | | Increase/ | | Percent | | |
| | 2020 | | 2019 | | (Decrease) | | Change | | |
| | (in millions, except percentages) | | |
Operating Expenses: | | | | | | | | | | | | | |
Compensation and benefits | | $ | 53.3 | | $ | 48.1 | | $ | 5.2 | | 10.8 | % | |
Depreciation and amortization | | | 40.5 | | | 47.2 | | | (6.7) | | (14.2) | % | |
Technology support services | | | 11.9 | | | 11.9 | | | — | | — | % | |
Professional fees and outside services | | | 14.9 | | | 16.2 | | | (1.3) | | (8.0) | % | |
Travel and promotional expenses | | | 2.1 | | | 2.6 | | | (0.5) | | (19.2) | % | |
Facilities costs | | | 4.1 | | | 2.1 | | | 2.0 | | 95.2 | % | |
Acquisition-related costs | | | 0.8 | | | 2.3 | | | (1.5) | | (65.2) | % | |
Other expenses | | | 4.3 | | | 3.6 | | | 0.7 | | 19.4 | % | |
Total operating expenses | | $ | 131.9 | | $ | 134.0 | | $ | (2.1) | | (1.6) | % | |
Compensation and Benefits
Compensation and benefits increased for the three and nine months ended September 30, 2017March 31, 2020 compared to the same period in 2019 primarily due to an increase in bonus expense of $2.6 million, an increase in equity compensation as a result of forfeitures in 2019 that did not recur in 2020, and a decrease in capitalized wages of $2.2 million due to a decrease in software projects eligible for capitalization, offset by a $2.1 million decline in benefits due to the adjustment of deferred compensation plan assets.
Depreciation and Amortization
Depreciation and amortization decreased for the three months ended March 31, 2020 compared to the same period in 2019 primarily due to the write-off of the CBOE Command software in the fourth quarter of 2019 that resulted in a $2.1 million decline in amortization, and the change in accounting classification of the Chicago headquarters building to held for sale in the second quarter of 2019, which resulted in depreciation ceasing on the building, offset by an increase of $1.2 million of depreciation related to equipment placed into service in the fourth quarter of 2019.
Technology Support Services
Technology support services costs were flat for the three months ended March 31, 2020 compared to the same periods in 2016 primarily driven by the incremental costs for additional employees from the Bats acquisition2019.
Professional Fees and $51.4 million, respectively. The remainder of the increase during the nine month period was due to the acceleration of stock-based compensation due to a change in the vesting terms in the first quarter of 2017.
DepreciationOutside ServicesProfessional fees and Amortization
Depreciation and amortization increasedoutside services decreased for the three and nine months ended September 30, 2017March 31, 2020 compared to the same periodsperiod in 20162019 primarily driven by amortizationdue to a decline in regulatory service fees of purchased intangible assets acquired from the Bats acquisition$0.6 million, a decline in consulting fees of $45.5$0.5 million, and $106.6 million, respectively.
Technology Support Services
Technology supporta decline in contracted services
of $0.2 million.Travel and Promotional Expenses
Travel and promotional expenses decreased for the three months ended March 31, 2020 compared to the same period in 2019 primarily due to travel restrictions implemented in March 2020 in response to the COVID-19 pandemic.
Facilities Costs
Facilities costs increased for the three and nine months ended September 30, 2017March 31, 2020 compared to the same periodsperiod in 20162019 primarily driven by incrementaldue to a reversal of deferred rent expense fromof $1.3 million in the acquisition of Batsfirst quarter 2019 that contributed $5.9 million and $14.0 million, respectively.
Professional Fees and Outside Services
Professional and outside services feesdid not recur in 2020, coupled with additional rent expense incurred for the new headquarters location beginning in January 2020.Acquisition-Related Costs
Acquisition-related costs decreased for the three months ended March 31, 2020 compared to the same period in 2019 primarily due to a decrease in equity compensation-related expenses in 2020.
Other Expenses
Other expenses increased for the three and nine months ended September 30, 2017March 31, 2020 compared to the same periodsperiod in 20162019 primarily driven by incremental expense from the acquisition of Bats that contributed $4.6 million and $9.8 million, respectively.
Acquisition-related costs
Acquisition-related costs increased for the three and nine months ended September 30, 2017 compareddue to the same periods in 2016 primarily driven by our acquisition of Bats. Acquisition-related costs include fees for investment banking advisors, lawyers, accountants, tax advisors, public relations firms, severance and retention costs, impairment of capitalized software and other external costs directlyadditional one-time charitable contributions made related to the mergers and acquisitions.
COVID-19 relief efforts of $1.0 million, offset by a write-off of bad debt in 2019 of $0.3 million that did not recur in 2020.Operating Income
As a result of the items above, operating income for the three months ended September 30, 2017March 31, 2020 was $119.3$226.4 million compared to $65.8$146.5 million for same period in 2016. Operating income for2019, an increase of $79.9 million.
Interest Expense, Net
Net interest expense decreased in the ninethree months ended September 30, 2017 was $263.2 millionMarch 31, 2020 compared to $223.3 million forthe same period in 2016.
Interest Expense, Net
Net interest expense increased in the three and nine months ended September 30, 20172019 primarily due to
$11.0the decrease in outstanding debt from $1,216.0 million
and $32.0at March 31, 2019 to $868.1 million
respectively, in interestat March 31, 2020.Other Expense, Net
Net other expense related to the financing of the Bats acquisition. To finance the cash required for the acquisition, we entered into a $1.0 billion term loan agreement and issued $650 million in aggregate principal amount of 3.650% senior notes. In June 2017, we issued $300 million in aggregate principal amount of 1.950% senior notes and used the net proceeds to pay down a portion of the term loan. See Note 11, Debt, to the condensed consolidated financial statements for a discussion of debt agreements.
Other (Expense) Income
Other (expense) income increaseddecreased for the three and nine months ended September 30, 2017March 31, 2020 compared to the three and nine months ended September 30, 2016 drivensame period in 2019 primarily due to the reversal of the $8.8 million OCC dividend declared in 2018, which was to be paid in 2019, as a result of the SEC’s disapproval of the OCC capital plan during the first quarter of 2019, partially offset by the provision for uncollectable convertible notes receivabledeferred compensation plan asset expense of $3.8 million related to our investment in Tradelegs, LLC.
$2.1 million.Income Before Income Tax Provision
As a result of the above, income before income tax provision for the three months ended September 30, 2017March 31, 2020 was $105.9$217.5 million compared to $67.4$127.8 million for the same period in 2016,2019, an increase of $38.5$89.7 million. For the nine months ended September 30, 2017 income before income tax provision was $230.3 million compared to $231.7 million for the same period in 2016, a decrease
ForThe effective tax rate from continuing operations was 27.6% and 25.5% for the three months ended September 30, 2017, the income tax provision was $45.6 million compared with $26.9 million for the same period in 2016.March 31, 2020 and 2019, respectively. The lower effective tax rate for the three months ended September 30, 2017 was 43.1% compared to 39.9% for the three months ended September 30, 2016. The increase in the effective tax rate for the three months ended September 30, 2017 against the comparable period in the prior yearMarch 31, 2019 was primarily due to a re-measurement of our deferred tax assets and liabilities as a result of a 1.75% corporate income tax rate increase in Illinois enacted on July 6, 2017.
For the nine months ended September 30, 2017, the income tax provision was $86.8 million compared with $91.1 million for the same period in 2016. The effective tax rate for the nine months ended September 30, 2017 was 37.7% compared to 39.3% for the nine months ended September 30, 2016. The decrease in the effective tax rate for the nine months ended September 30, 2017 against the comparable period in the prior year was primarily due to discrete events during the nine-month period, mainly the re-measurement of tax reserves and excess tax benefits associated with the exercise and vesting of stock-based compensation.
related to equity awards.Net Income
As a result of the items above, net income for the three months ended September 30, 2017March 31, 2020 was $60.3$157.4 million compared to $40.5$95.2 million for the three months ended September 30, 2016,March 31, 2019, an increase of $19.8$62.2 million.
As a result of the items above, net income for the nine months ended September 30, 2017 was $143.5 million compared to $140.6 million for the nine months ended September 30, 2016, an increase of $2.9 million.
Segment Operating Results
We report results from our five segments: Options, U.S. Equities, Futures, European Equities, and Global FX. Segment performance is primarily based on operating income (loss). We have aggregated all corporate costs, acquisition-related costs, as well as other business ventures, within the Corporate Items and Eliminations as those activities should not be used to evaluate a segment'ssegment’s operating performance. All operating expenses that relate to activities of a specific segment have been allocated to that segment.
The following summarizes our total revenues by segment (in millions, except percentages):segment:
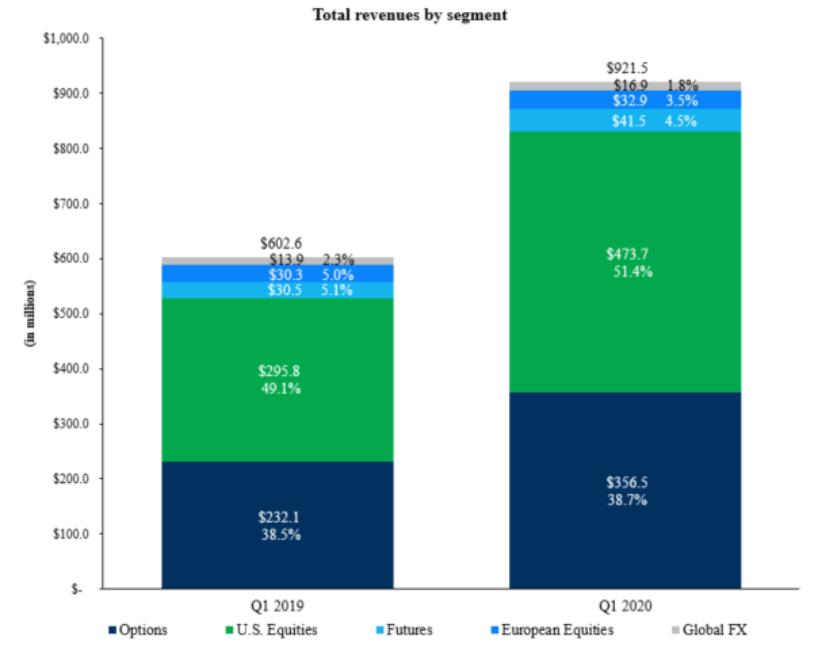
| | | | | | | | | | | | | | |
| | | | | | | | | | Percentage | | |
| | | | | | | | | | of Total | | |
| | | | | | | | | | Revenues | | |
| | Three Months Ended | | | | Three Months Ended | | |
| | March 31, | | Percent | | March 31, | | |
| | 2020 | | 2019 | | Change | | 2020 | | 2019 | | |
| | (in millions, except percentages) | | |
Options | | $ | 356.5 | | $ | 232.1 | | 53.6 | % | 38.7 | % | 38.5 | % | |
U.S. Equities | | | 473.7 | | | 295.8 | | 60.1 | % | 51.4 | % | 49.1 | % | |
Futures | | | 41.5 | | | 30.5 | | 36.1 | % | 4.5 | % | 5.1 | % | |
European Equities | | | 32.9 | | | 30.3 | | 8.6 | % | 3.6 | % | 5.0 | % | |
Global FX | | | 16.9 | | | 13.9 | | 21.6 | % | 1.8 | % | 2.3 | % | |
Total revenues | | $ | 921.5 | | $ | 602.6 | | 52.9 | % | 100.0 | % | 100.0 | % | |
The following summarizes our revenues less cost of revenues by segment:
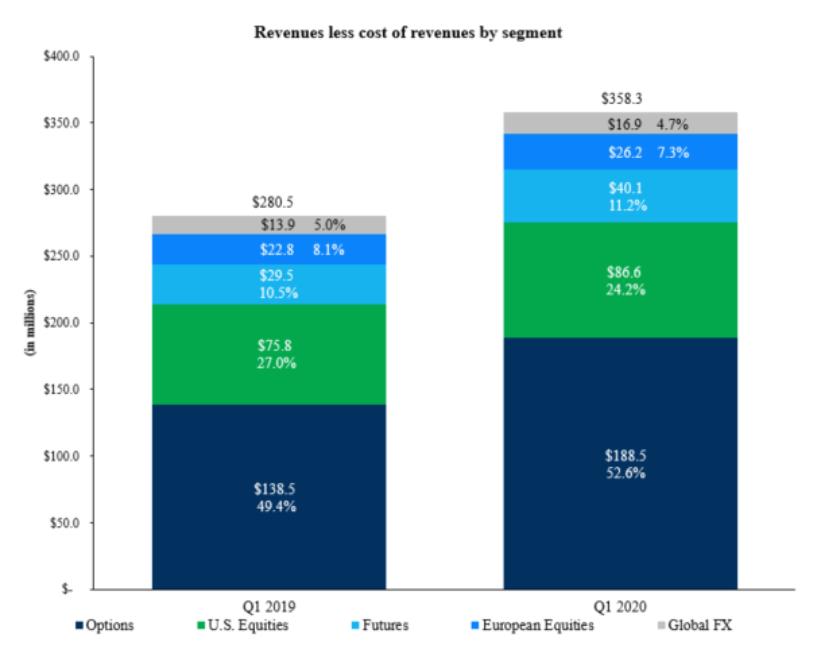
| | | | | | | | | | | | | | |
| | | | | | | | | | Percentage of | | |
| | | | | | | | | | Total Revenues | | |
| | | | | | | | | | Less Cost of Revenues | | |
| | Three Months Ended | | | | Three Months Ended | | |
| | March 31, | | Percent | | March 31, | | |
| | 2020 | | 2019 | | Change | | 2020 | | 2019 | | |
| | (in millions, except percentages) | | |
Options | | $ | 188.5 | | $ | 138.5 | | 36.1 | % | 52.6 | % | 49.4 | % | |
U.S. Equities | | | 86.6 | | | 75.8 | | 14.2 | % | 24.2 | % | 27.0 | % | |
Futures | | | 40.1 | | | 29.5 | | 35.9 | % | 11.2 | % | 10.5 | % | |
European Equities | | | 26.2 | | | 22.8 | | 14.9 | % | 7.3 | % | 8.1 | % | |
Global FX | | | 16.9 | | | 13.9 | | 21.6 | % | 4.7 | % | 5.0 | % | |
Total revenues less cost of revenues | | $ | 358.3 | | $ | 280.5 | | 27.7 | % | 100.0 | % | 100.0 | % | |
|
| | | | | | | | | | | | | | | | | | | | | | | | | | | | | | | | | | |
| | | |
| | |
| | |
| | Percentage of Total Revenues | | | | | | | | Percentage of Total Revenues |
| | Three Months Ended
September 30, | | Percent Change | | Three Months Ended
September 30, | | Nine Months Ended
September 30, | | Percent Change | | Nine Months Ended
September 30, |
| | 2017 | | 2016 | | | 2017 | | 2016 | | 2017 | | 2016 | | | 2017 | | 2016 |
| Options | | $ | 224.8 |
| | $ | 139.2 |
| | 61.5 | % | | 36.8 | % | | 82.5 | % | | $ | 651.0 |
| | $ | 426.8 |
| | 52.5 | % | | 40.5 | % | | 83.3 | % |
| U.S. Equities | | 308.5 |
| | — |
| | * |
| | 50.5 | % | | — | % | | 759.8 |
| | — |
| | * |
| | 47.3 | % | | — | % |
| Futures | | 40.3 |
| | 29.5 |
| | 36.6 | % | | 6.6 | % | | 17.5 | % | | 107.7 |
| | 85.5 |
| | 26.0 | % | | 6.7 | % | | 16.7 | % |
| European Equities | | 26.3 |
| | — |
| | * |
| | 4.3 | % | | — | % | | 63.2 |
| | — |
| | * |
| | 3.9 | % | | — | % |
| Global FX | | 11.3 |
| | — |
| | * |
| | 1.8 | % | | — | % | | 26.2 |
| | — |
| | * |
| | 1.6 | % | | — | % |
| Corporate Items and Eliminations | | 0.2 |
| | — |
| | * |
| | — | % | | — | % | | 0.5 |
| | — |
| | * |
| | — | % | | — | % |
| Total revenues | | $ | 611.4 |
| | $ | 168.7 |
| | 262.4 | % | | 100.0 | % | | 100.0 | % | | $ | 1,608.4 |
| | $ | 512.3 |
| | 214.0 | % | | 100.0 | % | | 100.0 | % |
* Not meaningfulThe following summarizes revenues less cost of revenues, operating expenses, operating income, EBITDA, and EBITDA margin for our Options segment:
| | | | | | | | | | | | | | | | | | |
| | | | | | | | | | | | | Percentage | | |
| | | | | | | | | | | | | of Total | | |
| | | | | | | | | | | | | Revenues | | |
| | Three Months Ended | | | | | | Three Months Ended | | |
| | March 31, | | | Percent | | | March 31, | | |
| | 2020 | | | 2019 | | | Change | | | 2020 | | | 2019 | | |
| | (in millions, except percentages) | | |
Revenues less cost of revenues | | $ | 188.5 | | | $ | 138.5 | | | 36.1 | % | | 52.9 | % | | 59.7 | % | |
Operating expenses | | | 45.1 | | | | 50.4 | | | (10.5) | % | | 12.7 | % | | 21.7 | % | |
Operating income | | $ | 143.4 | | | $ | 88.1 | | | 62.8 | % | | 40.2 | % | | 38.0 | % | |
EBITDA(1) | | $ | 151.0 | | | $ | 89.1 | | | 69.5 | % | | 42.4 | % | | 38.4 | % | |
EBITDA margin(2) | | | 80.1 | % | | | 64.3 | % | | * | | | * | | | * | | |
| (1) | See footnote (1) to the table under “Financial Summary” above for a reconciliation of net income to EBITDA, and management’s reasons for using such non-GAAP measures. |
| (2) | EBITDA margin represents EBITDA divided by revenues less cost of revenues. |
|
| | | | | | | | | | | | | | | | | | | | | | | | | | | | |
| | |
| |
| |
| | Percentage of Total Revenues | | |
| |
| | |
| | Percentage of Total Revenues |
| | Three Months Ended
September 30, | Percent | | Three Months Ended September 30, | | Nine Months Ended
September 30, | | Percent | | Nine Months Ended
September 30, |
| 2017 | 2016 | Change | | 2017 | 2016 | | 2017 | 2016 | | Change | | 2017 | 2016 |
| | (in millions, except percentages) |
| Revenues less cost of revenues | $ | 130.7 |
| $ | 107.8 |
| 21.2 | % | | 21.4 | % | 63.9 | % | | $ | 386.3 |
| $ | 341.1 |
| | 13.3 | % | | 24.0 | % | 66.5 | % |
| Operating expenses | 66.4 |
| 65.2 |
| 1.8 | % | | 10.9 | % | 38.6 | % | | 195.8 |
| 182.6 |
| | 7.2% | | 12.2 | % | 35.6 | % |
| Operating income | $ | 64.3 |
| $ | 42.6 |
| 50.9 | % | | 10.5 | % | 25.3 | % | | $ | 190.5 |
| $ | 158.5 |
| | 20.2 | % | | 11.8 | % | 30.9 | % |
| | | | | | | | | | | | | | | |
| EBITDA (1) | $ | 74.6 |
| $ | 53.7 |
| 38.9 | % | | 12.1 | % | 31.8 | % | | $ | 225.9 |
| $ | 192.6 |
| | 17.3 | % | | 14.0 | % | 37.6 | % |
| EBITDA margin (2) | 57.1 | % | 49.8 | % | * | | * | * | | 58.5 | % | 56.5 | % | | * | | * | * |
* Not meaningful
(1) See footnote (1) to the table under “Financial Summary” above for a reconciliation of net income to EBITDA, and management’s reasons for using such non-GAAP measures.
(2) EBITDA margin represents EBITDA divided by revenues less cost of revenues.
Revenues less cost of revenues increased $22.9$50.0 million for the three months ended September 30, 2017March 31, 2020 compared to the three months ended September 30, 2016,March 31, 2019, primarily driven by the acquisition of Bats, which contributed $12.6 million anddue to a 23.5%45.8% increase in overall options market ADV, including a 42.1% increase in index ADV partially offset by a 5.4% decrease in index options RPC and decreased Cboe Options and C2 access fees in the third quarter of 2017.ADV. For the three months ended September 30, 2017,March 31, 2020, the Options segment’s operating income increased $21.7$55.3 million compared to the three months ended September 30, 2016.
RevenuesMarch 31, 2019, due to higher revenues less cost of revenues increased $45.2revenues. Operating expenses decreased $5.3 million for the ninethree months ended September 30, 2017,March 31, 2020 compared to the ninethree months ended September 30, 2016,March 31, 2019, primarily driven by the acquisition of Bats, which contributed $27.2 milliondue to decreases in acquisition-related costs, professional fees and a 17.6% increase in index ADVoutside services, and depreciation and amortization, partially offset by a 2.7% decreasean increase in index options RPC. For the nine months ended September 30, 2017, the Options segment’s operating income increased $32.0 million compared to the nine months ended September 30, 2016.
compensation and benefits and facilities costs.U.S. Equities
The following summarizes revenues less cost of revenues, operating expenses, operating income, EBITDA, and EBIDTAEBITDA margin for our U.S. Equities segment:
| | | | | | | | | | | | | | | | | |
| | | | | | | | | | | | | Percentage | |
| | | | | | | | | | | | | of Total | |
| | | | | | | | | | | | | Revenues | |
| | Three Months Ended | | | | | | Three Months Ended | |
| | March 31, | | | Percent | | | March 31, | |
| | 2020 | | | 2019 | | | Change | | | 2020 | | | 2019 | |
| | (in millions, except percentages) | |
Revenues less cost of revenues | | $ | 86.6 | | | $ | 75.8 | | | 14.2 | % | | 18.3 | % | | 25.6 | % |
Operating expenses | | | 37.6 | | | | 38.2 | | | (1.6) | % | | 7.9 | % | | 12.9 | % |
Operating income | | $ | 49.0 | | | $ | 37.6 | | | 30.3 | % | | 10.3 | % | | 12.7 | % |
EBITDA(1) | | $ | 66.7 | | | $ | 57.3 | | | 16.4 | % | | 14.1 | % | | 19.4 | % |
EBITDA margin(2) | | | 77.0 | % | | | 75.6 | % | | * | | | * | | | * | |
|
| | | | | | | | | | | | | | | | | | | | | | | | | |
| | |
| |
| | | Percentage of Total Revenues | | |
| |
| | | Percentage of Total Revenues |
| | Three Months Ended
September 30, | Percent | | Three Months Ended
September 30, | | Nine Months Ended
September 30, | Percent | | Nine Months Ended
September 30, |
| 2017 | 2016 | Change | | 2017 | 2016 | | 2017 | 2016 | Change | | 2017 | 2016 |
| | (in millions, except percentages) |
| Revenues less cost of revenues | $ | 70.2 |
| $ | — |
| * | | 11.5 | % | — | % | | $ | 170.1 |
| $ | — |
| * | | 10.6 | % | — | % |
| Operating expenses | 40.3 |
| — |
| * | | 6.6 | % | — | % | | 94.7 |
| — |
| * | | 5.9 | % | — | % |
| Operating income | $ | 29.9 |
| $ | — |
| * | | 4.9 | % | — | % | | $ | 75.4 |
| $ | — |
| * | | 4.7 | % | — | % |
| | | | | | | | | | | | | | |
| EBITDA (1) | $ | 53.5 |
| $ | — |
| * | | 8.8 | % | — | % | | $ | 131.5 |
| $ | — |
| * | | 8.2 | % | — | % |
| EBITDA margin (2) | 76.2 | % | * | * | | * | * | | 77.3 | % | * | * | | * | * |
* Not meaningful
(1) See footnote (1) to the table under “Financial Summary” above for a reconciliation of net income to EBITDA, and management’s reasons for using such non-GAAP measures.
(2) | (1) | See footnote (1) to the table under “Financial Summary” above for a reconciliation of net income to EBITDA, and management’s reasons for using such non-GAAP measures. |
| (2) | EBITDA margin represents EBITDA divided by revenues less cost of revenues. |
Revenues less cost of revenues increased $10.8 million for the three months ended March 31, 2020 compared to the three months ended March 31, 2019, primarily due to a 46.7% increase in volumes traded on our U.S. Equities exchanges. For the three months ended March 31, 2020, the U.S. Equities segment’s operating income increased $11.4 million compared to the three months ended March 31, 2019, due to higher revenues less cost of revenues.
Forrevenue. Operating expenses decreased $0.6 million for the three and nine months ended September 30, 2017, U.S. Equities contributed revenues lessMarch 31, 2020 compared to the three months ended March 31, 2019, primarily due to decreases in depreciation and amortization and technology support services costs, of revenues of $70.2 millionpartially offset by higher professional fees and $170.1 million, respectively,outside services and operating income of $29.9 millioncompensation and $75.4 million, respectively, resulting from our acquisition of Bats on February 28, 2017.
The following summarizes revenues less cost of revenues, operating expenses, operating income, EBITDA, and EBITDA margin for our Futures segment:
| | | | | | | | | | | | | | | | | | |
| | | | | | | | | | | | | Percentage | | |
| | | | | | | | | | | | | of Total | | |
| | | | | | | | | | | | | Revenues | | |
| | Three Months Ended | | | | | | Three Months Ended | | |
| | March 31, | | | Percent | | | March 31, | | |
| | 2020 | | | 2019 | | | Change | | | 2020 | | | 2019 | | |
| | (in millions, except percentages) | | |
Revenues less cost of revenues | | $ | 40.1 | | | $ | 29.5 | | | 35.9 | % | | 96.6 | % | | 96.7 | % | |
Operating expenses | | | 13.2 | | | | 11.2 | | | 17.9 | % | | 31.8 | % | | 36.7 | % | |
Operating income | | $ | 26.9 | | | $ | 18.3 | | | 47.0 | % | | 64.8 | % | | 60.0 | % | |
EBITDA(1) | | $ | 27.6 | | | $ | 18.6 | | | 48.4 | % | | 66.5 | % | | 61.0 | % | |
EBITDA margin(2) | | | 68.8 | % | | | 63.1 | % | | * | | | * | | | * | | |
|
| | | | | | | | | | | | | | | | | | | | | | | | | | | | |
| | |
| |
| |
| | Percentage of Total Revenues | | |
| |
| | |
| | Percentage of Total Revenues |
Three Months Ended
September 30, | Percent | | Three Months Ended
September 30, | | Nine Months Ended
September 30, | | Percent | | Nine Months Ended
September 30, |
| 2017 | 2016 | Change | | 2017 | 2016 | | 2017 | 2016 | | Change | | 2017 | 2016 |
| | (in millions, except percentages) |
| Revenues less cost of revenues | $ | 38.9 |
| $ | 28.4 |
| 37.0 | % | | 6.4 | % | 16.8 | % | | 103.9 |
| 82.3 |
| | 26.2 | % | | 6.5 | % | 16.1 | % |
| Operating expenses | 3.5 |
| 2.9 |
| 20.7 | % | | 0.6 | % | 1.7 | % | | 9.2 |
| 10.1 |
| | (8.9 | )% | | 0.6 | % | 2.0 | % |
| Operating income | $ | 35.4 |
| $ | 25.5 |
| 38.8 | % | | 5.8 | % | 15.1 | % | | $ | 94.7 |
| $ | 72.2 |
| | 31.2 | % | | 5.9 | % | 14.1 | % |
| |
|
|
| |
|
| |
|
| |
| |
|
|
| EBITDA (1) | $ | 35.5 |
| $ | 26.1 |
| 36.0 | % | | 5.8 | % | 15.5 | % | | $ | 95.5 |
| $ | 74.6 |
| | 28.0 | % | | 5.9 | % | 14.6 | % |
| EBITDA margin (2) | 91.3 | % | 91.9 | % | * | | * | * | | 91.9 | % | 90.6 | % | | * | | * | * |
* Not meaningful
(1) See footnote (1) to the table under “Financial Summary” above for a reconciliation of net income to EBITDA, and management’s reasons for using such non-GAAP measures.
(2) | (1) | See footnote (1) to the table under “Financial Summary” above for a reconciliation of net income to EBITDA, and management’s reasons for using such non-GAAP measures. |
| (2) | EBITDA margin represents EBITDA divided by revenues less cost of revenues. |
Revenues less cost of revenues increased $10.6 million for the three months ended March 31, 2020 compared to the three months ended March 31, 2019, primarily due to a 43.1% increase in Futures ADV. For the three months ended March 31, 2020, the Futures segment’s operating income increased $8.6 million compared to the three months ended March 31, 2019, due to higher revenues less cost of revenues.
For Operating expenses increased $2.0 million for the three months ended
September 30, 2017March 31, 2020 compared to the
same period in 2016, the net revenue and operating income increased $10.5 million and $9.9 million, respectively,three months ended March 31, 2019, primarily
driven by a 35.9%due to an increase in
ADV, from 244 thousand contracts per day in 2016 to 331 thousand contracts per day in 2017compensation and
a 2.5% increase in revenue per contract.benefits.
For the nine months ended September 30, 2017 compared to the same period in 2016, the net revenue and operating income increased $21.6 million and $22.5 million, respectively, primarily driven by a 29.7% increase in ADV, from 240 thousand contracts per day in 2016 to 311 thousand contracts per day in 2017 and a 4.7% increase in revenue per contract.
The following summarizes revenues less cost of revenues, operating expenses, operating income, EBITDA, and EBITDA margin for our European Equities segment:
| | | | | | | | | | | | | | | | | | |
| | | | | | | | | | | | | Percentage | | |
| | | | | | | | | | | | | of Total | | |
| | | | | | | | | | | | | Revenues | | |
| | Three Months Ended | | | | | | Three Months Ended | | |
| | March 31, | | | Percent | | | March 31, | | |
| | 2020 | | | 2019 | | | Change | | | 2020 | | | 2019 | | |
| | (in millions, except percentages) | | |
Revenues less cost of revenues | | $ | 26.2 | | | $ | 22.8 | | | 14.9 | % | | 79.6 | % | | 75.2 | % | |
Operating expenses | | | 16.7 | | | | 17.0 | | | (1.8) | % | | 50.8 | % | | 56.1 | % | |
Operating income | | $ | 9.5 | | | $ | 5.8 | | | 63.8 | % | | 28.9 | % | | 19.1 | % | |
EBITDA(1) | | $ | 16.8 | | | $ | 12.9 | | | 30.2 | % | | 51.1 | % | | 42.6 | % | |
EBITDA margin(2) | | | 64.1 | % | | | 56.6 | % | | * | | | * | | | * | | |
|
| | | | | | | | | | | | | | | | | | | | | | | | | |
| | |
| |
| | | Percentage of Total Revenues | | |
| |
| | | Percentage of Total Revenues |
| | Three Months Ended
September 30, | Percent Change | | Three Months Ended
September 30, | | Nine Months Ended
September 30, | Percent Change | | Nine Months Ended
September 30, |
| 2017 | 2016 | | 2017 | 2016 | | 2017 | 2016 | | 2017 | 2016 |
| (in millions, except percentages) | | |
| |
| | |
| |
| | | |
| |
|
| Revenues less cost of revenues | $ | 18.4 |
| $ | — |
| * | | 3.0 | % | — | % | | $ | 43.0 |
| $ | — |
| * | | 2.7 | % | — | % |
| Operating expenses | 15.7 |
| — |
| * | | 2.6 | % | — | % | | 35.2 |
| — |
| * | | 2.2 | % | — | % |
| Operating income | $ | 2.7 |
| $ | — |
| * | | 0.4 | % | — | % | | $ | 7.8 |
| $ | — |
| * | | 0.5 | % | — | % |
| | | | | | | | | | | | | | |
| EBITDA (1) | $ | 10.6 |
| $ | — |
| * | | 1.7 | % | — | % | | $ | 25.6 |
| $ | — |
| * | | 1.6 | % | — | % |
| EBITDA margin (2) | 57.6 | % | * | * | | * | * | | 59.5 | % | * | * | | * | * |
(1) See footnote (1) to the table under “Financial Summary” above for a reconciliation of net income to EBITDA, and management’s reasons for using such non-GAAP measures.
(2) | (1) | See footnote (1) to the table under “Financial Summary” above for a reconciliation of net income to EBITDA, and management’s reasons for using such non-GAAP measures. |
| (2) | EBITDA margin represents EBITDA divided by revenues less cost of revenues. |
Revenues less cost of revenues increased $3.4 million for the three months ended March 31, 2020 compared to the three months ended March 31, 2019, primarily due to a 23.5% increase in European Equities ADNV. For the three months ended March 31, 2020, the European Equities segment’s operating income increased $3.7 million compared to the three months ended March 31, 2019, due to higher revenues less cost of revenues.
For Operating expenses decreased $0.3 million for the three and nine months ended September 30, 2017,March 31, 2020 compared to the European Equities segment contributed revenues less cost of revenues of $18.4 millionthree months ended March 31, 2019, primarily due to decreases in acquisition-related costs, depreciation and $43.0 million, respectively,amortization and operating income of $2.7 millionprofessional fees and $7.8 million, respectively, resulting from our acquisition of Bats on February 28, 2017.
outside services, partially offset by an increase in compensation and benefits.Global FX
The following summarizes revenues less cost of revenues, operating expenses, operating income, EBITDA, and EBITDA margin for our Global FX segment:
| | | | | | | | | | | | | | | | | | |
| | | | | | | | | | | | | Percentage | | |
| | | | | | | | | | | | | of Total | | |
| | | | | | | | | | | | | Revenues | | |
| | Three Months Ended | | | | | | Three Months Ended | | |
| | March 31, | | | Percent | | | March 31, | | |
| | 2020 | | | 2019 | | | Change | | | 2020 | | | 2019 | | |
| | (in millions, except percentages) | | |
Revenues less cost of revenues | | $ | 16.9 | | | $ | 13.9 | | | 21.6 | % | | 100.0 | % | | 100.0 | % | |
Operating expenses | | | 13.9 | | | | 14.3 | | | (2.8) | % | | 82.2 | % | | 102.9 | % | |
Operating income (loss) | | $ | 3.0 | | | $ | (0.4) | | | 850.0 | % | | 17.8 | % | | (2.9) | % | |
EBITDA(1) | | $ | 10.0 | | | $ | 7.4 | | | 35.1 | % | | 59.2 | % | | 53.2 | % | |
EBITDA margin(2) | | | 59.2 | % | | | 53.2 | % | | * | | | * | | | * | | |
| (1) | See footnote (1) to the table under “Financial Summary” above for a reconciliation of net income to EBITDA and adjusted EBITDA, and management’s reasons for using such non-GAAP measures. |
| (2) | EBITDA margin represents EBITDA divided by revenues less cost of revenues. |
|
| | | | | | | | | | | | | | | | | | | | | | | | | |
| | |
| |
| | | Percentage of Total Revenues | | |
| |
| | | Percentage of Total Revenues |
| | Three Months Ended
September 30, | Percent Change | | Three Months Ended
September 30, | | Nine Months Ended
September 30, | Percent | | Nine Months Ended
September 30, |
| 2017 | 2016 | | 2017 | 2016 | | 2017 | 2016 | Change | | 2017 | 2016 |
| | (in millions, except percentages) |
| Revenues less cost of revenues | $ | 11.3 |
| $ | — |
| * | | 1.8 | % | — | % | | $ | 26.2 |
| $ | — |
| * | | 1.6 | % | — | % |
| Operating expenses | 14.8 |
| — |
| * | | 2.4 | % | — | % | | 35.0 |
| — |
| * | | 2.1 | % | — | % |
| Operating (loss) income | $ | (3.5 | ) | $ | — |
| * | | (0.6 | )% | — | % | | $ | (8.8 | ) | $ | — |
| * | | (0.5 | )% | — | % |
| | �� | | | | | | | | | | | | |
| EBITDA (1) | $ | 5.6 |
| $ | — |
| * | | 0.9 | % | — | % | | $ | 12.4 |
| $ | — |
| * | | 0.8 | % | — | % |
| EBITDA margin (2) | 49.6 | % | * | * | | * | * | | 47.3 | % | * | * | | * | * |
(1) See footnote (1) to the table under “Financial Summary” above for a reconciliation
(2) EBITDA margin represents EBITDA divided by revenues less cost of revenues.
For the three and nine months ended September 30, 2017, the Global FX segment contributed revenuesRevenues less cost of revenues increased $3.0 million for the three months ended March 31, 2020 compared to the three months ended March 31, 2019, primarily due to an 18.6% increase in Global FX ADNV. For the three months ended March 31, 2020, the Global FX segment’s operating income increased $3.4 million compared to the three months ended March 31, 2019, due to higher revenues less costs of $11.3revenues. Operating expenses decreased $0.4 million for the three months ended March 31, 2020 compared to the three months ended March 31, 2019, primarily due to decreases in depreciation and $26.2 million, respectively,amortization and acquisition-related costs, partially offset by an operating loss of $3.5 millionincrease in compensation and $8.8 million, respectively, resulting from our acquisition of Bats on February 28, 2017.
Seasonality
In the securities and FX industries, quarterly revenue fluctuations are common and are due primarily to seasonal variations in trading volumes, as well as competition and technological and regulatory changes. Our business may experience seasonal fluctuations, reflecting reduced trading activity.
benefits.Liquidity and Capital Resources
Below are charts that reflect elements of our capital allocation:
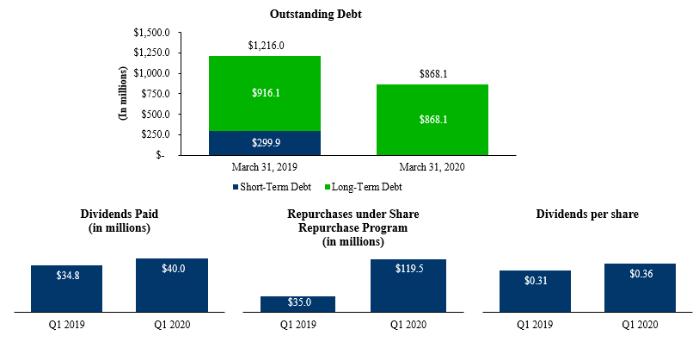
We expect our cash on hand at September 30, 2017March 31, 2020 and other available resources, including cash generated from operations, to be sufficient to continue to meet our 2017 cash requirements.requirements for the foreseeable future. In the near term, we expect that our cash from operations and availability under our revolving credit facility will meet our cash needs to fund our operations, capital expenditures, interest payments on debt, debt repayments, any dividends, potential strategic acquisitions, and opportunities for common stock repurchases under the previously announced program. We may also plan to utilize excess cash on hand to pay down amounts outstanding under the Term Loan Agreement. See Note 11 “Debt”(“Debt”) of the condensed consolidated financial statements for further information. Our long-term cash needs will depend on many factors, including an introduction of new products, enhancements of current products, the geographic mix of our business and any potential acquisitions. We believe our cash from operations and the availability under our revolving credit facility will meet any long-term needs unless a significant acquisition is identified, in which case we expect that we would be able to borrow the necessary funds to complete such an acquisition.
In addition, we do not expect COVID-19 to have a material impact on our liquidity or capital resources, including cash from operations or uses of cash, in the near term or the foreseeable future.Cash and cash equivalents include cash in banks and all non-restricted, highly liquid investments with original maturities of three months or less at the time of purchase. Cash and cash equivalents as of September 30, 2017 increased $27.5March 31, 2020 decreased $64.1 million from December 31, 20162019, primarily driven bydue to share repurchases under the Bats acquisitionshare repurchase program, acquisitions, and payment of long-term debt offset by the proceeds from long-term debt.cash dividends paid on common stock. See “—Cash“Cash Flow” below for further discussion.
Our cash and cash equivalents held outside of the United States in various foreign subsidiaries totaled $41.6$77.0 million as of September 30, 2017.March 31, 2020. The remaining balance was held in the United States and totaled $83.2$88.2 million as of September 30, 2017. NoMarch 31, 2020. Our cash orand cash equivalents were held outside of the United States as of December 31, 2016.2019 totaled $85.8 million, and are held in various foreign subsidiaries. The majority of cash held outside the United States is available for repatriation, but under current law, could subject us to additional United States income taxes, less applicable foreign tax credits. In connection with ETF.com, we have $1.8 million
Our financial investments include deferred compensation plan assets as well as investments with original or acquired maturities longer than three months but that mature in less than one year from the statement of financial conditionbalance sheet date and are recorded at fair value. As of September 30, 2017March 31, 2020 and December 31, 2016,2019, financial investments primarily consisted of U.S. Treasury securities.
securities and deferred compensation plan assets.Cash Flow
The following table summarizes our cash flow data for the ninethree months ended September 30, 2017:
|
| | | | | | | | |
| | | Nine Months Ended
September 30, |
| | 2017 | | 2016 |
| Net cash provided by operating activities | | $ | 178.9 |
| | $ | 174.1 |
|
| Net cash used in investing activities | | (1,369.6 | ) | | (77.3 | ) |
| Net cash provided by (used in) financing activities | | 1,214.3 |
| | (126.3 | ) |
| Effect of foreign currency exchange rate changes on cash and cash equivalents | | 3.9 |
| | — |
|
| | | $ | 27.5 |
| | $ | (29.5 | ) |
March 31, 2020 and 2019, respectively: | | | | | | |
| | Three Months Ended |
| | March 31, |
| | 2020 | | 2019 |
| | (in millions) |
Net cash provided by operating activities | | $ | 163.3 | | $ | 118.0 |
Net cash (used in) provided by investing activities | | | (51.0) | | | 22.0 |
Net cash used in financing activities | | | (175.7) | | | (71.7) |
Effect of foreign currency exchange rate changes on cash and cash equivalents | | | (0.7) | | | 2.8 |
(Decrease) increase in cash and cash equivalents | | $ | (64.1) | | $ | 71.1 |
Net Cash Flows Provided by Operating Activities
During the ninethree months ended September 30, 2017,March 31, 2020, net cash provided by operating activities was $39.7$5.9 million greaterhigher than net income. The variance is primarily attributed to our acquisitionthe change in income taxes receivable of Bats. Primarily as a result$45.3 million, the adjustment for depreciation expense of $40.5 million, the acquisition, we had depreciationchange for accounts payable and amortization totaling $136.3accrued liabilities of $37.4 million and the change in Section 31 fees payable of $30.1 million, partially offset by the change in accounts receivable of $164.1 for the three months ended March 31, 2020.
Net cash flows provided by operating activities were $163.3 and $118.0 million for the ninethree months ended September 30, 2017. This amount was offset by aMarch 31, 2020 and 2019, respectively. The change in net cash flows provided by operating activities was primarily due to the increase in net income, as well as changes in accounts receivable, accounts payable, and Section 31 feefees payable balances for the three months ended March 31, 2020 compared to the three months ended March 31, 2019.
Net Cash Flows (Used in) Provided by Investing Activities
Net cash flows (used in) provided by investing activities were $(51.0) million and $22.0 million for the three months ended March 31, 2020 and 2019, respectively. The variance is primarily due to acquisitions, net of $110.1 million.
cash acquired and purchases of property and equipment for the three months ended March 31, 2020.Net Cash Flows Used in InvestingFinancing Activities
Net cash flows used in investingfinancing activities for the ninethree months ended September 30, 2017March 31, 2020 and 20162019 were $1,369.6$175.7 million and $77.3 million.$71.7 million, respectively. The variance is primarily attributed to our acquisition of Bats on February 28, 2017.
Net Cash Flows Provided by (Used in) Financing Activities
Net cash flows provided by (used in) financing activitiesshare repurchases which were $119.5 million and $35.0 million for the ninethree months ended September 30, 2017March 31, 2020 and 2016 were $1,214.3 million and $(126.3) million,2019, respectively. We received proceeds from long-term debt
The following summarizes our financial assets as of September 30, 2017March 31, 2020 and December 31, 20162019 (in millions):
| | | | | | |
| | March 31, 2020 | | December 31, 2019 |
Cash and cash equivalents | | $ | 165.2 | | $ | 229.3 |
Financial investments | | | 43.6 | | | 71.0 |
Less deferred compensation plan assets | | | (18.4) | | | (23.4) |
Less cash collected for Section 31 Fees | | | (53.1) | | | (69.0) |
Adjusted Cash (1) | | $ | 137.3 | | $ | 207.9 |
| (1) | Adjusted cash is a non-GAAP measure and represents cash and cash equivalents plus financial investments, minus deferred compensation plan assets and cash collected for Section 31 fees. We have presented adjusted cash because we consider it an important supplemental measure of our liquidity and believe that it is frequently used by analysts, investors and other interested parties in the evaluation of companies. |
|
| | | | | | | |
| | September 30, 2017 | | December 31, 2016 |
| Cash and cash equivalents | $ | 124.8 |
| | $ | 97.3 |
|
| Financial investments | 2.4 |
| | — |
|
| Cash collected for Section 31 fees | — |
| | — |
|
| Adjusted cash (1) | $ | 127.2 |
| | $ | 97.3 |
|
(1) Adjusted cash is a non-GAAP measure and represents cash and cash equivalents plus financial investments minus cash collected for Section 31 fees, which will need to be remitted in the near term. We have presented adjusted cash because we consider it an important supplemental measure of our liquidity and believe that it is frequently used by analysts, investors and other interested parties in the evaluation of companies.
The following summarizes our debt obligations as of September 30, 2017March 31, 2020 and December 31, 20162019 (in millions):
|
| | | | | | | |
| | September 30, 2017 | | December 31, 2016 |
| Term Loan Agreement | $ | 375.0 |
| | $ | — |
|
| 3.650% Senior Notes | 650.0 |
| | — |
|
| 1.950% Senior Notes | 300.0 |
| | — |
|
| Revolving Credit Agreement | — |
| | — |
|
| Less unamortized discount and debt issuance costs | (12.6 | ) | | — |
|
| Total long-term debt | $ | 1,312.4 |
| | $ | — |
|
| | | | | | |
| | March 31, 2020 | | December 31, 2019 |
Term Loan Agreement | | $ | 225.0 | | $ | 225.0 |
3.650% Senior Notes | | | 650.0 | | | 650.0 |
Revolving Credit Agreement | | | — | | | — |
Less unamortized discount and debt issuance costs | | | (6.9) | | | (7.4) |
Total debt | | $ | 868.1 | | $ | 867.6 |
As of September 30, 2017March 31, 2020 and December 31, 2016,2019, we were in compliance with the covenants of our debt agreements.
In addition to the debt outstanding, as of September 30, 2017,March 31, 2020, we had an additional $150.0 million available through our revolving credit facility, with the ability to borrow another $100.0 million by increasing the commitments under the facility. Together with adjusted cash, we had $277.2$287.3 million available to fund our operations, capital expenditures, potential acquisitions, debt repayments and any dividends as of September 30, 2017.March 31, 2020.
Dividends
The Company’s expectation is to continue to pay dividends. The decision to pay a dividend, however, remains within the discretion of the Company's board of directors and may be affected by various factors, including our earnings, financial condition, capital requirements, level of indebtedness and other considerations our board of directors deems relevant. Future debt obligations and statutory provisions, among other things, may limit, or in some cases prohibit, our ability to pay dividends.
Share Repurchase Program
In 2011, the board of directors approved an initial authorization for the Company to repurchase shares of its outstanding common stock of $100 million and approved additional authorizations of $100 million in each of 2012, 2013, 2014, 2015 and 2016, $150 million in February 2018, $100 million in August 2018, and $250 million in October 2019 for a total authorization of $1.1 billion. The program permits the Company to purchase shares through a variety of methods, including in the open market or through privately negotiated transactions, in accordance with applicable securities laws. It does not obligate the Company to make any repurchases at any specific time or situation.
Under the program, for the three months ended March 31, 2020, the Company repurchased 1,062,881 shares of common stock at an average cost per share of $112.46, totaling $119.5 million. Since inception of the program through March 31, 2020, the Company has repurchased 14,778,890 shares of common stock at an average cost per share of $62.27, totaling $920.3 million.
As of March 31, 2020, the Company had $179.7 million of availability remaining under its existing share repurchase authorizations.
OCC Capital Plan
The Company’s contributed capital to OCC has been recorded under investments in the condensed consolidated balance sheets as of March 31, 2020 and December 31, 2019. Under OCC’s current capital management policy, which was approved by the SEC on January 24, 2020, if OCC’s equity capital falls below certain defined thresholds, OCC can access additional capital through an operational loss fee charged to clearing members. None of OCC’s shareholders (including Cboe Options) has any obligation to contribute capital to OCC under the capital management policy, nor does any shareholder have the right to receive dividends from OCC under such policy. OCC did not pay its shareholders any dividend or other return on the retained portion of their capital contributions. As such, the Company reversed the $8.8 million OCC dividend declared in 2018, which was to be paid in 2019, in other expense, net in the condensed consolidated statement of income for the three months ended March 31, 2019.
Commercial Commitments and Contractual Obligations
As of September 30, 2017,March 31, 2020, our commercial commitments and contractual obligations included real property leases, operating leases, data and telecommunications agreements, equipment leases, our long-term debt outstanding, contingent consideration and other obligations. See Note 21 (“Commitments, Contingencies, and Contingencies,Guarantees”) to the condensed consolidated financial statements for a discussion of commitments and contingencies, and Note 11 Debt,(“Debt”) for a discussion of the outstanding long-term debt.
debt, and Note 22 (“Leases”) for discussion on operating leases and equipment leases.Off Balance Sheet Arrangements
As of September 30, 2017March 31, 2020, we did not have any off-balance sheet arrangements.
Item 3.
Quantitative and Qualitative Disclosures about Market Risk
As a result of our operating activities, we are exposed to market risks such as foreign currency exchange rate risk, equity risk, credit risk, and creditinterest rate risk. We have implemented policies and procedures to measure, manage and monitor and report risk exposures, which are reviewed regularly by management and our board of directors.
Foreign Currency Exchange Rate Risk
As a result of the acquisition of Bats, we expanded ourOur operations in Europe and Asia and are subject to increased currency translation risk as revenues and expenses are denominated in foreign currencies, primarily the British pound, Singapore dollar, Hong Kong dollar, and the Euro. We also have de minimis exposure to other foreign currencies, including the Swiss Franc, Norwegian Kroner, Swedish Krona and Danish Kroner.
For the three and nine months ended September 30, 2017,March 31, 2020, our exposure to foreign-denominated revenues and expenses is presented by primary foreign currency in the following table:
| | | | | | |
| | Three Months Ended | |
| | March 31, 2020 | |
| | | | | British | |
| | Euro (1) | | | Pound (1) | |
| | (in millions, except | |
| | percentages) | |
Foreign denominated % of: | | | | | | |
Revenues | | 0.1 | % | | 3.5 | % |
Cost of revenues | | 0.0 | % | | 1.1 | % |
Operating expenses | | 0.4 | % | | 7.8 | % |
Impact of 10% adverse currency fluctuation on: | | | | | | |
Revenues | $ | 0.1 | | $ | 3.2 | |
Cost of revenues | | 0.0 | | | 0.6 | |
Operating expenses | | 0.0 | | | 1.0 | |
| (1) | An average foreign exchange rate to the U.S. dollar for the period was used. |
|
| | | | | | | | | | | | | | | |
| | Three Months Ended
September 30, 2017 | | Nine Months Ended
September 30, 2016 |
| Euro(1) | | British Pound (1) | | Euro(1) | | British Pound (1) |
| Foreign denominated % of: | | | | | | | |
| Revenues | 1.9 | % | | 1.8 | % | | 2.2 | % | | 2.0 | % |
| Cost of revenues | 1.6 | % | | — | % | | 1.9 | % | | — | % |
| Operating expenses | 0.4 | % | | — | % | | 0.1 | % | | — | % |
| Impact of 10% adverse currency fluctuation on: | | | | | | | |
| Revenues | $ | 1.1 |
| | $ | 1.1 |
| | $ | 3.5 |
| | $ | 3.3 |
|
| Cost of revenues | 0.5 |
| | — |
| | 1.0 |
| | — |
|
| Operating expenses | 0.1 |
| | — |
| | — |
| | — |
|
(1) An average foreign exchange rate to the U.S. dollar for the period was used.
Our investment in European operations is exposed to volatility in currency exchange rates through translation of our net assets or equity to U.S. dollars. The assets and liabilities of our European business are denominated in British pounds.pounds or Euros. Fluctuations in currency exchange rates may create volatility in our reported results as we are required to translate foreign currency reported statements of financial condition and incomeoperational results into U.S. dollars for consolidated reporting. The translation of these non-U.S. dollar statements of financial condition into U.S. dollars for consolidated reporting results in a cumulative translation adjustment, which is recorded in accumulated other comprehensive loss (income)income (loss) within stockholders'stockholders’ equity on our condensed consolidated statements of financial condition. balance sheet.
Our primary exposure to this equity risk as of September 30, 2017March 31, 2020 is presented by foreign currency in the following table:
| | | |
| | British |
| | Pounds (1) |
| | (in millions) |
Net equity investment in Cboe Europe Limited | | $ | 726.6 |
Impact on consolidated equity of a 10% adverse currency fluctuation | | $ | 72.7 |
| (1) | Converted to U.S. dollars using the foreign exchange rate of British pounds per U.S. dollar as of March 31, 2020. |
|
| | | |
| | British Pound (1) |
| | (in millions) |
| Net equity investment in Cboe Europe Equities | $ | 689.9 |
|
| Impact on consolidated equity of a 10% adverse currency fluctuation | $ | 69.0 |
|
(1) Converted to U.S. dollars using the foreign exchange rate of British pounds into U.S. dollars as of September 30, 2017.
We are exposed to credit risk from third parties, including customers, counterparties and clearing agents. These parties may default on their obligations due to bankruptcy, lack of liquidity, operational failure or other reasons. We limit our exposure to credit risk by considering such risk when selecting the counterparties with which we make investments and execute agreements.
We do not have counterparty credit risk with respect to trades matched on our exchanges in the U.SU.S. and Europe. With respect to listed cash equities, we deliver matched trades of our customers to the National Security Clearing Corporation NSCC,(“NSCC”) without taking on counterparty risk for those trades. NSCC acts as a central counterparty on all equity transactions occurring on BZX, BYX, EDGX and EDGA and, as such, guarantees clearance and settlement of all of our matched equity trades. Similarly, with respect to U.S. listed equity options and futures, we deliver matched trades of our customers to the OCC, which acts as a central counterparty on all transactions occurring on Cboe Options, C2, BZX, EDGX and CFE and, as such, guarantees clearance and settlement of all of our matched options and futures trades.
With respect to orders Cboe Trading routes to other markets for execution on behalf of our customers, Cboe Trading is exposed to some counterparty credit risk in the case of failure to perform on the part of our clearing firms, Morgan Stanley & Co. LLC (Morgan Stanley)(“Morgan Stanley”) or Wedbush Securities, Inc. (Wedbush Securities)(“Wedbush”). Morgan Stanley and Wedbush Securities guarantee trades until one day after the trade date, after which time NSCC provides a guarantee. Thus, Cboe Trading is potentially exposed to credit risk to the counterparty to a trade routed to another market center between the trade date and one day after the trade date in the event that Morgan Stanley or Wedbush Securities fails. We believe that any potential requirement for us to make payments under these guarantees is remote and accordingly, have not recorded any liability in the condensed consolidated financial statements for these guarantees.
Similarly, with respect to orders in U.S. listed equity options, we route orders for execution to other national securities exchanges through either Trading or through affiliates of Bank of America Merrill Lynch, Wedbush Securities, Wolverine Execution Services, L.L.C. and Compass Professional Services, L.L.C. Trading has counterparty credit risk exposure to these firms until a trade settles (generally one day after the trade date). We believe that any potential requirement for us to make payments under these guarantees is remote. Accordingly, we have not recorded any liability in our consolidated financial statements for these guarantees.
Historically, we have not incurred any liability due to a customer’s failure to satisfy its contractual obligations as counterparty to a system trade. Credit difficulties or insolvency, or the perceived possibility of credit difficulties or insolvency, of one or more larger or more visible market participants could also result in market-wide credit difficulties or other market disruptions.
We do not have counterparty credit risk with respect to institutional spot FX trades occurring on our platform because Cboe FX is not a counterparty to any FX transactions. All transactions occurring on our platform occur bilaterally between two banks or prime brokers as counterparties to the trade. While Cboe FX does not have direct counterparty risk, Cboe FX may suffer a decrease in transaction volume if a bank or prime broker experiences an event that causes other prime brokers to decrease or revoke the credit available to the prime broker experiencing the event. Therefore, Cboe FX may have risk that is related to the credit of the banks and prime brokers that trade FX on the Cboe FX platform.
We also have credit risk related to transaction fees that are billed in arrears to customers on a monthly basis. Our potential exposure to credit losses on these transactions is represented by the receivable balances in our consolidated statements of financial condition.balance sheet. Our customers are financial institutions whose ability to satisfy their contractual obligations may be impacted by volatile securities markets.
On a regular basis, we review and evaluate changes in the status of our counterparties’ creditworthiness. Credit losses such as those described above could adversely affect our condensed consolidated financial position and results of operations. Any such effects to date have been minimal.
Interest Rate Risk
We have exposure to market risk for changes in interest rates relating to our cash and cash equivalents, financial investments, and indebtedness. As of March 31, 2020 and 2019, our cash and cash equivalents and financial investments on the condensed consolidated balance sheets, were $208.8 million and $346.6 million, respectively, of which $85.8 million and $74.3 million is held outside of the United States in various foreign subsidiaries in 2020 and 2019, respectively. The remaining cash and cash equivalents and financial investments are denominated in U.S. dollars. We do not use our investment portfolio for trading or other speculative purposes. Due to the nature of these investments, we have not been exposed to, nor do we anticipate being exposed to, material risks due to changes in interest rates, assuming no change in the amount or composition of our cash and cash equivalents and financial investments.
As of March 31, 2020, we had $868.1 million in outstanding debt, of which $645.4 million relates to our 3.650% Senior Notes, which bear interest at fixed interest rates. Changes in interest rates will have no impact on the interest we pay on fixed-rate obligations. The remaining amount outstanding of $222.7 million relates to the Term Loan Agreement, which bears interest at fluctuating rates and, therefore, subjects us to interest rate risk. A hypothetical 100 basis point increase in interest rates relating to the amounts outstanding under the Term Loan Agreement as of March 31, 2020 would decrease annual pre-tax earnings by $2.3 million, assuming no change in the composition of our outstanding indebtedness. We are also exposed to changes in interest rates as a result of borrowings under our Revolving Credit Agreement, as this facility bears interest at fluctuating rates. As of March 31, 2020, there were no outstanding borrowings under our Revolving Credit Agreement. See Note 11 (“Debt”) to the condensed consolidated financial statements for a discussion of debt agreements.
Item 4. Controls and Procedures
a)Disclosure controls and procedures. The Company'sCompany’s management, with the participation of its Chief Executive Officer and Chief Financial Officer, has evaluated the effectiveness of the Company'sCompany’s disclosure controls and procedures (as defined in Rule 13a-15(e) and Rule 15d-15(e) under the Securities Exchange Act of 1934 (the “Exchange Act”))Act) as of the end of the period covered by this report. Based upon that evaluation, the Company'sCompany’s Chief Executive Officer and Chief Financial Officer have concluded that, as of the end of such period, the Company'sCompany’s disclosure controls and procedures are effective.
(b) b)Internal controls over financial reporting. On February 28, 2017, the Company acquired Bats. In conducting the evaluation of the effectiveness of internal controls over financial reporting, the Company elects to exclude Bats when conducting the annual evaluation of internal controls as permitted by applicable regulations. The Company is implementing internal controls over significant processes specific to the acquisition that management believes are appropriate in consideration of related integration of operations, systems, control activities, and accounting for the merger and merger-related transactions.
As of the date of this Quarterly Report on Form 10-Q, the Company is the process of further integrating the acquired Bats operations into the overall internal controls over financial reporting. The Merger resulted in changes in the operating results for the three and nine months ended September 30, 2017 compared to the three and nine months ended September 30, 2016. Revenue less cost of revenue increased to $269.7 million, an increase of 98.0% over the three months ended September 30, 2016. Total operating expenses increased 113.6% to $150.4 million. As a result, net income allocated to common stockholders increased 48.1% to $59.7 million. Revenue less cost of revenue increased to $730.0 million, an increase of 72.4% over the nine months ended September 30, 2016. Total operating expenses increased 133.3% to $466.8 million. As a result, net income allocated to common stockholders increased 1.5% to $142.1 million.
Except as described above, noNo changes occurred in the Company’s internal control over financial reporting during thirdfirst quarter 20172020 that have materially affected, or are reasonably likely to materially affect, the Company’s internal control over financial reporting.
PART II—OTHER INFORMATION
Item 1. Legal Proceedings.
Cboe Global Markets, Inc. incorporates herein by reference the discussion set forth in Note 19 (“Income Taxes”) and Note 21 (“Commitments, Contingencies, and Contingencies—Legal Proceedings”Guarantees”) of the condensed consolidated financial statements included herein.
There have been no material updates during the period covered by this Form 10-Q to the Legal Proceedings as set forth in Item 3. of our Annual Report on Form 10-K for the year ended December 31, 2019.
ThereOther than the risk factor listed below, there have been no material updates during the period covered by this Form 10-Q to the Risk Factors as set forth in Item 1A. of our Annual Report on Form 10-K for the year ended December 31, 2016.2019. These risks and uncertainties, however, are not the only risks and uncertainties that we face. Additional risks and uncertainties not currently known to us or that we currently deem to be immaterial may also significantly impact us. Any of these risks and uncertainties may materially and adversely affect our business, financial condition or results of operations, liquidity and cash flows.
The COVID-19 pandemic and its effects could have a material adverse effect on our business, financial condition, operating results and cash flows.
On March 11, 2020, the World Health Organization declared COVID-19 a global pandemic. Our business and operations could be materially and adversely affected by the effects of COVID-19, however, the extent to which our results could be affected by COVID-19 largely depends on future developments which cannot be accurately predicted and are uncertain. Governments, public institutions, and other organizations in countries and localities where cases of COVID-19 have been detected have taken, and may take additional, emergency measures to combat its spread, including implementation of travel bans and closures of offices, factories, schools, public buildings and businesses. These measures may interfere with the ability of our employees, vendors, technology equipment suppliers, data and disaster recovery centers, and other service providers to perform their respective responsibilities and obligations relative to the conduct of our business. In particular, after the close of business on March 13, 2020, we temporarily suspended open outcry trading in response to COVID-19. Further, changes in trading behavior, market disruptions and other future developments caused by the effects of COVID-19 could impact trading volumes and the demand for our products, market data and services, which could have a material adverse effect on our business, financial condition, operating results and cash flows.
General economic conditions and other factors beyond our control could significantly reduce demand for our products and services and harm our business.
The volume of exchange transactions and the demand for our products and services are directly affected by economic, political and market conditions in the U.S., Europe and elsewhere in the world that are beyond our control, including:
| ● | economic, political and geopolitical market conditions; |
| ● | broad trends in business and finance; |
| ● | concerns over inflation and wavering institutional or retail confidence levels; |
| ● | government or central bank actions, such as changes in government fiscal and monetary policy and foreign currency exchange rates; |
| ● | other legislative and regulatory changes; |
| ● | the availability of short-term and long-term funding and capital; |
| ● | the perceived attractiveness of the U.S. or European capital markets; |
| ● | the availability of alternative investment opportunities; |
| ● | changes in the level of trading activity in underlying instruments; |
| ● | changes and volatility in the prices of securities; |
| ● | changes in the volume of foreign currency transactions; |
| ● | changes in supply and demand for currencies; |
| ● | movements in currency exchange rates; |
| ● | the level and volatility of interest rates; |
| ● | changes in the financial strength of market participants; |
| ● | consolidation among market participants and market data subscribers; |
| ● | unforeseen market closures, suspensions of open outcry trading or other disruptions in trading; and |
| ● | disruptions due to terrorism, war, extreme weather events, pandemics or other catastrophes. |
Any of these factors, individually or collectively, could have a material adverse effect on our business, financial condition and operating results by causing a substantial decline in the financial services markets and reducing trading volumes and demand for market data.
A significant portion of our operating revenues is generated by our transaction-based business. If the amount of trading volume on our exchanges decreases, or the product mix shifts to lower revenue products, our revenues from transaction fees will most likely decrease.
In 2019, approximately 62.9% of our net revenues were generated by our transaction-based business. This business is dependent on our ability to attract and maintain order flow, both in absolute terms and relative to other market centers. If the amount of trading volume on our exchanges, CFE or notional value traded on Cboe FX, Cboe SEF and Cboe Europe Equities exchanges decreases, we are likely to see a decrease in transaction fees.
Our total trading volumes could decline if our market participants reduce their trading activity for any reason, such as:
| ● | heightened capital requirements; |
| ● | regulatory or legislative actions; |
| ● | reduced need to trade due to changes in volatility and/or passive investment trends; |
| ● | reduced access to capital required to fund trading activities; |
| ● | consolidation among market participants; |
| ● | suspensions of open outcry trading; or |
| ● | significant market disruptions. |
Over the past few years, a number of legislative actions have been taken, both domestically and internationally, that may cause market participants to be subject to increased capital requirements and additional compliance burdens. These actions, including the Collins Amendment to Dodd-Frank, MiFID II and MiFIR, may cause market participants to reduce trading activity on our exchanges.
In addition, the transaction fees generated are different based on type of product and other factors, including the type of customer and certain volume discounts. If the amount of our trading volume decreases, the mix traded shifts to our lower revenue per contract products or the transaction fee pilot is implemented, our revenues from transaction fees will most likely decrease. We can offer no assurance that we would be able to reduce our costs to match the amount of any such decrease.
Item 2. Unregistered Sales of Equity Securities and Use of Proceeds.
In 2011, the board of directors approved an initial authorization for the Company to repurchase shares of its outstanding common stock of $100 million and approved additional authorizations of $100 million in each of 2012, 2013, 2014, 2015 and 2016, $150 million in February 20162018, and $100 million in August 2018, and $250 million in October 2019 for a total authorization of $600 million.$1.1 billion. The program permits the Company to purchase shares through a variety of methods, including in the open market or through privately negotiated transactions, in accordance with applicable securities laws. It does not obligate the Company to make any repurchases at any specific time or situation.
AsThe table below shows the purchases of September 30, 2017,equity securities by the Company had $97.0 millionwhich settled during the three months ended March 31, 2020, reflecting the purchase of availability remainingcommon stock under its existingthe Company's share repurchase authorizations. We were not active in our share repurchase program during the third quarter of 2017.
program: | | | | | | | | | | |
| | | | | | | Total Number of | | Approximate Dollar |
| | | | | | | Shares Purchased | | Value of Shares that May |
| | | | | | | as Part of Publicly | | Yet Be Purchased Under |
| | Total Number of | | Average Price | | Announced Plans | | the Plans or Programs |
Period | | Shares Purchased | | Paid per Share | | or Programs | | (in millions) |
January 1 to January 31, 2020 | | 226,863 | | $ | 117.20 | | 226,863 | | $ | 272.6 |
February 1 to February 29, 2020 | | 770 | | | 119.99 | | 770 | | | 272.5 |
March 1 to March 31, 2020 | | 835,248 | | | 111.17 | | 835,248 | | | 179.7 |
Total | | 1,062,881 | | $ | 112.46 | | 1,062,881 | | | |
Purchase of common stock from employees
The table below reflects the acquisition of common stock by the Company acquired 19,330 shares for a total cost of approximately $2.0 million duringin the three months ended September 30, 2017March 31, 2020 that were not part of the publicly announced share repurchase authorization. These shares consisted of shares retained to cover payroll withholding taxes in connection with the vesting of restricted stock unit awards and performance share awards, and shares used by employees to cover the price of certain stock options that were exercised.
| | | | | |
Period | | Total Number of Shares Purchased | | Average Price Paid per Share |
January 1 to January 31, 2020 | | 26,727 | | $ | 118.49 |
February 1 to February 29, 2020 | | 88,138 | | | 121.93 |
March 1 to March 31, 2020 | | 1,912 | | | 116.15 |
Total | | 116,777 | | | |
Use of Proceeds
Purchases of Equity Securities
None.
Item 3. Defaults upon Senior Securities.
Item 4. Mine Safety Disclosures.
Item 5. Other Information.
None.
None.
|
| | |
Exhibit No. | | Description |
| | |
Exhibit No. |
| Description |
10.1 | | Third AmendedEmployment Agreement, by and Restated Certificate of Incorporation,between Cboe Global Markets, Inc. and Edward Tilly, dated February 11, 2020, incorporated by reference to Exhibit 3.110.1 to the Company'sCompany’s Current Report on Form 8-K (File No. 001-34774) filed on October 17, 2017.February 14, 2020.*
|
| | |
10.2 | | |
| | |
10.3 | | Form of 2020 Edward Tilly Restricted Stock Unit Award Agreement (earnings per share), incorporated by reference to Exhibit 10.3 to the Company’s Current Report on Form 8-K (File No. 001-34774) filed on October 17, 2017.February 14, 2020.* |
| | |
31.1 | | |
| | |
| | |
| | |
| | |
| | |
| | |
| | |
| | |
| | |
101.INS | | XBRL Instance Document (Filed herewith). — The instance document does not appear in the Interactive Data File because its XBRL tags are embedded within the Inline XBRL document. |
| | |
101.SCH | | XBRL Taxonomy Extension Schema Document (Filed herewith). |
| | |
101.CAL | | XBRL Taxonomy Extension Calculation Linkbase Document (Filed herewith). |
| | |
101.DEF | | XBRL Taxonomy Extension Definition Linkbase (Filed herewith). |
| | |
101.LAB | | XBRL Taxonomy Extension Label Linkbase Document (Filed herewith). |
| | |
101.PRE | | XBRL Taxonomy Extension Presentation Linkbase Document (Filed herewith). |
| | |
104 | | Cover Page Interactive Data File (embedded as Inline XBRL document). |
*Indicates Management Compensatory Plan, Contract or Arrangement.
Pursuant to the requirements of the Securities Exchange Act of 1934, the registrant has duly caused this report to be signed on its behalf by the undersigned, thereunto duly authorized.
| | |
| | | |
| | CBOE GLOBAL MARKETS, INC. |
| | Registrant |
| | | |
| By: | By: | /s/ Edward T. Tilly |
| | | Edward T. Tilly |
| | | President and Chief Executive Officer (Principal |
| | (Principal Executive Officer) |
Date: May 1, 2020 | November 7, 2017 | | |
| | | |
| By: | By: | /s/ Alan J. DeanBrian N. Schell |
| | | Alan J. DeanBrian N. Schell |
| | | Executive Vice President and Chief Financial Officer (Principal |
| | (Principal Financial Officer) |
Date: May 1, 2020 | November 7, 2017 | | |