SECURITIES AND EXCHANGE COMMISSION
| |
☒ | |
| |
☒ | QUARTERLY REPORT PURSUANT TO SECTION 13 OR 15(d) OF THE SECURITIES EXCHANGE ACT OF 1934 |
For the quarterly period ended September 30, 2017
| |
☐ | |
☐ | TRANSITION REPORT PURSUANT TO SECTION 13 OR 15(d) OF THE SECURITIES EXCHANGE ACT OF 1934 |
For the transition period from to
Commission file number: 001-34774
Cboe Global Markets, Inc.
(Exact Name of Registrant as Specified in Its Charter)
Delaware | 20-5446972 |
(State or Other Jurisdiction of | |
Incorporation or Organization) | |
433 West Van Buren Street, Chicago, Illinois | 60607 |
(Address of Principal Executive Offices) | |
(312) 786-5600
(Registrant’s telephone number, including area code)
Securities registered pursuant to Section 12(b) of the Act:
|
| | | |
Title of each class: |
| Trading Symbol |
| Name of each exchange on which registered: |
Delaware
Common Stock, par value $0.01 per share | 20-5446972 |
(State or Other Jurisdiction of
| (I.R.S. Employer |
Incorporation or Organization)CBOE | Identification No.) | CboeBZX |
|
| |
400 South LaSalle Street Chicago, Illinois | 60605 |
(Address of Principal Executive Offices) | (Zip Code) |
(312) 786-5600
(Registrant's telephone number, including area code)
CBOE Holdings, Inc.
(Former name, former address and former fiscal year, if changed since last report)
Indicate by check mark whether the registrant (1) has filed all reports required to be filed by Section 13 or 15(d) of the Securities Exchange Act of 1934 during the preceding 12 months (or for such shorter period that the registrant was required to file such reports), and (2) has been subject to such filing requirements for the past 90 days. Yes ☒⌧ No ☐
◻
Indicate by check mark whether the registrant has submitted electronically and posted on its corporate Web site, if any, every Interactive Data File required to be submitted and posted pursuant to Rule 405 of Regulation S-T (§232.405 of this chapter) during the preceding 12 months (or for such shorter period that the registrant was required to submit and post such files). Yes ☒ No ☐
◻
Indicate by check mark whether the registrant is a large accelerated filer, an accelerated filer, a non-accelerated filer, or a smaller reporting company, or an emerging growth company. See the definitions of “large accelerated filer,” “accelerated filer,” and “smaller reporting company,” and “emerging growth company” in Rule 12b-2 of the Exchange Act.
| | | | | |
Large Accelerated filer | ☒ | Accelerated Filer | ◻ | Non-accelerated Filer | ◻ |
Large accelerated filer | ☒ | Accelerated filer | ☐ | | |
Smaller Reporting Company | ☐ | Emerging Growth Company | |
Non-accelerated filer☐ | ☐ | Smaller reporting company | ☐ |
If an emerging growth company, indicate by check mark if the registrant has elected not to use the extended transition period for complying with any new or revised financial accounting standards provided pursuant to Section 13(a) of the Exchange Act. ◻
Indicate by check mark whether the registrant is a shell company (as defined in Rule 12b-212b-2 of the Exchange Act).
Yes ☐ No ☒
⌧
Indicate the number of shares outstanding of each of the registrant’s classes of common stock, as of the latest practicable date:
| | |
Class | | April 22, 2022 |
Class | | October 31, 2017 |
Common Stock, par value $0.01 per share | | 113,457,824106,188,570 shares |
Throughout this document, unless otherwise specified or the context so requires:
| ● | “Cboe,” “we,” “us,” “our” or “the Company” refers to Cboe Global Markets, Inc. and its subsidiaries. |
| ● | “ADV” means average daily volume. |
| ● | “ADNV” means average daily notional value. |
| ● | “AFM” refers to the Netherlands Authority for the Financial Markets. |
| ● | “ATS” refers to an alternative trading system. |
| ● | “Bats Global Markets” and “Bats” refer to our wholly-owned subsidiary Bats Global Markets, Inc., now known as Cboe Bats, LLC, and its subsidiaries. |
| ● | “BIDS Trading” refers to BIDS Trading, L.P., a wholly-owned subsidiary of Cboe Global Markets, Inc. The ATS operated by BIDS Trading is not a registered national securities exchange or a facility thereof. |
| ● | “BYX” refers to Cboe BYX Exchange, Inc., a wholly-owned subsidiary of Cboe Global Markets, Inc. |
| ● | “BZX” refers to Cboe BZX Exchange, Inc., a wholly-owned subsidiary of Cboe Global Markets, Inc. |
| ● | “C2” refers to Cboe C2 Exchange, Inc., a wholly-owned subsidiary of Cboe Global Markets, Inc. |
| ● | “Cboe Asia Pacific” refers to Chi-X Holdings Limited, a wholly-owned subsidiary of Cboe Global Markets, Inc. |
| ● | “Cboe Australia” refers to Cboe Australia Pty Ltd. (formerly known as Chi-X Australia Pty. Ltd.), a wholly-owned subsidiary of Cboe Global Markets, Inc. |
| ● | “Cboe Chi-X Europe” refers to Cboe Chi-X Europe Limited, a wholly-owned subsidiary of Cboe Global Markets, Inc. |
| ● | “Cboe Europe Equities and Derivatives” refers to the combined businesses of Cboe Europe and Cboe NL. |
| ● | “Cboe Europe” refers to Cboe Europe Limited, a wholly-owned subsidiary of Cboe Global Markets, Inc., the UK operator of our Multilateral Trading Facility (“MTF”), our Regulated Market (“RM”), and our Approved Publication Arrangement (“APA”) under its Recognized Investment Exchange (“RIE”) status. |
| ● | “Cboe FX” refers to Cboe FX Markets, LLC, a wholly-owned subsidiary of Cboe Global Markets, Inc. |
| ● | “Cboe Japan” refers to Cboe Japan Ltd. (formerly known as Chi-X Japan Ltd.), a wholly-owned subsidiary of Cboe Global Markets, Inc. |
| ● | “Cboe NL” refers to Cboe Europe BV, a wholly-owned subsidiary of Cboe Global Markets, Inc., the Netherlands operator of our MTF, RM, and APA. |
| ● | “Cboe Options” refers to Cboe Exchange, Inc., a wholly-owned subsidiary of Cboe Global Markets, Inc. |
| ● | “Cboe SEF” refers to Cboe SEF, LLC, a wholly-owned subsidiary of Cboe Global Markets, Inc. |
| ● | “Cboe Swiss” refers to Cboe Switzerland GmbH, a wholly-owned subsidiary of Cboe Global Markets, Inc. |
| ● | “Cboe Trading” refers to Cboe Trading, Inc., a wholly-owned subsidiary of Cboe Global Markets, Inc., operated in the United States. |
| ● | “CFE” refers to Cboe Futures Exchange, LLC, a wholly-owned subsidiary of Cboe Global Markets, Inc. |
| ● | “CFTC” refers to the U.S. Commodity Futures Trading Commission. |
| ● | “EDGA” refers to Cboe EDGA Exchange, Inc., a wholly-owned subsidiary of Cboe Global Markets, Inc. |
| ● | “EDGX” refers to Cboe EDGX Exchange, Inc., a wholly-owned subsidiary of Cboe Global Markets, Inc. |
| ● | “ErisX” refers to Eris Digital Holdings, LLC. |
| ● | “ESMA” refers to the European Securities and Markets Authority. |
| ● | “EuroCCP” refers to European Central Counterparty N.V., a wholly-owned subsidiary of Cboe Global Markets, Inc. |
| ● | “Exchanges” refers to Cboe Options, C2, BZX, BYX, EDGX, and EDGA. |
| ● | “FASB” refers to the Financial Accounting Standards Board. |
| ● | “FCA” refers to the UK Financial Conduct Authority. |
| ● | “FINRA” refers to the Financial Industry Regulatory Authority. |
| ● | “GAAP” refers to Generally Accepted Accounting Principles in the United States. |
| ● | “IIROC” refers to the Investment Industry Regulatory Organization of Canada. |
| ● | “MATCHNow” refers to TriAct Canada Marketplace LP, a wholly-owned subsidiary of Cboe Global Markets, Inc., the operator of our Canadian ATS called MATCHNow. |
| ● | “Merger” refers to our acquisition of Bats Global Markets, completed on February 28, 2017. |
| ● | “NEO” refers to Aequitas Innovations, Inc. |
| ● | “OCC” refers to The Options Clearing Corporation. |
| ● | “OPRA” refers to Options Price Reporting Authority, LLC. |
| ● | “SEC” refers to the U.S. Securities and Exchange Commission. |
| ● | “SPX” refers to our S&P 500 Index exchange-traded options products. |
| ● | “TPH” refers to either a Trading Permit Holder or a Trading Privilege Holder. |
| ● | “VIX” refers to our Cboe Volatility Index exchange traded options and futures products. |
"Cboe," "we," "us," "our" or "the Company" refers to Cboe Global Markets, Inc. and its subsidiaries.3
“Bats Global Markets” and “Bats” refer to our wholly-owned subsidiary Bats Global Markets, Inc., now known as Cboe Bats, LLC, and its subsidiaries.
“BYX” refers to Cboe BYX Exchange, Inc., a wholly-owned subsidiary“BZX” refers to Cboe BZX Exchange, Inc., a wholly-owned subsidiary of Cboe Global Markets, Inc.
"C2" refers to Cboe C2 Exchange, Inc. a wholly-owned subsidiary of Cboe Global Markets, Inc.
“Cboe Chi-X Europe” refers to our broker-dealer entity, Cboe Chi-X Europe Limited, a wholly-owned subsidiary of Cboe Global Markets, Inc.,operated in the United Kingdom.
“Cboe Europe Equities” refers to Cboe Europe Limited, a wholly-owned subsidiary of Cboe Global Markets, Inc., the U.K. operator of our Multilateral Trading Facility ("MTF"), and our Regulated Market ("RM"), under its Recognized Investment Exchange ("RIE") status.
"Cboe FX" refers to our foreign currency electronic communications network that is a wholly-owned subsidiary of Cboe Global Markets, Inc. Cboe FX operates in the United States and has an additional matching engine in the United Kingdom.
"Cboe Options" refers to Cboe Exchange, Inc., a wholly-owned subsidiary of Cboe Global Markets, Inc.
"Cboe SEF" refers to Cboe SEF, LLC, our swap execution facility that is a wholly-owned subsidiary of Cboe Global Markets, Inc.
"CFE" refers to Cboe Futures Exchange, LLC, a wholly-owned subsidiary of Cboe Global Markets, Inc.
"CFTC" refers to the U.S. Commodity Futures Trading Commission.
“EDGA” refers to Cboe EDGA Exchange, Inc., a wholly-owned subsidiary of Cboe Global Markets, Inc.
“EDGX” refers to Cboe EDGX Exchange, Inc., a wholly-owned subsidiary of Cboe Global Markets, Inc.
"Exchanges" refers to Cboe Options, C2, BZX, BYX, EDGX, and EDGA.
"FASB" refers to the Financial Accounting Standards Board.
"FCA" refers to the U.K. Financial Conduct Authority.
"GAAP" refers to Generally Accepted Accounting Principles in the United States.
"Merger" refers to our acquisition of Bats Global Markets, completed on February 28, 2017.
"OCC" refers to The Options Clearing Corporation, which is the issuer and registered clearing agency for all U.S. exchange-listed options and is the designated clearing organization for futures traded on CFE.
"SEC" refers to the U.S. Securities and Exchange Commission.
"SPX" refers to our S&P 500 Index exchange-traded options products.
“Trading” refers to our broker-dealer entity, Cboe Trading, Inc., a wholly-owned subsidiary of Cboe Global Markets, Inc., operated in the United States.
"VIX" refers to the Cboe Volatility Index methodology.
TRADEMARK AND OTHER INFORMATION
Cboe®Cboe®, CFE®Cboe Global Markets®, Bats®Bats®, BZX®BIDS Trading®, BYX®BYX®, EDGX®, EDGA®BZX®, Cboe Volatility Index®Index®, CFE®, EDGA®, EDGX®, EuroCCP®, Hybrid®, LiveVol®, MATCHNow®, Options Institute®, Silexx®, VIX® and VIX® XSP® are registered trademarks, and Cboe Global Markets
Futures ExchangeSM, Cboe BIDS EuropeSM, C2SM, SPXf(t)optionsSM, HanweckSM, NANOSM, Nanos by CboeSM, and Cboe Futures ExchangeTrade AlertSM are service marks of Cboe Global Markets, Inc. and its subsidiaries. Standard & Poor's®Poor's®, S&P®&P®, S&P 100®100®, S&P 500® and S&P 500®SPX® are registered trademarks of Standard & Poor's Financial Services LLC and have been licensed for use by Cboe Exchange, Inc. Dow Jones®Jones®, Dow Jones Industrial Average®Average®, DJIA®DJIA® and Dow Jones IndexesIndices are registered trademarks or service marks of Dow Jones Trademark Holdings, LLC, used under license. MSCI, and the MSCI index names are service marks of MSCI Inc., used under license. Russell®Russell® and the Russell index names are registered trademarks of Frank Russell Company, used under license. FTSE®FTSE® and the FTSE indexesindices are trademarks and service marks of FTSE International Limited, used under license. All other trademarks and service marks are the property of their respective owners.
MSCI and the MSCI index names are service marks of MSCI Inc. (“MSCI”) or its affiliates and have been licensed for use by us. Any derivative indices and any financial products based on the derivative indices (“MCSI-Based Products”) are not sponsored, guaranteed or endorsed by MSCI, its affiliates or any other party involved in, or related to, making or compiling such MSCI index. Neither MSCI, its affiliates nor any other party involved in, or related to, making or compiling any MSCI index makes any representations regarding the advisability of investing in such MSCI-Based Products; makes any warranty, express or implied; or bears any liability as to the results to be obtained by any person or any entity from the use of any such MSCI index or any data included therein. No purchaser, seller or holder of any MSCI-Based Product, or any other person or entity, should use or refer to any MSCI trade name, trademark or service mark to sponsor, endorse, market or promote any security without first contacting MSCI to determine whether MSCI’s permission is required.
This Quarterly Report on Form 10-Q includes market share and industry data that we obtained from industry publications and surveys, reports of governmental agencies and internal company surveys. Industry publications and surveys generally state that the information they contain has been obtained from sources believed to be reliable, but we cannot assure you that this information is accurate or complete. We have not independently verified any of the data from third-party sources nor have we ascertained the underlying economic assumptions relied upon therein. Statements as to our market position are based on the most currently available market data. While we are not aware of any misstatements regarding industry data presented herein, our estimates involve risks and uncertainties and are subject to change based on various factors. We refer you to the “Risk Factors” in Part II, Item 1A of this Quarterly Report on Form 10-Q and our other filings with the SEC.
FORWARD-LOOKING STATEMENTS
This Quarterly Report on Form 10-Q contains forward-looking statements within the meaning of the Private Securities Litigation Reform Act of 1995 that involve a number of risks and uncertainties. You can identify these statements by forward-looking words such as "may," "might," "should," "expect," "plan," "anticipate," "believe," "estimate," "predict," "potential"“may,” “might,” “should,” “expect,” “plan,” “anticipate,” “believe,” “estimate,” “predict,” “potential” or "continue,"“continue,” and the negative of these terms and other comparable terminology. All statements that reflect our expectations, assumptions or projections about the future other than statements of historical fact are forward-looking statements, including statements in the "Management's“Management’s Discussion and Analysis of Financial Condition and Results of Operations" section of this report.Operations”. These forward-looking statements, which are subject to known and unknown risks, uncertainties and assumptions about us, may include projections of our future financial performance based on our growth strategies and anticipated trends in our business. These statements are only predictions based on our current expectations and projections about future events. There are important factors that could cause our actual results, level of activity, performance or achievements to differ materially from thatthose expressed or implied by the forward-looking statements. In particular, you should consider the risks and uncertainties described under “Risk Factors” in Part II, Item 1A of this Quarterly Report on Form 10-Q and our other filings with the SEC.
While we believe we have identified thematerial risks, that are material to us, these risks and uncertainties are not exhaustive. Moreover, we operate in a very competitive and rapidly changing environment. New risks and uncertainties emerge from time to time, and it is not possible to predict all risks and uncertainties, nor can we assess the impact of all factors on our business or the extent to which any factor, or combination of factors, may cause actual results to differ materially from those contained in any forward-looking statements.
Some factors that could cause actual results to differ include:
| ● | the loss of our right to exclusively list and trade certain index options and futures products; |
| ● | economic, political and market conditions; |
| ● | compliance with legal and regulatory obligations; |
| ● | price competition and consolidation in our industry; |
| ● | decreases in trading or clearing volumes, market data fees or a shift in the mix of products traded on our exchanges; |
| ● | legislative or regulatory changes or changes in tax regimes; |
| ● | our ability to protect our systems and communication networks from security risks, cybersecurity risks, insider threats and unauthorized disclosure of confidential information; |
| ● | our ability to attract and retain skilled management and other personnel; |
| ● | increasing competition by foreign and domestic entities; |
| ● | our dependence on and exposure to risk from third parties; |
| ● | fluctuations to currency exchange rates; |
| ● | factors that impact the quality and integrity of our indices; |
| ● | the impact of the novel coronavirus (“COVID-19”) pandemic; |
| ● | our ability to operate our business without violating the intellectual property rights of others and the costs associated with protecting our intellectual property rights; |
| ● | our ability to minimize the risks, including our credit and default risks, associated with operating a European clearinghouse; |
| ● | our ability to accommodate trading and clearing volume and transaction traffic, including significant increases, without failure or degradation of performance of our systems; |
| ● | misconduct by those who use our markets or our products or for whom we clear transactions; |
| ● | challenges to our use of open source software code; |
| ● | our ability to meet our compliance obligations, including managing potential conflicts between our regulatory responsibilities and our for-profit status; |
| ● | our ability to maintain BIDS Trading as an independently managed and operated trading venue, separate from and not integrated with our registered national securities exchanges; |
| ● | damage to our reputation; |
| ● | the ability of our compliance and risk management methods to effectively monitor and manage our risks; |
| ● | our ability to manage our growth and strategic acquisitions or alliances effectively; |
| ● | restrictions imposed by our debt obligations and our ability to make payments on or refinance our debt obligations; |
| ● | our ability to maintain an investment grade credit rating; |
economic, political and market conditions;
compliance with legal and regulatory obligations;
price competition and consolidation in our industry;
decreases in trading volumes, market data fees or a shift in the mix of products traded on our exchanges;
legislative or regulatory changes;
increasing competition by foreign and domestic entities;
our dependence on and exposure to risk from third parties;
our index providers' ability to maintain the quality and integrity of their indexes and to perform under our agreements;
our ability to operate our business without violating the intellectual property rights of others and the costs associated with protecting our intellectual property rights;
our ability to attract and retain skilled management and other personnel, including those experienced with post-acquisition integration;
our ability to accommodate trading volume and transaction traffic, including significant increases, without failure or degradation of performance of our systems;
our ability to protect our systems and communication networks from security risks, including cyber-attacks and unauthorized disclosure of confidential information;
challenges to our use of open source software code;
our ability to meet our compliance obligations, including managing potential conflicts between our regulatory responsibilities and our for-profit status;
damage to our reputation;
the ability of our compliance and risk management methods to effectively monitor and manage our risks;
our ability to manage our growth and strategic acquisitions or alliances effectively;
unanticipated difficulties or expenditures relating to the Merger, including, without limitation, difficulties that result in the failure to realize expected synergies, accretion, efficiencies and cost savings from the Merger within the expected time period (if at all), whether in connection with integration, migrating trading platforms, broadening distribution of product offerings or otherwise;
restrictions imposed by our debt obligations;
our ability to maintain an investment grade credit rating;
potential difficulties in our migration of trading platforms and our ability to retain employees as a result of the Merger; and
the accuracy of our estimates and expectations.
| ● | impairment of our goodwill, long-lived assets, investments or intangible assets; |
| ● | the accuracy of our estimates and expectations; |
| ● | litigation risks and other liabilities; and |
| ● | if the acquisition of ErisX is consummated, operating a digital asset business. |
For a detailed discussion of these and other factors that might affect our performance, see Part II, Item 1A of this Report. We do not undertake, and expressly disclaim, any duty to update any forward-looking statement whether as a result of new information, future events or otherwise, except as required by law. We caution you not to place undue reliance on the forward-looking statements, which speak only as of the date of this filing.
PART I—FINANCIAL INFORMATION
Item 1. Financial Statements.
Cboe Global Markets, Inc. and Subsidiaries
Condensed Consolidated Balance Sheets
(in millions, except par value data share and per share amounts)
|
| | | | | | | |
| | September 30, 2017 | | December 31, 2016 |
| Assets | | | |
| Current Assets: | | | |
| Cash and cash equivalents | $ | 124.8 |
| | $ | 97.3 |
|
| Financial investments | 2.4 |
| | — |
|
| Accounts receivables, net | 195.8 |
| | 76.7 |
|
| Income taxes receivable | 35.2 |
| | 53.7 |
|
| Other current assets | 16.1 |
| | 7.4 |
|
| Total Current Assets | 374.3 |
| | 235.1 |
|
| Investments | 83.2 |
| | 72.9 |
|
| Land | 4.9 |
| | 4.9 |
|
| Property and equipment, net | 77.2 |
| | 55.9 |
|
| Goodwill | 2,696.3 |
| | 26.5 |
|
| Intangible assets, net | 1,940.2 |
| | 8.7 |
|
| Other assets, net | 52.0 |
| | 72.7 |
|
| Total Assets | $ | 5,228.1 |
| | $ | 476.7 |
|
| Liabilities, Redeemable Noncontrolling Interests and Stockholders’ Equity | | | |
| Current Liabilities: | | | |
| Accounts payable and accrued liabilities | $ | 140.4 |
| | $ | 82.4 |
|
| Section 31 fees payable | 25.4 |
| | 4.4 |
|
| Deferred revenue | 11.4 |
| | 3.1 |
|
| Income taxes payable | 4.2 |
| | — |
|
| Contingent consideration liability | 56.6 |
| | — |
|
| Total Current Liabilities | 238.0 |
| | 89.9 |
|
| | | | |
| Long-term debt | 1,312.4 |
| | — |
|
| Income tax liability | 67.2 |
| | 52.1 |
|
| Deferred income taxes | 715.7 |
| | — |
|
| Other non-current liabilities | 7.5 |
| | 4.2 |
|
| Commitments and Contingencies |
| |
|
| | | | |
| Redeemable Noncontrolling Interest | 9.4 |
| | 12.6 |
|
| | | | |
| Stockholders’ Equity: | | | |
| Preferred stock, $0.01 par value: 20,000,000 shares authorized, no shares issued and outstanding at September 30, 2017 and December 31, 2016 | — |
| | — |
|
| Common stock, $0.01 par value: 325,000,000 shares authorized, 125,332,691 and 113,457,824 shares issued and outstanding, respectively at September 30, 2017 and 92,950,065 and 81,285,307 shares issued and outstanding, respectively at December 31, 2016 | 1.2 |
| | 0.9 |
|
| Treasury stock, at cost: 11,874,867 shares at September 30, 2017 and 11,664,758 shares at December 31, 2016 | (550.2 | ) | | (532.2 | ) |
| Additional paid-in capital | 2,610.0 |
| | 139.2 |
|
| Retained earnings | 766.9 |
| | 710.8 |
|
| Accumulated other comprehensive income (loss), net | 50.0 |
| | (0.8 | ) |
| Total Stockholders’ Equity | 2,877.9 |
| | 317.9 |
|
| Total Liabilities, Redeemable Noncontrolling Interest and Stockholders’ Equity | $ | 5,228.1 |
| | $ | 476.7 |
|
| | | | | | |
| | March 31, | | December 31, |
| | 2022 | | 2021 |
Assets |
Current assets: | | | | | | |
Cash and cash equivalents | | $ | 659.4 | | $ | 341.9 |
Financial investments | | | 48.7 | | | 37.1 |
Accounts receivable, net of $0.9 allowance for credit losses at March 31, 2022 and $1.0 at December 31, 2021 | | | 380.3 | | | 326.9 |
Margin deposits and clearing funds | | | 1,810.3 | | | 745.9 |
Income taxes receivable | | | — | | | 42.7 |
Other current assets | | | 36.5 | | | 36.8 |
Total current assets | | | 2,935.2 | | | 1,531.3 |
| | | | | | |
Investments | | | 244.5 | | | 245.8 |
Land | | | 2.3 | | | 2.3 |
Property and equipment, net | | | 106.7 | | | 105.2 |
Operating lease right of use assets | | | 122.5 | | | 110.1 |
Goodwill | | | 3,018.1 | | | 3,025.4 |
Intangible assets, net | | | 1,628.6 | | | 1,668.6 |
Other assets, net | | | 140.2 | | | 125.8 |
Total assets | | $ | 8,198.1 | | $ | 6,814.5 |
Liabilities and Stockholders’ Equity |
Current liabilities: | | | | | | |
Accounts payable and accrued liabilities | | $ | 387.1 | | $ | 295.4 |
Section 31 fees payable | | | 36.2 | | | 40.8 |
Deferred revenue | | | 26.4 | | | 15.2 |
Margin deposits and clearing funds | | | 1,810.3 | | | 745.9 |
Income taxes payable | | | 32.5 | | | 8.2 |
Current portion of contingent consideration liabilities | | | 48.6 | | | 63.8 |
Total current liabilities | | | 2,341.1 | | | 1,169.3 |
| | | | | | |
Long-term debt | | | 1,593.6 | | | 1,299.3 |
Unrecognized tax benefits | | | 163.0 | | | 197.9 |
Deferred income taxes | | | 352.4 | | | 372.7 |
Non-current operating lease liabilities | | | 141.3 | | | 129.2 |
Contingent consideration liabilities | | | 4.7 | | | 6.7 |
Other non-current liabilities | | | 34.7 | | | 34.6 |
Total liabilities | | | 4,630.8 | | | 3,209.7 |
Commitments and contingencies | | | | | | |
| | | | | | |
Stockholders’ equity: | | | | | | |
Preferred stock, $0.01 par value: 20,000,000 shares authorized, 0 shares issued and outstanding at March 31, 2022 and December 31, 2021 | | | — | | | — |
Common stock, $0.01 par value: 325,000,000 shares authorized, 108,369,053 and 106,188,570 shares issued and outstanding, respectively at March 31, 2022 and 108,159,319 and 106,646,498 shares issued and outstanding, respectively at December 31, 2021 | | | 1.1 | | | 1.1 |
Common stock in treasury, at cost, 2,180,483 shares at March 31, 2022 and 1,512,821 shares at December 31, 2021 | | | (185.2) | | | (106.8) |
Additional paid-in capital | | | 1,518.6 | | | 1,509.4 |
Retained earnings | | | 2,203.7 | | | 2,145.5 |
Accumulated other comprehensive income, net | | | 29.1 | | | 55.6 |
Total stockholders’ equity | | | 3,567.3 | | | 3,604.8 |
Total liabilities and stockholders’ equity | | $ | 8,198.1 | | $ | 6,814.5 |
See accompanying notes to condensed consolidated financial statements.
Cboe Global Markets, Inc. and Subsidiaries
Condensed Consolidated Statements of Income
(in millions, except per share data)
|
| | | | | | | | | | | | | | | |
| | Three Months Ended
September 30, | | Nine Months Ended
September 30, |
| | 2017 | | 2016 | | 2017 | | 2016 |
| Revenues: | | | | | | | |
| Transaction fees | $ | 423.3 |
| | $ | 124.5 |
| | $ | 1,133.6 |
| | $ | 378.3 |
|
| Access fees | 30.1 |
| | 13.0 |
| | 77.6 |
| | 39.4 |
|
| Exchange services and other fees | 20.0 |
| | 11.4 |
| | 55.3 |
| | 34.2 |
|
| Market data fees | 46.8 |
| | 8.3 |
| | 117.3 |
| | 24.5 |
|
| Regulatory fees | 83.5 |
| | 9.1 |
| | 205.1 |
| | 27.4 |
|
| Other revenue | 7.7 |
| | 2.4 |
| | 19.5 |
| | 8.5 |
|
| Total Revenues | 611.4 |
| | 168.7 |
| | 1,608.4 |
| | 512.3 |
|
| Cost of Revenues: | | | | | | | |
| Liquidity payments | 234.3 |
| | 9.5 |
| | 606.1 |
| | 23.2 |
|
| Routing and clearing | 9.4 |
| | 3.6 |
| | 27.9 |
| | 7.9 |
|
| Section 31 fees | 75.9 |
| | — |
| | 180.5 |
| | — |
|
| Royalty fees | 22.1 |
| | 19.4 |
| | 63.9 |
| | 57.8 |
|
| Total Cost of Revenues | 341.7 |
| | 32.5 |
| | 878.4 |
| | 88.9 |
|
| Revenues Less Cost of Revenues | 269.7 |
| | 136.2 |
| | 730.0 |
| | 423.4 |
|
| Operating Expenses: | | | | | | | |
| Compensation and benefits | 50.4 |
| | 28.3 |
| | 148.2 |
| | 83.9 |
|
| Depreciation and amortization | 55.4 |
| | 10.2 |
| | 136.3 |
| | 34.4 |
|
| Technology support services | 11.4 |
| | 5.6 |
| | 30.9 |
| | 17.0 |
|
| Professional fees and outside services | 17.6 |
| | 12.7 |
| | 48.9 |
| | 41.0 |
|
| Travel and promotional expenses | 4.5 |
| | 2.6 |
| | 12.0 |
| | 7.6 |
|
| Facilities costs | 2.9 |
| | 1.3 |
| | 7.7 |
| | 4.2 |
|
| Acquisition-related costs | 5.5 |
| | 8.6 |
| | 75.4 |
| | 8.6 |
|
| Change in contingent consideration | 0.4 |
| | — |
| | 1.1 |
| | — |
|
| Other expenses | 2.3 |
| | 1.1 |
| | 6.3 |
| | 3.4 |
|
| Total Operating Expenses | 150.4 |
| | 70.4 |
| | 466.8 |
| | 200.1 |
|
| Operating Income | 119.3 |
| | 65.8 |
| | 263.2 |
| | 223.3 |
|
| Non-operating (Expenses) Income: | | | | | | | |
| Interest expense, net | (10.5 | ) | | (0.2 | ) | | (30.9 | ) | | (0.2 | ) |
| Other (expense) income | (2.9 | ) | | 1.8 |
| | (2.0 | ) | | 8.6 |
|
| Income Before Income Tax Provision | 105.9 |
| | 67.4 |
| | 230.3 |
| | 231.7 |
|
| Income tax provision | 45.6 |
| | 26.9 |
| | 86.8 |
| | 91.1 |
|
| Net income | 60.3 |
| | 40.5 |
| | 143.5 |
| | 140.6 |
|
| Net loss attributable to redeemable noncontrolling interest | 0.2 |
| | 0.3 |
| | 0.8 |
| | 0.8 |
|
| Net Income Excluding Noncontrolling Interest | 60.5 |
| | 40.8 |
| | 144.3 |
| | 141.4 |
|
| Change in redemption value of noncontrolling interest | (0.2 | ) | | (0.3 | ) | | (0.8 | ) | | (0.8 | ) |
| Net income allocated to participating securities | (0.6 | ) | | (0.2 | ) | | (1.4 | ) | | (0.6 | ) |
| Net Income Allocated to Common Stockholders | $ | 59.7 |
| | $ | 40.3 |
| | $ | 142.1 |
| | $ | 140.0 |
|
| Net Income Per Share Allocated to Common Stockholders: | | | | | | | |
| Basic earnings per share | $ | 0.53 |
| | $ | 0.50 |
| | $ | 1.35 |
| | $ | 1.72 |
|
| Diluted earnings per share | 0.53 |
| | 0.50 |
| | 1.34 |
| | 1.72 |
|
| | | | | | | | |
| Basic weighted average shares outstanding | 112.3 |
| | 81.3 |
| | 105.5 |
| | 81.5 |
|
| Diluted weighted average shares outstanding | 112.6 |
| | 81.3 |
| | 105.8 |
| | 81.5 |
|
| | | | | | |
| | Three Months Ended |
| | March 31, |
| | 2022 | | 2021 |
Revenues: | | | | | | |
Cash and spot markets | | $ | 461.9 | | $ | 548.9 |
Data and access solutions | | | 118.9 | | | 100.6 |
Derivatives markets | | | 393.7 | | | 361.3 |
Total revenues | | | 974.5 | | | 1,010.8 |
Cost of revenues: | | | | | | |
Liquidity payments | | | 467.5 | | | 501.8 |
Routing and clearing | | | 22.3 | | | 27.1 |
Section 31 fees | | | 35.7 | | | 91.9 |
Royalty fees and other cost of revenues | | | 30.9 | | | 24.5 |
Total cost of revenues | | | 556.4 | | | 645.3 |
Revenues less cost of revenues | | | 418.1 | | | 365.5 |
Operating expenses: | | | | | | |
Compensation and benefits | | | 81.2 | | | 72.3 |
Depreciation and amortization | | | 40.9 | | | 42.0 |
Technology support services | | | 19.2 | | | 17.2 |
Professional fees and outside services | | | 19.7 | | | 15.6 |
Travel and promotional expenses | | | 2.9 | | | 1.6 |
Facilities costs | | | 6.5 | | | 5.3 |
Acquisition-related costs | | | 2.0 | | | 3.4 |
Other expenses | | | 6.0 | | | 3.5 |
Total operating expenses | | | 178.4 | | | 160.9 |
Operating income | | | 239.7 | | | 204.6 |
Non-operating (expenses) income: | | | | | | |
Interest expense, net | | | (10.8) | | | (12.3) |
Other (expense) income, net | | | (4.0) | | | 0.6 |
Income before income tax provision | | | 224.9 | | | 192.9 |
Income tax provision | | | 115.3 | | | 55.7 |
Net income | | | 109.6 | | | 137.2 |
Net income allocated to participating securities | | | (0.4) | | | (0.4) |
Net income allocated to common stockholders | | $ | 109.2 | | $ | 136.8 |
Basic earnings per share | | $ | 1.02 | | $ | 1.27 |
Diluted earnings per share | | $ | 1.02 | | $ | 1.27 |
| | | | | | |
Basic weighted average shares outstanding | | | 106.6 | | | 107.3 |
Diluted weighted average shares outstanding | | | 106.8 | | | 107.4 |
See accompanying notes to condensed consolidated financial statements.
Cboe Global Markets, Inc. and Subsidiaries
Condensed Consolidated Statements of Comprehensive Income
|
| | | | | | | | | | | | | | |
| | Three Months Ended
September 30, | | Nine Months Ended
September 30, |
| | 2017 | | 2016 | | 2017 | 2016 |
| Net Income | $ | 60.3 |
| | $ | 40.5 |
| | $ | 143.5 |
| $ | 140.6 |
|
| Foreign currency translation adjustments | 20.5 |
| | — |
| | 50.7 |
| — |
|
| Unrealized holding (losses) gains on available-for-sale investments | (0.1 | ) | | — |
| | 0.1 |
| — |
|
| Comprehensive Income | 80.7 |
| | 40.5 |
| | 194.3 |
| 140.6 |
|
| Comprehensive loss attributable to noncontrolling interest | 0.2 |
| | 0.3 |
| | 0.8 |
| 0.8 |
|
| Comprehensive Income Excluding Noncontrolling Interest | 80.9 |
| | 40.8 |
| | 195.1 |
| 141.4 |
|
| Change in redemption value of noncontrolling interest | (0.2 | ) | | (0.3 | ) | | (0.8 | ) | (0.8 | ) |
| Comprehensive income allocated to participating securities | (0.3 | ) | | (0.2 | ) | | (1.4 | ) | (0.6 | ) |
| Comprehensive Income Allocated to Common Stockholders | $ | 80.4 |
| | $ | 40.3 |
| | $ | 192.9 |
| $ | 140.0 |
|
| | | | | | |
| | Three Months Ended |
| | March 31, |
| | 2022 | | 2021 |
Net income | | $ | 109.6 | | $ | 137.2 |
Other comprehensive (loss) income, net of income tax: | | | | | | |
Foreign currency translation adjustments | | | (26.5) | | | 4.8 |
Comprehensive income | | | 83.1 | | | 142.0 |
Comprehensive income allocated to participating securities | | | (0.4) | | | (0.4) |
Comprehensive income allocated to common stockholders, net of income tax | | $ | 82.7 | | $ | 141.6 |
See accompanying notes to condensed consolidated financial statements.
Cboe Global Markets, Inc. and Subsidiaries
Condensed Consolidated StatementStatements of Changes in Stockholders’ Equity
NineThree months ended September 30, 2017
March 31, 2022 and March 31, 2021(unaudited)
(in millions, except per share amount)
|
| | | | | | | | | | | | | | | | | | | | | | | | | | | | | | | |
| | Preferred Stock | | Common Stock | | Treasury Stock | | Additional Paid-In Capital | | Retained Earnings | | Accumulated Other Comprehensive (Loss) Income | | Total Stockholders’ Equity | | Redeemable Noncontrolling Interests |
| Balance at December 31, 2016 | $ | — |
| | $ | 0.9 |
| | $ | (532.2 | ) | | $ | 139.2 |
| | $ | 710.8 |
| | $ | (0.8 | ) | | $ | 317.9 |
| | $ | 12.6 |
|
| Issuance of stock for acquisition of Bats Global Markets, Inc. | — |
| | 0.3 |
| | — |
| | 2,424.4 |
| | — |
| | — |
| | 2,424.7 |
| | — |
|
| Issuance of vested restricted stock granted to employees | — |
| | — |
| | (12.0 | ) | | — |
| | — |
| | — |
| | (12.0 | ) | | — |
|
| Common stock issued from employee stock plans | — |
| | — |
| | (6.0 | ) | | 4.1 |
| | — |
| | — |
| | (1.9 | ) | | — |
|
| Stock-based compensation | — |
| | — |
| | — |
| | 39.1 |
| | — |
| | — |
| | 39.1 |
| | — |
|
| Net income excluding noncontrolling interest | — |
| | — |
| | — |
| | — |
| | 144.3 |
| | — |
| | 144.3 |
| | — |
|
| Cash dividends on common stock of $0.77 per share | — |
| | — |
| | — |
| | — |
| | (87.4 | ) | | — |
| | (87.4 | ) | | — |
|
| Purchase of additional equity interest from noncontrolling interest | — |
| | — |
| | — |
| | 3.2 |
| | — |
| | — |
| | 3.2 |
| | (3.2 | ) |
| Other comprehensive income | — |
| | — |
| | — |
| | — |
| | — |
| | 50.8 |
| | 50.8 |
| | — |
|
| Net loss attributable to redeemable noncontrolling interest | — |
| | — |
| | — |
| | — |
| | — |
| | — |
| | — |
| | (0.8 | ) |
| Redemption value adjustment | — |
| | — |
| | — |
| | — |
| | (0.8 | ) | | — |
| | (0.8 | ) | | 0.8 |
|
| Balance at September 30, 2017 | $ | — |
| | $ | 1.2 |
| | $ | (550.2 | ) |
| $ | 2,610.0 |
| | $ | 766.9 |
| | $ | 50.0 |
| | $ | 2,877.9 |
| | $ | 9.4 |
|
amounts) | | | | | | | | | | | | | | | | | | | | | |
| | | | | | | | | | | | Accumulated | | |
| | | | | | | | Additional | | | | other | | Total |
| | Preferred | | Common | | Treasury | | paid-in | | Retained | | comprehensive | | stockholders’ |
| | Stock | | Stock | | Stock | | capital | | earnings | | income, net | | equity |
Balance at December 31, 2021 | | $ | — | | $ | 1.1 | | $ | (106.8) | | $ | 1,509.4 | | $ | 2,145.5 | | $ | 55.6 | | $ | 3,604.8 |
Cash dividends on common stock of $0.48 per share | | | — | | | — | | | — | | | — | | | (51.4) | | | — | | | (51.4) |
Stock-based compensation | | | — | | | — | | | — | | | 9.1 | | | — | | | — | | | 9.1 |
Repurchases of common stock from employee stock plans | | | — | | | — | | | (8.4) | | | — | | | — | | | — | | | (8.4) |
Purchase of common stock | | | — | | | — | | | (70.0) | | | — | | | — | | | — | | | (70.0) |
Shares issued under employee stock purchase plan | | | — | | | — | | | — | | | 0.1 | | | — | | | — | | | 0.1 |
Net income | | | — | | | — | | | — | | | — | | | 109.6 | | | — | | | 109.6 |
Other comprehensive loss | | | — | | | — | | | — | | | — | | | — | | | (26.5) | | | (26.5) |
Balance at March 31, 2022 | | $ | — | | $ | 1.1 | | $ | (185.2) | | $ | 1,518.6 | | $ | 2,203.7 | | $ | 29.1 | | $ | 3,567.3 |
| | | | | | | | | | | | | | | | | | | | | |
| | | | | | | | | | | | Accumulated | | |
| | | | | | | | Additional | | | | other | | Total |
| | Preferred | | Common | | Treasury | | paid-in | | Retained | | comprehensive | | stockholders’ |
| | Stock | | Stock | | Stock | | capital | | earnings | | income, net | | equity |
Balance at December 31, 2020 | | $ | — | | $ | 1.2 | | $ | (1,250.4) | | $ | 2,713.3 | | $ | 1,809.8 | | $ | 75.0 | | $ | 3,348.9 |
Cash dividends on common stock of $0.42 per share | | | — | | | — | | | — | | | — | | | (45.3) | | | — | | | (45.3) |
Stock-based compensation | | | — | | | 0.1 | | | — | | | 11.7 | | | — | | | — | | | 11.8 |
Repurchases of common stock from employee stock plans | | | — | | | — | | | (5.7) | | | — | | | — | | | — | | | (5.7) |
Purchase of common stock | | | — | | | — | | | (47.6) | | | — | | | — | | | — | | | (47.6) |
Shares issued under employee stock purchase plan | | | — | | | — | | | — | | | 0.1 | | | — | | | — | | | 0.1 |
Net income | | | — | | | — | | | — | | | — | | | 137.2 | | | — | | | 137.2 |
Other comprehensive income | | | — | | | — | | | — | | | — | | | — | | | 4.8 | | | 4.8 |
Balance at March 31, 2021 | | $ | — | | $ | 1.3 | | $ | (1,303.7) | | $ | 2,725.1 | | $ | 1,901.7 | | $ | 79.8 | | $ | 3,404.2 |
See accompanying notes to condensed consolidated financial statements.
Cboe Global Markets, Inc. and Subsidiaries
Condensed Consolidated Statements of Cash Flows
|
| | | | | | | |
| | Nine Months Ended September 30, |
| | 2017 | | 2016 |
| Cash Flows from Operating Activities: | | | |
| Net income | $ | 143.5 |
| | $ | 140.6 |
|
| Adjustments to reconcile net income to net cash provided by operating activities: | | | |
| Depreciation and amortization | 136.3 |
| | 34.4 |
|
| Amortization of debt issuance cost | 3.1 |
| | — |
|
| Change in fair value of contingent consideration | 1.1 |
| | — |
|
| Gain on settlement of contingent consideration | — |
| | (1.4 | ) |
| Realized gain on available-for-sale securities | (0.4 | ) | | — |
|
Provision for uncollectable convertible notes receivable
| 3.8 |
| | — |
|
| Provision for deferred income taxes | (6.3 | ) | | 0.4 |
|
| Stock-based compensation expense | 39.1 |
| | 10.9 |
|
| Impairment of data processing software | 14.9 |
| | — |
|
| Equity in investments | (0.3 | ) | | (0.8 | ) |
| Excess tax benefit from stock-based compensation | 7.1 |
| | — |
|
| Changes in assets and liabilities: | | | |
| Accounts receivable | (2.1 | ) | | (0.1 | ) |
| Income taxes receivable | 24.1 |
| | (24.3 | ) |
| Trading financial investment | (1.9 | ) | | — |
|
| Other prepaid expenses | (8.7 | ) | | (3.4 | ) |
| Other current assets | — |
| | 0.4 |
|
| Accounts payable and accrued liabilities | (1.1 | ) | | 8.2 |
|
| Section 31 fees payable | (122.7 | ) | | — |
|
| Deferred revenue | 3.9 |
| | 2.8 |
|
| Income taxes payable | (50.2 | ) | | (1.6 | ) |
| Income tax liability | (5.3 | ) | | 8.0 |
|
| Other liabilities | 1.0 |
| | — |
|
| Net Cash Flows provided by Operating Activities | 178.9 |
| | 174.1 |
|
| Cash Flows from Investing Activities: | | | |
| Acquisitions, net of cash acquired | (1,405.4 | ) | | (14.3 | ) |
| Purchases of available-for-sale financial investments | (89.2 | ) | | — |
|
| Proceeds from maturities of available-for-sale financial investments | 155.1 |
| | — |
|
| Investments | (4.0 | ) | | (24.6 | ) |
| Payment of contingent consideration from acquisition | — |
| | (2.0 | ) |
| Purchases of property and equipment | (26.1 | ) | | (36.4 | ) |
| Net Cash Flows used in Investing Activities | (1,369.6 | ) | | (77.3 | ) |
| Cash Flows from Financing Activities: | | | |
| Proceeds from long-term debt | 1,944.2 |
| | — |
|
| Principal payments of long term debt | (625.0 | ) | | — |
|
| Debt issuance costs | (1.3 | ) | | (4.7 | ) |
| Dividends paid | (87.4 | ) | | (58.1 | ) |
| Purchase of unrestricted stock from employees | (18.0 | ) | | (4.1 | ) |
| Proceeds from exercise of stock-based compensation | 1.8 |
| | — |
|
| Excess tax benefit from stock-based compensation | — |
| | 1.1 |
|
| Purchase of common stock under announced program | — |
| | (60.5 | ) |
| Net Cash Flows provided by (used in) Financing Activities | 1,214.3 |
| | (126.3 | ) |
| Effect of Foreign Currency Exchange Rate Changes on Cash and Cash equivalents | 3.9 |
| | — |
|
| Increase (Decrease) in Cash and Cash Equivalents | 27.5 |
| | (29.5 | ) |
| Cash and Cash Equivalents: | | | |
| Beginning of Period | 97.3 |
| | 102.3 |
|
| End of Period | $ | 124.8 |
| | $ | 72.8 |
|
| Supplemental disclosure of noncash transactions: | | | |
| Forfeiture of common stock for payment of exercise of stock options | $ | 2.3 |
| | $ | — |
|
| Supplemental disclosure of noncash investing activities: | | | |
| Accounts receivable acquired | $ | 117.8 |
| | $ | — |
|
| Financial investments | 66.0 |
| | — |
|
| Property and equipment acquired | 21.8 |
| | — |
|
| Goodwill acquired | 2,651.0 |
| | — |
|
| Intangible assets acquired | 2,000.0 |
| | — |
|
| Other assets acquired | 32.8 |
| | — |
|
| Accounts payable and accrued expenses assumed | (59.9 | ) | | — |
|
| Section 31 fees payable acquired | (143.6 | ) | | — |
|
| Deferred tax liability acquired | (720.3 | ) | | — |
|
| Other liabilities assumed | (135.5 | ) | | — |
|
| Issuance of common stock related to acquisition | (2,424.7 | ) | | — |
|
| | | | | | |
| | Three Months Ended |
| | March 31, |
| | 2022 | | 2021 |
Cash flows from operating activities: | | | | | | |
Net income | | $ | 109.6 | | $ | 137.2 |
Adjustments to reconcile net income to net cash provided by operating activities: | | | | | | |
Depreciation and amortization | | | 40.9 | | | 42.0 |
Amortization of debt issuance cost and debt discount | | | 0.5 | | | 0.7 |
Provision for accounts receivable credit losses | | | 0.2 | | | 0.2 |
Provision for deferred income taxes | | | (17.8) | | | (5.8) |
Stock-based compensation expense | | | 9.1 | | | 11.7 |
Loss on disposal of property and equipment | | | 0.1 | | | — |
Impairment charge of investment | | | — | | | 0.6 |
Equity loss in investments | | | 3.1 | | | 0.4 |
Changes in assets and liabilities: | | | | | | |
Accounts receivable | | | (56.2) | | | (37.6) |
Restricted cash and cash equivalents (margin deposits and clearing funds) | | | 1,064.4 | | | 447.9 |
Income taxes receivable | | | 42.7 | | | 53.1 |
Other current assets | | | 0.3 | | | (12.8) |
Other assets | | | (15.7) | | | (6.1) |
Accounts payable and accrued liabilities | | | 2.8 | | | (2.5) |
Section 31 fees payable | | | (4.6) | | | (60.6) |
Deferred revenue | | | 11.2 | | | 11.0 |
Income taxes payable | | | 24.5 | | | 3.1 |
Unrecognized tax benefits | | | 56.0 | | | 9.5 |
Other liabilities | | | (11.3) | | | 7.1 |
Net cash provided by operating activities | | | 1,259.8 | | | 599.1 |
Cash flows from investing activities: | | | | | | |
Purchases of available-for-sale financial investments | | | (20.8) | | | (71.0) |
Proceeds from maturities of available-for-sale financial investments | | | 8.6 | | | 67.6 |
Contributions to investments | | | (1.9) | | | — |
Purchases of property and equipment and leasehold improvements | | | (10.8) | | | (9.9) |
Net cash used in investing activities | | | (24.9) | | | (13.3) |
Cash flows from financing activities: | | | | | | |
Proceeds from long-term debt | | | 298.6 | | | — |
Principal payments of current portion of long-term debt | | | — | | | (20.0) |
Debt issuance costs | | | (4.8) | | | — |
Cash dividends on common stock | | | (51.4) | | | (45.3) |
Repurchases of common stock from employee stock plans | | | (8.4) | | | (5.7) |
Payment of contingent consideration from acquisition | | | (17.4) | | | (0.8) |
Shares issued under employee stock purchase plan | | | (0.1) | | | (0.1) |
Purchase of common stock | | | (70.0) | | | (47.6) |
Net cash provided by (used in) financing activities | | | 146.5 | | | (119.5) |
Effect of foreign currency exchange rates on cash, cash equivalents, and restricted cash and cash equivalents | | | 0.7 | | | (0.5) |
Increase in cash, cash equivalents, and restricted cash and cash equivalents | | | 1,382.1 | | | 465.8 |
Cash, cash equivalents, and restricted cash and cash equivalents: | | | | | | |
Beginning of period | | | 1,092.2 | | | 1,057.5 |
End of period | | $ | 2,474.3 | | $ | 1,523.3 |
Reconciliation of cash, cash equivalents, and restricted cash and cash equivalents: | | | | | | |
Cash and cash equivalents | | | 659.4 | | | 263.3 |
Restricted cash and cash equivalents (margin deposits and clearing funds) | | | 1,810.3 | | | 1,260.0 |
Restricted cash and cash equivalents (included in other current assets) | | | 4.6 | | | — |
Total | | $ | 2,474.3 | | $ | 1,523.3 |
Supplemental disclosure of cash transactions: | | | | | | |
Cash paid for income taxes | | $ | 10.3 | | $ | 2.8 |
Cash paid for interest | | | 8.8 | | | 13.8 |
See accompanying notes to condensed consolidated financial statements.
Cboe Global Markets, Inc. and Subsidiaries
Notes to Condensed Consolidated Financial Statements (unaudited)
1. ORGANIZATION AND BASIS OF PRESENTATION
Cboe Global Markets, Inc. is one(“Cboe” or “the Company”), a leading provider of the world’s largest exchange holding companies, offeringmarket infrastructure and tradable products, delivers cutting-edge trading, clearing and investment solutions to investorsmarket participants around the world. The Company is committed to relentless innovation, connectingoperating a trusted, inclusive global markets with world-classmarketplace, and to providing leading products, technology and providing seamlessdata solutions that enhance the customer experience.
enable participants to define a sustainable financial future. Cboe offersprovides trading across a diverse range ofsolutions and products in multiple asset classes, including equities, derivatives and geographies, including options, futures, U.S.FX, across North America, Europe, and European equities, exchange-traded products (ETPs), global foreign exchange (FX) and multi-asset volatility products based on the VIX, the world’s barometer for equity market volatility.
Asia Pacific.Cboe’s trading venuessubsidiaries include the largest options exchange and the third largest stock exchange operator in the U.S. by volume andIn addition, the Company operates one of the largest stock exchangeexchanges by value traded in Europe. In addition, the Company is the second-largest stock exchange operatorEurope, and owns EuroCCP, a leading pan-European equities and derivatives clearinghouse, BIDS Trading, a leading block-trading ATS by volume in the U.S., MATCHNow, a leading equities ATS in Canada, Cboe Australia, an operator of trading venues in Australia, and Cboe Japan, an operator of trading venues in Japan. Cboe also is a leading market globally for ETPexchange-traded products (“ETPs”) listings and trading.
The Company is headquartered in Chicago with offices in Amsterdam, Belfast, Calgary, Hong Kong, Kansas City, London, Manila, New York, London, San Francisco, Sarasota Springs, Singapore, Hong Kong,Sydney, Tokyo and Ecuador.
In October 2017, the Company changed its legal name from CBOE Holdings, Inc. to Cboe Global Markets, Inc. The amendment to effect the name change was filed and became effective with the State of Delaware on October 16, 2017.
Toronto.Basis of Presentation
These interim unaudited condensed consolidated financial statements have been prepared in accordance with GAAP as established by FASB for interim financial information and with the instructions to Form 10-Q and should be read in conjunction with the consolidated financial statements and notes thereto contained in the Company’s Annual Report on Form 10-K for the year ended December 31, 2016.
2021. The results of operations for interim periods are not necessarily indicative of the results of operations for the full year.The preparation of condensed consolidated financial statements in conformity with GAAP requires management to make estimates and assumptions that affect the reported amounts of assets and liabilities, disclosures of contingent assets and liabilities, valuation of redeemable noncontrolling interests and reported amounts of revenues and expenses. On an ongoing basis, management evaluates its estimates based upon historical experience, observance of trends, information available from outside sources and various other assumptions that management believes to be reasonable under the circumstances. Actual results may differ from these estimates under different conditions or assumptions.
In the opinion of management, all adjustments (consisting of normal recurring adjustments) considered necessary for a fair presentation of financial position, results of operations and cash flows at the dates and for the periods presented have been included.
The resultsBeginning in the first quarter of operations2022, the Company updated the financial statement captions within its condensed consolidated statements of income for interimboth periods are not necessarily indicativepresented to better reflect the Company’s diversified products, expansive geographical reach, and overall business strategy. Below is a summary of the results of operations forchanges to the full year.
For those consolidated subsidiaries in whichfinancial statement captions. The changes do not have a financial impact on the Company's ownership isCompany’s reported revenue, revenues less than 100% and for which the Company has control over the assets and liabilities and the management of the entity, the outside stockholders' interest are shown as non-controlling interests.
In 2017, the Company changed the presentation of liquidity payments to be a cost of revenues,
which historically had been netted against transaction fees. reported net income, or cash flows from operations.Revenues
| ● | Cash and spot markets – includes associated transaction and clearing fees, the portion of market data fees relating to associated U.S. tape plan market data fees, associated regulatory fees, and associated other revenue from Cboe’s North American Equities, Europe and Asia Pacific, and Global FX segments. |
| ● | Data and access solutions – includes access and capacity fees, proprietary market data fees, and associated other revenue across Cboe’s 5 segments. |
| ● | Derivatives markets – includes associated transaction and clearing fees, the portion of market data fees relating to associated U.S. tape plan market data fees, associated regulatory fees, and associated other revenue from Cboe’s Options, Futures, and Europe and Asia Pacific segments. |
Cost of Revenues
| ● | Royalty fees and other cost of revenues – includes royalty fees and other cost of revenues across the Company’s 5 segments. |
Segment Information
The Company also changed the presentation of royalty fees to be a cost of revenues. The presentation of routing fees and costs were also changed. Routing fees were presented in transaction fees in total revenues and routing and clearing costs in total cost of revenues. These fees were previously presented as a net operating expense. These changes were made to conform to current presentation and the changes have been reflected in all periods presented.
Segment information
The Company previously operated as a single reportable business segment. As a result of the Bats acquisition on February 28, 2017 (Note 3), the Company is reporting fivehas 5 business segments: Options, U.S.North American Equities, Europe and Asia Pacific, Futures, European Equities, and
Cboe Global Markets, Inc. and Subsidiaries
Notes to Condensed Consolidated Financial Statements (unaudited)
Global FX, which is reflective of how the
Company'sCompany’s chief operating decision-maker reviews and operates the
business (Note 15). This change hasbusiness. See Note 14 (“Segment Reporting”) for more information.Update to Significant Accounting Policies
There have been reflectedno new or material changes to the significant accounting policies discussed in all periods presented.
the Company’s Annual Report on Form 10-K for the fiscal year ended December 31, 2021, that are of significance, or potential significance, to the Company.Recent Accounting Pronouncements - Adopted
In the first quarter of 2017, the Company adopted Accounting Standards Update (ASU) 2014-09, Revenue from Contracts with Customers (Topic 606). Under the ASU, revenue is recognized when a customer obtains control of promised goods or services in an amountThere were no recent applicable material accounting pronouncements that reflects the consideration the entity expects to receive in exchange for those goods or services. In addition, the standard requires disclosure of the nature, amount, timing, and uncertainty of revenue and cash flows arising from contracts with customers. The Company applied the five-step method outlined in the ASU to all revenue streams and elected the full retrospective implementation method. The additional disclosures required by the ASU have been included in Note 2.
In the first quarteradopted as of 2017, the Company adopted ASU 2016-09, Compensation — Stock Compensation. This ASU simplifies several aspects of the accounting for stock-based payment transactions, including the recognition of excess tax benefits and deficiencies, the classification of those excess tax benefits on the statement of cash flows, an accounting policy election for forfeitures, the amount an employer can withhold to cover income taxes and still qualify for equity classification and the classification of those taxes paid on the statement of cash flows. The Company has chosen to use the actual forfeiture rate and applied the prospective transition method for excess tax benefits and employees taxes paid. As of the adoption date,the Company did not have any awards classified as a liability under the previous guidance.
In the first quarter of 2017, the Company adopted ASU 2016-16, Accounting for Income Taxes:Intra-Entity Transfers of Assets other than Inventory. The ASU requires that the income tax impact of intra-entity sales and transfers of property, except for inventory, be recognized when the transfer occurs. The Company applied the full retrospective application which did not result in any impact to the financial statements.
March 31, 2022.Recent Accounting Pronouncements - Issued, not yet Adopted
In May 2017, the FASBThere were no applicable material accounting pronouncements that have been issued, ASU 2017-09,
Compensation - Stock Compensation (Topic 718) that provides additional guidance around which changes to a share-based payment award requires an entity to apply modification accounting. Specifically, an entity is to account for the effectsbut not yet adopted as of a modification, unless all of the following are satisfied: (1) the fair value (or calculated value or intrinsic value, if such an alternative measurement method is used) of the modified award is the same as the fair value (or calculated value or intrinsic value, if such an alternative measurement method is used) of the original award immediately before the original award is modified; (2) the vesting conditions of the modified award are the same as the vesting conditions of the original award immediately before the original award is modified; and (3) the classification of the modified award as an equity instrument or as a liability instrument is the same as the classification of the original award immediately before the original award is modified. For public entities, the update is effective beginning after December 15, 2017. Early adoption is permitted. The Company is in the process of evaluating this guidance and assessing the impact the ASU could have on the consolidated financial statements.
In March 2017, the FASB issued ASU 2017-07, Compensation - Retirement Benefits (Topic 715). This ASU requires an employer to report the service cost component in the same line item or items as other compensation costs arising from services rendered by the pertinent employees during the period. The other components are required to be presented in the income statement separately from the service cost component and outside a subtotal of income from operations. For public entities, the update is effective beginning after December 15, 2017. Early adoption is permitted. The Company is in the process of evaluating this guidance and assessing the impact the ASU could have on the consolidated financial statements.
In January 2017, the FASB issued ASU 2017-01, Business Combinations (Topic 805)-Clarifying the Definition of a Business. ASU No. 2017-01 clarifies the definition of a business with the objective of adding guidance to assist entities with evaluating whether transactions should be accounted for as acquisitions (or disposals) of assets or businesses. There are three elements of a business: inputs, processes, and outputs. While an integrated set of assets and activities (collectively, a “set”) that is a business usually has outputs, outputs are not required to be present. Additionally, all of the inputs and processes that a seller uses in operating a set are not required if market participants can acquire the set and continue to produce outputs. ASU No. 2017-01 provides a screen to determine when a set is not a business. The screen requires that when substantially all of the fair value of the gross assets acquired (or disposed of) is concentrated in a single identifiable asset or a group of similar identifiable assets, the set
Cboe Global Markets, Inc. and Subsidiaries
Notes to Condensed Consolidated Financial Statements (unaudited)
is not a business. This screen reduces the number of transactions that need to be further evaluated. If, however, the screen is not met, then the amendments in this ASU (1) require that to be considered a business, a set must include, at a minimum, an input and a substantive process that together significantly contribute to the ability to create output and (2) remove the evaluation of whether a market participant could replace missing elements. Finally, the amendments in this ASU narrow the definition of the term “output” so that it is consistent with the manner in which outputs are described in Topic 606 - Revenue from Contracts with Customers. For public entities, the update is effective for annual or any interim goodwill impairment tests in fiscal years beginning after December 15, 2018. Early adoption is permitted under certain circumstances. The Company is in the process of evaluating this guidance and assessing the impact the ASU could have on the consolidated financial statements.
In January 2017, the FASB issued ASU 2017-04, Intangibles-Goodwill and Other (Topic 350): Simplifying the Test for Goodwill Impairment. This ASU simplifies the manner in which an entity is required to test goodwill for impairment by eliminating Step 2 from the goodwill impairment test. Step 2 measures a goodwill impairment loss by comparing the implied fair value of a reporting unit’s goodwill with the carrying amount of that goodwill. In computing the implied fair value of goodwill under Step 2, an entity, prior to the amendments in ASU No. 2017-04, had to perform procedures to determine the fair value at the impairment testing date of its assets and liabilities, including unrecognized assets and liabilities, in accordance with the procedure that would be required in determining the fair value of assets acquired and liabilities assumed in a business combination. However, under this ASU, an entity should (1) perform its annual or interim goodwill impairment test by comparing the fair value of a reporting unit with its carrying amount, and (2) recognize an impairment charge for the amount by which the carrying amount exceeds the reporting unit’s fair value, with the understanding that the loss recognized should not exceed the total amount of goodwill allocated to that reporting unit. Additionally, ASU No. 2017-04 removes the requirements for any reporting unit with a zero or negative carrying amount to perform a qualitative assessment and, if it fails such qualitative test, to perform Step 2 of the goodwill impairment test. For public entities, the update is effective for annual or any interim goodwill impairment tests in fiscal years beginning after December 15, 2019. Early adoption is permitted for interim or annual goodwill impairment tests performed on testing dates after January 1, 2017. The Company is in the process of evaluating this guidance and assessing the impact the ASU could have on the consolidated financial statements.
In February 2016, the FASB issued ASU 2016-02, Leases. This update requires a lessee to recognize on the balance sheet a liability to make lease payments and a corresponding right-of-use asset. The guidance also requires certain qualitative and quantitative disclosures about the amount, timing and uncertainty of cash flows arising from leases. This update is effective for annual and interim periods beginning after December 15, 2018. Early adoption is permitted. The Company is in the process of evaluating this guidance and assessing the impact the ASU could have on the consolidated financial statements.
In September 2016, the FASB issued ASU 2016-15, Statement of Cash Flows (Topic 230) — Classification of Certain Cash Receipts and Cash Payments (a consensus of the FASB Emerging Issues Task Force). ASU No. 2016-15 addresses eight specific cash flow issues in an effort to reduce diversity in practice: (1) debt prepayment or debt extinguishment costs; (2) settlement of zero-coupon bonds; (3) contingent consideration payments made after a business combination; (4) proceeds from the settlement of insurance claims; (5) proceeds from the settlement of corporate-owned life insurance policies, including bank-owned life insurance policies; (6) distributions received from equity method investees; (7) beneficial interests in securitization transactions; and (8) separately identifiable cash flows and application of the predominance principle. The ASU is effective for the Company for fiscal years beginning after December 15, 2017, and for the interim periods within that fiscal year. Early adoption is permitted, including adoption during an interim period. The Company is in the process of evaluating this guidance and assessing the impact the ASU could have on the consolidated financial statements.
31, 2022.2. REVENUE RECOGNITION
As of January 1, 2017, the Company adopted ASU 2014-09 Revenue from Contracts with Customers - Topic 606 and all subsequent ASUs that modified ASC 606. The Company has elected to apply the ASU and all related ASUs retrospectively to each prior reporting period presented. The implementation of the guidance had no material impact on the measurement or recognition of revenue of prior periods, however, additional disclosures have been added in accordance with the ASU.
TheCompany’s main types of revenue contracts are:
Transaction fees - Transaction fees represent fees charged byconsist of the Company for the performance obligation of executing a trade on its markets. These fees can be variable based on trade volume tiered discounts, however, as all tiered discountsfollowing, which are calculated monthly, the actual discount is recorded on a monthly basis. Transaction fees, as well as any tiered volume discounts, are calculated and billed monthly in accordance with the Company’s published fee schedules. Transaction fees are recognized across all segments. The Company also pays liquidity payments to customers based
Cboe Global Markets, Inc. and Subsidiaries
Notes to Condensed Consolidated Financial Statements (unaudited)
on its published fee schedules. The Company uses these payments to improve the liquidity on its markets and therefore recognizes those payments as a cost of revenue.
Access fees - Access fees represent fees assessed for the opportunity to trade, including fees for trading-related functionality across all segments. These fees are billed monthly in accordance with the Company’s published fee schedules and recognized on a monthly basis when the performance obligation is met. There is no remaining performance obligation after revenue is recognized.
Exchange services and other fees - To facilitate trading, the Company offers technology services, terminal and other equipment rights, maintenance services, trading floor space and telecommunications services. Trading floor and equipment rights are generally on a month-to-month basis. Facilities, systems services and other fees are generally monthly fee-based, although certain services are influenced by trading volume or other defined metrics, while others are based solely on demand. All fees associated with the trading floor are recognized in the Options segment.
Market data fees - Market data fees represent the fees received by the Companydisaggregated from the U.S. tape plans and fees charged to customers for proprietary market data. Fees from the U.S. tape plans are collected monthly based on published fee schedules and distributed quarterly to the U.S. exchanges based on a known formula. A contract for proprietary market data is entered into and charged on a monthly basis in accordance with the Company’s published fee schedules as the service is provided. Both typescondensed consolidated statements of market data are satisfied over time, and revenue is recognized on a monthly basis as the customer receives and consumes the benefit as the Company provides the data. U.S. tape plan market data is recognized in the U.S. Equities and Options segments. Proprietary market data fees are recognized across all segments.income. | ● | Transaction and clearing fees - Transaction fees represent fees charged by the Company for meeting the point-in-time performance obligation of executing a trade on its markets. These fees can be variable based on trade volume tiered discounts; however, as all tiered discounts are calculated monthly, the actual discount is recorded on a monthly basis. Transaction fees are recognized across all segments. Clearing fees, which include settlement fees, represent fees charged by the Company for meeting the point-in-time performance obligation for transactions cleared and settled by EuroCCP. Clearing fees can be variable based on trade volume tiered discounts; however, as all tiered discounts are calculated monthly, the actual discount is recorded on a monthly basis. Clearing fees are recognized in the Europe and Asia Pacific segment. Transaction and clearing fees, as well as any tiered volume discounts, are calculated and billed monthly in accordance with the Company’s published fee schedules. |
| ● | Access and capacity fees - Access and capacity fees represent fees assessed for the opportunity to trade, including fees for trading-related functionality across all segments, terminal and other equipment rights, maintenance services, trading floor space and telecommunications services. Facilities, systems services and other fees are generally monthly fee-based. These fees are billed monthly in accordance with the Company’s published fee schedules and recognized on a monthly basis when the performance obligations are met. All access and capacity fees associated with the trading floor are recognized over time in the Options segment, as the performance obligations are met. |
| ● | Market data fees - Market data fees represent the fees received by the Company from the U.S. tape plans and fees charged to customers for proprietary market data. Fees from the U.S. tape plans are collected monthly based on published fee schedules and distributed quarterly to the Exchanges based on a known formula. A contract for proprietary market data is entered into and charged on a monthly basis in accordance with the Company’s published fee schedules as the service is provided. Proprietary market data also includes revenue from various licensing agreements, which was classified as other revenue prior to January 1, 2022. Both types of market data are satisfied over time, and revenue is recognized on a monthly basis as the customer receives and consumes the benefit as the Company provides the data to meet its performance obligation. U.S. tape plan market data is recognized in the North American Equities and Options segments. Proprietary market data fees are recognized across all segments. |
| ● | Regulatory fees - There are 2 types of regulatory fees that the Company recognizes. The first type represents fees collected by the Company to cover the Section 31 fees charged to the Exchanges by the SEC for meeting the point-in-time performance obligation of executing a trade on its markets. The fees charged to customers are based on the fee set by the SEC per notional value of U.S. Equities exchange transactions and per round turn of Options transactions executed on the Company’s U.S. securities markets. These fees are calculated and billed monthly and are recognized in the North American Equities and Options segments. As the Exchanges are responsible for the ultimate payment to the SEC, the Exchanges are considered the principal in these transactions. Regulatory fees also include the options regulatory fee (“ORF”) which supports the Company’s regulatory oversight function in the Options segment, along with other miscellaneous regulatory fees, and neither can be used for non-regulatory purposes. The ORF and miscellaneous fees are recognized when the performance obligation is fulfilled. |
| ● | Other revenue - Other revenue primarily includes interest income from clearing operations, all fees related to the trade reporting facility operated in the Europe and Asia Pacific segment, listing fees, and revenue associated with advertisements through the Company’s websites. |
Other revenue - Other revenueprimarily includes revenue from various licensing agreements, all fees related to the trade reporting facility operated in the European Equities segment, and revenue associated with advertisements through the Company’s website.
Cboe Global Markets, Inc. and Subsidiaries
Notes to Condensed Consolidated Financial Statements (unaudited)
All revenue recognized in the condensed consolidated statements of income statement is considered to be revenue from contracts with customers. customers, with the exception of interest income from clearing operations. The following table depicts the disaggregated revenue contract types listed above within each respective financial statement caption in the condensed consolidated statements of income (in millions):
| | | | | | | | | | | | |
| | Cash | | Data and | | | | |
| | and Spot | | Access | | Derivatives | | |
| | Markets | | Solutions | | Markets | | Total |
Three Months Ended March 31, 2022 | | | | | | | | | | | | |
Transaction and clearing fees | | $ | 395.5 | | $ | — | | $ | 374.1 | | $ | 769.6 |
Access and capacity fees | | | — | | | 77.9 | | | — | | | 77.9 |
Market data fees | | | 22.9 | | | 39.6 | | | 8.2 | | | 70.7 |
Regulatory fees | | | 31.9 | | | — | | | 10.7 | | | 42.6 |
Other revenue | | | 11.6 | | | 1.4 | | | 0.7 | | | 13.7 |
| | $ | 461.9 | | $ | 118.9 | | $ | 393.7 | | $ | 974.5 |
| | | | | | | | | | | | |
| | Cash | | Data and | | | | |
| | and Spot | | Access | | Derivatives | | |
| | Markets | | Solutions | | Markets | | Total |
Three Months Ended March 31, 2021 | | | | | | | | | | | | |
Transaction and clearing fees | | $ | 428.9 | | $ | — | | $ | 334.3 | | $ | 763.2 |
Access and capacity fees | | | — | | | 66.4 | | | — | | | 66.4 |
Market data fees | | | 26.9 | | | 29.7 | | | 7.2 | | | 63.8 |
Regulatory fees | | | 82.4 | | | — | | | 19.1 | | | 101.5 |
Other revenue | | | 10.7 | | | 4.5 | | | 0.7 | | | 15.9 |
| | $ | 548.9 | | $ | 100.6 | | $ | 361.3 | | $ | 1,010.8 |
The following table depicts the disaggregation of revenue according to product line and segment (in millions):
|
| | | | | | | | | | | | | | | | | | | | | | | | | | | |
| | | | | | | | | | | | Corporate | | |
| | | | U.S. | | | | European | | Global | | Items and | | |
| | Options | | Equities | | Futures | | Equities | | FX | | Eliminations | | Total |
| Three months ended September 30, 2017 | | | | | | | | | | | | | |
| Transaction fees | $ | 172.3 |
| | $ | 185.5 |
| | $ | 36.6 |
| | $ | 19.0 |
| | $ | 9.9 |
| | $ | — |
| | $ | 423.3 |
|
| Access fees | 14.4 |
| | 12.5 |
| | 0.4 |
| | 2.0 |
| | 0.8 |
| | — |
| | 30.1 |
|
| Exchange services and other fees | 10.0 |
| | 5.7 |
| | 2.5 |
| | 1.3 |
| | 0.5 |
| | — |
| | 20.0 |
|
| Market data fees | 10.0 |
| | 33.1 |
| | 0.8 |
| | 2.8 |
| | 0.1 |
| | — |
| | 46.8 |
|
| Regulatory fees | 13.7 |
| | 69.8 |
| | — |
| | — |
| | — |
| | — |
| | 83.5 |
|
| Other revenue | 4.4 |
| | 1.9 |
| | — |
| | 1.2 |
| | — |
| | 0.2 |
| | 7.7 |
|
| | $ | 224.8 |
| | $ | 308.5 |
| | $ | 40.3 |
| | $ | 26.3 |
| | $ | 11.3 |
| | $ | 0.2 |
| | $ | 611.4 |
|
| | | | | | | | | | | | | | |
| Timing of revenue recognition | | | | | | | | | | | | | |
| Services transferred at a point in time | $ | 190.4 |
| | $ | 257.2 |
| | $ | 36.6 |
| | $ | 20.2 |
| | $ | 9.9 |
| | $ | 0.2 |
| | $ | 514.5 |
|
| Services transferred over time | 34.4 |
| | 51.3 |
| | 3.7 |
| | 6.1 |
| | 1.4 |
| | — |
| | 96.9 |
|
| | $ | 224.8 |
| | $ | 308.5 |
| | $ | 40.3 |
| | $ | 26.3 |
| | $ | 11.3 |
| | $ | 0.2 |
| | $ | 611.4 |
|
| | | | | | | | | | | | | | |
| Three months ended September 30, 2016 | | | | | | | | | | | | | |
| Transaction fees | $ | 97.9 |
| | $ | — |
| | $ | 26.6 |
| | $ | — |
| | $ | — |
| | $ | — |
| | $ | 124.5 |
|
| Access fees | 12.8 |
| | — |
| | 0.2 |
| | — |
| | — |
| | — |
| | 13.0 |
|
| Exchange services and other fees | 9.4 |
| | — |
| | 2.0 |
| | — |
| | — |
| | — |
| | 11.4 |
|
| Market data fees | 7.6 |
| | — |
| | 0.7 |
| | — |
| | — |
| | — |
| | 8.3 |
|
| Regulatory fees | 9.1 |
| | — |
| | — |
| | — |
| | — |
| | — |
| | 9.1 |
|
| Other revenue | 2.4 |
| | — |
| | — |
| | — |
| | — |
| | — |
| | 2.4 |
|
| | $ | 139.2 |
| | $ | — |
| | $ | 29.5 |
| | $ | — |
| | $ | — |
| | $ | — |
| | $ | 168.7 |
|
Cboe Global Markets, Inc. and Subsidiaries
Notes to Condensed Consolidated Financial Statements (unaudited)
|
| | | | | | | | | | | | | | | | | | | | | | | | | | | | |
| | | | | | | | | | | | | Corporate | | |
| | | | | U.S. | | | | European | | Global | | Items and | | |
| | | Options | | Equities | | Futures | | Equities | | FX | | Eliminations | | Total |
| Nine months ended September 30, 2017 | | | | | | | | | | | | | | |
| Transaction fees | | $ | 493.7 |
| | $ | 470.5 |
| | $ | 99.3 |
| | $ | 47.0 |
| | $ | 23.1 |
| | $ | — |
| | $ | 1,133.6 |
|
| Access fees | | 40.6 |
| | 29.4 |
| | 1.4 |
| | 4.4 |
| | 1.8 |
| | — |
| | 77.6 |
|
| Exchange services and other fees | | 33.0 |
| | 13.6 |
| | 4.7 |
| | 2.9 |
| | 1.1 |
| | — |
| | 55.3 |
|
| Market data fees | | 30.9 |
| | 78.1 |
| | 1.6 |
| | 6.5 |
| | 0.2 |
| | — |
| | 117.3 |
|
| Regulatory fees | | 41.1 |
| | 164.0 |
| | — |
| | — |
| | — |
| | — |
| | 205.1 |
|
| Other revenue | | 11.7 |
| | 4.2 |
| | 0.7 |
| | 2.4 |
| | — |
| | 0.5 |
| | 19.5 |
|
| | | $ | 651.0 |
| | $ | 759.8 |
| | $ | 107.7 |
| | $ | 63.2 |
| | $ | 26.2 |
| | $ | 0.5 |
| | $ | 1,608.4 |
|
| | | | | | | | | | | | | | | |
| Timing of revenue recognition | | | | | | | | | | | | | | |
| Services transferred at a point in time | | $ | 546.5 |
| | $ | 638.7 |
| | $ | 100.0 |
| | $ | 49.4 |
| | $ | 23.1 |
| | $ | 0.5 |
| | $ | 1,358.2 |
|
| Services transferred over time | | 104.5 |
| | 121.1 |
| | 7.7 |
| | 13.8 |
| | 3.1 |
| | — |
| | 250.2 |
|
| | | $ | 651.0 |
| | $ | 759.8 |
| | $ | 107.7 |
| | $ | 63.2 |
| | $ | 26.2 |
| | $ | 0.5 |
| | $ | 1,608.4 |
|
| | | | | | | | | | | | | | | |
| | | | | | | | | | | | | | | |
| Nine months ended September 30, 2016 | | | | | | | | | | | | | | |
| Transaction fees | | $ | 302.2 |
| | $ | — |
| | $ | 76.1 |
| | $ | — |
| | $ | — |
| | $ | — |
| | $ | 378.3 |
|
| Access fees | | 38.8 |
| | — |
| | 0.6 |
| | — |
| | — |
| | — |
| | 39.4 |
|
| Exchange services and other fees | | 28.3 |
| | — |
| | 5.9 |
| | — |
| | — |
| | — |
| | 34.2 |
|
| Market data fees | | 22.2 |
| | — |
| | 2.3 |
| | — |
| | — |
| | — |
| | 24.5 |
|
| Regulatory fees | | 27.4 |
| | — |
| | — |
| | — |
| | — |
| | — |
| | 27.4 |
|
| Other revenue | | 7.9 |
| | — |
| | 0.6 |
| | — |
| | — |
| | ��� |
| | 8.5 |
|
| | | $ | 426.8 |
| | $ | — |
| | $ | 85.5 |
| | $ | — |
| | $ | — |
| | $ | — |
| | $ | 512.3 |
|
| | | | | | | | | | | | | | | | | | | | | |
| | | | | North | | Europe | | | | | | | | Corporate | | | |
| | | | | American | | and Asia | | | | | Global | | Items and | | | |
| | Options | | Equities | | Pacific | | Futures | | FX | | Eliminations | | Total |
Three Months Ended March 31, 2022 | | | | | | | | | | | | | | | | | | | | | |
Transaction and clearing fees | | $ | 348.3 | | $ | 330.8 | | $ | 50.1 | | $ | 25.8 | | $ | 14.6 | | $ | — | | $ | 769.6 |
Access and capacity fees | | | 35.8 | | | 26.0 | | | 9.3 | | | 4.5 | | | 2.3 | | | — | | | 77.9 |
Market data fees | | | 25.9 | | | 34.2 | | | 8.3 | | | 2.0 | | | 0.3 | | | — | | | 70.7 |
Regulatory fees | | | 10.7 | | | 31.9 | | | — | | | — | | | — | | | — | | | 42.6 |
Other revenue | | | 1.9 | | | 0.8 | | | 10.9 | | | — | | | 0.1 | | | — | | | 13.7 |
| | $ | 422.6 | | $ | 423.7 | | $ | 78.6 | | $ | 32.3 | | $ | 17.3 | | $ | — | | $ | 974.5 |
Timing of revenue recognition | | | | | | | | | | | | | | | | | | | | | |
Services transferred at a point in time | | $ | 360.9 | | $ | 363.5 | | $ | 61.0 | | $ | 25.8 | | $ | 14.7 | | $ | — | | $ | 825.9 |
Services transferred over time | | | 61.7 | | | 60.2 | | | 17.6 | | | 6.5 | | | 2.6 | | | — | | | 148.6 |
| | $ | 422.6 | | $ | 423.7 | | $ | 78.6 | | $ | 32.3 | | $ | 17.3 | | $ | — | | $ | 974.5 |
| | | | | | | | | | | | | | | | | | | | | |
Three Months Ended March 31, 2021 | | | | | | | | | | | | | | | | | | | | | |
Transaction and clearing fees | | $ | 308.7 | | $ | 381.8 | | $ | 34.7 | | $ | 25.6 | | $ | 12.4 | | $ | — | | $ | 763.2 |
Access and capacity fees | | | 29.4 | | | 23.4 | | | 7.1 | | | 4.4 | | | 2.1 | | | — | | | 66.4 |
Market data fees | | | 20.5 | | | 37.5 | | | 4.0 | | | 1.6 | | | 0.2 | | | — | | | 63.8 |
Regulatory fees | | | 19.1 | | | 82.4 | | | — | | | — | | | — | | | — | | | 101.5 |
Other revenue | | | 4.7 | | | 0.9 | | | 10.0 | | | — | | | — | | | 0.3 | | | 15.9 |
| | $ | 382.4 | | $ | 526.0 | | $ | 55.8 | | $ | 31.6 | | $ | 14.7 | | $ | 0.3 | | $ | 1,010.8 |
Timing of revenue recognition | | | | | | | | | | | | | | | | | | | | | |
Services transferred at a point in time | | $ | 332.5 | | $ | 465.1 | | $ | 44.7 | | $ | 25.6 | | $ | 12.4 | | $ | 0.3 | | $ | 880.6 |
Services transferred over time | | | 49.9 | | | 60.9 | | | 11.1 | | | 6.0 | | | 2.3 | | | — | | | 130.2 |
| | $ | 382.4 | | $ | 526.0 | | $ | 55.8 | | $ | 31.6 | | $ | 14.7 | | $ | 0.3 | | $ | 1,010.8 |
Contract liabilities for the nine months ended September 30, 2017as of March 31, 2022 primarily represent prepayments of transaction fees and certain access and capacity and market data fees to the Exchanges. The revenue recognized from contract liabilities and the remaining balance is shown below (in millions):
| | | | | | | | | | | | |
| | Balance at
December 31,
2021 | | Cash
Additions | | Revenue
Recognized | | Balance at
March 31,
2022 |
Liquidity provider sliding scale (1) | | $ | — | | $ | 7.2 | | $ | (1.8) | | $ | 5.4 |
Other, net | | | 15.3 | | | 9.3 | | | (3.5) | | | 21.1 |
Total deferred revenue | | $ | 15.3 | | $ | 16.5 | | $ | (5.3) | | $ | 26.5 |
|
| | | | | | | | | | | | | | | |
| | January 1, 2017 | | Cash Additions | | Revenue Recognition | | September 30, 2017 |
| Liquidity provider sliding scale (1) | $ | — |
| | $ | 12.0 |
| | $ | (9.0 | ) | | $ | 3.0 |
|
| Other, net | 3.1 |
| | 12.9 |
| | (7.6 | ) | | 8.4 |
|
| Total deferred revenue | $ | 3.1 |
| | $ | 24.9 |
| | $ | (16.6 | ) | | $ | 11.4 |
|
(1) | (1) | Liquidity providers are eligible to participate in the sliding scale program, which involves prepayment of transaction fees, and to receive reduced fees based on the achievement of certain volume thresholds within a calendar month. These transaction fees are amortized and recorded ratably as the transactions occur over the period. |
3. ACQUISITIONS
On July 1, 2021, the Company purchased Chi-X Holdings Limited, which was subsequently rebranded to Cboe Asia Pacific. Cboe Asia Pacific is a holding company of alternative market operators and providers of market solutions, which is included in the sliding scale program,Company’s Europe and Asia Pacific segment. The acquisition of Cboe Asia Pacific provided the Company with a single point of entry into 2 key capital markets, Australia and Japan, to help enable it to expand its global equities and market data business into Asia Pacific, bring other products and services to the region, and further expand access to its proprietary product suite in the region. Of the acquisition’s purchase price, $133.6 million was allocated to goodwill, $73.8 million was allocated to intangible assets, $25.7 million was allocated to working capital, and $49.6 million in contingent consideration, which involves prepayment of transaction fees, and to receive reduced feesis earned based on the achievement of certain volume thresholds within a calendar month. These transaction fees are amortized and recorded ratably as the transactions occur over the period.
3. ACQUISITIONS
Bats Global Markets, Inc.
On February 28, 2017, pursuant to the Agreement and Plan of Merger, dated as of September 25, 2016 (the “Merger Agreement”), by and among Cboe, Bats, CBOE Corporation, a Delaware corporation and a wholly-owned subsidiary of Cboe (“Merger Sub”), and Cboe Bats, LLC (formerly CBOE V, LLC), a Delaware limited liability company and a wholly-owned subsidiary of Cboe (“Merger LLC”), Cboe completed the merger of Merger Sub with and into Bats and the subsequent merger of Bats with and into Merger LLC. As a resultdevelopmental milestones of the Merger, Bats became a wholly-owned subsidiary of Cboe.
Cboe Global Markets, Inc. and Subsidiaries
Notes to Condensed Consolidated Financial Statements (unaudited)
The acquisition-date fair value of the consideration transferred totaled $4.0 billion, which consisted of the following (in millions):
|
| | | | |
| Cash | | $ | 955.5 |
|
| Common stock issued | | 2,387.3 |
|
| Equity awards issued | | 37.4 |
|
| | | 3,380.2 |
|
| Debt extinguished | | 580.0 |
|
| Total consideration paid | | $ | 3,960.2 |
|
As a result of the Merger, each share of voting common stock of Bats, par value of $0.01 per share (“Bats Voting Common Stock”), and each share of non-voting common stock of Bats, par value of $0.01 per share (“Bats Non-Voting Common Stock” and, together with the Bats Voting Common Stock, “Bats Common Stock”), issued and outstanding immediately prior to the effective time of the Merger (the “Effective Time”) (other than shares held by Cboe, Bats or any of their respective subsidiaries, shares held by any holder of Bats Common Stock who was entitled to demand and properly demanded appraisal of such shares under Delaware law and unvested restricted shares of Bats Common Stock granted under any Bats equity incentive plan (all such shares described in this parenthetical, “Excluded Shares”)) was converted into, at the election of the holder of such share, either (i) 0.3201 of a share of common stock, par value of $0.01 per share, of Cboe (“Cboe Common Stock”) and $10.00 in cash (the “Mixed Consideration”), (ii) $14.99 in cash and 0.2577 of a share of Cboe Common Stock (the “Cash Election Consideration”) or (iii) 0.4452 of a share of Cboe Common Stock (the “Stock Election Consideration”). Pursuant to the terms of the Merger Agreement, the Cash Election Consideration and Stock Election Consideration payable in the Merger were calculated based on the volume-weighted average price (rounded to four decimal places) of shares of Cboe Common Stock on The Nasdaq Stock Market LLC for the period of ten consecutive trading days ended on February 24, 2017, which was $79.9289. The Cash Election Consideration and the Stock Election Consideration were subject to automatic adjustment, as described in the Merger Agreement and in the definitive joint proxy statement/prospectus dated December 9, 2016, filed by Cboe with the SEC on December 12, 2016, as amended and supplemented from time to time (the “Prospectus”), to ensure that the total amount of cash paid and the total number of shares of Cboe Common Stock issued in the Merger were the same as what would have been paid and issued if all holders of Bats Common Stock received the Mixed Consideration at the Effective Time.
Theacquired business. These amounts
in the table below represent the allocation of the purchase price and are subject to revision during the remainder of the measurement period, a period not to exceed twelve months from the acquisition date.
Adjustments to the provisional values during the measurement period will be recorded in the reporting period in which the adjustment amounts are determined. See below for further discussion of intangible assets acquired.
The following table summarizespresents the estimated fair valuesdetails of theintangible assets acquired and liabilities assumed at the date of acquisition date (in millions):
|
| | | |
| Cash and cash equivalents | $ | 130.1 |
|
| Accounts receivable | 117.8 |
|
| Financial investments | 66.0 |
|
| Property and equipment | 21.8 |
|
| Other assets | 32.8 |
|
| Goodwill | 2,651.0 |
|
| Intangibles | 2,000.0 |
|
| Accounts payable | (33.7 | ) |
| Accrued expenses | (26.2 | ) |
| Section 31 fees payable | (143.6 | ) |
| Income tax payable | (52.9 | ) |
| Deferred tax liability | (720.3 | ) |
| Other liabilities | (82.6 | ) |
| | $ | 3,960.2 |
|
For tax purposes, no tax deductible goodwill was generatedmillions, except as a result of this acquisition. Goodwill was assigned to the Options, U.S. Equities, European Equities, and Global FX segments as further described in Note 9 and is attributable to the expansion of asset classes, broadening of geographic reach, and expected synergies of the combined workforce, products and
Cboe Global Markets, Inc. and Subsidiaries
Notes to Condensed Consolidated Financial Statements (unaudited)
technologies of the Company and Bats. Thestated). All acquired intangible assets
were assignedwith finite lives are amortized using the straight-line method. | | | | | |
| | Cboe
Asia Pacific | | Useful Life (Years) |
Trading registrations and licenses | | $ | 6.2 | | Indefinite |
Customer relationships | | | 60.1 | | 30 |
Technology | | | 7.5 | | 2 |
Total identifiable intangible assets | | $ | 73.8 | | |
Acquisition-related costs relate to the Options, U.S. Equities, European Equities,acquisitions and Global FX segments in the following manner and will be amortized over the following useful lives:
|
| | | | | | | | | | | | | | | | | | |
| | | | | U.S. | | European | | | | Useful life |
| (amounts in millions) | | Options | | Equities | | Equities | | Global FX | | (years) |
| Trading registrations and licenses | | $ | 95.5 |
| | $ | 572.7 |
| | $ | 171.8 |
| | $ | — |
| | indefinite |
| Customer relationships | | 37.1 |
| | 222.9 |
| | 160.0 |
| | 140.0 |
| | 20 |
| Market data customer relationships | | 53.6 |
| | 322.0 |
| | 60.0 |
| | 64.4 |
| | 15 |
| Technology | | 22.5 |
| | 22.5 |
| | 22.5 |
| | 22.5 |
| | 7 |
| Trademarks and trade names | | 1.0 |
| | 6.0 |
| | 1.8 |
| | 1.2 |
| | 2 |
| Goodwill | | 226.4 |
| | 1,738.1 |
| | 419.3 |
| | 267.2 |
| |
|
| | | $ | 436.1 |
| | $ | 2,884.2 |
| | $ | 835.4 |
| | $ | 495.3 |
| |
|
There were no goodwill or intangible assets assigned to the Futures segment as a result of this transaction as Bats did not operate a Futures business and no synergies are attributable to this segment.
The fair value of accounts receivable acquired was $117.8 million. The gross amount of accounts receivable was $118.0 million of which $0.2 million was deemed uncollectable.
other strategic opportunities. The Company expensed $5.5$2.0 million of acquisition-related costs during the three months ended September 30, 2017 that includedMarch 31, 2022, all of which related to professional fees and other expenses. The Company expensed $3.4 million of compensation-relatedacquisition-related costs and $2.1during the three months ended March 31, 2021, which included $2.8 million of professional fees.fees and other expenses and $0.6 million of impairment charges related to investments. These acquisition-related expenses are included in acquisition-related costs in the condensed consolidated statements of income.
The Company expensed $75.4 million of acquisition-related costs during the nine months ended September 30, 2017 that included $36.9 million of compensation-related costs, $22.7 million of professional fees, $14.9 million of an impairment of capitalized data processing software, and $0.9 million of facilities expenses. These expenses are included in acquisition-related costs in the condensed consolidated statements of income.
The amounts of revenue, operating income and net income of Bats are included in the Company’s condensed consolidated statements of income from the acquisition date to the three and nine months ended September 30, 2017 and are as follows (in millions):
|
| | | | | | | | |
| | | | | |
| | | Three Months Ended September 30, | | Nine Months Ended September 30, |
| | 2017 | | 2017 |
| Revenue | | $ | 411.6 |
| | $ | 1,017.4 |
|
| Operating income | | 27.1 |
| | 53.7 |
|
| Net income | | 15.7 |
| | 33.7 |
|
The financial information in the table below summarizes the combined results of operations of the Company and Bats, on a pro forma basis, as though the companies had been combined as of January 1, 2016. The pro forma financial information is presented for informational purposes only and is not indicative of the results of operations that would have been achieved if the acquisition had taken place at the beginning of the period presented. Such pro forma financial information is based on the historical financial statements of the Company and Bats. This pro forma financial information is based on estimates and assumptions that have been made solely for purposes of developing such pro forma information, including, without limitation, preliminary purchase accounting adjustments. The pro forma financial information does not reflect any synergies or operating cost reductions that may be achieved from the combined operations. The pro forma financial information combines the historical results for the Company and Bats for the three months ended September 30, 2016 and nine months ended September 30, 2017 and 2016 in the following table (in millions, except per share amounts):
Cboe Global Markets, Inc. and Subsidiaries
Notes to Condensed Consolidated Financial Statements (unaudited)
|
| | | | | | | | | | |
| | Three Months Ended September 30, | Nine Months Ended September 30, |
| | 2016 | 2017 | | 2016 |
| Revenue | $ | 610.3 |
| $ | 1,881.3 |
| | $ | 1,930.9 |
|
| Operating income | 98.2 |
| 354.2 |
| | 306.1 |
|
| Net income allocated to common stockholders | 52.6 |
| 201.3 |
| | 170.1 |
|
| Earnings per share: | | | | |
| Basic | $ | 0.47 |
| $ | 1.79 |
| | $ | 1.51 |
|
| Diluted | $ | 0.47 |
| $ | 1.79 |
| | $ | 1.51 |
|
The supplemental 2017 and 2016 pro forma amounts have been calculated after applying the Company's accounting policies and adjusting the results to reflect the additional amortization that would have been charged assuming the adjusted fair values of acquired intangible assets had been applied on January 1, 2017 and on January 1, 2016. The supplemental 2017 pro forma financial information includes pro forma adjustments of $61.7 million for acquisition-related costs, such as fees to investment bankers, attorneys, accountants and other professional advisors, as well as severance to employees.
Subsequent to the Bats acquisition, the Company determined that certain employees' positions were redundant. As such, the Company communicated employee termination benefits to these employees.
The following is a summary of the employee termination benefits recognized within acquisition costs in the Corporate Items and Eliminations unit in the condensed consolidated statements of income (in millions):
|
| | | |
| | Employee Termination Benefits |
| Balance at December 31, 2016 | $ | 0.4 |
|
| Termination benefits accrued | 20.7 |
|
| Termination payments made | (19.7 | ) |
| Balance at September 30, 2017 | $ | 1.4 |
|
Cboe Global Markets, Inc. and Subsidiaries
Notes to Condensed Consolidated Financial Statements (unaudited)
5. INVESTMENTS
As of September 30, 2017March 31, 2022 and December 31, 2016,2021, the Company'sCompany’s investments were comprised of the following (in millions):
|
| | | | | | | |
| | September 30, 2017 | | December 31, 2016 |
| Equity Method: | | | |
| Investment in Signal Trading Systems, LLC | $ | 13.4 |
| | $ | 12.4 |
|
| Investment in EuroCCP | 9.2 |
| | — |
|
| Total equity method investments | 22.6 |
| | 12.4 |
|
| | | | |
| Cost Method: | | | |
| Investment in OCC | 30.3 |
| | 30.3 |
|
| Other cost method investments | 30.3 |
| | 30.2 |
|
| Total cost method investments | 60.6 |
| | 60.5 |
|
| | | | |
| Total Investments | $ | 83.2 |
| | $ | 72.9 |
|
| | | | | | |
| | March 31, | | December 31, |
| | 2022 | | 2021 |
Equity method investments: | | | | | | |
Investment in 7Ridge Investments 3 LP | | $ | 208.2 | | $ | 209.5 |
Total equity method investments | | | 208.2 | | | 209.5 |
| | | | | | |
Other equity investments: | | | | | | |
Investment in Eris Exchange Holdings, LLC | | | 20.0 | | | 20.0 |
Investment in American Financial Exchange, LLC | | | 10.6 | | | 10.6 |
Investment in Cboe Vest Financial Group, Inc. | | | 2.9 | | | 2.9 |
Investment in Eris Digital Holdings, LLC | | | 1.1 | | | 1.1 |
Investment in OCC | | | 0.3 | | | 0.3 |
Other equity investments | | | 1.4 | | | 1.4 |
Total other equity investments | | | 36.3 | | | 36.3 |
| | | | | | |
Total investments | | $ | 244.5 | | $ | 245.8 |
Equity Method
Equity InvestmentsThe Company’s investment in 7Ridge Investments 3 LP (“7Ridge Fund”), accounted for under the equity method investments include investments in Signal Trading Systems, LLC ("Signal"of accounting, represents a nonconsolidated variable interest entity (“VIE”). The Company has determined that consolidation of the VIE is not required as the Company is not the primary beneficiary of the 7Ridge Fund, as it does not have controlling financial interest and EuroCCP, a Dutch domiciled clearing house. EuroCCP is one of three interoperable central counterparties,lacks the ability to unilaterally remove the general partner, 7Ridge Investments 3 GP Limited, direct material strategic decisions, or CCPs, used to clear trades conducted on Cboe Europe Equities' markets. Cboe Europe Equities owns 20% of EuroCCP and can exercise significant influence overdissolve the entity (i.e., the Company does not have unilateral substantive “kick-out” or “liquidation” rights).
The Company’s interest in the 7Ridge Fund is equal to the carrying value of the investment as an equal shareholder with four other investors.
Cost Method
of March 31, 2022, or $208.2 million, which includes periodic capital contributions to the 7Ridge Fund, as well as the Company’s share of 7Ridge Fund’s profit or loss, including gains or losses arising from the fair value measurement of the investment(s) held by the 7Ridge Fund, booked against the investment account. The carrying
amountvalue of
cost methodthe investment is included in investments
totaled $60.6 million aswithin the condensed consolidated balance sheets. The Company’s maximum loss exposure, in the unlikely event that all of
September 30, 2017 and $60.5 million asthe VIE’s assets become worthless, is limited to the carrying value of
December 31, 2016, andCompany’s investment.Other Equity Investments
The carrying value of other equity investments is included in investments in the condensed consolidated balance sheets. The Company accounts for these investments using the cost-methodmeasurement alternative given the absence of accounting primarily as a resultreadily
determinable fair values for the Company'srespective investments and due to the Company’s inability to exercise significant influence asover the Company is a smaller shareholder of these investments.investments based upon the respective ownership interests held. As of September 30, 2017, cost methodMarch 31, 2022, other equity investments primarily reflect a 20% investment in OCC and minority investments in Eris Exchange Holdings, LLC, American Financial Exchange, CurveGlobalLLC, and Cboe Vest Financial Group, Inc.
As announced on October 20, 2021, the Company plans to acquire the remaining interest in Eris Digital Holdings, LLC. However, Eris Exchange Holdings, LLC is not a part of this transaction and the Company retains its minority equity ownership interest in Eris Exchange Holdings, LLC.
In December 2014, OCC announced a newly-formed capital plan. The OCC capital plan was designed to strengthen OCC's capital base and facilitate its compliance with proposed SEC regulations for Systemically Important Financial Market Utilities ("SIFMUs") as well as international standards applicable to financial market infrastructures. On February 26, 2015, the SEC issued a notice of no objection to OCC's advance notice filing regarding the capital plan, and OCC and OCC's existing exchange stockholders, which include Cboe Options, subsequently executed agreements effecting the capital plan. Under the plan, each of OCC's existing exchange stockholders agreed to contribute its pro-rata share, based on ownership percentage, of $150 million in equity capital, which would increase OCC's shareholders' equity, and to provide its pro rata share in replenishment capital, up to a maximum of $40 million per exchange stockholder, if certain capital thresholds are breached. OCC also adopted policies under the plan with respect to fees, customer refunds, and stockholder dividends, which envision an annual dividend payment to the exchange stockholders equal to the portion of OCC's after-tax income that exceeds OCC's capital requirements after payment of refunds to OCC's clearing members (with such customer refunds generally to constitute 50%closing of the portiontransaction is subject to customary closing conditions. As a result, the timing of OCC's pre-tax income that exceeds OCC's capital requirements). On March 3, 2015, in accordance with the plan, Cboe Options contributed $30 million to OCC. That contribution has been recorded under investmentsclosing is uncertain, but the Company presently anticipates a closing in the condensed consolidated balance sheets assecond quarter of September 30, 2017.
On March 6, 2015, OCC informed Cboe Options that the SEC, acting though delegated authority, had approved OCC's proposed rule filing2022. See Item 2 (“Management’s Discussion and Analysis of Financial Condition and Results of Operations”) for the capital plan. Following petitions to review the approval based on delegated authority, the SEC conducted its own review and then approved the proposed rule change implementing OCC's capital plan. Certain petitioners subsequently appealed the SEC approval order for the OCC capital plan to the U.S. Court of Appeals for the D.C. Circuit and moved to stay the SEC approval order. On February 23, 2016, the Court denied the petitioners' motion to stay. On August 8,
Cboe Global Markets, Inc. and Subsidiaries
Notes to Condensed Consolidated Financial Statements (unaudited)
2017, the Court held that the SEC’s approval order lacked reasoned decision-making sufficient to support the SEC’s conclusion that the OCC capital plan complied with applicable statutory requirements. The Court declined to vacate the SEC’s approval order or to require the unwinding of actions taken under the OCC capital plan, but instead remanded the matter to the SEC for further proceedings concerning whether that capital plan complies with those statutory requirements. Petitioners requested a stay of dividend payments to the exchange stockholders until the SEC made a final decision about the OCC capital plan, but the SEC denied that request on September 14, 2017. On that date, the SEC also established a schedule for interested parties to provide information for the SEC’s consideration on the merits of the proposed capital plan, and that schedule presently calls for the last submissions to be made by November 13, 2017.
6. FINANCIAL INVESTMENTS
The Company’s financial investments with original or acquired maturities longer than three months, but that mature in less than one year from the condensed consolidated balance sheet date and any money market funds that are considered cash and cash equivalents are classified as current assets and are summarized as follows (in millions):
|
| | | | | | | | | | | | |
| | September 30, 2017 |
| Cost basis | Unrealized gains | Unrealized losses | Fair value |
| Trading securities: | | | | |
| U.S. Treasury securities | $ | 0.5 |
| $ | — |
| $ | — |
| $ | 0.5 |
|
| Other securities | 1.9 |
| — |
| — |
| 1.9 |
|
| Money market funds | 1.5 |
| — |
| — |
| 1.5 |
|
| Total | $ | 3.9 |
| $ | — |
| $ | — |
| $ | 3.9 |
|
|
| | | | | | | | | | | | |
| | December 31, 2016 |
| Cost basis | Unrealized gains | Unrealized losses | Fair value |
| Money market funds | $ | 67.5 |
| $ | — |
| $ | — |
| $ | 67.5 |
|
| Total | $ | 67.5 |
| $ | — |
| $ | — |
| $ | 67.5 |
|
7.5. PROPERTY AND EQUIPMENT, NET
Property and equipment, net consisted of the following as of September 30, 2017March 31, 2022 and December 31, 20162021 (in millions):
|
| | | | | | | | |
| | | September 30, | | December 31, |
| | 2017 | | 2016 |
| Construction in progress | | $ | 11.5 |
| | $ | 0.2 |
|
| Building | | 77.4 |
| | 77.0 |
|
| Furniture and equipment | | 168.2 |
| | 138.8 |
|
| Total property and equipment | | 257.1 |
| | 216.0 |
|
| Less accumulated depreciation | | (179.9 | ) | | (160.1 | ) |
| Total property and equipment, net | | $ | 77.2 |
| | $ | 55.9 |
|
| | | | | | |
| | March 31, | | December 31, |
| | 2022 | | 2021 |
Construction in progress | | $ | 17.7 | | $ | 17.3 |
Building | | | 68.8 | | | 68.8 |
Furniture and equipment | | | 261.4 | | | 256.5 |
Total property and equipment | | | 347.9 | | | 342.6 |
Less accumulated depreciation | | | (241.2) | | | (237.4) |
Total property and equipment, net | | $ | 106.7 | | $ | 105.2 |
Depreciation expense using the straight-line method was $7.9$8.6 million and $6.0$7.4 million for the three months ended September 30, 2017March 31, 2022 and 2016, respectively,2021, respectively.
As a result of the Merger, there was a reduction in employee workspace needed in Chicago, which led to the decision to market for sale the former headquarters location. The Company classified the associated land, building, and $23.2certain furniture and equipment of the former headquarters location as held for sale, performed an impairment assessment, and ceased depreciation effective May 1, 2019, as the Company anticipated selling the property held for sale in less than twelve months. As of March 31, 2022, the former headquarters location remains on the market for sale and management’s intent to sell the property is unchanged. However, due to the time elapsed since active marketing for sale of the building commenced, the Company has reclassified the property to held and used, effective May 1, 2021, and the building was once again subject to depreciation. The total value of the property classified as property held and used was $11.2 million, which includes $2.3 million of land and $17.9$8.9 million of property and equipment, net on the condensed consolidated balance sheet as of March 31, 2022.
6. CREDIT LOSSES
Current expected credit losses are estimated for accounts receivable and certain notes receivable. The notes receivable included within other assets, net on the ninecondensed consolidated balance sheets primarily relate to the consolidated audit trail (“CAT”), which involves the creation of an audit trail that strives to enhance regulators’ ability to monitor trading activity in the U.S. markets through a phased implementation. The funding of the CAT is ultimately expected to be provided by both self-regulatory organizations (“SROs”) (which includes the Exchanges) and industry members; however, the funding to date has solely been provided by the SROs in exchange for promissory notes, which are expected to be repaid once fee filings and plan amendments associated with a funding model are approved by the SEC and such industry member fees are collected. Until those fees are collected, the SROs may continue to incur additional significant costs, including additional promissory notes to fund CAT operations. The allowance for notes receivable credit losses associated with the CAT is calculated using a probability of default methodology that is primarily based on various potential outcomes of the funding model proposals being discussed with the SEC. Accounts receivable represent amounts due from the Company’s member firms. The allowance for accounts receivable credit losses is calculated using an aging schedule.
The following represents the changes in allowance for credit losses during the three months ended September 30, 2017 and 2016, respectively.
Cboe Global Markets, Inc. and Subsidiaries
Notes to Condensed Consolidated Financial Statements (unaudited)
8.March 31, 2022 (in millions): | | | | | | | | | | | | | | | |
| | Balance at
December 31,
2021 | | Current period provision for expected credit losses | | Write-offs charged against the allowance | | Recoveries collected | | Balance at
March 31,
2022 |
Allowance for notes receivable credit losses | | $ | 30.1 | | $ | — | | $ | — | | $ | — | | $ | 30.1 |
Allowance for accounts receivable credit losses | | | 1.0 | | | 0.2 | | | — | | | (0.3) | | | 0.9 |
Total allowance for credit losses | | $ | 31.1 | | $ | 0.2 | | $ | — | | $ | (0.3) | | $ | 31.0 |
7. OTHER ASSETS, NET
Other assets, net consisted of the following as of September 30, 2017March 31, 2022 and December 31, 20162021 (in millions):
| | | | | | |
| | March 31, | | December 31, |
| | 2022 | | 2021 |
Software development work in progress | | $ | 3.7 | | $ | 5.6 |
Data processing software | | | 106.3 | | | 103.8 |
Less accumulated depreciation and amortization | | | (72.8) | | | (70.9) |
Data processing software, net | | | 37.2 | | | 38.5 |
Other assets (1) | | | 103.0 | | | 87.3 |
Total other assets, net | | $ | 140.2 | | $ | 125.8 |
| (1) | At March 31, 2022 and December 31, 2021, the majority of the balance included notes receivable and long-term prepaid assets. See Note 6 (“Credit Losses”) for more information on the notes receivable included within other assets, net on the condensed consolidated balance sheets. As of March 31, 2022 and December 31, 2021, the notes receivable, net balance was $95.1 million and $79.3 million, respectively. |
|
| | | | | | | |
| | September 30, | | December 31, |
| | 2017 | | 2016 |
| Software development work in progress | $ | 5.9 |
| | $ | 12.3 |
|
| Data processing software | 217.0 |
| | 222.6 |
|
| Less accumulated depreciation | (184.9 | ) | | (172.0 | ) |
| Data processing software, net | 38.0 |
| | 62.9 |
|
| | | | |
| Other assets (1) | 14.0 |
| | 9.8 |
|
| Data processing software and other assets, net | $ | 52.0 |
| | $ | 72.7 |
|
(1) At December 31, 2016, other assets included $6.2 million of deferred financing costs and $3.5 million of deferred tax assets. The deferred financing costs were reclassified in 2017 and recorded as a reduction of long-term debt. At September 30, 2017, the majority of the balance included long-term prepaid assets and notes receivable.
Amortization expense related to data processing software was $4.9$1.7 million and $3.7$1.7 million for the three months ended September 30, 2017March 31, 2022 and 2016, respectively, and $13.2 million and $15.1 million for the nine months ended September 30, 2017 and 2016,2021, respectively.
9.8. GOODWILL AND INTANGIBLE ASSETS, NET
The following table presents the details of goodwill by segment (in millions):
|
| | | | | | | | | | | | | | | | | | | | | | | | |
| | | | | U.S. | | European | | Global | | Corporate Items | | |
| | | Options | | Equities | | Equities | | FX | | and Eliminations | | Total |
| Balance as of December 31, 2016 | | $ | 7.7 |
| | $ | — |
| | $ | — |
| | $ | — |
| | $ | 18.8 |
| | $ | 26.5 |
|
| Additions | | 226.4 |
| | 1,738.1 |
| | 419.3 |
| | 267.2 |
| | — |
| | 2,651.0 |
|
| Dispositions | | (1.4 | ) | | — |
| | — |
| | — |
| | — |
| | (1.4 | ) |
| Changes in foreign currency exchange rates | | — |
| | — |
| | 20.2 |
| | — |
| | — |
| | 20.2 |
|
| Balance as of September 30, 2017 | | $ | 232.7 |
| | $ | 1,738.1 |
| | $ | 439.5 |
| | $ | 267.2 |
| | $ | 18.8 |
| | $ | 2,696.3 |
|
| | | | | | | | | | | | | | | |
| | | | North American | | Europe and | | | | | | |
| | Options | | Equities | | Asia Pacific | | Global FX | | Total |
Balance as of December 31, 2021 | | $ | 305.8 | | $ | 1,876.9 | | $ | 575.5 | | $ | 267.2 | | $ | 3,025.4 |
Changes in foreign currency exchange rates | | | — | | | 0.6 | | | (7.9) | | | — | | | (7.3) |
Balance as of March 31, 2022 | | $ | 305.8 | | $ | 1,877.5 | | $ | 567.6 | | $ | 267.2 | | $ | 3,018.1 |
Goodwill has been allocated to specific reporting units for purposes of impairment testing - Options, U.S.North American Equities, European EquitiesEurope and Asia Pacific, and Global FX. NoNaN goodwill has been allocated to Futures. Goodwill impairment testing is performed annually in the fiscal fourth quarter or more frequently if conditions exist that indicate that the asset may be impaired. The allocation
The following table presents the details of the intangible assets (in millions):
|
| | | | | | | | | | | | | | | | | | | | | | | | |
| | | | | U.S. | | European | | Global | | Corporate Items | | |
| | | Options | | Equities | | Equities | | FX | | and Eliminations | | Total |
| Balance as of December 31, 2016 | | $ | 2.0 |
| | $ | — |
| | $ | — |
| | $ | — |
| | $ | 6.7 |
| | $ | 8.7 |
|
| Additions | | 209.7 |
| | 1,146.1 |
| | 416.1 |
| | 228.1 |
| | — |
| | 2,000.0 |
|
| Dispositions | | (0.2 | ) | | — |
| | — |
| | — |
| | — |
| | (0.2 | ) |
| Amortization | | (10.5 | ) | | (52.0 | ) | | (16.5 | ) | | (20.0 | ) | | (0.9 | ) | | (99.9 | ) |
| Changes in foreign currency exchange rates | | — |
| | — |
| | 31.6 |
| | — |
| | — |
| | 31.6 |
|
| Balance as of September 30, 2017 | | $ | 201.0 |
| | $ | 1,094.1 |
| | $ | 431.2 |
| | $ | 208.1 |
| | $ | 5.8 |
| | $ | 1,940.2 |
|
| | | | | | | | | | | | | | | |
| | | | North American | | Europe and | | | | | | |
| | Options | | Equities | | Asia Pacific | | Global FX | | Total |
Balance as of December 31, 2021 | | $ | 159.1 | | $ | 991.4 | | $ | 426.4 | | $ | 91.7 | | $ | 1,668.6 |
Amortization | | | (3.4) | | | (15.2) | | | (6.9) | | | (5.1) | | | (30.6) |
Changes in foreign currency exchange rates | | | — | | | 0.5 | | | (9.9) | | | — | | | (9.4) |
Balance as of March 31, 2022 | | $ | 155.7 | | $ | 976.7 | | $ | 409.6 | | $ | 86.6 | | $ | 1,628.6 |
For the three months ended September 30, 2017March 31, 2022 and 2016,2021, amortization expense was $42.8$30.6 million and $0.4 million, respectively. For the nine months ended September 30, 2017 and 2016, amortization expense was $99.9 million and $1.3
Cboe Global Markets, Inc. and Subsidiaries
Notes to Condensed Consolidated Financial Statements (unaudited)
$32.9 million, respectively. The estimated future amortization expense is $42.4$85.2 million for the remainder of 2017, $158.12022, $102.5 million for 2018, $137.22023, $79.1 million for 2019, $120.82024, $68.6 million for 2020, $105.62025, and $61.2 million for 2021 and $93.4 million for 2022.
The amounts in the table below represent the preliminary allocation of the purchase price and are subject to revision during the remainder of the measurement period, a period not to exceed 12 months from the acquisition date. Adjustments to the provisional values during the measurement period will be recorded in the reporting period in which the adjustment amounts are determined.
2026.The following tables present the categories of intangible assets as of September 30, 2017March 31, 2022 and December 31, 20162021 (in millions)millions, except as stated):
|
| | | | | | | | | | | | | | | | | | | | | | |
| | | | | | | | | | | | | Remaining |
| | | September 30, 2017 | | Weighted Average |
| | | | | U.S. | | European | | | | Corporate Items | | Amortization |
| | | Options | | Equities | | Equities | | Global FX | | and Eliminations | | Period (in years) |
| Trading registrations and licenses | | $ | 95.5 |
| | $ | 572.7 |
| | $ | 185.1 |
| | $ | — |
| | $ | — |
| | Indefinite |
| Customer relationships | | 37.9 |
| | 222.9 |
| | 172.4 |
| | 140.0 |
| | 3.0 |
| | 19 |
| Market data customer relationships | | 53.6 |
| | 322.0 |
| | 64.6 |
| | 64.4 |
| | — |
| | 14 |
| Technology | | 23.4 |
| | 22.5 |
| | 24.2 |
| | 22.5 |
| | 4.0 |
| | 6 |
| Trademarks and tradenames | | 1.4 |
| | 6.0 |
| | 1.9 |
| | 1.2 |
| | 1.0 |
| | 2 |
| Other | | 0.2 |
| | — |
| | — |
| | — |
| | — |
| | 2 |
| Accumulated amortization | | (11.0 | ) | | (52.0 | ) | | (17.0 | ) | | (20.0 | ) | | (2.2 | ) | |
|
| | | $ | 201.0 |
| | $ | 1,094.1 |
| | $ | 431.2 |
| | $ | 208.1 |
| | $ | 5.8 |
| | |
|
| | | | | | | | | | | | | | | | | | | | | | |
| | | | | | | | | | | | | Remaining |
| | | December 31, 2016 | | Weighted Average |
| | |
| | U.S. | | European | | | | Corporate | | Amortization |
| | | Options | | Equities | | Equities | | Global FX | | and Other | | Period (in years) |
| Trading registrations and licenses | | $ | — |
| | $ | — |
| | $ | — |
| | $ | — |
| | $ | — |
| | — |
| Customer relationships | | 0.9 |
| | — |
| | — |
| | — |
| | 3.0 |
| | 9 |
| Market data customer relationships | | — |
| | — |
| | — |
| | — |
| | — |
| | — |
| Technology | | 1.1 |
| | — |
| | — |
| | — |
| | 4.0 |
| | 4 |
| Trademarks and tradenames | | 0.4 |
| | — |
| | — |
| | — |
| | 1.0 |
| | 6 |
| Other | | 0.2 |
| | — |
| | — |
| | — |
| | — |
| | 2 |
| Accumulated amortization | | (0.6 | ) | | — |
| | — |
| | — |
| | (1.3 | ) | | |
| | | $ | 2.0 |
| | $ | — |
| | $ | — |
| | $ | — |
| | $ | 6.7 |
| | |
| | | | | | | | | | | | | | |
| | | | | | | | | | | | | | |
| | March 31, 2022 | | Weighted |
| | | | | North | | Europe | | | | | Average |
| | | | American | | and Asia | | | | | Amortization |
| | Options | | Equities | | Pacific | | Global FX | | Period (in years) |
Trading registrations and licenses | | $ | 95.5 | | $ | 592.4 | | $ | 215.3 | | $ | — | | Indefinite |
Customer relationships | | | 46.6 | | | 378.6 | | | 227.1 | | | 140.0 | | 17 |
Market data customer relationships | | | 53.6 | | | 322.0 | | | 63.4 | | | 64.4 | | 10 |
Technology | | | 28.1 | | | 41.1 | | | 34.8 | | | 22.5 | | 4 |
Trademarks and tradenames | | | 12.8 | | | 7.8 | | | 2.5 | | | 1.2 | | 8 |
Accumulated amortization | | | (80.9) | | | (365.2) | | | (133.5) | | | (141.5) | | |
| | $ | 155.7 | | $ | 976.7 | | $ | 409.6 | | $ | 86.6 | | |
| | | | | | | | | | | | | | |
| | | | | | | | | | | | | | |
| | December 31, 2021 | | Weighted |
| | | | | North | | Europe | | | | | Average |
| | | | American | | and Asia | | | | | Amortization |
| | Options | | Equities | | Pacific | | Global FX | | Period (in years) |
Trading registrations and licenses | | $ | 95.5 | | $ | 592.0 | | $ | 221.1 | | $ | — | | Indefinite |
Customer relationships | | | 46.6 | | | 378.3 | | | 232.3 | | | 140.0 | | 17 |
Market data customer relationships | | | 53.6 | | | 322.0 | | | 65.2 | | | 64.4 | | 10 |
Technology | | | 28.1 | | | 41.1 | | | 35.6 | | | 22.5 | | 5 |
Trademarks and tradenames | | | 12.9 | | | 7.8 | | | 2.5 | | | 1.2 | | 8 |
Accumulated amortization | | | (77.6) | | | (349.8) | | | (130.3) | | | (136.4) | | |
| | $ | 159.1 | | $ | 991.4 | | $ | 426.4 | | $ | 91.7 | | |
Cboe Global Markets, Inc. and Subsidiaries
Notes to Condensed Consolidated Financial Statements (unaudited)
10.9. ACCOUNTS PAYABLE AND ACCRUED LIABILITIES
Accounts payable and accrued liabilities consisted of the following as of September 30, 2017March 31, 2022 and December 31, 20162021 (in millions):
| | | | | | |
| | March 31, | | December 31, |
| | 2022 | | 2021 |
Compensation and benefit-related liabilities | | $ | 27.7 | | $ | 68.6 |
Royalties | | | 25.4 | | | 23.0 |
Current unrecognized tax benefits | | | 90.9 | | | — |
Accrued liabilities | | | 73.9 | | | 73.3 |
Rebates payable | | | 132.0 | | | 95.3 |
Marketing fee payable | | | 16.0 | | | 15.7 |
Accounts payable | | | 21.2 | | | 19.5 |
Total accounts payable and accrued liabilities | | $ | 387.1 | | $ | 295.4 |
|
| | | | | | | |
| | September 30, 2017 | | December 31, 2016 |
| |
| Compensation and benefit-related liabilities | $ | 13.9 |
| | $ | 25.1 |
|
| Termination benefits | 1.4 |
| | 0.4 |
|
| Royalties | 19.7 |
| | 17.8 |
|
| Accrued liabilities | 58.4 |
| | 25.4 |
|
| Marketing fee payable | 8.1 |
| | 7.2 |
|
| Accounts payable | 38.9 |
| | 6.5 |
|
| Total accounts payable and accrued liabilities | $ | 140.4 |
| | $ | 82.4 |
|
The Company's long-termCompany’s debt consisted of the following as of September 30, 2017March 31, 2022 and December 31, 20162021 (in millions):
| | | | | | |
| | March 31, | | December 31, |
| | 2022 | | 2021 |
Term Loan Agreement due December 2023, floating rate | | $ | 159.5 | | $ | 159.5 |
$300 million fixed rate Senior Notes due March 2032, stated rate of 3.000% | | | 295.8 | | | — |
$500 million fixed rate Senior Notes due December 2030, stated rate of 1.625% | | | 493.5 | | | 493.3 |
$650 million fixed rate Senior Notes due January 2027, stated rate of 3.650% | | | 646.7 | | | 646.5 |
Revolving Credit Agreement (1) | | | (1.9) | | | — |
EuroCCP Credit Facility | | | — | | | — |
Total debt | | $ | 1,593.6 | | $ | 1,299.3 |
|
| | | | | | | | |
| | | September 30, | | December 31, |
| | | 2017 | | 2016 |
| Term Loan Agreement | | $ | 369.6 |
| | $ | — |
|
| 3.650% Senior Notes | | 643.8 |
| | — |
|
| 1.950% Senior Notes | | 299.0 |
| | — |
|
| Revolving Credit Agreement | | — |
| | — |
|
| Total long-term debt | | $ | 1,312.4 |
| | $ | — |
|
In connection with the Merger,(1) | As of March 31, 2022 there was 0 balance drawn from the Revolving Credit Facility. The above represents the debt issuance costs related to the amendment of the Revolving Credit Agreement as defined below. |
As described below in further detail, on December 15, 2016,February 25, 2022, the Company entered intoamended the Revolving Credit Agreement (as defined below) to allow for an additional $150 million borrowing, on March 16, 2022, the Company issued $300 million, in aggregate principal amount, of the Company’s fixed rate Senior Notes due March 2032, in order to fund anticipated acquisitions, and on March 29, 2022, the Company amended the Term Loan Agreement (as defined below) providingto allow for a $1.0 billion senior unsecured delayed draw term loan facility and on January 12, 2017,additional draws of up to $400 million in the Company issued $650 million aggregate principal amount of 3.650% Senior Notes due 2027 ("3.650% Senior Notes"). The proceeds from this delayed draw term loan facility and issuance of our senior notes, in addition to using cash on hand at Cboe and Bats, were used to finance a portion of the cash component of the Merger consideration, to refinance existing indebtedness of Bats and its subsidiaries and to pay related fees and expenses. In addition, on December 15, 2016, the Company entered into a $150 million
revolving credit facility to be used for working capital and other general corporate purposes.
On June 29, 2017, Cboe refinanced approximately $300 million of the amounts outstanding under the aggregate.Term Loan Agreement through the issuance of $300 million in aggregate principal amount of 1.950% Senior Notes due 2019 ("1.950% Senior Notes" and, together with the 3.650% Senior Notes, the "Notes").
Term Loan Agreement
On December 15, 2016,March 22, 2018, the Company, as borrower, entered into a Term Loan Credit Agreement (the “Term Loan Agreement”) with Bank of America, N.A. (“Bank of America”), as administrative agent certain lenders named therein (the “Term Lenders”), Merrill Lynch, Pierce, Fenner & Smith Incorporated,and initial lender, and the several banks and other financial institutions from time to time party thereto as lenders. Bank of America also acted as sole lead arranger and sole bookrunner Morgan Stanley MUFGwith respect to the Term Loan Partners, LLC, as syndication agent, and Citibank, N.A., PNC Bank, National Association and JPMorgan Chase Bank, N.A., as co-documentation agents.Agreement. The Term Loan Agreement provided for a senior unsecured delayed draw term loan facility (the “Term Loan Facility”) in an aggregate principal amount of $1.0 billion.
Cboe Global Markets, Inc. and Subsidiaries
Notes$300 million. The proceeds of the loan under the Term Loan Agreement were used to Condensed Consolidated Financial Statements (unaudited)
repay the $300 million of outstanding indebtedness under the prior term loan agreement entered into on December 15, 2016.Loans under the Term Loan Agreement bear interest, at ourthe Company’s option, at either (i) the London Interbank Offered Rate (“LIBOR”) periodically fixed for an interest period (as selected by us)the Company) of one, two, three or six months plus a margin (based on ourthe Company’s public debt ratings) ranging from 1.00 percent per annum to 1.751.50 percent per annum or (ii) a daily floating rate based on the agent’s prime rate (subject to certain minimums based upon the federal funds effective rate or LIBOR) plus a margin (based on ourthe Company’s public debt ratings) ranging from zero0 percent per annum to 0.750.50 percent per annum. The Company was required to pay a tickingan up-front fee of 0.05 percent to the agent for the account of the Term Lenders which initially accrued at a rate (based on our public debt ratings) ranging from 0.10 percent per annum to 0.30 percent per annum multiplied by the undrawn aggregate commitments of the Term Lenders in respect ofentry into the Term Loan Facility, accruing duringAgreement.
On May 29, 2020, the Company amended the Term Loan Agreement to, among other items, (i) permit liens on assets of the EuroCCP settlement and clearing business that secures indebtedness incurred in support of its settlement and clearing activities, and permit the Company’s subsidiaries to incur such indebtedness, provided that such amounts are repaid within 35 days; and (ii) provide that LIBOR, as used in the Term Loan Agreement, may be succeeded by one or more secured overnight financing rates (“SOFR”) published by the Federal Reserve Bank of New York or another alternate benchmark rate giving due consideration to any evolving or then-existing convention for similar agreements.
On June 25, 2021, the Company further amended the Term Loan Agreement to, among other items, (i) extend the maturity date from December 15, 2021 to December 15, 2023; (ii) allow for an additional draw of $110 million, which the Company borrowed on June 25, 2021 in order to fund a portion of the previously announced acquisition of Cboe Asia Pacific; (iii) modify the applicable margin paid on the loans to 65 basis points regardless of the Company’s debt rating; (iv) add LIBOR replacement provisions, generally transitioning to a hardwired approach based on SOFR, with certain adjustments as further described in the amendment; (v) increase the amount of indebtedness certain subsidiaries may incur from the greater of $250 million and 35 percent consolidated EBITDA for four consecutive quarters to the greater of $350 million and 35 percent consolidated EBITDA for four consecutive quarters; (vi) allow the Company to increase the
maximum permitted consolidated leverage ratio to 4.00 to 1.00 (from 3.50 to 1.00) for four consecutive fiscal quarters following certain acquisitions, provided this increase may be made only once; and (vii) modify certain other provisions to be consistent with the Company’s Revolving Credit Agreement (as defined below).
On March 29, 2022, the Company further amended the Term Loan Agreement to, among other items, (i) allow for additional delayed draws of up to $400 million in the aggregate by the earliest of: (1) September 30, 2022, (2) the date of termination of the commitments of all of the lenders and (3) the date of termination of the commitment of each lender to make loans pursuant to an event of default; provided that this borrowing period commencingshall end immediately upon the funding of the fifth borrowing of committed loans; (ii) adds a commitment fee based on the Company’s public debt ratings that will accrue until the expiration of the borrowing period; (iii) replaces LIBOR as the applicable reference rate with SOFR; and (iv) allows the company to increase the maximum permitted consolidated leverage ratio to 4.25 to 1.00 or 4.00 to 1.00 (from 3.50 to 1.00) for four consecutive fiscal quarters following certain acquisitions, provided this increase may be made only once and at the time it exercises such financial covenant step-up, the Company shall be exercising a like step-up under its revolving credit facility.
The Term Loan Agreement, which matures on December 15, 2016 and ending on the earlier of the date on which the loans are drawn.
The Term Loan Agreement2023, contains customary representations, warranties and affirmative and negative covenants for facilities of its type, including financial covenants, events of default, including cross-defaults from the Company’s other indebtedness, and indemnification provisions in favor of the Term Lenders.lenders thereunder. The negative covenants include restrictions regarding the incurrence of liens, the incurrence of indebtedness by ourthe Company’s subsidiaries and fundamental changes, subject to certain exceptions in each case. The financial covenants require usthe Company to meet a quarterly financial test with respect to a minimum consolidated interest coverage ratio of not less than 4.00 to 1.00 and a maximum consolidated leverage ratio of not greater than 3.50 to 1.00.1.00; provided that the consolidated leverage ratio may, subject to certain triggering events set forth in the Term Loan Agreement, be increased to 4.25 to 1.00 or 4.00 to 1.00 (from 3.50 to 1.00) for four consecutive fiscal quarters following certain acquisitions, provided this increase may be made only once and at the time it exercises such financial covenant step-up, the Company shall be exercising a like step-up under its revolving credit facility. At September 30, 2017,March 31, 2022, the Company was in compliance with these covenants.
On February 28, 2017, Cboe made a draw under the Term Loan Agreement in the amount of $1.0 billion. Cboe used the proceeds to finance a portion of the cash component of the aggregate consideration for the Merger, repaid certain existing indebtedness of Bats, paid feescovenants and expenses incurred in connection with the transactions contemplated by the Merger Agreement, funded working capital needs, and for other general corporate purposes. Loans under the Term Loan Agreement mature five years following the closing date of the Merger.
On June 29, 2017, Cboe refinanced approximately $300 million of the amounts outstanding under the Term Loan Agreement through the issuance of $300 million in aggregate principal amount of 1.950% Senior Notes.
1.950% did not exercise financial covenant step-up.Senior Notes due 2019
On June 29, 2017, the Company issued $300 million aggregate principal amount of 1.950% Senior Notes. The form and terms of the 1.950% Senior Notes were established pursuant to an Officer’s Certificate, dated as of June 29, 2017, supplementing the Indenture (as defined below). Underwriter fees of $0.8 million were also capitalized and netted against long-term debt in the consolidated balance sheet, while other issuance fees of $0.9 million were expensed and are included in debt issuance costs on the consolidated statement of income for the nine months ended September 30, 2017.
The Company used the net proceeds from the 1.950% Senior Notes to repay amounts under the Term Loan Agreement. The 1.950% Senior Notes mature on June 28, 2019 and bear interest at the rate of 1.950% per annum, payable semi-annually in arrears on June 28 and December 28 of each year, commencing December 28, 2017. The 1.950% Senior Notes are unsecured obligations of the Company and rank equally with all of the Company’s other existing and future unsecured, senior indebtedness, but are effectively junior to the Company’s secured indebtedness, to the extent of the value of the assets securing such indebtedness, and will be structurally subordinated to the secured and unsecured indebtedness of the Company’s subsidiaries.
The Company has the option to redeem some or all of the 1.950% Senior Notes, at any time in whole or from time to time in part, at the redemption prices set forth in the Officer’s Certificate. The Company may also be required to offer to repurchase the 1.950% Senior Notes upon the occurrence of a Change of Control Triggering Event (as such term is defined in the Officer’s Certificate) at a repurchase price equal to 101% of the aggregate principal amount of 1.950% Senior Notes to be repurchased.
3.650% Senior Notes due 2027
On January 12, 2017, the Company entered into an indenture (the “Indenture”), by and between the Company and Computershare Trust Company, N.A. (as successor to Wells Fargo Bank, National Association,Association), as trustee, in connection with the issuance of $650 million aggregate principal amount of the Company’s 3.650% Senior Notes.Notes due 2027 (“3.650% Senior Notes”). The form and terms of the 3.650% Senior Notes were established pursuant to an Officer’s Certificate, dated as of January 12, 2017, supplementing the Indenture.
Cboe Global Markets, Inc. and Subsidiaries
Notes to Condensed Consolidated Financial Statements (unaudited)
The Company used a portion of the net proceeds from the 3.650% Senior Notes to fund, in part, the Merger, including the payment of related fees and expenses and the repayment of Bats’ existing indebtedness, and the remainder for general corporate purposes. The 3.650% Senior Notes mature on January 12, 2027 and bear interest at the rate of 3.650% per annum, payable semi-annually in arrears on January 12 and July 12 of each year, commencing July 12, 2017.
On December 15, 2020, the Company issued $500 million aggregate principal amount of 1.625% Senior Notes due 2030 ("1.625% Senior Notes"). The form and terms of the 1.625% Senior Notes were established pursuant to an Officer’s Certificate, dated as of December 15, 2020, supplementing the Indenture. The Company used the net proceeds from the 1.625% Senior Notes to finance the acquisition of BIDS Trading, repay a portion of amounts outstanding under the term loan facility and all outstanding indebtedness under the revolving credit facility and the remainder for general corporate purposes, which may include the financing of future acquisitions or the repayment of other outstanding indebtedness. The 1.625% Senior Notes mature on December 15, 2030 and bear interest at the rate of 1.625% per annum, payable semi-annually in arrears on June 15 and December 15 of each year, commencing June 15, 2021.
On March 16, 2022, the Company issued $300 million aggregate principal amount of 3.000% Senior Notes due 2032 (“3.000% Senior Notes” and, together with the 1.625% Senior Notes and the 3.650% Senior Notes, the "Senior Notes"). The form and terms of the 3.000% Senior Notes were established pursuant to an Officer’s Certificate, dated as of March 16, 2022, supplementing the Indenture. The Company intends to use the net proceeds from the 3.000% Senior Notes, together with cash on hand, and the proceeds of additional borrowings, to fund its previously announced acquisition of ErisX. The 3.000% Senior Notes mature on March 16, 2032 and bear interest at the rate of 3.000% per annum, payable semi-annually in arrears on March 16 and September 16 of each year, commencing September 16, 2022.
The Senior Notes are unsecured obligations of the Company and rank equally with all of the Company’s other existing and future unsecured, senior indebtedness, but are effectively junior to the Company’s secured indebtedness, to
the extent of the value of the assets securing such indebtedness, and will be structurally subordinated to the secured and unsecured indebtedness of the Company’s subsidiaries.
The Company has the option to redeem some or all of the 3.650% Senior Notes, at any time in whole or from time to time in part, at the redemption prices set forth in the applicable Officer’s Certificate. The Company may also be required to offer to repurchase the 3.650% Senior Notes upon the occurrence of a Change of Control Triggering Event (as such term is defined in the applicable Officer’s Certificate) at a repurchase price equal to 101%101 percent of the aggregate principal amount of 3.650% Senior Notes to be repurchased.
Under the Indenture, the Company may issue debt securities, which includes the 3.650% Senior Notes, the 1.625% Senior Notes, and the 3.000% Senior Notes at any time and from time to time, in one or more series without limitation on the aggregate principal amount. The Indenture governing the 3.650% Senior Notes, the 1.625% Senior Notes, and the 3.000% Senior Notes contains customary restrictions, including a limitation that restricts ourthe Company’s ability and the ability of certain of ourthe Company’s subsidiaries to create or incur secured debt. Such Indenture also limits certain sale and leaseback transactions and contains customary events of default. At September 30, 2017,March 31, 2022, the Company was in compliance with these covenants.
Revolving Credit Agreement
On December 15, 2016,February 25, 2022, the Company, as borrower, entered into a Second Amended and Restated Credit Agreement (the “Revolving Credit Agreement”), which amended and restated the prior revolving credit agreement, with Bank of America, N.A., as administrative agent and as swing line lender, certain lenders named therein (the “Revolving Lenders”), Merrill Lynch, Pierce, Fenner & Smith Incorporated,BOFA Securities, Inc., as sole lead arranger and sole bookrunner Morgan Stanley MUFG Loan Partners, LLC, asand certain syndication agent, and Citibank, N.A., PNC Bank, National Association and JPMorgan Chase Bank, N.A., as co-documentation agents.
agents named therein ("Syndication Agents").The Revolving Credit Agreement provides for a senior unsecured $150$400 million five-yearthree-year revolving credit facility (the “Revolving Credit Facility”) that includes a $25 million swing line sub-facility. The Company may also, subject to the agreement of the applicable lenders, increase the commitments under the Revolving Credit Facility by up to $100$200 million, for a total of $250$600 million. Subject to specified conditions, the Company may designate one1 or more of its subsidiaries as additional borrowers under the Revolving Credit Agreement provided that itthe Company guarantees all borrowings and other obligations of any such subsidiaries.subsidiaries under the Revolving Credit Agreement. As of September 30, 2017, noMarch 31, 2022, 0 subsidiaries were designated as additional borrowers.
Funds borrowed under the Revolving Credit Agreement may be used to fund working capital and for other general corporate purposes.purposes, including the making of any acquisitions the Company may pursue in the ordinary course of its business. As of September 30, 2017, noMarch 31, 2022, 0 borrowings were outstanding under the Revolving Credit Agreement. Accordingly, at September 30, 2017, $150March 31, 2022, $400 million of borrowing capacity was available for the purposes permitted by the Revolving Credit Agreement.
Loans under the Revolving Credit Agreement will bear interest, at ourthe Company’s option, at either (i) LIBOR periodically fixed for an interest period (as selected by us) of one, two, three or six monthsthe Relevant Rate (defined herein) plus a margin (based on ourthe Company’s public debt ratings) ranging from 1.000.75 percent per annum to 1.751.25 percent per annum or (ii) a daily floatingfluctuating rate based on ourthe Administrative Agent’s prime rate (subject to certain minimums based upon the federal funds effective rate or LIBOR)Term SOFR), which is subject to a 1 percent floor, plus a margin (based on ourthe Company’s public debt ratings) ranging from zero percent per annum to 0.750.25 percent per annum.
“Relevant Rate” means with respect to any committed borrowing or swingline borrowing denominated in (a) Dollars, Term SOFR plus a spread adjustment of 0.10 percent per annum, (b) Sterling, SONIA plus a spread adjustment of 0.0326 percent per annum and (c) Euros, EURIBOR, as applicable, provided that each Relevant Rate is subject to a 0 percent floor.Subject to certain conditions stated in the Revolving Credit Agreement, the Company and any subsidiaries designated as additional borrowers may borrow, prepay and reborrow amounts under the Revolving Credit Facility at any time during the term of the Revolving Credit Agreement. The Revolving Credit Agreement will terminate and all amounts owing thereunder will be due and payable on December 15, 2021,February 25, 2027, unless the commitments are terminated earlier, either at ourthe request of the Company or, if an event of default occurs, by the Revolving Lenders (or automatically in the case of certain bankruptcy-related events). The Revolving Credit Agreement contains customary representations, warranties and affirmative and negative covenants for facilities of its type, including financial covenants, events of default and indemnification provisions in favor of the Revolving Lenders. The negative covenants include restrictions regarding the incurrence of liens, the incurrence of indebtedness by ourthe Company’s subsidiaries and fundamental changes, subject to certain
Cboe Global Markets, Inc. and Subsidiaries
Notes to Condensed Consolidated Financial Statements (unaudited)
certain exceptions in each case. The financial covenants require usthe Company to meet a quarterly financial test with respect to a minimum consolidated interest coverage ratio of not less than 4.00 to 1.00 and a maximum consolidated leverage ratio of not greater than 3.50 to 1.00.1.00; provided that the consolidated leverage ratio may, subject to certain triggering events set forth in the Revolving Credit Agreement, be increased to 4.25 to 1.00 on one occasion and 4.00 to 1.00 on another occasion, in each case, for four consecutive fiscal quarters; provided that, prior to the exercise of the second such financial covenant step-up, the maximum consolidated leverage ratio shall have returned to a level of 3.50 to 1.00 for at least two consecutive fiscal quarters. At September 30, 2017,March 31, 2022, the Company was in compliance with these covenants.
Bridgecovenants and did not exercise financial covenant step-up.EuroCCP Credit Facility
In connection with entering into the Merger Agreement,On July 1, 2020, EuroCCP, as borrower, the Company, as guarantor, entered into a commitment letterFacility Agreement (the “Facility” or “EuroCCP Credit Facility”) with Bank of America N.A. and Merrill Lynch Pierce, Fenner & Smith Incorporated (orInternational Designated Activity Company, as co-ordinator, facility agent, lender, sole lead arranger and sole bookrunner, Citibank N.A., as security agent, and certain other lenders named therein.
The Facility provides for a €1.5 billion committed syndicated multicurrency revolving and swingline credit facility (i) that is available to be drawn by EuroCCP (as borrower) towards (a) financing unsettled amounts in connection with the settlement of transactions in securities and other items processed through EuroCCP’s clearing system and (b) financing any other liability or liquidity requirement of EuroCCP incurred in the operation of its designated affiliates) (Bankclearing system and (ii) under which the scheduled interest and fees on borrowings (but not the principal amount of America, N.A.,any borrowings) are guaranteed by the Company. Subject to certain conditions, EuroCCP is able to increase the commitments under the Facility by up to €500 million, to a total of €2.0 billion.
Borrowings under the Facility are secured by cash, eligible government bonds and other such financial institutionseligible equity assets deposited by EuroCCP into secured accounts. In addition, EuroCCP must ensure that accede as lender to such debt commitment letter in accordance with its terms are referred to herein asat all times the “Lenders”), which provides that, subjectaggregate of (a) each clearing participant’s contribution to the satisfactionrelevant clearing fund, (b) each clearing participant’s margin amount and waiver(c) any cash equities purchased using the proceeds of certain conditionsthe assets described in (a) and (b), less the amount of any such clearing participant contribution, margin amount or cash equities which are usual and customary for financinghave been transferred to (or secured in favor of) any provider of this type,settlement or custody services to EuroCCP, is not less than €500 million. As of March 31, 2022, 0 borrowings were outstanding under the Lenders are committed to provide debt financingFacility. Accordingly, at March 31, 2022, €1.5 billion of borrowing capacity was available for the purposes permitted by the Facility.
Borrowings under the Facility’s revolving loans and non-U.S. dollar swingline loans bear interest at the relevant floating base rate plus a margin of funding (i)1.75 percent per annum and (subject to certain conditions) borrowings under the cash considerationFacility’s U.S. dollar swingline loans bear interest as the higher of the relevant agent’s prime commercial lending rate for U.S. dollars and 0.5 percent per annum over the federal funds effective rate. A commitment fee of 0.30 percent per annum is payable on the unused and uncalled amount of the Facility during the availability period.
Subject to be paidcertain conditions stated in the transactions contemplatedFacility, EuroCCP may borrow, prepay and reborrow amounts under the Facility at any time during the term of the Facility. The Facility will terminate and all amounts owing thereunder will be due and payable on 364 days from the date of the agreement, unless the commitments are terminated earlier, either at the request of EuroCCP or, if an event of default occurs, by the Merger Agreement, (ii)Lenders (or automatically in the refinancingcase of certain existing indebtednessbankruptcy-related events).
The Facility contains customary representations, warranties and covenants for facilities of Batsits type, including events of default of the Company and EuroCCP and indemnification provisions in favor of the Lenders. In particular, the covenants include restrictions regarding the incurrence of liens by EuroCCP and its subsidiaries, and (iii) related fees and expenses, which debt financing consistsan event of default will be triggered if EuroCCP ceases its business, subject to certain exceptions in each case. There is also a senior unsecured 364-day bridge loan facility in an aggregate principal amountrequirement for the net worth of up to $1.65 billion to the extent(a) the Company fails to generate gross cash proceedsbe no less than $1.75 billion on the date of each drawdown and delivery of compliance certificates and (b) EuroCCP to be the higher of €24 million and any such amount required for EuroCCP to meet minimum liquidity regulations under applicable regulation at all times. At March 31, 2022, the Company and EuroCCP were in an aggregate principal amountcompliance with these covenants.
On July 1, 2021, the Facility was amended and restated to, among other items: (i) extend the term of upthe Facility until June 30, 2022; (ii) update benchmark rates for U.S. dollar swingline loans and alternative term rates for revolving loans; (iii) remove references to $1.65 billionLIBOR and clarified procedures to calculate interest rates; (iv) reduce the minimum tangible net worth requirement from permanent financing including€24 million to €20 million; (v) include a new tranche in the formrevolving and swingline facilities to
increase access to certain currencies; (vi) update the borrowing base calculations to more accurately reflect the collateral held by EuroCCP; and the issuance of senior unsecured notes on or prior(vii) modify certain other provisions to the consummation of the transaction contemplated by the Merger Agreement. The Company paid commitmentincorporate updates in applicable laws and structuring fees of $6.0 million. Through September 30, 2017, the Company has amortized $6.0 million of these fees as a result of the Company entering into more permanent debt arrangements. The Company entered into a term loan agreement and completed a notes offering, as described below, securing $1.65 billion to finance the cash portion of its acquisition of Bats as well as the repayment of Bats' existing indebtedness. As a result of securing the financing discussed above, the bridge facility was terminated.
regulations.Loan and Notes Payments and Contractual Interest
The future expected loan repayments related to the Term Loan Agreement and the Senior Notes as of September 30, 2017 isMarch 31, 2022 are as follows (in millions):
|
| | | |
| 2017 | $ | — |
|
| 2018 | — |
|
| 2019 | 300.0 |
|
| 2020 | — |
|
| 2021 | — |
|
| Thereafter | 1,025.0 |
|
| Principal amounts repayable | 1,325.0 |
|
| Debt issuance cost | (7.1 | ) |
| Unamortized discount on Notes | (5.5 | ) |
| Total debt outstanding | $ | 1,312.4 |
|
| | | |
Remainder of 2022 | | $ | — |
2023 | | | 160.0 |
2024 | | | — |
2025 | | | — |
2026 | | | — |
Thereafter | | | 1,450.0 |
Principal amounts repayable | | | 1,610.0 |
Debt issuance costs | | | (9.7) |
Unamortized discounts on notes | | | (6.7) |
Total debt outstanding | | $ | 1,593.6 |
Interest expense recognized on the Term Loan Agreement, the Senior Notes, and the NotesRevolving Credit Agreement is included in interest expense, net in the condensed consolidated statements of income. The Company is also obligated to pay commitment fees under the terms of the Revolving Credit Agreement, Term Loan Agreement and Facility, which are also included in interest expense, net. Interest expense, net recognized in the condensed consolidated statements of income for the three and nine months ended September 30, 2017March 31, 2022 and 20162021 is as follows (in millions):
|
| | | | | | | | | | | | | | | | |
| | | Three Months Ended September 30, | | Nine Months Ended September 30, |
| | | 2017 | | 2016 | | 2017 | | 2016 |
| Components of interest expense: | | | | | | | | |
| Contractual interest | | $ | 10.5 |
| | $ | 0.2 |
| | $ | 29.0 |
| | $ | 0.2 |
|
| Amortization of debt discount | | 0.3 |
| | — |
| | 0.6 |
| | — |
|
| Amortization of debt issuance cost | | 0.2 |
| | — |
| | 2.5 |
| | — |
|
| Interest expense | | 11.0 |
| | 0.2 |
| | 32.1 |
| | 0.2 |
|
| Interest income | | (0.5 | ) | | — |
| | (1.2 | ) | | — |
|
| Interest expense, net | | $ | 10.5 |
| | $ | 0.2 |
| | $ | 30.9 |
| | $ | 0.2 |
|
Cboe Global Markets, Inc. and Subsidiaries
Notes to Condensed Consolidated Financial Statements (unaudited)
12.
| | | | | | |
| | Three Months Ended |
| | March 31, |
| | 2022 | | 2021 |
Components of interest expense: | | | | | | |
Contractual interest | | $ | 11.2 | | $ | 11.7 |
Amortization of debt discount and issuance costs | | | 0.5 | | | 0.7 |
Interest expense | | $ | 11.7 | | $ | 12.4 |
Interest income | | | (0.9) | | | (0.1) |
Interest expense, net | | $ | 10.8 | | $ | 12.3 |
11. ACCUMULATED OTHER COMPREHENSIVE INCOME, NET
The following represents the changes in accumulated other comprehensive income, net by component (in millions):
| | | | | | | | | | | | |
| | Foreign | | | | | | | | Total Accumulated |
| | Currency | | Unrealized | | | | Other |
| | Translation | | Investment | | Post-Retirement | | Comprehensive |
| | Adjustment | | Loss | | Benefits | | Income, Net |
Balance at December 31, 2021 | | $ | 55.4 | | $ | (0.1) | | $ | 0.3 | | $ | 55.6 |
Other comprehensive loss | | | (26.5) | | | — | | | — | | | (26.5) |
Balance at March 31, 2022 | | $ | 28.9 | | $ | (0.1) | | $ | 0.3 | | $ | 29.1 |
12. CLEARING OPERATIONS
EuroCCP is a European equities central counterparty that provides post-trade services to stock exchanges, MTFs, over-the-counter (“OTC”) equities trades and an equity index derivatives exchange. EuroCCP clears equities from 18 European markets and the United States, as well as Depositary Receipts, ETFs, and exchange traded currencies (“ETCs”). In September 2021, EuroCCP began clearing equity index derivatives for 6 European markets. Through a novation process, EuroCCP becomes the buyer for every seller and the seller for every buyer, thereby protecting clearing participants from counterparty risk and allowing the settlement of trades in the event of a clearing participant default.
EuroCCP only assumes the guarantor role if it has an equal and offsetting claim against a clearing participant. For the period ended March 31, 2022, there have been no events of default for which a liability is required to be recognized in accordance with GAAP.
Clearing Participant Deposits
EuroCCP generally requires all clearing participants to deposit collateral to help mitigate EuroCCP’s exposure to credit risk in the event that a clearing participant fails to meet a financial or contractual obligation.
Margin Deposits
Margin deposits, which are predominately in the form of cash and cash equivalents, are deposits made by each clearing participant to EuroCCP to cover some or all of the credit risk of its failure to fulfill its obligations in the trade. EuroCCP maintains and manages all cash deposits related to margin deposits. Substantially all risks and rewards of margin deposit ownership, including net interest income, belong to EuroCCP and are recorded in other revenue on the condensed consolidated statements of income. In the event of a default, EuroCCP can access the defaulting participant’s margin deposits to cover the defaulting participant’s losses. For more information, see “Default and Liquidity Waterfalls” below.
Clearing Funds
The clearing fund mutualizes the risk of default among all clearing participants. Depending on their membership, clearing participants contribute to the cash-equity and/or derivatives segment of the clearing fund. Although the entire clearing fund is available to cover potential losses in the event that the margin deposits and the clearing fund deposits of a defaulting clearing participant are inadequate to fulfill that clearing participant’s outstanding financial obligations, the clearing fund first uses the product class segment of the Clearing Fund in which the defaulting participants was active (see “Default and Liquidity Waterfalls” below). In the event of a default, EuroCCP is generally required to liquidate the defaulting clearing participant’s open positions. To the extent that the positions remain open, EuroCCP is required to assume the defaulting clearing participant’s obligations related to the open positions. Clearing participants are required to make contributions to the clearing fund that are proportional to their risk exposure in the form of cash or non-cash contributions, which generally consist of highly liquid securities.
Interoperability Fund
For the cash equity business line, EuroCCP has entered into interoperable arrangements with 2 other central counterparties (“CCPs”). Under these arrangements, margin is paid to, and received from, the other CCPs. The interoperability fund consists of collateral pledged by EuroCCP to the other interoperable CCPs, to cover margin calls EuroCCP received from other interoperable CCPs. For EuroCCP, the collateral pledged by the clearing participants is maintained in an interoperability fund designated account. EuroCCP does not have any economic interest or ownership in the collateral; therefore, these balances are not included in the condensed consolidated balance sheet.
The following tables present the Company’s total clearing participant deposits as of March 31, 2022 and December 31, 2021 (in millions):
| | | | | | | | | |
| | March 31, 2022 |
| | Cash Contributions | | Non-Cash Contributions (1) | | Total Contributions |
Margin deposits | | $ | 1,666.8 | | $ | 495.8 | | $ | 2,162.6 |
Clearing funds | | | 143.5 | | | 38.3 | | | 181.8 |
Interoperability funds (1) | | | 788.6 | | | 95.8 | | | 884.4 |
Total | | $ | 2,598.9 | | $ | 629.9 | | $ | 3,228.8 |
| | | | | | | | | |
| | December 31, 2021 |
| | Cash Contributions | | Non-Cash Contributions (1) | | Total Contributions |
Margin deposits | | $ | 600.0 | | $ | 287.0 | | $ | 887.0 |
Clearing funds | | | 145.9 | | | 41.9 | | | 187.8 |
Interoperability funds (1) | | | 423.3 | | | 92.6 | | | 515.9 |
Total | | $ | 1,169.2 | | $ | 421.5 | | $ | 1,590.7 |
|
| | | | | | | | | | | | |
| | | | | |
| | Foreign | Unrealized | | Total Other |
| | Currency | Investment | Post-Retirement | Comprehensive |
| | Translation | Gain/Loss | Benefits | Income |
| Balance at December 31, 2016 | $ | — |
| $ | — |
| $ | (0.8 | ) | $ | (0.8 | ) |
| Other comprehensive income | 50.7 |
| 0.1 |
| — |
| 50.8 |
|
| Balance at September 30, 2017 | $ | 50.7 |
| $ | 0.1 |
| $ | (0.8 | ) | $ | 50.0 |
|
(1) These amounts are not reflected in the condensed consolidated balance sheet, as EuroCCP does not take economic ownership of these balances.
Default and Liquidity Waterfalls
The default waterfall is the priority order in which the capital resources are expected to be utilized in the event of a default where the defaulting clearing participant’s collateral would not be sufficient to cover the cost to liquidate its portfolio. If a default occurs and the defaulting clearing participant’s collateral, including margin deposits and clearing fund deposits, are depleted, then additional capital is utilized in the following order:
| ● | EuroCCP dedicated own resources: The EuroCCP default waterfall first utilizes its own dedicated resources ahead of clearing fund contributions of non-defaulting clearing participants, up to 25% of EuroCCP capital requirements discussed in Note 16 (“Regulatory Capital”). |
| ● | Clearing fund: Second, the EuroCCP default waterfall utilizes traditional CCP risk mutualization, in the event that default losses fully exhaust EuroCCP’s dedicated own resources amount, whereby contributions applicable to a particular product class are applied first to any loss attributable to that product class. |
| ● | Pro rata contributions: Third, if the default losses caused cannot be covered by the first two layers, the non-defaulting clearing participants shall on demand make additional payments to EuroCCP on a pro rata basis in proportion to the amount of their clearing fund contributions to cover any such remaining losses, which is limited to an amount equal to twice their clearing fund contribution as established under EuroCCP’s rules and regulations. In this scenario, contributions applicable to a particular product class are first applied to any losses attributable to that product class. |
In addition to the default waterfall, the liquidity waterfall is the priority order in which the liquidity resources are expected to be utilized for EuroCCP’s ordinary course business operations and in situations when additional liquidity resources and liquidity measures may be activated in case of a potential liquidity shortfall. Liquidity, intraday or overnight, is mainly required for securities settlement. In ordinary course business circumstances, liquidity resources include the collateral directly deposited with EuroCCP, FX swap arrangements, and reverse repurchase agreements, as well as the use of the Facility.
13. FAIR VALUE MEASURMENTS
MEASUREMENTFair value is the price that would be received upon the sale of an asset or paid upon the transfer of a liability in an orderly transaction between market participants at the measurement date and in the principal or most advantageous market for that asset or liability. The fair value should be calculated based on assumptions that market participants would use in pricing the asset or liability, not on assumptions specific to the entity. In addition, the fair value of liabilities should include consideration of non-performance risk, including the Company’s own credit risk.
The Company applied FinancialFASB Accounting Standards Board ASC 820,
Codification (“ASC”) 820— Fair Value Measurement and Disclosure, which provides guidance for using fair value to measure assets and liabilities by defining fair value and establishing the framework for measuring fair value. ASC 820 applies to financial and nonfinancial instruments that are measured and reported on a fair value basis. The three-level hierarchy of fair value measurements is based on whether the inputs to those measurements are observable or unobservable. Observable inputs reflect market data obtained from independent sources, while unobservable inputs reflect the Company’s market assumptions. The fair-valuefair value hierarchy requires the use of observable market data when available and consists of the following levels: | ● | Level 1—Unadjusted inputs based on quoted markets for identical assets or liabilities. |
| ● | Level 2—Observable inputs, either direct or indirect, not including Level 1 measurements, corroborated by market data or based upon quoted prices in non-active markets. |
| ● | Level 3—Unobservable inputs that reflect management’s best assumptions of what market participants would use in valuing the asset or liability. |
Level 1—Unadjusted inputs based on quoted markets for identical assets or liabilities.
Level 2—Observable inputs, either direct or indirect, not including Level 1, corroborated by market data or based upon quoted prices in non-active markets.
Level 3—Unobservable inputs that reflect management’s best assumptions of what market participants would use in valuing the asset or liability.
The Company has included a tabular disclosure for financial assets and liabilities that are measured at fair value on a recurring basis in the condensed consolidated balance sheetsheets as of September 30, 2017March 31, 2022 and December 31, 2016.2021, respectively.
Assets and Liabilities Measured at Fair Value on a Recurring Basis
The following tables presentspresent the Company’s fair value hierarchy for those assets and liabilities measured at fair value on a recurring basis as of September 30, 2017March 31, 2022 and December 31, 20162021 (in millions):
|
| | | | | | | | | | | | |
| | September 30, 2017 |
| Total | Level 1 | Level 2 | Level 3 |
| Assets: | | | | |
| Trading securities: | | | | |
| U.S. Treasury securities | $ | 0.5 |
| $ | 0.5 |
| $ | — |
| $ | — |
|
| Other securities | 1.9 |
| 1.9 |
| — |
| — |
|
| Money market funds | 1.5 |
| 1.5 |
| — |
| — |
|
| Total assets | $ | 3.9 |
| $ | 3.9 |
| $ | — |
| $ | — |
|
| Liabilities: | | | |
| |
|
| Contingent consideration liability | $ | 56.6 |
| $ | — |
| $ | — |
| $ | 56.6 |
|
| Total liabilities | $ | 56.6 |
| $ | — |
| $ | — |
| $ | 56.6 |
|
Cboe Global Markets, Inc. and Subsidiaries
Notes to Condensed Consolidated Financial Statements (unaudited)
|
| | | | | | | | | | | | | | | |
| | December 31, 2016 |
| Total | | Level 1 | | Level 2 | | Level 3 |
| Assets: | | | | | | | |
| Money market funds | $ | 67.5 |
| | $ | 67.5 |
| | $ | — |
| | $ | — |
|
| Total assets | $ | 67.5 |
| | $ | 67.5 |
| | $ | — |
| | $ | — |
|
| | | | | | | | | | | | |
| | March 31, 2022 |
| | Total | | Level 1 | | Level 2 | | Level 3 |
Assets: | | | | | | | | | | | | |
U.S. Treasury securities | | $ | 21.3 | | $ | 21.3 | | $ | — | | $ | — |
Marketable securities: | | | | | | | | | | | | |
Mutual funds | | | 17.4 | | | 17.4 | | | — | | | — |
Money market funds | | | 10.0 | | | 10.0 | | | — | | | — |
Total assets | | $ | 48.7 | | $ | 48.7 | | $ | — | | $ | — |
Liabilities: | | | | | | | | | | | | |
Contingent consideration liabilities | | $ | 53.3 | | $ | — | | $ | — | | $ | 53.3 |
Total liabilities | | $ | 53.3 | | $ | — | | $ | — | | $ | 53.3 |
| | | | | | | | | | | | |
| | December 31, 2021 |
| | Total | | Level 1 | | Level 2 | | Level 3 |
Assets: | | | | | | | | | | | | |
U.S. Treasury securities | | $ | 9.1 | | $ | 9.1 | | $ | — | | $ | — |
Marketable securities: | | | | | | | | | | | | |
Mutual funds | | | 18.4 | | | 18.4 | | | — | | | — |
Money market funds | | | 9.6 | | | 9.6 | | | — | | | — |
Total assets | | $ | 37.1 | | $ | 37.1 | | $ | — | | $ | — |
Liabilities: | | | | | | | | | | | | |
Contingent consideration liabilities | | $ | 70.5 | | $ | — | | $ | — | | $ | 70.5 |
Total liabilities | | $ | 70.5 | | $ | — | | $ | — | | $ | 70.5 |
The following is a description of the Company’s valuation methodologies used for instruments measured at fair value on a recurring basis:
Available-for-sale and trading securities
Financial Investments
Financial investments classified as trading and available‑for‑sale consist of highly liquid U.S. Treasury securities.securities and marketable securities held in a trust for the Company’s non-qualified retirement and benefit plans, also referred to as deferred compensation plan assets. The deferred compensation plan assets have an equal and offsetting deferred compensation plan liability based on the value of the deferred compensation plan assets. These securities are valued by obtaining feeds from a number of live data sources, including active market makers and inter‑inter dealer brokers and therefore categorized as Level 1.
No material adjustments were made to the carrying value of financial investments for the period ended March 31, 2022. See Note 15 (“Employee Benefit Plans”) for more information.Contingent consideration liability
Consideration LiabilitiesIn connection with the acquisitions of Hanweck Associates, LLC (“Hanweck”), MATCHNow, and Cboe Asia Pacific, as well as the acquisition of Bats,assets of FT Providers, LLC (“FT Options”) and Trade Alert, LLC (“Trade Alert”), the Company acquired aentered into contingent consideration arrangementarrangements with the former owners of Cboe FX.owners. The total fair value of this liabilitythe liabilities at September 30, 2017March 31, 2022 was $56.6$53.3 million. That value is based on estimatesthe Company’s estimate of the likelihood that certain performance targets in the respective acquisition agreements are expected to be accomplished. In connection with the contingent consideration arrangements, the Company paid a total of $17.4 million in contingent consideration to Hanweck, FT Options, and Cboe Asia Pacific during the three months ended March 31, 2022. Because the fair value measurements relating to the contingent consideration liabilities are subject to management judgment, measurement uncertainty is inherent in the valuation of the contingent consideration liabilities as of the reporting date. Based on the recorded balance of the liabilities, any measurement uncertainty related to this Level 3 measurement is immaterial as of March 31, 2022.
Assets and Liabilities Measured at Fair Value on a Nonrecurring Basis
Certain assets, such as goodwill and intangible assets, are measured at fair value on a non-recurring basis. For goodwill, the process involves using a market approach and income approach (using discounted futureestimated cash payments,flows) to determine the fair value of each reporting unit on a significant unobservable input,stand-alone basis. That fair value is compared to the carrying value of the reporting unit, including its recorded goodwill. In connection with the annual impairment evaluation of goodwill and indefinite life intangibles, impairment is considered to have occurred if the fair value of the reporting unit is lower than the carrying value of the reporting unit. For the intangible assets, the process also involves using a discounted cash flow method to determine the fair value of each intangible asset. Impairment is considered to have occurred if the fair value of the intangible asset is lower than its carrying value. The Company did not perform an impairment test during the three months ended March 31, 2022, as there were no market events that would indicate it was more likely than not that these assets were impaired. These measurements are considered Level 3 measurement.
and these assets are recognized at fair value if they are deemed to be impaired.Equity investments without readily determinable fair values that are valued using the measurement alternative are measured at fair value on a non-recurring basis. See Note 4 (“Investments”) for more information. During the three months ended March 31, 2022, no observable transactions or impairments materially impacted the measurements of the investments accounted for as other equity investments.
Fair Value of Financial Instruments
Assets and LiabilitiesThe following table presentstables present the Company’s fair value hierarchy for those financial instrumentscertain assets and liabilities held by the Company, with the exception of debt which is presented at its carrying value, as of September 30, 2017March 31, 2022 and December 31, 20162021 (in millions):
|
| | | | | | | | | | | | |
| | September 30, 2017 |
| Total | Level 1 | Level 2 | Level 3 |
| Assets: | | | | |
| Cash and cash equivalents | $ | 124.8 |
| $ | 124.8 |
| $ | — |
| $ | — |
|
| Trading investments | 2.4 |
| 2.4 |
| — |
| — |
|
| Available-for-sale investments | — |
| — |
| — |
| — |
|
| Accounts receivable | 195.8 |
| 195.8 |
| — |
| — |
|
| Income tax receivable | 35.2 |
| 35.2 |
| — |
| — |
|
| Total assets | $ | 358.2 |
| $ | 358.2 |
| $ | — |
| $ | — |
|
| Liabilities: | | | | |
| Accounts payable | $ | 38.9 |
| $ | — |
| $ | 38.9 |
| $ | — |
|
| Section 31 fees payable | 25.4 |
| — |
| 25.4 |
| — |
|
| Contingent consideration liability | 56.6 |
| — |
| — |
| 56.6 |
|
| Long-term debt | 1,312.4 |
| — |
| 1,312.4 |
| — |
|
| Total liabilities | $ | 1,433.3 |
| $ | — |
| $ | 1,376.7 |
| $ | 56.6 |
|
Cboe Global Markets, Inc. | | | | | | | | | | | | |
| | March 31, 2022 |
| | Total | | Level 1 | | Level 2 | | Level 3 |
Assets: | | | | | | | | | | | | |
U.S. Treasury securities | | $ | 21.3 | | $ | 21.3 | | $ | — | | $ | — |
Deferred compensation plan assets | | | 27.4 | | | 27.4 | | | — | | | — |
Total assets | | $ | 48.7 | | $ | 48.7 | | $ | — | | $ | — |
Liabilities: | | | | | | | | | | | | |
Contingent consideration liabilities | | $ | 53.3 | | $ | — | | $ | — | | $ | 53.3 |
Deferred compensation plan liabilities | | | 27.4 | | | 27.4 | | | — | | | — |
Debt | | | 1,593.6 | | | — | | | 1,593.6 | | | — |
Total liabilities | | $ | 1,674.3 | | $ | 27.4 | | $ | 1,593.6 | | $ | 53.3 |
| | | | | | | | | | | | |
| | December 31, 2021 |
| | Total | | Level 1 | | Level 2 | | Level 3 |
Assets: | | | | | | | | | | | | |
U.S. Treasury securities | | $ | 9.1 | | $ | 9.1 | | $ | — | | $ | — |
Deferred compensation plan assets | | | 28.0 | | | 28.0 | | | — | | | — |
Total assets | | $ | 37.1 | | $ | 37.1 | | $ | — | | $ | — |
Liabilities: | | | | | | | | | | | | |
Contingent consideration liabilities | | $ | 70.5 | | $ | — | | $ | — | | $ | 70.5 |
Deferred compensation plan liabilities | | | 28.0 | | | 28.0 | | | — | | | — |
Debt | | | 1,299.3 | | | — | | | 1,299.3 | | | — |
Total liabilities | | $ | 1,397.8 | | $ | 28.0 | | $ | 1,299.3 | | $ | 70.5 |
Certain financial assets and Subsidiaries
Notes to Condensed Consolidated Financial Statements (unaudited)
|
| | | | | | | | | | | | |
| | December 31, 2016 |
| Total | Level 1 | Level 2 | Level 3 |
| Assets: | | | | |
| Cash and cash equivalents | $ | 97.3 |
| $ | 97.3 |
| $ | — |
| $ | — |
|
| Accounts receivable | 76.7 |
| 76.7 |
| — |
| — |
|
| Income tax receivable | 53.7 |
| 53.7 |
| — |
| — |
|
| Total assets | $ | 227.7 |
| $ | 227.7 |
| $ | — |
| $ | — |
|
| Liabilities: |
|
|
|
|
| Accounts payable | $ | 6.5 |
| $ | — |
| $ | 6.5 |
| $ | — |
|
| Total liabilities | $ | 6.5 |
| $ | — |
| $ | 6.5 |
| $ | — |
|
The carrying amounts ofliabilities, including cash and cash equivalents, accounts receivable, income tax receivable, accounts payable and Section 31 fees payable, are not measured at fair value on a recurring basis, but the carrying values approximate fair value due to their liquid or short-term nature.
balance consists of fixed rate Senior Notes and a floating rate Term Loan Agreement. The carrying amountfair values of long-term debt approximates itsthe Senior Notes are classified as Level 2 under the fair value based on quoted LIBOR at September 30, 2017hierarchy and are estimated using prevailing market quotes.
The fair value of the Term Loan Agreement was determined by utilizing a discounted cash flow analysis and is considered a Level 2 measurement.
At March 31, 2022 and December 31, 2021, the fair values of the Company’s debt obligations were as follows (in millions):
| | | | | |
| Fair Value |
| March 31, 2022 | | December 31, 2021 |
Term Loan Agreement | $ | 155.0 | | $ | 160.1 |
3.650% Senior Notes | | 661.7 | | | 702.6 |
1.625% Senior Notes | | 430.4 | | | 470.9 |
3.000% Senior Notes | | 300.0 | | | — |
Information on Level 3 Financial Liabilities
The following table sets forth a summary of changes in the fair value of the Company’s Level 3 financial liabilities during the ninethree months ended September 30, 2017.
|
| | | | | | | | | | | | | |
| | | Level 3 Financial Liabilities for the Nine Months Ended September 30, 2017 |
| | Balance at Beginning of Period | Acquired During Period | Settlements | Balances at end of period |
| |
| |
| | Liabilities | | | | |
| | Contingent consideration liability | $ | — |
| $ | 56.6 |
| $ | — |
| $ | 56.6 |
|
| | Total Liabilities | $ | — |
| $ | 56.6 |
| $ | — |
| $ | 56.6 |
|
March 31, 2022 (in millions): | | | | | | | | | | | | | | | | | | |
| | Level 3 Financial Liabilities for the Three Months Ended March 31, 2022 |
| | Balance at | | Realized (Gains) | | | | | | Foreign | | Balance at |
| | Beginning of | | Losses during | | | | | | Currency | | End of |
| | Period | | Period | | Additions | | Settlements | | Translation | | Period |
Liabilities | | | | | | | | | | | | | | | | | | |
Contingent consideration liabilities | | $ | 70.5 | | $ | — | | $ | — | | $ | (17.4) | | $ | 0.2 | | $ | 53.3 |
Total liabilities | | $ | 70.5 | | $ | — | | $ | — | | $ | (17.4) | | $ | 0.2 | | $ | 53.3 |
14. REDEEMABLE NONCONTROLLING INTEREST
Redeemable noncontrolling interest are reported on the consolidated balance sheets in mezzanine equity in Redeemable Noncontrolling Interest. SEGMENT REPORTINGThe Company recognizes changes to the redemption value of redeemable noncontrolling interest as they occur and adjust the carrying value to equal the redemption value at the end of each reporting period. The resulting increases or decreases in the estimated redemption amount are affected by corresponding charges or credits against retained earnings, or in the absence of retained earnings, additional paid in capital. The redemption amounts have been estimated based on the fair value of the majority-owned subsidiary, determined based on a weighting of the discounted cash flow and other economic factors.
For the nine months ended September 30, 2017, the following reflects changes in our redeemable noncontrolling interest (in millions):
|
| | | |
| | Redeemable Noncontrolling Interest |
| Balance as at December 31, 2016 | $ | 12.6 |
|
| Decrease due to acquiring additional equity in Vest | (3.2 | ) |
| Net loss attributable to redeemable noncontrolling interest | (0.8 | ) |
| Redemption value adjustment | 0.8 |
|
| Balance as at September 30, 2017 | $ | 9.4 |
|
Cboe Global Markets, Inc. and Subsidiaries
Notes to Condensed Consolidated Financial Statements (unaudited)
15. SEGMENT REPORTING
The Company previously operated as a single reportablereports 5 business segment as of December 31, 2016. As a result of the Bats acquisition, beginning in 2017, the Company is reporting five segments: Options, U.S.North American Equities, Europe and Asia Pacific, Futures, European Equities, and Global FX, which is reflective of how the Company's chief operating decision-maker reviews and operates the business, (Note 1). This change has been reflectedas discussed in all periods presented.Note 1 (“Organization and Basis of Presentation”). Segment performance is primarily evaluated based on operating income (loss). The Company’s chief operating decision-maker does not use segment-level assets or income and expenses below operating income (loss) as key performance metrics; therefore, such information is not presented below. The Company has aggregated all of its corporate costs, acquisition-related costs, as well as other business ventures, within the Corporate Items and Eliminations unittotals based on the decision that those activities should not be used to evaluate the segment's operating performance;performance of the segments; however, operating expenses that relate to activities of a specific segment have been allocated to that segment.
Options.The Options segment includes our options exchange business, which lists for trading options on market indexes (index options)indices (“index options”), mostly on an exclusive basis, as well as on non-exclusive "multiply-listed" options, such as options on the stocks of individual corporations (equity options)(“equity options”), and options on other exchange-traded products (ETP options),ETPs, such as exchange-traded funds (ETF options)(“ETFs”) and exchange-traded notes (ETN options) that occur(“ETNs”), which are “multi-listed” options and listed on a non-exclusive basis. These options are eligible to trade on Cboe Options, C2, BZX, EDGX, and EDGX. Itother U.S. national security exchanges. Cboe Options is the Company’s primary options market and offers trading in listed options through a single system that integrates electronic trading and traditional open outcry trading on the Cboe Options trading floor in Chicago. C2 Options, BZX Options, and EDGX Options are all-electronic options exchanges, and typically operate with different market models and fee structures than Cboe Options. The Options segment also includes applicable market data fees generated from the listed equityconsolidated tape plans, the licensing of proprietary options routed transaction services that occur on Trading.
market data, index licensing, and access and capacity services.North American Equities.The U.S.North American Equities segment includes listed cashU.S. equities and ETP transaction services that occur on fully electronic exchanges owned and operated by BZX, BYX, EDGX, and EDGA. ItEDGA, equities transactions that occur on the BIDS Trading platform, and Canadian equities and other transaction services that occur on or through the MATCHNow ATS. The North American Equities segment also includes ETP listings on BZX, the Cboe Global Markets, Inc. common stock listing, applicable market data fees generated from the U.S.consolidated tape plans, as well as fees generated from the salelicensing of proprietary equities market data, of these exchanges. It also includes the listed cash equitiesrouting services, and ETPs routed transaction services, the listings business where ETPs are listed on BZX,access and advertising activity from ETF.com.
capacity services.Europe and Asia Pacific.The FuturesEurope and Asia Pacific segment includes the business of our futures exchange, CFE, which includes offering for trading futures on the VIX Indexpan-European listed equities and other futures products.
The European Equities segment includes the pan‑European listed cash equitiesderivatives transaction services, ETPs, exchange‑tradedexchange-traded commodities, and international depository receipts that occurare hosted on the Recognised Investment Exchange,MTFs operated by Cboe Europe Equities.Equities (Cboe Europe and Cboe NL equities exchanges) and Cboe Europe
Derivatives (“CEDX”). It also includes the listed cash equitiesETP listings business on RMs and ETPs routed transaction services that occur on Cboe Chi-X Europe,clearing activities of EuroCCP, as well as the listingsequities transaction services of Cboe Australia and Cboe Japan, each operators of trading venues in Australia and Japan. This segment was previously referred to as the European Equities segment but was updated to the Europe segment in the first quarter of 2021 as a result of the launch of Cboe Europe Derivatives, a pan-European derivatives platform in September 2021. The segment was subsequently updated to Europe and Asia Pacific to reflect the acquisition of Cboe Asia Pacific in July 2021. Cboe Europe operates lit and dark books, a periodic auctions book, and Cboe BIDS Europe, a Large-in-Scale (“LIS”) trading negotiation facility for UK symbols. Cboe NL, launched in October 2019 and based in Amsterdam, operates similar business where ETPs can be listedfunctionality to that offered by Cboe Europe, and provides for trading only in European Economic Area (“EEA”) symbols. The new Cboe Europe Derivatives venue offers futures and options based on Cboe Europe Equities.
equity indices. This segment also includes Cboe Europe, Cboe NL, CEDX, Cboe Australia and Cboe Japan revenue generated from the licensing of proprietary market data and from access and capacity services.Futures. The Futures segment includes transaction services provided by the Company’s fully electronic futures exchange, CFE, which includes offerings for trading of VIX futures and other futures products, the licensing of proprietary market data, as well as access and capacity services.
Global FX.The Global FX segment includes institutional FX trading services that occur on the Cboe FX fully electronic trading platform, as well as non-deliverable forward FX transactions executed(“NDFs”) offered for execution on Cboe SEF.
SEF and Cboe Swiss, as well as revenue generated from the licensing of proprietary market data and from access and capacity services.Summarized financial data of reportable segments was as follows (in millions):
|
| | | | | | | | | | | | | | | | | | | | | | | | | | | | |
| | | | | | | | | | | | | Corporate | | |
| | | | | U.S. | | | | European | | | | items and | | |
| | | Options | | Equities | | Futures | | Equities | | Global FX | | eliminations | | Total |
| Three months ended September 30, 2017 | | | | | | | | | | | | | | |
| Revenues | | $ | 224.8 |
| | $ | 308.5 |
| | $ | 40.3 |
| | $ | 26.3 |
| | $ | 11.3 |
| | $ | 0.2 |
| | $ | 611.4 |
|
| Operating income (loss) | | 64.3 |
| | 29.9 |
| | 35.4 |
| | 2.7 |
| | (3.5 | ) | | (9.5 | ) | | 119.3 |
|
| Three months ended September 30, 2016 | | | | | | | | | | | | | | |
| Revenues | | $ | 139.2 |
| | $ | — |
| | $ | 29.5 |
| | $ | — |
| | $ | — |
| | $ | — |
| | $ | 168.7 |
|
| Operating income (loss) | | 42.6 |
| | — |
| | 25.5 |
| | — |
| | — |
| | (2.3 | ) | | 65.8 |
|
|
| | | | | | | | | | | | | | | | | | | | | | | | | | | | |
| | | | | | | | | | | | | Corporate | | |
| | | | | U.S. | | | | European | | | | items and | | |
| | | Options | | Equities | | Futures | | Equities | | Global FX | | eliminations | | Total |
| Nine Months Ended September 30, 2017 | | | | | | | | | | | | | | |
| Revenues | | $ | 651.0 |
| | $ | 759.8 |
| | $ | 107.7 |
| | $ | 63.2 |
| | $ | 26.2 |
| | $ | 0.5 |
| | $ | 1,608.4 |
|
| Operating income (loss) | | 190.5 |
| | 75.4 |
| | 94.7 |
| | 7.8 |
| | (8.8 | ) | | (96.4 | ) | | 263.2 |
|
| Nine Months Ended September 30, 2016 | | | | | | | | | | | | | | |
| Revenues | | $ | 426.8 |
| | $ | — |
| | $ | 85.5 |
| | $ | — |
| | $ | — |
| | $ | — |
| | $ | 512.3 |
|
| Operating income (loss) | | 158.5 |
| | — |
| | 72.2 |
| | — |
| | — |
| | (7.4 | ) | | 223.3 |
|
| | | | | | | | | | | | | | | |
Cboe Global Markets, Inc. and Subsidiaries
Notes to Condensed Consolidated Financial Statements (unaudited)
16. | | | | | | | | | | | | | | | | | | | | | |
| | | | | North | | Europe | | | | | | | | Corporate | | | |
| | | | | American | | and Asia | | | | | | | Items and | | | |
| | Options | | Equities | | Pacific | | Futures | | Global FX | | Eliminations | | Total |
Three Months Ended March 31, 2022 | | | | | | | | | | | | | | | | | | | | | |
Revenues | | $ | 422.6 | | $ | 423.7 | | $ | 78.6 | | $ | 32.3 | | $ | 17.3 | | $ | — | | $ | 974.5 |
Operating income (loss) | | | 162.7 | | | 38.6 | | | 20.9 | | | 17.0 | | | 2.4 | | | (1.9) | | | 239.7 |
Three Months Ended March 31, 2021 | | | | | | | | | | | | | | | | | | | | | |
Revenues | | $ | 382.4 | | $ | 526.0 | | $ | 55.8 | | $ | 31.6 | | $ | 14.7 | | $ | 0.3 | | $ | 1,010.8 |
Operating income (loss) | | | 128.7 | | | 45.1 | | | 14.5 | | | 17.5 | | | 1.2 | | | (2.4) | | | 204.6 |
15. EMPLOYEE BENEFITS
Legacy Cboe and newBENEFIT PLANSEligible U.S. employees are eligible to participate in the Cboe Options SMART Plan (“SMART Plan”). The SMART Plan is a defined contribution plan, which is qualified under Internal Revenue Code Section 401(k). In addition, eligible employees may participate in the Supplemental Employee Retirement Plan, Executive Retirement Plan and Deferred Compensation Plan. Effective January 1, 2017, the Executive Retirement Plan is closed to new executive officers and employees. Each plan is a defined contribution plan that is non-qualified under the Internal Revenue Code. The Deferred Compensation Plan assets, held in a trust, are subject to the claims of general creditors of the Company and totaled $27.4 million and $28.0 million at March 31, 2022 and December 31, 2021, respectively. Although the value of the plans are recorded in financial investments on the condensed consolidated balance sheets, there are equal and offsetting liabilities in other non-current liabilities. The investment results of these plans have no impact on net income as the investment results are recorded in equal amounts to both other expense, net and compensation and benefits expense in the condensed consolidated statements of income. The Company contributed $1.3$3.3 million and $1.5 million$2.2 million to the defined contribution plans for the three months ended September 30, 2017March 31, 2022 and 2016, respectively,2021, respectively.
Eligible employees outside of the U.S., which includes employees of Cboe Europe, EuroCCP, MATCHNow, BIDS, and $5.1 million and $4.2 million, respectively,Cboe Asia Pacific are eligible to the definedparticipate in various employee-selected stakeholder contribution plans for the nine months ended September 30, 2017 and 2016, respectively. For the nine months ended September 30, 2017, $1.2 million of this expense was related to the acquisition of Bats and is included in acquisition-related costs in the condensed consolidated statements of income. The remaining expense is included in compensation and benefits in the condensed consolidated statements of income.
Upon completion of the Merger, the Company assumed Bats' defined contribution plan that offers a 401(k) retirement plan eligible to legacy Bats U.S. employees. Under the plan, the Company matches participating employee contributions dollar for dollar of up to five percent of salary.or plans covered by local jurisdictions or by applicable laws. The Company’s contribution amounted to $0.6$0.9 million and $1.1$0.6 million for the three and nine months ended September 30, 2017,March 31, 2022 and 2021, respectively. This expense is included in compensation and benefits in the condensed consolidated statements of income.
The Company also assumed the Cboe Europe Equities employee‑selected stakeholder contribution plan upon completion of the Merger. The Company matches participating employee contributions of up to five percent of salary. Employees of Cboe Europe Equities are eligible to participate. The Company’s contribution amounted to $0.1 million and $0.3 million for the three and nine months ended September 30, 2017, respectively. This expense is included in compensation and benefits in the condensed consolidated statements of income.
17.16. REGULATORY CAPITAL
As a broker‑dealerbroker-dealers registered with the SEC, Cboe Trading isand BIDS Trading are subject to the SEC’s Uniform Net Capital Rule (Rule 15c3‑1)(“Rule 15c3-1”), which requires the maintenance of minimum net capital, as defined therein. The SEC’s requirement also provides that equity capital may not be withdrawn or a cash dividend paid if certain minimum net capital
requirements are not met. Cboe Trading computesand BIDS Trading compute the net capital requirements under the basic method provided for in Rule 15c3‑1.
15c3-1. As of September 30, 2017,March 31, 2022, Cboe Trading isand BIDS Trading were required to maintain net capital equal to the greater of 6.67% of aggregate indebtedness items, as defined, or $0.1 million. At September 30, 2017, Trading had net capital of $11.9 million, which was $11.5 million in excess of its required net capital of $0.4 million.
As entities regulated by the FCA, Cboe Europe Equities is subject to the Financial Resource Requirement ("FRR"(“FRR”) and Cboe Chi-X Europe is subject to the Capital Resources Requirement ("CRR"(“CRR”). As a RIE, Cboe Europe Equities computes its FRR in accordance with its Financial Risk Assessment, as agreed by the FCA. This FRR was $20.1 million at September 30, 2017. At September 30, 2017, Cboe Europe Equities had capital in excess of its required FRR of $23.9 million.
As a Banks, Investment firms, PRUdential (BIPRU) 50k firm, as defined byIn accordance with the Markets in Financial Instruments Directive of the FCA requirements, Cboe Chi‑XChi-X Europe computes its CRR as the greater of the base requirement of $0.1 million at September 30, 2017,March 31, 2022, or the summation of the credit risk, market risk and fixed overheads requirements, as defined. At September 30, 2017,
On March 8, 2019, Cboe Chi‑X Europe hadNL received approval from the Dutch Ministry of Finance to operate a RM, an MTF, and an approved publication arrangement in the Netherlands. As a RM, Cboe NL is subject to minimum capital requirements, as established by the Dutch Ministry of Finance in the license dated March 8, 2019.
EuroCCP was granted authorization under European Market Infrastructure Regulation (“EMIR”) by the National Competent Authority, DNB. EuroCCP is required by the EMIR, to maintain a minimum amount of capital to reflect an estimate of the capital required to wind down or restructure the activities of the clearinghouse, cover operational, legal and business risks and to reserve capital to meet credit, counterparty and market risks not covered by the clearing participants’ collateral and clearing funds.
The Investment Industry Regulatory Organization of Canada (“IIROC”) sets and monitors regulatory capital requirements for MATCHNow to protect its clients and counterparties. MATCHNow is required to maintain a prescribed minimum level of risk adjusted capital in excess of its required CRR of $0.4 million.
accordance with such requirements as IIROC may from time to time prescribe.As a swap execution facilitydesignated contract market regulated by the CFTC, Cboe SEFCFE is required to meet two2 capital adequacy tests: (i) its financial resources must be equal to at least twelve months of its projected operating costs and (ii) its unencumbered, liquid financial assets, which may include a line of credit, must be equal to at least six months of its projected operating costs. AsThe amounts presented below represent the greater of September 30, 2017, Cboe SEF had annual operating expenses of $1.4 million and had financial resources that exceeded this amount. Additionally, as of September 30, 2017, Cboe SEF had projected operating expenses from six months of $0.7 million and had unencumbered, liquid financial assets that exceeded this amount.
the 2 capital adequacy requirements.As a designated contract marketswap execution facility regulated by the CFTC, CFECboe SEF is required to meet two2 capital adequacy tests: (i) its financial resources must be equal toexceed at least twelve months of its projected operating costs and (ii) its unencumbered, liquid financial assets must be equal to the greater of: (a) three months of projected operating costs or (b) its projected wind-down costs. The amounts presented below represent the greater of the 2 capital adequacy requirements.
The following table presents the Company’s subsidiaries with regulatory capital requirements discussed above, as well as the actual and minimum regulatory capital requirements of the subsidiary as of March 31, 2022 (in millions):
| | | | | | | | |
| | | | | | | Minimum |
Subsidiary | | Regulatory Authority | | Actual | | Requirement |
Cboe Trading | | FINRA/SEC | | $ | 17.4 | | $ | 1.2 |
BIDS Trading | | FINRA/SEC | | | 10.8 | | | 0.5 |
Cboe Europe | | FCA | | | 49.7 | | | 26.7 |
Cboe Chi-X Europe | | FCA | | | 0.4 | | | 0.1 |
Cboe NL | | Dutch Authority for Financial Markets | | | 9.9 | | | 5.4 |
EuroCCP | | DNB | | | 57.9 | | | 37.7 |
MATCHNow | | IIROC | | | 5.4 | | | 0.2 |
CFE | | CFTC | | | 59.7 | | | 46.8 |
SEF | | CFTC | | | 2.4 | | | 0.9 |
Cboe Australia is regulated by the Australian Securities and Investments Commission (“ASIC”). Cboe Australia is required to maintain sufficient financial resources to operate the market properly in accordance with Section 794A(d) of the Corporations Act, which Cboe Australia satisfies by maintaining a prudent cash reserve, which must be equal to at least six months of its projected operating costs.expenses. As of September 30, 2017, CFEMarch 31, 2022, Cboe Australia holds $4.6 million in cash deposits to meet this requirement.
Cboe Japan is regulated by the Japanese Financial Services Agency (“JFSA”) and the Japan Securities Dealers Association (“JSDA”). Cboe Japan is required to maintain a minimum level of regulatory capital ratio of 120% in
accordance with such requirements prescribed by the JFSA and JSDA. As of March 31, 2022, Cboe Japan had annual
Cboe Global Markets, Inc. and Subsidiaries
Notes to Condensed Consolidated Financial Statements (unaudited)
projected operating expensesa regulatory capital ratio of $19.2 million and had financial resources that exceeded this amount. Additionally, as of September 30, 2017, CFE had projected operating expenses for six months of $9.6 million and had unencumbered, liquid financial assets that exceeded this amount.
18.17. STOCK-BASED COMPENSATION
Stock-based compensation is based on the fair value of the award on the date of grant, which is recognized over the related service period, net of actual forfeitures. The service period is the period over which the related service is performed, which is generally the same as the vesting period. In the first quarter of 2017, the Company adopted ASU 2016-09,
Compensation — Stock Compensation. This ASU simplifies several aspects of the accountingVesting may be accelerated for stock-based payment transactions (See Note 1).On February 19, 2017, the Company granted 251,273 restricted stock units ("RSUs"), each of which entitles the holder to one share of common stock upon vesting, to certain officers and employees
atas a
fair valueresult of
$80.40 per share. attaining certain age and service based requirements in the Company’s long-term incentive plan and award agreements.The RSUs vest ratably overCompany recognized stock-based compensation expense of $9.1 million and $11.7 million for the three years, with one-third vesting on each anniversarymonths ended March 31, 2022 and 2021, respectively. Stock-based compensation expense is included in compensation and benefits and acquisition-related costs in the condensed consolidated statements of income.
The activity in the Company’s restricted stock, consisting of restricted stock awards (“RSAs”), restricted stock units (“RSUs”), and performance-based restricted stock units (“PSUs”) for the three months ended March 31, 2022 was as follows:
RSAs and RSUs
The following table summarizes RSA and RSU activity during the three months ended March 31, 2022:
| | | | | |
| | | | Weighted |
| | Number of | | average grant |
| | Shares | | date fair value |
Nonvested stock at December 31, 2021 | | 443,319 | | $ | 99.22 |
Granted | | 253,860 | | | 120.77 |
Vested | | (176,343) | | | 98.19 |
Forfeited | | (20,438) | | | 98.98 |
Nonvested stock at March 31, 2022 | | 500,398 | | $ | 110.52 |
RSAs granted to non-employee members of the grant date,Board of Directors have a one-year vesting period and vesting accelerates upon the occurrence of a change in control.control of the Company. Unvested portions of the RSAs will be forfeited if the director leaves the Board of Directors prior to the applicable vesting date. The RSAs have voting rights and entitle the holder to receive dividends.
RSUs entitle the holder to 1 share of common stock upon vesting, typically vest over a three year period, and vesting accelerates upon the occurrence of a change in control or a termination of employment following a change in control or in the event of a participant’s earlier death or disability. Vesting will also accelerate upon a qualified retirement where applicable and permitted. Where applicable and permitted, qualified retirement eligibility occurs once achieving 55 years of age and 10 years of service for grants awarded in and after 2017. Unvested RSUs will be forfeited if the officer, or employee leaves the Company prior to the applicable vesting date, except in limited circumstances. The RSUs have no voting rights but entitle the holder to receive dividend equivalents.
On February 28, 2017,During the three months ended March 31, 2022, to satisfy employees’ tax obligations upon the vesting of restricted stock, the Company granted 68,254 RSUs, each of which entitles the holder to one sharepurchased 65,429 shares of common stock upon vesting, to certain officers and employees at a fair value of $78.05 per share. The RSUs vest ratably over three years, with one-third vesting on each anniversarytotaling $7.8 million as the result of the grant date, and vesting accelerates upon the occurrence of a change in control. Unvested RSUs will be forfeited if the officer or employee leaves the Company prior to the applicable vesting date, except in limited circumstances. The RSUs have no voting rights but entitle the holder to receive dividend equivalents.
On February 28, 2017, the Company granted 49,703 RSUs, each of which entitles the holder to one share of common stock upon vesting, to certain officers and employees at a fair value of $78.05 per share. The RSUs vest on the third anniversary of the grant date, and vesting accelerates upon the occurrence of a change in control. Unvested RSUs will be forfeited if the officer or employee leaves the Company prior to the applicable vesting date, except in limited circumstances. The RSUs have no voting rights but entitle the holder to receive dividend equivalents.
The Merger Agreement provided that the number of175,047 shares of
Cboe commonrestricted stock.
PSUs
The following table summarizes restricted stock into which each such award of Cboe Restricted Shares is converted will be equal to the number of shares of Bats common stock subject to the corresponding Bats Restricted Share award multiplied by the exchange ratio, which is the sum of (a) 0.3201 of a share of Cboe common stock and (b) the quotient obtained by dividing $10.00 by the volume-weighted average price, rounded to four decimal places, of shares of Cboe common stock on NASDAQ for the ten consecutive trading day period ending on the second full trading day prior to the effective time of the merger. The remaining service period will be completed post-merger and future vesting and expense will be recognized accordingly. Pursuant to the Merger Agreement, each award of restricted Bats common stock (“Bats restricted shares”) granted under any of the Bats Plans that was unvested immediately prior to the Effective Time was assumed by the Registrant and converted into awards of restricted shares totaling 622,527 of Common Stock at a fair value of $78.05 per share.
Cboe Global Markets, Inc. and Subsidiaries
Notes to Condensed Consolidated Financial Statements (unaudited)
In addition, on February 19, 2017 and February 28, 2017, the Company granted 41,481 and 19,255 RSUs, respectively,units contingent
on theupon achievement of performance conditions,
at a fair value of $111.00 and $102.00, respectively,also known as PSUs, activity during the three months ended March 31, 2022:
| | | | | |
| | | | Weighted |
| | Number of | | average grant |
| | Shares | | date fair value |
Nonvested stock at December 31, 2021 | | 152,410 | | $ | 108.41 |
Granted | | 62,388 | | | 142.05 |
Vested | | (16,834) | | | 96.00 |
Forfeited | | (33,542) | | | 95.40 |
Nonvested stock at March 31, 2022 | | 164,422 | | $ | 125.10 |
PSUs include awards related to earnings per RSU,share during the performance period as well as awards related to total shareholder return during the performance period. The Company used the Monte Carlo valuation model method to estimate the fair value of the total shareholder return RSUsPSUs which incorporated the following assumptions: risk-free interest rate (0.90)(1.75)%, three-year volatility (21.1)(32.2)% and three yearthree-year correlation with S&P 500 Index (0.41)(0.51). Each of these performance shares has a performance condition under which the number of units ultimately awarded will vary from 0% to 200% of the original grant, with each unit representing the contingent right to receive one1 share of ourthe Company’s common stock. The vesting period for the RSUsPSUs contingent on the achievement of performance conditions is three years. For each of the performance awards, the RSUsPSUs will be settled in shares of ourthe Company’s common stock following vesting of the RSUPSU assuming that the participant has been continuously employed during the vesting period, subject to acceleration in the event of a change in control of the Company, or a termination of employment following a change in control, or in the event of a participant’s earlier death or disability. Participants have no voting rights with respect to the RSUsPSUs until the issuance of the shares of common stock. Dividends are accrued by the Company and will be paid once the RSUsPSUs contingent on the achievement of performance conditions vest.
On May 18, 2017, the Company granted 15,405 shares of stock, at a fair value of $84.41 per share, to non employee
members of the board of directors. The shares have a one-year vesting period and vesting accelerates upon the occurrence of a
change in control of the Company. Unvested portions of the stock will be forfeited if the director leaves the Company prior to
the applicable vesting date.
On May 15, 2017, the Company granted 2,655 RSUs, each of which entitles the holder to one share of common stock upon vesting, to certain officers and employees at a fair value $85.00 per share. On August 15, 2017, the Company granted 1,612 RSUs at a fair value of $97.54 per share. The RSUs vest ratably over three-years , with one-third vesting on each anniversary of the grant date, and vesting accelerates upon the occurrence of a change in control. Unvested RSUs will be forfeited if the officer or employee leaves the Company prior to the applicable vesting date, except in limited circumstances. The RSUs have no voting rights but entitle the holder to receive dividend equivalents.
The Company recognized stock-based compensation expense of $9.1 million and $3.8 million for
In the three months ended September 30, 2017 and 2016, respectively, and $39.1 million and $10.9 million for the nine months ended September 30, 2017 and 2016. Stock-based compensation expense includes $9.1 million of accelerated expense recorded in the first quarter for certain officers and employees as a result of attaining certain age and service based requirements in our long-term incentive plan and award agreements. Stock-based compensation expense is included in compensation and benefits and acquisition-related costs in the condensed consolidated statements of income.
Pursuant to the Merger Agreement, each outstanding option to purchase Bats common stock (each, a “Bats stock option”) granted under any of the Bats Global Markets, Inc. 2009 Stock Option Plan, the Bats Global Markets, Inc. Third Amended and Restated 2012 Equity Incentive Plan and the Bats Global Markets, Inc. 2016 Omnibus Incentive Plan (collectively, the “Bats Plans”) that was outstanding immediately prior to the effective time of the Merger (the “Effective Time”) was converted into an option to purchase Common Stock, on the same terms and conditions (including vesting schedule) as were applicable to such Bats stock option (but taking into account any changes, including any acceleration of vesting of such Bats stock option occurring by reason of the transactions contemplated by the Merger Agreement). The number of shares of Common Stock subject to each such converted stock option equals the number of shares of Bats common stock subject to the corresponding Bats stock option immediately prior to the Effective Time, multiplied by the exchange ratio (as defined below) (subject to certain adjustments and rounding). The exercise price per share for each such converted stock option equals the per share exercise price specified in the corresponding Bats stock option divided by the exchange ratio (rounded up to the nearest cent). The “exchange ratio” is equal to 0.4452, which equals the sum of 0.3201 plus the fraction obtained by dividing $10.00 by the volume-weighted average price, rounded to four decimal points, of a share of Common Stock on NASDAQ for the ten consecutive trading days ended February 24, 2017.
Pursuant to the Merger Agreement, each award of restricted Bats common stock (“Bats restricted shares”) granted under any of the Bats Plans that was unvested immediately prior to the Effective Time was assumed by the Company and converted into an award of restricted shares of Common Stock, subject to the same terms and conditions (including vesting schedule) that applied to the applicable Bats restricted shares immediately prior to the Effective Time (but taking into account any changes, including any acceleration of vesting of such Bats restricted shares, occurring by reason provided for in the Merger Agreement). The number of shares of Common Stock subject to each such converted award of Bats restricted shares equals the number of shares of Bats common stock subject to the corresponding Bats restricted share award multiplied by the exchange ratio (as defined above).
Cboe Global Markets, Inc. and Subsidiaries
Notes to Condensed Consolidated Financial Statements (unaudited)
The activity in the Company's stock options, restricted stock and restricted stock units for the nine months ended September 30, 2017 was as follows:
Stock Options
Summary stock option activity is presented below:
|
| | | | | | | | | | |
| | | Number of Shares | Weighted Average Exercise Price | Weighted Average Remaining Contractual Term (years) | Aggregate Intrinsic Value (in millions) |
| |
| |
| |
| | Outstanding, December 31, 2016 |
|
|
|
| — |
|
| | Granted | 683,390 |
| $ | 22.45 |
| 4.8 years | $ | 40.1 |
|
| | Exercised | (231,003 | ) | $ | 18.50 |
| | |
| | Outstanding and expected to vest at September 30, 2017 | 452,387 |
| $ | 25.13 |
| 5.4 years | $ | 37.3 |
|
| | Exercisable at September 30, 2017 | 371,318 |
| $ | 24.48 |
| 5.0 years | $ | 31.8 |
|
The Company estimated the grant date fair value of options awarded during 2017 using the Black-Scholes valuation
model with the following assumptions:
|
| |
| 2017 |
Expected term (in years) | 4.2 |
Expected volatility | 19.8% |
Expected dividend yield | 1.3% |
Risk-free rate | 1.78% |
Forfeiture rate | —% |
Summary of the status of nonvested options is presented below:
|
| | | | | | |
| | Nonvested Options | Options | Weighted Average Grant-Date Fair Value |
| |
| |
| | January 1, 2017 - Nonvested | — |
| $ | — |
|
| | Vested | — |
| — |
|
| | Granted | 81,068 |
| 49.17 |
|
| | Forfeited | — |
| — |
|
| | September 30, 2017 - Nonvested | 81,068 |
| $ | 49.17 |
|
In the nine months ended September 30, 2017,March 31, 2022, to satisfy employee's tax obligations and cash exercise payment due upon the election to exercise 231,003 stock options, the Company purchased 65,302 shares at a cost of $6.0 million.
As of September 30, 2017, there were $2.3 million in total unrecognized compensation costs related to stock options. These costs are expected to be recognized over a weighted average period of 1.2 years as the stock options vest.
Cboe Global Markets, Inc. and Subsidiaries
Notes to Condensed Consolidated Financial Statements (unaudited)
Restricted Stock and Restricted Stock Units
Summary restricted stock activity is presented below:
|
| | | | | | |
| | | Number of Shares | Weighted Average Grant Date Fair Value |
| |
| |
| |
| | Nonvested stock at December 31, 2016 | 480,595 |
| $ | 63.64 |
|
| | Granted | 1,091,843 |
| 78.94 |
|
| | Vested | (386,717 | ) | 64.88 |
|
| | Forfeited | (5,442 | ) | 73.43 |
|
| | Nonvested stock at September 30, 2017 | 1,180,279 |
| $ | 77.26 |
|
In the nine months ended September 30, 2017, to satisfy employees'employees’ tax obligations upon the vesting of restrictedperformance stock, the Company purchased 144,8075,245 shares of common stock totaling $12.0$0.6 million as the result of the vesting of 386,71716,834 shares of restrictedperformance stock.
As of September 30, 2017,March 31, 2022, there were $55.6$50.6 million in total unrecognized compensation costs related to restricted stock, restricted stock units, and restrictedperformance stock units. These costs are expected to be recognized over a weighted average period of 2.02.2 years.
Employee Stock Purchase Plan
In May 2018, the Company’s stockholders approved an Employee Stock Purchase Plan, (“ESPP”), under which a total of 750,000 shares of the Company’s common stock will be made available for purchase to employees. The ESPP is a broad-based plan that permits employees to contribute up to 10% of wages and base salary to purchase shares of the Company’s common stock at a discount, subject to applicable annual Internal Revenue Service limitations. Under the ESPP, a participant may not purchase more than a maximum of 312 shares of the Company’s common stock during any single offering period. No participant may accrue options to purchase shares of the Company’s common stock at a rate that exceeds $25,000 in fair market value of the Company’s common stock (determined at the time such options are granted) for each calendar year in which such rights are outstanding at any time. The exercise price per share of common stock shall be 90% (for eligible U.S. employees) or 85% (for eligible international employees) of the lesser of the fair value of the stock on the first day of the applicable offering period or the applicable exercise date.
The Company records compensation expense over the offering period related to the discount that is given to employees, which totaled $0.1 million and $0.1 million for the three months ended March 31, 2022 and 2021, respectively. As of March 31, 2022, 637,225 shares were reserved for future issuance under the ESPP.
18. EQUITY
Common Stock
The Company’s common stock is listed on Cboe BZX under the trading symbol CBOE. As of March 31, 2022, 325,000,000 shares of the Company’s common stock were authorized, $0.01 par value, and 108,369,053 and
106,188,570 shares were issued and outstanding, respectively. As of December 31, 2021, 325,000,000 shares of the Company’s common stock were authorized, $0.01 par value, and 108,159,319 and 106,646,498 shares were issued and outstanding, respectively. The holders of common stock are entitled to 1 vote per share.
Common Stock in Treasury, at Cost
The Company accounts for the purchase of treasury stock under the cost method with the shares of stock repurchased reflected as a reduction to Cboe stockholders’ equity and included in common stock in treasury, at cost in the condensed consolidated balance sheets. Shares repurchased under the Company’s share repurchase program are retired or they are available to be redistributed. When treasury shares are redistributed, they are recorded at the average cost of the treasury shares acquired. When treasury shares are retired, they are removed from the common stock in treasury balance. The Company held 2,180,483 and 1,512,821 shares of common stock in treasury as of March 31, 2022 and December 31, 2021, respectively.
Share Repurchase Program
In 2011, the Board of Directors approved an initial authorization for the Company to repurchase shares of its outstanding common stock of $100 million and subsequently approved additional authorizations for a total authorization of $1.6 billion. The Company expects to fund repurchases primarily through the use of existing cash balances. The program permits the Company to purchase shares, through a variety of methods, including in the open market or through privately negotiated transactions, in accordance with applicable securities laws. It does not obligate the Company to make any repurchases at any specific time or situation.
The table below shows the repurchased shares of common stock under the Company’s share repurchase program during the periods presented as follows:
| | | | | | |
| | Three Months Ended
March 31, |
| | 2022 | | 2021 |
Number of shares of common stock repurchased | | | 596,988 | | | 490,632 |
Average price paid per share | | $ | 117.25 | | $ | 96.97 |
Total purchase price (in millions) | | $ | 70.0 | | $ | 47.6 |
Since inception of the program through March 31, 2022, the Company has repurchased 18,669,117 shares of common stock at an average cost per share of $69.69, totaling $1.3 billion.
As of March 31, 2022 and 2021, the Company had $248.9 million and $352.5 million of availability remaining under its existing share repurchase authorizations, respectively.
Purchase of Common Stock from Employees
The Company purchased 70,674 and 59,202 shares that were not part of the publicly announced share repurchase authorization from employees for an average price paid per share of $118.89 and $96.03 during the three months ended March 31, 2022 and 2021, respectively. These shares consisted of shares retained to cover payroll withholding taxes in connection with the vesting of restricted stock awards, restricted stock units, and performance share awards.
Preferred Stock
The Company has authorized the issuance of 20,000,000 shares of preferred stock, par value $0.01 per share, issuable from time to time in one or more series. As of March 31, 2022, and December 31, 2021, the Company had 0 shares of preferred stock issued or outstanding.
Dividends
During the three months ended March 31, 2022, the Company declared and paid cash dividends per share of $0.48 for an aggregate payout of $51.4 million. During the three months ended March 31, 2021, the Company declared and paid cash dividends per share of $0.42 for an aggregate payout of $45.3 million.
Each share of common stock, including RSAs, RSUs, and PSUs, is entitled to receive dividend and dividend equivalents, respectively, if, as and when declared by the Board of Directors of the Company. The Company’s expectation
is to continue to pay dividends. The decision to pay a dividend, however, remains within the discretion of the Company’s Board of Directors and may be affected by various factors, including earnings, financial condition, capital requirements, level of indebtedness and other considerations the Board of Directors deems relevant. Future debt obligations and statutory provisions, among other things, may limit, or in some cases prohibit, the Company’s ability to pay dividends.
As a holding company, the Company’s ability to declare and continue to pay dividends in the future with respect to its common stock will also be dependent upon the ability of its subsidiaries to pay dividends to it under applicable corporate law.
19. INCOME TAXES
The Company records income tax expense during interim periods based on the best estimate of the full year’s tax rate as adjusted for discrete items, if any, that are taken into account in the relevant interim period. Each quarter, the Company updates its estimate of the annual effective tax rate and any change in the estimated rate is recorded on a cumulative basis.
The effective tax rate from continuing operations was
43.1%51.3% (29.9% excluding Section 199 related matters) and
39.9%28.9% for the three months ended
September 30, 2017March 31, 2022 and
2016,2021, respectively.
The increase infollowing table summarizes the non-GAAP calculation of the effective tax rate for the three months ended September 30, 2017 against the comparable periodMarch 31, 2022:
| | | |
| | Tax Rate | |
GAAP effective tax rate | | 51.3 | % |
Tax effect of Section 199 related matters | | (21.4) | % |
Effective tax rate excluding Section 199 matters | | 29.9 | % |
The higher effective tax rate in the prior year was primarilyfirst quarter of 2022 is due to the derecognition of the Company’s Section 199 tax benefits for tax years 2008 through 2016 upon the unfavorable decision by the United States Tax Court in the matter of Bats Global Markets Holdings, Inc. and Subsidiaries v. Commissioner of Internal Revenue, on March 31, 2022.
The Company petitioned the U.S. Tax Court on January 13, 2017, May 7, 2018 and November 29, 2018 for a re-measurementredetermination of our deferredIRS notices of deficiency for Cboe and certain of its subsidiaries for tax assetsyears 2011 through 2015 related to its Section 199 claims. These petitions resulted in the establishment of 3 cases before the U.S. Tax Court. The Company also filed a complaint on October 9, 2018 with the Court of Federal Claims for a refund of Section 199 claims related to tax years 2008 through 2010, resulting in the establishment of a single case before the Court of Federal Claims.
The first case that went to trial involved certain subsidiaries related to electronic trading for tax years 2011, 2012 and liabilities as2013. The U.S. Tax Court held the trial remotely from May 24, 2021 to June 1, 2021. On March 31, 2022, the U.S. Tax Court issued its decision rejecting the Company’s basis for its petition (the “Opinion”). A notice of appeal, which would lie before the U.S. Court of Appeals for the 10th Circuit, must be filed within 90 days of entry of the pending decision which will give effect to the Opinion. The Company plans to appeal. NaN cases remain pending in U.S. Tax Court and the case before the Court of Federal Claims also remains pending. Trial dates in those cases have not been established.
As a result of a 1.75% corporatethe Opinion, the Company’s Section 199 positions no longer meet the recognition threshold provided by ASC 740-10. Accordingly, the Company increased its provision for income tax rate increasetaxes in Illinois enacted on July 6, 2017.
The effective tax rate from continuing operations was 37.7% and 39.3%order to fully reserve for the nine months ended September 30, 2017 and 2016, respectively. The decrease inexpected aggregate amount of additional liabilities that the effective tax rate for the nine months ended September 30, 2017Company currently expects would result from these cases if they were all decided against the comparable period in the prior year was primarily due to discrete events during the nine-month period, mainly the re-measurement of tax reserves and excess tax benefits associated with the exercise and vesting of stock-based compensation.
Company.20. NET INCOMEEARNINGS PER COMMON SHARE
The computation of basic net income allocated toper common stockholdersshare is calculated by reducing net income for the period by dividends paid or declared and undistributed net income for the period that are allocated to participating securities to arrive at net income allocated to common stockholders. Net income allocated to common stockholders is divided by the weighted average number of common shares outstanding during the period to determine net income per share allocated to common stockholders.
The computation of diluted earningsnet income per share is calculated by dividing net income allocated to common stockholders by the sum of the weighted average number of common shares outstanding plus all additional common
shares that would have been outstanding if the potentially dilutive common shares had been issued. The dilutive effect is calculated using the more dilutive of the two-class or treasury stock method.
Additionally, the change in the redemption value for the noncontrolling interest reduces net income allocated to common shareholders.
Cboe Global Markets, Inc. and Subsidiaries
Notes to Condensed Consolidated Financial Statements (unaudited)
The following table reconciles net income allocated to common stockholders andsets forth the numbercomputation of shares used to calculate the basic and diluted net incomeearnings per common share for the three and nine months ended September 30, 2017March 31, 2022 and 2016:
|
| | | | | | | | | | | | | | | | |
| | | Three Months Ended
September 30, | | Nine Months Ended
September 30, |
| (in millions, except per share amounts) | | 2017 | | 2016 | | 2017 | | 2016 |
| Basic EPS Numerator: | | | | | | | | |
| Net Income | | $ | 60.3 |
| | $ | 40.5 |
| | $ | 143.5 |
| | $ | 140.6 |
|
| Loss attributable to noncontrolling interest | | 0.2 |
| | 0.3 |
| | 0.8 |
| | 0.8 |
|
| Net Income Excluding Noncontrolling Interest | | 60.5 |
| | 40.8 |
| | 144.3 |
| | 141.4 |
|
| Change in redemption value of noncontrolling interest | | (0.2 | ) | | (0.3 | ) | | (0.8 | ) | | (0.8 | ) |
| Earnings allocated to participating securities | | (0.6 | ) | | (0.2 | ) | | (1.4 | ) | | (0.6 | ) |
| Net Income Allocated to Common Stockholders | | $ | 59.7 |
| | $ | 40.3 |
| | $ | 142.1 |
| | $ | 140.0 |
|
| Basic EPS Denominator: | | | | | | | | |
| Weighted average shares outstanding | | 112.3 |
| | 81.3 |
| | 105.5 |
| | 81.5 |
|
| Basic Net Income Per Common Share | | $ | 0.53 |
| | $ | 0.50 |
| | $ | 1.35 |
| | $ | 1.72 |
|
| | | | | | | | | |
| Diluted EPS Numerator: | | | | | | | | |
| Net Income | | $ | 60.3 |
| | $ | 40.5 |
| | $ | 143.5 |
| | $ | 140.6 |
|
| Loss attributable to noncontrolling interest | | 0.2 |
| | 0.3 |
| | 0.8 |
| | 0.8 |
|
| Net Income Excluding Noncontrolling Interest | | 60.5 |
| | 40.8 |
| | 144.3 |
| | 141.4 |
|
| Change in redemption value of noncontrolling interest | | (0.2 | ) | | (0.3 | ) | | (0.8 | ) | | (0.8 | ) |
| Earnings allocated to participating securities | | (0.6 | ) | | (0.2 | ) | | (1.4 | ) | | (0.6 | ) |
| Net Income Allocated to Common Stockholders | | $ | 59.7 |
| | $ | 40.3 |
| | $ | 142.1 |
| | $ | 140.0 |
|
| Diluted EPS Denominator: | | | | | | | | |
| Weighted average shares outstanding | | 112.3 |
| | 81.3 |
| | 105.5 |
| | 81.5 |
|
| Dilutive common shares issued under stock program | | 0.3 |
| | — |
| | 0.3 |
| | — |
|
| Total Dilutive Weighted Average Shares | | 112.6 |
| | 81.3 |
| | 105.8 |
| | $ | 81.5 |
|
| Diluted Net Income Per Common Share | | $ | 0.53 |
| | $ | 0.50 |
| | $ | 1.34 |
| | $ | 1.72 |
|
2021 (in millions, except per share data): | | | | | | |
| | Three Months Ended
March 31, |
| | 2022 | | 2021 |
Basic earnings per share numerator: | | | | | | |
Net income | | $ | 109.6 | | $ | 137.2 |
Earnings allocated to participating securities | | | (0.4) | | | (0.4) |
Net income allocated to common stockholders | | $ | 109.2 | | $ | 136.8 |
Basic earnings per share denominator: | | | | | | |
Weighted average shares outstanding | | | 106.6 | | | 107.3 |
Basic earnings per share | | $ | 1.02 | | $ | 1.27 |
| | | | | | |
Diluted earnings per share numerator: | | | | | | |
Net income | | $ | 109.6 | | $ | 137.2 |
Earnings allocated to participating securities | | | (0.4) | | | (0.4) |
Net income allocated to common stockholders | | $ | 109.2 | | $ | 136.8 |
Diluted earnings per share denominator: | | | | | | |
Weighted average shares outstanding | | | 106.6 | | | 107.3 |
Dilutive potential common shares outstanding | | | 0.2 | | | 0.1 |
Total dilutive weighted average shares | | | 106.8 | | | 107.4 |
Diluted earnings per share | | $ | 1.02 | | $ | 1.27 |
For the periods presented, the Company did not have shares of stock-based compensation that would have an anti-dilutive effect on the computation of diluted net incomeearnings per common share.
21. COMMITMENTS, CONTINGENCIES, AND CONTINGENCIES
GUARANTEESLegal Proceedings
As of September 30, 2017,March 31, 2022, the Company was subject to the various legal proceedings and claims discussed below, as well as certain other legal proceedings and claims that have not been fully resolved and that have arisen in the ordinary course of business.
The Company reviews its legal proceedings and claims, regulatory reviews and inspections and other legal proceedings on an ongoing basis and follows appropriate accounting guidance when making accrual and disclosure decisions. The Company establishes accruals for those contingencies where the incurrence of a loss is probable and can be reasonably estimated, and the Company discloses the amount accrued and the amount of a reasonably possible loss in excess of the amount accrued, if such disclosure is necessary for ourthe condensed consolidated financial statements to not be misleading. The Company does not record liabilities when the likelihood that the liability has been incurred is probable, but the amount cannot be reasonably estimated, or when the liability is believed to be only reasonably possible or remote. The Company'sCompany’s assessment of whether a loss is remote, reasonably possible, or probable is based on its assessment of the ultimate outcome of the matter following all appeals.
As of September 30, 2017,March 31, 2022, the Company does not believe that there is a reasonable possibility that any material loss exceeding the amounts already recognized for these legal proceedings and claims, regulatory reviews, inspections or other legal proceedings, if any, has been incurred. While the consequences of certain unresolved proceedings are not presently determinable, the outcome of any litigationproceeding is inherently uncertain and an adverse outcome from certain matters could have a material effect on our earningsthe financial position, results of operations, or cash flows of the Company in any given reporting period.
City of Providence
On April 18, 2014, the City of Providence, Rhode Island filed a securities class action lawsuit in the federal district court for the Southern District of New York (“Lower Court”) against Bats and Direct Edge Holdings LLC, as well as 14 other securities exchanges. The action purports to be brought on behalf of all public investors who purchased and/or sold shares of stock in the United States since April 18, 2009 on a registered public stock exchange (“Exchange Defendants”) or a U.S.-based alternate trading venue and were injured as a result of the alleged misconduct detailed in the complaint, which includes allegations that the Exchange Defendants committed fraud through a variety of business practices associated with, among other things, what is commonly referred to as high frequency trading. On May 2, 2014 and May 20, 2014, American European Insurance Company and Harel Insurance Co., Ltd. each filed substantially similar class action lawsuits against the Exchange Defendants which were ultimately consolidated with the City of Providence, Rhode Island securities class action lawsuit. On June 18, 2015, the Lower Court held oral argument on the pending Motion to Dismiss and thereafter, on August 26, 2015, the Lower Court issued an Opinion and Order granting Exchange Defendants’ Motion to Dismiss, dismissing the complaint in full. On September 24, 2015, Plaintiffs filed a Notice of Appeal with the Court of Appeals for the Second Circuit (“2nd Circuit”), seeking to appeal the August 26, 2015 dismissal opinion and order. On January 7, 2016, Plaintiffs filed their opening brief with the 2nd Circuit and on April 7, 2019, the Exchange Defendants filed their opposition brief with the 2nd Circuit. Oral argument was held on August 24, 2016. Following oral argument, the 2nd Circuit issued an order requesting that the SEC submit an amicus brief on whether the Lower Court had jurisdiction and whether the Exchange Defendants have immunity in the claims alleged. The SEC filed its amicus brief with the 2nd Circuit on November 28, 2016 and Plaintiffs and the Exchange Defendants filed their respective supplemental response briefs on December 12, 2016. On December 19, 2017, the 2nd Circuit reversed the Lower Court’s dismissal and remanded the case back to the Lower Court. On March 13, 2018, the 2nd Circuit denied the Exchange Defendants’ motion for re-hearing. The Exchange Defendants filed their opening brief for their motion to dismiss May 18, 2018, Plaintiffs’ response was filed June 15, 2018 and the Exchange Defendants’ reply was filed June 29, 2018. On May 28, 2019, the Lower Court issued an opinion and order denying the Exchange Defendants’ motion to dismiss. On June 17, 2019, the Exchange Defendants filed a motion seeking interlocutory appeal of the May 28, 2019 dismissal order, which was denied July 16, 2019. Exchange Defendants filed their answers on July 25, 2019. Targeted discovery regarding class certification and legal preclusion concluded on April 26, 2021. On May 28, 2021, (1) Plaintiffs filed a Motion for Class Certification, (2) Bats and NYSE filed a joint Motion for Summary Judgment on Grounds of Legal Preclusion and a joint Motion for Summary Judgment on Grounds of Lack of Article III Standing, and (3) Nasdaq filed a Motion for Summary Judgment for Legal Preclusion. Briefing on these dispositive motions concluded in December 2021. The parties also filed motions to exclude some of the other’s experts. Oral argument regarding the joint Motion for Lack of Article III Standing and Exchange Defendant’s motion to exclude the testimony of one of Plaintiffs’ experts occurred on March 11, 2022. On March 28, 2022, the Lower Court entered an opinion and order dismissing all of Plaintiffs’ claims, without prejudice, against the Exchange Defendants and ordered that judgment be entered for the Defendant Exchanges. On April 25, 2022, Plaintiffs filed a Notice of Appeal with the 2nd Circuit, seeking to appeal the March 28, 2022 dismissal order and the judgment entered against them.
VIX Litigation
On March 20, 2018, a putative class action complaint captioned Tomasulo v. Cboe Global Markets,Exchange, Inc., et al., No. 18-cv-02025 was filed in federal district court for the Northern District of Illinois alleging that the Company intentionally designed its products, operated its platforms, and formulated the method for calculating VIX and the Special Opening Quotation, (i.e., the special VIX value designed by the Company and calculated on the settlement date of VIX derivatives prior to the opening of trading), in a manner that could be collusively manipulated by a group of entities named as John Doe defendants. A number of similar putative class actions, some of which do not name the Company as a party, were filed in federal court in Illinois and New York on behalf of investors in certain volatility-related products. On June 14, 2018, the Judicial Panel on Multidistrict Litigation centralized the putative class actions in the federal district court for the Northern District of Illinois. On September 28, 2018, plaintiffs filed a master, consolidated complaint that is a putative class action alleging various claims against the Company and John Doe defendants in the federal district court for the Northern District of Illinois. The claims asserted against the Company consist of a Securities Exchange Act fraud claim, 3 Commodity Exchange Act claims and a state law negligence claim. Plaintiffs request a judgment awarding class damages in an unspecified amount, as well as punitive or exemplary damages in an unspecified amount, prejudgment interest, costs including attorneys’ and experts’ fees and expenses and such other relief as the court may deem just and proper. On November 19, 2018, the Company filed a motion to dismiss the master consolidated complaint and the plaintiffs filed their response on January 7, 2019. The Company filed its reply on January 28, 2019. On May 29, 2019, the federal district court for the Northern District of Illinois granted the Company’s motion to dismiss plaintiffs’ entire complaint against the Company. The state law negligence claim was dismissed with prejudice and the other claims were dismissed without prejudice with leave to file an amended complaint, which plaintiffs filed on July 19, 2019. On August 28, 2019, the Company filed its second motion to dismiss the amended consolidated complaint and plaintiffs filed their response on
October 8, 2019. On January 27, 2020, the federal district court for the Northern District of Illinois granted the Company’s second motion to dismiss and all counts against the Company were dismissed with prejudice. On April 21, 2020, the federal district court for the Northern District of Illinois granted plaintiffs’ motion to certify the January 27, 2020 dismissal order for an immediate appeal. On May 19, 2020, plaintiffs filed a notice of appeal with the Court of Appeals for the Seventh Circuit (“7th Circuit”), seeking to appeal the April 21, 2020 order granting the entry of partial final judgment and both orders granting the Company’s motions to dismiss entered on May 29, 2019 and January 27, 2020. On June 29, 2020, plaintiffs filed their opening brief with the 7th Circuit, on August 28, 2020 the Company filed its opposition brief with the 7th Circuit, on September 7, 2020, CME Group Inc., Intercontinental Exchange, Inc. and Subsidiaries
NotesNational Futures Association filed an amici curiae brief in support of the Company on the Bad Faith Standard with the 7th Circuit and on October 16, 2020, plaintiffs filed their reply brief with the 7th Circuit. Oral arguments were held remotely on November 30, 2020 and the parties are currently awaiting a decision by the 7th Circuit. The Company currently believes that the claims are without merit and intends to Condensed Consolidated Financial Statements (unaudited)
reporting period. However,litigate the matter vigorously. The Company is unable to estimate what, if any, liability may result from this litigation.Other
As self-regulatory organizations under the jurisdiction of the SEC, Cboe Options, C2, BZX, BYX, EDGX and EDGA are subject to routine reviews and inspections by the SEC. As a designated contract market under the jurisdiction of the CFTC, CFE is subject to routine rule enforcement reviews and examinations by the CFTC. Cboe SEF, LLC is a swap execution facility registered with the CFTC and subject to routine rule enforcement reviews and examinations by the CFTC. Cboe Trading and BIDS Trading are subject to reviews and inspections by FINRA. The Company has from time to time received inquiries and investigative requests from the SEC’s Office of Compliance Inspections and Examinations and the CFTC’s Division of Market Oversight as well as the SEC Division of Enforcement and CFTC Division of Enforcement seeking information about the Company’s compliance with its obligations as a self-regulatory organization under the federal securities laws and Commodity Exchange Act as well as members’ compliance with the federal securities laws and Commodity Exchange Act.
In addition, while Cboe Europe, Cboe Chi-X Europe, EuroCCP, Cboe NL, Cboe Australia, Cboe Japan, and MATCHNow have not been the subject of any material litigation or regulatory investigation in the opinionpast, there is always the possibility of management,such action in the ultimate liabilityfuture. As Cboe Europe and Cboe Chi-X Europe are domiciled in the UK, it is likely that any action would be taken in the UK courts in relation to litigation or by the FCA in relation to any regulatory enforcement action. As EuroCCP is domiciled in the Netherlands, it is likely that any action would be taken in the Dutch courts in relation to litigation or by the DNB or Dutch Authority for Financial Markets in relation to any regulatory enforcement action. For Cboe NL, also domiciled in the Netherlands, it is likely that any actions would be taken in the Dutch courts in relation to litigation or Dutch Authority for Financial Markets in relation to any regulatory enforcement action. As Cboe Australia is domiciled in Australia, it is likely that any action would be taken in the Australian courts in relation to litigation or by the ASIC, in relation to any regulatory enforcement action. As Cboe Japan is domiciled in Japan, it is likely that any action would be taken in the Japanese courts in relation to litigation or by the JFSA or the JSDA in relation to any regulatory enforcement action. As MATCHNow is domiciled in Canada, it is likely that any action would be taken in the Canadian courts in relation to litigation or by the IIROC or Ontario Securities Commission in relation to any regulatory enforcement action.
The Company is also currently a party to various other legal proceedings in addition to those already mentioned. Management does not believe that the likely outcome of any of these other reviews, inspections, investigations or other legal proceedings is expected to have a material effectimpact on ourthe Company’s financial position, results of operations, liquidity or capital resources.
There have been no material changes duringSee also Note 6 (“Credit Losses”) for information on promissory notes related to the period covered by this Form 10-Q from the legal proceedings disclosures in our Annual Report on Form 10-K for the year ended December 31, 2016.
CAT.See also Note 19 (“Income Taxes”).
Contractual Obligations
The Company has contractual obligations related to licensing agreements with various licensors, some of which included fixed fees and/or variable fees calculated using agreed upon contracted rates and reported cleared volumes. Certain licensing agreements contain annual minimum fee requirements that total $14.0 million each year for thenextfiveyears.
See Note 12 (“Clearing Operations”) for information on EuroCCP’s clearinghouse exposure guarantee.
See Note 22 (“Leases”) for information on lease obligations.
22. LEASES
The Company currently leases office space, data centers, and remote network operations centers, and equipment under non-cancelable operating leases with third parties as of March 31, 2022. Certain leases include one or more options to renew, with renewal terms that can extend the lease terms remaining rangingterm fromone to five years or more, and some of which include the Company’s option to terminate the leases within one year. During the three months ended March 31, 2022, $14.8 million of right of use assets and $14.8 million of lease liabilities were added related to one hundrednew operating leases.
In May 2021, the Company signed a new lease to secure approximately 21,000 square feet of office space in London. The initial term of the lease is 69 months from the accounting commencement date, June 24, 2021. The Company has the option to renew the lease term for an additional 60 months. The total legally binding minimum lease payments for this lease are approximately $9.5 million.
Additionally, in October 2021, the Company signed a new lease to secure approximately 29,500 square feet of office space in Amsterdam. The initial term of the lease is 120 months from the accounting commencement date, February 1, 2022. The Company has the option to renew the lease term for an additional 60 months. The total legally binding minimum lease payments for this lease are approximately $9.2 million.
The following table presents the supplemental balance sheet information related to leases as of September 30, 2017. Total rent expense related to theseMarch 31, 2022 and December 31, 2021, respectively (in millions):
| | | | | |
| March 31, | | December 31, |
| 2022 | | 2021 |
Operating lease right of use assets | $ | 122.5 | | $ | 110.1 |
Total leased assets | $ | 122.5 | | $ | 110.1 |
| | | | | |
Accrued liabilities | $ | 16.9 | | $ | 15.6 |
Non-current operating lease liabilities | | 141.3 | | | 129.2 |
Total leased liabilities | $ | 158.2 | | $ | 144.8 |
The following table presents operating lease obligations, reflected in technology support servicescosts and facilities costs line items on the condensed consolidated statementsother information as of income,and for the three months ended September 30, 2017March 31, 2022 and 2016 were $2.2 million and $0.4 million,2021, respectively and $5.7 million and $1.0 million, for the nine months ended September 30, 2017 and 2016, respectively.
| | | | | | | |
| Three Months Ended
March 31, |
| 2022 | | | 2021 | |
Operating lease costs (1) | $ | 7.4 | | | $ | 6.2 | |
| | | | | | | |
Lease term and discount rate information: | | | | | | | |
Weighted average remaining lease term (years) | | 10.7 | | | | 11.9 | |
Weighted average discount rate | | 3.1 | % | | | 3.4 | % |
| | | | | | | |
Supplemental cash flow information and non-cash activity: | | �� | | | | | |
Cash paid for amounts included in the measurement of lease liabilities | $ | 5.3 | | | $ | 4.1 | |
Lease incentive for leasehold improvements | | — | | | | — | |
Right-of-use assets obtained in exchange for lease liabilities | | 14.8 | | | | 1.0 | |
|
| (1) | | | | | |
| | | | | Includes short-term lease and variable lease costs, which are immaterial. |
The maturities of the lease liabilities are as follows as of March 31, 2022 (in millions):
| | | |
| | March 31, |
| | 2022 |
Remainder of 2022 | | $ | 15.2 |
2023 | | | 21.0 |
2024 | | | 16.1 |
2025 | | | 15.2 |
2026 | | | 16.2 |
After 2026 | | | 105.1 |
Total lease payments (1) | | $ | 188.8 |
Less: Interest | | | (30.6) |
Present value of lease liabilities | | $ | 158.2 |
22.
| (1) | Total lease payments include $20.4 million related to options to extend lease terms that are reasonably certain of being exercised. |
23. SUBSEQUENT EVENTS
On OctoberApril 27, 2017,2022, pursuant to the Term Loan Agreement, the Company announced thatsubmitted a committed loan notice to borrow $190 million on April 29, 2022.
On April 28, 2022, the Company entered into an agreement to sell its board of directors declaredformer headquarters building with a quarterly cash dividend of $0.27 per share. The dividend is payable December 15, 2017tentative close date in June 2022, subject to stockholders of record at the close of business on December 1, 2017.
customary closing conditions.There have been no additionalother subsequent events that would require disclosure in, or adjustment to, the condensed consolidated financial statements as of and for the ninethree months ended September 30, 2017.March 31, 2022.
Item 2. Management'sManagement’s Discussion and Analysis of Financial Condition and Results of Operations
The following discussion should be read in conjunction with the accompanying unaudited condensed consolidated financial statements and the notes thereto, included in Item 1 in this Quarterly Report on Form 10-Q, and the audited consolidated financial statements in the Company’s Annual Report on Form 10-K for the year ended December 31, 2016,2021, and as contained in that report, the information under the heading “Management’s Discussion and Analysis of Financial Condition and Results of Operations.” This discussion contains forward-looking information. Please see
“Forward-Looking “Forward-Looking Statements” for a discussion of the uncertainties, risks and assumptions associated with these statements.
Cboe Global Markets, Inc. is one(“Cboe” or “the Company”), a leading provider of the world’s largest exchange holding companies, offeringmarket infrastructure and tradable products, delivers cutting-edge trading, clearing and investment solutions to investorsmarket participants around the world. The companyCompany is committed to relentless innovation, connectingoperating a trusted, inclusive global markets with world-classmarketplace, providing leading products, technology and providing seamlessdata solutions that enhance the customer experience.
enable participants to define a sustainable financial future. Cboe offersprovides trading across a diverse range ofsolutions and products in multiple asset classes, including equities, derivatives and geographies, including options, futures, U.S.FX, across North America, Europe, and European equities, exchange-traded products (ETPs), global foreign exchange (FX) and multi-asset volatility products based on the VIX, the world’s barometer for equity market volatility.
Asia Pacific.Cboe’s trading venuessubsidiaries include the largest options exchange in the U.S. by volume and the third largest stock exchange by value traded in Europe. In addition, the Company is the second-largest stock exchange operator in the U.S. In addition, the Company operates one of the largest stock exchanges by value traded in Europe, and owns EuroCCP, a leading pan-European equities and derivatives clearinghouse, BIDS Trading, a leading block-trading ATS by volume in the U.S., MATCHNow, a leading equities ATS in Canada, Cboe Australia, an operator of trading venues in Australia, and Cboe Japan, an operator of trading venues in Japan. Cboe also is a leading market globally for ETPexchange-traded products (“ETPs”) listings and trading.
The Company is headquartered in Chicago with offices in Amsterdam, Belfast, Calgary, Hong Kong, Kansas City, London, Manila, New York, London, San Francisco, Sarasota Springs, Singapore, Hong Kong,Sydney, Tokyo and Ecuador.
InToronto.Recent Developments
Planned acquisition of ErisX
On October 2017,20, 2021, the Company changedannounced it entered into a definitive agreement to acquire ErisX. ErisX operates a U.S. based digital asset spot market, a regulated futures exchange and a regulated clearinghouse. Ownership of ErisX presents a unique opportunity for the Company to enter the digital asset spot and derivatives marketplaces through a digital-first platform developed with industry partners to focus on robust regulatory compliance, data and transparency. The transaction is expected to close in the second quarter of 2022, subject to customary closing conditions.
Planned acquisition of NEO
On November 15, 2021, the Company announced it entered into a definitive agreement to acquire Aequitas Innovations, Inc. (“NEO”). NEO is a fintech organization that is comprised of a fully registered Tier-1 Canadian securities exchange with a diverse product and services set ranging from corporate listings to cash equity trading. Ownership of NEO will help allow the Company to provide a more fulsome Canadian equities offering, operating the NEO Exchange, a national securities exchange with trading, listings, and other services, in addition to MATCHNow, the ATS acquired by the Company in 2020. The transaction is expected to close in the second or third quarter of 2022, subject to regulatory review and other customary closing conditions.
Business Segments
The Company reports five business segments: Options, North American Equities, Europe and Asia Pacific, Futures, and Global FX. Segment performance is primarily based on operating income (loss). The Company has aggregated all of its legal namecorporate costs and eliminations, as well as other business ventures, within Corporate Items and Eliminations; however, operating expenses that relate to activities of a specific segment have been allocated to that segment. Our management allocates resources, assesses performance and manages our business according to these segments:
Options. The Options segment includes options on market indices (“index options”), as well as on the stocks of individual corporations (“equity options”), and options on ETPs, such as exchange-traded funds (“ETFs”) and exchange-traded notes (“ETNs”), which are “multi-listed” options and listed on a non-exclusive basis. These options are eligible to trade on Cboe Options, C2, BZX, EDGX, and other U.S. national security exchanges. Cboe Options is the Company’s
primary options market and offers trading in listed options through a single system that integrates electronic trading and traditional open outcry trading on the Cboe Options trading floor in Chicago. C2 Options, BZX Options, and EDGX Options are all-electronic options exchanges, and typically operate with different market models and fee structures than Cboe Options. The Options segment also includes applicable market data fees generated from CBOE Holdings, Inc. tothe consolidated tape plans, the licensing of proprietary options market data, index licensing, and access and capacity services.
North American Equities. The North American Equities segment includes listed U.S. equities and ETP transaction services that occur on fully electronic exchanges owned and operated by BZX, BYX, EDGX, and EDGA, equities transactions that occur on the BIDS Trading platform, and Canadian equities and other transaction services that occur on or through the MATCHNow ATS. The North American Equities segment also includes ETP listings on BZX, the Cboe Global Markets, Inc. common stock listing, applicable market data fees generated from the consolidated tape plans, the licensing of proprietary equities market data, routing services, and access and capacity services.
Europe and Asia Pacific.The amendment to effectEurope and Asia Pacific segment includes the name change was filedpan-European listed equities and became effective withderivatives transaction services, ETPs, exchange-traded commodities, and international depository receipts that are hosted on MTFs operated by Cboe Europe Equities (Cboe Europe and Cboe NL equities exchanges) and Cboe Europe Derivatives (“CEDX”). It also includes the StateETP listings business on RMs and clearing activities of Delaware on October 16, 2017.
On February 28, 2017, pursuant to the Agreement and Plan of Merger, dated as of September 25, 2016, Cboe acquired Bats Global Markets, Inc. The three months ended September 30, 2017 includes financial results for Bats for the entire period. The nine months ended September 30, 2017 includes financial results for Bats for the period from March 1, 2017 through September 30, 2017, respectively.
Components of Revenues
Transaction Fees
Transaction fees represent fees charged by the Company for the performance obligation of executing a trade on its markets. These fees can be variable based on trade volume tiered discounts, however as all tiered discounts are calculated monthly, the actual discount is recorded on a monthly basis. Transaction fees,EuroCCP, as well as any tiered volume discounts, are calculatedthe equities transaction services of Cboe Australia and billed monthlyCboe Japan, each operators of trading venues in accordance withAustralia and Japan. This segment was previously referred to as the Company’s published fee schedules. Transaction fees are recognized across all segments.European Equities segment but was updated to the Europe segment in the first quarter of 2021 as a result of the launch of Cboe Europe Derivatives, a pan-European derivatives platform in September 2021. The Company also pays liquidity paymentssegment was subsequently updated to customersEurope and Asia Pacific to reflect the acquisition of Cboe Asia Pacific in July 2021. Cboe Europe operates lit and dark books, a periodic auctions book, and Cboe BIDS Europe, a Large-in-Scale (“LIS”) trading negotiation facility for UK symbols. Cboe NL, launched in October 2019 and based in Amsterdam, operates similar business functionality to that offered by Cboe Europe, and provides for trading only in European Economic Area (“EEA”) symbols. The new Cboe Europe Derivatives venue offers futures and options based on its published fee schedules. The Company uses these payments to improve the liquidity on its marketsCboe Europe equity indices. This segment also includes Cboe Europe, Cboe NL, CEDX, Cboe Australia, and therefore recognizes those payments as a cost of revenue.
Access Fees
Access fees represent fees assessed for the opportunity to trade, including fees for trading-related functionality across all segments. They are billed monthly in accordance with the Company’s published fee schedules and recognized on a monthly basis when the performance obligation is met. There is no remaining performance obligation afterCboe Japan revenue is recognized.
Exchange Services and Other Fees
To facilitate trading, the Company offers technology services, terminal and other equipment rights, maintenance services, trading floor space and telecommunications services. Trading floor and equipment rights are generally on a month-to-month basis. Facilities, systems services and other fees are generally monthly fee-based, although certain services are influenced by trading volume or other defined metrics, others are based solely on demand. All fees associated with the trading floor are recognized in the Options segment.
Market Data Fees
Market data fees represent the feesgenerated from the
U.S. tape plans and fees from customers for proprietary market data. Fees from the U.S. tape plans are collected monthly based on published fee schedules and distributed quarterly to the U.S. exchanges based on a known formula using trading and/or quoting activity. A contract aroundlicensing of proprietary market data
and from access and capacity services.Futures. The Futures segment includes transaction services provided by the Company’s fully electronic futures exchange, CFE, which includes offerings for trading of VIX futures and other futures products, the licensing of proprietary market data, as well as access and capacity services.
Global FX. The Global FX segment includes institutional FX trading services that occur on the Cboe FX fully electronic trading platform, non-deliverable forward FX transactions (“NDFs”) offered for execution on Cboe SEF and Cboe Swiss, as well as revenue generated from the licensing of proprietary market data and from access and capacity services.
General Factors Affecting Results of Operations
In broad terms, our business performance is entered intoimpacted by a number of drivers, including macroeconomic events affecting the risk and chargedreturn of financial assets, investor sentiment, the regulatory environment for capital markets, geopolitical events, tax policies, central bank policies and changing technology, particularly in the financial services industry. We believe our future revenues and net income will continue to be influenced by a number of domestic and international economic trends, including:
| ● | trading volumes on our proprietary products such as VIX options and futures and SPX options; |
| ● | trading volumes in listed equity securities, options, futures, and ETPs in North America, Europe, and Asia Pacific, clearing volumes in listed equity securities and ETPs in Europe, volumes in listed equity options, and volumes in institutional FX trading; |
| ● | the demand for and pricing structure of the U.S. tape plan market data distributed by the Securities Information Processors (“SIPs”), which determines the pool size of the industry market data fees we receive based on our market share; |
| ● | consolidation and expansion of our customers and competitors in the industry; |
| ● | the demand for information about, or access to, our markets and products, which is dependent on the products we trade, our importance as a liquidity center, quality and integrity of our proprietary indices, and the quality and pricing of our data and access and capacity services; |
| ● | continuing pressure in transaction fee pricing due to intense competition in the North American, European, and Asia Pacific markets; |
| ● | significant fluctuations in foreign currency translation rates or weakened value of currencies; and |
| ● | regulatory changes and obligations relating to market structure and increased capital requirements, and those which affect certain types of instruments, transactions, products, pricing structures, capital market participants or reporting or compliance requirements. |
A number of significant structural, political and monetary issues, global conflicts and the COVID-19 pandemic continue to confront the global economy, and instability could continue, resulting in an increased or subdued level of inflation, market volatility, supply chain constraints, changes in trading volumes and greater uncertainty, inflationary increases in our expenses, such as compensation inflation, may have an adverse effect on our financial results.
We continue to closely monitor developments around COVID-19 and follow guidance provided by governmental and public health agencies. In response to COVID-19, we have provided frequent communications to employees, customers, regulators, critical vendors, technology equipment suppliers, data and disaster recovery centers, and other service providers and instructed non-essential employees to work from home on a monthlytemporary basis, implemented travel restrictions, and temporarily suspended open outcry trading between March 13, 2020 and June 14, 2020, without any known significant disruptions to our business or control processes. We expect to continue to take further actions as necessary in accordance withresponse to addressing COVID-19. Our business and operations could be materially and adversely affected by the Company’s published fee schedules aseffects of COVID-19, however, the service is provided. Both typesextent to which our results could be affected by COVID-19 largely depends on future developments which cannot be accurately predicted and are uncertain. Further, changes in trading behavior, additional suspensions of open outcry trading, market disruptions and other future developments caused by the effects of COVID-19 could impact trading volumes and the demand for our products, market data, and services, which could have a material adverse effect on our business, financial condition, operating results and cash flows for fiscal year 2022 and could be material during any future period impacted either directly or indirectly by this pandemic.
Components of Revenues
Cash and Spot Markets
Revenue aggregated into cash and spot markets includes associated transaction and clearing fees, the portion of market data are satisfied over time, and revenue is recognized on a monthly basis as the customer receives and consumes the benefit as the Company provides the data.fees relating to associated U.S. tape plan market data is recognized infees, associated regulatory fees, and associated other revenue from the U.S.Company’s North American Equities, Europe and OptionsAsia Pacific, and Global FX segments. Proprietary
Data and Access Solutions
Revenue aggregated into data and access solutions includes access and capacity fees, proprietary market data fees, are recognizedand associated other revenue across all segments.
Regulatory Fees
Regulatory fees primarily represent fees collected by the Company to cover the Section 31 fees charged to the Exchanges by the SEC. Consistent with industry practice, the fees charged to customers are based on the fee set by the SEC per notional value of the transaction executed on the Company’s
marketsfive segments.Derivatives Markets
Includes associated transaction and calculatedclearing fees, the portion of market data fees relating to associated U.S. tape plan market data fees, associated regulatory fees, and billed monthly. Theseassociated other fees are recognized in the U.S. Equities and Options segments and as the exchanges are responsible for the ultimate payment to the SEC, the exchanges are considered the principals in these transactions. Regulatory fees also include the options regulatory fee (ORF) which supportsfrom the Company’s regulatory oversight function in the Options, segment.
Other Revenue
Other revenue primarily includes among other items, revenue from various licensing agreements, all fees related to the trade reporting facility operated in the European Equities segment,Futures, and revenue associated with advertisements through the Company’s website.
Europe and Asia Pacific segments.Components of Cost of Revenues
Liquidity payments are directly correlated to the volume of securities traded on our markets. As mentionedstated above, we record the liquidity rebaterebates paid to market participants providing liquidity, in the case of C2, BZX, EDGX, and Cboe Europe Equities and Derivatives, as cost of revenue. BYX and EDGA offer a pricing model pursuant to whichwhere we rebate liquidity takers for executing against an order resting on our book, which is also recorded as a cost of revenue.
revenues.Routing and clearing
ClearingVarious rules require that U.S. options and cash equities trade executions occur at the National Best Bid/Offer (NBBO)NBBO displayed by any exchange. Linkage order routing consists of the cost incurred to provide a service whereby Cboe equityequities and options exchanges deliver orders to other execution venues when there is a potential for obtaining a better execution price or when instructed to directly route an order to another venue by the order provider. The service affords exchange order flow providers an opportunity to obtain the best available execution price and may also result in cost benefits to those clients. Such an
offering improves our competitive position and provides an opportunity to attract orders which would otherwise bypass our exchanges. We utilize third-party brokers or our broker-dealer, Cboe Trading, to facilitate such delivery.
Also included within routing and clearing are the Order Management System and Execution Management System (“OMS” and “EMS”, respectively) fees incurred for U.S. Equities Off-Exchange order execution, as well as settlement costs incurred for the settlement process executed by EuroCCP.Section 31 Fees
Exchanges under the authority of the SEC (Cboe Options, C2, BZX, BYX, EDGX, and EDGA) are assessed fees pursuant to the Exchange Act designed to recover the costs to the U.S. government of supervision and regulation of securities markets and securities professionals. We treat these fees as a pass-through charge to customers executing eligible listed cash equities and listed equity options trades. Accordingly, we recognize the amount that we are charged under Section 31 as a cost of revenues and the corresponding amount that we charge our customers as regulatory transaction fees revenue. Since the regulatory transaction fees recorded in revenues are equal to the Section 31 fees recorded in cost of revenues, there is no impact on our operating income. CFE, Cboe Trading, Cboe Europe, EquitiesCboe NL, BIDS, MATCHNow, Cboe FX, Cboe Australia and Cboe FXJapan are not U.S. national securities exchanges, and accordingly doare not paycharged Section 31 fees.
and Other Cost of RevenuesRoyalty fees primarily consist of license fees paid by us for the use of underlying indexesindices in our proprietary products usually based on contracts traded. The Company has licenses with the owners of the S&P 500 Index, S&P 100 Index and certain other S&P indexes,indices, FTSE Russell indices, the DJIA, MSCI, FTSE Russell indexes and certain other index products. This category also includes fees related to the dissemination of market data related to S&P indexes.
indices and other products through Cboe Streaming Market Indices (“CSMI”).Other cost of revenues primarily consists of interest expense from clearing operations, electronic access permit fees and other miscellaneous costs associated with other revenue.
Components of Operating Expenses
Compensation and Benefits
Compensation and benefits represent our largest expense category and tend to be driven by both our staffing requirements, financial performance, and the general dynamics of the employment market. Stock-based compensation is a non-cash expense related to equity awards. Stock-based compensation can vary depending on the quantity and fair value of the award on the date of grant and the related service period.
Depreciation and Amortization
Depreciation and amortization expense results from the depreciation of long-lived assets purchased, and the amortization of purchased and internally developed software, and the amortization of intangible assets.
Technology Support Services
Technology support services expense consists primarily of costs related to the maintenance of computer equipment supporting our system architecture, circuits supporting our wide area network, support for production software, operating system license and support fees, fees paid to information vendors for displaying data and off-site system hosting fees.
Professional Fees and Outside Services
Professional fees and outside services consist primarily of consulting services, which include: the supplementation ofinclude supplemental staff for activities primarily related to systems development and maintenance, legal, regulatory and audit, and tax advisory services.
Travel and Promotional Expenses
Travel and promotional expenses primarily consist of advertising, costs for special events, sponsorship of industry conferences, options education seminars and travel-related expenses.
Facilities costs primarily consist of expenses related to owned and leased properties including rent, maintenance, utilities, real estate taxes and telecommunications costs.
Acquisition-Related Costs
Acquisition-related costs relate to acquisitions and other strategic opportunities, including the Merger. The acquisition-related transaction costs include fees for investment banking advisors, lawyers, accountants, tax advisors, public relations firms, severance write-offsand retention costs, impairment of obsolete systemsgoodwill, capitalized software and facilities, and other external costs directly related to the mergers and acquisitions.
Other expenses represent costs necessary to support our operations that are not already included in the above categories.
OtherNon-Operating (Expenses) Income (Expense)
Income and expenses incurred through activities outside of our core operations are considered non-operating and are classified as other income/(expense). income. These activities primarily include interest earned on the investing of excess cash, interest expense related to outstanding debt facilities, dividend income, income and unrealized gains and losses related to investments held in a trust for the Company’s non-qualified retirement and benefit plans, and equity earnings or losses from our investments in other business ventures.
Business Segments
The Company previously operated as a single reportable business segment as of December 31, 2016. As a result of the Merger, beginning in 2017, the Company is reporting five segments: Options, U.S. Equities, Futures, European Equities, and Global FX. Segment performance is primarily based on operating income (loss). The Company has aggregated all of its corporate costs and eliminations, as well as other business ventures, within Corporate Items and Eliminations; however, operating expenses that relate to activities of a specific segment have been allocated to that segment. Our management allocates resources, assesses performance and manages our business according to these segments:
Options. Our Options segment includes listed market indexes (index options), mostly on an exclusive basis, as well as on non-exclusive "multiply-listed" options, such as options on the stocks of individual corporations (equity options) and options on other exchange-traded products (ETP options), such as exchange-traded funds (ETF options) and exchange-traded notes (ETN options) that occur on Cboe Options, C2, BZX and EDGX. It also includes the listed equity and ETP options routed transaction services that occur on Trading.
U.S. Equities. Our U.S. Equities segment includes listed cash equities and ETP transaction services that occur on BZX, BYX, EDGX and EDGA. It also includes the listings business where ETPs and the Company are listed on BZX.
Futures. Our Futures segment includes trading of futures on the VIX Index and other products that occur on CFE, our all-electronic futures exchange.
European Equities. Our European Equities segment includes pan‑European listed equities transaction services, ETPs, exchange‑traded commodities, and international depository receipts that occur on our MTF, and a listing and trading venue on our RM, which together we refer to as Cboe Europe Equities. It also includes the listed cash equities and exchange-traded products routed transaction services that occur on Cboe Chi-X Europe, as well as the listings business where ETPs can be listed on Cboe Europe Equities.
Global FX. Our Global FX segment includes institutional FX trading services that occur on the Cboe FX platform, as well as non-deliverable forward FX transactions executed on Cboe SEF.
General Factors Affecting Results of Operations
In broad terms, our business performance is impacted by a number of drivers, including macroeconomic events affecting the risk and return of financial assets, investor sentiment, the regulatory environment for capital markets, geopolitical events, central bank policies and changing technology, particularly in the financial services industry. Our future revenues and net income will continue to be influenced by a number of domestic and international economic trends, including:
trading volumes on our proprietary products such as the VIX options and futures and SPX options;
trading volumes in listed cash equity securities and ETPs in both the U.S. and Europe, volumes in listed equity options, and volumes in institutional FX trading, all of which are driven primarily by overall macroeconomic conditions;
the demand for the U.S. tape plan market data distributed by the Securities Information Processors (SIPs), which determines the pool size of the industry market data revenue we receive based on our market share;
the demand for information about, or access to, our markets, which is dependent on the products we trade, our importance as a liquidity center and the quality and pricing of our data and access services;
continuing pressure in transaction fee pricing due to intense competition in the United States and Europe; and
regulatory changes relating to market structure, increased capital requirements or affecting certain types of instruments, transactions, pricing structures, capital market participants or reporting or compliance requirements, including any changes resulting from Brexit.
A number of significant structural, political and monetary issues continue to confront the global economy, and instability could return at any time, resulting in an increased level of market volatility, increased trading volumes and a return of uncertainty. In contrast, many of the largest customers of our transactional businesses continue to adapt their business models as they address the implementation of regulatory changes initiated following the global financial crisis.
The comparability of our results of operations between reported periods is impacted by the acquisition of Bats on February 28, 2017. Operating results and other financial metrics for U.S. Equities, European Equities and Global FX represent activity for the seven months ended September 30, 2017. The following summarizesare summaries of changes in financial performance for the three and nine months ended September 30, 2017 and 2016 andinclude certain non-GAAP financial measures. Management uses these non-GAAP measures internally in conjunction with GAAP measures to help evaluate our performance and to help make financial and operational decisions. These non-GAAP financialsfinancial measures assist management in comparing our performance on a consistent basis for purposes of business decision making by removing the impact of certain items management believes do not reflect our underlying operations.
We believe our presentation of these measures provides investors with greater transparency into financial measures used by management and is useful to investors for period-to-period comparisons of our ongoing operating performance.
These non-GAAP financial measures are not presented in accordance with, or as an alternative to, GAAP financial measures and may be calculated differently from non-GAAP measures used by other companies, which reduces their usefulness as comparative measures. We encourage analysts, investors and other interested parties to use these non-GAAP measures as supplemental information to the GAAP financial measures included herein, including our consolidated financial statements, to enhance their analysis and understanding of our performance and in making comparisons. Please see the footnotes below for definitions, additional information, and reconciliations from our condensed consolidatedthe closest GAAP measure.
The following summarizes changes in financial statements.
|
| | | | | | | | | | | | | | | | | | | | | | | | | | | | | | |
| | Three Months Ended September 30, | | Increase/ | | Percent | | | Nine Months Ended September 30, | | Increase/ | | Percent |
| 2017 | 2016 | | (Decrease) | | Change | | | 2017 | | 2016 | | (Decrease) | | Change |
| (in millions, except trading days, percentages and as noted below) | | | (in millions, except trading days, percentages and as noted below) |
| Total revenues | $ | 611.4 |
| | $ | 168.7 |
| | $ | 442.7 |
| | 262.4 | % | | | $ | 1,608.4 |
| | $ | 512.3 |
| | $ | 1,096.1 |
| | 214.0 | % |
| Total cost of revenues | 341.7 |
| | 32.5 |
| | 309.2 |
| | 951.4 | % | | | 878.4 |
| | 88.9 |
| | 789.5 |
| | 888.1 | % |
| Revenues less cost of revenues | 269.7 |
| | 136.2 |
| | 133.5 |
| | 98.0 | % | | | 730.0 |
| | 423.4 |
| | 306.6 |
| | 72.4 | % |
| Total operating expenses | 150.4 |
| | 70.4 |
| | 80.0 |
| | 113.6 | % | | | 466.8 |
| | 200.1 |
| | 266.7 |
| | 133.3 | % |
| Operating income | 119.3 |
| | 65.8 |
| | 53.5 |
| | 81.3 | % | | | 263.2 |
| | 223.3 |
| | 39.9 |
| | 17.9 | % |
| Income before income tax provision | 105.9 |
| | 67.4 |
| | 38.5 |
| | 57.1 | % | | | 230.3 |
| | 231.7 |
| | (1.4 | ) | | (0.6 | )% |
| Income tax provision | 45.6 |
| | 26.9 |
| | 18.7 |
| | 69.5 | % | | | 86.8 |
| | 91.1 |
| | (4.3 | ) | | (4.7 | )% |
| Net income | 60.3 |
| | 40.5 |
| | 19.8 |
| | 48.9 | % | | | 143.5 |
| | 140.6 |
| | 2.9 |
| | 2.1 | % |
| Net income allocated to common stockholders | $ | 59.7 |
| | $ | 40.3 |
| | $ | 19.4 |
| | 48.1 | % | | | $ | 142.1 |
| | $ | 140.0 |
| | $ | 2.1 |
| | 1.5 | % |
| Basic earnings per share | $ | 0.53 |
| | $ | 0.50 |
| | $ | 0.03 |
| | 6.0 | % | | | $ | 1.35 |
| | $ | 1.72 |
| | $ | (0.37 | ) | | (21.5 | )% |
| Diluted earnings per share | 0.53 |
| | 0.50 |
| | 0.03 |
| | 6.0 | % | | | 1.34 |
| | 1.72 |
| | (0.38 | ) | | (22.1 | )% |
| Organic net revenue (1) | 157.1 |
| | 136.2 |
| | 20.9 |
| | 15.3 | % | | | 463.3 |
| | 423.4 |
| | 39.9 |
| | 9.4 | % |
| EBITDA(2) | 171.2 |
| | 77.6 |
| | 93.6 |
| | 120.6 | % | | | 396.1 |
| | 265.7 |
| | 130.4 |
| | 49.1 | % |
| EBITDA margin(3) | 63.5 | % | | 57 | % | | 6.5 | % | | * |
| | | 54.3 | % | | 62.8 | % | | (8.5 | )% | | * |
|
| Adjusted EBITDA(2) | $ | 180.9 |
| | $ | 85.0 |
| | $ | 95.9 |
| | 112.8 | % | | | $ | 485.5 |
| | $ | 269.7 |
| | $ | 215.8 |
| | 80.0 | % |
| Adjusted EBITDA margin(4) | 67.1 | % | | 62.4 | % | | 4.7 | % | | * |
| | | 66.5 | % | | 63.7 | % | | 2.8 | % | | * |
|
| Adjusted earnings(5) | $ | 100.1 |
| | $ | 47.2 |
| | $ | 52.9 |
| | 112.1 | % | | | $ | 270.3 |
| | $ | 145.6 |
| | $ | 124.7 |
| | 85.6 | % |
| Diluted weighted average shares outstanding | 112.6 |
| | 81.3 |
| | 31.3 |
| | 38.5 | % | | | 105.8 |
| | 81.5 |
| | 24.3 |
| | 29.8 | % |
| Diluted adjusted earnings per share | $ | 0.89 |
| | $ | 0.58 |
| | $ | 0.31 |
| | 53.4 | % | | | $ | 2.56 |
| | $ | 1.79 |
| | $ | 0.77 |
| | 43.0 | % |
| Options: | | | | | | | | | | | | | | | | |
| Average Daily Volume (ADV): | | | | | | | | | | | | | | | | |
| Total touched contracts | 6.8 |
| | 6.1 |
| | 0.7 |
| | 11.5 | % | | | 6.9 |
| | 6.2 |
| | 0.7 |
| | 11.3 | % |
| Market ADV | 16.2 |
| | 15.4 |
| | 0.8 |
| | 5.2 | % | | | 16.5 |
| | 16.1 |
| | 0.4 |
| | 2.5 | % |
| Index contract ADV | 2.1 |
| | 1.7 |
| | 0.4 |
| | 23.5 | % | | | 2.0 |
| | 1.7 |
| | 0.3 |
| | 17.6 | % |
| Trading days | 63 |
| | 64 |
| | (1 | ) | | (1.6 | )% | | | 188 |
| | 189 |
| | (1 | ) | | (0.5 | )% |
| U.S. Equities: | | | | | | | | | | | | | | | | |
| ADV: | | | | | | | | | | | | | | | | |
| Total touched shares ADV (in billions) | 1.2 |
| | — |
| | 1.2 |
| | * |
| | | 1.3 |
| | — |
| | 1.3 |
| | * |
|
| Market ADV (in billions) | 6.1 |
| | — |
| | 6.1 |
| | * |
| | | 6.5 |
| | — |
| | 6.5 |
| | * |
|
| Trading days | 63 |
| | — |
| | 63 |
| | * |
| | | 149 |
| | — |
| | 149 |
| | * |
|
| U.S. ETPs: launches (number of launches) | 23 |
| | — |
| | 23 |
| | * |
| | | 64 |
| | — |
| | 64 |
| | * |
|
| U.S. ETPs: listings (number of listings) | 234 |
| | — |
| | 234 |
| | * |
| | | 234 |
| | — |
| | 234 |
| | * |
|
| Futures: | | | | | | | | | | | | | | | | |
| ADV (in thousands) | 331.1 |
| | 243.6 |
| | 87.5 |
| | 35.9 | % | | | 311.1 |
| | 239.8 |
| | 71.3 |
| | 29.7 | % |
| Trading days | 63 |
| | 64 |
| | (1 | ) | | (1.6 | )% | | | 188 |
| | 189 |
| | (1 | ) | | (0.5 | )% |
| European Equities: | | | | | | | | | | | | | | | | |
| Average Daily Notional Value (ADNV): | | | | | | | | | | | | | | | | |
| Matched and touched ADNV (in billions) | € | 8.7 |
| | € | — |
| | € | 8.7 |
| | * |
| | | € | 9.6 |
| | € | — |
| | € | 9.6 |
| | * |
|
| Market ADNV (in billions) | € | 41.1 |
| | € | — |
| | € | 41.1 |
| | * |
| | | € | 45.2 |
| | € | — |
| | € | 45.2 |
| | * |
|
| Trading days | 65 |
| | — |
| | 65 |
| | * |
| | | 151 |
| | — |
| | 151 |
| | * |
|
| Average Euro/British pound exchange rate | £ | 0.898 |
| | £ | 0.848 |
| | £ | 0.050 |
| | 5.9 | % | | | £ | 0.873 |
| | £ | 0.800 |
| | £ | 0.073 |
| | 9.1 | % |
| Global FX: | | | | | | | | | | | | | | | | |
| ADNV (in billions) | $ | 29.0 |
| | $ | — |
| | $ | 29.0 |
| | * |
| | | $ | 28.7 |
| | $ | — |
| | $ | 28.7 |
| | * |
|
| Trading days | 65 |
| | — |
| | 65 |
| | * |
| | | 153 |
| | — |
| | 153 |
| | * |
|
| Market share: | | | | | | | | | | | | | | | | |
| Options | 41.7 | % | | 28.4 | % | | 13.3 | % | | * |
| | | 40.3 | % | | 27.4 | % | | 12.9 | % | | * |
|
| U.S. Equities | 19.2 | % | | — | % | | 19.2 | % | | * |
| | | 19.2 | % | | — | % | | 19.2 | % | | * |
|
| ETPs: launches | 37.1 | % | | — | % | | 37.1 | % | | * |
| | | 37.9 | % | | — | % | | 37.9 | % | | * |
|
| ETPs: listings | 11.5 | % | | — | % | | 11.5 | % | | * |
| | | 11.5 | % | | — | % | | 11.5 | % | | * |
|
|
| | | | | | | | | | | | | | | | | | | | | | | | | | | | | | |
| European Equities | 21.1 | % | | — | % | | 21.1 | % | | * |
| | | 21.2 | % | | — | % | | 21.2 | % | | * |
|
| Net capture: | | | | | | | | | | | | | | | | |
| Total Options (revenue per contract)(6) | $ | 0.247 |
| | $ | 0.302 |
| | $ | (0.055 | ) | | (18.2 | )% | | | $ | 0.245 |
| | $ | 0.325 |
| | $ | (0.080 | ) | | (24.6 | )% |
| Multiply Listed Options | 0.061 |
| | 0.064 |
| | (0.003 | ) | | (4.7 | )% | | | 0.060 |
| | 0.083 |
| | (0.023 | ) | | (27.7 | )% |
| Index Options | 0.669 |
| | 0.707 |
| | (0.038 | ) | | (5.4 | )% | | | 0.690 |
| | 0.709 |
| | (0.019 | ) | | (2.7 | )% |
| U.S. Equities (net capture per one hundred touched shares)(7) | 0.022 |
| | — |
| | 0.022 |
| | * |
| | | 0.023 |
| | — |
| | 0.023 |
| | * |
|
| Futures | 1.752 |
| | 1.709 |
| | 0.043 |
| | 2.5 | % | | | 1.759 |
| | 1.680 |
| | 0.079 |
| | 4.7 | % |
| European Equities (net capture per matched notional value in basis points)(8) | 0.168 |
| | — |
| | 0.168 |
| | * |
| | | 0.164 |
| | — |
| | 0.164 |
| | * |
|
| Global FX (net capture per one million dollars traded) (9) | $ | 2.63 |
| | $ | — |
| | $ | 2.63 |
| | * |
| | | $ | 2.63 |
| | $ | — |
| | $ | 2.63 |
| | * |
|
| Average British pound/U.S. dollar exchange rate | $ | 1.309 |
| | $ | 1.313 |
| | $ | (0.004 | ) | | (0.3 | )% | | | $ | 1.274 |
| | $ | 1.393 |
| | $ | (0.119 | ) | | (8.5 | )% |
* Not meaningful
performance for the three months ended March 31, 2022, compared to the three months ended March 31, 2021: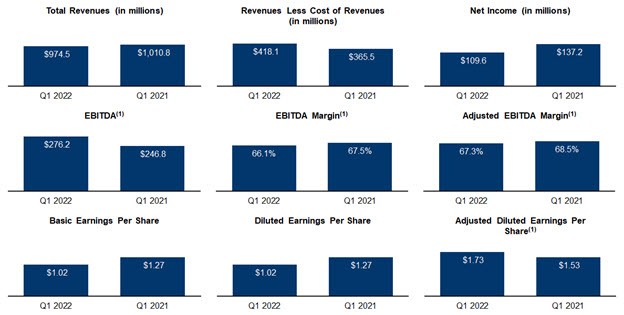
| (1) | These are Non-GAAP figures for which reconciliations are provided below. |
| | | | | | | | | | | | | |
| | Three Months Ended March 31, | | Increase/ | | Percent | | |
| | 2022 | | 2021 | | (Decrease) | | Change | | |
|
| | (in millions, except percentages, earnings per share, and as noted below) | | |
Total revenues | | $ | 974.5 | | $ | 1,010.8 | | $ | (36.3) | | (4) | % | |
Total cost of revenues | | | 556.4 | | | 645.3 | | | (88.9) | | (14) | % | |
Revenues less cost of revenues | | | 418.1 | | | 365.5 | | | 52.6 | | 14 | % | |
Total operating expenses | | | 178.4 | | | 160.9 | | | 17.5 | | 11 | % | |
Operating income | | | 239.7 | | | 204.6 | | | 35.1 | | 17 | % | |
Income before income tax provision | | | 224.9 | | | 192.9 | | | 32.0 | | 17 | % | |
Income tax provision | | | 115.3 | | | 55.7 | | | 59.6 | | 107 | % | |
Net income | | $ | 109.6 | | $ | 137.2 | | $ | (27.6) | | (20) | % | |
Basic earnings per share | | $ | 1.02 | | $ | 1.27 | | $ | (0.25) | | (20) | % | |
Diluted earnings per share | | | 1.02 | | | 1.27 | | | (0.25) | | (20) | % | |
Organic net revenue (1) | | | 409.7 | | | 365.5 | | | 44.2 | | 12 | % | |
EBITDA (2) | | | 276.2 | | | 246.8 | | | 29.4 | | 12 | % | |
EBITDA margin (3) | | | 66.1 | % | | 67.5 | % | | (1.4) | % | | * | |
Adjusted EBITDA (2) | | $ | 281.2 | | $ | 250.2 | | $ | 31.0 | | 12 | % | |
Adjusted EBITDA margin (4) | | | 67.3 | % | | 68.5 | % | | (1.2) | % | | * | |
Adjusted earnings (5) | | $ | 184.3 | | $ | 164.8 | | $ | 19.5 | | 12 | % | |
Adjusted earnings margin (5) | | | 44.1 | % | | 45.1 | % | | (1.0) | % | | * | |
Diluted weighted average shares outstanding | | | 106.8 | | | 107.4 | | | (0.6) | | (1) | % | |
Adjusted Diluted earnings per share (6) | | $ | 1.73 | | $ | 1.53 | | $ | 0.20 | | 13 | % | |
| (1) | Organic net revenue is defined as revenues less cost of revenues excluding revenues less cost of revenues of any acquisition that has been owned for the quarter the business was acquiredless than one year. Revenues from acquisitions that have been owned at least one year are considered organic and the following year comparable quarter.are no longer excluded from organic net revenue from either period for comparative purposes. Organic net revenue does not represent, and should not be considered as, an alternative to revenues less cost of revenues, or net revenue, as determined in accordance with GAAP. We have presented organic net revenue because we consider it an important supplemental measure of our performance and we use it as the basis for monitoring our operating financial performance before the effects of acquisitions. We also believe that it is frequently used by analysts, investors and other interested parties in the evaluation of companies. We believe that investors may find this non-GAAP measure useful in evaluating our performance compared to that of peer companies in our industry. Other companies may calculate organic net revenue differently than we do. Organic net revenue has limitations as an analytical tool, and you should not consider it in isolation or as a substitute for analysis of our results as reported under GAAP. |
The following is a reconciliation of revenues less cost of revenues to organic net revenue (in millions):
| | | | | | |
| | Three Months Ended |
| | March 31, |
| | 2022 | | 2021 |
| | | | Three Months Ended
September 30, | | Nine Months Ended
September 30, | |
| 2017 | | 2016 | | 2017 | | 2016 | |
| | (in millions) |
| Revenues less cost of revenues | $ | 269.7 |
| | $ | 136.2 |
| | $ | 730.0 |
| | $ | 423.4 |
| $ | 418.1 | | $ | 365.5 |
| Recent acquisitions: | | | | | | | | | | | | |
| Bats revenues less cost of revenues (since acquisition) | $ | (112.6 | ) | | $ | — |
| | $ | (266.7 | ) | | $ | — |
| |
Acquisition revenues less cost of revenues | | $ | (8.4) | | $ | — |
| Organic net revenue | $ | 157.1 |
| | $ | 136.2 |
| | $ | 463.3 |
| | $ | 423.4 |
| $ | 409.7 | | $ | 365.5 |
| |
| (2) | EBITDA is defined as income before interest, income taxes, depreciation and amortization. Adjusted EBITDA is defined as EBITDA before acquisition-related costs accelerated stock-based compensation, and a legal settlement.investment establishment costs. EBITDA and adjusted EBITDA do not represent, and should not be considered as, alternatives to net income or cash flows from operations, each as determined in accordance with GAAP. We have presented EBITDA and adjusted EBITDA because we consider them important supplemental measures of our performance and believe that they are frequently used by analysts, investors and other interested parties in the evaluation of companies. In addition, we use adjusted EBITDA as a measure of operating performance for preparation of our forecasts and evaluating our leverage ratio for the debt to earnings covenant included in our outstanding credit facility. Other companies may calculate EBITDA and adjusted EBITDA differently than we do. EBITDA and adjusted EBITDA have limitations as analytical tools, and you should not consider them in isolation or as substitutes for analysis of our results as reported under GAAP. |
The following tables are reconciliations of net income allocated to common stockholders to EBITDA and adjusted EBITDA (in millions):
|
| | | | | | | | | | | | | | | | | | | | | |
| | Three Months Ended September 30, 2017 |
| Options | U.S. Equities | Futures | European Equities | Global FX | Corporate Items and Eliminations | Total |
| Net income (loss) allocated to common stockholders | $ | 60.6 |
| $ | 29.6 |
| $ | 35.1 |
| $ | 2.9 |
| $ | (3.5 | ) | $ | (65.0 | ) | $ | 59.7 |
|
| Interest | — |
| — |
| — |
| — |
| — |
| 10.5 |
| 10.5 |
|
| Income tax provision | — |
| — |
| — |
| — |
| — |
| 45.6 |
| 45.6 |
|
| Depreciation and amortization | 14.0 |
| 23.9 |
| 0.4 |
| 7.7 |
| 9.1 |
| 0.3 |
| 55.4 |
|
| EBITDA | 74.6 |
| 53.5 |
| 35.5 |
| 10.6 |
| 5.6 |
| (8.6 | ) | 171.2 |
|
| Acquisition-related costs | — |
| — |
| — |
| — |
| — |
| 5.5 |
| 5.5 |
|
| Change in contingent consideration | — |
| — |
| — |
| — |
| 0.4 |
| — |
| 0.4 |
|
Provision for uncollectable convertible notes receivable
| 3.8 |
| — |
| — |
| — |
| — |
| — |
| 3.8 |
|
| Adjusted EBITDA | $ | 78.4 |
| $ | 53.5 |
| $ | 35.5 |
| $ | 10.6 |
| $ | 6.0 |
| $ | (3.1 | ) | $ | 180.9 |
|
|
| | | | | | | | | | | | | | | | | | | | | |
| Three Months Ended September 30, 2016 |
| Options | U.S. Equities | Futures | European Equities | Global FX | Corporate Items and Eliminations | Total |
| Net income (loss) allocated to common stockholders | $ | 17.2 |
| $ | — |
| $ | 25.5 |
| $ | — |
| $ | — |
| $ | (2.4 | ) | $ | 40.3 |
|
| Interest | 0.3 |
| — |
| — |
| — |
| — |
| (0.1 | ) | 0.2 |
|
| Income tax provision | 26.9 |
| — |
| — |
| — |
| — |
| — |
| 26.9 |
|
| Depreciation and amortization | 9.3 |
| — |
| 0.6 |
| — |
| — |
| 0.3 |
| 10.2 |
|
| EBITDA | 53.7 |
| — |
| 26.1 |
| — |
| — |
| (2.2 | ) | 77.6 |
|
| Acquisition-related costs | — |
| — |
| — |
| — |
| — |
| 8.6 |
| 8.6 |
|
| Gain on settlement of contingent consideration | — |
| — |
| — |
| — |
| — |
| (1.4 | ) | (1.4 | ) |
| Accelerated stock-based compensation | — |
| — |
| — |
| — |
| — |
| 0.2 |
| 0.2 |
|
| Adjusted EBITDA | $ | 53.7 |
| $ | — |
| $ | 26.1 |
| $ | — |
| $ | — |
| $ | 5.2 |
| $ | 85.0 |
|
|
| | | | | | | | | | | | | | | | | | | | | |
| | Nine Months Ended September 30, 2017 |
| | Options | U.S. Equities | Futures | European Equities | Global FX | Corporate Items and Eliminations | Total |
| Net income (loss) allocated to common stockholders | $ | 149.1 |
| $ | 74.2 |
| $ | 94.4 |
| $ | 5.5 |
| $ | (8.9 | ) | $ | (172.2 | ) | $ | 142.1 |
|
| Interest | — |
| — |
| — |
| — |
| — |
| 30.9 |
| 30.9 |
|
| Income tax provision | 37.7 |
| 0.9 |
| — |
| 2.5 |
| 0.1 |
| 45.6 |
| 86.8 |
|
| Depreciation and amortization | 39.1 |
| 56.4 |
| 1.1 |
| 17.6 |
| 21.2 |
| 0.9 |
| 136.3 |
|
| EBITDA | 225.9 |
| 131.5 |
| 95.5 |
| 25.6 |
| 12.4 |
| (94.8 | ) | 396.1 |
|
| Acquisition-related costs | — |
| — |
| — |
| — |
| — |
| 75.4 |
| 75.4 |
|
| Change in contingent consideration | — |
| — |
| — |
| — |
| 1.1 |
| — |
| 1.1 |
|
Provision for uncollectable convertible notes receivable
| 3.8 |
| — |
| — |
| — |
| — |
| — |
| 3.8 |
|
| Accelerated stock-based compensation | — |
| — |
| — |
| — |
| — |
| 9.1 |
| 9.1 |
|
| Adjusted EBITDA | $ | 229.7 |
| $ | 131.5 |
| $ | 95.5 |
| $ | 25.6 |
| $ | 13.5 |
| $ | (10.3 | ) | $ | 485.5 |
|
|
| | | | | | | | | | | | | | | | | | | | | |
| Nine Months Ended September 30, 2016 |
| Options | U.S. Equities | Futures | European Equities | Global FX | Corporate Items and Eliminations | Total |
| Net income (loss) allocated to common stockholders | $ | 70.2 |
| $ | — |
| $ | 72.2 |
| $ | — |
| $ | — |
| $ | (2.4 | ) | $ | 140.0 |
|
| Interest | 0.3 |
| — |
| — |
| — |
| — |
| (0.1 | ) | 0.2 |
|
| Income tax provision | 91.1 |
| — |
| — |
| — |
| — |
| — |
| 91.1 |
|
| Depreciation and amortization | 31.0 |
| — |
| 2.4 |
| — |
| — |
| 1.0 |
| 34.4 |
|
| EBITDA | 192.6 |
| — |
| 74.6 |
| — |
| — |
| (1.5 | ) | 265.7 |
|
| Acquisition-related costs | — |
|
|
|
|
| — |
| — |
| 9.3 |
| 9.3 |
|
| Legal settlement | — |
| — |
| — |
| — |
| — |
| (5.5 | ) | (5.5 | ) |
| Assessment of computer-based lease taxes for prior period use | — |
| — |
| — |
| — |
| — |
| 0.3 |
| 0.3 |
|
| Accelerated stock-based compensation | — |
| — |
| — |
| — |
| — |
| 1.3 |
| 1.3 |
|
| Gain on settlement of contingent consideration | — |
| — |
| — |
| — |
| — |
| (1.4 | ) | (1.4 | ) |
| Adjusted EBITDA | $ | 192.6 |
| $ | — |
| $ | 74.6 |
| $ | — |
| $ | — |
| $ | 2.5 |
| $ | 269.7 |
|
| |
| (3) | EBITDA margin represents EBITDA divided by revenues less cost of revenues. |
| |
| (4) | Adjusted EBITDA margin represents adjusted EBITDA divided by revenues less cost of revenues. |
| |
| (5) | Adjusted earnings is defined as net income adjusted for amortization of purchased intangibles, acquisition-related costs, legal settlements,investment establishment costs, tax reserves, and accelerated stock-based compensation,net income allocated to participating securities, net of the income tax effects of these adjustments. Adjusted earnings does not represent, and should not be considered as, an alternative to net income, as determined in accordance with GAAP. We have presented adjusted earnings because we consider it an important supplemental measure of our performance and we use it as the basis for monitoring our own core operating financial performance relative to other operators of exchanges. We also believe that it is frequently used by analysts, investors and other interested parties in the evaluation of companies. We believe that investors may find this non-GAAP measure useful in evaluating our performance compared to that of peer companies in our industry. Other companies may calculate adjusted earnings differently than we do. Adjusted earnings has limitations as an analytical tool, and you should not consider it in isolation or as a substitute for analysis of our results as reported under GAAP. |
| (6) | Adjusted diluted earnings per share represents adjusted earnings divided by diluted weighted average shares outstanding. |
The following is a reconciliation of net income (loss) allocated to common stockholders to EBITDA and adjusted EBITDA (in millions):
| | | | | | | | | | | | | | | | | | | | | |
| | Three Months Ended March 31, |
| | 2022 |
| | Options | | North American Equities | | Europe and Asia Pacific | | Futures | | Global FX | | Corporate | | Total |
Net income (loss) allocated to common stockholders | | $ | 162.4 | | $ | 38.4 | | $ | 14.0 | | $ | 16.9 | | $ | 2.4 | | $ | (124.9) | | $ | 109.2 |
Interest expense, net | | | — | | | — | | | 1.9 | | | — | | | — | | | 8.9 | | | 10.8 |
Income tax provision | | | — | | | — | | | 4.8 | | | — | | | — | | | 110.5 | | | 115.3 |
Depreciation and amortization | | | 6.7 | | | 18.1 | | | 9.6 | | | 0.7 | | | 5.8 | | | — | | | 40.9 |
EBITDA | | | 169.1 | | | 56.5 | | | 30.3 | | | 17.6 | | | 8.2 | | | (5.5) | | | 276.2 |
Acquisition-related costs | | | — | | | 0.4 | | | 0.8 | | | — | | | — | | | 0.8 | | | 2.0 |
Investment establishment costs | | | — | | | — | | | — | | | — | | | — | | | 3.0 | | | 3.0 |
Adjusted EBITDA | | $ | 169.1 | | $ | 56.9 | | $ | 31.1 | | $ | 17.6 | | $ | 8.2 | | $ | (1.7) | | $ | 281.2 |
| | | | | | | | | | | | | | | | | | | | | |
| | Three Months Ended March 31, |
| | 2021 |
| | Options | | North American Equities | | Europe and Asia Pacific | | Futures | | Global FX | | Corporate | | Total |
Net income (loss) allocated to common stockholders | | $ | 127.9 | | $ | 43.7 | | $ | 7.8 | | $ | 17.4 | | $ | 1.2 | | $ | (61.2) | | $ | 136.8 |
Interest expense, net | | | — | | | — | | | 3.4 | | | — | | | — | | | 8.9 | | | 12.3 |
Income tax provision | | | — | | | 1.2 | | | 3.5 | | | — | | | — | | | 51.0 | | | 55.7 |
Depreciation and amortization | | | 7.4 | | | 19.6 | | | 7.9 | | | 0.7 | | | 6.4 | | | — | | | 42.0 |
EBITDA | | | 135.3 | | | 64.5 | | | 22.6 | | | 18.1 | | | 7.6 | | | (1.3) | | | 246.8 |
Acquisition-related costs | | | 0.3 | | | — | | | — | | | — | | | — | | | 3.1 | | | 3.4 |
Adjusted EBITDA | | $ | 135.6 | | $ | 64.5 | | $ | 22.6 | | $ | 18.1 | | $ | 7.6 | | $ | 1.8 | | $ | 250.2 |
The following is a reconciliation of net income allocated to common stockholders to adjusted earnings (in millions):
| | | | | | | |
| | Three Months Ended | |
| | March 31, | |
| | 2022 | | 2021 | |
Net income allocated to common stockholders | | $ | 109.2 | | $ | 136.8 | |
Amortization | | | 30.6 | | | 32.9 | |
Acquisition-related costs | | | 2.0 | | | 3.4 | |
Investment establishment costs | | | 3.0 | | | — | |
Tax reserves | | | 48.5 | | | — | |
Tax effect of adjustments | | | (8.7) | | | (8.2) | |
Net income allocated to participating securities | | | (0.3) | | | (0.1) | |
Adjusted earnings | | $ | 184.3 | | $ | 164.8 | |
The following summarizes changes in certain operational and financial metrics for the three months ended March 31, 2022, compared to the three months ended March 31, 2021:
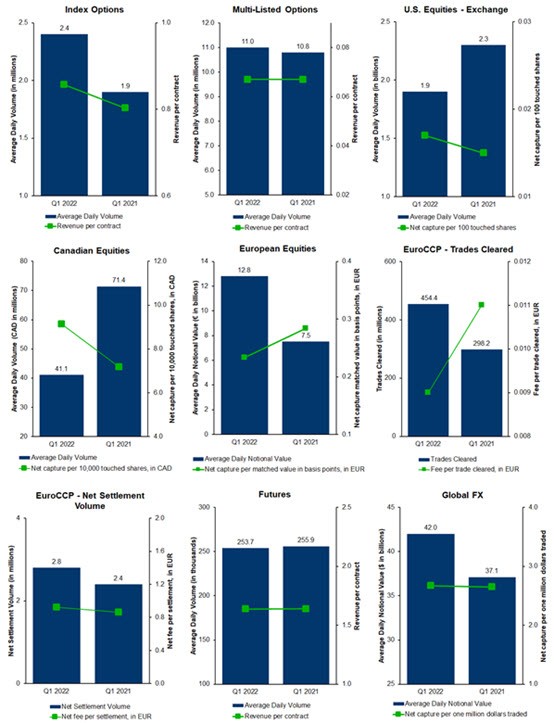
The following table includes operational and financial metrics for our Options, North American Equities, Europe and Asia Pacific, Futures, and Global FX segments. The metrics listed for Australian Equities and Japanese Equities in the table below are newly added for the three months ended March 31, 2022 as a result of the acquisition completed during 2021. Therefore, the table does not include results from the periods preceding each acquisition for the applicable metrics. The following summarizes changes in certain operational and financial metrics for the three months ended March 31, 2022 compared to the three months ended March 31, 2021:
| | | | | | | | | | | | | |
| | Three Months Ended March 31, | | Increase/ | | Percent | | |
| | 2022 | | 2021 | | (Decrease) | | Change | | |
|
| | (in millions, except percentages, trading days, and as noted below) | | |
Options: | | | | | | | | | | | | | |
Average daily volume (ADV) (in millions of contracts): | | | | | | | | | | | | | |
Market ADV | | | 42.5 | | | 42.0 | | | 0.5 | | 1 | % | |
Total touched contracts (1) | | | 13.4 | | | 12.7 | | | 0.7 | | 6 | % | |
Multi-listed contract ADV | | | 11.0 | | | 10.8 | | | 0.2 | | 2 | % | |
Index contract ADV | | | 2.4 | | | 1.9 | | | 0.5 | | 27 | % | |
Number of trading days | | | 62 | | | 61 | | | 1 | | 2 | % | |
Total Options revenue per contract (RPC) (2) | | $ | 0.210 | | $ | 0.177 | | $ | 0.033 | | 18 | % | |
Multi-listed options RPC (2) | | | 0.067 | | | 0.067 | | | — | | — | % | |
Index options RPC (2) | | | 0.857 | | | 0.803 | | | 0.054 | | 7 | % | |
Total Options market share | | | 31.5 | % | | 30.2 | % | | 1.3 | % | | * | |
Multi-listed options market share | | | 27.4 | % | | 26.9 | % | | 0.5 | % | | * | |
Index options market share | | | 99.1 | % | | 99.0 | % | | 0.1 | % | | * | |
North American Equities: | | | | | | | | | | | | | |
U.S. Equities: | | | | | | | | | | | | | |
U.S. Equities - Exchange: | | | | | | | | | | | | | |
ADV: | | | | | | | | | | | | | |
Total touched shares (in billions) (1) | | | 1.9 | | | 2.3 | | | (0.4) | | (17) | % | |
Market ADV (in billions) | | | 12.9 | | | 14.7 | | | (1.8) | | (12) | % | |
Market share | | | 14.3 | % | | 15.0 | % | | (0.7) | % | | * | |
U.S. Equities - Exchange (net capture per one hundred touched shares) (3) | | $ | 0.017 | | $ | 0.015 | | $ | 0.002 | | 8 | % | |
U.S. ETPs: launches (number of launches) | | | 32 | | | 35 | | | (3) | | (9) | % | |
U.S. ETPs: listings (number of listings) | | | 566 | | | 471 | | | 95 | | 20 | % | |
U.S. Equities - Off-Exchange: | | | | | | | | | | | | | |
ADV: | | | | | | | | | | | | | |
Total touched shares (in millions) (1) | | | 108.5 | | | 99.5 | | | 9.0 | | 9 | % | |
U.S. Equities - Off-Exchange (net capture per one hundred touched shares) (4) | | $ | 0.117 | | $ | 0.121 | | $ | (0.004) | | (4) | % | |
Trading days | | | 62 | | | 61 | | | 1 | | 2 | % | |
Canadian Equities: | | | | | | | | | | | | | |
ADV (matched shares, in millions) (5) | | | 41.1 | | | 71.4 | | | (30.3) | | (42) | % | |
Trading days | | | 62 | | | 62 | | | — | | — | % | |
Net capture (per 10,000 touched shares, in Canadian dollars) (6) | | | 9.131 | | | 7.184 | | | 1.947 | | 27 | % | |
Europe and Asia Pacific: | | | | | | | | | | | | | |
European Equities: | | | | | | | | | | | | | |
ADNV: | | | | | | | | | | | | | |
Matched ADNV (in billions) (7) | | € | 12.8 | | € | 7.5 | | € | 5.3 | | 71 | % | |
Market ADNV (in billions) | | | 58.7 | | | 44.8 | | | 13.9 | | 31 | % | |
Trading days | | | 64 | | | 63 | | | 1 | | 2 | % | |
Market share | | | 21.8 | % | | 16.8 | % | | 5.0 | % | | * | |
Net capture (per matched notional value in basis points) (8) | | | 0.233 | | | 0.284 | | | (0.051) | | (18) | % | |
EuroCCP: | | | | | | | | | | | | | |
Trades cleared (9) | | | 454.4 | | | 298.2 | | | 156.2 | | 52 | % | |
Fee per trade cleared (10) | | € | 0.009 | | € | 0.011 | | € | (0.002) | | (14) | % | |
Net settlement volume (11) | | | 2.8 | | | 2.4 | | | 0.4 | | 16 | % | |
Net fee per settlement (12) | | € | 0.924 | | € | 0.865 | | € | 0.059 | | 7 | % | |
Australian Equities: | | | | | | | | | | | | | |
ADNV (AUD billions) | | $ | 0.9 | | $ | — | | $ | 0.9 | | — | % | |
Trading days | | | 63 | | | — | | | 63 | | — | % | |
Market share - Continuous | | | 15.8 | % | | — | % | | 15.8 | | | * | |
Net capture (per matched notional value in basis points) (13) | | | 0.173 | | | — | | | 0.173 | | — | % | |
Japanese Equities: | | | | | | | | | | | | | |
ADNV (JPY billions) | | ¥ | 164.6 | | ¥ | — | | ¥ | 164.6 | | — | % | |
Trading days | | | 58 | | | — | | | 58 | | — | % | |
Market share - Lit Continuous | | | 3.8 | % | | — | % | | 3.8 | % | | * | |
Net capture (per matched notional value in basis points) (14) | | | 0.228 | | | — | | | 0.228 | | — | % | |
Futures: | | | | | | | | | | | | | |
ADV (in thousands) | | | 253.7 | | | 255.9 | | | (2.2) | | (1) | % | |
Trading days | | | 62 | | | 61 | | | 1 | | 2 | % | |
Revenue per contract | | $ | 1.637 | | $ | 1.639 | | $ | (0.002) | | — | % | |
Global FX: | | | | | | | | | | | | | |
ADNV (in billions) | | $ | 42.0 | | $ | 37.1 | | $ | 4.9 | | 13 | % | |
Trading days | | | 64 | | | 63 | | | 1 | | 2 | % | |
Global FX (net capture per one million dollars traded) (15) | | | 2.67 | | | 2.65 | | | 0.02 | | 1 | % | |
| | | | | | | | | | | | | |
Average British pound/U.S. dollar exchange rate | | $ | 1.342 | | $ | 1.379 | | $ | (0.037) | | (3) | % | |
Average Canadian dollar/U.S. dollar exchange rate | | $ | 0.789 | | $ | 0.790 | | $ | (0.001) | | — | % | |
Average Euro/U.S. dollar exchange rate | | $ | 1.122 | | $ | 1.205 | | $ | (0.083) | | (7) | % | |
Average Euro/British pound exchange rate | | £ | 0.836 | | £ | 0.874 | | £ | (0.038) | | (4) | % | |
Average Australian dollar/U.S. dollar exchange rate | | $ | 0.721 | | $ | — | | $ | 0.721 | | — | % | |
Average Japanese Yen/U.S. dollar exchange rate | | $ | 0.009 | | $ | — | | $ | 0.009 | | — | % | |
|
| | | | | | | | | | | | | | | |
| | Three Months Ended
September 30, | | Nine Months Ended
September 30, |
| 2017 | | 2016 | | 2017 | | 2016 |
| Net income allocated to common stockholders | $ | 59.7 |
| | $ | 40.3 |
| | $ | 142.1 |
| | $ | 140.0 |
|
| Amortization | 42.6 |
| | 0.3 |
| | 99.6 |
| | 0.9 |
|
| Acquisition-related costs | 5.5 |
| | 8.6 |
| | 75.4 |
| | 9.3 |
|
Provision for uncollectable convertible notes receivable
| 3.8 |
| | — |
| | 3.8 |
| | — |
|
| Debt issuance cost | — |
| | — |
| | 0.9 |
| | — |
|
| Assessment of computer-based lease taxes | — |
| | — |
| | — |
| | 0.3 |
|
| Acceleration of stock based compensation | — |
| | — |
| | 9.1 |
| | — |
|
| Other compensation related items | — |
| | 0.2 |
| | — |
| | 1.3 |
|
| Legal settlement | — |
| | — |
| | — |
| | (5.5 | ) |
| Interest and other borrowing costs | — |
| | 0.2 |
| | 4.3 |
| | 0.2 |
|
| Change in contingent consideration | 0.4 |
| | — |
| | 1.1 |
| | — |
|
| Gain on settlement of contingent consideration | — |
| | (1.4 | ) | | — |
| | (1.4 | ) |
| Change in redemption value of noncontrolling interest | 0.2 |
| | 0.3 |
| | 0.8 |
| | 0.8 |
|
| Tax effects of adjustments | (19.1 | ) | | (1.3 | ) | | (73.1 | ) | | (0.3 | ) |
| Re-measurement of deferred tax assets and liabilities as a result of corporate rate increases in Illinois | 7.4 |
| | — |
| | 7.4 |
| | — |
|
| Net income allocated to participating securities | (0.4 | ) | | — |
| | (1.1 | ) | | — |
|
| Adjusted earnings | $ | 100.1 |
| | $ | 47.2 |
| | $ | 270.3 |
| | $ | 145.6 |
|
Note, the percent change listed represents the change in the unrounded metrics figures.
(6)(1) | RevenueTouched volume represents the total number of shares of equity securities and ETFs internally matched on our exchanges or routed to and executed on an external market center. |
| (2) | Average revenue per contract, for options and futures represents total net transaction fees less liquidity payments and routing and clearing costsrecognized for the period divided by total contracts traded during the period. |
divided by total touched contracts.
| (3) | |
(7) | Net capture per one hundred touched shares refers to transaction fees less liquidity payments and routing and clearing costs divided by the product of one-hundredth ADV of touched shares on BZX, BYX, EDGX, and EDGA and the number of trading days. |
| (4) | Net capture per 100 touched shares refers to transaction fees less order and execution management system (OMS/EMS) fees and clearing costs divided by the product of one-hundredth ADV of touched shares on BIDS Trading and the number of trading days for the period. |
| (5) | Matched volume represents the total number of shares of equity securities and ETFs activity executed on our exchanges. |
| (6) | Net capture per 10,000 touched shares refers to transaction fees divided by the product of one-ten thousandth ADV of shares for MATCHNow and the number of trading days. |
| (7) | Matched ADNV represents the average daily notional value of shares or contracts executed on our exchanges. |
| (8) | Net capture per matched notional value refers to transaction fees less liquidity payments in British pounds divided by the product of ADNV in British pounds of shares matched on Cboe Europe Equities and the number of trading days for the period.days. |
| |
| (9) | Trades cleared refers to the total number of non-interoperable trades cleared. |
| (10) | Fee per trade cleared refers to clearing fees divided by number of non-interoperable trades cleared. |
| (11) | Net settlement volume refers to the total number of settlements executed after netting. |
| (12) | Net fee per settlement refers to settlement fees less direct costs incurred to settle divided by the number of settlements executed after netting. |
| (13) | Net capture per matched notional value refers to transaction fees less liquidity payments in Australian dollars divided by the product of ADNV in Australian dollars of shares matched on Cboe Australia and the number of Australian Equities trading days. |
| (14) | Net capture per matched notional value refers to transaction fees less liquidity payments in Japanese Yen divided by the product of ADNV in Japanese Yen of shares matched on Cboe Japan and the number of Japanese Equities trading days. |
| (15) | Net capture per one million dollars traded refers to net transaction fees less liquidity payments, if any, divided by the productSpot and SEF products of one-thousandth of ADNV traded on the Cboe FX marketMarkets and the number of trading days, divided by two, which represents the buyer and seller that are both charged on the transaction for the period.transaction. |
Revenues
Total revenues increased infor the three and nine months ended September 30, 2017,March 31, 2022 decreased $36.3 million, or 4%, compared to the prior period primarily due to decreased cash and spot markets revenue as a result of our acquisition of Bats that contributed $411.6 milliona decline in the Section 31 fee rate and $1,017.4 million, respectively.
a decline in volumes traded on the U.S. Equities exchanges, partially offset by increased derivatives markets revenue attributable to increased volumes traded on the Options exchanges, coupled with increased data and access solutions revenue primarily related to increased access and capacity fees in the Options and North American Equities segments. The following summarizes changes in revenues for the three and nine months ended September 30, 2017,March 31, 2022, compared to the three and nine months ended September 30, 2016:
|
| | | | | | | | | | | | | | | | | | | | | | | |
| | Three Months Ended
September 30, | Increase/ (Decrease) | Percent Change | | Nine Months Ended
September 30, | Increase/ (Decrease) | Percent Change |
| 2017 | 2016 | | 2017 | 2016 |
| (in millions, except percentages) | | (in millions, except percentages) |
| Transaction fees | $ | 423.3 |
| $ | 124.5 |
| $ | 298.8 |
| 240.0 | % | | $ | 1,133.6 |
| $ | 378.3 |
| $ | 755.3 |
| 199.7 | % |
| Access fees | 30.1 |
| 13.0 |
| 17.1 |
| 131.5 | % | | 77.6 |
| 39.4 |
| 38.2 |
| 97.0 | % |
| Exchange services and other fees | 20.0 |
| 11.4 |
| 8.6 |
| 75.4 | % | | 55.3 |
| 34.2 |
| 21.1 |
| 61.7 | % |
| Market data fees | 46.8 |
| 8.3 |
| 38.5 |
| 463.9 | % | | 117.3 |
| 24.5 |
| 92.8 |
| 378.8 | % |
| Regulatory fees | 83.5 |
| 9.1 |
| 74.4 |
| 817.6 | % | | 205.1 |
| 27.4 |
| 177.7 |
| 648.5 | % |
| Other revenue | 7.7 |
| 2.4 |
| 5.3 |
| 220.8 | % | | 19.5 |
| 8.5 |
| 11.0 |
| 129.4 | % |
| Total revenues | $ | 611.4 |
| $ | 168.7 |
| $ | 442.7 |
| 262.4 | % | | $ | 1,608.4 |
| $ | 512.3 |
| $ | 1,096.1 |
| 214.0 | % |
Transaction Fees
Transaction fees increased for the threeMarch 31, 2021 (in millions, except percentages): | | | | | | | | | | | | |
| | Three Months Ended | | | | | | |
| | March 31, | | Increase/ | | Percent | |
| | 2022 | | 2021 | | (Decrease) | | Change | |
Cash and spot markets | | $ | 461.9 | | $ | 548.9 | | $ | (87.0) | | (16) | % |
Data and access solutions | | | 118.9 | | | 100.6 | | | 18.3 | | 18 | % |
Derivatives markets | | | 393.7 | | | 361.3 | | | 32.4 | | 9 | % |
Total revenues | | $ | 974.5 | | $ | 1,010.8 | | $ | (36.3) | | (4) | % |
Cash and nine months ended September 30, 2017 compared to the same periods in 2016 primarily driven by the acquisition of Bats that contributed $271.1 millionSpot Markets
Cash and $689.3 million, respectively. The remaining increase was primarily driven by increased ADV in index options of 23.5%spot markets revenue decreased for the three months ended September 30, 2017 and 17.6% in the nine months ended September 30, 2017. Also contributing to the increase was an increased futures ADV of 35.9% for the three months ended September 30, 2017 and 29.7% for the nine months ended September 30, 2017.
Access fees
Access fees increased for the three and nine months ended September 30, 2017 compared to the same periods in 2016 primarily driven by the Bats acquisition that contributed $18.5 million and $42.4 million, respectively. This was offset by decreases driven by pricing decreases for market maker permits and floor broker permits effective in the first quarter of 2017.
Exchange services and other fees
Exchange services and other fees increased for the three and nine months ended September 30, 2017 compared to the same periods in 2016 primarily driven by the Bats acquisition that contributed $7.5 million and $17.6 million, respectively.
Market Data Fees
Market data fees increased for the three and nine months ended September 30, 2017 compared to the same periods in 2016 primarily due to the Bats acquisition that contributed $38.1 million and $90.2 million, respectively.
Regulatory Fees
Regulatory transaction fees increased for the three and nine months ended September 30, 2017 compared to the same periods in 2016 primarily due to the acquisition of Bats that contributed $72.6 million and $170.7 million, respectively.
Other Revenue
Other revenue increased for the three and nine months ended September 30, 2017March 31, 2022 compared to the same period in 20162021 primarily due to the Bats acquisition that contributed $3.7 milliondecreases in regulatory fees and $7.2 million, respectively.
Cost of Revenues
Cost of revenues increasedtransaction and clearing fees. Regulatory fees decreased primarily due to a 68% decline in the
Section 31 fee rate, from an average rate of $15.80 per million dollars of covered sales for the three
and nine months ended
September 30, 2017March 31, 2021 to an average rate of $5.10 per million dollars of covered sales during the three months ended March 31, 2022. Transaction and clearing fees decreased primarily due to a 17% decrease in total touched shares on U.S. Equities exchanges, partially offset by a 71% increase in European Equities matched ADNV.Data and Access Solutions
Data and access solutions revenue increased for the three months ended March 31, 2022 compared to the same periodsperiod in 20162021 primarily due to increases in access and capacity fees and proprietary market data fees. Access and capacity fees increased primarily due to increases in logical port revenue in the acquisitionOptions and North American Equities segments, increases in physical port revenue in the North American Equities and Options segments, and increased access fees in the Europe and Asia Pacific segment. Proprietary market data fees increased primarily due to proprietary market data attributable to Cboe Asia Pacific, which was acquired in the third quarter of Bats.2021, coupled with an increase in financial risk analytics market data in the Options segment, partially offset by a decrease in licensing fees.
Derivatives Markets
Derivatives markets revenue increased for the three months ended March 31, 2022 compared to the same period in 2021 primarily due to an increase in transaction and clearing fees, partially offset by a decrease in regulatory fees. Transaction and clearing fees increased primarily due to a 27% increase in index options ADV. Regulatory fees decreased primarily due to a 68% decline in the Section 31 fee rate, from an average rate of $15.80 per million dollars of covered sales for the three months ended March 31, 2021 to an average rate of $5.10 per million dollars of covered sales during the three months ended March 31, 2022.
Cost of Revenues
The following tables reconcile the cost of revenues captions presented on the condensed consolidated statements of income to the updated net revenue captions discussed in Note 1 (“Organization and Basis of Presentation”) for the three months ended March 31, 2022 and 2021, respectively (in millions):
| | | | | | | | | | | | |
| | | Three Months Ended March 31, |
| | | 2022 |
| | Cash and
Spot Markets | | Data and
Access Solutions | | Derivatives
Markets | | Total |
Liquidity payments | | $ | 299.6 | | $ | — | | $ | 167.9 | | $ | 467.5 |
Routing and clearing fees | | | 15.6 | | | — | | | 6.7 | | | 22.3 |
Section 31 fees | | | 31.8 | | | — | | | 3.9 | | | 35.7 |
Royalty fees and other cost of revenues | | | 4.6 | | | 2.4 | | | 23.9 | | | 30.9 |
Total cost of revenues | | $ | 351.6 | | $ | 2.4 | | $ | 202.4 | | $ | 556.4 |
| | | | | | | | | | | | |
| | | Three Months Ended March 31, |
| | | 2021 |
| | Cash and
Spot Markets | | Data and
Access Solutions | | Derivatives
Markets | | Total |
Liquidity payments | | $ | 335.8 | | $ | — | | $ | 166.0 | | $ | 501.8 |
Routing and clearing fees | | | 21.6 | | | — | | | 5.5 | | | 27.1 |
Section 31 fees | | | 82.0 | | | — | | | 9.9 | | | 91.9 |
Royalty fees and other cost of revenues | | | 4.2 | | | 2.0 | | | 18.3 | | | 24.5 |
Total cost of revenues | | $ | 443.6 | | $ | 2.0 | | $ | 199.7 | | $ | 645.3 |
| | | | | | | �� | | | | | |
Cost of revenues decreased for the three months ended March 31, 2022 compared to the same period in 2021 primarily due to decreased cash and spot markets cost of revenues related to lower Section 31 fees, coupled with a decline in liquidity payments.
The following summarizes changes in the disaggregated cost of revenues for the three and nine months ended September 30, 2017March 31, 2022 compared to the three months ended September 30, 2016: March 31, 2021 (in millions, except percentages):
| | | | | | | | | | | | |
| | Three Months Ended | | | | | | |
| | March 31, | | Increase/ | | Percent | |
| | 2022 | | 2021 | | (Decrease) | | Change | |
Liquidity payments | | $ | 467.5 | | $ | 501.8 | | $ | (34.3) | | (7) | % |
Routing and clearing | | | 22.3 | | | 27.1 | | | (4.8) | | (18) | % |
Section 31 fees | | | 35.7 | | | 91.9 | | | (56.2) | | (61) | % |
Royalty fees and other cost of revenues | | | 30.9 | | | 24.5 | | | 6.4 | | 26 | % |
Total cost of revenues | | $ | 556.4 | | $ | 645.3 | | $ | (88.9) | | (14) | % |
Liquidity Payments
Liquidity payments decreased for the three months ended March 31, 2022 compared to the same period in 2021 primarily due to a decrease in volumes traded on the U.S. Equities exchanges, partially offset by increased volumes traded on the European Equities exchanges.
Routing and Clearing
Routing and clearing fees decreased for the three months ended March 31, 2022 compared to the same period in 2021 primarily due to a decline in routed trades in the North American Equities segment, partially offset by an increase in routed shares on the Options exchanges.
Section 31 Fees
Section 31 fees decreased for the three months ended March 31, 2022 compared to the same period in 2021 primarily due to a 68% decline in the Section 31 fee rate, from an average rate of $15.80 per million dollars of covered
|
| | | | | | | | | | | | | | | | | | | | | | | |
| | Three Months Ended
September 30, | Increase/ (Decrease) | Percent Change | | Nine Months Ended
September 30, | Increase/ (Decrease) | Percent Change |
| 2017 | 2016 | | 2017 | 2016 |
| | (in millions, except percentages) | | (in millions, except percentages) |
| Liquidity payments | $ | 234.3 |
| $ | 9.5 |
| $ | 224.8 |
| * |
| | $ | 606.1 |
| $ | 23.2 |
| $ | 582.9 |
| * |
|
| Routing and clearing | 9.4 |
| 3.6 |
| 5.8 |
| 161.1 | % | | 27.9 |
| 7.9 |
| 20.0 |
| 253.2 | % |
| Section 31 fees | 75.9 |
| — |
| 75.9 |
| * |
| | 180.5 |
| — |
| 180.5 |
| * |
|
| Royalty fees | 22.1 |
| 19.4 |
| 2.7 |
| 13.9 | % | | 63.9 |
| 57.8 |
| 6.1 |
| 10.6 | % |
| Total cost of revenues | $ | 341.7 |
| $ | 32.5 |
| $ | 309.2 |
| 951.4 | % | | $ | 878.4 |
| $ | 88.9 |
| $ | 789.5 |
| 888.1 | % |
*Not meaningful
Liquidity Payments
Liquidity paymentssales for the three months ended March 31, 2021 to an average rate of $5.10 per million dollars of covered sales during the three months ended March 31, 2022.
Royalty Fees and Other Cost of Revenues
Royalty fees and other cost of revenues increased for the three and nine months ended September 30, 2017March 31, 2022 compared to the same periodsperiod in 2016 primarily driven by the Bats acquisition that contributed $219.3 million and $561.7 million, respectively.
Routing and Clearing
The increase in routing and clearing fees for the three and nine months ended September 30, 2017 compared to the same periods in 2016 was primarily driven by the Bats acquisition that contributed $7.7 million and $19.7 million, respectively.
Section 31 Fees
Section 31 fees increased for the three and nine months ended September 30, 2017 compared to the same periods in 2016 primarily driven by the Bats acquisition that contributed $71.9 million and $169.0 million, respectively.
Royalty Fees
Royalty fees increased for the three and nine months ended September 30, 2017 compared to the same periods in 20162021 primarily due to higheran increase in trading volume in licensed products.
Revenues Less Cost of Revenues
Revenues less cost of revenues increased in$52.6 million, or 14%, for the three and nine months ended September 30, 2017March 31, 2022 compared to the same periodsperiod in 20162021 primarily due to increased derivatives markets revenue attributable to increased volumes traded on the acquisition of Bats.
Options exchanges, as well as increased access and capacity fees in the Options and North American Equities segments.The following tables summarizesummarizes the components of revenues less cost of revenues for the three and nine months ended September 30, 2017, presented as a percentage of revenues less cost of revenues and compared to the three and nine months ended September 30, 2016:
|
| | | | | | | | | | | | | | | | | | | | | | | |
| | Three Months Ended
September 30, | Increase/ | Percent | | Nine Months Ended
September 30, | Increase/ | Percent |
| | 2017 | 2016 | (Decrease) | Change | | 2017 | 2016 | (Decrease) | Change |
| | (in millions, except percentages) | | (in millions, except percentages) |
| Transaction fees less liquidity payments and routing and clearing costs | $ | 179.6 |
| $ | 111.4 |
| $ | 68.2 |
| 61.2 | % | | $ | 499.6 |
| $ | 347.2 |
| $ | 152.4 |
| 43.9 | % |
| Access fees | 30.1 |
| 13.0 |
| 17.1 |
| 131.5 | % | | 77.6 |
| 39.4 |
| 38.2 |
| 97.0 | % |
| Exchange services and other fees | 20.0 |
| 11.4 |
| 8.6 |
| 75.4 | % | | 55.3 |
| 34.2 |
| 21.1 |
| 61.7 | % |
| Market data fees | 46.8 |
| 8.3 |
| 38.5 |
| 463.9 | % | | 117.3 |
| 24.5 |
| 92.8 |
| 378.8 | % |
| Regulatory fees, less Section 31 fees | 7.6 |
| 9.1 |
| (1.5 | ) | (16.5 | )% | | 24.6 |
| 27.4 |
| (2.8 | ) | (10.2 | )% |
| Royalty fees | (22.1 | ) | (19.4 | ) | (2.7 | ) | 13.9 | % | | (63.9 | ) | (57.8 | ) | (6.1 | ) | 10.6 | % |
| Other | 7.7 |
| 2.4 |
| 5.3 |
| 220.8 | % | | 19.5 |
| 8.5 |
| 11.0 |
| 129.4 | % |
| Revenues less cost of revenues | $ | 269.7 |
| $ | 136.2 |
| $ | 133.5 |
| 98.0 | % | | $ | 730.0 |
| $ | 423.4 |
| $ | 306.6 |
| 72.4 | % |
Transaction Fees Less Liquidity Payments and Routing and Clearing Costs
Transaction fees less liquidity payments and routing and clearing costs increased in the three and nine months ended September 30, 2017 compared to the same periods in 2016 primarily driven by the acquisition of Bats that contributed $44.2 million and $107.9 million, respectively. The remaining increase was primarily due to higher trading volumes in index options and futures in both the three and nine months ended September 30, 2017.
Access Fees
Access fees increased for the three and nine months ended September 30, 2017 compared to the same periods in 2016 primarily driven by the Bats acquisition that contributed $18.5 million and $42.4 million, respectively. This was partially offset by decreases driven by pricing decreases for market maker permits and floor broker permits effective in the first quarter of 2017.
Exchange services and other fees
Exchange services and other fees increased for the three and nine months ended September 30, 2017 compared to the same periods in 2016 primarily driven by the Bats acquisition that contributed $7.5 million and $17.6 million, respectively.
Market Data Fees
Market data fees increased for the three and nine months ended September 30, 2017 compared to the same periods in 2016 primarily due to the Bats acquisition that contributed $38.1 million and $90.2 million, respectively.
Regulatory Fees, less SectionMarch 31, Fees
Regulatory fees decreased in the three and nine months ended September 30, 2017 compared to the same periods in 2016 primarily due to a decrease in options regulatory fees reflecting lower regulatory costs to oversee the options markets.
Royalty Fees
Royalty fees increased for the three and nine months ended September 30, 2017 compared to the same periods in 2016 primarily due to higher trading volume in licensed products.
Other
Other revenue increased in the three and nine months ended September 30, 2017 compared to the same periods in 2016 primarily due the Bats acquisition that contributed $3.6 million and $6.8 million, respectively.
Operating Expenses
Total operating expenses increased 114% for the three months ended September 30, 20172022 compared to the three months ended
September 30, 2016March 31, 2021 (in millions, except percentages): | | | | | | | | | | | | |
| | Three Months Ended | | | | | | |
| | March 31, | | | | Percent | |
| | 2022 | | 2021 | | Increase | | Change | |
Cash and spot markets | | $ | 110.3 | | $ | 105.3 | | $ | 5.0 | | 5 | % |
Data and access solutions | | | 116.5 | | | 98.6 | | | 17.9 | | 18 | % |
Derivatives markets | | | 191.3 | | | 161.6 | | | 29.7 | | 18 | % |
Total revenues less cost of revenues | | $ | 418.1 | | $ | 365.5 | | $ | 52.6 | | 14 | % |
Cash and Spot Markets
Cash and spot markets revenues less cost of revenues increased for the three months ended March 31, 2022 compared to the same period in 2021 primarily due to incremental operating expensesincreased transaction and clearing fees in the European Equities segment. Transaction and clearing fees increased primarily due to a 71% increase in European Equities matched ADNV, partially offset by a 17% decline in total touched shares on U.S. Equities exchanges. Routing and clearing fees decreased primarily due to a 36% decline in routed shares on U.S. Equities exchanges.
Data and Access Solutions
Data and access solutions revenues less cost of Bats in 2017. Forrevenues increased for the ninethree months ended September 30, 2017March 31, 2022 compared to the ninesame period in 2021 primarily due to increases in access and capacity fees and proprietary market data fees. Access and capacity fees increased due to increases in logical port revenue in the Options and North American Equities segments, increases in physical port revenue in the North American Equities and Options segments, and increased access fees in the Europe and Asia Pacific segment. Proprietary market data fees increased due to proprietary market data attributable to Cboe Asia Pacific, coupled with an increase in financial risk analytics market data in the Options segment.
Derivatives Markets
Derivatives markets revenues less cost of revenues increased for the three months ended September 30, 2016 acquisition-related costs of $75.4 millionMarch 31, 2022 compared to the same period in 2021 due to increased transaction and clearing fees, partially offset by increased royalty fees in the Options segment. Transaction and clearing fees increased primarily due to a 27% increase in index options ADV.
Operating Expenses
Total operating expenses for the Bats acquisition drove the increase in operating expenses. Incremental operating expenses of Bats from the acquisition date to September 30, 2017 also contributedthree months ended March 31, 2022 compared to the increasesame period in 2021 increased $17.5 million, or 11%, primarily due to increases in depreciation and amortization and compensation and benefits. benefits, professional fees and outside services, and other expenses, partially offset by a decrease in acquisition-related costs.
The following summarizes changes in operating expenses for the three and nine months ended September 30, 2017,March 31, 2022 compared to the three and nine months ended September 30, 2016:
|
| | | | | | | | | | | | | | | | | | | | | | | |
| | Three Months Ended
September 30, | Increase/ | Percent | | Nine Months Ended
September 30, | Increase/ | Percent |
| 2017 | 2016 | (Decrease) | Change | | 2017 | 2016 | (Decrease) | Change |
| (in millions, except percentages) | | (in millions, except percentages) |
| Operating expenses: | | | | | | | | | |
| Compensation and benefits | $ | 50.4 |
| $ | 28.3 |
| $ | 22.1 |
| 78.1 | % | | $ | 148.2 |
| $ | 83.9 |
| $ | 64.3 |
| 76.6 | % |
| Depreciation and amortization | 55.4 |
| 10.2 |
| 45.2 |
| 443.1 | % | | 136.3 |
| 34.4 |
| 101.9 |
| 296.2 | % |
| Technology support services | 11.4 |
| 5.6 |
| 5.8 |
| 103.6 | % | | 30.9 |
| 17.0 |
| 13.9 |
| 81.8 | % |
| Professional fees and outside services | 17.6 |
| 12.7 |
| 4.9 |
| 38.6 | % | | 48.9 |
| 41.0 |
| 7.9 |
| 19.3 | % |
| Travel and promotional expenses | 4.5 |
| 2.6 |
| 1.9 |
| 73.1 | % | | 12.0 |
| 7.6 |
| 4.4 |
| 57.9 | % |
| Facilities costs | 2.9 |
| 1.3 |
| 1.6 |
| 123.1 | % | | 7.7 |
| 4.2 |
| 3.5 |
| 83.3 | % |
| Acquisition-related costs | 5.5 |
| 8.6 |
| (3.1 | ) | (36.0 | )% | | 75.4 |
| 8.6 |
| 66.8 |
| 776.7 | % |
| Change in contingent consideration | 0.4 |
| — |
| 0.4 |
| * |
| | 1.1 |
| — |
| 1.1 |
| * |
|
| Other expenses | 2.3 |
| 1.1 |
| 1.2 |
| 109.1 | % | | 6.3 |
| 3.4 |
| 2.9 |
| 85.3 | % |
| Total operating expenses | $ | 150.4 |
| $ | 70.4 |
| $ | 80.0 |
| 113.6 | % | | $ | 466.8 |
| $ | 200.1 |
| $ | 266.7 |
| 133.3 | % |
* Not meaningful
March 31, 2021 (in millions, except percentages): | | | | | | | | | | | | |
| | Three Months Ended | | | | | | |
| | March 31, | | Increase/ | | Percent | |
| | 2022 | | 2021 | | (Decrease) | | Change | |
Compensation and benefits | | $ | 81.2 | | $ | 72.3 | | $ | 8.9 | | 12 | % |
Depreciation and amortization | | | 40.9 | | | 42.0 | | | (1.1) | | (3) | % |
Technology support services | | | 19.2 | | | 17.2 | | | 2.0 | | 12 | % |
Professional fees and outside services | | | 19.7 | | | 15.6 | | | 4.1 | | 26 | % |
Travel and promotional expenses | | | 2.9 | | | 1.6 | | | 1.3 | | 81 | % |
Facilities costs | | | 6.5 | | | 5.3 | | | 1.2 | | 23 | % |
Acquisition-related costs | | | 2.0 | | | 3.4 | | | (1.4) | | (41) | % |
Other expenses | | | 6.0 | | | 3.5 | | | 2.5 | | 71 | % |
Total operating expenses | | $ | 178.4 | | $ | 160.9 | | $ | 17.5 | | 11 | % |
Compensation and Benefits
Compensation and benefits increased for the three and nine months ended September 30, 2017March 31, 2022 compared to the same periodsperiod in 20162021 primarily due to a $9.8 million increase in salaries, wages, and bonuses, driven by a $3.5 million increase in compensation and benefits expense related to Cboe Asia Pacific, a $4.6 million increase in salaries, wages, and bonuses driven by strong Company performance year to date, merit increases, and increased headcount excluding acquisitions, and a $1.0 million increase in benefits driven by increases in payroll taxes and benefit plan contributions, partially offset by a $2.7 million decrease in equity compensation related to the incremental costsreversal of 2019 PSUs which did not meet performance conditions required for additional employees fromvesting and forfeited awards during the three months ended March 31, 2022.
Depreciation and Amortization
Depreciation and amortization decreased for the three months ended March 31, 2022 compared to the same period in 2021 primarily due to a decrease in amortization under the discounted cash flow method for the intangibles acquired in the Bats acquisition, of $22.0 million and $51.4 million, respectively. The remainder ofpartially offset by an increase in depreciation expense related to Cboe Asia Pacific, as well as an increase in depreciation expense related to the increaseformer headquarters location, which was not subject to depreciation during the nine monththree months ended March 31, 2021 as it was classified as held for sale from May 1, 2019 until May 1, 2021.
Technology Support Services
Technology support services increased for the three months ended March 31, 2022 compared to the same period wasin 2021 primarily due to increases in software maintenance support service fees and market data support service fees, partially offset by a decrease in purchased hardware and equipment.
Professional Fees and Outside Services
Professional fees and outside services increased for the accelerationthree months ended March 31, 2022 compared to the same period in 2021 primarily due to increases in legal fees, contract services, and recruiting fees.
Travel and Promotional Expenses
Travel and promotional expenses increased for the three months ended March 31, 2022 compared to the same period in 2021 primarily due to increases in marketing expenses and travel expenses.
Facilities Costs
Facilities costs increased for the three months ended March 31, 2022 compared to the same period in 2021 primarily due to an increase in rent expense related to additional office locations following the acquisition of stock-based compensationCboe Asia Pacific, along with the new trading floor in Chicago.
Acquisition-Related Costs
Acquisition-related costs decreased for the three months ended March 31, 2022 compared to the same period in 2021 primarily due to a changedecline in professional fees, partially offset by an impairment charge related to the vesting termsCompany’s investment in Signal Trading Systems, LLC that occurred in the first quarter of 2017.
Depreciation2021 and Amortization
Depreciation and amortizationdid not recur in 2022.Other Expenses
Other expenses increased for the three and nine months ended September 30, 2017March 31, 2022 compared to the same periodsperiod in 20162021 primarily driven by amortization of purchased intangible assets acquired from the Bats acquisition of $45.5 milliondue to increases in taxes, licenses, and $106.6 million, respectively.
Technology Support Services
Technology support servicespermits, as well as record storage costs increased forand additional one-time charitable contributions made related to Ukraine relief efforts during the three and nine months ended September 30, 2017 compared to the same periods in 2016 primarily driven by incremental expense from the acquisition of Bats that contributed $5.9 million and $14.0 million, respectively.
Professional Fees and Outside Services
Professional and outside services fees increased for the three and nine months ended September 30, 2017 compared to the same periods in 2016 primarily driven by incremental expense from the acquisition of Bats that contributed $4.6 million and $9.8 million, respectively.
Acquisition-related costs
Acquisition-related costs increased for the three and nine months ended September 30, 2017 compared to the same periods in 2016 primarily driven by our acquisition of Bats. Acquisition-related costs include fees for investment banking advisors, lawyers, accountants, tax advisors, public relations firms, severance and retention costs, impairment of capitalized software and other external costs directly related to the mergers and acquisitions.
March 31, 2022.Operating Income
As a result of the items above, operating income for the three months ended September 30, 2017March 31, 2022 was $119.3$239.7 million, compared to $65.8$204.6 million for the same period in 2016. Operating income2021, an increase of $35.1 million.
Interest Expense, Net
Net interest expense decreased for the ninethree months ended September 30, 2017 was $263.2 millionMarch 31, 2022 compared to $223.3 million forthe same period in 2016.
Interest Expense, Net
Net interest expense increased in2021. The decrease for the three and nine months ended September 30, 2017March 31, 2022 was primarily due to $11.0 million and $32.0 million, respectively,a decrease in interest expense related to the financing of the Bats acquisition. To finance the cash required for the acquisition, we entered into a $1.0 billion term loan agreementEuroCCP Credit Facility, which was amended and issued $650 millionrestated in aggregate principal amount of 3.650% senior notes. In June 2017, we issued $300 million in aggregate principal amount of 1.950% senior notes and used the net proceedsJuly 2021, partially offset by interest income related to pay down a portion of the term loan. See Note 11, Debt, to the condensed consolidated financial statements for a discussion of debt agreements.
Cboe Asia Pacific.Other (Expense) Income,
Other (expense) NetNet other income increaseddecreased for the three and nine months ended September 30, 2017March 31, 2022 compared to the three and nine months ended September 30, 2016 driven by the provision for uncollectable convertible notes receivable of $3.8same period in 2021 primarily due to a $3.1 million loss, related to ourthe Company’s share of the 7Ridge Fund’s loss accounted for under the equity method of accounting, of which $3.0 million was related to investment in Tradelegs, LLC.
establishment costs, which are not expected to recur.Income Before Income Tax Provision
As a result of the above, income before income tax provision for the three months ended September 30, 2017March 31, 2022 was $105.9$224.9 million, compared to $67.4$192.9 million for the same period in 2016,2021, an increase of $38.5$32.0 million. For the nine months ended September 30, 2017 income before income tax provision was $230.3 million compared to $231.7 million for the same period in 2016, a decrease of $1.4 million.
ForThe effective tax rate from continuing operations was 51.3% and 28.9% for the three months ended September 30, 2017, the income tax provision was $45.6 million compared with $26.9 million for the same period in 2016.March 31, 2022 and 2021, respectively. The higher effective tax rate for the three months ended September 30, 2017 was 43.1% compared to 39.9% for the three months ended September 30, 2016. The increase in the effective tax rate for the three months ended September 30, 2017 against the comparable period in the prior year wasMarch 31, 2022 is primarily due to a re-measurement of our deferred tax assets and liabilities as a result of a 1.75% corporate income tax rate increase in Illinois enacted on July 6, 2017.
For the nine months ended September 30, 2017, the income tax provision was $86.8 million compared with $91.1 million for the same period in 2016. The effective tax rate for the nine months ended September 30, 2017 was 37.7% compared to 39.3% for the nine months ended September 30, 2016. The decrease in the effective tax rate for the nine months ended September 30, 2017 against the comparable period in the prior year was primarily due to discrete events during the nine-month period, mainly the re-measurement ofadditional tax reserves and excess tax benefits associated withof $48.5 million related to the exercise and vesting of stock-based compensation.
Section 199 litigation.Net Income
As a result of the items above, net income for the three months ended September 30, 2017March 31, 2022 was $60.3$109.6 million, compared to $40.5$137.2 million for the three months ended September 30, 2016, an increaseMarch 31, 2021, a decrease of $19.8$27.6 million.
Segment Operating Results
We report results from our five segments: Options, U.S.North American Equities, Europe and Asia Pacific, Futures, European Equities, and Global FX. Segment performance is primarily based on operating income (loss). We have aggregated all corporate costs, acquisition-related costs, as well as other business ventures, within the Corporate Items and Eliminations as those activities should not be used to evaluate a segment'ssegment’s operating performance. All operating expenses that relate to activities of a specific segment have been allocated to that segment.
The following summarizes our total revenues by segment (in millions, except percentages):
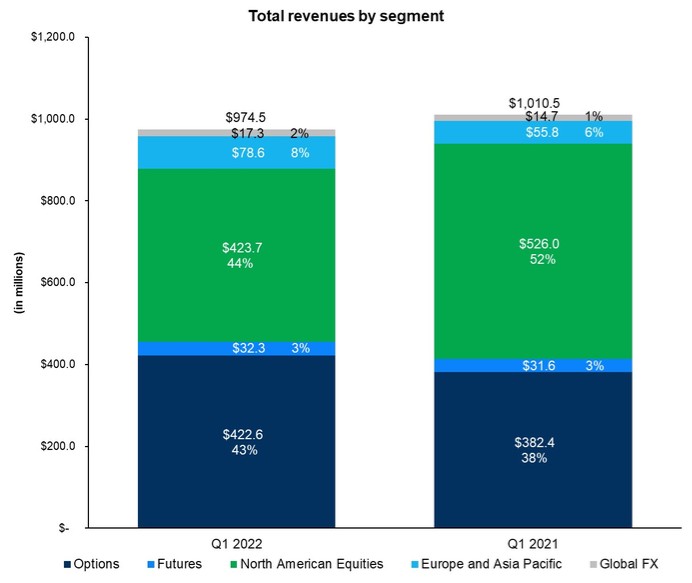
Note, the chart excludes Corporate revenues less cost of revenues of $0.3 million for the quarter ended March 31, 2021.
| | | | | | | | | | | | | | |
| | | | | | | | | | Percentage | | |
| | | | | | | | | | of Total | | |
| | | | | | | | | | Revenues | | |
| | Three Months Ended | | | | Three Months Ended | | |
| | March 31, | | Percent | | March 31, | | |
| | 2022 | | 2021 | | Change | | 2022 | | 2021 | | |
Options | | $ | 422.6 | | $ | 382.4 | | 11 | % | 43 | % | 38 | % | |
North American Equities | | | 423.7 | | | 526.0 | | (19) | % | 44 | % | 52 | % | |
Europe and Asia Pacific | | | 78.6 | | | 55.8 | | 41 | % | 8 | % | 6 | % | |
Futures | | | 32.3 | | | 31.6 | | 2 | % | 3 | % | 3 | % | |
Global FX | | | 17.3 | | | 14.7 | | 18 | % | 2 | % | 1 | % | |
Corporate | | | — | | | 0.3 | | — | % | — | % | — | % | |
Total revenues | | $ | 974.5 | | $ | 1,010.8 | | (4) | % | 100 | % | 100 | % | |
The following summarizes our revenues less cost of revenues by segment (in millions, except percentages):
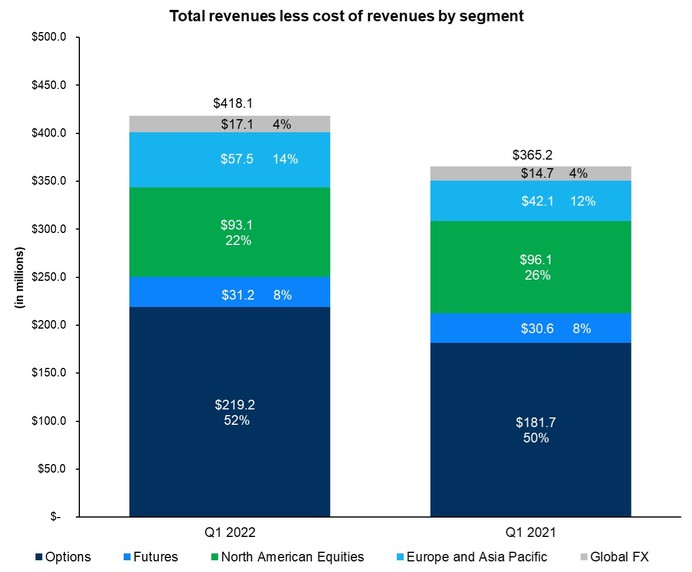
Note, the chart excludes Corporate revenues less cost of revenues of $0.3 million for the quarter ended March 31, 2021.
| | | | | | | | | | | | | | |
| | | | | | | | | | Percentage of | | |
| | | | | | | | | | Total Revenues | | |
| | | | | | | | | | Less Cost of Revenues | | |
| | Three Months Ended | | | | Three Months Ended | | |
| | March 31, | | Percent | | March 31, | | |
| | 2022 | | 2021 | | Change | | 2022 | | 2021 | | |
Options | | $ | 219.2 | | $ | 181.7 | | 21 | % | 52 | % | 50 | % | |
North American Equities | | | 93.1 | | | 96.1 | | (3) | % | 22 | % | 26 | % | |
Europe and Asia Pacific | | | 57.5 | | | 42.1 | | 37 | % | 14 | % | 12 | % | |
Futures | | | 31.2 | | | 30.6 | | 2 | % | 8 | % | 8 | % | |
Global FX | | | 17.1 | | | 14.7 | | 16 | % | 4 | % | 4 | % | |
Corporate | | | — | | | 0.3 | | — | % | — | % | — | % | |
Total revenues less cost of revenues | | $ | 418.1 | | $ | 365.5 | | 14 | % | 100 | % | 100 | % | |
|
| | | | | | | | | | | | | | | | | | | | | | | | | | | | | | | | | | |
| | | |
| | |
| | |
| | Percentage of Total Revenues | | | | | | | | Percentage of Total Revenues |
| | Three Months Ended
September 30, | | Percent Change | | Three Months Ended
September 30, | | Nine Months Ended
September 30, | | Percent Change | | Nine Months Ended
September 30, |
| | 2017 | | 2016 | | | 2017 | | 2016 | | 2017 | | 2016 | | | 2017 | | 2016 |
| Options | | $ | 224.8 |
| | $ | 139.2 |
| | 61.5 | % | | 36.8 | % | | 82.5 | % | | $ | 651.0 |
| | $ | 426.8 |
| | 52.5 | % | | 40.5 | % | | 83.3 | % |
| U.S. Equities | | 308.5 |
| | — |
| | * |
| | 50.5 | % | | — | % | | 759.8 |
| | — |
| | * |
| | 47.3 | % | | — | % |
| Futures | | 40.3 |
| | 29.5 |
| | 36.6 | % | | 6.6 | % | | 17.5 | % | | 107.7 |
| | 85.5 |
| | 26.0 | % | | 6.7 | % | | 16.7 | % |
| European Equities | | 26.3 |
| | — |
| | * |
| | 4.3 | % | | — | % | | 63.2 |
| | — |
| | * |
| | 3.9 | % | | — | % |
| Global FX | | 11.3 |
| | — |
| | * |
| | 1.8 | % | | — | % | | 26.2 |
| | — |
| | * |
| | 1.6 | % | | — | % |
| Corporate Items and Eliminations | | 0.2 |
| | — |
| | * |
| | — | % | | — | % | | 0.5 |
| | — |
| | * |
| | — | % | | — | % |
| Total revenues | | $ | 611.4 |
| | $ | 168.7 |
| | 262.4 | % | | 100.0 | % | | 100.0 | % | | $ | 1,608.4 |
| | $ | 512.3 |
| | 214.0 | % | | 100.0 | % | | 100.0 | % |
* Not meaningfulThe following summarizes revenues less cost of revenues, operating expenses, operating income, EBITDA, and EBITDA margin for our Options segment:
| | | | | | | | | | | | | | | | | | |
| | | | | | | | | | | | | Percentage | | |
| | | | | | | | | | | | | of Total | | |
| | | | | | | | | | | | | Revenues | | |
| | Three Months Ended | | | | | | Three Months Ended | | |
| | March 31, | | | Percent | | | March 31, | | |
| | 2022 | | | 2021 | | | Change | | | 2022 | | | 2021 | | |
Revenues less cost of revenues | | $ | 219.2 | | | $ | 181.7 | | | 21 | % | | 52 | % | | 48 | % | |
Operating expenses | | | 56.5 | | | | 53.0 | | | 7 | % | | 13 | % | | 14 | % | |
Operating income | | $ | 162.7 | | | $ | 128.7 | | | 26 | % | | 38 | % | | 34 | % | |
EBITDA (1) | | $ | 169.1 | | | $ | 135.3 | | | 25 | % | | 40 | % | | 35 | % | |
EBITDA margin (2) | | | 77.1 | % | | | 74.5 | % | | * | | | * | | | * | | |
|
| | | | | | | | | | | | | | | | | | | | | | | | | | | | |
| | |
| |
| |
| | Percentage of Total Revenues | | |
| |
| | |
| | Percentage of Total Revenues |
| | Three Months Ended
September 30, | Percent | | Three Months Ended September 30, | | Nine Months Ended
September 30, | | Percent | | Nine Months Ended
September 30, |
| 2017 | 2016 | Change | | 2017 | 2016 | | 2017 | 2016 | | Change | | 2017 | 2016 |
| | (in millions, except percentages) |
| Revenues less cost of revenues | $ | 130.7 |
| $ | 107.8 |
| 21.2 | % | | 21.4 | % | 63.9 | % | | $ | 386.3 |
| $ | 341.1 |
| | 13.3 | % | | 24.0 | % | 66.5 | % |
| Operating expenses | 66.4 |
| 65.2 |
| 1.8 | % | | 10.9 | % | 38.6 | % | | 195.8 |
| 182.6 |
| | 7.2% | | 12.2 | % | 35.6 | % |
| Operating income | $ | 64.3 |
| $ | 42.6 |
| 50.9 | % | | 10.5 | % | 25.3 | % | | $ | 190.5 |
| $ | 158.5 |
| | 20.2 | % | | 11.8 | % | 30.9 | % |
| | | | | | | | | | | | | | | |
| EBITDA (1) | $ | 74.6 |
| $ | 53.7 |
| 38.9 | % | | 12.1 | % | 31.8 | % | | $ | 225.9 |
| $ | 192.6 |
| | 17.3 | % | | 14.0 | % | 37.6 | % |
| EBITDA margin (2) | 57.1 | % | 49.8 | % | * | | * | * | | 58.5 | % | 56.5 | % | | * | | * | * |
* Not meaningful
(1) See footnote (1) to the table under “Financial Summary” above for a reconciliation of net income to EBITDA, and management’s reasons for using such non-GAAP measures.
(2) EBITDA margin represents EBITDA divided by revenues less cost of revenues.
| (1) | See footnote (2) to the table under “Financial Summary” above for a reconciliation of net income to EBITDA, and management’s reasons for using such non-GAAP measures. |
| (2) | EBITDA margin represents EBITDA divided by revenues less cost of revenues. |
Revenues less cost of revenues increased $22.9$37.5 million for the three months ended September 30, 2017March 31, 2022 compared to the three months ended September 30, 2016,March 31, 2021 primarily driven by the acquisition of Bats, which contributed $12.6 million anddue to a 23.5%27% increase in index options ADV partially offset byand a 5.4% decrease7% increase in index options RPC and decreased Cboe Options and C2 access fees in the third quarter of 2017.net capture. For the three months ended September 30, 2017,March 31, 2022, operating income for the Options segment’s operating incomesegment increased $21.7$34.0 million compared to the three months ended September 30, 2016.
Revenues less cost of revenues increased $45.2 million for the nine months ended September 30, 2017, comparedMarch 31, 2021 primarily due to the nine months ended September 30, 2016, primarily driven by the acquisition of Bats, which contributed $27.2 million and a 17.6%an increase in index ADV partially offset by a 2.7% decrease in index options RPC. For the nine months ended September 30, 2017, the Options segment’s operating income increased $32.0 million compared to the nine months ended September 30, 2016.
U.S. Equities
The following summarizes revenues less cost of revenues, operatingrevenues. Operating expenses operating income, EBITDA, and EBIDTA marginincreased $3.5 million for our U.S. Equities segment:
|
| | | | | | | | | | | | | | | | | | | | | | | | | |
| | |
| |
| | | Percentage of Total Revenues | | |
| |
| | | Percentage of Total Revenues |
| | Three Months Ended
September 30, | Percent | | Three Months Ended
September 30, | | Nine Months Ended
September 30, | Percent | | Nine Months Ended
September 30, |
| 2017 | 2016 | Change | | 2017 | 2016 | | 2017 | 2016 | Change | | 2017 | 2016 |
| | (in millions, except percentages) |
| Revenues less cost of revenues | $ | 70.2 |
| $ | — |
| * | | 11.5 | % | — | % | | $ | 170.1 |
| $ | — |
| * | | 10.6 | % | — | % |
| Operating expenses | 40.3 |
| — |
| * | | 6.6 | % | — | % | | 94.7 |
| — |
| * | | 5.9 | % | — | % |
| Operating income | $ | 29.9 |
| $ | — |
| * | | 4.9 | % | — | % | | $ | 75.4 |
| $ | — |
| * | | 4.7 | % | — | % |
| | | | | | | | | | | | | | |
| EBITDA (1) | $ | 53.5 |
| $ | — |
| * | | 8.8 | % | — | % | | $ | 131.5 |
| $ | — |
| * | | 8.2 | % | — | % |
| EBITDA margin (2) | 76.2 | % | * | * | | * | * | | 77.3 | % | * | * | | * | * |
* Not meaningful
(1) See footnote (1) to the table under “Financial Summary” above for a reconciliation of net income to EBITDA, and management’s reasons for using such non-GAAP measures.
(2) EBITDA margin represents EBITDA divided by revenues less cost of revenues.
For the three and nine months ended September 30, 2017, U.S. Equities contributed revenues less costs of revenues of $70.2 million and $170.1 million, respectively, and operating income of $29.9 million and $75.4 million, respectively, resulting from our acquisition of Bats on February 28, 2017.
Futures
The following summarizes revenues, operating expenses, operating income, EBITDA, and EBITDA margin for our Futures segment:
|
| | | | | | | | | | | | | | | | | | | | | | | | | | | | |
| | |
| |
| |
| | Percentage of Total Revenues | | |
| |
| | |
| | Percentage of Total Revenues |
Three Months Ended
September 30, | Percent | | Three Months Ended
September 30, | | Nine Months Ended
September 30, | | Percent | | Nine Months Ended
September 30, |
| 2017 | 2016 | Change | | 2017 | 2016 | | 2017 | 2016 | | Change | | 2017 | 2016 |
| | (in millions, except percentages) |
| Revenues less cost of revenues | $ | 38.9 |
| $ | 28.4 |
| 37.0 | % | | 6.4 | % | 16.8 | % | | 103.9 |
| 82.3 |
| | 26.2 | % | | 6.5 | % | 16.1 | % |
| Operating expenses | 3.5 |
| 2.9 |
| 20.7 | % | | 0.6 | % | 1.7 | % | | 9.2 |
| 10.1 |
| | (8.9 | )% | | 0.6 | % | 2.0 | % |
| Operating income | $ | 35.4 |
| $ | 25.5 |
| 38.8 | % | | 5.8 | % | 15.1 | % | | $ | 94.7 |
| $ | 72.2 |
| | 31.2 | % | | 5.9 | % | 14.1 | % |
| |
|
|
| |
|
| |
|
| |
| |
|
|
| EBITDA (1) | $ | 35.5 |
| $ | 26.1 |
| 36.0 | % | | 5.8 | % | 15.5 | % | | $ | 95.5 |
| $ | 74.6 |
| | 28.0 | % | | 5.9 | % | 14.6 | % |
| EBITDA margin (2) | 91.3 | % | 91.9 | % | * | | * | * | | 91.9 | % | 90.6 | % | | * | | * | * |
* Not meaningful
(1) See footnote (1) to the table under “Financial Summary” above for a reconciliation of net income to EBITDA, and management’s reasons for using such non-GAAP measures.
(2) EBITDA margin represents EBITDA divided by revenues less cost of revenues.
For the three months ended September 30, 2017March 31, 2022 compared to the same period in 2016, the net revenue and operating income increased $10.5 million and $9.9 million, respectively, primarily driven by a 35.9% increase in ADV, from 244 thousand contracts per day in 2016 to 331 thousand contracts per day in 2017 and a 2.5% increase in revenue per contract.
For the ninethree months ended September 30, 2017 comparedMarch 31, 2021 primarily due to the same periodincreases in 2016, the net revenueprofessional fees and operating income increased $21.6 millionoutside services, other expenses, and $22.5 million, respectively, primarily driven by a 29.7% increase in ADV, from 240 thousand contracts per day in 2016 to 311 thousand contracts per day in 2017 and a 4.7% increase in revenue per contract.
Europeantechnology support services.North American Equities
The following summarizes revenues less cost of revenues, operating expenses, operating income, EBITDA, and EBITDA margin for our EuropeanNorth American Equities segment:
| | | | | | | | | | | | | | | | | | |
| | | | | | | | | | | | | Percentage | | |
| | | | | | | | | | | | | of Total | | |
| | | | | | | | | | | | | Revenues | | |
| | Three Months Ended | | | | | | Three Months Ended | | |
| | March 31, | | | Percent | | | March 31, | | |
| | 2022 | | | 2021 | | | Change | | | 2022 | | | 2021 | | |
Revenues less cost of revenues | | $ | 93.1 | | | $ | 96.1 | | | (3) | % | | 22 | % | | 18 | % | |
Operating expenses | | | 54.5 | | | | 51.0 | | | 7 | % | | 13 | % | | 10 | % | |
Operating income | | $ | 38.6 | | | $ | 45.1 | | | (14) | % | | 9 | % | | 9 | % | |
EBITDA (1) | | $ | 56.5 | | | $ | 64.5 | | | (12) | % | | 13 | % | | 12 | % | |
EBITDA margin (2) | | | 60.7 | % | | | 67.1 | % | | * | | | * | | | * | | |
|
| | | | | | | | | | | | | | | | | | | | | | | | | |
| | |
| |
| | | Percentage of Total Revenues | | |
| |
| | | Percentage of Total Revenues |
| | Three Months Ended
September 30, | Percent Change | | Three Months Ended
September 30, | | Nine Months Ended
September 30, | Percent Change | | Nine Months Ended
September 30, |
| 2017 | 2016 | | 2017 | 2016 | | 2017 | 2016 | | 2017 | 2016 |
| (in millions, except percentages) | | |
| |
| | |
| |
| | | |
| |
|
| Revenues less cost of revenues | $ | 18.4 |
| $ | — |
| * | | 3.0 | % | — | % | | $ | 43.0 |
| $ | — |
| * | | 2.7 | % | — | % |
| Operating expenses | 15.7 |
| — |
| * | | 2.6 | % | — | % | | 35.2 |
| — |
| * | | 2.2 | % | — | % |
| Operating income | $ | 2.7 |
| $ | — |
| * | | 0.4 | % | — | % | | $ | 7.8 |
| $ | — |
| * | | 0.5 | % | — | % |
| | | | | | | | | | | | | | |
| EBITDA (1) | $ | 10.6 |
| $ | — |
| * | | 1.7 | % | — | % | | $ | 25.6 |
| $ | — |
| * | | 1.6 | % | — | % |
| EBITDA margin (2) | 57.6 | % | * | * | | * | * | | 59.5 | % | * | * | | * | * |
* Not meaningful
(1) | (1) | See footnote (1) to the table under “Financial Summary” above for a reconciliation of net income to EBITDA, and management’s reasons for using such non-GAAP measures.(2) to the table under “Financial Summary” above for a reconciliation of net income to EBITDA, and management’s reasons for using such non-GAAP measures. |
| (2) | EBITDA margin represents EBITDA divided by revenues less cost of revenues. |
Revenues less cost of revenues decreased $3.0 million for the three months ended March 31, 2022 compared to the three months ended March 31, 2021 primarily due to a decline in transaction and clearing fees as a result of a 17% decrease in total touched shares on U.S. Equities exchanges. For the three months ended March 31, 2022, operating income for the North American Equities segment decreased $6.5 million compared to the three months ended March 31, 2021 primarily due to an increase in operating expenses, coupled with a decrease in revenues less cost of revenues.
For Operating expenses increased $3.5 million for the three and nine months ended September 30, 2017,March 31, 2022 compared to the European Equities segment contributedthree months ended March 31, 2021 primarily due to increases in professional fees and outside services and compensation and benefits, partially offset by a decrease in depreciation and amortization.
Europe and Asia Pacific
The following summarizes revenues less cost of revenues, of $18.4 million and $43.0 million, respectively, andoperating expenses, operating income, EBITDA, and EBITDA margin for our Europe and Asia Pacific segment (in millions, except percentages):
| | | | | | | | | | | | | | | | | | |
| | | | | | | | | | | | | Percentage | | |
| | | | | | | | | | | | | of Total | | |
| | | | | | | | | | | | | Revenues | | |
| | Three Months Ended | | | | | | Three Months Ended | | |
| | March 31, | | | Percent | | | March 31, | | |
| | 2022 | | | 2021 | | | Change | | | 2022 | | | 2021 | | |
Revenues less cost of revenues | | $ | 57.5 | | | $ | 42.1 | | | 37 | % | | 73 | % | | 75 | % | |
Operating expenses | | | 36.6 | | | | 27.6 | | | 33 | % | | 47 | % | | 50 | % | |
Operating income | | $ | 20.9 | | | $ | 14.5 | | | 44 | % | | 27 | % | | 26 | % | |
EBITDA (1) | | $ | 30.3 | | | $ | 22.6 | | | 34 | % | | 39 | % | | 41 | % | |
EBITDA margin (2) | | | 52.7 | % | | | 53.7 | % | | * | | | * | | | * | | |
*Not meaningful
| (1) | See footnote (2) to the table under “Financial Summary” above for a reconciliation of net income to EBITDA, and management’s reasons for using such non-GAAP measures. |
| (2) | EBITDA margin represents EBITDA divided by revenues less cost of revenues. |
Revenues less cost of $2.7revenues increased $15.4 million for the three months ended March 31, 2022 compared to the three months ended March 31, 2021 primarily due to a 71% increase in European Equities matched ADNV, driven by a 31% increase in European Equities market ADNV, and $7.8additional revenue attributable to Cboe Asia Pacific. For the three months ended March 31, 2022, operating income for the Europe and Asia Pacific segment increased $6.4 million respectively, resulting fromcompared to the three months ended March 31, 2021, due to higher revenues less cost of revenues. Operating expenses increased $9.0 million for the three months ended March 31, 2022 compared to the three months ended March 31, 2021 primarily due to increases in compensation and benefits and depreciation and amortization attributable to Cboe Asia Pacific.
Futures
The following summarizes revenues less cost of revenues, operating expenses, operating income, EBITDA, and EBITDA margin for our acquisitionFutures segment (in millions, except percentages):
| | | | | | | | | | | | | | | | | | |
| | | | | | | | | | | | | Percentage | | |
| | | | | | | | | | | | | of Total | | |
| | | | | | | | | | | | | Revenues | | |
| | Three Months Ended | | | | | | Three Months Ended | | |
| | March 31, | | | Percent | | | March 31, | | |
| | 2022 | | | 2021 | | | Change | | | 2022 | | | 2021 | | |
Revenues less cost of revenues | | $ | 31.2 | | | $ | 30.6 | | | 2 | % | | 97 | % | | 97 | % | |
Operating expenses | | | 14.2 | | | | 13.1 | | | 8 | % | | 44 | % | | 42 | % | |
Operating income | | $ | 17.0 | | | $ | 17.5 | | | (3) | % | | 53 | % | | 55 | % | |
EBITDA (1) | | $ | 17.6 | | | $ | 18.1 | | | (3) | % | | 54 | % | | 57 | % | |
EBITDA margin (2) | | | 56.4 | % | | | 59.2 | % | | * | | | * | | | * | | |
| (1) | See footnote (2) to the table under “Financial Summary” above for a reconciliation of net income to EBITDA, and management’s reasons for using such non-GAAP measures. |
| (2) | EBITDA margin represents EBITDA divided by revenues less cost of revenues. |
Revenues less cost of Bats on February 28, 2017.revenues increased $0.6 million for the three months ended March 31, 2022 compared to the three months ended March 31, 2021 primarily due to an increase in proprietary market data and logical port fees. For the three months ended March 31, 2022, operating income for the Futures segment decreased $0.5 million compared to the three months ended March 31, 2021 primarily due to higher operating expenses. Operating expenses increased $1.1 million for the three months ended March 31, 2022 compared to the three months ended March 31, 2021 primarily due to an increase in professional fees and outside services.
The following summarizes revenues less cost of revenues, operating expenses, operating income, EBITDA, and EBITDA margin for our Global FX segment:
| | | | | | | | | | | | | | | | | | |
| | | | | | | | | | | | | Percentage | | |
| | | | | | | | | | | | | of Total | | |
| | | | | | | | | | | | | Revenues | | |
| | Three Months Ended | | | | | | Three Months Ended | | |
| | March 31, | | | Percent | | | March 31, | | |
| | 2022 | | | 2021 | | | Change | | | 2022 | | | 2021 | | |
Revenues less cost of revenues | | $ | 17.1 | | | $ | 14.7 | | | 16 | % | | 99 | % | | 100 | % | |
Operating expenses | | | 14.7 | | | | 13.5 | | | 9 | % | | 85 | % | | 92 | % | |
Operating income | | $ | 2.4 | | | $ | 1.2 | | | 100 | % | | 14 | % | | 8 | % | |
EBITDA (1) | | $ | 8.2 | | | $ | 7.6 | | | 8 | % | | 47 | % | | 52 | % | |
EBITDA margin (2) | | | 48.0 | % | | | 51.7 | % | | * | | | * | | | * | | |
|
| | | | | | | | | | | | | | | | | | | | | | | | | |
| | |
| |
| | | Percentage of Total Revenues | | |
| |
| | | Percentage of Total Revenues |
| | Three Months Ended
September 30, | Percent Change | | Three Months Ended
September 30, | | Nine Months Ended
September 30, | Percent | | Nine Months Ended
September 30, |
| 2017 | 2016 | | 2017 | 2016 | | 2017 | 2016 | Change | | 2017 | 2016 |
| | (in millions, except percentages) |
| Revenues less cost of revenues | $ | 11.3 |
| $ | — |
| * | | 1.8 | % | — | % | | $ | 26.2 |
| $ | — |
| * | | 1.6 | % | — | % |
| Operating expenses | 14.8 |
| — |
| * | | 2.4 | % | — | % | | 35.0 |
| — |
| * | | 2.1 | % | — | % |
| Operating (loss) income | $ | (3.5 | ) | $ | — |
| * | | (0.6 | )% | — | % | | $ | (8.8 | ) | $ | — |
| * | | (0.5 | )% | — | % |
| | �� | | | | | | | | | | | | |
| EBITDA (1) | $ | 5.6 |
| $ | — |
| * | | 0.9 | % | — | % | | $ | 12.4 |
| $ | — |
| * | | 0.8 | % | — | % |
| EBITDA margin (2) | 49.6 | % | * | * | | * | * | | 47.3 | % | * | * | | * | * |
* Not meaningful
(1) | (1) | See footnote (1) to the table under “Financial Summary” above for a reconciliation of net income to EBITDA and adjusted EBITDA, and management’s reasons for using such non-GAAP measures.(2) to the table under “Financial Summary” above for a reconciliation of net income to EBITDA, and management’s reasons for using such non-GAAP measures. |
| (2) | EBITDA margin represents EBITDA divided by revenues less cost of revenues. |
Revenues less cost of revenues increased $2.4 million for the three months ended March 31, 2022 compared to the three months ended March 31, 2021 primarily due to a 13% increase in Global FX ADNV. For the three months ended March 31, 2022, operating income for the Global FX segment increased $1.2 million compared to the three months ended March 31, 2021 primarily due to an increase in revenues less cost of revenues.
For Operating expenses increased $1.2 million for the three and nine months ended September 30, 2017,March 31, 2022 compared to the Global FX segment contributed revenues less cost of revenues of $11.3 millionthree months ended March 31, 2021 primarily due to an increase in compensation and $26.2 million, respectively,benefits, partially offset by a decrease in depreciation and an operating loss of $3.5 million and $8.8 million, respectively, resulting from our acquisition of Bats on February 28, 2017.
Seasonality
In the securities and FX industries, quarterly revenue fluctuations are common and are due primarily to seasonal variations in trading volumes, as well as competition and technological and regulatory changes. Our business may experience seasonal fluctuations, reflecting reduced trading activity.
amortization.Liquidity and Capital Resources
Below are charts that reflect elements of our capital allocation:
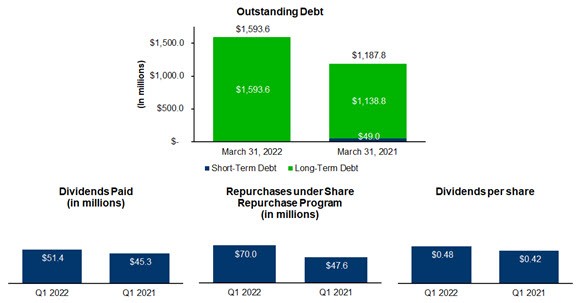
We expect our cash on hand at September 30, 2017March 31, 2022 and other available resources, including cash generated from operations, to be sufficient to continue to meet our 2017 cash requirements.requirements for the foreseeable future. In the near term, we expect that our cash from operations and availability under our revolving credit facilitythe Revolving Credit Facility and Term Loan Agreement will
meet our cash needs to fund our operations, capital expenditures, interest payments on debt, debt repayments, any dividends, andpotential strategic acquisitions, opportunities for common stock repurchases under the previously announced program.program, and payouts related to the unfavorable decision in the Section 199 litigation. We may also plan to utilize excess cash on hand to pay down amounts outstanding under the Term Loan Agreement. See Note 11 “Debt”10 (“Debt”) of the condensed consolidated financial statements for further information.
EuroCCP also has a €1.5 billion committed syndicated multicurrency revolving and swingline credit facility agreement with EuroCCP as borrower and the Company as guarantor of scheduled interest and fees on borrowings (but not the principal amount of any borrowings) (the “Facility”). The Facility is available to be drawn by EuroCCP towards (a) financing unsettled amounts in connection with the settlement of transactions in securities and other items processed through EuroCCP’s clearing system and (b) financing any other liability or liquidity requirement of EuroCCP incurred in the operation of its clearing system. Borrowings under the Facility are secured by cash, eligible bonds and eligible equity assets deposited by EuroCCP into secured accounts. As a result, should the Facility be drawn by EuroCCP it could potentially impact EuroCCP’s liquidity, and we can give no assurance that this Facility will be sufficient to meet all of such obligations or sufficiently mitigate EuroCCP’s liquidity risk to meet its payment obligations when due. Additionally, a default of the Facility may allow lenders, under certain circumstances, to accelerate any related drawn amounts and may result in the acceleration of the Company’s other outstanding debt to which a cross-acceleration or cross-default provision applies, which may limit the Company’s liquidity, business and financing activities. The Facility is expected to terminate on June 30, 2022 and we may not be able to enter into a replacement facility on commercially reasonable terms, or at all.
Our long-term cash needs will depend on many factors, including an introduction of new products, enhancements of current products, the geographic mix of our business and any potential acquisitions. We believe our cash from operations and the availability under our revolving credit facilityRevolving Credit Facility will meet any long-term needs unless a significant acquisition isor acquisitions are identified, in which case we expect that we would be able to borrow the necessary funds and/or issue additional shares of our common stock to complete such an acquisition.
acquisition(s). In addition, we do not expect COVID-19 to have a material impact on our liquidity or capital resources, including cash from operations or uses of cash, or change our ability to access capital markets in the near term or the foreseeable future.Cash and cash equivalents include cash in banks and all non-restricted, highly liquid investments with original maturities of three months or less at the time of purchase. Cash and cash equivalents as of September 30, 2017March 31, 2022 increased $27.5$317.5 million from December 31, 20162021 primarily driven bydue to the Bats acquisitionissuance of the 3.000% Senior Notes, results of operations, and payment of long-term debt offset by the proceeds from long-term debt.adjustment for depreciation expense. See “—Cash“Cash Flow” below for further discussion.
Our cash and cash equivalents held outside of the United States in various foreign subsidiaries totaled $41.6$173.1 million as of September 30, 2017.March 31, 2022. The remaining balance was held in the United States and totaled $83.2$486.3 million as of September 30, 2017. No cash or cash equivalents were held outside of the United States as of DecemberMarch 31, 2016.2022. The majority of cash held outside the United States is available for repatriation, but under current law, could subject us to additional United States income taxes, less applicable foreign tax credits. In connection with ETF.com, we have $1.8 million of restricted cash held to be paid to the sellers of ETF.com within 18 months after the acquisition date of April 1, 2016 upon release of seller indemnifications per the terms of the acquisition agreement.
Our financial investments include deferred compensation plan assets, as well as investments with original or acquired maturities longer than three months, but that mature in less than one year from the statement of financial conditionbalance sheet date and are recorded at fair value. As of September 30, 2017March 31, 2022 and December 31, 2016,2021, financial investments primarily consisted of U.S. Treasury securities.securities and deferred compensation plan assets.
The following table summarizes our cash flow data for the ninethree months ended September 30, 2017:
|
| | | | | | | | |
| | | Nine Months Ended
September 30, |
| | 2017 | | 2016 |
| Net cash provided by operating activities | | $ | 178.9 |
| | $ | 174.1 |
|
| Net cash used in investing activities | | (1,369.6 | ) | | (77.3 | ) |
| Net cash provided by (used in) financing activities | | 1,214.3 |
| | (126.3 | ) |
| Effect of foreign currency exchange rate changes on cash and cash equivalents | | 3.9 |
| | — |
|
| | | $ | 27.5 |
| | $ | (29.5 | ) |
March 31, 2022 and 2021, respectively (in millions): | | | | | | |
| | Three Months Ended |
| | March 31, |
| | 2022 | | 2021 |
Net cash provided by operating activities | | $ | 1,259.8 | | $ | 599.1 |
Net cash used in investing activities | | | (24.9) | | | (13.3) |
Net cash provided by (used in) financing activities | | | 146.5 | | | (119.5) |
Effect of foreign currency exchange rate changes on cash, cash equivalents, and restricted cash and cash equivalents | | | 0.7 | | | (0.5) |
Increase in cash, cash equivalents, and restricted cash and cash equivalents | | $ | 1,382.1 | | $ | 465.8 |
|
| | |
| | As of March 31, |
| | 2022 | | 2021 |
Reconciliation of cash, cash equivalents, and restricted cash and cash equivalents: | | | | | | |
Cash and cash equivalents | | $ | 659.4 | | $ | 263.3 |
Restricted cash and cash equivalents (margin deposits and clearing funds) | | | 1,810.3 | | | 1,260.0 |
Restricted cash and cash equivalents (included in other current assets) | | | 4.6 | | | — |
Total | | $ | 2,474.3 | | $ | 1,523.3 |
Net Cash Flows Provided by Operating Activities
During the ninethree months ended September 30, 2017,March 31, 2022, net cash provided by operating activities was $39.7$1,150.2 million greaterhigher than net income. The variance is primarily attributedattributable to our acquisitionthe change of Bats. Primarily as a result$1,064.4 million of restricted cash and cash equivalents, driven by margin deposits and clearing funds related to EuroCCP, the acquisition, we hadchange in accounts payable and accrued liabilities of $93.7 million, the change in income taxes receivable of $42.7 million, the adjustment for depreciation of $40.9 million, and amortization totaling $136.3the change in income taxes payable of $24.5 million, partially offset by the change in accounts receivable of $56.2 million and the adjustment for the provision for deferred income taxes of $17.8 million for the ninethree months ended September 30, 2017. This amountMarch 31, 2022.
Net cash flows provided by operating activities were $1,259.8 million and $599.1 million for the three months ended March 31, 2022 and 2021, respectively. The change in net cash flows provided by operating activities was primarily due to the change in restricted cash and cash equivalents, driven by margin deposits and clearing funds related to EuroCCP, the change in Section 31 fees payable, and the change in unrecognized tax benefits, partially offset by athe change in accounts receivable and the Sectionchange in other liabilities for the three months ended March 31, fee payable of $110.1 million.
2022 compared to the three months ended March 31, 2021.Net Cash Flows Used in Investing Activities
Net cash flows used in investing activities were $24.9 million and $13.3 million for the ninethree months ended September 30, 2017March 31, 2022 and 2016 were $1,369.6 million, and $77.3 million.2021, respectively. The variance is primarily attributeddue to our acquisitionthe change in the proceeds from available-for-sale financial investments, partially offset by the change in purchases of Bats on February 28, 2017.
available-for-sale financial investments for the three months ended March 31, 2022 compared to the three months ended March 31, 2021.Net Cash Flows Provided by (Used in) Financing Activities
Net cash flows provided by (used in) financing activities were $146.5 and ($119.5) million for the ninethree months ended September 30, 2017March 31, 2022 and 2016 were $1,214.3 million and $(126.3) million,2021, respectively. We receivedThe variance is primarily attributable to proceeds from the long-term debt issuance of $1,944.2$298.6 million, while making principal payments on long-term debtpartially offset by the change in share repurchases, as well as the change in payment of $625.0 million and paying dividends totaling $87.4 million.contingent consideration from acquisition for the three months ended March 31, 2022 compared to the three months ended March 31, 2021.
The following summarizes our financial assets, excluding margin deposits and clearing funds, as of September 30, 2017March 31, 2022 and December 31, 20162021 (in millions):
| | | | | | |
| | March 31, | | December 31, |
| | 2022 | | 2021 |
Cash and cash equivalents | | $ | 659.4 | | $ | 341.9 |
Financial investments | | | 48.7 | | | 37.1 |
Less deferred compensation plan assets | | | (27.4) | | | (28.0) |
Less cash collected for Section 31 fees | | | (20.7) | | | (25.9) |
Adjusted cash (1) | | $ | 660.0 | | $ | 325.1 |
| (1) | Adjusted cash is a non-GAAP measure and represents cash and cash equivalents plus financial investments, minus deferred compensation plan assets and cash collected for Section 31 fees. We have presented adjusted cash because we consider it an important supplemental measure of our liquidity and believe that it is frequently used by analysts, investors and other interested parties in the evaluation of companies. |
|
| | | | | | | |
| | September 30, 2017 | | December 31, 2016 |
| Cash and cash equivalents | $ | 124.8 |
| | $ | 97.3 |
|
| Financial investments | 2.4 |
| | — |
|
| Cash collected for Section 31 fees | — |
| | — |
|
| Adjusted cash (1) | $ | 127.2 |
| | $ | 97.3 |
|
(1) Adjusted cash is a non-GAAP measure and represents cash and cash equivalents plus financial investments minus cash collected for Section 31 fees, which will need to be remitted in the near term. We have presented adjusted cash because we consider it an important supplemental measure of our liquidity and believe that it is frequently used by analysts, investors and other interested parties in the evaluation of companies.
The following summarizes our debt obligations as of September 30, 2017March 31, 2022 and December 31, 20162021 (in millions):
|
| | | | | | | |
| | September 30, 2017 | | December 31, 2016 |
| Term Loan Agreement | $ | 375.0 |
| | $ | — |
|
| 3.650% Senior Notes | 650.0 |
| | — |
|
| 1.950% Senior Notes | 300.0 |
| | — |
|
| Revolving Credit Agreement | — |
| | — |
|
| Less unamortized discount and debt issuance costs | (12.6 | ) | | — |
|
| Total long-term debt | $ | 1,312.4 |
| | $ | — |
|
| | | | | | |
| | March 31, | | December 31, |
| | 2022 | | 2021 |
Term Loan Agreement | | $ | 160.0 | | $ | 160.0 |
3.650% Senior Notes | | | 650.0 | | | 650.0 |
1.625% Senior Notes | | | 500.0 | | | 500.0 |
3.000% Senior Notes | | | 300.0 | | | — |
Revolving Credit Agreement | | | — | | | — |
EuroCCP Credit Facility | | | — | | | — |
Less unamortized discount and debt issuance costs | | | (16.4) | | | (10.7) |
Total debt | | $ | 1,593.6 | | $ | 1,299.3 |
As of September 30, 2017March 31, 2022 and December 31, 2016,2021, we were in compliance with the covenants of our debt agreements.
In addition to the debt outstanding, as of September 30, 2017,March 31, 2022, we had an additional $150.0$400.0 million available through our revolving credit facility.facility, with the ability to borrow another $200.0 million by increasing the commitments under the facility, and, as of March 31, 2022, through September 30, 2022 we have an additional $400.0 million available through our term loan agreement. Together with adjusted cash, we had $277.2 million$1.7 billion available to fund our operations, capital expenditures, potential acquisitions, debt repayments and any dividends as of September 30, 2017.March 31, 2022.
Dividends
The Company’s expectation is to continue to pay dividends. The decision to pay a dividend, however, remains within the discretion of the Company's Board of Directors and may be affected by various factors, including our earnings, financial condition, capital requirements, level of indebtedness and other considerations our Board of Directors deems relevant. Future debt obligations and statutory provisions, among other things, may limit, or in some cases prohibit, our ability to pay dividends.
Share Repurchase Program
In 2011, the Board of Directors approved an initial authorization for the Company to repurchase shares of its outstanding common stock of $100 million and subsequently approved additional authorizations for a total authorization of $1.6 billion. The program permits the Company to purchase shares through a variety of methods, including in the open market or through privately negotiated transactions, in accordance with applicable securities laws. It does not obligate the Company to make any repurchases at any specific time or situation.
Under the program, for the three months ended March 31, 2022, the Company repurchased 596,988 shares of common stock at an average cost per share of $117.25, totaling $70.0 million. Since inception of the program through March 31, 2022, the Company has repurchased 18,669,117 shares of common stock at an average cost per share of $69.69, totaling $1.3 billion.
As of March 31, 2022, the Company had $248.9 million of availability remaining under its existing share repurchase authorizations.
Commercial Commitments and Contractual Obligations
As of September 30, 2017,March 31, 2022, our commercial commitments and contractual obligations included real property leases, operating leases, data and telecommunications agreements, equipment leases, our long-term debt outstanding, contingent considerationconsiderations and other obligations. See Note 21 (“Commitments, Contingencies, and Contingencies,Guarantees”) to the condensed consolidated financial statements for a discussion of commitments and contingencies, and Note 11, Debt,10 (“Debt”) for a discussion of the outstanding long-term debt.debt, Note 12 (“Clearing Operations”) for information on EuroCCP’s clearinghouse exposure guarantee, and Note 22 (“Leases”) for discussion on operating leases and equipment leases.
Guarantees
We use Wedbush and Morgan Stanley to clear our routed equities transactions for our U.S. Equities exchanges. Wedbush and Morgan Stanley guarantee the trade until one day after the trade date, after which time the National Securities Clearing Corporation (“NSCC”) provides a guarantee. The BIDS Trading ATS platform delivers matched trades to BofA Securities, Inc. (“BOA”), which delivers the matched trades to the NSCC. BOA guarantees the trade until one day after the trade date, after which time the NSCC provides a guarantee. In the case of failure to perform on the part of Wedbush or Morgan Stanley on routed transactions for our U.S. Equities exchanges, we provide the guarantee to the counterparty to the trader. In the case of failure to perform on the part of BOA on transactions for the BIDS Trading ATS platform, BIDS has obligations to the counterparties to satisfy the trades. OCC acts as a central counterparty on all transactions in listed equity options in our Options segment, and as such, guarantees clearance and settlement of all of our options transactions. We believe that any potential requirement for us to make payments under these guarantees is remote and accordingly, have not recorded any liability in the consolidated financial statements for these guarantees. Similarly, with respect to U.S. listed equity options and futures, we deliver matched trades of our customers to the OCC, which acts as a central counterparty on all transactions occurring on Cboe Options, C2, BZX, EDGX, and CFE and, as such, guarantees clearance and settlement of all of our matched options and futures trades. With respect to Canadian equities, we deliver matched trades of our customers to The Canadian Depository for Securities, which acts as a central counterparty on all transactions occurring on MATCHNow and, as such, guarantees clearance and settlement of all of our matched Canadian equities trades. With respect to Australian equities and derivatives, we deliver matched trades of our customers to ASX Clear Pty Ltd and ASX Settlement Pty Ltd. ASX Clear Pty Ltd acts as a central counterparty on all transactions occurring on Cboe Australia and, as such, guarantees clearance and settlement on all of our matched trades in Australia. With respect to Japanese equities, we deliver matched trades of our customers to the Japanese Securities Clearing Corporation, which acts as a central counterparty on all transactions occurring on Cboe Japan and, as such, guarantees clearance and settlement on all of our matched trades in Japan.
Critical Accounting Estimates
The preparation of consolidated financial statements in conformity with U.S. GAAP requires our management to make estimates and assumptions that affect the reported amounts of assets and liabilities, disclosure of the amounts of contingent assets and liabilities at the date of the financial statements and the reported amounts of revenues and expenses during the reporting period. Actual results could differ materially from those estimates. On an ongoing basis, the Company evaluates its estimates, including those related to areas that require a significant level of judgment or are otherwise subject to an inherent degree of uncertainty. The Company bases its estimates on historical experience, observance of trends in particular areas, information available from outside sources and various other assumptions that are believed to be reasonable under the circumstances. Information from these sources form the basis for making judgments about the carrying values of assets and liabilities that may not be readily apparent from other sources.
In the three months ended March 31, 2022, there were no significant changes to our critical accounting estimates from those disclosed in the “Management’s Discussion and Analysis of Financial Condition and Results of Operations” in our 2021 Annual Report on Form 10-K.
Off Balance Sheet Arrangements65
As
Item 3.
Quantitative and Qualitative Disclosures about Market Risk
As a result of our operating activities, we are exposed to market risks such as foreign currency exchange rate risk, equity risk, credit risk, interest rate risk, and creditliquidity risk. We have implemented policies and procedures to measure, manage and monitor and report risk exposures, which are reviewed regularly by management and our boardBoard of directors.
Directors.Foreign Currency Exchange Rate Risk
As a result of the acquisition of Bats, we expanded ourOur operations in Europe, Canada and Asia and are subject to increased currency translation risk as revenues and expenses are denominated in foreign currencies, primarily the British pound, SingaporeCanadian dollar, Euro, Australian dollar, and the Euro.Japanese Yen. We also have de minimis exposure to other foreign currencies, including the Swiss Franc, Norwegian Kroner, Swedish Krona, Danish Kroner, Singapore dollar, Hong Kong dollar, and Danish Kroner.
Philippine Peso.For the three and nine months ended September 30, 2017,March 31, 2022, our exposure to foreign-denominated revenues and expenses is presented by primary foreign currency in the following table:
table (in millions, except percentages): | | | | | | | | | | | | |
| | Three Months Ended | |
| | March 31, 2022 | |
| | British | | | | | | Australian | |
| | Pounds (1) | | | Euros (1) | | | Dollars (1) | |
Foreign denominated % of: | | | | | | | | | | | | |
Revenues | | | 2.0 | % | | | 3.6 | % | | | 0.6 | % |
Cost of revenues | | | — | % | | | 3.2 | % | | | 0.1 | % |
Operating expenses | | | 4.9 | % | | | 5.8 | % | | | 2.9 | % |
Impact of 10% adverse currency fluctuation on: | | | | | | | | | | | | |
Revenues | | $ | 1.9 | | | $ | 3.5 | | | $ | 0.6 | |
Cost of revenues | | | — | | | | 1.8 | | | | — | |
Operating expenses | | | 0.9 | | | | 1.0 | | | | 0.5 | |
| (1) | An average foreign exchange rate to the U.S. dollar for the period was used. See Item 2 (“Management’s Discussion and Analysis of Financial Condition and Results of Operations”) for the table summarizing the changes in certain operational and financial metrics for more information. |
|
| | | | | | | | | | | | | | | |
| | Three Months Ended
September 30, 2017 | | Nine Months Ended
September 30, 2016 |
| Euro(1) | | British Pound (1) | | Euro(1) | | British Pound (1) |
| Foreign denominated % of: | | | | | | | |
| Revenues | 1.9 | % | | 1.8 | % | | 2.2 | % | | 2.0 | % |
| Cost of revenues | 1.6 | % | | — | % | | 1.9 | % | | — | % |
| Operating expenses | 0.4 | % | | — | % | | 0.1 | % | | — | % |
| Impact of 10% adverse currency fluctuation on: | | | | | | | |
| Revenues | $ | 1.1 |
| | $ | 1.1 |
| | $ | 3.5 |
| | $ | 3.3 |
|
| Cost of revenues | 0.5 |
| | — |
| | 1.0 |
| | — |
|
| Operating expenses | 0.1 |
| | — |
| | — |
| | — |
|
(1) An average foreign exchange rate to the U.S. dollar for the period was used.
Our investment in European, Canadian, and Asia Pacific operations is exposed to volatility in currency exchange rates through translation of our net assets or equity to U.S. dollars. The assets and liabilities of our European businessbusinesses are denominated in British pounds.pounds or Euros. The assets and liabilities of our Canadian businesses are denominated in Canadian dollars. The assets and liabilities of our Asia Pacific businesses are denominated in Hong Kong dollars, Australian dollars, Japanese Yen, or Philippine Pesos. Fluctuations in currency exchange rates may create volatility in our reported results as we are required to translate foreign currency reported statements of financial condition and incomeoperational results into U.S. dollars for consolidated reporting. The translation of these non-U.S. dollar statements of financial condition into U.S. dollars for consolidated reporting results in a cumulative translation adjustment, which is recorded in accumulated other comprehensive loss (income)income, net within stockholders' equity on our condensed consolidated statements of financial condition. balance sheet.
Our primary exposure to this equity risk as of September 30, 2017March 31, 2022 is presented by foreign currency in the following table:
| | | | | | | | | |
| | British | | | | Canadian |
| | Pounds (1) | | Euros (1) | | Dollars (1) |
Net equity investment in Cboe Europe Equities and Derivatives, EuroCCP, and MATCHNow | | $ | 634.8 | | $ | 129.4 | | $ | 194.5 |
Impact on consolidated equity of a 10% adverse currency fluctuation | | | 63.5 | | | 12.9 | | | 19.4 |
| (1) | Converted to U.S. dollars using the foreign exchange rate of British pounds per U.S. dollar, Euros per U.S. dollar, and Canadian dollars per U.S. dollar, respectively, as of March 31, 2022. |
|
| | | |
| | British Pound (1) |
| | (in millions) |
| Net equity investment in Cboe Europe Equities | $ | 689.9 |
|
| Impact on consolidated equity of a 10% adverse currency fluctuation | $ | 69.0 |
|
(1) Converted to U.S. dollars using the foreign exchange rate
We are exposed to credit risk from third parties, including customers, counterparties and clearing agents. These parties may default on their obligations due to bankruptcy, lack of liquidity, operational failure or other reasons. We limit our exposure to credit risk by considering such risk when selecting the counterparties with which we make investments and execute agreements.
We do not have counterparty credit risk with respect to trades matched on our exchanges in the U.SU.S., Canada, and Europe. With respect to listed cash equities, we deliver matched trades of our customers to the National Security Clearing Corporation, NSCC without taking on counterparty risk for those trades. NSCC acts as a central counterparty on all equity transactions occurring on BZX, BYX, EDGX and EDGA and, as such, guarantees clearance and settlement of all of our matched equity trades. Similarly, with respect to U.S. listed equity options and futures, we deliver matched trades of our customers to the OCC, which acts as a central counterparty on all transactions occurring on Cboe Options, C2, BZX, EDGX and CFE and, as such, guarantees clearance and settlement of all of our matched options and futures trades.
With respect to Canadian equities, we deliver matched trades of our customers to The Canadian Depository for Securities, which acts as a central counterparty on all transactions occurring on MATCHNow and, as such, guarantees clearance and settlement of all of our matched Canadian equities trades. The BIDS Trading ATS platform delivers matched trades to BOA, which delivers the matched trades to the NSCC. BOA guarantees the trade until one day after the trade date, after which time the NSCC provides a guarantee. Thus, BIDS Trading is potentially exposed to credit risk to the counterparty between the trade date and one day after the trade date in the event BOA fails. With respect to Australian equities and derivatives, we deliver matched trades of our customers to ASX Clear Pty Ltd and ASX Settlement Pty Ltd. ASX Clear Pty Ltd acts as a central counterparty on all transactions occurring on Cboe Australia and, as such, guarantees clearance and settlement on all of our matched trades in Australia. With respect to Japanese equities, we deliver matched trades of our customers to the Japanese Securities Clearing Corporation, which acts as a central counterparty on all transactions occurring on Cboe Japan and, as such, guarantees clearance and settlement on all of our matched trades in Japan.With respect to orders Cboe Trading routes to other markets for execution on behalf of our customers, Cboe Trading is exposed to some counterparty credit risk in the case of failure to perform on the part of our clearing firms, Morgan Stanley & Co. LLC (Morgan Stanley) or Wedbush Securities, Inc. (Wedbush Securities).Wedbush. Morgan Stanley and Wedbush Securities guarantee trades until one day after the trade date, after which time NSCC provides a guarantee. The BIDS Trading ATS platform delivers matched trades to BOA, which delivers the matched trades to the NSCC. Thus, Cboe Trading is potentially exposed to credit risk to the counterparty to a trade routed to another market center between the trade date and one day after the trade date in the event that Morgan Stanley or Wedbush Securitiesfails. The BIDS Trading ATS platform is potentially exposed to counterparty credit risk on equities trades between the trade date and one day after the trade date in the event that BOA fails. We believe that any potential requirement for us to make payments under these guarantees is remote and accordingly, have not recorded any liability in the condensed consolidated financial statements for these guarantees.
Similarly, with respect to orders in U.S. listed equity options, we route orders for execution to other national securities exchanges through either Trading or through affiliates of Bank of America Merrill Lynch, Wedbush Securities, Wolverine Execution Services, L.L.C. and Compass Professional Services, L.L.C. Trading has counterparty credit risk exposure to these firms until a trade settles (generally one day after the trade date). We believe that any potential requirement for us to make payments under these guarantees is remote. Accordingly, we have not recorded any liability in our consolidated financial statements for these guarantees.
Historically, we have not incurred any liability due to a customer’s failure to satisfy its contractual obligations as counterparty to a system trade. Credit difficulties or insolvency, or the perceived possibility of credit difficulties or insolvency, of one or more larger or more visible market participants could also result in market-wide credit difficulties or other market disruptions.
We do not have counterparty credit risk with respect to institutional spot FX trades occurring on our platform because Cboe FX is not a counterparty to any FX transactions. All transactions occurring on our platform occur bilaterally between two banks or prime brokers as counterparties to the trade. While Cboe FX does not have direct counterparty risk, Cboe FX may suffer a decrease in transaction volume if a bank or prime broker experiences an event that causes other prime brokers to decrease or revoke the credit available to the prime broker experiencing the event. Therefore, Cboe FX may have risk that is related to the credit of the banks and prime brokers that trade FX on the Cboe FX platform.
We also have credit risk related to transaction fees that are billed in arrears to customers on a monthly basis. Our potential exposure to credit losses on these transactions is represented by the receivable balances in our consolidated statements of financial condition.balance sheet. Our customers are financial institutions whose ability to satisfy their contractual obligations may be impacted by volatile securities markets.
The Company is exposed to further credit risk through our clearing operations. EuroCCP holds material amounts of clearing participant collateral, both cash and non-cash deposits, which are held or invested primarily to provide security of
capital while minimizing credit risk as well as liquidity and market risks. The following is a summary of the risks associated with these deposits and how these risks are mitigated:
| ● | Credit Risk -The credit risk is predominantly in the event a clearing participant fails to meet a financial or contractual obligation. EuroCCP attempts to mitigate this risk through minimum participant requirements for clearing participants and monitoring their financial health. To cover potential loss to EuroCCP in the event of a clearing participant default, collateral is required from clearing participants. Besides potential defaults of clearing participants, the main credit risk faced by the clearinghouse is exposure to clearing participants when a trade fails to settle. To help mitigate this risk, a fail fee is charged to discourage late settlements. This fee covers EuroCCP’s costs but also acts as a deterrent as required by Regulation (EU) No 236/2012 on short selling, together with certain aspects of credit default swaps. |
| ● | Liquidity Risk -Liquidity risk is the risk EuroCCP may not be able to meet its payment obligations in the right currency, in the right place and at the right time. To help mitigate this risk, EuroCCP monitors its liquidity requirements closely and maintains funds and assets in a manner which attempt to minimize the risk of loss or delay in the access by the clearinghouse to such funds and assets. For example, holding funds with a central bank where possible or making only short-term investments serves to help reduce liquidity risks. Liquidity is mainly required for securities settlement. The payment and settlement obligations generally stem from the function of EuroCCP as a cash equity clearinghouse: shares are bought and sold by clearing participants on a trading platform or OTC, and netted to settle two days later. During the settlement the actual payment for and delivery of the shares take place, this process requires intraday liquidity. If counterparties, which receive shares against payment, are unable to settle, an overnight liquidity need arises. The overnight liquidity is typically very short term, and is usually limited to a few days. |
| ● | Market Risk - EuroCCP is also exposed to market risk in the event that a clearing participant defaults and the market prices of the securities in its open positions have moved adversely so the clearinghouse can only close out the participant’s obligations at a loss. To help mitigate market risk, EuroCCP collects collateral from clearing participants to cover for the probable loss during normal market conditions, together with contributions to the clearing fund to cover losses if a default occurred during extreme but plausible market conditions. Adverse movements in exchange rates affecting the value of obligations and collateral are factored into the calculation of the amount of collateral to be collected. |
On a regular basis, we review and evaluate changes in the status of our counterparties’ creditworthiness. Credit losses such as those described above could adversely affect our condensed consolidated financial position and results of operations. Any such effects to date have been minimal.
Interest Rate Risk
We have exposure to market risk for changes in interest rates relating to our cash and cash equivalents, financial investments, and indebtedness. As of March 31, 2022 and 2021, our cash and cash equivalents and financial investments were $708.1 million and $358.8 million, respectively, of which $173.1 million and $133.4 million is held outside of the United States in various foreign subsidiaries in 2022 and 2021, respectively. The remaining cash and cash equivalents and financial investments are denominated in U.S. dollars. We do not use our investment portfolio for trading or other speculative purposes. Due to the nature of these investments, we have not been exposed to, nor do we anticipate being exposed to, material risks due to changes in interest rates, assuming no change in the amount or composition of our cash and cash equivalents and financial investments.
As of March 31, 2022, we had $1,593.6 million in outstanding debt, of which $1,436.0 million relates to our Senior Notes, which bear interest at fixed interest rates. Changes in interest rates will have no impact on the interest we pay on fixed-rate obligations. $159.5 million of the outstanding debt relates to the Term Loan Agreement, which bears interest at fluctuating rates and, therefore, subjects us to interest rate risk. The discontinuance of LIBOR and introduction to SOFR also contributes to interest rate risk. The overnight Treasury repurchase market underlying SOFR has experienced and may experience disruptions from time to time, which may result in unexpected fluctuations, including potentially higher rates, in SOFR. The Company continues to monitor the transition from LIBOR to SOFR and the potential impacts on our operating results. A hypothetical 100 basis point increase in interest rates relating to the amounts outstanding under the Term Loan Agreement as of March 31, 2022 would decrease annual pre-tax earnings by $1.6 million, assuming no change in the composition of our outstanding indebtedness. We are also exposed to changes in interest rates as a result of borrowings under our Revolving Credit Agreement and the EuroCCP Credit Facility, as these facilities bear interest at fluctuating rates. As of March 31, 2022, there were no outstanding borrowings under our Revolving Credit Agreement. However, there were $1.9 million in debt issuance costs related to the amendment of the Revolving Credit Agreement as
defined in Note 10 (“Debt”). There were no outstanding borrowings under the EuroCCP Credit Facility. See Note 10 (“Debt”) to the condensed consolidated financial statements for a discussion of debt agreements.
Liquidity Risk
We are exposed to liquidity risk under certain circumstances in relation to the cross-acceleration and cross-default provisions within the Term Loan Agreement and the Revolving Credit Agreement as a result of the Company, as guarantor, entering into the EuroCCP Credit Facility. A default of the Facility may allow lenders to accelerate any related drawn amounts and may result in the acceleration of the Company’s other outstanding debt to which a cross-acceleration or cross-default provision applies, which may limit the Company’s liquidity, business and financing activities. See Note 10 (“Debt”) to the condensed consolidated financial statements for a discussion of debt agreements.
Item 4. Controls and Procedures
a)Disclosure controls and procedures. The Company'sCompany’s management, with the participation of its Chief Executive Officer and Chief Financial Officer, has evaluated the effectiveness of the Company'sCompany’s disclosure controls and procedures (as defined in Rule 13a-15(e) and Rule 15d-15(e) under the Securities Exchange Act of 1934 (the “Exchange Act”))1934) as of the end of the period covered by this report. Based upon that evaluation, the Company'sCompany’s Chief Executive Officer and Chief Financial Officer have concluded that, as of the end of such period, the Company'sCompany’s disclosure controls and procedures are effective.
(b) b)Internal controls over financial reporting. On February 28, 2017, the Company acquired Bats. In conducting the evaluation of the effectiveness of internal controls over financial reporting, the Company elects to exclude Bats when conducting the annual evaluation of internal controls as permitted by applicable regulations. The Company is implementing internal controls over significant processes specific to the acquisition that management believes are appropriate in consideration of related integration of operations, systems, control activities, and accounting for the merger and merger-related transactions.
As of the date of this Quarterly Report on Form 10-Q, the Company is the process of further integrating the acquired Bats operations into the overall internal controls over financial reporting. The Merger resulted in changes in the operating results for the three and nine months ended September 30, 2017 compared to the three and nine months ended September 30, 2016. Revenue less cost of revenue increased to $269.7 million, an increase of 98.0% over the three months ended September 30, 2016. Total operating expenses increased 113.6% to $150.4 million. As a result, net income allocated to common stockholders increased 48.1% to $59.7 million. Revenue less cost of revenue increased to $730.0 million, an increase of 72.4% over the nine months ended September 30, 2016. Total operating expenses increased 133.3% to $466.8 million. As a result, net income allocated to common stockholders increased 1.5% to $142.1 million.
Except as described above, noNo changes occurred in the Company’s internal control over financial reporting during thirdthe first quarter 20172022 that have materially affected, or are reasonably likely to materially affect, the Company’s internal control over financial reporting.
PART II—OTHER INFORMATION
Item 1. Legal Proceedings.
Cboe Global Markets, Inc. incorporates herein by reference the discussion set forth in Note 19 (“Income Taxes”) and Note 21 (“Commitments, Contingencies, and Contingencies—Legal Proceedings”Guarantees”) of the condensed consolidated financial statements included herein.
Other than the legal proceedings below and incorporated by reference herein, there have been no material updates during the period covered by this Form 10-Q to the Legal Proceedings as set forth in Item 3. of our Annual Report on Form 10-K for the year ended December 31, 2021.
CT Plan Order (Continuation of Consolidated Data Plans Proceeding)
On May 6, 2020, the SEC issued an order (the “Consolidated Data Plan Order”) that directed the U.S. equities exchanges and FINRA to submit a new National Market System (“NMS”) Plan regarding Consolidated Equity Market Data. The contemplated new NMS Plan is referred to as the “CT Plan” and it will replace three Equity Data Plans that govern the dissemination of real-time, consolidated market data for NMS stocks. The Consolidated Data Plan Order set forth certain changes to be included in the proposed CT Plan, including governance structure changes related to voting rights and a deadline of August 11, 2020 by which the proposed CT Plan had to be filed.
On June 29, 2020, the Company filed a Petition for Review (“PFR”) with the Court of Appeals for the D.C. Circuit Court (“D.C. Circuit) challenging the Consolidated Data Plan Order. Briefing concluded on March 12, 2021 and oral argument was held on April 26, 2021. On June 15, 2021, the D.C. Circuit issued an order dismissing the PFR for lack of jurisdiction, holding that the Consolidated Data Plan Order was not a “final order” because the SEC had not determined whether the challenged features would make it into the new CT Plan.
On August 6, 2021, the SEC issued an order approving the CT Plan that was previously filed on August 11, 2020 (as mandated by the Consolidated Data Plan Order) and subject to public comment (“CT Plan Order”). On August 9, 2021, the Company filed another PFR with the D.C. Circuit challenging the CT Plan Order and the prior Consolidated Data Plan Order. On September 13, 2021, the Company filed a motion requesting that the D.C. Circuit stay the CT Plan Order pending resolution of the appeal and also requesting that the D.C. Circuit expedite the appeal. On October 13, 2021, the D.C. Circuit granted the motion to stay the CT Plan order and to expedite the appeal and established a briefing schedule. Briefing concluded in January 2022 and oral argument occurred on March 24, 2022. The Company is currently awaiting a decision by the D.C. Circuit.
The new CT Plan approved by the SEC may cause the Company’s equities exchanges, BZX, BYX, EDGX, and EDGA, to require additional resources to comply with or challenge such new consolidated data plan and it may have a material impact on our business, financial condition and operating results if, for example, there is a negative impact on the applicable market data fees that we receive that are generated from such new plan.
Market Data Infrastructure Final Rule
On December 9, 2020, the SEC issued a Market Data Infrastructure Final Rule (“Final Rule”), which makes significant additions to the content available on the Securities Information Processors (“SIPs”) and replaces the exclusive processors with a competing consolidator model. The Final Rule is limited to market data disseminated by the equities SIPs and does not apply to proprietary market data, or the dissemination of options market data through OPRA.
On February 5, 2021, the Company filed a Petition for Review (the “2/5 PFR”) with the Court of Appeals for the D.C. Circuit challenging the Final Order. Additionally, on February 5, 2021, the Company filed a motion for stay of the Final Rule with the SEC, which the SEC denied on March 24, 2021.
On March 24, 2021, the SEC filed a Motion to Dismiss (“MTD”) with the D.C. Circuit: (1) arguing that the PFR is not ripe because the Final Rule had not been published in the Federal Register (“FR”), (2) suggesting (if there is ambiguity) that the D.C. Circuit clarify whether publication in the FR opens the filing window, and (3) suggesting that the D.C. Circuit could hold the case in abeyance pending filing of a PFR after publication in the FR.
On April 9, 2021, the Final Rule was published in the FR. On April 13, 2021, the Company filed another PFR (the “4/13 PFR””) as a protective measure in the event the D.C. Circuit determined that the time to file a PFR does not commence until publication of the Final Rule in the FR.
On June 15, 2021, the D.C. Circuit entered an order granting the SEC’s MTD respecting the 2/5 PFR. This order does not affect the 4/13 PFR, which was filed after publication of the Final Rule in the FR on April 9, 2021. On July 9, 2021, the D.C. Circuit entered a briefing schedule, which concluded in January 2022. Oral argument occurred on March 18, 2022. The Company is currently awaiting a decision by the D.C. Circuit.
The implementation of the Final Rule could cause Cboe’s equities exchanges, BZX, BYX, EDGX, and EDGA, to require additional resources to comply with or to challenge the new rules and they may have a material impact on our business, financial condition and operating results if, for example, there are lower SIP plan revenues or we must reduce the fees we charge for market data. The Company intends to litigate the matter vigorously.
ThereFactorsOther than the risk factor listed below, there have been no material updates during the period covered by this Form 10-Q to the Risk Factors as set forth in Item 1A. of our Annual Report on Form 10-K for the year ended December 31, 2016.2021. These risks and uncertainties, however, are not the only risks and uncertainties that we face. Additional risks and uncertainties not currently known to us or that we currently deem to be immaterial may also significantly impact us. Any of these risks and uncertainties may materially and adversely affect our business, financial condition or results of operations, liquidity and cash flows.
Risks Relating to Our Business Following Consummation of Pending ErisX Acquisition
Digital asset custodial solutions and related technology, including ErisX’s systems and custodial arrangements, are subject to risks related to a loss of funds due to theft of digital assets, employee or vendor sabotage, security and cybersecurity risks, system failures and other operational issues which could cause damage to our and ErisX’s reputation and brand.
The secure storage and transmission of digital assets and data over networks is a critical element of ErisX’s operations. Threats to ErisX’s storage and transmission of digital assets and data may come from external factors such as governments, organized crime, hackers and other third parties such as outsourced or infrastructure-support providers and application developers, or may originate internally from an employee or service provider to whom ErisX has granted access to its systems.
Digital asset transactions may be irrevocable, and stolen or incorrectly transferred digital assets may be irretrievable. Once a transaction has been verified and recorded in a block that is added to the blockchain, an incorrect transfer of a digital asset generally will not be reversible, and ErisX may not be capable of seeking compensation for any such transfer or theft. It is possible that, through computer or human error, or through theft or criminal action, the digital asset could be
transferred in incorrect amounts or to unauthorized third parties, or to uncontrolled accounts. Such events could have a material adverse effect on the ability of ErisX to continue as a going concern, which may have an adverse effect on our business following the acquisition.
While we and ErisX maintain cybersecurity procedures and policies, those procedures and policies may not be adequate to avoid the potential losses caused by security breaches, and ErisX may lose digital assets without any recourse. Unlike bank accounts or accounts at some other financial institutions, in the event of loss or loss of utility value, there is no public insurer, such as the Securities Investor Protection Corporation or the FDIC, to offer recourse to us, ErisX, or to any investor and the misappropriated digital assets may not easily be traced to the bad actor.
Further, when cryptocurrency custodial solutions (whether involving ErisX systems or others) experience system failures or other operational issues, such events could result in a reduction in cryptocurrency prices or confidence and impact the success of ErisX and have a material adverse effect on the ability of ErisX to continue as a going concern, which may have an adverse effect on our business following the acquisition.
While we understand that ErisX has experienced in the past cybersecurity threats and events of varying degrees, we are not aware of any of these threats or events having a material impact on ErisX’s business, financial condition or operating results to date. However, we cannot assure you that we or ErisX will not experience future threats or events that may be material. If any such threats or events materialize, ErisX may be subject to contractual restrictions, liability and damages, loss of business, penalties, unfavorable publicity, and increased scrutiny by its regulators, which may materially impact its business, financial condition and operating results, and which may have an adverse effect on our business following the acquisition.
Item 2. Unregistered Sales of Equity Securities and Use of Proceeds.
In 2011, the boardBoard of directorsDirectors approved an initial authorization for the Company to repurchase shares of its outstanding common stock of $100 million and subsequently approved additional authorizations of $100 million in each of 2012, 2013, 2014, 2015, and February 2016 for a total authorization of $600 million.$1.6 billion. The program permits the Company to purchase shares through a variety of methods, including in the open market or through privately negotiated transactions, in accordance with applicable securities laws. It does not obligate the Company to make any repurchases at any specific time or situation.
As The Company repurchased 596,988 shares of September 30, 2017,its common stock under its share repurchase program during the Companyfirst quarter of 2022 at an average cost per share of $117.25, totaling $70.0 million and had $97.0$248.9 million of availability remaining under its existing share repurchase authorizations. We were not active in our share repurchase program during the third quarterauthorizations as of 2017.
March 31, 2022.Purchase of common stock from employees
The table below reflects the acquisition of common stock by the Company acquired 19,330 shares for a total cost of approximately $2.0 million duringin the three months ended September 30, 2017March 31, 2022 that were not part of the publicly announced share repurchase authorization. These shares consisted of shares retained to cover payroll withholding taxes in connection with the vesting of restricted stock unit awards and performance share awards, and shares used by employees to cover the price of certain stock options that were exercised.
awards. | | | | | |
Period | | Total Number of Shares Purchased | | Average Price Paid per Share |
January 1 to January 31, 2022 | | — | | $ | — |
February 1 to February 28, 2022 | | 323,377 | | | 118.87 |
March 1 to March 31, 2022 | | 273,611 | | | 115.32 |
Total | | 596,988 | | $ | 117.25 |
Use of Proceeds
Purchases of Equity Securities
None.
Item 3. Defaults upon Senior Securities.
Item 4. Mine Safety Disclosures.
Item 5. Other Information.
None.
None.
| | |
| | |
Exhibit No. |
| Description |
| | |
4.1 | | Third Amended and RestatedOfficers’ Certificate, dated as of Incorporation,March 16, 2022, establishing the 3.000% Senior Notes due 2032 of Cboe Global Markets, Inc., incorporated by reference to Exhibit 3.14.2 to the Company'sCompany’s Current Report on Form 8-K (File No. 001-34774) filed on October 17, 2017.March 16, 2022.
|
| | |
4.2 | | |
| | |
10.1 | | Amendment No. 19 to the Restated License Agreement, dated November 1, 1994, by and between Standard & Poor’s Financial Services LLC (as successor-in-interest to Standard & Poor’s, a division of McGraw-Hill, Inc.) and Cboe Exchange, Inc. (f/k/a Chicago Board Options Exchange, Incorporated), effective as of February 23, 2022 (Filed herewith). |
| | |
10.2 | | Second Amended and Restated Bylaws,Credit Agreement, dated as of February 25, 2022, by and among Cboe Global Markets, Inc., with Bank of America, N.A., as administrative agent and as swing line lender, certain lenders named therein, BofA Securities, Inc., as sole lead arranger and sole bookrunner and certain syndication agents named therein, incorporated by reference to Exhibit 3.210.1 to the Company'sCompany’s Current Report on Form 8-K (File No. 001-34774) filed on October 17, 2017.February 28, 2022. |
| | |
10.3 | | |
| | |
10.4 | | |
| | |
31.1 | | Certification of Chief Executive Officer pursuant to Rule 13a-14 (Filed herewith). |
| | |
| | |
| | |
| | |
| | |
| | |
| | |
101.INS | | XBRL Instance Document (Filed herewith). — The instance document does not appear in the Interactive Data File because its XBRL tags are embedded within the Inline XBRL document. |
| | |
101.SCH | | XBRL Taxonomy Extension Schema Document (Filed herewith). |
| | |
101.CAL | | XBRL Taxonomy Extension Calculation Linkbase Document (Filed herewith). |
| | |
101.DEF | | XBRL Taxonomy Extension Definition Linkbase (Filed herewith). |
| | |
101.LAB | | XBRL Taxonomy Extension Label Linkbase Document (Filed herewith). |
| | |
101.PRE | | XBRL Taxonomy Extension Presentation Linkbase Document (Filed herewith). |
| | |
104 | | Cover Page Interactive Data File (embedded as Inline XBRL document). |
* Indicates Management Compensatory Plan, Contract or Arrangement.
Pursuant to the requirements of the Securities Exchange Act of 1934, the registrant has duly caused this report to be signed on its behalf by the undersigned, thereunto duly authorized.
| | |
| | | |
| | CBOE GLOBAL MARKETS, INC. |
| | Registrant |
| | | |
| By: | By: | /s/ Edward T. Tilly |
| | | Edward T. Tilly |
| | | President and Chief Executive Officer (Principal |
| | (Principal Executive Officer) |
Date: April 29, 2022 | November 7, 2017 | | |
| | | |
| By: | By: | /s/ Alan J. DeanBrian N. Schell |
| | | Alan J. DeanBrian N. Schell |
| | | Executive Vice President and Chief Financial Officer (Principal |
| | (Principal Financial Officer) |
Date: April 29, 2022 | November 7, 2017 | | |