UNITED STATES
SECURITIES AND EXCHANGE COMMISSION
Washington, D.C. 20549
Form 10-Q
|
| | | | | | | |
| (Mark One) |
| ☑ | QUARTERLY REPORT PURSUANT TO SECTION 13 OR 15(d) OF THE SECURITIES EXCHANGE ACT OF 1934 |
| | |
| For the quarterly period ended | September 30, 20192020 |
| | |
| OR |
| |
| ☐ | TRANSITION REPORT PURSUANT TO SECTION 13 OR 15(d) OF THE SECURITIES EXCHANGE ACT OF 1934 |
| | |
For the transition period from to |
Commission file number: 001-33492
CVR ENERGY, INC.INC.
(Exact name of registrant as specified in its charter)
|
| | | | | | | | | | | | | |
| Delaware | | | | 61-1512186 |
(State or other jurisdiction of incorporation or organization) | | | (I.R.S. Employer
Identification No.) |
2277 Plaza Drive, Suite 500,, Sugar Land,, Texas77479
(Address of principal executive offices) (Zip Code)
(281) (281) 207-3200
(Registrant’s telephone number, including area code)
Securities registered pursuant to Section 12(b) of the Act:
|
| | | | | | | |
| Title of each class | Trading Symbol(s) | Name of each exchange on which registered |
| Common Stock, $0.01 par value per share | CVI | The New York Stock Exchange |
Indicate by check mark whether the registrant (1) has filed all reports required to be filed by Section 13 or 15(d) of the Securities Exchange Act of 1934 during the preceding 12 months (or for such shorter period that the registrant was required to file such reports), and (2) has been subject to such filing requirements for the past 90 days. Yes ☑ No ☐
Indicate by check mark whether the registrant has submitted electronically every Interactive Data File required to be submitted pursuant to Rule 405 of Regulation S-T (§232.405 of this chapter) during the preceding 12 months (or for such shorter period that the registrant was required to submit such files). Yes ☑ No ☐
Indicate by check mark whether the registrant is a large accelerated filer, an accelerated filer, a non-accelerated filer, a smaller reporting company, or an emerging growth company. See the definitions of “large accelerated filer,” “accelerated filer,” “smaller reporting company” and “emerging growth company” in Rule 12b-2 of the Exchange Act.
|
| | | | | | | | | | | | | | | | |
| Large accelerated filer | ☐☑ | Accelerated filer | ☑☐ | Non-accelerated filer | ☐ |
| Smaller reporting company | ☐ | Emerging growth company | ☐ | | |
If an emerging growth company, indicate by check mark if the registrant has elected not to use the extended transition period for complying with any new or revised financial accounting standards provided pursuant to Section 13(a) of the Exchange Act. ☐
Indicate by check mark whether the registrant is a shell company (as defined by Rule 12b-2 of the Exchange Act). Yes ☐ No ☑
There were 100,530,599 shares of the registrant’s common stock outstanding at October 22, 2019.
TABLE OF CONTENTS
CVR Energy, Inc. - Quarterly Report on Form 10-Q
September 30, 20192020
|
| | | | | | |
| PART I. Financial Information | | | PART II. Other Information | |
| | | | | | | |
| | | | | | |
| | | | | | | |
| | | | | | | |
| | | | | | | |
| | | | | | |
| | | | | |
| | | |
| | | |
| | | |
| | | | | | | | | | | | | | | | | | | | |
| PART I. Financial Information | | | PART II. Other Information | |
| | | | | | |
| | | | | | |
| | | | | | |
| | | | | | |
| | | | | | |
| | | | | |
| | | | |
| | | |
| | | |
| | | |
This Quarterly Report on Form 10-Q (including documents incorporated by reference herein) contains statements with respect to our expectations or beliefs as to future events. These types of statements are “forward-looking” and subject to uncertainties. See “Important Information Regarding Forward-Looking Statements” section of this filing.
September 30, 20192020 | 2
Important Information Regarding Forward-Looking Statements
This Quarterly Report on Form 10-Q (this “Report”) contains forward-looking statements within the meaning of Section 27A of the Securities Act of 1933, as amended (the “Securities Act”), and Section 21E of the Securities Exchange Act of 1934, as amended (the “Exchange Act”), including, but not limited to, those under Item 2. Management’s Discussion and Analysis of Financial Condition and Results of Operations. These forward-looking statements are subject to a number of risks and uncertainties, many of which are beyond our control. All statements other than statements of historical fact, including without limitation, statements regarding future operations, financial position, estimated revenues and losses, growth, capital projects, stock or unit repurchases, impacts of legal proceedings, projected costs, prospects, plans and objectives are forward-looking statements. The words “could,” “believe,” “anticipate,” “intend,” “estimate,” “expect,” “may,” “continue,” “predict,” “potential,” “project,” and similar terms and phrases are intended to identify forward-looking statements.
Although we believe our assumptions concerning future events are reasonable, a number of risks, uncertainties, and other factors could cause actual results and trends to differ materially from those projected or forward-looking, includingforward looking. Forward looking statements, as well as certain risks, contingencies or uncertainties that may impact our forward looking statements, include but are not limited to:to the following:
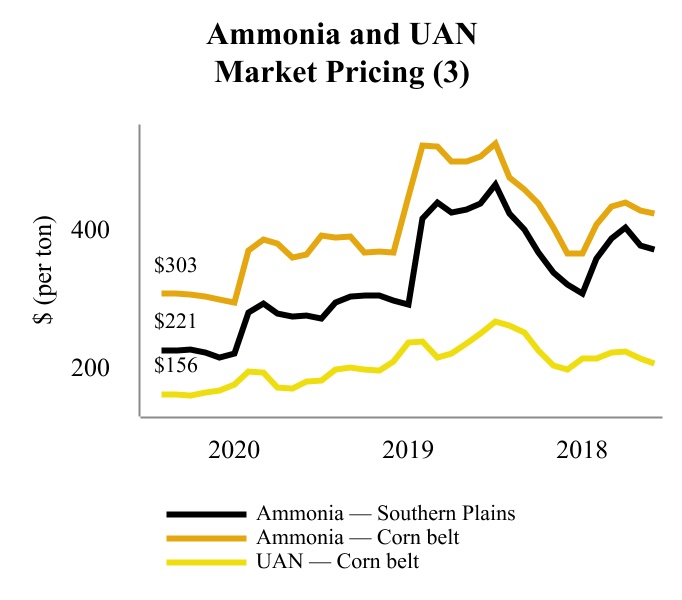
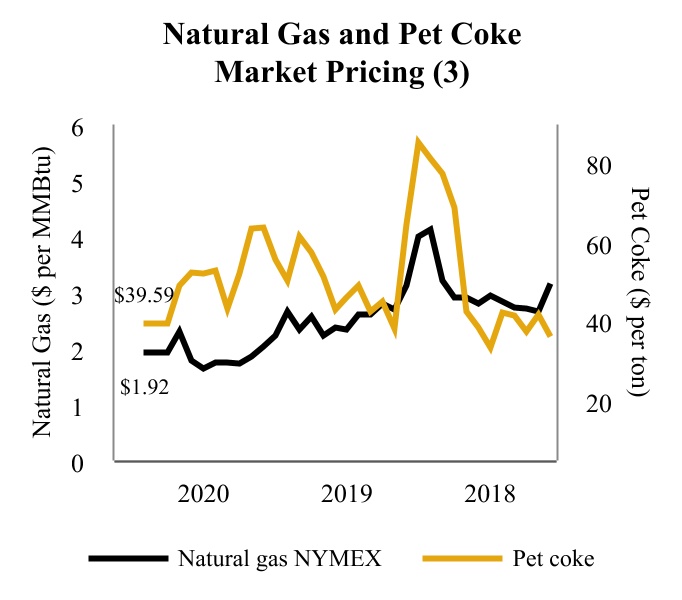
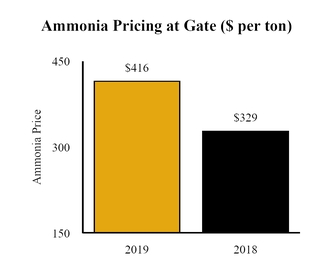
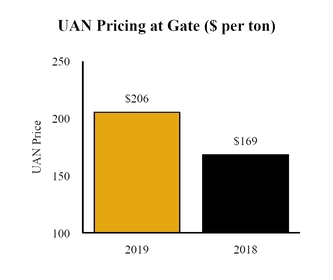
•volatile margins in the refining and nitrogen fertilizer industriesindustry and exposure to the risks associated with the pricing and availability ofvolatile crude oil, other feedstocks, pet coke, utilities, refined products, urea ammonium nitrate (“UAN”), ammonia, natural gas, Renewable Identification Numbers (“RIN”)product and environmental credits;feedstock prices;
•the availability of adequate cash credit and other sources of liquidity including volatility infor the capital needs of our businesses;
•the severity, magnitude, duration, and credit marketsimpact of the novel coronavirus 2019 (“COVID-19”) pandemic and changesof businesses’ and governments’ responses to such pandemic on our capital requirements;operations, personnel, commercial activity, and supply and demand across our and our customers’ and suppliers’ business;
•changes in market conditions and market volatility arising from the expected valueCOVID-19 pandemic, including crude oil and other commodity prices, demand for those commodities, storage and transportation capacities, and the impact of benefits derived from,such changes on our operating results and ourfinancial position;
•the ability to successfully implement, business strategies, transactions, turnarounds, maintenance,forecast our future financial condition, results of operations, revenues and capital projects;expenses;
•the effects of transactions involving forward and derivative instruments;
•changes in (and in the application of) local, state and federal laws, rules, regulations and policies including with respect to environmental matters (including climate change), health and safety, exports, transportation (including pipeline and trucking transportationthe export of crude oil, and other products), alternative energy or fuel sources, the end-use and application of fertilizers and taxes (including the tax status of CVR Partners);
changes in economic conditions impacting our business and the business of our suppliers, customers, counterparties and lenders;
interruption of or changes in the cost, availability or regulation of pipelines, vessels, trucks and other means of transporting crude oil, feedstocks, refined products pet coke, UAN, ammonia andor other products relating to our businesses;hydrocarbons;
changes•interruption in pipelines supplying feedstocks or distributing the petroleum business’ products;
•competition in the petroleum and nitrogen fertilizer businesses including topotential impacts of domestic and global supply and demand and/or domestic or international duties, tariffs, or similar costs;
•capital expenditures;
•changes in our competitive advantages;or our segments’ credit profiles;
•the cyclical and/orand seasonal nature of the petroleum and nitrogen fertilizer businesses;
•the supply, availability, and price levels of essential raw materials and feedstocks;
•our production levels, including the risk of a material decline in those levels;
•accidents or other unscheduled shutdowns or interruptions affecting our facilities, machinery, or equipment, or those of our suppliers or customers;
•existing and future laws, rulings, and regulations, including but not limited to those relating to the environment, climate change and/or the transportation of production of hazardous chemicals like ammonia, including potential liabilities or capital requirements arising from such laws, rulings or regulations;
•potential operating hazards from accidents, fire, severe weather, tornadoes, floods, or other natural disasters;
•the impact of weather on the nitrogen fertilizer business including our ability to produce, market or sell fertilizer products profitability or at all;
•rulings, judgements or settlements in litigation, tax or other legal or regulatory matters;
•the dependence of the nitrogen fertilizer business on customers and distributors including to transport goods and equipment;
•the reliance on, or the ability to procure economically or at all, pet coke our nitrogen fertilizer business purchases from CVR Refining, LP and third-party suppliers or the natural gas, electricity, oxygen, nitrogen, sulfur processing and compressed dry air and other products purchased from third parties by the nitrogen fertilizer and petroleum businesses;
weather conditions, fires, tornadoes, floods or other natural disasters affecting our operations or the areas in which our feedstocks or refined products and fertilizers are marketed or sold;
•risks associated with governmental policies affectingthird party operation of or control over important facilities necessary for operation of our refineries and nitrogen fertilizer facilities;
•risks of terrorism, cybersecurity attacks, and the agriculturalsecurity of chemical manufacturing facilities and other matters beyond our control;
•our lack of diversification of assets or operating and supply areas;
•the petroleum refining industries;
direct or indirect effects from actual or threatened terrorist incidents, security or cyber-security breaches or acts of war;
business’ and the nitrogen fertilizer business’ dependence on significant customers and suppliers and the creditworthiness and performance by counterparties;
•the potential loss of the nitrogen fertilizer business’ transportation cost advantage over its competitors;
•the potential inability to successfully implement our business strategies, including the completion of significant capital programs or projects;
•our ability to continue to license the technology used infor our operations;
•our petroleum business’ ability to purchase renewable identification numbers (“RINs”) on a timely and cost effective basis;
•our businesses’ ability to obtain, retain or securerenew environmental and other governmental permits, requiredlicenses or authorizations necessary for the petroleum businessoperation of its business;
•existing and nitrogen fertilizer business operations;proposed laws, rulings, and regulations, including but not limited to those relating to climate change, alternative energy or fuel sources, and existing and future regulations related to the end-use of our products or the application of fertilizers;
adverse rulings, judgments or settlements in litigation or other legal or tax matters, including unexpected environmental remediation costs in excess of any reserves;
•refinery and nitrogen fertilizer facilities’ operating hazards and interruptions, or production declines, including unscheduled maintenance or downtime and the availability and recoverability of adequate insurance coverage;
•risks related to services provided by or competition among our subsidiaries, including conflicts of interests and control of CVR Partners’ general partner;
•instability and volatility in the capital and credit markets;
•restrictions in our debt agreements;
•asset impairments and impacts thereof;
•the variable nature of CVR Partners’ distributions, including the ability of its general partner to modify or revoke its distribution policy, or to cease making cash distributions on its common units;
•risks associated with noncompliance by CVR Partners with continued listing standards of the New York Stock Exchange (the “NYSE”) or the effectiveness of the announced reverse unit split for regaining and maintaining compliance, including potential suspension or delisting and the impacts thereof on CVR Partners’ common unit price, valuation, access to capital, liquidity, the number of investors willing to hold or acquire CVR Partners’ common units, its ability to issue securities or obtain financing and the impact, cost, and timing of any reverse split;
•changes in CVR Partners’ treatment as a partnership for U.S. federal income or state tax purposes;
•our ability to recover under our insurance policies for damages or losses in full or at all; and
•the factors described in greater detail under “Risk Factors” in Item 1A of our Annual Report on Form 10-K for the year ended December 31, 20182019 and this Report and our other filings with the Securities and Exchange Commission.Commission (the “SEC”).
All forward-lookingforward looking statements contained in this Report only speak as of the date of this Report. Except as required by law, weWe undertake no obligation to publicly update or revise any forward-looking statements to reflect events or circumstances that occur after the date of this Report, or to reflect the occurrence of unanticipated events, except to the extent required by law.
September 30, 20192020 | 34
PART I. FINANCIAL INFORMATION
Item 1. Financial Statements
CVR ENERGY, INC. AND SUBSIDIARIES
CONDENSED CONSOLIDATED BALANCE SHEETS
(unaudited)
| | | | | | | | | | | |
| (in millions) | September 30, 2020 | | December 31, 2019 |
| ASSETS |
| Current assets: | | | |
| Cash and cash equivalents (including $48 and $37, respectively, of consolidated variable interest entities (“VIEs”)) | $ | 672 | | | $ | 652 | |
| Accounts receivable (including $19 and $34, respectively, of VIEs) | 133 | | | 182 | |
| | | |
| Inventories (including $46 and $48, respectively, of VIEs) | 266 | | | 373 | |
| Prepaid expenses and other current assets (including $3 and $5, respectively, of VIEs) | 183 | | | 67 | |
| | | |
| | | |
| Total current assets | 1,254 | | | 1,274 | |
| Property, plant and equipment, net (including $913 and $952, respectively, of VIEs) | 2,267 | | | 2,336 | |
| | | |
| | | |
| | | |
| Other long-term assets (including $18 and $61, respectively, of VIEs) | 355 | | | 295 | |
| Total assets | $ | 3,876 | | | $ | 3,905 | |
| | | |
| LIABILITIES AND EQUITY |
| Current liabilities: | | | |
| | | |
| | | |
| Accounts payable (including $25 and $24, respectively, of VIEs) | $ | 242 | | | $ | 412 | |
| | | |
| | | |
| | | |
| | | |
| Other current liabilities (including $44 and $52, respectively, of VIEs) | 215 | | | 184 | |
| Total current liabilities | 457 | | | 596 | |
| | | |
| Long-term debt and finance lease obligations (including $633 and $632, respectively, of VIEs) | 1,683 | | | 1,190 | |
| | | |
| Deferred income taxes | 379 | | | 396 | |
| Other long-term liabilities (including $10 and $10, respectively, of VIEs) | 55 | | | 55 | |
| Total long-term liabilities | 2,117 | | | 1,641 | |
| | | |
| Equity: | | | |
| CVR stockholders’ equity: | | | |
| Common stock $0.01 par value per share, 350,000,000 shares authorized, 100,629,209 and 100,629,209 shares issued as of September 30, 2020 and December 31, 2019, respectively. | 1 | | | 1 | |
| Additional paid-in-capital | 1,508 | | | 1,507 | |
| Accumulated deficit | (423) | | | (113) | |
| Treasury stock, 98,610 shares at cost | (2) | | | (2) | |
| | | |
| Total CVR stockholders’ equity | 1,084 | | | 1,393 | |
| Noncontrolling interest | 218 | | | 275 | |
| Total equity | 1,302 | | | 1,668 | |
| Total liabilities and equity | $ | 3,876 | | | $ | 3,905 | |
|
| | | | | | | |
| (in millions) | September 30, 2019 | | December 31, 2018 |
| ASSETS |
| Current assets: | | | |
| Cash and cash equivalents (including $84 and $415, respectively, of consolidated variable interest entities (VIEs)) | $ | 692 |
| | $ | 668 |
|
| Accounts receivable (including $15 and $169, respectively, of VIEs) | 181 |
| | 169 |
|
| Inventories (including $57 and $380, respectively, of VIEs) | 388 |
| | 380 |
|
| Prepaid expenses and other current assets (including $5 and $56, respectively, of VIEs) | 66 |
| | 76 |
|
| Total current assets | 1,327 |
| | 1,293 |
|
| Property, plant and equipment, net (including $965 and $2,414, respectively, of VIEs) | 2,356 |
| | 2,430 |
|
| Other long-term assets (including $56 and $270, respectively, of VIEs) | 279 |
| | 277 |
|
| Total assets | $ | 3,962 |
| | $ | 4,000 |
|
| LIABILITIES AND EQUITY |
| Current liabilities: | | | |
| Accounts payable (including $32 and $317, respectively, of VIEs) | $ | 390 |
| | $ | 320 |
|
| Other current liabilities (including $53 and $154, respectively, of VIEs) | 200 |
| | 176 |
|
| Total current liabilities | 590 |
| | 496 |
|
| Long-term debt and finance lease obligations (including $632 and $1,167, respectively, of VIEs) | 1,190 |
| | 1,167 |
|
| Deferred income taxes | 405 |
| | 380 |
|
| Other long-term liabilities (including $12 and $7, respectively, of VIEs) | 52 |
| | 14 |
|
| Total long-term liabilities | 1,647 |
| | 1,561 |
|
|
| |
|
| Equity: | | | |
| CVR stockholders’ equity: | | | |
| Common stock $0.01 par value per share, 350,000,000 shares authorized, 100,629,209 shares issued | 1 |
| | 1 |
|
| Additional paid-in-capital | 1,507 |
| | 1,474 |
|
| Accumulated deficit | (77 | ) | | (187 | ) |
| Treasury stock, 98,610 shares at cost | (2 | ) | | (2 | ) |
| Total CVR stockholders’ equity | 1,429 |
| | 1,286 |
|
| Noncontrolling interest | 296 |
| | 657 |
|
| Total equity | 1,725 |
| | 1,943 |
|
| Total liabilities and equity | $ | 3,962 |
| | $ | 4,000 |
|
The accompanying notes are an integral part of these condensed consolidated financial statements.
September 30, 20192020 | 45
CVR ENERGY, INC. AND SUBSIDIARIES
CONDENSED CONSOLIDATED STATEMENTS OF OPERATIONS
(unaudited)
| | | | | | | | | | | | | | | | | | | | | | | |
| Three Months Ended
September 30, | | Nine Months Ended
September 30, |
| (in millions, except share data) | 2020 | | 2019 | | 2020 | | 2019 |
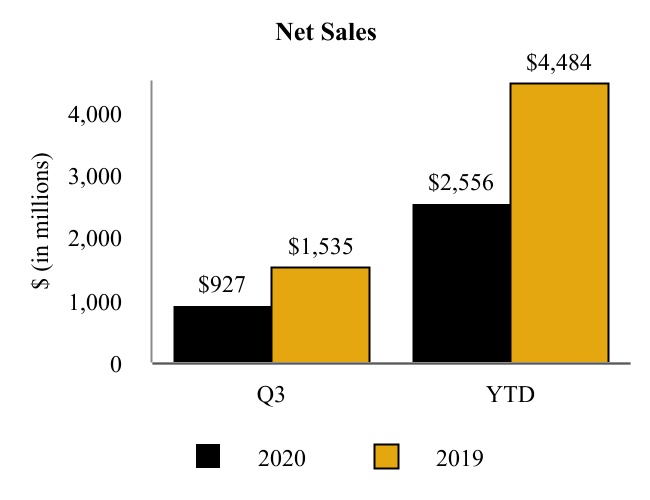
| Net sales | $ | 1,005 | | | $ | 1,622 | | | $ | 2,811 | | | $ | 4,794 | |
| Operating costs and expenses: | | | | | | | |
| Cost of materials and other | 846 | | | 1,221 | | | 2,348 | | | 3,589 | |
| Direct operating expenses (exclusive of depreciation and amortization) | 116 | | | 139 | | | 353 | | | 397 | |
| Depreciation and amortization | 67 | | | 69 | | | 200 | | | 210 | |
| Cost of sales | 1,029 | | | 1,429 | | | 2,901 | | | 4,196 | |
| | | | | | | |
| Selling, general and administrative expenses (exclusive of depreciation and amortization) | 20 | | | 29 | | | 65 | | | 85 | |
| Depreciation and amortization | 2 | | | 2 | | | 8 | | | 7 | |
| Loss (gain) on asset disposals | 0 | | | 3 | | | 2 | | | (5) | |
| Goodwill impairment | 0 | | | 0 | | | 41 | | | 0 | |
| | | | | | | |
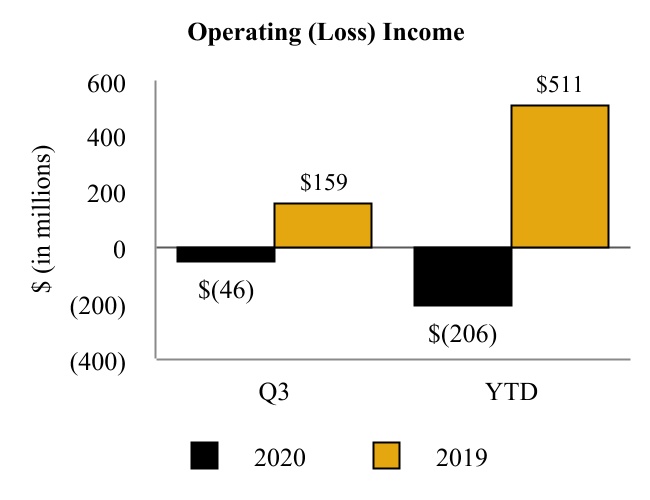
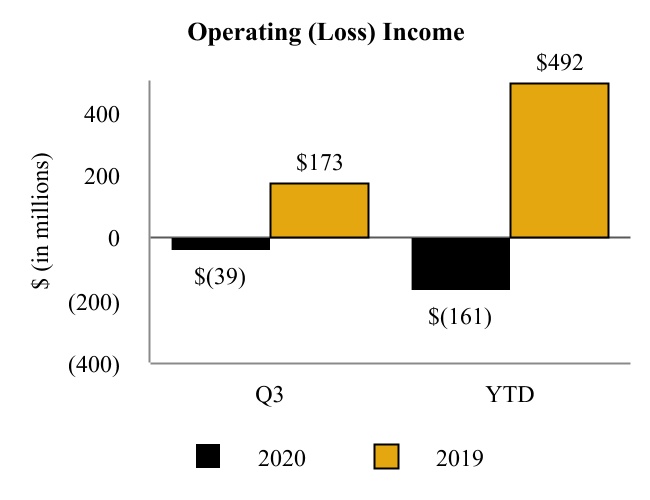
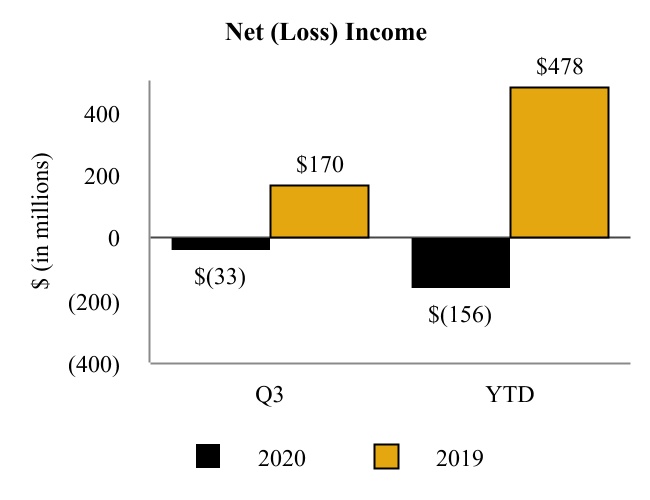
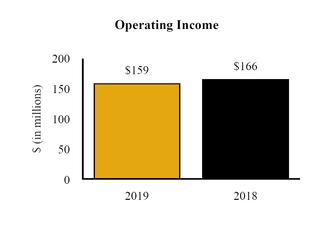
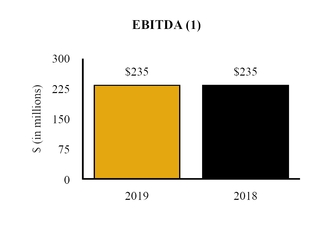
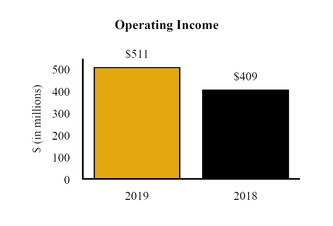
| Operating (loss) income | (46) | | | 159 | | | (206) | | | 511 | |
| Other (expense) income: | | | | | | | |
| Interest expense, net | (31) | | | (26) | | | (98) | | | (77) | |
| | | | | | | |
| | | | | | | |
| Investment loss from marketable securities | (65) | | | 0 | | | (13) | | | 0 | |
| Other income, net | 3 | | | 5 | | | 3 | | | 10 | |
| | | | | | | |
| (Loss) income before income tax expense | (139) | | | 138 | | | (314) | | | 444 | |
| Income tax (benefit) expense | (31) | | | 34 | | | (73) | | | 110 | |
| Net (loss) income | (108) | | | 104 | | | (241) | | | 334 | |
| Less: Net loss attributable to noncontrolling interest | (12) | | | (15) | | | (53) | | | (2) | |
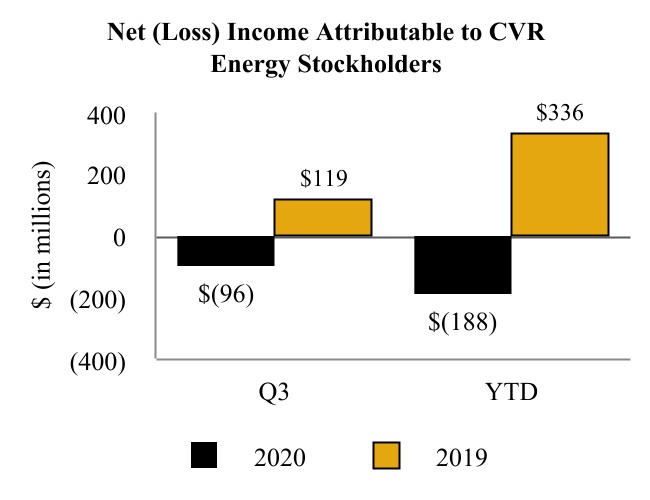
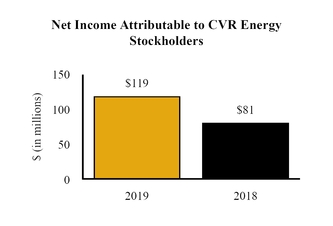
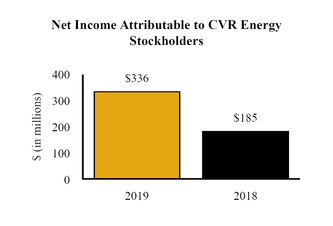
| Net (loss) income attributable to CVR Energy stockholders | $ | (96) | | | $ | 119 | | | $ | (188) | | | $ | 336 | |
| | | | | | | |
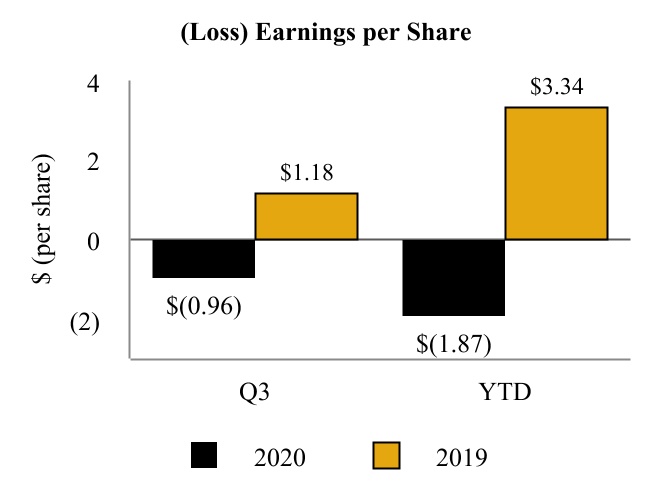
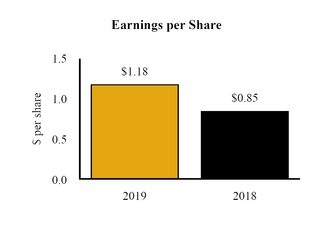
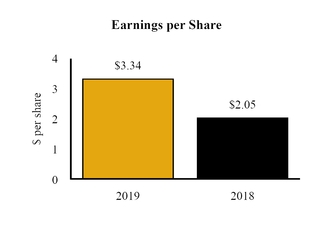
| Basic and diluted (loss) earnings per share | $ | (0.96) | | | $ | 1.18 | | | $ | (1.87) | | | $ | 3.34 | |
| | | | | | | |
| Dividends declared per share | $ | 0 | | | $ | 0.75 | | | $ | 1.20 | | | $ | 2.25 | |
| | | | | | | |
| Weighted-average common shares outstanding: | | | | | | | |
| Basic and diluted | 100.5 | | | 100.5 | | | 100.5 | | | 100.5 | |
| | | | | | | |
|
| | | | | | | | | | | | | | | |
| | Three Months Ended
September 30, | | Nine Months Ended
September 30, |
| (in millions, except share data) | 2019 | | 2018 | | 2019 | | 2018 |
| Net sales | $ | 1,622 |
| | $ | 1,935 |
| | $ | 4,794 |
| | $ | 5,386 |
|
| Operating costs and expenses: | | | | | | | |
| Cost of materials and other | 1,221 |
| | 1,556 |
| | 3,589 |
| | 4,295 |
|
| Direct operating expenses (exclusive of depreciation and amortization as reflected below) | 139 |
| | 119 |
| | 397 |
| | 390 |
|
| Depreciation and amortization | 69 |
| | 63 |
| | 210 |
| | 196 |
|
| Cost of sales | 1,429 |
| | 1,738 |
| | 4,196 |
| | 4,881 |
|
| Selling, general and administrative expenses (exclusive of depreciation and amortization as reflected below) | 29 |
| | 27 |
| | 85 |
| | 83 |
|
| Depreciation and amortization | 2 |
| | 3 |
| | 7 |
| | 8 |
|
| Loss (gain) on asset disposals | 3 |
| | 1 |
| | (5 | ) | | 5 |
|
| Operating income | 159 |
| | 166 |
| | 511 |
| | 409 |
|
| Other (expense) income: | | | | | | | |
| Interest expense, net | (26 | ) | | (26 | ) | | (77 | ) | | (79 | ) |
| Other income, net | 5 |
| | 3 |
| | 10 |
| | 6 |
|
| Income before income tax expense | 138 |
| | 143 |
| | 444 |
| | 336 |
|
| Income tax expense | 34 |
| | 33 |
| | 110 |
| | 65 |
|
| Net income | 104 |
| | 110 |
| | 334 |
| | 271 |
|
| Less: Net (loss) income attributable to noncontrolling interest | (15 | ) | | 29 |
| | (2 | ) | | 86 |
|
| Net income attributable to CVR Energy stockholders | $ | 119 |
| | $ | 81 |
| | $ | 336 |
| | $ | 185 |
|
| | | | | | | | |
| Basic and diluted earnings per share | $ | 1.18 |
| | $ | 0.85 |
| | $ | 3.34 |
| | $ | 2.05 |
|
| Dividends declared per share | $ | 0.75 |
| | $ | 0.75 |
| | $ | 2.25 |
| | $ | 2.00 |
|
| | | | | | | | |
| Weighted-average common shares outstanding: | | | | | | | |
| Basic and diluted | 100.5 |
| | 95.8 |
| | 100.5 |
| | 89.8 |
|
The accompanying notes are an integral part of these condensed consolidated financial statements.
September 30, 20192020 | 56
CVR ENERGY, INCINC. AND SUBSIDIARIES
CONDENSED CONSOLIDATED STATEMENTS OF CHANGES IN EQUITY
(unaudited)
| | | | | | | | | | | | | | | | | | | | | | | | | | | | | | | | | | | | | | | | | | | | | | | | | |
| Common Stockholders | | | | |
| (in millions, except share data) | Shares
Issued | | $0.01 Par Value Common Stock | | Additional
Paid-In
Capital | | Accumulated Deficit | | Treasury
Stock | | | | Total CVR
Stockholders’
Equity | | Noncontrolling
Interest | | Total
Equity |
| Balance at December 31, 2019 | 100,629,209 | | | $ | 1 | | | $ | 1,507 | | | $ | (113) | | | $ | (2) | | | | | $ | 1,393 | | | $ | 275 | | | $ | 1,668 | |
| Dividends paid to CVR Energy stockholders | — | | | — | | | — | | | (80) | | | — | | | | | (80) | | | — | | | (80) | |
| | | | | | | | | | | | | | | | | |
| | | | | | | | | | | | | | | | | |
| | | | | | | | | | | | | | | | | |
| | | | | | | | | | | | | | | | | |
| | | | | | | | | | | | | | | | | |
| Other | — | | | — | | | — | | | (1) | | | — | | | | | (1) | | | — | | | (1) | |
| Net loss | — | | | — | | | — | | | (87) | | | — | | | | | (87) | | | (14) | | | (101) | |
| Balance at March 31, 2020 | 100,629,209 | | | $ | 1 | | | $ | 1,507 | | | $ | (281) | | | $ | (2) | | | | | $ | 1,225 | | | $ | 261 | | | $ | 1,486 | |
| Dividends paid to CVR Energy stockholders | — | | | — | | | — | | | (41) | | | — | | | | | (41) | | | — | | | (41) | |
| Changes in equity due to CVR Partners’ common unit repurchases | — | | | — | | | 1 | | | — | | | — | | | | | 1 | | | (1) | | | 0 | |
| | | | | | | | | | | | | | | | | |
| | | | | | | | | | | | | | | | | |
| | | | | | | | | | | | | | | | | |
| Net loss | — | | | — | | | — | | | (5) | | | — | | | | | (5) | | | (27) | | | (32) | |
| Balance at June 30, 2020 | 100,629,209 | | | 1 | | | $ | 1,508 | | | $ | (327) | | | $ | (2) | | | | | $ | 1,180 | | | $ | 233 | | | $ | 1,413 | |
| | | | | | | | | | | | | | | | | |
| | | | | | | | | | | | | | | | | |
| Changes in equity due to CVR Partners’ common unit repurchases | — | | | — | | | 0 | | | — | | | — | | | | | 0 | | | (3) | | | (3) | |
| | | | | | | | | | | | | | | | | |
| Net loss | — | | | — | | | — | | | (96) | | | — | | | | | (96) | | | (12) | | | (108) | |
| Balance at September 30, 2020 | 100,629,209 | | | $ | 1 | | | $ | 1,508 | | | $ | (423) | | | $ | (2) | | | | | $ | 1,084 | | | $ | 218 | | | $ | 1,302 | |
|
| | | | | | | | | | | | | | | | | | | | | | | | | | | | | | |
| | Common Stockholders | | | | |
| (in millions, except share data) | Shares Issued | | $0.01 Par
Value
Common
Stock | | Additional Paid-In Capital | | Accumulated Deficit | | Treasury Stock | | Total CVR Stockholders’ Equity | | Noncontrolling Interest | | Total Equity |
| Balance at December 31, 2018 | 100,629,209 |
| | $ | 1 |
| | $ | 1,474 |
| | $ | (187 | ) | | $ | (2 | ) | | $ | 1,286 |
| | $ | 657 |
| | $ | 1,943 |
|
| Dividends paid to CVR Energy stockholders | — |
| | — |
| | — |
| | (75 | ) | | — |
| | (75 | ) | | — |
| | (75 | ) |
| Distributions from CVR Partners to its public unitholders | — |
| | — |
| | — |
| | — |
| | — |
| | — |
| | (9 | ) | | (9 | ) |
| Acquisition of CVR Refining noncontrolling interest | — |
| | | | (1 | ) | | — |
| | — |
| | (1 | ) | | (334 | ) | | (335 | ) |
| Effect of turnaround accounting change | — |
| | — |
| | 35 |
| | — |
| | — |
| | 35 |
| | — |
| | 35 |
|
| Other | — |
| | — |
| | (1 | ) | | (1 | ) | | — |
| | (2 | ) | | — |
| | (2 | ) |
| Net income | — |
| | — |
| | — |
| | 101 |
| | — |
| | 101 |
| | 1 |
| | 102 |
|
| Balance at March 31, 2019 | 100,629,209 |
| | $ | 1 |
| | $ | 1,507 |
| | $ | (162 | ) | | $ | (2 | ) | | $ | 1,344 |
| | $ | 315 |
| | $ | 1,659 |
|
| Dividends paid to CVR Energy stockholders | — |
| | — |
| | — |
| | (75 | ) | | — |
| | (75 | ) | | — |
| | (75 | ) |
| Distributions from CVR Partners to its public unitholders | — |
| | — |
| | — |
| | — |
| | — |
| | — |
| | (5 | ) | | (5 | ) |
| Net income | — |
| | — |
| | — |
| | 116 |
| | — |
| | 116 |
| | 12 |
| | 128 |
|
| Balance at June 30, 2019 | 100,629,209 |
| | 1 |
| | $ | 1,507 |
| | $ | (121 | ) | | $ | (2 | ) | | $ | 1,385 |
| | $ | 322 |
| | $ | 1,707 |
|
| Dividends paid to CVR Energy stockholders | — |
| | — |
| | — |
| | (75 | ) | | — |
| | (75 | ) | | — |
| | (75 | ) |
| Distributions from CVR Partners to its public unitholders | — |
| | — |
| | — |
| | — |
| | — |
| | — |
| | (11 | ) | | (11 | ) |
| Net income (loss) | — |
| | — |
| | — |
| | 119 |
| | — |
| | 119 |
| | (15 | ) | | 104 |
|
| Balance at September 30, 2019 | 100,629,209 |
| | $ | 1 |
| | $ | 1,507 |
| | $ | (77 | ) | | $ | (2 | ) | | $ | 1,429 |
| | $ | 296 |
| | $ | 1,725 |
|
| | | | | | | | | | | | | | | | | | | | | | | | | | | | | | | | | | | | | | | | | | | | | | | | | |
| Common Stockholders | | | | |
| (in millions, except share data) | Shares
Issued | | $0.01 Par Value Common Stock | | Additional
Paid-In
Capital | | Accumulated Deficit | | Treasury
Stock | | | | Total CVR
Stockholders’
Equity | | Noncontrolling
Interest | | Total
Equity |
| Balance at December 31, 2018 | 100,629,209 | | | $ | 1 | | | $ | 1,474 | | | $ | (187) | | | $ | (2) | | | | | $ | 1,286 | | | $ | 657 | | | $ | 1,943 | |
| Dividends paid to CVR Energy stockholders | — | | | — | | | — | | | (75) | | | — | | | | | (75) | | | — | | | (75) | |
| Distributions from CVR Partners to its public unitholders | — | | | — | | | — | | | — | | | — | | | | | — | | | (9) | | | (9) | |
| Acquisition of CVR Refining noncontrolling interest | — | | | — | | | (1) | | | — | | | — | | | | | (1) | | | (334) | | | (335) | |
| Effect of turnaround accounting change | — | | | — | | | 34 | | | — | | | — | | | | | 34 | | | — | | | 34 | |
| Other | — | | | — | | | (1) | | | (1) | | | — | | | | | (2) | | | — | | | (2) | |
| Net income | — | | | — | | | — | | | 101 | | | — | | | | | 101 | | | 1 | | | 102 | |
| Balance at March 31, 2019 | 100,629,209 | | | $ | 1 | | | $ | 1,506 | | | $ | (162) | | | $ | (2) | | | | | $ | 1,343 | | | $ | 315 | | | $ | 1,658 | |
| Dividends paid to CVR Energy stockholders | — | | | — | | | — | | | (75) | | | — | | | | | (75) | | | — | | | (75) | |
| Distributions from CVR Partners to its public unitholders | — | | | — | | | — | | | — | | | — | | | | | — | | | (5) | | | (5) | |
| | | | | | | | | | | | | | | | | |
| | | | | | | | | | | | | | | | | |
| | | | | | | | | | | | | | | | | |
| Net income | — | | | — | | | — | | | 116 | | | — | | | | | 116 | | | 12 | | | 128 | |
| Balance at June 30, 2019 | 100,629,209 | | | $ | 1 | | | $ | 1,506 | | | $ | (121) | | | $ | (2) | | | | | $ | 1,384 | | | $ | 322 | | | $ | 1,706 | |
| Dividends paid to CVR Energy stockholders | — | | | — | | | — | | | (75) | | | — | | | | | (75) | | | — | | | (75) | |
| Distributions from CVR Partners to its public unitholders | — | | | — | | | — | | | — | | | — | | | | | — | | | (11) | | | (11) | |
| | | | | | | | | | | | | | | | | |
| | | | | | | | | | | | | | | | | |
| | | | | | | | | | | | | | | | | |
| Net income (loss) | — | | | — | | | — | | | 119 | | | — | | | | | 119 | | | (15) | | | 104 | |
| Balance at September 30, 2019 | 100,629,209 | | | $ | 1 | | | $ | 1,506 | | | $ | (77) | | | $ | (2) | | | | | $ | 1,428 | | | $ | 296 | | | $ | 1,724 | |
|
| | | | | | | | | | | | | | | | | | | | | | | | | | | | | | |
| | Common Stockholders | | | | |
| (in millions, except share data) | Shares Issued | | $0.01 Par Value Common Stock | | Additional Paid-In Capital | | Accumulated Deficit | | Treasury Stock | | Total CVR Stockholders’ Equity | | Noncontrolling Interest | | Total Equity |
| Balance at December 31, 2017 | 86,929,660 |
| | $ | 1 |
| | $ | 1,197 |
| | $ | (208 | ) | | $ | (2 | ) | | $ | 988 |
| | $ | 835 |
| | $ | 1,823 |
|
| Dividends paid to CVR Energy stockholders | — |
| | — |
| | — |
| | (43 | ) | | — |
| | (43 | ) | | — |
| | (43 | ) |
| Distributions from CVR Partners to its public unitholders | — |
| | — |
| | — |
| | — |
| | — |
| | — |
| | (23 | ) | | (23 | ) |
| Other | — |
| | — |
| | — |
| | (1 | ) | | — |
| | (1 | ) | | — |
| | (1 | ) |
| Net income | — |
| | — |
| | — |
| | 60 |
| | — |
| | 60 |
| | 33 |
| | 93 |
|
| Balance at March 31, 2018 | 86,929,660 |
| | $ | 1 |
| | $ | 1,197 |
| | $ | (192 | ) | | $ | (2 | ) | | $ | 1,004 |
| | $ | 845 |
| | $ | 1,849 |
|
| Dividends paid to CVR Energy stockholders | — |
| | — |
| | — |
| | (109 | ) | | — |
| | (109 | ) | | — |
| | (109 | ) |
| Distributions from CVR Partners to its public unitholders | — |
| | — |
| | — |
| | — |
| | — |
| | — |
| | (25 | ) | | (25 | ) |
| Other | — |
| | — |
| | — |
| | 1 |
| | — |
| | 1 |
| | (1 | ) | | — |
|
| Net income | — |
| | — |
| | — |
| | 43 |
| | — |
| | 43 |
| | 25 |
| | 68 |
|
| Balance at June 30, 2018 | 86,929,660 |
| | $ | 1 |
| | $ | 1,197 |
| | $ | (257 | ) | | $ | (2 | ) | | $ | 939 |
| | $ | 844 |
| | $ | 1,783 |
|
| Dividends paid to CVR Energy stockholders | — |
| | — |
| | — |
| | (10 | ) | | — |
| | (10 | ) | | — |
| | (10 | ) |
| Distributions from CVR Partners to its public unitholders | — |
| | — |
| | — |
| | — |
| | — |
| | — |
| | (19 | ) | | (19 | ) |
| CVR Refining units exchange | 13,600,939 |
| | — |
| | 277 |
| | — |
| | — |
| | 277 |
| | (192 | ) | | 85 |
|
| Other | — |
| | — |
| | — |
| | (1 | ) | | — |
| | (1 | ) | | — |
| | (1 | ) |
| Net income | — |
| | — |
| | — |
| | 81 |
| | — |
| | 81 |
| | 29 |
| | 110 |
|
| Balance at September 30, 2018 | 100,530,599 |
| | $ | 1 |
| | $ | 1,474 |
| | $ | (187 | ) | | $ | (2 | ) | | $ | 1,286 |
| | $ | 662 |
| | $ | 1,948 |
|
The accompanying notes are an integral part of these condensed consolidated financial statements.
September 30, 20192020 | 67
CVR ENERGY, INCINC. AND SUBSIDIARIES
CONDENSED CONSOLIDATED STATEMENTS OF CASH FLOWS
| | | | Nine Months Ended September 30, | | Nine Months Ended September 30, |
| (in millions) | 2019 | | 2018 | (in millions) | 2020 | | 2019 |
| Cash flows from operating activities: | | | | Cash flows from operating activities: | | | |
| Net income | $ | 334 |
| | $ | 271 |
| |
| Adjustments to reconcile net income to net cash provided by operating activities: | | | | |
| Net (loss) income | | Net (loss) income | $ | (241) | | | $ | 334 | |
| Adjustments to reconcile net (loss) income to net cash provided by operating activities: | | Adjustments to reconcile net (loss) income to net cash provided by operating activities: | |
| Depreciation and amortization | 217 |
| | 204 |
| Depreciation and amortization | 208 | | | 217 | |
| Deferred income tax expense | 26 |
| | 39 |
| |
| (Gain) loss on disposition of assets | (5 | ) | | 5 |
| |
| | Loss on lower of cost or net realizable value adjustment | | Loss on lower of cost or net realizable value adjustment | 59 | | | 0 | |
| Goodwill impairment | | Goodwill impairment | 41 | | | 0 | |
| Unrealized loss on marketable securities | | Unrealized loss on marketable securities | 20 | | | 0 | |
| Change in deferred income tax expense | | Change in deferred income tax expense | (18) | | | 26 | |
| Loss (gain) on disposition of assets | | Loss (gain) on disposition of assets | 2 | | | (5) | |
| | Share-based compensation | 14 |
| | 17 |
| Share-based compensation | 0 | | | 14 | |
| Other non-cash items | (7 | ) | | 2 |
| |
| | Other items | | Other items | 8 | | | (7) | |
| Changes in assets and liabilities: | | | | Changes in assets and liabilities: | |
| Current assets and liabilities | 69 |
| | (27 | ) | Current assets and liabilities | (23) | | | 69 | |
| | Non-current assets and liabilities | 5 |
| | 15 |
| Non-current assets and liabilities | 6 | | | 5 | |
| | Net cash provided by operating activities | 653 |
| | 526 |
| Net cash provided by operating activities | 62 | | | 653 | |
| Cash flows from investing activities: | | | | Cash flows from investing activities: | | | |
| Capital expenditures | (85 | ) | | (68 | ) | Capital expenditures | (101) | | | (85) | |
| Capitalized turnaround expenditures | (24 | ) | | (7 | ) | |
| | Turnaround expenditures | | Turnaround expenditures | (158) | | | (24) | |
| | Proceeds from sale of assets | 36 |
| | — |
| Proceeds from sale of assets | 1 | | | 36 | |
| Investment in marketable securities | | Investment in marketable securities | (140) | | | 0 | |
| Other investing activities | — |
| | 1 |
| Other investing activities | 2 | | | 0 | |
| | Net cash used in investing activities | (73 | ) | | (74 | ) | Net cash used in investing activities | (396) | | | (73) | |
| Cash flows from financing activities: | | | | Cash flows from financing activities: | | | |
| | Proceeds from issuance of senior secured notes | | Proceeds from issuance of senior secured notes | 1,000 | | | 0 | |
| Principal payments on senior secured notes | | Principal payments on senior secured notes | (500) | | | 0 | |
| Call premium on extinguishment of debt | | Call premium on extinguishment of debt | (5) | | | 0 | |
| Repurchase of common units by CVR Partners | | Repurchase of common units by CVR Partners | (2) | | | 0 | |
| Acquisition of CVR Refining common units | (301 | ) | | — |
| Acquisition of CVR Refining common units | 0 | | | (301) | |
| | Dividends to CVR Energy’s stockholders | (225 | ) | | (162 | ) | Dividends to CVR Energy’s stockholders | (121) | | | (225) | |
| Distributions to CVR Refining or CVR Partners’ noncontrolling interest holders | (25 | ) | | (67 | ) | Distributions to CVR Refining or CVR Partners’ noncontrolling interest holders | 0 | | | (25) | |
| Other financing activities | (5 | ) | | (3 | ) | Other financing activities | (11) | | | (5) | |
| Net cash used in financing activities | (556 | ) | | (232 | ) | |
| Net increase in cash and cash equivalents | 24 |
| | 220 |
| |
| Cash and cash equivalents, beginning of period | 668 |
| | 482 |
| |
| Cash and cash equivalents, end of period | $ | 692 |
| | $ | 702 |
| |
| Net cash provided by (used in) financing activities | | Net cash provided by (used in) financing activities | 361 | | | (556) | |
| Net increase in cash, cash equivalents and restricted cash | | Net increase in cash, cash equivalents and restricted cash | 27 | | | 24 | |
| Cash, cash equivalents and restricted cash, beginning of period | | Cash, cash equivalents and restricted cash, beginning of period | 652 | | | 668 | |
| Cash, cash equivalents and restricted cash, end of period | | Cash, cash equivalents and restricted cash, end of period | $ | 679 | | | $ | 692 | |
|
The accompanying notes are an integral part of these condensed consolidated financial statements.
September 30, 20192020 | 78
NOTES TO THE CONDENSED CONSOLIDATED FINANCIAL STATEMENTS
(unaudited)
(1) Organization and Nature of Business
Organization
CVR Energy, Inc. (“CVR Energy,” “CVR,” “we,” “us,” “our,” or the “Company”) is a diversified holding company primarily engaged in the petroleum refining and nitrogen fertilizer manufacturing industries through its holdings in CVR Refining, LP (the “Petroleum Segment” or “CVR Refining”) and CVR Partners, LP (the “Nitrogen Fertilizer Segment” or “CVR Partners”). CVR Refining is an independent petroleum refiner and marketer of high value transportation fuels. CVR Partners produces and markets nitrogen fertilizers in the form of urea ammonium nitrate (“UAN”) and ammonia. CVR’s common stock is listed on the New York Stock Exchange (“NYSE”(the “NYSE”) under the symbol “CVI.” Icahn Enterprises L.P. and its affiliates (“IEP”) owned approximately 71% of the Company’s outstanding common shares as of September 30, 2019.2020.
Stock Repurchase Program
On October 23, 2019, the Board of Directors of the Company authorized a stock repurchase program (the “Stock Repurchase Program”). The Stock Repurchase Program would enable the Company to repurchase up to $300 million of the Company’s common stock. Repurchases under the Stock Repurchase Program may be made from time-to-time through open market transactions, block trades, privately negotiated transactions or otherwise in accordance with applicable securities laws. The timing, price and amount of repurchases (if any) will be made at the discretion of management and are subject to market conditions as well as corporate, regulatory and other considerations. While the Stock Repurchase Program currently has a duration of four years, it does not obligate the Company to acquire any stock and may be terminated by the Company’s Board of Directors at any time.
CVR Refining, LP
On January 17, 2019, the general partner of CVR Refining assigned to the Company its right to purchase all of the issued and outstanding CVR Refining common units not already owned by CVR Refining’s general partner or its affiliates. On January 29, 2019, the Company purchased all remaining CVR Refining common units not already owned by the Company or its affiliates for a cash purchase price of $10.50 per unit (the “Call Price”), or approximately $241 million in the aggregate (the “Public Unit Purchase”). In conjunction with the exercise of its call right for all CVR Refining common units not already owned by the Company or its affiliates, the Company entered into a purchase agreement with American Entertainment Properties Corporation (“AEP”) and IEP, pursuant to which, on January 29, 2019, all of the Common Units held by AEP and IEP were purchased by the Company for a cash price per unit equal to the Call Price, or approximately $60 million in the aggregate (the “Affiliate Unit Purchase” together with the Public Unit Purchase, the “CVRR Unit Purchase”). The total purchase price of $301 million was funded with approximately $105 million in borrowings under a new credit agreement entered into by the Company on January 29, 2019, with the remaining amount being funded from the Company’s cash on hand. Amounts drawn under the new credit agreement were fully repaid in February 2019. See Note 7 (“Long-Term Debt and Finance Lease Obligations”) for further information on the credit agreement. The consolidated results of operations and financial position of CVR Refining are reflected as CVR’s Petroleum Segment. Following this transaction, CVR Refining became a wholly-owned subsidiary of the Company and therefore is no longer accounted for as a variable interest entity.
Upon the closing of the CVRR Unit Purchase, the Company, and certain of the Company’s subsidiaries, executed a full and unconditional guarantee of CVR Refining’s Senior Notes due 2022 (the “2022 Senior Notes”). Effective February 8, 2019, CVR Refining’s reporting obligations under the Exchange Act were suspended. Pursuant to SEC regulations, the Company has elected to provide condensed consolidating financial statements in lieu of providing standalone CVR Refining financial statements. See Note 15 (“Guarantor Financial Information”) for further discussion and the condensed consolidated financial statements.
CVR Partners, LP
Interest Holders - As of September 30, 2019,2020, public securitycommon unit holders held approximately 66%65% of CVR Partners’ outstanding common units and CVR Services, LLC (“CVR Services”) (formerly Coffeyville Resources, LLC (“CRLLC”)LLC), a wholly-owned subsidiary of CVR Energy, held approximately 34%35% of CVR Partners’ outstanding common units. In addition, CRLLC ownsCVR Services held 100% of CVR Partners’ general partner, CVR GP, LLC (“CVR GP”), which holdsheld a non-economic general partner interest in CVR Partners.Partners as of September 30, 2020. Following the acquisition of the noncontrolling interest in CVR Refining in January 2019, the noncontrolling interest reflected on the condensed consolidated balance sheets of CVR is only impacted by the net income of, and distributions from, CVR Partners.
NYSE Listing Requirements and Reverse Split - On April 20, 2020, the average closing price of CVR Partners’ common units over a 30 consecutive trading-day period fell below $1.00 per common unit, resulting in noncompliance with the continued listing standards in Section 802.01C of the NYSE Listed Company Manual. CVR Partners received written notification of this noncompliance from the NYSE on April 22, 2020, and currently has until January 1, 2021 to regain compliance or be subject to the NYSE’s suspension and delisting procedures. See the Form 8-K filed by CVR Partners with the SEC on April 24, 2020 for further discussion. As of September 30, 2020, the average closing price of CVR Partners’ common units over the preceding consecutive 30 trading-day period remained below $1.00 per common unit.
On November 2, 2020, CVR Partners announced that the board of directors of its general partner (the “UAN GP Board”) had approved a 1-for-10 reverse split of CVR Partners’ common units to be effective at 5:00 p.m. Eastern Time on November 23, 2020, pursuant to which each ten common units of CVR Partners would be converted into one common unit of the Partnership (the “Reverse Unit Split”). In accordance with CVR Partners’ Agreement of Limited Partnership, as amended, following the Reverse Unit Split, any fractional units of record holders will be rounded up or down, as applicable, to the nearest whole common unit, with any fraction equal to or above 0.5 common units rounding up to the next higher common unit. Following the Reverse Unit Split, the number of CVR Partners common units outstanding would decrease from approximately 111 million common units to approximately 11 million common units, with proportionate adjustments to the common units under CVR Partners’ long-term incentive plan and outstanding awards thereunder.
The UAN GP Board determined the 1-for-10 ratio to be appropriate to meet CVR Partners’ goals of improving the marketability of its common units, regaining compliance with NYSE listing requirements, and reducing the risk of future noncompliance with such listing requirements.
CVR Partners’ common units are expected to begin trading on a split-adjusted basis when markets open on November 24, 2020, under the symbol “UAN” and a new CUSIP number.
Unit Repurchase Program - On May 6, 2020, the UAN GP Board, on behalf of CVR Partners, authorized a unit repurchase program (the “Unit Repurchase Program”). The Unit Repurchase Program enables CVR Partners to repurchase up to $10 million of its common units. During the three and nine months ended September 30, 2020, CVR Partners repurchased 1,403,784 and 2,294,002 common units, respectively, on the open market in accordance with a repurchase agreement under Rules 10b5-1 and 10b-18 of the Exchange Act, which was terminated on August 6, 2020, at a cost of $1 million and $2 million, respectively, inclusive of transaction costs, or an average price of $0.94 and $0.99 per common unit, respectively. At September 30, 2020, CVR Partners had $8 million in authority remaining under the Unit Repurchase Program. This Unit Repurchase Program does not obligate CVR Partners to acquire any common units and may be cancelled or terminated by the UAN GP Board at any time.
September 30, 20192020 | 89
NOTES TO THE CONDENSED CONSOLIDATED FINANCIAL STATEMENTS (Continued)
(unaudited)
As a result of these repurchases, and the resulting change in CVR Energy’s ownership of CVR Partners while maintaining control, CVR Energy recognized an increase of $2.9 million to additional paid-in capital from the reduction of non-controlling interests totaling $3.9 million and the recognition of a deferred tax liability totaling $1.0 million from changes in its book versus tax basis in CVR Partners.
(2) Basis of Presentation
The accompanying condensed consolidated financial statements have been prepared in accordance with accounting principles generally accepted in the United States of America (“GAAP”) and in accordance with the rules and regulations of the Securities and Exchange Commission (the “SEC”). Effective January 1, 2019, the Company revised its accounting policy method for the costs of planned major maintenance activities (turnarounds) specific to the Petroleum Segment from being expensed as incurred (the direct expensing method) to the deferral method. Comparable prior period information has been recast to reflect this accounting change. The impact of adopting the new policy to account for turnaround expenses is reflected within a Current Report on Form 8-K filed by the Company with the SEC on June 12, 2019, which recast the December 31, 2018 audited information (the “Recast Form 8-K for 2018”). See Note 3 (“Recent Accounting Pronouncements and Accounting Changes”) for additional information. These condensed consolidated financial statements should be read in conjunction with the December 31, 20182019 audited consolidated financial statements and notes thereto included in CVR Energy’s Annual Report on Form 10-K for the year ended December 31, 2018, as well as the Recast2019 (the “2019 Form 8-K for 2018.10-K”).
Our condensed consolidated financial statements include the consolidated results of CVR Partners, which is defined as a variable interest entity.
In the opinion of the Company’s management, the accompanying condensed consolidated financial statements reflect all adjustments that are necessary for fair presentation of the financial position and results of operations of the Company for the periods presented. Such adjustments are of a normal recurring nature, unless otherwise disclosed.
Certain other reclassifications have been made within the condensed consolidated balance sheets as of December 31, 2019 and the condensed consolidated statements of operations for the three and nine months ended September 30, 20182019. Catalyst inventory with a value of $17 million as of December 31, 2019 was reclassified during the first quarter of 2020 to include gain (loss) on derivatives within the Cost of materials and other financial statement line itemOther long-term assets to conform withto current presentation.
The preparation of the condensed consolidated financial statements in conformity with GAAP requires management to make certain estimates and assumptions that affect the reported amounts of assets, liabilities, revenues and expenses, and the disclosure of contingent assets and liabilities. Actual results could differ from those estimates. Results of operations and cash flows for the interim periods presented are not necessarily indicative of the results that will be realized for the year ending December 31, 20192020 or any other interim or annual period.
(3) Recent Accounting Pronouncements and Accounting Changes
Recent Accounting PronouncementPronouncements - Adoption of New LeaseCredit Losses Standard
In FebruaryJune 2016, the Financial Accounting Standards Board (“FASB”) issued Accounting StandardsStandard Update (“ASU”) No. 2016-02, “Leases” (“2016-13, Financial Instruments - Credit Losses (Topic 326). The ASU 2016-02”), creatingreplaces the incurred loss model with a new topic, FASB ASC Topic 842, “Leases” (“Topic 842”), which supersedes lease requirements in FASB ASC Topic 840, “Leases.” The new standard revises accountingcurrent expected credit loss model for operating leases by a lessee, among other changes, and requires a lessee to recognize a liability related to future lease payments and a right-of-use (“ROU”) asset representing its right to usemore timely recognition of the underlying assetexpected impairment losses for the lease term on the condensed consolidated balance sheet. The ROU asset for operating leases is classified as Other long-term assets on the condensed consolidated balance sheet. The current and long-term operating lease liabilities are classified as Other current liabilities and Other long-term liabilities, respectively, on the condensed consolidated balance sheet. The ROU asset for finance leases is classified as Property, plant and equipment, net of accumulated depreciation and amortization on the condensed consolidated balance sheet. The current and long-term finance lease liabilities are classified as Other current liabilities and Long-term debt and finance lease obligations, respectively, on the condensed consolidated balance sheet.
We adopted Topic 842 as of January 1, 2019, electing the option to apply the transition provisions at the adoption date instead of the earliest comparative period presented in themost financial statements. In connection with the adoption of Topic 842, we made the following elections:
Under the short-term lease exception provided for in Topic 842, only ROU assets and related lease liabilities for leases with a term greater than one year were and will be recognized;
The accounting treatment for existing land easements was carried forward;
Lease and non-lease components were and willcertain other instruments that are not be bifurcated for all of the Company’s asset groups, respectively; and
NOTES TO THE CONDENSED CONSOLIDATED FINANCIAL STATEMENTS (Continued)
(unaudited)
The portfolio approach was, and will be, used in the selection of the discount rate used to calculate minimum lease payments and the related ROU asset and operating lease liability amounts.
The Company’s adoption of Topic 842 resulted in the recognition of additional ROU assets and lease liabilities of approximately $56 million as of January 1, 2019, in addition to the recognition of a finance lease asset of $26 million with an obligation of $23 million. There were no impacts to our condensed consolidated statements of operations or cash flows. See Note 6 (“Leases”) for further discussion.
Accounting Change - Turnaround Expenses
measured at fair value through net income. Effective January 1, 2019, the Company revised its accounting policy method for the costs of planned major maintenance activities (turnarounds) specific to the Petroleum Segment from being expensed as incurred (the direct expensing method) to the deferral method. Turnarounds are planned shutdowns of refinery processing units for significant overhaul and refurbishment. Under the deferral method, the costs of turnarounds are deferred and amortized on a straight-line basis generally over a four-year period of time, which represents the estimated time until the next turnaround occurs. The new method of accounting for turnarounds is considered preferable as it is more consistent2020, we adopted this ASU with the accounting policy of our peer companies and better reflects the economic substance of the benefits earned from turnaround expenditures. The condensed consolidated balance sheet as of December 31, 2018, the condensed consolidated statement of operations for the three and nine months ended September 30, 2018, and the condensed consolidated statement of cash flows for the nine months ended September 30, 2018 have been retrospectively adjusted to apply the new method. These turnaround costs, and related accumulated amortization, are included in the condensed consolidated balance sheet as Other long-term assets. The amortization expense related to turnaround costs is included in Depreciation and amortization in the condensed consolidated statement of operations. The Nitrogen Fertilizer Segment will continue to follow the direct expensing method, therefore this change had no material impact on the Nitrogen Fertilizer Segment’s current condensedCompany’s consolidated financial statements.position or results of operations.
The policy change for turnaround expenses retrospectively impacted the Company’s December 31, 2018 condensed consolidated balance sheet by increasing total assets by $93 million and total equity by $75 million. The adoption of Topic 842 on January 1, 2019 incrementally impacted the Company’s consolidated balance sheet as of that date. The following presents the financial statement line items impacted by the turnaround accounting change and the Company’s Topic 842 adoption as of the respective dates.
Effect of Topic 842 Adoption on Condensed Consolidated Balance Sheet as of January 1, 2019
|
| | | | | | | | | | | |
| (in millions) | December 31, 2018
As Stated (1) | | Effect of Adoption of Topic 842 - Leases (Unaudited) | | January 1, 2019
As Adjusted |
| Current assets: | | | | | |
| Prepaid expenses and other current assets | $ | 76 |
| | $ | (3 | ) | (2) | $ | 73 |
|
| Total currents assets | 1,293 |
| | (3 | ) | | 1,290 |
|
| Property, plant and equipment, net | 2,430 |
| | 26 |
| (3) | 2,456 |
|
| Other long-term assets | 277 |
| | 56 |
| (4) | 333 |
|
| Total assets | $ | 4,000 |
| | $ | 79 |
| | $ | 4,079 |
|
| Current liabilities: | | | | | |
| Other current liabilities | $ | 176 |
| | $ | 16 |
| (5) | $ | 192 |
|
| Total current liabilities | 496 |
| | 16 |
| | 512 |
|
| Long-term debt and finance lease obligations | 1,167 |
| | 23 |
| (3) | 1,190 |
|
| Other long-term liabilities | 14 |
| | 40 |
| (5) | 54 |
|
| Total long-term liabilities | 1,561 |
| | 63 |
| | 1,624 |
|
| Equity: | | | | | |
| Total liabilities and equity | $ | 4,000 |
| | $ | 79 |
| | $ | 4,079 |
|
| |
(1) | Represents the retrospectively adjusted balance sheet amounts upon reflection of the turnaround accounting change, for which the Recast Form 8-K for 2018 was filed on June 12, 2019, prior to the adoption of Topic 842. |
NOTES TO THE CONDENSED CONSOLIDATED FINANCIAL STATEMENTS (Continued)
(unaudited)
| |
(2) | Represents lease prepayments reclassified to ROU assets. |
| |
(3) | The additional $26 million right-of-use asset and $23 million in lease liability represents a lease with a third-party that met the definition of a finance lease under ASC 842 as compared to an operating lease under ASC 840. |
| |
(4) | Represents recognition of initial ROU assets for operating leases, including the reclassification of certain lease prepayments as noted above. |
| |
(5) | Represents the initial recognition of lease liabilities. |
Due to the retrospective adjustments for the turnaround accounting change, the three and nine months ended September 30, 2018 condensed consolidated statement of operations and the nine months ended September 30, 2018 condensed consolidated statement of cash flows have been recast. The impacts to previously reported amounts are shown below only for those line items impacted.
Effect of Turnaround Accounting on Condensed Consolidated Statement of Operations for the Three Months Ended September 30, 2018
|
| | | | | | | | | | | |
| (in millions) | As Previously Reported | | Effect of Turnaround Accounting Change (Unaudited) | | As Stated |
| Condensed Consolidated Statement of Operations | | | | | |
| Direct operating expenses (exclusive of depreciation and amortization as reflected below) | $ | 121 |
| | $ | (2 | ) | | $ | 119 |
|
| Depreciation and amortization | 49 |
| | 14 |
| | 63 |
|
| Income tax expense | 35 |
| | (2 | ) | | 33 |
|
| Net income | 121 |
| | (11 | ) | | 110 |
|
| Less: Net income attributable to noncontrolling interest | 31 |
| | (2 | ) | | 29 |
|
| Net income attributable to CVR Energy stockholders | $ | 90 |
| | $ | (9 | ) | | $ | 81 |
|
Effect of Turnaround Accounting on Condensed Consolidated Statement of Operations and Condensed Consolidated Statement of Cash Flows for the Nine Months Ended September 30, 2018
|
| | | | | | | | | | | |
| (in millions) | As Previously Reported | | Effect of Turnaround Accounting Change (Unaudited) | | As Stated |
| Condensed Consolidated Statement of Operations | | | | | |
| Direct operating expenses (exclusive of depreciation and amortization as reflected below) | $ | 394 |
| | $ | (4 | ) | | $ | 390 |
|
| Depreciation and amortization | 151 |
| | 45 |
| | 196 |
|
| Income tax expense | 73 |
| | (8 | ) | | 65 |
|
| Net income | 304 |
| | (33 | ) | | 271 |
|
| Less: Net income attributable to noncontrolling interest | 97 |
| | (11 | ) | | 86 |
|
| Net income attributable to CVR Energy stockholders | $ | 207 |
| | $ | (22 | ) | | $ | 185 |
|
| | | | | | |
| Condensed Consolidated Statement of Cash Flows | | | | | |
| Net cash provided by operating activities | $ | 519 |
| | $ | 7 |
| | $ | 526 |
|
| Net cash used by investing activities | $ | (67 | ) | | $ | (7 | ) | | $ | (74 | ) |
New Accounting Standards Issued But Not Yet Implemented
In August 2018, the FASB issued ASU 2018-13, Fair Value Measurement (Topic 820). The ASU eliminates such disclosures as the amount of, and reasons for, transfers between Level 1 and Level 2 of the fair value hierarchy. Certain disclosures are required to be applied on a retrospective basis and others on a prospective basis. Effective January 1, 2020, we adopted this ASU with no material impact on the Company’s disclosures.
New Accounting Standards Issued But Not Yet Implemented
In December 2019, the FASB issued ASU 2019-12, Income Taxes (Topic 740). The ASU simplifies the accounting for income taxes by removing certain exceptions to the general principles in Topic 740 and modifies other areas of the topic to clarify the application of GAAP. Certain amendments within the standard are required to be applied on a retrospective basis and others on a prospective basis. This standard is effective for the Company beginning January
NOTES TO THE CONDENSED CONSOLIDATED FINANCIAL STATEMENTS (Continued)
(unaudited)
1, 2020,2021, with early adoption permitted. The Company is evaluating the effect of adopting this new accounting guidance but does not currently expect adoption will have a material impact on the Company’s disclosures.
In August 2018, the FASB issued ASU 2018-15, Intangibles-Goodwill and Other-Internal-Use Software (Subtopic 350-40). This ASU addresses customer’s accounting for implementation costs incurred in a cloud computing arrangement that is a service contract and also adds certain disclosure requirements related to implementation costs incurred for internal-use software and cloud computing arrangements. The amendment aligns the requirements for capitalizing implementation costs incurred in a hosting arrangement that is a service contract with the requirements for capitalizing implementation costs incurred to develop or obtain internal-use software (and hosting arrangements that include an internal-use software license). This standard is effective for the Company beginning January 1, 2020, with early adoption permitted. The amendments in this standard can be applied either retrospectively or prospectively to all implementation costs incurred after the date of adoption. The Company is evaluating the effect of adopting this new accounting guidance on its consolidated financial
NOTES TO THE CONDENSED CONSOLIDATED FINANCIAL STATEMENTS (Continued)
(unaudited)
statements, but does not currently expect adoption will have a material impact on the Company’s consolidated financial position or results of operations. The Company does not intend to early adopt this ASU.
In March 2020, the FASB issued ASU 2020-04, Reference Rate Reform (Topic 848). This ASU was issued because, by the end of 2021, banks will no longer be required to report information that is used to determine London Interbank Offered Rate (“LIBOR”), which is used globally by all types of entities. As a result, LIBOR could be discontinued, as well as other interest rates used globally. ASU 2020-04 provides companies with optional expedients for contract modifications under Topics 310, 470, 842, and 815-15, excluded components of certain hedging relationships, fair value hedges, and cash flow hedges, as well as certain exceptions, which are intended to help ease the potential accounting burden associated with transitioning away from these reference rates. Companies can apply the ASU immediately. However, the guidance will only be available for a limited time (generally through December 31, 2022). The Company is currently evaluating the impact that adopting this new accounting standard will have on its consolidated financial statements and related disclosures.
(4) Inventories
Inventories consisted of the following:
| | | | | | | | | | | |
| (in millions) | September 30, 2020 | | December 31, 2019 |
| Finished goods | $ | 110 | | | $ | 177 | |
| Raw materials | 73 | | | 112 | |
| In-process inventories | 17 | | | 18 | |
| Parts, supplies and other | 66 | | | 66 | |
| Total inventories | $ | 266 | | | $ | 373 | |
|
| | | | | | | |
| (in millions) | September 30, 2019 | | December 31, 2018 |
| Raw materials | $ | 114 |
| | $ | 101 |
|
| In-process inventories | 18 |
| | 12 |
|
| Finished goods | 176 |
| | 186 |
|
| Parts, supplies and other | 80 |
| | 81 |
|
| Total inventories | $ | 388 |
| | $ | 380 |
|
As of March 31, 2020, the carrying amounts of the Petroleum Segment’s inventories exceeded their net realizable value (market value) by $58 million resulting in the recognition of a lower of cost or net realizable value adjustment. The $58 million loss represents the difference between the carrying value of the Petroleum Segment’s inventories accounted for using the first-in-first-out method and selling prices for refined products subsequent to March 31, 2020. NaN adjustment was necessary as of September 30, 2020, June 30, 2020, or December 31, 2019.
(5) Property, Plant and Equipment
Property, plant and equipment consisted of the following:
| | | | | | | | | | | |
| (in millions) | September 30, 2020 | | December 31, 2019 |
| Machinery and equipment | $ | 3,871 | | | $ | 3,805 | |
| Buildings and improvements | 88 | | | 87 | |
| ROU finance leases | 81 | | | 81 | |
| Land and improvements | 47 | | | 46 | |
| Furniture and fixtures | 37 | | | 35 | |
| Construction in progress | 91 | | | 95 | |
| Other | 15 | | | 14 | |
| | | |
| | | |
| | | |
| | | |
| 4,230 | | | 4,163 | |
| Less: Accumulated depreciation and amortization | 1,963 | | | 1,827 | |
| Total property, plant and equipment, net | $ | 2,267 | | | $ | 2,336 | |
|
| | | | | | | |
| (in millions) | September 30, 2019 | | December 31, 2018 |
| Machinery and equipment | $ | 3,830 |
| | $ | 3,785 |
|
| Buildings and improvements | 87 |
| | 87 |
|
| Land and improvements | 46 |
| | 43 |
|
| Furniture and fixtures | 33 |
| | 33 |
|
| ROU finance lease | 27 |
| | — |
|
| Construction in progress | 98 |
| | 102 |
|
| Other | 14 |
| | 17 |
|
| | 4,135 |
| | 4,067 |
|
| Less: Accumulated depreciation | 1,779 |
| | 1,637 |
|
| Total property, plant and equipment, net | $ | 2,356 |
| | $ | 2,430 |
|
As of September 30, 2020, the Company had not identified the existence of an impairment indicator for our long-lived asset groups as outlined under ASC 360.
On May 21, 2019, a subsidiary of CVR Energy sold its crude oil storage terminal located in Cushing, Oklahoma and related assets (the “Terminal”). As part of this transaction the Company received cash consideration of $43 million for the Terminal and related crude oil inventories resulting in the recognition of a gain on sale of $9 million. The carrying value(6) Goodwill
One of the inventory sold as partreporting units associated with our Nitrogen Fertilizer Segment’s Coffeyville, Kansas facility (the “Coffeyville Facility”) had a goodwill balance of this transaction has been presented on a net basis, with$41 million at December 31, 2019. During the proceeds on sale, withinsecond quarter of 2020, following the net cash used in investing sectioncompletion of the Condensed Consolidated Statements of Cash Flows.
September 30, 20192020 | 1211
NOTES TO THE CONDENSED CONSOLIDATED FINANCIAL STATEMENTS (Continued)
(unaudited)
(6) Leases
(7) Leases
Lease Overview
We lease certain pipelines, storage tanks, railcars, office space, land, and equipment across our refining, fertilizer and corporate operations. Most leases include one or more options to renew, with renewal terms that can extend the lease term from one to 20 years or more. The exercise of lease renewal options is at our sole discretion. Certain leases also include options to purchase the leased property. The depreciable life of assets and leasehold improvements is limited by the expected lease term, unless there is a transfer of title or purchase option reasonably certain of exercise. Certain of our lease agreements include rental payments which are adjusted periodically for factors such as inflation. Our lease agreements do not contain any material residual value guarantees or material restrictive covenants. Additionally, we do not have any material lessor or sub-leasing arrangements.
The adoption of Topic 842 impacted our January 1, 2019 condensed consolidated balance sheet as shown below only for those line items impacted.
Effect of Initial Adoption of Topic 842 - January 1, 2019
ROU Assets. Upon initial recognition, our ROU assets for operating and finance leases were comprised of the following:
|
| | | |
| (in millions) | January 1, 2019 (initial recognition) |
| Pipeline and storage agreements (1) | $ | 29 |
|
| Railcar leases (2) | 15 |
|
| Real Estate and other leases (3) | 35 |
|
| Total ROU assets | $ | 79 |
|
(1) Includes finance leased assets of $1 million as of January 1, 2019.
(2) Includes $14 million of railcar leases recognized by CVR Partners.
(3) Includes finance leased assets of $25 million as of January 1, 2019.
Lease Liabilities. Upon initial recognition, our lease liabilities for operating and finance leases were comprised of the following:
|
| | | | |
| (in millions) | | January 1, 2019 (initial recognition) |
| Current liabilities: | | |
| Operating leases | | $ | 14 |
|
| Finance leases | | 2 |
|
| Long-term liabilities: | | |
| Operating leases | | 40 |
|
| Finance leases | | 23 |
|
| Total lease liabilities | | $ | 79 |
|
NOTES TO THE CONDENSED CONSOLIDATED FINANCIAL STATEMENTS (Continued)
(unaudited)
Balance Sheet Summary as of September 30, 2020 and December 31, 2019
The following tables summarize the right of use asset and lease liability balances for the Company’s operating and finance leases at September 30, 2020 and December 31, 2019:
|
| | | |
| (in millions) | September 30, 2019 |
| Operating Leases: | |
| ROU assets, net | |
| Pipeline and storage | $ | 22 |
|
| Railcars | 12 |
|
| Real estate and other | 14 |
|
| Lease liability | |
| Pipelines and storage | $ | 23 |
|
| Railcars | 12 |
|
| Real estate and other | 12 |
|
|
| | | |
| (in millions) | September 30, 2019 |
| Financing Leases: | |
| ROU assets, net | |
| Pipeline and storage | $ | 30 |
|
| Real estate and other | 25 |
|
| Lease liability | |
| Pipelines and storage | $ | 41 |
|
| Real estate and other | 26 |
|
| | | | | | | | | | | |
| (in millions) | September 30, 2020 | | December 31, 2019 |
| Operating Leases: | | | |
| ROU assets, net | | | |
| Pipeline and storage | $ | 17 | | | $ | 20 | |
| Railcars | 9 | | | 12 | |
| Real estate and other | 16 | | | 16 | |
| Lease liability | | | |
| Pipelines and storage | $ | 17 | | | $ | 22 | |
| Railcars | 9 | | | 12 | |
| Real estate and other | 15 | | | 14 | |
| | | | | | | | | | | |
| (in millions) | September 30, 2020 | | December 31, 2019 |
| Finance Leases: | | | |
| ROU assets, net | | | |
| Pipeline and storage | $ | 27 | | | $ | 29 | |
| Real estate and other | 22 | | | 24 | |
| Lease liability | | | |
| Pipelines and storage | $ | 39 | | | $ | 40 | |
| Real estate and other | 23 | | | 25 | |
NOTES TO THE CONDENSED CONSOLIDATED FINANCIAL STATEMENTS (Continued)
(unaudited)
Lease Expense Summary for the Three and Nine Months Ended September 30, 2020 and 2019
We recognize lease expense on a straight-line basis over the lease term. For the three and nine months ended September 30, 2020 and 2019, we recognized lease expense comprised of the following components:
| | | | | | | | | | | | | | | | | | | | | | | |
| Three Months Ended
September 30, | | Nine Months Ended
September 30, |
| (in millions) | 2020 | | 2019 | | 2020 | | 2019 |
| Operating lease expense | $ | 4 | | | $ | 4 | | | $ | 13 | | | $ | 12 | |
| Finance lease expense: | | | | | | | |
| Amortization of ROU | $ | 2 | | | $ | 2 | | | $ | 5 | | | $ | 5 | |
| Interest expense on lease liability | 1 | | | 2 | | | 4 | | | 5 | |
|
| | | | | | | |
| (in millions) | Three Months Ended
September 30, 2019 | | Nine Months Ended
September 30, 2019 |
| Operating lease expense | $ | 4 |
| | $ | 12 |
|
| Financing lease expense: | | | |
| Amortization of ROU | $ | 2 |
| | $ | 5 |
|
| Interest expense on lease liability | 2 |
| | 5 |
|
Short-term lease expense, recognized within directDirect operating expenses (exclusive of depreciation and amortization), was $2 million and $6 million for the three and nine months ended September 30, 2019.
2020, respectively, and $2 million and $6 million for the three and nine months ended September 30, 2019, | 14
NOTES TO THE CONDENSED CONSOLIDATED FINANCIAL STATEMENTS (Continued)
(unaudited)
Lease Terms and Discount Rates
The following outlines the remaining lease terms and discount rates used in the measurement of the Company’s ROU assets and liabilities:
| | | | | | | | | | | |
| September 30, 2020 | | December 31, 2019 |
| Weighted-average remaining lease term (years) | | | |
| Operating Leases | 3.3 | | 3.7 |
| Finance Leases | 8.4 | | 9.0 |
| Weighted-average discount rate | | | |
| Operating Leases | 5.5 | % | | 5.6 | % |
| Finance Leases | 9.0 | % | | 8.9 | % |
|
| | | | | |
| | September 30, 2019 | | January 1, 2019 (initial recognition) |
| Weighted-average remaining lease term (years) | | | |
| Operating Leases | 3.9 |
| | 4.4 |
|
| Finance Leases | 9.8 |
| | 10.3 |
|
| Weighted-average discount rate | | | |
| Operating Leases | 5.7 | % | | 5.8 | % |
| Finance Leases | 9.6 | % | | 9.8 | % |
Maturities of Lease Liabilities
The following summarizes the remaining minimum lease payments through maturity of the Company’s right-of-use assets and liabilities at September 30, 2019:2020:
| | | | | | | | | | | |
| (in millions) | Operating Leases | | Financing
Leases |
| Remainder of 2020 | $ | 4 | | | $ | 3 | |
| 2021 | 15 | | | 11 | |
| 2022 | 12 | | | 11 | |
| 2023 | 8 | | | 10 | |
| 2024 | 5 | | | 10 | |
| Thereafter | 0 | | | 43 | |
| Total lease payments | 44 | | | 88 | |
| Less: imputed interest | (3) | | | (26) | |
| Total lease liability | $ | 41 | | | $ | 62 | |
|
| | | | | | | |
| (in millions) | Operating Leases | | Financing Leases |
| Remainder of 2019 | $ | 4 |
| | $ | 3 |
|
| 2020 | 15 |
| | 11 |
|
| 2021 | 13 |
| | 11 |
|
| 2022 | 10 |
| | 11 |
|
| 2023 | 6 |
| | 10 |
|
| Thereafter | 4 |
| | 53 |
|
| Total lease payments | 52 |
| | 99 |
|
| Less: imputed interest | (5 | ) | | (32 | ) |
| Total lease liability | $ | 47 |
| | $ | 67 |
|
(7)September 30, 2020 | 13
NOTES TO THE CONDENSED CONSOLIDATED FINANCIAL STATEMENTS (Continued)
(unaudited)
air separation unit over the life of the Messer Agreement. The Messer Agreement also obligates Messer to install a new oxygen storage vessel and related equipment to be used solely by the Coffeyville Facility. This arrangement for the use of the oxygen storage vessel and related equipment meets the definition of a lease under ASC 842, as CRNF will receive all output associated with the vessel. Based on terms outlined in the Messer Agreement, the Company expects the lease of the oxygen storage vessel to be classified as a financing lease with an amount between $20 and $25 million being capitalized upon lease commencement when the oxygen storage vessel is placed in service.
(8) Other Current Liabilities
Other current liabilities were as follows:
| | | | | | | | | | | |
| (in millions) | September 30, 2020 | | December 31, 2019 |
| Accrued Renewable Fuel Standards (“RFS”) obligation | $ | 83 | | | $ | 7 | |
| Accrued taxes other than income taxes | 33 | | | 28 | |
| Accrued interest | 27 | | | 9 | |
| Personnel accruals | 25 | | | 47 | |
| Operating lease liabilities | 13 | | | 14 | |
| Deferred revenue | 12 | | | 28 | |
| Current portion of long-term debt and finance lease obligations | 7 | | | 5 | |
| Share-based compensation | 6 | | | 6 | |
| Accrued income taxes | 0 | | | 24 | |
| Accrued derivatives | 0 | | | 7 | |
| Other accrued expenses and liabilities | 9 | | | 9 | |
| Total other current liabilities | $ | 215 | | | $ | 184 | |
NOTES TO THE CONDENSED CONSOLIDATED FINANCIAL STATEMENTS (Continued)
(unaudited)
(9) Long-Term Debt and Finance Lease Obligations
Long-term debt and finance lease obligations consist of the following:
|
| | | | | | | |
| (in millions) | September 30, 2019 | | December 31, 2018 |
| CVR Partners: | | | |
| 9.25% Senior Secured Notes due 2023 (1)(3) | $ | 645 |
| | $ | 645 |
|
| 6.50% Senior Notes due 2021 | 2 |
| | 2 |
|
| Unamortized discount and debt issuance costs | (16 | ) | | (18 | ) |
| Total CVR Partners Debt | $ | 631 |
| | $ | 629 |
|
| |
|
| |
|
|
| CVR Refining: | | | |
| 6.50% Senior Notes due 2022 (2)(4) | $ | 500 |
| | $ | 500 |
|
| Finance lease obligations, net of current portion (5) | 62 |
| | 41 |
|
| Unamortized debt issuance cost | (3 | ) | | (3 | ) |
| Total CVR Refining Debt | 559 |
| | 538 |
|
| Total Long-Term Debt and Finance Lease Obligations | $ | 1,190 |
| | $ | 1,167 |
|
| | | | | | | | | | | |
| (in millions) | September 30, 2020 | | December 31, 2019 |
| CVR Partners: | | | |
| 9.25% Senior Secured Notes, due June 2023 | $ | 645 | | | $ | 645 | |
| 6.50% Senior Notes, due April 2021, net of current portion (1) | 0 | | | 2 | |
| | | |
| Unamortized discount and debt issuance costs | (12) | | | (15) | |
| Total CVR Partners debt, net of current portion | $ | 633 | | | $ | 632 | |
| | | |
| CVR Refining: | | | |
| 6.50% Senior Notes, due November 2022 (2) | $ | 0 | | | $ | 500 | |
| Finance lease obligations, net of current portion (3) | 56 | | | 61 | |
| Unamortized debt issuance cost | 0 | | | (3) | |
| | | |
| Total CVR Refining debt, net of current portion | $ | 56 | | | $ | 558 | |
| | | |
| CVR Energy: | | | |
| 5.25% Senior Notes, due February 2025 | $ | 600 | | | $ | 0 | |
| 5.75% Senior Notes, due February 2028 | 400 | | | — | |
| Unamortized debt issuance costs | (6) | | | 0 | |
| Total CVR Energy debt | 994 | | | 0 | |
| Total long-term debt and finance lease obligations, net of current portion | $ | 1,683 | | | $ | 1,190 | |
| Current portion of long-term debt and finance lease obligations (4) | 7 | | | 5 | |
| Total long-term debt and finance lease obligations, including current portion | $ | 1,690 | | | $ | 1,195 | |
(1)The 6.50% Notes, due April 2021, mature within 12 months, and, therefore, the outstanding balance of $2 million has been classified as short-term debt as of September 30, 2020.
(2)On January 27, 2020, the Company redeemed all of the 6.50% Senior Notes due November 2022 (the “2022 Notes”) for a redemption price equal to 101.083%, plus accrued and unpaid interest on the redeemed notes.
(3)Current portion of finance lease obligations recognized was approximately $5 million and $5 million as of September 30, 2020 and December 31, 2019, respectively.
(4)Amounts reported in Other current liabilities.
CVR Refining
On January 27, 2020, the Company redeemed all of the outstanding 2022 Notes and settled accrued interest of approximately $8 million through the date of redemption. The redeemed notes were repurchased for approximately $505 million, or 101.083% of par value. As a result of this transaction, the Company recognized an $8 million loss on extinguishment of debt in the first quarter of 2020, which includes the call premium paid of $5 million and the write-off of unamortized deferred financing costs of $3 million.
CVR Energy
2025 Notes and 2028 Notes - On January 27, 2020, CVR Energy completed a private offering of $600 million aggregate principal amount of 5.25% Senior Notes due 2025 (the “2025 Notes”) and $400 million aggregate principal amount of 5.75% Senior Notes due 2028 (the “2028 Notes” and, collectively with the 2025 Notes, the “Notes”). Interest on the Notes is payable semi-annually in arrears on February 15 and August 15 each year, commencing on August 15, 2020. The 2025 Notes mature on February 15, 2025, unless earlier redeemed or repurchased by the issuers. The 2028 Notes mature on February 15, 2028, unless earlier redeemed or repurchased by the issuers. The Notes are jointly and severally guaranteed on a senior unsecured basis by the wholly-owned subsidiaries of CVR Energy with the exception of CVR GP, CVR Partners and its subsidiaries, and certain
| |
(1) | This debt was issued at a $16 million discount which is being amortized, as interest expense, over the remaining term of the debt. Debt issuance costs associated with this debt totaled $9 million. |
September 30, 20192020 | 15
NOTES TO THE CONDENSED CONSOLIDATED FINANCIAL STATEMENTS (Continued)
(unaudited)
immaterial wholly-owned subsidiaries of CVR Energy. See Part II, Item 8 of the 2019 Form 10-K for further details of the Notes.
Credit Agreements
| | | | | | | | | | | | | | | | | | | | | | | | | | | | | |
| (in millions) | Total Available Borrowing Capacity | | Amount Borrowed as of September 30, 2020 | | Outstanding Letters of Credit | | Available Capacity as of September 30, 2020 | | Maturity Date |
| CVR Partners: | | | | | | | | | |
| Asset Based (“Nitrogen Fertilizer ABL”) Credit Agreement (1)(2) | $ | 25 | | | $ | 0 | | | $ | 0 | | | $ | 25 | | | September 30, 2022 |
| CVR Refining: | |
| Amended and Restated Asset Based (“Petroleum ABL”) Credit Agreement (3) | $ | 400 | | | $ | 0 | | | $ | 7 | | | $ | 393 | | | November 14, 2022 |
| | |
(2) | Debt issuance costs associated with this debt totaled $9 million. On January 29, 2019, the 2022 Senior Notes were amended such that CVR Energy was included as the primary guarantor, on a senior unsecured basis, of the 2022 Senior Notes. The CVR Energy guarantee is full and unconditional and joint and several. See Note 15 (“Guarantor Financial Information”) for further discussion and implications of this change to guarantor. |
| |
(3) | The estimated fair value of the 9.25% Senior Notes due 2023 was approximately $672 million and $671 million as of September 30, 2019 and December 31, 2018, respectively. |
| |
(4) | The estimated fair value of the 2022 Senior Notes was approximately $506 million and $493 million as of September 30, 2019 and December 31, 2018, respectively. |
| |
(5) | Current portion of finance lease obligations was approximately $5 million and $3 million as of September 30, 2019 and December 31, 2018, respectively. |
Credit Facilities
|
| | | | | | | | | | | | | | | | | |
| (in millions) | Total Capacity | | Amount Borrowed as of September 30, 2019 | | Outstanding Letters of Credit | | Available Capacity as of September 30, 2019 | | Maturity Date |
| CVR Refining: | |
| Amended and Restated Asset Based (“Amended and Restated ABL”) Credit Facility (1) | $ | 400 |
| | $ | — |
| | $ | 7 |
| | $ | 393 |
| | November 14, 2022 |
| CVR Partners: | | | | | | | | | |
| Asset Based (“AB”) Credit Facility (2) | $ | 48 |
| | $ | — |
| | $ | — |
| | $ | 48 |
| | September 30, 2021 |
| |
(1) | Loans under the Amended and Restated ABL Credit Facility initially bear interest at an annual rate equal to (i) 1.50% plus LIBOR or (ii) 0.50% plus a base rate, subject to quarterly excess availability. |
| |
(2) | Loans under the AB Credit Facility initially bear interest at an annual rate equal to (i) 2.00% plus LIBOR or (ii) 1.00% plus a base rate, subject to a 0.50% step-down based on the previous quarter’s excess availability. |
(1)Through December 31, 2020, loans under the Nitrogen Fertilizer ABL bear interest at an annual rate equal to (i) 2.00% plus LIBOR or (ii) 1.00% plus a base rate. Thereafter, loans will bear interest (i) at such rates if our quarterly excess availability is greater than 50% and (ii) (a) 2.50% plus LIBOR or (b) 1.50% plus a base rate, otherwise.
(2)The Nitrogen Fertilizer ABL was amended on September 29, 2020, to, among other things, reduce the commitments thereunder to $35 million and extend the maturity date to September 30, 2022. Deferred financing costs of less than $1 million were capitalized related to this amendment and will be amortized from Prepaid expenses and other current assets and Other long-term assets over the remaining term of the Nitrogen Fertilizer ABL.
(3)Loans under the Petroleum ABL bear interest at an annual rate equal to (i) (a) 1.50% plus LIBOR or (b) 0.50% plus a base rate, if our quarterly excess availability is greater than 50% and (ii) 1.75% plus LIBOR or (b) 0.75% plus a base rate, otherwise.
Covenant Compliance
The Company isand its subsidiaries were in compliance with all covenants of the Amended and Restated ABL and AB credit facilities and the senior notesunder their respective debt instruments as of September 30, 2019.
(8)
(10) Revenue
The following tables present the Company’s revenue, disaggregated by major product. The following tables include a reconciliation of the disaggregated revenue with the Company’s reportable segments.
| | | | | | | | | | | | | | | | | | | | | | | | | | | | | | | | | | | | | | | | | | | | | | | |
| Three Months Ended September 30, 2020 | | Nine Months Ended September 30, 2020 |
| (in millions) | Petroleum | | Nitrogen Fertilizer | | Other / Elimination | | Consolidated | | Petroleum | | Nitrogen Fertilizer | | Other / Elimination | | Consolidated |
| Major Product | | | | | | | | | | | | | | | |
| Gasoline | $ | 513 | | | $ | 0 | | | $ | 0 | | | $ | 513 | | | $ | 1,329 | | | $ | 0 | | | $ | 0 | | | $ | 1,329 | |
| Distillates (1) | 381 | | | 0 | | | 0 | | | 381 | | | 1,102 | | | 0 | | | 0 | | | 1,102 | |
| Ammonia | 0 | | | 13 | | | 0 | | | 13 | | | 0 | | | 64 | | | 0 | | | 64 | |
| UAN | 0 | | | 51 | | | 0 | | | 51 | | | 0 | | | 153 | | | 0 | | | 153 | |
| Other urea products | 0 | | | 3 | | | 0 | | | 3 | | | 0 | | | 11 | | | 0 | | | 11 | |
| Freight revenue | 4 | | | 10 | | | 0 | | | 14 | | | 13 | | | 24 | | | 0 | | | 37 | |
| Other (2) | 21 | | | 2 | | | (1) | | | 22 | | | 56 | | | 8 | | | (5) | | | 59 | |
| Revenue from product sales | 919 | | | 79 | | | (1) | | | 997 | | | 2,500 | | | 260 | | | (5) | | | 2,755 | |
| | | | | | | | | | | | | | | |
| Crude oil sales | 8 | | | 0 | | | 0 | | | 8 | | | 55 | | | 0 | | | 0 | | | 55 | |
| Other revenue (2) | 0 | | | 0 | | | 0 | | | 0 | | | 1 | | | 0 | | | 0 | | | 1 | |
| Net sales | $ | 927 | | | $ | 79 | | | $ | (1) | | | $ | 1,005 | | | $ | 2,556 | | | $ | 260 | | | $ | (5) | | | $ | 2,811 | |
| | | | | | | | | | | | | | | |
| | | | | | | | | | | | | | | |
| | | | | | | | | | | | | | | |
|
| | | | | | | | | | | | | | | |
| | Three Months Ended September 30, 2019 |
| (in millions) | Petroleum | | Nitrogen Fertilizer | | Other / Eliminations | | Consolidated |
| Major Product | | | | | | | |
| Gasoline | $ | 796 |
| | $ | — |
| | $ | — |
| | $ | 796 |
|
| Distillates (1) | 692 |
| | — |
| | — |
| | 692 |
|
| Ammonia | — |
| | 11 |
| | — |
| | 11 |
|
| UAN | — |
| | 62 |
| | — |
| | 62 |
|
| Other urea products | — |
| | 5 |
| | — |
| | 5 |
|
| Freight revenue | 6 |
| | 9 |
| | — |
| | 15 |
|
| Other (2) | 34 |
| | 2 |
| | (2 | ) | | 34 |
|
| Revenue from product sales | 1,528 |
| | 89 |
| | (2 | ) | | 1,615 |
|
| | | | | | | | |
| Crude oil sales | 7 |
| | — |
| | — |
| | 7 |
|
| Net sales | $ | 1,535 |
| | $ | 89 |
| | $ | (2 | ) | | $ | 1,622 |
|
September 30, 20192020 | 16
NOTES TO THE CONDENSED CONSOLIDATED FINANCIAL STATEMENTS (Continued)
(unaudited)
| | | | | | | | | | | | | | | | | | | | | | | | | | | | | | | | | | | | | | | | | | | | | | | |
| Three Months Ended September 30, 2019 | | Nine Months Ended September 30, 2019 |
| (in millions) | Petroleum | | Nitrogen Fertilizer | | Other / Elimination | | Consolidated | | Petroleum | | Nitrogen Fertilizer | | Other / Elimination | | Consolidated |
| Major Product | | | | | | | | | | | | | | | |
| Gasoline | $ | 796 | | | $ | 0 | | | $ | 0 | | | $ | 796 | | | $ | 2,285 | | | $ | 0 | | | $ | 0 | | | $ | 2,285 | |
| Distillates (1) | 692 | | | 0 | | | 0 | | | 692 | | | 2,035 | | | 0 | | | 0 | | | 2,035 | |
| Ammonia | 0 | | | 11 | | | 0 | | | 11 | | | 0 | | | 74 | | | 0 | | | 74 | |
| UAN | 0 | | | 62 | | | 0 | | | 62 | | | 0 | | | 200 | | | 0 | | | 200 | |
| Other urea products | 0 | | | 5 | | | 0 | | | 5 | | | 0 | | | 14 | | | 0 | | | 14 | |
| Freight revenue | 6 | | | 9 | | | 0 | | | 15 | | | 17 | | | 24 | | | 0 | | | 41 | |
| Other (2) | 34 | | | 2 | | | (2) | | | 34 | | | 108 | | | 6 | | | (8) | | | 106 | |
| Revenue from product sales | 1,528 | | | 89 | | | (2) | | | 1,615 | | | 4,445 | | | 318 | | | (8) | | | 4,755 | |
| | | | | | | | | | | | | | | |
| Crude oil sales | 7 | | | 0 | | | 0 | | | 7 | | | 36 | | | 0 | | | 0 | | | 36 | |
| | | | | | | | | | | | | | | |
| Net sales | $ | 1,535 | | | $ | 89 | | | $ | (2) | | | $ | 1,622 | | | $ | 4,484 | | | $ | 318 | | | $ | (8) | | | $ | 4,794 | |
| | | | | | | | | | | | | | | |
| | | | | | | | | | | | | | | |
| | | | | | | | | | | | | | | |
|
| | | | | | | | | | | | | | | |
| | Nine Months Ended September 30, 2019 |
| (in millions) | Petroleum | | Nitrogen Fertilizer | | Other / Eliminations | | Consolidated |
| Major Product | | | | | | | |
| Gasoline | $ | 2,285 |
| | $ | — |
| | $ | — |
| | $ | 2,285 |
|
| Distillates (1) | 2,035 |
| | — |
| | — |
| | 2,035 |
|
| Ammonia | — |
| | 74 |
| | — |
| | 74 |
|
| UAN | — |
| | 200 |
| | — |
| | 200 |
|
| Other urea products | — |
| | 14 |
| | — |
| | 14 |
|
| Freight revenue | 17 |
| | 24 |
| | — |
| | 41 |
|
| Other (2) | 108 |
| | 6 |
| | (8 | ) | | 106 |
|
| Revenue from product sales | 4,445 |
| | 318 |
| | (8 | ) | | 4,755 |
|
| | | | | | | | |
| Crude oil sales | 36 |
| | — |
| | — |
| | 36 |
|
| Other revenue (2) | 3 |
| | — |
| | — |
| | 3 |
|
| Net sales | $ | 4,484 |
| | $ | 318 |
| | $ | (8 | ) | | $ | 4,794 |
|
|
| | | | | | | | | | | | | | | |
| | Three Months Ended September 30, 2018 |
| (in millions) | Petroleum | | Nitrogen Fertilizer | | Other / Eliminations | | Consolidated |
| Major Product | | | | | | | |
| Gasoline | $ | 951 |
| | $ | — |
| | $ | — |
| | $ | 951 |
|
| Distillates (1) | 844 |
| | — |
| | — |
| | 844 |
|
| Ammonia | — |
| | 11 |
| | — |
| | 11 |
|
| UAN | — |
| | 53 |
| | — |
| | 53 |
|
| Other urea products | — |
| | 5 |
| | — |
| | 5 |
|
| Freight revenue | 6 |
| | 9 |
| | — |
| | 15 |
|
| Other (2) | 43 |
| | 2 |
| | (2 | ) | | 43 |
|
| Revenue from product sales | 1,844 |
| | 80 |
| | (2 | ) | | 1,922 |
|
| | | | | | | | |
| Crude oil sales | 12 |
| | — |
| | — |
| | 12 |
|
| Other revenue (2) | 1 |
| | — |
| | — |
| | 1 |
|
| Net sales | $ | 1,857 |
| | $ | 80 |
| | $ | (2 | ) | | $ | 1,935 |
|
NOTES TO THE CONDENSED CONSOLIDATED FINANCIAL STATEMENTS (Continued)
(unaudited)
|
| | | | | | | | | | | | | | | |
| | Nine Months Ended September 30, 2018 |
| (in millions) | Petroleum | | Nitrogen Fertilizer | | Other / Eliminations | | Consolidated |
| Major Product | | | | | | | |
| Gasoline | $ | 2,558 |
| | $ | — |
| | $ | — |
| | $ | 2,558 |
|
| Distillates (1) | 2,334 |
| | — |
| | — |
| | 2,334 |
|
| Ammonia | — |
| | 51 |
| | — |
| | 51 |
|
| UAN | — |
| | 157 |
| | — |
| | 157 |
|
| Other urea products | — |
| | 15 |
| | — |
| | 15 |
|
| Freight revenue | 17 |
| | 24 |
| | — |
| | 41 |
|
| Other (2) | 151 |
| | 6 |
| | (6 | ) | | 151 |
|
| Revenue from product sales | 5,060 |
| | 253 |
| | (6 | ) | | 5,307 |
|
| | | | | | | | |
| Crude oil sales | 75 |
| | — |
| | — |
| | 75 |
|
| Other revenue (2) | 4 |
| | — |
| | — |
| | 4 |
|
| Net sales | $ | 5,139 |
| | $ | 253 |
| | $ | (6 | ) | | $ | 5,386 |
|
| |
(1) | Distillates consist primarily of diesel fuel, kerosene, and jet fuel. |
| | | | | |
(2) | Other revenue consists primarily of feedstock and asphalt sales and the Cushing, OK storage tank lease revenue. See Note 5 (“Property, Plant and Equipment”) for further discussion on the Cushing, OK storage tanks. | | | | | | |
| | | | | | | |
| | | | | | | |
| | | | | | | |
| | | | | | | |
| | | | | | | |
| | | | | | | |
| | | | | | | |
| | | | | | | |
| | | | | | | |
| | | | | | | |
| | | | | | | |
| | | | | | | |
(1)Distillates consist primarily of diesel fuel, kerosene, and jet fuel.
(2)Other revenue consists primarily of feedstock and asphalt sales.
Petroleum Segment
The Petroleum Segment’s revenue from product sales is recorded upon delivery to customers, which is the point at which title is transferred and the customer has assumed the risk of loss. This generally takes place as product passes into the pipeline, as a product transfer order occurs within a pipeline system, or as product enters equipment or locations supplied or designated by the customer. The Petroleum Segment has elected to apply the sales tax practical expedient, whereby qualifyingQualifying excise and other taxes collected from the Petroleum Segment’s customers and remitted to governmental authorities are not included in reported revenues.
Many of the Petroleum Segment’s contracts have index-based pricing which is considered variable consideration that should be estimated in determining the transaction price. The Petroleum Segment determined that it does not need to estimate the variable consideration because the uncertainty related to the consideration is resolved on the pricing date or the date when the product is delivered.
The Petroleum Segment may incur broker commissions or transportation costs prior to product transfer on some of its sales. The Petroleum Segment has elected to apply the practical expedient allowing it to expense theexpenses these broker costs, since the contract durations are less than a year in length.year. Transportation costs are accounted for as fulfillment costs and are expensed as incurred since they do not meet the requirement for capitalization.
The Petroleum Segment’s contracts with its customers state the terms of the sale, including the description, quantity, and price of each product sold. Depending on the product sold, payment from customers is generally due in full within 2 to 32 days of product delivery or invoice date. The Petroleum Segment’s contracts with customers commonly include a provision which states that the Petroleum Segment will accept customer returns of off-spec product and refund the customer (or provide on-spec product). Typically, if the customer is not satisfied with the product, the price is adjusted downward instead of the product being returned or exchanged. The Petroleum Segment has determined that product returns or refunds are very rare and will account for them as they occur. The Petroleum Segment generally provides no warranty other than the implicit promise that goods delivered are free of liens and encumbrances and meet the agreed upon specification. The Petroleum Segment has determined that product returns or refunds are very rare and will account for them as they occur.
Freight revenue recognized by the Petroleum Segment is primarily tariff and line loss charges rebilled to customers to reimburse the Petroleum Segment for expenses incurred from a pipeline operator. An offsetting expense is included in Cost of materials and other.
NOTES TO THE CONDENSED CONSOLIDATED FINANCIAL STATEMENTS (Continued)
(unaudited)
Nitrogen Fertilizer Segment
The Nitrogen Fertilizer Segment sells its products on a wholesale basis under a contract or by purchase order. The Nitrogen Fertilizer Segment’s contracts with customers generally contain fixed pricing and most have terms of less than one year. The Nitrogen Fertilizer Segment recognizes revenue at the point in time at which the customer obtains control of the product, which is generally upon delivery and acceptance by the customer. The customer acceptance point is stated in the contract and may be
NOTES TO THE CONDENSED CONSOLIDATED FINANCIAL STATEMENTS (Continued)
(unaudited)
at one of the Nitrogen Fertilizer Segment’s manufacturing facilities, at one of the Nitrogen Fertilizer Segment’s off-site loading facilities, or at the customer’s designated facility. Freight revenue recognized by the nitrogen fertilizer segmentNitrogen Fertilizer Segment represents the pass-through finished goods delivery costs incurred prior to customer acceptance and is reimbursed by customers. An offsetting expense for freight is included in Cost of materials and other. Qualifying excise and other taxes collected from the Nitrogen Fertilizer Segment’s customers and remitted to governmental authorities are not included in reported revenues.
Depending on the product sold and the type of contract, payments from customers are generally either due prior to delivery or within 15 to 30 days of product delivery.
The Nitrogen Fertilizer Segment generally provides no warranty other than the implicit promise that goods delivered are free of liens and encumbrances and meet the agreed upon specifications. Product returns are rare, and as such, the Nitrogen Fertilizer Segment does not record a specific warranty reserve or consider activities related to such warranty, if any, to be a separate performance obligation.
The Nitrogen Fertilizer Segment has an immaterial amount of variable consideration for contracts with an original duration of less than a year. A small portion of the Nitrogen Fertilizer Segment’s revenue includes contracts extending beyond one year, some of which contain variable pricing in which the majority of the variability is attributed to the market-based pricing. The Nitrogen Fertilizer Segment’s contracts do not contain a significant financing component.
The Nitrogen Fertilizer Segment has an immaterial amount of fee-based revenue, included in other revenue in the table above, that is recognized based on the net amount of the proceeds received, consistent with prior accounting practice.
Transaction price allocated to remaining performance obligations
As of September 30, 2019, CVR Partners2020, the Nitrogen Fertilizer Segment had approximately $7 million of remaining performance obligations for contracts with an original expected duration of more than one year. CVR PartnersThe Nitrogen Fertilizer Segment expects to recognize approximately 20%$1 million of these performance obligations as revenue by the end of 2019,2020, an additional 40%$3 million in 2020,2021, and the remaining balance thereafter. The Nitrogen Fertilizer Segment has elected to not disclose the amount of transaction price allocated to remaining performance obligations for contracts with an original expected duration of less than one year. The Nitrogen Fertilizer Segment has elected to not disclose variable consideration allocated to wholly unsatisfied performance obligations that are based on market prices that have not yet been determined.
Contract balances
The Nitrogen Fertilizer Segment’s deferred revenue is a contract liability that primarily relates to nitrogen fertilizer sales contracts requiring customer prepayment prior to product delivery to guarantee a price and supply of nitrogen fertilizer. Deferred revenue is recorded at the point in time in which a prepaid contract is legally enforceable and the associated right to consideration is unconditional prior to transferring product to the customer. An associated receivable is recorded for uncollected prepaid contract amounts. Contracts requiring prepayment are generally short-term in nature and, as discussed above, revenue is recognized at the point in time in which the customer obtains control of the product.
A summary of the Nitrogen Fertilizer Segment’s deferred revenue activity during the nine months ended September 30, 2020 is presented below:
| | | | | |
| (in millions) | |
| Balance at December 31, 2019 | $ | 28 | |
| Add: | |
| New prepay contracts entered into during the period (1) | 28 | |
| Less: | |
| Revenue recognized that was included in the contract liability balance at the beginning of the period | (27) | |
| Revenue recognized related to contracts entered into during the period | (17) | |
| |
| Balance at September 30, 2020 | $ | 12 | |
(1) Includes $26 million where payment associated with prepaid contracts was collected as of September 30, 2020.
September 30, 20192020 | 1918
NOTES TO THE CONDENSED CONSOLIDATED FINANCIAL STATEMENTS (Continued)
(unaudited)
A summary of CVR Partners’ deferred revenue activity during the nine months ended September 30, 2019 is presented below:
|
| | | |
| (in millions) | |
| Balance at December 31, 2018 | $ | 69 |
|
| Add: | |
| New prepay contracts entered into during the period (1) | 24 |
|
| Less: | |
| Revenue recognized that was included in the contract liability balance at the beginning of the period | 68 |
|
| Revenue recognized related to contracts entered into during the period | 8 |
|
| Other changes | 1 |
|
| Balance at September 30, 2019 | $ | 16 |
|
| |
(1) | Includes $24 million where payment associated with prepaid contracts was collected. |
(9)(11) Derivative Financial Instruments, Investments and Fair Value Measurements
Derivative Financial Instruments
Our segments are subject to price fluctuations caused by supply conditions, weather, economic conditions, interest rate fluctuations, and other factors. To manage price risk on crude oil and other inventories and to fix margins on certain future production, the Petroleum Segment from time to time enters into various commodity derivative transactions. On a regular basis, the Company enters into commodity contracts with counterparties for the purchases or sale of crude oil, blendstocks, various finished products, and renewable identification numbers (“RINs”).RINs. The contracts usually qualify for the normal purchase normal sale exception and follow the accrual method of accounting. All other derivative instruments are recorded at fair value using mark-to-market accounting on a periodic basis utilizing third partythird-party pricing.
The Petroleum Segment holds derivative instruments, such as exchange-traded crude oil futures and certain over-the-counter forward swap agreements, which it believes provide an economic hedge on future transactions, but such instruments are not designated as hedges under GAAP. There are no premiums paid or received at inception of the derivative contracts or upon settlement. The Petroleum Segment may enter into forward purchase or sale contracts associated with RINs. As of September 30, 2019,2020, the Petroleum Segment had open fixed-price commitments to purchase 38sell a net 62 million RINs.
Commodity derivatives include commodity swaps and forward purchase and sale commitments. There were 0less than a million outstanding commodity swap positions as of September 30, 2019.2020. There were approximately 53 million forward purchase commitments and 12 million forward sale commitments as of September 30, 2019.2020.
The following outlines the gains (losses) recognized on the Company’s derivative activities, all of which are recorded in Cost of materials and other on the condensed consolidated statements of operations:
| | | | | | | | | | | | | | | | | | | | | | | |
| Gain on Derivatives |
| Three Months Ended
September 30, | | Nine Months Ended
September 30, |
| (in millions) | 2020 | | 2019 | | 2020 | | 2019 |
| Forward purchases and sales contracts, net | $ | 4 | | | $ | 17 | | | $ | 55 | | | $ | 37 | |
| Commodity swap instruments | 1 | | | 0 | | | 5 | | | 0 | |
| Futures contracts | 0 | | | 1 | | | 10 | | | 1 | |
| Total gain on derivatives, net | $ | 5 | | | $ | 18 | | | $ | 70 | | | $ | 38 | |
|
| | | | | | | | | | | | | | | |
| Gain (Loss) on Derivatives |
| | Three Months Ended
September 30, | | Nine Months Ended
September 30, |
| (in millions) | 2019 | | 2018 | | 2019 | | 2018 |
| Forward purchases and sales, net | $ | 17 |
| | $ | 4 |
| | $ | 37 |
| | $ | 33 |
|
| Swaps | — |
| | — |
| | — |
| | 43 |
|
| Futures | 1 |
| | 1 |
| | 1 |
| | (1 | ) |
| Total gain on derivatives, net | $ | 18 |
| | $ | 5 |
| | $ | 38 |
| | $ | 75 |
|
NOTES TO THE CONDENSED CONSOLIDATED FINANCIAL STATEMENTS (Continued)
(unaudited)
The following outlines our open commodity derivative instruments, which are classified as Prepaid expenses and other current assets andor Other current liabilities on the condensed consolidated balance sheets:
| | | | | | | | | | | |
| Open Commodity Derivative Instruments |
| (in millions of barrels) | September 30, 2020 | | December 31, 2019 |
| | | |
| | | |
| | | |
| | | |
| | | |
| | | |
| Forward purchases and sales contracts, net: | | | |
| Canadian crude oil | 6 | | | 5 | |
|
| | | | | |
| Open Commodity Derivative Instruments |
| (in millions of barrels) | September 30, 2019 | | December 31, 2018 |
| Forward Contracts: | | | |
| Canadian crude oil | 6 |
| | 2 |
|
Offsetting Assets and Liabilities
The Company elected to offset the fair value amounts recognized for multiple derivative contracts executed with the same counterparty. These amounts are recognized as current assets and current liabilities within the Prepaid expenses and other current assets and Other current liabilities financial statement line items, respectively, in the condensed consolidated balance sheets as follows:
| | | | | | | | | | | | | | | | | | | | | | | |
| Derivative Assets | | Derivative Liabilities |
| (in millions) | September 30, 2020 | | December 31, 2019 | | September 30, 2020 | | December 31, 2019 |
| Commodity derivatives | $ | 7 | | | $ | 3 | | | $ | (1) | | | $ | (11) | |
| | | | | | | |
| Less: Counterparty netting | (1) | | | (3) | | | 1 | | | 3 | |
| Total net fair value of derivatives | $ | 6 | | | $ | 0 | | | $ | 0 | | | $ | (8) | |
|
| | | | | | | | | | | | | | | |
| | Derivative Assets | | Derivative Liabilities |
| (in millions) | September 30, 2019 | | December 31, 2018 | | September 30, 2019 | | December 31, 2018 |
| Commodity Derivatives | $ | 17 |
| | $ | 8 |
| | $ | 1 |
| | $ | 1 |
|
| Less: Counterparty Netting | (1 | ) | | (1 | ) | | (1 | ) | | (1 | ) |
| Total Net Fair Value of Derivatives | $ | 16 |
| | $ | 7 |
| | $ | — |
| | $ | — |
|
NOTES TO THE CONDENSED CONSOLIDATED FINANCIAL STATEMENTS (Continued)
(unaudited)
Investments
Investments consist of equity securities, which are reported at fair value in our condensed consolidated balance sheets. These investments are considered trading securities. Investment loss from marketable securities consists of the following:
| | | | | | | | | | | | | | | | | | | | | | | |
| Three Months Ended
September 30, | | Nine Months Ended
September 30, |
| (in millions) | 2020 | | 2019 | | 2020 | | 2019 |
| Dividend income | $ | 3 | | | $ | 0 | | | $ | 7 | | | $ | 0 | |
| Unrealized (loss) gain | (68) | | | 0 | | | (20) | | | 0 | |
| Investment loss from marketable securities | $ | (65) | | | $ | 0 | | | $ | (13) | | | $ | 0 | |
Fair Value Measurements
In accordance with FASB ASC Topic 820 — Fair Value Measurements and Disclosures (“ASC 820”), the Company utilizes the market approach to measure fair value for its financial assets and liabilities. The market approach uses prices and other relevant information generated by market transactions involving identical or comparable assets, liabilities or a group of assets or liabilities, such as a business.
ASC 820 utilizes a fair value hierarchy that prioritizes the inputs to valuation techniques used to measure fair value into three broad levels. The following is a brief description of those three levels:
•Level 1 — Quoted prices in active markets for identical assets or liabilities
•Level 2 — Other significant observable inputs (including quoted prices in active markets for similar assets or liabilities)
•Level 3 — Significant unobservable inputs (including the Company’s own assumptions in determining the fair value)
The following tables set forth the assets and liabilities measured or disclosed at fair value on a recurring basis, by input level, as of September 30, 20192020 and December 31, 2018:2019:
| | | | | | | | | | | | | | | | | | | | | | | |
| September 30, 2020 |
| (in millions) | Level 1 | | Level 2 | | Level 3 | | Total |
| Location and Description | | | | | | | |
| | | | | | | |
| Prepaid expenses and other current assets (investments) | $ | 119 | | | $ | 0 | | | $ | 0 | | | $ | 119 | |
| Prepaid expenses and other current assets (commodity derivatives) | 0 | | | 6 | | | 0 | | | 6 | |
| | | | | | | |
| Total Assets | 119 | | | 6 | | | 0 | | | 125 | |
| | | | | | | |
| | | | | | | |
| Other current liabilities (RFS obligation) | 0 | | | (83) | | | 0 | | | (83) | |
| Long-term debt and finance lease obligations (senior notes) | 0 | | | (1,459) | | | 0 | | | (1,459) | |
| Total Liabilities | $ | 0 | | | $ | (1,542) | | | $ | 0 | | | $ | (1,542) | |
|
| | | | | | | | | | | | | | | |
| | September 30, 2019 |
| (in millions) | Level 1 | | Level 2 | | Level 3 | | Total |
| Location and Description | | | | | | | |
| Prepaid expenses and other current assets (commodity derivatives) | $ | — |
| | $ | 17 |
| | $ | — |
| | $ | 17 |
|
| Total Assets | — |
| | 17 |
| | — |
| | 17 |
|
| Other current liabilities (Renewable Fuel Standard “RFS” obligation) | — |
| | (9 | ) | | — |
| | (9 | ) |
| Total Liabilities | $ | — |
| | $ | (9 | ) | | $ | — |
| | $ | (9 | ) |
NOTES TO THE CONDENSED CONSOLIDATED FINANCIAL STATEMENTS (Continued)
(unaudited)
|
| | | | | | | | | | | | | | | |
| | December 31, 2018 |
| (in millions) | Level 1 | | Level 2 | | Level 3 | | Total |
| Location and Description | | | | | | | |
| Prepaid expenses and other current assets (commodity derivatives) | — |
| | 7 |
| | — |
| | 7 |
|
| Total Assets | $ | — |
| | $ | 7 |
| | $ | — |
| | $ | 7 |
|
| Other current liabilities (RFS obligation) | — |
| | (2 | ) | | — |
| | (2 | ) |
| Total Liabilities | $ | — |
| | $ | (2 | ) | | $ | — |
| | $ | (2 | ) |
| | | | | | | | | | | | | | | | | | | | | | | |
| December 31, 2019 |
| (in millions) | Level 1 | | Level 2 | | Level 3 | | Total |
| Location and Description | | | | | | | |
| | | | | | | |
| | | | | | | |
| | | | | | | |
| | | | | | | |
| | | | | | | |
| Other current liabilities (commodity derivatives) | $ | 0 | | | $ | (8) | | | $ | 0 | | | $ | (8) | |
| | | | | | | |
| Other current liabilities (RFS obligation) | 0 | | | (7) | | | 0 | | | (7) | |
| Long-term debt and finance lease obligations (senior notes) | 0 | | | (1,180) | | | 0 | | | (1,180) | |
| Total Liabilities | $ | 0 | | | $ | (1,195) | | | $ | 0 | | | $ | (1,195) | |
As of September 30, 20192020 and December 31, 2018,2019, the only financial assets and liabilities that are measured at fair value on a recurring basis are the Company’s cash equivalents, restricted cash, investments, derivative instruments, long-term debt,
NOTES TO THE CONDENSED CONSOLIDATED FINANCIAL STATEMENTS (Continued)
(unaudited)
and the RFS obligation. The Petroleum Segment’s commodity derivative contracts and RFS obligation, which use fair value measurements and are valued using broker quoted market prices of similar instruments, are considered Level 2 inputs. The Company had no transfers of assets or liabilities between any of the above levels during the nine months ended September 30, 2019.
(10)
(12) Share-Based Compensation
A summary of compensation expense during the three and nine months ended September 30, 20192020 and 20182019 is presented below:
| | | | | | | | | | | | | | | | | | | | | | | |
|
| Three Months Ended
September 30, | | Nine Months Ended
September 30, |
| (in millions) | 2020 | | 2019 | | 2020 | | 2019 |
| | | | | | | |
| CVR Refining - Phantom Unit Awards | 0 | | | 1 | | | $ | 0 | | | $ | 3 | |
| CVR Partners LTIP - Phantom Unit Awards | 0 | | | 0 | | | 0 | | | 2 | |
| Incentive Unit Awards | (1) | | | 2 | | | 0 | | | 9 | |
| Total Share-Based Compensation Expense | $ | (1) | | | $ | 3 | | | $ | 0 | | | $ | 14 | |
|
| | | | | | | | | | | | | | | |
| | Three Months Ended
September 30, | | Nine Months Ended
September 30, |
| (in millions) | 2019 | | 2018 | | 2019 | | 2018 |
| Performance Unit Awards | $ | — |
| | $ | 1 |
| | $ | — |
| | $ | 3 |
|
| CVR Refining - Phantom Unit Awards | 1 |
| | 1 |
| | 3 |
| | 8 |
|
| CVR Partners LTIP - Phantom Unit Awards | — |
| | 1 |
| | 2 |
| | 2 |
|
| Incentive Unit Awards | 2 |
| | 2 |
| | 9 |
| | 4 |
|
| Total Share-Based Compensation Expense | $ | 3 |
| | $ | 5 |
| | $ | 14 |
| | $ | 17 |
|
(11)(13) Commitments and Contingencies
Except as described below, there have been no material changes in the Company’s commitments and contingencies disclosed in the 20182019 Form 10-K or the Recast Form 8-K for 2018.10-K. In the ordinary course of business, the Company may become party to lawsuits, administrative proceedings, and governmental investigations, including environmental, regulatory, and other matters. The outcome of these matters cannot always be predicted accurately, but the Company accrues liabilities for these matters if the Company has determined that it is probable a loss has been incurred and the loss can be reasonably estimated. While it is not possible to predict the outcome of such proceedings, if one or more of them were decided against us, the Company believes there would be no material impact on its consolidated financial statements.
The Company continues to monitor its contractual arrangements and customer, vendor, and supplier relationships to determine whether and to what extent, if any, the impacts of the COVID-19 pandemic or recent crude oil or refined product price volatility will impair or excuse the performance of the Company or its subsidiaries or their customers, vendors, or suppliers under existing agreements. As of September 30, 2020, the Company had not experienced a material financial impact from any actual or threatened impairment of or excuse in its or others’ performance under such agreements.
Crude Oil Supply Agreement
On August 31, 2012, an indirect, wholly-owned subsidiary of the Petroleum Segment and Vitol Inc. (“Vitol”) entered into an Amended and Restated Crude Oil Supply Agreement (as amended, the “Crude Oil Supply Agreement”). Under the Crude Oil Supply Agreement, Vitol supplies the Petroleum Segment with crude oil and intermediation logistics helping to reduce the amount of inventory held at a certain pointlocations and mitigate crude oil pricing risk. Volumes contracted under the Crude Oil Supply Agreement, as a percentage of the total crude oil purchases (in barrels), was approximately 38%33% and 44%38% for the three months ended September 30, 20192020 and 2018,2019, respectively, and 39%30% and 41%39% for the nine months ended September 30, 20192020 and 2018,2019, respectively. The Crude Oil Supply Agreement, which currently extends through December 31, 2021, automatically renews for successive one-year terms (each such term, a “Renewal Term”) unless either party provides the other with notice of nonrenewal at least 180 days prior to expiration of any Renewal Term.
Renewable Fuel Standard (“RFS”)RFS
The Petroleum Segment is subject to the RFS of the Environmental Protection Agency (“EPA”) that require refiners to either blend renewable fuels in with their transportation fuels or purchase renewable fuel credits, known as RINs, in lieu of blending.
NOTES TO THE CONDENSED CONSOLIDATED FINANCIAL STATEMENTS (Continued)
(unaudited)
The Petroleum Segment is not able to blend the substantial majority of its transportation fuels and has to purchase RINs on the open market, and may have to obtain waiver credits for cellulosic biofuels from the EPA, in order to comply with the RFS.
For the three months ended September 30, 2020 and 2019, the Company recognized expense of approximately $36 million and a benefit of $2 million, respectively, and for the nine months ended September 30, 20192020 and 2018,2019, the Company recognized
expense of approximately $71 million and $31 million, ($2 million benefit for the three months ended September 30, 2019) and $47 million ($20 million expense for the three months ended September 30, 2018), respectively, for the Petroleum Segment’s compliance with the RFS. The recognized amounts are included within Cost of materials and other in the condensed consolidated statements of operations. The Company’s costs to comply with the RFS include the recognition of the Petroleum Segment’s biofuel blending obligation based on the purchased cost of RINs acquired,or the impactfair value of recognizing the Petroleum Segment’s uncommitted biofuel blending obligation at fair valuefor which RINs have not been purchased, based on market prices at each reporting date, and the valuation change of RINs acquired in excess of its RFS obligation as of the reporting date.
Tax Matters
On March 27, 2020, the President signed into law the Coronavirus Aid, Relief, and Economic Security Act (the “CARES Act”), an economic stimulus package in response to the COVID-19 pandemic. The CARES Act contains several corporate income tax provisions, including a five-year carry back of net operating losses generated in tax years 2018, 2019, and 2020, an increase in the amount of deductible interest and deferral of certain employer payroll taxes otherwise required to be paid in 2020. The Company will continue to monitor the impact the CARES Act and any related legislation will have on its current and certain prior period tax returns.
Litigation
The U.S. Attorney’s office for the Southern District of New York contacted CVR Energy in September 2017 seeking production of information pertaining to CVR Refining’s, CVR Energy’s and Mr. Carl C. Icahn’s activities relating to the RFS and Mr. Icahn’s former role as an advisor to the President. WePresident of the United States. CVR Energy cooperated with the request and provided information in response to the subpoena. The U.S. Attorney’s office has not made any claims or allegations against usCVR Energy or Mr. Icahn. We maintainCVR Energy believes it maintains a strong compliance program and, while no assurances can be made, we doCVR Energy does not believe this inquiry will have a material impact on its business, financial condition, results of operations or cash flows.
On August 21, 2018,In June and October 2020, Coffeyville Resources Refining and& Marketing, LLC (“CRRM”), a subsidiary of CVRR, received a demand letter and related documents from the United States Department of Justice (“DOJ”) on(on behalf of the EPAEPA) and the Kansas Department of Health and Environment (“KDHE”) alleging violations of the Clean Air Act (“CAA”) and aCRRM’s 2012 Consent Decree between CRRM, the United States (on behalf of EPA) and KDHE at(“CD”) relating to CRRM’s Coffeyville refinery. In September 2018,refinery (the “Coffeyville Refinery”), and seeking certain penalties in connection therewith. CRRM executedis evaluating this matter, including the dispute resolution and related provisions of the CD regarding such allegations. Pursuant to the CD, the Company has deposited funds into a tolling agreement withcommercial escrow account pending resolution of disputed claims. These funds are legally restricted for use and are included within Prepaid expenses and other current assets on the DOJ and KDHE extending time for negotiation regarding the agencies’ allegations through March 2019, and this tolling agreement was extended in March 2019 through November 30, 2019.condensed consolidated balance sheets. At this time, this matter has not had a material impact on the Company’s financial position, results of operations, or cash flows, and the Company cannot yet reasonably estimate the potential penalties, costs, fines or other expendituresfull impact that may result from this matter or any subsequent enforcement or litigation relating theretothereto.
In April 2020, the U.S. Court of Appeals for the 10th Circuit (the “10th Circuit”) denied the petitions of Wynnewood Refining Company, LLC (“WRC”) and therefore,others seeking rehearing en banc of the Company cannot determine ifJanuary 2020 decision of a three-judge panel of the ultimate outcome10th Circuit vacating 3 small refinery exemptions (“SREs”) under the RFS program under the CAA, including 1 issued to WRC’s Wynnewood refinery (the “Wynnewood Refinery”) for 2017, and remanding the matter back to the EPA for further proceedings. WRC filed a writ of certiorari with the Supreme Court of the United States (the “Supreme Court”) on September 4, 2020. As it is not yet clear whether this matter will havebe heard by the Supreme Court, or what steps the EPA will take with respect to SREs, we cannot currently estimate the outcome, impact, or timing of resolution of this matter.
On April 6, 2020, a material impact onlawsuit was filed in the Company’s financial position, results of operations or cash flows.
In 2008, Coffeyville Resources Nitrogen Fertilizer LLC (“CRNF”), a subsidiary of CVR Partners LP, protested the reclassification and reassessment by Montgomery County, Kansas (the “County”) of CRNF’s nitrogen fertilizer plant following expiration of its 10 year property tax abatement that expired on December 31, 2007, which reclassification and reassessment resulted in an increase in CRNF’s annual property tax expense in excess of $10 million per yearUnited States District Court for the 2008 through 2012 tax years. DespiteSouthern District of New York against the Company, CVR Refining and its protest, CRNF fully accrued and paid these property taxes. In February 2013, the County and CRNF agreed to a settlement for tax years 2009 through 2012 which resulted in decreased property taxes through 2017, leaving 2008 in dispute. In 2013, the Kansas Court of Appeals overturned an adverse ruling of the Kansas Board of Tax Appeals (“BOTA”) and instructed BOTA to classify each CRNF asset on an asset-by-asset basis. In March 2015, BOTA concluded its classification and determined a substantial majority of CRNF’s assets in dispute were personal property for the 2008 tax year. In September 2018, the Kansas Court of Appeals upheld BOTA’s property tax determinations in CRNF’s favor. In October 2018, the County petitioned the Kansas Supreme Court to review the Court of Appeals determination. Subsequent briefs were filed by CRNF and the County. In April 2019, CRNF and the County executed an agreement under which the County agreed to withdraw its petition to the Kansas Supreme Court and CRNF is expected to recover $8 million through favorable property tax assessments from 2019 through 2028, subject to the terms of the settlement agreement.
During 2019, CVR Energy, CVR Refining,general partner, CVR Refining Holdings, IEP, and certain directors and affiliates have been named in 9 lawsuits filed in the Court of Chancery of the State of Delaware (“Chancery Court”)Company’s Chief Executive Officer by purported former unitholders of CVR Refining on behalf of themselves and an alleged class of similarly situated unitholders (the “Call Option Lawsuits”). The Call Option Lawsuits primarily allege breach of contract, tortious interference and breach of the implied covenant of good faith and fair dealing and seek monetary damages and attorneys’ fees, among other remedies, relating to the Company’s exercise of the call option under the CVR Refining Amended and Restated Agreement of Limited Partnership assigned to it by CVR Refining’s general partner. The Call Option Lawsuits have beenThis lawsuit, which primarily alleges violations of Sections 10(b) and 20(a) of the Exchange Act and Rule 10b-5 thereunder and seeks monetary damages and attorney’s fees, among other remedies, is in addition to the 9 lawsuits consolidated in the Court of Chancery Court and are inof the early stagesState of litigation.Delaware related to the Company’s exercise of the call option. The Company believes the Call Option Lawsuitsall of these lawsuits are without merit and intends to vigorously defend against them.
As these lawsuits are in the early stages of litigation, the Company cannot determine at this time the outcome of the lawsuits, including whether the outcome would have a material impact on the Company’s financial position, results of operations, or cash flows. September 30, 2019 | 23
NOTES TO THE CONDENSED CONSOLIDATED FINANCIAL STATEMENTS (Continued)
(unaudited)
(12)(14) Business Segments
CVR Energy’s revenues are derived from 2 operating segments: the Petroleum Segment and the Nitrogen Fertilizer Segment. The Company evaluates the performance of its segments based primarily on segment operating income and EBITDA.Earnings Before Interest, Taxes, Depreciation, and Amortization (“EBITDA”). For the purposes of the operating segment disclosure, the Company presents operating income as it is the most comparable measure to the amounts presented on the condensed consolidated statementstatements of operations. The other amounts reflect intercompany eliminations, corporate cash and cash equivalents, income tax activities, and other corporate activities that are not allocated to the operating segments.
The following table summarizes certain operating results and capital expenditures information by segment:
| | | | | | | | | | | | | | | | | | | | | | | |
| Three Months Ended
September 30, | | Nine Months Ended
September 30, |
| (in millions) | 2020 | | 2019 | | 2020 | | 2019 |
| Net sales | | | | | | | |
| Petroleum | $ | 927 | | | $ | 1,535 | | | $ | 2,556 | | | $ | 4,484 | |
| Nitrogen Fertilizer | 79 | | | 89 | | | 260 | | | 318 | |
| Other | (1) | | | (2) | | | (5) | | | (8) | |
| Total | $ | 1,005 | | | $ | 1,622 | | | $ | 2,811 | | | $ | 4,794 | |
| | | | | | | |
| | | | | | | |
| | | | | | | |
| | | | | | | |
| | | | | | | |
| | | | | | | |
| | | | | | | |
| | | | | | | |
| | | | | | | |
| | | | | | | |
| Operating (loss) income | | | | | | | |
| Petroleum | $ | (39) | | | $ | 173 | | | $ | (161) | | | $ | 492 | |
| Nitrogen Fertilizer | (3) | | | (8) | | | (34) | | | 36 | |
| Other | (4) | | | (6) | | | (11) | | | (17) | |
| Total | (46) | | | 159 | | | (206) | | | 511 | |
| Interest expense, net | (31) | | | (26) | | | (98) | | | (77) | |
| Investment loss from marketable securities | (65) | | | 0 | | | (13) | | | 0 | |
| Other income, net | 3 | | | 5 | | | 3 | | | 10 | |
| (Loss) income before income tax expense | $ | (139) | | | $ | 138 | | | $ | (314) | | | $ | 444 | |
| Depreciation and amortization | | | | | | | |
| Petroleum | $ | 51 | | | $ | 51 | | | $ | 150 | | | $ | 152 | |
| Nitrogen Fertilizer | 18 | | | 18 | | | 57 | | | 60 | |
| Other | 0 | | | 2 | | | 1 | | | 5 | |
| Total | $ | 69 | | | $ | 71 | | | $ | 208 | | | $ | 217 | |
| Capital expenditures (1) | | | | | | | |
| Petroleum | $ | 17 | | | $ | 27 | | | $ | 80 | | | $ | 65 | |
| Nitrogen Fertilizer | 5 | | | 7 | | | 13 | | | 12 | |
| Other | 1 | | | 0 | | | 3 | | | 4 | |
| Total | $ | 23 | | | $ | 34 | | | $ | 96 | | | $ | 81 | |
|
| | | | | | | | | | | | | | | |
| | Three Months Ended
September 30, | | Nine Months Ended
September 30, |
| (in millions) | 2019 | | 2018 | | 2019 | | 2018 |
| Net sales | | | | | | | |
| Petroleum | $ | 1,535 |
| | $ | 1,857 |
| | $ | 4,484 |
| | $ | 5,139 |
|
| Nitrogen Fertilizer | 89 |
| | 80 |
| | 318 |
| | 253 |
|
| Other | (2 | ) | | (2 | ) | | (8 | ) | | (6 | ) |
| Total | $ | 1,622 |
| | $ | 1,935 |
| | $ | 4,794 |
| | $ | 5,386 |
|
| Operating Income | | | | | | | |
| Petroleum | $ | 173 |
| | $ | 167 |
| | $ | 492 |
| | $ | 424 |
|
| Nitrogen Fertilizer | (8 | ) | | 3 |
| | 36 |
| | (2 | ) |
| Other | (6 | ) | | (4 | ) | | (17 | ) | | (13 | ) |
| Total | 159 |
| | 166 |
| | 511 |
| | 409 |
|
| Interest expense, net | (26 | ) | | (26 | ) | | (77 | ) | | (79 | ) |
| Other income, net | 5 |
| | 3 |
| | 10 |
| | 6 |
|
| Income before income taxes | $ | 138 |
| | $ | 143 |
| | $ | 444 |
| | $ | 336 |
|
| Depreciation and amortization | | | | | | | |
| Petroleum | $ | 51 |
| | $ | 49 |
| | $ | 152 |
| | $ | 146 |
|
| Nitrogen Fertilizer | 18 |
| | 16 |
| | 60 |
| | 53 |
|
| Other | 2 |
| | 1 |
| | 5 |
| | 5 |
|
| Total | $ | 71 |
| | $ | 66 |
| | $ | 217 |
| | $ | 204 |
|
| Capital expenditures (1) | | | | | | | |
| Petroleum | $ | 27 |
| | $ | 22 |
| | $ | 65 |
| | $ | 51 |
|
| Nitrogen Fertilizer | 7 |
| | 5 |
| | 12 |
| | 16 |
|
| Other | — |
| | 1 |
| | 4 |
| | 3 |
|
| Total | $ | 34 |
| | $ | 28 |
| | $ | 81 |
| | $ | 70 |
|
The following table summarizes total assets by segment:
| | | | | | | | | | | |
| (in millions) | September 30, 2020 | | December 31, 2019 |
| | | |
| Petroleum | $ | 2,919 | | | $ | 3,187 | |
| Nitrogen Fertilizer | 1,047 | | | 1,138 | |
| Other (2) | (90) | | | (420) | |
| Total Assets | $ | 3,876 | | | $ | 3,905 | |
| | | |
| | | |
| | | |
| | | |
| | | |
| | | |
|
| | | | | | | |
| (in millions) | September 30, 2019 | | December 31, 2018 |
| Petroleum | $ | 3,076 |
| | $ | 2,453 |
|
| Nitrogen Fertilizer | 1,180 |
| | 1,254 |
|
| Other (2) | (294 | ) | | 293 |
|
| Total Assets | $ | 3,962 |
| | $ | 4,000 |
|
(1)Capital expenditures are shown exclusive of turnarounds.capitalized turnaround expenditures.
(2)Includes elimination of intercompany assets.assets and net cash proceeds from the Notes issued during the nine months ended September 30, 2020.
September 30, 20192020 | 2421
NOTES TO THE CONDENSED CONSOLIDATED FINANCIAL STATEMENTS (Continued)
(unaudited)
(13)(15) Supplemental Cash Flow Information
Cash flows related to taxes, interest, leases, and capital expenditures included in accounts payable were as follows:
| | | | | | | | | | | |
| Nine Months Ended
September 30, |
| (in millions) | 2020 | | 2019 |
| Supplemental disclosures: | | | |
| Cash (received for income taxes, net of payments) paid for income taxes, net of refunds | $ | (2) | | | $ | 57 | |
| Cash paid for interest | 81 | | | 55 | |
| Cash paid for amounts included in the measurement of lease liabilities: | | | |
| Operating cash flows from operating leases | 12 | | | 12 | |
| Operating cash flows from finance leases | 4 | | | 5 | |
| Financing cash flows from finance leases | 4 | | | 4 | |
| Non-cash investing activities: | | | |
| | | |
| Change in capital expenditures included in accounts payable (1) | (5) | | | (4) | |
| | | |
|
| | | | | | | |
| | Nine Months Ended
September 30, |
| (in millions) | 2019 | | 2018 |
| Supplemental disclosures: | | | |
| Cash paid for income taxes, net of refunds | $ | 57 |
| | $ | 13 |
|
| Cash paid for interest | 55 |
| | 55 |
|
| Cash paid for amounts included in the measurement of lease liabilities (1): | | | |
| Operating cash flows from operating leases | 12 |
| | |
| Operating cash flows from finance leases | 5 |
| | |
| Financing cash flows from finance leases | 4 |
| | |
| Non-cash investing activities: | | | |
| Change in capital expenditures included in accounts payable | (4 | ) | | 2 |
|
(1)Capital expenditures are shown exclusive of capitalized turnaround expenditures.
Cash, cash equivalents and restricted cash consisted of the following:
| | | | | | | | | | | |
| (in millions) | September 30, 2020 | | December 31, 2019 |
| Cash and cash equivalents | $ | 672 | | | $ | 652 | |
| Restricted cash (2) | 7 | | | 0 | |
| Cash, cash equivalents and restricted cash | $ | 679 | | | $ | 652 | |
| |
(1) | The lease standard was adopted on January 1, 2019 on a prospective basis. Therefore, only 2019 disclosures are applicable to be included within the table above. See Note 3 (“Recent Accounting Pronouncements and Accounting Changes”). |
(14)(2)The restricted cash balance is included within Prepaid expenses and other current assets on the condensed consolidated balance sheets.
(16) Related Party Transactions
Activity associated with the Company’s related party arrangements for the three and nine months ended September 30, 20192020 and 20182019 is summarized below:
Expenses from related parties
| | | | | | | | | | | | | | | | | | | | | | | |
| Three Months Ended
September 30, | | Nine Months Ended
September 30, |
| (in millions) | 2020 | | 2019 | | 2020 | | 2019 |
| Cost of materials and other | | | | | | | |
| Joint Venture Transportation Agreement: | | | | | | | |
| Enable | $ | 3 | | | $ | 3 | | | $ | 9 | | | $ | 8 | |
| | | | | | | |
| | | | | | | |
| Payments made | | | | | | | |
| | | | | | | |
| Dividends (1) | $ | 0 | | | $ | 53 | | | 85 | | | 159 | |
| | | | | | | |
| | | | | | | |
|
| | | | | | | | | | | | | | | |
| | Three Months Ended
September 30, | | Nine Months Ended
September 30, |
| (in millions) | 2019 | | 2018 | | 2019 | | 2018 |
| Cost of materials and other | | | | | | | |
| Joint Venture Transportation Agreement: | | | | | | | |
| Enable | $ | 3 |
| | $ | 2 |
| | $ | 8 |
| | $ | 6 |
|
| American Railcar Industries, Inc. | — |
| | — |
| | — |
| | 1 |
|
| Payments made | | | | | | | |
| Tax Allocation Agreement: | | | | | | | |
| American Entertainment Properties Corporation | $ | — |
| | $ | 5 |
| | $ | — |
| | $ | 13 |
|
Amounts due from related parties
|
| | | | | | | |
| (in millions) | September 30, 2019 | | December 31, 2018 |
| Tax Allocation Agreement: | | | |
| American Entertainment Properties Corporation | $ | — |
| | $ | 4 |
|
September 30, 20192020 | 2522
NOTES TO THE CONDENSED CONSOLIDATED FINANCIAL STATEMENTS (Continued)
(unaudited)
Agency Arrangement with IEP
On February 4, 2020, CVR Energy and Icahn Enterprises Holdings LP (“IEH”), a subsidiary of IEP, entered into an agency arrangement wherein IEH would act as the agent for CVR Energy. Under this arrangement, the Company invested approximately $140 million in certain marketable securities of Delek US Holdings, Inc. (“Delek”) (NYSE ticker symbol: DK) and could make additional investments in Delek or invest in other public companies in the future under this arrangement. The Company reimbursed IEH for all costs associated with the initial purchase and did not incur any additional fees as part of this transaction.
Property Exchange
On October 22, 2019, the Audit Committee of CVR Energy’s board of directors (the “Board”) and the Conflicts Committee of the UAN GP Board each agreed to authorize the exchange of certain parcels of property owned by CRRM with an equal number of parcels owned by CRNF, all located in Coffeyville, Kansas (the “Property Exchange”). On February 19, 2020, CRRM and CRNF executed the Property Exchange agreement. This Property Exchange will enable each such subsidiary to create a more usable, contiguous parcel of land near its own operating footprint. This transaction resulted in no net impact on the Company’s condensed consolidated financial statements.
Dividends to CVR Energy Stockholders
The following table presents dividends paid to the Company’s stockholders, including IEP, as of September 30, 2019.
|
| | | | | | | | | | | | | | | | | | |
| | | | | | | Dividends Paid (in millions) |
| Related Period | | Date Paid | | Dividend Per Share | | Stockholders | | IEP | | Total |
| 2018 - 4th Quarter | | March 11, 2019 | | $ | 0.75 |
| | $ | 21 |
| | $ | 54 |
| | $ | 75 |
|
| 2019 - 1st Quarter | | May 13, 2019 | | 0.75 |
| | 21 |
| | 54 |
| | 75 |
|
| 2019 - 2nd Quarter | | August 12, 2019 | | 0.75 |
| | 21 |
| | 54 |
| | 75 |
|
| Total | | | | $ | 2.25 |
| | $ | 63 |
| | $ | 162 |
| | $ | 225 |
|
For the third quarter of 2019, the Company, upon approval by the Company’s Board of Directors on October 23, 2019, declared a cash dividend of $0.80 per share, or $80 million, which is payable on November 12, 2019 to shareholders of record as of November 4, 2019. Of this amount, IEP will receive $57 million due to its ownership interest in the Company’s shares.
Dividends, if any, including the payment, amount and timing thereof, are subject to change at the discretion of the Board. There were 0 dividends declared or paid by the Company during the three months ended September 30, 2020 related to the second quarter of 2020. NaN dividends were declared for the third quarter of 2020.
The following tables present dividends paid to the Company’s Board of Directors.stockholders, including IEP, during 2020 and 2019 (amounts presented in tables below may not add to totals presented due to rounding).
| | | | | | | | | | | | | | | | | | | | | | | | | | | | | | | | |
| | | | | | Dividends Paid (in millions) |
| Related Period | | Date Paid | | Dividend Per Share | | Stockholders | | IEP | | Total |
| 2019 - 4th Quarter | | March 9, 2020 | | $ | 0.80 | | | $ | 23 | | | $ | 57 | | | $ | 80 | |
| 2020 - 1st Quarter | | May 26, 2020 | | 0.40 | | | 12 | | | 28 | | | 40 | |
| | | | | | | | | | |
| Total | | | | $ | 1.20 | | | $ | 35 | | | $ | 85 | | | $ | 121 | |
| | | | | | | | | | | | | | | | | | | | | | | | | | | | | | | | |
| | | | | | Dividends Paid (in millions) |
| Related Period | | Date Paid | | Dividend Per Share | | Stockholders | | IEP | | Total |
| 2018 - 4th Quarter | | March 11, 2019 | | $ | 0.75 | | | $ | 22 | | | $ | 53 | | | $ | 75 | |
| 2019 - 1st Quarter | | May 13, 2019 | | 0.75 | | | 22 | | | 53 | | | 75 | |
| 2019 - 2nd Quarter | | August 12, 2019 | | 0.75 | | | 22 | | | 53 | | | 75 | |
| 2019 - 3rd Quarter | | November 11, 2019 | | 0.80 | | | 23 | | | 57 | | | 80 | |
| Total | | | | $ | 3.05 | | | $ | 90 | | | $ | 217 | | | $ | 307 | |
Distributions to CVR Partners’ Unitholders
The following table presents distributions paid by CVR Partners to CVR Partners’ unitholders, including amounts received by the Company, as of September 30, 2019.
|
| | | | | | | | | | | | | | | | | | |
| | | | | | | Dividends Paid (in millions) |
| Related Period | | Date Paid | | Dividend Per Common Unit | | Unitholders | | CVR Energy | | Total |
| 2018 - 4th Quarter | | March 11, 2019 | | $ | 0.12 |
| | $ | 9 |
| | $ | 5 |
| | $ | 14 |
|
| 2019 - 1st Quarter | | May 13, 2019 | | 0.07 |
| | 5 |
| | 3 |
| | 8 |
|
| 2019 - 2nd Quarter | | August 12, 2019 | | 0.14 |
| | 11 |
| | 5 |
| | 16 |
|
| Total | | | | $ | 0.33 |
| | $ | 25 |
| | $ | 13 |
| | $ | 38 |
|
For the third quarter of 2019, CVR Partners, upon approval by the Board of Directors of CVR Partners’ general partner on October 22, 2019, declared a distribution of $0.07 per common unit, or $8 million, which will be paid on November 12, 2019 to unitholders of record as of November 4, 2019. Of this amount, we will receive approximately $3 million, with the remaining amount payable to public unitholders.
Distributions, if any, including the payment, amount and timing thereof, are subject to change at the discretion of the BoardUAN GP Board. There were 0 distributions declared or paid by CVR Partners during the nine months ended September 30, 2020 related to the fourth quarter of Directors2019 or the first and second quarters of CVR Partners’ general partner.
2020, and 0 distributions were declared for the third quarter of 2020. (15) Guarantor Financial Information
CVR Refining’s 2022 Senior Notes are guaranteed on a senior unsecured basis by the Company and certain wholly-owned subsidiaries, including CVR Refining and certain of its subsidiaries (the “Guarantors”). The guarantees are full and unconditional and joint and several among the Guarantors.
The information is presented in accordance with the requirements of Rule 3-10 under the SEC’s Regulation S-X and prepared on the equity basis of accounting. The financial information may not necessarily be indicative of results of operations, cash flows or financial position had the Guarantors operated as independent entities. The Company has not presented separate financial and narrative information for each of the Guarantors because it believes such financial and narrative information would not provide any additional information that would be material in evaluating the sufficiency of the Guarantors.
September 30, 20192020 | 2623
NOTES TO THE CONDENSED CONSOLIDATED FINANCIAL STATEMENTS (Continued)
(unaudited)
Condensed Consolidated Balance Sheet | | | | | | | | | | | | | | | | | | | | | | | | | | | | | | | | |
| | | | | | Distributions Paid (in thousands) |
| Related Period | | Date Paid | | Distribution Per
Common Unit | | Public Unitholders | | CVR Energy | | Total |
| 2018 - 4th Quarter | | March 11, 2019 | | $ | 0.12 | | | $ | 9 | | | $ | 5 | | | $ | 14 | |
| 2019 - 1st Quarter | | May 13, 2019 | | 0.07 | | | 5 | | | 3 | | | 8 | |
| 2019 - 2nd Quarter | | August 12, 2019 | | 0.14 | | | 10 | | | 5 | | | 16 | |
| 2019 - 3rd Quarter | | November 11, 2019 | | 0.07 | | | 5 | | | 3 | | | 8 | |
| Total | | | | $ | 0.40 | | | $ | 30 | | | $ | 16 | | | $ | 45 | |
|
| | | | | | | | | | | | | | | | | | | | | | | |
| | September 30, 2019 |
| (in millions) | Parent | | Subsidiary Issuer | | Guarantor Subsidiaries | | Non-Guarantor Subsidiaries | | Intercompany Elimination | | Consolidated |
| ASSETS | | | | | | | | | | | |
| Current assets: | | | | | | | | | | | |
| Cash and cash equivalents | $ | 5 |
| | $ | 548 |
| | $ | 54 |
| | $ | 85 |
| | $ | — |
| | $ | 692 |
|
| Accounts receivable | — |
| | — |
| | 166 |
| | 15 |
| | — |
| | 181 |
|
| Intercompany receivable | 6 |
| | — |
| | — |
| | 20 |
| | (26 | ) | | — |
|
| Inventories | — |
| | — |
| | 331 |
| | 57 |
| | — |
| | 388 |
|
| Prepaid expenses and other current assets | 100 |
| | 2 |
| | — |
| | 13 |
| | (49 | ) | | 66 |
|
| Total current assets | 111 |
| | 550 |
| | 551 |
| | 190 |
| | (75 | ) | | 1,327 |
|
| Property, plant and equipment, net of accumulated depreciation | — |
| | 1 |
| | 1,388 |
| | 967 |
| | — |
| | 2,356 |
|
| Investment in and advances from subsidiaries | 1,332 |
| | 1,589 |
| | 435 |
| | 424 |
| | (3,780 | ) | | — |
|
| Other long-term assets | — |
| | 4 |
| | 226 |
| | 49 |
| | — |
| | 279 |
|
| Total assets | $ | 1,443 |
| | $ | 2,144 |
| | $ | 2,600 |
| | $ | 1,630 |
| | $ | (3,855 | ) | | $ | 3,962 |
|
| LIABILITIES AND STOCKHOLDERS’ EQUITY | | | | | | | | | | | |
| Current liabilities: | | | | | | | | | | | |
| Accounts payable | $ | 1 |
| | $ | 2 |
| | $ | 347 |
| | $ | 40 |
| | $ | — |
| | $ | 390 |
|
| Intercompany payables | — |
| | — |
| | 26 |
| | — |
| | (26 | ) | | — |
|
| Other current liabilities | 6 |
| | 25 |
| | 41 |
| | 177 |
| | (49 | ) | | 200 |
|
| Total current liabilities | 7 |
| | 27 |
| | 414 |
| | 217 |
| | (75 | ) | | 590 |
|
| Long-term liabilities: | | | | | | | | | | | |
| Long-term debt and finance lease obligations, net of current portion | — |
| | 497 |
| | 61 |
| | 632 |
| | — |
| | 1,190 |
|
| Investment and advances from subsidiaries | — |
| | — |
| | — |
| | 1,046 |
| | (1,046 | ) | | — |
|
| Deferred income taxes | 3 |
| | — |
| | — |
| | 402 |
| | — |
| | 405 |
|
| Other long-term liabilities | 4 |
| | 1 |
| | 33 |
| | 14 |
| | — |
| | 52 |
|
| Total long-term liabilities | 7 |
| | 498 |
| | 94 |
| | 2,094 |
| | (1,046 | ) | | 1,647 |
|
| Commitments and contingencies |
|
| |
|
| |
|
| |
|
| |
|
| |
|
|
| Equity: | | | | | | | | | | | |
| Total CVR stockholders’ equity | 1,429 |
| | 1,619 |
| | 2,092 |
| | (977 | ) | | (2,734 | ) | | 1,429 |
|
| Noncontrolling interest | — |
| | — |
| | — |
| | 296 |
| | — |
| | 296 |
|
| Total equity | 1,429 |
| | 1,619 |
| | 2,092 |
| | (681 | ) | | (2,734 | ) | | 1,725 |
|
| Total liabilities and equity | $ | 1,443 |
| | $ | 2,144 |
| | $ | 2,600 |
| | $ | 1,630 |
| | $ | (3,855 | ) | | $ | 3,962 |
|
September 30, 20192020 | 2724
NOTES TO THE CONDENSED CONSOLIDATED FINANCIAL STATEMENTS (Continued)
(unaudited)
Condensed Consolidated Balance Sheet
|
| | | | | | | | | | | | | | | | | | | | | | | |
| | December 31, 2018 |
| (in millions) | Parent | | Subsidiary Issuer | | Guarantor Subsidiaries | | Non-Guarantor Subsidiaries | | Intercompany Elimination | | Consolidated |
| ASSETS | | | | | | | | | | | |
| Current assets: | | | | | | | | | | | |
| Cash and cash equivalents | $ | 3 |
| | $ | 349 |
| | $ | 252 |
| | $ | 64 |
| | $ | — |
| | $ | 668 |
|
| Accounts receivable | — |
| | — |
| | 107 |
| | 62 |
| | — |
| | 169 |
|
| Intercompany receivable | 6 |
| | — |
| | 4 |
| | — |
| | (10 | ) | | — |
|
| Inventories | — |
| | — |
| | 316 |
| | 64 |
| | — |
| | 380 |
|
| Prepaid expenses and other current assets | 31 |
| | 2 |
| | 47 |
| | 3 |
| | (7 | ) | | 76 |
|
| Total current assets | 40 |
| | 351 |
| | 726 |
| | 193 |
| | (17 | ) | | 1,293 |
|
| Property, plant and equipment, net of accumulated depreciation | — |
| | 3 |
| | 1,409 |
| | 1,018 |
| | — |
| | 2,430 |
|
| Investment in and advances from subsidiaries | 1,263 |
| | 1,693 |
| | 173 |
| | — |
| | (3,129 | ) | | — |
|
| Other long-term assets | — |
| | 2 |
| | 231 |
| | 44 |
| | — |
| | 277 |
|
| Total assets | $ | 1,303 |
| | $ | 2,049 |
| | $ | 2,539 |
| | $ | 1,255 |
| | $ | (3,146 | ) | | $ | 4,000 |
|
| LIABILITIES AND STOCKHOLDERS’ EQUITY | | | | | | | | | | | |
| Current liabilities: | | | | | | | | | | | |
| Accounts payable | $ | 1 |
| | $ | 3 |
| | $ | 291 |
| | $ | 25 |
| | $ | — |
| | $ | 320 |
|
| Intercompany payables | — |
| | — |
| | — |
| | 10 |
| | (10 | ) | | — |
|
| Other current liabilities | 6 |
| | 14 |
| | 65 |
| | 98 |
| | (7 | ) | | 176 |
|
| Total current liabilities | 7 |
| | 17 |
| | 356 |
| | 133 |
| | (17 | ) | | 496 |
|
| Long-term liabilities: | | | | | | | | | | | |
| Long-term debt and finance lease obligations, net of current portion | — |
| | 496 |
| | 42 |
| | 629 |
| | — |
| | 1,167 |
|
| Investment and advances from subsidiaries | — |
| | — |
| | 106 |
| | 993 |
| | (1,099 | ) | | — |
|
| Deferred income taxes | (24 | ) | | — |
| | — |
| | 404 |
| | — |
| | 380 |
|
| Other long-term liabilities | 3 |
| | 1 |
| | 6 |
| | 4 |
| | — |
| | 14 |
|
| Total long-term liabilities | (21 | ) | | 497 |
| | 154 |
| | 2,030 |
| | (1,099 | ) | | 1,561 |
|
| Commitments and contingencies |
|
| |
|
| |
|
| |
|
| |
|
| |
|
|
| Equity: | | | | | | | | | | | |
| Total CVR stockholders’ equity | 1,317 |
| | 1,207 |
| | 2,029 |
| | (1,237 | ) | | (2,030 | ) | | 1,286 |
|
| Noncontrolling interest | — |
| | 328 |
| | — |
| | 329 |
| | — |
| | 657 |
|
| Total equity | 1,317 |
| | 1,535 |
| | 2,029 |
| | (908 | ) | | (2,030 | ) | | 1,943 |
|
| Total liabilities and equity | $ | 1,303 |
| | $ | 2,049 |
| | $ | 2,539 |
| | $ | 1,255 |
| | $ | (3,146 | ) | | $ | 4,000 |
|
NOTES TO THE CONDENSED CONSOLIDATED FINANCIAL STATEMENTS (Continued)
(unaudited)
Condensed Consolidated Statement of Operations
|
| | | | | | | | | | | | | | | | | | | | | | | |
| | Three Months Ended September 30, 2019 |
| (in millions) | Parent | | Subsidiary Issuer | | Guarantor Subsidiaries | | Non-Guarantor Subsidiaries | | Intercompany Eliminations | | Consolidated |
| Net sales | $ | — |
| | $ | — |
| | $ | 1,535 |
| | $ | 89 |
| | $ | (2 | ) | | $ | 1,622 |
|
| Operating costs and expenses: | | | | | | | | | | | |
| Cost of materials and other | — |
| | — |
| | 1,202 |
| | 21 |
| | (2 | ) | | 1,221 |
|
| Direct operating expenses (exclusive of depreciation and amortization as reflected below) | — |
| | — |
| | 91 |
| | 48 |
| | — |
| | 139 |
|
| Depreciation and amortization | — |
| | — |
| | 51 |
| | 18 |
| | — |
| | 69 |
|
| Cost of sales | — |
| | — |
| | 1,344 |
| | 87 |
| | (2 | ) | | 1,429 |
|
| Selling, general and administrative expenses (exclusive of depreciation and amortization as reflected below) | 5 |
| | 2 |
| | 15 |
| | 7 |
| | — |
| | 29 |
|
| Depreciation and amortization | — |
| | — |
| | 2 |
| | — |
| | — |
| | 2 |
|
| Loss on asset disposals | — |
| | — |
| | — |
| | 3 |
| | — |
| | 3 |
|
| Operating income (loss) | (5 | ) | | (2 | ) | | 174 |
| | (8 | ) | | — |
| | 159 |
|
| Other income (expense): | | | | | | | | | | | |
| Interest expense, net | (3 | ) | | (7 | ) | | (2 | ) | | (14 | ) | | — |
| | (26 | ) |
| Other income, net | — |
| | — |
| | 4 |
| | 1 |
| | — |
| | 5 |
|
| Income (loss) from subsidiaries | 136 |
| | 176 |
| | (10 | ) | | (5 | ) | | (297 | ) | | — |
|
| Income (loss) before income taxes | 128 |
| | 167 |
| | 166 |
| | (26 | ) | | (297 | ) | | 138 |
|
| Income tax expense | 9 |
| | — |
| | — |
| | 25 |
| | — |
| | 34 |
|
| Net income (loss) | 119 |
| | 167 |
| | 166 |
| | (51 | ) | | (297 | ) | | 104 |
|
| Less: Net loss attributable to noncontrolling interest | — |
| | — |
| | — |
| | (15 | ) | | — |
| | (15 | ) |
| Net income (loss) attributable to CVR Energy stockholders | $ | 119 |
| | $ | 167 |
| | $ | 166 |
| | $ | (36 | ) | | $ | (297 | ) | | $ | 119 |
|
NOTES TO THE CONDENSED CONSOLIDATED FINANCIAL STATEMENTS (Continued)
(unaudited)
Condensed Consolidated Statement of Operations
|
| | | | | | | | | | | | | | | | | | | | | | | |
| | Three Months Ended September 30, 2018 |
| (in millions) | Parent | | Subsidiary Issuer | | Guarantor Subsidiaries | | Non-Guarantor Subsidiaries | | Intercompany Eliminations | | Consolidated |
| Net sales | $ | — |
| | $ | — |
| | $ | 1,857 |
| | $ | 81 |
| | $ | (3 | ) | | $ | 1,935 |
|
| Operating costs and expenses: | | | | | | | | | | | |
| Cost of materials and other | — |
| | — |
| | 1,539 |
| | 20 |
| | (3 | ) | | 1,556 |
|
| Direct operating expenses (exclusive of depreciation and amortization as reflected below) | — |
| | — |
| | 84 |
| | 35 |
| | — |
| | 119 |
|
| Depreciation and amortization | — |
| | — |
| | 46 |
| | 17 |
| | — |
| | 63 |
|
| Cost of sales | — |
| | — |
| | 1,669 |
| | 72 |
| | (3 | ) | | 1,738 |
|
| Selling, general and administrative expenses (exclusive of depreciation and amortization as reflected below) | 4 |
| | 2 |
| | 14 |
| | 7 |
| | — |
| | 27 |
|
| Depreciation and amortization | — |
| | 1 |
| | 2 |
| | — |
| | — |
| | 3 |
|
| Loss on asset disposals | — |
| | — |
| | 1 |
| | — |
| | — |
| | 1 |
|
| Operating income (loss) | (4 | ) | | (3 | ) | | 171 |
| | 2 |
| | — |
| | 166 |
|
| Other income (expense): | | | | | | | | | | | |
| Interest expense, net | — |
| | (9 | ) | | (2 | ) | | (15 | ) | | — |
| | (26 | ) |
| Other income, net | — |
| | — |
| | 3 |
| | — |
| | — |
| | 3 |
|
| Income (loss) from subsidiaries | 84 |
| | 173 |
| | (10 | ) | | (11 | ) | | (236 | ) | | — |
|
| Income (loss) before income taxes | 80 |
| | 161 |
| | 162 |
| | (24 | ) | | (236 | ) | | 143 |
|
| Income tax expense (benefit) | (1 | ) | | — |
| | — |
| | 34 |
| | — |
| | 33 |
|
| Net income (loss) | 81 |
| | 161 |
| | 162 |
| | (58 | ) | | (236 | ) | | 110 |
|
| Less: Net income (loss) attributable to noncontrolling interest | — |
| | 38 |
| | — |
| | (9 | ) | | — |
| | 29 |
|
| Net income (loss) attributable to CVR Energy stockholders | $ | 81 |
| | $ | 123 |
| | $ | 162 |
| | $ | (49 | ) | | $ | (236 | ) | | $ | 81 |
|
NOTES TO THE CONDENSED CONSOLIDATED FINANCIAL STATEMENTS (Continued)
(unaudited)
Condensed Consolidated Statement of Operations
|
| | | | | | | | | | | | | | | | | | | | | | | |
| | Nine Months Ended September 30, 2019 |
| (in millions) | Parent | | Subsidiary Issuer | | Guarantor Subsidiaries | | Non-Guarantor Subsidiaries | | Intercompany Eliminations | | Consolidated |
| Net sales | $ | — |
| | $ | — |
| | $ | 4,484 |
| | $ | 318 |
| | $ | (8 | ) | | $ | 4,794 |
|
| Operating costs and expenses: | | | | | | | | | | | |
| Cost of materials and other | — |
| | — |
| | 3,525 |
| | 72 |
| | (8 | ) | | 3,589 |
|
| Direct operating expenses (exclusive of depreciation and amortization as reflected below) | — |
| | — |
| | 269 |
| | 128 |
| | — |
| | 397 |
|
| Depreciation and amortization | — |
| | — |
| | 150 |
| | 60 |
| | — |
| | 210 |
|
| Cost of sales | — |
| | — |
| | 3,944 |
| | 260 |
| | (8 | ) | | 4,196 |
|
| Selling, general and administrative expenses (exclusive of depreciation and amortization as reflected below) | 15 |
| | 6 |
| | 45 |
| | 19 |
| | — |
| | 85 |
|
| Depreciation and amortization | — |
| | 1 |
| | 5 |
| | 1 |
| | — |
| | 7 |
|
| (Gain) loss on asset disposals | — |
| | — |
| | (8 | ) | | 3 |
| | — |
| | (5 | ) |
| Operating income (loss) | (15 | ) | | (7 | ) | | 498 |
| | 35 |
| | — |
| | 511 |
|
| Other income (expense): | | | | | | | | | | | |
| Interest expense, net | (7 | ) | | (15 | ) | | (8 | ) | | (47 | ) | | — |
| | (77 | ) |
| Other income, net | — |
| | — |
| | 10 |
| | — |
| | — |
| | 10 |
|
| Income (loss) from subsidiaries | 389 |
| | 500 |
| | (14 | ) | | (21 | ) | | (854 | ) | | — |
|
| Income (loss) before income taxes | 367 |
| | 478 |
| | 486 |
| | (33 | ) | | (854 | ) | | 444 |
|
| Income tax expense | 31 |
| | — |
| | — |
| | 79 |
| | — |
| | 110 |
|
| Net income (loss) | 336 |
| | 478 |
| | 486 |
| | (112 | ) | | (854 | ) | | 334 |
|
| Less: Net income (loss) attributable to noncontrolling interest | — |
| | 5 |
| | — |
| | (7 | ) | | — |
| | (2 | ) |
| Net income (loss) attributable to CVR Energy stockholders | $ | 336 |
| | $ | 473 |
| | $ | 486 |
| | $ | (105 | ) | | $ | (854 | ) | | $ | 336 |
|
NOTES TO THE CONDENSED CONSOLIDATED FINANCIAL STATEMENTS (Continued)
(unaudited)
Condensed Consolidated Statement of Operations
|
| | | | | | | | | | | | | | | | | | | | | | | |
| | Nine Months Ended September 30, 2018 |
| (in millions) | Parent | | Subsidiary Issuer | | Guarantor Subsidiaries | | Non-Guarantor Subsidiaries | | Intercompany Eliminations | | Consolidated |
| Net sales | $ | — |
| | $ | — |
| | $ | 5,138 |
| | $ | 253 |
| | $ | (5 | ) | | $ | 5,386 |
|
| Operating costs and expenses: | | | | | | | | | | | |
| Cost of materials and other | — |
| | — |
| | 4,238 |
| | 62 |
| | (5 | ) | | 4,295 |
|
| Direct operating expenses (exclusive of depreciation and amortization as reflected below) | — |
| | — |
| | 269 |
| | 121 |
| | — |
| | 390 |
|
| Depreciation and amortization | — |
| | — |
| | 143 |
| | 53 |
| | — |
| | 196 |
|
| Cost of sales | — |
| | — |
| | 4,650 |
| | 236 |
| | (5 | ) | | 4,881 |
|
| Selling, general and administrative expenses (exclusive of depreciation and amortization as reflected below) | 12 |
| | 8 |
| | 44 |
| | 19 |
| | — |
| | 83 |
|
| Depreciation and amortization | — |
| | 2 |
| | 5 |
| | 1 |
| | — |
| | 8 |
|
| Loss on asset disposals | — |
| | — |
| | 4 |
| | 1 |
| | — |
| | 5 |
|
| Operating income (loss) | (12 | ) | | (10 | ) | | 435 |
| | (4 | ) | | — |
| | 409 |
|
| Other income (expense): | | | | | | | | | | | |
| Interest expense, net | — |
| | (25 | ) | | (7 | ) | | (47 | ) | | — |
| | (79 | ) |
| Other income, net | — |
| | — |
| | 6 |
| | — |
| | — |
| | 6 |
|
| Income (loss) from subsidiaries | 194 |
| | 431 |
| | (34 | ) | | (35 | ) | | (556 | ) | | — |
|
| Income (loss) before income taxes | 182 |
| | 396 |
| | 400 |
| | (86 | ) | | (556 | ) | | 336 |
|
| Income tax expense (benefit) | (3 | ) | | — |
| | — |
| | 68 |
| | — |
| | 65 |
|
| Net income (loss) | 185 |
| | 396 |
| | 400 |
| | (154 | ) | | (556 | ) | | 271 |
|
| Less: Net income (loss) attributable to noncontrolling interest | — |
| | 118 |
| | — |
| | (32 | ) | | — |
| | 86 |
|
| Net income (loss) attributable to CVR Energy stockholders | $ | 185 |
| | $ | 278 |
| | $ | 400 |
| | $ | (122 | ) | | $ | (556 | ) | | $ | 185 |
|
NOTES TO THE CONDENSED CONSOLIDATED FINANCIAL STATEMENTS (Continued)
(unaudited)
Condensed Consolidated Statement of Cash Flows
|
| | | | | | | | | | | | | | | | | | | | | | | |
| | Nine Months Ended September 30, 2019 |
| (in millions) | Parent | | Subsidiary Issuer | | Guarantor Subsidiaries | | Non-Guarantor Subsidiaries | | Intercompany Elimination | | Consolidated |
| Net cash provided by (used in) operating activities | $ | (123 | ) | | $ | (12 | ) | | $ | 616 |
| | $ | 172 |
| | $ | — |
| | $ | 653 |
|
| | | | | | | | | | | | |
| Cash flows from investing activities: | | | | | | | | | | | |
| Capital expenditures | — |
| | — |
| | (76 | ) | | (9 | ) | | — |
| | (85 | ) |
| Turnaround expenditures | — |
| | — |
| | (24 | ) | | — |
| | — |
| | (24 | ) |
| Investment in affiliates, net of return of investment | 652 |
| | 243 |
| | 263 |
| | (22 | ) | | (1,136 | ) | | — |
|
| Proceeds from sale of assets | — |
| | — |
| | 36 |
| | — |
| | — |
| | 36 |
|
| Net cash provided by (used in) investing activities | 652 |
| | 243 |
| | 199 |
| | (31 | ) | | (1,136 | ) | | (73 | ) |
| | | | | | | | | | | | |
| Cash flows from financing activities: | | | | | | | | | | | |
| Dividends to CVR Energy stockholders | (225 | ) | | — |
| | — |
| | — |
| | — |
| | (225 | ) |
| Acquisition of CVR Refining common units | (301 | ) | | — |
| | — |
| | — |
| | — |
| | (301 | ) |
| Distributions to CVR Partners’ noncontrolling interest holders | — |
| | — |
| | — |
| | (25 | ) | | — |
| | (25 | ) |
| Distributions or intercompany advances to other CVR Energy subsidiaries | — |
| | (32 | ) | | (1,011 | ) | | (93 | ) | | 1,136 |
| | — |
|
| Other financing activities | (1 | ) | | — |
| | (2 | ) | | (2 | ) | | — |
| | (5 | ) |
| Net cash provided by (used in) financing activities | (527 | ) | | (32 | ) | | (1,013 | ) | | (120 | ) | | 1,136 |
| | (556 | ) |
| Net increase (decrease) in cash and cash equivalents | 2 |
| | 199 |
| | (198 | ) | | 21 |
| | — |
| | 24 |
|
| Cash and cash equivalents, beginning of period | 3 |
| | 349 |
| | 252 |
| | 64 |
| | — |
| | 668 |
|
| Cash and cash equivalents, end of period | $ | 5 |
| | $ | 548 |
| | $ | 54 |
| | $ | 85 |
| | $ | — |
| | $ | 692 |
|
NOTES TO THE CONDENSED CONSOLIDATED FINANCIAL STATEMENTS (Continued)
(unaudited)
Condensed Consolidated Statement of Cash Flows
|
| | | | | | | | | | | | | | | | | | | | | | | |
| | Nine Months Ended September 30, 2018 |
| (in millions) | Parent | | Subsidiary Issuer | | Guarantor Subsidiaries | | Non-Guarantor Subsidiaries | | Intercompany Elimination | | Consolidated |
| Net cash provided by (used in) operating activities | $ | (2 | ) | | $ | (10 | ) | | $ | 598 |
| | $ | (60 | ) | | $ | — |
| | $ | 526 |
|
| | | | | | | | | | | | |
| Cash flows from investing activities: | | | | | | | | | | | |
| Capital expenditures | — |
| | (2 | ) | | (51 | ) | | (15 | ) | | — |
| | (68 | ) |
| Turnaround expenditures | — |
| | — |
| | (7 | ) | | — |
| | — |
| | (7 | ) |
| Investment in affiliates, net of return of investment | 162 |
| | 793 |
| | 383 |
| | 168 |
| | (1,506 | ) | | — |
|
| Other investing activities | — |
| | — |
| | 1 |
| | — |
| | — |
| | 1 |
|
| Net cash provided by (used in) investing activities | 162 |
| | 791 |
| | 326 |
| | 153 |
| | (1,506 | ) | | (74 | ) |
| | | | | | | | | | | | |
| Cash flows from financing activities: | | | | | | | | | | | |
| Dividends to CVR Energy stockholders | (162 | ) | | — |
| | — |
| | — |
| | — |
| | (162 | ) |
| Distributions to CVR Refining or CVR Partners’ noncontrolling interest holders | — |
| | — |
| | — |
| | (67 | ) | | — |
| | (67 | ) |
| Distributions or intercompany advances to other CVR Energy subsidiaries | — |
| | (550 | ) | | (943 | ) | | (13 | ) | | 1,506 |
| | — |
|
| Other financing activities | — |
| | — |
| | (2 | ) | | (1 | ) | | — |
| | (3 | ) |
| Net cash provided by (used in) financing activities | (162 | ) | | (550 | ) | | (945 | ) | | (81 | ) | | 1,506 |
| | (232 | ) |
| Net increase (decrease) in cash and cash equivalents | (2 | ) | | 231 |
| | (21 | ) | | 12 |
| | — |
| | 220 |
|
| Cash and cash equivalents, beginning of period | 4 |
| | 163 |
| | 264 |
| | 51 |
| | — |
| | 482 |
|
| Cash and cash equivalents, end of period | $ | 2 |
| | $ | 394 |
| | $ | 243 |
| | $ | 63 |
| | $ | — |
| | $ | 702 |
|
Item 2. Management’s Discussion and Analysis of Financial Condition and Results of Operations
In the first quarter of 2019, the Company revised its accounting policy method for the costs of planned major maintenance activities (turnarounds) specific to the Petroleum Segment from being expensed as incurred (the direct expensing method) to the deferral method. Comparable prior period information has been recast to reflect this accounting change. The impact of adopting the new policy to account for turnaround expenses is reflected within a Current Report on Form 8-K filed by the Company with the Securities Exchange Commission (“SEC”) on June 12, 2019, which recast the December 31, 2018 audited information (the “Recast Form 8-K for 2018”). The following discussion and analysis of our financial condition and results of operations should be read in conjunction with our Annual Report on Form 10-K for the year ended December 31, 20182019 filed with the SEC on February 21, 201920, 2020 (the “2018“2019 Form 10-K”), and the unaudited condensed consolidated financial statements and related notes and with the statistical information and financial data appearing in this Report as well as our Recast Form 8-K for 2018.Report. Results of operations and cash flows for the three and nine months ended September 30, 20192020 and cash flows for the nine months ended September 30, 2020 are not necessarily indicative of results to be attained for any other period. See “Important Information Regarding Forward LookingForward-Looking Statements”.
Company Overview
CVR Energy, Inc. (“CVR Energy,” “CVR,” “we,” “us,” “our,” or the “Company”) is a diversified holding company primarily engaged in the petroleum refining and nitrogen fertilizer manufacturing industries through our holdings in CVR Refining and CVR Partners.Partners, respectively. CVR Refining is a refiner that does not have crude oil exploration or production operations (an “independent petroleum refiner”) and is a marketer of high value transportation fuels. CVR Partners produces nitrogen fertilizers in the form of ammonia and urea ammonium nitrate (“UAN”). Ammonia is a direct application fertilizer and is primarily used as a building block for other nitrogen products for industrial applications and finished fertilizer products. UAN is an aqueous solution of urea and ammonium nitrate. At September 30, 2019,2020, we owned the general partner and approximately 34%35% of the outstanding common units representing limited partner interests in CVR Partners. As of September 30, 2019,2020, Icahn Enterprises L.P. and its affiliates (“IEP”) owned approximately 71% of our outstanding common stock.
On January 29, 2019, the Company purchased all issued and outstanding CVR Refining common units not already owned by the Company for a cash purchase price of $10.50 per unit, or approximately $301 million in the aggregate. The total purchase price was funded with approximately $105 million in borrowings under a new credit agreement entered into by the Company on January 29, 2019, with the remaining amount being funded from the Company’s cash on hand. Amounts drawn under the new credit agreement were fully repaid in February 2019. See Note 15 (“Guarantor Financial Information”) for further discussion and the condensed consolidated financial statements presented as a result of this transaction.
We operate under two business segments: petroleum and nitrogen fertilizer, which are referred to in this document as our “Petroleum Segment” and our “Nitrogen Fertilizer Segment,” respectively.
Strategy and Goals
Mission and Core Values
Our missionMission is to be a top tier North American petroleum refining and nitrogen-based fertilizer company as measured by safe and reliable operations, superior performance and profitable growth. The foundation of how we operate is built on five core values:
| |
• | Safety - We always put safety first. The protection of our employees, contractors and communities is paramount. We have an unwavering commitment to safety above all else. If it’s not safe, then we don’t do it.
|
| |
• | Environment - We care for our environment. Complying with all regulations and minimizing any environmental impact from our operations is essential. We understand our obligation to the environment and that it’s our duty to protect it.
|
| |
• | Integrity - We require high business ethics. We comply with the law and practice sound corporate governance. We only conduct business one way—the right way with integrity.
|
| |
• | Corporate Citizenship - We are proud members of the communities where we operate. We are good neighbors and know that it’s a privilege we can’t take for granted. We seek to make a positive economic and social impact through our financial donations and the contributions of time, knowledge and talent of our employees to the places where we live and work.
|
September 30, 2019 |
•35Safety - We always put safety first. The protection of our employees, contractors and communities is paramount. We have an unwavering commitment to safety above all else. If it’s not safe, then we don’t do it.
•Environment - We care for our environment. Complying with all regulations and minimizing any environmental impact from our operations is essential. We understand our obligation to the environment and that it’s our duty to protect it.
•Integrity - We require high business ethics. We comply with the law and practice sound corporate governance. We only conduct business one way—the right way with integrity.
•Corporate Citizenship - We are proud members of Contentsthe communities where we operate. We are good neighbors and know that it’s a privilege we can’t take for granted. We seek to make a positive economic and social impact through our financial donations and the contributions of time, knowledge and talent of our employees to the places where we live and work.
| |
• | •Continuous Improvement - We believe in both individual and team success. We foster accountability under a performance-driven culture that supports creative thinking, teamwork, diversity and personal development so that employees can realize their maximum potential. We use defined work practices for consistency, efficiency and to create value across the organization.
- We believe in both individual and team success. We foster accountability under a performance-driven culture that supports creative thinking, teamwork and personal development so that employees can realize their maximum potential. We use defined work practices for consistency, efficiency and to create value across the organization.
|
Our core valuesValues are driven by our people, inform the way we do business each and every day and enhance our ability to accomplish our mission and related strategic objectives.
Strategic Objectives
We have outlined the following strategic objectives to drive the accomplishment of our mission:
Safety - We aim to achieve continuous improvement in all environmental, health and safety areas through ensuring our people’s commitment to environmental, health and safety comes first, the refinement of existing policies, continuous training, and enhanced monitoring procedures.
Reliability - Our goal is to achieve industry-leading utilization factors at our facilities through safe and reliable operations. We are focusing on improvements in day-to-day plant operations, identifying alternative sources for plant inputs to reduce lost time due to third-party operational constraints, and optimizing our commercial and marketing functions to maintain plant operations at their highest level.
Market Capture - We continuously evaluate opportunities to improve the facilities’ netbacks and reduce variable costs incurred in production to maximize our capture of market opportunities.
Financial Discipline - We strive to be as efficient as possible by maintaining low operating costs and a disciplined deployment of capital.
Achievements
During 2019,the first nine months of 2020, we successfully executed a number of achievements in support of our strategic objectives shown below through the date of this filing:
| | | | | | | | | | | | | | | | | | | | | | | |
| Safety | | Reliability | | Market Capture | | Financial Discipline |
| Corporate: | | | | | | | |
| Increased liquidity and extended debt maturity with the January issuance of $1.0 billion of Senior Notes due in 2025 and 2028, and the redemption of $0.5 billion CVR Refining Senior Notes due in 2022. | | | | | | | ü |
| Operated our Petroleum and Nitrogen Fertilizer Segments’ facilities and corporate offices safely and reliably and maintained financial discipline amid COVID-19 pandemic. | ü | | ü | | | | ü |
| Reduced consolidated operating and SG&A expenses by 12% for the first nine months of 2020 as compared to the same period of 2019. | | | | | | | ü |
| | | | | | | |
| | | | | | | |
| Petroleum Segment: | Safety | | Reliability | | Market Capture | | Financial Discipline |
Petroleum Segment: | | | | | | | |
CompletedSafely completed the planned turnaround of the Coffeyville Refinery in April 2020, limiting exposure to the volatile margin environment. | ü | | ü | | | | |
Received Board approval for additional engineering, purchase of long-lead equipment, and initial permit filings on the Renewable Diesel Unit (“RDU”) project at the Wynnewood turnaround safely, on time and under budgetRefinery. | ü | | ü | | ü | | ü |
CompletedReduced operating and SG&A expenses by 13% for the Wynnewood refinery’s BenFree repositioning project now in service enabling increased premium gasoline salesfirst nine months of 2020 as compared to the same period of 2019. | ü | | | | ü | | ü |
Completed the sale of the Cushing, Oklahoma crude oil terminal | | | | | | | ü |
Maintained high utilization at both facilities through | | | | | | | |
| | | | | | | |
| Nitrogen Fertilizer Segment: | | | | | | | |
| | | | | | | |
Amended and extended the Nitrogen Fertilizer ABL during the third quarter of 20192020. | ü | | ü | | | | ü |
Nitrogen Fertilizer Segment:Generated first carbon offset credits related to N2O abatement and continued sequestration of CO2 for enhanced crude oil recovery at the Coffeyville Facility. | ü | | | | | | |
Safely completed the East Dubuque turnaround | ü | | | | | | |
Maintained high asset reliability and a combined utilization rate of 98% at both facilities throughduring the third quarter of 20192020. | ü | | ü | | ü | | ü |
Generated positive cash availableReduced operating and SG&A expenses by 10% for distribution for three consecutive quarters in 2019the first nine months of 2020 as compared to the same period of 2019. | | | ü | | ü | | ü |
CVR Partners declared cash distributions of 40 cents per unit in 2019 | | | | | | | ü |
Corporate: | | | | | | | |
Declared cash dividends of $3.05 per share in 2019 | | | | | | | ü |
Announced $300 million share repurchase authorization | | | | | | | ü |
September 30, 20192020 | 3626
Industry Factors
General Business Environment
In March 2020, the World Health Organization categorized COVID-19 as a pandemic, and the President of the United States declared the COVID-19 outbreak a national emergency. The COVID-19 pandemic and actions taken by governments and others in response thereto has and continues to negatively impact the worldwide economy, financial markets, and the energy industry. The COVID-19 pandemic has also resulted in significant business and operational disruptions, including business closures, liquidity strains, destruction of non-essential demand, as well as supply chain challenges, travel restrictions, stay-at-home orders, and limitations on the availability of the workforce. As a result of these factors, the regional demand for gasoline and diesel for the third quarter of 2020 declined 9% versus the third quarter of 2019. However, demand for the third quarter of 2020 has recovered 7% versus the second quarter of 2020. Further, there has been a significant decline in business and leisure travel due to the pandemic, leading to a dramatic decline in air travel and corresponding jet fuel demand. The airline industry continues to see minimal improvement in air miles traveled which has forced jet fuel to shift into the distillate pool, resulting in diesel crack spreads for the third quarter of 2020 54% below the 5-year average and 60% below the same period of 2019. These markets are seeing a slow recovery, and crude oil differentials are expected to remain weak until shale oil production recovers. Continuing concerns surrounding the negative effects of the COVID-19 pandemic on economic and business prospects across the world have contributed to increased market and price volatility and have diminished expectations for the global economy, and may precipitate a prolonged economic slowdown and recession.
These declines were amplified late in the first quarter by market plays between the world’s largest oil producers. The simultaneous shocks to oil supply and demand has resulted in a decline in the price of crude oil and led to a significant decrease in the price of the refined petroleum products we produce and sell. The Company believes it is experiencing the most challenging energy environment since its formation. The general business environment in which the Company operates and the uncertainty around the availability and prices of the Company’s feedstocks, primarily crude oil, and the demand for its products will likely continue to remain volatile through the remainder of the year and beyond. The decrease in the demand for refined petroleum products caused by the artificial pausing of the U.S. economy has resulted in a significant decrease in the price of the products we produce and sell, although demand and prices have since slightly recovered as states begin reopening. The price of refined products we sell and the feedstocks we purchase significantly impact our revenues, income from operations, net income and cash flows. As a result, the Company anticipates its future operating results and current and long-term financial condition could be further negatively impacted.
Petroleum Segment
The earnings and cash flows of the Petroleum Segment are primarily affected by the relationship between refined product prices and the prices for crude oil and other feedstocks that are processed and blended into refined products. The cost to acquire crude oil and other feedstocks and the price for which refined products are ultimately sold dependdepends on factors beyond the Petroleum Segment’s control, including the supply of, and demand for crude oil, as well as gasoline and other refined products which, in turn, depend on, among other factors, changes in domestic and foreign economies, driving habits, weather conditions, domestic and foreign political affairs, production levels, the availability of imports, the marketing of competitive fuels, and the extent of government regulation. Because the Petroleum Segment applies first-in first-out accounting to value its inventory, crude oil price movements may impact net income in the short termshort-term because of changes in the value of its unhedged inventory. The effect of changes in crude oil prices on the Petroleum Segment results of operations is partially influenced by the rate at which the process of refined products adjust to reflect these changes.
The prices of crude oil and other feedstocks and refined products are also affected by other factors, such as product pipeline capacity, system inventory, local market conditions, and the operating levels of competing refineries. Crude oil costs and the prices of refined products have historically been subject to wide fluctuations. Widespread expansion or upgrades of competitors’ facilities, price volatility, international political and economic developments, and other factors are likely to continue to play an important role in refining industry economics. These factors can impact, among other things, the level of inventories in the market, resulting in price volatility and a reduction in product margins. Moreover, the refining industry typically experiences seasonal fluctuations in demand for refined products, such as increases in the demand for gasoline during the summer driving season and for volatile seasonal exports of diesel from the United States Gulf Coast markets.
In addition to current market conditions, there are long-term factors that may impact the demand for refined products. These factors include mandated renewable fuels standards, proposed climate change laws and regulations, and increased mileage standards for vehicles. The Petroleum Segmentpetroleum business is also subject to the RFSrenewable fuel standard (“RFS”) of the EPA,
Environmental Protection Agency (the “EPA”), which, each year, requires blending renewable fuels“renewable fuels” with transportation fuels or purchasepurchasing renewable identification numbers (“RINs”), in lieu of blending, by March 31, 2020 or otherwise be subject to penalties. Our cost to comply with the RFS is dependent upon a variety of factors, which include the availability of ethanol for blending at our refineries and downstream terminals or RINs for purchase, the price at which RINs can be purchased, transportation fuel production levels, and the mix of our products, as well as the fuel blending performed at our refineries and downstream terminals, all of which can vary significantly from period to period. Due to recent uncertainty resulting from the ruling of the U.S. Court of Appeals for the 10th Circuit in January 2020 and recent broad rejections of waiver requests by the EPA, our costs to comply with RFS have increased compared to 2019, as RIN prices have increased significantly since the beginning of 2020. Based upon recent market prices of RINs and current estimates related to the other variable factors, our estimated cost to comply with the RFS is $40$110 to $50$115 million for 2019.
2019 Market Conditions
NYMEX WTI crude oil is an industry wide benchmark that is utilized in the market pricing of a barrel of crude oil. The pricing differences between other crudes and WTI, known as differentials, show how the market for other crude oils such as WCS, White Cliffs (“Condensate”), Brent Crude (“Brent”), and Midland WTI (“Midland”) are trending. Due to the COVID-19 pandemic, actions taken by governments and others in response thereto, refined product prices have experienced extreme volatility. As a result of the current environment, refining margins have been and could continue to be significantly reduced.
As a performance benchmark and a comparison with other industry participants, we utilize NYMEX and Group 3 crack spreads. These crack spreads are a measure of the difference between market prices for crude oil and refined products and are a commonly used proxy within the industry to estimate or identify trends in refining margins. Crack spreads can fluctuate significantly over time as a result of market conditions and supply and demand balances. The tables below show relevant market indicators for the Petroleum Segment, on a perNYMEX 2-1-1 crack spread is calculated using two barrels basis, forof WTI producing one barrel of NYMEX RBOB Gasoline (“RBOB”) and one barrel of NYMEX NY Harbor ULSD (“HO”). The Group 3 2-1-1 crack spread is calculated using two barrels of WTI crude oil producing one barrel of Group 3 sub-octane gasoline and one barrel of Group 3 ultra-low sulfur diesel.
Both NYMEX 2-1-1 and Group 3 2-2-1 crack spreads decreased during the nine months ended September 30, 2019, and for2020 compared to the yearsnine months ended September 30, 2019. The NYMEX 2-1-1 crack spread averaged $12.37 per barrel during the nine months ended September 30, 2020 compared to $20.42 per barrel in the nine months ended September 30, 2019. The Group 3 2-1-1 crack spread averaged $9.75 per barrel during the nine months ended September 30, 2020 compared to $18.76 per barrel during the nine months ended September 30, 2019.
2018 and 2017:
September 30, 20192020 | 3828
| |
(1) | The table below shows the change over time in NYMEX - WTI, as reflected in the graph above. |
|
| | | | | | | | | | | | | | | | | | | | | | | |
| (in $/bbl) | Average 2017 | | At December 31, 2017 | | Average 2018 | | At December 31, 2018 | | Average 2019 | | At September 30, 2019 |
| WTI | $ | 50.95 |
| | $ | 57.95 |
| | $ | 64.77 |
| | $ | 48.98 |
| | $ | 57.10 |
| | $ | 56.97 |
|
| |
(2) | Information used within these charts was obtained from MarketView. |
(1)The table below shows the change over time in NYMEX - WTI, as reflected in the graph above.
| | | | | | | | | | | | | | | | | | | | | | | | | | | | | | | | | | | |
| (in $/bbl) | Average 2018 | | Average December 2018 | | Average 2019 | | Average December 2019 | | Average 2020 | | Average September 2020 |
| WTI | $ | 64.77 | | | $ | 48.98 | | | $ | 57.03 | | | $ | 61.06 | | | $ | 38.21 | | | $ | 39.63 | |
(2)Information used within these charts was obtained from MarketView.
Nitrogen Fertilizer Segment
InWithin the Nitrogen Fertilizer Segment, earnings and cash flows from operations are primarily affected by the relationship between nitrogen fertilizer product prices, utilization, rates, and operating costs and expenses, including petroleum coke and natural gas feedstock costs.
The price at which nitrogen fertilizer products are ultimately sold depends on numerous factors, including the global supply and demand for nitrogen fertilizer products which, in turn, depends on, among other factors, world grain demand and production levels, changes in world population, the cost and availability of fertilizer transportation infrastructure, weather conditions, the availability of imports, and the extent of government intervention in agriculture markets.
products. Nitrogen fertilizer prices are also affected by local factors, including local market conditions and the operating levels of competing facilities. An expansion or upgrade of competitors’ facilities, new facility development, political and economic developments, and other factors are likely to continue to play an important role in nitrogen fertilizer industry economics. These factors can impact, among other things, the level of inventories in the market, resulting in price volatility and a reduction in product margins. Moreover, the industry typically experiences seasonal fluctuations in demand for nitrogen fertilizer products.
Goodwill and Long-Lived Assets
As of December 31, 2019, the Nitrogen Fertilizer Segment’s Coffeyville, Kansas facility (the “Coffeyville Facility”) reporting unit had a goodwill balance of $41 million for which the estimated fair value had been in excess of carrying value based on our 2018 and 2019 assessments. As a result of lower expectations for market conditions in the fertilizer industry, the market performance of CVR Partners’ common units, a qualitative analysis, and additional risks associated with the business, the Company concluded a triggering event had occurred that required an interim quantitative impairment assessment of goodwill for this reporting unit as of June 30, 2020. The results of the impairment test indicated that the carrying amount of the Coffeyville Facility reporting unit exceeded the estimated fair value of the reporting unit, and a full impairment of the asset was required. Significant assumptions inherent in the valuation methodologies for goodwill include, but are not limited to, prospective financial information, growth rates, discount rates, inflationary factors, and cost of capital. To evaluate the sensitivity of the fair value calculations for the reporting unit, the Company applied a hypothetical 1% favorable change in the weighted average cost of capital, and separately, increased the revenue projections by 10%, holding gross margins steady. The results of these sensitivity analyses confirmed the need to record a full, non-cash impairment charge of $41 million during the three months ended June 30, 2020.
With the adverse economic impacts discussed above and the uncertainty surrounding the COVID-19 pandemic, there is a heightened risk that amounts recognized, including other long-lived assets, may not be recoverable. While our assessment in 2020 has not identified the existence of an impairment indicator for the Nitrogen Fertilizer Segment’s long-lived asset groups, we continue to monitor the current environment, including the duration and breadth of the impacts that the pandemic will have on demand for our fertilizer products, to assess whether qualitative factors indicate a quantitative assessment is required. If a quantitative test is performed, the extent to which the recoverability of our long-lived assets could be impaired is unknown. Such impairment could have a significant adverse impact on our results of operations; however, an impairment would have no impact on our financial condition or liquidity.
Market Conditions
While there is risk of short-termshorter-term volatility given the inherent nature of the commodity cycle and the impacts of the global COVID-19 pandemic, the Company believes the long-term fundamentals for the U.S. nitrogen fertilizer industry remain intact. The Nitrogen Fertilizer Segment views the anticipated combination of (i) increasing global population, (ii) decreasing arable land per capita, (iii) continued evolution to more protein-based diets in developing countries, (iv) sustained use of corn as feedstock for the domestic production of ethanol, and (v) positioning at the lower end of the global cost curve should continue to provide a solid foundation for nitrogen fertilizer producers in the U.SU.S. over the longer term.
While weather conditions in 2020 have exhibited normal patterns, excessive wet conditions significantly impacted the timing of the planting season for corn and soybeans in 2019, which were planted later than normal in the spring leading to a late harvest of these crops in the fall of 2019. As a result, the ammonia application season in the fall of 2019 was shortened creating a surplus of ammonia inventory in the market during the winter of 2019 and into 2020. UAN continues to be impacted by the imposition of import duties on UAN product by the European Union (the “EU”), shifting UAN trade flows for product that had previously been shipped to the EU. In 2020, natural gas prices across the world declined significantly as compared to 2019; however, since the summer of 2020, forward market prices indicate significantly higher prices for 2021 versus historically low prices in 2020. Natural gas is the primary feedstock for production of nitrogen fertilizers. As a result of these factors, the Nitrogen Fertilizer Segment has seen a softening of prices related to these products.
Corn and soybean are two major crops planted by farmers in North America. Corn crops result in the depletion of the amount of nitrogen and ammonia within the soil in which it is grown, while soybeans are able to obtain their own nitrogen through a process known as “N fixation” leaving certain amounts of nitrogen in the soil. As such, upon harvesting of corn, these nutrients need to be replenished after each growing cycle. Further, the relationship between the total acres planted for both corn and soybean has a direct impact on the overall demand for nitrogen products. Due to these factors, nitrogen fertilizer consumers generally operate a balanced corn-soybean rotational planting cycle as evident through the chart presented below for 2020 and 2019.
Ethanol is blended with gasoline to meet renewable fuel standard requirements and for its octane value. Ethanol production has historically consumed approximately 35% of the U.S. corn crop, so demand for corn generally rises and falls with ethanol demand. There has been a decline in the ethanol market due to decreased demand for transportation fuels as a result of the COVID-19 pandemic. While there is uncertainty surrounding if and when gasoline demand will return to normal levels, the
September 30, 20192020 | 3930
2019 Market Conditions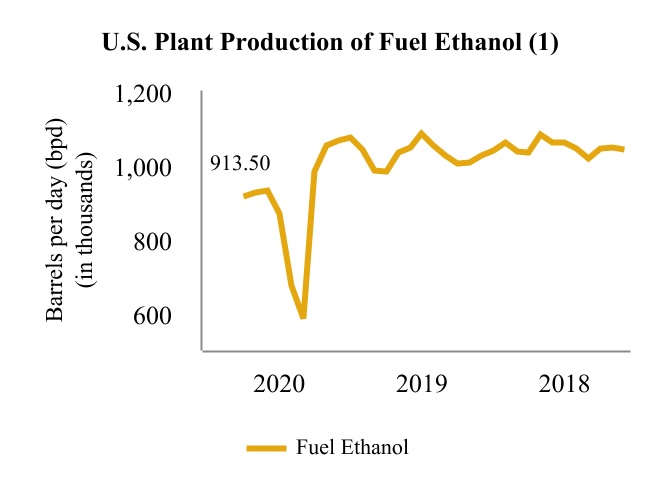
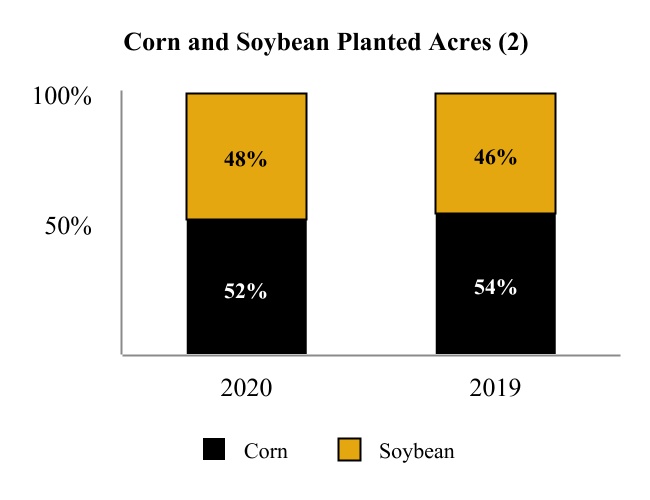
The tabletables below showsshow relevant market indicators for the Nitrogen Fertilizer Segment by month through September 30, 2020:
(1)Information used within this chart was obtained from the U.S. Energy Information Administration (“EIA”).
(2)Information used within this chart was obtained from the USDA, National Agricultural Statistics Services.
(3)Information used within these charts was obtained from various third-party sources, including Green Markets (a Bloomberg Company), Pace Petroleum Coke Quarterly, and the EIA, amongst others.
Results of Operations
Consolidated
Our consolidated results of operations include certain other unallocated corporate activities and the elimination of intercompany transactions and therefore do not equal the sum of the operating results of the Petroleum Segment and Nitrogen Fertilizer Segment.
Consolidated Financial Highlights (Three and Nine Months Ended September 30, 2020 versus September 30, 2019)
(1)See “Non-GAAP Reconciliations” section below for reconciliations of the non-GAAP measures shown above.
Three and Nine Months Ended September 30, 2020 versus September 30, 2019 (Consolidated)
Overview - For the three and nine months ended September 30, 2020, the Company’s operating income decreased by $205 million and $717 million, respectively, resulting in an operating loss of $46 million and $206 million, respectively, as compared to the three and nine months ended September 30, 2019. For the three months ended September 30, 2020, these decreases were driven primarily by a decline in operating results of $212 million within the Petroleum Segment and were partially offset by improved results of $5 million within the Nitrogen Fertilizer Segment. For the nine months ended September 30, 2020, declines in operating results of $653 million and $70 million within the Petroleum and Nitrogen Fertilizer Segments, respectively, were the primary drivers of these decreases. Refer to our discussion of each segment’s results of operations below for further information.
Investment Income from Marketable Securities - During the first quarter of 2020, we acquired a 14.9% ownership interest in Delek US Holdings, Inc. (“Delek”) (NYSE ticker symbol: DK). During the three and nine months ended September 30, 2020, we received $3 million and $7 million, respectively, in dividend income related to the associated common shares owned. The Company recognized an unrealized loss based on market pricing on September 30, 2020 of $68 million and $20 million for the three and nine months ended September 30, 2020, respectively.
Income Tax Expense - Income tax benefit for the three and nine months ended September 30, 2020 was $31 million and $73 million, or 22.2% and 23.1% of loss before income taxes, respectively, as compared to income tax expense for the three and nine months ended September 30, 2019 of $34 million and $110 million, or 25.0% and 24.8% of income before income taxes, respectively. The fluctuation in income tax (benefit) expense was due primarily to changes in pretax income between all periods presented. In addition, the change in the effective tax rate was due primarily to the effects of the Nitrogen Fertilizer Segment’s goodwill impairment recorded during the the second quarter of 2020 and changes in pretax earnings attributable to noncontrolling interests between all periods presented.
Petroleum Segment
The Petroleum Segment utilizes certain inputs within its refining operations. These inputs include crude oil, butanes, natural gasoline, ethanol, and bio-diesel (these are also known as “throughputs”).
Refining Throughput and Production Data by Refinery
| | | | | | | | | | | | | | | | | | | | | | | |
| Throughput Data | Three Months Ended
September 30, | | Nine Months Ended
September 30, |
| (in bpd) | 2020 | | 2019 | | 2020 | | 2019 |
| Coffeyville | | | | | | | |
| Regional crude | 35,769 | | | 41,150 | | | 36,277 | | | 44,238 | |
| WTI | 58,743 | | | 80,717 | | | 42,794 | | | 74,325 | |
| | | | | | | |
| Midland WTI | — | | | 1,436 | | | — | | | 4,959 | |
| Condensate | 13,885 | | | 2,378 | | | 8,502 | | | 3,588 | |
| Heavy Canadian | 22 | | | 4,555 | | | 1,362 | | | 5,199 | |
| Other crude oil | 9,702 | | | — | | | 3,258 | | | — | |
| Other feedstocks and blendstocks | 8,203 | | | 8,455 | | | 7,001 | | | 8,608 | |
| Wynnewood | | | | | | | |
| Regional crude | 57,919 | | | 61,345 | | | 53,057 | | | 52,750 | |
| WTI | — | | | 13 | | | — | | | 4 | |
| WTL | 8,657 | | | — | | | 6,994 | | | — | |
| Midland WTI | — | | | 11,313 | | | 1,573 | | | 12,406 | |
| Condensate | 5,330 | | | 7,435 | | | 7,175 | | | 7,408 | |
| | | | | | | |
| Other feedstocks and blendstocks | 2,936 | | | 3,203 | | | 3,468 | | | 3,579 | |
| Total throughput | 201,168 | | | 222,000 | | | 171,460 | | | 217,064 | |
| | | | | | | | | | | | | | | | | | | | | | | |
| Production Data | Three Months Ended
September 30, | | Nine Months Ended
September 30, |
| (in bpd) | 2020 | | 2019 | | 2020 | | 2019 |
| Coffeyville | | | | | | | |
| Gasoline | 68,572 | | 69,122 | | 53,241 | | 71,144 |
| Distillate | 49,407 | | 58,457 | | 38,976 | | 59,008 |
| Other liquid products | 5,246 | | 7,157 | | 4,328 | | 6,808 |
| Solids | 3,382 | | 4,580 | | 2,836 | | 4,886 |
| Wynnewood | | | | | | | |
| Gasoline | 37,118 | | 42,464 | | 37,334 | | 38,673 |
| Distillate | 32,514 | | 36,555 | | 29,864 | | 32,003 |
| Other liquid products | 2,712 | | 1,756 | | 2,532 | | 3,064 |
| Solids | 23 | | 33 | | 25 | | 31 |
| Total production | 198,975 | | 220,124 | | 169,135 | | 215,617 |
| | | | | | | |
| Light product yield (as % of crude throughput) (1) | 98.7 | % | | 98.2 | % | | 99.0 | % | | 98.0 | % |
| Liquid volume yield (as % of total throughput) (2) | 97.2 | % | | 97.1 | % | | 97.0 | % | | 97.1 | % |
| Distillate yield (as % of crude throughput) (3) | 43.1 | % | | 45.2 | % | | 42.8 | % | | 44.4 | % |
(1)Total Gasoline and Distillate divided by total Regional crude, WTI, WTL, Midland WTI, Condensate, and Heavy Canadian throughput.
(2)Total Gasoline, Distillate, and Other liquid products divided by total throughput.
(3)Total Distillate divided by total Regional crude, WTI, WTL, Midland WTI, Condensate, and Heavy Canadian throughput.
Petroleum SegmentFinancial Highlights (Three and Nine Months Ended September 30, 2020 versus September 30, 2019)
Overview - For the three months ended September 30, 2020, the Petroleum Segment’s operating loss and net loss were $39 million and $33 million, respectively, compared to operating income and net income of $173 million and $170 million, respectively, for the three months ended September 30, 2019. For the nine months ended September 30, 2020, the Petroleum Segment’s operating loss and net loss were $161 million and $156 million, respectively, compared to operating income and net income of $492 million and $478 million, respectively, for the nine months ended September 30, 2019. The declines during both periods were primarily driven by lower sales volumes and unfavorable refining margins when compared to the prior periods.
(1)See “Non-GAAP Reconciliations” section below for reconciliations of the non-GAAP measures shown above.
Net Sales - For the three and nine months ended September 30, 2020, net sales for the Petroleum Segment decreased by $608 million and $1,928 million, respectively, when compared to the three and nine months ended September 30, 2019. These declines were primarily driven by lower sales volumes and prices as a result of reduced demand and excess supply caused by the COVID-19 pandemic. Further, during the second quarter of 2020, the refinery in Coffeyville, Kansas (the “Coffeyville Refinery”) came online after a full, planned turnaround, which began in the first quarter of 2020. Utilization rates were reduced at both refineries throughout the majority of the second quarter of 2020 given market dynamics and remained below full capacity in the third quarter due to naphtha processing constraints driven by tighter heavy crude oil differentials favoring a very light crude slate.
(1)See “Non-GAAP Reconciliations” section below for reconciliations of the non-GAAP measures shown below.
Refining Margin - For the three months ended September 30, 2020, refining margin was $101 million, or $5.47 per throughput barrel, as compared to $334 million, or $16.34 per throughput barrel, for the three months ended September 30, 2019. The decrease in refining margin of $233 million was due to reduced throughput volumes of 20,832 bpd and lower crack spreads. Market volatility in crude oil and refined product pricing continues due to the demand impacts of state-enacted shut down measures, primarily in the second quarter of 2020, to address the COVID-19 pandemic and high inventory levels for crude oil, gasoline, diesel, and jet fuel. Market prices for crude oil partially recovered over the course of the quarter resulting in a $16 million favorable inventory valuation impact during the three months ended September 30, 2020 with an unfavorable inventory valuation impact of $1 million during the same period of 2019. In addition, the Company recognized RINs expense of $36 million, or $1.96 per throughput barrel, and a benefit of $2 million, or $0.12 per throughput barrel, for the three months ended September 30, 2020 and 2019, respectively, primarily related to significantly higher RIN prices during the current quarter.
For the nine months ended September 30, 2020, refining margin was $271 million, or $5.77 per throughput barrel, as compared to $959 million, or $16.18 per throughput barrel, for the nine months ended September 30, 2019. The decrease in refining margin of $688 million was in part due to a reduction in throughput volumes of 45,604 bpd and lower crack spreads. Throughput volumes were impacted in 2020 by the full, planned turnaround at the Coffeyville Refinery that took place from late February 2020 to the middle of April 2020, reduced utilization rates post startup and at the refinery in Wynnewood, Oklahoma (the “Wynnewood Refinery”) through the end of the second quarter, and continued lower rates at the Coffeyville Refinery in the third quarter due to running a very light crude slate. The decline in market pricing for crude oil, and the associated reduction in selling prices experienced at the end of the first quarter of 2020 for refined products, coupled with the demand destruction caused by the COVID-19 pandemic resulted in $74 million of unfavorable inventory impacts, or $1.57 per total throughput barrel. This amount includes an unfavorable lower of cost or net realizable value adjustment of $58 million, based on the difference between the carrying value of inventories accounted for using the first-in-first-out method and selling prices for our refined products experienced subsequent to March 2020. No such loss was recognized in 2019. The 2020 inventory impact includes a $16 million unfavorable impact from the crude oil price change during the nine months ended September 30, 2020 compared to a $31 million favorable impact for the nine months ended September 30, 2019.
In addition, the Company recognized RINs expense of $71 million, or $1.51 per throughput barrel, and $31 million, or $0.52 per throughput barrel, for the nine months ended September 30, 2020 and 2019, respectively, primarily related to significantly higher RIN prices during the current period. Refining margins in the third quarter of 2020 were also impacted negatively compared to 2019, yet positively impacted in 2020 for the nine months ended period, due to changes in derivative gains. There were derivative gains of $5 million and $70 million recognized during the three and nine months ended September 30, 2020, respectively, compared to derivative gains of $18 million and $38 million for the same periods of 2019, respectively. Our derivative gains primarily reflect gains from the sale of WCS barrels at Cushing, hedges of excess inventories, crack spreads swaps, and hedges entered into during 2019 that fixed WCS to WTI differentials for a portion of the WCS barrels we expect in 2020.
(1)Exclusive of depreciation and amortization expense.
Direct Operating Expenses (Exclusive of Depreciation and Amortization) - For the three months ended September 30, 2020, direct operating expenses on a total throughput barrel basis decreased to $4.17 per barrel from $4.46 per barrel, primarily due to lower throughput volumes coupled with reduced personnel costs and lower costs incurred as part of our cost reduction efforts. For the nine months ended September 30, 2020, direct operating expenses on a total throughput barrel basis increased to $5.09 per barrel from $4.53 per barrel, largely due to decreased throughput volumes primarily resulting from the Coffeyville Refinery being in a full, planned turnaround beginning the last week of February 2020 extending into mid-April 2020 and both refineries running at reduced rates given market dynamics. Direct operating expenses (exclusive of depreciation and amortization) were $77 million and $91 million for the three months ended September 30, 2020 and 2019, respectively. The change was primarily a result of decreased personnel costs, repairs and maintenance, and other variable expenses resulting from our cost reduction efforts. For the nine months ended September 30, 2020 and 2019, direct operating expenses (exclusive of depreciation and amortization) were $239 million and $269 million, respectively. The decrease was primarily due to lower natural gas and electricity usage due to the refineries running at reduced rates, coupled with a decrease in personnel costs and repairs and maintenance expense resulting from our cost reduction efforts.
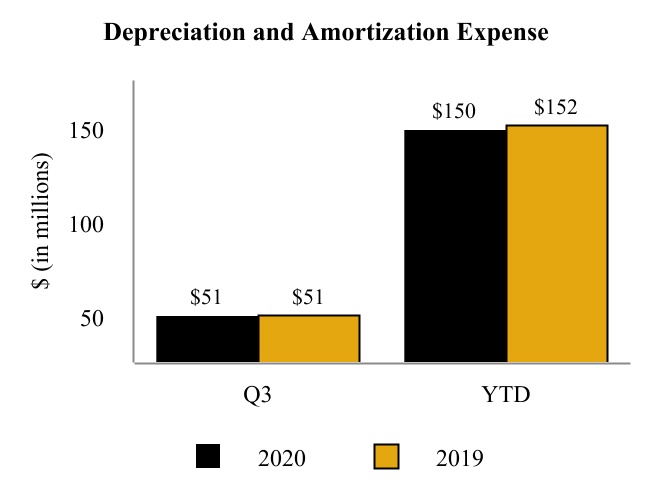
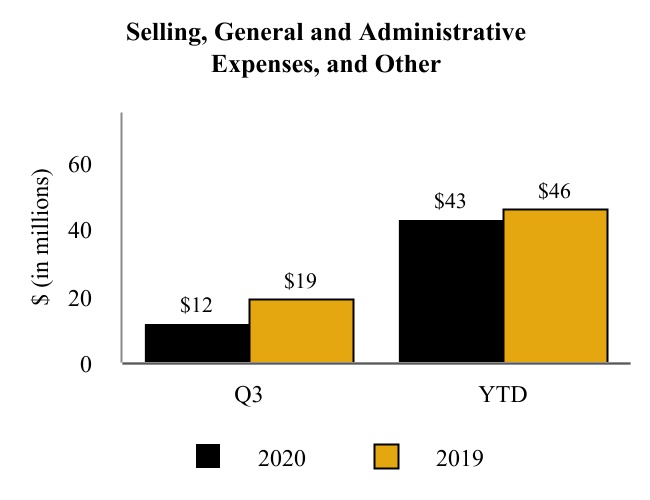
Selling, General, and Administrative Expenses, and Other - For the three and nine months ended September 30, 2020, selling, general and administrative expenses and other were $12 million and $43 million, respectively, compared to $19 million and $46 million for the three and nine months ended September 30, 2019, respectively. The decrease for both periods was primarily a result of decreased corporate allocations and personnel costs in the 2020 periods as compared to the 2019 periods. Additionally, the nine months ended September 30, 2019 includes a $10 million gain on the sale of Cushing tank assets.
Nitrogen Fertilizer Segment
Utilization and Production Volumes - The following tables summarize the ammonia utilization at the Coffeyville Facility and East Dubuque, Illinois facility (the “East Dubuque Facility”). Utilization is an important measure used by management to assess operational output at each of the Nitrogen Fertilizer Segment’s facilities. Utilization is calculated as actual tons of ammonia produced divided by capacity adjusted for planned maintenance and turnarounds.
The presentation of our utilization is on a two-year rolling average which takes into account the impact of our planned and unplanned outages on any specific period. We believe the two-year rolling average is a more useful presentation of the long-term utilization performance of the Nitrogen Fertilizer Segment’s facilities.
Utilization is presented solely on ammonia production, rather than each nitrogen product, as it provides a comparative baseline against industry peers and eliminates the disparity of facility configurations for upgrade of ammonia into other nitrogen products. With efforts primarily focused on ammonia upgrade capabilities, we believe this measure provides a meaningful view of how well we operate.
Gross tons produced for ammonia represent the total ammonia produced, including ammonia produced that was upgraded into other fertilizer products. Net tons available for sale represent the ammonia available for sale that was not upgraded into other fertilizer products. The tables below presents all of these Nitrogen Fertilizer Segment metrics for the three and nine months ended September 30, 2020 and 2019:
Ammonia Utilization
| | | | | | | | | | | | | | | | | |
| | | Two Years Ended September 30 |
| | | | | 2020 | | 2019 | | |
| Consolidated | | | | | 94 | % | | 93 | % | | |
| Coffeyville Facility | | | | | 95 | % | | 95 | % | | |
| East Dubuque Facility | | | | | 94 | % | | 91 | % | | |
Production Volumes
| | | | | | | | | | | | | | | | | | | | | | | |
| Three Months Ended
September 30, | | Nine Months Ended
September 30, |
| (in thousands of tons) | 2020 | | 2019 | | 2020 | | 2019 |
| Ammonia (gross produced) | 215 | | | 196 | | | 631 | | 586 |
| Ammonia (net available for sale) | 71 | | | 56 | | | 228 | | 168 |
| UAN | 330 | | | 318 | | | 968 | | 969 |
On a consolidated basis, the Nitrogen Fertilizer Segment’s utilization increased 1% to 94% for the two years ended September 30, 2020 compared to the two years ended September 30, 2019. The first quarter of 2019 ammonia storage capacity was constrained at the East Dubuque Facility impacting comparability to 2020.
Sales and Pricing per Ton - Two of the Nitrogen Fertilizer Segment‘s key operating metrics are total sales for ammonia and UAN along with the product pricing per ton realized at the gate. Product pricing at the gate represents net sales less freight revenue divided by product sales volume in tons and is shown in order to provide a pricing measure comparable across the fertilizer industry.
| | | | | | | | | | | | | | | | | | | | | | | | | |
| Three Months Ended
September 30, | | Nine Months Ended
September 30, |
| 2020 | | 2019 | | 2020 | | 2019 | | |
| Consolidated sales (thousand tons) | | | | | | | | | |
| Ammonia | 54 | | | 33 | | | 218 | | | 179 | | | |
| UAN | 365 | | | 340 | | | 986 | | | 968 | | | |
| | | | | | | | | |
| Consolidated product pricing at gate (dollars per ton) | | | | | | | | | |
| Ammonia | $ | 242 | | | $ | 337 | | | $ | 293 | | | $ | 416 | | | |
| UAN | 140 | | | 182 | | | 156 | | | 206 | | | |
Feedstock - The Nitrogen Fertilizer Segment’s Coffeyville Facilityutilizes a pet coke gasification process to produce nitrogen fertilizer, while the East Dubuque Facility uses natural gas in its production of ammonia. The table below presents these feedstocks for both facilities within the Nitrogen Fertilizer Segment for the three and nine months ended September 30, 2020 and 2019:
| | | | | | | | | | | | | | | | | | | | | | | |
| Three Months Ended
September 30, | | Nine Months Ended
September 30, |
| 2020 | | 2019 | | 2020 | | 2019 |
| | | | | | | |
| Petroleum coke used in production (thousand tons) | 129 | | | 137 | | | 393 | | | 404 | |
| Petroleum coke (dollars per ton) | $ | 35.11 | | | $ | 37.75 | | | $ | 36.77 | | | $ | 36.68 | |
| Natural gas used in production (thousands of MMBtu) (1) | 2,136 | | | 1,700 | | | 6,408 | | | 5,210 | |
| Natural gas used in production (dollars per MMBtu) (1) | $ | 2.10 | | | $ | 2.40 | | | $ | 2.15 | | | $ | 2.88 | |
| Natural gas cost of materials and other (thousands of MMBtu) (1) | 2,026 | | | 1,294 | | | 6,660 | | | 5,487 | |
| Natural gas cost of materials and other (dollars per MMBtu) (1) | $ | 2.01 | | | $ | 2.46 | | | $ | 2.25 | | | $ | 3.22 | |
| | | | | | | |
| | | | | | | |
| | | | | | | |
| | | | | | | |
| | | | | | | |
| | | | | | | |
| | | | | | | |
(1)The feedstock natural gas shown above does not include natural gas used for fuel. The cost of fuel natural gas is included in Direct operating expenses (exclusive of depreciation and amortization).
Nitrogen Fertilizer Segment Financial Highlights (Three and Nine Months Ended September 30, 2020 versus September 30, 2019)
Overview - For the three months ended September 30, 2020, the Nitrogen Fertilizer Segment’s operating and net loss were $3 million and $19 million, a $5 million and $4 million improvement in operating and net loss, respectively, compared to the three months ended September 30, 2019, driven by lower operating and allocated costs that more than offset lower revenue for both ammonia and UAN compared to the three months ended September 30, 2019. For the nine months ended September 30, 2020, the Nitrogen Fertilizer Segment’s operating and net loss were $34 million and $81 million, a $70 million decrease in operating income and $71 million increase in net loss, respectively, compared to the nine months ended September 30, 2019. These changes were driven primarily by a softening natural gas market and increased imports of UAN, as well as unfavorable ammonia and UAN pricing seen during the second and third quarters of 2020. Additionally, for the nine months ended September 30, 2020, a goodwill impairment of $41 million was recognized.
(1)See “Non-GAAP Reconciliations” section below for reconciliations of the non-GAAP measures shown above.
Net Sales - For the three months ended September 30, 2020, the Nitrogen Fertilizer Segment’s net sales decreased by $10 million to $79 million compared to the three months ended September 30, 2019.This decrease wasprimarily due to unfavorable pricing conditions which contributed $20 million in lower revenues, partially offset by increased sales volumes contributing $12 million, as compared to the three months ended September 30, 2019.
The following table demonstrates the impact of changes in sales volumes and pricing for the primary components of net sales, excluding urea products, freight, and other revenue, for the three months ended September 30, 2020 as compared to the three months ended September 30, 2019:
| | | | | | | | | | | |
| (in millions) | Price
Variance | | Volume
Variance |
| UAN | $ | (15) | | | $ | 5 | |
| Ammonia | (5) | | | 7 | |
The decrease in UAN and ammonia sales pricing for the three months ended September 30, 2020 as compared to the three months ended September 30, 2019 was primarily attributable to competitive pricing pressures seen throughout the domestic and international markets. For UAN, a softening natural gas market, which is the typical feedstock for nitrogen plants, shifting trade flows in UAN due to the imposition of import duties on UAN in the EU, and lower corn prices due to decreased demand for corn for ethanol blending contributed to lower UAN prices. For ammonia, lower natural gas and corn prices and reduced demand for industrial uses of ammonia contributed to lower prices. The increase in both UAN and ammonia sales volumes
between the periods were a result of stronger customer fill demand for both products at the beginning of the third quarter of 2020, which enabled shipments throughout the quarter.
For the nine months ended September 30, 2020, the Nitrogen Fertilizer Segment’s net sales decreased by $58 million to $260 million compared to the nine months ended September 30, 2019.This decrease wasprimarily due to unfavorable pricing conditions which contributed $77 million in lower revenues, partially offset by increased sales volumes contributing $20 million, as compared to the nine months ended September 30, 2019.
The following table demonstrates the impact of changes in sales volumes and pricing for the primary components of net sales, excluding urea products, freight, and other revenue, for the nine months ended September 30, 2020 as compared to the nine months ended September 30, 2019:
| | | | | | | | | | | |
| (in millions) | Price
Variance | | Volume
Variance |
| UAN | $ | (50) | | | $ | 4 | |
| Ammonia | (27) | | | 16 | |
The decrease in UAN and ammonia sales pricing for the nine months ended September 30, 2020 as compared to the nine months ended September 30, 2019 was primarily attributable to the competitive pricing pressures discussed above. For UAN, the softening natural gas markets, shifting trade flows, and lower corn prices seen during the second quarter of 2020 contributed to lower prices. For ammonia, lower natural gas and corn prices and reduced demand for industrial uses of ammonia contributed to lower prices. The increase in both UAN and ammonia sales volumes between the periods were a result of strong customer fill demand at the beginning of the third quarter of 2020, which enabled shipments throughout the quarter, coupled with a stronger spring ammonia run than the same period of 2019.
Cost of Materials and Other - For the three months ended September 30, 2020, cost of materials and other was $22 million, consistent with the same period of 2019. For the nine months ended September 30, 2020, cost of materials and other was $68 million from $71 million for the nine months ended September 30, 2019 as a result of lower natural gas prices at the East Dubuque Facility and fordecreased pet coke costs at the years ended2018 and 2017:Coffeyville Facility.
| |
(1) | Information used in the charts was obtained from various third-party sources, including Pace Petroleum Coke Quarterly, Green Markets (a Bloomberg Company) and the U.S. Energy Information Administration. |
Non-GAAP Measures
Our management uses certain non-GAAP performance measures to evaluate current and past performance and prospects for the future to supplement our GAAP financial information presented in accordance with U.S. GAAP. These non-GAAP financial measures are important factors in assessing our operating results and profitability and include the performance and liquidity measures defined below.
Effective January 1, 2019, the Company revised its accounting policy method for the costs of planned major maintenance activities (turnarounds) specific to the Petroleum Segment from being expensed as incurred (the direct expensing method) to the deferral method. See Note 3 (“Recent Accounting Pronouncements and Accounting Changes”) for a further discussion of the impacts of this change in accounting policy. As a result of this change in accounting policy, the non-GAAP measures of Adjusted EBITDA, Petroleum Adjusted EBITDA, Nitrogen Fertilizer Adjusted EBITDA, Adjusted Net Income (Loss) and Direct Operating Expenses per Total Throughput Barrel net of Turnaround Expense are no longer being presented.
The following are non-GAAP measures that continue to be presented for the period ended September 30, 2019:2020:
EBITDA - Consolidated net income (loss) before (i) interest expense, net, (ii) income tax expense (benefit) and (iii) depreciation and amortization expense.
Petroleum EBITDA and Nitrogen Fertilizer EBITDA - Segment net income (loss) before segment (i) interest expense, net, (ii) income tax expense (benefit), and (iii) depreciation and amortization.
Refining Margin - The difference between our Petroleum Segment net sales and cost of materials and other.
Refining Margin adjusted for Inventory Valuation ImpactImpacts - Refining Margin adjusted to exclude the impact of current period market price and volume fluctuations on crude oil and refined product inventories recognized in prior periods.periods and lower of cost or market reserves, if applicable. We record our commodity inventories on the first-in-first-out basis. As a result, significant current period fluctuations in market prices and the volumes we hold in inventory can have favorable or unfavorable impacts on our refining margins as compared to similar metrics used by other publicly-traded companies in the refining industry. The inventory valuation impact is calculated based upon inventory values at the beginning of the accounting period and at the end of the accounting period.
Refining Margin and Refining Margin adjusted for Inventory Valuation Impact,Impacts, per Throughput Barrel - Refining Margin adjusted to exclude the impact of current period market price and volume fluctuations on crude oil and refined product inventories recognized in prior periods, divided by the total throughput barrels during the period, which is calculated as total throughput barrels per day times the number of days in the period.
Direct Operating Expenses per Throughput Barrel - Direct operating expenses for our Petroleum Segment divided by the total throughput barrels forduring the period, which is calculated as total throughput barrels per day times the number of days in the period.
Free Cash Flow - Net cash provided by (used in) operating activities less capital expenditures and capitalized turnaround expenditures.
We present these measures because we believe they may help investors, analysts, lenders and ratings agencies analyze our results of operations and liquidity in conjunction with our U.S. GAAP results, including but not limited to our operating performance as compared to other publicly-traded companies in the refining industry, without regard to historical cost basis or financing methods and our ability to incur and service debt and fund capital expenditures. Non-GAAP measures have important limitations as analytical tools, because they exclude some, but not all, items that affect net earnings and operating income. These measures should not be considered substitutes for their most directly comparable U.S. GAAP financial measures. See “Non-GAAP Reconciliations” section included herein for reconciliation of these amounts. Due to rounding, numbers presented within this section may not add or equal to numbers or totals presented elsewhere within this document.
Our historical results of operations for the periods presented may not be comparable with prior periods or to our results of operations in the future for the reasons discussed below.
Petroleum Segment
Coffeyville Refinery - Beginning in March 2020, the Coffeyville Refinery had a planned, full facility turnaround lasting 57 days, which was completed in April 2020. During the three and nine months ended September 30, 2020, we capitalized costs of $1 million and $154 million, respectively, related to this planned turnaround.
Nitrogen Fertilizer Segment
Goodwill Impairment
As of June 30, 2020, a full, non-cash impairment charge of $41 million was recorded. Refer to Note 6 (“Goodwill”) to Part I, Item 1 of this Report for further discussion.
Non-GAAP Reconciliations
Reconciliation of Net (Loss) Income to EBITDA
| | | | | | | | | | | | | | | | | | | | | | | |
| Three Months Ended
September 30, | | Nine Months Ended
September 30, |
| (in millions) | 2020 | | 2019 | | 2020 | | 2019 |
| Net (loss) income | $ | (108) | | | $ | 104 | | | $ | (241) | | | $ | 334 | |
| Add: | | | | | | | |
| Interest expense, net | 31 | | | 26 | | | 98 | | | 77 | |
| Income tax (benefit) expense | (31) | | | 34 | | | (73) | | | 110 | |
| Depreciation and amortization | 69 | | | 71 | | | 208 | | | 217 | |
| EBITDA | $ | (39) | | | $ | 235 | | | $ | (8) | | | $ | 738 | |
Results of Operations
Consolidated
Our consolidated results of operations include certain other unallocated corporate activities and the elimination of intercompany transactions and therefore do not equal the sum of the operating results of the Petroleum Segment and Nitrogen Fertilizer Segment.
Consolidated Financial Highlights (three months ended September 30, 2019 versus September 30, 2018)
September 30, 20192020 | 42
Consolidated Financial Highlights (nine months ended September 30, 2019 versus September 30, 2018)
| |
(1) | See “Non-GAAP Reconciliations” section below for reconciliations of the non-GAAP measures shown above. |
Operating Income (Loss) by Segment
|
| | | | | | | | | | | | | | | |
| | Three Months Ended
September 30, | | Nine Months Ended
September 30, |
| (in millions) | 2019 | | 2018 | | 2019 | | 2018 |
| Petroleum | $ | 173 |
| | $ | 167 |
| | $ | 492 |
| | $ | 424 |
|
| Nitrogen Fertilizer | (8 | ) | | 3 |
| | 36 |
| | (2 | ) |
| Other | (6 | ) | | (4 | ) | | (17 | ) | | (13 | ) |
| Consolidated | $ | 159 |
| | $ | 166 |
| | $ | 511 |
| | $ | 409 |
|
EBITDA by Segment (1)
|
| | | | | | | | | | | | | | | |
| | Three Months Ended
September 30, | | Nine Months Ended
September 30, |
| (in millions) | 2019 | | 2018 | | 2019 | | 2018 |
| Petroleum | $ | 228 |
| | $ | 219 |
| | $ | 653 |
| | $ | 576 |
|
| Nitrogen Fertilizer | 11 |
| | 19 |
| | 97 |
| | 51 |
|
| Other | (4 | ) | | (3 | ) | | (12 | ) | | (8 | ) |
| Consolidated | $ | 235 |
| | $ | 235 |
| | $ | 738 |
| | $ | 619 |
|
| |
(1) | See “Non-GAAP Reconciliations” section below for reconciliations of the non-GAAP measures shown above. |
Consolidated Results of Operations
Three Months Ended September 30, 2019 Compared to the Three Months Ended September 30, 2018 (Consolidated)
Overview - For the three months ended September 30, 2019, the Petroleum Segment’s operating income was $6 million higher than the three months ended September 30, 2018, primarily due to a higher refining margin. Refining margin was $334 million, or $16.34 per throughput barrel, as compared to $319 million, or $15.70 per throughput barrel for the three months ended September 30, 2018, primarily due to a decrease in RINs expense resulting from a reduction in 2018 renewable volume obligations (“RVO”) and an increase in gains on derivative transactions. For the three months ended September 30, 2019, the Nitrogen Fertilizer Segment’s net sales increased by $9 million to $89 million primarily due to favorable pricing and higher volumes. The increase in volumes was primarily attributable to inclement weather in the first quarter of 2019 which pushed demand and purchases into the third quarter of 2019.
Income Tax Expense - Income tax expense for the three months ended September 30, 2019 was $34 million, or 25.0% of income before income taxes, as compared to income tax expense for the three months ended September 30, 2018 of $33 million, or 23.1% of income before income taxes. The fluctuation in income tax expense was primarily due to a decrease in noncontrolling interest from the three months ended September 30, 2018 to the three months ended September 30, 2019. The decrease in noncontrolling interest is due to the Company’s January 29, 2019 purchase of all issued and outstanding CVR Refining common units not already owned by the Company. The effective income tax rate varies from the federal statutory income tax rate of 21% primarily as a result of state income tax expense.
Nine Months Ended September 30, 2019 Compared to the Nine Months Ended September 30, 2018 (Consolidated)
Overview - For the nine months ended September 30, 2019, the Petroleum Segment’s operating income was $68 million higher than the nine months ended September 30, 2018, driven primarily by higher refining margins. Refining margin was $959 million, or $16.18 per throughput barrel, as compared to $899 million, or $15.71 per throughput barrel for the nine months ended September 30, 2018. This increase in refining margin of $60 million is primarily due to increased throughput volumes and lower RINs expense resulting from a reduction in 2018 RVOs. Further, there was a gain on the sale of the Cushing, Oklahoma crude oil terminal (occurred in the second quarter of 2019), positively impacting the Petroleum Segment. For the nine months ended September 30, 2019, the Nitrogen Fertilizer Segment net sales increased by $65 million to $318 million as a result of favorable pricing and higher volumes. The increase in volumes was primarily attributable to a shift in demand from the fourth quarter 2018 to the second quarter of 2019 due to inclement weather.
Income Tax Expense - Income tax expense for the nine months ended September 30, 2019 was $110 million, or 24.8% of income before income taxes, as compared to income tax expense for the nine months ended September 30, 2018 of $65 million, or 19.3% of income before income taxes. The fluctuation in income tax expense was due primarily to the increase in pretax income and the decrease in noncontrolling interest from the nine months ended September 30, 2018 to the nine months ended September 30, 2019. The decrease in noncontrolling interest is due to the Company’s January 29, 2019 purchase of all issued and outstanding CVR Refining common units not already owned by the Company. The effective income tax rate varies from the federal statutory income tax rate of 21% primarily as a result of state income tax expense.
Petroleum Segment
Refining Throughput and Production Data by Refinery
|
| | | | | | | | | | | |
| Throughput Data | Three Months Ended
September 30, | | Nine Months Ended
September 30, |
| (in bpd) | 2019 | | 2018 | | 2019 | | 2018 |
| Coffeyville | | | | | | | |
| Regional crude | 41,150 |
| | 31,244 |
| | 44,238 |
| | 29,832 |
|
| WTI | 80,717 |
| | 68,659 |
| | 74,325 |
| | 65,093 |
|
| Midland WTI | 1,436 |
| | 27,889 |
| | 4,959 |
| | 15,012 |
|
| Condensate | 2,378 |
| | 273 |
| | 3,588 |
| | 6,448 |
|
| Heavy Canadian | 4,555 |
| | 6,746 |
| | 5,199 |
| | 4,518 |
|
| Other feedstocks and blendstocks | 8,455 |
| | 7,707 |
| | 8,608 |
| | 7,134 |
|
| Wynnewood | | | | | | | |
| Regional crude | 61,345 |
| | 61,618 |
| | 52,750 |
| | 55,684 |
|
| WTI | 13 |
| | 459 |
| | 4 |
| | 3,148 |
|
| Midland WTI | 11,313 |
| | 3,858 |
| | 12,406 |
| | 11,194 |
|
| Condensate | 7,435 |
| | 8,152 |
| | 7,408 |
| | 6,708 |
|
| Other feedstocks and blendstocks | 3,203 |
| | 4,150 |
| | 3,579 |
| | 4,829 |
|
| Total throughput | 222,000 |
| | 220,755 |
| | 217,064 |
| | 209,600 |
|
|
| | | | | | | | | | | |
| Production Data | Three Months Ended
September 30, | | Nine Months Ended
September 30, |
| (in bpd) | 2019 | | 2018 | | 2019 | | 2018 |
| Coffeyville | | | | | | | |
| Gasoline | 69,122 |
| | 72,337 |
| | 71,144 |
| | 62,543 |
|
| Distillate | 58,457 |
| | 60,521 |
| | 59,008 |
| | 54,914 |
|
| Other liquid products | 7,157 |
| | 4,352 |
| | 6,808 |
| | 6,041 |
|
| Solids | 4,580 |
| | 5,548 |
| | 4,886 |
| | 5,025 |
|
| Wynnewood | | | | | | | |
| Gasoline | 42,464 |
| | 38,750 |
| | 38,673 |
| | 40,715 |
|
| Distillate | 36,555 |
| | 33,635 |
| | 32,003 |
| | 34,410 |
|
| Other liquid products | 1,756 |
| | 3,562 |
| | 3,064 |
| | 4,374 |
|
| Solids | 33 |
| | 35 |
| | 31 |
| | 46 |
|
| Total production | 220,124 |
| | 218,740 |
| | 215,617 |
| | 208,068 |
|
|
| | | | | | | | | | | |
| Liquid volume yield (as % of total throughput) | 97.1 | % | | 96.6 | % | | 97.1 | % | | 96.8 | % |
Financial Highlights (three months ended September 30, 2019 versus September 30, 2018)
Financial Highlights (nine months ended September 30, 2019 versus September 30, 2018)
| |
(1) | See “Non-GAAP Reconciliations” section below for reconciliations of the non-GAAP measures shown above. |
Petroleum Operating Results
|
| | | | | | | | | | | | | | | |
| | Three Months Ended
September 30, | | Nine Months Ended
September 30, |
| (in millions) | 2019 | | 2018 | | 2019 | | 2018 |
| Net sales | $ | 1,535 |
| | $ | 1,857 |
| | $ | 4,484 |
| | $ | 5,139 |
|
| Cost of materials and other | 1,201 |
| | 1,538 |
| | 3,525 |
| | 4,240 |
|
| Direct operating expenses | 91 |
| | 84 |
| | 269 |
| | 268 |
|
| Selling, general and administrative expenses | 18 |
| | 18 |
| | 54 |
| | 56 |
|
| Depreciation and amortization | 51 |
| | 49 |
| | 152 |
| | 146 |
|
| Loss (gain) on asset disposals | 1 |
| | 1 |
| | (8 | ) | | 5 |
|
| Petroleum Operating income | $ | 173 |
| | $ | 167 |
| | $ | 492 |
| | $ | 424 |
|
| | | | | | | | |
| Refining margin | $ | 334 |
| | $ | 319 |
| | $ | 959 |
| | $ | 899 |
|
| Petroleum EBITDA (1) | $ | 228 |
| | $ | 219 |
| | $ | 653 |
| | $ | 576 |
|
| | | | | | | | |
| Key Operating Metrics per Total Throughput Barrel | | | | | | | |
| Refining Margin (1) | $ | 16.34 |
| | $ | 15.70 |
| | $ | 16.18 |
| | $ | 15.71 |
|
| Refining Margin, excluding Inventory Valuation Impacts (1) | $ | 16.37 |
| | $ | 15.57 |
| | $ | 15.65 |
| | $ | 14.93 |
|
| Direct Operating Expenses (1) | $ | 4.46 |
| | $ | 4.13 |
| | $ | 4.53 |
| | $ | 4.69 |
|
| |
(1) | See “Non-GAAP Reconciliations” section below for reconciliations of the non-GAAP measures shown above. |
Three Months Ended September 30, 2019 Compared to the Three Months Ended September 30, 2018 (Petroleum Segment)
Overview - For the three months ended September 30, 2019 the Petroleum Segment’s operating income was $6 million higher than the same period in the prior year, primarily driven by a higher refining margin.
Refining Margin - Refining margin was $334 million, or $16.34 per throughput barrel, as compared to $319 million, or $15.70 per throughput barrel, for the three months ended September 30, 2018, primarily due to increased gains on derivative transactions and a decrease in RIN expense resulting from a reduction in 2018 RVOs, partially offset by decreased Group 3-2-1-1 crack spreads. Gains from derivative transactions increased by $13 million in the third quarter of 2019 compared to the third quarter of 2018, primarily due to increased Canadian crude oil positions. The impact of RIN expense improved refining margin over this period by $22 million. Additionally, the Group 3 2-1-1 crack spread decreased in the three months ended September 30, 2019 by $1.58 per barrel compared to the same period last year, driven by decreases to both gasoline and distillate cracks of $1.53 and $1.62 per barrel, respectively.
Direct Operating Expenses (Exclusive of Depreciation and Amortization) - Direct operating expenses (exclusive of depreciation and amortization) were $91 million for the three months ended September 30, 2019 compared to $84 million for the three months ended September 30, 2018. The increase of approximately $7 million was primarily due to increased personnel costs, partially offset by lower natural gas prices. As a result, direct operating expenses on a total throughput barrel basis increased to $4.46 per barrel from $4.13 per barrel.
Nine Months Ended September 30, 2019 Compared to the Nine Months Ended September 30, 2018 (Petroleum Segment)
Overview - For the nine months ended September 30, 2019, Petroleum Segment operating income was $492 million, a $68 million increase over the nine months ended September 30, 2018 driven primarily by higher refining margins and a gain on the sale of the Cushing, Oklahoma crude oil terminal in the second quarter of 2019.
Refining Margin - Refining margin was $959 million, or $16.18 per throughput barrel, as compared to $899 million, or $15.71 per throughput barrel, for the nine months ended September 30, 2018, primarily due to increased throughput volumes, lower RINs expense resulting from a reduction in 2018 RVOs, and increased Group 3-2-1-1 crack spreads, partially offset by decreased gains on derivatives in the current period. Total throughput averaged 217,000 bpd for the nine months ended September 30, 2019 as
compared to 210,000 bpd for the same period in 2018. RINs expense favorably impacted refining margin in the first nine months of 2019. Costs decreased $16 million to $31 million for the nine months ended September 30, 2019, compared to $47 million for the nine months ended September 30, 2018. The Group 3 2-1-1 crack spread improved in the nine months ended September 30, 2019 by $0.16 per barrel compared to the nine months ended September 30, 2018, driven largely by an increase in the distillate crack spread of $1.18, partially offset by a decrease in the gasoline crack of $0.87. Derivative gains decreased by $37 million in the first nine months of 2019 compared to the first nine months of 2018, primarily due to gains on derivative transactions in 2018.
Direct Operating Expenses (Exclusive of Depreciation and Amortization) - Direct operating expenses (exclusive of depreciation and amortization) were $269 million for the nine months ended September 30, 2019 compared to $268 million for the nine months ended September 30, 2018. The increase of approximately $1 million was primarily due to increased personnel costs, partially offset by decreased environmental expense. Direct operating expenses on a total throughput barrel basis decreased to $4.53 per barrel from $4.69 per barrel largely due to the increased throughput volumes.
Selling, General, and Administrative Expenses, and Other - Selling, general and administrative expenses and other decreased approximately $9 million for the nine months ended September 30, 2019 compared to the nine months ended September 30, 2018. This was primarily a result of the gain on the sale of the Cushing, Oklahoma crude oil terminal in the second quarter of 2019 which contributed $9 million to operating income in 2019.
Nitrogen Fertilizer Segment
Utilization - The following tables summarize the ammonia utilization at the Coffeyville and East Dubuque facilities. Utilization is an important measure used by management to assess operational output at each of the Nitrogen Fertilizer Segment’s facilities. Utilization is calculated as actual tons produced divided by capacity adjusted for planned turnarounds.
We present our utilization on a two-year rolling average to take into account the impact of our planned and unplanned outages on any specific period. We believe the two-year rolling average is a more useful presentation of the long-term utilization performance of the Nitrogen Fertilizer Segment’s plants.
We present utilization solely on ammonia production rather than each nitrogen product as it provides a comparative baseline against industry peers and eliminates the disparity of plant configurations for upgrade of ammonia into other nitrogen products. With efforts primarily focused on Ammonia upgrade capabilities, we believe this measure is the most meaningful in terms of management success in operations.
Consolidated Ammonia Utilization - The Nitrogen Fertilizer Segment’s utilization decreased 2% to 93% for the two years ended September 30, 2019 compared to the two years ended September 30, 2018. This decrease was primarily a result of ammonia
storage capacity constraints at the East Dubuque facility in the first quarter of 2019 due to inclement weather impacting customers’ ability to apply ammonia.
Sales and Pricing per Ton - Two of the Nitrogen Fertilizer Segment‘s key operating metrics are total sales for ammonia and UAN along with the product pricing per ton realized at the gate. Product pricing at the gate represents net sales less freight revenue divided by product sales volume in tons and is shown in order to provide a pricing measure that is comparable across the fertilizer industry.
Operating Highlights (three months ended September 30, 2019 versus September 30, 2018)
Operating Highlights (nine months ended September 30, 2019 versus September 30, 2018)
Production Volumes - Gross tons produced for ammonia represent the total ammonia produced, including ammonia produced, that was upgraded into other fertilizer products. Net tons available for sale represent the ammonia available for sale that was not upgraded into other fertilizer products.
|
| | | | | | | | | | | |
| | Three Months Ended
September 30, | | Nine Months Ended
September 30, |
| (in thousands of tons) | 2019 | | 2018 | | 2019 | | 2018 |
| Ammonia (gross produced) | 196 |
| | 212 |
| | 586 |
| | 584 |
|
| Ammonia (net available for sale) | 56 |
| | 63 |
| | 168 |
| | 187 |
|
| UAN | 318 |
| | 338 |
| | 969 |
| | 919 |
|
Feedstock -Our Coffeyville facilityutilizes a pet coke gasification process to produce nitrogen fertilizer. Our East Dubuque facility uses natural gas in its production of ammonia.
|
| | | | | | | | | | | | | | | |
| | Three Months Ended
September 30, | | Nine Months Ended
September 30, |
| | 2019 | | 2018 | | 2019 | | 2018 |
| Feedstock: | | | | | | | |
| Petroleum coke used in production (thousand tons) | 137 |
| | 117 |
| | 404 |
| | 325 |
|
| Petroleum coke (dollars per ton) | $ | 37.75 |
| | $ | 25.65 |
| | $ | 36.68 |
| | $ | 22.89 |
|
| Natural gas used in production (thousands of MMBtu) (1) | 1,700 |
| | 2,118 |
| | 5,210 |
| | 5,933 |
|
| Natural gas used in production (dollars per MMBtu) (1) | $ | 2.40 |
| | $ | 3.03 |
| | $ | 2.88 |
| | $ | 3.01 |
|
| Natural gas cost of materials and other (thousands of MMBtu) (1) | 1,294 |
| | 1,439 |
| | 5,487 |
| | 5,268 |
|
| Natural gas cost of materials and other (dollars per MMBtu) (1) | $ | 2.46 |
| | $ | 2.98 |
| | $ | 3.22 |
| | $ | 3.03 |
|
| | | | | | | | |
| Reconciliation to net sales (dollars in millions): | | | | | | | |
| Sales net at gate | $ | 78 |
| | $ | 69 |
| | $ | 288 |
| | $ | 223 |
|
| Freight in revenue | 9 |
| | 9 |
| | 24 |
| | 24 |
|
| Other revenue | 2 |
| | 2 |
| | 6 |
| | 6 |
|
| Total net sales | $ | 89 |
| | $ | 80 |
| | $ | 318 |
| | $ | 253 |
|
| |
(1) | The feedstock natural gas shown above does not include natural gas used for fuel. The cost of fuel natural gas is included in direct operating expense (exclusive of depreciation and amortization). |
Financial Highlights (three months ended September 30, 2019 versus September 30, 2018)
Financial Highlights (nine months ended September 30, 2019 versus September 30, 2018)
| |
(2) | See “Non-GAAP Reconciliations” section below for reconciliations of the non-GAAP measures shown above. |
Three Months Ended September 30, 2019 Compared to the Three Months Ended September 30, 2018 (Nitrogen Fertilizer Segment)
Net Sales - Nitrogen Fertilizer Segment net sales increased by $9 million to $89 million for the three months ended September 30, 2019compared to the three months ended September 30, 2018. The increase was primarily due to favorable pricing and volume conditions which contributed $6 million and $3 million, respectively, in higher revenues in the current period as compared to 2018.
The following table demonstrates the impact of changes in sales volumes and pricing for the primary components of net sales, excluding freight, for the three months ended September 30, 2019 as compared to the three months ended September 30, 2018:
|
| | | | | | | |
| (in millions) | Price Variance | | Volume Variance |
| UAN | $ | 4 |
| | $ | 5 |
|
| Ammonia | $ | 2 |
| | $ | (2 | ) |
The increase in UAN and ammonia sales pricing for the three months ended September 30, 2019, as compared to the three months ended September 30, 2018 was primarily attributable to inclement weather throughout the region in the first quarter of 2019, delaying the crop cycle and also continuing nitrogen demand during the three months ended September 30, 2019. As a result of the aforementioned delay in the crop cycle, UAN sales volumes increased for the three months ended September 30, 2019 as compared to the three months ended September 30, 2018.
Cost of Materials and Other - Nitrogen Fertilizer Segment cost of materials and other for the three months ended September 30, 2019 was $22 million compared to $20 million for the three months ended September 30, 2018. The $2 million increase was
comprised of increases in pet coke costs, freight costs, and inventory draw resulting from increased demand totaling $4 million, partially offset by favorable natural gas pricing of $2 million for the three months ended September 30, 2019.
Direct Operating Expenses (Exclusive of Depreciation and Amortization) - Nitrogen Fertilizer Segment direct operating expenses (exclusive of depreciation and amortization) for the three months ended September 30, 2019were $48 million compared to $35 million for the three months ended September 30, 2018. The increase was primarily due to turnaround costs at the East Dubuque facility of $7 million coupled with an inventory draw contributing $4 million due to increased sales in the third quarter of 2019.
Nine Months Ended September 30, 2019 Compared to the Nine Months Ended September 30, 2018 (Nitrogen Fertilizer Segment)
Net Sales-Nitrogen Fertilizer Segment net sales increased by $65 million to $318 million for the nine months ended September 30, 2019 compared to the nine months ended September 30, 2018. This increase wasprimarily due to favorable pricing and volume conditions which contributed $51 million and $15 million, respectively, in higher revenues in the current period as compared to 2018.
The following table demonstrates the impact of changes in sales volumes and pricing for the primary components of net sales, excluding freight, for the nine months ended September 30, 2019 as compared to the nine months ended September 30, 2018:
|
| | | | | | | |
| (in millions) | Price Variance | | Volume Variance |
| UAN | $ | 35 |
| | $ | 7 |
|
| Ammonia | $ | 16 |
| | $ | 8 |
|
The increase in UAN and ammonia sales pricing for the nine months ended September 30, 2019 as compared to the nine months ended September 30, 2018 was primarily attributable to a shift in the timing of demand from the fourth quarter of 2018 to the second quarter of 2019, as customers delayed receipt of nitrogen products due to continued inclement weather. As a result, customer demand for ammonia increased in the second quarter of 2019 as customers attempted to make up for the missed application. In addition, the aforementioned ammonia application coupled with freezing temperatures and flooding throughout the Midwest and Southern Plains in the current period shifted the demand for ammonia, resulting in increased sales volumes for the nine months ended September 30, 2019 compared to the nine months ended September 30, 2018.
Cost of Materials and Other - Cost of materials and other for the nine months ended September 30, 2019 was $71 million, compared to $61 million for the nine months ended September 30, 2018. The $10 million increase was comprised primarily of a $6 million increase in pet coke costs at our Coffeyville facility, coupled with a draw in ammonia inventories as a result of increased sales contributing $5 million.
Direct Operating Expenses (exclusive of depreciation and amortization) - Direct operating expenses (exclusive of depreciation and amortization) for the nine months ended September 30, 2019were $128 million as compared to $121 million for the nine months ended September 30, 2018. The $7 million increase was primarily due to spare part inventory write-offs totaling $1 million, increased personnel costs of $2 million, and an inventory draw contributing $3 million due to increased sales in the second quarter of 2019.
Non-GAAP Reconciliations
Reconciliation of Net IncomeCash Provided By Operating Activities to EBITDAFree Cash Flow
|
| | | | | | | | | | | | | | | |
| | Three Months Ended
September 30, | | Nine Months Ended
September 30, |
| (in millions) | 2019 | | 2018 | | 2019 | | 2018 |
| Net income | $ | 104 |
| | $ | 110 |
| | $ | 334 |
| | $ | 271 |
|
| Add: | | | | | | | |
| Interest expense, net | 26 |
| | 26 |
| | 77 |
| | 79 |
|
| Income tax expense | 34 |
| | 33 |
| | 110 |
| | 65 |
|
| Depreciation and amortization | 71 |
| | 66 |
| | 217 |
| | 204 |
|
| EBITDA | $ | 235 |
| | $ | 235 |
| | $ | 738 |
| | $ | 619 |
|
| | | | | | | | | | | | | | | | | | | | | | | |
| Three Months Ended
September 30, | | Nine Months Ended
September 30, |
| 2020 | | 2019 | | 2020 | | 2019 |
| Net cash provided by operating activities | $ | 111 | | | $ | 269 | | | $ | 62 | | | $ | 653 | |
| Less: | | | | | | | |
| Capital expenditures | (24) | | | (30) | | | (101) | | | (85) | |
| Capitalized turnaround expenditures | (11) | | | — | | | (158) | | | (24) | |
| Free cash flow | $ | 76 | | | $ | 239 | | | $ | (197) | | | $ | 544 | |
Reconciliation of Petroleum Segment Net (Loss) Income to EBITDA
| | | | Three Months Ended
September 30, | | Nine Months Ended
September 30, | | Three Months Ended
September 30, | | Nine Months Ended
September 30, |
| (in millions) | 2019 | | 2018 | | 2019 | | 2018 | (in millions) | 2020 | | 2019 | | 2020 | | 2019 |
| Petroleum net income | $ | 170 |
| | $ | 160 |
| | $ | 478 |
| | $ | 398 |
| |
| Petroleum net (loss) income | | Petroleum net (loss) income | $ | (33) | | | $ | 170 | | | $ | (156) | | | $ | 478 | |
| Add: | | | | | | | | Add: | |
| Interest expense, net | 7 |
| | 10 |
| | 23 |
| | 32 |
| |
| Interest (income) expense, net | | Interest (income) expense, net | (3) | | | 7 | | | (2) | | | 23 | |
| | Depreciation and amortization | 51 |
| | 49 |
| | 152 |
| | 146 |
| Depreciation and amortization | 51 | | | 51 | | | 150 | | | 152 | |
| Petroleum EBITDA | $ | 228 |
| | $ | 219 |
| | $ | 653 |
| | $ | 576 |
| Petroleum EBITDA | $ | 15 | | | $ | 228 | | | $ | (8) | | | $ | 653 | |
Reconciliation of Petroleum Segment Gross Profit to Refining Margin and Refining Margin adjustedAdjusted for inventory valuation impactInventory Valuation Impact
| | | | Three Months Ended
September 30, | | Nine Months Ended
September 30, | | Three Months Ended
September 30, | | Nine Months Ended
September 30, |
| (in millions) | 2019 | | 2018 | | 2019 | | 2018 | (in millions) | 2020 | | 2019 | | 2020 | | 2019 |
| Net sales | $ | 1,535 |
| | $ | 1,857 |
| | $ | 4,484 |
| | $ | 5,139 |
| Net sales | $ | 927 | | | $ | 1,535 | | | $ | 2,556 | | | $ | 4,484 | |
| Cost of materials and other | 1,201 |
| | 1,538 |
| | 3,525 |
| | 4,240 |
| Cost of materials and other | 826 | | | 1,201 | | | 2,285 | | | 3,525 | |
| Direct operating expenses (exclusive of depreciation and amortization as reflected below) | 91 |
| | 84 |
| | 269 |
| | 268 |
| |
| Direct operating expenses (exclusive of depreciation and amortization) | | Direct operating expenses (exclusive of depreciation and amortization) | 77 | | | 91 | | | 239 | | | 269 | |
| | Depreciation and amortization | 51 |
| | 49 |
| | 152 |
| | 146 |
| Depreciation and amortization | 51 | | | 51 | | | 150 | | | 152 | |
| Gross profit | 192 |
| | 186 |
| | 538 |
| | 485 |
| |
| | Gross (loss) profit | | Gross (loss) profit | (27) | | | 192 | | | (118) | | | 538 | |
| Add: | | | | | | | | Add: | |
| Direct operating expenses (exclusive of depreciation and amortization as reflected below) | 91 |
| | 84 |
| | 269 |
| | 268 |
| |
| Direct operating expenses (exclusive of depreciation and amortization) | | Direct operating expenses (exclusive of depreciation and amortization) | 77 | | | 91 | | | 239 | | | 269 | |
| | Depreciation and amortization | 51 |
| | 49 |
| | 152 |
| | 146 |
| Depreciation and amortization | 51 | | | 51 | | | 150 | | | 152 | |
| Refining margin | 334 |
| | 319 |
| | 959 |
| | 899 |
| Refining margin | 101 | | | 334 | | | 271 | | | 959 | |
| Inventory valuation impact, unfavorable (favorable) (1) | 1 |
| | (3 | ) | | (31 | ) | | (45 | ) | |
| Inventory valuation impact, (favorable) unfavorable (1) (2) | | Inventory valuation impact, (favorable) unfavorable (1) (2) | (16) | | | 1 | | | 74 | | | (31) | |
| | Refining margin adjusted for inventory valuation impact | $ | 335 |
| | $ | 316 |
| | $ | 928 |
| | $ | 854 |
| Refining margin adjusted for inventory valuation impact | $ | 85 | | | $ | 335 | | | $ | 345 | | | $ | 928 | |
(1)The Petroleum Segment’s basis for determining inventory value under GAAP is First-In, First-Out (“FIFO”). Changes in crude oil prices can cause fluctuations in the inventory valuation of crude oil, work in process and finished goods, thereby resulting in a favorable inventory valuation impact when crude oil prices increase and an unfavorable inventory valuation impact when crude oil prices decrease. The inventory valuation impact is calculated based upon inventory values at the beginning of the accounting period and at the end of the accounting period. In order to derive the inventory valuation impact per total throughput barrel, we utilize the total dollar figures for the inventory valuation impact and divide by the number of total throughput barrels for the period.
(2)Includes an inventory valuation charge of $58 million recorded in the first quarter of 2020, as inventories were reflected at the lower of cost or net realizable value.No adjustment was necessary as of September 30, 2020, June 30, 2020, or December 31, 2019.
| |
(1) | The Petroleum Segment’s basis for determining inventory value under GAAP is First-In, First-Out (“FIFO”). Changes in crude oil prices can cause fluctuations in the inventory valuation of crude oil, work in process and finished goods, thereby resulting in a favorable inventory valuation impact when crude oil prices increase and an unfavorable inventory valuation impact when crude oil prices decrease. The inventory valuation impact is calculated based upon inventory values at the beginning of the accounting period and at the end of the accounting period. In order to derive the inventory valuation impact per total throughput barrel, we utilize the total dollar figures for the inventory valuation impact and divide by the number of total throughput barrels for the period. |
September 30, 20192020 | 5543
Reconciliation of Petroleum Segment total throughput barrelTotal Throughput Barrels
| | | | Three Months Ended
September 30, | | Nine Months Ended
September 30, | | Three Months Ended
September 30, | | Nine Months Ended
September 30, |
| | 2019 | | 2018 | | 2019 | | 2018 | | 2020 | | 2019 | | 2020 | | 2019 |
| Total throughput barrels per day | 222,000 |
| | 220,755 |
| | 217,064 |
| | 209,600 |
| Total throughput barrels per day | 201,168 | | | 222,000 | | | 171,460 | | | 217,064 | |
| Days in the period | 92 |
| | 92 |
| | 273 |
| | 273 |
| Days in the period | 92 | | | 92 | | | 274 | | | 273 | |
| Total throughput barrels | 20,423,972 |
| | 20,309,500 |
| | 59,258,366 |
| | 57,220,863 |
| Total throughput barrels | 18,507,431 | | | 20,423,972 | | | 46,980,133 | | | 59,258,366 | |
Reconciliation of Petroleum Segment Refining Margin (in millions and on per total throughput barrel basis)Total Throughput Barrel
| | | | Three Months Ended
September 30, | | Nine Months Ended
September 30, | | Three Months Ended
September 30, | | Nine Months Ended
September 30, |
| (in millions, except per total throughput barrel) | 2019 | | 2018 | | 2019 | | 2018 | (in millions, except per total throughput barrel) | 2020 | | 2019 | | 2020 | | 2019 |
| Refining margin | $ | 334 |
| | $ | 319 |
| | $ | 959 |
| | $ | 899 |
| Refining margin | $ | 101 | | | $ | 334 | | | $ | 271 | | | $ | 959 | |
| Divided by: total throughput barrels | 20 |
| | 20 |
| | 59 |
| | 57 |
| Divided by: total throughput barrels | 19 | | | 20 | | | 47 | | | 59 | |
| Refining margin per total throughput barrel | $ | 16.34 |
| | $ | 15.70 |
| | $ | 16.18 |
| | $ | 15.71 |
| Refining margin per total throughput barrel | $ | 5.47 | | | $ | 16.34 | | | $ | 5.77 | | | $ | 16.18 | |
Reconciliation of Petroleum Segment Refining Margin Adjusted for Inventory Valuation Impact (in millions and on per total throughput barrel basis)Total Throughput Barrel
| | | | Three Months Ended
September 30, | | Nine Months Ended
September 30, | | Three Months Ended
September 30, | | Nine Months Ended
September 30, |
| (in millions, except per total throughput barrel) | 2019 | | 2018 | | 2019 | | 2018 | (in millions, except per total throughput barrel) | 2020 | | 2019 | | 2020 | | 2019 |
| Refining margin adjusted for inventory valuation impact | $ | 335 |
| | $ | 316 |
| | $ | 928 |
| | $ | 854 |
| Refining margin adjusted for inventory valuation impact | $ | 85 | | | $ | 335 | | | $ | 345 | | | $ | 928 | |
| Divided by: total throughput barrels | 20 |
| | 20 |
| | 59 |
| | 57 |
| Divided by: total throughput barrels | 19 | | | 20 | | | 47 | | | 59 | |
| Refining margin adjusted for inventory valuation impact per total throughput barrel | $ | 16.37 |
| | $ | 15.57 |
| | $ | 15.65 |
| | $ | 14.93 |
| Refining margin adjusted for inventory valuation impact per total throughput barrel | $ | 4.61 | | | $ | 16.37 | | | $ | 7.34 | | | $ | 15.65 | |
Reconciliation of Petroleum Segment Direct Operating Expenses per total throughput barrel (in millions and on per total throughput barrel basis)Total Throughput Barrel
| | | | Three Months Ended
September 30, | | Nine Months Ended
September 30, | | Three Months Ended
September 30, | | Nine Months Ended
September 30, |
| (in millions, except per total throughput barrel) | 2019 | | 2018 | | 2019 | | 2018 | (in millions, except per total throughput barrel) | 2020 | | 2019 | | 2020 | | 2019 |
| Direct operating expenses (exclusive of depreciation and amortization) | $ | 91 |
| | $ | 84 |
| | $ | 269 |
| | $ | 268 |
| Direct operating expenses (exclusive of depreciation and amortization) | $ | 77 | | | $ | 91 | | | $ | 239 | | | $ | 269 | |
| Divided by: total throughput barrels | 20 |
| | 20 |
| | 59 |
| | 57 |
| Divided by: total throughput barrels | 19 | | | 20 | | | 47 | | | 59 | |
| Direct operating expenses per total throughput barrel | $ | 4.46 |
| | $ | 4.13 |
| | $ | 4.53 |
| | $ | 4.69 |
| Direct operating expenses per total throughput barrel | $ | 4.17 | | | $ | 4.46 | | | $ | 5.09 | | | $ | 4.53 | |
Reconciliation of Nitrogen Fertilizer Segment Net Loss to EBITDA
| | | | Three Months Ended
September 30, | | Nine Months Ended
September 30, | | Three Months Ended
September 30, | | Nine Months Ended
September 30, |
| (in millions) | 2019 | | 2018 | | 2019 | | 2018 | (in millions) | 2020 | | 2019 | | 2020 | | 2019 |
| Nitrogen fertilizer net loss | $ | (23 | ) | | $ | (13 | ) | | $ | (10 | ) | | $ | (49 | ) | Nitrogen fertilizer net loss | $ | (19) | | | $ | (23) | | | $ | (81) | | | $ | (10) | |
| Add: | | | | | | | | Add: | |
| Interest expense, net | 16 |
| | 16 |
| | 47 |
| | 47 |
| Interest expense, net | 16 | | | 16 | | | 47 | | | 47 | |
| | Depreciation and amortization | 18 |
| | 16 |
| | 60 |
| | 53 |
| Depreciation and amortization | 18 | | | 18 | | | 57 | | | 60 | |
| Nitrogen Fertilizer EBITDA | $ | 11 |
| | $ | 19 |
| | $ | 97 |
| | $ | 51 |
| Nitrogen Fertilizer EBITDA | $ | 15 | | | $ | 11 | | | $ | 23 | | | $ | 97 | |
|
September 30, 20192020 | 5644
Liquidity and Capital Resources
Our principal source of liquidity has historically been cash from operations. Our principal uses of cash are for working capital, capital expenditures, funding our debt service obligations, and paying dividends to our stockholders, as further discussed below.
We
The effects of the COVID-19 pandemic have resulted in a significant and swift reduction in U.S. economic activity. For our industry, these effects have predominately resulted in significant changes in crude oil supply, decreases in crude oil and refined product pricing due to dramatic reductions in demand for crude oil and our refined products, primarily gasoline and jet fuel, all of which have caused significant volatility and disruption of the commodity and financial markets. This period of extreme economic disruption, low crude oil and refined product prices, and reduced demand has and is likely to continue to have an impact on our business, results of operations, and access to sources of liquidity.
In view of the uncertainty of the depth and extent of the contraction in demand due to the COVID-19 pandemic, combined with the weaker commodity price environment, we remain focused on safe and reliable operations, cash conservation, and protecting the balance sheet. As a result of these factors, and in light of the uncertainty of the current environment as well as potential future cash requirements of the Company, CVR Energy’s board of directors (the “Board”) reduced the cash dividend declared for the first quarter of 2020 to $0.40 per share and elected not to declare a cash dividend for the second or third quarter of 2020. These decisions support the Company’s continued focus on financial discipline through a balanced approach of stockholder distributions and strategic investments while providing additional flexibility to weather the uncertain environment. The Board will continue to evaluate the economic environment, the Company’s cash needs, optimal uses of cash, and other applicable factors, and may elect to make additional changes to the Company’s dividend in future periods. Additionally, in executing financial discipline, we have announced the following proactive measures:
•The deferment of the majority of our growth capital spending, with the exception of the RDU Project at the Wynnewood Refinery;
•A reduction in the amount of expected maintenance capital expenditures for the remainder of 2020 to only include those projects which are a priority to support continuing safe and reliable operations, or are required to support future activities;
•A reduction in operational and general and administrative costs;
•For the Petroleum Segment, the deferment of the Wynnewood Refinery turnaround from the spring of 2021 to the spring of 2022, resulting in the delay of long-lead expenditures into 2021;
•For the Nitrogen Fertilizer Segment, the deferment of the Coffeyville Facility turnaround from the fall of 2020 to the summer of 2021 and the East Dubuque Facility turnaround from 2021 to 2022;
•Seeking certain tax benefits under the Coronavirus Aid, Relief, and Economic Security Act (the “CARES Act”) by deferring certain payroll taxes otherwise required to be paid in 2020, increasing our business interest deduction, and carrying back our net operating loss generated in 2020; and
•The amendment of the Nitrogen Fertilizer ABL extending its term to September 30, 2022, optimizing the borrowing capacity and fee structure, and revising certain provisions to provide an improved credit facility for the Nitrogen Fertilizer Segment.
When paired with the actions outlined above, we believe that our cash from operations and existing cash and cash equivalents, along with borrowings, as necessary, under the AB Credit Facility andCVR Refining’s Amended and Restated ABL Credit Agreement (the “Petroleum ABL”) and CVR Partners’ ABL Credit Agreement, formerly the AB Credit Facility (the “Nitrogen Fertilizer ABL”), will be sufficient to satisfy anticipated cash requirements associated with our existing operations for at least the next 12 months. However, our future capital expenditures and other cash requirements could be higher than we currently expect as a result of various factors. Additionally, our ability to generate sufficient cash from our operating activities and secure additional financing depends on our future operational performance, which is subject to general economic, political, financial, competitive, and other factors, some of which may be beyond our control.
Depending on the needs of our business, contractual limitations and market conditions, we may from time to time seek to issue equity securities, incur additional debt, issue debt securities, or otherwise refinance our existing debt. There can be no assurance that we will seek to do any of the foregoing or that we will be able to do any of the foregoing on terms acceptable to us or at all.
The Company’s January 2020 offering of $600 million in aggregate principal amount of 5.25% Senior Unsecured Notes due 2025 (the “2025 Notes”), which mature on February 15, 2025, and $400 million in aggregate principal amount of 5.75% Senior Unsecured Notes due 2028 (the “2028 Notes”), which mature on February 15, 2028, along with the associated repayment of the CVR Refining Senior Notes due 2022 (the “2022 Notes”), and amendments to the Nitrogen Fertilizer ABL, collectively represent a material changeschange in the Company’s liquidity fromposition as compared to our 20182019 Form 10-K. See Note 9 (“Long-Term Debt and Finance Lease Obligations”) for further discussion. The Company, and its subsidiaries, were in compliance with all covenants under their respective debt instruments as of September 30, 2019, as applicable.2020.
Cash Balances and Other Liquidity
As of September 30, 2019,2020, we had consolidated cash and cash equivalents of $692$672 million, $393 million available under CVR Refining’s Amendedthe Petroleum ABL, and Restated ABL Credit Facility and $48$25 million available under CVR Partners’ AB Credit Facility.the Nitrogen Fertilizer ABL.
| | | | | | | | | | | |
| (in millions) | September 30, 2020 | | December 31, 2019 |
| CVR Partners: | | | |
| 9.25% Senior Secured Notes, due June 2023 | $ | 645 | | | $ | 645 | |
| 6.50% Senior Notes, due April 2021, net of current portion (1) | — | | | 2 | |
| Unamortized discount and debt issuance costs | (12) | | | (15) | |
| Total CVR Partners debt | $ | 633 | | | $ | 632 | |
| | | |
| CVR Refining: | | | |
| 6.50% Senior Notes, due November 2022 (2) | $ | — | | | $ | 500 | |
| | | |
| Unamortized debt issuance cost | — | | | (3) | |
| | | |
| Total CVR Refining debt | $ | — | | | $ | 497 | |
| | | |
| CVR Energy: | | | |
| 5.25% Senior Notes, due February 2025 | $ | 600 | | | $ | — | |
| 5.75% Senior Notes, due February 2028 | 400 | | | — | |
| Unamortized debt issuance costs | (6) | | | — | |
| Total CVR Energy debt | $ | 994 | | | $ | — | |
| Total long-term debt | $ | 1,627 | | | $ | 1,129 | |
| Current portion of long-term debt (1) | 2 | | | — | |
| Total long-term debt, including current portion | $ | 1,629 | | | $ | 1,129 | |
|
| | | | | | | |
| (in millions) | September 30, 2019 | | December 31, 2018 |
| CVR Partners: | | | |
| 9.25% Senior Secured Notes due June 2023 | $ | 645 |
| | $ | 645 |
|
| 6.50% Senior Notes due April 2021 | 2 |
| | 2 |
|
| Unamortized discount and debt issuance costs | (16 | ) | | (18 | ) |
| Total CVR Partners Debt | $ | 631 |
| | $ | 629 |
|
| | | | |
| CVR Refining: | | | |
| 6.50% Senior Notes due November 2022 | $ | 500 |
| | $ | 500 |
|
| Unamortized debt issuance cost | (3 | ) | | (3 | ) |
| Total CVR Refining Debt | 497 |
| | 497 |
|
| | | | |
| Total Long-Term Debt | $ | 1,128 |
| | $ | 1,126 |
|
(1)The 6.50% Notes, due April 2021, mature within 12 months, and, therefore, the outstanding balance of $2 million has been classified as short-term debt as of September 30, 2020. Amounts reported in Other current liabilities.
(2)On January 27, 2020, the Company redeemed all of the 2022 Notes for a redemption price equal to 101.083%, plus accrued and unpaid interest, on the redeemed notes.
CVR Partners
AB Credit Facility - The Nitrogen Fertilizer Segment has an AB Credit Facility,a 9.25% Senior Secured Notes due 2023, 6.50% Senior Notes due 2021, and the Nitrogen Fertilizer ABL, the proceeds of which may be used to fund working capital, capital expenditures, and for other general corporate purposes. The AB Credit Facility is a senior secured asset-based revolving credit facility with an aggregate principal amount of availability of up to $50 million with an incremental facility, which permits an increase in borrowings of up to $25 million inNitrogen Fertilizer Segment amended and extended the aggregate subject to additional lender commitments and certain other conditions. The AB Credit Facility maturesNitrogen Fertilizer ABL in September 2021.2020. Refer to Note 9 (“Long-Term Debt and Finance Lease Obligations”) to Part I, Item 1 of this Report for further discussion.
The Petroleum Segment has the Petroleum ABL, the proceeds of which may be used to fund working capital, capital expenditures, and for other general corporate purposes. The Company redeemed all of the 2022 Notes in January 2020. Refer to Note 9 (“Long-Term Debt and Finance Lease Obligations”) to Part I, Item 1 of this Report for further discussion.
September 30, 20192020 | 5746
2023
On January 27, 2020, CVR Energy issued the 2025 Notes - CVR Partners issued $645 million aggregate principal amount of 9.25% Senior Secured Notes due 2023 (the “2023 Notes”) in 2016. The 2023 Notes are guaranteed on a senior secured basis by alland 2028 Notes. A portion of the Nitrogen Fertilizer Segment‘s existing subsidiaries. On or after June 15, 2019, we may on any one or more occasions, redeem all or part ofnet proceeds from the 20232025 Notes at the redemption prices set forth below expressed as a percentage of the principal amount of the 2023and 2028 Notes plus accrued and unpaid interest to the applicable redemption date.
|
| |
| 12-month period beginning June 15, | Percentage |
| 2019 | 104.625% |
| 2020 | 102.313% |
| 2021 and thereafter | 100.000% |
Upon the occurrence of certain change of control events as defined in the 2023 Indenture (including the sale of all or substantially all of the properties or assets of the Nitrogen Fertilizer Segment and its subsidiaries taken as a whole), each holder of the 2023 Notes will have the right to require that the Nitrogen Fertilizer Segment repurchase all or a portion of such holder’s 2023 Notes in cash at a purchase price equal to 101% of the aggregate principal amount thereof plus any accrued and unpaid interest to the date of repurchase.
CVR Refining
Amended and Restated ABL Credit Facility - On November 14, 2017, Coffeyville Resources LLC (“CRLLC”), CVR Refining, CVR Refining LLC (“Refining LLC”) and each of the operating subsidiaries of Refining LLC (collectively, the “Credit Parties”) entered into Amendment No. 1 to the Amended and Restated ABL Credit Agreement (the “Amendment”) with a group of lenders and Wells Fargo Bank, National Association, as administrative agent and collateral agent. Such agreement, as amended by the Amendment, was otherwise scheduled to mature in December 2017. The Amended and Restated ABL Credit Facility is a $400 million asset-based revolving credit facility, with sub-limits for letters of credit and swingline loans of $60 million and $40 million, respectively. The Amended and Restated ABL Credit Facility also includes a $200 million uncommitted incremental facility. The proceeds of the loans may be used for capital expenditures, working capital and general corporate purposes. The Amended and Restated ABL Credit Facility matures in November 2022. We were in compliance with all applicable covenants as of September 30, 2019.
2022 Notes - CVR Refining’s $500 million aggregate principal amount of 6.50% Second Lien Senior Notes due 2022 (the “2022 Notes”) are unsecured and fully and unconditionally guaranteed by CVI, CVR Refining and each of Refining LLC’s existing domestic subsidiaries (other than the co-issuer, Coffeyville Finance) on a joint and several basis. The 2022 Notes mature on November 1, 2022, unless earlier redeemed or repurchased by the issuers. Interest is payable on the 2022 Notes semi-annually on May 1 and November 1 of each year, to holders of record at the close of business on April 15 and October 15, as the case may be, immediately preceding each such interest payment date.
Credit Agreement - On January 29, 2019, the Company entered into a credit agreement (the “Credit Agreement”) with Jefferies Finance LLC to provide a term loan credit facility with a maturity date of March 10, 2019. The borrowings under the Credit Agreement of $105 million were used to fund a portionthe redemption of the CVRR Unit Purchase. All amounts were repaid on February 11, 2019.2022 Notes. The remaining net proceeds will be used for general corporate purposes, which may include funding (i) acquisitions, (ii) capital projects, and/or (iii) share repurchases or other distributions to our stockholders. Refer to Part II, Item 8 of our 2019 Form 10-K and Note 9 (“Long-Term Debt and Finance Lease Obligations”) of this Report for further discussion of the issuance of these new notes and the redemption of the 2022 Notes.
Capital Spending
We divide capital spending needs into two categories: maintenance and growth. Maintenance capital spending includes non-discretionary maintenance projects and projects required to comply with environmental, health, and safety regulations. Growth capital projects generally involve an expansion of existing capacity and/or a reduction in direct operating expenses. We undertake growth capital spending based on the expected return on incremental capital employed.
Our total capital expenditures for the nine months ended September 30, 2019,2020, along with our estimated expenditures for 2019,2020, by segment, are as follows:
| | | | | | | | | | | | | | | | | | | | | | | | | | | | | | | | |
| Nine Months Ended
September 30, 2020 Actual | | 2020 Estimate (1) |
| | Maintenance | Growth | Total |
| (in millions) | Maintenance | Growth | Total | | Low | High | Low | High | Low | High |
| Petroleum Segment | $ | 66 | | $ | 14 | | $ | 80 | | | $ | 73 | | $ | 77 | | $ | 13 | | $ | 15 | | $ | 86 | | $ | 92 | |
| Nitrogen Fertilizer Segment | 9 | | 4 | | 13 | | | 13 | | 15 | | 5 | | 6 | | 18 | | 21 | |
| Other (2) | 3 | | — | | 3 | | | 2 | | 3 | | 15 | | 19 | | 17 | | 22 | |
| Total | $ | 78 | | $ | 18 | | $ | 96 | | | $ | 88 | | $ | 95 | | $ | 33 | | $ | 40 | | $ | 121 | | $ | 135 | |
|
| | | | | | | | | | | | | | | | | | | | | | | | | | | | |
| (in millions) | Nine Months Ended
September 30, 2019 Actual | | 2019 Estimate (1) |
| | | Maintenance | Growth | Total |
| | Maintenance | Growth | Total | | Low | High | Low | High | Low | High |
| Petroleum Segment | $ | 58 |
| $ | 7 |
| $ | 65 |
| | $ | 95 |
| $ | 100 |
| $ | 20 |
| $ | 25 |
| $ | 115 |
| $ | 125 |
|
| Nitrogen Fertilizer Segment | 11 |
| 1 |
| 12 |
| | 18 |
| 20 |
| 2 |
| 5 |
| 20 |
| 25 |
|
| Other | 4 |
| — |
| 4 |
| | 10 |
| 15 |
| — |
| — |
| 10 |
| 15 |
|
| Total | $ | 73 |
| $ | 8 |
| $ | 81 |
| | $ | 123 |
| $ | 135 |
| $ | 22 |
| $ | 30 |
| $ | 145 |
| $ | 165 |
|
| |
(1) | Total 2019 estimated capital expenditures includes approximately $4 to 8 million of growth-related projects that will require additional approvals before commencement. |
(2)Includes total 2020 estimated RDU capital expenditures of between $15 and $19 million.
We have reduced our 2020 estimated capital expenditures from the guidance provided in the 2019 Form 10-K, as outlined in our discussion above. Our estimated capital expenditures are subject to further change due to unanticipated changes in the cost, scope, and completion time for capital projects. For example, we may experience unexpected changes in labor or equipment costs necessary to comply with government regulations or to complete projects that sustain or improve the profitability of the refineries or nitrogen fertilizer plants.facilities. We may also accelerate or defer some capital expenditures from time to time. Capital spending for CVR Partners is determined by the board of directors of its general partner.
In theThe Petroleum Segment wecompleted a major scheduled turnaround at the Coffeyville Refinery during the second quarter of 2020. Total capitalized expenditures in 2020, primarily relating to the Coffeyville Refinery turnaround, were $154 million, of which $127 million, $26 million, and $4$1 million was capitalized in the first, second, and third quarters of turnaround expenditures incurred during2020, respectively. During the nine months ended September 30, 2019, and 2018, respectively. The next planned majortotal amounts capitalized relating to turnaround within the Petroleum Segment is at the Coffeyville refinery in 2020 with total estimated expenditures of $130were $27 million, to $140 million, of which $20 million to $25 million is expected to be incurred and capitalized in the second half of 2019. Asprimarily relating to the Nitrogen Fertilizer Segment, the East Dubuque facility began a major scheduled turnaround on September 14, 2019, which was completed in October. We have incurred $7 million in the nine months ended September 30, 2019 related to this turnaround and estimate total costs of approximately $9 million, with the remaining costs to be incurred in the fourth quarter of 2019.Wynnewood Refinery.
Dividends to CVR Energy Stockholders
The following table presents dividends paid to the Company’s stockholders, including Icahn Enterprises L.P. and its affiliates (“IEP”), as of September 30, 2019.
|
| | | | | | | | | | | | | | | | | | |
| | | | | | | Dividends Paid (in millions) |
| Related Period | | Date Paid | | Dividend Per Share | | Stockholders | | IEP | | Total |
| 2018 - 4th Quarter | | March 11, 2019 | | $ | 0.75 |
| | $ | 21 |
| | $ | 54 |
| | $ | 75 |
|
| 2019 - 1st Quarter | | May 13, 2019 | | 0.75 |
| | 21 |
| | 54 |
| | 75 |
|
| 2019 - 2nd Quarter | | August 12, 2019 | | 0.75 |
| | 21 |
| | 54 |
| | 75 |
|
| Total | | | | $ | 2.25 |
| | $ | 63 |
| | $ | 162 |
| | $ | 225 |
|
For the third quarter of 2019, the Company, upon approval by the Company’s board of directors on October 23, 2019, declared a cash dividend of $0.80 per share, or $80 million, which is payable on November 12, 2019 to shareholders of record as of November 4, 2019. Of this amount, IEP will receive $57 million due to its ownership interest in the Company’s shares.
Dividends, if any, including the payment, amount and timing thereof, are subject to change at the discretion of the Company’s BoardBoard. There were no dividends declared or paid by the Company during the three months ended September 30, 2020 related to the second quarter of Directors.2020. No dividends were declared for the third quarter of 2020.
September 30, 20192020 | 5947
The following tables present dividends paid to the Company’s stockholders, including IEP, during 2020 and 2019 (amounts presented in the tables below may not add to totals presented due to rounding).
| | | | | | | | | | | | | | | | | | | | | | | | | | | | | | | | |
| | | | | | Dividends Paid (in millions) |
| Related Period | | Date Paid | | Dividend Per Share | | Stockholders | | IEP | | Total |
| 2019 - 4th Quarter | | March 9, 2020 | | $ | 0.80 | | | $ | 23 | | | $ | 57 | | | $ | 80 | |
| 2020 - 1st Quarter | | May 26, 2020 | | 0.40 | | | 12 | | | 28 | | | 40 | |
| | | | | | | | | | |
| Total | | | | $ | 1.20 | | | $ | 35 | | | $ | 85 | | | $ | 121 | |
| | | | | | | | | | | | | | | | | | | | | | | | | | | | | | | | |
| | | | | | Dividends Paid (in millions) |
| Related Period | | Date Paid | | Dividend Per Share | | Stockholders | | IEP | | Total |
| 2018 - 4th Quarter | | March 11, 2019 | | $ | 0.75 | | | $ | 22 | | | $ | 53 | | | $ | 75 | |
| 2019 - 1st Quarter | | May 13, 2019 | | 0.75 | | | 22 | | | 53 | | | 75 | |
| 2019 - 2nd Quarter | | August 12, 2019 | | 0.75 | | | 22 | | | 53 | | | 75 | |
| 2019 - 3rd Quarter | | November 11, 2019 | | 0.80 | | | 23 | | | 57 | | | 80 | |
| Total | | | | $ | 3.05 | | | $ | 90 | | | $ | 217 | | | $ | 307 | |
Distributions to CVR Partners’ Unitholders
The following table presents distributions paid by CVR Partners to CVR Partners’ unitholders, including amounts received by the Company, as of September 30, 2019.
|
| | | | | | | | | | | | | | | | | | |
| | | | | | | Dividends Paid (in millions) |
| Related Period | | Date Paid | | Dividend Per Common Unit | | Unitholders | | CVR Energy | | Total |
| 2018 - 4th Quarter | | March 11, 2019 | | $ | 0.12 |
| | $ | 9 |
| | $ | 5 |
| | $ | 14 |
|
| 2019 - 1st Quarter | | May 13, 2019 | | 0.07 |
| | 5 |
| | 3 |
| | 8 |
|
| 2019 - 2nd Quarter | | August 12, 2019 | | 0.14 |
| | 11 |
| | 5 |
| | 16 |
|
| Total | | | | $ | 0.33 |
| | $ | 25 |
| | $ | 13 |
| | $ | 38 |
|
For the third quarter of 2019, CVR Partners, upon approval by the Board of Directors of CVR Partners’ general partner on October 22, 2019, declared a distribution of $0.07 per common unit, or $8 million, which will be paid on November 12, 2019 to unitholders of record as of November 4, 2019. Of this amount, we will receive approximately $3 million, with the remaining amount payable to public unitholders.
Distributions, if any, including the payment, amount and timing thereof, are subject to change at the discretion of the Boardboard of Directorsdirectors of its general partner (the “UAN GP Board”). There were no distributions declared or paid by CVR Partners’ general partner.Partners during the nine months ended September 30, 2020 related to the fourth quarter of 2019 or the first and second quarters of 2020, and no distributions were declared for the third quarter of 2020.
The following table presents distributions paid by CVR Partners to its common unitholders, including amounts paid to CVR Energy, during 2019 (amounts presented in table below may not add to totals presented due to rounding).
| | | | | | | | | | | | | | | | | | | | | | | | | | | | | | | | |
| | | | | | Distributions Paid (in thousands) |
| Related Period | | Date Paid | | Distribution Per
Common Unit | | Public Unitholders | | CVR Energy | | Total |
| 2018 - 4th Quarter | | March 11, 2019 | | $ | 0.12 | | | $ | 9 | | | $ | 5 | | | $ | 14 | |
| 2019 - 1st Quarter | | May 13, 2019 | | 0.07 | | | 5 | | | 3 | | | 8 | |
| 2019 - 2nd Quarter | | August 12, 2019 | | 0.14 | | | 10 | | | 5 | | | 16 | |
| 2019 - 3rd Quarter | | November 11, 2019 | | 0.07 | | | 5 | | | 3 | | | 8 | |
| Total | | | | $ | 0.40 | | | $ | 30 | | | $ | 16 | | | $ | 45 | |
Capital Structure
On October 23, 2019, the Board of Directors of the Company authorized a stock repurchase program (the “Stock Repurchase Program”). The Stock Repurchase Program would enable the Company to repurchase up to $300 million of the Company’s common stock. Repurchases under the Stock Repurchase Program may be made from time-to-time through open market transactions, block trades, privately negotiated transactions or otherwise in accordance with applicable securities laws. The timing, price and amount of repurchases (if any) will be made at the discretion of management and are subject to market conditions as well as corporate, regulatory and other considerations. While the Stock Repurchase Program currently has a duration of four years, it does not obligate the Company to acquire any stock and may be terminated by the Board at any time. As of September 30, 2020, the Company has not repurchased any of the Company’s common stock under the Stock Repurchase Program.
On May 6, 2020, the UAN GP Board, on behalf of DirectorsCVR Partners, authorized a unit repurchase program (the “Unit Repurchase Program”). The Unit Repurchase Program enables CVR Partners to repurchase up to $10 million of its common units. During the three and nine months ended September 30, 2020, CVR Partners repurchased 1,403,784 and 2,294,002 common units, respectively, on the open market at a cost of $1 million and $2 million, respectively, inclusive of transaction costs, or an average price of $0.94 and $0.99 per common unit, respectively. At September 30, 2020, CVR Partners had
$8 million in authority remaining under the Unit Repurchase Program. This Unit Repurchase Program does not obligate CVR Partners to acquire any common units and may be cancelled or terminated by the UAN GP Board at any time.
As disclosed in CVR Partners’ Form 8-K filed with the SEC on April 24, 2020, on April 20, 2020, the average closing price of CVR Partners’ common units had fallen below $1.00 per unit over a 30 consecutive trading-day period, which is the minimum average unit price for continued listing on the New York Stock Exchange (the “NYSE”) under Section 802.01C of the NYSE Listed Company Manual. CVR Partners has until January 1, 2021 to regain compliance with this continued listing standard. As of September 30, 2020, the average closing price of CVR Partners’ common units over the preceding consecutive 30 trading-day period remained below $1.00 per common unit.
On November 2, 2020, CVR Partners announced that the UAN GP Board had approved a 1-for-10 reverse split of CVR Partners’ common units to be effective at 5:00 p.m. Eastern Time on November 23, 2020, pursuant to which each ten common units of CVR Partners would be converted into one common unit of the Partnership (the “Reverse Unit Split”). In accordance with CVR Partners’ Agreement of Limited Partnership, as amended, following the Reverse Unit Split, any fractional units of record holders will be rounded up or down, as applicable, to the nearest whole common unit, with any fraction equal to or above 0.5 common units rounding up to the next higher common unit. Following the Reverse Unit Split, the number of CVR Partners common units outstanding would decrease from approximately 111 million common units to approximately 11 million common units, with proportionate adjustments to the common units under CVR Partners’ long-term incentive plan and outstanding awards thereunder.
The UAN GP Board determined the 1-for-10 ratio to be appropriate to meet CVR Partners’ goals of improving the marketability of its common units, regaining compliance with NYSE listing requirements, and reducing the risk of future noncompliance with such listing requirements.
CVR Partners’ common units are expected to begin trading on a split-adjusted basis when markets open on November 24, 2020, under the symbol “UAN” and a new CUSIP number.
Cash Flows
Free cash flow for the nine months ended September 30, 2020 was a use of cash of $197 million as compared to a source of cash of $544 million for the nine months ended September 30, 2019. The significant decline in free cash flow is due to a decline in net income, an increase in capital expenditures, and an increase in turnaround expenditures primarily associated with the Coffeyville Refinery turnaround in the first half of 2020. The following table sets forth our consolidated cash flows for the periods indicated below:
| | | | | | | | | | | | | | | | | |
| Nine Months Ended September 30, |
| (in millions) | 2020 | | 2019 | | Change |
| Net cash provided by (used in): | | | | | |
| Operating activities | $ | 62 | | | $ | 653 | | | $ | (591) | |
| Investing activities | (396) | | | (73) | | | (323) | |
| Financing activities | 361 | | | (556) | | | 917 | |
| Net increase in cash and cash equivalents | $ | 27 | | | $ | 24 | | | $ | 3 | |
|
| | | | | | | | | | | |
| | Nine Months Ended September 30, |
| (in millions) | 2019 | | 2018 | | Change |
| Net cash provided by (used in): | | | | | |
| Operating activities | $ | 653 |
| | $ | 526 |
| | $ | 127 |
|
| Investing activities | (73 | ) | | (74 | ) | | 1 |
|
| Financing activities | (556 | ) | | (232 | ) | | (324 | ) |
| Net increase in cash and cash equivalents | $ | 24 |
| | $ | 220 |
| | $ | (196 | ) |
Operating Activities
The change in operating activities for the nine months ended September 30, 2019,2020, as compared to the nine months ended September 30, 2018,2019, was primarily due to improved operating resultsa decline in net income, excluding non-cash items, of $41$500 million and favorablepaired with unfavorable changes in working capital of $96$92 million associated with the decline in crude oil prices during 2020, partially offset by unfavorablefavorable changes in non-current assets and liabilities of $10$1 million.
September 30, 20192020 | 6049
Investing Activities
The change in net cash used in investing activities for the nine months ended September 30, 2019,2020, as compared to the nine months ended September 30, 20182019 was primarily due to the receiptpurchase of $36Delek common stock for $140 million in the first quarter of proceeds from the sale of Cushing assets net of the carrying value of inventory sold as part of the divestment. These net proceeds were partially offset by2020, an increase in turnaround expenditures of $17$134 million primarily relating to the completion of the Wynnewood refineryCoffeyville Refinery turnaround in the second quarterfirst half of 20192020, a decrease in proceeds from the sale of assets of $35 million, and an increase in capital expenditures of $17$16 million.
Financing Activities
The change in net cash used inprovided by financing activities for the nine months ended September 30, 2019,2020, as compared to the net cash used in financing activities for nine months ended September 30, 2019 was due to increased cash inflows from the private offering of the 2025 Notes and 2028 Notes totaling $1.0 billion in January 2020, a decrease in CVR Energy’s dividends and CVR Partners’ distributions during 2020 of $104 million and $25 million, respectively, along with a decrease in cash outflows from the purchase of remaining CVR Refining’s units outstanding of $301 million during the nine months ended September 30, 2018 was due to $301 million2019 with no corresponding amounts paid in funds used to acquire the remaining CVR Refining common units not otherwise owned2020. Cash provided by us, along with increases in CVR Energy dividends and CVR Partners distributions of $63 million and $25 million, respectively. These increases in cash outflows werefinancing activities is partially offset by distributions paid to CVR Refining public unitholders totaling $67payments of $500 million for the nine months ended September 30, 2018, with no corresponding amount paidredemption of the outstanding 2022 Notes in 2019.January 2020, $5 million in a call premium on the January 2020 extinguishment of the CVR Refining senior notes, the repurchase of CVR Partners’ common units of $2 million, and an increase in other financing activities of $6 million.
Off-Balance Sheet Arrangements
We do not have any “off-balance sheet arrangements” as such term is defined within the rules and regulations of the SEC.
Item 3. Quantitative and Qualitative Disclosures About Market Risk
There have been no material changes to our market risks as of and for the three and nine months ended September 30, 20192020 as compared to the risks discussed in Part II, Item 7A of our 20182019 Form 10-K.
Item 4. Controls and Procedures
Evaluation of Disclosure Controls and Procedures
As of September 30, 2019,2020, we have evaluated, under the direction of our Chief Executive Officer, Chief Financial Officer and Chief Accounting Officer, the effectiveness of our disclosure controls and procedures, as defined in Exchange Act Rule 13a-15(e). Based upon and as of the date of that evaluation, our Chief Executive Officer, Chief Financial Officer and Chief Accounting Officer, concluded that our disclosure controls and procedures were effective to provide reasonable assurance that information required to be disclosed in the reports that we file or submit under the Exchange Act is recorded, processed, summarized and reported within the time periods specified in the Security and Exchange Commission’s rules and forms, and that such information is accumulated and communicated to our management, including our Chief Executive Officer, our Chief Financial Officer and our Chief Accounting Officer, as appropriate, to allow timely decisions regarding required disclosure.
Changes in Internal Control Over Financial Reporting
There have been no changes in our internal controls over financial reporting required by Rule 13a-15 of the Exchange Act that occurred during the fiscal quarter ended September 30, 20192020 that materially affected, or is reasonably likely to materially affect, our internal control over financial reporting. Despite many of our employees working in a remote environment due to the COVID-19 pandemic, we have not experienced any material impact to our internal controls over financial reporting. We are continually monitoring and assessing the COVID-19 pandemic to determine any potential impact on the design and operating effectiveness of our internal controls over financial reporting.
PART II. OTHER INFORMATION
Item 1. Legal Proceedings
See Note 1113 (“Commitments and Contingencies”) to Part I, Item 1 of this Report, which is incorporated by reference into this Part II, Item 1, for a description of certain litigation, legal, and administrative proceedings and environmental matters.
Item 1A. Risk Factors
There have been no material changes fromThe risk factors below should be read in conjunction with the risk factors previously discussed in Part I, Item 1A of our 2019 Form 10-K, which risk factors could also be affected by the potential effects of the outbreak of COVID-19 discussed below. Additional risks and uncertainties, including risks and uncertainties not presently known to us, or that we currently deem immaterial, could also have an adverse effect on our business, financial condition, and/or results of operations.
The COVID-19 pandemic, and actions taken in response thereto, as well as certain developments in the global oil markets have had, and may continue to have, material adverse impacts on the operations, business, financial condition, liquidity, and results of operations of the Company or its customers, suppliers, and other counterparties.
The COVID-19 pandemic and actions of governments and others in response thereto has resulted in significant business and operational disruptions, including business closures, supply chain disruptions, travel restrictions, stay-at-home orders, and limitations on the availability and effectiveness of the workforce. These impacts have negatively impacted and may continue to negatively impact worldwide economic and commercial activity, financial markets, and demand for and prices of crude oil and other petroleum products. These impacts may also potentially precipitate a prolonged economic slowdown and recession. These declines have been further exacerbated by the production dispute between members of OPEC and Russia and the subsequent actions taken by such countries and other countries and crude oil producers as a result thereof.
Declines in the market prices of crude oil and certain other petroleum products below the carrying cost of such commodities in the Company’s inventory have required, and may continue to require, the Company to adjust the value of, and record a loss on, certain inventories, which has had, and may continue to have a negative impact on our operating income. This decline may also adversely impact other areas of our business, our ability to profitably operate our facilities, and our results of operations, such as revenues and cost of sales, and could also result in significant financial constraints on certain producers from which we acquire our crude oil. Such conditions could also result in an increased risk that customers, lenders, and other counterparties may be unable to fulfill their obligations in a timely manner, or at all. Further, if general economic conditions continue to remain uncertain for an extended period of time, our liquidity and ability to repay our outstanding debt may be harmed and the trading price of our common stock, which has seen recent volatility, may decline.
The ultimate impact of the COVID-19 pandemic is unknown and continues to rapidly evolve. The extent to which the COVID-19 pandemic may negatively impact our business and operations will depend on the severity, location, and duration of the effects and spread of COVID-19, the actions undertaken by national, regional, and local governments and health officials to contain such virus or remedy its effects, and if, how quickly and to what extent economic conditions recover and normal business and operating conditions resume.
CVR Partners may fail to regain or maintain compliance with the continued listing standards of the NYSE, which may result in the suspension or delisting of its common units from the NYSE, which suspension or delisting may have, among other negative impacts, a material adverse effect on the value of the CVR Partners assets held by the Company.
As disclosed in CVR Partners’ Form 8-K filed with the “Risk Factors” sectionSEC on April 24, 2020, the average closing price of its common units had fallen below $1.00 per unit over a 30 consecutive trading-day period, which is the minimum average unit price for continued listing on the NYSE under Section 802.01C of the NYSE Listed Company Manual. CVR Services currently owns the general partner and 35% of the outstanding common units of CVR Partners and the suspension or delisting of CVR partners’ common units may have, among other negative conditions, a material adverse effect on the value of the assets held by or distributions paid to CVR Services or the liquidity or financial condition of CVR Partners. While CVR Partners has announced a one-for-ten reverse unit split in our 2018 Form 10-K.an effort to cure this deficiency and regain compliance with the aforementioned listing requirement, there is no guaranty it will be able to do so.
September 30, 20192020 | 6151
See Note 1 (“Organization and Nature of Business”) to Part I, Item 1 of this Report, which is incorporated by reference into this Part II, Item 2, for a discussion of the Company’s Stock Repurchase Program.
Item 5. Other Information
None.
Item 6. Exhibits
| | | | | | | | |
|
| Exhibit Number | | Exhibit Description |
| | |
| 4.1** | | | | Exhibit Description4.1 to the Form 8-K filed on January 27, 2020). |
| 10.1**+ | | |
| 10.2** | | Amendment No. 1 to ABL Credit Agreement, dated as of September 29, 2020, among CVR Partners, LP, CVR Nitrogen, LP, East Dubuque Nitrogen Fertilizers, LLC, CVR Nitrogen Holdings, LLC, Coffeyville Resources Nitrogen Fertilizers, LLC, CVR Nitrogen GP, LLC and CVR Nitrogen Finance Corporation, the lenders party thereto and UBS AG, Stamford Branch, as administrative agent and collateral agent (incorporated by reference toExhibit 10.1 to the Form 8-K filed by CVR Partners, LP on September 30, 2020). |
| 31.1* | | |
| | |
| | |
| | |
101* | | |
| 101* | | The following financial information for CVR Energy, Inc.’s Quarterly Report on Form 10-Q for the quarter ended September 30, 2019 2020formatted in XBRL (“Extensible Business Reporting Language”) includes: (i) Condensed Consolidated Balance Sheets (unaudited), (ii) Condensed Consolidated Statements of Operations (unaudited), (iii) Condensed Consolidated Statements of Comprehensive Income (unaudited), (iv) Condensed Consolidated Statement of Changes in Equity (unaudited), (v) Condensed Consolidated Statements of Cash Flows (unaudited) and (vi) the Notes to Condensed Consolidated Financial Statements (unaudited), tagged in detail. |
| 104* | | Cover Page Interactive Data File (formatted as Inline XBRL and contained in Exhibit 101). |
** Previously filed.
+ Certain portions of this Exhibit have been redacted pursuant to Item 601(b)(10) of Regulation S-K. The Company agrees to furnish an unredacted copy of this Exhibit to the SEC on a confidential basis upon request.
† Furnished herewith.
PLEASE NOTE: Pursuant to the rules and regulations of the SEC, we may file or incorporate by reference agreements as exhibits to the reports that we file with or furnish to the SEC. The agreements are filed to provide investors with information regarding their respective terms. The agreements are not intended to provide any other factual information about the Company, its business or operations. In particular, the assertions embodied in any representations, warranties and covenants contained in the agreements may be subject to qualifications with respect to knowledge and materiality different from those applicable to investors and may be qualified by information in confidential disclosure schedules not included with the exhibits. These disclosure schedules may contain information that modifies, qualifies and creates exceptions to the representations, warranties and covenants set forth in the agreements. Moreover, certain representations, warranties and covenants in the agreements may have been used for the purpose of allocating risk between the parties, rather than establishing matters as facts. In addition, information concerning the subject matter of the representations, warranties and covenants may have changed after the date of the respective agreement, which subsequent information may or may not be fully reflected in the Company’s public disclosures. Accordingly, investors should not rely on the representations, warranties and covenants in the agreements as characterizations of the actual state of facts about the Company, its business or operations on the date hereof.
September 30, 20192020 | 6252
SIGNATURES
Pursuant to the requirements of the Securities Exchange Act of 1934, the registrant has duly caused this report to be signed on its behalf by the undersigned thereunto duly authorized.
| | | | | | | | | | | |
| | | |
| | | |
| | | |
| | | |
| | CVR Energy, Inc. |
| | | |
| | | |
| | | |
October 24, 2019November 3, 2020 | | By: | /s/ Tracy D. Jackson |
| | | Executive Vice President and Chief Financial Officer |
| | | (Principal Financial Officer) |
| | | |
| | | |
October 24, 2019November 3, 2020 | | By: | /s/ Matthew W. Bley |
| | | Chief Accounting Officer and Corporate Controller |
| | | (Principal Accounting Officer) |
| | | |
September 30, 20192020 | 6353