UNITED STATES
SECURITIES AND EXCHANGE COMMISSION
Washington, D.C. 20549
FORM 10-Q
(MARK ONE)
x QUARTERLY REPORT PURSUANT TO SECTION 13, 15(d), OR 37 OF THE
SECURITIES EXCHANGE ACT OF 1934
For the quarterly period ended June 30, 20192020
OR
o TRANSITION REPORT PURSUANT TO SECTION 13 OR 15(d) OF
THE SECURITIES EXCHANGE ACT OF 1934
For the transition period from _____ to _____
Commission file number 000-52313
TENNESSEE VALLEY AUTHORITY
(Exact name of registrant as specified in its charter)
|
| | | | | | | | | | |
A corporate agency of the United States created by an act of Congress (State(State or other jurisdiction of incorporation or organization)
| | | 62-0474417 (I.R.S. Employer Identification No.) |
| | | |
400 W. Summit Hill Drive Knoxville, Tennessee (Address of principal executive offices) | | | 37902 (Zip Code) |
(865) 632-2101
(Registrant's telephone number, including area code)
None
(Former name, former address and former fiscal year, if changed since last report)
Securities registered pursuant to Section 12(b) of the Act |
| | | | | | | |
| Title of each class | Trading Symbol(s) | Name of each exchange on which registered |
| N/A | N/A | N/A |
Indicate by check mark whether the registrant (1) has filed all reports required to be filed by Section 13, 15(d), or 37 of the Securities Exchange Act of 1934 during the preceding 12 months (or for such shorter period that the registrant was required to file such reports), and (2) has been subject to such filing requirements for the past 90 days.
Yes x No o
Indicate by check mark whether the registrant has submitted electronically and posted on its corporate Web site, if any, every Interactive Data File required to be submitted and posted pursuant to Rule 405 of Regulation S-T (§ 232.405 of this chapter) during the preceding 12 months (or for such shorter period that the registrant was required to submit and post such files).
Yes x No o
Indicate by check mark whether the registrant is a large accelerated filer, an accelerated filer, a non-accelerated filer, a smaller reporting company, or an emerging growth company. See the definitions of "large accelerated filer," "accelerated filer," "smaller reporting company," and "emerging growth company" in Rule 12b-2 of the Exchange Act.
Large accelerated filer o Accelerated filer o
Non-accelerated filer x(Do not check if a smaller reporting company) Smaller reporting company o
Emerging growth company o
If an emerging growth company, indicate by check mark if the registrant has elected not to use the extended transition period for complying with any new or revised financial accounting standards provided pursuant to Section 13(a) of the Exchange Act. o
Indicate by check mark whether the registrant is a shell company (as defined in Rule 12b-2 of the Exchange Act).
Yes o No x
|
| | |
| Table of Contents | |
| |
| Page |
GLOSSARY OF COMMON ACRONYMS...................................................................................................................................... | |
FORWARD-LOOKING INFORMATION......................................................................................................................................... | |
GENERAL INFORMATION............................................................................................................................................................ | |
| |
| |
| |
ITEM 1. FINANCIAL STATEMENTS............................................................................................................................................. | |
| |
Consolidated Statements of Comprehensive Income (Loss) (unaudited).............................................................................(Unaudited)............................................................................ | |
Consolidated Balance Sheets (unaudited)............................................................................................................................ (Unaudited)........................................................................................................................... | |
| (Unaudited).......................................................................................................... | |
| (Unaudited)............................................................................ | |
| (Unaudited).................................................................................................... | |
| |
| ITEM 2. MANAGEMENT'S DISCUSSION AND ANALYSIS OF FINANCIAL CONDITION AND RESULTS OF OPERATIONS... | |
Executive Overview............................................................................................................................................................... | |
Results of Operations............................................................................................................................................................ | |
Liquidity and Capital Resources............................................................................................................................................ | |
| Key Initiatives and Challenges.............................................................................................................................................. | |
| Environmental Matters.......................................................................................................................................................... | |
| Legal Proceedings................................................................................................................................................................ | |
Off-Balance Sheet Arrangements.........................................................................................................................................Arrangements.......................................................................................................................................... | |
| |
| |
| Legislative and Regulatory Matters....................................................................................................................................... | |
| |
| |
| |
ITEM 4. CONTROLS AND PROCEDURES.................................................................................................................................. | |
| Disclosure Controls and Procedures..................................................................................................................................... | |
| Changes in Internal Control over Financial Reporting.......................................................................................................... | |
| |
| |
| |
ITEM 1. LEGAL PROCEEDINGS.................................................................................................................................................. | |
| |
ITEM 1A. RISK FACTORS....................................................................................................................................................................................................................................................................................................................... | |
| |
| ITEM 5. OTHER INFORMATION.................................................................................................................................................. | |
| |
ITEM 6. EXHIBITS............................................................................................................................................................................................................................................................................................................................................... | |
| |
SIGNATURES............................................................................................................................................................................... | |
|
| | | | | | | |
| GLOSSARY OF COMMON ACRONYMS | | |
Following are definitions of some of the terms or acronyms that may be used in this Quarterly Report on Form 10-Q for the quarter ended June 30, 20192020 (the "Quarterly Report"): |
| |
| | |
| Term or Acronym | | Definition |
AFUDC | | Allowance for funds used during construction |
AOCIACE | | Affordable Clean Energy |
| ANI | | American Nuclear Insurers |
| AOCI | | Accumulated other comprehensive income (loss) |
| ARO | | Asset retirement obligation |
| ART | | Asset Retirement Trust |
ASLBBonds | | Atomic Safety and Licensing BoardBonds, notes, or other evidences of indebtedness |
BLEUCAA | | Blended low-enriched uranium |
CAA | | Clean Air Act |
CAIRCCR | | Clean Air Interstate Rule |
CCR | | Coal combustion residuals |
CMECEL | | Chilling Effect Letter |
| CME | | Chicago Mercantile Exchange |
CO2 | | Carbon dioxide |
COLCOVID-19 | | Combined construction and operating licenseCoronavirus Disease 2019 |
COLACPP | | Cost-of-living adjustmentClean Power Plan |
| CSAPR | | Cross-State Air Pollution Rule |
| CTs | | Combustion turbine unit(s) |
| CVA | | Credit valuation adjustment |
| CY | | Calendar year |
| DCP | | Deferred Compensation Plan |
| DER | | Distributed energy resources |
| DOE | | Department of Energy |
EAEIS | | Environmental Assessments |
EIS | | Environmental Impact Statement |
EPAELGs | | Effluent Limitation Guidelines |
| EMP | | Electromagnetic pulses |
| EO | | Executive Order |
| EPA | | Environmental Protection Agency |
EPUEPRI | | Electric Power Research Institute |
| EPU | | Extended Power UpdateUprate |
| ESPA | | Early Site Permit Application |
| FASB | | Financial Accounting Standards Board |
FCMFERC | | Futures Commission Merchant |
FERC | | Federal Energy Regulatory Commission |
| FTP | | Financial Trading Program |
| GAAP | | Accounting principles generally accepted in the United States of America |
| GHG | | Greenhouse gas |
GWhGMDs | | Gigawatt hour(s)Geomagnetic disturbances |
HAPGWh | | Gigawatt hour(s) |
| HAP | | Hazardous Air Pollutants |
IRPJSCCG | | Integrated Resource Plan |
JSCCG | | John Sevier Combined Cycle Generation LLC |
| KOC | | Knoxville Office Complex |
kWhkW | | Kilowatt hour(s)Kilowatts |
LPCkWh | | TVA's localKilowatt hours |
| LPC | | Local power company customercustomers |
| MATS | | Mercury and Air Toxics Standards |
| MD&A | | Management's Discussion and Analysis of Financial Condition and Results of Operations |
| mmBtu | | Million British thermal unit(s) |
| | | | | | | | |
| MtM | | Mark-to-market |
| MW | | MegawattMegawatts |
| NAAQS | | National Ambient Air Quality Standards |
| NAV | | Net asset value |
|
| NDT | | |
NDT | | Nuclear Decommissioning Trust |
NEPANEIL | | Nuclear Electric Insurance Limited |
| NEPA | | National Environmental Policy Act |
| NERC | | North American Electric Reliability Corporation |
NOx | | Nitrogen oxide |
| NPDES | | National Pollutant Discharge Elimination System |
| NRC | | Nuclear Regulatory Commission |
NSRNWP | | New Source ReviewNationwide Permit |
| OCI | | Other comprehensive income (loss) |
OCIPPARRS | | Owner Controlled Insurance Program |
PARRS | | Putable Automatic Rate Reset Securities |
| PM | | Particulate matter |
QERQTE | | Quadrennial Energy Review |
QTE | | Qualified technological equipment and software |
REITRCRA | | Real Estate Investment TrustResource Conservation and Recovery Act |
SCCGRECs | | Renewable Energy Certificates |
| SCCG | | Southaven Combined Cycle Generation LLC |
| SCRs | | Selective catalytic reduction systems |
| SEC | | Securities and Exchange Commission |
| SERP | | Supplemental Executive Retirement Plan |
| SHLLC | | Southaven Holdco LLC |
| SIPs | | State implementation plans |
| SMR | | Small modular reactor(s) |
SO2 | | Sulfur dioxide |
TCWNSPC | | Tennessee Clean Water NetworkSummer Place Complex |
TDECSSSL | | Seven States Southaven LLC |
| TDEC | | Tennessee Department of Environment &and Conservation |
TOU | | Time-of-use |
| TVA Act | | The Tennessee Valley Authority Act of 1933, as amended, 16 U.S.C. §§ 831-831ee |
| TVARS | | Tennessee Valley Authority Retirement System |
| U.S. Treasury | | United States Department of the Treasury |
| VIE | | Variable interest entity |
| XBRL | | eXtensible Business Reporting Language |
FORWARD-LOOKING INFORMATION
This Quarterly Report contains forward-looking statements relating to future events and future performance. All statements other than those that are purely historical may be forward-looking statements. In certain cases, forward-looking statements can be identified by the use of words such as "may," "will," "should," "expect," "anticipate," "believe," "intend," "project," "plan," "predict," "assume," "forecast," "estimate," "objective," "possible," "probably," "likely," "potential," "speculate," the negative of such words, or other similar expressions.
Although the Tennessee Valley Authority ("TVA") believes that the assumptions underlying theany forward-looking statements are reasonable, TVA does not guarantee the accuracy of these statements. Numerous factors could cause actual results to differ materially from those in theany forward-looking statements. These factors include, among other things:
•The impact of the Coronavirus Disease 2019 (“COVID-19”) pandemic on TVA's operating results, financial condition, and cash flows, the demand for electricity, TVA’s workforce and operations, the availability of fuel and critical parts, supplies, and services, and the business and financial condition of TVA’s customers and counterparties;
•The duration and severity of the COVID-19 pandemic, actions taken to contain its spread and mitigate its effects, and broader impacts of the COVID-19 pandemic on economic and market conditions, including impacts on interest rates, commodity prices, investment performance, and foreign currency exchange rates;
•New, amended, or existing laws, regulations, or administrative orders or interpretations, including those related to environmental matters, and the costs of complying with these laws, regulations, or administrative orders or interpretations;
•The cost of complying with known, anticipated, or new emissions reduction requirements, some of which could render continued operation of many of TVA's aging coal-fired generation units not cost-effective or result in their removal from service, perhaps permanently;
•Significant reductions in demand for electricity produced through non-renewable or centrally located generation sources that may result from, among other things, economic downturns, increased energy efficiency and conservation, increased utilization of distributed generation and microgrids, and improvements in alternative generation and energy storage technologies;
•Changes in customer preferences for energy produced from cleaner generation sources;
•Changes in technology;
•Actions taken, or inaction, by the U.S. government relating to the national or TVA debt ceiling or automatic spending cuts in government programs;
•Costs or liabilities that are not anticipated in TVA’sTVA's financial statements for third-party claims, natural resource damages, environmental cleanup activities, or fines or penalties associated with unexpected events such as failures of a facility or infrastructure;
•Addition or loss of customers by TVA or TVA's local power company customers ("LPCs");
•Significant delays, cost increases, or cost overruns associated with the construction and maintenance of generation, transmission, navigation, flood control, or related assets;
Changes in•Requirements or decisions changing the amount or timing of funding obligations associated with TVA's pension plans, other post-retirement benefit plans, or health care plans;
•Increases in TVA's financial liabilities for decommissioning its nuclear facilities or retiring other assets;
•Risks associated with the operation of nuclear facilities or other generation and related facilities, including coal combustion residualresiduals ("CCR") facilities, or other facilities;
•Physical attacks on TVA's assets;
•Cyber attacks on TVA's assets or the assets of third parties upon which TVA relies;
•The outcome of legal or administrative proceedings, including the CCR proceedings involving the Gallatin Fossil Plant ("Gallatin") as well as any other CCR proceedings that may be brought in the future;proceedings;
•The failure of TVA's generation, transmission, navigation, flood control, and related assets and infrastructure, including CCR facilities, to operate as anticipated, resulting in lost revenues, damages, or other costs that are not reflected in TVA’sTVA's financial statements or projections;
•Differences between estimates of revenues and expenses and actual revenues earned and expenses incurred;
•Weather conditions;
•Catastrophic events such as fires, earthquakes, explosions, solar events, electromagnetic pulses ("EMP"), geomagnetic disturbances ("GMDs"), droughts, floods, hurricanes, tornadoes, or other casualty events or pandemics, wars, national emergencies, terrorist activities, or other similar events, especially if these events occur in or near TVA's service area;
•Events at a TVA facility, which, among other things, could result in loss of life, damage to the environment, damage to or loss of the facility, and damage to the property of others;
•Events or changes involving transmission lines, dams, and other facilities not operated by TVA, including those that affect the reliability of the interstate transmission grid of which TVA's transmission system is a part and those that increase flows across TVA's transmission grid;
•Disruption of fuel supplies, which may result from, among other things, economic conditions, weather conditions, production or transportation difficulties, labor challenges, or environmental laws or regulations affecting TVA's fuel suppliers or transporters;
•Purchased power price volatility and disruption of purchased power supplies;
•Events which affect the supply of water for TVA's generation facilities;
•Changes in TVA's determinations of the appropriate mix of generation assets;
•Ineffectiveness of TVA's efforts at adapting its organization to an evolving marketplace and remaining cost competitive;
•Inability to use regulatory accounting or loss of regulatory accounting approval for certain costs;
•Inability to obtain, or loss of, regulatory approval for the construction or operation of assets;
Inability to use regulatory accounting or loss of regulatory accounting approval for certain costs;
•The requirement or decision to make additional contributions to TVA's Nuclear Decommissioning Trust ("NDT"), or Asset Retirement Trust ("ART"), or pension plans;;
•Limitations on TVA's ability to borrow money which may result from, among other things, TVA's approaching or substantially reaching the limit on bonds, notes, and other evidences of indebtedness specified in the Tennessee Valley Authority Act of 1933, as amended (the “TVA Act”("TVA Act");
•An increase in TVA's cost of capital that may result from, among other things, changes in the market for TVA's debt securities, changes in the credit rating of TVA or the U.S. government, or, potentially, an increased reliance by TVA on alternative financing should TVA approach its debt limit;
•Changes in the economy and volatility in financial markets;
•Reliability or creditworthiness of counterparties;
•Changes in the market price of commodities such as coal, uranium, natural gas, fuel oil, crude oil, construction materials, reagents, electricity, or emission allowances;
•Changes in the market price of equity securities, debt securities, or other investments;
•Changes in interest rates, currency exchange rates, or inflation rates;
•Ineffectiveness of TVA's disclosure controls and procedures or its internal control over financial reporting;
•Inability to eliminate identified deficiencies in TVA's systems, standards, controls, or corporate culture;
•Inability to attract or retain a skilled workforce;
•Inability to respond quickly enough to current or potential customer demands or needs;
•Events at a nuclear facility, whether or not operated by or licensed to TVA, which, among other things, could lead to increased regulation or restriction on the construction, ownership, operation, or decommissioning of nuclear facilities or on the storage of spent fuel, obligate TVA to pay retrospective insurance premiums, reduce the availability and affordability of insurance, increase the costs of operating TVA's existing nuclear units, or cause TVA to forego future construction at these or other facilities;
•Loss of quorum of the TVA Board of Directors (the "TVA("TVA Board");
•Changes in the priorities of the TVA Board or TVA senior management; or
•Other unforeseeable events.
See also Item 1A, Risk Factors, and Item 7, Management's Discussion and Analysis of Financial Condition and Results of Operations in TVA's Annual Report on Form 10-K10-K/A for the year ended September 30, 20182019 (the "Annual Report"), and Part I, Item 2, Management's Discussion and Analysis of Financial Condition and Results of Operations, and Part II, Item 1A, Risk Factors in this Quarterly Report for a discussion of factors that could cause actual results to differ materially from those in aany forward-looking statement. New factors emerge from time to time, and it is not possible for TVA to predict all such factors or to assess the extent to which any factor or combination of factors may impact TVA's business or cause results to differ materially from those contained in any forward-looking statement. TVA undertakes no obligation to update any forward-looking statement to reflect developments that occur after the statement is made.
GENERAL INFORMATION
Fiscal Year
References to years (2019, 2018,(2020, 2019, etc.) in this Quarterly Report are to TVA's fiscal years ending September 30. Years that are preceded by "CY" are references to calendar years.
Notes
References to "Notes" are to the Notes to Consolidated Financial Statements contained in Part I, Item 1, Financial Statements in this Quarterly Report.
Available Information
TVA's Annual Reports on Form 10-K, Quarterly Reports on Form 10-Q, Current Reports on Form 8-K, and all amendments to those reports, are available on TVA's website, free of charge, as soon as reasonably practicable after such reports are electronically filed with or furnished to the Securities and Exchange Commission ("SEC"). TVA's website is www.tva.gov. Information contained on TVA's website shall not be deemed to be incorporated into, or to be a part of, this Quarterly Report. All TVA SEC reports are available to the public without charge from the website maintained by the SEC at www.sec.gov.
PART I - FINANCIAL INFORMATION
ITEM 1. FINANCIAL STATEMENTS
TENNESSEE VALLEY AUTHORITY
CONSOLIDATED STATEMENTS OF OPERATIONS (Unaudited)
| | | | Three Months Ended June 30 | | Nine Months Ended June 30 | | Three Months Ended June 30 | | | Nine Months Ended June 30 | |
| | 2019 | | 2018 | | 2019 | | 2018 | | 2020 | | 2019 | | 2020 | | 2019 |
| Operating revenues | | | | | | | | Operating revenues | | | | | | | |
| Revenue from sales of electricity | $ | 2,565 |
| | $ | 2,669 |
| | $ | 7,958 |
| | $ | 7,931 |
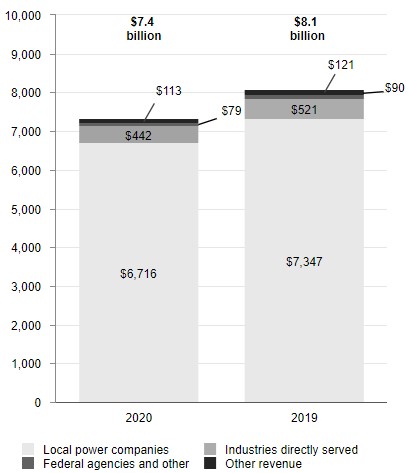
| Revenue from sales of electricity | $ | 2,216 | | | $ | 2,565 | | | $ | 7,237 | | | $ | 7,958 | |
| Other revenue | 39 |
| | 38 |
| | 121 |
| | 117 |
| Other revenue | 35 | | | 39 | | | 113 | | | 121 | |
| Total operating revenues | 2,604 |
|
| 2,707 |
|
| 8,079 |
|
| 8,048 |
| Total operating revenues | 2,251 | | | 2,604 | | | 7,350 | | | 8,079 | |
| Operating expenses | |
| | |
| | |
| | |
| Operating expenses | | | | | | | |
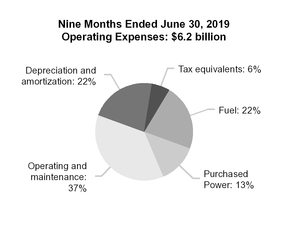
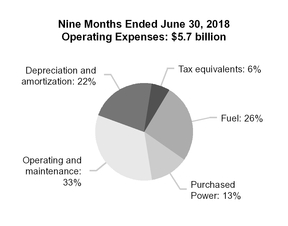
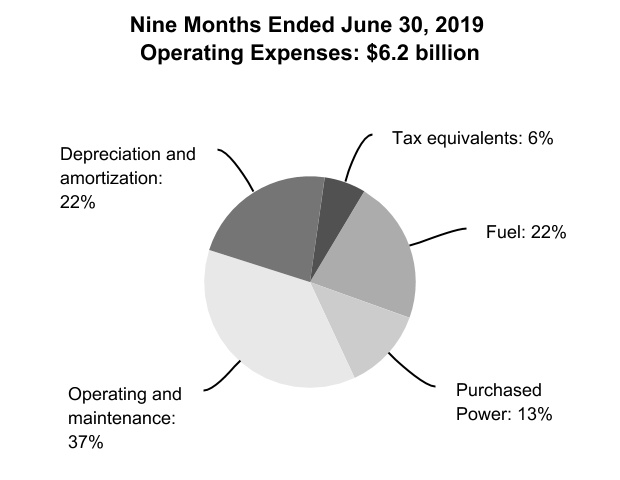
| Fuel | 417 |
| | 503 |
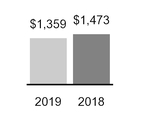
| | 1,359 |
| | 1,473 |
| Fuel | 312 | | | 417 | | | 1,164 | | | 1,359 | |
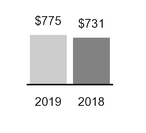
| Purchased power | 223 |
| | 238 |
| | 775 |
| | 731 |
| Purchased power | 209 | | | 223 | | | 680 | | | 775 | |
| Operating and maintenance | 744 |
| | 603 |
| | 2,289 |
| | 1,881 |
| Operating and maintenance | 681 | | | 744 | | | 2,014 | | | 2,289 | |
| Depreciation and amortization | 576 |
| | 404 |
| | 1,387 |
| | 1,263 |
| Depreciation and amortization | 389 | | | 576 | | | 1,430 | | | 1,387 | |
| Tax equivalents | 128 |
| | 129 |
| | 396 |
| | 379 |
| Tax equivalents | 125 | | | 128 | | | 388 | | | 396 | |
| Total operating expenses | 2,088 |
| | 1,877 |
| | 6,206 |
| | 5,727 |
| Total operating expenses | 1,716 | | | 2,088 | | | 5,676 | | | 6,206 | |
| Operating income | 516 |
| | 830 |
| | 1,873 |
| | 2,321 |
| Operating income | 535 | | | 516 | | | 1,674 | | | 1,873 | |
| Other income (expense), net | 14 |
| | 11 |
| | 52 |
| | 34 |
| Other income (expense), net | 16 | | | 14 | | | 27 | | | 52 | |
| Other net periodic benefit cost | 65 |
| | 65 |
| | 194 |
| | 193 |
| Other net periodic benefit cost | 63 | | | 65 | | | 190 | | | 194 | |
| Interest expense | 300 |
| | 306 |
| | 902 |
| | 942 |
| Interest expense | 283 | | | 300 | | | 859 | | | 902 | |
| Net income (loss) | $ | 165 |
| | $ | 470 |
| | $ | 829 |
| | $ | 1,220 |
| Net income (loss) | $ | 205 | | | $ | 165 | | | $ | 652 | | | $ | 829 | |
| The accompanying notes are an integral part of these consolidated financial statements. | The accompanying notes are an integral part of these consolidated financial statements. | The accompanying notes are an integral part of these consolidated financial statements. | |
TENNESSEE VALLEY AUTHORITY
CONSOLIDATED STATEMENTS OF COMPREHENSIVE INCOME (LOSS) (Unaudited)
(in millions)
| | | | | | | | | | | | | | | | | | | | | | | |
| | Three Months Ended June 30 | | | | Nine Months Ended June 30 | | |
| | 2020 | | 2019 | | 2020 | | 2019 |
| Net income (loss) | $ | 205 | | | $ | 165 | | | $ | 652 | | | $ | 829 | |
| Other comprehensive income (loss) | | | | | | | |
| Net unrealized gain (loss) on cash flow hedges | 31 | | | (47) | | | (56) | | | (76) | |
| Net unrealized (gain) loss reclassified to earnings from cash flow hedges | (7) | | | 13 | | | (10) | | | 17 | |
| Total other comprehensive income (loss) | 24 | | | (34) | | | (66) | | | (59) | |
| Total comprehensive income (loss) | $ | 229 | | | $ | 131 | | | $ | 586 | | | $ | 770 | |
| The accompanying notes are an integral part of these consolidated financial statements. | | | | | | | |
|
| | | | | | | | | | | | | | | |
| | Three Months Ended June 30 | | Nine Months Ended June 30 |
| | 2019 | | 2018 | | 2019 | | 2018 |
| Net income (loss) | $ | 165 |
| | $ | 470 |
| | $ | 829 |
| | $ | 1,220 |
|
| Other comprehensive income (loss) | | | | | | | |
| Net unrealized gain (loss) on cash flow hedges | (47 | ) | | (65 | ) | | (76 | ) | | 17 |
|
| Reclassification to earnings from cash flow hedges | 13 |
| | 43 |
| | 17 |
| | 13 |
|
| Total other comprehensive income (loss) | (34 | ) | | (22 | ) | | (59 | ) | | 30 |
|
| Total comprehensive income (loss) | $ | 131 |
| | $ | 448 |
| | $ | 770 |
| | $ | 1,250 |
|
| The accompanying notes are an integral part of these consolidated financial statements. |
TENNESSEE VALLEY AUTHORITY
CONSOLIDATED BALANCE SHEETS (Unaudited)
(in millions)
| | | | | | | | | | | |
| ASSETS | | | |
| | June 30, 2020 | | September 30, 2019 |
| Current assets | | | |
| Cash and cash equivalents | $ | 800 | | | $ | 299 | |
| | | |
| | | |
| Accounts receivable, net | 1,364 | | | 1,739 | |
| Inventories, net | 1,060 | | | 999 | |
| Regulatory assets | 149 | | | 156 | |
| Other current assets | 90 | | | 85 | |
| Total current assets | 3,463 | | | 3,278 | |
| | | |
| Property, plant, and equipment | | | |
| Completed plant | 64,027 | | | 62,944 | |
| Less accumulated depreciation | (32,753) | | | (31,384) | |
| Net completed plant | 31,274 | | | 31,560 | |
| Construction in progress | 2,088 | | | 1,893 | |
| Nuclear fuel | 1,533 | | | 1,534 | |
| Finance leases | 139 | | | 146 | |
| Total property, plant, and equipment, net | 35,034 | | | 35,133 | |
| | | |
| Investment funds | 2,991 | | | 2,968 | |
| | | |
| Regulatory and other long-term assets | | | |
| Regulatory assets | 9,251 | | | 8,763 | |
| Operating lease assets, net of amortization | 332 | | | — | |
| Other long-term assets | 339 | | | 325 | |
| Total regulatory and other long-term assets | 9,922 | | | 9,088 | |
| | | |
| Total assets | $ | 51,410 | | | $ | 50,467 | |
| The accompanying notes are an integral part of these consolidated financial statements. | | | |
|
| | | | | | | |
| ASSETS |
| | June 30, 2019 |
| September 30, 2018 |
| Current assets | |
| |
| Cash and cash equivalents | $ | 300 |
| | $ | 299 |
|
| Accounts receivable, net | 1,551 |
| | 1,657 |
|
| Inventories, net | 1,051 |
| | 961 |
|
| Regulatory assets | 183 |
| | 414 |
|
| Other current assets | 87 |
| | 86 |
|
| Total current assets | 3,172 |
| | 3,417 |
|
| | | | |
| Property, plant, and equipment | |
| | |
|
| Completed plant | 62,716 |
| | 61,114 |
|
| Less accumulated depreciation | (30,928 | ) | | (29,335 | ) |
| Net completed plant | 31,788 |
| | 31,779 |
|
| Construction in progress | 1,783 |
| | 1,999 |
|
| Nuclear fuel | 1,408 |
| | 1,487 |
|
| Capital leases | 146 |
| | 149 |
|
| Total property, plant, and equipment, net | 35,125 |
| | 35,414 |
|
| | | | |
| Investment funds | 2,899 |
| | 2,862 |
|
| | | | |
| Regulatory and other long-term assets | |
| | |
|
| Regulatory assets | 6,755 |
| | 6,612 |
|
| Other long-term assets | 324 |
| | 362 |
|
| Total regulatory and other long-term assets | 7,079 |
| | 6,974 |
|
| | | | |
| Total assets | $ | 48,275 |
| | $ | 48,667 |
|
| The accompanying notes are an integral part of these consolidated financial statements. |
TENNESSEE VALLEY AUTHORITY
CONSOLIDATED BALANCE SHEETS (Unaudited)
(in millions)
| | | | | | | | | | | |
| LIABILITIES AND PROPRIETARY CAPITAL | | | |
| June 30, 2020 | | September 30, 2019 |
| Current liabilities | | | |
| Accounts payable and accrued liabilities | $ | 2,055 | | | $ | 1,812 | |
| | | |
| Accrued interest | 280 | | | 296 | |
| Current portion of leaseback obligations | 177 | | | 40 | |
| | | |
| Regulatory liabilities | 197 | | | 150 | |
| Short-term debt, net | 777 | | | 922 | |
| Current maturities of power bonds | 1,917 | | | 1,030 | |
| Current maturities of long-term debt of variable interest entities | 40 | | | 39 | |
| Current maturities of notes payable | — | | | 23 | |
| Total current liabilities | 5,443 | | | 4,312 | |
| | | |
| Other liabilities | | | |
| Post-retirement and post-employment benefit obligations | 5,912 | | | 6,181 | |
| Asset retirement obligations | 5,805 | | | 5,453 | |
| Operating lease liabilities | 244 | | | — | |
| Other long-term liabilities | 2,748 | | | 2,490 | |
| Leaseback obligations | 46 | | | 223 | |
| | | |
| | | |
| Regulatory liabilities | 5 | | | — | |
| Total other liabilities | 14,760 | | | 14,347 | |
| | | |
| Long-term debt, net | | | |
| Long-term power bonds, net | 17,932 | | | 19,094 | |
| Long-term debt of variable interest entities, net | 1,069 | | | 1,089 | |
| | | |
| Total long-term debt, net | 19,001 | | | 20,183 | |
| | | |
| Total liabilities | 39,204 | | | 38,842 | |
| | | |
| Contingencies and legal proceedings (Note 20) | | | |
| | | |
| Proprietary capital | | | |
| Power program appropriation investment | 258 | | | 258 | |
| Power program retained earnings | 11,476 | | | 10,823 | |
| Total power program proprietary capital | 11,734 | | | 11,081 | |
| Nonpower programs appropriation investment, net | 550 | | | 556 | |
| Accumulated other comprehensive income (loss) | (78) | | | (12) | |
| Total proprietary capital | 12,206 | | | 11,625 | |
| | | |
| Total liabilities and proprietary capital | $ | 51,410 | | | $ | 50,467 | |
| The accompanying notes are an integral part of these consolidated financial statements. | | | |
|
| | | | | | | |
| LIABILITIES AND PROPRIETARY CAPITAL |
| | June 30, 2019 | | September 30, 2018 |
| Current liabilities | | | |
| Accounts payable and accrued liabilities | $ | 1,739 |
| | $ | 1,982 |
|
| Accrued interest | 287 |
| | 305 |
|
| Current portion of leaseback obligations | 40 |
| | 38 |
|
| Current portion of energy prepayment obligations | — |
| | 10 |
|
| Regulatory liabilities | 161 |
| | 187 |
|
| Short-term debt, net | 1,444 |
| | 1,216 |
|
| Current maturities of power bonds | 1,030 |
| | 1,032 |
|
| Current maturities of long-term debt of variable interest entities | 39 |
| | 38 |
|
| Current maturities of notes payable | 23 |
| | 46 |
|
| Total current liabilities | 4,763 |
| | 4,854 |
|
| | | | |
| Other liabilities | | | |
| Post-retirement and post-employment benefit obligations | 4,260 |
| | 4,476 |
|
| Asset retirement obligations | 5,468 |
| | 4,665 |
|
| Other long-term liabilities | 2,226 |
| | 2,715 |
|
| Leaseback obligations | 223 |
| | 263 |
|
| Regulatory liabilities | 64 |
| | 104 |
|
| Total other liabilities | 12,241 |
| | 12,223 |
|
| | | | |
| Long-term debt, net | | | |
| Long-term power bonds, net | 19,115 |
| | 20,157 |
|
| Long-term debt of variable interest entities, net | 1,108 |
| | 1,127 |
|
| Long-term notes payable | — |
| | 23 |
|
| Total long-term debt, net | 20,223 |
| | 21,307 |
|
| | | | |
| Total liabilities | 37,227 |
| | 38,384 |
|
| | | | |
| Commitments and contingencies (Note 19) | | | |
| | | | |
| Proprietary capital | | | |
| Power program appropriation investment | 258 |
| | 258 |
|
| Power program retained earnings | 10,234 |
| | 9,404 |
|
| Total power program proprietary capital | 10,492 |
| | 9,662 |
|
| Nonpower programs appropriation investment, net | 558 |
| | 564 |
|
| Accumulated other comprehensive income (loss) | (2 | ) | | 57 |
|
| Total proprietary capital | 11,048 |
| | 10,283 |
|
| | | | |
| Total liabilities and proprietary capital | $ | 48,275 |
| | $ | 48,667 |
|
| The accompanying notes are an integral part of these consolidated financial statements. |
TENNESSEE VALLEY AUTHORITY
CONSOLIDATED STATEMENTS OF CASH FLOWS (Unaudited)
For the Nine Months Ended June 30
(in millions)
| | | | | | | | | | | |
| | 2020 | | 2019 |
| Cash flows from operating activities | | | |
| Net income (loss) | $ | 652 | | | $ | 829 | |
| Adjustments to reconcile net income (loss) to net cash provided by operating activities | | | |
Depreciation and amortization(1) | 1,447 | | | 1,402 | |
| Amortization of nuclear fuel cost | 284 | | | 277 | |
| Non-cash retirement benefit expense | 243 | | | 235 | |
| | | |
| Other regulatory amortization and deferrals | 65 | | | 240 | |
| | | |
| | | |
| | | |
| Changes in current assets and liabilities | | | |
| Accounts receivable, net | 376 | | | 149 | |
| Inventories and other current assets, net | (86) | | | (145) | |
| Accounts payable and accrued liabilities | (126) | | | (217) | |
| Accrued interest | (20) | | | (21) | |
| | | |
| Pension contributions | (230) | | | (232) | |
| | | |
| | | |
| | | |
| Other, net | (109) | | | (38) | |
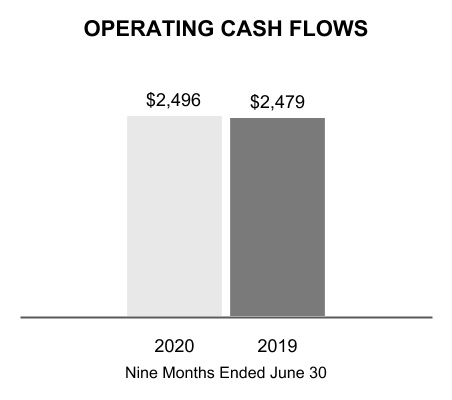
| Net cash provided by operating activities | 2,496 | | | 2,479 | |
| | | |
| Cash flows from investing activities | | | |
| Construction expenditures | (1,221) | | | (1,292) | |
| | | |
| Nuclear fuel expenditures | (251) | | | (223) | |
| | | |
| Loans and other receivables | | | |
| Advances | (6) | | | (8) | |
| Repayments | 5 | | | 6 | |
| Other, net | 6 | | | (16) | |
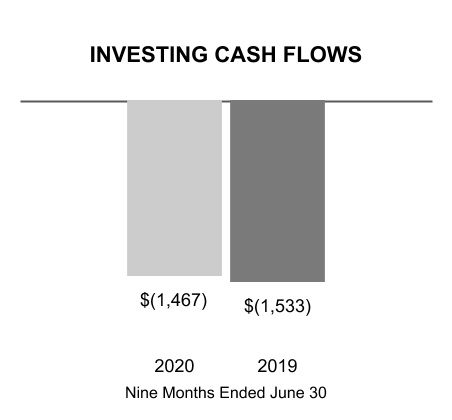
| Net cash used in investing activities | (1,467) | | | (1,533) | |
| | | |
| Cash flows from financing activities | | | |
| Long-term debt | | | |
| Issues of power bonds | 997 | | | — | |
| | | |
| Redemptions and repurchases of power bonds | (1,286) | | | (1,034) | |
| Redemptions of notes payable | (23) | | | (46) | |
| Redemptions of debt of variable interest entities | (20) | | | (19) | |
| Short-term debt issues (redemptions), net | (145) | | | 196 | |
| Payments on leases and leasebacks | (44) | | | (41) | |
| | | |
| Financing costs, net | (4) | | | — | |
| | | |
| | | |
| | | |
| Other, net | (3) | | | (1) | |
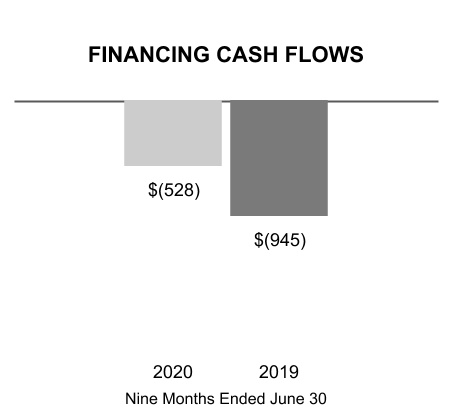
| Net cash provided by (used in) financing activities | (528) | | | (945) | |
| Net change in cash, cash equivalents, and restricted cash | 501 | | | 1 | |
| Cash, cash equivalents, and restricted cash at beginning of period | 322 | | | 322 | |
| Cash, cash equivalents, and restricted cash at end of period | $ | 823 | | | $ | 323 | |
| | | |
| | | |
| | | |
| | | |
| | | |
Note (1) Includes amortization of debt issuance costs and premiums/discounts. | | | |
| The accompanying notes are an integral part of these consolidated financial statements. | | | |
|
| | | | | | | |
| | 2019 | | 2018 |
| Cash flows from operating activities | | | |
| Net income (loss) | $ | 829 |
| | $ | 1,220 |
|
| Adjustments to reconcile net income (loss) to net cash provided by operating activities | |
| | |
|
Depreciation and amortization(1) | 1,402 |
| | 1,285 |
|
| Amortization of nuclear fuel cost | 277 |
| | 282 |
|
| Non-cash retirement benefit expense | 235 |
| | 243 |
|
| Prepayment credits applied to revenue | (10 | ) | | (75 | ) |
| Other regulatory amortization and deferrals | 240 |
| | 15 |
|
| Changes in current assets and liabilities | |
| | |
|
| Accounts receivable, net | 149 |
| | (11 | ) |
| Inventories and other current assets, net | (145 | ) | | 5 |
|
| Accounts payable and accrued liabilities | (217 | ) | | (68 | ) |
| Accrued interest | (21 | ) | | (52 | ) |
| Pension contributions | (232 | ) | | (229 | ) |
| Other, net | (28 | ) | | (78 | ) |
| Net cash provided by operating activities | 2,479 |
| | 2,537 |
|
| | | | |
| Cash flows from investing activities | |
| | |
|
| Construction expenditures | (1,292 | ) | | (1,354 | ) |
| Nuclear fuel expenditures | (223 | ) | | (181 | ) |
| Loans and other receivables | |
| | |
|
| Advances | (8 | ) | | (12 | ) |
| Repayments | 6 |
| | 3 |
|
| Other, net | (16 | ) | | (2 | ) |
| Net cash used in investing activities | (1,533 | ) | | (1,546 | ) |
| | | | |
| Cash flows from financing activities | |
| | |
|
| Long-term debt | |
| | |
|
| Issues of power bonds | — |
| | 998 |
|
| Redemptions and repurchases of power bonds | (1,034 | ) | | (1,731 | ) |
| Redemptions of notes payable | (46 | ) | | (52 | ) |
| Redemptions of debt of variable interest entities | (19 | ) | | (18 | ) |
| Short-term debt issues (redemptions), net | 196 |
| | (133 | ) |
| Payments on leases and leasebacks | (41 | ) | | (40 | ) |
| Financing costs, net | — |
| | (3 | ) |
| Other, net | (1 | ) | | — |
|
| Net cash provided by (used in) financing activities | (945 | ) | | (979 | ) |
| Net change in cash, cash equivalents, and restricted cash | 1 |
| | 12 |
|
| Cash, cash equivalents, and restricted cash at beginning of period | 322 |
| | 300 |
|
| Cash, cash equivalents, and restricted cash at end of period | $ | 323 |
| | $ | 312 |
|
| | | | |
| Supplemental disclosures | | | |
| Significant non-cash transactions | | | |
| Accrued capital and nuclear fuel expenditures | $ | 266 |
| | $ | 315 |
|
| Capital lease obligations incurred | 6 |
| | — |
|
| The accompanying notes are an integral part of these consolidated financial statements. |
Note
(1) Includes amortization of debt issuance costs and premiums/discounts.
TENNESSEE VALLEY AUTHORITY
CONSOLIDATED STATEMENTS OF CHANGES IN PROPRIETARY CAPITAL (Unaudited)
For the Three Months Ended June 30, 20192020 and 20182019
(in millions)
| | | | | | | | | | | | | | | | | | | | | | | | | | | | | |
| | Power Program Appropriation Investment | |
Power Program Retained Earnings | | Nonpower Programs Appropriation Investment, Net | | Accumulated
Other
Comprehensive
Income (Loss) | |
Total |
| Balance at March 31, 2019 | $ | 258 | | | $ | 10,069 | | | $ | 560 | | | $ | 32 | | | $ | 10,919 | |
| Net income (loss) | — | | | 167 | | | (2) | | | — | | | 165 | |
| Total other comprehensive income (loss) | — | | | — | | | — | | | (34) | | | (34) | |
| Return on power program appropriation investment | — | | | (2) | | | — | | | — | | | (2) | |
| | | | | | | | | |
| Balance at June 30, 2019 | $ | 258 | | | $ | 10,234 | | | $ | 558 | | | $ | (2) | | | $ | 11,048 | |
| | | | | | | | | |
| Balance at March 31, 2020 | $ | 258 | | | $ | 11,271 | | | $ | 552 | | | $ | (102) | | | $ | 11,979 | |
| Net income (loss) | — | | | 207 | | | (2) | | | — | | | 205 | |
| Total other comprehensive income (loss) | — | | | — | | | — | | | 24 | | | 24 | |
| Return on power program appropriation investment | — | | | (2) | | | — | | | — | | | (2) | |
| | | | | | | | | |
| Balance at June 30, 2020 | $ | 258 | | | $ | 11,476 | | | $ | 550 | | | $ | (78) | | | $ | 12,206 | |
| The accompanying notes are an integral part of these consolidated financial statements. | | | | | | | | | |
|
| | | | | | | | | | | | | | | | | | | |
| | Power Program Appropriation Investment | | Power Program Retained Earnings | | Nonpower Programs Appropriation Investment, Net | | Accumulated Other Comprehensive Income (Loss) from Net Gains (Losses) on Cash Flow Hedges | | Total |
| Balance at March 31, 2018 | $ | 258 |
| | $ | 9,033 |
| | $ | 568 |
| | $ | 73 |
| | $ | 9,932 |
|
| Net income (loss) | — |
| | 472 |
| | (2 | ) | | — |
| | 470 |
|
| Total other comprehensive income (loss) | — |
| | — |
| | — |
| | (22 | ) | | (22 | ) |
| Return on power program appropriation investment | — |
| | (1 | ) | | — |
| | — |
| | (1 | ) |
| Balance at June 30, 2018 | $ | 258 |
| | $ | 9,504 |
| | $ | 566 |
| | $ | 51 |
| | $ | 10,379 |
|
| | | | | | | | | | |
| Balance at March 31, 2019 | $ | 258 |
| | $ | 10,069 |
| | $ | 560 |
| | $ | 32 |
| | $ | 10,919 |
|
| Net income (loss) | — |
| | 167 |
| | (2 | ) | | — |
| | 165 |
|
| Total other comprehensive income (loss) | — |
| | — |
| | — |
| | (34 | ) | | (34 | ) |
| Return on power program appropriation investment | — |
| | (2 | ) | | — |
| | — |
| | (2 | ) |
| Balance at June 30, 2019 | $ | 258 |
| | $ | 10,234 |
| | $ | 558 |
| | $ | (2 | ) | | $ | 11,048 |
|
| The accompanying notes are an integral part of these consolidated financial statements. |
TENNESSEE VALLEY AUTHORITY
CONSOLIDATED STATEMENTS OF CHANGES IN PROPRIETARY CAPITAL (Unaudited)
For the Nine Months Ended June 30, 20192020 and 20182019
(in millions)
| | | | | | | | | | | | | | | | | | | | | | | | | | | | | |
| | Power Program Appropriation Investment | |
Power Program Retained Earnings | | Nonpower Programs Appropriation Investment, Net | | Accumulated
Other
Comprehensive
Income (Loss) | |
Total |
| Balance at September 30, 2018 | $ | 258 | | | $ | 9,404 | | | $ | 564 | | | $ | 57 | | | $ | 10,283 | |
| Net income (loss) | — | | | 835 | | | (6) | | | — | | | 829 | |
| Total other comprehensive income (loss) | — | | | — | | | — | | | (59) | | | (59) | |
| Return on power program appropriation investment | — | | | (5) | | | — | | | — | | | (5) | |
| | | | | | | | | |
| Balance at June 30, 2019 | $ | 258 | | | $ | 10,234 | | | $ | 558 | | | $ | (2) | | | $ | 11,048 | |
| | | | | | | | | |
| Balance at September 30, 2019 | $ | 258 | | | $ | 10,823 | | | $ | 556 | | | $ | (12) | | | $ | 11,625 | |
| Net income (loss) | — | | | 658 | | | (6) | | | — | | | 652 | |
| Total other comprehensive income (loss) | — | | | — | | | — | | | (66) | | | (66) | |
| Return on power program appropriation investment | — | | | (5) | | | — | | | — | | | (5) | |
| | | | | | | | | |
| Balance at June 30, 2020 | $ | 258 | | | $ | 11,476 | | | $ | 550 | | | $ | (78) | | | $ | 12,206 | |
| The accompanying notes are an integral part of these consolidated financial statements. | | | | | | | | | |
|
| | | | | | | | | | | | | | | | | | | |
| | Power Program Appropriation Investment | | Power Program Retained Earnings | | Nonpower Programs Appropriation Investment, Net | | Accumulated Other Comprehensive Income (Loss) from Net Gains (Losses) on Cash Flow Hedges | | Total |
| Balance at September 30, 2017 | $ | 258 |
| | $ | 8,282 |
| | $ | 572 |
| | $ | 21 |
| | $ | 9,133 |
|
| Net income (loss) | — |
| | 1,226 |
| | (6 | ) | | — |
| | 1,220 |
|
| Total other comprehensive income (loss) | — |
| | — |
| | — |
| | 30 |
| | 30 |
|
| Return on power program appropriation investment | — |
| | (4 | ) | | — |
| | — |
| | (4 | ) |
| Balance at June 30, 2018 | $ | 258 |
| | $ | 9,504 |
| | $ | 566 |
| | $ | 51 |
| | $ | 10,379 |
|
| | | | | | | | | | |
| Balance at September 30, 2018 | $ | 258 |
| | $ | 9,404 |
| | $ | 564 |
| | $ | 57 |
| | $ | 10,283 |
|
| Net income (loss) | — |
| | 835 |
| | (6 | ) | | — |
| | 829 |
|
| Total other comprehensive income (loss) | — |
| | — |
| | — |
| | (59 | ) | | (59 | ) |
| Return on power program appropriation investment | — |
| | (5 | ) | | — |
| | — |
| | (5 | ) |
| Balance at June 30, 2019 | $ | 258 |
| | $ | 10,234 |
| | $ | 558 |
| | $ | (2 | ) | | $ | 11,048 |
|
| The accompanying notes are an integral part of these consolidated financial statements. |
NOTES TO CONSOLIDATED FINANCIAL STATEMENTS (Unaudited)
(Dollars in millions except where noted)
| | | | | | | | | | | |
| Note | | | Page |
| 1 | | Summary of Significant Accounting Policies | |
| 2 | | Impact of New Accounting Standards and Interpretations | |
| 3 | | Accounts Receivable, Net | |
| 4 | | Inventories, Net | |
| 5 | | Plant Closures | |
| 6 | | Leases | |
| 7 | | Other Long-Term Assets | |
| 8 | | Regulatory Assets and Liabilities | |
| 9 | | Variable Interest Entities | |
| 10 | | Other Long-Term Liabilities | |
| 11 | | Asset Retirement Obligations | |
| 12 | | Debt and Other Obligations | |
| 13 | | Accumulated Other Comprehensive Income (Loss) | |
| 14 | | Risk Management Activities and Derivative Transactions | |
| 15 | | Fair Value Measurements | |
| 16 | | Revenue | |
| 17 | | Other Income (Expense), Net | |
| 18 | | Supplemental Cash Flow Information | |
| 19 | | Benefit Plans | |
| 20 | | Contingencies and Legal Proceedings | |
| 21 | | Subsequent Events | |
|
| | | |
| Note | Page |
| 1 | | Nature of Operations and Summary of Significant Accounting Policies | |
| 2 | | Impact of New Accounting Standards and Interpretations | |
| 3 | | Accounts Receivable, Net | |
| 4 | | Inventories, Net | |
| 5 | | Plant Closures | |
| 6 | | Other Long-Term Assets | |
| 7 | | Regulatory Assets and Liabilities | |
| 8 | | Variable Interest Entities | |
| 9 | | Gallatin Coal Combustion Residual Facilities | |
| 10 | | Other Long-Term Liabilities | |
| 11 | | Asset Retirement Obligations | |
| 12 | | Debt and Other Obligations | |
| 13 | | Accumulated Other Comprehensive Income (Loss) | |
| 14 | | Risk Management Activities and Derivative Transactions | |
| 15 | | Fair Value Measurements | |
| 16 | | Revenue | |
| 17 | | Other Income (Expense), Net | |
| 18 | | Benefit Plans | |
| 19 | | Contingencies and Legal Proceedings | |
1. Nature of Operations and Summary of Significant Accounting Policies
General
The Tennessee Valley Authority ("TVA") is a corporate agency and instrumentality of the United States ("U.S.") that was created in 1933 by federal legislation in response to a proposal by President Franklin D. Roosevelt. TVA was created to, among other things, improve navigation on the Tennessee River, reduce the damage from destructive flood waters within the Tennessee River system and downstream on the lower Ohio and Mississippi Rivers, further the economic development of TVA's service area in the southeastern U.S., and sell the electricity generated at the facilities TVA operates.
Today, TVA operates the nation's largest public power system and supplies power in most of Tennessee, northern Alabama, northeastern Mississippi, and southwestern Kentucky and in portions of northern Georgia, western North Carolina, and southwestern Virginia to a population of nearly 10 million people.
TVA also manages the Tennessee River, its tributaries, and certain shorelines to provide, among other things, year-round navigation, flood damage reduction, and affordable and reliable electricity. Consistent with these primary purposes, TVA also manages the river system and public lands to provide recreational opportunities, adequate water supply, improved water quality, cultural and natural resource protection, and economic development.
The power program has historically been separate and distinct from the stewardship programs. It is required to be self-supporting from power revenues and proceeds from power financings, such as proceeds from the issuance of bonds, notes, or other evidences of indebtedness ("Bonds"(collectively, "Bonds"). Although TVA does not currently receive congressional appropriations, it is required to make annual payments to the United StatesU.S. Department of the Treasury ("U.S. Treasury") as a return on the government's appropriation investment in TVA's power facilities (the "Power Program Appropriation Investment"). In the 1998 Energy and Water Development Appropriations Act, Congress directed TVA to fund essential stewardship activities related to its management of the Tennessee River system and nonpower or stewardship properties with power revenues in the event that there were insufficient appropriations or other available funds to pay for such activities in any fiscal year. Congress has not provided any appropriations to TVA to fund such activities since 1999. Consequently, during 2000, TVA began paying for essential stewardship activities primarily with power revenues, with the remainder funded with user fees and other forms of revenues derived in connection with those activities. The activities related to stewardship properties do not meet the criteria of an operating segment under accounting principles generally accepted in the United States of America ("GAAP"). Accordingly, these assets and properties are included as part of the power program, TVA's only operating segment.
Power rates are established by the TVA Board of Directors (the "TVA("TVA Board") as authorized by the Tennessee Valley Authority Act of 1933, as amended (the "TVA("TVA Act"). The TVA Act requires TVA to charge rates for power that will produce gross revenues sufficient to provide funds for operation, maintenance, and administration of its power system; payments to states and counties in lieu of taxes ("tax equivalents"); debt service on outstanding indebtedness; payments to the U.S. Treasury in repayment of and as a return on the Power Program Appropriation Investment; and such additional margin as the TVA Board may consider desirable for investment in power system assets, retirement of outstanding Bonds in advance of maturity, additional reduction of the Power Program Appropriation Investment, and other purposes connected with TVA's power business. TVA fulfilled its obligation under the TVA Actrequirement to repay $1.0 billion of the Power Program Appropriation Investment with the 2014 payment, andpayment; therefore, this item is no longer a component of rate setting. In setting TVA's rates, the TVA Board is charged by the TVA Act to have due regard for the primary objectives of the TVA Act, including the objective that power shall be sold at rates as low as are feasible. Rates set by the TVA Board are not subject to review or approval by any state or other federal regulatory body.
Fiscal Year
TVA's fiscal year ends September 30. Years ((2020, 2019,, 2018, etc.) refer to TVA's fiscal years unless they are preceded by "CY," in which case the references are to calendar years.
Cost-Based Regulation
Since the TVA Board is authorized by the TVA Act to set rates for power sold to its customers, TVA is self-regulated. Additionally, TVA's regulated rates are designed to recover its costs. Based on current projections, TVA believes that rates, set at levels that will recover TVA's costs, can be charged and collected. As a result of these factors, TVA records certain assets and liabilities that result from the regulated ratemaking process that would not be recorded under GAAP for non-regulated entities. Regulatory assets generally represent incurred costs that have been deferred because such costs are probable of future recovery in customer rates. Regulatory liabilities generally represent obligations to make refunds to customers for previous collections for costs that are not likely to be incurred or deferral of gains that will be credited to customers in future periods. TVA assesses whether the regulatory assets are probable of future recovery by considering factors such as applicable regulatory changes, potential legislation, and changes in technology. Based on these assessments, TVA believes the existing regulatory assets are probable of recovery. This determination reflects the current regulatory and political environment and is subject to change in the future. If future recovery of regulatory assets ceases to be probable, or any of the other factors described above cease to be applicable, TVA would no longer be considered to be a regulated entity and would be required to
write off these costs. All regulatory asset write-offs would be required to be recognized in earnings in the period in which future recovery ceases to be probable.
Basis of Presentation
TVA prepares its consolidated interim financial statements in conformity with GAAP for consolidated interim financial information. Accordingly, TVA's consolidated interim financial statements do not include all of the information and notes required by GAAP for annual financial statements. As such, they should be read in conjunction with the audited financial statements for the year ended September 30, 2018,2019, and the notes thereto, which are contained in TVA's Annual Report on Form 10-K10-K/A for the year ended September 30, 20182019 (the "Annual Report"). In the opinion of management, all adjustments (consisting of items of a normal recurring nature) considered necessary for fair presentation are included inon the consolidated interim financial statements.
The accompanying consolidated interim financial statements, which have been prepared in accordance with GAAP, include the accounts of TVA, wholly-owned direct subsidiaries, and variable interest entities ("VIE") of which TVA is the primary beneficiary. See Note 8.9 — Variable Interest Entities. Intercompany balances and transactions have been eliminated in consolidation.
Use of Estimates
The preparation of financial statements requires TVA to estimate the effects of various matters that are inherently uncertain as of the date of the consolidated financial statements. Although the consolidated financial statements are prepared in conformity with GAAP, TVA is required to make estimates and assumptions that affect the reported amounts of assets and liabilities, the disclosure of contingent assets and liabilities, and the amounts of revenues and expenses, including impacts from the COVID-19 pandemic, reported during the reporting period. Each of these estimates varies in regard to the level of judgment involved and its potential impact on TVA's financial results. Estimates are considered critical either when a different estimate could have reasonably been used, or where changes in the estimate are reasonably likely to occur from period to period, and such use or change would materially impact TVA's financial condition, results of operations, or cash flows.
Reclassifications
Certain historical amounts have been reclassified in the accompanying consolidated financial statements to the current presentation. TVA reclassified $65 million and $193 million of net periodic benefit costs from Operating and maintenance expense to Other net periodic benefit cost in the Consolidated Statements of Operations for the three and nine months ended June 30, 2018, respectively, as a result of the retrospective presentation of financing costs due to the implementation of the new
accounting standard for defined benefit plan costs effective for TVA October 1, 2018. TVA also reclassified $13 million from Restricted cash and cash equivalents to Other long-term assets on the Consolidated Balance Sheet at September 30, 2018.
In the June 30, 20182019, Consolidated Statements of Cash Flows, amounts previously reported as $(6)$(10) million Fuel cost adjustment deferral, $(8) million Fuel cost tax equivalents, and $29 millionof Prepayment credits applied to revenue were reclassified to Other, net were consolidated and presented as $15 million Other regulatory amortization and deferrals. Additionally, $(20) million in cash flows from operating activities previously recorded as $(12) million Accounts payable and accrued liabilities and $(8) million Regulatory asset costs were reclassified to Other, net.activities.
Cash, Cash Equivalents, and Restricted Cash
Cash includes cash on hand, non-interest bearing cash, and deposit accounts. All highly liquid investments with original maturities of three months or less are considered cash equivalents. Cash and cash equivalents that are restricted, as to withdrawal or use under the terms of certain contractual agreements, are recorded in Other long-term assets inon the Consolidated Balance Sheets. Restricted cash and cash equivalents includes cash held in trusts that are currently restricted for TVA economic development loans and for certain TVA environmental programs in accordance with agreements related to compliance with certain environmental regulations. See Note 1920 — Contingencies and Legal Proceedings — Legal Proceedings — Environmental Agreements.
The following table provides a reconciliation of cash, cash equivalents, and restricted cash reported inon the Consolidated Balance Sheets and Consolidated Statements of Cash Flows:
| | | | | | | | | | | |
| Cash, Cash Equivalents, and Restricted Cash | | | |
| | At June 30, 2020 | | At September 30, 2019 |
| Cash and cash equivalents | $ | 800 | | | $ | 299 | |
| | | |
| Restricted cash and cash equivalents included in Other long-term assets | 23 | | | 23 | |
| Total cash, cash equivalents, and restricted cash | $ | 823 | | | $ | 322 | |
Due to higher volatility in the financial markets associated with the Coronavirus Disease 2019 ("COVID-19") pandemic, TVA increased its target balance of Cash and cash equivalents beginning in March 2020 by $500 million through discount note issuances.
|
| | | | | | | |
| Cash, Cash Equivalents, and Restricted Cash |
| | At June 30, 2019 | | At September 30, 2018 |
| Cash and cash equivalents | $ | 300 |
| | $ | 299 |
|
| Restricted cash and cash equivalents included in Other long-term assets | 23 |
| | 23 |
|
| Total Cash, cash equivalents, and restricted cash | $ | 323 |
| | $ | 322 |
|
The allowance for uncollectible accounts reflects TVA's estimate of probable losses inherent in its accounts and loans receivable balances, excluding the EnergyRight® loans receivable. TVA determines the allowance based on known accounts, historical experience, and other currently available information including events such as customer bankruptcy and/or a customer failing to fulfill payment arrangements after 90 days. It also reflects TVA's corporate credit department's assessment of the financial condition of customers and the credit quality of the receivables. TVA continues to monitor the impact of the COVID-19 pandemic on accounts and loans receivable balances to evaluate the allowance for uncollectible accounts.
The allowance for uncollectible accounts was less than $1 million at both June 30, 2020, and September 30, 2019, for accounts receivable. Additionally, loans receivable of $134 million and $131 million at June 30, 2020, and September 30, 2019, respectively, are included in Accounts receivable, net and Other long-term assets, for the current and long-term portions, respectively, and are reported net of allowances for uncollectible accounts of less than $1 million at both June 30, 2020, and September 30, 2019.
Revenues
TVA recognizes revenue from contracts with customers to depict the transfer of goods or services to customers in an amount to which the entity expects to be entitled in exchange for those goods or services. For the generation and transmission of electricity, this is generally at the time the power is delivered to a metered customer delivery point for the customer's consumption or distribution. As a result, revenues from power sales are recorded as electricity is delivered to customers. In addition to power sales invoiced and recorded during the month, TVA accrues estimated unbilled revenues for power sales provided to five customers whose billing date occurs prior to the end of the month. Exchange power sales are presented in the accompanying Consolidated Statements of Operations as a component of sales of electricity. Exchange power sales are sales of excess power after meeting TVA native load and directly served requirements. Native load refers to the customers on whose behalf a company, by statute, franchise, regulatory requirement, or contract, has undertaken an obligation to serve. TVA engages in other arrangements in addition to power sales. Certain other revenue from activities related to TVA’sTVA's overall mission are recorded in Other revenue. Revenues that are not related to the overall mission are recorded in Other income (expense), net.
From time to time,Leases
TVA may transfer fiber optic capacity on TVA’s network to telecommunications service carriersrecognizes a lease asset and TVA's local power company customers ("LPCs"). These transactions are structured as indefeasible rightslease liability for leases with terms of use ("IRUs"), which are the exclusivegreater than 12 months. Lease assets represent TVA's right to use an underlying asset for the lease term, and lease liabilities represent TVA's obligation to make lease payments arising from the lease, both of which are recognized based on the present value of the future minimum lease payments over the lease term at the commencement date. TVA has certain lease agreements that include variable lease payments that are based on energy production levels. These variable lease payments are not included in the measurement of the lease assets or lease liabilities but are recognized in the period in which the expenses are incurred.
While not specifically structured as leases, certain power purchase agreements are deemed to contain a specifiedlease of the underlying generating units when the terms convey the right to control the use of the assets. Amounts recorded for these leases are generally based on the amount of fiber opticthe scheduled capacity for a specified term.payments due over the remaining terms of the power purchase agreements, the terms of which vary. The total lease obligation included in Accounts payable and accrued liabilities and Operating lease liabilities related to these agreements was $285 million at June 30, 2020.
TVA accountshas agreements with lease and non-lease components and has elected to account for the consideration receivedcomponents separately. Consideration is allocated to lease and non-lease components generally based on transfersrelative standalone selling prices.
TVA has lease agreements which include options for renewal and early termination. The intent to renew a lease varies depending on the lease type and asset. Renewal options that are reasonably certain to be exercised are included in the lease measurements. The decision to terminate a lease early is dependent on various economic factors. No termination options have been included in TVA's lease measurements.
Leases with an initial term of fiber optic capacity and on all12 months or less, which do not include an option to extend the initial term of the other elements deliverable under an IRU as revenue ratablylease to greater than 12 months that TVA is reasonably certain to exercise, are not recorded on the Consolidated Balance Sheets at June 30, 2020.
Operating leases are recognized on a straight-line basis over the term of the lease agreement. TVA does not recognize revenueRent expense associated with short-term leases and variable leases is recorded in Operating and maintenance expense, Fuel expense, or Purchased power expense on any contemporaneous exchangesthe Consolidated Statements of its fiber optic capacity for an IRUOperations. Expenses associated with finance leases result in the separate presentation of fiber optic capacityinterest expense on the lease liability and amortization expense of the counterparty torelated lease asset on the exchange.Consolidated Statements of Operations.
Allowance for Uncollectible Accounts
The allowance for uncollectible accounts reflects TVA's estimate of probable losses inherent in its accounts and loans receivable balances. TVA determines the allowance based on known accounts, historical experience, and other currently available information including events such as customer bankruptcy and/or a customer failing to fulfill payment arrangements after 90 days. It also reflects TVA's corporate credit department's assessment of the financial condition of customers and the credit quality of the receivables.
The allowance for uncollectible accounts was less than $1 million at both June 30, 2019, and September 30, 2018, for accounts receivable. Additionally, loans receivable of $125 million and $138 million at June 30, 2019, and September 30, 2018, respectively, are included in Accounts receivable, net and Other long-term assets and are reported net of allowances for uncollectible accounts of less than $1 million at both June 30, 2019, and September 30, 2018.
Depreciation
Pre-Commercial Plant Operations
As part of the process of completing the construction of a generating unit, the electricity produced is used to serve the
demands of the electric system. TVA estimates revenue from such pre-commercial generation based on the guidance provided by Federal Energy Regulatory Commission ("FERC") regulations. The Allen Combined Cycle Plant ("Allen CC") began pre-commercial operations in September 2017, and began commercial operations in April 2018. Cogeneration capability at Johnsonville Combustion Turbine Unit 20 commenced pre-commercial plant operations in September 2017, and was placed in service during December 2017. Estimated revenue of less than $1 million and $11 million related to these projects was capitalized to offset project costs for the three and nine months ended June 30, 2018, respectively. TVA also capitalized related fuel costs for these construction projects of approximately $5 million and $20 million during the three and nine months ended June 30, 2018, respectively. No such amounts were capitalized during the three and nine months ended June 30, 2019.
Depreciation
TVA accounts for depreciation of its properties using the composite depreciation convention of accounting. Under the composite method, assets with similar economic characteristics are grouped and depreciated as one asset. Depreciation is generally computed on a straight-line basis over the estimated service lives of the various classes of assets. The estimation of asset useful lives requires management judgment, supported by external depreciation studies of historical asset retirement experience. Depreciation rates are determined based on the external depreciation studies. These studies are updated at least every five years. Depreciation expense was $536$344 million and $301$536 million for the three months ended June 30, 20192020 and 2018,2019, respectively. Depreciation expense was $1.3 billion and $950 million for both the nine months ended June 30, 20192020 and 2018, respectively.2019. See Note 5 — Financial Impact Plant Closures for a discussion of the impact of plant closures.
2. Impact of New Accounting Standards and Interpretations
The following are accounting standard updates issued by the Financial Accounting Standards Board ("FASB") that TVA adopted during 2019:
|
| | | | | | | | | | | | | |
Defined Benefit CostsLease Accounting | | | | |
| Description | This guidance changes howthe provisions of recognition in both the lessee and lessor accounting models. The standard requires entities that lease assets ("lessees") to recognize on the balance sheet the assets and liabilities for the rights and obligations created by leases with terms of more than 12 months, while also refining the definition of a lease. In addition, lessees are required to disclose key information about defined benefit costs for pension plansthe amount, timing, and other post-retirement benefit plans is presented in employer financial statements.uncertainty of cash flows arising from leasing arrangements. The guidancerecognition, measurement, and presentation of expenses and cash flows arising from a lease by a lessee primarily depend on its classification as a finance lease (formerly referred to as capital lease) or operating lease. The standard requires employers that present a measureboth types of operating income in their statement of income to include only the service cost component of net periodic pension cost and net periodic post-retirement benefit cost in operating expenses (together with other employee compensation costs). The other components of net benefit cost, including amortization of prior service cost/credit and settlement and curtailment effects, areleases to be includedrecognized on the balance sheet. Operating leases will result in non-operating expenses. Additionally,straight-line expense, while finance leases will result in recognition of interest on the guidance stipulates that onlylease liability separate from amortization expense. The accounting rules for the service cost componentowner of net benefit costassets leased by the lessee ("lessor accounting") remain relatively unchanged.
The standard allows for certain practical expedients to be elected related to lease term determination, separation of lease and non-lease elements, reassessment of existing leases, and short-term leases. The standard is eligible for capitalization in assets. The guidance requiresto be applied using a modified retrospective presentation of the service and non-service cost components in the Consolidated Statements of Operations. transition. | | | |
| Effective Date for TVA | October 1, 20182019 | | | |
| Effect on the Financial Statements or Other Significant Matters | TVA adopted this standard on ahas elected the modified retrospective basis formethod of adoption effective October 1, 2019. Under the modified retrospective method of adoption, prior period presented resulting in lower operating expenses and higher non-operating expenses in the Consolidated Statements of Operations of $194year reported results are not restated.
TVA recorded $205 million and $192$210 million for the nine months ended June 30, 2019 and 2018, respectively. There was no impact on the Consolidated Balance Sheets because TVA has historically capitalized only the service cost component, which is consistent with the new guidance. |
|
Financial Instruments |
Description | This guidance applies to the recognition and measurement of financiallease assets and liabilities.lease liabilities, respectively, for operating leases in effect at the adoption date. The standard requires all equity investments to be measured at fair value with changes in the fair value recognized through net income (other than those accounted for under the equity method of accounting or those that result in consolidation of the investee). The standard also amends presentation requirements related to certain changes in the fair value of a liability and eliminates certain disclosure requirements of significant assumptions for financial instruments measured at amortized cost on the balance sheet. Public entities must apply the amendments by means of a cumulative-effect adjustment to the balance sheet as of the beginning of the fiscal year of adoption. |
Effective Date for TVA | October 1, 2018 |
Effect on the Financial Statements or Other Significant Matters | TVA currently measures all of its equity investments (other than those that result in the consolidation of the investee) at fair value, with changes in the fair value recognized through net income, unless regulatory accounting is applied. The TVA Board has authorized the use of regulatory accounting for changes in fair valuefinance leases remained substantially unchanged. Adoption of certain equity investments, and as a result, those changes in fair value are deferred as regulatory assets or liabilities. TVA currently discloses significant assumptions around its estimates of fair value for financial instruments carried at amortized cost on its consolidated balance sheet. The adoption of thisthe standard did not have a materialmaterially impact on TVA's financial condition, results of operations or cash flows because changes in fair value accounting are recognized through regulatory accounting.flows.
TVA has elected to apply the following practical expedients: |
| | |
| |
Revenue from Contracts with Customers |
DescriptionPractical Expedient | This guidance, including subsequent amendments, replaces the existing accounting standard and industry specific guidance for revenue recognition with a five-step model for recognizing and measuring revenue from contracts with customers. The underlying principle of the guidance is to recognize revenue related to the transfer of goods or services to customers at the amount expected to be collected. The objective of the new standard is to provide a single, comprehensive revenue recognition model for all contracts with customers to improve comparability within and across industries. The new standard also requires enhanced disclosures regarding the nature, amount, timing, and uncertainty of revenue and the related cash flows arising from contracts with customers. Description |
Effective Date for TVA | October 1, 2018 |
Effect on the Financial Statements or Other Significant Matters | TVA adopted this standard using the modified retrospective method with no material changes to the amount or timing of revenue recognition. In accordance with the modified retrospective method, TVA’s previously issued financial statements have not been restated to comply with the new accounting standard.
TVA recognizes revenue when it satisfies a performance obligation by transferring control to the customer. For the generation and transmission of electricity, this is generally at the time the power is delivered to a metered customer delivery point for a customer's consumption or distribution. As a result, revenues from power sales are recorded as electricity is delivered to customers.
TVA utilized certain practical expedients including applying the guidance to open contracts at the date of adoption, applying the guidance to a portfolio of contracts with similar characteristics, and recognizing revenue in the amount for which it has the right to invoice.
As a result of adoption of the standard, TVA did not have a cumulative-effect adjustment to proprietary capital.
|
|
Statement of Cash Flows - Classification of Certain Cash Receipts and Cash Payments |
Description | This standard adds or clarifies guidance on the classification of certain cash receipts and payments on the statement of cash flows as follows: debt prepayment or extinguishment costs, settlement of zero-coupon bonds, contingent consideration payments made after a business combination, proceeds from the settlement of insurance claims, proceeds from the settlement of corporate-owned life insurance policies and bank-owned life insurance policies, distributions received from equity method investees, beneficial interest in securitization transactions, and the application of the predominance principle to separately identifiable cash flows. |
Effective Date for TVA | October 1, 2018 |
Effect on the Financial Statements or Other Significant Matters | TVA's previous treatment of the classification of certain cash receipts and cash payments is consistent
with the new standard, and adoption of the standard had no impact on TVA's financial condition, results of operations, or presentation or disclosure of cash flows. |
|
Statement of Cash Flows - Restricted Cash |
Description | This guidance requires that a statement of cash flows explain the change during the period in the total of cash, cash equivalents, and amounts generally described as restricted cash or restricted cash equivalents. Therefore, amounts generally described as restricted cash and restricted cash equivalents should be included with cash and cash equivalents when reconciling the beginning-of-period and end-of-period total amounts shown on the statement of cash flows. This guidance does not provide a definition of restricted cash or restricted cash equivalents. |
Effective Date for TVA | October 1, 2018 |
Effect on the Financial Statements or Other Significant Matters | Adoption of this standard resulted in a change to the beginning-of-period and end-of-period cash and cash equivalents and restricted cash amounts shown on the Consolidated Statements of Cash Flows. TVA applied this standard on a retrospective basis for the prior periods presented. |
The following accounting standards have been issued but as of June 30, 2019, were not effective and had not been adopted by TVA:
|
| | Package of transition practical expedients (for leases commenced prior to adoption date; expedients must be adopted as a package) | Do not need to (1) reassess whether any expired or existing contracts are leases or contain leases, (2) reassess the lease classification for any expired or existing leases, or (3) reassess initial direct costs for any existing leases. | |
| | Short-term lease expedient (elect by class of underlying asset) | Elect as an accounting policy to not apply the recognition requirements to short-term leases by asset class. | |
| | Existing and expired land easements not previously accounted for as leases | Elect to not evaluate existing or expired easements under the new guidance and carry forward current accounting treatment. | |
| | Comparative reporting requirements for initial adoption | Elect to apply transition requirements at adoption date, recognize cumulative effect adjustment to retained earnings in period of adoption, and not apply the new requirements to comparative periods, including disclosures. | |
| | | | |
| | | | |
| Derivatives and Hedging - Improvements to Accounting for Hedging Activities | | | | |
| Description | This guidance better aligns an entity's risk management activities and financial reporting for hedging relationships through changes to both the designation and measurement guidance for qualifying hedging relationships and the presentation of hedge results. To meet that objective, the amendments expand and refine hedge accounting for both nonfinancial and financial risk components and align the recognition and presentation of the effects of the hedging instrument and the hedged item in the financial statements. | | | |
| Effective Date for TVA | The new standard is effective for TVA's interim and annual reporting periods beginning October 1, 2019. While early adoption is permitted, TVA does not plan to adopt the standard early.2019 | | | |
| Effect on the Financial Statements or Other Significant Matters | TVA does not expecthas adopted the standard on a prospective basis. The adoption of this standard todid not have a material impact on TVA's financial condition, results of operations, or cash flows. TVA only uses hedge accounting under its foreign currency swap arrangements, and the adoption of this standard had no impact on those arrangements. |
| | |
| |
Lease Accounting | | |
Description | This guidance changes the provisions of recognition in both the lessee and lessor accounting models. The standard requires entities that lease assets ("lessees") to recognize on the balance sheet the assets and liabilities for the rights and obligations created by leases with terms of more than 12 months. The recognition, measurement, and presentation of expenses and cash flows arising from a lease by a lessee primarily will depend on its classification as a finance (similar to current capital leases) or operating lease. However, unlike current lease accounting rules, which require only capital leases to be recognized on the balance sheet, the new standard will require both types of leases to be recognized on the balance sheet. Operating leases will result in straight-line expense, while financing leases will result in recognition of interest on the lease liability separate from amortization expense. The accounting for the owner of the assets leased by the lessee ("lessor accounting") will remain largely unchanged from current lease accounting rules. The standard allows for certain practical expedients to be elected related to lease term determination, separation of lease and non-lease elements, reassessment of existing leases, and short-term leases. When the standard becomes effective, it will include interim periods within the fiscal year of adoption and will be required to be applied using a modified retrospective transition. |
Effective Date for TVA | The new standard is effective for TVA's interim and annual reporting periods beginning October 1, 2019. While early adoption is permitted, TVA does not plan to adopt the standard early. |
Effect on the Financial Statements or Other Significant Matters | TVA is evaluating the potential impact of these changes on its consolidated financial statements and related disclosures. The standard is expected to impact financial position as adoption will increase the amount of assets and liabilities recognized on TVA’s Consolidated Balance Sheets. The standard is not expected to have a material impact on results of operations or cash flows as expense recognition is intended to be substantially the same as the existing standard. TVA plans to elect certain of the practical expedients included in the new standard. TVA has selected a lease system solution and continues to evaluate the completeness of the lease population, the effectiveness of internal control related to leases, and appropriate financial statement disclosure. TVA is also continuing to monitor industry implementation and will analyze the related impacts to lease accounting. |
|
Defined Benefit Plans - Disclosure Requirements |
Description | This guidance applies to all employers that sponsor defined benefit pension or other post-retirement plans and modifies or clarifies the disclosure requirements for those plans. The amendments in this update remove disclosures that no longer are considered cost-beneficial, clarify the specific requirements of disclosures, and add disclosure requirements identified as relevant. Entities are required to apply the amendments retrospectively. |
Effective Date for TVA | The new standard is effective for TVA's annual reporting periods beginning October 1, 2021. While early adoption is permitted, TVA does not plan to adopt the standard early. |
Effect on the Financial Statements or Other Significant Matters | TVA is evaluating the potential impact of these changes on its consolidated financial statements and related disclosures. |
|
| Customer's Accounting for Implementation Costs in a Cloud Arrangement That Is a Service Contract | | | | |
| Description | This guidance relates to the accounting for a customer’scustomer's implementation costs in a hosting arrangement that is a service contract. The amendments align the requirements for capitalizing those implementation costs with the requirements for capitalizing implementation costs incurred to develop or obtain internal-use software and hosting arrangements that include an internal-use software license. The amendments also provide requirements for the classification of the capitalized costs and related expense and cash flows in the financial statements, the application of impairment guidance to the capitalized costs, and the application of abandonment guidance to the capitalized costs. Entities are required to apply the amendments either retrospectively or prospectively to all implementation costs incurred after the adoption date. | | | |
| Effective Date for TVA | The new standard is effective for TVA's interim and annual reporting periods beginning October 1, 2020. Early adoption is permitted, and TVA plans to adopt this standard October 1, 2019 on a prospective basis. | | | |
| Effect on the Financial Statements or Other Significant Matters | TVA doeshas adopted the standard on a prospective basis. Adoption of this standard did not expect anyhave a material impact on TVA's financial condition, results of operations, or cash flows afterflows. TVA records qualified implementation costs in a cloud arrangement that is a service contract as a prepaid asset and amortizes the adoptionprepaid asset to Operating and maintenance expense based on the term of this standard.the contract. | | | |
The following accounting standards have been issued but at June 30, 2020, were not effective and had not been adopted by TVA:
| | | | | |
| |
| |
| |
| |
| |
| |
| |
| |
| |
| |
| |
| |
| |
| |
| |
| |
| |
| |
| |
| |
| |
| |
| |
| |
| |
| Financial Instruments - Credit Losses | |
| Description | This guidance eliminates the probable initial recognition threshold in current GAAP and, instead, requires an allowance to be recorded for all expected credit losses for certain financial assets that are not measured at fair value. The allowance for credit losses is based on historical information, current conditions, and reasonable and supportable forecasts. The new standard also makes revisions to the other than temporary impairment model for available-for-sale debt securities. Disclosures of credit quality indicators in relation to the amortized cost of financing receivables are further disaggregated by year of origination. |
| Effective Date for TVA | The new standard is effective for TVA’sTVA's interim and annual reporting periods beginning October 1, 2020. While early adoption is permitted, TVA does not plan to adopt the standard early. |
| Effect on the Financial Statements or Other Significant Matters | TVA will adopt this standard using the modified retrospective method through a cumulative-effect adjustment to retained earnings as of the beginning of the period of adoption. Upon adoption, TVA will recognize an allowance for credit losses based on management's estimate of losses expected to be incurred over the life of certain financial assets. This standard will primarily impact TVA's long-term loans receivable. Adoption of this standard is evaluating the potentialnot expected to have a material impact on TVA's financial condition, results of these changes on its consolidated financial statements and related disclosures. |
| operations, or cash flows. |
| |
| Fair Value Measurement Disclosure | |
| Description | The guidance changes certain disclosure requirements for fair value measurements. It removes certain disclosure requirements, such as the amount of and reasons for transfers between Level 1 and Level 2 of the fair value hierarchy; the policy for timing of the transfers between levels; and the valuation processes for Level 3 fair value measurements. Some disclosure requirements are added, such as the change in unrealized gains and losses included in other comprehensive income for recurring Level 3 fair value measurements and the range and weighted average of significant unobservable inputs used to develop Level 3 fair value measurements. |
| Effective Date for TVA | The new standard is effective for TVA’sTVA's interim and annual reporting periods beginning October 1, 2020. While early adoption is permitted, TVA does not plan to adopt the standard early. |
| Effect on the Financial Statements or Other Significant Matters | TVA does not expect the adoption of this standard to have a material impact on TVA’sTVA's financial condition, results of operations, or cash flows. TVA is evaluatingcontinuing to evaluate the potential impact on related disclosures. |
| |
| Reference Rate Reform | |
| Description | The guidance provides temporary optional expedients and exceptions to the guidance in GAAP on contract modifications and hedge accounting to ease the financial reporting burdens related to the expected market transition from the London Interbank Offered Rate ("LIBOR") and other interbank offered rates to alternative reference rates, such as the Secured Overnight Financing Rates. |
| Effective Date for TVA | The new standard is effective for adoption at any time between March 12, 2020, and December 31, 2022. TVA currently plans to adopt the standard by December 31, 2022. |
| Effect on the Financial Statements or Other Significant Matters | TVA continues to review this standard and evaluate the impact of using an alternative reference rate instead of LIBOR in its interest rate swap contracts. TVA expects the adoption of the standard will simplify the accounting for any modifications to its interest rate swap contracts. |
3. Accounts Receivable, Net
Accounts receivable primarily consist of amounts due from customers for power sales. The table below summarizes the types and amounts of TVA's accounts receivable:
| | Accounts Receivable, Net | Accounts Receivable, Net | Accounts Receivable, Net | |
| | At June 30, 2019 | | At September 30, 2018 | | At June 30, 2020 | | At September 30, 2019 |
| Power receivables | $ | 1,436 |
| | $ | 1,570 |
| Power receivables | $ | 1,286 | | | $ | 1,624 | |
| Other receivables | 115 |
| | 87 |
| Other receivables | 78 | | | 115 | |
| Accounts receivable, net | $ | 1,551 |
| | 1,657 |
| $ | 1,364 | | | $ | 1,739 | |
Note
(1) Allowance for uncollectible accounts was less than $1 million at June 30, 20192020, and September 30, 2018,2019, and therefore is not represented in the table
above.
In response to the COVID-19 pandemic, the TVA Board approved the Public Power Support and Stabilization Program, which includes alternative wholesale payment arrangements for LPCs, on March 25, 2020. TVA is offering up to $1.0 billion of credit support to LPCs that demonstrate the need for temporary financial relief, through the deferral of a portion of LPCs' wholesale power payments owed to TVA. The program, which began in April 2020, requires LPCs to apply monthly and is subject to approval by TVA. If approved, TVA will establish a repayment schedule based on the LPC's need, not to exceed two years, and an initial repayment date will be approved by TVA no later than December 31, 2020. As of August 3, 2020, $1 million of credit support has been approved under the Public Power Support and Stabilization Program.
4. Inventories, Net
The table below summarizes the types and amounts of TVA's inventories:
| | | | | | | | | | | |
Inventories, Net | | | |
| | At June 30, 2020 | | At September 30, 2019 |
| Materials and supplies inventory | $ | 784 | | | $ | 742 | |
| Fuel inventory | 307 | | | 294 | |
| Renewable energy certificates/emission allowance inventory, net | 15 | | | 16 | |
| Allowance for inventory obsolescence | (46) | | | (53) | |
| Inventories, net | $ | 1,060 | | | $ | 999 | |
|
| | | | | | | |
Inventories, Net |
| | At June 30, 2019 | | At September 30, 2018 |
| Materials and supplies inventory | $ | 744 |
| | 725 |
|
| Fuel inventory | 351 |
| | 266 |
|
| Renewable energy certificates/emission allowance inventory, net | 18 |
| | 14 |
|
| Allowance for inventory obsolescence | (62 | ) | | (44 | ) |
| Inventories, net | $ | 1,051 |
| | $ | 961 |
|
5. Plant Closures
Background
TVA must continuously evaluate all generating assets to ensure an optimumoptimal energy portfolio that provides safe, clean, and reliable power while maintaining flexibility and fiscal responsibility to the people of the Tennessee Valley. During its August 2018 meeting,Based on results of assessments presented to the TVA Board approved a plan to perform assessmentsin 2019, the retirement of Bull Run Fossil Plant ("Bull Run") and Paradise Fossil Plant ("Paradise"). These assessments included resiliency studies for fuel and transmission and financial considerations. TVA also prepared Environmental Assessments ("EAs") pursuant to the National Environmental Policy Act ("NEPA"). Results of these assessments were presented to the TVA Board at its February 2019 meeting, and the Board approved the retirement of Paradise Unit 3 by December 2020 and Bull Run Fossil Plant ("Bull Run") by December 2023.2023 was approved. Subsequent to the TVA Board approval, TVA determined that Paradise would not be restarted after January 2020 due to the plant's material condition. Paradise Fossil Plant Unit 3 was taken offline on February 1, 2020, effectively retiring the plant.
Financial Impact
As a result of TVA’sTVA's decision to accelerate the retirements of Paradise and Bull Run, certain construction projects at these locations were identified as probable of abandonment or were no longer expected to be in service for greater than one year prior to the plants' retirement dates. The write-off of these projects resulted in $20 million and $144$124 million of Operating and maintenance expense during the second quarter of 2019. TVA has since recognized a cumulative $37 million of Operating and maintenance expense related to other activities including certain regulatory compliance projects at these facilities. Of this amount, $3 million and $10 million were recognized during the three and nine months ended June 30, 2019,2020, respectively. TVA has also recognized lossesa cumulative $21 million of $5 million and $16 million in Operating and maintenance expense related to additional materials and supplies inventory reserves and write-offs identified at ParadiseParadise. No such amounts were recognized during the three andmonths ended June 30, 2020, with $2 million recognized during the nine months ended June 30, 2019, respectively.2020. Additional amounts for Bull Run may be written off during closure activities.
TVA’sTVA's policy is to adjust depreciation rates to reflect the most current assumptions, ensuring units will be fully depreciated by the applicable retirement dates. As a result of TVA's decision to accelerate the retirementretirements of Paradise and Bull Run, TVA has recognized an additional $225 million and $341a cumulative $916 million of accelerated depreciation, with $34 million and $350 million being recognized during the three and nine months ended June 30, 2020, respectively.
6. Leases
As described in Note 2 — Impact of New Accounting Standards and Interpretations, TVA has elected the modified retrospective method of adoption for the new lease accounting standard effective October 1, 2019. Under the modified retrospective method of adoption, prior year reported results are not restated.
TVA recorded $205 million and $210 million of lease assets and lease liabilities, respectively, for operating leases in effect at the adoption date. The accounting for finance leases remained substantially unchanged. Adoption of the standard did not materially impact results of operations or cash flows.
The following table provides additional information regarding the presentation of leases on the Consolidated Balance Sheets at June 30, 2020:
| | | | | | | | |
Amounts Recognized on TVA's Consolidated Balance Sheets At June 30, 2020 | | |
| Assets | | |
| Operating | Operating lease assets, net of amortization | $ | 332 | |
| Finance | Finance leases | 139 | |
| Total lease assets | | $ | 471 | |
| | |
| Liabilities | | |
| Current | | |
| Operating | Accounts payable and accrued liabilities | $ | 101 | |
| Finance | Accounts payable and accrued liabilities | 6 | |
| Non-current | | |
| Operating | Operating lease liabilities | 244 | |
| Finance | Other long-term liabilities | 180 | |
| Total lease liabilities | | $ | 531 | |
TVA's leases consist primarily of railcars, equipment, real estate/land, power generating facilities, and gas pipelines. TVA's leases have various terms and expiration dates remaining from less than 1 year to 27 years. The components of lease costs for the three and nine months ended June 30, 2020, were as follows:
| | | | | | | | | | | | | | | |
Lease Costs(1) | | | | | | | |
| Three Months Ended June 30, 2020 | | | | Nine Months Ended June 30, 2020 | | |
Operating lease costs(1) | $ | 26 | | | | | $ | 65 | | | |
Variable lease costs(1) | 26 | | | | | 52 | | | |
Short-term lease costs(1) | 2 | | | | | 5 | | | |
| Finance lease costs | | | | | | | |
Amortization of lease assets(2) | 2 | | | | | 7 | | | |
Interest on lease liabilities(3)(4) | 9 | | | | | 24 | | | |
| Total finance lease costs | 11 | | | | | 31 | | | |
| Total lease costs | $ | 65 | | | | | $ | 153 | | | |
Notes
(1) Costs are included in Operating and maintenance expense, Fuel expense, Purchased power expense, and Tax equivalents expense on the Consolidated Statements of Operations. TVA's rental expense for operating leases was approximately $18 million and $54 million for the three and nine months ended June 30, 2019, respectively.
(2) Expense is included in Depreciation and amortization expense on the Consolidated Statements of Operations.
(3) Expense is included in Interest expense on the Consolidated Statements of Operations. 6.(4) Certain finance leases receive regulatory accounting treatment and are reclassified to Fuel expense and Purchased power expense.
TVA's variable lease costs are primarily related to renewable energy purchase agreements that require TVA to purchase all output from the underlying facility. Payments under those agreements are solely based on the actual output over the lease term. Certain TVA lease agreements contain renewal options. Those renewal options that are reasonably certain to be exercised are included in the lease measurements.
The following table contains additional information with respect to cash and non-cash activities related to leases:
| | | | | |
Amounts Recognized on TVA's Consolidated Statements of Cash Flows For the Nine Months Ended June 30, 2020 | |
| Operating cash flows for operating leases | $ | 57 | |
| Operating cash flows for finance leases | 24 | |
| Financing cash flows for finance leases | 4 | |
| |
| Lease assets obtained in exchange for lease obligations (non-cash) | |
Operating leases(1) | $ | 188 | |
| Finance leases | 3 | |
Note
(1) Amount excludes operating lease assets recorded as a result of the adoption of the new lease standard
TVA has certain finance leases under power purchase agreements under which the present value of the minimum lease payments exceeds the fair value of the related lease asset at the date of measurement. This resulted in an interest rate that was higher than TVA's incremental borrowing rate. At June 30, 2020, the weighted average remaining lease term in years and the weighted average discount rate for TVA's operating and financing leases were as follows:
| | | | | |
Weighted Averages At June 30, 2020 | |
| Weighted average remaining lease terms | |
| Operating leases | 4 years |
| Finance leases | 12 years |
| |
Weighted average discount rate(1) | |
| Operating leases | 1.6% |
| Finance leases | 35.1% |
Note
(1) The discount rate is calculated using the rate implicit in a lease if it is readily determinable. If the rate used by the lessor is not readily determinable, TVA uses its incremental borrowing rate as permitted by accounting guidance. The incremental borrowing rate is influenced by TVA's credit rating and lease term and as such may differ for individual leases, embedded leases, or portfolios of leased assets.
The following table presents maturities of lease liabilities and a reconciliation of the undiscounted cash flows to lease liabilities at June 30, 2020:
| | | | | |
Future Minimum Lease Payments Minimum Payments Due at June 30, 2020 | |
| Operating leases | |
| 2020 (remaining) | $ | 38 | |
| 2021 | 106 | |
| 2022 | 91 | |
| 2023 | 43 | |
| 2024 | 35 | |
| Thereafter | 44 | |
| Minimum annual payments | 357 | |
| Less: present value discount | (12) | |
| Operating present value of net minimum lease payments | $ | 345 | |
| |
| Finance leases | |
| 2020 (remaining) | $ | 14 | |
| 2021 | 53 | |
| 2022 | 53 | |
| 2023 | 56 | |
| 2024 | 52 | |
| Thereafter | 418 | |
| Minimum annual payments | 646 | |
| Less: amount representing interest | (460) | |
| Finance present value of net minimum lease payments | $ | 186 | |
The following table presents the future minimum lease payments under operating leases and the finance lease maturities as reported under the previous lease standard at September 30, 2019:
| | | | | |
Future Minimum Lease Payments Minimum Payments Due at September 30, 2019 | |
| Operating leases | |
| 2020 | $ | 76 | |
| 2021 | 75 | |
| 2022 | 60 | |
| 2023 | 12 | |
| 2024 | 3 | |
| Thereafter | 2 | |
| Minimum annual payments | 228 | |
| Less: present value discount | — | |
| Operating present value of net minimum lease payments | $ | 228 | |
| |
| Finance leases | |
| 2020 | $ | 53 | |
| 2021 | 53 | |
| 2022 | 53 | |
| 2023 | 55 | |
| 2024 | 51 | |
| Thereafter | 418 | |
| Minimum annual payments | 683 | |
| Less: amount representing interest | (495) | |
| Finance present value of net minimum lease payments | $ | 188 | |
TVA entered into a power purchase agreement with a renewable resource provider for solar generation and rights to charge and discharge a battery energy storage system. The system is considered a lease component in this agreement. This lease has a term of 20 years, and is expected to commence on October 1, 2022. Payments made over the term of this lease are expected to total approximately $89 million.
7. Other Long-Term Assets
The table below summarizes the types and amounts of TVA's other long-term assets:
| | | Other Long-Term Assets | Other Long-Term Assets | Other Long-Term Assets | |
| | At June 30, 2019 | | At September 30, 2018 | | At June 30, 2020 | | At September 30, 2019 |
| Loans and other long-term receivables, net(1) | $ | 120 |
| | $ | 125 |
| $ | 128 | | | $ | 125 | |
EnergyRight® receivables | 82 |
| | 90 |
| EnergyRight® receivables | 73 | | | 81 | |
Prepaid long-term service agreements(1) | | Prepaid long-term service agreements(1) | 39 | | | 22 | |
Restricted cash and cash equivalents(1) | | 23 | | | 23 | |
| Prepaid capacity payments | 21 |
| | 27 |
| Prepaid capacity payments | 13 | | | 19 | |
Restricted cash and cash equivalents(1) | 23 |
| | 23 |
| |
| Commodity contract derivative assets | 6 |
| | 31 |
| |
| | Other | 72 |
| | 66 |
| Other | 63 | | | 55 | |
| Other long-term assets | $ | 324 |
| | $ | 362 |
| |
| Total other long-term assets | | Total other long-term assets | $ | 339 | | | $ | 325 | |
Note
(1) Certain historical amounts have been reclassified to conform with current year presentation of Restricted cash and cash equivalents.presentation.
EnergyRight® Receivables. In association with the EnergyRight® Solutions program, LPCsTVA's local power company customers ("LPCs") offer financing to end-use customers for the purchase of energy-efficient equipment. Depending on the nature of the energy-efficiency project, loans may have a maximum term of five years or 10 years. TVA purchases the resulting loans receivable from its LPCs. The loans receivable are then transferred to a third-party bank with which TVA has agreed to repay in full any loans receivable that have been in default for 180 days or more or that TVA has determined are uncollectible. Given this continuing involvement, TVA accounts for the transfer of the loans receivable as secured borrowings. The current and long-term
portions of the loans receivable are reported in Accounts receivable, net and Other long-term assets, respectively, on TVA's Consolidated Balance Sheets. As ofAt June 30, 2019,2020, and September 30, 2018,2019, the carrying amount of the loans receivable, net of discount, reported in Accounts receivable, net was approximately $21$18 million and $22$20 million, respectively. See Note 10 — Other Long-Term Liabilities for information regarding the associated financing obligation.
Prepaid Long-Term Service Agreements. TVA has entered into various long-term service agreements for major maintenance activities at certain of its combined cycle plants. TVA uses the direct expense method of accounting for these arrangements. TVA accrues for parts when it takes ownership and for contractor services when they are rendered. Under certain of these agreements, payments made exceed the value of parts received and services rendered. The current and long-term portions of the resulting prepayments are reported in Other current assets and Other long-term assets, respectively, on TVA's Consolidated Balance Sheets. At June 30, 2020, and September 30, 2019, prepayments of $4 million and $5 million, respectively, were recorded in Other current assets.
7.
8. Regulatory Assets and Liabilities
Regulatory assets generally represent incurred costs that have been deferred because such costs are probable of future recovery in customer rates. Regulatory liabilities generally represent obligations to make refunds to customers for previous collections for costs that are not likely to be incurred or deferral of gains that will be credited to customers in future periods. Components of regulatory assets and regulatory liabilities are summarized in the table below:
| | | | | | | | | | | |
| Regulatory Assets and Liabilities | | | |
| | At June 30, 2020 | | At September 30, 2019 |
| Current regulatory assets | | | |
| | | |
| Unrealized losses on interest rate derivatives | $ | 111 | | | $ | 89 | |
| | | |
| Unrealized losses on commodity derivatives | 38 | | | 39 | |
| | | |
| | | |
| Fuel cost adjustment receivable | — | | | 28 | |
| | | |
| Total current regulatory assets | 149 | | | 156 | |
| | | |
| Non-current regulatory assets | | | |
| Deferred pension costs and other post-retirement benefits costs | 4,524 | | | 4,756 | |
| Non-nuclear decommissioning costs | 2,012 | | | 1,741 | |
| | | |
| Nuclear decommissioning costs | 963 | | | 868 | |
| Unrealized losses on interest rate derivatives | 1,603 | | | 1,241 | |
| | | |
| Unrealized losses on commodity contracts | 2 | | | 15 | |
| | | |
| | | |
| Other non-current regulatory assets | 147 | | | 142 | |
| Total non-current regulatory assets | 9,251 | | | 8,763 | |
| Total regulatory assets | $ | 9,400 | | | $ | 8,919 | |
| | | |
| Current regulatory liabilities | | | |
| Fuel cost adjustment tax equivalents | $ | 121 | | | $ | 138 | |
| Fuel cost adjustment | 71 | | | — | |
| Unrealized gains on commodity derivatives | 5 | | | 12 | |
| Total current regulatory liabilities | 197 | | | 150 | |
| | | |
| Non-current regulatory liabilities | | | |
| | | |
| Unrealized gains on commodity derivatives | 5 | | | — | |
| | | |
| | | |
| Total regulatory liabilities | $ | 202 | | | $ | 150 | |
|
| | | | | | | |
Regulatory Assets and Liabilities |
| | At June 30, 2019 | | At September 30, 2018 |
| Current regulatory assets | | | |
Gallatin coal combustion residual facilities(1) | $ | — |
| | $ | 38 |
|
| Unrealized losses on interest rate derivatives | 85 |
| | 73 |
|
| Environmental agreements | — |
| | 3 |
|
| Unrealized losses on commodity contracts | 33 |
| | 4 |
|
| Environmental cleanup costs - Kingston ash spill | 65 |
| | 266 |
|
| Fuel cost adjustment receivable | — |
| | 30 |
|
| Total current regulatory assets | 183 |
| | 414 |
|
| | | | |
| Non-current regulatory assets | |
| | |
|
| Deferred pension costs and other post-retirement benefits costs | 2,940 |
| | 3,119 |
|
Non-nuclear decommissioning costs(1) | 1,761 |
| | 1,019 |
|
Gallatin coal combustion residuals facilities(1) | — |
| | 861 |
|
| Nuclear decommissioning costs | 847 |
| | 784 |
|
| Unrealized losses on interest rate derivatives | 1,049 |
| | 692 |
|
| Environmental agreements | 12 |
| | 11 |
|
| Unrealized losses on commodity contracts | 9 |
| | 8 |
|
| Other non-current regulatory assets | 137 |
| | 118 |
|
| Total non-current regulatory assets | 6,755 |
| | 6,612 |
|
| Total regulatory assets | $ | 6,938 |
| | $ | 7,026 |
|
| | | | |
| Current regulatory liabilities | |
| | |
|
| Fuel cost adjustment tax equivalents | $ | 138 |
| | $ | 146 |
|
| Fuel cost adjustment | 10 |
| | — |
|
| Unrealized gains on commodity derivatives | 13 |
| | 41 |
|
| Total current regulatory liabilities | 161 |
| | 187 |
|
| | | | |
| Non-current regulatory liabilities | |
| | |
|
| Deferred other post-retirement benefits cost | 58 |
| | 73 |
|
| Unrealized gains on commodity derivatives | 6 |
| | 31 |
|
| Total non-current regulatory liabilities | 64 |
| | 104 |
|
| Total regulatory liabilities | $ | 225 |
| | $ | 291 |
|
Note
(1)Due to higher volatility in the financial markets associated with the COVID-19 pandemic, TVA has experienced unrealized losses related to its derivative instruments for the nine months ended June 30, 2020. TVA does not recognize unrealized gains and losses from the investment portfolios and derivative instruments within earnings but rather defers all such gains and losses within a regulatory liability or asset in accordance with its accounting policy. See Note 9.14 — Risk Management Activities and Derivative Transactions and Note 15 — Fair Value Measurements.
8.9. Variable Interest Entities
A VIE is an entity that either (i) has insufficient equity to permit the entity to finance its activities without additional subordinated financial support or (ii) has equity investors who lack the characteristics of owning a controlling financial interest. When TVA determines that it has a variable interest in a VIE, a qualitative evaluation is performed to assess which interest holders have the power to direct the activities that most significantly impact the economic performance of the entity and have the obligation to absorb losses or receive benefits that could be significant to the entity. The evaluation considers the purpose and design of the business, the risks that the business was designed to create and pass along to other entities, the activities of the
business that can be directed and which party can direct them, and the expected relative impact of those activities on the economic performance of the business through its life. TVA has the power to direct the activities of an entity when it has the ability to make key operating and financing decisions, including, but not limited to, capital investment and the issuance of debt. Based on the evaluation of these criteria, TVA has determined it is the primary beneficiary of certain entities and as such is required to account for the VIEs on a consolidated basis.
John Sevier VIEs
In 2012, TVA entered into a $1.0 billion construction management agreement and lease financing arrangement with John Sevier Combined Cycle Generation LLC ("JSCCG") for the completion and lease by TVA of the John Sevier Combined Cycle Facility ("John Sevier CCF"). JSCCG is a special single-purpose limited liability company formed in January 2012 to finance the John Sevier CCF through a $900 million secured note issuance (the "JSCCG("JSCCG notes") and the issuance of $100 million of membership interests subject to mandatory redemption. The membership interests were purchased by John Sevier Holdco LLC ("Holdco"). Holdco is a special single-purpose entity, also formed in January 2012, established to acquire and hold the membership interests in JSCCG. A non-controlling interest in Holdco is held by a third party through nominal membership interests, to which none of the income, expenses, and cash flows are allocated.
The membership interests held by Holdco in JSCCG were purchased with proceeds from the issuance of $100 million of secured notes (the "Holdco("Holdco notes") and are subject to mandatory redemption pursuant to a schedule of amortizing, semi-annual payments due each January 15 and July 15, with a final payment due in January 2042. The payment dates for the mandatorily redeemable membership interests are the same as those of the Holdco notes. The sale of the JSCCG notes, the membership interests in JSCCG, and the Holdco notes closed in January 2012. The JSCCG notes are secured by TVA's lease payments, and the Holdco notes are secured by Holdco's investment in, and amounts receivable from, JSCCG. TVA's lease payments to JSCCG are equal to and payable on the same dates as JSCCG's and Holdco's semi-annual debt service payments. In addition to the lease payments, TVA pays administrative and miscellaneous expenses incurred by JSCCG and Holdco. Certain agreements related to this transaction contain default and acceleration provisions.
Due to its participation in the design, business conduct, and credit and financial support of JSCCG and Holdco, TVA has determined that it has a variable interest in each of these entities. Based on its analysis, TVA has concluded that it is the primary beneficiary of JSCCG and Holdco and, as such, is required to account for the VIEs on a consolidated basis. Holdco's membership interests in JSCCG are eliminated in consolidation.
Southaven VIE
In 2013, TVA entered into a $400 million lease financing arrangement with Southaven Combined Cycle Generation LLC ("SCCG") for the lease by TVA of the Southaven Combined Cycle Facility ("Southaven CCF"). SCCG is a special single-purpose limited liability company formed in June 2013 to finance the Southaven CCF through a $360 million secured notes issuance (the "SCCG("SCCG notes") and the issuance of $40 million of membership interests subject to mandatory redemption. The membership interests were purchased by Southaven Holdco LLC ("SHLLC"). SHLLC is a special single-purpose entity, also formed in June 2013, established to acquire and hold the membership interests in SCCG. A non-controlling interest in SHLLC is held by a third party through nominal membership interests, to which none of the income, expenses, and cash flows of SHLLC are allocated.
The membership interests held by SHLLC were purchased with proceeds from the issuance of $40 million of secured notes (the "SHLLC("SHLLC notes") and are subject to mandatory redemption pursuant to a schedule of amortizing, semi-annual payments due each February 15 and August 15, with a final payment due on August 15, 2033. The payment dates for the mandatorily redeemable membership interests are the same as those of the SHLLC notes, and the payment amounts are sufficient to provide returns on, as well as returns of, capital until the investment has been repaid to SHLLC in full. The rate of return on investment to SHLLC is 7.0 percent, which is reflected as interest expense inon the Consolidated Statements of Operations. SHLLC is required to pay a pre-determined portion of the return on investment to Seven States Southaven, LLC ("SSSL") on each lease payment date as agreed in SHLLC's formation documents (the "Seven States Return"). The current and long-term portions of
the Membership interests of VIE subject to mandatory redemption are included in Accounts payable and accrued liabilities and Other long-term liabilities, respectively.
The payment dates for the mandatorily redeemable membership interests are the same as those of the SHLLC notes. The SCCG notes are secured by TVA's lease payments, and the SHLLC notes are secured by SHLLC's investment in, and amounts receivable from, SCCG. TVA's lease payments to SCCG are payable on the same dates as SCCG's and SHLLC's semi-annual debt service payments and are equal to the sum of (i) the amount of SCCG's semi-annual debt service payments, (ii) the amount of SHLLC's semi-annual debt service payments, and (iii) the amount of the Seven States Return. In addition to the lease payments, TVA pays administrative and miscellaneous expenses incurred by SCCG and SHLLC. Certain agreements related to this transaction contain default and acceleration provisions.
In the event that TVA were to choose to exercise an early buy out feature of the Southaven facility lease, in part or in whole, TVA must pay to SCCG amounts sufficient for SCCG to repay or partially repay on a pro rata basis the membership interests held by SHLLC, including any outstanding investment amount plus accrued but unpaid return. TVA also has the right,
at any time and without any early redemption of the other portions of the Southaven facility lease payments due to SCCG, to fully repay SHLLC's investment, upon which repayment SHLLC will transfer the membership interests to a designee of TVA.
TVA participated in the design, business conduct, and financial support of SCCG and has determined that it has a direct variable interest in SCCG resulting from risk associated with the value of the Southaven CCF at the end of the lease term. Based on its analysis, TVA has determined that it is the primary beneficiary of SCCG and, as such, is required to account for the VIE on a consolidated basis.
Impact on Consolidated Financial Statements
The financial statement items attributable to carrying amounts and classifications of JSCCG, Holdco, and SCCG as ofat June 30, 2019,2020, and September 30, 2018,2019, as reflected inon the Consolidated Balance Sheets, are as follows:
| | | | | | | | | | | |
Summary of Impact of VIEs on Consolidated Balance Sheets (in millions) | | | |
| | At June 30, 2020 | | At September 30, 2019 |
| | | |
| | | |
| | | |
| | | |
| Current liabilities | | | |
| Accrued interest | $ | 24 | | | $ | 11 | |
| Accounts payable and accrued liabilities | 3 | | | 3 | |
| Current maturities of long-term debt of variable interest entities | 40 | | | 39 | |
| Total current liabilities | 67 | | | 53 | |
| Other liabilities | | | |
| Other long-term liabilities | 24 | | | 25 | |
| Long-term debt, net | | | |
| Long-term debt of variable interest entities, net | 1,069 | | | 1,089 | |
| Total liabilities | $ | 1,160 | | | $ | 1,167 | |
|
| | | | | | | |
| Summary of Impact of VIEs on Consolidated Balance Sheets |
| | At June 30, 2019 | | At September 30, 2018 |
| Current liabilities | | | |
|
| Accrued interest | 25 |
| | $ | 11 |
|
| Accounts payable and accrued liabilities | 2 |
| | 2 |
|
| Current maturities of long-term debt of variable interest entities | 39 |
| | 38 |
|
| Total current liabilities | 66 |
| | 51 |
|
| Other liabilities | | | |
| Other long-term liabilities | 27 |
| | 28 |
|
| Long-term debt, net | | | |
| Long-term debt of variable interest entities, net | 1,108 |
| | 1,127 |
|
| Total liabilities | $ | 1,201 |
| | $ | 1,206 |
|
Interest expense of $13 million and $14 million for both the three months ended June 30, 2020 and 2019, respectively, and 2018,$41 million and $42 million and $43 million for the nine months ended June 30, 20192020 and 2018,2019, respectively, is included inon the Consolidated Statements of Operations related to debt of VIEs and membership interests of VIEs subject to mandatory redemption.
Creditors of the VIEs have no recourse to the general credit of TVA. TVA does not have any obligations to provide financial support to the VIEs other than as prescribed in the terms of the agreements related to these transactions.
9. Gallatin Coal Combustion Residual Facilities
Background
TVA is involved in two lawsuits relating to alleged discharges of pollutants from the CCR facilities at Gallatin.
Lawsuit Brought by TDEC. In January 2015, the Tennessee Department of Environment and Conservation ("TDEC") filed a lawsuit against TVA in the Chancery Court for Davidson County, Tennessee, alleging that pollutants from Gallatin have been discharged in violation of the Tennessee Water Quality Control Act and the Tennessee Solid Waste Disposal Act. The Tennessee Scenic Rivers Association ("TSRA") and Tennessee Clean Water Network ("TCWN") are also plaintiffs. On June 13, 2019, the parties filed a consent decree with the Court to resolve this matter, which the Court approved and entered on July 24, 2019. Under the consent decree, TVA agreed to close the existing wet ash disposal impoundments by removal, either to an onsite landfill or to an offsite facility, which will be determined after appropriate environmental reviews. TVA may also submit a plan that allows for beneficial reuse of the CCR material. Under the consent decree, TVA must submit a removal and closure plan to TDEC and must remove the CCR material within 20 years of TDEC’s approval of the plan. The consent decree does not contain penalties or any admission of fault or liability. In addition to the consent decree, TDEC entered an administrative order providing for ongoing investigation and monitoring related to a closed legacy impoundment at the site. After a five-year study period, TDEC and TVA will determine whether any additional corrective action and/or closure activities are necessary for the legacy impoundment.
Lawsuit Brought by TSRA and TCWN. In April 2015, TSRA and TCWN filed a lawsuit against TVA in the U.S. District Court for the Middle District of Tennessee alleging that pollutants have been discharged into the Cumberland River from CCR facilities at Gallatin in violation of the Clean Water Act (“CWA”). The plaintiffs sought injunctive relief, including an order requiring TVA to relocate the CCR facilities, civil penalties of up to $37,500 per violation per day, and attorneys’ fees.
On August 4, 2017, the court issued a decision (the "August 2017 Order") that found TVA had discharged pollutants into the Cumberland River in the past and that the discharge was likely ongoing. The court ordered TVA to excavate the CCR
materials and move them to a lined facility. The court did not assess any monetary penalties against TVA for the CWA violations, citing the fact that its order to relocate the CCR materials would cause TVA to incur significant costs.
On October 2, 2017, TVA appealed the August 2017 Order to the United States Court of Appeals for the Sixth Circuit ("Sixth Circuit"). On September 24, 2018, a panel of the Sixth Circuit reversed the district court decision and held that the district court erred by imposing CWA liability against TVA and that, therefore, the imposition of injunctive relief was an abuse of discretion. On October 22, 2018, the plaintiffs filed a petition requesting that the full Sixth Circuit rehear the case. On January 17, 2019, the Sixth Circuit denied the petition. On April 15, 2019, the plaintiffs requested review by the United States Supreme Court.
Financial Impact
Based on the August 2017 Order and the assumptions that a new lined facility would be permitted and constructed on the Gallatin site and all existing CCR materials at Gallatin would be moved to this site, TVA estimated the costs of the project to be approximately $900 million, which reflected the expected costs of inflation over the duration of the project but was not discounted to a present value amount given the nature of the obligation. At September 30, 2018, related liabilities of $862 million and $30 million were recorded in Other long-term liabilities and Accounts payable and accrued liabilities, respectively.
As a result of the subsequent decision in TVA's favor by the Sixth Circuit, as well as the June 2019 consent decree filed in the case brought by TDEC, amounts previously recorded as Other long-term liabilities on an undiscounted basis have been reversed and an ARO in the amount of $667 million has been recorded for the discounted cash flows expected for the closure and post-closure activities related to Gallatin CCR facilities. See Note 11 for additional details.
The ultimate cost of the removal project will depend on actual timing and results of ongoing litigation, environmental studies, licensing, permitting, site subsurface conditions, contractor availability, weather, equipment, available material resources, and other contingency factors. These contingency factors could cause the project cost estimate to change materially in the near term. TVA updates its estimate for project costs as changes in these factors are determined to be probable of occurring.
10. Other Long-Term Liabilities
Other long-term liabilities consist primarily of liabilities related to certain derivative agreements and finance leases, as well as liabilities for environmental remediation and liabilities under agreements related to compliance with certain environmental regulations. The table below summarizes the types and amounts of Other long-term liabilities:
| | | | | | | | | | | |
Other Long-Term Liabilities (in millions) | | | |
| | At June 30, 2020 | | At September 30, 2019 |
| Interest rate swap liabilities | $ | 1,997 | | | $ | 1,676 | |
| | | |
| Finance lease liabilities | 180 | | | 182 | |
| Currency swap liabilities | 166 | | | 193 | |
| | | |
| | | |
| | | |
| | | |
| | | |
EnergyRight® financing obligations | 81 | | | 90 | |
| Paradise pipeline financing obligation | 79 | | | 80 | |
| Accrued long-term service agreements | 59 | | | 66 | |
| Other | 186 | | | 203 | |
| Total other long-term liabilities | $ | 2,748 | | | $ | 2,490 | |
|
| | | | | | | |
| Other Long-Term Liabilities |
| | At June 30, 2019 | | At September 30, 2018 |
| Interest rate swap liabilities | $ | 1,454 |
| | $ | 1,122 |
|
| Gallatin coal combustion residual facilities liability | — |
| | 862 |
|
| Capital lease obligations | 181 |
| | 178 |
|
| Currency swap liabilities | 157 |
| | 81 |
|
EnergyRight® financing obligation | 92 |
| | 102 |
|
Paradise pipeline financing obligation(1) | 80 |
| | 80 |
|
Accrued long-term service agreement(1) | 69 |
| | 74 |
|
Other(1) | 193 |
| | 216 |
|
| Total other long-term liabilities | $ | 2,226 |
| | $ | 2,715 |
|
Note
(1) Certain amounts have been reclassified to conform with current year presentation.
Interest Rate Swap Liabilities. TVA uses interest rate swaps to fix variable short-term debt to a fixed rate. The values of these derivatives are included in Accounts payable and accrued liabilities and Other long-term liabilities on the Consolidated Balance Sheets. As ofAt June 30, 2019,2020, and September 30, 2018,2019, the carrying amount of the interest rate swap liabilities reported in Accounts payable and accrued liabilities was approximately $84$111 million and $77$88 million, respectively. See Note 14 —Risk Management Activities and Derivative Transactions — Derivatives Not Receiving Hedge Accounting Treatment — Interest Rate Derivatives for information regarding the interest rate swap liabilities. As of June 30, 2019, Interest2020, interest rate swap liabilities increased $332$344 million as compared to September 30, 2018,2019, primarily due to decreasesa decrease in forecasted future interest rates resulting in higher mark-to-market values on future expected net cash flows.
Gallatin Coal Combustion Residual Facilities Liability. As of September 30, 2018, the estimated cost of the potential Gallatin CCR project was $900 million. The current and long-term portions of the resulting obligation were reported in Accounts payable and accrued liabilities and Other long-term liabilities, respectively, on TVA's Consolidated Balance Sheets. As of
September 30, 2018, related liabilities of $30 million were recorded in Accounts payable and accrued liabilities. As a result of the subsequent decision in TVA’s favor by the Sixth Circuit, as well as the June 2019 consent decree filed in the case brought by TDEC, Gallatin CCR project costs are now recorded in Asset retirement obligations. See Note 9 for information regarding the Gallatin CCR facilities and Note 11 for information regarding Asset retirement obligations.
EnergyRight® Financing ObligationObligations. TVA purchases certain loans receivable from its LPCs in association with the EnergyRight® Solutions program. The current and long-term portions of the resulting financing obligationobligations are reported in Accounts payable and accrued liabilities and Other long-term liabilities, respectively, on TVA's Consolidated Balance Sheets. TheAt June 30, 2020, and September 30, 2019, the carrying amount of the financing obligationobligations reported in Accounts payable and accrued liabilities for June 30, 2019, and September 30, 2018, was approximately $23$20 million and $25$23 million, respectively. See Note 67 — Other Long-Term Assets for information regarding the associated loans receivable.
In response to the COVID-19 pandemic, customers experiencing financial hardship can request a deferral of loan payments for a period of up to six months. This deferral option began April 20, 2020, and is available through October 31, 2020. Deferred loans will not accrue interest during the deferral months.
Paradise Pipeline Financing Obligation. TVA reserves firm pipeline capacity on an approximately 19 mile19-mile pipeline owned by Texas Gas, which serves TVA’sTVA's Paradise Combined Cycle Plant. The capacity contract contains a lease component due to TVA’s exclusive right to use the pipeline. TVA accounts for this lease componentcontract as a financing transaction. The current and long-term portions of the resulting financing obligation are reported in Accounts payable and accrued liabilities and Other long-term liabilities, respectively, on TVA's Consolidated Balance Sheets. As ofAt both June 30, 2019,2020, and September 30, 2018,2019, related liabilities of less than $1 million were recorded in Accounts payable and accrued liabilities.
Accrued Long-Term Service Agreement. Agreements. TVA has entered into various long-term service agreements for major maintenance activities at certain of its combined cycle plants. TVA uses the direct expense method of accounting for these arrangements. TVA accrues for parts when it takes ownership and for contractor services when they are rendered. Under certain of these agreements, parts received and services rendered exceed payments made. The current and long-term portions of the resulting obligation are reported in Accounts payable and accrued liabilities and Other long-term liabilities, respectively, on TVA's Consolidated Balance Sheets. As ofAt June 30, 2019,2020, and September 30, 2018,2019, related liabilities of $16$11 million and $30$12 million, respectively, were recorded in Accounts payable and accrued liabilities.
11. Asset Retirement Obligations
During the nine months ended June 30, 2019,2020, TVA's total asset retirement obligations ("ARO") liability increased $853$455 million as a result of recording an ARO for the Gallatin CCR facilities, additions to obligations,periodic accretion and revisions in estimates and periodic accretion,estimate, partially offset by settlement activity from ongoing ARO projects at TVA facilities.that were conducted during the period. The nuclear and non-nuclear accretion amounts were deferred as regulatory assets. During the nine months ended June 30, 2019, $1082020, $127 million of the related non-nuclear regulatory assets were amortized into expense as these amounts were collected in rates. See Note 7.8 — Regulatory Assets and Liabilities. TVA maintains investment trusts to help fund its decommissioning obligations. See Note 15 — Fair Value Measurements — Investment Funds and Note 1920 — Contingencies and Legal Proceedings — Contingencies — Decommissioning Costs for disclosure of the current balances of the trusts and a discussion of the trusts' objectives and the current balancesobjectives.
| | Asset Retirement Obligation Activity(1) | Asset Retirement Obligation Activity(1) | Asset Retirement Obligation Activity(1) | |
| | Nuclear | | Non-Nuclear | | Total | | Nuclear | | Non-Nuclear | | Total |
| Balance at September 30, 2018 | $ | 2,989 |
| | $ | 1,790 |
| | $ | 4,779 |
| |
| Balance at September 30, 2019 | | Balance at September 30, 2019 | $ | 3,136 | | | $ | 2,480 | | | $ | 5,616 | |
| Settlements | (2 | ) | | (56 | ) | | (58 | ) | Settlements | — | | | (85) | | | (85) | |
| Revisions in estimate | — |
| | 89 |
| | 89 |
| Revisions in estimate | — | | | 387 | | | 387 | |
| Additional obligation | 18 |
| | — |
| | 18 |
| |
| Gallatin CCR | — |
| | 667 |
| | 667 |
| |
| | Accretion (recorded as regulatory asset) | 102 |
| | 35 |
| | 137 |
| Accretion (recorded as regulatory asset) | 106 | | | 47 | | | 153 | |
| Balance at June 30, 2019 | $ | 3,107 |
| | $ | 2,525 |
| | $ | 5,632 |
| |
| | Balance at June 30, 2020 | | Balance at June 30, 2020 | $ | 3,242 | | | $ | 2,829 | | | $ | 6,071 | |
|
Note
(1) The current portionportions of the ARO liability in the amountamounts of $164$266 million and $115$163 million isat June 30, 2020, and September 30, 2019, respectively, are included in Accounts payable and accrued liabilities at June 30, 2019, and September 30, 2018, respectively.liabilities.
The revisions in non-nuclear estimates increased $89$387 million for the nine months ended June 30, 2019. As2020. In November 2019, the Tennessee Department of Environment and Conservation ("TDEC") released amendments to its regulations which govern solid waste disposal facilities, including TVA's active Coal Combustion Residuals ("CCR") facilities covered by a resultsolid waste disposal permit and those which closed pursuant to a TDEC approved closure plan. Such facilities are generally subject to a 30-year post-closure care period during which the owner or operator must undertake certain activities, including monitoring and maintaining the facility. The amendments will, among other things, add an additional 50-year period after the end of recent experience in completing settlements at certain facilities, costs for asbestos abatementthe post-closure care period, require TVA to submit recommendations as to what activities across TVA's fossil fleet increased $114 million.must be performed during this 50-year period to protect human health and the environment, and require TVA also approved a change in the preferredto submit revised closure method for the Allen West Impoundment from closure-in-place to closure-by-removal, whichplans every 10 years. This regulatory revision resulted in a costan increase of $33 million. Partially offsetting these increases$129 million, of which $38 million was a $57 million decrease in costs for Paradise closure projects.
Additionally, as a result of the decision in TVA’s favor by the Sixth Circuit in the lawsuit brought by TSRA and TCWN, as well as the June 2019 consent decree filed in the case brought by TDEC, Gallatin discounted cash flows related to operating CCR closurefacilities and post-closure costs$91 million was related to inactive or closed CCR facilities. Additionally, in June 2020, based on most recent project cost data and estimates, TVA revised its AROs for certain CCR facilities at Allen Fossil Plant, resulting in an increase of $667 million have been recorded as Asset retirement obligations. The obligation is based upon the assumptions outlined in the consent decree, including a new lined facility will be permitted and constructed on the Gallatin site and existing CCR materials in the existing wet ash disposal impoundments at Gallatin will be moved to this new facility over a 20 year period. See Note 9 for additional details.$267 million.
12. Debt and Other Obligations
Debt Outstanding
Total debt outstanding at June 30, 2019,2020, and September 30, 2018,2019, consisted of the following:
| | | | | | | | | | | |
Debt Outstanding
(in millions) | | | |
| At June 30, 2020 | | At September 30, 2019 |
| Short-term debt | | | |
| Short-term debt, net | $ | 777 | | | $ | 922 | |
Current maturities of power bonds issued at par(1) | 1,917 | | | 1,030 | |
| Current maturities of long-term debt of VIEs issued at par | 40 | | | 39 | |
| Current maturities of notes payable | — | | | 23 | |
| Total current debt outstanding, net | 2,734 | | | 2,014 | |
| Long-term debt | | | |
Long-term power bonds(2) | 18,057 | | | 19,225 | |
| Long-term debt of VIEs, net | 1,069 | | | 1,089 | |
| | | |
| Unamortized discounts, premiums, issue costs, and other | (125) | | | (131) | |
| Total long-term debt, net | 19,001 | | | 20,183 | |
| Total debt outstanding | $ | 21,735 | | | $ | 22,197 | |
|
| | | | | | | |
Debt Outstanding |
| | At June 30, 2019 | | At September 30, 2018 |
| Short-term debt | | | |
| Short-term debt, net | $ | 1,444 |
| | $ | 1,216 |
|
| Current maturities of power bonds | 1,030 |
| | 1,032 |
|
| Current maturities of long-term debt of variable interest entities | 39 |
| | 38 |
|
| Current maturities of notes payable | 23 |
| | 46 |
|
| Total current debt outstanding, net | 2,536 |
| | 2,332 |
|
| Long-term debt | |
| | |
|
Long-term power bonds(1) | 19,249 |
| | 20,300 |
|
| Long-term debt of variable interest entities, net | 1,108 |
| | 1,127 |
|
| Long-term notes payable | — |
| | 23 |
|
| Unamortized discounts, premiums, issue costs, and other | (134 | ) | | (143 | ) |
| Total long-term debt, net | 20,223 |
| | 21,307 |
|
| Total outstanding debt | $ | 22,759 |
| | $ | 23,639 |
|
NoteNotes
(1) Includes net exchange gain from currency transactions of $167 million and $147$83 million at June 30, 2019,2020. There were no such amounts at September 30, 2019.
(2) Includes net exchange gain from currency transactions of $101 million and $191 million at June 30, 2020, and September 30, 2018,2019, respectively.
For the nine months ended June 30, 2020, long-term debt decreased primarily due to approximately $1.9 billion of power bonds maturing in 2021, offset by a $1.0 billion power bond issuance in May 2020. Short-term debt increased primarily due to power bonds maturing in 2021.
Debt Securities Activity
The table below summarizes the long-term debt securities activity for the period from October 1, 2018,2019, to June 30, 2019:2020:
| | | | | | | | | | | | | | | | | | | | |
| Debt Securities Activity | | | | | | |
| | | Date | | Amount (in millions) | | Interest Rate |
Issues(1) | | | | | | |
| 2020 Series A Power Bonds | | May 2020 | | $ | 1,000 | | | 0.75 | % |
| | | | | | |
| Discount on debt issues | | | | (3) | | | |
| Total long-term debt issues | | | | $ | 997 | | | |
| | | | | | |
Redemptions/Maturities(2) | | | | | | |
electronotes® | | First Quarter 2020 | | $ | 217 | | | 3.33 | % |
electronotes® | | Third Quarter 2020 | | 1 | | | 2.65 | % |
| | | | | | |
| | | | | | |
| | | | | | |
| 2009 Series B | | December 2019 | | 1 | | | 3.77 | % |
| | | | | | |
| 2018 Series A | | March 2020 | | 1,000 | | | 2.25 | % |
| 1999 Series A PARRS (TVE) | | May 2020 | | 23 | | | 3.36 | % |
| 1998 Series D PARRS (TVC) | | June 2020 | | 17 | | | 3.55 | % |
| 2009 Series B | | June 2020 | | 27 | | | 3.77 | % |
| Total redemptions/maturities of power bonds | | | | 1,286 | | | |
| Notes payable | | | | 23 | | | 1.64 | % |
| Debt of variable interest entities | | | | 20 | | | 4.32 | % |
| Total redemptions/maturities of debt | | | | $ | 1,329 | | | |
| | | | | | |
| | | | | | |
| | | | | | |
| | | | | | |
| | | | | | |
|
| | | | | | | | | |
| Debt Securities Activity |
| | | Date | | Amount(1) | | Interest Rate |
| Redemptions/Maturities | | | | | | |
electronotes® | | First Quarter 2019 | | $ | 1 |
| | 2.65 | % |
electronotes® | | Second Quarter 2019 | | 1 |
| | 3.48 | % |
electronotes® | | Third Quarter 2019 | | 2 |
| | 2.89 | % |
| 2013 Series A | | October 2018 | | 1,000 |
| | 1.75 | % |
| 2009 Series B | | December 2018 | | 1 |
| | 3.77 | % |
| 2009 Series B | | June 2019 | | 29 |
| | 3.77 | % |
| Total redemptions/maturities of power bonds | | | | 1,034 |
| |
|
|
| Notes payable | | | | 46 |
| | 1.27 | % |
| Debt of variable interest entities | | | | 19 |
| | 4.31 | % |
| Total redemptions/maturities of debt | | | | $ | 1,099 |
| |
|
|
NoteNotes
(1) The 2020 Series A Power Bonds were issued at 99.7 percent of par.
(2) All redemptions were at 100 percent of par.
Credit Facility Agreements
TVA has funding available under 4 long-term revolving credit facilities totaling $2.7 billion: a $150 million credit facility that matures on December 11, 2021, a $1.0 billion credit facility that matures on June 13, 2023, a $1.0 billion credit facility that matures on September 28, 2023, and a $500 million credit facility that matures on February 1, 2025. The interest rate on any borrowing under these facilities varies based on market factors and the rating of TVA's senior unsecured, long-term, non-credit-enhanced debt. TVA is required to pay an unused facility fee on the portion of the total $2.7 billion that TVA has not borrowed or committed under letters of credit. This fee, along with letter of credit fees, may fluctuate depending on the rating of TVA's senior unsecured, long-term, non-credit-enhanced debt. At June 30, 2020, and September 30, 2019, there were approximately $1.5 billion and $1.3 billion, respectively, of letters of credit outstanding under these facilities, and there were 0 borrowings outstanding. See Note 14 — Risk Management Activities and Derivative Transactions — Other Derivative Instruments — Collateral.
The following table provides additional information regarding TVA's funding available under the four long-term revolving credit facilities:
Credit Facility Agreements | | | | | | | | | | | | | | | | | | | | | | | | | | |
Summary of Long-Term Credit Facilities At June 30, 2020 (in millions) | | | | | | | | |
| | Facility Limit | | Letters of Credit Outstanding | | Cash Borrowings | | Availability |
| Maturity Date | | | | | | | | |
| December 2021 | | $ | 150 | | | $ | 38 | | | $ | — | | | $ | 112 | |
| June 2023 | | 1,000 | | | 522 | | | — | | | 478 | |
| September 2023 | | 1,000 | | | 450 | | | — | | | 550 | |
| February 2025 | | 500 | | | 500 | | | — | | | — | |
| Total | | $ | 2,650 | | | $ | 1,510 | | | $ | — | | | $ | 1,140 | |
TVA and the U.S. Treasury, pursuant to the TVA Act, have entered into a memorandum of understanding under which the U.S. Treasury provides TVA with a $150 million credit facility. This credit facility was renewed in 20182019 with a maturity date of September 30, 2019.2020. Access to this credit facility or other similar financing arrangements with the U.S. Treasury has been available to TVA since the 1960s. TVA can borrow under the U.S. Treasury credit facility only if it cannot issue Bonds in the market on reasonable terms, and TVA considers the U.S. Treasury credit facility a secondary source of liquidity. The interest rate on any borrowing under this facility is based on the average rate on outstanding marketable obligations of the U.S. with maturities from date of issue of one year or less. There were no outstanding borrowings under the facility at June 30, 2019.2020. The availability of this credit facility may be impacted by how the U.S. government addresses the possibility of approaching its debt limit.
TVA also has funding available under four long-term revolving credit facilities totaling $2.7 billion: a $150 million credit facility that matures on December 11, 2021, a $500 million credit facility that matures on February 1, 2022, a $1.0 billion credit facility that matures on June 13, 2023, and a $1.0 billion credit facility that matures on September 28, 2023. The interest rate on any borrowing under these facilities varies based on market factors and the rating of TVA's senior unsecured, long-term, non-credit-enhanced debt. TVA is required to pay an unused facility fee on the portion of the total $2.7 billion that TVA has not borrowed or committed under letters of credit. This fee, along with letter of credit fees, may fluctuate depending on the rating of TVA's senior unsecured, long-term, non-credit-enhanced debt. At June 30, 2019, and September 30, 2018, there were approximately $1.1 billion and $921 million, respectively, of letters of credit outstanding under these facilities, and there were no borrowings outstanding. See Note 14 — Other Derivative Instruments — Collateral.
The following table provides additional information regarding TVA's funding available under the four long-term revolving credit facilities:
|
| | | | | | | | | | | | | | | |
Summary of Long-Term Credit Facilities At June 30, 2019 |
| | Facility Limit | | Letters of Credit Outstanding | | Cash Borrowings | | Availability |
| Maturity Date | | | | | | | |
| December 2021 | $ | 150 |
| | $ | 38 |
| | $ | — |
| | $ | 112 |
|
| February 2022 | 500 |
| | 500 |
| | — |
| | — |
|
| June 2023 | 1,000 |
| | 242 |
| | — |
| | 758 |
|
| September 2023 | 1,000 |
| | 310 |
| | — |
| | 690 |
|
| Total | $ | 2,650 |
| | $ | 1,090 |
| | $ | — |
| | $ | 1,560 |
|
Lease/Leasebacks
TVA previously entered into leasing transactions to obtain third-party financing for 24 peaking combustion turbine units ("CTs") as well as certain qualified technological equipment and software (collectively, "QTE"("QTE"). Due to TVA's continuing involvement with the combustion turbine facilities and the QTE during the leaseback term, TVA accounted for the lease proceeds as financing obligations. At June 30, 20192020, and September 30, 2018,2019, the outstanding leaseback obligations related to the remaining CTs and QTE were $263$223 million and $301$263 million, respectively. In March 2019, TVA made final rent payments under lease/leaseback transactions involving eight CTs, and TVA had previously acquired the equity interests related to these transactions. These transactions were terminated in July 2019. FinalIn May 2020, TVA made final rent payments are scheduledunder lease/leaseback transactions involving eight additional CTs, and TVA had previously acquired the equity interest related to be madethese transactions. Rent payments under the remaining CT lease/leaseback transactions on various dates from May 2020are scheduled to be made through January 2022. TVA has already acquired the equity interests related to transactions involving eight of these CTs and willdoes have the option to acquire the equity interests related to transactions involving the remaining eight CTs for additional amounts. In addition, on October 30, 2019, TVA provided notice of its intent to purchase the ownership interest in certain QTE. Repurchase payments are expected to be paid through a series of installments in 2021 and 2022, after which the associated leases will be terminated.
13. Accumulated Other Comprehensive Income (Loss)
Accumulated other comprehensive income (loss) ("AOCI") represents market valuation adjustments related to TVA's currency swaps. The currency swaps are cash flow hedges and are the only derivatives in TVA's portfolio that have been designated and qualify for hedge accounting treatment. TVA records exchange rate gains and losses on its foreign currency-denominated debt and any related accrued interest in net income and marks its currency swap assets and liabilities to market through other comprehensive income (loss) ("OCI"). TVA then reclassifies an amount out of AOCI into net income, offsetting the exchange gain/loss recorded on the debt. During the three months ended June 30, 20192020 and 2018,2019, TVA reclassified $13$7 million of gains and $43$13 million of losses, respectively, related to its cash flow hedges from AOCI to Interest expense. During the nine months ended June 30, 20192020 and 2018,2019, TVA reclassified $17$10 million of gains and $13$17 million of losses, respectively, related to its cash flow hedges from AOCI to Interest expense. See Note 14 — Risk Management Activities and Derivative Transactions.
TVA records certain assets and liabilities that result from the regulated ratemaking process that would not be recorded under GAAP for non-regulated entities. As such, certain items that would generally be reported in AOCI or that would impact the statements of operations are recorded as regulatory assets or regulatory liabilities. See Note 78 — Regulatory Assets and Liabilities for a schedule of regulatory assets and liabilities. See Note 14 — Risk Management Activities and Derivative Transactions for a discussion of the recognition in AOCI of gains and losses associated with certain derivative contracts. See Note 15 — Fair Value Measurementsfor a discussion of the recognition of certain investment fund gains and losses as regulatory assets and liabilities. See Note 1819 — Benefit Plans for a discussion of the regulatory accounting related to components of TVA's benefit plans.
14.�� Risk Management Activities and Derivative Transactions
TVA is exposed to various risks. These include risks related to commodity prices, investment prices, interest rates, currency exchange rates, and inflation as well as counterparty credit and performance risks. To help manage certain of these risks, TVA has historically entered into various derivative transactions, principally commodity option contracts, forward contracts, swaps, swaptions, futures, and options on futures. Other than certain derivative instruments in its trust investment funds, it is TVA’sTVA's policy to enter into these derivative transactions solely for hedging purposes and not for speculative purposes. TVA has suspended its Financial Trading Program ("FTP") in 2014 and no longer uses financial instruments to hedge risks related to commodity prices; however, TVA plans to continue to manage fuel price volatility through other methods and to periodically reevaluate its suspended FTP program for future use of financial instruments.
Overview of Accounting Treatment
TVA recognizes certain of its derivative instruments as either assets or liabilities on its Consolidated Balance Sheets at fair value. The accounting for changes in the fair value of these instruments depends on (1) whether TVA uses regulatory accounting to defer the derivative gains and losses, (2) whether the derivative instrument has been designated and qualifies for hedge accounting treatment, and (3) if so, the type of hedge relationship (for example, cash flow hedge).
The following tables summarize the accounting treatment that certain of TVA's financial derivative transactions receive:
| | | | | | | | | | | | | | | | | | | | | | | | | | | | | | | | | | | | | | | | | |
Summary of Derivative Instruments That Receive Hedge Accounting Treatment (part 1)Amount of Mark-to-Market Gain (Loss) Recognized in Accumulated Other Comprehensive Income (Loss)
(in millions) | | | | | | | | | | | | | |
| | | | | | Three Months Ended
June 30 | | | | Nine Months Ended
June 30 | | | |
| Derivatives in Cash Flow Hedging Relationship | | Objective of Hedge Transaction | | Accounting for Derivative
Hedging Instrument | | 2020 | | 2019 | | 2020 | | 2019 | |
| Currency swaps | | To protect against changes in cash flows caused by changes in foreign currency exchange rates (exchange rate risk) | | Unrealized gains and losses are recorded in AOCI and reclassified to Interest expense to the extent they are offset by gains and losses on the hedged transaction | | $ | 31 | | | $ | (47) | | | $ | (56) | | | $ | (76) | | |
|
| | | | | | | | | | | | | | | | | | | | | |
Summary of Derivative Instruments That Receive Hedge Accounting Treatment (part 1)
Amount of Mark-to-Market Gain (Loss) Recognized in Accumulated Other Comprehensive Income (Loss) |
| | | | | | | Three Months Ended
June 30 | | Nine Months Ended
June 30 | |
| Derivatives in Cash Flow Hedging Relationship | | Objective of Hedge Transaction | | Accounting for Derivative
Hedging Instrument | | 2019 | | 2018 | | 2019 | | 2018 | |
| Currency swaps | | To protect against changes in cash flows caused by changes in foreign currency exchange rates (exchange rate risk) | | Unrealized gains and losses are recorded in AOCI and reclassified to interest expense to the extent they are offset by gains and losses on the hedged transaction | | $ | (47 | ) | | $ | (65 | ) | | $ | (76 | ) | | $ | 17 |
| |
|
| | | | | | | | | | | | | | | | | |
Summary of Derivative Instruments That Receive Hedge Accounting Treatment (part 2)
Amount of Gain (Loss) Reclassified from Accumulated Other Comprehensive Income to Interest Expense(1) |
| | | Three Months Ended
June 30 | | Nine Months Ended
June 30 | |
| Derivatives in Cash Flow Hedging Relationship | | 2019 | | 2018 | | 2019 | | 2018 | |
| Currency swaps | | $ | (13 | ) | | $ | (43 | ) | | $ | (17 | ) | | $ | (13 | ) | |
| | | | | | | | | | | | | | | | | | | | | | | | | | | | | |
Summary of Derivative Instruments That Receive Hedge Accounting Treatment (part 2)(1)
Amount of Gain (Loss) Reclassified from Accumulated Other Comprehensive Income (Loss) to Interest Expense
(in millions) | | | | | | | | | |
| | Three Months Ended
June 30 | | | | Nine Months Ended
June 30 | | | |
| Derivatives in Cash Flow Hedging Relationship | | 2020 | | 2019 | | 2020 | | 2019 | |
| Currency swaps | | $ | 7 | | | $ | (13) | | | $ | 10 | | | $ | (17) | | |
Note
(1) There were no ineffective portions or amounts excluded from effectiveness testing for any of the periods presented. Based on forecasted foreign currency exchange rates, TVA expects to reclassify approximately $36$30 million of gains from AOCI to interestInterest expense within the next 12 months to offset amounts anticipated to be recorded in interestInterest expense related to net exchange gain on the debt.
| | Summary of Derivative Instruments That Do Not Receive Hedge Accounting Treatment Amount of Gain (Loss) Recognized in Income on Derivatives(1) | Summary of Derivative Instruments That Do Not Receive Hedge Accounting Treatment Amount of Gain (Loss) Recognized in Income on Derivatives(1) | Summary of Derivative Instruments That Do Not Receive Hedge Accounting Treatment Amount of Gain (Loss) Recognized in Income on Derivatives(1) | |
|
| | Three Months Ended
June 30 | | Nine Months Ended
June 30 | | | Three Months Ended June 30 | | | Nine Months Ended June 30 | | |
| Derivative Type | | Objective of Derivative | | Accounting for Derivative Instrument | | 2019 | | 2018 | | 2019 | | 2018 | | Derivative Type | | Objective of Derivative | | Accounting for Derivative Instrument | | 2020 | | 2019 | | 2020 | | 2019 | |
| Interest rate swaps | | To fix short-term debt variable rate to a fixed rate (interest rate risk) | | Mark-to-market gains and losses are recorded as regulatory assets or liabilities
Realized gains and losses are recognized in interest expense when incurred during the settlement period | | $ | (19 | ) | | $ | (21 | ) | | $ | (59 | ) | | $ | (68 | ) | | Interest rate swaps | | To fix short-term debt variable rate to a fixed rate (interest rate risk) | | Mark-to-market gains and losses are recorded as regulatory assets or liabilities
Realized gains and losses are recognized in Interest expense when incurred during the settlement period and are presented in operating cash flow | | $ | (25) | | | $ | (19) | | | $ | (69) | | | $ | (59) | | |
| | | | | | | | | | | | |
Commodity derivatives under FTP | | To protect against fluctuations in market prices of purchased commodities (price risk) | | Mark-to-market gains and losses are recorded as regulatory assets or liabilities
Realized gains and losses are recognized in fuel expense or purchased power expense when the related commodity is used in production | | — |
| | — |
| | — |
| | (8 | ) | | |
| Commodity contract derivatives | | Commodity contract derivatives | | To protect against fluctuations in market prices of purchased coal or natural gas (price risk) | | Mark-to-market gains and losses are recorded as regulatory assets or liabilities
Realized gains and losses due to contract settlements are recognized in Fuel expense as incurred | | (2) | | | — | | | (1) | | | — | | |
|
Note
(1) All of TVA's derivative instruments that do not receive hedge accounting treatment have unrealized gains (losses) that would otherwise be recognized in income but instead are deferred as regulatory assets and liabilities. As such, there was nowere 0 related gain (loss)gains (losses) recognized in income for these unrealized gains (losses) for the three and nine months ended June 30, 20192020 and 2018.2019.
| | | | | | | | | | | | | | | | | | | | | | | |
Fair Values of TVA Derivatives (in millions) | | | | | | | |
| | At June 30, 2020 | | | | At September 30, 2019 | | |
| Derivatives That Receive Hedge Accounting Treatment: | | | | | | | |
| Balance | | Balance Sheet Presentation | | Balance | | Balance Sheet Presentation |
| Currency swaps | | | | | | | |
| £200 million Sterling | $ | (90) | | | Accounts payable and accrued liabilities $(89); Other long-term liabilities $(1) | | $ | (90) | | | Accounts payable and
accrued liabilities $(6); Other long-term liabilities $(84) |
| £250 million Sterling | (85) | | | Accounts payable and accrued liabilities $(6); Other long-term liabilities $(79) | | (61) | | | Accounts payable and accrued liabilities $(5); Other long-term liabilities $(56) |
| £150 million Sterling | (89) | | | Accounts payable and accrued liabilities $(3); Other long-term liabilities $(86) | | (57) | | | Accounts payable and
accrued liabilities $(4); Other long-term liabilities $(53) |
| | | | | | | |
| Derivatives That Do Not Receive Hedge Accounting Treatment: | | | | | | | |
| Balance | | Balance Sheet Presentation | | Balance | | Balance Sheet Presentation |
| Interest rate swaps | | | | | | | |
| $1.0 billion notional | $ | (1,492) | | | Accounts payable and
accrued liabilities $(77);
Other long-term liabilities
$(1,415) | | $ | (1,261) | | | Accounts payable and
accrued liabilities $(62); Other long-term liabilities $(1,199) |
| $476 million notional | (611) | | | Accounts payable and
accrued liabilities $(32);
Other long-term liabilities
$(579) | | (498) | | | Accounts payable and
accrued liabilities $(24);
Other long-term liabilities
$(474) |
| $42 million notional | (5) | | | Accounts payable and
accrued liabilities $(2); Other long-term liabilities $(3) | | (5) | | | Accounts payable and
accrued liabilities $(2); Other long-term liabilities $(3) |
| Commodity contract derivatives | (30) | | | Other current assets $5; Other long-term assets $5; Accounts payable and accrued liabilities $(38); Other long-term liabilities $(2) | | (41) | | | Other current assets $12; Accounts payable and accrued liabilities $(37); Other long-term liabilities $(16) |
|
| | | | | | | | | | | |
| Fair Values of TVA Derivatives |
| | At June 30, 2019 | | At September 30, 2018 |
| Derivatives That Receive Hedge Accounting Treatment: |
| | Balance | | Balance Sheet Presentation | | Balance | | Balance Sheet Presentation |
| Currency swaps | | | | | | | |
| £200 million Sterling | $ | (80 | ) | | Accounts payable and accrued liabilities $(5); Other long-term liabilities $(75) | | $ | (67 | ) | | Accounts payable and
accrued liabilities $(5); Other long-term liabilities $(62) |
| £250 million Sterling | (44 | ) | | Accounts payable and accrued liabilities $(5); Other long-term liabilities $(39) | | (12 | ) | | Accounts payable and accrued liabilities $(5); Other long-term liabilities $(7) |
| £150 million Sterling | (46 | ) | | Accounts payable and accrued liabilities $(3); Other long-term liabilities $(43) | | (15 | ) | | Accounts payable and
accrued liabilities $(3); Other long-term liabilities $(12) |
| | | | | | | | |
| Derivatives That Do Not Receive Hedge Accounting Treatment: |
| | Balance | | Balance Sheet Presentation | | Balance | | Balance Sheet Presentation |
| Interest rate swaps | | | | | | | �� |
| $1.0 billion notional | $ | (1,107 | ) | | Accounts payable and
accrued liabilities $(60);
Other long-term liabilities
$(1,047) | | $ | (878 | ) | | Accounts payable and
accrued liabilities $(56); Other long-term liabilities $(822) |
| $476 million notional | (425 | ) | | Accounts payable and
accrued liabilities $(22);
Other long-term liabilities
$(403) | | (317 | ) | | Accounts payable and
accrued liabilities $(20);
Other long-term liabilities
$(297) |
| $42 million notional | (6 | ) | | Accounts payable and
accrued liabilities $(2); Other long-term liabilities $(4) | | (4 | ) | | Accounts payable and
accrued liabilities $(1); Other long-term liabilities $(3) |
| Commodity contract derivatives | (22 | ) | | Other current assets $14; Other long-term assets $6; Other long-term liabilities $(9); Accounts payable and accrued liabilities $(33) | | 60 |
| | Other current assets $41; Other long-term assets $31; Other long-term liabilities $(8); Accounts payable and accrued liabilities $(4) |
Cash Flow Hedging Strategy for Currency Swaps
To protect against exchange rate risk related to three3 British pound sterling denominated Bond transactions, TVA entered into foreign currency hedges at the time the Bond transactions occurred. TVA had three3 currency swaps outstanding as ofat June 30, 2019,2020, with total currency exposure of £600£600 million and expiration dates ranging fromfrom 2021 to 2043.
When the dollar strengthens against the British pound sterling, the exchange gain on the Bond liability and related accrued interest is offset by an equal amount of loss on the swap contract that is reclassified out of AOCI. Conversely, the exchange loss on the Bond liability and related accrued interest is offset by an equal amount of gain on the swap contract that is reclassified out of AOCI. All such exchange gains or losses on the Bond liability and related accrued interest are included in Long-term debt, net and Accounts payable and accrued liabilities, respectively. The offsetting exchange losses or gains on the swap contracts are recognized in AOCI. If any gain (loss) were to be incurred as a result of the early termination of the foreign currency swap contract, the resulting income (expense) would be amortized over the remaining life of the associated Bond as a component of Interest expense. The values of the currency swap liabilities are included in Accounts payable and accrued liabilities and Other long-term liabilities on the Consolidated Balance Sheets.
Derivatives Not Receiving Hedge Accounting Treatment
Interest Rate Derivatives. Generally TVA uses interest rate swaps to fix variable short-term debt to a fixed rate, and TVA uses regulatory accounting treatment to defer the mark-to-market ("MtM") gains and losses on its interest rate swaps. The net deferred unrealized gains and losses are classified as regulatory assets or liabilities on TVA's Consolidated Balance Sheets and are included in the ratemaking formula when gains or losses are realized. The values of these derivatives are included in Accounts payable and accrued liabilities and Other long-term liabilities on the Consolidated Balance Sheets, and realized gains and losses, if any, are included inon TVA's Consolidated Statements of Operations. For the three months ended June 30, 2020 and 2019, the changes in fair market value of the interest rate swaps resulted in the deferral of unrealized gains of $15 million and 2018,unrealized losses of $159 million, respectively. For the nine months ended June 30, 2020 and 2019, the changes in fair market value of the interest rate swaps resulted in the deferral of unrealized losses of $159$370 million and unrealized gains of $56$369 million, respectively. For the nine months ended June 30, 2019 and 2018, the changes in fair market value of the interest rate swaps resulted in the deferral of unrealized losses of $369 million and unrealized gains of $227 million, respectively.
Commodity Derivatives. TVA enters into certain derivative contracts for coal and natural gas that require physical delivery of the contracted quantity of the commodity. TVA marks to market all such contracts and defers the fair market values as regulatory assets or liabilities on a gross basis. At June 30, 2019,2020, TVA's coal and natural gas contract derivatives both had terms of up to three years.2 and 4 years, respectively.
| | | | | | | | | | | | | | | | | | | | | | | | | | | | | | | | | | | |
Commodity Contract Derivatives | | | | | | | | | | | |
| | At June 30, 2020 | | | | | | At September 30, 2019 | | | | |
| | Number of Contracts | | Notional Amount | | Fair Value (MtM) | | Number of Contracts | | Notional Amount | | Fair Value (MtM) |
| Coal contract derivatives | 6 | | 8 million tons | | $ | (10) | | | 8 | | 9 million tons | | $ | (4) | |
| Natural gas contract derivatives | 44 | | 355 million mmBtu | | (20) | | | 65 | | 330 million mmBtu | | (37) | |
|
| | | | | | | | | | | | | | | |
Commodity Contract Derivatives |
| | At June 30, 2019 | | At September 30, 2018 |
| | Number of Contracts | | Notional Amount | | Fair Value (MtM) | | Number of Contracts | | Notional Amount | | Fair Value (MtM) |
| Coal contract derivatives | 8 | | 12 million tons | | $ | 19 |
| | 13 | | 20 million tons | | $ | 58 |
|
| Natural gas contract derivatives | 48 | | 359 million mmBtu | | $ | (41 | ) | | 61 | | 359 million mmBtu | | $ | 2 |
|
Derivatives Under FTP. TVA has suspended its FTP and no longer uses financial instruments to hedge risks related to commodity prices. Prior to the suspension of the FTP, TVA deferred all FTP unrealized gains (losses) as regulatory liabilities (assets) and recorded only realized gains or losses to match the delivery period of the underlying commodity. TVA did not experience any unrealized gains and losses related to the FTP at June 30, 2019 or September 30, 2018. TVA experienced the following realized losses related to the FTP during the periods set forth in the table below:
|
| | | | | | | | | | | | | | | | | |
| Financial Trading Program Realized Gains (Losses) |
| | | Three Months Ended
June 30 | | Nine Months Ended
June 30 | |
| | | 2019 | | 2018 | | 2019 | | 2018 | |
| Decrease (increase) in fuel expense | | | | | | | | | |
| Natural gas | | $ | — |
| | $ | — |
| | $ | — |
| | $ | (6 | ) | |
| Decrease (increase) in purchased power expense | | | | | | | | | |
| Natural gas | | — |
| | — |
| | — |
| | (2 | ) | |
Offsetting of Derivative Assets and Liabilities
The amounts of TVA's derivative instruments as reported inon the Consolidated Balance Sheets at June 30, 2019,2020, and September 30, 2018,2019, are shown in the table below:
|
| | | | | | | | | | | |
| Derivative Assets and Liabilities |
| | At June 30, 2019 |
| | Gross Amounts of Recognized Assets/Liabilities | | Gross Amounts Offset in the Balance Sheet(1) | | Net Amounts of Assets/Liabilities Presented in the Balance Sheet(2) |
| Assets | | | | | |
| Commodity derivatives not subject to master netting or similar arrangement | $ | 20 |
| | $ | — |
| | $ | 20 |
|
| | | | | | |
| Liabilities | | | | | |
Currency swaps(3) | $ | 170 |
| | $ | — |
| | $ | 170 |
|
Interest rate swaps(3) | 1,538 |
| | — |
| | 1,538 |
|
| Total derivatives subject to master netting or similar arrangement | 1,708 |
| | — |
| | 1,708 |
|
| Commodity derivatives not subject to master netting or similar arrangement | 42 |
| | — |
| | 42 |
|
| Total liabilities | $ | 1,750 |
| | $ | — |
| | $ | 1,750 |
|
| | | | | | |
| | At September 30, 2018 |
| | Gross Amounts of Recognized Assets/Liabilities | | Gross Amounts Offset in the Balance Sheet(1) | | Net Amounts of Assets/Liabilities Presented in the Balance Sheet(2) |
| Assets | | | | | |
| Commodity derivatives not subject to master netting or similar arrangement | $ | 72 |
| | $ | — |
| | $ | 72 |
|
| |
|
| |
|
| |
|
|
| Liabilities |
| |
| |
|
Currency swaps(3) | $ | 94 |
| | $ | — |
| | $ | 94 |
|
Interest rate swaps(3) | 1,199 |
| | — |
| | 1,199 |
|
| Total derivatives subject to master netting or similar arrangement | 1,293 |
| | — |
| | 1,293 |
|
| Commodity derivatives not subject to master netting or similar arrangement | 12 |
| | — |
| | 12 |
|
| Total liabilities | $ | 1,305 |
| | $ | — |
| | $ | 1,305 |
|
| | | | | | | | | | | | | | |
Derivative Assets and Liabilities(1)
(in millions) | | | | | | |
| At June 30, 2020 | | | | | At September 30, 2019 |
| Assets | | | | | | |
| | | | | | |
| Commodity derivatives not subject to master netting or similar arrangement | $ | 10 | | | | | | $ | 12 | |
| | | | | | |
| | | | | | |
| Liabilities | | | | | | |
Currency swaps(2) | $ | 264 | | | | | | $ | 208 | |
Interest rate swaps(2) | 2,108 | | | | | | 1,764 | |
| Total derivatives subject to master netting or similar arrangement | 2,372 | | | | | | 1,972 | |
| Commodity derivatives not subject to master netting or similar arrangement | 40 | | | | | | 53 | |
| Total liabilities | $ | 2,412 | | | | | | $ | 2,025 | |
| | | | | | |
| | | | | | |
| | | | | | |
| | | | | | |
| | | | | | |
| | | | | | |
| | | | | | |
| | | | | | |
| | | | | | |
| | | | | | |
| | | | | | |
| | | | | | |
| | | | | | |
| | | | | | |
| | | | | | |
| | | | | | |
| | | | | | |
Notes
(1) AmountsOffsetting amounts primarily include counterparty netting of derivative contracts, margin account deposits for futures commission merchants transactions, and cash collateral received or paid in accordance with the accounting guidance for derivatives and hedging transactions.
(2) There arewere no derivative contracts subject to a master netting arrangement or similar agreement that are not offset in theoffsetting amounts on TVA's Consolidated Balance Sheets.Sheets at either June 30, 2020, or September 30, 2019.
(3)(2) Letters of credit of approximately $1.1$1.5 billion and $921 million$1.3 billion were posted as collateral at June 30, 2019,2020, and September 30, 2018,2019, respectively, to partially secure the liability positions of one of the currency swaps and one of the interest rate swaps in accordance with the collateral requirements for these derivatives.
Other Derivative Instruments
Investment Fund Derivatives. Investment funds consist primarily of funds held in the Nuclear Decommissioning Trust ("NDT"), the Asset Retirement Trust ("ART"), the Supplemental Executive Retirement Plan ("SERP"), and the TVA Deferred Compensation Plan ("DCP"). See Note 15 — Fair Value Measurements — Investment Funds for a discussion of the trusts, plans, and types of investments. The NDT and ART may invest in derivative instruments which may include swaps, futures, options, forwards, and other instruments. At June 30, 2019,2020, and September 30, 2018,2019, the NDT held investments in forward contracts to purchase debt securities. The fair values of these derivatives were in net asset positions totaling $25$11 million and $45$22 million at June 30, 2019,2020, and September 30, 2018,2019, respectively.
Collateral. TVA's interest rate swaps and currency swaps contain contract provisions that require a party to post collateral (in a form such as cash or a letter of credit) when the party's liability balance under the agreement exceeds a certain threshold. At June 30, 2019,2020, the aggregate fair value of all derivative instruments with credit-risk related contingent features that were in a liability position was $1.7$2.4 billion. TVA's collateral obligations at June 30, 2019,2020, under these arrangements were approximately $1.1$1.5 billion, for which TVA had posted approximately $1.1$1.5 billion in letters of credit. These letters of credit reduce
the available balance under the related credit facilities. TVA's assessment of the risk of its nonperformance includes a reduction in its exposure under the contract as a result of this posted collateral.
For all of its derivative instruments with credit-risk related contingent features:
•If TVA remains a majority-owned U.S. government entity but Standard & Poor's Financial Services, LLC ("S&P") or Moody's Investors Service, Inc. ("Moody's") downgrades TVA's credit rating to AA or Aa2, respectively, TVA's collateral obligations would likely increase by $22 million, and
•If TVA ceases to be majority-owned by the U.S. government, TVA's credit rating would likely be downgraded and TVA would be required to post additional collateral.
Counterparty Risk
TVA may be exposed to certain risks when a counterparty has the potential to fail to meet its obligations in accordance with agreed terms. These risks may be related to credit, operational, or nonperformance matters. To mitigate certain counterparty risk, TVA analyzes the counterparty’scounterparty's financial condition prior to entering into an agreement, establishes credit limits, monitors the appropriateness of those limits, as well as any changes in the creditworthiness of the counterparty, on an ongoing basis, and when required, employs credit mitigation measures, such as collateral or prepayment arrangements and master purchase and sale agreements, to mitigate credit risk.agreements.
Customers. TVA is exposed to counterparty credit risk associated with trade accounts receivable from delivered power sales to LPCs, and from industries and federal agencies directly served, all located in the Tennessee Valley region. Of the $1.3
billion and $1.6 billion of receivables from power sales outstanding at June 30, 2020, and September 30, 2019, respectively, nearly all counterparties were rated investment grade. The obligations of customers that are not investment grade are secured by collateral. TVA is also exposed to risk from exchange power arrangements with a small number of investor-owned regional utilities related to either delivered power or the replacement of open positions of longer-term purchased power or fuel agreements. TVA believes its policies and procedures for counterparty performance risk reviews have generally protected TVA against significant exposure related to market and economic conditions. See Note 1— Summary of Significant Accounting Policies — Allowance for Uncollectible Accounts and Note 3.3 — Accounts Receivable, Net.
TVA had revenue from two LPCs that collectively accounted for 18 percent of total operating revenues for both the three months ended June 30, 2020 and 2019. TVA had revenue from two LPCs that collectively accounted for 17 percent and 16 percent of total operating revenues for the nine months ended June 30, 2020 and 2019, respectively.
Suppliers. TVA assesses potential supplier performance risks, including procurement of fuel, parts, and services. If suppliers are unable to perform under TVA's existing contracts or if TVA is unable to obtain similar services from other vendors, TVA could experience delays, disruptions, additional costs, or other operational outcomes that may impact generation,
maintenance, and capital programs. If one of TVA's fuel or purchased power suppliers fails to perform under the terms of its contract with TVA, TVA might lose the money that it paid to the supplier under the contract and have to purchase replacement fuel or power on the spot market, perhaps at a significantly higher price than TVA was entitled to pay under the contract. In addition, TVA might not be able to acquire replacement fuel or power in a timely manner and thus might be unable to satisfy its own obligations to deliver power. Nuclear fuel requirements, including uranium mining and milling, conversion services, enrichment services, and fabrication services, are met from various suppliers, depending on the type of service.
Natural Gas. TVA purchases the majority of its natural gas requirements from a variety of suppliers under short-term contracts. In the event of nonperformance by these suppliers, TVA believes that it can obtain replacement natural gas.
Coal. To help ensure a reliable supply of coal, TVA had coal contracts with multiple suppliers at June 30, 2019.2020. The contracted supply of coal is sourced from multiple geographic regions of the United StatesU.S. and is to be delivered via various transportation methods (e.g., barge, rail, and truck). Emerging technologies, environmental regulations, and low natural gas prices have contributed to weak demand for coal. As a result, coal suppliers are facing increased financial pressure, which has led to relatively poor credit ratings and bankruptcies. Continued difficulties by coal suppliers, including impacts from the COVID-19 pandemic, could result in consolidations, additional bankruptcies, restructuring, contract renegotiations, or other scenarios. Under these scenarios and TVA’s potential available responses, TVA does not anticipate a significant financial impact in obtaining continued fuel supply for its coal-fired generation.
Nuclear Fuel. Nuclear fuel is obtained predominantly through long-term uranium concentrate supply contracts, contracted conversion services, contracted enrichment services, or a combination thereof, and contracted fuel fabrication services. The supply markets for uranium concentrates and certain nuclear fuel services are subject to price fluctuations and availability restrictions. Supply market conditions may make procurement contracts subject to credit risk related to the potential nonperformance of counterparties. In the event of nonperformance by these or other suppliers, TVA believes that replacement uranium concentrate and nuclear fuel services can be obtained, although at prices that may be unfavorable when compared to the prices under the current supply agreements.
Purchased Power. TVA has a power purchase agreement that expires on March 31, 2032, with a supplier of electricity for 440 megawatts ("MW") of summer net capability from a lignite-fired generating plant. TVA has determined that the supplier has the equivalent of a non-investment grade credit rating; therefore, the supplier has provided credit assurance to TVA under the terms of the agreement.
Other Suppliers. At this time, TVA has experienced minimal impacts due to force majeure events, with the exception of a manufacturing delay for a major turbine component. TVA and the vendor have developed a mitigation strategy to reduce projected delays and impacts to TVA's outage schedule.
Derivative Counterparties. TVATVA has entered into physical and financial contracts that qualify as derivatives for hedging purposes, and TVA's NDT, fund, ART, fund, and qualified defined benefit pension plan have entered into derivative contracts for investment purposes. If a counterparty to one of the physical or financial derivative transactions defaults, TVA might incur substantial costs in connection with entering into a replacement transaction. If a counterparty to the derivative contracts into which the NDT, fund, the ART, fund, and the qualified pension plan have entered for investment purposes defaults, the value of the investment could decline significantly or perhaps become worthless. TVA has concentrations of credit risk from the banking, coal, and coalgas industries because multiple companies in these industries serve as counterparties to TVA in various derivative transactions. At June 30, 2019,2020, all of TVA's currency swaps and interest rate swaps as well as all of the derivatives in the NDT and the ART were with banking counterparties whose Moody's credit ratings were A3 or higher.
TVA classifies qualified forward coal and natural gas contracts as derivatives. See Derivatives Not Receiving Hedge Accounting Treatment above. At June 30, 2019,2020, the coal contracts were with counterparties whose Moody's credit rating, or TVA’sTVA's internal analysis when such information was unavailable, ranged from DB1 to Ba3.Ba1. At June 30, 2019,2020, the natural gas contracts were with counterparties whose ratings ranged from B1Caa2 to A1.A2. See Suppliers above for discussion of challenges facing the coal industry. TVA's total value for derivative contracts with coalTVA recognizes the oil and natural gas counterpartiesindustry has been impacted as the result of the COVID-19 pandemic and the slowdown in an asset position asdemand. TVA will continue to monitor the impacts and affected credit ratings and enforce contract performance assurance provisions when applicable.
15. Fair Value Measurements
Fair value is determined based on the exchange price that would be received for an asset or paid to transfer a liability (an exit price) in the asset or liability's principal market, or in the absence of a principal market, the most advantageous market for the asset or liability in an orderly transaction between market participants. TVA uses market or observable inputs as the preferred source of values, followed by assumptions based on hypothetical transactions in the absence of market inputs.
Valuation Techniques
The measurement of fair value results in classification into a hierarchy by the inputs used to determine the fair value as follows:
|
| | | | | | | | | | |
| Level 1 | —
| | Unadjusted quoted prices in active markets accessible by the reporting entity for identical assets or liabilities. Active markets are those in which transactions for the asset or liability occur with sufficient frequency and volume to provide pricing. |
Level 2
| —
| | Pricing inputs other than quoted market prices included in Level 1 that are based on observable market data and that are directly or indirectly observable for substantially the full term of the asset or liability. These include quoted market prices for similar assets or liabilities, quoted market prices for identical or similar assets in markets that are not active, adjusted quoted market prices, inputs from observable data such as interest rate and yield curves, volatilities and default rates observable at commonly quoted intervals, and inputs derived from observable market data by correlation or other means. |
| Level 3 | —
| | Pricing inputs that are unobservable, or less observable, from objective sources. Unobservable inputs are only to be used to the extent observable inputs are not available. These inputs maintain the concept of an exit price from the perspective of a market participant and should reflect assumptions of other market participants. An entity should consider all market participant assumptions that are available without unreasonable cost and effort. These are given the lowest priority and are generally used in internally developed methodologies to generate management's best estimate of the fair value when no observable market data is available. |
A financial instrument's level within the fair value hierarchy (where Level 1 is the highest and Level 3 is the lowest) is based on the lowest level of input significant to the fair value measurement.
The following sections describe the valuation methodologies TVA uses to measure different financial instruments at fair value. Except for gains and losses on SERP and DCP assets, all changes in fair value of these assets and liabilities have been recorded as changes in regulatory assets, regulatory liabilities, or AOCI on TVA's Consolidated Balance Sheets and Consolidated Statements of Comprehensive Income (Loss). Except for gains and losses on SERP and DCP assets, there has been no impact to the Consolidated Statements of Operations or the Consolidated Statements of Cash Flows related to these fair value measurements.
Investment Funds
At June 30, 2019,2020, Investment funds were composedcomprised of $2.9$3.0 billion of equity securities and debt securities classified as trading measured at fair value. Equity and trading debt securities are held in the NDT, ART, SERP, and DCP. The NDT holds funds for the ultimate decommissioning of TVA's nuclear power plants. The ART holds funds primarily for the costs related to the future closure and retirement of TVA's other long-lived assets. The balances in the NDT and ART were $2.1 billion and $717$777 million, respectively, at June 30, 2019.2020.
TVA established a SERP to provide benefits to selected employees of TVA which are comparable to those provided by competing organizations. The DCP is designed to provide participants with the ability to defer compensation until employment with TVA ends. The NDT, ART, SERP, and DCP funds are invested in portfolios of securities generally designed to achieve a return in line with overall equity and debt market performance.
The NDT, ART, SERP, and DCP are composed of multiple types of investments and are managed by external institutional investment managers. Most U.S. and international equities, U.S. Treasury inflation-protected securities, real estate investment trust securities, and cash securities and certain derivative instruments are measured based on quoted exchange prices in active markets and are classified as Level 1 valuations. Fixed-income investments, high-yield fixed-income investments, currencies, and most derivative instruments are non-exchange traded and are classified as Level 2 valuations. These measurements are based on market and income approaches with observable market inputs.
Private equity limited partnerships, private real estateasset investments, and private credit investments may include holdings of investments in private real estate, venture capital, buyout, mezzanine or subordinated debt, restructuring or distressed debt, and special situations through funds managed by third-party investment managers. These investments generally involve a three-to-four-year period where the investor contributes capital, followed by a period of distribution, typically over several years. The
investment period is generally, at a minimum, 10 years or longer. The NDT had unfunded commitments related to private equity limited partnerships of $185$216 million, unfunded commitments related to private real estateassets of $35$58 million, and unfunded commitments related to private credit of $4$20 million at June 30, 2019.2020. The ART had unfunded commitments related to private equity limited partnerships of $95$133 million, unfunded commitments related to private real estateassets of $16$50 million, and unfunded commitments related to private credit of $2$10 million at June 30, 2019.2020. These investments have no redemption or limited redemption options and may also impose restrictions on the NDT's and ART's ability to liquidate their investments. There are no0 readily available quoted exchange prices for these investments. The fair value of these investments is based on information provided by the investment managers. These investments are valued on a quarterly basis. TVA's private equity limited partnerships, private real estateasset investments, and private credit investments are valued at net asset values ("NAV") as a practical expedient for fair value. TVA classifies its interest in these types of investments as investments measured at net asset value in the fair value hierarchy.
Commingled funds represent investment funds comprising multiple individual financial instruments. The commingled funds held by the NDT, ART, SERP, and DCP consist of either a single class of securities, such as equity, debt, or foreign currency securities, or multiple classes of securities. All underlying positions in these commingled funds are either exchange traded or measured using observable inputs for similar instruments. The fair value of commingled funds is based on NAV per fund share (the unit of account), derived from the prices of the underlying securities in the funds. These commingled funds can be redeemed at the measurement date NAV and are classified as Commingled funds measured at net asset value in the fair value hierarchy.
Realized and unrealized gains and losses on equity and trading debt securities are recognized in current earnings and are based on average cost. The gains and losses of the NDT and ART are subsequently reclassified to a regulatory asset or liability account in accordance with TVA's regulatory accounting policy. See Note 1 — Summary of Significant Accounting Policies — Cost-Based Regulation and Note 8 — Regulatory Assets and Liabilities. TVA recorded unrealized gains and losses related to its equity and trading debt securities held during each period as follows:
| | | | | | | | | | | | | | | | | | | | | | | | | | | | | | | | | | | |
Unrealized Investment Gains (Losses) (in millions) | | | | | | | | | | | |
| | | | Three Months Ended
June 30 | | | | Nine Months Ended
June 30 | | | |
| Fund | | Financial Statement Presentation | | 2020 | | 2019 | | 2020 | | 2019 | |
| NDT | | Regulatory asset | | $ | 235 | | | $ | (37) | | | $ | (11) | | | $ | (84) | | |
| ART | | Regulatory asset | | 97 | | | (6) | | | (1) | | | (58) | | |
| SERP | | Other income (expense) | | 7 | | | 1 | | | (1) | | | — | | |
| DCP | | Other income (expense) | | 2 | | | 1 | | | — | | | (1) | | |
|
| | | | | | | | | | | | | | | | | | | |
| Unrealized Investment Gains (Losses) |
| | | | | Three Months Ended
June 30 | | Nine Months Ended
June 30 | |
| Fund | | Financial Statement Presentation | | 2019 | | 2018 | | 2019 | | 2018 | |
| SERP | | Other income (expense) | | $ | 1 |
| | $ | — |
| | $ | — |
| | $ | — |
| |
| DCP | | Other income (expense) | | 1 |
| | — |
| | (1 | ) | | — |
| |
| NDT | | Regulatory asset | | (37 | ) | | 9 |
| | (84 | ) | | (19 | ) | |
| ART | | Regulatory asset | | (6 | ) | | 1 |
| | (58 | ) | | 7 |
| |
Due to higher volatility in the financial markets associated with the COVID-19 pandemic, TVA has experienced fluctuations related to its ART and NDT investment portfolio during the nine months ended June 30, 2020. The losses experienced during the three months ended March 31, 2020, have been recovered. For the nine months ended June 30, 2020, the NDT has increased in value $17 million. Despite this volatility, TVA’s NDT funding as of June 30, 2020, continues to be fully funded per the Nuclear Regulatory Commission’s (“NRC”) funding requirements.
Currency and Interest Rate Derivatives
See Note 14 — Risk Management Activities and Derivative Transactions — Cash Flow Hedging Strategy for Currency Swaps and Derivatives Not Receiving Hedge Accounting Treatment for a discussion of the nature, purpose, and contingent features of TVA's currency swaps and interest rate swaps. These swaps are classified as Level 2 valuations and are valued based on income approaches using observable market inputs for similar instruments.
Commodity Contract Derivatives
Most of these contracts are valued based on market approaches which utilize short-short-term and mid-term market-quoted prices from an external industry brokerage service. A small number of these contracts are valued based on a pricing model using long-term price estimates from TVA's coal price forecast. To value the volume option component of applicable coal contracts, TVA uses a Black-Scholes pricing model which includes inputs from the forecast, contract-specific terms, and other market inputs. These contracts are classified as Level 3 valuations.
Nonperformance Risk
The assessment of nonperformance risk, which includes credit risk, considers changes in current market conditions, readily available information on nonperformance risk, letters of credit, collateral, other arrangements available, and the nature of master netting arrangements. TVA is a counterparty to currency swaps, interest rate swaps, commodity contracts, and other derivatives which subject TVA to nonperformance risk. Nonperformance risk on the majority of investments and certain exchange-traded instruments held by TVA is incorporated into the exit price that is derived from quoted market data that is used to mark the investment to market.
Nonperformance risk for most of TVA's derivative instruments is an adjustment to the initial asset/liability fair value. TVA adjusts for nonperformance risk, both of TVA (for liabilities) and the counterparty (for assets), by applying credit valuation adjustments ("CVAs"). TVA determines an appropriate CVA for each applicable financial instrument based on the term of the instrument and TVA's or the counterparty's credit rating as obtained from Moody's. For companies that do not have an observable credit rating, TVA uses internal analysis to assign a comparable rating to the counterparty. TVA discounts each financial instrument using the historical default rate (as reported by Moody's for CY 1983 to CY 2018)2019) for companies with a similar credit rating over a time period consistent with the remaining term of the contract. The application of CVAs resulted in a less than $1 million decrease in the fair value of assets and a $1 million decrease in the fair value of liabilities at June 30, 2019.2020.
Fair Value Measurements
The following tables set forth by level, within the fair value hierarchy, TVA's financial assets and liabilities that were measured at fair value on a recurring basis as of at June 30, 2019,2020, and September 30, 2018.2019. Financial assets and liabilities have been classified in their entirety based on the lowest level of input that is significant to the fair value measurement. TVA's assessment of the significance of a particular input to the fair value measurement requires judgment and may affect the determination of the fair value of the assets and liabilities and their classification in the fair value hierarchy levels.
|
| | | | | | | | | | | | | | | |
Fair Value Measurements
At June 30, 2019 |
| | Quoted Prices in Active
Markets for
Identical Assets
(Level 1) | | Significant Other
Observable Inputs
(Level 2) | | Significant
Unobservable
Inputs
(Level 3) | | Total |
| Assets | | | | | | | |
| Investments | | | | | | | |
| Equity securities | $ | 330 |
| | $ | — |
| | $ | — |
| | $ | 330 |
|
| Government debt securities | 235 |
| | 60 |
| | — |
| | 295 |
|
| Corporate debt securities | — |
| | 430 |
| | — |
| | 430 |
|
| Mortgage and asset-backed securities | — |
| | 35 |
| | — |
| | 35 |
|
| Institutional mutual funds | 245 |
| | — |
| | — |
| | 245 |
|
| Forward debt securities contracts | — |
| | 25 |
| | — |
| | 25 |
|
Private credit funds measured at net asset value(1) | — |
| | — |
| | — |
| | 30 |
|
Private equity funds measured at net asset value(1) | — |
| | — |
| | — |
| | 135 |
|
Private real estate funds measured at net asset value(1) | — |
| | — |
| | — |
| | 131 |
|
Commingled funds measured at net asset value(1) | — |
| | — |
| | — |
| | 1,243 |
|
| Total investments | 810 |
| | 550 |
| | — |
| | 2,899 |
|
| Commodity contract derivatives | — |
| | 1 |
| | 19 |
| | 20 |
|
| Total | $ | 810 |
| | $ | 551 |
| | $ | 19 |
| | $ | 2,919 |
|
| | | | | | | | |
| | Quoted Prices in Active Markets for Identical Liabilities (Level 1) | | Significant Other
Observable Inputs
(Level 2) | | Significant
Unobservable
Inputs
(Level 3) | | Total |
| Liabilities | | | | | | | |
Currency swaps(2) | $ | — |
| | $ | 170 |
| | $ | — |
| | $ | 170 |
|
| Interest rate swaps | — |
| | 1,538 |
| | — |
| | 1,538 |
|
| Commodity contract derivatives | — |
| | 42 |
| | — |
| | 42 |
|
| Total | $ | — |
| | $ | 1,750 |
| | $ | — |
| | $ | 1,750 |
|
| | | | | | | | | | | | | | | | | | | | | | | |
Fair Value Measurements
At June 30, 2020
(in millions) | | | | | | | |
| Quoted Prices in Active
Markets for
Identical Assets
(Level 1) | | Significant Other
Observable Inputs
(Level 2) | | Significant
Unobservable
Inputs
(Level 3) | | Total |
| Assets | | | | | | | |
| Investments | | | | | | | |
| Equity securities | $ | 470 | | | $ | — | | | $ | — | | | $ | 470 | |
| Government debt securities | 366 | | | 52 | | | — | | | 418 | |
| Corporate debt securities | — | | | 322 | | | — | | | 322 | |
| Mortgage and asset-backed securities | — | | | 28 | | | — | | | 28 | |
| Institutional mutual funds | 173 | | | — | | | — | | | 173 | |
| Forward debt securities contracts | — | | | 11 | | | — | | | 11 | |
Private credit funds measured at net asset value(1) | — | | | — | | | — | | | 57 | |
Private equity funds measured at net asset value(1) | — | | | — | | | — | | | 181 | |
Private real asset funds measured at net asset value(1) | — | | | — | | | — | | | 162 | |
Commingled funds measured at net asset value(1) | — | | | — | | | — | | | 1,169 | |
| Total investments | 1,009 | | | 413 | | | — | | | 2,991 | |
| | | | | | | |
| Commodity contract derivatives | — | | | 8 | | | 2 | | | 10 | |
| | | | | | | |
| | | | | | | |
| Total | $ | 1,009 | | | $ | 421 | | | $ | 2 | | | $ | 3,001 | |
| | | | | | | |
| Quoted Prices in Active Markets for Identical Liabilities
(Level 1) | | Significant Other
Observable Inputs
(Level 2) | | Significant
Unobservable
Inputs
(Level 3) | | Total |
| Liabilities | | | | | | | |
Currency swaps(2) | $ | — | | | $ | 264 | | | $ | — | | | $ | 264 | |
| Interest rate swaps | — | | | 2,108 | | | — | | | 2,108 | |
| Commodity contract derivatives | — | | | 28 | | | 12 | | | 40 | |
| Total | $ | — | | | $ | 2,400 | | | $ | 12 | | | $ | 2,412 | |
Notes
(1) Certain investments that are measured at fair value using the net asset value per share (or its equivalent) practical expedient have not been categorized in the fair value hierarchy. The fair value amounts presented in this table are intended to permit reconciliation of the fair value hierarchy to the amounts presented inon the Consolidated Balance Sheets.
(2) TVA records currency swaps net of cash collateral received from or paid to the counterparty, to the extent such amount is not recorded in Accounts payable and accrued liabilities. See Note 14 — Risk Management Activities and Derivative Transactions — Offsetting of Derivative Assets and Liabilities.
|
| | | | | | | | | | | | | | | |
Fair Value Measurements
At September 30, 2018 |
| Quoted Prices in Active
Markets for
Identical Assets
(Level 1) | | Significant Other
Observable Inputs
(Level 2) | | Significant
Unobservable
Inputs
(Level 3) | | Total |
| Assets |
| |
| |
| |
|
| Investments | | | | | | | |
| Equity securities | $ | 220 |
| | $ | — |
| | $ | — |
| | $ | 220 |
|
| Government debt securities | 199 |
| | 37 |
| | — |
| | 236 |
|
| Corporate debt securities | — |
| | 499 |
| | — |
| | 499 |
|
| Mortgage and asset-backed securities | — |
| | 50 |
| | — |
| | 50 |
|
| Institutional mutual funds | 126 |
| | — |
| | — |
| | 126 |
|
| Forward debt securities contracts | — |
| | 45 |
| | — |
| | 45 |
|
Private equity funds measured at net asset value(1) | — |
| | — |
| | — |
| | 132 |
|
Private real estate funds measured at net asset value(1) | — |
| | — |
| | — |
| | 124 |
|
Commingled funds measured at net asset value(1) | — |
| | — |
| | — |
| | 1,430 |
|
| Total investments | 545 |
| | 631 |
| | — |
| | 2,862 |
|
| Commodity contract derivatives | — |
| | 13 |
| | 59 |
| | 72 |
|
| Total | $ | 545 |
| | $ | 644 |
| | $ | 59 |
| | $ | 2,934 |
|
|
|
| |
|
| |
|
| |
|
|
| Quoted Prices in Active Markets for Identical Liabilities (Level 1) | | Significant Other
Observable Inputs
(Level 2) | | Significant
Unobservable
Inputs
(Level 3) | | Total |
| Liabilities |
| |
| |
| |
|
Currency swaps(2) | $ | — |
| | $ | 94 |
| | $ | — |
| | $ | 94 |
|
| Interest rate swaps | — |
| | 1,199 |
| | — |
| | 1,199 |
|
| Commodity contract derivatives | — |
| | 11 |
| | 1 |
| | 12 |
|
| Total | $ | — |
| | $ | 1,304 |
| | $ | 1 |
| | $ | 1,305 |
|
| | | | | | | | | | | | | | | | | | | | | | | |
Fair Value Measurements
At September 30, 2019
(in millions) | | | | | | | |
| Quoted Prices in Active
Markets for
Identical Assets
(Level 1) | | Significant Other
Observable Inputs
(Level 2) | | Significant
Unobservable
Inputs
(Level 3) | | Total |
| Assets | | | | | | | |
| Investments | | | | | | | |
| Equity securities | $ | 464 | | | $ | — | | | $ | — | | | $ | 464 | |
| Government debt securities | 279 | | | 65 | | | — | | | 344 | |
| Corporate debt securities | — | | | 417 | | | — | | | 417 | |
| Mortgage and asset-backed securities | — | | | 32 | | | — | | | 32 | |
| Institutional mutual funds | 250 | | | — | | | — | | | 250 | |
| Forward debt securities contracts | — | | | 22 | | | — | | | 22 | |
Private equity funds measured at net asset value(1) | — | | | — | | | — | | | 140 | |
Private real estate funds measured at net asset value(1) | — | | | — | | | — | | | 135 | |
Private credit funds measured at net asset value(1) | — | | | — | | | — | | | 33 | |
Commingled funds measured at net asset value(1) | — | | | — | | | — | | | 1,131 | |
| Total investments | 993 | | | 536 | | | — | | | 2,968 | |
| | | | | | | |
| Commodity contract derivatives | — | | | 7 | | | 5 | | | 12 | |
| | | | | | | |
| | | | | | | |
| Total | $ | 993 | | | $ | 543 | | | $ | 5 | | | $ | 2,980 | |
| | | | | | | |
| | | | | | | |
| Quoted Prices in Active Markets for Identical Liabilities
(Level 1) | | Significant Other
Observable Inputs
(Level 2) | | Significant
Unobservable
Inputs
(Level 3) | | Total |
| Liabilities | | | | | | | |
Currency swaps(2) | $ | — | | | $ | 208 | | | $ | — | | | $ | 208 | |
| Interest rate swaps | — | | | 1,764 | | | — | | | 1,764 | |
| Commodity contract derivatives | — | | | 44 | | | 9 | | | 53 | |
| | | | | | | |
| | | | | | | |
| Total | $ | — | | | $ | 2,016 | | | $ | 9 | | | $ | 2,025 | |
Notes
(1) Certain investments that are measured at fair value using the net asset value per share (or its equivalent) practical expedient have not been categorized in the fair value hierarchy. The fair value amounts presented in this table are intended to permit reconciliation of the fair value hierarchy to the amounts presented inon the Consolidated Balance Sheets.
(2) TVA records currency swaps net of cash collateral received from or paid to the counterparty, to the extent such amount is not recorded in Accounts payable and accrued liabilities. See Note 14 — Risk Management Activities and Derivative Transactions — Offsetting of Derivative Assets and Liabilities.
TVA uses internal valuation specialists for the calculation of its commodity contract derivatives fair value measurements classified as Level 3. Analytical testing is performed on the change in fair value measurements each period to ensure the valuation is reasonable based on changes in general market assumptions. Significant changes to the estimated data used for unobservable inputs, in isolation or combination, may result in significant variations to the fair value measurement reported.
The following table presents a reconciliation of all commodity contract derivatives measured at fair value on a recurring basis using significant unobservable inputs (Level 3):
| | | | | | | | | | | |
Fair Value Measurements Using Significant Unobservable Inputs
(in millions) | | | |
| Commodity Contract Derivatives | | |
| Three Months Ended
June 30 | | Nine Months Ended
June 30 |
| Balance at beginning of period | $ | 38 | | | $ | 58 | |
| | | |
| | | |
| | | |
| | | |
| Change in net unrealized gains (losses) deferred as regulatory assets and liabilities | (19) | | | (39) | |
| Balance at June 30, 2019 | $ | 19 | | | $ | 19 | |
| | | |
| Balance at beginning of period | $ | (7) | | | $ | (4) | |
| | | |
| | | |
| | | |
| Settlements | (1) | | | (1) | |
| Change in net unrealized gains (losses) deferred as regulatory assets and liabilities | (2) | | | (5) | |
| Balance at June 30, 2020 | $ | (10) | | | $ | (10) | |
|
| | | | | | | |
| Fair Value Measurements Using Significant Unobservable Inputs |
| | Commodity Contract Derivatives |
| | Three Months Ended
June 30 | | Nine Months Ended
June 30 |
| Balance at beginning of period | $ | (52 | ) | | $ | (67 | ) |
| Change in net unrealized gains (losses) deferred as regulatory assets and liabilities | 57 |
| | 72 |
|
| Balance at June 30, 2018 | $ | 5 |
| | $ | 5 |
|
| | | | |
| Balance at beginning of period | $ | 38 |
| | $ | 58 |
|
| Change in net unrealized gains (losses) deferred as regulatory assets and liabilities | (19 | ) | | (39 | ) |
| Balance at June 30, 2019 | $ | 19 |
| | $ | 19 |
|
The following table presents quantitative information related to the significant unobservable inputs used in the measurement of fair value of TVA's assets and liabilities classified as Level 3 in the fair value hierarchy:
| | | | | | | | | | | | | | | | | | | | | | | |
Quantitative Information about Level 3 Fair Value Measurements | | | | | | | |
| Fair Value at June 30, 2020 | | Valuation Technique(s) | | Unobservable Inputs | | Range(1) |
| Assets | | | | | | | |
| Commodity contract derivatives | $ | 2 | |
| Pricing model | | Coal supply and demand | | 0.5 - 0.6 billion tons/year |
| | | | | Long-term market prices | | $11.90 - $43.00/ton |
| Liabilities | | | | | | | |
| | | | | | | |
| Commodity contract derivatives | 12 | | | Pricing model | | Coal supply and demand | | 0.5 - 0.6 billion tons/year |
| | | | | Long-term market prices | | $11.90 - $43.00/ton |
|
| | | | | | | | | | |
Quantitative Information about Level 3 Fair Value Measurements |
| | Fair Value at June 30,
2019 | | Valuation Technique(s) | | Unobservable Inputs | | Range | |
| Assets | | | | | | | | |
| Commodity contract derivatives | $ | 19 |
| | Pricing model | | Coal supply and demand | | 0.6 - 0.8 billion tons/year | |
| | | | | | Long-term market prices | | $12.20 - $106.35/ton | |
| Liabilities | | | | | | | | |
| There were no commodity contract derivatives in liability positions at June 30, 2019. | |
| | | | | | | | | | | | | | | | | | | | | | | |
Quantitative Information about Level 3 Fair Value Measurements | | | | | | | |
| Fair Value at September 30, 2019 | | Valuation Technique(s) | | Unobservable Inputs | | Range |
| Assets | | | | | | | |
| Commodity contract derivatives | $ | 5 | | | Pricing model | | Coal supply and demand | | 0.4 - 0.8 billion tons/year |
| | | | | Long-term market prices | | $12.10 - $94.51/ton |
| Liabilities | | | | | | | |
| Commodity contract derivatives | 9 | | | Pricing model | | Coal supply and demand | | 0.4 - 0.8 billion tons/year |
| | | | | Long-term market prices | | $12.10 - $94.51/ton |
Note
(1) During the third quarter of 2020, TVA updated the range estimate to align with the maximum contract term of related commodity contract derivatives.
|
| | | | | | | | | | |
Quantitative Information about Level 3 Fair Value Measurements |
| | Fair Value at September 30, 2018 | | Valuation Technique(s) | | Unobservable Inputs | | Range | |
| Assets | | | | | | | | |
| Commodity contract derivatives | $ | 59 |
| | Pricing model | | Coal supply and demand | | 0.7 - 0.8 billion tons/year | |
| | | | | | Long-term market prices | | $12.25 - $112.24/ton | |
| Liabilities | | | | | | | | |
| Commodity contract derivatives | $ | 1 |
| | Pricing model | | Coal supply and demand | | 0.7 - 0.8 billion tons/year | |
| | | | | | Long-term market prices | | $12.25 - $112.24/ton | |
Other Financial Instruments Not Recorded at Fair Value
TVA uses the methods and assumptions described below to estimate the fair value of each significant class of financial instrument.instruments. The fair value of the financial instruments held at June 30, 2019,2020, and September 30, 2018,2019, may not be representative of the actual gains or losses that will be recorded when these instruments mature or are called or presented for early redemption. The estimated values of TVA's financial instruments not recorded at fair value at June 30, 2019,2020, and September 30, 2018,2019, were as follows:
| | | | | | | | | | | | | | | | | | | | | | | | | | | | | |
Estimated Values of Financial Instruments Not Recorded at Fair Value
(in millions) | | | | | | | | | |
| | | At June 30, 2020 | | | | At September 30, 2019 | | |
| Valuation Classification | | Carrying
Amount | | Fair
Value | | Carrying
Amount | | Fair
Value |
EnergyRight® receivables (including current portion) | Level 2 | | $ | 91 | | | $ | 90 | | | $ | 101 | | | $ | 100 | |
| | | | | | | | | |
| Loans and other long-term receivables, net (including current portion) | Level 2 | | 134 | | | 122 | | | 131 | | | 120 | |
| | | | | | | | | |
EnergyRight® financing obligations (including current portion) | Level 2 | | 101 | | | 112 | | | 113 | | | 126 | |
| | | | | | | | | |
| Unfunded loan commitments | Level 2 | | — | | | 7 | | | — | | | 10 | |
| | | | | | | | | |
| Membership interests of VIEs subject to mandatory redemption (including current portion) | Level 2 | | 27 | | | 38 | | | 28 | | | 37 | |
| | | | | | | | | |
| Long-term outstanding power bonds (including current maturities), net | Level 2 | | 19,849 | | | 26,749 | | | 20,124 | | | 26,059 | |
| | | | | | | | | |
| Long-term debt of VIEs (including current maturities), net | Level 2 | | 1,109 | | | 1,437 | | | 1,128 | | | 1,371 | |
| | | | | | | | | |
| Long-term notes payable (including current maturities) | Level 2 | | — | | | — | | | 23 | | | 23 | |
|
| | | | | | | | | | | | | | | | | |
| Estimated Values of Financial Instruments Not Recorded at Fair Value |
| | | | At June 30, 2019 | | At September 30, 2018 |
| | Valuation Classification | | Carrying
Amount | | Fair
Value | | Carrying
Amount | | Fair
Value |
EnergyRight® receivables (including current portion) | Level 2 | | $ | 103 |
| | $ | 102 |
| | $ | 112 |
| | $ | 112 |
|
| | | | | | | | | | |
| Loans and other long-term receivables, net (including current portion) | Level 2 | | $ | 125 |
| | $ | 111 |
| | $ | 138 |
| | $ | 123 |
|
| | | | | | | | | | |
EnergyRight® financing obligation (including current portion) | Level 2 | | $ | 115 |
| | $ | 129 |
| | $ | 127 |
| | $ | 143 |
|
| | | | | | | | | | |
| Unfunded loan commitments | Level 2 | | $ | — |
| | $ | 9 |
| | $ | — |
| | $ | 3 |
|
| | | | | | | | | | |
| Membership interest of variable interest entities subject to mandatory redemption (including current portion) | Level 2 | | $ | 29 |
| | $ | 37 |
| | $ | 30 |
| | $ | 37 |
|
| | | | | | | | | | |
| Long-term outstanding power bonds (including current maturities), net | Level 2 | | $ | 20,145 |
| | $ | 24,846 |
| | $ | 21,189 |
| | $ | 23,896 |
|
| | | | | | | | | | |
| Long-term debt of variable interest entities (including current maturities), net | Level 2 | | $ | 1,147 |
| | $ | 1,351 |
| | $ | 1,165 |
| | $ | 1,256 |
|
| | | | | | | | | | |
| Long-term notes payable (including current maturities) | Level 2 | | $ | 23 |
| | $ | 23 |
| | $ | 69 |
| | $ | 68 |
|
The carrying value of Cash and cash equivalents, Restricted cash and cash equivalents, and Short-term debt, net approximate their fair values.
The fair value for loans and other long-term receivables is estimated by determining the present value of future cash flows using a discount rate equal to lending rates for similar loans made to borrowers with similar credit ratings and for similar remaining maturities, where applicable. The fair value of long-term debt and membership interests of VIEVIEs subject to mandatory redemption is estimated by determining the present value of future cash flows using current market rates for similar obligations, giving effect to credit ratings and remaining maturities.
16. Revenue
As described in Note 2, TVA adopted Revenue from Contracts with Customers effective October 1, 2018, using the modified retrospective method of adoption, which does not require restatement of prior year reported results. As a result of the adoption of this standard, no cumulative effect adjustment was recorded. Additionally, comparative disclosures for 2018 operating results with the previous revenue recognition rules are not applicable as TVA’s revenue recognition has not materially changed as a result of the new standard.
Revenue from Sales of Electricity
TVA’sTVA's revenue from contracts with customers is primarily derived from the generation and sale of electricity to its customers and is included in Revenue from sales of electricity on the Consolidated Statements of Operations. Electricity is sold primarily to LPCs for distribution to their end-use customers. In addition, TVA sells electricity to directly served industrial companies, federal agencies, and others.
|
| | | | |
| LPC sales | Approximately 9293 percent of TVA’sTVA's revenue from sales of electricity isfor the three and nine months ended June 30, 2020 was to LPCs, which then distribute the power to their customers using their own distribution systems. Power is delivered to each LPC at delivery points within the LPC's service territory. TVA recognizes revenue when the customer takes possession of the power at the delivery point. For power sales, the performance obligation to deliver power is satisfied in a series over time because the sales of electricity over the term of the customer contract are a series of distinct goods that are substantially the same and have the same pattern of transfer to the customer. TVA has no continuing performance obligations subsequent to delivery. Using the output method for revenue recognition provides a faithful depiction of the transfer of electricity as customers obtain control of the power and benefit from its use at delivery. Additionally, TVA has an enforceable right to consideration for energy delivered at any discrete point in time and will recognize revenue at an amount that reflects the consideration to which TVA is entitled for the energy delivered.
The amount of revenue is based on contractual prices approved by the TVA Board. Customers are invoiced monthly for power delivered as measured by meters located at the delivery points. The net transaction price is offset by certain credits available to customers that are known at the time of billing. Credits are designed to achieve objectives of the TVA Act and include items such as hydro preference credits for residential customers of LPCs, economic development credits to promote growth in the Tennessee Valley, wholesale bill credits to LPCs participating in the long-term Partnership Agreement, and interruptible credits allowing TVA to reduce industrial customer usage in periods of peak demand to balance system demand. Payments are typically due within approximately one month of invoice issuance. |
| |
| Directly served customers | Directly served customers, including industrial customers, federal agencies, and other customers, take power for their own consumption. Similar to LPCs, power is delivered to a delivery point, at which time the customer takes possession and TVA recognizes revenue. For all power sales, the performance obligation to deliver power is satisfied in a series over time since the sales of electricity over the term of the customer contract are a series of distinct goods that are substantially the same and have the same pattern of transfer to the customer. TVA has no continuing performance obligations subsequent to delivery. Using the output method for revenue recognition provides a faithful depiction of the transfer of electricity as customers obtain control of the power and benefit from its use at delivery. Additionally, TVA has an enforceable right to consideration for energy delivered at any discrete point in time and will recognize revenue at an amount that reflects the consideration to which TVA is entitled for the energy delivered.
The amount of revenue is based on contractual prices approved by the TVA Board. Customers are invoiced monthly for power delivered as measured by meters located at the delivery points. The net transaction price is offset by certain credits available to customers that are known at the time of billing. Examples of credits include items such as economic development credits to promote growth in the Tennessee Valley and interruptible credits allowing TVA to reduce industrial customer usage in periods of peak demand to balance system demand. Payments are typically due within approximately one month of invoice issuance.
|
Other Revenue
Other revenue consists primarily of wheeling and network transmission charges, sales of excess steam that is a by-product of power production, delivery point charges for interconnection points between TVA and the customer, and certain other ancillary goods or services.
Disaggregated RevenueRevenues
During the three and nine months ended June 30, 2019,2020, revenues generated from TVA’sTVA's electricity sales were $2.6$2.2 billion and $8.0$7.2 billion, respectively, and accounted for virtually all of TVA’sTVA's revenues. TVA’sTVA's operating revenues by state for the three and nine months endedJune 30, 20192020 and 20182019, are detailed in the table below:
| | | | | | | | | | | | | | | | | | | | | | | |
Operating Revenues By State (in millions) | | | | | | | |
| Three Months Ended June 30 | | | | Nine Months Ended June 30 | | |
| | 2020 | | 2019 | | 2020 | | 2019 |
| Alabama | $ | 312 | | | $ | 367 | | | $ | 1,041 | | | $ | 1,146 | |
| Georgia | 52 | | | 59 | | | 179 | | | 196 | |
| Kentucky | 140 | | | 157 | | | 455 | | | 498 | |
| Mississippi | 204 | | | 250 | | | 668 | | | 751 | |
| North Carolina | 13 | | | 15 | | | 50 | | | 56 | |
| Tennessee | 1,485 | | | 1,705 | | | 4,809 | | | 5,273 | |
| Virginia | 9 | | | 10 | | | 32 | | | 35 | |
| Subtotal | 2,215 | | | 2,563 | | | 7,234 | | | 7,955 | |
| Off-system sales | 1 | | | 2 | | | 3 | | | 3 | |
| Revenue from sales of electricity | 2,216 | | | 2,565 | | | 7,237 | | | 7,958 | |
| Other revenue | 35 | | | 39 | | | 113 | | | 121 | |
| Total operating revenues | $ | 2,251 | | | $ | 2,604 | | | $ | 7,350 | | | $ | 8,079 | |
|
| | | | | | | | | | | | | | | |
Operating Revenues By State (in millions) |
| | Three Months Ended
June 30 | | Nine Months Ended
June 30 |
| | 2019 | | 2018 | | 2019 | | 2018 |
| Alabama | $ | 367 |
| | $ | 383 |
| | $ | 1,146 |
| | $ | 1,152 |
|
| Georgia | 59 |
| | 59 |
| | 196 |
| | 196 |
|
| Kentucky | 157 |
| | 171 |
| | 498 |
| | 504 |
|
| Mississippi | 250 |
| | 258 |
| | 751 |
| | 746 |
|
| North Carolina | 15 |
| | 14 |
| | 56 |
| | 49 |
|
| Tennessee | 1,705 |
| | 1,771 |
| | 5,273 |
| | 5,252 |
|
| Virginia | 10 |
| | 11 |
| | 35 |
| | 37 |
|
| Subtotal | 2,563 |
| | 2,667 |
| | 7,955 |
| | 7,936 |
|
| Off-system sales | 2 |
| | 2 |
| | 3 |
| | 6 |
|
Revenue capitalized during pre-commercial plant operations(1) | — |
| | — |
| | — |
| | (11 | ) |
| Revenue from sales of electricity | 2,565 |
| | 2,669 |
| | 7,958 |
| | 7,931 |
|
| Other revenues | 39 |
| | 38 |
| | 121 |
| | 117 |
|
| Total operating revenues | $ | 2,604 |
| | $ | 2,707 |
| | $ | 8,079 |
| | $ | 8,048 |
|
Note
(1) Represents revenue capitalized during pre-commercial operations of less than $1 million and $11 million for the three and nine months ended June 30, 2018, respectively. See Note 1 — Pre-Commercial Plant Operations.
TVA’sTVA's operating revenues by customer type for the three and nine months ended June 30, 20192020 and 20182019, are detailed in the table below:
| | Operating Revenues by Customer Type (in millions) | Operating Revenues by Customer Type (in millions) | Operating Revenues by Customer Type (in millions) | |
| | Three Months Ended
June 30 | | Nine Months Ended
June 30 | | Three Months Ended June 30 | | | Nine Months Ended June 30 | |
| | 2019 | | 2018 | | 2019 | | 2018 | | 2020 | | 2019 | | 2020 | | 2019 |
| Revenue from sales of electricity | | | | | | | | Revenue from sales of electricity | | | | | | | |
| Local power companies | $ | 2,366 |
| | $ | 2,464 |
| | $ | 7,347 |
| | $ | 7,344 |
| |
Local power companies(1) | | Local power companies(1) | $ | 2,058 | | | $ | 2,366 | | | $ | 6,716 | | | $ | 7,347 | |
| Industries directly served | 168 |
| | 172 |
| | 521 |
| | 506 |
| Industries directly served | 132 | | | 168 | | | 442 | | | 521 | |
| Federal agencies and other | 31 |
| | 33 |
| | 90 |
| | 92 |
| Federal agencies and other | 26 | | | 31 | | | 79 | | | 90 | |
Revenue capitalized during pre-commercial plant operations(1) | — |
| | — |
| | — |
| | (11 | ) | |
| Revenue from sales of electricity | 2,565 |
| | 2,669 |
| | 7,958 |
| | 7,931 |
| Revenue from sales of electricity | 2,216 | | | 2,565 | | | 7,237 | | | 7,958 | |
| Other revenues | 39 |
| | 38 |
| | 121 |
| | 117 |
| |
| Other revenue | | Other revenue | 35 | | | 39 | | | 113 | | | 121 | |
| Total operating revenues | $ | 2,604 |
| | $ | 2,707 |
| | $ | 8,079 |
| | $ | 8,048 |
| Total operating revenues | $ | 2,251 | | | $ | 2,604 | | | $ | 7,350 | | | $ | 8,079 | |
Note
(1) Represents revenue capitalized during pre-commercial operations of less than $1 million and $11 millionThe amount for the three and nine months ended June 30, 2018, respectively. See Note 1 — Pre-Commercial Plant Operations.2020, is net of $38 million and $108 million, respectively, of wholesale bill credits to LPCs participating in the long-term Partnership Agreement.
TVA and LPCs continue to work together to meet the changing needs of consumers around the Tennessee Valley. At its August 2019 meeting, the TVA Board approved a 20-year Partnership Agreement option that better aligns the length of LPC contracts with TVA's long-term commitments. These agreements are automatically extended each year after their initial effective date, contingent upon certain circumstances, including agreement on flexibility options and limited rate increases going forward. Participating LPCs will receive benefits including a 3.1 percent wholesale bill credit in exchange for their long-term commitment, which enables TVA to recover its long-term financial commitments over a commensurate period. In June 2020, TVA provided participating LPCs a flexibility option that allows them to locally generate up to approximately five percent of average total hourly energy sales over the prior five years in order to meet their individual customers' needs. As of August 3, 2020, 141 LPCs had signed the 20-year Partnership Agreement with TVA, and 42 LPCs had signed a Flexibility Agreement.
The number of LPCs with the contract arrangements described below, the revenues derived from such arrangements for the three and nine months endedJune 30, 2019,2020, and the percentage of TVA’sTVA's total operating revenues for the three and nine months ended June 30, 20192020 represented by these revenues, are summarized in the tables below:
|
| | | | | | | | | |
TVA Local Power Company Contracts
At June 30, 2019 |
Contract Arrangements(1) | Number of LPCs | | Sales to LPCs
in the Three Months Ended June 30, 2019
(in millions) | | Percentage of Total Operating Revenues in the Three Months Ended June 30, 2019 |
| 20-year termination notice | 3 |
| | $ | 28 |
| | 1.1 | % |
| 15-year termination notice | 11 |
| | 112 |
| | 4.3 | % |
| 12-year termination notice | 1 |
| | 6 |
| | 0.2 | % |
| 10-year termination notice | 52 |
| | 822 |
| | 31.6 | % |
| 6-year termination notice | 1 |
| | 11 |
| | 0.4 | % |
| 5-year termination notice | 86 |
| | 1,387 |
| | 53.3 | % |
| Total | 154 |
| | $ | 2,366 |
| | 90.9 | % |
| | | | | | | | | | | | | | | | | | | | |
TVA Local Power Company Contracts
At and for the Three Months Ended June 30, 2020 | | | | | | |
Contract Arrangements(1) | | Number of LPCs | | Revenue from Sales of Electricity to LPCs
(in millions) | | Percentage of Total Operating Revenues |
| 20-year termination notice | | 141 | | | $ | 1,630 | | | 72.4 | % |
| | | | | | |
| | | | | | |
| 10-year termination notice | | 1 | | | 1 | | | — | % |
| | | | | | |
| 5-year termination notice | | 12 | | | 427 | | | 19.0 | % |
| Total | | 154 | | | $ | 2,058 | | | 91.4 | % |
Note
(1) Ordinarily, the LPCs and TVA have the same termination notice period; however, in contracts with fivetwo of the LPCs with five-year termination notices, TVA has a 10-year termination notice (which becomes a five-year termination notice if TVA loses its discretionary wholesale rate-setting authority). Two of theCertain LPCs have five-year termination notices or a shorter period if any act of Congress, court decision, or regulatory change requires or permits that election.
|
| | | | | | | | | |
TVA Local Power Company Contracts
At June 30, 2019 |
Contract Arrangements(1) | Number of LPCs | | Sales to LPCs
in the Nine Months Ended June 30, 2019
(in millions) | | Percentage of Total Operating Revenues in the
Nine Months Ended June 30, 2019 |
| 20-year termination notice | 3 |
| | $ | 96 |
| | 1.2 | % |
| 15-year termination notice | 11 |
| | 362 |
| | 4.5 | % |
| 12-year termination notice | 1 |
| | 19 |
| | 0.2 | % |
| 10-year termination notice | 52 |
| | 2,536 |
| | 31.4 | % |
| 6-year termination notice | 1 |
| | 36 |
| | 0.4 | % |
| 5-year termination notice | 86 |
| | 4,298 |
| | 53.2 | % |
| Total | 154 |
| | $ | 7,347 |
| | 90.9 | % |
| | | | | | | | | | | | | | | | | | | | |
TVA Local Power Company Contracts
At and for the Nine Months Ended June 30, 2020 | | | | | | |
Contract Arrangements(1) | | Number of LPCs | | Revenue from Sales of Electricity to LPCs
(in millions) | | Percentage of Total Operating Revenues |
| 20-year termination notice | | 141 | | | $ | 5,399 | | | 73.5 | % |
| | | | | | |
| | | | | | |
| 10-year termination notice | | 1 | | | 1 | | | — | % |
| | | | | | |
| 5-year termination notice | | 12 | | | 1,316 | | | 17.9 | % |
| Total | | 154 | | | $ | 6,716 | | | 91.4 | % |
Note
(1) Ordinarily, the LPCs and TVA have the same termination notice period; however, in contracts with fivetwo of the LPCs with five-year termination notices, TVA has a 10-year termination notice (which becomes a five-year termination notice if TVA loses its discretionary wholesale rate-setting authority). Two of theCertain LPCs have five-year termination notices or a shorter period if any act of Congress, court decision, or regulatory change requires or permits that election.
TVA’s
TVA's two largest LPCs — Memphis Light, Gas and Water Division ("MLGW") and Nashville Electric Service ("NES") — have contracts with a five-year and a 10-year20-year termination notice period, respectively. Sales to MLGW and NES accounted for 9 percent and 8 percent, respectively, of TVA's total operating revenues during the nine months ended June 30, 2020. Sales to MLGW and NES each accounted for 8 percent of TVA’sTVA's total operating revenues during the nine months ended June 30, 2019. In May 2020, MLGW published a draft Integrated Resource Plan to guide energy choices in the future, and in July 2020, TVA made a proposal to MLGW that highlights the benefits of remaining a TVA customer.
Contract Balances
Contract assets represent an entity’sentity's right to consideration in exchange for goods and services that the entity has transferred to customers. TVA does not have any material contract assets as ofat June 30, 2019.2020.
Contract liabilities represent an entity’sentity's obligations to transfer goods or services to customers for which the entity has received consideration (or an amount of consideration is due) from the customers. These contract liabilities are primarily related to upfront consideration received prior to the satisfaction of the performance obligation.
Energy Prepayment Obligations. In 2004, TVA and its largest customer, Memphis Light, Gas and Water Division ("MLGW"), entered into an energy prepayment agreement under which MLGW prepaid TVA $1.5 billion for the future costs of electricity to be delivered by TVA to MLGW over a period of 15 years. TVA accounted for the prepayment as unearned revenue and reported the obligation to deliver power under this arrangement as Energy prepayment obligations and Current portion of energy prepayment obligations on the September 30, 2018, Consolidated Balance Sheets. TVA recognized approximately $100 million of noncash revenue in each year of the arrangement as electricity was delivered to MLGW based on the ratio of units of kilowatt hours delivered to total units of kilowatt hours under contract. Atdoes not have any material contract liabilities at June 30, 2019, $1.5 billion had been recognized as2020.
noncash revenue on a cumulative basis during the life of the agreement, $25 million of which was recognized as noncash revenue and a corresponding reduction in the balance of Energy prepayment obligations during the three months ended June 30, 2018. There was no recognized noncash revenue during the three months ended June 30, 2019. During the nine months ended June 30, 2019 and 2018, $10 million and $75 million, respectively, were recognized as noncash revenue and a corresponding reduction in the balance of Energy prepayment obligations. Discounts to account for the time value of money, which were recorded as a reduction to electricity sales, amounted to $12 million for the three months ended June 30, 2018. There were no discounts to account for the time value of money during the three months ended June 30, 2019. Discounts to account for the time value of money, which were recorded as a reduction to electricity sales, amounted to $4 million and $34 million for the nine months ended June 30, 2019 and 2018, respectively.
Economic Development Incentives. Under certain economic development programs, TVA offers incentives to existing and potential power customers in certain business sectors that make multi-year commitments to invest in the Tennessee Valley. TVA records those incentives as reductions of revenue. Incentives recorded as a reduction to revenue were $76$78 million and $70$76 million during the three months ended June 30, 2019,2020 and 2018,2019, respectively. Incentives recorded as a reduction to revenue were $231$238 million and $206$231 million during the nine months ended June 30, 2019,2020 and 2018,2019, respectively. Incentives that have been approved but have not been paid are recorded in Accounts payable and accrued liabilities and Other long-term liabilities inon the Consolidated Balance Sheets. At June 30, 20192020, and September 30, 2018,2019, the outstanding unpaid incentives were $154$169 million and $145$157 million, respectively. These incentives may be subject to clawback provisions if the customers fail to meet certain program requirements. In April 2020, TVA established flexibility provisions to support the continued operations and recovery of participating customers impacted by the COVID-19 pandemic.
17. Other Income (Expense), Net
Income and expenses not related to TVA's operating activities are summarized in the following table:
| | | | | | | | | | | | | | | | | | | | | | | |
Other Income (Expense), Net | | | | | | | |
| | Three Months Ended
June 30 | | | | Nine Months Ended
June 30 | | |
| | 2020 | | 2019 | | 2020 | | 2019 |
| Bellefonte deposit | $ | — | | | $ | — | | | $ | — | | | $ | 21 | |
| Interest income | 3 | | | 7 | | | 14 | | | 19 | |
| External services | 3 | | | 3 | | | 9 | | | 9 | |
| Gains (losses) on investments | 10 | | | 3 | | | 4 | | | 2 | |
| Miscellaneous | — | | | 1 | | | — | | | 1 | |
| Total Other income (expense), net | $ | 16 | | | $ | 14 | | | $ | 27 | | | $ | 52 | |
|
| | | | | | | | | | | | | | | | |
Other Income (Expense), Net |
| | Three Months Ended
June 30 | | Nine Months Ended
June 30 | |
| | 2019 | | 2018 | | 2019 | | 2018 | |
| Bellefonte deposit | $ | — |
| | $ | — |
| | $ | 21 |
| | $ | — |
| |
| Interest income | 7 |
| | 6 |
| | 19 |
| | 17 |
| |
| External services | 3 |
| | 2 |
| | 9 |
| | 10 |
| |
| Gains (losses) on investments | 3 |
| | 1 |
| | 2 |
| | 4 |
| |
| Miscellaneous | 1 |
| | 2 |
| | 1 |
| | 3 |
| |
| Total Other income (expense), net | $ | 14 |
| | $ | 11 |
| | $ | 52 |
| | $ | 34 |
| |
During the three months ended June 30, 2019,2020, Other income (expense), net increased $3$2 million primarilyas compared to the same period of the prior year, driven by $2an increase of $7 million ofin Gains on investments primarily related to unrealized gains on the SERP and DCP investments and anas a result of higher volatility in the financial markets associated with the COVID-19 pandemic. Partially offsetting this increase was a decrease of $1$4 million related to Interest income primarily as a result of lower interest income during the quarter. rates.
During the nine months ended June 30, 2019,2020, Other income (expense), net increased $18decreased $25 million, primarily driven by $21 million of other income in 2019 related to a deposit liability received by TVA as a down payment on the sale of Bellefonte.Bellefonte Nuclear Plant ("Bellefonte"). The purchaser, Nuclear Development, LLC, failed to fulfill the requirements of the sales contract with respect to obtaining NRC approval of the transfer of required nuclear licenses and payment of the remainder of the selling price before the November 30, 2018, closing date. Partially offsetting this increase was $2See Note 20 — Contingencies and Legal Proceedings — Legal Proceedings for a discussion of the lawsuit filed by Nuclear Development, LLC.
18. Supplemental Cash Flow Information
Construction in progress and Nuclear fuel expenditures included in Accounts payable and accrued liabilities at June 30, 2020 and 2019, were $339 million and $266 million, respectively, and are excluded from the Statements of unrealized losses onConsolidated Cash Flows for the SERPnine months ended June 30, 2020 and DCP investments.2019, as non-cash investing activities.
Excluded from the Statements of Consolidated Cash Flows at June 30, 2020 and 2019, as non-cash financing activities were lease obligations incurred related to lease equipment of $3 million and $6 million, respectively. 18.
19. Benefit Plans
TVA sponsors a qualified defined benefit plan ("pension plan") that covers most of its full-time employees hired before July 1, 2014, a qualified defined contribution plan ("401(k) plan") that covers most of its full-time employees, two2 unfunded post-retirement health care plans that provide for non-vested contributions toward the cost of eligible retirees' medical coverage, other post-employment benefits, such as workers' compensation, and the SERP. The pension plan and the 401(k) plan are administered by a separate legal entity, the TVA Retirement System ("TVARS"), which is governed by its own board of directors.
The components of net periodic benefit cost and other amounts recognized as changes in regulatory assets for the three and nine months endedJune 30, 20192020 and 2018,2019, were as follows:
| | | | | | | | | | | | | | | | | | | | | | | | | | | | | | | | | | | | | | | | | | | | | | | |
Components of TVA's Benefit Plans(1) | | | | | | | | | | | | | | | |
| | For the Three Months Ended June 30 | | | | | | | | For the Nine Months Ended June 30 | | | | | | |
| | Pension Benefits | | | | Other Post-Retirement Benefits | | | | Pension Benefits | | | | Other Post-Retirement Benefits | | |
| | 2020 | | 2019 | | 2020 | | 2019 | | 2020 | | 2019 | | 2020 | | 2019 |
| Service cost | $ | 14 | | | $ | 11 | | | $ | 4 | | | $ | 2 | | | $ | 41 | | | $ | 33 | | | $ | 12 | | | $ | 8 | |
| Interest cost | 104 | | | 125 | | | 4 | | | 5 | | | 312 | | | 374 | | | 12 | | | 14 | |
| Expected return on plan assets | (122) | | | (119) | | | — | | | — | | | (366) | | | (358) | | | — | | | — | |
| Amortization of prior service credit | (25) | | | (25) | | | (6) | | | (6) | | | (73) | | | (74) | | | (18) | | | (18) | |
| Recognized net actuarial loss | 109 | | | 84 | | | 2 | | | 1 | | | 327 | | | 252 | | | 7 | | | 3 | |
| Total net periodic benefit cost as actuarially determined | 80 | | | 76 | | | 4 | | | 2 | | | 241 | | | 227 | | | 13 | | | 7 | |
| Amount (capitalized) / expensed due to actions of regulator | (3) | | | — | | | — | | | — | | | (11) | | | 1 | | | — | | | — | |
| Total net periodic benefit cost | $ | 77 | | | $ | 76 | | | $ | 4 | | | $ | 2 | | | $ | 230 | | | $ | 228 | | | $ | 13 | | | $ | 7 | |
|
| | | | | | | | | | | | | | | | | | | | | | | | | | | | | | | | |
Components of TVA's Benefit Plans(1) |
| | For the Three Months Ended
June 30 | | For the Nine Months Ended
June 30 | |
| | Pension Benefits | | Other Post-Retirement Benefits | | Pension Benefits | | Other Post-Retirement Benefits | |
| | 2019 | | 2018 | | 2019 | | 2018 | | 2019 | | 2018 | | 2019 | | 2018 | |
| Service cost | $ | 11 |
| | $ | 13 |
| | $ | 2 |
| | $ | 4 |
| | $ | 33 |
| | $ | 40 |
| | $ | 8 |
| | $ | 11 |
| |
| Interest cost | 125 |
| | 118 |
| | 5 |
| | 5 |
| | 374 |
| | 355 |
| | 14 |
| | 14 |
| |
| Expected return on plan assets | (119 | ) | | (119 | ) | | — |
| | — |
| | (358 | ) | | (358 | ) | | — |
| | — |
| |
| Amortization of prior service credit | (25 | ) | | (25 | ) | | (6 | ) | | (5 | ) | | (74 | ) | | (74 | ) | | (18 | ) | | (16 | ) | |
| Recognized net actuarial loss | 84 |
| | 103 |
| | 1 |
| | 1 |
| | 252 |
| | 307 |
| | 3 |
| | 5 |
| |
| Total net periodic benefit cost as actuarially determined | 76 |
| | 90 |
| | 2 |
| | 5 |
| | 227 |
| | 270 |
| | 7 |
| | 14 |
| |
| Amount expensed (capitalized) due to actions of regulator | — |
| | (13 | ) | | — |
| | — |
| | 1 |
| | (40 | ) | | — |
| | — |
| |
| Total net periodic benefit cost | $ | 76 |
| | $ | 77 |
| | $ | 2 |
| | $ | 5 |
| | $ | 228 |
| | $ | 230 |
| | $ | 7 |
| | $ | 14 |
| |
Note
(1) The components of net benefit cost other than the service cost component are included in Other net periodic benefit cost inon the Consolidated Statements of Operations.
TVA's minimum required pension plan contribution for 20192020 is $300 million. TVA contributes $25 million per month to TVARS and as of June 30, 2019,2020, had contributed $225 million. The remaining $75 million will be contributed by September 30, 2019.2020. For the nine months ended June 30, 2019,2020, TVA also contributed $64$67 million to the 401(k) plan, and $28$19 million (net of $3$4 million in rebates) to the other post-retirement plans. TVA has contributed $7plans, and $5 million to the SERPSERP.
Financial markets have experienced higher volatility since September 30, 2019, due to the COVID-19 pandemic. The uncertainty as to the duration and severity of the COVID-19 pandemic has resulted in significantly lower market valuations for many investments. The impact of these events on TVA’s pension system is reflected in changes in the nine months endedasset portfolio values from $8.0 billion at September 30, 2019, to $6.8 billion at March 31, 2020, and rebounding to $7.8 billion at June 30, 2019.2020. TVA has not determined at this time whether additional contributions will be made to TVARS during 2020. Additionally, other post-retirement contributions related to the retiree health plans may be higher than previously assumed as a result of the COVID-19 pandemic increasing health care costs, but cannot be estimated at this time.
The ultimate impact of the COVID-19 pandemic on the pension plan and other post-retirement plans depends on factors beyond TVA’s knowledge or control, including the duration and severity of this outbreak, actions taken to contain its spread and mitigate its effects, and broader impacts of the COVID-19 pandemic on the country and region’s economy. Therefore, TVA cannot estimate the potential impact to the pension plan and other post-retirement plans at this time. 19.
20. Contingencies and Legal Proceedings
Contingencies
Nuclear Insurance. Section 170 of the Atomic Energy Act, commonly known as the Price-Anderson Act, provides a layered framework of financial protection to compensate for liability claims of members of the public for personal injury and property damages arising from a nuclear eventincident in the U.S. This financial protection consists of two layers of coverage:
•The primary level is private insurance underwritten by American Nuclear Insurers ("ANI") and provides public liability insurance coverage of $450 million for each operating reactor.nuclear power plant licensed to operate. If this amount is not sufficient to cover claims arising from an accident,a nuclear incident, the second level, Secondary Financial Protection, applies.
•Within the Secondary Financial Protection level, the ownerlicensee of each nuclear reactor has a contingent obligation to pay a retrospective premium, equal to its proportionate share of the loss in excess of the primary level, regardless of proximity to the incident of fault, up to a maximum of approximately $138 million per reactor per incident. With TVA’s sevenTVA's 7 reactors, the maximum total contingent obligation per incident is $963 million. This retrospective premium is payable at a maximum rate currently set at approximately $20 million per year per incident per reactor. Currently, 9897 reactors are participating in the Secondary Financial Protection program.
In the event that a nuclear power plant eventincident results in third-party damages,public liability claims, the primary level provided by ANI combined with the Secondary Financial Protection wouldshould provide up to approximately $14.0$13.8 billion in coverage.
Federal law requires that each NRC power reactor licensee obtain property insurance from private sources to cover the
cost of stabilizing or shutting downand decontaminating a reactor and its station site after an accident. TVA carries property, decommissioning liability, and decontamination
liability insurance from Nuclear Electric Insurance Limited ("NEIL"), totaling $5.1 billion. The limits for its licensed nuclear plants witheach site vary depending on the site and range from up to $2.1 billion to $2.8 billion available for a loss at any one site.TVA's three sites. Some of this insurance may require the payment of retrospective premiums up to a
maximum of approximately $139$145 million.
TVA purchases accidental outage (business interruption) insurance for TVA's nuclear sites from NEIL. In the event that an accident covered by this policy takes a nuclear unit offline or keeps a nuclear unit offline, NEIL will pay TVA, after a waiting period, an indemnity (a set dollar amount per week) up towith a maximum indemnity of $490 million per unit. This insurance policy may require the payment of retrospective premiums up to a maximum of approximately $46 million.
Workers' Compensation. The Federal Employees' Compensation Act ("FECA") governs liability to TVA employees for service-connected injuries. TVA purchases insurance that compensates TVA for certain FECA costs. In addition, TVA sponsors an Owner Controlled Insurance Program ("OCIP") that provides workers' compensation and liability insurance for a select group
of contractors performing maintenance, modifications, outage, and new construction activities at TVA facilities. The insurance and OCIP are subject$43 million, but only to the terms and conditionsextent the retrospective premium is deemed necessary by the NEIL Board of the relevant policies including deductibles and self-insured retentions. To the extent insurance would not provide either a partial or total recovery of the costs associated with a loss, TVA would haveDirectors to recover any such costs through other means, including through power rates.pay losses unable to be covered by NEIL's surplus.
Decommissioning Costs. TVA recognizes legal obligations associated with the future retirement of certain tangible long-lived assets related primarily to nuclear generating plants, coal-fired generating plants, hydroelectric generating plants/dams, transmission structures, and other property-related assets. See Note 11.11 — Asset Retirement Obligations.
Nuclear Decommissioning. Provision for decommissioning costs of nuclear generating units is based on options prescribed by the NRC procedures to dismantle and decontaminate the facilities to meet the NRC criteria for license termination. At June 30, 2019,2020, $3.2 billion, representing the discounted value of future estimated future decommissioning cost of $3.1 billioncosts, was included in AROs. The actual decommissioning costs may vary from the derived estimates because of, among other things, changes in current assumptions, such as the assumed dates of decommissioning, changes in regulatory requirements, changes in technology, and changes in the cost of labor, materials, and equipment. Utilities that own and operate nuclear plants are required to use different procedures in calculating nuclear decommissioning costs under GAAP than those that are used in calculating nuclear decommissioning costs when reporting to the NRC. The two2 sets of procedures produce different estimates for the costs of decommissioning primarily because of differences in the underlying assumptions. Decommissioning costs studies are updated for each of TVA's nuclear units at least every five years.
TVA maintains a NDT to provide funding for the ultimate decommissioning of its nuclear power plants. See Note 15 — Fair Value Measurements — Investment Funds. TVA monitors the value of its NDT and believes that, over the long term and before cessation of nuclear plant operations and commencement of decommissioning activities, adequate funds from investments and additional contributions, if necessary, will be available to support decommissioning. TVA's operating nuclear power units are licensed through various dates between 2033 - 2055,2033-2055, depending on the unit. It may be possible to extend the operating life of some of the units with approval from the NRC. See Note 8 — Regulatory Assets and Liabilities and Note 11 — Asset Retirement Obligations.
Non-Nuclear Decommissioning. The estimated future non-nuclear decommissioning ARO was $2.5$2.8 billion at June 30, 2019.2020. This decommissioning cost estimate involves estimating the amount and timing of future expenditures and making judgments concerning whether or not such costs are considered a legal obligation. Estimating the amount and timing of future expenditures includes, among other things, making projections of the timing and duration of the asset retirement process and how costs will escalate with inflation. The actual decommissioning costs may vary from the derived estimates because of changes in current assumptions, such as the assumed dates of decommissioning, changes in regulatory requirements, changes in selected closure methodology, changes in available technology, and changes in the cost of labor, materials, and equipment. TVA updates its underlying assumptions for non-nuclear decommissioning AROs at least every five years. However, material changes in underlying assumptions that impact the amount and timing of undiscounted cash flows are continuously monitored and incorporated into ARO balances in the period identified.
TVA maintains an ART to help fund the ultimate decommissioning of its non-nuclear power assets. See Note 15.15 — Fair Value Measurements — Investment Funds. Estimates involved in determining if additional funding will be made to the ART include inflation rate, rate of return projections on the fund investments, and the planned use of other sources to fund decommissioning costs. See Note 8 — Regulatory Assets and Liabilities and Note 11 — Asset Retirement Obligations.
Environmental Matters. TVA's power generation activities, like those across the utility industry and in other industrial sectors, are subject to federal, state, and local environmental laws and regulations. Major areas of regulation affecting TVA's activities include air quality control, water quality control, and management and disposal of solid and hazardous wastes. In the future, regulations in all of these areas are expected to become more stringent. Regulations are also expected to apply to new emissions and sources, withhave a particular emphasis on climate change, renewable generation, and energy efficiency.
TVA has incurred, and expects to continue to incur, substantial capital and operating and maintenance costs to comply with evolving environmental requirements primarily associated with, but not limited to, the operation of TVA's coal-fired generating units. Environmental requirements placed on the operation of TVA's coal-fired and other generating units will likely continue to become more restrictive over time. Litigation over emissions or discharges from coal-fired generating units is also occurring, including litigation against TVA.occurring. Failure to comply with environmental and safety laws can result in TVA being subject to enforcement actions, which can lead to the imposition of significant civil liability, including fines and penalties, criminal sanctions, and/or the shutting down of non-compliant facilities.
TVA estimates that compliance with existing and future Clean Air Act ("CAA") requirements (excluding greenhouse gas ("GHG") requirements) could lead to costs of approximately $189$132 million from 20192020 to 2029,2024, which include future clean air controls, existing controls capital projects and air operations and maintenance projects. TVA also estimates additional expenditures of $1.4approximately $1.0 billion from 20192020 to 20232024 relating to TVA's CCR conversion program, as well as expenditures of approximately $324$211 million from 20192020 to 20252024 relating to compliance with Clean Water Act requirements. Future costs could differ from these estimates if new environmental laws or regulations become applicable to TVA or the facilities it operates, or if existing environmental laws or regulations are revised or reinterpreted. There could also be costs that cannot reasonably be predicted at this time, due to uncertainty of actions, that could increase these estimates.
Liability for releases and cleanup of hazardous substances is primarily regulated by the federal Comprehensive Environmental Response, Compensation, and Liability Act, and other federal and parallel state statutes. In a manner similar to many other industries and power systems, TVA has generated or used hazardous substances over the years. TVA operations at some facilities have resulted in contamination that TVA is addressing. At both June 30, 2019,2020, and September 30, 2018,2019, TVA's
estimated liability for cleanup and similar environmental work for those sites for which sufficient information is available to develop a cost estimate was approximately $16$15 million and $12 million, respectively, on a non-discounted basis, and was included in Accounts payable and accrued liabilities and Other long-term liabilities on the Consolidated Balance Sheets.
Potential Liability Associated with Workers’Workers' Exposure to CCR Materials. In response to the 2008 ash spill at Kingston, TVA hired Jacobs Engineering Group, Inc. ("Jacobs") to oversee certain aspects of the cleanup. After the cleanup was completed, Jacobs was sued in the United States District Court for the Eastern District of Tennessee ("Eastern District") by employees of a contractor involved in the cleanup and family members of some of the employees. The plaintiffs alleged that Jacobs had failed to take or provide proper health precautions and misled workers about the health risks associated with exposure to coal fly ash, which is a CCR material. The plaintiffs alleged that exposure to the fly ash caused a variety of significant health issues and illnesses, including in some cases death. The case was split into two phases, with the first phase considering, among other issues, general causation and the second determining specific causation and damages. On November 7, 2018, a jury hearing the first phase returned a verdict in favor of the plaintiffs, including determinations that Jacobs failed to adhere to its contract with TVA or the Site Wide Safety and Health Plan in place;Plan; Jacobs failed to provide reasonable care to the plaintiffs; and Jacobs’sJacobs's failures were capable of causing a list of medical conditions, ranging from hypertension to cancer. On January 11, 2019, the district courtEastern District referred the parties to mediation. Depending onMediation has concluded, but the outcome of mediation,parties did not resolve the matter. The litigation will now proceed to the second phase on the question of whether Jacobs’sJacobs's failures did in fact cause the plaintiffs’plaintiffs' alleged injuries and damages.
On May 13, 2019, an additional group of contractor employees and family members filed suit against Jacobs in the Circuit Court for Roane County, Tennessee. These plaintiffs have raised similar claims to those being litigated in the case referenced above.
While TVA is not a party to either of these lawsuits, TVA could be contractually obligatedmay potentially have an indemnity obligation to reimburse Jacobs for some amounts that Jacobs is required to pay. Further, TVA will continue monitoring the litigation to determine whether thisthese or similar cases could have broader implications for the utility industry. TVA does not expect any potential liability to have a material adverse impact on its results of operations or financial condition.
Legal Proceedings
Legal Proceedings
From time to time, TVA is party to or otherwise involved in lawsuits, claims, proceedings, investigations, and other legal matters ("Legal Proceedings") that have arisen in the ordinary course of conducting TVA's activities, as a result of a catastrophic event or otherwise.
General. At June 30, 2019,2020, TVA had accrued $14 million of probable losses with respect to Legal Proceedings. Of the accrued amount, $12$13 million is included in Other long-term liabilities and $2$1 million is included in Accounts payable and accrued liabilities. No assurance can be given that TVA will not be subject to significant additional claims and liabilities. If actual liabilities significantly exceed the estimates made, TVA's results of operations, liquidity, and financial condition could be materially adversely affected.
Environmental Agreements. In April 2011, TVA entered into two2 substantively similar agreements, one1 with the Environmental Protection Agency ("EPA") and the other with Alabama, Kentucky, North Carolina, Tennessee, and three environmental advocacy groups: the Sierra Club, the National Parks Conservation Association, and Our Children's Earth Foundation (collectively, the "Environmental Agreements"). They became effective in June 2011. Under the Environmental Agreements, TVA committed to, (1) retire on a phased schedule 18 coal-firedamong other things, take actions regarding coal units with a combined summer net dependable capability of 2,200 MW, (2) control, convert, or retire additional coal-fired units with a combined summer net dependable capability of 3,500 MW, (3) comply with annual, declining emission caps for sulfur dioxide ("SO2") and nitrogen oxide, (4)that have been completed. TVA also agreed to invest $290 million in certain TVA environmental projects (ofof which TVA had spent approximately $278$279 million as of June 30, 2019), (5) provide $60 million to Alabama, Kentucky, North Carolina, and Tennessee to fund environmental projects, and (6) pay civil penalties of $10 million.2020. In exchange for these commitments, most past claims against TVA based on alleged New Source Review and associated violations were waived and cannot be brought against TVA. Future claims, including those for sulfuric acid mist and GHG emissions, can still be brought against TVA, and claims for increases in particulates can also be pursued at many of TVA's coal-fired units. Additionally, the Environmental Agreements do not address compliance with new laws and regulations or the cost associated with such compliance.TVA.
The liabilities related to the Environmental Agreements are included in Accounts payable and accrued liabilities and
Other long-term liabilities on the June 30, 2019,2020, Consolidated Balance Sheet.Sheets. In conjunction with the approval of the
Environmental Agreements, the TVA Board determined that it was appropriate to record TVA's obligations under the
Environmental Agreements as regulatory assets, and they are included as such on the June 30, 2019,2020, Consolidated
Balance SheetSheets and will be recovered in rates in future periods. TVA has substantially completed the requirements in the
Environmental Agreements related to retiring coal-fired units or installing controls on such units.
Case Involving Kingston Fossil Plant. On May 7, 2019, Roane County and the Cities of Kingston and Harriman (“("local governments”governments") filed a lawsuit in the Circuit Court for Roane County, Tennessee, against TVA and Jacobs for monetary damages and unspecified injunctive relief relating to TVA’sTVA's cleanup response to the 2008 ash spill at Kingston Fossil Plant.Kingston. The local governments allege that TVA and Jacobs failed to take proper measures to mitigate environmental and health risks during the
cleanup response and misled the local governments and their citizens about health and environmental risks associated with exposure to coal fly ash. The local governments seek to recover monetary damages on behalf of their citizens for personal injury and property loss claims, damages for lost tax revenue, damages for increased emergency and medical response costs claims, punitive damages, and unspecified injunctive relief. On June 6, 2019, TVA removed the lawsuit to the Eastern District.District, and TVA hasand Jacobs filed separate motions to dismiss. Plaintiffs, in response, filed a response opposing both motions and a separate motion seeking leave to file a proposed amended class action complaint in which Roane County would serve as class representative for the municipalities and their citizens.
In December 2019, the federal court ruled that the local governments did not have standing to assert representative claims on behalf of their citizens and rejected their motion to proceed as a class action on behalf of their citizens because of the dissimilarity of the injuries allegedly suffered by the local governments (lost tax revenue) and the personal injuries and personal medical expenses allegedly suffered by the individuals. The court indicated, however, that the local governments may have legal standing to assert claims for their direct injuries (claims relating to municipally owned property) and directed the local governments to file an amended pleading in conformance with the court's order by January 16, 2020. The plaintiffs filed their amended complaint on January 15, 2020. On February 26, 2020, TVA and Jacobs moved to dismiss the case.amended complaint and the court has not yet ruled on this motion. Discovery is ongoing, and trial is set for April 20, 2021.
Cases Class Action Lawsuit Involving GallatinKingston Fossil Plant. On November 7, 2019, a resident of Roane County, Tennessee, filed a proposed class action lawsuit against Jacobs and TVA in the Eastern District. The complaint alleges that the class representative and all other members of the proposed class were damaged as a result of the 2008 ash spill at Kingston and the resulting cleanup activities. The complaint alleges, among other things, that (1) TVA was negligent in its construction and operation of the Kingston CCR Facilitiesfacility, (2) TVA and Jacobs failed to take proper measures to mitigate environmental and health risks during the cleanup response, and (3) TVA and Jacobs misled the community about health and environmental risks associated with exposure to coal fly ash. The complaint seeks monetary damages and injunctive relief in the form of an order requiring the defendants to establish a blood testing program and medical monitoring protocol and to remediate damage to the properties of the proposed class. On April 22, 2020, TVA moved to dismiss the complaint and the court has not yet ruled on this motion.
Case Involving Bull Run Fossil Plant. On February 5, 2020, two plaintiffs who reside near Bull Run filed suit against TVA isin the Circuit Court for Anderson County, Tennessee, on behalf of themselves and their two minor children. The plaintiffs allege that they and their children were injured from direct exposures to CCR material originating from Bull Run and from second-hand exposures to coal ash through contact with a partyfamily member who worked at an undisclosed TVA facility. TVA
removed the case to the Eastern District on March 5, 2020, and the plaintiffs filed an amended complaint in two lawsuits relatingfederal court on
March 12, 2020. On June 19, 2020, TVA moved to alleged releases of waste materials fromdismiss the CCR facilities at Gallatin. See Note 9 — Background — Lawsuit Brought by TDEC amended complaint and — Lawsuit Brought by TSRA and TCWN.the court has not yet ruled on this motion.
Consent Decree Involving Colbert Fossil Plant. In May 2013, the Alabama Department of Environmental Management
("ADEM") and TVA entered into a consent decree concerning alleged violations of the Alabama Water Pollution Control Act. The
consent decree required, among other things, that TVA continue remediation efforts TVA had begun prior to the suit being filed
and stop using an unlined landfill after a lined landfill is approved and constructed. TVA also paid $150,000 to Alabama under this 2013 consent decree. In August 2018, the parties agreed to amend the consent decree to deal with groundwater issues identified after TVA published groundwater monitoring reports in accordance with the EPA's CCR rule. The amended consent decree requires TVA to investigate the nature and extent of any groundwater contamination, develop and implement a remedy, provide semiannual status reports to ADEM, and remedy any seeps identified during inspections. TVA also paid $100,000 to Alabama under the amended consent decree. In accordance with the amended consent decree, TVA submitted to ADEM a Comprehensive Groundwater Investigation Report on May 17, 2019, and an Assessment of Corrective Measures on July 17, 2019. TVA is continuing to develop the groundwater remedy and submit reports to ADEM.
Case Involving Tennessee River Boat Accident. On July 23, 2015, plaintiffs filed suit in the United States District Court for the Northern District of Alabama ("Northern District"), seeking recovery for personal injuries sustained when the plaintiffs’plaintiffs' boat struck a TVA transmission line which was being raised from the Tennessee River during a repair operation. The district court dismissed the case, finding that TVA’sTVA's exercise of its discretion as a governmental entity in deciding how to carry out the operation barred any liability for negligence. In August 2017, the United StatesU.S. Court of Appeals for the Eleventh Circuit (“("Eleventh Circuit”Circuit") affirmed the decision. The plaintiffs petitioned the U.S. Supreme Court ("Supreme Court") for review of the decision, arguing that the provision of the TVA Act which allows suit to be brought against TVA does not allow TVA to claim immunity for discretionary actions. On April 29, 2019, the Supreme Court issued its opinion reversing the judgment of the Eleventh Circuit
and remanding the case to the Eleventh Circuit. On July 17, 2019, the Eleventh Circuit remanded the case to the district court for further proceedings consistent with the Supreme Court’sCourt's opinion. Trial is currently scheduled for February 16, 2021.
Case Involving Bellefonte Nuclear Plant. On November 30, 2018, Nuclear Development, LLC, filed suit against TVA in the United States District Court for the Northern District of Alabama.District. The plaintiff alleges that TVA breached its agreement to sell Bellefonte to the plaintiff. The plaintiff seeks, among other things, (1) an injunction requiring TVA to maintain Bellefonte and the associated NRC permits until the case is concluded, (2) an order compelling TVA to complete the sale of Bellefonte to the plaintiff, and (3) if the court does not order TVA to complete the sale, monetary damages in excess of $30 million. On December 26, 2018, Nuclear Development, LLC, and TVA filed a joint stipulation with the court. Under the stipulation, Nuclear Development, LLC, withdrew its request for an expedited hearing on its injunction in exchange for TVA’sTVA's agreement to continue to maintain Bellefonte in accordance with the NRC permits and to give Nuclear Development, LLC, and the court five days prior notice of any filing by TVA to terminate the permits or sell the site. TVA filed a motion to dismiss the case on February 4, 2019. On May 15, 2019, the court denied TVA's motion. TrialDiscovery is currentlyongoing, and the case is scheduled to be ready for Maytrial by December 2020.
Case Involving Rate Changes. On June 9, 2020, a proposed class action lawsuit was filed in federal court in Abingdon, Virginia, by a LPC customer, asserting claims for breach of contract and violation of the Administrative Procedure Act. The lawsuit alleges that the customers of TVA's LPCs are third-party beneficiaries under TVA's wholesale power contracts with its LPCs and that TVA’s rate changes dating back to 2010 violate Section 11 of the TVA Act. Section 11 of the TVA Act establishes the broad policy that TVA power projects shall be considered primarily for the benefit of the people of the Tennessee Valley and that service to industry is a secondary purpose to be used principally to secure a sufficiently high load factor and revenue returns to permit domestic and rural use at the lowest possible rates. The remedies requested include an injunction prohibiting TVA rate changes that violate Section 11, monetary damages, and repayment of rates charged in violation of Section 11.
21. Subsequent Events
Redemption of Power Bonds
On June 15, 2020, TVA provided notice of its intent to redeem on July 15, 2020, all of its 6.235 percent 1995 Series B Power Bonds (CUSIP number 880591CF7) due July 15, 2045. The bonds, with a principal amount outstanding of $140 million, were redeemed at 100 percent of par value.
United States Credit Rating
On July 31, 2020, Fitch Ratings affirmed the United States' Long-Term Foreign-Currency, Local-Currency, and Issuer Default Ratings ("credit ratings") at AAA, but revised the ratings outlooks from stable to negative. The change in outlooks on the United States’ credit ratings is expected to result in a similar action by Fitch Ratings on the outlook for TVA’s credit ratings.
Federal Contracting and Hiring Practices
On August 3, 2020, President Trump issued an "Executive Order ("EO") on Aligning Federal Contracting and Hiring Practices With the Interests of American Workers." Among other things, the EO directs federal agencies to review their contracting and hiring practices and assess negative impacts from the use of temporary foreign labor or offshoring of work. TVA is reviewing this EO and has not yet determined the extent to which this EO may impact TVA’s operations.
ITEM 2. MANAGEMENT'S DISCUSSION AND ANALYSIS OF FINANCIAL CONDITION AND RESULTS OF OPERATIONS
(Dollars in millions except where noted)
Management’sManagement's Discussion and Analysis of Financial Condition and Results of Operations ("MD&A") explains the results of operations and general financial condition of the Tennessee Valley Authority ("TVA"). The MD&A should be read in conjunction with the accompanying unaudited consolidated financial statements and TVA's Annual Report on Form 10-K10-K/A for the fiscal year ended September 30, 20182019 (the "Annual Report").
Executive Overview
TVA's net income for the three and nine months ended June 30, 2019,2020, was $165$205 million and $829$652 million, respectively, as compared with net income of $470$165 million and $1.2 billion$829 million for the same periods of the prior year. TVA’sWhile weather is typically one of the primary drivers of TVA's sales and revenue, impacts due to the Coronavirus Disease 2019 ("COVID-19") pandemic had a greater impact on sales of electricity for the third quarter of 2020. TVA estimates base revenues were reduced by approximately $130 million for the nine months ended June 30, 2020 due to the impacts of COVID-19, and based on current estimates, TVA anticipates base revenue could be up to $100 million lower than plan for the fourth quarter of 2020. It is uncertain at this time the extent to which TVA's revenues may be impacted beyond 2020. In addition, TVA's service territory experienced overall milder than normal weather during the nine months ended June 30, 2019,2020, despite record-setting cold weatherheat experienced during October 2019 and record-setting cold during November 2018.2019. This overall milder weather drove lower energy sales. However,As such, revenue from sales of electricity increased $27decreased $721 million for the nine months ended June 30, 2019,2020, as compared to the same period of the prior year primarily driven by the base rate adjustment that became effective October 1, 2018.year.
Fuel and purchased power expense decreased $70$290 million for the nine months ended June 30, 2019,2020, as compared to the same period of the prior year. This decrease was primarily due to an overall decrease inlower energy sales, of electricityas well as lower effective fuel and significant hydroelectric generation resulting from record rainfall in the second quarter of 2019. This decrease was partially offset by an increase in purchased power utilized to meet increased demand during the first quarterrates and availability of 2019.lower cost TVA-owned generation. Operating and maintenance
expense increased $408decreased $275 million for the nine months ended June 30, 2019,2020, as compared to the same period of the prior year. This was primarily driven by prior year recovery of the regulatory asset for environmental cleanup costs related to the Kingston ash spill. Depreciation and amortization expense increased $43 million for the nine months ended June 30, 2020, as compared to the same period of the prior year. This increase was primarily driven by accelerated recoverydue to net additions to Completed plant.
In March 2020, the World Health Organization declared the outbreak of COVID-19 a pandemic, which continues to spread throughout the regulatory asset for Environmental cleanup costs relatedUnited States. TVA continues to coordinate with local power company customers (“LPCs”) and partners to understand the Kingston ash spill in accordance withimpact to its service territory. During March 2020, the TVA Board approved the Public Power Support and Stabilization Program, offering up to $1.0 billion of Directors (the "TVA Board") ratemaking authority, an increase in project write-offs and Materials and supplies inventory reserves and write-offs associated with the anticipated retirement of Paradise Fossil Plant (“Paradise”) and Bull Run Fossil Plant (“Bull Run”), and increased outage expense driven by additional planned nuclear outage days.
TVA remains committed to planning its system in a way that ensures evolving resource portfolios remain reliable and provide the most value to all customers. TVA utilizes an Integrated Resource Plan ("IRP")credit support to provide direction on how to best meet future electricity demand. During the third quarter of 2019, TVA finalized the 2019 IRP, which considered many views of the future to determine how TVA can continue to provide low-cost, reliable electricity, support environmental stewardship, and spur economic developmenttemporary financial relief for its LPCs in the Tennessee Valley over the next 20 years. The final 2019 IRP will be presentedform of deferred payments of power bills under certain circumstances. Operations and delivery of energy to thecustomers have not been materially impacted at this time. TVA Board for consideration at its August 2019 meeting.
During the third quarter of 2019, TVA completed power ascension testing on the third and final phase of the extended power uprate ("EPU") project at Browns Ferry Nuclear Plant ("Browns Ferry"). The generating capacity is expected to increase by an estimated 465 MW after completion of the project and sufficient run time to validate the new capacity.
TVA also continues to achievemonitor the situation and will adjust its response as necessary to ensure reliable service while protecting the safety and health of its workforce and sustaining business operations.
TVA continues to maintain 99.999 percent reliability in delivering energy to its customers. TVA's reliability and economic development efforts continuedcontinue to attract and encourage the expansion of business and industries in the Tennessee Valley, with over $8.0$7.1 billion in investments and more than 58,50058,400 jobs created or retained through the third quarter of 2019.2020.
Results of Operations
Sales of Electricity
The following charts compare TVA's sales Sales of electricity for the three and nine months ended June 30, 2019 and 2018:
|
| | |
| Sales of Electricity | |
Three Months Ended June 30 |
| (millions of kWh) | |
|
| | |
| Sales of Electricity | |
Nine Months Ended June 30 |
| (millions of kWh) | |
Notes
(1) Pre-commercial generation included in the three months ended June 30, 2018, was less than 1 million kilowatt hours ("kWh"). See Note 1 — Pre-Commercial Plant Operations.
(2) Includes approximately 429 million2020 and 2019, were 34,272 and 37,272 millions of kWh, respectively. Sales of pre-commercial generationelectricity for the nine months ended June 30, 2018. See Note 1 — Pre-Commercial Plant Operations.2020 and 2019 were 108,396 and 113,609 millions of kWh, respectively. The following charts show a breakdown of TVA's sales of electricity by customer type for the periods indicated:
| | | | | | | | | | | | | | | |
| Sales of Electricity | | Sales of Electricity | | | | |
| Three Months Ended June 30 | | Nine Months Ended June 30 | | | | |
| (millions of kWh) | | (millions of kWh) | | | | |
The following charts show a breakdown of TVA's energy load:
Note
Information included in the charts above was derived from energy usage of directly served customers and customers served by LPCs during calendar year 2019, and these graphs will continue to be updated on a calendar year basis.
Weather affects both the demand for TVA power and the price for that power. TVA uses degree days to measure the impact of weather on its power operations. Degree days measure the extent to which the TVA system 23-station average temperatures vary from 65 degrees Fahrenheit. During 2019,Although weather is generally the primary driver of changes in demand for TVA transitioned degree day calculation methodologies, movingpower, the COVID-19 pandemic has had a greater impact on sales of electricity for the three months ended June 30, 2020.
| | | | | | | | | | | | | | | | | | | | | | | | | | | | | | | | | | | | | | | | | |
| Degree Days | | | | | | | | | | | | |
| Variation from Normal | | | | | | | | | | | | Variation from Prior Period |
| | 2020 | | Normal | | Percent Variation | | 2019 | | Normal | | Percent Variation | | Percent Change |
| Heating Degree Days | | | | | | | | | | | | | |
| Three Months Ended June 30 | 305 | | | 191 | | 59.7 | % | | 139 | | | 191 | | | (27.2) | % | | 119.4 | % |
| Nine Months Ended June 30 | 3,039 | | | 3,362 | | (9.6) | % | | 3,219 | | | 3,350 | | | (3.9) | % | | (5.6) | % |
| | | | | | | | | | | | | |
| Cooling Degree Days | | | | | | | | | | | | | |
| Three Months Ended June 30 | 473 | | | 565 | | (16.3) | % | | 612 | | | 565 | | | 8.3 | % | | (22.7) | % |
| Nine Months Ended June 30 | 586 | | | 619 | | (5.3) | % | | 730 | | | 617 | | | 18.3 | % | | (19.7) | % |
| | | | | | | | | | | | | |
| | | | | | | | | | | | | |
| | | | | | | | | | | | | |
| | | | | | | | | | | | | |
Sales of electricity decreased approximately eight percent for the three months ended June 30, 2020, as compared to the same period of the prior year. This was primarily due to decreased sales volume as a result of the COVID-19 pandemic, which accounted for approximately 75 percent of the change in sales of electricity from the
averageprior period. Also, the Tennessee Valley's weather averaged milder temperatures
over this period, thereby reducing energy sales. Cooling degree days generally have a greater impact on sales of
electricity per degree day. As such, the
five largest citiesdecrease in
TVA's service area tocooling degree days for the
average temperaturesthree months ended June 30, 2020, resulted in a net decrease in sales of
23 stations throughout TVA's service area. This transition provides TVA with increased geographic granularity throughout its service territory and improved modeling accuracy.electricity. |
| | | | | | | | | | | | | | | | | | | | |
| | Degree Days | | |
| | Variation from Normal | | Variation from Prior Period |
| | 2019 Actual | | Normal | | Percent Variation | | 2018 Actual(1) | | Normal(1) | | Percent Variation | | Percent Change |
| Heating Degree Days | | | | | | | | | | | | | |
| Three Months Ended June 30 | 139 |
| | 191 |
| | (27.2 | )% | | 292 |
| | 191 |
| | 52.9 | % | | (52.4 | )% |
| Nine Months Ended June 30 | 3,219 |
| | 3,350 |
| | (3.9 | )% | | 3,381 |
| | 3,350 |
| | 0.9 | % | | (4.8 | )% |
| | | | | | | | | | | | | | |
| Cooling Degree Days | | | | | | | | | | | | | |
| Three Months Ended June 30 | 612 |
| | 565 |
| | 8.3 | % | | 706 |
| | 565 |
| | 25.0 | % | | (13.3 | )% |
| Nine Months Ended June 30 | 730 |
| | 617 |
| | 18.3 | % | | 809 |
| | 617 |
| | 31.1 | % | | (9.8 | )% |
| | | | | | | | | | | | | | |
| Total Degree Days | | | | | | | | | | | | | |
| Three Months Ended June 30 | 751 |
| | 756 |
| | (0.7 | )% | | 998 |
| | 756 |
| | 32.0 | % | | (24.7 | )% |
| Nine Months Ended June 30 | 3,949 |
| | 3,967 |
| | (0.5 | )% | | 4,190 |
| | 3,967 |
| | 5.6 | % | | (5.8 | )% |
Note
(1) The prior period degree day information has been adjusted in order to incorporate a change in TVA’s current calculation of this information. Every five years this calculation is updated in order to incorporate the current 15-year period of weather history. The most recent update, to incorporate weather history for CYs 2001-2015, occurred during the first quarter of 2019.
Sales of electricity decreased approximately five percent for the threenine months ended June 30, 2019,2020, as compared to the same period of the prior year,year. This was primarily due to decreased sales volume driven predominantly by overall milder weather and the COVID-19 pandemic, which each accounted for LPCs driven by a 25approximately 50 percent decreaseof the change in total degree days. Additionally, sales to industries directly served decreased slightly, particularly in the chemical and metal sectors.
Sales of electricity decreased approximately two percent for the nine months ended June 30, 2019, as compared to the same period offrom the prior year, primarily due to decreased sales volume for LPCs driven by a six percent decrease in total degree days. Milder than normal weather during the months of Januaryperiod. During October 2019, and February 2019 offset record-setting cold experienced during November 2018, where TVA recorded its secondthird largest peak power demand for the month of October, and during November 2019, TVA recorded its highest peak power demand for the month of November. Partially offsettingDespite record-setting heat experienced during October 2019 and record-setting cold during November 2019, TVA's service territory experienced overall milder weather during the decreased sales volume for LPCs, sales to industries directly served increased slightly, particularly in the polysilicon sector.nine months ended June 30, 2020.
Financial Results
The following table compares operating results for the three and nine months endedJune 30, 20192020 and 2018:2019:
| | | | | | | | | | | | | | | | | | | | | | | | | | | | | | | | | | | | |
Summary Consolidated Statements of Operations (in millions) | | | | | | | | | | | | |
| | Three Months Ended June 30 | | | | | | Nine Months Ended June 30 | | | | | |
| | 2020 | | 2019 | | Percent Change | | 2020 | | 2019 | | Percent Change | |
| Operating revenues | $ | 2,251 | | | $ | 2,604 | | | (13.6) | % | | $ | 7,350 | | | $ | 8,079 | | | (9.0) | % | |
| Operating expenses | 1,716 | | | 2,088 | | | (17.8) | % | | 5,676 | | | 6,206 | | | (8.5) | % | |
| Operating income | 535 | | | 516 | | | 3.7 | % | | 1,674 | | | 1,873 | | | (10.6) | % | |
| Other income (expense), net | 16 | | | 14 | | | 14.3 | % | | 27 | | | 52 | | | (48.1) | % | |
| Other net periodic benefit cost | 63 | | | 65 | | | (3.1) | % | | 190 | | | 194 | | | (2.1) | % | |
| Interest expense | 283 | | | 300 | | | (5.7) | % | | 859 | | | 902 | | | (4.8) | % | |
| Net income (loss) | $ | 205 | | | $ | 165 | | | 24.2 | % | | $ | 652 | | | $ | 829 | | | (21.4) | % | |
|
| | | | | | | | | | | | | | | | | | | | | |
Summary Consolidated Statements of Operations |
| | Three Months Ended June 30 | | Nine Months Ended June 30 |
| | 2019 | | 2018 | | Percent Change | | 2019 | | 2018 | | Percent Change |
| Operating revenues | $ | 2,604 |
| | $ | 2,707 |
| | (3.8 | )% | | $ | 8,079 |
| | $ | 8,048 |
| | 0.4 | % |
| Operating expenses | 2,088 |
| | 1,877 |
| | 11.2 | % | | 6,206 |
| | 5,727 |
| | 8.4 | % |
| Operating income | 516 |
| | 830 |
| | (37.8 | )% | | 1,873 |
| | 2,321 |
| | (19.3 | )% |
| Other income, net | 14 |
| | 11 |
| | 27.3 | % | | 52 |
| | 34 |
| | 52.9 | % |
| Other net periodic benefit cost | 65 |
| | 65 |
| | — | % | | 194 |
| | 193 |
| | 0.5 | % |
| Interest expense, net | 300 |
| | 306 |
| | (2.0 | )% | | 902 |
| | 942 |
| | (4.2 | )% |
| Net income | $ | 165 |
| | $ | 470 |
| | (64.9 | )% | | $ | 829 |
| | $ | 1,220 |
| | (32.0 | )% |
Operating Revenues. Operating revenues for the three and nine months ended June 30, 20192020 and 2018,2019, consisted of the following:
|
| | | | | | | |
| Operating Revenues | |
Three Months Ended June 30 |
|
| | |
| Operating Revenues | |
Nine Months Ended June 30 |
| | |
Notes
(1) ExcludesTVA's two largest LPCs — Memphis Light, Gas and Water Division ("MLGW") and Nashville Electric Service ("NES") — have contracts with a contra-revenue amountfive-year and a 20-year termination notice period, respectively. Sales to MLGW and NES accounted for 9 percent and 8 percent, respectively, of less than $1 million representing revenue capitalizedTVA's total operating revenues during pre-commercial operations for the three months ended June 30, 2018. See Note 1 — Pre-Commercial Plant Operations.
(2) Excludes a contra-revenue amount of approximately $11 million representing revenue capitalized during pre-commercial operations for the nine months ended June 30, 2018. See Note 1 — Pre-Commercial Plant Operations.2020. Sales to MLGW and NES each accounted for 8 percent of TVA's total operating revenues during the nine months ended June 30, 2019. In May 2020, MLGW published a draft Integrated Resource Plan to guide energy choices in the future, and in July 2020, TVA made a proposal to MLGW that highlights the benefits of remaining a TVA customer.
TVA's current rate structure provides pricing signals intended to signal higher cost periods to serve its customers and capture a portion of TVA’sTVA's fixed costs in fixed charges. The structure includes three base revenue components: time of use demand charges, time of use energy charges, and a grid access charge ("GAC"). The demand charges are based upon the customer's peak monthly usage and increase as the peak increases. The energy charges are based on time differentiated kWh used by the customer. Both of these components can be significantly impacted by weather. The GAC which was implemented in October 2018, captures a portion of fixed costs and will beis offset by a corresponding reduction to the energy rates. The GAC will also reducereduces the impact of weather variability to the overall rate structure. Recognizing
Additionally, at its August 2019 meeting, the needTVA Board approved a 20-year Partnership Agreement option that better aligns the length of LPC contracts with TVA's long-term commitments. Participating LPCs will receive benefits including a 3.1 percent wholesale bill credit in exchange for flexibility, alltheir long-term commitment, which enables TVA to recover its long-term financial commitments over a commensurate period. As of August 3, 2020, 141 LPCs were presentedhad signed the 20-year Partnership Agreement with the option to implement the GAC in October 2018 or defer the implementation until October 2019. Seventy-nine LPCs elected to implement in October 2018, while the remaining 75 have elected to implement wholesale changes in October 2019.TVA.
In addition to base revenues, the rate structure also includes a separate fuel rate that includes the costs of natural gas, fuel oil, purchased power, coal, emission allowances, nuclear fuel, and other fuel-related commodities; realized gains and losses on derivatives purchased to hedge the costs of such commodities; and payments to states and counties in lieu of taxes ("tax equivalents") associated with the fuel cost adjustments.
The changes in revenue components for the three and nine months ended June 30, 2019,2020, compared to the three andnine months ended June 30, 2018, are summarized below:
|
| | | | | | | | | | | | | | | | | | | | | | | |
| Changes in Revenue Components |
| | Three Months Ended June 30 | | Nine Months Ended June 30 |
| | 2019 | | 2018 | | Change | | 2019 | | 2018 | | Change |
| Base revenue |
|
| |
|
| |
|
| | | | | |
|
|
| Energy revenue | $ | 1,171 |
| | $ | 1,271 |
| (1) | $ | (100 | ) | | $ | 3,596 |
| | $ | 3,796 |
| (1) | $ | (200 | ) |
| Demand revenue | 849 |
| | 824 |
| | 25 |
| | 2,565 |
| | 2,464 |
| | 101 |
|
| Grid access charge | 64 |
| | — |
| | 64 |
| | 193 |
| | — |
| | 193 |
|
Other charges and credits(2) | (144 | ) | | (158 | ) | | 14 |
| | (460 | ) | | (483 | ) | | 23 |
|
| Total base revenue | 1,940 |
| | 1,937 |
| | 3 |
| | 5,894 |
| | 5,777 |
| | 117 |
|
| Fuel cost recovery | 623 |
| | 730 |
| | (107 | ) | | 2,061 |
| | 2,148 |
| | (87 | ) |
| Off-system sales | 2 |
| | 2 |
| | — |
| | 3 |
| | 6 |
| | (3 | ) |
| Revenue from sales of electricity | 2,565 |
| | 2,669 |
| | (104 | ) | | 7,958 |
| | 7,931 |
| | 27 |
|
| Other revenue | 39 |
| | 38 |
| | 1 |
| | 121 |
| | 117 |
| | 4 |
|
| Total operating revenues | $ | 2,604 |
| | $ | 2,707 |
| | $ | (103 | ) | | $ | 8,079 |
| | $ | 8,048 |
| | $ | 31 |
|
Notes
(1) Includes the impact of revenue capitalized during pre-commercial operations of less than $1 million and approximately $11 million for the three and nine months ended June 30, 2018, respectively. See Note 1 — Pre-Commercial Plant Operations.2019, are summarized below:
(2) | | | | | | | | | | | | | | | | | | | | | | | | | | | | | | | | | | | |
Changes in Revenue Components (in millions) | | | | | | | | | | | |
| Three Months Ended June 30 | | | | | | Nine Months Ended June 30 | | | | |
| | 2020 | | 2019 | | Change | | 2020 | | 2019 | | Change |
| Base revenue | | | | | | | | | | | |
| Energy revenue | $ | 1,011 | | | $ | 1,171 | | | $ | (160) | | | $ | 3,190 | | | $ | 3,596 | | | $ | (406) | |
| Demand revenue | 750 | | | 849 | | | (99) | | | 2,427 | | | 2,565 | | | (138) | |
| Grid access charge | 149 | | | 64 | | | 85 | | | 448 | | | 193 | | | 255 | |
| Long-term partnership credits for LPCs | (38) | | | — | | | (38) | | | (108) | | | — | | | (108) | |
Other charges and credits(1) | (137) | | | (144) | | | 7 | | | (447) | | | (460) | | | 13 | |
| Total base revenue | 1,735 | | | 1,940 | | | (205) | | | 5,510 | | | 5,894 | | | (384) | |
| Fuel cost recovery | 480 | | | 623 | | | (143) | | | 1,724 | | | 2,061 | | | (337) | |
| Off-system sales | 1 | | | 2 | | | (1) | | | 3 | | | 3 | | | — | |
| Revenue from sales of electricity | 2,216 | | | 2,565 | | | (349) | | | 7,237 | | | 7,958 | | | (721) | |
| Other revenue | 35 | | | 39 | | | (4) | | | 113 | | | 121 | | | (8) | |
| Total operating revenues | $ | 2,251 | | | $ | 2,604 | | | $ | (353) | | | $ | 7,350 | | | $ | 8,079 | | | $ | (729) | |
Note
(1) Includes economic development credits to promote growth in the Tennessee Valley, hydro preference credits for residential customers of LPCs, and interruptible credits allowing TVA to reduce industrial customer usage in periods of peak demand to balance system demand. See Note 16 — Revenue from Sales of Electricity.Revenue.
Operating revenues decreased $103$353 million for the three months ended June 30, 2019,2020, as compared to the same period of the prior year, primarily due to a $107$205 million decrease in base revenue and a $143 million decrease in fuel cost recovery revenues.revenue. The $107$205 million decrease in base revenue was driven by a decrease of $163 million attributable to lower sales volume and a decrease of $42 million attributable to lower effective rates. The $143 million decrease in fuel cost recovery revenuesrevenue was driven by a $73$94 million decrease attributable to lower fuel rates and a $34$49 million decrease attributable to lower energy sales. Base revenue was slightly higher driven by an increase of $97 million attributable to higher effective rates resultingsales during the quarter. Lower energy sales resulted primarily from the base rate adjustment that became effective October 1, 2018, offset by a $94impact of the COVID-19 pandemic, which accounted for approximately $120 million decrease attributableof decreased sales. TVA's service area also experienced milder weather during the three months ended June 30, 2020, as compared to lower sales volume.the prior period.
Operating revenues increased $31decreased $729 million for the nine months ended June 30, 2019,2020, as compared to the same period of the prior year, primarily due to a $117$384 million increasedecrease in base revenue and a $337 million decrease in fuel cost recovery revenue. The $117$384 million increasedecrease in base revenue was driven by an increasea decrease of $239$258 million attributable to higherlower sales volume and a decrease of $126 million attributable to lower effective rates resulting from the base rate adjustment that became effective October 1, 2018, partially offsetrates. The $337 million decrease in fuel cost recovery revenue was driven by a $133$241 million decrease attributable to lower fuel rates and a $96 million decrease attributable to lower energy sales volume. Milder than normal weather during the monthsperiod. Lower energy sales resulted primarily from the COVID-19 pandemic, which accounted for approximately $130 million of January 2019decreased sales, and February 2019 offset record-setting cold experienced during November 2018, where TVA recorded its second highest peak power demandthe overall milder weather for the month of November. Further, there were no pre-commercial plant operationsTennessee Valley service area during the nine months ended June 30, 2019. Therefore, revenue capitalized as a result of pre-commercial generation during the nine months ended June 30, 2018, contributed $11 million to the additional base revenue for the nine months ended June 30, 2019. See Note 1 — Pre-Commercial Plant Operations. Partially offsetting these increases was an $87 million decrease in fuel cost recovery revenues, driven by a $44 million decrease attributable to lower energy sales and a $43 million decrease attributable to lower fuel rates.2020.
Operating Expenses. Operating expense components as a percentage of total operating expenses for the three and nine months ended June 30, 20192020 and 2018,2019, consisted of the following:
| | | | | | | | | | | | | | | | | | | | | | | | | | | | | | | | | | | |
Operating Expenses (in millions) | | | | | | | | | | | |
| Three Months Ended June 30 | | | | | | Nine Months Ended June 30 | | | | |
| 2020 | | 2019 | | Change | | 2020 | | 2019 | | Change |
| Operating expenses | | | | | | | | | | | |
| Fuel | $ | 312 | | | $ | 417 | | | $ | (105) | | | $ | 1,164 | | | $ | 1,359 | | | $ | (195) | |
| Purchased power | 209 | | | 223 | | | (14) | | | 680 | | | 775 | | | (95) | |
| Operating and maintenance | 681 | | | 744 | | | (63) | | | 2,014 | | | 2,289 | | | (275) | |
| Depreciation and amortization | 389 | | | 576 | | | (187) | | | 1,430 | | | 1,387 | | | 43 | |
| Tax equivalents | 125 | | | 128 | | | (3) | | | 388 | | | 396 | | | (8) | |
| Total operating expenses | $ | 1,716 | | | $ | 2,088 | | | $ | (372) | | | $ | 5,676 | | | $ | 6,206 | | | $ | (530) | |
Three Months Ended June 30, 2019,2020, Compared to Three Months Ended June 30, 20182019
Fuel expense decreased $105 million for the three months ended June 30, 2020, as compared to the same period of the prior year. This decrease was primarily due to lower effective fuel rates of $80 million, resulting from lower natural gas prices and more hydroelectric generation. Also, the COVID-19 pandemic and milder weather reduced demand, resulting in a decrease in volume of $33 million. Partially offsetting these decreases was an increase of $8 million in fuel rate recovery.
Purchased power expense decreased $14 million for the three months ended June 30, 2020, as compared to the same period of the prior year. This was due to a reduction in volume driven by decreased demand from the COVID-19 pandemic and milder weather.
Operating and maintenance expense decreased $63 million for the three months ended June 30, 2020, as compared to the same period of the prior year. This was primarily driven by a decrease of $22 million in project write-offs and materials and supplies inventory reserves and write-offs related to the retirement of Bull Run and Paradise. Additionally, $65 million of prior year recovery of the regulatory asset for Environmental cleanup costs related to the Kingston ash spill contributed to the decrease. Partially offsetting these decreases was $20 million of increased payroll and benefit costs due to labor escalation for cost of living increases and an increase of $15 million due to additional planned nuclear outage days. In addition, contract labor related to timing of nuclear outages, emergent work, and contract model transition contributed $11 million to the increase.
Depreciation and amortization expense decreased $187 million for the three months ended June 30, 2020, as compared to the same period of the prior year. This was primarily driven by a net decrease in depreciation expense of $199 million related to the decision in the second quarter of 2019 to accelerate the retirements of Bull Run and Paradise. As Paradise was fully depreciated prior to the third quarter of 2020, no depreciation was recognized for the three months ended June 30, 2020. Partially offsetting this decrease was a $6 million increase in amortization expense of non-nuclear decommissioning costs recovered in rates. The remaining variance was due to depreciation of additions to Completed plant.
Tax equivalents expense decreased $3 million for the three months ended June 30, 2020, as compared to the same period of the prior year. The change is primarily driven by a decrease in the tax equivalents collected in the fuel rate recovery.
Nine Months Ended June 30, 2020, Compared to Nine Months Ended June 30, 2019
Fuel expense decreased $195 million for the nine months ended June 30, 2020, as compared to the same period of the prior year. Lower effective fuel rates contributed $200 million to the decrease, resulting from lower natural gas prices. Also, the COVID-19 pandemic and milder weather reduced demand, resulting in a decrease in volume of $34 million. Partially offsetting these decreases was an increase of $39 million driven by variances in fuel rate recovery.
Purchased power expense decreased $95 million for the nine months ended June 30, 2020, as compared to the same period of the prior year. This was primarily due to a decrease in volume of $111 million driven by decreased demand from the COVID-19 pandemic and overall milder weather. Partially offsetting this decrease was an increase of $20 million in fuel rate recovery.
Operating and maintenance expense decreased $275 million for the nine months ended June 30, 2020, as compared to the same period of the prior year. This was primarily driven by a decrease of $148 million in project write-offs and materials and supplies inventory reserves and write-offs related to the retirement of Bull Run and Paradise. Additionally, $195 million of prior year recovery of the regulatory asset for Environmental cleanup costs related to the Kingston ash spill contributed to the decrease. Partially offsetting these decreases were $69 million of increased payroll and benefit costs due to labor escalation for cost of living increases, $24 million of increased contract labor related to timing of nuclear outages, emergent work, and contract model transition, and a $15 million increase to TVA's capital spare program.
Depreciation and amortization expense increased $43 million for the nine months ended June 30, 2020, as compared to the same period of the prior year. This was primarily driven by net additions to Completed plant of $23 million and an increase of $19 million in amortization expense of non-nuclear decommissioning costs recovered in rates.
Tax equivalents expense decreased $8 million for the nine months ended June 30, 2020, as compared to the same period of the prior year. The change is primarily driven by a decrease in the tax equivalents collected in the fuel rate recovery.
The following table showstables show TVA's net generation and purchased power by generating source as a percentage of all electrical power generated and purchased (based on kWh) for the periods indicated:
| | | Power Supply from TVA-Operated Generation Facilities and Purchased Power | Power Supply from TVA-Operated Generation Facilities and Purchased Power | Power Supply from TVA-Operated Generation Facilities and Purchased Power | |
| | | Three Months Ended June 30 | | | | | | Three Months Ended June 30 | | |
| | | 2019 | | 2018 | | | | | | | 2020 | | | 2019 | | |
| | | kWh (millions) | | Percent of Power Supply | | kWh
(millions) | | Percent of Power Supply | | Change | | Percentage Change | | kWh
(millions) | | Percent of Power Supply | | kWh
(millions) | | Percent of Power Supply | | Change | | Percentage Change |
| Coal-fired | | 5,774 |
| | 15 | % | | 7,694 |
| | 19 | % | | (1,920 | ) | | (25 | )% | Coal-fired | | 2,835 | | | 8 | % | | 5,774 | | | 15 | % | | (2,939) | | | (51) | % |
| Nuclear | | 16,438 |
| | 44 | % | | 15,665 |
| | 40 | % | | 773 |
| | 5 | % | Nuclear | | 15,223 | | | 44 | % | | 16,438 | | | 44 | % | | (1,215) | | | (7) | % |
| Hydroelectric | | 3,503 |
| | 9 | % | | 3,499 |
| | 9 | % | | 4 |
| | — | % | Hydroelectric | | 4,273 | | | 12 | % | | 3,503 | | | 9 | % | | 770 | | | 22 | % |
Natural gas and/or oil-fired(1) | | 7,129 |
| | 19 | % | | 7,574 |
| | 19 | % | | (445 | ) | | (6 | )% | |
| Natural gas and/or oil-fired | | Natural gas and/or oil-fired | | 7,929 | | | 23 | % | | 7,129 | | | 19 | % | | 800 | | | 11 | % |
| Total TVA-operated generation facilities(2)(1) | | 32,844 |
| | 87 | % | | 34,432 |
| | 87 | % | | (1,588 | ) | | (5 | )% | | 30,260 | | | 87 | % | | 32,844 | | | 87 | % | | (2,584) | | | (8) | % |
Purchased power (non-renewable)(3)(2) | | 2,853 |
| | 8 | % | | 3,322 |
| | 8 | % | | (469 | ) | | (14 | )% | | 2,360 | | | 7 | % | | 2,853 | | | 8 | % | | (493) | | | (17) | % |
Purchased power (renewable)(4)(3) | | 2,081 |
| | 5 | % | | 1,875 |
| | 5 | % | | 206 |
| | 11 | % | | 2,232 | | | 6 | % | | 2,081 | | | 5 | % | | 151 | | | 7 | % |
| Total purchased power | | 4,934 |
| | 13 | % | | 5,197 |
| | 13 | % | | (263 | ) | | (5 | )% | Total purchased power | | 4,592 | | | 13 | % | | 4,934 | | | 13 | % | | (342) | | | (7) | % |
| Total power supply | | 37,778 |
| | 100 | % | | 39,629 |
| | 100 | % | | (1,851 | ) | | (5 | )% | Total power supply | | 34,852 | | | 100 | % | | 37,778 | | | 100 | % | | (2,926) | | | (8) | % |
Notes
(1) The natural gas and/or oil-fired amount includes less than 1 million kWh of pre-commercial generation at the Allen Combined Cycle Plant ("Allen CC") for the three months ended June 30, 2018. See Note 1 — Pre-Commercial Plant Operations.
(2) Generation from TVA-owned renewable resources (non-hydroelectric) is less than one percent for all periods shown and therefore is not represented in the table above.
(3)(2) Includes generation from Caledonia Combined Cycle Plant, which is currently a leased facility operated by TVA. Generation from Caledonia Combined Cycle Plant was 8821,013 million kWh and 695882 million kWh for the three months ended June 30, 20192020 and 2018,2019, respectively.
(4)(3) Includes purchased power purchased from the following renewable sources: hydroelectric, solar, wind, and cogeneration.
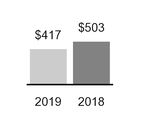
|
|
Fuel |
Fuel expense decreased $86 million for the three months ended June 30, 2019, as compared to the same period of the prior year, due to decreases of $33 million in the fuel rate driven by lower commodity prices and $22 million in lower fuel volume resulting from lower sales of electricity. In addition, variances in fuel rate recovery contributed $31 million to the decrease. |
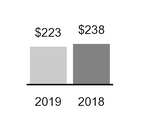
|
|
Purchased Power |
Purchased power expense decreased $15 million for the three months ended June 30, 2019, as compared to the same period of the prior year. This was primarily driven by a $12 million decrease in volume resulting from lower overall demand and an $11 million decrease in fuel rate recovery. Partially offsetting these decreases was an increase of $8 million in the price of purchased power. |
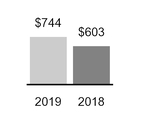
|
|
Operating and Maintenance |
Operating and maintenance expense increased $141 million for the three months ended June 30, 2019, as compared to the same period of the prior year. This was primarily driven by an increase of $108 million due to accelerated recovery of the regulatory asset for Environmental cleanup costs related to the Kingston ash spill in accordance with the TVA Board's ratemaking authority and $25 million for project write-offs and Materials and supplies inventory reserves related to the anticipated retirements of Bull Run and Paradise. Additionally, there was an increase in planned nuclear outage days which increased outage expense by $18 million.
|
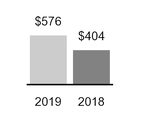
|
|
Depreciation and Amortization |
Depreciation and amortization expense increased $172 million for the three months ended June 30, 2019, as compared to the same period of the prior year. This was primarily driven by accelerated depreciation expense of $225 million due to the decision to accelerate the retirements of Bull Run and Paradise. The increase also included $5 million from new additions to Completed plant. Partially offsetting these increases was a decrease of $58 million of prior year accelerated amortization of Deferred nuclear generating units and Nuclear training costs regulatory assets due to excess revenues collected in 2018 in accordance with the TVA Board's ratemaking authority.
|

|
|
Tax Equivalents |
Tax equivalents expense decreased $1 million for the three months ended June 30, 2019, as compared to the same period of the prior year. This change primarily reflects a decrease in the accrued tax equivalent expense related to the fuel cost adjustment mechanism. The accrued tax equivalent expense is equal to five percent of the fuel cost adjustment mechanism revenues and decreased for the three months ended June 30, 2019, as compared to the same period of the prior year. |
Nine Months Ended June 30, 2019, Compared to Nine Months Ended June 30, 2018
The following table shows TVA's net generation and purchased power by generating source for the periods indicated:
| | | Power Supply from TVA-Operated Generation Facilities and Purchased Power | Power Supply from TVA-Operated Generation Facilities and Purchased Power | Power Supply from TVA-Operated Generation Facilities and Purchased Power | |
| | | Nine Months Ended June 30 | | | | | | Nine Months Ended June 30 | | |
| | | 2019 | | 2018 | | | | | | | 2020 | | | 2019 | | |
| | | kWh (millions) | | Percent of Power Supply | | kWh
(millions) | | Percent of Power Supply | | Change | | Percentage Change | | kWh
(millions) | | Percent of Power Supply | | kWh
(millions) | | Percent of Power Supply | | Change | | Percentage Change |
| Coal-fired | | 17,971 |
| | 16 | % | | 22,226 |
| | 19 | % | | (4,255 | ) | | (19 | )% | Coal-fired | | 11,767 | | | 11 | % | | 17,971 | | | 16 | % | | (6,204) | | | (35) | % |
| Nuclear | | 46,890 |
| | 41 | % | | 47,768 |
| | 41 | % | | (878 | ) | | (2 | )% | Nuclear | | 47,740 | | | 43 | % | | 46,890 | | | 41 | % | | 850 | | | 2 | % |
| Hydroelectric | | 13,162 |
| | 11 | % | | 10,444 |
| | 9 | % | | 2,718 |
| | 26 | % | Hydroelectric | | 12,869 | | | 12 | % | | 13,162 | | | 11 | % | | (293) | | | (2) | % |
Natural gas and/or oil-fired(1) | | 20,690 |
| | 18 | % | | 21,783 |
| | 18 | % | | (1,093 | ) | | (5 | )% | |
| Natural gas and/or oil-fired | | Natural gas and/or oil-fired | | 23,791 | | | 21 | % | | 20,690 | | | 18 | % | | 3,101 | | | 15 | % |
| Total TVA-operated generation facilities(2)(1) | | 98,713 |
| | 86 | % | | 102,221 |
| | 87 | % | | (3,508 | ) | | (3 | )% | | 96,167 | | | 87 | % | | 98,713 | | | 86 | % | | (2,546) | | | (3) | % |
Purchased power (non-renewable)(3)(2) | | 10,299 |
| | 9 | % | | 9,645 |
| | 8 | % | | 654 |
| | 7 | % | | 7,565 | | | 7 | % | | 10,299 | | | 9 | % | | (2,734) | | | (27) | % |
Purchased power (renewable)(4)(3) | | 6,202 |
| | 5 | % | | 5,982 |
| | 5 | % | | 220 |
| | 4 | % | | 6,531 | | | 6 | % | | 6,202 | | | 5 | % | | 329 | | | 5 | % |
| Total purchased power | | 16,501 |
| | 14 | % | | 15,627 |
| | 13 | % | | 874 |
| | 6 | % | Total purchased power | | 14,096 | | | 13 | % | | 16,501 | | | 14 | % | | (2,405) | | | (15) | % |
| Total power supply | | 115,214 |
| | 100 | % | | 117,848 |
| | 100 | % | | (2,634 | ) | | (2 | )% | Total power supply | | 110,263 | | | 100 | % | | 115,214 | | | 100 | % | | (4,951) | | | (4) | % |
Notes
(1) The natural gas and/or oil-fired amount includes 429 million kWh of pre-commercial generation at the Allen CC for the nine months ended June 30, 2018. See Note 1 — Pre-Commercial Plant Operations.
(2) Generation from TVA-owned renewable resources (non-hydroelectric) is less than one percent for all periods shown and therefore is not represented in the table above.
(3)(2) Includes generation from Caledonia Combined Cycle Plant, which is currently a leased facility operated by TVA. Generation from Caledonia Combined Cycle Plant was 2,8872,932 million kWh and 2,7622,887 million kWh for the nine months ended June 30, 20192020 and 2018,2019, respectively.
(4)(3) Includes purchased power purchased from the following renewable sources: hydroelectric, solar, wind, and cogeneration.
|
|
Fuel |
Fuel expense decreased $114 million for the nine months ended June 30, 2019, as compared to the same period of the prior year. Lower effective fuel rates contributed $95 million to the decrease resulting from lower commodity prices and significantly more hydroelectric generation. Lower fuel volume contributed $50 million to the decrease driven by lower sales of electricity. Partially offsetting these decreases was an increase of $31 million driven by variances in fuel rate recovery resulting from the winter peaks experienced in the second quarter of 2018 compared to the overall milder than normal weather in the second quarter of 2019. |
|
|
Purchased Power |
Purchased power expense increased $44 million for the nine months ended June 30, 2019, as compared to the same period of the prior year. This was primarily due to a $41 million increase in the volume of purchased power and a $14 million increase in fuel rate recovery resulting from the winter peaks experienced in the second quarter of 2018 compared to the overall milder than normal weather in the second quarter of 2019. Partially offsetting these increases was a decrease of $11 million in the price of purchased power.
|
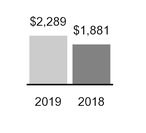
|
|
Operating and Maintenance |
Operating and maintenance expense increased $408 million for the nine months ended June 30, 2019, as compared to the same period of the prior year. This was primarily driven by an increase of $162 million due to accelerated recovery of the regulatory asset for Environmental cleanup costs related to the Kingston ash spill in accordance with the TVA Board's ratemaking authority and $160 million for project write-offs and Materials and supplies inventory reserves related to the anticipated retirements of Bull Run and Paradise. Additionally, there was an increase in planned nuclear outage days which increased outage expense by $66 million. |
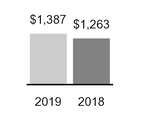
|
|
Depreciation and Amortization |
Depreciation and amortization expense increased by $124 million for the nine months ended June 30, 2019, as compared to the same period of the prior year. This was primarily driven by an increase of $341 million of accelerated depreciation expense due to the decision to accelerate the retirements of Bull Run and Paradise. The increase also included $19 million from new additions to Completed plant. Partially offsetting this increase was a decrease of $176 million of prior year accelerated amortization of Deferred nuclear generating units and Nuclear training costs regulatory assets due to excess revenues collected in 2018 in accordance with the TVA Board's ratemaking authority and a decrease of $59 million due to the retirements of certain units at Allen Fossil Plant and Johnsonville Fossil Plant in 2018.
|
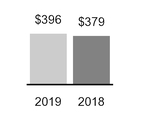
|
|
Tax Equivalents |
Tax equivalents expense increased $17 million for the nine months ended June 30, 2019, as compared to the same period of the prior year. This change is primarily driven by an increase in TVA's overall revenue in 2018, which is used as the basis for calculating tax equivalent expense.
|
Interest Expense.Interest expense and interest rates for the three and nine months ended June 30, 20192020 and 2018,2019, were as follows:
| | | Interest Expense and Rates | |
Interest Expense and Rates(4) | | Interest Expense and Rates(4) | |
| | Three Months Ended June 30 | | Nine Months Ended June 30 | | Three Months Ended June 30 | | | Nine Months Ended June 30 | |
| | 2019 | | 2018 | | Percent
Change | | 2019 | | 2018 | | Percent
Change | | 2020 | | 2019 | | Percent
Change | | 2020 | | 2019 | | Percent
Change | |
Interest expense(1) | $ | 300 |
| | $ | 306 |
| | (2.0 | )% | | $ | 902 |
| | $ | 942 |
| | (4.2 | )% | Interest expense(1) | $ | 283 | | | $ | 300 | | | (5.7) | % | | $ | 859 | | | $ | 902 | | | (4.8) | % | |
| | | | | | | | | | | | | | |
Average blended debt balance(2) | $ | 23,117 |
| | $ | 24,701 |
| | (6.4 | )% | | $ | 23,449 |
| | $ | 25,074 |
| | (6.5 | )% | Average blended debt balance(2) | 22,159 | | | 23,117 | | | (4.1) | % | | 22,079 | | | 23,449 | | | (5.8) | % | |
| | | | | | | | | | | | | | |
Average blended interest rate(3) | 4.94 | % | | 4.74 | % | | 4.2 | % | | 4.90 | % | | 4.81 | % | | 1.9 | % | Average blended interest rate(3) | 4.96 | % | | 4.94 | % | | 0.4 | % | | 5.04 | % | | 4.90 | % | | 2.9 | % | |
Notes
(1) Total interest expense includesIncludes amortization of debt discounts, issuance, and reacquisition costs, net.
(2) Includes average balances of long-term power bonds, debt of variable interest entities ("VIE"),VIE, and discount notes.
(3) Includes interest on long-term power bonds, debt of VIE, and discount notes.
(4) There were no Allowance for Funds Used During Construction amounts for the periods shown above.
Total interest expense decreased $6$17 million for the three months ended June 30, 2019,2020, as compared to the same period of the prior year. This decrease was primarily driven by $13a decrease of $10 million of lower long-term interest expense due to lower average debt balances on long-term debt. Partially offsetting thisand a decrease was an increase of $6$7 million due to higher average rates on long-term debt.as a result of lower short-term rates.
Total interest expense decreased $40$43 million for the nine months ended June 30, 2019,2020, as compared to the same period of the prior year. This decrease was primarily driven by $50a decrease of $33 million of lower long-term interest expense due to lower average debt balances on long-term debt and $2 million of lower long-term interest expense due to lower average rates on long-term debt. Partially offsetting these decreases was an increasea decrease of $10 million inas a result of lower short-term interest due primarily to higher average rates on short-term debt.rates.
Other Income (Expense), Net. During the three months ended June 30, 2019,2020, Other income (expense), net increased $3$2 million primarilyas compared to the same period of the prior year, driven by $2an increase of $7 million ofin Gains on investments primarily related to unrealized gains on the Supplemental Executive Retirement Plan ("SERP") and Deferred Compensation Plan ("DCP") investments and anas a result of higher volatility in the financial markets associated with the COVID-19 pandemic. Partially offsetting this increase was a decrease of $1$4 million related to Interest income primarily as a result of lower interest income during the quarter. rates.
During the nine months ended June 30, 2019,2020, Other income (expense), net increased $18decreased $25 million, primarily driven by $21 million of other income in 2019 related to a deposit liability received by TVA as a down payment on the sale of Bellefonte.Bellefonte Nuclear Plant ("Bellefonte"). The purchaser, Nuclear Development, LLC, failed to fulfill the requirements of the sales contract with respect to obtaining Nuclear Regulatory Commission ("NRC") approval of the transfer of required nuclear licenses and payment of the remainder of the selling price before the November 30, 2018, closing date. See Key InitiativesNote 20 — Contingencies and ChallengesLegal Proceedings —Surplus Property — Bellefonte Legal Proceedings for a discussion of the lawsuit filed by Nuclear Plant for additional details. Partially offsetting this increase was $2 million of unrealized losses on the SERP and DCP investments.Development, LLC.
Liquidity and Capital Resources
Sources of Liquidity
TVA depends on various sources of liquidity to meet cash needs and contingencies. TVA's primary sources of liquidity are cash from operations and proceeds from the issuance of short-term debt in the form of Discount Notes,discount notes, along with periodic issuances of long-term debt. TVA’sTVA's balance of short-term debt typically changes frequently as TVA issues Discount Notesdiscount notes to meet short-term cash needs and pay scheduled maturities of Discount Notesdiscount notes and long-term debt. The periodic amounts of short-term debt issued are determined by near-term expectations for cash receipts, cash expenditures, and funding needs, while seeking to maintain a target range of cash and cash equivalents on hand.
In addition to cash from operations and proceeds from the issuance of short-term and long-term debt, TVA's sources of liquidity include a $150 million credit facility with the United States Department of the Treasury ("U.S. Treasury"), four long-term revolving credit facilities totaling $2.7 billion, and proceeds from other financings. See Note 12 — Debt and Other Obligations —
Credit Facility Agreements. Other financing arrangements may include sales of receivables, loans, and other assets.
The TVA Act authorizes TVA to issue bonds, notes, or other evidences of indebtedness (collectively, "Bonds") in an amount not to exceed $30.0 billion outstanding at any time. Power bondsBonds outstanding, excluding unamortized discounts and premiums and net exchange gains from foreign currency transactions, at June 30, 2019,2020, were $22$20.9 billion (including current maturities). The balance of Bonds outstanding directly affects TVA's capacity to meet operational liquidity needs and to strategically use Bonds to fund certain capital investments as management and the TVA Board may deem desirable. Other options for financing not subject to the limit on Bonds, including lease financings (see Lease Financings below, Note 6 — Leases, and Note 8)9 — Variable Interest Entities), could provide supplementary funding if needed. Currently, TVA believes that it has adequate capability to fund its ongoing operational liquidity needs and make planned capital investments over the next decade through
a combination of Bonds, additional power revenues through power rate increases, cost reductions, or other ways. See Lease Financings below, Note 8,9 — Variable Interest Entities, and Note 12 — Debt and Other Obligations for additional information.
TVA may from time to time seek to retire or purchase its outstanding debt through cash purchases and/or exchanges for securities, in open market purchases, privately negotiated transactions, or otherwise. Such repurchases or exchanges, if any, will depend on prevailing market conditions, TVA’sTVA's liquidity requirements, contractual restrictions, and other factors. The amounts involved may be material.
Due to higher volatility in the financial markets associated with the COVID-19 pandemic, TVA increased its target balance of Cash and cash equivalents beginning in March 2020 by $500 million through discount note issuances. TVA has maintained continued debt market access since the outbreak of the pandemic. TVA successfully funded the maturity of $1.0 billion of power bonds in March 2020 with cash from operations and proceeds from the issuance of discount notes. TVA's next material power bond maturity of $1.5 billion is in February 2021. In May 2020, TVA issued $1.0 billion of power bonds to take advantage of the historically low interest rate environment and to meet its ongoing funding needs.
In response to the COVID-19 pandemic, the TVA Board approved the Public Power Support and Stabilization Program, which includes alternative wholesale payment arrangements for LPCs, on March 25, 2020. Under these arrangements, TVA is offering up to $1.0 billion of credit support to LPCs, that demonstrate the need for temporary financial relief, through the deferral of a portion of LPCs' wholesale power payments owed to TVA. The program, which began in April 2020, requires LPCs to apply monthly and is subject to approval by TVA. If approved, TVA will establish a repayment schedule based on the LPC's need, not to exceed two years, and an initial repayment date will be approved by TVA no later than December 31, 2020. As of August 3, 2020, $1 million of credit support has been approved under the Public Power Support and Stabilization Program. These actions continue to show TVA's commitment to support the financial integrity of LPCs during challenging economic conditions caused by the COVID-19 pandemic.
Debt Securities. TVA's Bonds are not obligations of the United States,U.S., and the United StatesU.S. does not guarantee the payments of principal or interest on Bonds. TVA's Bonds consist of power bonds and discount notes. Power bonds have maturities of between one and 50 years. At June 30, 2019,2020, the average maturity of long-term power bonds was 16.3615.46 years, and the average interest rate was 4.654.57 percent. Discount notes have maturities of less than one year. Power bonds and discount notes have a first priority and equal claim of payment out of net power proceeds. Net power proceeds are defined as the remainder of TVA's gross power revenues after deducting the costs of operating, maintaining, and administering its power properties and payments to states and counties in lieu of taxes, but before deducting depreciation accruals or other charges representing the amortization of capital expenditures, plus the net proceeds from the sale or other disposition of any power facility or interest therein. In addition to power bonds and discount notes, TVA had long-term debt associated with certain VIEs outstanding at June 30, 2019.2020. During the third quarter of 2020, TVA also hadmade the final payment on the secured notes outstanding at June 30, 2019, that were assumed in a prior year asset acquisition. Therefore, TVA had no secured notes outstanding at June 30, 2020. See Lease Financings below, Note 8,9 — Variable Interest Entities, and Note 12 — Debt and Other Obligations for additional information.
The following table provides additional information regarding TVA's short-term borrowings:
| | | | | | | | | | | | | | | | | | | | | | | | | | | | | | | | | |
| Short-Term Borrowing Table | | | | | | | | | | | |
| | At June 30, 2020 | | Three Months Ended June 30, 2020 | | Nine Months Ended June 30, 2020 | | At June 30, 2019 | | Three Months Ended June 30, 2019 | Nine Months Ended June 30, 2019 | |
| Gross Amount Outstanding (at End of Period) or Average Gross Amount Outstanding (During Period) | | | | | | | | | | | |
| Discount Notes | $ | 777 | | | $ | 1,152 | | | $ | 909 | | | $ | 1,445 | | | $ | 1,475 | | $ | 1,783 | | |
| Maximum Month-End Gross Amount Outstanding (During Period) | | | | | | | | | | | |
| Discount Notes | N/A | | $ | 1,800 | | | $ | 1,875 | | | N/A | | $ | 1,622 | | $ | 2,390 | | |
| Weighted Average Interest Rate | | | | | | | | | | | |
| Discount Notes | 0.11 | % | | 0.19 | % | | 0.90 | % | | 2.25 | % | | 2.41 | % | 2.35 | % | |
|
| | | | | | | | | | | | | | | | | | | | | | |
| Short-Term Borrowing Table |
| | At
June 30,
2019 | | Three
Months
Ended
June 30,
2019 | | Nine Months Ended
June 30, 2019 | | At
June 30,
2018 | | Three
Months
Ended
June 30,
2018 | Nine Months Ended
June 30, 2018 |
| Gross Amount Outstanding (at End of Period) or Average Gross Amount Outstanding (During Period) | | | | | | | | | | |
| Discount Notes | $ | 1,445 |
| | $ | 1,475 |
| | $ | 1,783 |
| | $ | 1,887 |
| | $ | 1,990 |
| $ | 2,079 |
|
| Weighted Average Interest Rate | | | | | | | | | | |
| Discount Notes | 2.248 | % | | 2.410 | % | | 2.350 | % | | 1.863 | % | | 1.760 | % | 1.400 | % |
| Maximum Month-End Gross Amount Outstanding (During Period) | | | | | | | | | | |
| Discount Notes | N/A |
| | $ | 1,622 |
| | $ | 2,390 |
| | N/A |
| | $ | 2,144 |
| $ | 2,722 |
|
Lease Financings. TVA has entered into certain leasing transactions with special purpose entities ("SPEs") to obtain third-party financing for its facilities. These SPEs are sometimes identified as VIEs of which TVA is determined to be the primary beneficiary. TVA is required to account for these VIEs on a consolidated basis. See Note 89 — Variable Interest Entities and Note 12— Debt and Other Obligations for information about TVA's lease financing activities. During 2017 and 2016, TVA acquired 100 percent of the equity interests in certain SPEs created for the purpose of facilitating lease financing. TVA may seek to enter into similar arrangements in the future. In March 2019, TVA made final rent payments under lease/leaseback transactions involving eight CTs, and in July 2019, these transactions were terminated. In May 2020, TVA made final rent payments under lease/leaseback transactions involving eight additional CTs.
Summary Cash Flows
A major source of TVA's liquidity is operating cash flows resulting from the generation and sale of electricity. Cash, cash equivalents, and restricted cash were $823 million at June 30, 2020, compared to $323 million at June 30, 2019, compared to $312 million at June 30, 2018.2019. A summary of cash flow components for the nine months ended June 30, 20192020 and 2018,2019, follows:
Cash provided by (used in):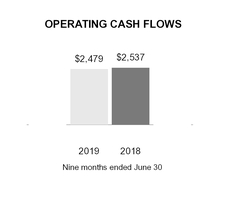
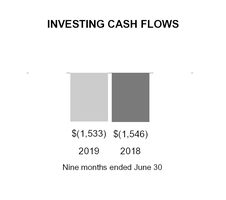
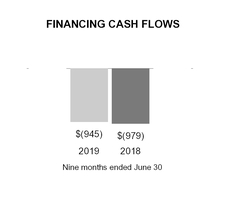
Operating Activities. TVA’sTVA's cash flows from operations are primarily driven by sales of electricity, fuel expense, and operating and maintenance expense. The timing and level of cash flows from operations can be affected by the weather, changes in working capital, commodity price fluctuations, outages, and other project expenses.
Net cash flows provided by operating activities decreased $58increased $17 million for the nine months ended June 30, 2019,2020, as compared to the same period of the prior year, primarily driven by timingyear. The increase was due to lower fuel and purchased power payments as a result of lower natural gas prices and decreased demand from the COVID-19 pandemic and overall milder weather. Lower interest payments and increased cash used for fuel inventory purchases and outage costs.also contributed to the increase. These changesincreases were partially offset by the timing oflower revenue collections increased base revenuedue to decreased sales of electricity driven predominately by overall milder weather and the base rate adjustment that becameCOVID-19 pandemic, in addition to lower effective October 1, 2018, and lower interest paid.rates as a result of the long-term partnership credits for LPCs.
Investing Activities. The majority of TVA’sTVA's investing cash flows are due to investments to acquire, upgrade, or maintain generating and transmission assets, including environmental projects and the purchase of nuclear fuel.
Net cash flows used in investing activities decreased $13$66 million for the nine months ended June 30, 2019,2020, as compared to the same period of the prior year driven by the completion of the Allen Combined Cycle Plant, clean air controls projects at Gallatin Fossil Plant ("Gallatin") and Shawnee Fossil Plant ("Shawnee"), and the manufacturing of the Watts Bar Nuclear Plant ("Watts Bar") steam generatorBrowns Ferry extended power uprate in the prior year. These decreases wereThis decrease was partially offset by an increase in expenditures for the Boone Dam and Pickwick South Embankment remediation projects.Remediation projects and increases in nuclear fuel expenditures. Nuclear fuel expenditures vary depending on the number of outages and the prices and timing of purchases of uranium and enrichment services.
Financing Activities. TVA’sTVA's cash flows provided by or used in financing activities are primarily driven by the timing and level of cash flows provided by operating activities, cash flows used in investing activities, and net issuance and redemption of debt instruments to maintain a strategic balance of cash on hand.
Net cash flows used in financing activities decreased $34$417 million for the nine months ended June 30, 2019,2020, as compared to
the same period of the prior year primarily attributabledriven by the increase in net debt issuances to decreased long-term debt redemptions resulting from higher operating cash flows and a $1.0 billionfund power bond issuancematurities and to increase the Cash and cash equivalents target balance by $500 million due to higher volatility in the prior year, partially offsetfinancial markets
associated with the COVID-19 pandemic.
As a result of certain commercial and industrial customers curtailing operations in response to the COVID-19 pandemic, TVA experienced decreases in base revenue. TVA estimates base revenues were reduced by increased short-term debt net issuancesapproximately $130 million for the nine months ended June 30, 2020 due to the impacts of COVID-19, and based on current estimates, TVA anticipates base revenue could be up to $100 million lower than plan for the fourth quarter of 2020. It is uncertain at this time the extent to which TVA's revenues may be impacted beyond 2020. Due to expected reductions in revenue associated with the current year.COVID-19 pandemic, TVA is implementing various cost savings initiatives such as deferring and prioritizing certain capital projects, and decreasing discretionary spending. TVA may also experience an increase in interest cost, fuel cost, and other additional operating costs. The ultimate impact of the COVID-19 pandemic on TVA's financial condition depends on factors beyond TVA’s financing activities reflect an overall reduction in debt driven by strong financial performanceknowledge or control, including the duration and executionseverity of long-range financial plansthis outbreak, actions taken to reduce debtcontain its spread and keep TVA’s electric rates competitive.mitigate its effects, and broader impacts of the COVID-19 pandemic on the country and region’s economy.
Contractual Obligations
TVA has obligations and commitments to make future payments under certain contracts. As a resultDuring the nine months ended June 30, 2020, there were no material changes in TVA's contractual obligations outside of the subsequent decision in TVA's favor by the Sixth Circuit, as well as the June 2019 consent decree filed in the case brought by TDEC, amounts previously recorded as Other long-term liabilities on an undiscounted basis have been reversed and an Asset retirement obligation in the amountordinary course of $667 million has been recorded for the discounted cash flows expected for the closure and post-closure activities related to Gallatin CCR facilities. See Note 9 and Note 11.business. TVA's contractual obligations are discussed in Item 7, Management's Discussion and Analysis of Financial Condition and Results of Operations — Liquidity and Capital Resources and Note 21 — Benefit Plans of the Notes to Consolidated Financial Statements in the Annual Report.
Key Initiatives and Challenges
Coronavirus Pandemic
In December 2019, a novel strain of coronavirus was reported in China. As this strain continued to spread across the globe, the World Health Organization declared the outbreak of the 2019 novel coronavirus a pandemic on March 11, 2020. TVA has performed risk analyses across the company to determine potential impacts and monitor performance throughout the situation and has implemented a company-wide pandemic plan to address specific aspects of the COVID-19 pandemic. TVA’s pandemic plan continues to evolve based on medical guidance and federal, regional, and local guidelines. Based on ongoing monitoring, COVID-19 continues to pose a significant risk in the U.S. and in the Tennessee Valley region, and as a result TVA has extended the timeframe for workforce reintegration and continues to limit non-essential travel. Mandatory telework has been implemented for those employees who do not have to be physically present at a TVA facility or office building to provide mission-essential activities or produce safe, reliable power. TVA continues to implement strong physical and cybersecurity measures to ensure that systems remain functional to keep employees, customers, and communities safe and enable TVA to continue achieving its mission to serve the people of the Valley.
Certain TVA recreation areas including TVA campgrounds, day use areas, trails, and undeveloped lands have reopened since TVA had initially closed them to slow the spread of the virus. However, for public and staff safety, areas of routine gatherings remain closed at TVA's developed recreation areas. These changes will continue until it is safe to resume full operations.
In addition to measures to protect its workforce, stakeholders, and critical operations, TVA is actively monitoring generation, transmission, and distribution functions. Operations and delivery of energy to customers have not been materially impacted. Certain commercial and industrial customers have curtailed operations in response to COVID-19 pandemic social distancing standards and economic uncertainty. Therefore, TVA is experiencing decreased energy demand in those sectors. Due to reductions in TVA's revenue through June 30, 2020 and anticipated reductions for the remainder of 2020 associated with this decreased energy demand, TVA is implementing various cost savings initiatives such as deferring and prioritizing certain capital projects, and decreasing discretionary spending.
For the nine months ended June 30, 2020, TVA estimates base revenues were reduced by approximately $130 million due to the impacts of COVID-19. In an effort to estimate the impact of the COVID-19 pandemic on its operations, TVA has developed internal forecasts based on a range of external data sources. The model inputs include external projections of gross domestic and gross regional products, unemployment rates, pandemic duration, business and social responses to the disease, and other factors to forecast the impact on TVA's load demand and revenues. Based on current estimates, TVA anticipates base revenue could be up to $100 million lower than plan for the fourth quarter of 2020 due to the impacts of COVID-19. However, each of these factors and their impacts are constantly changing as the pandemic situation and its economic impacts evolve and projections are refined. As such, TVA’s estimate of the impact to its financial position, results of operations, and cash flows will be evolving over the remainder of the year and could differ materially from forecasts. It is uncertain at this time the extent to which TVA's revenues may be impacted beyond 2020.
TVA is also assessing potential supplier performance risks, including procurement of fuel, parts, and services. If suppliers are unable to perform under TVA's existing contracts or if TVA is unable to obtain similar services from other vendors, TVA could experience delays, disruptions, additional costs, or other operational outcomes that may impact generation, maintenance, and capital programs. TVA continues to monitor the situation and remain in contact with suppliers to identify potential risks. At this time, TVA has experienced minimal impacts due to force majeure events, with the exception of a manufacturing delay for a major turbine component. TVA and the vendor have developed a mitigation strategy to reduce projected delays and impacts to TVA's outage schedule.
The COVID-19 pandemic has created economic uncertainty for TVA’s LPCs and the communities they serve. To support LPCs and strengthen the public power response to the COVID-19 pandemic, TVA announced initiatives to enable and support LPCs in taking timely, local action. TVA first provided regulatory flexibility for LPCs to halt disconnection of services and respond to the local needs of their customers and communities. On March 25, 2020, the TVA Board approved the Public Power Support and Stabilization Program, which includes alternative wholesale payment arrangements for LPCs. TVA is offering up to $1.0 billion of credit support to LPCs that demonstrate the need for temporary financial relief, through the deferral of a portion of LPCs' wholesale power payments owed to TVA. The program requires LPCs to apply for the deferral, which is subject to approval by TVA. If approved, TVA will establish a repayment schedule based on the LPC’s need, not to exceed two years, and an initial repayment date will be approved by TVA no later than December 31, 2020. As of August 3, 2020, $1 million of credit
support has been approved under the Public Power Support and Stabilization Program. Additionally, TVA created the Back-to-Business credit program that will enable TVA and LPCs to provide relief to certain large customers affected by the COVID-19 pandemic by providing certain credits when returning to operations. As of June 30, 2020, TVA has provided over $4 million in Back-to-Business credits under this program. TVA is also partnering with LPCs through the Community Care Fund by providing over $2 million in matching funds to support local initiatives that address hardships created by the COVID-19 pandemic. Approximately $2 million in matching funds has been provided as of June 30, 2020. These actions continue to show TVA's commitment to support the financial integrity of LPCs along with communities and customers across the Tennessee Valley during these challenging economic conditions caused by the COVID-19 pandemic.
The COVID-19 pandemic is a rapidly evolving situation that may lead to extended disruption of economic activity and an adverse impact on TVA's results of operations. TVA is closely monitoring developments and will continue adjusting its response as necessary to ensure reliable service while protecting the safety and health of its workforce. Despite TVA’s efforts to manage the effects of the COVID-19 pandemic, their ultimate impact also depends on factors beyond TVA’s knowledge or control, including the duration and severity of this outbreak, actions taken to contain its spread and mitigate its effects, and broader impacts of the COVID-19 pandemic on the country and region’s economy.
Distributed Energy Resources
Consumer desire for energy choice, among other things, is driving the expectation for flexible options in the electric industry. TVA and LPCs are working together to leverage the strengths of the Tennessee Valley public power model to provide distributed energy solutions that are economic,economical, sustainable, and flexible. TVA will focus on the safety and reliability impacts of these resources as they are interconnected to the grid and will ensure that the pricing of electricity remains as low as feasible. Additional regulatory considerations and analysis may be required as the DER market, technologies, and programs evolve. TVA is working to develop pricing and regulatory structures with a deliberate and thoughtful analysis of each current and future program offering. This requires strong partnerships with LPCs to give customers choices and provide end-use consumers the flexibility they desire.
In May 2017, the TVA Board authorized up to $300 million to be spent over the next 10 years, subject to annual budget availability and necessary environmental reviews, to build an enhanced fiber optic network by adding up to 3,500 additional miles that will better connect itsTVA's operational assets. Fiber is a vital part of TVA’sTVA's modern communication infrastructure. The new fiber optic lines will improve the reliability and resiliency of the generation and transmission system while enabling the system to better accommodate DER as they enter the market. As of June 30, 2019, TVA had installed 433 miles of fiber. As of June 30, 2019,2020, TVA had spent $62$110 million on installation of the fiber optic lines and expects to spend an additional $238$190 million to complete the project.
Changing Customer Preferences
As more consumers and businesses are demanding cleaner and greener energy, the utility industry is evolving to meet those needs. As TVA also evolves, it will see impacts to the way it does business through the pricing of products, transmission of energy, and development of new products and services for its customers in support of changing customer preferences and its economic development efforts. End-use customers are becoming more technologically sophisticated and want greater control over their energy usage. Many companies are focusing more on sustainability and requiring more energy efficiency as well as cleaner, greener,and renewable energy options. The continuing challenge for TVA and others is finding ways to meet the needs and preferences of customers while successfully developing flexible pricing models to accommodate the evolving markets.
Low-Income Energy Efficiency Program. Through the Home Uplift Program, TVA is partnering with LPCs, state and local governments, non-profit agencies, energy efficiency advocates, and the Tennessee Valley Public Power Association to complete home evaluations and make high-impact home energy upgrades for qualifying homeowners. In addition, TVA and LPCs conduct workshops to educate homeowners about low and no-cost energy efficiency upgrades that improve their quality of life.
Renewable Power Purchase Agreements. In order to meet customer preferences and requirements for cleaner and greener energy, TVA has entered into certain power purchase agreements (“PPAs”("PPAs") with renewable resource providers during 2019. These agreements are the latest to stem from TVA’sTVA's 2017 request for proposals for renewable energy. During the first quarter ofIn 2019, TVA signed four solar PPAs for 674 MWmegawatts ("MW") of solar generation at sites in Tennessee and Alabama. TheseThree of these four solar projects are expected to come online in 2021. One of the PPA counterparties has not fully complied with the terms of its PPA. TVA is currently evaluating potential options and remedies available under the terms of the PPA. During 2020, as a result of TVA’s 2019 request for proposals for renewable energy, TVA signed six additional PPAs for 661 MW of solar generation with 50 MW of battery storage expected to come online in 2022. Due to transmission issues for one of the projects, the 661 MW will be decreased to 651 MW. TVA will procure the renewable energy and sell the resulting Renewable Energy Certificates to specific customers, allowing TVA to increase its renewable energy portfolio without additional costs to other Tennessee Valley customers. These agreements are part of progressive partnerships thathelp to align the core values of TVA and the public power model with the desire of TVA's customers for renewable energy.
Further, TVA issued another request for proposal during the second quarter of 2020 for up to 200 MW of new renewable energy. The ultimate volume contracted will align to TVA customers' demand for renewable energy, allowing TVA to increase its
renewable energy portfolio without additional costs to other Tennessee Valley customers. TVA anticipates making selections in CY 2020.
Renewable Power Solutions. During its February 2019 meeting, the TVA Board approved new renewable power solutions, including a utility-scale option and a mid-scale option, that better equip TVA and LPCs with the flexibility to meet changing end-use customer needs. The utility-scale option, referenced at the February 2019 TVA Board meeting as the Flexibility Renewable Option, is implemented by a Renewable Investment Agreement (“RIA”), which aggregates demand through a competitive procurement process.process, is implemented by a renewable investment agreement through TVA's Green Invest Program. TVA may also construct its own renewable facilities to meet these needs. The mid-scale option, also known as the Flexibility Research Project, is a joint project with
LPCs to enable solutions for situations where the end-use consumer needs onsite renewable or distributed generation while gaininggeneration. This project will allow TVA to gain market knowledge and operational insights from these research projects. insights.
In addition, Energy Exchange Market
TVA issuedand other utilities across the southeastern United States are exploring the creation of a request for proposal in April 2019 for upnew automated energy exchange across the region, to 200 MWfacilitate more immediate and short-term power exchanges. The creation of new renewable energy. The ultimate volume contracted will align to TVA customers' demand for renewablethis energy allowing TVA to increase its renewable energy portfolio without additional costs to other Valley customers. TVA accepted proposals through mid-May 2019 and anticipates making selections in October 2019.
Integrated Resource Planning
During 2018 and 2019, TVA conducted a study of its energy resources in order to update and replace the IRP that was accepted by the TVA Board in 2015. The IRP is a comprehensive study that provides direction on how to best meet future power demand by identifying the need for generating capacity, determining the best mix of resources, and evaluating the evolving role of DER. The IRP considers many viewsexchange market would require approval of the futureFederal Energy Regulatory Commission, which regulates power transfers by jurisdictional public utilities. These discussions demonstrate TVA’s commitment to determine how TVA can continue to provide low-cost, reliable electricity, support environmental stewardship,maintaining and spur economic developmentimproving reliability in the Tennessee Valley over the next 20 years. To inform TVA's next long-term financial plan and proactively address the changing utility marketplace, TVA began this work sooner than originally planned.
To ensure TVA best meets projected future needs, TVA will continue its tradition of innovation in each IRP. The 2011 IRP focused on diversifying and modernizing its generation portfolio, part of which included adding cost-effective renewables. The 2015 IRP identified DER as a growing trend in the utility industry and designed a mechanism where energy efficiency could be chosen as a resource. The 2019 IRP explored various DER scenarios, considering the speed and amount of DER penetration, and improved TVA's understanding of the impact and benefit of system flexibility with increasing renewable and distributed resources.least-cost manner.
During the IRP process, TVA - with significant input from stakeholders and the public - considered a wide range of future scenarios, various business strategies, and a diverse mix of power-generation resources to build on TVA’s existing asset portfolio. IRP study results show:
There is a need for new capacity in all scenarios to replace expiring or retiring capacity.
Solar expansion plays a substantial role in all futures.
Gas, storage, and demand response additions provide reliability and/or flexibility.
No baseload resources (designed to operate around the clock) are added, highlighting the need for operational flexibility in the resource portfolio.
Additional coal retirements occur in certain futures.
Energy efficiency levels depend on market depth and cost-competitiveness.
Wind could play a role if it becomes cost-competitive.
In all cases, TVA will continue to provide for economic growth in the Tennessee Valley.
The IRP was developed with input from the public and contributions from a working group of stakeholders from local power companies, environmental organizations, and other public and private entities with a vested interest, including an extensive public outreach that included a series of open meetings around the Tennessee Valley. The final 2019 IRP will be presented to the TVA Board for consideration at its August 2019 meeting.
Natural Resource Plan
In May 2020, the TVA is updating itsBoard of Directors approved changes to TVA’s Natural Resource Plan ("NRP"), which was completed in 2011 to guide TVA’s management of the public landssupport a more strategic, flexible, and waters within its seven-state service area. TVA remains committed to a balancedcomprehensive management approach to TVA’s natural and is considering changescultural resource stewardship work. TVA published its Record of Decision to the NRP that include objectives and programs for each focus area and a flexible approach for long-term planning. These changes aligncomplete its environmental review process in July 2020. The updated plan enhances alignment with TVA’s mission through economic development, energy, and will helpenvironmental stewardship, and guides business planning. In the newly published NRP, TVA beexpanded from six resource areas to ten focus areas, ensuring the NRP provides a more comprehensive view of resource stewardship efforts.
Strategic Financial Plan
In 2019, the TVA Board approved an annual budget that reflects the first year of a new Strategic Financial Plan. The Strategic Financial Plan, which extends from 2020 through 2030, is flexible in aligning customer preferences and TVA's mission while at the same time establishing a long-term forecast of financial results. Key focus areas of the Strategic Financial Plan include maintaining rates as low as feasible, establishing better equippedalignment between the length of LPC contracts and TVA's long-term commitments, stabilizing debt in an $18.0 billion to prioritize funding plans$20.0 billion range, assuming 100 percent long-term partner participation, maintaining a cash balance of $300 million, and create efficienciespursuing operational efficiencies. As TVA executes the plan, key assumptions and performance may change estimated debt and cash balances. Due to higher volatility in business planningthe financial markets associated with the COVID-19 pandemic, TVA increased its target balance of Cash and stewardship project implementation. TVA released the draft NRP and the associated Supplemental Environmental Impact Statement ("SEIS")cash equivalents beginning in May 2019 for public review and comment. During June 2019, TVA hosted public meetings around the Valley and is currently evaluating comments received. The final SEIS and updated NRP are expected to be published in early 2020.March 2020 by $500 million through discount note issuances.
Generation Resources
Extreme Flooding Preparedness. Updates to the TVA analytical hydrology model completed in 2009 indicated that under "probable maximum flood" conditions, some of TVA's dams might not have been capable of regulating the higher flood waters. A "probable maximum flood" is an extremely unlikely event; however, TVA is obligated to provide protection for its nuclear plants against such events. As a result, TVA installed a series of modifications at four dams.
Since 2009, TVA has performed further hydrology modeling of portions of the TVA watershed using updated modeling tools. The revised hydrology models were reviewed and approved by the NRC for Watts Bar Units 1 and 2. However, TVA identified an error in the modeling that will require the models for Watts Bar Units 1 and 2 to be resubmitted. TVA plans to
resubmit models for Watts Bar Units 1 and 2 during 2019.by the end of 2020. In addition, TVA plans to submitsubmitted models for Sequoyah Nuclear Plant ("Sequoyah") Units 1 and 2 in 2019.on January 14, 2020. TVA will subsequently address conditions at Browns Ferry as needed. TVA is deferring the decision on the need for additional modifications until after the modeling work is complete.
As of June 30, 20192020, TVA had spent $153 million on the modifications and improvements related to extreme flooding preparedness and expects to spend up to an additional $27$28 million to complete the modifications.
NRC Seismic Assessments. On May 9,In 2014, the NRC notified licensees of nuclear power reactors in the central and eastern U.S. of the results of seismic hazard screening and prioritization evaluations performed by unit owners and reviewed by the NRC staff. Because the seismic hazards for Browns Ferry, Sequoyah, and Watts Bar had increases in seismic parameters beyond the technical information available when the plants were designed and licensed, TVA must conduct seismic risk evaluations for these plants. TVA completed the risk evaluation for Watts Bar and submitted it to the NRC on June 30,in 2017; the evaluation concluded that no additional actions were required. The NRC completed its review of the Watts Bar evaluation in July 2018 and concluded that no further response or regulatory actions were required. The evaluationsevaluation for Sequoyah was submitted on October 18, 2019, and the
evaluation for Browns Ferry and Sequoyah are duewas submitted on December 17, 2019. TVA anticipates the NRC will complete its review by December 31, 2019.the end of 2020.
Mitigation of Beyond-Design-Basis Events. NRC rulemaking has been developed to codify the requirements promulgated by orders related to beyond-design-basis flooding and seismic events discussed above. The NRC staff submitted the draft final rule — Mitigation of Beyond-Design-Basis Events — to the NRC Commission on December 15, 2016, requesting approval to publish the final rule. The NRC Commissioners affirmed their final votes on the proposed rule in January 2019. The approved final rule language deleted several items that were included in the proposed rule language, resulting in minimal changes between the orders and the final rule. The final rule is expected to be published for implementation in 2019. Once issued, TVA will review the final rule in 2019. TVA plans to identify anyimplement requirements for Sequoyah and Watts Bar by 2022 and for Browns Ferry by 2023. A gap review of the revised rule has been performed, and no new gaps to compliance. Gaps could result in TVA havingcompliance were identified. Actions to make modifications to one or more of its nuclear plants. Cost estimates for any required modifications cannot be developed until after the rule is finalized, but costs for modifications could be substantial.complete flood and seismic assessments are still ongoing. See Extreme Flooding Preparedness and NRC Seismic Assessments above.
Baffle-Former Bolt Degradation. In July 2016, Westinghouse Electric Co., LLC ("Westinghouse") issued a Nuclear Safety Advisory Letter ("NSAL") 16-01 that addressed recently identified degradation of baffle-former bolts in some U.S. pressurized water reactors ("PWRs"). Baffle-former bolts help hold together a structure inside certain reactor vessels. Sequoyah Units 1 and 2, both PWRs, are referenced in the NSAL. Visual inspections of baffle-former bolts in Sequoyah Units 1 and 2 during 2017 refueling outages showed no degradation of baffle-former bolts. TVA completed ultrasonic testing for Unit 1 in the third quarter of 2018 and Unit 2 in the first quarter of 2019. Results for both units were within acceptable standards. Retesting will not be required until 2028.
Work Environment at Nuclear Plants. In March 2016, the NRC issued a Chilling Effect Letter ("CEL") to TVA regarding work environment concerns identified at Watts Bar. In June 2018, the NRC conducted a follow-up inspection at Watts Bar and noted some improvement. In the mid-cycle assessment letter issued in June 2018, the NRC issued a Cross Cutting Issue ("CCI") in safety conscious work environment ("CCI") and outlined the closure criteria for both the CEL and the CCI. In August 2018,October 2019, TVA informed the NRC documented a chilled work environment in an additional department. TVA is working to implement actions to address the issues in the additional departmentof its CEL and CCI closure criteria readiness, and the NRC completed its inspection, resulting in no findings with progress noted as documented in its December 2019 inspection report. In March 2020, the NRC issued its Annual Assessment Letter for Watts Bar noting TVA’s progress in addressing the CEL and CCI while stating that the NRC continues to monitor TVA’s activities as they deliberate on the appropriate time to close the CEL and CCI.
Apparent Violations of NRC Regulations. On March 2, 2020, the NRC issued a letter to TVA identifying four apparent violations of NRC regulations that prohibit licensees from retaliating against employees for their having raised protected nuclear safety concerns. On March 9, 2020, the NRC issued a letter to TVA identifying twelve apparent violations of NRC regulations: six relating to operational activities and six relating to NRC regulations governing the completeness and accuracy of information. TVA is evaluating these matters in accordance with its processes and has discussed these matters with the NRC at pre-decision enforcement conferences. Although TVA cannot predict the final outcome of these matters, it is probable that the NRC may direct TVA to change certain aspects of its operations and/or impose civil penalties on TVA. TVA does not expect any such penalties to have a material adverse impact on its results of operations or financial condition.
Tritium-Producing Burnable Absorber Rods. TVA was a cooperating agency in the February 2016 Department of Energy ("DOE") Final SEIS for the Production of Tritium in a Commercial Light Water Reactor. On April 5,In 2017, due to an anticipated need for more tritium-producing burnable absorber rods ("TPBARs"), the DOE announced its preferred alternative for irradiation services, which included use of an additional reactor. As a result of TVA’sTVA's assessment and concurrence with the DOE’sDOE's alternative, TVA submitted a license amendment request to the NRC in December 2017 to authorize the irradiation of TPBARs in Watts Bar Unit 2. The NRC approved the request on May 22,in 2019. TVA is projecting to begin tritium production in Watts Bar Unit 2 in the fall of 2020.2021. The DOE's decision also allows for irradiation of TPBARs at Sequoyah in the future; however, TVA does not have plans to employ Sequoyah units for tritium production in the near term.
Extended Power Uprate. TVA has undertaken an EPUextended power uprate ("EPU") project at Browns Ferry to increase the amount of electrical generation capacity of its reactors. The license for each reactor was amended to allow reactor operation at the higher power level. The Browns Ferry EPU license amendments were approved by the NRC on August 14,in 2017, following a nearly two-year review.
Unit 3 was completed and synced to the grid in April 2018, reaching the new EPU 100 percent power in July 2018. Unit 1 was completed and synced to the grid in November 2018, reaching the new EPU 100 percent power in January 2019. Unit 2 was completed and synced to the grid in April 2019, reaching the new EPU 100 percent power in June 2019. The project involved extensive engineering analyses and modification and replacement of certain existing plant components to enable the units to produce the additional power requested by the license amendments. The project is estimated toproject's total cost will be approximately $475 million. Physical work on all units was completed in 2019. The generating capacity is expected to increase by an estimated 465 MW afterthat must be validated through operation of all units for four seasons and completion of additional testing. TVA is currently operating and testing the project and sufficient run timeunits through the required period to validatecomplete the newvalidation of the increased generating capacity.
Plant Closures. During its August 2018 meeting, the TVA Board approved a plan to perform assessments of Bull Run and Paradise. These assessments included resiliency studies for fuel and transmission, financial considerations, and Environmental Assessments (“EAs”) pursuant to the National Environmental Policy Act ("NEPA"). Results of these assessments performed at Paradise and Bull Run were presented to the TVA Board at its February 2019 meeting, and themeeting. The TVA Board approved the retirement of Paradise Unit 3 by December 2020 and Bull Run by December 2023. Subsequent to the TVA Board approval, TVA determined that Paradise would not be restarted after January 2020 due to the plant’splant's material condition. Paradise Fossil Plant Unit 3 was taken offline on February 1, 2020, effectively retiring the plant. See Note 5.5 — Plant Closures.
Optimum Energy Portfolio. TVA must continuously evaluate all generating assets to ensure an optimal energy portfolio that provides safe, clean, and reliable power while maintaining flexibility and fiscal responsibility to the people of the Tennessee Valley. During 2019, the TVA Board approved the Integrated Resource Plan, which recommended an action to evaluate the engineering end-of-life of aging fossil units. These assessments consider material condition, plant performance, system flexibility needs, environmental impacts, grid support, and other factors. In addition, TVA will prepare Environmental Assessments ("EAs") pursuant to the National Environmental Policy Act ("NEPA"). TVA is also considering plans for additional generating facilities to replace retiring or expiring capacity and to support a low cost, reliable, flexible, and increasingly clean power system.
Coal Combustion Residual Facilities. Residuals Facilities. TVA has committed to a programmatic approach for the elimination of wet storage of CCRscoal combustion residuals ("CCR") within the TVA service area. Under this program (the “CCR("CCR Conversion Program”Program"), TVA has committed to (1) convertis converting all operational coal-fired plants to dry CCR storage (2) closeand closing all wet storage facilities, and (3) meet all applicable state and federal regulations. To carry out its CCR Conversion Program, TVA is undertaking the following actions:facilities.
Dry generation and dewatering projects. Conversion of coal plant CCR wet processes to dry generation or dewatering is complete at Bull Run, Shawnee, and Kingston Fossil Plant ("Kingston"). Construction at Gallatin Fossil Plant ("Gallatin") was completed during the first quarter of 2020. Construction is underway at Gallatin and Cumberland Fossil Plant ("Cumberland"). and is scheduled for completion in late 2020. Fly ash and gypsum conversion projects at Paradise were complete during the third quarter ofcompleted in 2019.
Landfills. TVA has made strategic decisions to build and maintain lined and permitted dry storage facilities on TVA-owned property at severalsome TVA locations, allowing these facilities to operate beyond existing dry storage capacity. Currently, linedLined and permitted dry storage facilitieslandfills are completed and operational at Bull Run, Kingston, Gallatin, and Gallatin; a lined dry storage facility at Paradise has been constructed but is not yet operational. Construction of a lined dry storage facility at Cumberland is expected to start in 2021. A lined dry storage facilityand permitted landfill at Shawnee is currently under construction with completion scheduled for 2021. Kingston’sSeptember 2020; construction of a lined and permitted lined dry storage expansionlandfill at Cumberland is scheduled for completionexpected to start in 2021.2021; and TVA is designing and permitting a lateral expansion of the existing landfill at Gallatin. TVA is initiating the design and permitting processhas withdrawn its permit applications for a new lined landfill at Bull Run but no decision to construct the facilityand has been madestopped construction of a permitted lined landfill expansion at this time.Kingston until TVA can determine its need for these landfills with certainty. Construction of additional lined facilities may occur to support future business requirements.
Wet CCR impoundment closures. TVA is planningworking to close wet CCR impoundments in accordance with federal and state requirements when (1) coal-fired plants are converted to dry CCR processes and dry storage landfills become operational or (2) the related plant operations cease.requirements. Closure project schedules and costs are driven by the selected closure methodology (such as cap and close in placeclosure-in-place or closureclosure-by-removal). Closure initiation dates are driven by removal).environmental regulations. TVA's predominant closure methodology is cap and close in place,closure-in-place, with exceptions at certain facilities. TVA issued an EISenvironmental impact statement ("EIS") in June 2016 that addresses the closure of CCR impoundments at TVA's coal-fired plants. TVA issued its associated Record of Decision in July 2016. Although the EIS was designed to be programmatic in order to address the mode of impoundment closures, it specifically addressed closure methods at 10 impoundments. TVA subsequently decided to close those impoundments. The method of final closure for each of these facilities will depend on various factors, including the results of studies conducted pursuant to NEPA and approval by appropriate state regulators. Additional site-specific NEPA studies will be conducted as other facilities are designated for closure.
On January 25, 2019, TVA approved a change in the preferred closure method for the Allen West Impoundment from closure-in-place to closure-by-removal. The cost impact of changing the closure method resulted in an increase of approximately $33 million to the non-nuclear asset retirement obligations ("AROs"). The method of final closure for this impoundment will depend on various factors, including the completion of all environmental reviews. See Note 11.11 — Asset Retirement Obligations.
Groundwater monitoring. Compliance with the EPA'sEnvironmental Protection Agency's ("EPA's") CCR rule (the "CCR("CCR Rule") as well as other requirements will require additional engineering and analysis as well as implementation of a comprehensive groundwater monitoring program. As further analyses are performed, including evaluation of monitoring results, there is the potential for additional costs for investigation and/or remediation. TVA expects to continue to evaluate and update these cost estimates.
In compliance with the CCR Rule, TVA published the results of additional groundwater testing at TVA's CCR facilities on March 1, 2019. The results included values above groundwater protection standards for some constituents at several CCR units. Accordingly, TVA will have to cease sending CCR and non-CCR waste streamswastestreams to any impacted unlined CCR surface impoundments as soon as possible but no later than the applicable CCR Rule date. The EPA has published a prepublication copy of a final rule that would change the deadline to cease sending CCR and non-CCR wastestreams to unlined CCR impoundments and to initiate closure or retrofit the units from October 31, 2020 (and potentially earlier due to location demonstration results)April 11, 2021. The rule would also allow for extensions based on meeting certain criteria. TVA evaluated and initiate additional corrective actions for groundwater. TVA is developing these corrective actions and anticipates publishing the relevantpublished Assessment of Corrective Measures reports to its CCR website in August 2019. DueTVA is continuing to location demonstration results,publish periodic reports on additional groundwater testing at its CCR facilities; the latest report was published on February 28, 2020. In addition, TVA has already ceased sending waste streamsbeen and will continue posting semi-annual progress reports on the status of remedy selection.
As of June 30, 2020, TVA had spent approximately $2.0 billion on its CCR Conversion Program. TVA expects to one impoundment at Allen and four impoundments at Gallatin. As required byspend an additional $1.0 billion on the CCR Rule,Conversion Program through 2024. These estimates may change depending on the final closure method selected for each facility. Once the CCR Conversion Program is completed, TVA will continue to publish reports in the second quarter of each year on annual groundwater monitoringundertake certain CCR projects, including building new landfill cells under existing permits and corrective actions at its active CCR facilities.closing existing cells once they reach capacity.
TVA iswas involved in two lawsuits relating to alleged releases of waste materials fromconcerning the CCR facilities at Gallatin. The parties in oneOne of these cases was resolved by the cases filedentry of a consent decreeorder that when entered, will resolve this matter. Under the consent decree,became effective July 31, 2019. TVA agreed to close the existing wet ash impoundments by removal, either to an onsite landfill or to an offsite facility. TVA may also submit a plan that allows for beneficial reuse. TVA is currently conducting additional studies and environmental reviews to support its determination of the specific removal plans. See Note 9.11 — Asset Retirement Obligations.
As of June 30, 2019, TVA had spent approximately $1.7 billion onEnvironment and Conservation ("TDEC") released amendments to its regulations which govern solid waste disposal facilities, including TVA's active CCR Conversion Program. TVA expectsfacilities covered by a solid waste disposal permit and those which closed pursuant to spenda TDEC approved closure plan. Such facilities are generally subject to a 30-year post-closure care period during which the owner or operator must undertake certain activities, including monitoring and maintaining the facility. The amendments will, among other things, add an additional $1.4 billion on50-year period after the CCR Conversion Program through 2023. These estimates may change depending onend of the finalpost-closure care period, require TVA to submit recommendations as to what activities must be performed during this 50-year period to protect human health and the environment, and require TVA to submit revised closure method selected for each facility. Once the CCR Conversion Program is completed, TVA will continue to undertake certain CCR projects, including building new landfill cells under existing permits and closing existing cells once they reach capacity.plans every 10 years.
Potential Liability Associated with Workers’Workers' Exposure to CCR Materials. In response to the 2008 ash spill at Kingston, TVA hired Jacobs Engineering Group, Inc. (“Jacobs”("Jacobs") to oversee certain aspects of the cleanup. After the cleanup was completed, Jacobs was sued in the United States District Court for the Eastern District of Tennessee ("Eastern District") by
employees of a contractor involved in the cleanup and family members of some of the employees. The plaintiffs alleged that Jacobs had failed to take or provide proper health precautions and misled workers about the health risks associated with exposure to coal fly ash, which is a CCR material. The plaintiffs alleged that exposure to the fly ash caused a variety of significant health issues and illnesses, including in some cases death. The case was split into two phases, with the first phase considering, among other issues, general causation and the second determining specific causation and damages. On November 7,In 2018, a jury hearing the first phase returned a verdict in favor of the plaintiffs, including determinations that Jacobs failed to adhere to its contract with TVA or the Site Wide Safety and Health Plan in place;Plan; Jacobs failed to provide reasonable care to the plaintiffs; and Jacobs’sJacobs's failures were capable of causing a list of medical conditions, ranging from hypertension to cancer. On January 11,In 2019, the district court referred the parties to mediation. Depending onMediation has concluded, but the outcome of mediation,parties did not resolve the matter. The litigation will proceed to the second phase on the question of whether Jacobs’s failures didnow proceed.
Further in fact cause the plaintiffs’ alleged injuries and damages.
On May 13, 2019, an additional group of contractor employees and family members filed suit against Jacobs in the Circuit Court for Roane County, Tennessee. These plaintiffs have raised similar claims to those being litigated in the case referenced above.
While TVA is not a party to either of these lawsuits, TVA could be contractually obligatedmay potentially have an indemnity obligation to reimburse Jacobs for some amounts that Jacobs is required to pay. Further, TVA will continue monitoring the litigation to determine whether thisthese or similar cases could have broader implications for the utility industry. TVA does not expect any potential liability to have a material adverse impact on its results of operations or financial condition. See Note 20 — Contingencies and Legal Proceedings —Contingencies.
River Management. Rainfall and runoff in the Tennessee Valley duringthrough the third quarter of 20192020 were 126153 percent and 115161 percent of normal, respectively. Above normal rainfall and runoff hashave continued to help TVA meet its river system commitments, including managing minimum river flows for navigation, generating low-cost hydroelectric power, maintaining water quality and water supply, and providing recreational opportunities for the Tennessee Valley. In addition, having cool water available helps TVA to meet thermal compliance and support normal operation of TVA's nuclear and fossil-fueled plants, while oxygenating water helps fish species remain healthy. Rainfall and runoff in the Tennessee Valley throughduring the third quarter of 20192020 were 144128 percent and 163131 percent of normal, respectively.
Small Modular Reactors. In 2015, DOE entered into an Interagency Agreement with TVA submittedto fund 50 percent of site characterization activities and the development of an Early Site Permit Application ("ESPA") for review by the NRC in May 2016. The progress of the NRC’s review of the ESPA is consistent with the NRC’s published schedule.a generic small modular reactor ("SMR"). The ESPA is based on the potential future construction and operation of two or more small modular reactors ("SMRs")SMR units at TVA’sTVA's Clinch River siteSite in Oak Ridge, Tennessee. TVA’sTVA submitted the ESPA is based upon information regardingfor review by the various SMR designs under developmentNRC in 2016. NRC staff concluded their environmental review and issued a final environmental impact statement in April 2019, followed by the U.S. TVAconclusion of the safety review and issuance of a final safety evaluation report in June 2019. The Commission held the statutorily required mandatory hearing for the ESPA in August 2019, and the DOE are working under an interagency agreement to jointly fund licensing activities forpermit was issued by the Clinch River site with DOE reimbursement of up to 50 percent of TVA's eligible costsNRC in December 2019. The permit is valid through 2020.
TVA is developing the Clinch River site at a pace consistent with progress being made by developers on the engineering2039 and licensing of SMR designs. The project hastherefore provides TVA a great deal of flexibility at this early stageto make new nuclear decisions based on energy needs and by workingeconomic factors.
TVA is in the process of evaluating new nuclear technology options and potential deployment scenarios. To assist in the evaluation of SMRs, TVA has entered into memorandums of understanding with Oak Ridge National Laboratory and the University of Tennessee. These partnerships allow for collaboration, exploring highly efficient advanced reactor designs as a next-generation nuclear technology while leveraging advanced modeling and simulation tools to reduce licensing risk, TVA expects to beassist in a position to build an SMR if and when additional power sources are needed.determining the feasibility of SMRs. Any decision to construct an SMR would require approval by the TVA Board.Board and the NRC. As of June 30, 2020, TVA had spent $79 million on work regarding SMRs, including work to complete the ESPA for the Clinch River Site, of which the DOE reimbursed TVA $27 million. Additional expenditures will be determined based on future project development.
Seismic ActivitySystem Operations Center. A new system operations center has been approved for $255 million. The new secured facility is being built to accommodate a new energy management system and to adapt to new regulatory requirements. The facility is expected to be constructed by 2022 and fully operational by 2024. As of June 30, 2020, TVA service area experienced several earthquakes duringhad spent approximately $25 million on the first nine months of 2019. Inspections were completedproject and no impactsexpects to the TVA generating facilities or dams were identified. TVA's generating system continued to operate safely.spend an additional $230 million.
Dam Safety and Remediation Initiatives
Assurance Initiatives. TVA has an established dam safety program, which includes procedures based on the Federal Guidelines for Dam Safety, with the objective of reducing the risk of a dam safety event. The program is comprised of various engineering activities for all of TVA’sTVA's dams including safety reassessments using modern industry criteria and the new probable maximum flood and site-specific seismic load cases. One aspect of the guidelines is that dam structures will be periodically assessed to assure that TVA's dams meet current design criteria. These assessments include material sampling of the dam and foundational structures and detailed engineering analysis. TVA will continue preventative and ongoing maintenance as a part of this safety program.
Boone Dam Remediation. In October 2014,2015, a sinkhole was discovered near the base of the earthen embankment at Boone Dam, and a small amount of water and sediment was found seeping from the river bank below the dam. TVA identified underground pathways contributing to the seepage and prepared a plan to repair the dam, which consists of the construction of a
a composite seepage barrier wall in the dam's earthen embankment. TVA has completed grouting and construction of an upstream and downstream buttress. Installation of the concrete cut-off wall elements is in process.
As design and construction plans are finalized, the estimated cost and duration continue to be refined. As of June 30, 2019,2020, TVA had spent $161$227 million related to this project and expects to spend an additional $295$229 million through 2023. TVA expects the reservoir to return to normal operations in 2022 and is continuing to work with the community to help mitigate local impacts of the extended drawdown.
Pickwick South Embankment Remediation. Reassessments of Pickwick Landing Dam ("Pickwick") found low safety factors for post-earthquake stability indicating that the dam is at significant risk for slope stability failure following a seismic event in portions of the south embankment. Slope stability failure could lead to a breach of the south embankment and loss of the reservoir, resulting in loss of life and damage to property downstream, disruption to navigation, and loss of generation and recreation.
TVA is planning to upgradeupgrading the south embankment by constructing berms on the upstream and downstream slopes. The design phase of the project began during the first quarter ofin 2017 and is now completed. Construction began in the spring of 2019, and the project is currently estimated to be completed in two years, but could take longer depending on successful construction sequencing. As of June 30, 2019,2020, TVA had spent $42$117 million related to this project and expects to spend an additional $106 million.$31 million through 2022.
Surplus PropertyReal Estate Portfolio
TVA continues to study its real estate portfolio for the purpose of aligningand align its real estate holdings with TVA's strategic direction. A comprehensive assessment of its real estate holdingsportfolio has been completed,completed. TVA will continue to develop and TVA is implementingimplement a strategy aimed at reducing cost and right-sizing its portfolio as part of the effort.
Bellefonte Nuclear Plant. On November 14, 2016, following a public auction, TVA entered into a contract to sell substantially all of the Bellefonte site to Nuclear Development, LLC, for $111 million. Nuclear Development, LLC, paid TVA $22 million on November 14, 2016, with the remaining $89 million due at closing. Nuclear Development, LLC, had up to two years from November 14, 2016, to close on the property, and TVA agreed to maintain the site until closing. Nuclear Development, LLC, requested and was granted an extension of the initial closing date to November 30, 2018. Nuclear Development, LLC, failed to obtain NRC approval of the transfer of the Bellefonte nuclear licenses. TVA determined that the Atomic Energy Act required that this approval be obtained before closing. TVA declined to provide a second extension of the purchase agreement. On November 30, 2018, Nuclear Development, LLC, filed suit against TVA in the United States District Court for the Northern District of Alabama. See Note 19 — Legal Proceedings for a discussion of the lawsuit filed by Nuclear Development, LLC.
Knoxville Property. In 2016, TVA completed a comprehensive assessment of its real estate holdings in the Knoxville, Tennessee region including the Knoxville Office Complex ("KOC") and adjacent Summer Place Complex ("SPC"). As a result of this study and a subsequent environmental assessmentEnvironmental Assessment in 2017, TVA is in the process of consolidatinghas consolidated its Knoxville area employees into the West Tower of the KOC or aand the Greenway Drive Transmission Service Center, and is completing the centralized field officeoffices in Norris, Tennessee. As part of this consolidation effort, TVA plans to conveyhas approved the conveyance of the SPC and the East Tower of the KOC.KOC and expects the transaction to close by the end of 2020.
Regulatory Compliance
Steam-Electric Effluent Guidelines. On November 3,In 2015, the EPA published a final rule revising the existing
steam-electric effluent limitation guidelines ("ELGs"). The ELGs update the existing technology-based water discharge limitations for power plants. Compliance with new requirements is required in the 2018-2023 timeframe and will necessitate major upgrades to wastewater treatment systems at all coal-fired plants. Dry fly ash handling is mandated by the rule. The rule also requires either dry bottom ash handling systems or “no discharge”"no discharge" recycle of bottom ash transport waters, and new technology-based limits on flue gas desulfurization ("FGD") (scrubber) wastewater require primary physical/chemical treatment and secondary biological treatment to meet extremely low limits for arsenic, mercury, and selenium.
The EPA published a rule on September 18,in 2017, postponing certain compliance/applicability dates to provide the EPA time to review and revise, as necessary, the 2015 ELGs for FGD wastewater and bottom ash transport water. The EPA delayed the compliance dates for these two waste streams from the 2018-2023 timeframe to 2020-2023. However, the 2018-2023 applicability dates and the accompanying requirements for fly ash transport water, flue gas mercury control wastewater, and gasification wastewater remain unchanged. While the EPA reconsiders the limits for FGD wastewater and bottom ash transport water, states have issued NPDESNational Pollutant Discharge Elimination System ("NPDES") permits for all of TVA's active coal facilities based on the 2015 ELGs, recognizing that the permits may need to be reopened to incorporate modifications to those ELGs. The EPA proposed revised ELGs for bottom ash transport water and FGD wastewater on November 4, 2019.
The primary impact of these proposed regulations for TVA is on the operation of existing coal-fired generation facilities. The proposed revised ELGs could impact long-term investment decisions being made relative to the long-term compliance and operability of these plants. The proposed revisions may require TVA to install additional wastewater treatment systems for FGD wastewater and bottom ash transport water, and TVA could incur substantial costs to comply with the new rule. TVA currently has fourthree plants with wet scrubbers that may be subject to new scrubber-related limits, the largest being Cumberland. With the recent Board approval of accelerated retirement for Bull Run and Paradise, these plants may be exemptedis exempt from the imposition of new scrubber-related limits either as a result of the rule reconsideration currently underway or due to the pending retirement of the unitsplant prior to the regulatory deadline. The proposed revision also includes a subcategory for which Cumberland would qualify that provides TVA greater flexibility in meeting the ELGs. However, given that these are proposed rules, it is workingunclear as to address future compliance with the ELGs at Cumberland given its unique "once-through" scrubber design. Compliance withnature of the current rule at Cumberland withoutfinal impact to TVA.
modification to address the unique design could cause TVA to incur disproportionately high costs at Cumberland or experience other operational outcomes which TVA cannot predict at this time.
Allen Groundwater Investigation. The 2015 EPA CCR Rule required TVA to conduct additional engineering and analysis, as well as implement a comprehensive groundwater monitoring program.program at units subject to the rule. As a result of this groundwater monitoring program, TVA reported to the Tennessee Department of Environment and Conservation ("TDEC")TDEC in May 2017 elevated levels of arsenic, lead, and fluoride in watergroundwater samples taken at a fewcollected from two shallow-aquifer groundwater monitoring wells around the Allen East Impoundment.Ash Disposal Area. TVA, under the oversight of TDEC, has been conductingconducted a remedial investigation into the nature
and extent of the contamination. In July 2017,2018, TVA receivedsubmitted a draft Remedial Site Investigation request fromReport to TDEC outlining the objectives of the investigation and requiring TVA to provide a work plan.
The plan, which was revised after discussions with TDEC and additional investigation. TVA submitted the Final Updated Remedial Investigation Report to TDEC in September 2017, included more extensive groundwater monitoring sampling2019.
The remedial investigation confirmed that the high arsenic, fluoride, and lead concentrations are limited to identifythe shallow alluvial aquifer in the north and south areas of the Allen East Ash Disposal Area. These areas are not adversely impacting the Memphis aquifer, which is the source and extent of the contamination. The plan also included groundwater modeling to determinepublic drinking water supply. All samples taken from the current groundwater flow conditions and likely future conditions that may develop as aMemphis aquifer through TVA production wells were below the EPA drinking water standards. As the result of a pumping cooling water fromtest conducted on TVA production wells at the deeper aquifernearby Allen Combined Cycle Plant ("Allen CC") by the United States Geological Survey and the University of Memphis, TVA is committed to the Allen CC, including a pump test involving the cooling water withdrawal wells. While evaluation continues, TVA has suspended plans to obtain cooling water from the deeper aquifer.not operating these production wells until additional data supports safe use. TVA constructed water tanks on site and is purchasing cooling water from the LPC, Memphis Light, Gas and Water Division.Water. The use of water tanks rather than the wells may impose some operational restrictions on the Allen CC due to the lower availability of cooling water.
TVA is continuing to work with TDEC on the remedial investigation. On March 14, 2019, TDEC approved TVA’s interim groundwaterTVA's Remedial Investigation/Interim Response Action Groundwater Monitoring Plan in 2019. The plan will be reviewed and modified annually as required to support project needs. The 2020 Remedial Investigation/Interim Response Action Groundwater Monitoring Plan has been sent to TDEC. TVA sampled the monitoring plan. Approval of this plan allowswells around the Allen East Ash Disposal Area quarterly throughout CY 2019. TVA prepared a memorandum following each sampling event, and has issued an annual report that has been submitted to proceed with the next steps of the investigation and interim response action, including the installation of new groundwater monitoring wells.TDEC. TVA is currently in the final design stageprocess of finalizing the interim response action which is expected to befor a groundwater extraction system to control and begin treating the shallow groundwater that contains elevated concentrations of arsenic. TVA also plans to beginbegan dewatering the Allen East Impoundment in AugustSeptember 2019.
TVA is preparinghas evaluated closure options for the Allen East Ash Disposal Area, as well as the nearby West Ash Impoundment, through an Environmental Impact StatementEIS pursuant to address the potential environmental effects associated with the future management of CCR material at Allen.NEPA. In March 2019, TVA released its public scoping report, which eliminated closure-in-place as a reasonablean alternative. TVA published the final EIS on March 13, 2020 and its Record of Decision on April 14, 2020, which documents the final decision regarding the closure method for the CCR units at the Allen Fossil Plant. TVA has decided to remove CCR from the above identified areas to an existing permitted offsite landfill.
Federal Contracting and Hiring Practices. On August 3, 2020, President Trump issued an "Executive Order ("EO") on Aligning Federal Contracting and Hiring Practices With the Interests of American Workers". Among other things, the EO directs federal agencies to review their contracting and hiring practices and assess negative impacts from the use of temporary foreign labor or offshoring of work. TVA is reviewing this EO and has not yet determined the extent to which this EO may impact TVA’s operations.
Ratemaking
At its August 22, 2018, meeting, the TVA Board approved a base rate adjustment which became effective on October 1, 2018. The base rate adjustment is expected to contribute approximately $200 million to 2019 revenues.
Since the fall of 2013, TVA, LPCs, and directly served industries have worked collaboratively in recent years to develop changes to TVA's rates that focus on TVA’sTVA's long-term pricing efforts. A comprehensive rate restructuring was implementedefforts and the changing needs of customers in October 2015 to improvethe Tennessee Valley. These changes have improved pricing by better aligning rates with underlying cost drivers and by sending improved pricing signals, while maintaining competitive industrial rates and keeping residential rates affordable.
Consistent with the pricing direction and changes implemented in the 2015 rate restructuring, TVA staff recommended, and the TVA Board approved, the proposed 2018 rate change on May 10, 2018. This change reduced wholesale energy rates for Standard Service and introduced a GAC at an offsetting rate to better recover fixed costs. Recognizing the need for flexibility, all LPCs were presented with the option to implement the wholesale changes in October 2018 or defer the implementation of the GAC until October 2019. Seventy-nine LPCs elected to implement the wholesale changes in October of 2018, while the remaining 75 have elected to implement the wholesale changes in October of 2019.
The 2018 rate change better reflects the wholesale cost of energy and recognizes the value of the grid’s reliability and associated fixed costs. This modernized approach to pricing provides bill stability while maintaining reliability and fairness for all TVA's customers. Concurrent with this process, an Environmental Assessment was completed on May 4, 2018, resulting in a finding of no significant impact.
At its May 9,In 2019, meeting, the TVA Board approved a change20-year Partnership Agreement option that better aligns the length of LPC contracts with TVA's long-term commitments. These agreements are automatically extended each year after their initial effective date, contingent upon certain circumstances, including agreement on flexibility options and limited rate increases going forward. Participating LPCs will receive benefits including a 3.1 percent wholesale bill credit in exchange for their long-term commitment, which enables TVA to recover its long-term financial commitments over a commensurate period. In June 2020, TVA provided participating LPCs a flexibility option that allows them to locally generate up to approximately five percent of average total hourly energy sales over the wholesale power rate schedulesprior five years in order to providemeet their individual customers' needs. As of August 3, 2020, 141 LPCs had signed the 20-year Partnership Agreement with TVA, and 42 LPCs had signed a mechanism to adjust the GAC for large changes in LPC load. This change helps ensure the equitable administration of the GAC.Flexibility Agreement.
Safeguarding Assets
Physical Security — Non-Nuclear Asset Protection. TVA utilizes a variety of security technologies, security awareness activities, and security personnel to prevent sabotage, vandalism, and thefts. Any of these activities could negatively impact the ability of TVA to generate, transmit, and deliver power to its customers. TVA's Police and Emergency Management personnel are active participants with numerous professional and peer physical security organizations in both the electric industry and law enforcement communities.
Physical attacks on transmission facilities across the country have heightened awareness of the need to physically protect facilities. TVA continues to work with the North American Electric Reliability Corporation ("NERC"), the SERC Reliability Corporation, the North American Transmission Forum, and other utilities to implement industry approved recommendations and standards.
Nuclear Security. Nuclear security is carried out in accordance with federal regulations as set forth by the NRC. These regulations are designed for the protection of TVA's nuclear power plants, the public, and employees from the threat of radiological sabotage and other nuclear-related terrorist threats. TVA has security forces to guard against such threats.
Cybersecurity. TVA operates in a highly regulated environment with respect to cybersecurity. TVA's cybersecurity program aligns or complies with the Federal Information Security Management Act, the NERC Critical Infrastructure Protection requirements, and the NRC requirements for cybersecurity, as well as industry best practices. As part of the U.S. government, TVA coordinates with and works closely with the U.S. Department of Homeland Security and the United StatesU.S. Computer Emergency Readiness Team ("US-CERT"). US-CERT functions as a liaison between the U.S. Department of Homeland Security and the public and private sectors to coordinate responses to security threats from the internet.
The risk of these cybersecurity events such as malicious code attacks, unauthorized access attempts, and social engineering attempts continues to intensify. While TVA hasand its third-party vendors and service providers have been, and will likely continue to be, subjected to such attacks and attempts to disrupt operations, to date the attacks have not impacted TVA's ability to operate as planned or compromised data which could involve TVA in lawsuits, claims, proceedings, investigations, and other legal matters ("Legal Proceedings").planned. See Item 1A, Risk Factors — Operational Risks — TVA's facilities and information infrastructure may not operate as planned due to cyber threats to TVA's assets and operations in the Annual Report.
Over the last few years, there has been an increase of malicious cyber activity across all industries, including the energy sector. Over the last six months, TVA has observed a significant increase in malicious activity related to the COVID-19 pandemic including phishing campaigns and malicious websites. These types of malicious activity are occurring across the industry and have also been observed by TVA’s external vendors, stakeholders, and partners. This activity has caused the need for heightened awareness and preparedness. Although TVA has not been compromised during these recent incidents, it is leveraging its federal intelligenceand other partners to better identify, detect, protect, and respond to these potential attacks. While there have been incidents of phishing and attempted fraud against TVA and its vendors and service providers, these events have not had a significant or material impact on business or operations.
Transmission Assets. In addition to physical and cybersecurity attacks, TVA's transmission assets are vulnerable to various types of electrically charged energy disruptions such as those from geomagnetic disturbances ("GMDs") and electromagnetic pulses ("EMP"). Because the effects of GMD and EMP are similar, they are often considered together. In September 2016, the Federal Energy Regulatory Commission ("FERC") approved a new standard to address GMD events, and in November 2018,March 2020, FERC approved a revision to the standard. TVA has met the requirements of the original standard and most of the requirements of the revised standard,subsequent revisions, and has evaluated the effects of solar storms ranging from NERC's reference case to possible extreme levels. TVA continues as an active participant with NERC in this field. The most serious threats from EMP are those caused by high-altitude nuclear explosions. Like others in the industry, TVA is coordinating with federal and state authorities, NERC, Electric Power Research Institute, ("EPRI"), and other grid owners and operators to address this concern.
Bulk-Power System Assets. On May 1, 2020, President Trump issued EO 13920, Securing the United States Bulk-Power System. Among other things, the EO prohibits the acquisition or installation of any bulk-power system electric equipment where the transaction (1) involves any property in which any foreign country or a national thereof has any interest and (2) poses an undue risk to the bulk-power system in, or national security of, the United States. Whether a bulk-power system electric equipment acquisition or installation is prohibited will depend on determinations by the Secretary of DOE that have not yet been made. At this time, it is uncertain to what extent this EO may impact TVA’s operations.
Environmental Matters
TVA's activities, particularly its power generation activities, are subject to comprehensive regulation under environmental laws and regulations relating to air pollution, water pollution, and management and disposal of solid and hazardous wastes, among other issues. Emissions from all TVA-owned and operated units (including small combustion turbine units of less than 25 MWs)MW) have been reduced from historic peaks. Emissions of nitrogen oxide ("NOx") have been reduced by 96 percent below peak 1995 levels and emissions of sulfur dioxide ("SO2") have been reduced by 99 percent below 1977 levels through CY 2018.2019. For CY 2018, TVA’s2019, TVA's emission of carbon dioxide ("CO2") from its sources was 5247 million tons, a 5155 percent reduction from 2005 levels. This amount includes 5,0372,383 tons from units rated at less than 25 MWs.MW. To remain consistent and provide clear information and to align with the EPA’sEPA's reporting requirements, TVA intends to continue to reportreporting CO2 emissions on a calendar year basis.
Clean Air Act
Mercury The CAA establishes a comprehensive program to protect and improve the nation's air quality and control sources of air pollution. The major CAA programs that affect TVA's power generation activities are described below.
National Ambient Air Toxics Standards for Electric Utility Units.Quality Standards. The U.S. Court of Appeals forCAA requires the District of Columbia Circuit ("D.C. Circuit") upheld the Mercury andEPA to set National Ambient Air ToxicsQuality Standards ("MATS"NAAQS") rule on April 15, 2014. In June 2015, however,for certain air pollutants. The EPA has done this for ozone, particulate matter ("PM"), SO2, nitrogen dioxide, carbon monoxide, and lead. Over the U.S. Supreme Court left the rule in place but remanded it back to the D.C. Circuit, finding thatyears, the EPA was requiredhas made the NAAQS more stringent. Each state must develop a plan to consider cost before deciding whether the regulation of hazardous air pollutants ("HAP") emitted from steam electric utilities was appropriate and necessary. In response to the Supreme Court's remand,be approved by the EPA published the final Supplemental Finding That It is Appropriatefor achieving and Necessary to Regulate Hazardous Air Pollutants from Coal- and Oil-Fired Electric Utility Steam Generating Units (the "Supplemental Finding") in April 2016. Several groups filed petitions with the D.C. Circuit challenging the Supplemental Finding. In April 2017, the EPA, under the new Administration, announced that it was reviewing the Supplemental Finding. On December 27, 2018, the EPA released a proposed rule to replace the Supplemental Finding with a new finding that it is not appropriate and necessary to regulate HAPmaintaining NAAQS within its borders. These plans impose limits on emissions from steam electric utilities. However, the EPA also proposed that notwithstanding this new finding, it wouldpollution sources, including TVA fossil fuel-fired plants. Areas meeting a NAAQS are designated as attainment areas. Areas not remove electricmeeting a NAAQS are designated as non-attainment areas, and more stringent requirements apply in those areas, including stricter controls on industrial facilities and more complicated permitting processes. TVA fossil fuel-fired plants can be impacted by these requirements. All TVA generating units from the source categories listed under Section 112 of the Clean Air Act ("CAA") and it would not rescind the MATS requirements. Additionally, the EPA proposed to find that further restrictions on HAP emissions are not warranted upon conducting a residual risk and technology review ("RTR") for thislocated in areas designated as in attainment with NAAQS.
source category. Until a final rule is issued, specific impacts to TVA cannot be determined; however, as proposed, the rule would not change TVA’s MATS compliance requirements or strategy.
Cross-State Air Pollution Rule.Rule. The EPA issued the Cross-State Air Pollution Rule ("CSAPR") in July 2011 requiring several states in the eastern U.S. to improve air quality relative to the 1997 ozone National Ambient Air Quality Standards (“NAAQS”) and the 1997 and 2006 fine particle NAAQS by reducing power plant emissions that contribute to pollution in other
states. In September 2016, the EPA issued an update to CSAPR to address cross-state air pollution (the "CSAPR Update Rule"). The EPA subsequently issued an additional rule to addressresolve any remaining cross-state pollution relative toair pollutant issues ("CSAPR Close-Out Rule"). The U.S. Court of Appeals for the 2008 ozone NAAQS and also to respond toDistrict of Columbia Circuit ("D.C. Circuit") has remanded a July 2015 remandportion of the CSAPR emission budgets for certain states by the D.C. Circuit. On December 6, 2018, the EPA finalized its determination that the CSAPR Update Rule fully addresses the obligations for 22 states in the eastern U.S. under the good neighbor provision of the CAA regarding interstate pollution transport for the 2008 ozone NAAQS. Tennessee and Kentucky, states in which TVA operates coal-fired units, are among the states subjectback to the EPA to address its failure to require upwind states to eliminate substantial contributions to downwind nonattainment by the statutory deadline. The D.C. Circuit also vacated the CSAPR UpdateClose-Out Rule. TVA does not anticipate significant changes to its operations based on the CSAPR Update Rule.Rule and the CSAPR Close-Out Rule, but cannot predict how the EPA will respond to the previously mentioned court decisions in amending these rules.
Petition to ExpandMercury and Air Toxics Standards for Electric Utility Units. On April 16, 2020, the Ozone Transport Region. On December 9, 2013, eightEPA issued a final rule which revokes the agency’s earlier finding that regulation of hazardous air pollutants ("HAP") emitted from steam electric utilities is “appropriate and necessary.” The rule does not remove electric generating units from the twelve states that make up the
Ozone Transport Region ("OTR") submitted a petition, pursuant to section 176A(a)source categories listed under Section 112 of the CAA requestingnor does it rescind the MATS requirements. Additionally, the EPA determined that further restrictions on HAP emissions are not warranted based on a residual risk and technology review for this source category. TVA does not anticipate that the final rule will change TVA's MATS compliance requirements or strategy.
Environmental Agreements. See Note 20 — Contingencies and Legal Proceedings — Legal Proceedings — Environmental Agreements for a discussion of the Environmental Agreements, which discussion is incorporated herein by reference.
Acid Rain Program. The Acid Rain Program is intended to add ninehelp reduce emissions of SO2 and NOx, which are the primary pollutants implicated in the formation of acid rain. The program includes a cap-and-trade emission reduction program for SO2 emissions from power plants. TVA continues to reduce SO2 and NOx emissions from its coal-fired plants, and the SO2 allowances allocated to TVA under the Acid Rain Program are sufficient to cover the operation of its coal-fired plants. In the TVA service area, the limitations imposed on SO2 and NOx emissions by the CSAPR program are more stringent than the Acid Rain Program. Therefore, TVA does not anticipate that the Acid Rain Program will impose any additional material requirements on TVA.
states, including Kentucky and Tennessee, to the OTR.
Regional Haze Program. The EPA failedissued the Clean Air Visibility Rule, which required certain older sources to act on the petition within the 180-day period provided
under the CAA. On October 6, 2016, six of the eight states filing the petition sued the EPA in the U.S. District Courtinstall best available retrofit technology. No additional controls or lower operating limits are required for the
Southern District of New York, asking the courtany TVA units to require the EPA to act on the petition by a date certain.meet best available retrofit technology requirements. In response to this lawsuit,January 2017, the EPA published the final rule that changed some of the requirements for Regional Haze State Implementation Plans ("SIPs"). Specific impacts cannot be determined until future Regional Haze SIPs are developed.
Opacity. Opacity, or visible emissions, measures the denseness (or color) of power plant plumes and has traditionally been used by states as a notice in the Federal Register on January 19, 2017, proposingmeans of monitoring good maintenance and operation of particulate control equipment. Under some conditions, retrofitting a unit with additional equipment to deny the petition on the basis thatbetter control SO2 and NOx emissions can adversely affect opacity performance, and TVA and other utilities have addressed this issue. The evaluation of utilities' compliance with opacity requirements is coming under increased scrutiny, especially during periods of startup, shutdown, and malfunction. Historically, SIPs developed under the CAA provides other options to address the impacttypically excluded periods of interstate air pollution. These options include the use of the “good neighbor provision”startup, shutdowns, and malfunctions, but in Section 110 of the CAA and the authority granted states under Section 126 of the CAA to petitionJune 2015, the EPA Administratorfinalized a rule to set emission limits.eliminate such exclusions. The EPA alsorule required states that its CSAPR Update Rule is a significant step to control states’ emission reduction obligations under Section 110 to meet the CY 2008 ozone NAAQS. On October 27, 2017, the EPA denied the petition. On December 22, 2017, the eight petitioningmodify their implementation plans by November 2016. Kentucky, Tennessee, and Mississippi submitted implementation plans, but Alabama has not. Environmental petitioners and several states filed in the D.C. Circuit a petitionpetitions for judicial review of the EPA’s denial ofEPA final rule before the petition to add states to the OTR. OnD.C. Circuit. In April 23, 2019,2017, the D.C. Circuit, deniedat the petition for judicial reviewrequest of the new EPA Administrator, ordered this litigation to be suspended pending the EPA's refusalreview to expanddetermine whether to reconsider all or part of the OTR to include nine additional states.rule. TVA does not expect significant impacts from these rule changes.
New York Petition to Address Impacts from Upwind High Emitting Sources. OnSources. In March 12, 2018, the State of New York
filed a petition with the EPA under Section 126(b) of the CAA to address ozone impacts on New York from the NOx emissions
from sources emitting at least 400 tons of NOx in CY 2017 from nine states including Kentucky. The New York petition requests
that the EPA require daily NOx limits for utility units with SCRs such as Paradise Unit 3Shawnee Units 1 and 4 and emission reductions from utility units
without SCRs such as Shawnee Units 2, 3 and 5-9. On April 12, 2019, the State of New York filed a lawsuit against the EPA asking the U.S. District Court for the Southern District of New York to set a deadline for the EPA to make the requested finding on New York’s Section 126(b) petition or deny it. Kentucky utility unit NOx emissions are already limited by the CSAPR Update Rule and are declining, and current EPA modeling projects no additional requirements to reduce Kentucky NOx emissions are necessary. During its February 2019 meeting, the TVA Board approved the retirement of Paradise Unit 3 by December 2020. On MaySeptember 20, 2019, the EPA proposed to denyfinalized its denial of New York's petition because the state did not demonstrate, and the EPA could not independently establish, that sources in the states listed in the petition contribute to exceedances of the 2008 and 2015 ozone NAAQS in New York.
Proposed Rule on National Emission Standards for Hazardous Air Pollutants for Stationary Combustion Turbines. On April 12,October 29, 2019, the EPA publishedState of New York filed a proposed rule to finalize its residual risk and technologypetition in the D.C. Circuit for judicial review for stationary combustion turbines that the EPA is required to conduct in accordance with the CAA. The EPA is proposing to find that the health risks from the emissions of air toxics from stationary combustion turbines are acceptable and that the existing National Emission Standards for Hazardous Air Pollutants for these turbines provides an ample margin of safety to protect public health. The EPA also identified no new cost effective controls for these turbines that would achieve further emission reductions. In addition, the EPA proposes to remove the current stay of the stationary combustion turbine National Emission StandardsEPA's denial of the petition. Specific impacts to TVA as a result of the filing of the petition for Hazardous Air Pollutants that has been in place since 2004. These rules apply only to those stationary turbines constructed after January 14, 2003, and that are located at facilities classified as major sources of hazardous air pollutants by the EPA because they have the potential to emit 10 tons or more per year of any hazardous air pollutant or 25 tons or more per year of any combination of hazardous air pollutants. As proposed, the rule would not have significant impacts on TVA. The TVA stationary combustion turbines that may become subject to the rules already have controls installed that are expected to meet the emission standards that become effective if the stay is removed. Actual impacts on TVAjudicial review cannot be determined until a final rule is issued.at this time.
Affordable Clean Energy Rule.Rule. On June 19, 2019, the EPA finalized the final Affordable Clean Energy ("ACE") rule and repealed the Clean Power Plan.EPA's previous regulation addressing greenhouse gas ("GHG") emissions from existing fossil fuel-fired units. The ACE rule establishes guidelines for greenhouse gas ("GHG")GHG emissions from existing coal-fired units based on efficiency improvements that can be achieved at those units at reasonable cost. States are required to apply the emission guidelines to coal-fired units within their respective jurisdictions and take into account the remaining useful lifelives of those units. The impact of the ACE rule on TVA's coal-fired units cannot be determined until Tennessee and Kentucky submit to the EPA their state implementation plans ("SIPs")SIPs implementing guidelines in the ACE rule and the EPA approves these SIPs. The ACE rule allows states three years to submit their SIPs and allows the EPA one year18 months for approval.
Proposed Revisions to New Source Performance Standards for Greenhouse Gas Emission Standards for Electric Generating Units.Standards. On December 6, 2018, the EPA proposed revisions to the GHG emission standards for new, modified, and
reconstructed electric utility generating units that were finalized by the EPA onin October 23, 2015. For coal-fired units, the EPA proposes to revise the current new source standards such that carbon capture and sequestration technology is no longer necessary to meet the standards of performance that reflect the best system of emission reduction. The resulting limits are less stringent than limits under the current rule and can be met by modern coal-fired units (e.g., supercritical steam generators) in combination with best operating practices, but without carbon capture and sequestration. The EPA is not proposing to revise the new source performance standard for GHG emission from gas-fired units. If finalized as proposed, the revisions are not expected to significantly impact TVA since TVA does not currently plan to construct, modify, or reconstruct any coal-fired units.
Maryland Petition to Address Impacts from Upwind Electric Generating Units. OnUnits. In September 27, 2017, the State of
Maryland filed a lawsuit against the EPA for failing to act within 60 days on Maryland’sMaryland's petition under Section 126 of the CAA to
address ozone impacts on Maryland from the NOxemissions of 36 electric generating units, including TVA’s Paradise coal-fired
Unit 3. On October 4, 2017, a group of seven environmental advocacy groups filed a similar complaint against the EPA. At
issue in Maryland’s petition are alleged excessive NOx emissions from the 36 electric generating units as a result of SCR units
not being operated continuously.TVA's Paradise coal-fired Unit 3 is equipped with a SCR that TVA continuously operates to3. The EPA has denied the
greatest extent technically practicable in order to minimize NOx emissions. See Note 5. On October 5, 2018, the EPA denied Maryland's petition in light of thebecause existing regulations already addressingaddress emissions from the generating units identified in the petition.at issue. On October 15, 2018, the State of Maryland filed a petition for judicial review with the D.C. Circuit asking the court to review the EPA's decision. With the retirement of Paradise Unit 3 on February 1, 2020, the outcome of this litigation will not affect TVA.
Climate Change
Executive Actions. In March 2017, President Trump issued EO 13783, "Promoting Energy Independence and Economic Growth." The EO reversed or altered many actions taken by the federal government in the last four years of the Obama Administration to address climate change and mandates that federal agencies review existing regulations and actions that potentially burden energy development and use. Several EOs, policy statements, and reports that established climate change objectives were rescinded or revoked. EO 13783 did not mandate that the EPA reconsider its finding under the CAA that GHG emissions cause climate change and therefore endanger public health and the environment.
Implementation of EO 13783 has resulted in the replacement of the Clean Power Plan ("CPP") rule for existing fossil generation units by the Affordable Clean Energy ("ACE") rule. The impact of the ACE rule is discussed above.
In May 2018, EO 13834, "Efficient Federal Operations," was signed. EO 13834 emphasizes meeting statutory requirements and gives agencies greater flexibility and discretion to decide how best to improve operations in order to "optimize energy and environmental performance, reduce waste, and cut costs." It also calls on the White House Council of Environmental Quality to streamline pre-existing environmental orders by "refocusing agencies on cost-effectively meeting mandates and goals" established by law. The order seeks to consolidate requirements related to energy and water efficiency, high performance buildings, renewable energy consumption, and federal vehicle fleet management. TVA consistently seeks to improve its operations in order to optimize energy and environmental performance and does not anticipate significant changes in its planning or operations as a result of the new EO.
International Accords. In September 2016, the U.S. formally accepted the Paris Agreement. The agreement met the threshold of at least 55 countries that account for at least 55 percent of global GHG emissions and formally entered into force in November 2016. The durability of the Paris Agreement commitments is uncertain after President Trump's announcement in June 2017 that the U.S. would withdraw from the agreement. On November 4, 2019, the United States formally notified the United Nations that it would withdraw from the agreement. Under the terms of the agreement, the effective date for the withdrawal will be November 4, 2020. Specific impacts to TVA cannot be determined at this time.
In response to President Trump's Paris withdrawal announcement, 25 states have formed the U.S. Climate Alliance, a bipartisan coalition of governors committed to reducing GHG emissions consistent with the goals of the Paris Agreement. North Carolina and Virginia are the only states in the TVA region that are U.S. Climate Alliance members. Among other commitments, each state commits to implement policies that advance the goals of the Paris Agreement, aiming to reduce GHG emissions by at least 26-28 percent below CY 2005 levels by CY 2025 and to accelerate new and existing policies to reduce carbon pollution and promote clean energy deployment at the state and federal level. In June 2017, America's Pledge was announced as a collaborative opportunity for these states to work with U.S. cities and businesses representing more than half of the U.S. economy. In September 2018, America's Pledge released its economy-wide policy analysis with recommendations of how states, cities, businesses, and other stakeholders can influence U.S. decarbonization. It is premature to determine potential impacts to TVA.
Litigation. In addition to legislative activity, climate change issues have been the subject of a number of lawsuits, including lawsuits against TVA. See Note 20 — Contingencies and Legal Proceedings for additional information.
Indirect Consequences of Regulation or Business Trends. Legal, technological, political, and scientific developments regarding climate change may create new opportunities and risks. The potential indirect consequences could include an increase or decrease in electricity demand, increased demand for generation from alternative energy sources, and subsequent impacts to business reputation and public opinion.
Physical Impacts of Climate Change. TVA's Climate Change Adaptation Plan was last updated in June 2018. The goal of the adaptation planning process is to ensure TVA continues to achieve its mission and program goals and to operate in a secure, effective, and efficient manner in a changing climate by integrating climate change adaptation efforts in coordination with state and local partners, tribal governments, and private stakeholders. TVA manages the potential effects of climate change on its mission, programs, and operations within its environmental management processes.
Actions Taken by TVA to Reduce GHG Emissions. TVA has reduced GHG emissions from both its generation stations and its operations. Recent TVA Board actions have focused on TVA's plan to balance its coal-fired generation by increasing its nuclear capacity, modernizing its hydroelectric generation system, increasing natural gas-fired generation, installing emission control equipment on certain of its coal-fired units, increasing its purchases of renewable energy, building solar facilities, and investing in energy efficiency initiatives to reduce energy use in the Tennessee Valley. Additionally, TVA has invested to reduce energy use in its operations. The combination of more stringent environmental regulations, lower natural gas prices, and lower demand for energy across the Tennessee Valley has reduced the utilization of coal-fired generation. These factors have resulted in lower CO2 emissions from the TVA system.
Renewable/Clean Energy Standards
Twenty-nine states and the District of Columbia have established enforceable or mandatory requirements for electric utilities to generate a certain amount of electricity from renewable sources. One state within the TVA service area, North Carolina, has a mandatory renewable standard that, while not applying directly to TVA, does apply to TVA's LPCs serving retail customers in that state. TVA's policy is to provide compliance assistance to any distributor of TVA power, and TVA is providing assistance to the covered LPCs that sell TVA power in North Carolina. Likewise, the Mississippi Public Service Commission adopted an energy efficiency rule applying to electric and natural gas providers in the state, and TVA is supplying information on participation in TVA's energy efficiency programs to support the covered Mississippi LPCs.
Water Quality Control Developments
Cooling Water Intake Structures. In May 2014, the EPA released a final rule under Section 316(b) of the Clean Water Act relating to cooling water intake structures ("CWIS") for existing power generating facilities. The rule requires changes in CWIS used to cool the vast majority of coal, gas, and nuclear steam-electric generating plants and a wide range of manufacturing and industrial facilities in the U.S. The final rule requires CWIS to reflect the best technology available for minimizing adverse environmental impacts, primarily by reducing the amount of fish and shellfish that are impinged or entrained at a cooling water intake structure. These new requirements will potentially affect a number of TVA's fossil- and nuclear-fueled facilities and will likely require capital upgrades to ensure compliance. Most TVA facilities are projected to require retrofit of CWIS with "fish-friendly" screens and fish return systems to achieve compliance with the new rule. The rule is being implemented through permits issued under the National Pollutant Discharge Elimination System ("NPDES") in Section 402 of the Clean Water Act. State agencies administer the NPDES permit program in most states including those in which TVA's facilities are located. In addition, the responsible state agencies must provide all permit applications to the U.S. Fish and Wildlife Service for a 60-day review prior to public notice and an opportunity to comment during the public notice. As a result, the permit may include requirements for additional studies of threatened and endangered species arising from U.S. Fish and Wildlife Service comments and may require additional measures be taken to protect threatened and endangered species and critical habitats directly or indirectly related to the plant cooling water intake. TVA's review of the final rule indicates that the rule offers adequate flexibility for cost-effective compliance. The required compliance timeframe is linked to plant specific NPDES permit renewal cycles (i.e., technology retrofits), and compliance is expected to be required in the CYs 2022-2024 timeframe.
The EPA has never applied the requirements under Section 316(b) to hydroelectric facilities. However, two EPA regions that do not cover TVA's activities are proposing to include Section 316(b) requirements in NPDES permits for hydroelectric facilities in those regions. It is not clear whether the requirements will be adopted nationwide or, given the unique features of hydroelectric facilities and the manner in which they withdraw cooling water, how the best technology available standard would be applied.
Hydrothermal Discharges. The EPA and many states continue to focus regulatory attention on potential effects of hydrothermal discharges. Many TVA plants have variances from thermal standards under Section 316(a) of the Clean Water Act that are subject to review as NPDES permits are renewed. Specific data requirements in the future will be determined based on negotiations between TVA and regulators. If plant thermal limits are made more stringent, TVA may have to install cooling towers at some of its plants and operate installed cooling towers more often. This could result in a substantial cost to TVA.
Steam-Electric Effluent Guidelines. In 2015, the EPA revised existing steam-electric effluent limitation guidelines ("ELGs"), which regulate water discharge pollutants and require the application of certain pollutant control technologies. The 2015 ELGs establish more stringent performance standards for existing and new sources and will require major upgrades to wastewater treatment options at all coal-fired plants. Compliance with new requirements was originally required in the CYs 2018-2023 timeframe, but the EPA delayed the compliance for flue gas desulfurization ("FGD") wastewater and bottom ash transport water until CYs 2020-2023 to allow the EPA time to review and potentially revise the ELGs with regard to these waste streams.
In August 2017, the EPA Administrator announced his decision to conduct a rulemaking to potentially revise the new, more stringent effluent limitations that apply to bottom ash transport water and FGD wastewater in the CY 2015 ELG rule. In April 2019, the United States Court of Appeals for the Fifth Circuit ("Fifth Circuit") remanded portions of the 2015 ELG because it determined that some of the standards did not comply with statutory requirements. The EPA proposed revised ELGs for bottom ash transport water and FGD wastewater on November 4, 2019, but did not address the portions of the ELG that were remanded by the Fifth Circuit.
The primary impact for TVA is on the operation of existing coal-fired generation facilities. The proposed revised ELGs could impact long-term investment decisions being made relative to the long-term compliance and operability of these plants. The proposed revisions may require TVA to install additional wastewater treatment systems for FGD wastewater and bottom ash transport water, and TVA could incur substantial costs to comply with the new rule. The proposed revision also includes a subcategory for which the Cumberland Fossil Plant ("Cumberland") would qualify that provides TVA greater flexibility in meeting the ELGs. However, given that these are proposed rules, it is unclear what the final impact to TVA will be. The proposed revisions may require TVA to install additional wastewater treatment systems for FGD wastewater and bottom ash transport water, and TVA could incur substantial costs to comply with the new rule.
Other Clean Water Act Requirements. As is the case in other industrial sectors, TVA and other utilities are also facing more stringent requirements related to the protection of wetlands, reductions in storm water impacts from construction activities, new water quality criteria for nutrients and other pollutants, new wastewater analytical methods, and regulation of pesticide discharges.
Recent Clean Water Act Decisions
On April 23, 2020, in County of Maui v. Hawaii Wildlife Fund, the Supreme Court held that the Clean Water Act requires a permit when there is a direct discharge of pollutants from a point source to waters of the U.S. and when there is the “functional equivalent” of a direct discharge. The Court suggested seven factors for determining when such a discharge is the functional equivalent of a direct discharge and acknowledged that the new test would be somewhat difficult to apply, potentially requiring evaluation of multiple factors. The Court noted that "time and distance" of pollutant migration often will be the most important factor but that other relevant factors may include, for example, the nature of the material through which the pollutant travels and the extent to which the pollutant is diluted or chemically changed as it travels. TVA is evaluating what impact the decision and application of the test will have on its operations.
On April 15, 2020, in Northern Plains Resource Council v. U.S. Army Corps of Engineers, the U.S. District Court for the District of Montana vacated the Nationwide Permit (“NWP”) 12, which authorizes discharges of dredged or fill material into waters of the U.S., and enjoined the U.S. Army Corps of Engineers from authorizing projects nationwide under the permit. The District Court subsequently amended its order on May 11, 2020, to allow NWP 12 to remain in place pending appeal for non-pipeline construction projects. The Supreme Court further granted a stay of the decision on July 6, 2020, allowing NWP 12 to remain in place for all pipeline construction projects except the Keystone XL pipeline. Consequently, the District Court's decision vacating NWP 12 does not have an immediate effect on TVA; however, unless the District Court's decision is reversed on appeal, there remains a risk that NWP 12 will not be available for TVA projects in the future.
Cleanup of Solid and Hazardous Wastes
Liability for releases and cleanup of hazardous substances is imposed under the federal Comprehensive Environmental Response, Compensation, and Liability Act, and other federal and parallel state statutes. In a manner similar to many other industries and power systems, TVA has generated or used hazardous substances over the years.
TVA Sites. TVA operations at some of its facilities have resulted in contamination that TVA is addressing including at TVA's Environmental Research Center at Muscle Shoals, Alabama. At June 30, 2020, TVA's estimated liability for cleanup and similar environmental work for those sites for which sufficient information was available to develop a cost estimate is approximately $15 million and was included in Accounts payable and accrued liabilities and Other long-term liabilities on the Consolidated Balance Sheets. In addition, the ERC has an active groundwater monitoring program as part of a Resource Conservation and Recovery Act ("RCRA") Corrective Action Permit.
Non-TVA Sites. TVA is aware of alleged hazardous-substance releases at certain non-TVA areas for which it may have some liability. See Note 20 — Contingencies and Legal Proceedings — Environmental Matters.
Coal Combustion Residuals. The EPA published its final rule governing CCR in April 2015. The rule regulates CCR as nonhazardous waste under Subtitle D of the RCRA. While states may adopt the rule's requirements into their regulatory programs, the rule does not require states to adopt the requirements. The initial version of the rule provided for self-implementation by utilities and allows enforcement through citizen suits in federal court. The Water Infrastructure Improvements for the Nation Act ("WIIN Act") subsequently allowed state or federal-based permitting to implement the CCR rule as an alternative to self-implementation and citizen suits. The rule, which became effective in October 2015, has later effective dates for certain provisions. See Item 7, Management's Discussion and Analysis of Financial Condition and Results of Operations —
Key Initiatives and Challenges — Generation Resources — Coal Combustion Residual Facilities in the Annual Report for a discussion of the impact on TVA's operations, including the cost and timing estimates of related projects.
In July 2018, the EPA issued a final rule which provided additional flexibility and an extension of certain deadlines. On March 13, 2019, the D.C. Circuit granted the EPA’sEPA's request to remand athis final rule issued by the EPA in July 2018 amending portions of the CCR Rule to provide flexibility and an extension of certain deadlines to align the rule with the previously issued Steam-Electric Effluent Guidelines rule. The remand allowsallow the EPA to reconsider the amendments to the CCR Rule. The remand also allows the EPA additional time to complete a new rulemaking to establish revised timelines for unlined impoundments to initiate closure and to reexamine the October 2020 deadline for closing some unlined impoundments. On August 14, 2019, the EPA issued a proposed rule to amend portions of the CCR Rule regarding beneficial use, temporary piles, and public access to information. As a result of these developments, it is not possible to predict changes topotential impacts on TVA.
On November 4, 2019, the EPA announced a proposed rule that will revise portions of the CCR Rule requiring closure of unlined surface impoundments, and potential impacts on TVA.July 29, 2020, the EPA published a prepublication copy of the final rule on its website. The final rule will become effective 30 days after it is published in the Federal Register. Among other things, the final rule will require all unlined CCR surface impoundments to stop receiving CCR and non-CCR wastestreams and to initiate closure or retrofit by no later than April 11, 2021. Additionally, the final rule provides a process for a utility to seek site-specific approval from the EPA to continue to use the unlined CCR surface impoundment until October 15, 2023, and possibly longer under certain circumstances. The final rule also includes requirements that enhance the public’s access to groundwater monitoring and corrective action reports. TVA does not currently anticipate the final rule will have a significant impact because TVA is already planning to close its unlined CCR surface impoundments and already makes groundwater monitoring and correction action reports publicly available.
In August 2015, TDEC issued an order that (1) allowed TDEC to oversee TVA's implementation of the EPA's CCR rule and (2) required TVA to assess CCR contamination risks at seven of TVA's eight coal-fired plants in Tennessee and to remediate any unacceptable risks. The TDEC order does not allege that TVA is violating any CCR regulatory requirements nor does it assess TVA penalties. The TDEC order sets out an iterative process through which TVA and TDEC will identify and evaluate any CCR contamination risks and, if necessary, respond to such risks.
Groundwater Contamination. Environmental groups and state regulatory agencies are increasing their attention on alleged groundwater contamination associated with CCR management activities. As a result, TVA may have to change how it manages CCRsCCR at some of its plants, potentially resulting in higher costs. See Part I, Item 2, Management’sManagement's Discussion and Analysis of Financial Condition and Results of Operations — Key Initiatives and Challenges — Generation Resources — Coal Combustion ResidualResiduals Facilities and Key InitiativesNote 11 — Asset Retirement Obligations.
Environmental Investments
From 1970 to 2019, TVA spent approximately $6.8 billion on controls to reduce emissions from its coal-fired power plants. In addition, TVA has reduced emissions by idling or retiring coal-fired units and Challenges — Regulatory Compliance — Allen Groundwater Investigation.relying more on cleaner energy resources including natural gas and nuclear generation.
TVA currently anticipates spending significant amounts on environmental projects through 2024, including investments in new clean energy generation including renewables to reduce TVA's overall environmental footprint. TVA environmental project expenditures also result from coal-fired plant decommissioning and from effective ash management modernization. Based on TVA's decisions regarding certain coal-fired units, the amount and timing of expenditures could change.
SO2 Emissions and NOx Emissions. To reduce SO2 emissions, TVA operates scrubbers on 19 of its coal-fired units and switched to lower-sulfur coal at 13 coal-fired units. To reduce NOx emissions, TVA operates SCRs on 19 coal-fired units, operates low-NOx burners or low-NOx combustion systems on 19 units, operates over-fire air on one cyclone unit, optimized combustion on six units, and operates NOx control equipment year round when units are operating (except during start-up, shutdown, and maintenance periods). TVA has also retired 34 of 59 coal-fired units. Except for seven units at Shawnee, the remaining coal-fired units have scrubbers and SCRs.
Particulate Emissions. To reduce particulate emissions of air pollutants, TVA has equipped all of its coal-fired units with scrubbers, mechanical collectors, electrostatic precipitators, and/or bag houses.
Greenhouse Gas Emissions. There could be additional material costs if further reductions of GHGs, including CO2, are mandated by legislative, regulatory, or judicial actions and if more stringent emission reduction requirements for conventional pollutants are established. These costs cannot reasonably be predicted at this time because of the uncertainty of these actions. The EPA may issue regulations establishing more stringent air, water, and waste requirements, and these requirements could result in significant changes in the structure of the U.S. power industry, especially in the eastern half of the country.
Estimated Required Environmental Expenditures
The following table contains information about TVA's current estimates of expenditures foron projects related to environmental laws and regulations:
|
| | | | | | | | | | | | | | | |
Estimated Potential Environmental Expenditures(1)(2) At June 30, 2019 (in millions)
|
| | Remaining 2019 | | 2020 | | Thereafter(3) | | Total |
Coal combustion residual conversion program(4) | $ | 117 |
| | $ | 375 |
| | $ | 862 |
| | $ | 1,354 |
|
Clean air control projects(5) | 2 |
| | 24 |
| | 163 |
| | 189 |
|
Clean Water Act requirements(6) | 22 |
| | 84 |
| | 218 |
| | 324 |
|
| | | | | | | | | | | | | | | | | | | | | | | |
Estimated Potential Environmental Expenditures(1)(2) At June 30, 2020 (in millions) | | | | | | | |
| | Remaining 2020 | | 2021 | | Thereafter(3)(4) | | Total |
Coal combustion residuals conversion program(5) | $ | 73 | | | $ | 290 | | | $ | 602 | | | $ | 965 | |
Clean air control projects(6) | 2 | | | 26 | | | 104 | | | 132 | |
Clean Water Act requirements(7) | 20 | | | 73 | | | 118 | | | 211 | |
Notes
(1) These estimates are subject to change as additional information becomes available and as regulations change.
(2) These estimates include $88$31 million, $328$206 million, and $524$256 million for the remainder of 2019, 2020, 2021, and thereafter, respectively, in capital expenditures.
(3) See Note 1920 — Contingencies and Legal Proceedings — Contingencies.
(4) These estimates include expenditures expected to be incurred during 2022, 2023, and 2024.
(5) Includes costs associated with pond closures, conversion of wet to dry handling, and landfill activities. TVA is continuing to evaluate the rules and their impact on its operations, including the cost and timing estimates of related projects. See Part I, Item 2, Management's Discussion and Analysis of Financial Condition and Results of Operations — Key Initiatives and Challenges — Generation Resources — Coal Combustion Residual Facilities.Residuals Facilities and Note 11 — Asset Retirement Obligations.
(5)(6) Includes air quality projects that TVA is currently performing to comply with existing air quality regulations, but does not include any projects that may be required to comply with potential GHG regulations or transmission upgrades.
(6)(7) Includes projects that TVA is currently planning to comply with revised rules under the Clean Water Act (i.e., Section 316(b)(regarding CWIS and effluent limitation guidelinesELGs for
steam electric power plants).
Legal Proceedings
From time to time, TVA is party to or otherwise involved in lawsuits, claims, proceedings, investigations, and other legal matters ("Legal Proceedings") that have arisen in the ordinary course of conducting its activities, as a result of catastrophic events or otherwise. At June 30, 2019,2020, TVA had accrued $14 million with respect to Legal Proceedings. No assurance can be given that TVA will not be subject to significant additional claims and liabilities. If actual liabilities significantly exceed the estimates made, TVA's results of operations, liquidity, and financial condition could be materially adversely affected.
For a discussion of certain current material Legal Proceedings, see Note 920 — Contingencies and Note 19 — Legal Proceedings —Legal Proceedings, which discussions are incorporated into this Part I, Item 2, Management's Discussion and Analysis of Financial Condition and Results of Operations.
Off-Balance Sheet Arrangements
At June 30, 2019,2020, TVA had no off-balance sheet arrangements.
Critical Accounting Policies and Estimates
The preparation of financial statements requires TVA to estimate the effects of various matters that are inherently uncertain as of the date of the financial statements. Although the financial statements are prepared in conformity with accounting principles generally accepted in the U.S., TVA is required to make estimates and assumptions that affect the reported amounts of assets and liabilities, the disclosure of contingent assets and liabilities, and the amounts of revenues and expenses reported during the reporting period. Each of these estimates varies in regard to the level of judgment involved and its potential impact on TVA's financial results. Estimates are deemed critical either when a different estimate could have reasonably been used, or where changes in the estimate are reasonably likely to occur from period to period, and such use or change would materially impact TVA's financial condition, results of operations, or cash flows. TVA's critical accounting policies are discussed in Item 7, Management's Discussion and Analysis of Financial Condition and Results of Operations — Critical Accounting Policies and Estimates and Note 1 — Summary of Significant Accounting Policies of the Notes to Consolidated Financial Statements in the Annual Report.
New Accounting Standards and Interpretations
For a discussion of new accounting standards and interpretations, see Note 2 — Impact of New Accounting Standards and Interpretations, which discussion is incorporated into this Part I, Item 2, Management's Discussion and Analysis of Financial Condition and Results of Operations.
Legislative and Regulatory Matters
TVA continues to monitor how regulatory agencies are interpreting and implementing the provisions of the Dodd-Frank Wall Street Reform and Consumer Protection Act, which was enacted in July 2010. As a result, TVA has become subject to
recordkeeping, reporting, and reconciliation requirements related to its derivative transactions. In addition, depending on how regulatory agencies interpret and implement the provisions, TVA's hedging costs may increase, and TVA may have to post additional collateral and margin in connection with its derivative transactions.
TVA does not engage, and does not control any entity that is engaged, in any activity listed under Section 13(r) of the Securities Exchange Act of 1934 (the "Exchange("Exchange Act"), which requires certain issuers to disclose certain activities relating to Iran involving the issuer and its affiliates. Based on information supplied by each such person, none of TVA's directors and executive officers are involved in any such activities. While TVA is an agency and instrumentality of the U.S., TVA does not believe its disclosure obligations, if any, under Section 13(r) extend to the activities of any other departments, divisions, or agencies of the U.S.
ITEM 3. QUANTITATIVE AND QUALITATIVE DISCLOSURES ABOUT MARKET RISK
There are no material changes related Financial markets have experienced higher volatility during the nine months ended June 30, 2020, due to the COVID-19 pandemic. The uncertainty has resulted in significant fluctuations in market risks disclosed under Item 7, Management's Discussionvaluations for many investments and Analysis of Financial Condition and Results of Operationsderivative instruments. See Note 14 — Risk Management Activities in the Annual Report. See Note 14 and Derivative Transactions for additional information regarding TVA's derivative transactions and risk management activities.activities, Note 15 — Fair Value Measurements for disclosure of the current balances of investment funds, and Note 19 — Benefit Plans for additional information regarding the impacts to TVA's pension system.
ITEM 4. CONTROLS AND PROCEDURES
Disclosure Controls and Procedures
TVA's management, including the President and Chief Executive Officer, the Executive Vice President and Chief Financial Officer, and members of the Disclosure Control Committee, including the Vice President and Controller (Principal Accounting Officer), evaluated the effectiveness of TVA's disclosure controls and procedures (as defined in Rule 13a-15(e) under the Securities Exchange Act of 1934)Act) as of June 30, 2019.2020. Based on this evaluation, TVA's management, including the President and Chief Executive Officer, the Executive Vice President and Chief Financial Officer, and members of the Disclosure Control Committee, including the Vice President and Controller (Principal Accounting Officer), concluded that TVA's disclosure
controls and procedures were effective as of June 30, 2019,2020, to ensure that information required to be disclosed by TVA in reports that it files or submits under the Exchange Act, is recorded, processed, summarized, and reported, within the time periods specified in the Securities and Exchange Commission's rules and forms, and include controls and procedures designed to ensure that information required to be disclosed by TVA in such reports is accumulated and communicated to TVA's management, including the President and Chief Executive Officer, the Executive Vice President and Chief Financial Officer, and members of the Disclosure Control Committee, including the Vice President and Controller (Principal Accounting Officer), as appropriate, to allow timely decisions regarding required disclosure.
Changes in Internal Control over Financial Reporting
During the quarter ended June 30, 2019,2020, there were no changes in TVA's internal control over financial reporting
that materially affected, or are reasonably likely to materially affect, TVA's internal control over financial reporting.
PART II - OTHER INFORMATION
ITEM 1. LEGAL PROCEEDINGS
From time to time, TVA is party to or otherwise involved in lawsuits, claims, proceedings, investigations, and other legal matters ("Legal Proceedings") that have arisen in the ordinary course of conducting its activities, as a result of catastrophic events or otherwise. While the outcome of the Legal Proceedings to which TVA is a party cannot be predicted with certainty, any adverse outcome to a Legal Proceeding involving TVA may have a material adverse effect on TVA's financial condition, results of operations, and cash flows.
For a discussion of certain current material Legal Proceedings, see Note 920 — Contingencies and Note 19Legal Proceedings — Legal Proceedings, which discussions are incorporated by reference into this Part II, Item 1, Legal Proceedings.
ITEM 1A. RISK FACTORS
There are noThe following risk factor describes a material changes related to risk factorschange from the risk factors disclosed in Item 1A, Risk Factors of the Annual Report. The following information should be read in conjunction with additional risk factors included in the Annual Report.
Events such as health epidemics, pandemics, and similar outbreaks could adversely affect TVA’s business, financial condition, and results of operations.
Health epidemics, pandemics, and similar outbreaks, including the global pandemics resulting from the outbreak of the Coronavirus Disease 2019 (“COVID-19”) and efforts to contain the virus, can adversely affect TVA’s business, financial condition, and results of operations. Such impacts can include reduced revenues as customers curtail operations to reduce the spread of the outbreak, including quarantines, closures, or reduced operations of businesses or other institutions, deferral of revenues under programs offered by TVA to its local power company customers to offset the impact of customers’ inability to pay during the outbreak, and the impairment of accounts and loans receivable. TVA has been adversely affected by the COVID-19 pandemic, and expects to continue to be adversely affected. TVA estimates base revenues were reduced by approximately $130 million for the nine months ended June 30, 2020 due to the impacts of COVID-19, and based on current estimates, TVA anticipates base revenue could be up to $100 million lower than plan for the fourth quarter of 2020. It is uncertain at this time the extent to which TVA's revenues may be impacted beyond 2020.
TVA could be further adversely affected by impacts of the COVID-19 pandemic on the economy and financial markets, including an economic downturn and continued volatility in interest rates, commodity prices, investment performance, and foreign currency exchange rates. TVA has experienced fluctuations related to its pension plan assets and other investment portfolios during the nine months ended June 30, 2020. The ultimate impact of the COVID-19 pandemic on the pension plan and other investments depends on factors beyond TVA’s knowledge or control. A long-term recession could impact access to capital and have other long-term negative effects on operations.
In addition, TVA’s operations could be impacted by, among other things, the need to implement social distancing to prevent illness from spreading within the workforce, travel restrictions, the availability of the workforce to perform essential functions, and the unavailability of fuel or critical parts, supplies, or services due to transportation restrictions and the shutdown, slowdown, or inability to meet contractual requirements of suppliers or other vendors in TVA’s supply chain. In addition, the continued spread of the COVID-19 pandemic could adversely impact TVA’s ability to develop, construct, and operate facilities and could lead to impairments of TVA's long-lived assets.
To address specific aspects of the COVID-19 pandemic, TVA has implemented a company-wide pandemic plan, including limiting non-essential travel and mandatory telework for those that do not have to be physically present at a TVA facility or office building, implementing strong physical and cyber-security measures, keeping certain developed recreation areas closed, actively monitoring generation, transmission, and distribution functions, and maintaining an increased cash reserve; however, it is possible that these measures will not be successful in mitigating the impact of the outbreak. At this time, operations and delivery of energy to customers have not been materially impacted.
The extent to which the COVID-19 pandemic will impact TVA’s business, financial condition, and results of operations is uncertain and will depend on numerous evolving factors beyond TVA’s knowledge or control including, among other things, the duration and severity of the outbreak, actions taken to contain its spread and mitigate its effects, and broader impacts of the COVID-19 pandemic on the country and region’s economy. However, TVA reasonably anticipates that a prolonged outbreak could have a material impact on its business, financial condition, and results of operations, and could require TVA to change how it conducts certain operations, takes power under certain agreements, or dispatches its own facilities.
ITEM 5. OTHER INFORMATION
At an August 3, 2020 news conference, President Donald J. Trump announced an "Executive Order on Aligning Federal Contracting and Hiring Practices With the Interests of American Workers." During the news conference, President Trump referenced the removal of two current TVA directors. Later in the day, TVA received copies of letters from the White House informing James R. Thompson, III and Richard C. Howorth that they have both been removed from the TVA Board by the President effective immediately, and thanking them for their service.
ITEM 6. EXHIBITS
| | | | | |
| Exhibit No. | Description |
| |
| |
Exhibit No. | Description |
| |
| |
| 31.1 | |
| |
| 31.2 | |
| |
| 32.1 | |
| |
| 32.2 | |
| |
101.INS10.1 | |
| |
| 101.INS | TVA XBRL Instance Document |
| |
| 101.SCH | TVA XBRL Taxonomy Extension Schema |
| |
| 101.CAL | TVA XBRL Taxonomy Extension Calculation Linkbase |
| |
| 101.DEF | TVA XBRL Taxonomy Extension Definition Linkbase |
| |
| 101.LAB | TVA XBRL Taxonomy Extension Label Linkbase |
| |
| 101.PRE | TVA XBRL Taxonomy Extension Presentation Linkbase |
SIGNATURES
Pursuant to the requirements of Section 13, 15(d), or 37 of the Securities Exchange Act of 1934, the registrant has duly caused this report to be signed on its behalf by the undersigned, thereunto duly authorized.
|
| | | | | | | | | | |
| Date: | August 1, 20193, 2020 | | TENNESSEE VALLEY AUTHORITY |
| | | (Registrant) |
| | | |
| | | |
| | By: | /s//s/ Jeffrey J. Lyash |
| | | Jeffrey J. Lyash |
| | | President and Chief Executive Officer
(Principal Executive Officer)
|
| | By: | /s//s/ John M. Thomas, III |
| | | John M. Thomas, III |
| | | Executive Vice President and Chief Financial Officer
(Principal Financial Officer)
|