UNITED STATES
SECURITIES AND EXCHANGE COMMISSION
Washington, D.C. 20549
FORM 10-Q
☒QUARTERLY REPORT PURSUANT TO SECTION 13 OR 15(d) OF THE SECURITIES EXCHANGE ACT OF 1934
For the quarterly period ended September 30, 2019March 31, 2020
or
☐TRANSITION REPORT PURSUANT TO SECTION 13 OR 15(d) OF THE SECURITIES EXCHANGE ACT OF 1934
For the transition period from to
Commission file number 001-33366
Cheniere Energy Partners, L.P.
(Exact name of registrant as specified in its charter)
|
| |
| Delaware | 20-5913059 |
| (State or other jurisdiction of incorporation or organization) | (I.R.S. Employer Identification No.) |
700 Milam Street, Suite 1900
Houston, Texas 77002
(Address of principal executive offices) (Zip Code)
(713) 375-5000
(Registrant’s telephone number, including area code)
Securities registered pursuant to Section 12(b) of the Act:
|
| | |
| Title of each class | Trading Symbol | Name of each exchange on which registered |
| Common Units Representing Limited Partner Interests | CQP | NYSE American |
Indicate by check mark whether the registrant (1) has filed all reports required to be filed by Section 13 or 15(d) of the Securities Exchange Act of 1934 during the preceding 12 months (or for such shorter period that the registrant was required to file such reports), and (2) has been subject to such filing requirements for the past 90 days. Yes ☒ No ☐
Indicate by check mark whether the registrant has submitted electronically every Interactive Data File required to be submitted pursuant to Rule 405 of Regulation S-T (§232.405 of this chapter) during the preceding 12 months (or for such shorter period that the registrant was required to submit such files). Yes ☒ No ☐
Indicate by check mark whether the registrant is a large accelerated filer, an accelerated filer, a non-accelerated filer, a smaller reporting company, or an emerging growth company. See the definitions of “large accelerated filer,” “accelerated filer,” “smaller reporting company” and “emerging growth company” in Rule 12b-2 of the Exchange Act.
|
| | | | | |
| | Large accelerated filer | ☒ | | Accelerated filer | ☐ |
| | Non-accelerated filer | ☐ | | Smaller reporting company | ☐ |
| | | | | Emerging growth company | ☐ |
If an emerging growth company, indicate by check mark if the registrant has elected not to use the extended transition period for complying with any new or revised financial accounting standards provided pursuant to Section 13(a) of the Exchange Act. ☐
Indicate by check mark whether the registrant is a shell company (as defined in Rule 12b-2 of the Exchange Act). Yes ☐ No ☒
As of October 25, 2019,April 24, 2020, the registrant had 348,629,792348,631,292 common units and 135,383,831 subordinated units outstanding.
CHENIERE ENERGY PARTNERS, L.P.
TABLE OF CONTENTS
DEFINITIONS
As used in this quarterly report, the terms listed below have the following meanings:
Common Industry and Other Terms
|
| | |
| Bcf | | billion cubic feet |
| Bcf/d | | billion cubic feet per day |
| Bcf/yr | | billion cubic feet per year |
| Bcfe | | billion cubic feet equivalent |
| DOE | | U.S. Department of Energy |
| EPC | | engineering, procurement and construction |
| FERC | | Federal Energy Regulatory Commission |
| FTA countries | | countries with which the United States has a free trade agreement providing for national treatment for trade in natural gas |
| GAAP | | generally accepted accounting principles in the United States |
| Henry Hub | | the final settlement price (in USD per MMBtu) for the New York Mercantile Exchange’s Henry Hub natural gas futures contract for the month in which a relevant cargo’s delivery window is scheduled to begin |
| LIBOR | | London Interbank Offered Rate |
| LNG | | liquefied natural gas, a product of natural gas that, through a refrigeration process, has been cooled to a liquid state, which occupies a volume that is approximately 1/600th of its gaseous state |
| MMBtu | | million British thermal units, an energy unit |
| mtpa | | million tonnes per annum |
| non-FTA countries | | countries with which the United States does not have a free trade agreement providing for national treatment for trade in natural gas and with which trade is permitted |
| SEC | | U.S. Securities and Exchange Commission |
| SPA | | LNG sale and purchase agreement |
| TBtu | | trillion British thermal units, an energy unit |
| Train | | an industrial facility comprised of a series of refrigerant compressor loops used to cool natural gas into LNG |
| TUA | | terminal use agreement |
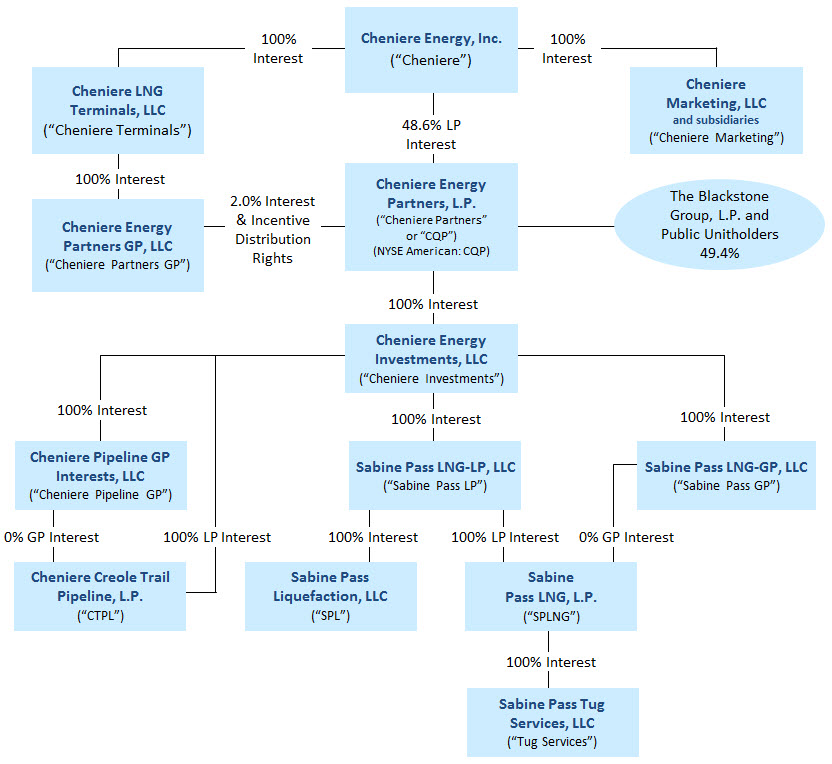
Abbreviated Legal Entity Structure
The following diagram depicts our abbreviated legal entity structure as of September 30, 2019,March 31, 2020, including our ownership of certain subsidiaries, and the references to these entities used in this quarterly report:
Unless the context requires otherwise, references to “Cheniere Partners,” “the Partnership,” “we,” “us” and “our” refer to Cheniere Energy Partners, L.P. and its consolidated subsidiaries, including SPLNG, SPL and CTPL.
References to “Blackstone Group” refer to The Blackstone Group, L.P. References to “Blackstone CQP Holdco” refer to Blackstone CQP Holdco LP. References to “Blackstone” refer to Blackstone Group and Blackstone CQP Holdco.
| |
| PART I. | FINANCIAL INFORMATION |
| |
| ITEM 1. | CONSOLIDATED FINANCIAL STATEMENTS |
CHENIERE ENERGY PARTNERS, L.P. AND SUBSIDIARIES
CONSOLIDATED BALANCE SHEETS
(in millions, except unit data)
| | | | | September 30, | | December 31, | | March 31, | | December 31, |
| | | 2019 | | 2018 | | 2020 | | 2019 |
| ASSETS | | (unaudited) | | | | (unaudited) | | |
| Current assets | | | | | | | | |
| Cash and cash equivalents | | $ | 1,707 |
| | $ | — |
| | $ | 1,734 |
| | $ | 1,781 |
|
| Restricted cash | | 185 |
| | 1,541 |
| | 109 |
| | 181 |
|
| Accounts and other receivables | | 277 |
| | 348 |
| | 259 |
| | 297 |
|
| Accounts receivable—affiliate | | 67 |
| | 114 |
| | 38 |
| | 105 |
|
| Advances to affiliate | | 177 |
| | 228 |
| | 146 |
| | 158 |
|
| Inventory | | 103 |
| | 99 |
| | 98 |
| | 116 |
|
| Derivative assets | | 8 |
| | 6 |
| | 13 |
| | 17 |
|
| Other current assets | | 65 |
| | 20 |
| | 49 |
| | 51 |
|
| Other current assets—affiliate | | | 2 |
| | 1 |
|
| Total current assets | | 2,589 |
| | 2,356 |
| | 2,448 |
| | 2,707 |
|
| | | | | | | | | |
| Property, plant and equipment, net | | 16,338 |
| | 15,390 |
| | 16,476 |
| | 16,368 |
|
| Operating lease assets, net | | 91 |
| | — |
| | 92 |
| | 94 |
|
| Debt issuance costs, net | | 17 |
| | 13 |
| | 20 |
| | 15 |
|
| Non-current derivative assets | | 29 |
| | 31 |
| | 41 |
| | 32 |
|
| Other non-current assets, net | | 157 |
| | 184 |
| | 156 |
| | 168 |
|
| Total assets | | $ | 19,221 |
| | $ | 17,974 |
| | $ | 19,233 |
| | $ | 19,384 |
|
| | | | | | | | | |
| LIABILITIES AND PARTNERS’ EQUITY | | | | | | | | |
| Current liabilities | | | | | | | | |
| Accounts payable | | $ | 17 |
| | $ | 15 |
| | $ | 8 |
| | $ | 40 |
|
| Accrued liabilities | | 657 |
| | 821 |
| | 569 |
| | 709 |
|
| Current debt | | | 1,996 |
| | — |
|
| Due to affiliates | | 40 |
| | 49 |
| | 30 |
| | 46 |
|
| Deferred revenue | | 169 |
| | 116 |
| | 94 |
| | 155 |
|
| Deferred revenue—affiliate | | — |
| | 1 |
| | — |
| | 1 |
|
| Current operating lease liabilities | | 6 |
| | — |
| | 6 |
| | 6 |
|
| Derivative liabilities | | 29 |
| | 66 |
| | 12 |
| | 9 |
|
| Total current liabilities | | 918 |
| | 1,068 |
| | 2,715 |
| | 966 |
|
| | | | | | | | | |
| Long-term debt, net | | 17,571 |
| | 16,066 |
| | 15,591 |
| | 17,579 |
|
| Non-current operating lease liabilities | | 84 |
| | — |
| | 85 |
| | 87 |
|
| Non-current derivative liabilities | | 32 |
| | 14 |
| | 2 |
| | 16 |
|
| Other non-current liabilities | | 4 |
| | 4 |
| | 1 |
| | 1 |
|
| Other non-current liabilities—affiliate | | 20 |
| | 22 |
| | 19 |
| | 20 |
|
| | | | | | | | | |
| Partners’ equity | | | | | | | | |
| Common unitholders’ interest (348.6 million units issued and outstanding at September 30, 2019 and December 31, 2018) | | 1,692 |
| | 1,806 |
| |
| Subordinated unitholders’ interest (135.4 million units issued and outstanding at September 30, 2019 and December 31, 2018) | | (1,035 | ) | | (990 | ) | |
| General partner’s interest (2% interest with 9.9 million units issued and outstanding at September 30, 2019 and December 31, 2018) | | (65 | ) | | (16 | ) | |
| Common unitholders’ interest (348.6 million units issued and outstanding at March 31, 2020 and December 31, 2019) | | | 1,879 |
| | 1,792 |
|
| Subordinated unitholders’ interest (135.4 million units issued and outstanding at March 31, 2020 and December 31, 2019) | | | (962 | ) | | (996 | ) |
| General partner’s interest (2% interest with 9.9 million units issued and outstanding at March 31, 2020 and December 31, 2019) | | | (97 | ) | | (81 | ) |
| Total partners’ equity | | 592 |
|
| 800 |
| | 820 |
|
| 715 |
|
| Total liabilities and partners’ equity | | $ | 19,221 |
| | $ | 17,974 |
| | $ | 19,233 |
| | $ | 19,384 |
|
The accompanying notes are an integral part of these consolidated financial statements.
3
CHENIERE ENERGY PARTNERS, L.P. AND SUBSIDIARIES
CONSOLIDATED STATEMENTS OF INCOME
(in millions, except per unit data)
(unaudited)
| | | | | Three Months Ended September 30, | | Nine Months Ended September 30, | | Three Months Ended March 31, |
| | | 2019 | | 2018 | | 2019 | | 2018 | | 2020 | | 2019 |
| Revenues | |
| |
| | | | | | | | |
| LNG revenues | | $ | 1,140 |
| | $ | 1,249 |
| | $ | 3,678 |
| | $ | 3,419 |
| | $ | 1,449 |
| | $ | 1,367 |
|
| LNG revenues—affiliate | | 257 |
| | 205 |
| | 1,017 |
| | 886 |
| | 188 |
| | 305 |
|
| Regasification revenues | | 66 |
| | 66 |
| | 199 |
| | 196 |
| | 67 |
| | 66 |
|
| Other revenues | | 13 |
| | 9 |
| | 36 |
| | 28 |
| | 14 |
| | 11 |
|
| Total revenues | | 1,476 |
| | 1,529 |
| | 4,930 |
| | 4,529 |
| | 1,718 |
| | 1,749 |
|
| | | | | | | | | | | | | |
| Operating costs and expenses | | |
| | | | | | | | | | |
| Cost of sales (excluding depreciation and amortization expense shown separately below) | | 742 |
| | 756 |
| | 2,501 |
| | 2,291 |
| |
| Cost of sales—affiliate | | 6 |
| | — |
| | 6 |
| | — |
| |
| Cost of sales (excluding items shown separately below) | | | 699 |
| | 879 |
|
| Operating and maintenance expense | | 172 |
| | 113 |
| | 472 |
| | 306 |
| | 152 |
| | 138 |
|
| Operating and maintenance expense—affiliate | | 34 |
| | 31 |
| | 100 |
| | 87 |
| | 33 |
| | 29 |
|
| Development expense | | — |
| | 1 |
| | — |
| | 2 |
| |
| General and administrative expense | | 3 |
| | 3 |
| | 9 |
| | 9 |
| | 2 |
| | 3 |
|
| General and administrative expense—affiliate | | 34 |
| | 18 |
| | 82 |
| | 53 |
| | 25 |
| | 21 |
|
| Depreciation and amortization expense | | 138 |
| | 107 |
| | 390 |
| | 318 |
| | 138 |
| | 114 |
|
| Impairment expense and loss on disposal of assets | | 1 |
| | 8 |
| | 6 |
| | 8 |
| | 5 |
| | 2 |
|
| Total operating costs and expenses | | 1,130 |
| | 1,037 |
| | 3,566 |
| | 3,074 |
| | 1,054 |
| | 1,186 |
|
| | | | | | | | | | | | | |
| Income from operations | | 346 |
| | 492 |
| | 1,364 |
| | 1,455 |
| | 664 |
| | 563 |
|
| | | | | | | | | | | | | |
| Other income (expense) | | |
| | | | | | | | | | |
| Interest expense, net of capitalized interest | | (231 | ) | | (183 | ) | | (648 | ) | | (552 | ) | | (234 | ) | | (187 | ) |
| Loss on modification or extinguishment of debt | | (13 | ) | | (12 | ) | | (13 | ) | | (12 | ) | | (1 | ) | | — |
|
| Derivative gain, net | | — |
| | 2 |
| | — |
| | 13 |
| |
| Other income | | 8 |
| | 8 |
| | 24 |
| | 19 |
| |
| Other income, net | | | 6 |
| | 9 |
|
| Total other expense | | (236 | ) | | (185 | ) | | (637 | ) | | (532 | ) | | (229 | ) | | (178 | ) |
| | | | | | | | | | | | | |
| Net income | | $ | 110 |
| | $ | 307 |
| | $ | 727 |
| | $ | 923 |
| | $ | 435 |
| | $ | 385 |
|
| | | | | | | | | | | | | |
| Basic and diluted net income per common unit | | $ | 0.19 |
| | $ | 0.60 |
| | $ | 1.38 |
| | $ | 1.82 |
| | $ | 0.84 |
| | $ | 0.75 |
|
| | | | | | | | | | | | | |
| Weighted average number of common units outstanding used for basic and diluted net income per common unit calculation | | 348.6 |
| | 348.6 |
| | 348.6 |
| | 348.6 |
| | 348.6 |
| | 348.6 |
|
The accompanying notes are an integral part of these consolidated financial statements.
4
CHENIERE ENERGY PARTNERS, L.P. AND SUBSIDIARIES
CONSOLIDATED STATEMENTS OF PARTNERS’ EQUITY
(in millions)
(unaudited)
|
| | | | | | | | | | | | | | | | | | | | | | | | |
| Three and Nine Months Ended September 30, 2019 | | | | | | | | | | | | | |
| | Common Unitholders’ Interest | | Subordinated Unitholder’s Interest | | General Partner’s Interest | | Total Partners’ Equity |
| | Units | | Amount | | Units | | Amount | | Units | | Amount | |
| Balance at December 31, 2018 | 348.6 |
|
| $ | 1,806 |
|
| 135.4 |
|
| $ | (990 | ) |
| 9.9 |
|
| $ | (16 | ) |
| $ | 800 |
|
| Net income | — |
| | 272 |
| | — |
| | 105 |
| | — |
| | 8 |
| | 385 |
|
| Distributions | | | | | | | | | | | | |
|
|
| Common units, $0.59/unit | — |
| | (206 | ) | | — |
| | — |
| | — |
| | — |
| | (206 | ) |
| Subordinated units, $0.59/unit | — |
| | — |
| | — |
| | (80 | ) | | — |
| | — |
| | (80 | ) |
| General partner units | — |
| | — |
| | — |
| | — |
| | — |
| | (18 | ) | | (18 | ) |
| Balance at March 31, 2019 | 348.6 |
| | 1,872 |
| | 135.4 |
| | (965 | ) | | 9.9 |
| | (26 | ) | | 881 |
|
| Net income | — |
| | 164 |
| | — |
| | 64 |
| | — |
| | 4 |
| | 232 |
|
| Distributions | | | | | | | | | | | | | |
| Common units, $0.60/unit | — |
| | (209 | ) | | — |
| | — |
| | — |
| | — |
| | (209 | ) |
| Subordinated units, $0.60/unit | — |
| | — |
| | — |
| | (81 | ) | | — |
| | — |
| | (81 | ) |
| General partner units | — |
| | — |
| | — |
| | — |
| | — |
| | (22 | ) | | (22 | ) |
| Balance at June 30, 2019 | 348.6 |
| | 1,827 |
| | 135.4 |
| | (982 | ) | | 9.9 |
| | (44 | ) | | 801 |
|
| Net income | — |
| | 77 |
| | — |
| | 30 |
| | — |
| | 3 |
| | 110 |
|
| Distributions | | | | | | | | | | | | |
|
|
| Common units, $0.61/unit | — |
| | (212 | ) | | — |
| | — |
| | — |
| | — |
| | (212 | ) |
| Subordinated units, $0.61/unit | — |
| | — |
| | — |
| | (83 | ) | | — |
| | — |
| | (83 | ) |
| General partner units | — |
| | — |
| | — |
| | — |
| | — |
| | (24 | ) | | (24 | ) |
| Balance at September 30, 2019 | 348.6 |
| | $ | 1,692 |
| | 135.4 |
| | $ | (1,035 | ) | | 9.9 |
| | $ | (65 | ) | | $ | 592 |
|
|
| | | | | | | | | | | | | | | | | | | | | | | | |
| Three Months Ended March 31, 2020 | | | | | | | | | | | | | |
| | Common Unitholders’ Interest | | Subordinated Unitholder’s Interest | | General Partner’s Interest | | Total Partners’ Equity |
| | Units | | Amount | | Units | | Amount | | Units | | Amount | |
| Balance at December 31, 2019 | 348.6 |
|
| $ | 1,792 |
|
| 135.4 |
|
| $ | (996 | ) |
| 9.9 |
|
| $ | (81 | ) |
| $ | 715 |
|
| Net income | — |
| | 307 |
| | — |
| | 119 |
| | — |
| | 9 |
| | 435 |
|
| Distributions | | | | | | | | | | | | |
|
|
| Common units, $0.63/unit | — |
| | (220 | ) | | — |
| | — |
| | — |
| | — |
| | (220 | ) |
| Subordinated units, $0.63/unit | — |
| | — |
| | — |
| | (85 | ) | | — |
| | — |
| | (85 | ) |
| General partner units | — |
| | — |
| | — |
| | — |
| | — |
| | (25 | ) | | (25 | ) |
| Balance at March 31, 2020 | 348.6 |
| | $ | 1,879 |
| | 135.4 |
| | $ | (962 | ) | | 9.9 |
| | $ | (97 | ) | | $ | 820 |
|
|
| | | | | | | | | | | | | | | | | | | | | | | | |
| Three Months Ended March 31, 2019 | | | | | | | | | | | | | |
| | Common Unitholders’ Interest | | Subordinated Unitholder’s Interest | | General Partner’s Interest | | Total Partners’ Equity |
| | Units | | Amount | | Units | | Amount | | Units | | Amount | |
| Balance at December 31, 2018 | 348.6 |
| | $ | 1,806 |
| | 135.4 |
| | $ | (990 | ) | | 9.9 |
| | $ | (16 | ) | | $ | 800 |
|
| Net income | — |
| | 272 |
| | — |
| | 105 |
| | — |
| | 8 |
| | 385 |
|
| Distributions | | | | | | | | | | | | | |
| Common units, $0.59/unit | — |
| | (206 | ) | | — |
| | — |
| | — |
| | — |
| | (206 | ) |
| Subordinated units, $0.59/unit | — |
| | — |
| | — |
| | (80 | ) | | — |
| | — |
| | (80 | ) |
| General partner units | — |
| | — |
| | — |
| | — |
| | — |
| | (18 | ) | | (18 | ) |
| Balance at March 31, 2019 | 348.6 |
| | $ | 1,872 |
| | 135.4 |
| | $ | (965 | ) | | 9.9 |
| | $ | (26 | ) | | $ | 881 |
|
The accompanying notes are an integral part of these consolidated financial statements.
5
CHENIERE ENERGY PARTNERS, L.P. AND SUBSIDIARIES
CONSOLIDATED STATEMENTS OF PARTNERS’ EQUITY—CONTINUED
(in millions)
(unaudited)
|
| | | | | | | | | | | | | | | | | | | | | | | | |
| Three and Nine Months Ended September 30, 2018 | | | | | | | | | | | | | |
| | Common Unitholders’ Interest | | Subordinated Unitholder’s Interest | | General Partner’s Interest | | Total Partners’ Equity |
| | Units | | Amount | | Units | | Amount | | Units | | Amount | |
| Balance at December 31, 2017 | 348.6 |
| | $ | 1,670 |
| | 135.4 |
| | $ | (1,043 | ) | | 9.9 |
| | $ | 12 |
| | $ | 639 |
|
| Net income | — |
| | 236 |
| | — |
| | 92 |
| | — |
| | 7 |
| | 335 |
|
| Distributions | | | | | | | | | | | | |
|
|
| Common units, $0.50/unit | — |
| | (175 | ) | | — |
| | — |
| | — |
| | — |
| | (175 | ) |
| Subordinated units, $0.50/unit | — |
| | — |
| | — |
| | (68 | ) | | — |
| | — |
| | (68 | ) |
| General partner units | — |
| | — |
| | — |
| | — |
| | — |
| | (6 | ) | | (6 | ) |
| Balance at March 31, 2018 | 348.6 |
| | 1,731 |
| | 135.4 |
| | (1,019 | ) | | 9.9 |
| | 13 |
| | 725 |
|
| Net income | — |
| | 199 |
| | — |
| | 77 |
| | — |
| | 5 |
| | 281 |
|
| Distributions | | | | | | | | | | | | | |
| Common units, $0.55/unit | — |
| | (191 | ) | | — |
| | — |
| | — |
| | — |
| | (191 | ) |
| Subordinated units, $0.55/unit | — |
| | — |
| | — |
| | (74 | ) | | — |
| | — |
| | (74 | ) |
| General partner units | — |
| | — |
| | — |
| | — |
| | — |
| | (13 | ) | | (13 | ) |
| Balance at June 30, 2018 | 348.6 |
| | 1,739 |
| | 135.4 |
| | (1,016 | ) | | 9.9 |
| | 5 |
| | 728 |
|
| Net income | — |
| | 216 |
| | — |
| | 84 |
| | — |
| | 7 |
| | 307 |
|
| Distributions | | | | | | | | | | | | |
|
|
| Common units, $0.56/unit | — |
| | (196 | ) | | — |
| | — |
| | — |
| | — |
| | (196 | ) |
| Subordinated units, $0.56/unit | — |
| | — |
| | — |
| | (76 | ) | | — |
| | — |
| | (76 | ) |
| General partner units | — |
| | — |
| | — |
| | — |
| | — |
| | (15 | ) | | (15 | ) |
| Balance at September 30, 2018 | 348.6 |
| | $ | 1,759 |
| | 135.4 |
| | $ | (1,008 | ) | | 9.9 |
| | $ | (3 | ) | | $ | 748 |
|
The accompanying notes are an integral part of these consolidated financial statements.
6
CHENIERE ENERGY PARTNERS, L.P. AND SUBSIDIARIES
CONSOLIDATED STATEMENTS OF CASH FLOWS
(in millions)
(unaudited)
| | | | Nine Months Ended September 30, | Three Months Ended March 31, |
| | 2019 | | 2018 | 2020 | | 2019 |
| Cash flows from operating activities | | | | | | |
| Net income | $ | 727 |
| | $ | 923 |
| $ | 435 |
| | $ | 385 |
|
| Adjustments to reconcile net income to net cash provided by operating activities: | | | | | | |
| Depreciation and amortization expense | 390 |
| | 318 |
| 138 |
| | 114 |
|
| Amortization of debt issuance costs, deferred commitment fees, premium and discount | 23 |
| | 24 |
| |
| Amortization of debt issuance costs, premium and discount | | 9 |
| | 6 |
|
| Loss on modification or extinguishment of debt | 13 |
| | 12 |
| 1 |
| | — |
|
| Total losses (gains) on derivatives, net | (30 | ) | | 29 |
| |
| Net cash provided by (used for) settlement of derivative instruments | 11 |
| | — |
| |
| Total gains on derivatives, net | | (21 | ) | | (77 | ) |
| Net cash provided by settlement of derivative instruments | | 5 |
| | 5 |
|
| Impairment expense and loss on disposal of assets | 6 |
| | 8 |
| 5 |
| | 2 |
|
| Other | 8 |
| | 5 |
| 3 |
| | 2 |
|
| Changes in operating assets and liabilities: | | | | | | |
| Accounts and other receivables | 36 |
| | (33 | ) | 38 |
| | 105 |
|
| Accounts receivable—affiliate | 47 |
| | 140 |
| 67 |
| | 1 |
|
| Advances to affiliate | (47 | ) | | (79 | ) | 17 |
| | (26 | ) |
| Inventory | (3 | ) | | 6 |
| 19 |
| | (9 | ) |
| Accounts payable and accrued liabilities | (209 | ) | | (77 | ) | (100 | ) | | (131 | ) |
| Due to affiliates | (3 | ) | | (5 | ) | (13 | ) | | (14 | ) |
| Deferred revenue | 54 |
| | 6 |
| (61 | ) | | (10 | ) |
| Other, net | (42 | ) | | (10 | ) | (3 | ) | | (7 | ) |
| Other, net—affiliate | (4 | ) | | (3 | ) | (4 | ) | | (2 | ) |
| Net cash provided by operating activities | 977 |
| | 1,264 |
| 535 |
| | 344 |
|
| | | | | | | |
| Cash flows from investing activities | |
| | |
| |
| | |
|
| Property, plant and equipment, net | (1,156 | ) | | (578 | ) | (317 | ) | | (283 | ) |
| Other | (1 | ) | | — |
| — |
| | (1 | ) |
| Net cash used in investing activities | (1,157 | ) | | (578 | ) | (317 | ) | | (284 | ) |
| | | | | | | |
| Cash flows from financing activities | |
| | |
| |
| | |
|
| Proceeds from issuances of debt | 2,230 |
| | 1,100 |
| |
| Repayments of debt | (730 | ) | | (1,090 | ) | |
| Debt issuance and deferred financing costs | (33 | ) | | (8 | ) | |
| Debt extinguishment costs | (4 | ) | | (6 | ) | |
| Debt issuance and other financing costs | | (7 | ) | | — |
|
| Distributions to owners | (935 | ) | | (814 | ) | (330 | ) | | (304 | ) |
| Other | 3 |
| | — |
| |
| Net cash provided by (used in) financing activities | 531 |
| | (818 | ) | |
| Net cash used in financing activities | | (337 | ) | | (304 | ) |
| | | | | | | |
| Net increase (decrease) in cash, cash equivalents and restricted cash | 351 |
| | (132 | ) | |
| Net decrease in cash, cash equivalents and restricted cash | | (119 | ) | | (244 | ) |
| Cash, cash equivalents and restricted cash—beginning of period | 1,541 |
| | 1,589 |
| 1,962 |
| | 1,541 |
|
| Cash, cash equivalents and restricted cash—end of period | $ | 1,892 |
| | $ | 1,457 |
| $ | 1,843 |
| | $ | 1,297 |
|
Balances per Consolidated Balance Sheet:
| | | | | March 31, |
| | September 30, 2019 | 2020 |
| Cash and cash equivalents | $ | 1,707 |
| $ | 1,734 |
|
| Restricted cash | 185 |
| 109 |
|
| Total cash, cash equivalents and restricted cash | $ | 1,892 |
| $ | 1,843 |
|
The accompanying notes are an integral part of these consolidated financial statements.
76
CHENIERE ENERGY PARTNERS, L.P. AND SUBSIDIARIES
NOTES TO CONSOLIDATED FINANCIAL STATEMENTS
(unaudited)
NOTE 1—NATURE OF OPERATIONS AND BASIS OF PRESENTATION
Through SPL, we are in various stages of operating and constructing 6 natural gas liquefaction Trains (the “Liquefaction Project”) at theThe Sabine Pass LNG terminal is located in Cameron Parish, Louisiana, on the Sabine-Neches Waterway less than four miles from the Gulf Coast. Through our subsidiary, SPL, we are currently operating 5 natural gas liquefaction Trains and are constructing 1 additional Train for a total production capacity of approximately 30 mtpa of LNG (the “Liquefaction Project”) at the Sabine Pass LNG terminal. Through our subsidiary, SPLNG, we own and operate regasification facilities atTrains 1 through 5 are operational and Train 6 is under construction. The the Sabine Pass LNG terminal, has operational regasification facilities owned by SPLNG andwhich includes pre-existing infrastructure of 5 LNG storage tanks, 2 marine berths and vaporizers. We also own a 94-mile pipeline owned bythrough our subsidiary, CTPL, that interconnects the Sabine Pass LNG terminal with a number of large interstate pipelines.pipelines (the “Creole Trail Pipeline”).
Basis of Presentation
The accompanying unaudited Consolidated Financial Statements of Cheniere Partners have been prepared in accordance with GAAP for interim financial information and with Rule 10-01 of Regulation S-X. Accordingly, they do not include all of the information and footnotes required by GAAP for complete financial statements and should be read in conjunction with the Consolidated Financial Statements and accompanying notes included in our annual report on Form 10-K for the year ended December 31, 20182019.
Results of operations for the three and nine months ended September 30, 2019March 31, 2020 are not necessarily indicative of the results of operations that will be realized for the year ending December 31, 2019.2020.
We are not subject to either federal or state income tax, as our partners are taxed individually on their allocable share of our taxable income.
Recent Accounting Standards
We adopted ASU 2016-02,In March 2020, the Financial Accounting Standards Board (“FASB”) issued Accounting Standards Update (“ASU”) 2020-04, LeasesReference Rate Reform (Topic 842)848): Facilitation of the Effects of Reference Rate Reform on Financial Reporting,. This guidance primarily provides temporary optional expedients which simplify the accounting for contract modifications to existing debt agreements expected to arise from the market transition from LIBOR to alternative reference rates. The optional expedients were available to be used upon issuance of this guidance but we have not yet applied the guidance because we have not yet modified any of our existing contracts for reference rate reform. Once we apply an optional expedient to a modified contract and adopt this standard, the guidance will be applied to all subsequent amendments thereto (“ASC 842”) on January 1, 2019 usingapplicable contract modifications until December 31, 2022, at which time the optional transition approach to apply the standard at the beginning of the first quarter of 2019 withexpedients are no retrospective adjustments to prior periods. The adoption of the standard resulted in the recognition of right-of-use assets and lease liabilities for operating leases of approximately $100 million on our Consolidated Balance Sheets, with no material impact on our Consolidated Statements of Income or Consolidated Statements of Cash Flows. We have elected the practical expedients to (1) carryforward prior conclusions related to lease identification and classification for existing leases, (2) combine lease and non-lease components of an arrangement for all classes of leased assets, (3) omit short-term leases with a term of 12 months or less from recognition on the balance sheet and (4) carryforward our existing accounting for land easements not previously accounted for as leases. See Note 11—Leases for additional information on our leases following the adoption of this standard.longer available.
NOTE 2—UNITHOLDERS’ EQUITY
The common units and subordinated units represent limited partner interests in us. The holders of the units are entitled to participate in partnership distributions and exercise the rights and privileges available to limited partners under our partnership agreement. Our partnership agreement requires that, within 45 days after the end of each quarter, we distribute all of our available cash (as defined in our partnership agreement). Generally, our available cash is our cash on hand at the end of a quarter less the amount of any reserves established by our general partner. All distributions paid to date have been made from accumulated operating surplus as defined in the partnership agreement.
The holders of common units have the right to receive initial quarterly distributions of $0.425 per common unit, plus any arrearages thereon, before any distribution is made to the holders of the subordinated units. The holders of subordinated units will receive distributions only to the extent we have available cash above the initial quarterly distribution requirement for our common unitholders and general partner and certain reserves. Subordinated units will convert into common units on a one-for-one basis when we meet financial tests specified in the partnership agreement. Although common and subordinated unitholders are not obligated to fund losses of the Partnership, their capital accounts, which would be considered in allocating the net assets of the Partnership were it to be liquidated, continue to share in losses.
The general partner interest is entitled to at least 2% of all distributions made by us. In addition, the general partner holds incentive distribution rights (“IDRs”), which allow the general partner to receive a higher percentage of quarterly distributions of available cash from operating surplus after the initial quarterly distributions have been achieved and as additional target levels are
CHENIERE ENERGY PARTNERS, L.P. AND SUBSIDIARIES
NOTES TO CONSOLIDATED FINANCIAL STATEMENTS—CONTINUED
(unaudited)
available cash from operating surplus after the initial quarterly distributions have been achieved and as additional target levels are met, but may transfer these rights separately from its general partner interest. The higher percentages range from 15% to 50%, inclusive of the general partner interest.
As of September 30, 2019,March 31, 2020, Cheniere, Blackstone CQP Holdco LP (“Blackstone CQP Holdco”) and the public owned a 48.6%, 40.3%41.2% and 9.1%8.2% interest in us, respectively. Cheniere’s ownership percentage includes its subordinated units and Blackstone CQP Holdco’s ownership percentage excludes any common units that may be deemed to be beneficially owned by Blackstone Group, an affiliate of Blackstone CQP Holdco.
NOTE 3—RESTRICTED CASH
Restricted cash consists of funds that are contractually or legally restricted as to usage or withdrawal and have been presented separately from cash and cash equivalents on our Consolidated Balance Sheets. As of September 30, 2019March 31, 2020 and December 31, 2018,2019, we had $109 million and $181 million of current restricted cash, consisted of the following (in millions):
|
| | | | | | | | |
| | | September 30, | | December 31, |
| | | 2019 | | 2018 |
| Current restricted cash | | | | |
| Liquefaction Project | | $ | 185 |
| | $ | 756 |
|
| Cash held by us and our guarantor subsidiaries | | — |
| | 785 |
|
| Total current restricted cash | | $ | 185 |
| | $ | 1,541 |
|
Pursuant to the accounts agreement entered into with the collateral trustee for the benefit of SPL’s debt holders, SPL is required to deposit all cash received into reserve accounts controlled by the collateral trustee. The usage or withdrawal of such cash is restricted to the payment of liabilities related to the Liquefaction Project and other restricted payments.
The cash held by us and our guarantor subsidiaries was restricted in use under the terms of the previous $2.8 billion credit facilities (the “2016 CQP Credit Facilities”) and the related depositary agreement governing the extension of credit to us, but is no longer restricted following the termination of the 2016 CQP Credit Facilities. Amounts not classified as restricted have been reserved by our general partner under the terms of our partnership agreement.
NOTE 4—ACCOUNTS AND OTHER RECEIVABLES
As of September 30, 2019March 31, 2020 and December 31, 2018,2019, accounts and other receivables consisted of the following (in millions):
| | | | | September 30, | | December 31, | | March 31, | | December 31, |
| | | 2019 | | 2018 | | 2020 | | 2019 |
| SPL trade receivable | | $ | 261 |
| | $ | 330 |
| | $ | 248 |
| | $ | 283 |
|
| Other accounts receivable | | 16 |
| | 18 |
| | 11 |
| | 14 |
|
| Total accounts and other receivables | | $ | 277 |
| | $ | 348 |
| | $ | 259 |
| | $ | 297 |
|
NOTE 5—INVENTORY
As of September 30, 2019March 31, 2020 and December 31, 2018,2019, inventory consisted of the following (in millions):
| | | | | September 30, | | December 31, | | March 31, | | December 31, |
| | | 2019 | | 2018 | | 2020 | | 2019 |
| Natural gas | | $ | 15 |
| | $ | 28 |
| | $ | 11 |
| | $ | 9 |
|
| LNG | | 7 |
| | 6 |
| | 7 |
| | 27 |
|
| Materials and other | | 81 |
| | 65 |
| | 80 |
| | 80 |
|
| Total inventory | | $ | 103 |
| | $ | 99 |
| | $ | 98 |
| | $ | 116 |
|
NOTE 6—PROPERTY, PLANT AND EQUIPMENT
As of March 31, 2020 and December 31, 2019, property, plant and equipment, net consisted of the following (in millions):
|
| | | | | | | | |
| | | March 31, | | December 31, |
| | | 2020 | | 2019 |
| LNG terminal costs | | | | |
| LNG terminal and interconnecting pipeline facilities | | $ | 16,917 |
| | $ | 16,894 |
|
| LNG terminal construction-in-process | | 1,495 |
| | 1,275 |
|
| Accumulated depreciation | | (1,943 | ) | | (1,807 | ) |
| Total LNG terminal costs, net | | 16,469 |
| | 16,362 |
|
| Fixed assets | | |
| | |
|
| Fixed assets | | 29 |
| | 27 |
|
| Accumulated depreciation | | (22 | ) | | (21 | ) |
| Total fixed assets, net | | 7 |
| | 6 |
|
| Property, plant and equipment, net | | $ | 16,476 |
| | $ | 16,368 |
|
CHENIERE ENERGY PARTNERS, L.P. AND SUBSIDIARIES
NOTES TO CONSOLIDATED FINANCIAL STATEMENTS—CONTINUED
(unaudited)
NOTE 6—PROPERTY, PLANT AND EQUIPMENT
As of September 30, 2019 and December 31, 2018, property, plant and equipment, net consisted of the following (in millions):
|
| | | | | | | | |
| | | September 30, | | December 31, |
| | | 2019 | | 2018 |
| LNG terminal costs | | | | |
| LNG terminal and interconnecting pipeline facilities | | $ | 16,807 |
| | $ | 12,760 |
|
| LNG terminal construction-in-process | | 1,196 |
| | 3,913 |
|
| Accumulated depreciation | | (1,671 | ) | | (1,290 | ) |
| Total LNG terminal costs, net | | 16,332 |
| | 15,383 |
|
| Fixed assets | | |
| | |
|
| Fixed assets | | 26 |
| | 26 |
|
| Accumulated depreciation | | (20 | ) | | (19 | ) |
| Total fixed assets, net | | 6 |
| | 7 |
|
| Property, plant and equipment, net | | $ | 16,338 |
| | $ | 15,390 |
|
Depreciation expense was $136$137 million and $104$113 million during the three months ended September 30,March 31, 2020 and 2019, and 2018, respectively, and $386 million and $310 million during the nine months ended September 30, 2019 and 2018, respectively.
We realized offsets to LNG terminal costs of $48 million during the ninethree months ended September 30,March 31, 2019 that were related to the sale of commissioning cargoes because these amounts were earned or loaded prior to the start of commercial operations of the respective Trains of the Liquefaction Project, during the testing phase for its construction. We did 0t realize any offsets to LNG terminal costs during the three months ended September 30, 2019 and in the three and nine months ended September 30, 2018.March 31, 2020.
NOTE 7—DERIVATIVE INSTRUMENTS
We have entered into the following derivative instruments that are reported at fair value:
interest rate swaps to hedge the exposure to volatility in a portion of the floating-rate interest payments under certain credit facilities (“Interest Rate Derivatives”) and
commodity derivatives consisting of natural gas supply contracts for the commissioning and operation of the Liquefaction Project (“Physical Liquefaction Supply Derivatives”) and associated economic hedges (collectively, the “Liquefaction Supply Derivatives”).
We recognize our derivative instruments as either assets or liabilities and measure those instruments at fair value. None of our derivative instruments are designated as cash flow or fair value hedging instruments, and changes in fair value are recorded within our Consolidated Statements of Income to the extent not utilized for the commissioning process.
The following table shows the fair value of our derivative instruments that are required to be measured at fair value on a recurring basis as of September 30, 2019March 31, 2020 and December 31, 2018,2019, which are classified as derivative assets, non-current derivative assets, derivative liabilities or non-current derivative liabilities in our Consolidated Balance Sheets (in millions).
|
| | | | | | | | | | | | | | | | | | | | | | | | | | | | | | | |
| | Fair Value Measurements as of |
| | September 30, 2019 | | December 31, 2018 |
| | Quoted Prices in Active Markets (Level 1) | | Significant Other Observable Inputs (Level 2) | | Significant Unobservable Inputs (Level 3) | | Total | | Quoted Prices in Active Markets (Level 1) | | Significant Other Observable Inputs (Level 2) | | Significant Unobservable Inputs (Level 3) | | Total |
| Liquefaction Supply Derivatives asset (liability) | $ | (6 | ) | | $ | (10 | ) | | $ | (8 | ) | | $ | (24 | ) | | $ | 5 |
| | $ | (23 | ) | | $ | (25 | ) | | $ | (43 | ) |
|
| | | | | | | | | | | | | | | | | | | | | | | | | | | | | | | |
| | Fair Value Measurements as of |
| | March 31, 2020 | | December 31, 2019 |
| | Quoted Prices in Active Markets (Level 1) | | Significant Other Observable Inputs (Level 2) | | Significant Unobservable Inputs (Level 3) | | Total | | Quoted Prices in Active Markets (Level 1) | | Significant Other Observable Inputs (Level 2) | | Significant Unobservable Inputs (Level 3) | | Total |
| Liquefaction Supply Derivatives asset (liability) | $ | (1 | ) | | $ | (8 | ) | | $ | 49 |
| | $ | 40 |
| | $ | 3 |
| | $ | (3 | ) | | $ | 24 |
| | $ | 24 |
|
We value our Liquefaction Supply Derivatives using a market-based approach incorporating present value techniques, as needed, using observable commodity price curves, when available, and other relevant data.
CHENIERE ENERGY PARTNERS, L.P. AND SUBSIDIARIES
NOTES TO CONSOLIDATED FINANCIAL STATEMENTS—CONTINUED
(unaudited)
The fair value of our Physical Liquefaction Supply Derivatives is predominantly driven by observable and unobservable market commodity prices and, as applicable to our natural gas supply contracts, our assessment of the associated events deriving fair value, including evaluating whether the respective market is available as pipeline infrastructure is developed. The fair value of our Physical Liquefaction Supply Derivatives incorporates risk premiums related to the satisfaction of conditions precedent, such as completion and placement into service of relevant pipeline infrastructure to accommodate marketable physical gas flow. As of September 30, 2019March 31, 2020 and December 31, 2018,2019, some of our Physical Liquefaction Supply Derivatives existed within markets for which the pipeline infrastructure was under development to accommodate marketable physical gas flow.
We include a portion of our Physical Liquefaction Supply Derivatives as Level 3 within the valuation hierarchy as the fair value is developed through the use of internal models which may be impacted by inputsincorporate significant unobservable inputs. In instances where observable data is unavailable, consideration is given to the assumptions that aremarket participants would use in valuing the asset or liability. This includes assumptions about market risks, such as future prices of energy units for unobservable in the marketplace. The curves used to generate the fair value of our Physical Liquefaction Supply Derivatives are based on basis adjustments applied to forward curves for a liquid trading point. In addition, there may be observable liquid market basis information in the near term, but terms of a Physical Liquefaction Supply Derivativesperiods, liquidity, volatility and contract may exceed the period for which such information is available, resulting in a Level 3 classification. In these instances, the fair value of the contract incorporates extrapolation assumptions made in the determination of the market basis price for future delivery periods in which applicable commodity basis prices were either not observable or lacked corroborative market data.duration.
CHENIERE ENERGY PARTNERS, L.P. AND SUBSIDIARIES
NOTES TO CONSOLIDATED FINANCIAL STATEMENTS—CONTINUED
(unaudited)
The Level 3 fair value measurements of natural gas positions within our Physical Liquefaction Supply Derivatives could be materially impacted by a significant change in certain natural gas market basis spreads due to the contractual notional amount represented by our Level 3 positions, which is a substantial portion of our overall Physical Liquefaction Supply Derivatives portfolio.prices. The following table includes quantitative information for the unobservable inputs for our Level 3 Physical Liquefaction Supply Derivatives as of September 30, 2019:March 31, 2020:
|
| | | | | | | | |
| | | Net Fair Value LiabilityAsset (in millions) | | Valuation Approach | | Significant Unobservable Input | | Range of Significant Unobservable Inputs Range/ Weighted Average (1) |
| Physical Liquefaction Supply Derivatives | | $(8)49 | | Market approach incorporating present value techniques | | Henry Hub basis spread | | $(0.618)(0.380) - $0.056$0.054 / 0.007 |
(1) Unobservable inputs were weighted by the relative fair value of the instruments.
Increases or decreases in basis, in isolation, would decrease or increase, respectively, the fair value of our Physical Liquefaction Supply Derivatives.
The following table shows the changes in the fair value of our Level 3 Physical Liquefaction Supply Derivatives during the three and nine months ended September 30,March 31, 2020 and 2019 and 2018 (in millions):
| | | | | Three Months Ended September 30, | | Nine Months Ended September 30, | | Three Months Ended March 31, |
| | | 2019 | | 2018 | | 2019 | | 2018 | | 2020 | | 2019 |
| Balance, beginning of period | | $ | 34 |
| | $ | 11 |
| | $ | (25 | ) | | $ | 43 |
| | $ | 24 |
| | $ | (25 | ) |
| Realized and mark-to-market gains (losses): | | | | | | | | | |
| Realized and mark-to-market gains: | | | | | |
| Included in cost of sales | | (42 | ) | | 4 |
| | (22 | ) | | (5 | ) | | 25 |
| | 9 |
|
| Purchases and settlements: | | | | | | | | | | | | |
| Purchases | | (1 | ) | | 4 |
| | (4 | ) | | 8 |
| | 1 |
| | — |
|
| Settlements | | 1 |
| | 1 |
| | 43 |
| | (27 | ) | | (3 | ) | | 45 |
|
| Transfers out of Level 3 (1) | | — |
| | (1 | ) | | — |
| | — |
| | 2 |
| | — |
|
| Balance, end of period | | $ | (8 | ) | | $ | 19 |
| | $ | (8 | ) | | $ | 19 |
| | $ | 49 |
| | $ | 29 |
|
| Change in unrealized gains (losses) relating to instruments still held at end of period | | $ | (42 | ) | | $ | 4 |
| | $ | (22 | ) | | $ | (5 | ) | |
| Change in unrealized gains relating to instruments still held at end of period | | | $ | 25 |
| | $ | 9 |
|
(1) Transferred to Level 2 as a result of observable market for the underlying natural gas purchase agreements.
Derivative assets and liabilities arising from our derivative contracts with the same counterparty are reported on a net basis, as all counterparty derivative contracts provide for the unconditional right of set-off in the event of default. The use of derivative instruments exposes us to counterparty credit risk, or the risk that a counterparty will be unable to meet its commitments in instances when our derivative instruments are in an asset position. Additionally, counterparties are at risk that we will be unable to meet our commitments in instances where our derivative instruments are in a liability position. We incorporate both our own nonperformance risk and the respective counterparty’s nonperformance risk in fair value measurements. In adjusting the fair value of our derivative contracts for the effect of nonperformance risk, we have considered the impact of netting and any applicable credit enhancements, such as collateral postings, set-off rights and guarantees.
CHENIERE ENERGY PARTNERS, L.P. AND SUBSIDIARIES
NOTES TO CONSOLIDATED FINANCIAL STATEMENTS—CONTINUED
(unaudited)
Interest Rate Derivatives
We previously had interest rate swaps (“CQP Interest Rate Derivatives” and, collectively with the CCH Interest Rate Derivatives and the CCH Interest Rate Forward Start Derivatives, the “Interest Rate Derivatives”) to hedge a portion of the variable interest payments on our credit facilities. In October 2018, we terminated the CQP Interest Rate Derivatives related to the 2016 CQP Credit Facilities and realized a derivative gain of $28 million.
Liquefaction Supply Derivatives
SPL has entered into primarily index-based physical natural gas supply contracts and associated economic hedges to purchase natural gas for the commissioning and operation of the Liquefaction Project. The remaining terms of the physical natural gas supply contracts range up to ten10 years, some of which commence upon the satisfaction of certain events or states of affairs.
SPL had secured up to approximately 4,108 TBtu and 3,464 TBtu of natural gas feedstock through natural gas supply contracts as of September 30, 2019 and December 31, 2018, respectively. The notional natural gas position of our Liquefaction Supply Derivatives was approximately 3,8805,231 TBtu and 2,9783,663 TBtu as of September 30, 2019March 31, 2020 and December 31, 2018, respectively.2019, respectively, of which 91 TBtu and 0 TBtu, respectively, were for a natural gas supply contract that SPL has with a related party.
CHENIERE ENERGY PARTNERS, L.P. AND SUBSIDIARIES
NOTES TO CONSOLIDATED FINANCIAL STATEMENTS—CONTINUED
(unaudited)
The following table shows the fair value and location of our Liquefaction Supply Derivatives on our Consolidated Balance Sheets (in millions):
| | | | | Fair Value Measurements as of (1) | | Fair Value Measurements as of (1) |
| Consolidated Balance Sheet Location | | September 30, 2019 | | December 31, 2018 | | March 31, 2020 | | December 31, 2019 |
| Derivative assets | | $ | 8 |
| | $ | 6 |
| | $ | 13 |
| | $ | 17 |
|
| Non-current derivative assets | | 29 |
| | 31 |
| | 41 |
| | 32 |
|
| Total derivative assets | | 37 |
| | 37 |
| | 54 |
| | 49 |
|
| | | | | | | | | |
| Derivative liabilities | | (29 | ) | | (66 | ) | | (12 | ) | | (9 | ) |
| Non-current derivative liabilities | | (32 | ) | | (14 | ) | | (2 | ) | | (16 | ) |
| Total derivative liabilities | | (61 | ) | | (80 | ) | | (14 | ) | | (25 | ) |
| | | | | | | | | |
| Derivative liability, net | | $ | (24 | ) | | $ | (43 | ) | |
| Derivative asset, net | | | $ | 40 |
| | $ | 24 |
|
| |
| (1) | Does not include collateral callsposted with counterparties by us of $10$6 million and $1$2 million for such contracts, which are included in other current assets in our Consolidated Balance Sheets as of September 30, 2019March 31, 2020 and December 31, 2018,2019, respectively. Includes a natural gas supply contract that SPL has with a related party, which had a fair value of 0 as of March 31, 2020. |
The following table shows the changes in the fair value, settlements and location of our Liquefaction Supply Derivatives recorded on our Consolidated Statements of Income during the three and nine months ended September 30,March 31, 2020 and 2019 and 2018 (in millions):
| | | | | Three Months Ended September 30, | | Nine Months Ended September 30, | | Three Months Ended March 31, |
| | Consolidated Statement of Income Location (1) | | 2019 | | 2018 | | 2019 | | 2018 | Consolidated Statement of Income Location (1) | | 2020 | | 2019 |
| Liquefaction Supply Derivatives gain | LNG revenues | | $ | 1 |
| | $ | — |
| | $ | 2 |
| | $ | — |
| LNG revenues | | $ | — |
| | $ | 1 |
|
| Liquefaction Supply Derivatives gain (loss) | Cost of sales | | (55 | ) | | 10 |
| | 28 |
| | (42 | ) | |
| Liquefaction Supply Derivatives gain | | Cost of sales | | 21 |
| | 76 |
|
| |
| (1) | Does not include the realized value associated with derivative instruments that settle through physical delivery. Fair value fluctuations associated with commodity derivative activities are classified and presented consistently with the item economically hedged and the nature and intent of the derivative instrument. |
CHENIERE ENERGY PARTNERS, L.P. AND SUBSIDIARIES
NOTES TO CONSOLIDATED FINANCIAL STATEMENTS—CONTINUED
(unaudited)
Consolidated Balance Sheet Presentation
Our derivative instruments are presented on a net basis on our Consolidated Balance Sheets as described above. The following table shows the fair value of our derivatives outstanding on a gross and net basis (in millions):
| | | | | Gross Amounts Recognized | | Gross Amounts Offset in the Consolidated Balance Sheets | | Net Amounts Presented in the Consolidated Balance Sheets | | Gross Amounts Recognized | | Gross Amounts Offset in the Consolidated Balance Sheets | | Net Amounts Presented in the Consolidated Balance Sheets |
| Offsetting Derivative Assets (Liabilities) | | |
| As of September 30, 2019 | | | | | | | |
| As of March 31, 2020 | | | | | | | |
| Liquefaction Supply Derivatives | | $ | 40 |
| | $ | (3 | ) | | $ | 37 |
| | $ | 56 |
| | $ | (2 | ) | | $ | 54 |
|
| Liquefaction Supply Derivatives | | (63 | ) | | 2 |
| | (61 | ) | | (15 | ) | | 1 |
| | (14 | ) |
| As of December 31, 2018 | | | | | | | |
| As of December 31, 2019 | | | | | | | |
| Liquefaction Supply Derivatives | | $ | 63 |
| | $ | (26 | ) | | $ | 37 |
| | $ | 51 |
| | $ | (2 | ) | | $ | 49 |
|
| Liquefaction Supply Derivatives | | (92 | ) | | 12 |
| | (80 | ) | | (27 | ) | | 2 |
| | (25 | ) |
CHENIERE ENERGY PARTNERS, L.P. AND SUBSIDIARIES
NOTES TO CONSOLIDATED FINANCIAL STATEMENTS—CONTINUED
(unaudited)
NOTE 8—OTHER NON-CURRENT ASSETS
As of September 30, 2019March 31, 2020 and December 31, 2018,2019, other non-current assets, net consisted of the following (in millions):
| | | | | September 30, | | December 31, | | March 31, | | December 31, |
| | | 2019 | | 2018 | | 2020 | | 2019 |
| Advances made to municipalities for water system enhancements | | $ | 88 |
| | $ | 90 |
| | $ | 86 |
| | $ | 87 |
|
| Advances and other asset conveyances to third parties to support LNG terminals | | 35 |
| | 36 |
| |
| Tax-related payments and receivables | | 17 |
| | 17 |
| |
| Advances and other asset conveyances to third parties to support LNG terminal | | | 35 |
| | 35 |
|
| Tax-related prepayments and receivables | | | 17 |
| | 17 |
|
| Information technology service prepayments | | 8 |
| | 20 |
| | 5 |
| | 6 |
|
| Advances made under EPC and non-EPC contracts | | 2 |
| | 14 |
| | 7 |
| | 15 |
|
| Other | | 7 |
| | 7 |
| | 6 |
| | 8 |
|
| Total other non-current assets, net | | $ | 157 |
| | $ | 184 |
| | $ | 156 |
| | $ | 168 |
|
NOTE 9—ACCRUED LIABILITIES
As of September 30, 2019March 31, 2020 and December 31, 2018,2019, accrued liabilities consisted of the following (in millions):
| | | | | September 30, | | December 31, | | March 31, | | December 31, |
| | | 2019 | | 2018 | | 2020 | | 2019 |
| Interest costs and related debt fees | | $ | 217 |
| | $ | 224 |
| | $ | 251 |
| | $ | 241 |
|
| Accrued natural gas purchases | | 254 |
| | 518 |
| | 224 |
| | 325 |
|
| LNG terminal and related pipeline costs | | 161 |
| | 79 |
| | 81 |
| | 135 |
|
| Other accrued liabilities | | 25 |
| | — |
| | 13 |
| | 8 |
|
| Total accrued liabilities | | $ | 657 |
| | $ | 821 |
| | $ | 569 |
| | $ | 709 |
|
CHENIERE ENERGY PARTNERS, L.P. AND SUBSIDIARIES
NOTES TO CONSOLIDATED FINANCIAL STATEMENTS—CONTINUED
(unaudited)
NOTE 10—DEBT
As of September 30, 2019March 31, 2020 and December 31, 2018,2019, our debt consisted of the following (in millions):
| | | | | September 30, | | December 31, | | March 31, | | December 31, |
| | | 2019 | | 2018 | | 2020 | | 2019 |
| Long-term debt: | | | | | | | | |
| SPL | | | | | | | | |
| 5.625% Senior Secured Notes due 2021 (“2021 SPL Senior Notes”) | | $ | 2,000 |
| | $ | 2,000 |
| | $ | — |
| | $ | 2,000 |
|
| 6.25% Senior Secured Notes due 2022 (“2022 SPL Senior Notes”) | | 1,000 |
| | 1,000 |
| | 1,000 |
| | 1,000 |
|
| 5.625% Senior Secured Notes due 2023 (“2023 SPL Senior Notes”) | | 1,500 |
| | 1,500 |
| | 1,500 |
| | 1,500 |
|
| 5.75% Senior Secured Notes due 2024 (“2024 SPL Senior Notes”) | | 2,000 |
| | 2,000 |
| | 2,000 |
| | 2,000 |
|
| 5.625% Senior Secured Notes due 2025 (“2025 SPL Senior Notes”) | | 2,000 |
| | 2,000 |
| | 2,000 |
| | 2,000 |
|
| 5.875% Senior Secured Notes due 2026 (“2026 SPL Senior Notes”) | | 1,500 |
| | 1,500 |
| | 1,500 |
| | 1,500 |
|
| 5.00% Senior Secured Notes due 2027 (“2027 SPL Senior Notes”) | | 1,500 |
| | 1,500 |
| | 1,500 |
| | 1,500 |
|
| 4.200% Senior Secured Notes due 2028 (“2028 SPL Senior Notes”) | | 1,350 |
| | 1,350 |
| | 1,350 |
| | 1,350 |
|
| 5.00% Senior Secured Notes due 2037 (“2037 SPL Senior Notes”) | | 800 |
| | 800 |
| | 800 |
| | 800 |
|
$1.2 billion SPL Working Capital Facility executed in 2020 (“2020 SPL Working Capital Facility”)
| | | — |
| | — |
|
| Cheniere Partners | | | | | | | | |
| 5.250% Senior Notes due 2025 (“2025 CQP Senior Notes”) | | 1,500 |
| | 1,500 |
| | 1,500 |
| | 1,500 |
|
| 5.625% Senior Notes due 2026 (“2026 CQP Senior Notes”) | | 1,100 |
| | 1,100 |
| | 1,100 |
| | 1,100 |
|
| 4.500% Senior Notes due 2029 (“2029 CQP Senior Notes”) | | 1,500 |
| | — |
| | 1,500 |
| | 1,500 |
|
| 2016 CQP Credit Facilities | | — |
| | — |
| |
| CQP Credit Facilities entered into in 2019 (“2019 CQP Credit Facilities”) | | — |
| | — |
| |
| CQP Credit Facilities executed in 2019 (“2019 CQP Credit Facilities”) | | | — |
| | — |
|
| Unamortized premium, discount and debt issuance costs, net | | (179 | ) | | (184 | ) | | (159 | ) | | (171 | ) |
| Total long-term debt, net | | 17,571 |
| | 16,066 |
| | 15,591 |
|
| 17,579 |
|
| | | | | | | | | |
| Current debt: | | | | | | | | |
| $1.2 billion SPL Working Capital Facility (“SPL Working Capital Facility”) | | — |
| | — |
| |
| 2021 SPL Senior Notes | | | 2,000 |
| | — |
|
| $1.2 billion SPL Working Capital Facility executed in 2015 (“2015 SPL Working Capital Facility”) | | | — |
| | — |
|
| Unamortized premium, discount and debt issuance costs, net | | | (4 | ) | | — |
|
| Total current debt | | | 1,996 |
| | — |
|
| | | | | | | | | |
| Total debt, net | | $ | 17,571 |
| | $ | 16,066 |
| | $ | 17,587 |
| | $ | 17,579 |
|
20192020 Material Debt Issuances and TerminationsActivities
2029 CQP Senior Notes2020 SPL Working Capital Facility
In September 2019, we issued anMarch 2020, SPL entered into the 2020 SPL Working Capital Facility with aggregate principal amountcommitments of $1.5$1.2 billion, which replaced the 2015 SPL Working Capital Facility. The 2020 SPL Working Capital Facility is intended to be used for loans to SPL (“SPL Revolving Loans”), swing line loans to SPL (“SPL Swing Line Loans”) and the issuance of letters of credit on behalf of SPL, primarily for (1) the refinancing of the 2029 CQP Senior Notes, which are jointly2015 SPL Working Capital Facility, (2) fees and severally guaranteed by each of our subsidiaries other thanexpenses related to the 2020 SPL Working Capital Facility, (3) SPL’s gas purchase obligations and (4) SPL and subjectcertain of its future subsidiaries’ general corporate purposes. SPL may, from time to certain conditions governing its guarantee, Sabine Pass LP (the “CQP Guarantors”). The proceeds oftime, request increases in the offering were used to prepay the outstanding balance of the $750 million term loancommitments under the 2019 CQP Credit Facilities (“CQP Term Facility”) and for general corporate purposes, including funding future capital expenditures in connection with the construction2020 SPL Working Capital Facility of Train 6 at the Liquefaction Project, resulting in the recognition of debt modification and extinguishment costs of $13 million for the three and nine months ended September 30, 2019. As of September 30, 2019, only the $750 million revolving credit facility (“CQP Revolving Facility”), all of which is undrawn, remains as part of the 2019 CQP Credit Facilities.up to $800 million.
BorrowingsLoans under the 2029 CQP Senior Notes2020 SPL Working Capital Facility accrue interest at a fixedvariable rate of 4.500% per annum equal to LIBOR or the base rate (equal to the highest of the senior facility agent’s published prime rate, the federal funds rate, as published by the Federal Reserve Bank of New York, plus 0.50% and one month LIBOR plus 0.50%), plus the applicable margin. The applicable margin for LIBOR loans under the 2020 SPL Working Capital Facility is 1.125% to 1.750% per annum (depending on the then-current rating of SPL), and the applicable margin for base rate loans under the 2020 SPL Working Capital Facility is 0.125% to 0.750% per annum (depending on the then-current rating of SPL). Interest on LIBOR loans is due and payable at the end of each applicable LIBOR period, and interest on base rate loans is due and payable at the 2029 CQP Senior Notes is payable semi-annually in cash in arrears. The 2029 CQP Senior Notes are governed by the same base indenture as the 2025 CQP Senior Notes and the 2026 CQP Senior Notes (the “CQP Base Indenture”), and are further governed by the Third Supplemental Indenture (together with the CQP Base Indenture, the “2029 CQP Notes Indenture”), which contains customary terms and eventsend of default and certain covenants that, among other things, limit our ability and the ability of the CQP Guarantors to incur liens and sell assets, enter into transactions with affiliates, enter into sale-leaseback transactions and consolidate, merge or sell, lease or otherwise dispose of all or substantially all of the applicable entity’s properties or assets.each fiscal quarter.
At any time prior to October 1, 2024, we may redeem all or a part of the 2029 CQP Senior Notes at a redemption price equal to 100% of the aggregate principal amount of the 2029 CQP Senior Notes redeemed, plus the “applicable premium” set forth in the 2029 CQP Notes Indenture, plus accrued and unpaid interest, if any, to the date of redemption. In addition, at any time prior to October 1, 2022, we may redeem up to 35% of the aggregate principal amount of the 2029 CQP Senior Notes with an amount
CHENIERE ENERGY PARTNERS, L.P. AND SUBSIDIARIES
NOTES TO CONSOLIDATED FINANCIAL STATEMENTS—CONTINUED
(unaudited)
of cash not greater than the net cash proceeds from certain equity offerings atSPL pays a redemption pricecommitment fee equal to 104.5%an annual rate of 0.1% to 0.3% (depending on the then-current rating of SPL), which accrues on the daily amount of the aggregatetotal commitment less the sum of (1) the outstanding principal amount of SPL Revolving Loans, (2) letters of credit issued and (3) the 2029 CQP Senior Notes redeemed, plus accrued and unpaid interest, if any, to the date of redemption. At any time on or after October 1, 2024 through the maturity date of October 1, 2029, we may redeem the 2029 CQP Senior Notes, in whole or in part, at the redemption prices set forth in the 2029 CQP Notes Indenture.
The 2025 CQP Senior Notes, the 2026 CQP Senior Notes and the 2029 CQP Senior Notes (collectively, the “CQP Senior Notes”) are our senior obligations, ranking equally in right of payment with our other existing and future unsubordinated debt and senior to any of our future subordinated debt. In the event that the aggregateoutstanding principal amount of our secured indebtedness and the secured indebtednessSPL Swing Line Loans. If draws are made upon a letter of the CQP Guarantors (other than the CQP Senior Notes or any other series of notescredit issued under the CQP Base Indenture) outstanding at any one time exceeds2020 SPL Working Capital Facility and SPL does not elect for such draw to be deemed an SPL LC Loan (an “SPL LC Draw”), SPL is required to pay the greater of (1) $1.5 billion and (2) 10% of net tangible assets, the CQP Senior Notes will be secured to the same extent as such obligations under the 2019 CQP Credit Facilities. The obligations under the 2019 CQP Credit Facilities are secured on a first-priority basis (subject to permitted encumbrances) with liens on (1) substantially all the existing and future tangible and intangible assets and our rights and the rightsfull amount of the CQP Guarantors and equity interests inSPL LC Draw on or prior to noon eastern time on the CQP Guarantors (except, in each case, for certain excluded properties set forth in the 2019 CQP Credit Facilities) and (2) substantially allbusiness day of the real property of SPLNG (except for excluded properties referenced in the 2019 CQP Credit Facilities). The liens securing the CQP Senior Notes, if applicable, will be shared equally and ratably (subject to permitted liens) with the holders of other senior secured obligations, which include the 2019 CQP Credit Facilities obligations and any future additional senior secured debt obligations.
In connection with the closing of the 2029 CQP Senior Notes offering, we and the CQP Guarantors entered into a registration rights agreement (the “CQP Registration Rights Agreement”). Under the CQP Registration Rights Agreement, we and the CQP Guarantors have agreed to file with the SEC and cause to become effective a registration statement relating to an offer to exchange any and all of the 2029 CQP Senior Notes for a like aggregate principal amount of our debt securities with terms identical in all material respects to the 2029 CQP Senior Notes sought to be exchanged (other than with respect to restrictions on transfer or to any increase in annual interest rate), within 360 days after the notes issuance date of September 12, 2019. Under specified circumstances, we and the CQP Guarantors have also agreed to cause to become effective a shelf registration statement relating to resales of the 2029 CQP Senior Notes. We will be obligated to pay additional interest on the 2029 CQP Senior Notes if we fail to comply with our obligation to register the 2029 CQP Senior Notes within the specified time period.
2016 CQP Credit Facilities
In May 2019, the remaining commitments under the 2016 CQP Credit Facilities were terminated. There were 0 write-offs of discounts, premiums and debt issuance costs associated with the termination of the 2016 CQP Credit Facilities.
2019 CQP Credit Facilities
In May 2019, we entered into the 2019 CQP Credit Facilities, which consisted of the $750 million CQP Term Facility, which was prepaid and terminated upon issuance of the 2029 CQP Senior Notes in September 2019, and the $750 million CQP Revolving Facility. Borrowings under the 2019 CQP Credit Facilities will be used to fund the development and construction of Train 6 of the Liquefaction Project and for general corporate purposes, subject to a sublimit, and the 2019 CQP Credit Facilities are also available for the issuance of letters of credit.
Loans under the 2019 CQP Credit Facilities accrueSPL LC Draw. An SPL LC Draw accrues interest at a variable rate per annum equal to LIBOR or the base rate (equal to the highest of the prime rate, the federal funds effective rate, as published by the Federal Reserve Bank of New York, plus 0.50%, and the adjusted one-month LIBOR plus 1.0%), plus the applicable margin. UnderAs of March 31, 2020, 0 SPL LC Draws had been made upon any letters of credit issued under the CQP Term Facility, the applicable margin for LIBOR loans was 1.50% per annum, and the applicable margin for base rate loans was 0.50% per annum. Under the CQP Revolving Facility, the applicable margin for LIBOR loans is 1.25% to 2.125% per annum, and the applicable margin for base rate loans is 0.25% to 1.125% per annum, in each case depending on our then-current rating. Interest on LIBOR loans is due and payable at the end of each applicable LIBOR period (and at the end of every three-month period within the LIBOR period, if any), and interest on base rate loans is due and payable at the end of each calendar quarter.2020 SPL Working Capital Facility.
The 2019 CQP Credit Facilities mature2020 SPL Working Capital Facility matures on May 29, 2024. Any outstanding balanceMarch 19, 2025, but may be repaid, in whole or in part, at any time without premium or penalty, exceptextended with consent of the lenders. The 2020 SPL Working Capital Facility provides for interest rate breakage costs. mandatory prepayments under customary circumstances.
The 2019 CQP Credit Facilities contain2020 SPL Working Capital Facility contains customary conditions precedent for extensions of credit, as well as customary affirmative and negative covenants,covenants. SPL is restricted from making certain distributions under agreements governing its indebtedness generally until, among other requirements, satisfaction of a 12-month forward-looking and limit our ability to make restricted
backward-looking 1.25:1.00 debt service reserve ratio test. The obligations of SPL under the 2020 SPL Working Capital Facility are secured by substantially all of the assets of SPL as well as a pledge of all of the membership interests in SPL and certain future subsidiaries of SPL on a CHENIERE ENERGY PARTNERS, L.P. AND SUBSIDIARIESpari passu
NOTES TO CONSOLIDATED FINANCIAL STATEMENTS—CONTINUED
(unaudited)
payments, including distributions, to once per fiscal quarter and one true-up per fiscal quarter as long as certain conditions are satisfied.
The 2019 CQP Credit Facilities are unconditionally guaranteed and securedbasis by a first priority lien (subject to permitted encumbrances) on substantially all of our andwith the CQP Guarantors’ existing and future tangible and intangible assets and rights and equity interests in the CQP Guarantors (except, in each case, for certain excluded properties set forth in the 2019 CQP Credit Facilities).SPL Senior Notes.
Credit Facilities
Below is a summary of our credit facilities outstanding as of September 30, 2019March 31, 2020 (in millions):
| | | | | SPL Working Capital Facility (1) | | 2019 CQP Credit Facilities | | 2020 SPL Working Capital Facility | | 2019 CQP Credit Facilities |
| Original facility size | | $ | 1,200 |
| | $ | 1,500 |
| | $ | 1,200 |
| | $ | 1,500 |
|
| Less: | | | | | | | | |
| Outstanding balance | | — |
| | — |
| | — |
| | — |
|
| Commitments prepaid or terminated | | — |
| | 750 |
| | — |
| | 750 |
|
| Letters of credit issued | | 414 |
| | — |
| | 414 |
| | — |
|
| Available commitment | | $ | 786 |
|
| $ | 750 |
| | $ | 786 |
| | $ | 750 |
|
| | | | | | | | | |
| Interest rate on available balance | | LIBOR plus 1.75% or base rate plus 0.75% | | LIBOR plus 1.25% - 2.125% or base rate plus 0.25% - 1.125% | | LIBOR plus 1.125% - 1.750% or base rate plus 0.125% - 0.750% | | LIBOR plus 1.25% - 2.125% or base rate plus 0.25% - 1.125% |
| Weighted average interest rate of outstanding balance | | | n/a | | n/a |
| Maturity date | | December 31, 2020 | | May 29, 2024 | | March 19, 2025 | | May 29, 2024 |
| |
(1) | The SPL Working Capital Facility was amended in May 2019 in connection with commercialization and financing of Train 6 of the Liquefaction Project. All terms of the SPL Working Capital Facility substantially remained unchanged. |
Restrictive Debt Covenants
As of September 30, 2019,March 31, 2020, we and SPL were in compliance with all covenants related to our respective debt agreements.
Interest Expense
Total interest expense consisted of the following (in millions):
|
| | | | | | | | | | | | | | | | |
| | | Three Months Ended September 30, | | Nine Months Ended September 30, |
| | | 2019 | | 2018 | | 2019 | | 2018 |
| Total interest cost | | $ | 246 |
| | $ | 235 |
| | $ | 718 |
| | $ | 701 |
|
| Capitalized interest | | (15 | ) | | (52 | ) | | (70 | ) | | (149 | ) |
| Total interest expense, net | | $ | 231 |
| | $ | 183 |
| | $ | 648 |
| | $ | 552 |
|
|
| | | | | | | | |
| | | Three Months Ended March 31, |
| | | 2020 | | 2019 |
| Total interest cost | | $ | 254 |
| | $ | 235 |
|
| Capitalized interest | | (20 | ) | | (48 | ) |
| Total interest expense, net | | $ | 234 |
|
| $ | 187 |
|
Fair Value Disclosures
The following table shows the carrying amount, which is net of unamortized premium, discount and debt issuance costs, and estimated fair value of our debt (in millions):
|
| | | | | | | | | | | | | | | | |
| | | September 30, 2019 | | December 31, 2018 |
| | | Carrying Amount | | Estimated Fair Value | | Carrying Amount | | Estimated Fair Value |
| Senior notes (1) | | $ | 16,780 |
| | $ | 18,340 |
| | $ | 15,275 |
| | $ | 15,672 |
|
| 2037 SPL Senior Notes (2) | | 791 |
| | 909 |
| | 791 |
| | 817 |
|
| Credit facilities (3) | | — |
| | — |
| | — |
| | — |
|
| |
(1) | Includes 2021 SPL Senior Notes, 2022 SPL Senior Notes, 2023 SPL Senior Notes, 2024 SPL Senior Notes, 2025 SPL Senior Notes, 2026 SPL Senior Notes, 2027 SPL Senior Notes, 2028 SPL Senior Notes, 2025 CQP Senior Notes, 2026 |
CHENIERE ENERGY PARTNERS, L.P. AND SUBSIDIARIES
NOTES TO CONSOLIDATED FINANCIAL STATEMENTS—CONTINUED
(unaudited)
CQP Senior NotesFair Value Disclosures
The following table shows the carrying amount and 2029 CQP Senior Notes. The Level 2 estimated fair value was based on quotes obtained from broker-dealers or market makers of these senior notes and other similar instruments.our debt (in millions):
|
| | | | | | | | | | | | | | | | |
| | | March 31, 2020 | | December 31, 2019 |
| | | Carrying Amount | | Estimated Fair Value | | Carrying Amount | | Estimated Fair Value |
| Senior notes (1) | | $ | 16,950 |
| | $ | 15,762 |
| | $ | 16,950 |
| | $ | 18,320 |
|
| 2037 SPL Senior Notes (2) | | 800 |
| | 709 |
| | 800 |
| | 934 |
|
| Credit facilities (3) | | — |
| | — |
| | — |
| | — |
|
| |
| (1) | Includes the SPL Senior Notes except the 2037 SPL Senior Notes and the CQP Senior Notes. The Level 2 estimated fair value was based on quotes obtained from broker-dealers or market makers of these senior notes and other similar instruments. |
| |
| (2) | The Level 3 estimated fair value was calculated based on inputs that are observable in the market or that could be derived from, or corroborated with, observable market data, including our stock price and interest rates based on debt issued by parties with comparable credit ratings to us and inputs that are not observable in the market. |
| |
| (3) | Includes 2015 SPL Working Capital Facility, 2016 CQP Credit Facilities2020 SPL Working Capital Facility and 2019 CQP Credit Facilities. The Level 3 estimated fair value approximates the principal amount because the interest rates are variable and reflective of market rates and the debt may be repaid, in full or in part, at any time without penalty. |
NOTE 11—LEASES
Our leased assets consist primarily of tug vessels and land sites, all of which are classified as operating leases.
ASC 842 requires a lessee to recognize leases on its balance sheet by recording a lease liability representing the obligation to make future lease payments and a right-of-use asset representing the right to use the underlying asset for the lease term. As our leases generally do not provide an implicit rate, in order to calculate the lease liability, we discounted our expected future lease payments using our relevant subsidiary’s incremental borrowing rate at the later of January 1, 2019 or the commencement date of the lease. The incremental borrowing rate is an estimate of the rate of interest that a given subsidiary would have to pay to borrow on a collateralized basis over a similar term to that of the lease term.
Many of our leases contain renewal options exercisable at our sole discretion. Options to renew a lease are included in the lease term and recognized as part of the right-of-use asset and lease liability only to the extent they are reasonably certain to be exercised, such as when necessary to satisfy obligations that existed at the execution of the lease or when the non-renewal would otherwise result in an economic penalty.
We have elected the practical expedient to omit leases with an initial term of 12 months or less (“short-term lease”) from recognition on the balance sheet. We recognize short-term lease payments on a straight-line basis over the lease term and variable payments under short-term leases in the period in which the obligation is incurred.
Certain of our leases contain non-lease components which are not separated from the lease components when calculating the right-of-use asset and lease liability per our use of the practical expedient to combine both components of an arrangement for all classes of leased assets.
Certain of our leases also contain variable payments, such as inflation, that are not included when calculating the right-of-use asset and lease liability unless the payments are in-substance fixed. We recognize lease expense for operating leases on a straight-line basis over the lease term.
The following table shows the classification and location of our right-of-use assets and lease liabilities on our Consolidated Balance Sheets (in millions):
|
| | | | | |
| | Consolidated Balance Sheet Location | | September 30, 2019 |
| Right-of-use assets—Operating | Operating lease assets, net | | $ | 91 |
|
| Current operating lease liabilities | Current operating lease liabilities | | 6 |
|
| Non-current operating lease liabilities | Non-current operating lease liabilities | | 84 |
|
The following table shows the classification and location of our lease cost on our Consolidated Statements of Income (in millions):
|
| | | | | | | | | |
| | Consolidated Statement of Income Location | | Three Months Ended September 30, 2019 | | Nine Months Ended September 30, 2019 |
| Operating lease cost (1) | Operating costs and expenses (2) | | $ | 2 |
| | $ | 8 |
|
(1) Includes $1 million of variable lease costs.
CHENIERE ENERGY PARTNERS, L.P. AND SUBSIDIARIES
NOTES TO CONSOLIDATED FINANCIAL STATEMENTS—CONTINUED
(unaudited)
| |
(2) | Presented in cost of sales, operating and maintenance expense, general and administrative expense or general and administrative expense—affiliate consistent with the nature of the asset under lease. |
Future annual minimum lease payments for operating leases as of September 30, 2019 are as follows (in millions):
|
| | | |
| Years Ending December 31, | Operating Leases |
| 2019 | $ | 3 |
|
| 2020 | 10 |
|
| 2021 | 10 |
|
| 2022 | 10 |
|
| 2023 | 10 |
|
| Thereafter | 125 |
|
| Total lease payments | 168 |
|
| Less: Interest | (78 | ) |
| Present value of lease liabilities | $ | 90 |
|
Future annual minimum lease payments for operating leases as of December 31, 2018, prepared in accordance with accounting standards prior to the adoption of ASC 842, were as follows (in millions):
|
| | | |
| Years Ending December 31, | Operating Leases (1) |
| 2019 | $ | 10 |
|
| 2020 | 10 |
|
| 2021 | 10 |
|
| 2022 | 10 |
|
| 2023 | 10 |
|
| Thereafter | 124 |
|
| Total | $ | 174 |
|
| |
(1) | Includes certain lease option renewals that are reasonably assuredand payments for certain non-lease components.
|
The following table shows the weighted-average remaining lease term (in years) and the weighted-average discount rate for our operating leases:
|
| | |
| September 30, 2019 |
Weighted-average remaining lease term (in years) | 25.9 |
|
Weighted-average discount rate | 4.8 | % |
The following table includes other quantitative information for our operating leases (in millions):
|
| | | |
| | Nine Months Ended September 30, 2019 |
| Cash paid for amounts included in the measurement of lease liabilities: | |
| Operating cash flows for operating leases | $ | 7 |
|
CHENIERE ENERGY PARTNERS, L.P. AND SUBSIDIARIES
NOTES TO CONSOLIDATED FINANCIAL STATEMENTS—CONTINUED
(unaudited)
NOTE 12—REVENUES FROM CONTRACTS WITH CUSTOMERS
The following table represents a disaggregation of revenue earned from contracts with customers during the three and nine months ended September 30,March 31, 2020 and 2019 and 2018 (in millions):
| | | | | Three Months Ended September 30, | | Nine Months Ended September 30, | | Three Months Ended March 31, |
| | | 2019 | | 2018 | | 2019 | | 2018 | | 2020 | | 2019 |
LNG revenues | | $ | 1,139 |
| | $ | 1,249 |
| | $ | 3,676 |
| | $ | 3,419 |
| | $ | 1,449 |
| | $ | 1,366 |
|
| LNG revenues—affiliate | | 257 |
| | 205 |
| | 1,017 |
| | 886 |
| | 188 |
| | 305 |
|
| Regasification revenues | | 66 |
| | 66 |
| | 199 |
| | 196 |
| | 67 |
| | 66 |
|
| Other revenues | | 13 |
| | 9 |
| | 36 |
| | 28 |
| | 14 |
| | 11 |
|
| Total revenues from customers | | 1,475 |
|
| 1,529 |
| | 4,928 |
| | 4,529 |
| | 1,718 |
| | 1,748 |
|
Net derivative gains (1)(2) | | 1 |
| | — |
| | 2 |
| | — |
| | — |
| | 1 |
|
| Total revenues | | $ | 1,476 |
|
| $ | 1,529 |
| | $ | 4,930 |
| | $ | 4,529 |
| | $ | 1,718 |
| | $ | 1,749 |
|
| |
| (1) | LNG revenues include revenues for LNG cargoes in which our customers exercised their contractual right to not take delivery but remained obligated to pay fixed fees irrespective of such election. If contractually the customer cannot make up unexercised quantities in future periods, our performance obligation with respect to declined volumes is satisfied, and revenue associated with any unexercised quantities is generally recognized upon notice of customer cancellation. |
Deferred Revenue Reconciliation
The following table reflects the changes in our contract liabilities, which we classify as deferred revenue on our Consolidated Balance Sheets (in millions):
| | | | | Nine Months Ended September 30, 2019 | | Three Months Ended March 31, 2020 |
| Deferred revenues, beginning of period | | $ | 116 |
| | $ | 155 |
|
| Cash received but not yet recognized | | 169 |
| | 94 |
|
| Revenue recognized from prior period deferral | | (116 | ) | | (155 | ) |
| Deferred revenues, end of period | | $ | 169 |
| | $ | 94 |
|
CHENIERE ENERGY PARTNERS, L.P. AND SUBSIDIARIES
NOTES TO CONSOLIDATED FINANCIAL STATEMENTS—CONTINUED
(unaudited)
Transaction Price Allocated to Future Performance Obligations
Because many of our sales contracts have long-term durations, we are contractually entitled to significant future consideration which we have not yet recognized as revenue. The following table discloses the aggregate amount of the transaction price that is allocated to performance obligations that have not yet been satisfied as of September 30, 2019March 31, 2020 and December 31, 2018:2019:
| | | | | September 30, 2019 | | December 31, 2018 | | March 31, 2020 | | December 31, 2019 |
| | | Unsatisfied
Transaction Price
(in billions) | | Weighted Average Recognition Timing (years) (1) | | Unsatisfied
Transaction Price
(in billions) | | Weighted Average Recognition Timing (years) (1) | | Unsatisfied
Transaction Price
(in billions) | | Weighted Average Recognition Timing (years) (1) | | Unsatisfied
Transaction Price
(in billions) | | Weighted Average Recognition Timing (years) (1) |
| LNG revenues (2) | | $ | 55.7 |
| | 10 | | $ | 53.6 |
| | 10 | | $ | 54.2 |
| | 10 | | $ | 55.0 |
| | 10 |
| Regasification revenues | | 2.4 |
| | 5 | | 2.6 |
| | 6 | | 2.3 |
| | 5 | | 2.4 |
| | 5 |
| Total revenues | | $ | 58.1 |
| | $ | 56.2 |
| | | $ | 56.5 |
| | $ | 57.4 |
| |
| |
| (1) | The weighted average recognition timing represents an estimate of the number of years during which we shall have recognized half of the unsatisfied transaction price. |
| |
| (2) | Includes future consideration from agreement contractually assigned to SPL from Cheniere Marketing. |
We have elected the following exemptions which omit certain potential future sources of revenue from the table above:
| |
| (1) | We omit from the table above all performance obligations that are part of a contract that has an original expected duration of one year or less. |
| |
| (2) | The table above excludes substantially all variable consideration under our SPAs and TUAs. We omit from the table above all variable consideration that is allocated entirely to a wholly unsatisfied performance obligation or to a wholly unsatisfied promise to transfer a distinct good or service that forms part of a single performance obligation when that performance obligation qualifies as a series. The table above excludes substantially all variable consideration under our SPAs and TUAs. The amount of revenue from variable fees that is not included in the transaction price will vary based on the future prices of Henry Hub throughout the contract terms, to the extent customers elect to take delivery of their LNG, and adjustments to the consumer price index. Certain of our contracts contain additional variable consideration based on the outcome of contingent events and the movement of various indexes. We have not included such variable consideration in the transaction price to the extent the consideration is considered constrained due to the uncertainty of ultimate pricing and receipt. Approximately 44% and 58% of our LNG revenues from contracts with a duration of over one year during the three months ended March 31, 2020 and 2019, respectively, were related to variable consideration received from customers. During each of the three months ended March 31, 2020 and 2019, approximately 3% of our regasification revenues were related to variable consideration received from customers. All of our LNG revenues—affiliate were related to variable consideration received from customers during each of the three months ended March 31, 2020 and 2019. |
CHENIERE ENERGY PARTNERS, L.P. AND SUBSIDIARIES
NOTES TO CONSOLIDATED FINANCIAL STATEMENTS—CONTINUED
(unaudited)
customers elect to take delivery of their LNG, and adjustments to the consumer price index. Approximately 49% and 55% of our LNG revenues during the three months ended September 30, 2019 and 2018, respectively, and approximately 53% and 55% of our LNG revenues during the nine months ended September 30, 2019 and 2018, respectively, were related to variable consideration received from customers. During each of the three and nine months ended September 30, 2019 and 2018, approximately 3% of our regasification revenues were related to variable consideration received from customers. All of our LNG revenues—affiliate were related to variable consideration received from customers during each of the three and nine months ended September 30, 2019 and 2018.
We have entered into contracts to sell LNG that are conditioned upon one or both of the parties achieving certain milestones such as reaching a final investment decision on a certain liquefaction Train, obtaining financing or achieving substantial completion of a Train and any related facilities. These contracts are considered completed contracts for revenue recognition purposes and are included in the transaction price above when the conditions are considered probable of being met.
CHENIERE ENERGY PARTNERS, L.P. AND SUBSIDIARIES
NOTES TO CONSOLIDATED FINANCIAL STATEMENTS—CONTINUED
(unaudited)
NOTE 13—12—RELATED PARTY TRANSACTIONS
Below is a summary of our related party transactions as reported on our Consolidated Statements of Income for the three and nine months ended September 30,March 31, 2020 and 2019 and 2018 (in millions):
| | | | | Three Months Ended September 30, | | Nine Months Ended September 30, | | Three Months Ended March 31, |
| | | 2019 | | 2018 | | 2019 | | 2018 | | 2020 | | 2019 |
| LNG revenues—affiliate | LNG revenues—affiliate | | | | | | | | LNG revenues—affiliate | | | |
| Cheniere Marketing Agreements | Cheniere Marketing Agreements | $ | 255 |
| | $ | 205 |
| | $ | 1,015 |
| | $ | 886 |
| Cheniere Marketing Agreements | $ | 182 |
| | $ | 305 |
|
| Contracts for Sale and Purchase of Natural Gas and LNG | Contracts for Sale and Purchase of Natural Gas and LNG | 2 |
| | — |
| | 2 |
| | — |
| Contracts for Sale and Purchase of Natural Gas and LNG | 6 |
| | — |
|
| Total LNG revenues—affiliate | Total LNG revenues—affiliate | 257 |
| | 205 |
| | 1,017 |
| | 886 |
| Total LNG revenues—affiliate | 188 |
| | 305 |
|
| | | | | | | | | | | | | |
| Cost of sales—affiliate | | | | | | | | |
| Contracts for Sale and Purchase of Natural Gas and LNG | 6 |
| | — |
| | 6 |
| | — |
| |
| | | | | | | | | |
| Operating and maintenance expense—affiliate | Operating and maintenance expense—affiliate | | | | | | | | Operating and maintenance expense—affiliate | | | |
| Services Agreements | Services Agreements | 34 |
| | 31 |
| | 100 |
| | 87 |
| Services Agreements | 33 |
| | 29 |
|
| | | | | | | | | | | | | |
| General and administrative expense—affiliate | General and administrative expense—affiliate | | | | | | | | General and administrative expense—affiliate | | | |
| Services Agreements | Services Agreements | 34 |
| | 18 |
| | 82 |
| | 53 |
| Services Agreements | 25 |
| | 21 |
|
As of September 30, 2019March 31, 2020 and December 31, 2018,2019, we had $67$38 million and $114$105 million, respectively, of accounts receivable—affiliate, under the agreements described below.
Terminal Use Agreement
SPL obtained approximately 2.02 Bcf/d of regasification capacity and other liquefaction support services under a TUA with SPLNG as a result of an assignment in July 2012 by Cheniere Investments of its rights, title and interest under its TUA with SPLNG. SPL is obligated to make monthly capacity payments to SPLNG aggregating approximately $250 million per year (the “TUA Fees”), continuing until at least May 2036.
In connection with this TUA, SPL is required to pay for a portion of the cost (primarily LNG inventory) to maintain the cryogenic readiness of the regasification facilities at the Sabine Pass LNG terminal, which is recorded as operating and maintenance expense on our Consolidated Statements of Income.
Cheniere Marketing Agreements
Cheniere Marketing SPA
Cheniere Marketing has an SPA (“Base SPA”) with SPL to purchase, at Cheniere Marketing’s option, any LNG produced by SPL in excess of that required for other customers at a price of 115% of Henry Hub plus $3.00 per MMBtu of LNG.
CHENIERE ENERGY PARTNERS, L.P. AND SUBSIDIARIES
NOTES TO CONSOLIDATED FINANCIAL STATEMENTS—CONTINUED
(unaudited)
In May 2019, SPL and Cheniere Marketing entered into an amendment to the Base SPA to remove certain conditions related to the sale of LNG from Trains 5 and 6 of the Liquefaction Project and provide that cargoes rejected by Cheniere Marketing under the Base SPA can be sold by SPL to Cheniere Marketing at a contract price equal to a portion of the estimated net profits from the sale of such cargo.
Cheniere Marketing Master SPA
SPL has an agreement with Cheniere Marketing that allows the parties to sell and purchase LNG with each other by executing and delivering confirmations under this agreement. SPL executed a confirmation with Cheniere Marketing that obligated Cheniere Marketing in certain circumstances to buy LNG cargoes produced during the period while Bechtel Oil, Gas and Chemicals, Inc. (“Bechtel”) had control of, and was commissioning, Train 5 of the Liquefaction Project.
Cheniere Marketing Letter AgreementAgreements
In MayDecember 2019, SPL and Cheniere Marketing entered into a letter agreement for the sale of up to 2043 cargoes totaling approximately 70 million MMBtu scheduled for delivery between May 3 and December 31, 2019in 2020 at a price of 115% of Henry Hub plus $2.00$1.67 per MMBtu.
CHENIERE ENERGY PARTNERS, L.P. AND SUBSIDIARIES
NOTES TO CONSOLIDATED FINANCIAL STATEMENTS—CONTINUED
(unaudited)
Services Agreements
As of September 30, 2019March 31, 2020 and December 31, 2018,2019, we had $177$146 million and $228$158 million of advances to affiliates, respectively, under the services agreements described below. The non-reimbursement amounts incurred under these agreements are recorded in general and administrative expense—affiliate.
Cheniere Partners Services Agreement
We have a services agreement with Cheniere Terminals, a wholly owned subsidiary of Cheniere, pursuant to which Cheniere Terminals is entitled to a quarterly non-accountable overhead reimbursement charge of $3 million (adjusted for inflation) for the provision of various general and administrative services for our benefit. In addition, Cheniere Terminals is entitled to reimbursement for all audit, tax, legal and finance fees incurred by Cheniere Terminals that are necessary to perform the services under the agreement.
Cheniere Investments Information Technology Services Agreement
Cheniere Investments has an information technology services agreement with Cheniere, pursuant to which Cheniere Investments’ subsidiaries receive certain information technology services. On a quarterly basis, the various entities receiving the benefit are invoiced by Cheniere Investments according to the cost allocation percentages set forth in the agreement. In addition, Cheniere is entitled to reimbursement for all costs incurred by Cheniere that are necessary to perform the services under the agreement.
SPLNG O&M Agreement
SPLNG has a long-term operation and maintenance agreement (the “SPLNG O&M Agreement”) with Cheniere Investments pursuant to which SPLNG receives all necessary services required to operate and maintain the Sabine Pass LNG receiving terminal. SPLNG pays a fixed monthly fee of $130,000 (indexed for inflation) under the SPLNG O&M Agreement and the cost of a bonus equal to 50% of the salary component of labor costs in certain circumstances to be agreed upon between SPLNG and Cheniere Investments at the beginning of each operating year. In addition, SPLNG is required to reimburse Cheniere Investments for its operating expenses, which consist primarily of labor expenses. Cheniere Investments provides the services required under the SPLNG O&M Agreement pursuant to a secondment agreement with a wholly owned subsidiary of Cheniere. All payments received by Cheniere Investments under the SPLNG O&M Agreement are required to be remitted to such subsidiary.
CHENIERE ENERGY PARTNERS, L.P. AND SUBSIDIARIES
NOTES TO CONSOLIDATED FINANCIAL STATEMENTS—CONTINUED
(unaudited)
SPLNG MSA
SPLNG has a long-term management services agreement (the “SPLNG MSA”) with Cheniere Terminals, pursuant to which Cheniere Terminals manages the operation of the Sabine Pass LNG receiving terminal, excluding those matters provided for under the SPLNG O&M Agreement. SPLNG pays a monthly fixed fee of $520,000 (indexed for inflation) under the SPLNG MSA.
SPL O&M Agreement
SPL has an operation and maintenance agreement (the “SPL O&M Agreement”) with Cheniere Investments pursuant to which SPL receives all of the necessary services required to construct, operate and maintain the Liquefaction Project. Before each Train of the Liquefaction Project is operational, the services to be provided include, among other services, obtaining governmental approvals on behalf of SPL, preparing an operating plan for certain periods, obtaining insurance, preparing staffing plans and preparing status reports. After each Train is operational, the services include all necessary services required to operate and maintain the Train. Prior to the substantial completion of each Train of the Liquefaction Project, in addition to reimbursement of operating expenses, SPL is required to pay a monthly fee equal to 0.6% of the capital expenditures incurred in the previous month. After substantial completion of each Train, for services performed while the Train is operational, SPL will pay, in addition to the reimbursement of operating expenses, a fixed monthly fee of $83,333 (indexed for inflation) for services with respect to the Train. Cheniere Investments provides the services required under the SPL O&M Agreement pursuant to a secondment agreement with a wholly owned subsidiary of Cheniere. All payments received by Cheniere Investments under the SPL O&M Agreement are required to be remitted to such subsidiary.
CHENIERE ENERGY PARTNERS, L.P. AND SUBSIDIARIES
NOTES TO CONSOLIDATED FINANCIAL STATEMENTS—CONTINUED
(unaudited)
SPL MSA
SPL has a management services agreement (the “SPL MSA”) with Cheniere Terminals pursuant to which Cheniere Terminals manages the construction and operation of the Liquefaction Project, excluding those matters provided for under the SPL O&M Agreement. The services include, among other services, exercising the day-to-day management of SPL’s affairs and business, managing SPL’s regulatory matters, managing bank and brokerage accounts and financial books and records of SPL’s business and operations, entering into financial derivatives on SPL’s behalf and providing contract administration services for all contracts associated with the Liquefaction Project. Prior to the substantial completion of each Train of the Liquefaction Project, SPL pays a monthly fee equal to 2.4% of the capital expenditures incurred in the previous month. After substantial completion of each Train, SPL will pay a fixed monthly fee of $541,667 (indexed for inflation) for services with respect to such Train.
CTPL O&M Agreement
CTPL has an amended long-term operation and maintenance agreement (the “CTPL O&M Agreement”) with Cheniere Investments pursuant to which CTPL receives all necessary services required to operate and maintain the Creole Trail Pipeline. CTPL is required to reimburse Cheniere Investments for its operating expenses, which consist primarily of labor expenses. Cheniere Investments provides the services required under the CTPL O&M Agreement pursuant to a secondment agreement with a wholly owned subsidiary of Cheniere. All payments received by Cheniere Investments under the CTPL O&M Agreement are required to be remitted to such subsidiary.
Natural Gas Supply Agreement
SPL has entered into a natural gas supply contract to obtain feed gas for the operation of the Liquefaction Project with a related party in the ordinary course of business. The term of the agreement is for five years, which can commence no earlier than November 1, 2021 and no later than November 1, 2022, following the achievement of contractually-defined conditions precedent. SPL did 0t have any deliveries under this contract during the three months ended March 31, 2020 and 2019.
Agreement to Fund SPLNG’s Cooperative Endeavor Agreements
SPLNG has executed Cooperative Endeavor Agreements (“CEAs”) with various Cameron Parish, Louisiana taxing authorities that allowed them to collect certain annual property tax payments from SPLNG from 2007 through 2016. This initiative represented an aggregate commitment of $25 million over 10 years in order to aid in their reconstruction efforts following Hurricane Rita. In exchange for SPLNG’s advance payments of annual ad valorem taxes, Cameron Parish willmay grant SPLNG a dollar-for-dollar credit against future ad valorem taxes to be levied against the Sabine Pass LNG terminal starting inas early as 2019. Beginning in September 2007, SPLNG entered into various agreements with Cheniere Marketing, pursuant to which Cheniere Marketing would pay SPLNG additional TUA revenues equal to any and all amounts payable by SPLNG to the Cameron Parish taxing authorities under the CEAs. In exchange for such amounts received as TUA revenues from Cheniere Marketing, SPLNG will make payments to Cheniere Marketing equal to ad valorem tax levied on our LNG terminal in the year the Cameron Parish dollar-for-dollar credit is applied.
CHENIERE ENERGY PARTNERS, L.P. AND SUBSIDIARIES
NOTES TO CONSOLIDATED FINANCIAL STATEMENTS—CONTINUED
(unaudited)
On a consolidated basis, these advance tax payments were recorded to other non-current assets, and payments from Cheniere Marketing that SPLNG utilized to make the ad valorem tax payments were recorded as obligations. We had $4$3 million and $3$2 million in due to affiliates and $20$19 million and $22$20 million of other non-current liabilities—affiliate resulting from these payments received from Cheniere Marketing as of September 30, 2019March 31, 2020 and December 31, 2018,2019, respectively.
Contracts for Sale and Purchase of Natural Gas and LNG
SPLNG is able to sell and purchase natural gas and LNG under agreements with Cheniere Marketing. Under these agreements, SPLNG purchases natural gas or LNG from Cheniere Marketing at a sales price equal to the actual purchase price paid by Cheniere Marketing to suppliers of the natural gas or LNG, plus any third-party costs incurred by Cheniere Marketing with respect to the receipt, purchase and delivery of natural gas or LNG to the Sabine Pass LNG terminal.
SPL has an agreement with CCL that allows them to sell and purchase natural gas from each other. Natural gas soldpurchased under this agreement is initially recorded as inventory and purchasedthen to cost of sales—affiliate upon its sale, except for purchases related
CHENIERE ENERGY PARTNERS, L.P. AND SUBSIDIARIES
NOTES TO CONSOLIDATED FINANCIAL STATEMENTS—CONTINUED
(unaudited)
to commissioning activities which are capitalized as LNG terminal construction-in-process. Natural gas sold under this agreement is recorded as LNG revenues—affiliate and cost of sales—affiliate, respectively.affiliate.
Terminal Marine Services Agreement
In connection with its tug boat lease, Tug Services entered into an agreement with a wholly owned subsidiary of Cheniere Terminals to provide its LNG cargo vessels with tug boat and marine services at the Sabine Pass LNG terminal. The agreement also provides that Tug Services shall contingently pay the wholly owned subsidiary of Cheniere Terminals a portion of its future revenues. Accordingly, Tug Services distributed $2$1 million duringin each of the three months ended September 30,March 31, 2020 and 2019 and 2018, respectively, and $5 million and $4 million during the nine months ended September 30, 2019 and 2018, respectively, to the wholly owned subsidiary of Cheniere Terminals, which is recognized as part of the distributions to our general partner interest holders on our Consolidated Statements of Partners’ Equity.
LNG Terminal Export Agreement
SPLNG and Cheniere Marketing have an LNG terminal export agreement that provides Cheniere Marketing the ability to export LNG from the Sabine Pass LNG terminal. SPLNG did 0t record any revenues associated with this agreement during the three and nine months ended September 30, 2019March 31, 2020 and 2018.2019.
State Tax Sharing Agreements
SPLNG has a state tax sharing agreement with Cheniere. Under this agreement, Cheniere has agreed to prepare and file all state and local tax returns which SPLNG and Cheniere are required to file on a combined basis and to timely pay the combined state and local tax liability. If Cheniere, in its sole discretion, demands payment, SPLNG will pay to Cheniere an amount equal to the state and local tax that SPLNG would be required to pay if its state and local tax liability were calculated on a separate company basis. There have been 0 state and local taxes paid by Cheniere for which Cheniere could have demanded payment from SPLNG under this agreement; therefore, Cheniere has not demanded any such payments from SPLNG. The agreement is effective for tax returns due on or after January 1, 2008.
SPL has a state tax sharing agreement with Cheniere. Under this agreement, Cheniere has agreed to prepare and file all state and local tax returns which SPL and Cheniere are required to file on a combined basis and to timely pay the combined state and local tax liability. If Cheniere, in its sole discretion, demands payment, SPL will pay to Cheniere an amount equal to the state and local tax that SPL would be required to pay if SPL’s state and local tax liability were calculated on a separate company basis. There have been 0 state and local taxes paid by Cheniere for which Cheniere could have demanded payment from SPL under this agreement; therefore, Cheniere has not demanded any such payments from SPL. The agreement is effective for tax returns due on or after August 2012.
CTPL has a state tax sharing agreement with Cheniere. Under this agreement, Cheniere has agreed to prepare and file all state and local tax returns which CTPL and Cheniere are required to file on a combined basis and to timely pay the combined state and local tax liability. If Cheniere, in its sole discretion, demands payment, CTPL will pay to Cheniere an amount equal to the state and local tax that CTPL would be required to pay if CTPL’s state and local tax liability were calculated on a separate company basis. There have been 0 state and local taxes paid by Cheniere for which Cheniere could have demanded payment from CTPL
CHENIERE ENERGY PARTNERS, L.P. AND SUBSIDIARIES
NOTES TO CONSOLIDATED FINANCIAL STATEMENTS—CONTINUED
(unaudited)
under this agreement; therefore, Cheniere has not demanded any such payments from CTPL. The agreement is effective for tax returns due on or after May 2013.
NOTE 14—13—NET INCOME PER COMMON UNIT
Net income per common unit for a given period is based on the distributions that will be made to the unitholders with respect to the period plus an allocation of undistributed net income based on provisions of the partnership agreement, divided by the weighted average number of common units outstanding. Distributions paid by us are presented on the Consolidated Statements of Partners’ Equity. On October 28, 2019,April 27, 2020, we declared a $0.62$0.64 distribution per common unit and subordinated unit and the related distribution to our general partner and IDR holders to be paid on November 14, 2019May 15, 2020 to unitholders of record as of NovemberMay 7, 20192020 for the period from JulyJanuary 1, 20192020 to September 30, 2019.March 31, 2020.
The two-class method dictates that net income for a period be reduced by the amount of available cash that will be distributed with respect to that period and that any residual amount representing undistributed net income to be allocated to common unitholders and other participating unitholders to the extent that each unit may share in net income as if all of the net income for the period
CHENIERE ENERGY PARTNERS, L.P. AND SUBSIDIARIES
NOTES TO CONSOLIDATED FINANCIAL STATEMENTS—CONTINUED
(unaudited)
had been distributed in accordance with the partnership agreement. Undistributed income is allocated to participating securities based on the distribution waterfall for available cash specified in the partnership agreement. Undistributed losses (including those resulting from distributions in excess of net income) are allocated to common units and other participating securities on a pro rata basis based on provisions of the partnership agreement. Distributions are treated as distributed earnings in the computation of earnings per common unit even though cash distributions are not necessarily derived from current or prior period earnings.
CHENIERE ENERGY PARTNERS, L.P. AND SUBSIDIARIES
NOTES TO CONSOLIDATED FINANCIAL STATEMENTS—CONTINUED
(unaudited)
The following table provides a reconciliation of net income and the allocation of net income to the common units, the subordinated units, the general partner units and IDRs for purposes of computing basic and diluted net income per unit (in millions, except per unit data).
| | | | | | | Limited Partner Units | | | | | | | | Limited Partner Units | | | | |
| | | Total | | Common Units | | Subordinated Units | | General Partner Units | | IDR | | Total | | Common Units | | Subordinated Units | | General Partner Units | | IDR |
| Three Months Ended September 30, 2019 | | | | | | | | | | | |
| Three Months Ended March 31, 2020 | | | | | | | | | | | |
| Net income | | $ | 110 |
| | | | | | | | | | $ | 435 |
| | | | | | | | |
| Declared distributions | | 323 |
| | 217 |
| | 84 |
| | 6 |
| | 16 |
| | 336 |
| | 223 |
| | 87 |
| | 6 |
| | 20 |
|
| Assumed allocation of undistributed net loss (1) | | $ | (213 | ) | | (151 | ) | | (58 | ) | | (4 | ) | | — |
| |
| Assumed allocation of undistributed net income (1) | | | $ | 99 |
| | 70 |
| | 27 |
| | 2 |
| | — |
|
| Assumed allocation of net income | | | | $ | 66 |
| | $ | 26 |
| | $ | 2 |
| | $ | 16 |
| | | | $ | 293 |
| | $ | 114 |
| | $ | 8 |
| | $ | 20 |
|
| | | | | | | | | | | | | | | | | | | | | |
| Weighted average units outstanding | | | | 348.6 |
| | 135.4 |
| | | | | | | | 348.6 |
| | 135.4 |
| | | | |
| Basic and diluted net income per unit | | | | $ | 0.19 |
| | $ | 0.19 |
| | | | | | | | $ | 0.84 |
| | $ | 0.84 |
| | | | |
| | | | | | | | | | | | | | | | | | | | | |
| Three Months Ended September 30, 2018 | | | | | | | | | | | |
| Three Months Ended March 31, 2019 | | | | | | | | | | | |
| Net income | | $ | 307 |
| | | | | | | | | | $ | 385 |
| | | | | | | | |
| Declared distributions | | 297 |
| | 202 |
| | 79 |
| | 5 |
| | 11 |
| | 310 |
| | 210 |
| | 81 |
| | 6 |
| | 13 |
|
| Assumed allocation of undistributed net income (1) | | $ | 10 |
| | 7 |
| | 3 |
| | — |
| | — |
| | $ | 75 |
| | 52 |
| | 21 |
| | 2 |
| | — |
|
| Assumed allocation of net income | | | | $ | 209 |
| | $ | 82 |
| | $ | 5 |
|
| $ | 11 |
| | | | $ | 262 |
| | $ | 102 |
| | $ | 8 |
| | $ | 13 |
|
| | | | | | | | | | | | | | | | | | | | | |
| Weighted average units outstanding | | | | 348.6 |
| | 135.4 |
| | | | | | | | 348.6 |
| | 135.4 |
| | | | |
Basic and diluted net income per unit (2) | | | | $ | 0.60 |
| | $ | 0.60 |
| | | | | | | | $ | 0.75 |
| | $ | 0.75 |
| | | | |
| | | | | | | | | | | | |
| Nine Months Ended September 30, 2019 | | | | | | | | | | | |
| Net income | | $ | 727 |
| | | | | | | | | |
| Declared distributions | | 949 |
| | 638 |
| | 248 |
| | 19 |
| | 44 |
| |
| Assumed allocation of undistributed net loss (1) | | $ | (222 | ) | | (157 | ) | | (61 | ) | | (4 | ) | | — |
| |
| Assumed allocation of net income | | | | $ | 481 |
| | $ | 187 |
| | $ | 15 |
| | $ | 44 |
| |
| | | | | | | | | | | | |
| Weighted average units outstanding | | | | 348.6 |
| | 135.4 |
| | | | | |
| Basic and diluted net income per unit | | | | $ | 1.38 |
| | $ | 1.38 |
| | | | | |
| | | | | | | | | | | | |
| Nine Months Ended September 30, 2018 | | | | | | | | | | | |
| Net income | | $ | 923 |
| | | | | | | | | |
| Declared distributions | | 859 |
| | 589 |
| | 229 |
| | 17 |
| | 24 |
| |
| Assumed allocation of undistributed net income (1) | | $ | 64 |
| | 45 |
| | 18 |
| | 1 |
| | — |
| |
| Assumed allocation of net income | | | | $ | 634 |
| | $ | 247 |
| | $ | 18 |
| | $ | 24 |
| |
| | | | | | | | | | | | |
| Weighted average units outstanding | | | | 348.6 |
| | 135.4 |
| | | | | |
| Basic and diluted net income per unit | | | | $ | 1.82 |
| | $ | 1.82 |
| | | | | |
| |
| (1) | Under our partnership agreement, the IDRs participate in net income (loss) only to the extent of the amount of cash distributions actually declared, thereby excluding the IDRs from participating in undistributed net income (loss). |
| |
(2) | Earnings per unit in the table may not recalculate exactly due to rounding because it is calculated based on whole numbers, not the rounded numbers presented.income. |
CHENIERE ENERGY PARTNERS, L.P. AND SUBSIDIARIES
NOTES TO CONSOLIDATED FINANCIAL STATEMENTS—CONTINUED
(unaudited)
NOTE 15—14—CUSTOMER CONCENTRATION
The following table shows customers with revenues of 10% or greater of total revenues from external customers and customers with accounts receivable balances of 10% or greater of total accounts receivable from external customers:
| | | | | Percentage of Total Revenues from External Customers | | Percentage of Accounts Receivable from External Customers | | Percentage of Total Revenues from External Customers | | Percentage of Accounts Receivable from External Customers |
| | | Three Months Ended September 30, | | Nine Months Ended September 30, | | September 30, | | December 31, | | Three Months Ended March 31, | | March 31, | | December 31, |
| | | 2019 | | 2018 | | 2019 | | 2018 | | 2019 | | 2018 | | 2020 | | 2019 | | 2020 | | 2019 |
| Customer A | | 24% | | 24% | | 28% | | 27% | | 20% | | 35% | | 28% | | 31% | | 21% | | 21% |
| Customer B | | 18% | | 21% | | 19% | | 22% | | 17% | | 23% | | 15% | | 19% | | 14% | | 13% |
| Customer C | | 22% | | 21% | | 20% | | 23% | | 15% | | 30% | | 15% | | 19% | | 28% | | 22% |
| Customer D | | 19% | | 24% | | 21% | | 18% | | 21% | | * | | 16% | | 22% | | 14% | | 13% |
| Customer E | | * | | —% | | * | | —% | | 14% | | —% | | * | | —% | | * | | 13% |
| Customer F | | | 11% | | —% | | 14% | | 14% |
* Less than 10%
CHENIERE ENERGY PARTNERS, L.P. AND SUBSIDIARIES
NOTES TO CONSOLIDATED FINANCIAL STATEMENTS—CONTINUED
(unaudited)
NOTE 16—15—SUPPLEMENTAL CASH FLOW INFORMATION
The following table provides supplemental disclosure of cash flow information (in millions):
|
| | | | | | | |
| | Nine Months Ended September 30, |
| | 2019 | | 2018 |
| Cash paid during the period for interest, net of amounts capitalized | $ | 624 |
| | $ | 586 |
|
|
| | | | | | | |
| | Three Months Ended March 31, |
| | 2020 | | 2019 |
| Cash paid during the period for interest, net of amounts capitalized | $ | 211 |
| | $ | 185 |
|
The balance in property, plant and equipment, net funded with accounts payable and accrued liabilities (including affiliate) was $298$219 million and $204$330 million as of September 30,March 31, 2020 and 2019, and 2018, respectively.
NOTE 17—16—SUPPLEMENTAL GUARANTOR INFORMATION
Our CQP Senior Notes are jointly and severally guaranteed by each of our subsidiaries other than SPL (the “Guarantors”) and, subject to certain conditions governing its guarantee, Sabine Pass LP (collectively with SPL, the “Non-Guarantors”). These guarantees are full and unconditional, subject to certain customary release provisions including (1) the sale, exchange, disposition or transfer (by merger, consolidation or otherwise) of the capital stock or all or substantially all of the assets of the Guarantors, (2) upon the liquidation or dissolution of a Guarantor, (3) following the release of a Guarantor from its guarantee obligations and (4) upon the legal defeasance or satisfaction and discharge of obligations under the indenture governing the CQP Senior Notes. See Note 10—Debt in this quarterly report and Note 11—Debt of our Notes to Consolidated Financial Statements in our annual report on Form 10-K for the year ended December 31, 20182019 for additional information regarding the CQP Senior Notes.
The following is condensed consolidating financial information for Cheniere Partners (“Parent Issuer”), the Guarantors on a combined basis and the Non-Guarantors on a combined basis. We have accounted for investments in subsidiaries using the equity method.
CHENIERE ENERGY PARTNERS, L.P. AND SUBSIDIARIES
NOTES TO CONSOLIDATED FINANCIAL STATEMENTS—CONTINUED
(unaudited)
| | Condensed Consolidating Balance Sheet | | September 30, 2019 | |
| March 31, 2020 | | March 31, 2020 |
(in millions) | | | | | | | | | | | | | | | | | | | | |
| | Parent Issuer | | Guarantors | | Non-Guarantors | | Eliminations | | Consolidated | Parent Issuer | | Guarantors | | Non-Guarantors | | Eliminations | | Consolidated |
| ASSETS | | | | | | | | | | | | | | | | | | |
| Current assets | | | | | | | | | | | | | | | | | | |
| Cash and cash equivalents | $ | 1,701 |
| | $ | 6 |
| | $ | — |
| | $ | — |
| | $ | 1,707 |
| $ | 1,731 |
| | $ | 3 |
| | $ | — |
| | $ | — |
| | $ | 1,734 |
|
| Restricted cash | — |
| | — |
| | 185 |
| | — |
| | 185 |
| — |
| | — |
| | 109 |
| | — |
| | 109 |
|
| Accounts and other receivables | — |
| | 3 |
| | 274 |
| | — |
| | 277 |
| — |
| | 3 |
| | 256 |
| | — |
| | 259 |
|
| Accounts receivable—affiliate | — |
| | 35 |
| | 66 |
| | (34 | ) | | 67 |
| — |
| | 24 |
| | 38 |
| | (24 | ) | | 38 |
|
| Advances to affiliate | — |
| | 151 |
| | 154 |
| | (128 | ) | | 177 |
| — |
| | 128 |
| | 122 |
| | (104 | ) | | 146 |
|
| Inventory | — |
| | 13 |
| | 90 |
| | — |
| | 103 |
| — |
| | 13 |
| | 85 |
| | — |
| | 98 |
|
| Derivative assets | — |
| | — |
| | 8 |
| | — |
| | 8 |
| — |
| | — |
| | 13 |
| | — |
| | 13 |
|
| Other current assets | 1 |
| | 12 |
| | 52 |
| | — |
| | 65 |
| — |
| | 14 |
| | 35 |
| | — |
| | 49 |
|
| Other current assets—affiliate | — |
| | — |
| | 22 |
| | (22 | ) | | — |
| — |
| | 2 |
| | 21 |
| | (21 | ) | | 2 |
|
| Total current assets | 1,702 |
| | 220 |
| | 851 |
| | (184 | ) | | 2,589 |
| 1,731 |
| | 187 |
| | 679 |
| | (149 | ) | | 2,448 |
|
| | | | | | | | | | | | | | | | | | | |
| Property, plant and equipment, net | 79 |
| | 2,454 |
| | 13,831 |
| | (26 | ) | | 16,338 |
| 79 |
| | 2,451 |
| | 13,972 |
| | (26 | ) | | 16,476 |
|
| Operating lease assets, net | — |
| | 86 |
| | 21 |
| | (16 | ) | | 91 |
| — |
| | 88 |
| | 20 |
| | (16 | ) | | 92 |
|
| Debt issuance costs, net | 10 |
| | — |
| | 7 |
| | — |
| | 17 |
| 9 |
| | — |
| | 11 |
| | — |
| | 20 |
|
| Non-current derivative assets | — |
| | — |
| | 29 |
| | — |
| | 29 |
| — |
| | — |
| | 41 |
| | — |
| | 41 |
|
| Investments in subsidiaries | 2,931 |
| | 495 |
| | — |
| | (3,426 | ) | | — |
| 3,168 |
| | 718 |
| | — |
| | (3,886 | ) | | — |
|
| Other non-current assets, net | — |
| | 25 |
| | 132 |
| | — |
| | 157 |
| — |
| | 18 |
| | 138 |
| | — |
| | 156 |
|
| Total assets | $ | 4,722 |
| | $ | 3,280 |
| | $ | 14,871 |
| | $ | (3,652 | ) | | $ | 19,221 |
| $ | 4,987 |
| | $ | 3,462 |
| | $ | 14,861 |
| | $ | (4,077 | ) | | $ | 19,233 |
|
| | | | | | | | | | | | | | | | | | | |
| LIABILITIES AND PARTNERS’ EQUITY | | | | | | | | | | | | | | | | | | |
| Current liabilities | | | | | | | | | | | | | | | | | | |
| Accounts payable | $ | — |
| | $ | 5 |
| | $ | 12 |
| | $ | — |
| | $ | 17 |
| $ | — |
| | $ | 3 |
| | $ | 5 |
| | $ | — |
| | $ | 8 |
|
| Accrued liabilities | 77 |
| | 36 |
| | 544 |
| | — |
| | 657 |
| 108 |
| | 20 |
| | 441 |
| | — |
| | 569 |
|
| Current debt | | — |
| | — |
| | 1,996 |
| | — |
| | 1,996 |
|
| Due to affiliates | — |
| | 158 |
| | 45 |
| | (163 | ) | | 40 |
| 3 |
| | 120 |
| | 35 |
| | (128 | ) | | 30 |
|
| Deferred revenue | — |
| | 21 |
| | 148 |
| | — |
| | 169 |
| — |
| | 22 |
| | 72 |
| | — |
| | 94 |
|
| Deferred revenue—affiliate | — |
| | 21 |
| | — |
| | (21 | ) | | — |
| — |
| | 21 |
| | — |
| | (21 | ) | | — |
|
| Current operating lease liabilities | — |
| | 6 |
| | — |
| | — |
| | 6 |
| — |
| | 6 |
| | — |
| | — |
| | 6 |
|
| Derivative liabilities | — |
| | — |
| | 29 |
| | — |
| | 29 |
| — |
| | — |
| | 12 |
| | — |
| | 12 |
|
| Total current liabilities | 77 |
| | 247 |
| | 778 |
| | (184 | ) | | 918 |
| 111 |
| | 192 |
| | 2,561 |
| | (149 | ) | | 2,715 |
|
| | | | | | | | | | | | | | | | | | | |
| Long-term debt, net | 4,053 |
| | — |
| | 13,518 |
| | — |
| | 17,571 |
| 4,056 |
| | — |
| | 11,535 |
| | — |
| | 15,591 |
|
| Non-current operating lease liabilities | — |
| | 79 |
| | 5 |
| | — |
| | 84 |
| — |
| | 81 |
| | 4 |
| | — |
| | 85 |
|
| Non-current derivative liabilities | — |
| | — |
| | 32 |
| | — |
| | 32 |
| — |
| | — |
| | 2 |
| | — |
| | 2 |
|
| Other non-current liabilities | — |
| | 3 |
| | 1 |
| | — |
| | 4 |
| — |
| | 1 |
| | — |
| | — |
| | 1 |
|
| Other non-current liabilities—affiliate | — |
| | 20 |
| | 16 |
| | (16 | ) | | 20 |
| — |
| | 20 |
| | 15 |
| | (16 | ) | | 19 |
|
| | | | | | | | | | | | | | | | | | | |
| Partners’ equity | 592 |
| | 2,931 |
| | 521 |
| | (3,452 | ) | | 592 |
| 820 |
| | 3,168 |
| | 744 |
| | (3,912 | ) | | 820 |
|
| Total liabilities and partners’ equity | $ | 4,722 |
| | $ | 3,280 |
| | $ | 14,871 |
| | $ | (3,652 | ) | | $ | 19,221 |
| $ | 4,987 |
| | $ | 3,462 |
| | $ | 14,861 |
| | $ | (4,077 | ) | | $ | 19,233 |
|
CHENIERE ENERGY PARTNERS, L.P. AND SUBSIDIARIES
NOTES TO CONSOLIDATED FINANCIAL STATEMENTS—CONTINUED
(unaudited)
| | Condensed Consolidating Balance Sheet | | December 31, 2018 | |
| December 31, 2019 | | December 31, 2019 |
(in millions) | | | | | | | | | | | | | | | | | | | | |
| | Parent Issuer | | Guarantors | | Non-Guarantors | | Eliminations | | Consolidated | Parent Issuer | | Guarantors | | Non-Guarantors | | Eliminations | | Consolidated |
| ASSETS | | | | | | | | | | | | | | | | | | |
| Current assets | | | | | | | | | | | | | | | | | | |
| Cash and cash equivalents | $ | — |
| | $ | — |
| | $ | — |
| | $ | — |
| | $ | — |
| $ | 1,778 |
| | $ | 3 |
| | $ | — |
| | $ | — |
| | $ | 1,781 |
|
| Restricted cash | 779 |
| | 6 |
| | 756 |
| | — |
| | 1,541 |
| — |
| | — |
| | 181 |
| | — |
| | 181 |
|
| Accounts and other receivables | 1 |
| | 1 |
| | 346 |
| | — |
| | 348 |
| — |
| | 5 |
| | 292 |
| | — |
| | 297 |
|
| Accounts receivable—affiliate | 1 |
| | 40 |
| | 113 |
| | (40 | ) | | 114 |
| — |
| | 43 |
| | 104 |
| | (42 | ) | | 105 |
|
| Advances to affiliate | — |
| | 104 |
| | 210 |
| | (86 | ) | | 228 |
| — |
| | 145 |
| | 133 |
| | (120 | ) | | 158 |
|
| Inventory | — |
| | 12 |
| | 87 |
| | — |
| | 99 |
| — |
| | 13 |
| | 103 |
| | — |
| | 116 |
|
| Derivative assets | — |
| | — |
| | 6 |
| | — |
| | 6 |
| — |
| | — |
| | 17 |
| | — |
| | 17 |
|
| Other current assets | — |
| | 2 |
| | 18 |
| | — |
| | 20 |
| — |
| | 15 |
| | 36 |
| | — |
| | 51 |
|
| Other current assets—affiliate | — |
| | — |
| | 21 |
| | (21 | ) | | — |
| — |
| | 1 |
| | 22 |
| | (22 | ) | | 1 |
|
| Total current assets | 781 |
| | 165 |
| | 1,557 |
| | (147 | ) | | 2,356 |
| 1,778 |
| | 225 |
| | 888 |
| | (184 | ) | | 2,707 |
|
| | | | | | | | | | | | | | | | | | | |
| Property, plant and equipment, net | 79 |
| | 2,128 |
| | 13,209 |
| | (26 | ) | | 15,390 |
| 79 |
| | 2,454 |
| | 13,861 |
| | (26 | ) | | 16,368 |
|
| Operating lease assets, net | | — |
| | 88 |
| | 21 |
| | (15 | ) | | 94 |
|
| Debt issuance costs, net | 1 |
| | — |
| | 12 |
| | — |
| | 13 |
| 9 |
| | — |
| | 6 |
| | — |
| | 15 |
|
| Non-current derivative assets | — |
| | — |
| | 31 |
| | — |
| | 31 |
| — |
| | — |
| | 32 |
| | — |
| | 32 |
|
| Investments in subsidiaries | 2,544 |
| | 440 |
| | — |
| | (2,984 | ) | | — |
| 2,963 |
| | 508 |
| | — |
| | (3,471 | ) | | — |
|
| Other non-current assets, net | — |
| | 26 |
| | 158 |
| | — |
| | 184 |
| — |
| | 24 |
| | 144 |
| | — |
| | 168 |
|
| Total assets | $ | 3,405 |
| | $ | 2,759 |
| | $ | 14,967 |
| | $ | (3,157 | ) | | $ | 17,974 |
| $ | 4,829 |
| | $ | 3,299 |
| | $ | 14,952 |
| | $ | (3,696 | ) | | $ | 19,384 |
|
| | | | | | | | | | | | | | | | | | | |
| LIABILITIES AND PARTNERS’ EQUITY | | | | | | | | | | | | | | | | | | |
| Current liabilities | | | | | | | | | | | | | | | | | | |
| Accounts payable | $ | — |
| | $ | 4 |
| | $ | 11 |
| | $ | — |
| | $ | 15 |
| $ | — |
| | $ | 2 |
| | $ | 38 |
| | $ | — |
| | $ | 40 |
|
| Accrued liabilities | 39 |
| | 14 |
| | 768 |
| | — |
| | 821 |
| 56 |
| | 24 |
| | 629 |
| | — |
| | 709 |
|
| Due to affiliates | — |
| | 127 |
| | 48 |
| | (126 | ) | | 49 |
| 3 |
| | 155 |
| | 49 |
| | (161 | ) | | 46 |
|
| Deferred revenue | — |
| | 25 |
| | 91 |
| | — |
| | 116 |
| — |
| | 23 |
| | 132 |
| | — |
| | 155 |
|
| Deferred revenue—affiliate | — |
| | 22 |
| | — |
| | (21 | ) | | 1 |
| — |
| | 22 |
| | — |
| | (21 | ) | | 1 |
|
| Current operating lease liabilities | | — |
| | 6 |
| | — |
| | — |
| | 6 |
|
| Derivative liabilities | — |
| | — |
| | 66 |
| | — |
| | 66 |
| — |
| | — |
| | 9 |
| | — |
| | 9 |
|
| Total current liabilities | 39 |
| | 192 |
| | 984 |
| | (147 | ) | | 1,068 |
| 59 |
| | 232 |
| | 857 |
| | (182 | ) | | 966 |
|
| | | | | | | | | | | | | | | | | | | |
| Long-term debt, net | 2,566 |
| | — |
| | 13,500 |
| | — |
| | 16,066 |
| 4,055 |
| | — |
| | 13,524 |
| | — |
| | 17,579 |
|
| Non-current operating lease liabilities | | — |
| | 82 |
| | 5 |
| | — |
| | 87 |
|
| Non-current derivative liabilities | — |
| | — |
| | 14 |
| | — |
| | 14 |
| — |
| | — |
| | 16 |
| | — |
| | 16 |
|
| Other non-current liabilities | — |
| | 1 |
| | 3 |
| | — |
| | 4 |
| — |
| | 1 |
| | — |
| | — |
| | 1 |
|
| Other non-current liabilities—affiliate | — |
| | 22 |
| | — |
| | — |
| | 22 |
| — |
| | 21 |
| | 16 |
| | (17 | ) | | 20 |
|
| | | | | | | | | | | | | | | | | | | |
| Partners’ equity | 800 |
| | 2,544 |
| | 466 |
| | (3,010 | ) | | 800 |
| 715 |
| | 2,963 |
| | 534 |
| | (3,497 | ) | | 715 |
|
| Total liabilities and partners’ equity | $ | 3,405 |
| | $ | 2,759 |
| | $ | 14,967 |
| | $ | (3,157 | ) | | $ | 17,974 |
| $ | 4,829 |
| | $ | 3,299 |
| | $ | 14,952 |
| | $ | (3,696 | ) | | $ | 19,384 |
|
CHENIERE ENERGY PARTNERS, L.P. AND SUBSIDIARIES
NOTES TO CONSOLIDATED FINANCIAL STATEMENTS—CONTINUED
(unaudited)
|
| | | | | | | | | | | | | | | | | | | |
| Condensed Consolidating Statement of Income |
| Three Months Ended September 30, 2019 |
| (in millions) |
| | | | | | | | | | |
| | Parent Issuer | | Guarantors | | Non-Guarantors | | Eliminations | | Consolidated |
| | | | | | | | | | |
| Revenues | | | | | | | | | |
| LNG revenues | $ | — |
| | $ | — |
| | $ | 1,140 |
| | $ | — |
| | $ | 1,140 |
|
| LNG revenues—affiliate | — |
| | — |
| | 257 |
| | — |
| | 257 |
|
| Regasification revenues | — |
| | 66 |
| | — |
| | — |
| | 66 |
|
| Regasification revenues—affiliate | — |
| | 65 |
| | — |
| | (65 | ) | | — |
|
| Other revenues | — |
| | 13 |
| | — |
| | — |
| | 13 |
|
| Other revenues—affiliate | — |
| | 36 |
| | — |
| | (36 | ) | | — |
|
| Total revenues | — |
| | 180 |
| | 1,397 |
| | (101 | ) | | 1,476 |
|
| | | | | | | | | | |
| Operating costs and expenses | | | | | | | | | |
| Cost of sales (excluding depreciation and amortization expense shown separately below) | — |
| | — |
| | 742 |
| | — |
| | 742 |
|
| Cost of sales—affiliate | — |
| | 6 |
| | 17 |
| | (17 | ) | | 6 |
|
| Operating and maintenance expense | — |
| | 22 |
| | 150 |
| | — |
| | 172 |
|
| Operating and maintenance expense—affiliate | — |
| | 5 |
| | 113 |
| | (84 | ) | | 34 |
|
| General and administrative expense | 1 |
| | 1 |
| | 1 |
| | — |
| | 3 |
|
| General and administrative expense—affiliate | 4 |
| | 8 |
| | 28 |
| | (6 | ) | | 34 |
|
| Depreciation and amortization expense | 1 |
| | 21 |
| | 117 |
| | (1 | ) | | 138 |
|
| Impairment expense and loss on disposal of assets | — |
| | — |
| | 1 |
| | — |
| | 1 |
|
| Total operating costs and expenses | 6 |
| | 63 |
| | 1,169 |
| | (108 | ) | | 1,130 |
|
| | | | | | | | | | |
| Income (loss) from operations | (6 | ) | | 117 |
| | 228 |
| | 7 |
| | 346 |
|
| | | | | | | | | | |
| Other income (expense) | | | | | | | | | |
| Interest expense, net of capitalized interest | (47 | ) | | (1 | ) | | (183 | ) | | — |
| | (231 | ) |
| Loss on modification or extinguishment of debt | (13 | ) | | — |
| | — |
| | — |
| | (13 | ) |
| Equity earnings of subsidiaries | 170 |
| | 48 |
| | — |
| | (218 | ) | | — |
|
| Other income (expense) | 6 |
| | (1 | ) | | 3 |
| | — |
| | 8 |
|
| Total other income (expense) | 116 |
| | 46 |
| | (180 | ) | | (218 | ) | | (236 | ) |
| | | | | | | | | | |
| Net income | $ | 110 |
| | $ | 163 |
| | $ | 48 |
| | $ | (211 | ) | | $ | 110 |
|
|
| | | | | | | | | | | | | | | | | | | |
| Condensed Consolidating Statement of Income |
| Three Months Ended March 31, 2020 |
| (in millions) |
| | | | | | | | | | |
| | Parent Issuer | | Guarantors | | Non-Guarantors | | Eliminations | | Consolidated |
| | | | | | | | | | |
| Revenues | | | | | | | | | |
| LNG revenues | $ | — |
| | $ | — |
| | $ | 1,449 |
| | $ | — |
| | $ | 1,449 |
|
| LNG revenues—affiliate | — |
| | — |
| | 188 |
| | — |
| | 188 |
|
| Regasification revenues | — |
| | 67 |
| | — |
| | — |
| | 67 |
|
| Regasification revenues—affiliate | — |
| | 67 |
| | — |
| | (67 | ) | | — |
|
| Other revenues | — |
| | 14 |
| | — |
| | — |
| | 14 |
|
| Other revenues—affiliate | — |
| | 62 |
| | — |
| | (62 | ) | | — |
|
| Total revenues | — |
| | 210 |
| | 1,637 |
| | (129 | ) | | 1,718 |
|
| | | | | | | | | | |
| Operating costs and expenses | | | | | | | | | |
| Cost of sales (excluding items shown separately below) | — |
| | — |
| | 699 |
| | — |
| | 699 |
|
| Cost of sales—affiliate | — |
| | — |
| | 12 |
| | (12 | ) | | — |
|
| Operating and maintenance expense | — |
| | 13 |
| | 139 |
| | — |
| | 152 |
|
| Operating and maintenance expense—affiliate | — |
| | 33 |
| | 113 |
| | (113 | ) | | 33 |
|
| General and administrative expense | 1 |
| | — |
| | 1 |
| | — |
| | 2 |
|
| General and administrative expense—affiliate | 4 |
| | 7 |
| | 18 |
| | (4 | ) | | 25 |
|
| Depreciation and amortization expense | 1 |
| | 20 |
| | 117 |
| | — |
| | 138 |
|
| Impairment expense and loss on disposal of assets | — |
| | 5 |
| | — |
| | — |
| | 5 |
|
| Total operating costs and expenses | 6 |
| | 78 |
| | 1,099 |
| | (129 | ) | | 1,054 |
|
| | | | | | | | | | |
| Income (loss) from operations | (6 | ) | | 132 |
| | 538 |
| | — |
| | 664 |
|
| | | | | | | | | | |
| Other income (expense) | | | | | | | | | |
| Interest expense, net of capitalized interest | (54 | ) | | (2 | ) | | (178 | ) | | — |
| | (234 | ) |
| Loss on modification or extinguishment of debt | — |
| | — |
| | (1 | ) | | — |
| | (1 | ) |
| Equity earnings of subsidiaries | 490 |
| | 360 |
| | — |
| | (850 | ) | | — |
|
| Other income, net | 5 |
| | — |
| | 1 |
| | — |
| | 6 |
|
| Total other income (expense) | 441 |
| | 358 |
| | (178 | ) | | (850 | ) | | (229 | ) |
| | | | | | | | | | |
| Net income | $ | 435 |
| | $ | 490 |
| | $ | 360 |
| | $ | (850 | ) | | $ | 435 |
|
CHENIERE ENERGY PARTNERS, L.P. AND SUBSIDIARIES
NOTES TO CONSOLIDATED FINANCIAL STATEMENTS—CONTINUED
(unaudited)
|
| | | | | | | | | | | | | | | | | | | |
| Condensed Consolidating Statement of Income |
| Three Months Ended September 30, 2018 |
| (in millions) |
| | | | | | | | | | |
| | Parent Issuer | | Guarantors | | Non-Guarantors | | Eliminations | | Consolidated |
| | | | | | | | | | |
| Revenues | | | | | | | | | |
| LNG revenues | $ | — |
| | $ | — |
| | $ | 1,249 |
| | $ | — |
| | $ | 1,249 |
|
| LNG revenues—affiliate | — |
| | — |
| | 205 |
| | — |
| | 205 |
|
| Regasification revenues | — |
| | 66 |
| | — |
| | — |
| | 66 |
|
| Regasification revenues—affiliate | — |
| | 64 |
| | — |
| | (64 | ) | | — |
|
| Other revenues | — |
| | 9 |
| | — |
| | — |
| | 9 |
|
| Other revenues—affiliate | — |
| | 48 |
| | — |
| | (48 | ) | | — |
|
| Total revenues | — |
| | 187 |
| | 1,454 |
| | (112 | ) | | 1,529 |
|
| | | | | | | | | | |
| Operating costs and expenses | | | | | | | | | |
| Cost of sales (excluding depreciation and amortization expense shown separately below) | — |
| | — |
| | 758 |
| | (2 | ) | | 756 |
|
| Cost of sales—affiliate | — |
| | — |
| | 8 |
| | (8 | ) | | — |
|
| Operating and maintenance expense | — |
| | 17 |
| | 96 |
| | — |
| | 113 |
|
| Operating and maintenance expense—affiliate | — |
| | 39 |
| | 107 |
| | (115 | ) | | 31 |
|
| Development expense | — |
| | 1 |
| | — |
| | — |
| | 1 |
|
| General and administrative expense | 1 |
| | 1 |
| | 1 |
| | — |
| | 3 |
|
| General and administrative expense—affiliate | 3 |
| | 6 |
| | 12 |
| | (3 | ) | | 18 |
|
| Depreciation and amortization expense | 1 |
| | 19 |
| | 88 |
| | (1 | ) | | 107 |
|
| Other | — |
| | 8 |
| | — |
| | — |
| | 8 |
|
| Total operating costs and expenses | 5 |
| | 91 |
| | 1,070 |
| | (129 | ) | | 1,037 |
|
| | | | | | | | | | |
| Income (loss) from operations | (5 | ) | | 96 |
| | 384 |
| | 17 |
| | 492 |
|
| | | | | | | | | | |
| Other income (expense) | | | | | | | | | |
| Interest expense, net of capitalized interest | (36 | ) | | (1 | ) | | (146 | ) | | — |
| | (183 | ) |
| Loss on early extinguishment of debt | (12 | ) | | — |
| | — |
| | — |
| | (12 | ) |
| Derivative gain, net | 2 |
| | — |
| | — |
| | — |
| | 2 |
|
| Equity earnings of subsidiaries | 354 |
| | 243 |
| | — |
| | (597 | ) | | — |
|
| Other income (expense) | 4 |
| | (1 | ) | | 5 |
| | — |
| | 8 |
|
| Total other income (expense) | 312 |
| | 241 |
| | (141 | ) | | (597 | ) | | (185 | ) |
| | | | | | | | | | |
| Net income | $ | 307 |
| | $ | 337 |
| | $ | 243 |
| | $ | (580 | ) | | $ | 307 |
|
|
| | | | | | | | | | | | | | | | | | | |
| Condensed Consolidating Statement of Income |
| Three Months Ended March 31, 2019 |
| (in millions) |
| | | | | | | | | | |
| | Parent Issuer | | Guarantors | | Non-Guarantors | | Eliminations | | Consolidated |
| | | | | | | | | | |
| Revenues | | | | | | | | | |
| LNG revenues | $ | — |
| | $ | — |
| | $ | 1,367 |
| | $ | — |
| | $ | 1,367 |
|
| LNG revenues—affiliate | — |
| | — |
| | 305 |
| | — |
| | 305 |
|
| Regasification revenues | — |
| | 66 |
| | — |
| | — |
| | 66 |
|
| Regasification revenues—affiliate | — |
| | 66 |
| | — |
| | (66 | ) | | — |
|
| Other revenues | — |
| | 11 |
| | — |
| | — |
| | 11 |
|
| Other revenues—affiliate | — |
| | 59 |
| | — |
| | (59 | ) | | — |
|
| Total revenues | — |
| | 202 |
| | 1,672 |
| | (125 | ) | | 1,749 |
|
| | | | | | | | | | |
| Operating costs and expenses | | | | | | | | | |
| Cost of sales (excluding items shown separately below) | — |
| | — |
| | 879 |
| | — |
| | 879 |
|
| Cost of sales—affiliate | — |
| | — |
| | 9 |
| | (9 | ) | | — |
|
| Operating and maintenance expense | — |
| | 28 |
| | 110 |
| | — |
| | 138 |
|
| Operating and maintenance expense—affiliate | — |
| | 33 |
| | 107 |
| | (111 | ) | | 29 |
|
| General and administrative expense | 1 |
| | 1 |
| | 1 |
| | — |
| | 3 |
|
| General and administrative expense—affiliate | 3 |
| | 6 |
| | 15 |
| | (3 | ) | | 21 |
|
| Depreciation and amortization expense | 1 |
| | 17 |
| | 96 |
| | — |
| | 114 |
|
| Impairment expense and loss on disposal of assets | — |
| | — |
| | 2 |
| | — |
| | 2 |
|
| Total operating costs and expenses | 5 |
| | 85 |
| | 1,219 |
| | (123 | ) | | 1,186 |
|
| | | | | | | | | | |
| Income (loss) from operations | (5 | ) | | 117 |
| | 453 |
| | (2 | ) | | 563 |
|
| | | | | | | | | | |
| Other income (expense) | | | | | | | | | |
| Interest expense, net of capitalized interest | (36 | ) | | (1 | ) | | (150 | ) | | — |
| | (187 | ) |
| Equity earnings of subsidiaries | 422 |
| | 308 |
| | — |
| | (730 | ) | | — |
|
| Other income, net | 4 |
| | — |
| | 5 |
| | — |
| | 9 |
|
| Total other income (expense) | 390 |
| | 307 |
| | (145 | ) | | (730 | ) | | (178 | ) |
| | | | | | | | | | |
| Net income | $ | 385 |
| | $ | 424 |
| | $ | 308 |
| | $ | (732 | ) | | $ | 385 |
|
CHENIERE ENERGY PARTNERS, L.P. AND SUBSIDIARIES
NOTES TO CONSOLIDATED FINANCIAL STATEMENTS—CONTINUED
(unaudited)
|
| | | | | | | | | | | | | | | | | | | |
| Condensed Consolidating Statement of Income |
| Nine Months Ended September 30, 2019 |
| (in millions) |
| | | | | | | | | | |
| | Parent Issuer | | Guarantors | | Non-Guarantors | | Eliminations | | Consolidated |
| | | | | | | | | | |
| Revenues | | | | | | | | | |
| LNG revenues | $ | — |
| | $ | — |
| | $ | 3,678 |
| | $ | — |
| | $ | 3,678 |
|
| LNG revenues—affiliate | — |
| | — |
| | 1,017 |
| | — |
| | 1,017 |
|
| Regasification revenues | — |
| | 199 |
| | — |
| | — |
| | 199 |
|
| Regasification revenues—affiliate | — |
| | 196 |
| | — |
| | (196 | ) | | — |
|
| Other revenues | — |
| | 36 |
| | — |
| | — |
| | 36 |
|
| Other revenues—affiliate | — |
| | 160 |
| | — |
| | (160 | ) | | — |
|
| Total revenues | — |
| | 591 |
| | 4,695 |
| | (356 | ) | | 4,930 |
|
| | | | | | | | | | |
| Operating costs and expenses | | | | | | | | | |
| Cost of sales (excluding depreciation and amortization expense shown separately below) | — |
| | — |
| | 2,501 |
| | — |
| | 2,501 |
|
| Cost of sales—affiliate | — |
| | 6 |
| | 35 |
| | (35 | ) | | 6 |
|
| Operating and maintenance expense | — |
| | 74 |
| | 398 |
| | — |
| | 472 |
|
| Operating and maintenance expense—affiliate | — |
| | 76 |
| | 335 |
| | (311 | ) | | 100 |
|
| General and administrative expense | 3 |
| | 2 |
| | 4 |
| | — |
| | 9 |
|
| General and administrative expense—affiliate | 10 |
| | 22 |
| | 64 |
| | (14 | ) | | 82 |
|
| Depreciation and amortization expense | 2 |
| | 58 |
| | 331 |
| | (1 | ) | | 390 |
|
| Impairment expense and loss on disposal of assets | — |
| | — |
| | 6 |
| | — |
| | 6 |
|
| Total operating costs and expenses | 15 |
| | 238 |
| | 3,674 |
| | (361 | ) | | 3,566 |
|
| | | | | | | | | | |
| Income (loss) from operations | (15 | ) | | 353 |
| | 1,021 |
| | 5 |
| | 1,364 |
|
| | | | | | | | | | |
| Other income (expense) | | | | | | | | | |
| Interest expense, net of capitalized interest | (120 | ) | | (4 | ) | | (524 | ) | | — |
| | (648 | ) |
| Loss on modification or extinguishment of debt | (13 | ) | | — |
| | — |
| | — |
| | (13 | ) |
| Equity earnings of subsidiaries | 860 |
| | 506 |
| | — |
| | (1,366 | ) | | — |
|
| Other income | 15 |
| | — |
| | 9 |
| | — |
| | 24 |
|
| Total other income (expense) | 742 |
| | 502 |
| | (515 | ) | | (1,366 | ) | | (637 | ) |
| | | | | | | | | | |
| Net income | $ | 727 |
| | $ | 855 |
| | $ | 506 |
| | $ | (1,361 | ) | | $ | 727 |
|
|
| | | | | | | | | | | | | | | | | | | |
| Condensed Consolidating Statement of Cash Flows |
| Three Months Ended March 31, 2020 |
| (in millions) |
| | | | | | | | | | |
| | Parent Issuer | | Guarantors | | Non-Guarantors | | Eliminations | | Consolidated |
| Cash flows provided by operating activities | $ | 490 |
| | $ | 521 |
| | $ | 374 |
| | $ | (850 | ) | | $ | 535 |
|
| | | | | | | | | | |
| Cash flows from investing activities | | | | | | | | | |
| Property, plant and equipment, net | — |
| | (24 | ) | | (293 | ) | | — |
| | (317 | ) |
| Investments in subsidiaries | (286 | ) | | (225 | ) | | — |
| | 511 |
| | — |
|
| Return of capital | 79 |
| | 11 |
| | — |
| | (90 | ) | | — |
|
| Net cash used in investing activities | (207 | ) | | (238 | ) | | (293 | ) | | 421 |
| | (317 | ) |
| | | | | | | | | | |
| Cash flows from financing activities | | | | | | | | | |
| Debt issuance and other financing costs | — |
| | — |
| | (7 | ) | | — |
| | (7 | ) |
| Distributions to parent | — |
| | (568 | ) | | (371 | ) | | 939 |
| | — |
|
| Contributions from parent | — |
| | 285 |
| | 225 |
| | (510 | ) | | — |
|
| Distributions to owners | (330 | ) | | — |
| | — |
| | — |
| | (330 | ) |
| Net cash used in financing activities | (330 | ) |
| (283 | ) |
| (153 | ) |
| 429 |
|
| (337 | ) |
| | | | | | | | | | |
| Net decrease in cash, cash equivalents and restricted cash | (47 | ) | | — |
| | (72 | ) | | — |
| | (119 | ) |
| Cash, cash equivalents and restricted cash—beginning of period | 1,778 |
| | 3 |
| | 181 |
| | — |
| | 1,962 |
|
| Cash, cash equivalents and restricted cash—end of period | $ | 1,731 |
| | $ | 3 |
| | $ | 109 |
| | $ | — |
| | $ | 1,843 |
|
Balances per Condensed Consolidating Balance Sheet:
|
| | | | | | | | | | | | | | | | | | | |
| | March 31, 2020 |
| | Parent Issuer | | Guarantors | | Non-Guarantors | | Eliminations | | Consolidated |
| Cash and cash equivalents | $ | 1,731 |
| | $ | 3 |
| | $ | — |
| | $ | — |
| | $ | 1,734 |
|
| Restricted cash | — |
| | — |
| | 109 |
| | — |
| | 109 |
|
| Total cash, cash equivalents and restricted cash | $ | 1,731 |
| | $ | 3 |
| | $ | 109 |
| | $ | — |
| | $ | 1,843 |
|
CHENIERE ENERGY PARTNERS, L.P. AND SUBSIDIARIES
NOTES TO CONSOLIDATED FINANCIAL STATEMENTS—CONTINUED
(unaudited)
|
| | | | | | | | | | | | | | | | | | | |
| Condensed Consolidating Statement of Income |
| Nine Months Ended September 30, 2018 |
| (in millions) |
| | | | | | | | | | |
| | Parent Issuer | | Guarantors | | Non-Guarantors | | Eliminations | | Consolidated |
| | | | | | | | | | |
| Revenues | | | | | | | | | |
| LNG revenues | $ | — |
| | $ | — |
| | $ | 3,419 |
| | $ | — |
| | $ | 3,419 |
|
| LNG revenues—affiliate | — |
| | — |
| | 886 |
| | — |
| | 886 |
|
| Regasification revenues | — |
| | 196 |
| | — |
| | — |
| | 196 |
|
| Regasification revenues—affiliate | — |
| | 194 |
| | — |
| | (194 | ) | | — |
|
| Other revenues | — |
| | 28 |
| | — |
| | — |
| | 28 |
|
| Other revenues—affiliate | — |
| | 183 |
| | — |
| | (183 | ) | | — |
|
| Total revenues | — |
| | 601 |
| | 4,305 |
| | (377 | ) | | 4,529 |
|
| | | | | | | | | | |
| Operating costs and expenses | | | | | | | | | |
| Cost of sales (excluding depreciation and amortization expense shown separately below) | — |
| | 2 |
| | 2,291 |
| | (2 | ) | | 2,291 |
|
| Cost of sales—affiliate | — |
| | — |
| | 23 |
| | (23 | ) | | — |
|
| Operating and maintenance expense | — |
| | 48 |
| | 258 |
| | — |
| | 306 |
|
| Operating and maintenance expense—affiliate | — |
| | 113 |
| | 317 |
| | (343 | ) | | 87 |
|
| Development expense | — |
| | 1 |
| | 1 |
| | — |
| | 2 |
|
| General and administrative expense | 3 |
| | 2 |
| | 4 |
| | — |
| | 9 |
|
| General and administrative expense—affiliate | 9 |
| | 17 |
| | 36 |
| | (9 | ) | | 53 |
|
| Depreciation and amortization expense | 2 |
| | 56 |
| | 261 |
| | (1 | ) | | 318 |
|
| Impairment expense and loss on disposal of assets | — |
| | 8 |
| | — |
| | — |
| | 8 |
|
| Total operating costs and expenses | 14 |
| | 247 |
| | 3,191 |
| | (378 | ) | | 3,074 |
|
| | | | | | | | | | |
| Income (loss) from operations | (14 | ) | | 354 |
| | 1,114 |
| | 1 |
| | 1,455 |
|
| | | | | | | | | | |
| Other income (expense) | | | | | | | | | |
| Interest expense, net of capitalized interest | (104 | ) | | (3 | ) | | (445 | ) | | — |
| | (552 | ) |
| Loss on modification or early extinguishment of debt | (12 | ) | | — |
| | — |
| | — |
| | (12 | ) |
| Derivative gain, net | 13 |
| | — |
| | — |
| | — |
| | 13 |
|
| Equity earnings of subsidiaries | 1,030 |
| | 678 |
| | — |
| | (1,708 | ) | | — |
|
| Other income | 10 |
| | — |
| | 9 |
| | — |
| | 19 |
|
| Total other income (expense) | 937 |
| | 675 |
| | (436 | ) | | (1,708 | ) | | (532 | ) |
| | | | | | | | | | |
| Net income | $ | 923 |
| | $ | 1,029 |
| | $ | 678 |
| | $ | (1,707 | ) | | $ | 923 |
|
CHENIERE ENERGY PARTNERS, L.P. AND SUBSIDIARIES
NOTES TO CONSOLIDATED FINANCIAL STATEMENTS—CONTINUED
(unaudited)
|
| | | | | | | | | | | | | | | | | | | |
| Condensed Consolidating Statement of Cash Flows |
| Nine Months Ended September 30, 2019 |
| (in millions) |
| | | | | | | | | | |
| | Parent Issuer | | Guarantors | | Non-Guarantors | | Eliminations | | Consolidated |
| Cash flows provided by operating activities | $ | 782 |
| | $ | 907 |
| | $ | 656 |
| | $ | (1,368 | ) | | $ | 977 |
|
| | | | | | | | | | |
| Cash flows from investing activities | | | | | | | | | |
| Property, plant and equipment, net | — |
| | (35 | ) | | (1,123 | ) | | 2 |
| | (1,156 | ) |
| Investments in subsidiaries | (1,109 | ) | | (949 | ) | | — |
| | 2,058 |
| | — |
|
| Return of capital | 721 |
| | 546 |
| | — |
| | (1,267 | ) | | — |
|
| Other | — |
| | — |
| | (1 | ) | | — |
| | (1 | ) |
| Net cash used in investing activities | (388 | ) | | (438 | ) | | (1,124 | ) | | 793 |
| | (1,157 | ) |
| | | | | | | | | | |
| Cash flows from financing activities | | | | | | | | | |
| Proceeds from issuances of debt | 2,230 |
| | — |
| | — |
| | — |
| | 2,230 |
|
| Repayments of debt | (730 | ) | | — |
| | — |
| | — |
| | (730 | ) |
| Debt issuance and deferred financing costs | (33 | ) | | — |
| | — |
| | — |
| | (33 | ) |
| Debt extinguishment costs | (4 | ) | | — |
| | — |
| | — |
| | (4 | ) |
| Distributions to parent | — |
| | (1,581 | ) | | (1,052 | ) | | 2,633 |
| | — |
|
| Contributions from parent | — |
| | 1,109 |
| | 949 |
| | (2,058 | ) | | — |
|
| Distributions to owners | (935 | ) | | — |
| | — |
| | — |
| | (935 | ) |
| Other | — |
| | 3 |
| | — |
| | — |
| | 3 |
|
| Net cash provided by (used in) financing activities | 528 |
|
| (469 | ) |
| (103 | ) |
| 575 |
|
| 531 |
|
| | | | | | | | | | |
| Net increase (decrease) in cash, cash equivalents and restricted cash | 922 |
| | — |
| | (571 | ) | | — |
| | 351 |
|
| Cash, cash equivalents and restricted cash—beginning of period | 779 |
| | 6 |
| | 756 |
| | — |
| | 1,541 |
|
| Cash, cash equivalents and restricted cash—end of period | $ | 1,701 |
| | $ | 6 |
| | $ | 185 |
| | $ | — |
| | $ | 1,892 |
|
Balances per Condensed Consolidating Balance Sheet:
|
| | | | | | | | | | | | | | | | | | | |
| | September 30, 2019 |
| | Parent Issuer | | Guarantors | | Non-Guarantors | | Eliminations | | Consolidated |
| Cash and cash equivalents | $ | 1,701 |
| | $ | 6 |
| | $ | — |
| | $ | — |
| | $ | 1,707 |
|
| Restricted cash | — |
| | — |
| | 185 |
| | — |
| | 185 |
|
| Total cash, cash equivalents and restricted cash | $ | 1,701 |
| | $ | 6 |
| | $ | 185 |
| | $ | — |
| | $ | 1,892 |
|
CHENIERE ENERGY PARTNERS, L.P. AND SUBSIDIARIES
NOTES TO CONSOLIDATED FINANCIAL STATEMENTS—CONTINUED
(unaudited)
| | Condensed Consolidating Statement of Cash Flows | | Nine Months Ended September 30, 2018 | |
| Three Months Ended March 31, 2019 | | Three Months Ended March 31, 2019 |
(in millions) | | | | | | | | | | | | | | | | | | | | |
| | Parent Issuer | | Guarantors | | Non-Guarantors | | Eliminations | | Consolidated | Parent Issuer | | Guarantors | | Non-Guarantors | | Eliminations | | Consolidated |
| Cash flows provided by operating activities | $ | 339 |
| | $ | 408 |
| | $ | 928 |
| | $ | (411 | ) | | $ | 1,264 |
| $ | 404 |
| | $ | 364 |
| | $ | 213 |
| | $ | (637 | ) | | $ | 344 |
|
| | | | | | | | | | | | | | | | | | | |
| Cash flows from investing activities | | | | | | | | | | | | | | | | | | |
| Property, plant and equipment, net | — |
| | (24 | ) | | (554 | ) | | — |
| | (578 | ) | — |
| | (5 | ) | | (280 | ) | | 2 |
| | (283 | ) |
| Investments in subsidiaries | (202 | ) | | (81 | ) | | — |
| | 283 |
| | — |
| (218 | ) | | (164 | ) | | — |
| | 382 |
| | — |
|
| Distributions received from affiliates, net | 447 |
| | 350 |
| | — |
| | (797 | ) | | — |
| |
| Net cash provided by (used in) investing activities | 245 |
| | 245 |
| | (554 | ) | | (514 | ) | | (578 | ) | |
| Other | | — |
| | — |
| | (1 | ) | | — |
| | (1 | ) |
| Net cash used in investing activities | | (218 | ) | | (169 | ) | | (281 | ) | | 384 |
| | (284 | ) |
| | | | | | | | | | | | | | | | | | | |
| Cash flows from financing activities | | | | | | | | | | | | | | | | | | |
| Proceeds from issuances of debt | 1,100 |
| | — |
| | — |
| | — |
| | 1,100 |
| |
| Repayments of debt | (1,090 | ) | | — |
| | — |
| | — |
| | (1,090 | ) | |
| Debt issuance and deferred financing costs | (8 | ) | | — |
| | — |
| | — |
| | (8 | ) | |
| Debt extinguishment costs | (6 | ) | | — |
| | — |
| | — |
| | (6 | ) | |
| Distributions to parent | — |
| | (858 | ) | | (350 | ) | | 1,208 |
| | — |
| — |
| | (404 | ) | | (231 | ) | | 635 |
| | — |
|
| Contributions from parent | — |
| | 202 |
| | 81 |
| | (283 | ) | | — |
| — |
| | 218 |
| | 164 |
| | (382 | ) | | — |
|
| Distributions to owners | (814 | ) | | — |
| | — |
| | — |
| | (814 | ) | (304 | ) | | — |
| | — |
| | — |
| | (304 | ) |
| Net cash used in financing activities | (818 | ) | | (656 | ) | | (269 | ) | | 925 |
| | (818 | ) | (304 | ) | | (186 | ) | | (67 | ) | | 253 |
| | (304 | ) |
| | | | | | | | | | | | | | | | | | | |
| Net increase (decrease) in cash, cash equivalents and restricted cash | (234 | ) | | (3 | ) | | 105 |
| | — |
| | (132 | ) | (118 | ) | | 9 |
| | (135 | ) | | — |
| | (244 | ) |
| Cash, cash equivalents and restricted cash—beginning of period | 1,033 |
| | 12 |
| | 544 |
| | — |
| | 1,589 |
| 779 |
| | 6 |
| | 756 |
| | — |
| | 1,541 |
|
| Cash, cash equivalents and restricted cash—end of period | $ | 799 |
| | $ | 9 |
| | $ | 649 |
| | $ | — |
| | $ | 1,457 |
| $ | 661 |
| | $ | 15 |
| | $ | 621 |
| | $ | — |
| | $ | 1,297 |
|
| |
| ITEM 2. | MANAGEMENT’S DISCUSSION AND ANALYSIS OF FINANCIAL CONDITION AND RESULTS OF OPERATIONS |
Information Regarding Forward-Looking Statements
This quarterly report contains certain statements that are, or may be deemed to be, “forward-looking statements” within the meaning of Section 27A of the Securities Act of 1933, as amended (the “Securities Act”), and Section 21E of the Securities Exchange Act of 1934, as amended (the “Exchange Act”). All statements, other than statements of historical or present facts or conditions, included herein or incorporated herein by reference are “forward-looking statements.” Included among “forward-looking statements” are, among other things:
statements regarding our ability to pay distributions to our unitholders;
statements regarding our expected receipt of cash distributions from SPLNG, SPL or CTPL;
statements that we expect to commence or complete construction of our proposed LNG terminals, liquefaction facilities, pipeline facilities or other projects, or any expansions or portions thereof, by certain dates, or at all;
statements regarding future levels of domestic and international natural gas production, supply or consumption or future levels of LNG imports into or exports from North America and other countries worldwide or purchases of natural gas, regardless of the source of such information, or the transportation or other infrastructure or demand for and prices related to natural gas, LNG or other hydrocarbon products;
statements regarding any financing transactions or arrangements, or our ability to enter into such transactions;
statements relating to the construction of our Trains, including statements concerning the engagement of any EPC contractor or other contractor and the anticipated terms and provisions of any agreement with any EPC or other contractor, and anticipated costs related thereto;
statements regarding any SPA or other agreement to be entered into or performed substantially in the future, including any revenues anticipated to be received and the anticipated timing thereof, and statements regarding the amounts of total LNG regasification, natural gas liquefaction or storage capacities that are, or may become, subject to contracts;
statements regarding counterparties to our commercial contracts, construction contracts, and other contracts;
statements regarding our planned development and construction of additional Trains, including the financing of such Trains;
statements that our Trains, when completed, will have certain characteristics, including amounts of liquefaction capacities;
statements regarding our business strategy, our strengths, our business and operation plans or any other plans, forecasts, projections, or objectives, including anticipated revenues, capital expenditures, maintenance and operating costs and cash flows, any or all of which are subject to change;
statements regarding legislative, governmental, regulatory, administrative or other public body actions, approvals, requirements, permits, applications, filings, investigations, proceedings or decisions;
statements regarding the outbreak of COVID-19 and its impact on our business and operating results, including any customers not taking delivery of LNG cargoes, the ongoing credit worthiness of our contractual counterparties, any disruptions in our operations or construction of our Trains and the health and safety of Cheniere’s employees, and on our customers, the global economy and the demand for LNG; and
| |
| • | any other statements that relate to non-historical or future information. |
All of these types of statements, other than statements of historical or present facts or conditions, are forward-looking statements. In some cases, forward-looking statements can be identified by terminology such as “may,” “will,” “could,” “should,” “achieve,” “anticipate,” “believe,” “contemplate,” “continue,” “estimate,” “expect,” “intend,” “plan,” “potential,” “predict,” “project,” “pursue,” “target,” the negative of such terms or other comparable terminology. The forward-looking statements contained in this quarterly report are largely based on our expectations, which reflect estimates and assumptions made by our management. These estimates and assumptions reflect our best judgment based on currently known market conditions and other factors. Although we believe that such estimates are reasonable, they are inherently uncertain and involve a number of risks and uncertainties beyond our control. In addition, assumptions may prove to be inaccurate. We caution that the forward-looking
statements contained in this quarterly report are not guarantees of future performance and that such statements may not be realized or the forward-looking statements or events may not occur. Actual results may differ materially from those anticipated or implied in forward-looking statements as a result of a variety of factors described in this quarterly report and in the other reports and other information that we file with the SEC, including those discussed under “Risk Factors” in our annual report on Form 10-K for the
year ended December 31, 20182019. All forward-looking statements attributable to us or persons acting on our behalf are expressly qualified in their entirety by these risk factors. These forward-looking statements speak only as of the date made, and other than as required by law, we undertake no obligation to update or revise any forward-looking statement or provide reasons why actual results may differ, whether as a result of new information, future events or otherwise.
Introduction
The following discussion and analysis presents management’s view of our business, financial condition and overall performance and should be read in conjunction with our Consolidated Financial Statements and the accompanying notes. This information is intended to provide investors with an understanding of our past performance, current financial condition and outlook for the future. Our discussion and analysis includes the following subjects:
Overview of Business
Overview of Significant Events
Impact of COVID-19 and Market Environment
Liquidity and Capital Resources
Results of Operations
Off-Balance Sheet Arrangements
Summary of Critical Accounting Estimates
Recent Accounting Standards
Overview of Business
We are a publicly traded Delaware limited partnership formed by Cheniere.Cheniere in 2006. We provide clean, secure and affordable LNG to integrated energy companies, utilities and energy trading companies around the world. We aspire to the world, while responsiblyconduct our business in a safe and responsible manner, delivering a reliable, competitive and integrated source of LNG in a safe and rewarding work environment. The liquefaction of natural gas into LNG allows it to be shipped economically from the United States where natural gas is abundant and inexpensive to produce to our international customers in areas where natural gas demand and infrastructure exist. Through our wholly owned subsidiary, SPL, we are in various stages of operating and constructing six natural gas liquefaction Trains (the “Liquefaction Project”) at thecustomers.
The Sabine Pass LNG terminal is located in Cameron Parish, Louisiana, on the Sabine-Neches Waterway less than four miles from the Gulf Coast. Through our subsidiary, SPL, we are currently operating five natural gas liquefaction Trains 1 through 5and are operational andconstructing one additional Train 6 is under construction. Each Train is expected to havefor a nominaltotal production capacity which is prior to adjusting for planned maintenance, production reliability, potential overdesign and debottlenecking opportunities, of approximately 4.530 mtpa of LNG per Train.(the “Liquefaction Project”) at the Sabine Pass LNG terminal, one of the largest LNG production facilities in the world. Through our wholly owned subsidiary, SPLNG, we own and operate regasification facilities at the Sabine Pass LNG terminal, which includes pre-existing infrastructure of five LNG storage tanks with aggregate capacity of approximately 16.917 Bcfe, two marine berths that can each accommodate vessels with nominal capacity of up to 266,000 cubic meters and vaporizers with regasification capacity of approximately 4.04 Bcf/d. We also own a 94-mile pipeline through our wholly owned subsidiary, CTPL, that interconnects the Sabine Pass LNG terminal with a number of large interstate pipelines.
Overview of Significant Events
Our significant accomplishmentsevents since January 1, 20192020 and through the filing date of this Form 10-Q include the following:
Strategic
In May 2019, the board of directors of our general partner made a positive final investment decision with respect to Train 6 of the Liquefaction Project and issued a full notice to proceed with construction to Bechtel Oil, Gas and Chemicals, Inc. (“Bechtel”) in June 2019.
Operational
As of October 25, 2019, approximately 800April 27, 2020, more than 975 cumulative LNG cargoes totaling approximately 55over 65 million tonnes of LNG have been produced, loaded and exported from the Liquefaction Project.
In March 2019, SPL achieved substantial completion of Train 5 of the Liquefaction Project and commenced operating activities.
Financial
In September 2019, we issued an aggregate principal amount of $1.5 billion of 4.500% Senior Notes due 2029 (the “2029 CQP Senior Notes”) to prepay the outstanding balance under the $750 million term loan under our credit facilities (the “2019 CQP Credit Facilities”), which were entered into in May 2019, and for general corporate purposes, including funding future capital expenditures in connection with the construction of Train 6 at the Liquefaction Project. After applying the proceeds of this offering, only a $750 million revolving credit facility, which is currently undrawn, remains as part of the 2019 CQP Credit Facilities.
In September 2019, the date of first commercial delivery was reached under the 20-year SPAs with Centrica plc and Total Gas & Power North America, Inc. (“Total”) relating to Train 5 of the Liquefaction Project.
In March 2020, SPL entered into a $1.2 billion Working Capital Revolving Credit and Letter of Credit Reimbursement Agreement (the “2020 SPL Working Capital Facility”), which refinanced its previous working capital facility, reduced the interest rate and extended the maturity date to March 2025.
Impact of COVID-19 and Market Environment
The business environment in which we operate has been impacted by the recent downturn in the energy market as well as the outbreak of COVID-19 and its progression into a pandemic in March 2020. As a result of these developments, our growth estimates for LNG in 2020 have moderated from previous expectations. Annual LNG demand grew by 13% in 2019 to approximately 360 mtpa. In a report published in the datemonth of first commercial delivery was reached underApril 2020, IHS Markit projected LNG demand in 2020 to reach 363 mtpa, down from a pre-COVID-19 estimate of approximately 377 mtpa. This implies a year-over-year rate of growth of approximately 0.8% in 2020 compared to the 20-year SPAimplied 4.7% pre-COVID-19 year-over-year growth estimate. While worldwide demand increased by approximately 10% during the three months ended March 31, 2020 compared to the comparable period of 2019, we expect to potentially see year-over-year declines in some future quarters as reduced economic activity affects LNG demand and high storage inventory levels reduce the need for imports. The robust LNG supply additions over the past several years, along with BG Gulf Coastwarmer winters and now strict virus containment measures, have exerted downward pressure on global gas prices. As an example, the Dutch Title Transfer Facility (“TTF”), a virtual trading point for natural gas in the Netherlands, averaged $3.35 during the quarter ended March 31, 2020, 51% lower than the comparable period of 2019, while the Japan Korean Marker (“JKM”), an LNG LLC relating to Train 4benchmark price assessment for spot physical cargoes delivered ex-ship into certain key markets in Asia, averaged $4.82 during the three months ended March 31, 2020, 43% lower than the comparable period of 2019. As a result of the Liquefaction Project.weaker LNG market environment, as well as customer-specific variables, we have recently experienced an increase in the number of LNG cargoes for which our customers have notified us they will not take delivery. While this may impact our expected LNG production, we do not expect it to have a material impact on our forecasted financial results for 2020, due to the highly contracted nature of our business and the fact that customers continue to be obligated to pay fixed fees for cargoes in relation to which they have exercised their contractual right to cancel. Revenue associated with canceled LNG cargoes is generally recognized upon notice of customer cancellation. During the three months ended March 31, 2020, we recognized revenue of approximately $16 million associated with canceled LNG cargoes.
In addition, in response to the COVID-19 pandemic, Cheniere has modified certain business and workforce practices to protect the safety and welfare of its employees who continue to work at its facilities and offices worldwide, as well as implemented certain mitigation efforts to ensure business continuity. In March 2020, Cheniere began consulting with a medical advisor, and implemented social distancing through revised shift schedules, work from home policies and designated remote work locations where appropriate, restricted non-essential business travel and began requiring self-screening for employees and contractors. In April 2020, Cheniere began utilizing temporary on-site housing for its workforce at our facilities, implemented temperature testing, incorporated medical and social workers to support employees, enforced prior self-isolation and screening for on-site housing and implemented marine operations with zero contact during loading activities. These measures have resulted in increased costs, which Cheniere expects to continue until the risks associated with the COVID-19 pandemic diminish. As of April 28, 2020, we have incurred approximately $17 million of such costs.
Liquidity and Capital Resources
The following table provides a summary of our liquidity position at September 30, 2019March 31, 2020 and December 31, 20182019 (in millions):
|
| | | | | | | |
| | September 30, | | December 31, |
| | 2019 | | 2018 |
| Cash and cash equivalents | $ | 1,707 |
| | $ | — |
|
| Restricted cash designated for the following purposes: | | | |
| Liquefaction Project | 185 |
| | 756 |
|
| Cash held by us and our guarantor subsidiaries | — |
| | 785 |
|
| Available commitments under the following credit facilities: | | | |
| $1.2 billion SPL Working Capital Facility (“SPL Working Capital Facility”) | 786 |
| | 775 |
|
| 2019 CQP Credit Facilities | 750 |
| | — |
|
| $2.8 billion Credit Facilities (“2016 CQP Credit Facilities”) | — |
| | 115 |
|
For additional information regarding our debt agreements, see Note 10—Debt of our Notes to Consolidated Financial Statements in this quarterly report and Note 11—Debt of our Notes to Consolidated Financial Statements in our annual report on Form 10-K for the year ended December 31, 2018. |
| | | | | | | |
| | March 31, | | December 31, |
| | 2020 | | 2019 |
| Cash and cash equivalents | $ | 1,734 |
| | $ | 1,781 |
|
| Restricted cash designated for the following purposes: | | | |
| Liquefaction Project | 109 |
| | 181 |
|
| Available commitments under the following credit facilities: | | | |
| $1.2 billion Amended and Restated SPL Working Capital Facility (“2015 SPL Working Capital Facility”) | — |
| | 786 |
|
| 2020 SPL Working Capital Facility | 786 |
| | — |
|
| CQP Credit Facilities executed in 2019 (“2019 CQP Credit Facilities”) | 750 |
| | 750 |
|
CQP Senior Notes
In September 2019, we issued an aggregate principal amount of $1.5 billion of the 2029 CQP Senior Notes, which in addition to the existingThe $1.5 billion of 5.250% Senior Notes due 2025 (the “2025 CQP Senior Notes”) and, $1.1 billion of 5.625% Senior Notes due 2026 (the “2026 CQP Senior Notes”) and $1.5 billion of 4.500% Senior Notes due 2029 (the “2029 CQP Senior Notes”) (collectively, the “CQP Senior Notes”), are jointly and severally guaranteed by each of our subsidiaries other than SPL and, subject to certain conditions governing its guarantee, Sabine Pass LP (the “CQP Guarantors”). The 2025 CQP Senior Notes 2026 CQP Senior Notes and 2029 CQP Senior Notes (collectively, the “CQP Senior Notes”) are governed by
the same base indenture (the “CQP Base Indenture”). The 2025 CQP Senior Notes are further governed by the First Supplemental Indenture, (together with the CQP Base Indenture, the “2025 CQP Notes Indenture”), the 2026 CQP Senior Notes are further governed by the Second Supplemental Indenture (together with the CQP Base Indenture, the “2026 CQP Notes Indenture”) and the 2029 CQP Senior Notes are further governed by the Third Supplemental Indenture (together withIndenture. The indentures governing the CQP Base Indenture, the “2029 CQPSenior Notes Indenture”). The 2025 CQP Notes Indenture, the 2026 CQP Notes Indenture and the 2029 CQP Notes Indenture contain customary terms and events of default and certain covenants that, among other things, limit our ability and the ability of the CQP GuarantorsGuarantors’ ability to incur liens and sell assets, enter into transactions with affiliates, enter into sale-leaseback transactions and consolidate, merge or sell, lease or otherwise dispose of all or substantially all of the applicable entity’s properties or assets.
At any time prior to October 1, 2020 for the 2025 CQP Senior Notes, October 1, 2021 for the 2026 CQP Senior Notes and October 1, 2024 for the 2029 CQP Senior Notes, we may redeem all or a part of the applicable CQP Senior Notes at a redemption price equal to 100% of the aggregate principal amount of the CQP Senior Notes redeemed, plus the “applicable premium” set forth in the respective indentures governing the CQP Senior Notes, plus accrued and unpaid interest, if any, to the date of redemption. In addition, at any time prior to October 1, 2020 for the 2025 CQP Senior Notes, October 1, 2021 for the 2026 CQP Senior Notes and October 1, 2024 for the 2029 CQP Senior Notes, we may redeem up to 35% of the aggregate principal amount of the CQP Senior Notes with an amount of cash not greater than the net cash proceeds from certain equity offerings at a redemption price equal to 105.250% of the aggregate principal amount of the 2025 CQP Senior Notes, 105.625% of the aggregate principal amount
of the 2026 CQP Senior Notes and 104.5% of the aggregate principal amount of the 2029 CQP Senior Notes redeemed, plus accrued and unpaid interest, if any, to the date of redemption. We also may at any time on or after October 1, 2020 through the maturity date of October 1, 2025 for the 2025 CQP Senior Notes, October 1, 2021 through the maturity date of October 1, 2026 for the 2026 CQP Senior Notes and October 1, 2024 through the maturity date of October 1, 2029 for the 2029 CQP Senior Notes, redeem the CQP Senior Notes, in whole or in part, at the redemption prices set forth in the respective indentures governing the CQP Senior Notes.
The CQP Senior Notes are our senior obligations, ranking equally in right of payment with our other existing and future unsubordinated debt and senior to any of our future subordinated debt. In the event that the aggregate amount of our secured indebtedness and the secured indebtedness of the CQP Guarantors (other than the CQP Senior Notes or any other series of notes issued under the CQP Base Indenture) outstanding at any one time exceeds the greater of (1) $1.5 billion and (2) 10% of net tangible assets, the CQP Senior Notes will be secured to the same extent as such obligations under the 2019 CQP Credit Facilities. The obligations under the 2019 CQP Credit Facilities are secured on a first-priority basis (subject to permitted encumbrances) with liens on (1) substantially all theour existing and future tangible and intangible assets and our rights and the rights of the CQP Guarantors and equity interests in the CQP Guarantors (except, in each case, for certain excluded properties set forth in the 2019 CQP Credit Facilities) and (2) substantially all of the real property of SPLNG (except for excluded properties referenced in the 2019 CQP Credit Facilities). The liens securing the CQP Senior Notes, if applicable, will be shared equally and ratably (subject to permitted liens) with the holders of other senior secured obligations, which include the 2019 CQP Credit Facilities obligations and any future additional senior secured debt obligations.
2016 CQP Credit Facilities
In May 2019, the remaining commitments under the 2016 CQP Credit Facilities were terminated.
2019 CQP Credit Facilities
In May 2019, we entered into the 2019 CQP Credit Facilities, which consisted of the $750 million term loan (“CQP Term Facility”), which was prepaid and terminated upon issuance of the 2029 CQP Senior Notes in September 2019, and the $750 million revolving credit facility (“CQP Revolving Facility”). Borrowings under the 2019 CQP Credit Facilities will be used to fund the development and construction of Train 6 of the Liquefaction Project and for general corporate purposes, subject to a sublimit, and the 2019 CQP Credit Facilities are also available for the issuance of letters of credit.
Loans As of both March 31, 2020 and December 31, 2019, we had $750 million of available commitments and no letters of credit issued or loans outstanding under the 2019 CQP Credit Facilities accrue interest at a variable rate per annum equal to LIBOR or the base rate (equal to the highest of the prime rate, the federal funds effective rate, as published by the Federal Reserve Bank of New York, plus 0.50%, and the adjusted one-month LIBOR plus 1.0%), plus the applicable margin. Under the CQP Revolving Facility, the applicable margin for LIBOR loans is 1.25% to 2.125% per annum, and the applicable margin for base rate loans is 0.25% to 1.125% per annum, in each case depending on our then-current rating. Interest on LIBOR loans is due and payable at the end of each applicable LIBOR period (and at the end of every three-month period within the LIBOR period, if any), and interest on base rate loans is due and payable at the end of each calendar quarter.
We pay a commitment fee equal to an annual rate of 30% of the margin for LIBOR loans multiplied by the average daily amount of the undrawn commitment, payable quarterly in arrears.Facilities.
The 2019 CQP Credit Facilities mature on May 29, 2024. Any outstanding balance may be repaid, in whole or in part, at any time without premium or penalty, except for interest rate breakage costs. The 2019 CQP Credit Facilities contain conditions precedent for extensions of credit, as well as customary affirmative and negative covenants, and limit our ability to make restricted payments, including distributions, to once per fiscal quarter and one true-up per fiscal quarter as long as certain conditions are satisfied.
The 2019 CQP Credit Facilities are unconditionally guaranteed and secured by a first priority lien (subject to permitted encumbrances) on substantially all of our and the CQP Guarantors’ existing and future tangible and intangible assets and rights and equity interests in the CQP Guarantors (except, in each case, for certain excluded properties set forth in the 2019 CQP Credit Facilities).
Sabine Pass LNG Terminal
Liquefaction Facilities
The Liquefaction Project is one of the largest LNG production facilities in the world. We are in various stages of constructingcurrently operating five Trains and operatingtwo marine berths at the Liquefaction Project at the Sabine Pass LNG terminal adjacent to the existing regasification facilities.and are constructing one additional Train. We have received authorization from the FERC to site, construct and operate Trains 1 through 6.6, as well as for the construction of a third marine berth. We have achieved substantial completion of the first five Trains 1, 2, 3, 4 and 5 of the Liquefaction Project and commenced commercial operating activities for each Train at various times starting in May 2016, September 2016, March 2017, October 2017 and March 2019, respectively.2016. The following table summarizes the project completion and construction status of Train 6 of the Liquefaction Project as of September 30, 2019:March 31, 2020:
|
| | | |
| | | Train 6 |
| Overall project completion percentage | | 38.1%53.9% |
| Completion percentage of: | |
|
| Engineering | | 83.8%93.8% |
| Procurement | | 54.1%78.4% |
| Subcontract work | | 34.3%39.5% |
| Construction | | 5.5%15.0% |
| Date of expected substantial completion | | 1H 2023 |
The following orders have been issued by the DOE authorizing the export of domestically produced LNG by vessel from the Sabine Pass LNG terminal:
Trains 1 through 4—FTA countries for a 30-year term, which commenced onin May 15, 2016, and non-FTA countries for a 20-year term, which commenced onin June 3, 2016, in an amount up to a combined total of the equivalent of 16 mtpa (approximately 803 Bcf/yr of natural gas).
Trains 1 through 4—FTA countries for a 25-year term and non-FTA countries for a 20-year term, both of which commenced in December 2018, in an amount up to a combined total of the equivalent of approximately 203 Bcf/yr of natural gas (approximately 4 mtpa).
Trains 5 and 6—FTA countries and non-FTA countries for a 20-year term, which partially commenced in June 2019 and the remainder commenced in September 2019, in an amount up to a combined total of 503.3 Bcf/yr of natural gas (approximately 10 mtpa).
In each case, the terms of these authorizations beginbegan on the earlier of the date of first export thereunder or the date specified in the particular order, which ranges from five to 10 years from the date the order was issued.order. In addition, SPL received an order providing for a three-year makeup period with respect to each of the non-FTA orders for LNG volumes SPL was authorized but unable to export during any portion of the initial 20-year export period of such order.
In January 2018, theThe DOE issued ordersan order authorizing SPL to export domestically produced LNG by vessel from the Sabine Pass LNG terminal to FTA countries and non-FTA countries over a two-year period commencing January 2018,2020, in an aggregate amount up to the equivalent of 600 Bcf of natural gas (however, exports under this order, when combined with exports under the orders above, may not exceed 1,509 Bcf/yr).
An application was filed in September 2019 seeking authorization to make additional exports from the Liquefaction Project to FTA countries for a 25-year term and to non-FTA countries for a 20-year term in an amount up to the equivalent of approximately 153 Bcf/yr of natural gas, for a total Liquefaction Project export capacity of approximately 1,662 Bcf/yr. The terms of the authorizations are requested to commence on the date of first commercial export from the Liquefaction Project of the volumes contemplated in the application. In April 2020, the DOE issued an order authorizing SPL to export to FTA countries related to this application, but has not yet issued an order authorizing SPL to export to non-FTA countries for the corresponding LNG volume. A corresponding application for authorization to increase the total LNG production capacity of the Liquefaction Project from the currently authorized level to approximately 1,662 Bcf/yr was also submitted to the FERC and is currently pending.
Customers
SPL has entered into fixed price long-term SPAs generally with terms of at least 20 years (plus extension rights) with eight third parties for Trains 1 through 6 of the Liquefaction Project including an agreement anticipated to be assigned from Cheniere Marketing, to make available an aggregate amount of LNG that is between approximately
75% to 85% of the expected aggregate adjusted nominaltotal production capacity from these Trains.Trains, potentially increasing up to approximately 85% after giving effect to an SPA that Cheniere has committed to provide to us by the end of 2020. Under these SPAs, the customers will purchase LNG from SPL on a free on board (“FOB”) basis for a price consisting of a fixed fee per MMBtu of LNG (a portion of which is subject to annual adjustment for inflation) plus a variable fee per MMBtu of LNG generally equal to approximately 115% of Henry Hub. In certain circumstances, theThe customers may elect to cancel or suspend deliveries of LNG cargoes, with advance notice as governed by each respective SPA, in which case the customers would still be required to pay the fixed fee with respect to the contracted volumes that are not delivered as a result of such cancellation or suspension. We refer to the fee component that is applicable regardless of a cancellation or suspension of LNG cargo deliveries under the SPAs as the fixed fee component of the price under SPL’s SPAs. We refer to the fee component that is applicable only in connection with LNG cargo deliveries as the variable fee component of the price under SPL’s SPAs. The variable fees under SPL’s SPAs were generally sized at the time of entry into each SPA with the intent to cover the costs of gas purchases and transportation related to, and operating and maintenance costsliquefaction fuel to produce the LNG to be sold under each such SPA. The SPAs and contracted volumes to be made available under the SPAs are not tied to a specific Train; however, the term of each SPA generally commences upon the date of first commercial delivery of a specified Train.
In aggregate, the annual fixed fee portion to be paid by the third-party SPA customers is approximately $2.3$2.9 billion for Trains 1 through 4 and increasing to $2.9 billion upon the date of first commercial delivery of Train 5, which occurred in September 2019.5. After giving effect to an SPA that Cheniere has committed to provide to SPL by the end of 2020, the annual fixed fee portion to be paid by the third-party SPA customers would increase to at least $3.3 billion, which is expected to occur upon the date of first commercial delivery of Train 6.
In addition, Cheniere Marketing has agreements with SPL to purchase: (1) at Cheniere Marketing’s option, any LNG produced by SPL in excess of that required for other customers and (2) up to 2043 cargoes totaling approximately 70 million MMBtu scheduled for delivery between May 3 and December 31, 2019in 2020 at a price of 115% of Henry Hub plus $2.00$1.67 per MMBtu.
Natural Gas Transportation, Storage and Supply
To ensure SPL is able to transport adequate natural gas feedstock to the Sabine Pass LNG terminal, it has entered into transportation precedent and other agreements to secure firm pipeline transportation capacity with CTPL and third-party pipeline companies. SPL has entered into firm storage services agreements with third parties to assist in managing variability in natural gas needs for the Liquefaction Project. SPL has also entered into enabling agreements and long-term natural gas supply contracts with third parties in order to secure natural gas feedstock for the Liquefaction Project. As of September 30, 2019,March 31, 2020, SPL had secured up to approximately 4,1085,300 TBtu of natural gas feedstock through long-term and short-term natural gas supply contracts with remaining terms that range up to ten years.10 years, a portion of which is subject to conditions precedent.
Construction
SPL entered into lump sum turnkey contracts with Bechtel Oil, Gas and Chemicals, Inc. (“Bechtel”) for the engineering, procurement and construction of Trains 1 through 6 of the Liquefaction Project, under which Bechtel charges a lump sum for all work performed and generally bears project cost, riskschedule and performance risks unless certain specified events occur, in which case Bechtel may cause SPL to enter into a change order, or SPL agrees with Bechtel to a change order.
The total contract price of the EPC contract for Train 6 of the Liquefaction Project is approximately $2.5 billion, including estimated costs for an optional third marine berth. As of March 31, 2020, we have incurred $1.3 billion under this contract.
Regasification Facilities
The Sabine Pass LNG terminal has operational regasification capacity of approximately 4.04 Bcf/d and aggregate LNG storage capacity of approximately 16.917 Bcfe. Approximately 2.02 Bcf/d of the regasification capacity at the Sabine Pass LNG terminal has been reserved under two long-term third-party TUAs, under which SPLNG’s customers are required to pay fixed monthly fees, whether or not they use the LNG terminal. Each of Total and Chevron U.S.A. Inc. (“Chevron”) has reserved approximately 1.01 Bcf/d of regasification capacity and is obligated to make monthly capacity payments to SPLNG aggregating approximately $125 million annually, prior to inflation adjustments, for 20 years that commenced in 2009. Total S.A. has guaranteed Total’s obligations under its TUA up to $2.5 billion, subject to certain exceptions, and Chevron Corporation has guaranteed Chevron’s obligations under its TUA up to 80% of the fees payable by Chevron.
The remaining approximately 2.02 Bcf/d of capacity has been reserved under a TUA by SPL. SPL is obligated to make monthly capacity payments to SPLNG aggregating approximately $250 million annually, prior to inflation adjustments, continuing until
at least May 2036. SPL entered into a partial TUA assignment agreement with Total, whereby upon substantial completion of Train 5 of the Liquefaction Project, SPL gained access to substantially all of Total’s capacity and other services provided under Total’s TUA with SPLNG. This agreement provides SPL with additional berthing and storage capacity at the Sabine Pass LNG terminal that may be used to provide increased flexibility in managing LNG cargo loading and unloading activity, permit SPL to more flexibly manage its LNG storage capacity and accommodate the development of Train 6. Notwithstanding any arrangements between Total and SPL, payments required to be made by Total to SPLNG will continue to be made by Total to SPLNG in accordance with its TUA. During the three months ended September 30,March 31, 2020 and 2019, and 2018, SPL recorded $32 million and $7.5 million, respectively, and during the nine months ended September 30, 2019 and 2018, SPL recorded $72 million and $23 million, respectively, as operating and maintenance expense under this partial TUA assignment agreement.
Under each of these TUAs, SPLNG is entitled to retain 2% of the LNG delivered to the Sabine Pass LNG terminal.
Capital Resources
We currently expect that SPL’s capital resources requirements with respect to the Liquefaction Project will be financed through project debt and borrowings, cash flows under the SPAs and equity contributions from us. We believe that with the net proceeds of borrowings, available commitments under the 2020 SPL Working Capital Facility, 2019 CQP Credit Facilities, cash flows from operations and equity contributions from us, SPL will have adequate financial resources available to meet its currently anticipated capital, operating and debt service requirements with respect to Trains 1 through 6 of the Liquefaction Project. SPL began generating cash flows from operations from the Liquefaction Project in May 2016, when Train 1 achieved substantial completion and initiated operating activities. Trains 2, 3, 4 and 5 subsequently achieved substantial completion in September 2016, March 2017, October 2017 and March 2019, respectively. We realized offsets to LNG terminal costs of $48 million in the nine months ended September 30, 2019 that were related to the sale of commissioning cargoes because these amounts were earned or loaded prior to the start of commercial operations of Train 5 of the Liquefaction Project during the testing phase for its construction. We did not realize any offsets to LNG terminal costs in the three months ended September 30, 2019 and in the three and nine months ended September 30, 2018. Additionally, SPLNG generates cash flows from the TUAs, as discussed above.
The following table provides a summary of our capital resources from borrowings and available commitments for the Sabine Pass LNG Terminal, excluding equity contributions to our subsidiaries and cash flows from operations (as described in Sources and Uses of Cash), at September 30, 2019March 31, 2020 and December 31, 20182019 (in millions):
| | | | | September 30, | | December 31, | | March 31, | | December 31, |
| | | 2019 | | 2018 | | 2020 | | 2019 |
| Senior notes (1) | | $ | 17,750 |
| | $ | 16,250 |
| | $ | 17,750 |
| | $ | 17,750 |
|
| Credit facilities outstanding balance (2) | | — |
| | — |
| | — |
| | — |
|
| Letters of credit issued (3) | | 414 |
| | 425 |
| | 414 |
| | 414 |
|
| Available commitments under credit facilities (3) | | 1,536 |
| | 775 |
| | 1,536 |
| | 1,536 |
|
Total capital resources from borrowings and available commitments | | $ | 19,700 |
| | $ | 17,450 |
| | $ | 19,700 |
| | $ | 19,700 |
|
| |
| (1) | Includes SPL’s 5.625% Senior Secured Notes due 2021, 6.25% Senior Secured Notes due 2022, 5.625% Senior Secured Notes due 2023, 5.75% Senior Secured Notes due 2024, 5.625% Senior Secured Notes due 2025, 5.875% Senior Secured Notes due 2026 (the “2026 SPL Senior Notes”), 5.00% Senior Secured Notes due 2027 (the “2027 SPL Senior Notes”), 4.200% Senior Secured Notes due 2028 (the “2028 SPL Senior Notes”) and 5.00% Senior Secured Notes due 2037 (the “2037 SPL Senior Notes”) (collectively, the “SPL Senior Notes”) and our CQP Senior Notes. |
| |
| (2) | Includes outstanding balances under the 2015 SPL Working Capital Facility, 2020 SPL Working Capital Facility and 2019 CQP Credit Facilities, inclusive of any portion of the 2020 SPL Working Capital Facility and 2019 CQP Credit Facilities that may be used for general corporate purposes. |
| |
| (3) | Consists of 2015 SPL Working Capital Facility, 2020 SPL Working Capital Facility and 2019 CQP Credit Facilities. Balance at December 31, 2018 did |
| |
| (4) | Does not include the letters of credit issued orequity contributions that may be available commitmentsfrom Cheniere’s borrowings under the terminated 2016 CQP Credit Facilities,its convertible notes, which were not specificallymay be used for the Sabine Pass LNG Terminal. |
For additional information regarding our debt agreements related to the Sabine Pass LNG Terminal, see Note 10—Debt of our Notes to Consolidated Financial Statements in this quarterly report and Note 11—Debt of our Notes to Consolidated Financial Statements in our annual report on Form 10-K for the year ended December 31, 2018.2019.
SPL Senior Notes
The SPL Senior Notes are secured on a pari passu first-priority basis by a security interest in all of the membership interests in SPL and substantially all of SPL’s assets.
At any time prior to three months before the respective dates of maturity for each series of the SPL Senior Notes (except for the 2026 SPL Senior Notes, 2027 SPL Senior Notes, 2028 SPL Senior Notes and 2037 SPL Senior Notes, in which case the
time period is six months before the respective dates of maturity), SPL may redeem all or part of such series of the SPL Senior Notes at a redemption price equal to the “make-whole” price (except for the 2037 SPL Senior Notes, in which case the redemption price is equal to the “optional redemption” price) set forth in the respective indentures governing the SPL Senior Notes, plus accrued and unpaid interest, if any, to the date of redemption. SPL may also, at any time within three months of the respective maturity dates for each series of the SPL Senior Notes (except for the 2026 SPL Senior Notes, 2027 SPL Senior Notes, 2028 SPL Senior Notes and 2037 SPL Senior Notes, in which case the time period is within six months of the respective dates of maturity),
redeem all or part of such series of the SPL Senior Notes at a redemption price equal to 100% of the principal amount of such series of the SPL Senior Notes to be redeemed, plus accrued and unpaid interest, if any, to the date of redemption.
Both the indenture governing the 2037 SPL Senior Notes (the “2037 SPL Senior Notes Indenture”) and the common indenture governing the remainder of the SPL Senior Notes (the “SPL Indenture”) include restrictive covenants. SPL may incur additional indebtedness in the future, including by issuing additional notes, and such indebtedness could be at higher interest rates and have different maturity dates and more restrictive covenants than the current outstanding indebtedness of SPL, including the SPL Senior Notes and the 2020 SPL Working Capital Facility. Under the 2037 SPL Senior Notes Indenture and the SPL Indenture, SPL may not make any distributions until, among other requirements, deposits are made into debt service reserve accounts as required and a debt service coverage ratio test of 1.25:1.00 is satisfied. Semi-annual principal payments for the 2037 SPL Senior Notes are due on March 15 and September 15 of each year beginning September 15, 2025.2025 and are fully amortizing according to a fixed sculpted amortization schedule.
2015 SPL Working Capital Facility
In SeptemberMarch 2020, SPL terminated the remaining commitments under the 2015 SPL Working Capital Facility. As of December 31, 2019, SPL had $786 million of available commitments, $414 million aggregate amount of issued letters of credit and no outstanding borrowings under the 2015 SPL Working Capital Facility.
2020 SPL Working Capital Facility
In March 2020, SPL entered into the 2020 SPL Working Capital Facility with aggregate commitments of $1.2 billion, which replaced the 2015 SPL Working Capital Facility. The 2020 SPL Working Capital Facility is intended to be used for loans to SPL, (“Working Capital Loans”),swing line loans to SPL and the issuance of letters of credit on behalf of SPL, as well as for swing line loans to SPL (“Swing Line Loans”), primarily for certain working capital requirements(1) the refinancing of the 2015 SPL Working Capital Facility, (2) fees and expenses related to developingthe 2020 SPL Working Capital Facility, (3) SPL’s gas purchase obligations and placing into operation the Liquefaction Project.(4) SPL and certain of its future subsidiaries’ general corporate purposes. SPL may, from time to time, request increases in the commitments under the 2020 SPL Working Capital Facility of up to $760 million and, upon the completion of the debt financing of Train 6 of the Liquefaction Project, request an incremental increase in commitments of up to an additional $390$800 million. As of September 30, 2019 and DecemberMarch 31, 2018,2020, SPL had $786 million and $775 million of available commitments, and $414 million and $425 million aggregate amount of issued letters of credit under the SPL Working Capital Facility, respectively. SPL did not have anyand no outstanding borrowings under the 2020 SPL Working Capital Facility as of both September 30, 2019 and December 31, 2018.Facility.
The 2020 SPL Working Capital Facility matures on December 31, 2020, and the outstanding balanceMarch 19, 2025, but may be repaid, in whole or in part, at any time without premium or penalty upon three business days’ notice. Loans deemed made in connectionextended with a draw upon a letterconsent of credit have a term of up to one year. Swing Line Loans terminate upon the earliest of (1) the maturity date or earlier termination of thelenders. The 2020 SPL Working Capital Facility (2) the date 15 days after such Swing Line Loan is made and (3) the first borrowing dateprovides for a Working Capital Loan or Swing Line Loan occurring at least three business days following the date the Swing Line Loan is made. SPL is required to reduce the aggregate outstanding principal amount of all Working Capital Loans to zero for a period of five consecutive business days at least once each year.mandatory prepayments under customary circumstances.
The 2020 SPL Working Capital Facility contains customary conditions precedent for extensions of credit, as well as customary affirmative and negative covenants. SPL is restricted from making certain distributions under agreements governing its indebtedness generally until, among other requirements, satisfaction of a 12-month forward-looking and backward-looking 1.25:1.00 debt service reserve ratio test. The obligations of SPL under the 2020 SPL Working Capital Facility are secured by substantially all of the assets of SPL as well as a pledge of all of the membership interests in SPL and certain future subsidiaries of SPL on a pari passu basis by a first priority lien with the SPL Senior Notes.
Restrictive Debt Covenants
As of September 30, 2019,March 31, 2020, we and SPL were in compliance with all covenants related to our respective debt agreements.
LIBOR
The use of LIBOR is expected to be phased out by the end of 2021. It is currently unclear whether LIBOR will be utilized beyond that date or whether it will be replaced by a particular rate. We intend to continue to work with our lenders to pursue any amendments to our debt agreements that are currently subject to LIBOR and will continue to monitor, assess and plan for the phase out of LIBOR.
Sources and Uses of Cash
The following table summarizes the sources and uses of our cash, cash equivalents and restricted cash for the ninethree months ended September 30,March 31, 2020 and 2019 and 2018 (in millions). The table presents capital expenditures on a cash basis; therefore, these amounts differ from the amounts of capital expenditures, including accruals, which are referred to elsewhere in this report. Additional discussion of these items follows the table.
| | | | Nine Months Ended September 30, | Three Months Ended March 31, |
| | 2019 | | 2018 | 2020 | | 2019 |
| Operating cash flows | $ | 977 |
| | $ | 1,264 |
| $ | 535 |
| | $ | 344 |
|
| Investing cash flows | (1,157 | ) | | (578 | ) | (317 | ) | | (284 | ) |
| Financing cash flows | 531 |
| | (818 | ) | (337 | ) | | (304 | ) |
| | | | | | | |
| Net increase (decrease) in cash, cash equivalents and restricted cash | 351 |
|
| (132 | ) | |
| Net decrease in cash, cash equivalents and restricted cash | | (119 | ) |
| (244 | ) |
| Cash, cash equivalents and restricted cash—beginning of period | 1,541 |
| | 1,589 |
| 1,962 |
| | 1,541 |
|
| Cash, cash equivalents and restricted cash—end of period | $ | 1,892 |
| | $ | 1,457 |
| $ | 1,843 |
| | $ | 1,297 |
|
Operating Cash Flows
Our operating cash net inflows during the ninethree months ended September 30,March 31, 2020 and 2019 and 2018 were $977$535 million and $1,264$344 million, respectively. The $287$191 million decreaseincrease in operating cash inflows in 2019 compared to 2018 was primarily related to increased operating costs and expenses, partially offset by increased cash receipts from the sale of LNG cargoes as a result of an additional Train 5 that was operatingbecame operational at the Liquefaction Project in 2019. In addition to Trains 1 through 4 of the Liquefaction Project that were operational during both the nine months ended September 30, 2019 and 2018, Train 5 was operational for approximately seven months during the nine months ended September 30,March 2019.
Investing Cash Flows
Investing cash net outflows during the ninethree months ended September 30,March 31, 2020 and 2019 and 2018 were $1,157$317 million and $578$284 million, respectively, and were primarily used to fund the construction costs for the Liquefaction Project. These costs are capitalized as construction-in-process until achievement of substantial completion.
Financing Cash Flows
Financing cash net inflowsoutflows of $531$337 million during the ninethree months ended September 30, 2019 wasMarch 31, 2020 were primarily a result of:
$730330 million of borrowingsdistributions to unitholders; and repayments under the 2019 CQP Credit Facilities;
issuance of an aggregate principal amount of $1.5 billion of the 2029 CQP Senior Notes, which was used to prepay the outstanding balance of the term loan under the 2019 CQP Credit Facilities;
$337 million of debt issuance costs related to the up-front fees paid upon the issuancerefinancing of the 2019 CQP Credit Facilities and 2029 CQP Senior Notes; and
$935 million of distributions to unitholders.2020 SPL Working Capital Facility.
Financing cash net outflows of $818$304 million during the ninethree months ended September 30, 2018 was primarilyMarch 31, 2019 were a result of:
issuance of an aggregate principal amount of $1.1 billion of the 2026 CQP Senior Notes, which was used to prepay $1.1billion of the outstanding borrowings under the 2016 CQP Credit Facilities;
$8 million of debt issuance costs related to up-front fees paid upon the issuance of the 2026 CQP Senior Notes;
$6 million in debt extinguishment costs related to the prepayment of the 2016 CQP Credit Facilities; and
$814 million in distributions to unitholders.
Cash Distributions to Unitholders
Our partnership agreement requires that, within 45 days after the end of each quarter, we distribute all of our available cash (as defined in our partnership agreement). Our available cash is our cash on hand at the end of a quarter less the amount of any reserves established by our general partner. All distributions paid to date have been made from accumulated operating surplus. The following provides a summary of distributions paid by us during the ninethree months ended September 30, 2019March 31, 2020 and 2018:2019:
|
| | | | | | | | | | | | | | | | | | | | | | | | | | |
| | | | | | | | | Total Distribution (in millions) |
| Date Paid | | Period Covered by Distribution | | Distribution Per Common Unit | | Distribution Per Subordinated Unit | | Common Units | | Subordinated Units | | General Partner Units | | Incentive Distribution Rights |
| August 14, 2019 | | April 1 - June 30, 2019 | | $ | 0.61 |
| | $ | 0.61 |
| | $ | 213 |
| | $ | 83 |
| | $ | 6 |
| | $ | 15 |
|
| May 15, 2019 | | January 1 - March 31, 2019 | | 0.60 |
| | 0.60 |
| | 209 |
| | 81 |
| | 6 |
| | 13 |
|
| February 14, 2019 | | October 1 - December 31, 2018 | | 0.59 |
| | 0.59 |
| | 206 |
| | 80 |
| | 6 |
| | 12 |
|
| | | | | | | | | | | | | | | |
| August 14, 2018 | | April 1 - June 30, 2018 | | 0.56 |
| | 0.56 |
| | 195 |
| | 76 |
| | 6 |
| | 7 |
|
| May 15, 2018 | | January 1 - March 31, 2018 | | 0.55 |
| | 0.55 |
| | 192 |
| | 74 |
| | 5 |
| | 6 |
|
| February 14, 2018 | | October 1 - December 31, 2017 | | 0.50 |
| | 0.50 |
| | 174 |
| | 68 |
| | 5 |
| | 1 |
|
|
| | | | | | | | | | | | | | | | | | | | | | | | | | |
| | | | | | | | | Total Distribution (in millions) |
| Date Paid | | Period Covered by Distribution | | Distribution Per Common Unit | | Distribution Per Subordinated Unit | | Common Units | | Subordinated Units | | General Partner Units | | Incentive Distribution Rights |
| | | | | | | | | | | | | | | |
| | | | | | | | | | | | | | | |
| February 14, 2020 | | October 1- December 31, 2019 | | $ | 0.63 |
| | $ | 0.63 |
| | $ | 220 |
| | $ | 85 |
| | $ | 6 |
| | $ | 18 |
|
| February 14, 2019 | | October 1 - December 31, 2018 | | 0.59 |
| | 0.59 |
| | 206 |
| | 80 |
| | 6 |
| | 12 |
|
On October 28, 2019,April 27, 2020, we declared a $0.62$0.64 distribution per common unit and subordinated unit and the related distribution to our general partner and incentive distribution right holders to be paid on November 14, 2019May 15, 2020 to unitholders of record as of NovemberMay 7, 20192020 for the period from JulyJanuary 1, 20192020 to September 30, 2019.March 31, 2020.
The subordinated units will receive distributions only to the extent we have available cash above the initial quarterly distributions requirement for our common unitholders and general partner along with certain reserves. Such available cash could be generated through new business development. The ending of the subordination period and conversion of the subordinated units into common units will depend upon future business development.
Results of Operations
The following charts summarize the number of Trains that were in operation during the year ended December 31, 2019 and the three months ended March 31, 2020 and total revenues and total LNG volumes loaded (including both operational and commissioning volumes) during the three months ended March 31, 2020 and 2019:
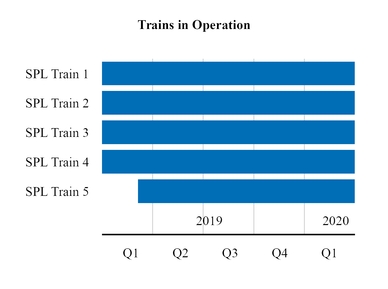
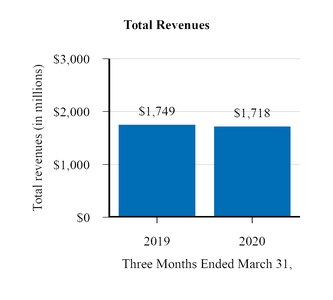
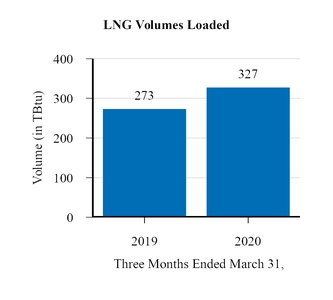
Our consolidated net income was $110$435 million, or $0.19$0.84 per common unit (basic and diluted), in the three months ended September 30, 2019,March 31, 2020, compared to $307$385 million, or $0.60$0.75 per common unit (basic and diluted), in the three months ended September 30, 2018.March 31, 2019. This $197$50 million decreaseincrease in net income was primarily a result of increased operating and maintenance expense, increased depreciation and amortization expense, and decreased margins due to decreased pricing on LNG but higher volumes of LNG sold, and increased interest expense, net of capitalized interest, due to a decrease in the portion of total interest costs that could be capitalized as Train 5 of the Liquefaction Project completed construction in March 2019.
Our consolidated net income was $727 million, or $1.38 per common unit (basic and diluted), in the nine months ended September 30, 2019, compared to $923 million, or $1.82 per common unit (basic and diluted), in the nine months ended September 30, 2018. This $196 million decrease in net income was primarily a result of increased operating and maintenance expense, increased interest expense, net of capitalized interest and increased depreciation and amortization expense, partially offset by increasedgross margins due to higher volumes of LNG sold, but decreased pricing on LNG.partially offset by increases in (1) interest expense, net of capitalized interest, (2) operating and maintenance expense and (3) depreciation and amortization expense.
We enter into derivative instruments to manage our exposure to changing interest rates and commodity-related marketing and price risk. Derivative instruments are reported at fair value on our Consolidated Financial Statements. In some cases, the underlying transactions economically hedged receive accrual accounting treatment, whereby revenues and expenses are recognized only upon delivery, receipt or realization of the underlying transaction. Because the recognition of derivative instruments at fair value has the effect of recognizing gains or losses relating to future period exposure, use of derivative instruments may increase the volatility of our results of operations based on changes in market pricing, counterparty credit risk and other relevant factors.
Revenues
| | | | Three Months Ended September 30, | | Nine Months Ended September 30, | Three Months Ended March 31, |
| (in millions, except volumes) | 2019 | | 2018 | | Change | | 2019 | | 2018 | | Change | 2020 | | 2019 | | Change |
| LNG revenues | $ | 1,140 |
| | $ | 1,249 |
| | $ | (109 | ) | | $ | 3,678 |
| | $ | 3,419 |
| | $ | 259 |
| $ | 1,449 |
| | $ | 1,367 |
| | $ | 82 |
|
| LNG revenues—affiliate | 257 |
| | 205 |
| | 52 |
| | 1,017 |
| | 886 |
| | 131 |
| 188 |
| | 305 |
| | (117 | ) |
| Regasification revenues | 66 |
| | 66 |
| | — |
| | 199 |
| | 196 |
| | 3 |
| 67 |
| | 66 |
| | 1 |
|
| Other revenues | 13 |
| | 9 |
| | 4 |
| | 36 |
| | 28 |
| | 8 |
| 14 |
| | 11 |
| | 3 |
|
| Total revenues | $ | 1,476 |
| | $ | 1,529 |
| | $ | (53 | ) | | $ | 4,930 |
| | $ | 4,529 |
| | $ | 401 |
| $ | 1,718 |
| | $ | 1,749 |
| | $ | (31 | ) |
| | | | | | | | | | | | | | | | | |
| LNG volumes recognized as revenues (in TBtu) | 277 |
| | 228 |
| | 49 |
| | 845 |
| | 691 |
| | 154 |
| 327 |
| | 263 |
| | 64 |
|
We begin recognizing LNGTotal revenues decreased during the three months ended March 31, 2020 from the Liquefaction Project following the substantial completion and the commencement of operating activities of the respective Trains. In addition to Trains 1 through 4 of the Liquefaction Project that were operational during both the ninethree months ended September 30,March 31, 2019, and 2018, Train 5primarily as a result of decreased revenues per MMBtu, partially offset by increased volumes recognized as revenues between the Liquefaction Project was operational for approximately seven months during the nine months ended September 30, 2019. The decrease inperiods. LNG revenues during the three months ended September 30, 2019 from the comparable period March 31, 2020 also included $16 millionin 2018 was primarilyrevenues attributable to the decreased revenues per MMBtu,LNG cargoes contractually canceled by our customers, for which was partially offset by the increased volumesrevenue is generally recognized upon notice of LNG sold following the achievement of substantial completion of Train 5 of the Liquefaction Project. The increase in revenues during the nine months ended September 30, 2019 from the nine months ended September 30, 2018 was primarily attributable to the increased volumes of LNG, partially offset by decreased revenues per MMBtu.customer cancellation. We expect our LNG revenues to increase in the future upon Train 6 of the Liquefaction Project becoming operational.
Prior to substantial completion of a Train, amounts received from the sale of commissioning cargoes from that Train are offset against LNG terminal construction-in-process, because these amounts are earned or loaded during the testing phase for the construction of that Train. WeDuring the three months ended March 31, 2019, we realized offsets to LNG terminal costs of $48 million corresponding to 10 TBtu of LNG, in the nine
months ended September 30, 2019 that were related to the sale of commissioning cargoes from the Liquefaction Project.cargoes. We did not realize any offsets to LNG terminal costs induring the three months ended September 30, 2019 and in the three and nine months ended September 30, 2018.March 31, 2020.
Also included in LNG revenues are gains and losses from derivative instruments which include the realized value associated with a portion of derivative instruments that settle through physical delivery, and the sale of unutilized natural gas procured for the liquefaction process. DuringWe recognized revenues of $56 million and $45 million during the three months ended September 30,March 31, 2020 and 2019, and 2018, we realized $35 million and $67 million, respectively, of gains and other revenues from these transactions. During the nine months ended September 30, 2019 and 2018, we realized $114 million and $127 million, respectively, of gainsrelated to derivative instruments and other revenues from these transactions.
Operating costs and expenses
| | | | Three Months Ended September 30, | | Nine Months Ended September 30, | Three Months Ended March 31, |
| (in millions) | 2019 | | 2018 | | Change | | 2019 | | 2018 | | Change | 2020 | | 2019 | | Change |
| Cost of sales | $ | 742 |
| | $ | 756 |
| | $ | (14 | ) | | $ | 2,501 |
| | $ | 2,291 |
| | $ | 210 |
| $ | 699 |
| | $ | 879 |
| | $ | (180 | ) |
| Cost of sales—affiliate | 6 |
| | — |
| | 6 |
| | 6 |
| | — |
| | 6 |
| |
| Operating and maintenance expense | 172 |
| | 113 |
| | 59 |
| | 472 |
| | 306 |
| | 166 |
| 152 |
| | 138 |
| | 14 |
|
| Operating and maintenance expense—affiliate | 34 |
| | 31 |
| | 3 |
| | 100 |
| | 87 |
| | 13 |
| 33 |
| | 29 |
| | 4 |
|
| Development expense | — |
| | 1 |
| | (1 | ) | | — |
| | 2 |
| | (2 | ) | |
| General and administrative expense | 3 |
| | 3 |
| | — |
| | 9 |
| | 9 |
| | — |
| 2 |
| | 3 |
| | (1 | ) |
| General and administrative expense—affiliate | 34 |
| | 18 |
| | 16 |
| | 82 |
| | 53 |
| | 29 |
| 25 |
| | 21 |
| | 4 |
|
| Depreciation and amortization expense | 138 |
| | 107 |
| | 31 |
| | 390 |
| | 318 |
| | 72 |
| 138 |
| | 114 |
| | 24 |
|
| Impairment expense and loss on disposal of assets | 1 |
| | 8 |
| | (7 | ) | | 6 |
| | 8 |
| | (2 | ) | 5 |
| | 2 |
| | 3 |
|
| Total operating costs and expenses | $ | 1,130 |
| | $ | 1,037 |
| | $ | 93 |
| | $ | 3,566 |
| | $ | 3,074 |
| | $ | 492 |
| $ | 1,054 |
| | $ | 1,186 |
| | $ | (132 | ) |
Our total operating costs and expenses increaseddecreased during the three and nine months ended September 30, 2019March 31, 2020 from the three and nine months ended September 30, 2018,March 31, 2019, primarily as a result of an additionaldecreased cost of sales from lower pricing of natural gas feedstock, partially offset by increased TUA reservation charges due to Total under the partial TUA assignment agreement and increased depreciation and amortization expense as Train that was operating between each5 of the periods and increased third-party service and maintenance costs from additional maintenance and related activities at the Liquefaction Project.Project became operational in March 2019.
Cost of sales includes costs incurred directly for the production and delivery of LNG from the Liquefaction Project, to the extent those costs are not utilized for the commissioning process. Cost of sales decreased during the three months ended September 30, 2019March 31, 2020 from the three months ended September 30, 2018March 31, 2019, primarily due to decreaseddecrease in pricing of natural gas feedstock between the quarterly periods, which in turn was partially offset by increased volumes of natural gas feedstock for our LNG sales as a result of substantial completion of Train 5 of the Liquefaction Project. Additionally, thereProject that was aoperational for one of the three months ended March 31, 2019 compared to all three months ended March 31, 2020. Partially offsetting the decrease in costs associated with a portioncost of natural gas feedstock was decreased derivative instruments that settle through physical delivery. Partially offsetting these decreases was increased derivative lossesgains from a decrease in fair value of the derivatives associated withour economic hedges to secure natural gas feedstock for the Liquefaction Project. Cost of sales increased during the nine months ended September 30, 2019 from the nine months ended September 30, 2018Project, primarily due to increased volumes of natural gas feedstock for our LNG sales as a result of substantial completion of Train 5 of the Liquefaction Project, partially offset by decreased pricing of natural gas feedstockrelative shifts in long-term forward prices between the periods. Partially offsetting the increase in cost of natural gas feedstock was decreased derivative losses from an increase in fair value of the derivatives associated with hedges to secure natural gas feedstock for the Liquefaction Project, due to a favorable shift in the long-term forward prices. Cost of sales also includes variable transportation and storage costs and other costs to convert natural gas into LNG.
Operating and maintenance expense primarily includes costs associated with operating and maintaining the Liquefaction Project. The increase in operating and maintenance expense (including affiliates) during the three and nine months ended September 30, 2019March 31, 2020 from the three and nine months ended September 30, 2018March 31, 2019 was primarily related to: (1) increased cost of turnaround and related activities at the Liquefaction Project, (2)to increased TUA reservation charges paiddue to Total from payments under the partial TUA assignment agreement, and (3) increased natural gas transportation and storage capacity demand charges paid to third parties from operating Train 5 of the Liquefaction Project following its substantial completion. Partially offsetting these increases was a decrease in third-party service and maintenance contract costs, as the three months ended March 31, 2019 included increased cost of turnaround and related activities at the Liquefaction Project, that did not recur in the comparable period of 2020. Operating and maintenance expense (including affiliates) also includes payroll and benefit costs of operations personnel, insurance and regulatory costs and other operating costs.
Depreciation and amortization expense increased during the three and nine months ended September 30, 2019March 31, 2020 from the three and nine months ended September 30, 2018March 31, 2019, as a result of commencing operations ofthe assets related to Train 5 of the Liquefaction Project as the related assets began depreciating upon reaching substantial completion.completion in March 2019.
Other expense (income)
| | | | Three Months Ended September 30, | | Nine Months Ended September 30, | Three Months Ended March 31, |
| (in millions) | 2019 | | 2018 | | Change | | 2019 | | 2018 | | Change | 2020 | | 2019 | | Change |
| Interest expense, net of capitalized interest | $ | 231 |
| | $ | 183 |
| | $ | 48 |
| | $ | 648 |
| | $ | 552 |
| | $ | 96 |
| $ | 234 |
| | $ | 187 |
| | $ | 47 |
|
| Loss on modification or extinguishment of debt | 13 |
| | 12 |
| | 1 |
| | 13 |
| | 12 |
| | 1 |
| 1 |
| | — |
| | 1 |
|
| Derivative gain, net | — |
| | (2 | ) | | 2 |
| | — |
| | (13 | ) | | 13 |
| |
| Other income | (8 | ) | | (8 | ) | | — |
| | (24 | ) | | (19 | ) | | (5 | ) | |
| Other income, net | | (6 | ) | | (9 | ) | | 3 |
|
| Total other expense | $ | 236 |
| | $ | 185 |
| | $ | 51 |
| | $ | 637 |
| | $ | 532 |
| | $ | 105 |
| $ | 229 |
| | $ | 178 |
| | $ | 51 |
|
Interest expense, net of capitalized interest, increased during the three and nine months ended September 30, 2019 compared toMarch 31, 2020 from the three and nine months ended September 30, 2018, primarilyMarch 31, 2019 as a result of (1) a decrease in the portion of total interest costs that could be capitalizedis eligible for capitalization as an additional Train 5 of the Liquefaction Project completed construction betweenin March 2019 and (2) higher interest costs as a result of the periods. Forissuance of the 2029 CQP Senior Notes in September 2019. During the three months ended September 30,March 31, 2020 and 2019, and 2018, we incurred $246$254 million and $235 million of total interest cost, respectively, of which we capitalized $15$20 million and $52$48 million, respectively, which was primarily related to interest costs incurred to construct the constructionremaining assets of the Liquefaction Project. For the nine months ended September 30, 2019 and 2018, we incurred $718 million and $701 million of total interest cost, respectively, of which we capitalized $70 million and $149 million, respectively, which was primarily related to the construction of the Liquefaction Project.
Loss on modification or extinguishment of debt during the three and nine months ended September 30, 2019 increased from the comparable periods in 2018. The loss on modification or extinguishment of debt in 2019 of $13 million was related to the termination of $750 million of commitments under the 2019 CQP Credit Facilities in connection with the issuance of the 2029 CQP Senior Notes. Loss on modification or extinguishment of debt recognized in 2018 was attributable to the incurrence of third party fees and write off of unamortized debt issuance costs in September 2018 as a result of the termination of approximately $1.2 billion of commitments under the 2016 CQP Credit Facilities in connection with the issuance of the 2026 CQP Senior Notes.
Derivative gain, net decreased during the three and nine months ended September 30, 2019 compared to the three and nine months ended September 30, 2018, as we no longer held interest rate swaps used to hedge a portion of the variable interest payments on our credit facilities, as they were terminated in October 2018.
Off-Balance Sheet Arrangements
As of September 30, 2019,March 31, 2020, we had no transactions that met the definition of off-balance sheet arrangements that may have a current or future material effect on our consolidated financial position or operating results.
Summary of Critical Accounting Estimates
The preparation of our Consolidated Financial Statements in conformity with GAAP requires management to make certain estimates and assumptions that affect the amounts reported in the Consolidated Financial Statements and the accompanying notes. There have been no significant changes to our critical accounting estimates from those disclosed in our annual report on Form 10-K for the year ended December 31, 20182019.
Recent Accounting Standards
| |
| ITEM 3. | QUANTITATIVE AND QUALITATIVE DISCLOSURES ABOUT MARKET RISK |
Marketing and Trading Commodity Price Risk
We have entered into commodity derivatives consisting of natural gas supply contracts for the commissioning and operation of the Liquefaction Project (“Liquefaction Supply Derivatives”). In order to test the sensitivity of the fair value of the Liquefaction Supply Derivatives to changes in underlying commodity prices, management modeled a 10% change in the commodity price for natural gas for each delivery location as follows (in millions):
|
| | | | | | | | | | | | | | | |
| | September 30, 2019 | | December 31, 2018 |
| | Fair Value | | Change in Fair Value | | Fair Value | | Change in Fair Value |
| Liquefaction Supply Derivatives | $ | (24 | ) | | $ | 6 |
| | $ | (43 | ) | | $ | 7 |
|
|
| | | | | | | | | | | | | | | |
| | March 31, 2020 | | December 31, 2019 |
| | Fair Value | | Change in Fair Value | | Fair Value | | Change in Fair Value |
| Liquefaction Supply Derivatives | $ | 40 |
| | $ | — |
| | $ | 24 |
| | $ | 1 |
|
ITEM 4. CONTROLS AND PROCEDURES
We maintain a set of disclosure controls and procedures that are designed to ensure that information required to be disclosed by us in the reports filed by us under the Exchange Act is recorded, processed, summarized and reported within the time periods specified in the SEC’s rules and forms. As of the end of the period covered by this report, we evaluated, under the supervision and with the participation of our general partner’s management, including our general partner’s Chief Executive Officer and Chief Financial Officer, the effectiveness of our disclosure controls and procedures pursuant to Rule 13a-15 of the Exchange Act. Based on that evaluation, our general partner’s Chief Executive Officer and Chief Financial Officer concluded that our disclosure controls and procedures are effective.
During the most recent fiscal quarter, there have been no changes in our internal control over financial reporting that have materially affected, or are reasonably likely to materially affect, our internal control over financial reporting.
PART II. OTHER INFORMATION
ITEM 1. LEGAL PROCEEDINGS
The outbreak of COVID-19 and volatility in the energy markets may materially and adversely affect our business, financial condition, operating results, cash flow, liquidity and prospects.
The outbreak of COVID-19 and its development into a pandemic in March 2020 have resulted in significant disruption globally. Actions taken by various governmental authorities, individuals and companies around the world to prevent the spread of COVID-19 have restricted travel, business operations, and the overall level of individual movement and in-person interaction across the globe. Additionally, recent disputes over production levels between members of the Organization of Petroleum Exporting Countries and other oil producing countries has resulted in increased volatility in oil and natural gas prices.
The extent, duration and magnitude of the COVID-19 pandemic’s effects will depend on future developments, all of which are highly uncertain and difficult to predict, including the impact of the pandemic on global and regional economies, travel, and economic activity, as well as actions taken by governments, business and individuals in response to the pandemic or any future resurgence. These developments include the impact of the COVID-19 pandemic on unemployment rates, the demand for oil and natural gas, levels of consumer confidence and the post-pandemic pace of recovery.
Many uncertainties remain with respect to the COVID-19 pandemic, and we continue to monitor the rapidly evolving situation. The COVID-19 pandemic alone or coupled with continued volatility in the energy markets may materially and adversely affect our business, financial condition, operating results, cash flow, liquidity and prospects or have the effect of heightening many of the other risks described herein and in our annual report on Form 10-K for the year ended December 31, 2019. The extent to which our business, contracts, financial condition, operating results, cash flow, liquidity and prospects are affected by the COVID-19 outbreak or volatility in the energy markets will depend on various factors beyond our control and are highly uncertain, including the duration and scope of the outbreak, decreased demand for LNG and the resulting economic effects of the outbreak of COVID-19.
Our ability to generate cash is substantially dependent upon the performance by customers under long-term contracts that we have entered into, and we could be materially and adversely affected if any significant customer fails to perform its contractual obligations for any reason.
Our future results and liquidity are substantially dependent upon performance by our customers to make payments under long-term contracts. As of March 31, 2020, SPL had SPAs with eight third-party customers and SPLNG had TUAs with two third-party customers. We are dependent on each customer’s continued willingness and ability to perform its obligations under its SPA or TUA. We are exposed to the credit risk of any guarantor of these customers’ obligations under their respective agreements in the event that we must seek recourse under a guaranty. As a result of the disruptions caused by the COVID-19 pandemic and the volatility in the energy markets, we believe we are exposed to heightened credit and performance risk of our customers. Additionally, some customers have indicated to us that COVID-19 has begun to impact their operations and/or may impact their operations in the future. Some of our SPA customers’ primary countries of business have experienced a significant number of COVID-19 cases and/or have been subject to government imposed lockdown or quarantine measures. Although we believe that impacts of the COVID-19 pandemic on LNG regasification facilities, downstream markets and broader energy demand do not constitute valid force majeure claims under our FOB LNG SPAs, if any significant customer fails to perform its obligations under its SPA or TUA, our business, contracts, financial condition, operating results, cash flow, liquidity and prospects could be materially and adversely affected, even if we were ultimately successful in seeking damages from that customer or its guarantor for a breach of the agreement.
Cost overruns and delays in the completion of Train 6 or any future Trains, as well as difficulties in obtaining sufficient financing to pay for such costs and delays, could have a material adverse effect on our business, contracts, financial condition, operating results, cash flow, liquidity and prospects.
The actual construction costs of Train 6 and any future Trains may be significantly higher than our current estimates as a result of many factors, including change orders under existing or future EPC contracts resulting from the occurrence of certain specified events that may give our EPC contractor the right to cause us to enter into change orders or resulting from changes with which we otherwise agree. We have already experienced increased costs due to change orders. As construction progresses, we may decide or be forced to submit change orders to our contractor that could result in longer construction periods, higher construction costs or both, including change orders to comply with existing or future environmental or other regulations.
The outbreak of COVID-19 and the resulting actions taken by governmental and regulatory authorities to prevent the spread of COVID-19 may cause a slow-down in the construction of one or more Trains. Our EPC contractor has advised us of voluntary proactive measures it is taking to protect employees and to mitigate risks associated with COVID-19, however, it has not indicated that there will be any changes to the project cost or schedule and is still performing its obligations under its EPC contract. While the construction of Train 6 is continuing, if there was a major outbreak of COVID-19 at any construction site or the implementation of restrictions by the government that prevented construction for an extended period, we could experience significant delays in the construction of one or more Trains.
Delays in the construction of one or more Trains beyond the estimated development periods, as well as change orders to our existing EPC contract or any future EPC contract related to additional Trains, could increase the cost of completion beyond the amounts that we estimate, which could require us to obtain additional sources of financing to fund our operations until the Liquefaction Project is fully constructed (which could cause further delays). Our ability to obtain financing that may be needed to provide additional funding to cover increased costs will depend, in part, on factors beyond our control. Accordingly, we may not be able to obtain financing on terms that are acceptable to us, or at all. Even if we are able to obtain financing, we may have to accept terms that are disadvantageous to us or that may have a material adverse effect on our current or future business, contracts, financial condition, operating results, cash flow, liquidity and prospects.
Outbreaks of infectious diseases, such as the outbreak of COVID-19, at our facilities could adversely affect our operations.
Federal, state and local governments have enacted various measures to try to contain the outbreak of COVID-19, such as travel bans and restrictions, quarantines, shelter-in-place orders and business shutdowns. Our facilities at the Sabine Pass LNG terminal are critical infrastructure and have continued to operate during the outbreak, which means that Cheniere must keep its employees who operate our facilities safe and minimize unnecessary risk of exposure to the virus. In response, Cheniere has taken extra precautionary measures to protect the continued safety and welfare of its employees who continue to work at our facilities and have modified certain business and workforce practices, such as implementing work from home policies where appropriate. The measures taken to prevent an outbreak at our facilities have resulted in increased costs. If a large number of Cheniere’s employees in those critical facilities were to contract COVID-19 at the same time, our operations could be adversely affected.
ITEM 6. EXHIBITS
|
| | |
| Exhibit No. | | Description |
1.1 | | |
4.1 | | |
| 10.1 | | Registration RightsWorking Capital Revolving Credit and Letter of Credit Reimbursement Agreement, datedamong SPL, as borrower, certain subsidiaries of September 12, 2019, amongSPL, The Bank of Nova Scotia, as Senior Facility Agent, Société Générale, as the Partnership,Common Security Trustee, the guarantorsissuing banks and lenders from time to time party thereto and RBC Capital Markets, LLCother participants (Incorporated by reference to Exhibit 10.1 to the Partnership’s Current Report on Form 8-K (SEC File No. 001-33366), filed on September 12, 2019)March 23, 2020) |
10.2*10.2 | | |
| 10.3 | | |
| 10.4* | | Change order to the Lump Sum Turnkey Agreement for the Engineering, Procurement and Construction of the Sabine Pass LNG Stage 4 Liquefaction Facility, dated November 7, 2018, by and between SPL and Bechtel Oil Gas and Chemicals, Inc.: (i) the Change Order CO-00002 Fuel Provisional Sum Closure,CO-00013 Cost to Comply with SPL FTZ (FTZ entries, bonded transports and receipts for AG Pipe Spools Only), dated July 8, 2019,February 10, 2020, (ii) the Change Order CO-00003 Currency Provisional Sum Closure,CO-00014 Permanent Access Road to Third Berth, dated July 8, 2019,February 10, 2020, (iii) the Change Order CO-00004 Foreign Trade Zone,CO-00015 Modifications to Schedule Bonus Language, dated July 2, 2019,February 10, 2020, (iv) the Change Order CO-00005 NGPL Gate Access Security Coordination Provisional Sum,CO-00016 LNG Berth 3 LNTP No 3, dated July 17, 2019,January 31, 2020 and (v) the Change Order CO-00006 Alternate to Adams Valves,CO-00017 Construction Doc Fender Guards and LP Fuel Gas Overpressure Interlock, dated August 14, 2019, (vi) the Change Order CO-00007 E-1503 to HRU Permanent Drain Piping, dated August 14, 2019, (vii) the Change Order CO-00008 Differing Subsurface Soil Conditions - Train 6 ISBL, dated August 27, 2019, (viii) the Change Order CO-00009 LNG Berth 3, dated September 25, 2019 and (iv) the Change Order CO-00010 Cold Box Redesign and Addition of Inspection Boxes on Methane Cold Box, dated September 16, 2019March 18, 2020 |
| 31.1* | | |
| 31.2* | | |
| 32.1** | | |
| 32.2** | | |
| 101.INS* | | XBRL Instance Document - the instance document does not appear in the Interactive Data File because its XBRL tags are embedded within the Inline XBRL document. |
| 101.SCH* | | Inline XBRL Taxonomy Extension Schema Document |
| 101.CAL* | | Inline XBRL Taxonomy Extension Calculation Linkbase Document |
| 101.DEF* | | Inline XBRL Taxonomy Extension Definition Linkbase Document |
| 101.LAB* | | Inline XBRL Taxonomy Extension Labels Linkbase Document |
| 101.PRE* | | Inline XBRL Taxonomy Extension Presentation Linkbase Document |
| 104* | | Cover Page Interactive Data File (formatted as Inline XBRL and contained in Exhibit 101) |
|
| |
| * | Filed herewith. |
| ** | Furnished herewith. |
Pursuant to the requirements of the Securities Exchange Act of 1934, the registrant has duly caused this report to be signed on its behalf by the undersigned, thereunto duly authorized.
|
| | | |
| | | CHENIERE ENERGY PARTNERS, L.P. |
| | | By: | Cheniere Energy Partners GP, LLC, |
| | | its general partner |
| | | | |
| Date: | October 31, 2019April 29, 2020 | By: | /s/ Michael J. Wortley |
| | | | Michael J. Wortley |
| | | | Executive Vice President and Chief Financial Officer |
| | | | (on behalf of the registrant and as principal financial officer) |
| | | | |
| Date: | October 31, 2019April 29, 2020 | By: | /s/ Leonard E. Travis |
| | | | Leonard E. Travis |
| | | | Vice President and Chief Accounting Officer |
| | | | (on behalf of the registrant and as principal accounting officer) |